Welcome message from author
This document is posted to help you gain knowledge. Please leave a comment to let me know what you think about it! Share it to your friends and learn new things together.
Transcript

SAVITRIBAI PHULE PUNE UNIVERSITYDEPARTMENT OF ATMOSPHERIC & SPACE SCIENCES
Ganeshkhind,PUNE-411 007 (INDIA)Tel. : +91 (020) 25607752 25601161
With Best WishesProf. P. Pradeep KumarConvener, Local Organizing CommitteeNational Space Science Symposium-2019
Greetings from NSSS-2019.
We are glad to inform you that your abstract has been accepted for presentation at the National Space Science Symposium-2019 (NSSS-2019) being organized by the Savitribai Phule Pune University with co-hosts Inter-University Centre for Astronomy and Astrophysics (IUCAA) and National Centre for Radio Astrophysics (NCRA). The details are as follows:Abstract id: 1810000142Abstract Title: Metal Mirrors in X- ray AstronomySession: PS-4 Mode of Presentation : Oral
To better suit the subject area, few abstracts have been re-assigned to parallel sessions different from that submitted for. The decision of the session conveners in this regard is taken as final.Details of technical programme, date and time of your presentation will be available on the web site one week before the symposium. The dimensions of the poster and details of ppt to be prepared will be put on the NSSS-2019 Web siteby January first week. Posters have to be displayed on all the three days of the symposium.
Travel support (if requested) and accommodation (if allotted to guest house) will be communicated to you via e-mail. For those coming with accompanying persons guest house will not be available. Details of hotels where the participants can book directly will be available on the website shortly. Please make frequent visits to NSSS-2019 website for periodic updates.
Registration is restricted to Presenting author plus two coauthors from the accepted abstract. So, we request you to provide the details of the two co-author(s) likely to attend (Name of the co-author, Application id generated after submitting response form, which can be seen in the dashboard of the co-author). Kindly submit this information on the following link https://goo.gl/forms/MNAv8tbJbT23sYaf1 by 11 December 2018.
For registration and participation in NSSS-2019 you are required to login onto the web portal (the same one through which you submitted your abstract) using your login- id and proceed to the payment page (even if you have Registration Waiver). There is no provision for accepting registration payment by DD/Cheque. Due to logistic reasons on-spot registration will not be accepted. All payments should be made online before the dates mentioned on the website.
Please inform these details to the co-authors also. Any two co-authors who have submitted the response forms will be able to register for participation in the symposium after you have provided their details on the link given above.You are invited to participate in the NSSS-2019, and present your paper. We look forward to seeing you at the symposium.If you are not going to register for the symposium kindly intimate us (with your application id/ abstract id) as early as possible.
(Formerly University of Pune)
Dear Mr. Nazimudeen, 20180001762018000176
Note: It is Digitally Generated Letter and does not require any signature
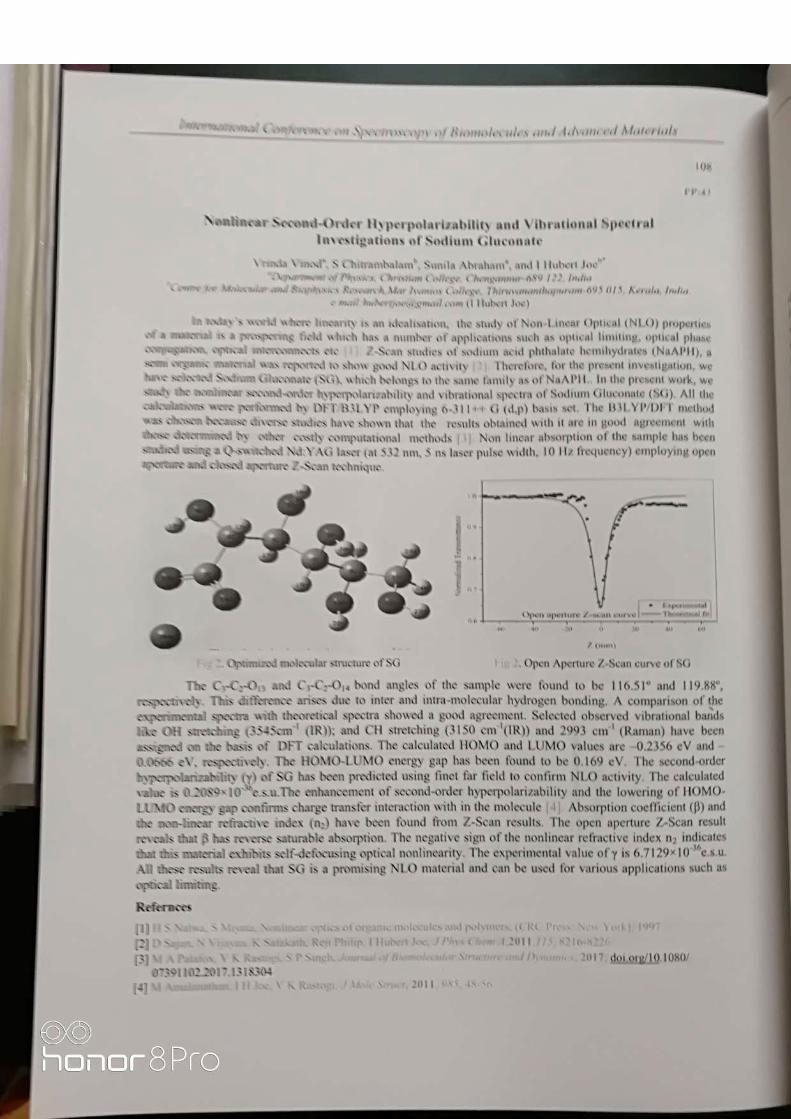
Metal Mirrors in X- ray Astronomy E.A Nazimudeen
1, T.E Girish
2*, Sunila Abraham
1, C.V Midhun
3, K.M Varier
2 1 Department of Physics, Christian College, Chengannur, Kerala, India – 689122
2 Department of Physics, University College, Thiruvananthapuram, Kerala, India 695034
3 Department of Physics, University of Calicut, Malappuram, Kerala, India – 673635
*Email : [email protected]
Abstract
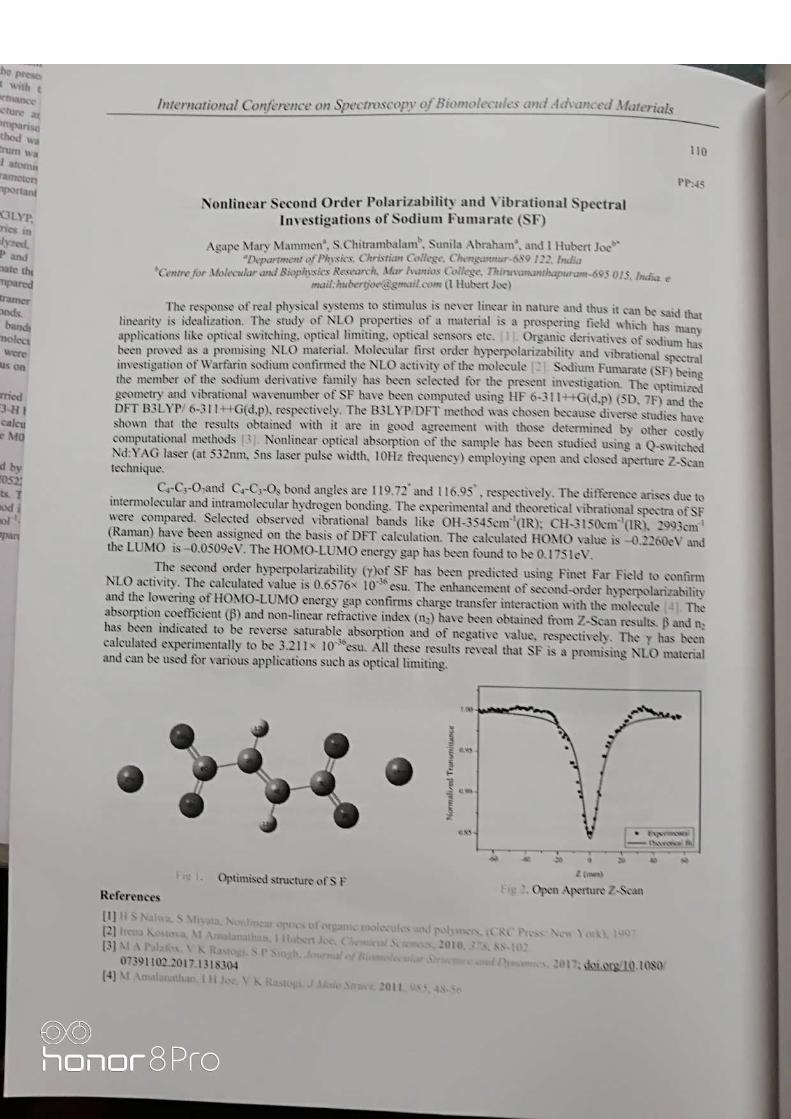
The technological advances in X- ray reflecting telescopes and mirrors have transformed the
field of X- ray astronomy into a major scientific discipline in astrophysics and cosmology. The
remarkable scientific observations in hard X-ray imaging have enriched and guided new views of
the universe. In this context, we have studied the reflectivity of variety of mirror materials in the
hard X-ray region based on theoretical calculations and computer simulations. We have inferred
that the reflectivity of Speculum metal in the hard X-ray region particularly in the energy range
of 17.6 keV is higher than that of commonly used other mirror materials. The reflectivity of
speculum metal is also compared with other mirror materials for different photon energies
ranging from 8 keV to 300 keV. Further we have discussed the radiation resistance properties of
speculum metal separately for electron and X-ray irradiations in the MeV range.
Photoluminiscent Cd(II)btec based MOFs with unprecedented structural
features.
Sujesh Baby1,2 and M.Padmanabhan2.
1, Department of Chemistry, Christian College Chengannur, Kerala- 689122.
2, School of Chemical Sciences, M.G. University, Kottayam, Kerala-686560.
E mail: - [email protected] , 09446963119
Key words: MOFs, coordination polymers, photo-luminescence, inorganic-organic hybrid
materials.
Abstract:- Coordination Polymers (CPs) and metal-organic frameworks (MOFs) are crystalline
inorganic-organic hybrid materials that have attracted considerable interests from scientists
working in almost areas and disciplines because of their versatile functional properties and
widespread applications. They are mostly infinitely extended systems which can be built from
organic linkers and connectors through coordinative interaction with metal ions of our choice.
The resulting metal-organic hybrid systems can be of varying dimensionality (from zero to
three) and often will have interesting topology and, further, will lead to diverse and unique
supra-molecular assemblies through weak non-bonding interactions encompassing H-bonding,
van der Waals forces, π-π stacking, dipole-dipole interactions, etc. In this work, we present the
synthesis and detailed characterisation of amine templated Cd(II)btec based MOF materials
using spectral, structural and thermal techniques. Single crystal XRD studies shows that in this
system, each btec moiety acts as a µ4-bridge, through O-atoms of four carboxylates of four
different -btec moieties, resulting a slightly distorted tetrahedron around Cd(II) which was
supported by varying O–Cd–O bond angles and Cd–O distances . Out of the eight oxygen
atoms belonging to the four carboxylate units of btec, only four make C–O–Cd bond and the
rest remain non-coordinated. Each building block is linked together through Cd-O bonds to
generate a three dimensional structure made up of [Cd(C6H2COO4)]2-n framework and
having a porous rhomboid channel along the crystallographic c axis .The dimension of the pore
is 11.479 Å x 11.021 Å. It accommodates the alkyl ammonium cations and H2O molecules
which get H-bonded to each other. The synthesised polymeric system also shows exciting
photo-luminescence properties and it may attributed to the ligand-to-metal charge-transfer
(LMCT) transitions. These materials have enough applications in the field of light emitting
devices.
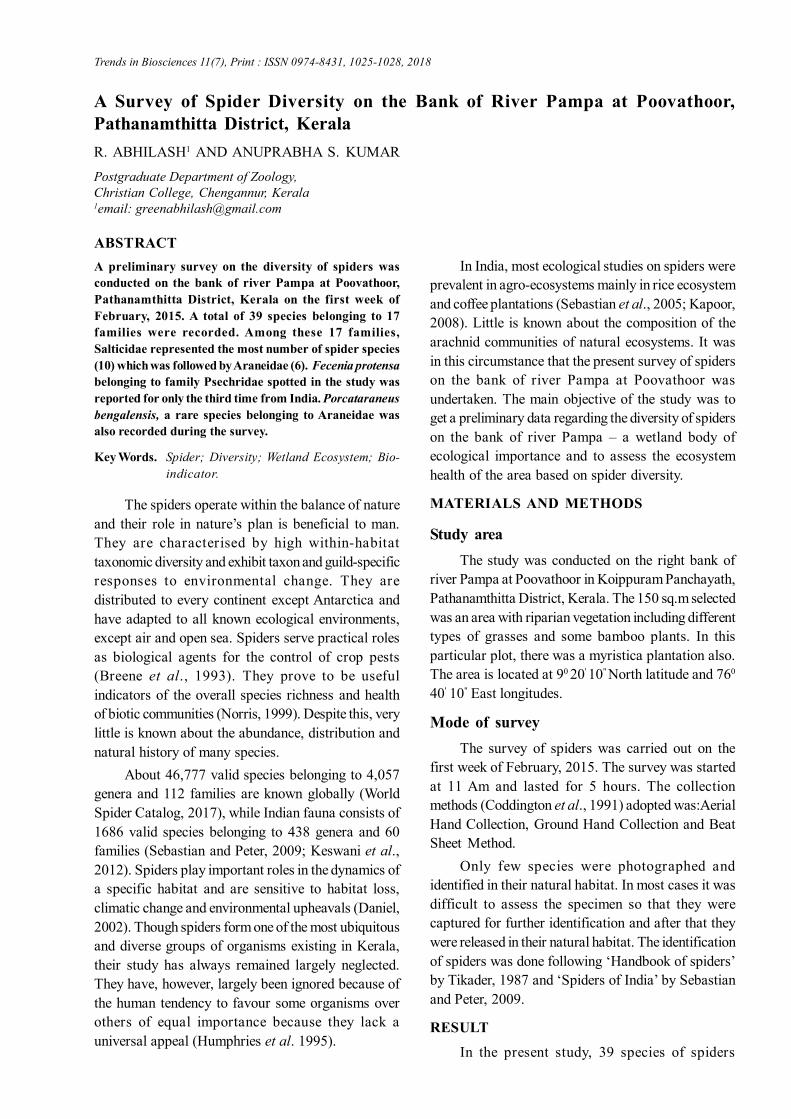
A Survey of Spider Diversity on the Bank of River Pampa at Poovathoor,Pathanamthitta District, KeralaR. ABHILASH1 AND ANUPRABHA S. KUMARPostgraduate Department of Zoology,Christian College, Chengannur, Kerala1email: [email protected]
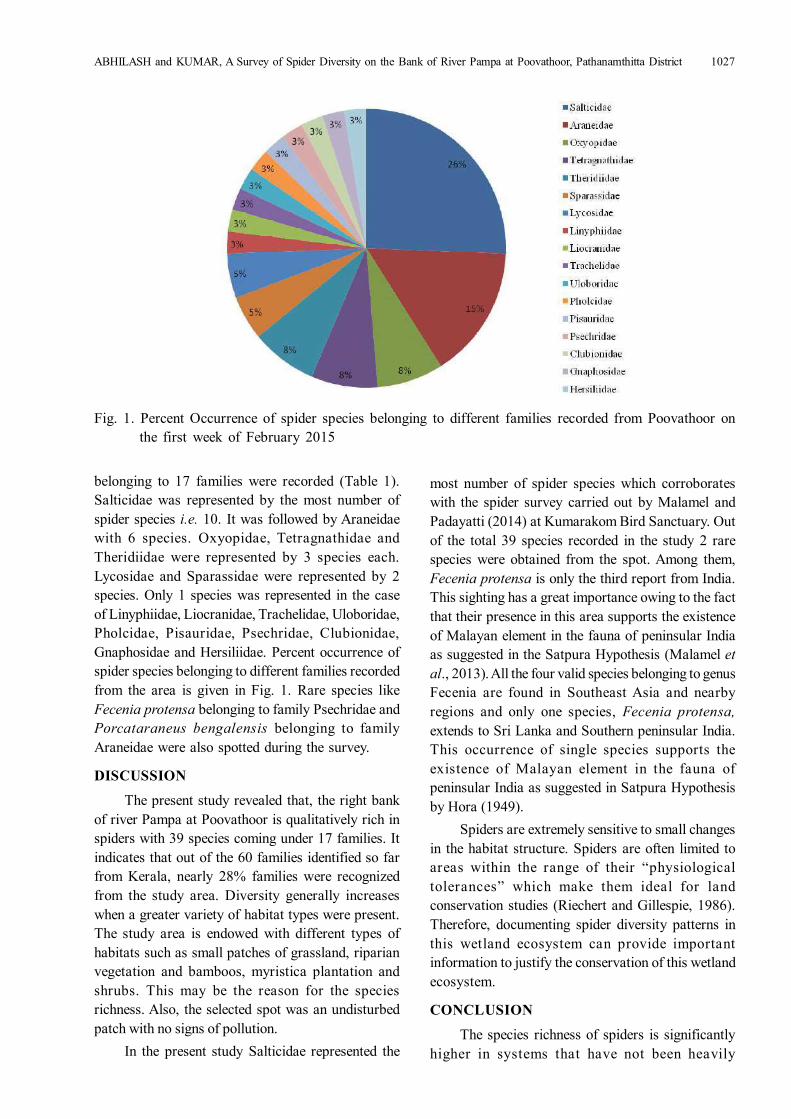
ABSTRACTA preliminary survey on the diversity of spiders wasconducted on the bank of river Pampa at Poovathoor,Pathanamthitta District, Kerala on the first week ofFebruary, 2015. A total of 39 species belonging to 17families were recorded. Among these 17 families,Salticidae represented the most number of spider species(10) which was followed by Araneidae (6). Fecenia protensabelonging to family Psechridae spotted in the study wasreported for only the third time from India. Porcataraneusbengalensis, a rare species belonging to Araneidae wasalso recorded during the survey.
Key Words. Spider; Diversity; Wetland Ecosystem; Bio-indicator.
The spiders operate within the balance of natureand their role in nature’s plan is beneficial to man.They are characterised by high within-habitattaxonomic diversity and exhibit taxon and guild-specificresponses to environmental change. They aredistributed to every continent except Antarctica andhave adapted to all known ecological environments,except air and open sea. Spiders serve practical rolesas biological agents for the control of crop pests(Breene et al., 1993). They prove to be usefulindicators of the overall species richness and healthof biotic communities (Norris, 1999). Despite this, verylittle is known about the abundance, distribution andnatural history of many species.
About 46,777 valid species belonging to 4,057genera and 112 families are known globally (WorldSpider Catalog, 2017), while Indian fauna consists of1686 valid species belonging to 438 genera and 60families (Sebastian and Peter, 2009; Keswani et al.,2012). Spiders play important roles in the dynamics ofa specific habitat and are sensitive to habitat loss,climatic change and environmental upheavals (Daniel,2002). Though spiders form one of the most ubiquitousand diverse groups of organisms existing in Kerala,their study has always remained largely neglected.They have, however, largely been ignored because ofthe human tendency to favour some organisms overothers of equal importance because they lack auniversal appeal (Humphries et al. 1995).
In India, most ecological studies on spiders wereprevalent in agro-ecosystems mainly in rice ecosystemand coffee plantations (Sebastian et al., 2005; Kapoor,2008). Little is known about the composition of thearachnid communities of natural ecosystems. It wasin this circumstance that the present survey of spiderson the bank of river Pampa at Poovathoor wasundertaken. The main objective of the study was toget a preliminary data regarding the diversity of spiderson the bank of river Pampa – a wetland body ofecological importance and to assess the ecosystemhealth of the area based on spider diversity.
MATERIALS AND METHODS
Study areaThe study was conducted on the right bank of
river Pampa at Poovathoor in Koippuram Panchayath,Pathanamthitta District, Kerala. The 150 sq.m selectedwas an area with riparian vegetation including differenttypes of grasses and some bamboo plants. In thisparticular plot, there was a myristica plantation also.The area is located at 90 20' 10" North latitude and 760
40' 10" East longitudes.
Mode of surveyThe survey of spiders was carried out on the
first week of February, 2015. The survey was startedat 11 Am and lasted for 5 hours. The collectionmethods (Coddington et al., 1991) adopted was:AerialHand Collection, Ground Hand Collection and BeatSheet Method.
Only few species were photographed andidentified in their natural habitat. In most cases it wasdifficult to assess the specimen so that they werecaptured for further identification and after that theywere released in their natural habitat. The identificationof spiders was done following ‘Handbook of spiders’by Tikader, 1987 and ‘Spiders of India’ by Sebastianand Peter, 2009.
RESULT
In the present study, 39 species of spiders
Trends in Biosciences 11(7), Print : ISSN 0974-8431, 1025-1028, 2018
1026 Trends in Biosciences 11 (7), 2018
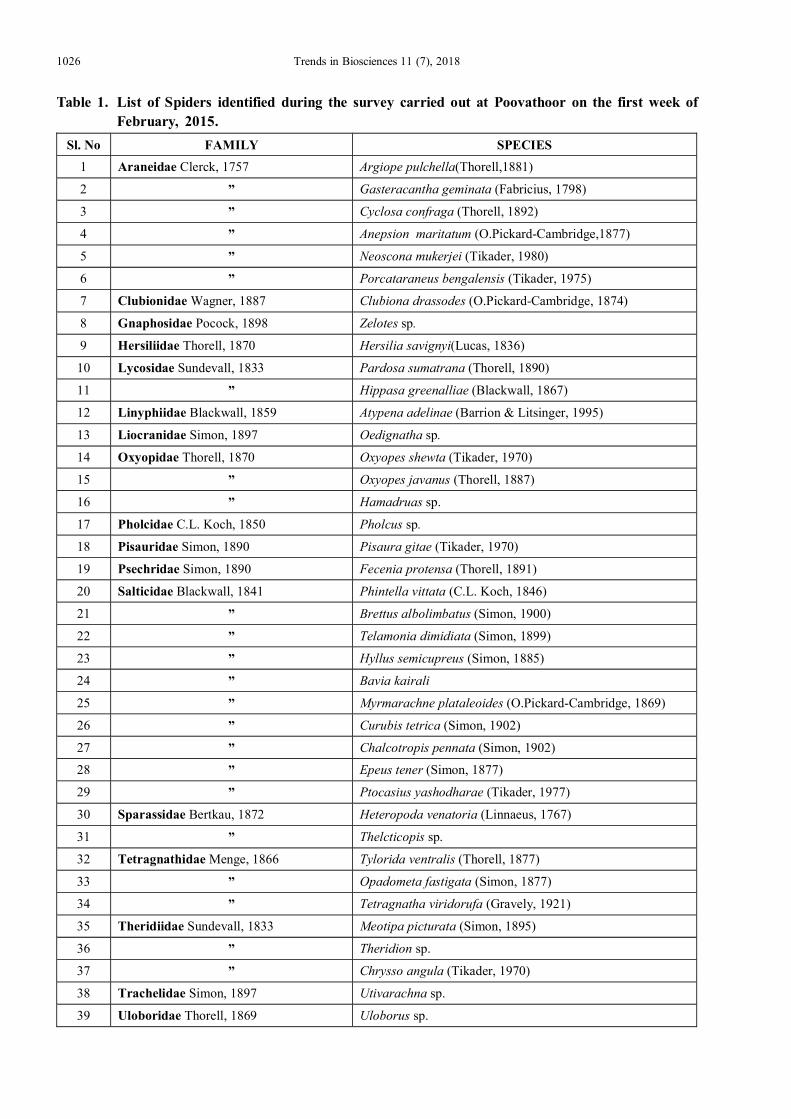
Table 1. List of Spiders identified during the survey carried out at Poovathoor on the first week ofFebruary, 2015.
Sl. No FAMILY SPECIES 1 Araneidae Clerck, 1757 Argiope pulchella(Thorell,1881)
2 ” Gasteracantha geminata (Fabricius, 1798)
3 ” Cyclosa confraga (Thorell, 1892)
4 ” Anepsion maritatum (O.Pickard-Cambridge,1877)
5 ” Neoscona mukerjei (Tikader, 1980)
6 ” Porcataraneus bengalensis (Tikader, 1975)
7 Clubionidae Wagner, 1887 Clubiona drassodes (O.Pickard-Cambridge, 1874)
8 Gnaphosidae Pocock, 1898 Zelotes sp.
9 Hersiliidae Thorell, 1870 Hersilia savignyi(Lucas, 1836)
10 Lycosidae Sundevall, 1833 Pardosa sumatrana (Thorell, 1890)
11 ” Hippasa greenalliae (Blackwall, 1867)
12 Linyphiidae Blackwall, 1859 Atypena adelinae (Barrion & Litsinger, 1995)
13 Liocranidae Simon, 1897 Oedignatha sp.
14 Oxyopidae Thorell, 1870 Oxyopes shewta (Tikader, 1970)
15 ” Oxyopes javanus (Thorell, 1887)
16 ” Hamadruas sp.
17 Pholcidae C.L. Koch, 1850 Pholcus sp.
18 Pisauridae Simon, 1890 Pisaura gitae (Tikader, 1970)
19 Psechridae Simon, 1890 Fecenia protensa (Thorell, 1891)
20 Salticidae Blackwall, 1841 Phintella vittata (C.L. Koch, 1846)
21 ” Brettus albolimbatus (Simon, 1900)
22 ” Telamonia dimidiata (Simon, 1899)
23 ” Hyllus semicupreus (Simon, 1885)
24 ” Bavia kairali
25 ” Myrmarachne plataleoides (O.Pickard-Cambridge, 1869)
26 ” Curubis tetrica (Simon, 1902)
27 ” Chalcotropis pennata (Simon, 1902)
28 ” Epeus tener (Simon, 1877)
29 ” Ptocasius yashodharae (Tikader, 1977)
30 Sparassidae Bertkau, 1872 Heteropoda venatoria (Linnaeus, 1767)
31 ” Thelcticopis sp.
32 Tetragnathidae Menge, 1866 Tylorida ventralis (Thorell, 1877)
33 ” Opadometa fastigata (Simon, 1877)
34 ” Tetragnatha viridorufa (Gravely, 1921)
35 Theridiidae Sundevall, 1833 Meotipa picturata (Simon, 1895)
36 ” Theridion sp.
37 ” Chrysso angula (Tikader, 1970)
38 Trachelidae Simon, 1897 Utivarachna sp.
39 Uloboridae Thorell, 1869 Uloborus sp.
ABHILASH and KUMAR, A Survey of Spider Diversity on the Bank of River Pampa at Poovathoor, Pathanamthitta District 1027
belonging to 17 families were recorded (Table 1).Salticidae was represented by the most number ofspider species i.e. 10. It was followed by Araneidaewith 6 species. Oxyopidae, Tetragnathidae andTheridiidae were represented by 3 species each.Lycosidae and Sparassidae were represented by 2species. Only 1 species was represented in the caseof Linyphiidae, Liocranidae, Trachelidae, Uloboridae,Pholcidae, Pisauridae, Psechridae, Clubionidae,Gnaphosidae and Hersiliidae. Percent occurrence ofspider species belonging to different families recordedfrom the area is given in Fig. 1. Rare species likeFecenia protensa belonging to family Psechridae andPorcataraneus bengalensis belonging to familyAraneidae were also spotted during the survey.
DISCUSSION
The present study revealed that, the right bankof river Pampa at Poovathoor is qualitatively rich inspiders with 39 species coming under 17 families. Itindicates that out of the 60 families identified so farfrom Kerala, nearly 28% families were recognizedfrom the study area. Diversity generally increaseswhen a greater variety of habitat types were present.The study area is endowed with different types ofhabitats such as small patches of grassland, riparianvegetation and bamboos, myristica plantation andshrubs. This may be the reason for the speciesrichness. Also, the selected spot was an undisturbedpatch with no signs of pollution.
In the present study Salticidae represented the
most number of spider species which corroborateswith the spider survey carried out by Malamel andPadayatti (2014) at Kumarakom Bird Sanctuary. Outof the total 39 species recorded in the study 2 rarespecies were obtained from the spot. Among them,Fecenia protensa is only the third report from India.This sighting has a great importance owing to the factthat their presence in this area supports the existenceof Malayan element in the fauna of peninsular Indiaas suggested in the Satpura Hypothesis (Malamel etal., 2013). All the four valid species belonging to genusFecenia are found in Southeast Asia and nearbyregions and only one species, Fecenia protensa,extends to Sri Lanka and Southern peninsular India.This occurrence of single species supports theexistence of Malayan element in the fauna ofpeninsular India as suggested in Satpura Hypothesisby Hora (1949).
Spiders are extremely sensitive to small changesin the habitat structure. Spiders are often limited toareas within the range of their “physiologicaltolerances” which make them ideal for landconservation studies (Riechert and Gillespie, 1986).Therefore, documenting spider diversity patterns inthis wetland ecosystem can provide importantinformation to justify the conservation of this wetlandecosystem.
CONCLUSION
The species richness of spiders is significantlyhigher in systems that have not been heavily
Fig. 1. Percent Occurrence of spider species belonging to different families recorded from Poovathoor onthe first week of February 2015
1028 Trends in Biosciences 11 (7), 2018
manipulated as observed in the present study. Furtherstudies can build upon the present data and continueto catalogue the poorly documented spider fauna andperhaps discover new species along the way. At atime when all the ecosystems are experiencing lot ofanthropogenic disturbances, the present investigationemphasizes the urgent need to conserve wetlandecosystems and associated regions of the area. Spidersare well documented as a potential bio-indicator invarious ecosystems and their role in the dynamics ofinsect pest population control is well known, therefore,the data can be used in designing a future BiologicalMonitoring Program (BMP) on the bank of riverPampa.
ACKNOWLEDGEMENT
The authors thank Mr. Pradeep M.S. and Mr.Jimmy Paul, Research Scholars, Division ofArachnology, S.H College, Thevara for their supportand necessary guidance for this study.
LITERATURE CITEDBreene, R.G., Dean, D.A., Nyffeler, M. and Edwards, G.B. 1993.
Biology, predation ecology, and significance of spiders in Texascotton ecosystems.The Texas Agricultural Experiment StationBulletin, 1711: 1-115
Coddington, J.A., Griswold, C.E., Silva, D., Penaranda, D. andLarcher, S. 1991. Designing and testing sampling protocols toestimate biodiversity in tropical ecosystems. In E.C. Dudley(Ed.), The unity of evolutionary biology. Proceedings of thefourth international congress of systematic and evolutionarybiology. University of Maryland, College Park, USA: 44–60
Daniel, J.C. 2002. The book of Indian Reptiles and Amphibians.Bombay Natural History Society and Oxford University Press,Mumbai: 238.
Hora, S.L. 1949. Satpura hypothesis of the distribution of the
Malayan fauna and flora to Peninsular India.Proceedings ofthe National Institute of Sciences of India, 15 (8): 309-314
Humphries, C.J., Wilson, P.H. and Vane-Wright, R.I. 1995.Measuring biodiversity value for conservation, Annual Reviewof Ecology and Systamatics, 26:93-111
Kapoor, V. 2008. Effects of rainforest fragmentation and shadecoffee plantations on spider communities in the Western Ghats,India, Journal of Insect Conservation, 12: 53-68
Keswani, S., Hadole, P. and Rajoria, A. 2012. Checklist of Spiders(Arachnida: Araneae) from India. Indian Journal ofArachnology,1(1):129
Malamel, J.J. and Padayatty, D.S. 2014. A Pioneering Study onthe Spider Fauna of Kumarakom Bird Sanctuary, InternationalJournal of Science, Environment and Technology, 3 (3): 872-880
Malamel, J.J., Pradeep, M.S. and Sebastian, P.A. 2013. Feceniatravancoria Pocock is recognised as a junior synonym of Feceniaprotensa Thorell (Arachnida: Psechridae): a case ofintraspecific variation, Zootaxa,3741(3): 359-368
Norris, K.C. 1999. Quantifying change through time in spiderassemblages: Sampling methods, Indices and Sources of Errors,Journal of Insect Conservation, 3: 309-325
Riechert, S.E. and Gillespie, R.G. 1986. Habitat choice andutilization in web building spiders. In: Shear W.B. (Ed.):Spiders: Webs, Behaviour and Evolution. Stanford, StanfordUniversity Press: 23-48
Sebastian, P.A. and Peter, K.V. 2009. Spiders of India, First edition,Universities Press, Hyderabad, India, 18-606
Sebastian, P.A., Mathew, M.J., Beevi, S.P., Joseph, J. and Biju,C.R. 2005. The spider fauna of the irrigated rice ecosystem incentral Kerala, India across different elevational ranges, TheJournal of Arachnology, 33(2): 247-255
Tikader, B.K. 1987. Hand book: Indian Spiders. Zoological Surveyof India , Calcutta , 8-251
World Spider Catalog 2017. World Spider Catalog. Natural HistoryMuseum Bern, online at http://wsc.nmbe.ch, version 18.0,accessed on 14-12-2017. doi: 10.24436/2
Received on 14-02-2018 Accepted on 16-02-2018


Scanned by CamScanner

Scanned by CamScanner
Int. J. Math. And Appl., 6(2–A)(2018), 173–179
ISSN: 2347-1557
Available Online: http://ijmaa.in/Applications•ISSN:234
7-15
57•In
ternationalJo
urna
l of MathematicsAnd
its
International Journal ofMathematics And its Applications
Binary Linear Topological Spaces
Tresa Mary Chacko1,∗ and D. Susha2
1 Department of Mathematics, Christian College, Chengannur, Kerala, India.
2 Department of Mathematics, Catholicate College, Pathanamthitta, Kerala, India.
Abstract: In this paper we define and study the concept of binary linear topological spaces (BLTS) and their properties. Here weprove that the binary product of two linear topological spaces is a BLTS. Also we have the main result that the binary
product preserve metrizability and normability. Finally we construct a BLTS from a family of binary seminorms on apair of vector spaces.
MSC: 54A05, 54A99.
Keywords: Linear Topological Spaces, Binary topology, locally convex, metrizable.
c© JS Publication. Accepted on: 21.03.2018
1. Introduction
P. Thangavelu and Nithanantha Jothi introduced the concept of binary topology in [4]. It is a single topological structure
that carries the subsets of a set X as well as the subsets of another set Y for studying the information about the ordered
pair (A,B) of subsets of X and Y . A linear topological space is a linear space endowed with a topology such that the
vector addition and scalar multiplication are both continuous. The theory of linear topological spaces provide a remarkable
economy in discussion of many classical mathematical problems. We introduce the concept of binary topology to linear
topological spaces and form the theory of binary linear topology. Section 2 contains the prerequisites for the paper. In
section 3 we define the concept of binary linear topological spaces (BLTS). We prove that the binary product of two linear
topological spaces is a BLTS. Also we discuss the concept of locally convex BLTS and locally bounded BLTS and prove
some of their properties. In section 4 we define binary metric and binary norm. The main result of this section is that the
binary product preserve metrizability and normability. Section 5 deals with the construction of a BLTS using a family of
binary seminorms.
2. Preliminaries
Definition 2.1 ([4]). Let X and Y be any two non-empty sets and ℘(X) and ℘(Y ) be their power sets respectively. A binary
topology from X to Y is a binary structure M ⊆ ℘(X)× ℘(Y ) that satisfies the following axioms.
(1). (φ, φ) and (X,Y ) ∈M
∗ E-mail: [email protected]
173
Binary Linear Topological Spaces
(2). If (A1, B1) and (A2, B2) ∈M , then (A1 ∩A2, B1 ∩B2) ∈M .
(3). If (Aα, Bα) : α ∈ ∆ is a family of members of M , then (∪α∈∆Aα,∪α∈∆Bα) ∈M.
If M is a binary topology from X to Y then the triplet (X,Y,M) is called a binary topological space and the members of M
are called binary open sets. (C,D) is called binary closed if (X \C, Y \D) is binary open. The elements of X ×Y are called
the binary points of the binary topological space (X,Y,M). Let (X,Y,M) be a binary topological space and let (x, y) ∈ X×Y .
The binary open set (A,B) is called a binary neighbourhood of (x, y) if x ∈ A and y ∈ B. If X = Y then M is called a
binary topology on X and we write (X,M) as a binary space.
Proposition 2.2 ([4]). Let (X,Y,M) be a binary topological space. Then
(1). τ(M) = A ⊆ X : (A,B) ∈M for some B ⊆ Y is a topology on X.
(2). τ ′(M) = B ⊆ Y : (A,B) ∈M for some A ⊆ X is a topology on Y .
Proposition 2.3 ([4]). Suppose (X, ρ) and (Y, σ) are two topological spaces. Then ρ× σ is a binary topology from X to Y
such that τ(ρ× σ) = ρ and τ ′(ρ× σ) = σ.
Definition 2.4 ([5]). A linear topological space is a linear space E with a topology such that addition and scalar multiplication
are both continuous. That is for every elements x, y ∈ E and for every neighbourhood V of x+ y there exists neighbourhoods
V1 of x and V2 of y such that V1 + V2 ⊆ V and also for every neighbourhood W of λx there exists neighbourhoods K of λ
and U of x such that KU ⊆W . A base for the neighbourhood system of 0 in E is called a local base.
Throughout this paper we consider vector spaces over the same field K.
Definition 2.5 ([1]). Let ραα∈J be a family of seminorms on a vector space X. Then the αth open strip of radius r
centered at x ∈ X is Bαr (x) = y ∈ X : ρα(x − y) < r. Let ε be the collection of all open strips in X : ε = Bαr (x) : α ∈
J, r > 0, x ∈ X. The topology τ(ε) generated by ε is called the topology induced by ραα∈J .
Proposition 2.6 ([1]). Let ραα∈J be a family of seminorms on a vector space X. Then B = ∩nj=1Bαjr (x) : n ∈ N, αj ∈
J, r > 0, x ∈ X forms a base for the topology induced from these seminorms. In fact if U is open and x ∈ U , then there
exists an r > 0 and α1, ..., αn ∈ J such that ∩nj=1Bαjr (x) ⊆ U. Further every element of B is convex.
Theorem 2.7 ([1]). If X is a vector space whose topology is induced from a family of seminorms ραα∈J , then X is a
locally convex topological vector space.
3. Binary Linear Topology
Definition 3.1. A binary topology between two vector spaces is said to be binary linear if the two operations are continuous
i.e. if V1 and V2 are two vector spaces over the same field K and for every neighbourhoods U of (x1 +x2, y1 +y2) ∈ V1×V2, ∃
two neighbourhoods U1 and U2 of (x1, y1) and (x2, y2) respectively such that U1 +U2 ⊆ U . Similarly for every neighbourhood
W of (λx, λy) ∈ V1 × V2 there exists a neighbourhood W ′ of (x, y) such that λW ′ ⊆ W . If M is a binary linear topology
between two vector spaces V1 and V2, then the triplet (V1, V2,M) is called a binary linear topological space (BLTS).
Definition 3.2. Suppose (X1, τ1) and (X2, τ2) are two linear topological spaces. Then (X1, X2, τ1 × τ2) is called the binary
product of the given spaces.
Proposition 3.3. If (V1, τ1) and (V2, τ2) are two linear topological spaces, then (V1, V2, τ1×τ2) is a binary linear topological
space.
174

Tresa Mary Chacko and D. Susha
Proof. By proposition 2.3, (V1, V2, τ1× τ2) is a binary topological space. It remains to show that τ1× τ2 is a binary linear
topology. Let (x1, x2), (y1, y2) ∈ V1 × V2 and (A1, A2) be a neighbourhood of [(x1, x2) + (y1, y2)]. Then x1 + y1 ∈ A1 and
x2 + y2 ∈ A2. Since A1 ∈ τ1 and A2 ∈ τ2, and τ1 and τ2 are linear topologies, there exist neighbourhoods B1 and C1 of x1
and y1 respectively in τ1 such that B1 + C1 ⊆ A1 and neighbourhoods B2 and C2 of x2 and y2 respectively in τ2 such that
B2 +C2 ⊆ A2. Then in τ1× τ2, (B1, B2) is a neighbourhood of (x1, x2) and (C1, C2) is a neighbourhood of (y1, y2) such that
(B1, B2) + (C1, C2) = (B1 +C1, B2 +C2) ⊆ (A1, A2). Now let (A1, A2) be a neighbourhood of λ(x1, x2) in τ1× τ2. Then A1
is a neighbourhood of λx1 in τ1 and A2 is a neighbourhood of λx2 in τ2. So there exists two neighbourhoods B1 and B2 of
x1 and x2 respectively such that λB1 ⊆ A1 and λB2 ⊆ A2. This implies that (B1, B2) is a neighbourhood of (x1, x2) such
that λ(B1, B2) ⊆ (A1, A2). Thus τ1 × τ2 is a binary linear topology.
Proposition 3.4. If (V1, V2,M) is a BLTS, then τ(M) = A ⊆ V1 : (A,B) ∈ M for some B ⊆ V2 is a linear topology on
V1 and τ ′(M) = B ⊆ V2 : (A,B) ∈M for some A ⊆ V1 is a linear topology on V2.
Proof. By Proposition 2.2 τ(M) and τ ′(M) are both topologies in V1 and V2 respectively. Let x1, y1 ∈ V1 and A ∈ τ(M)
contains x1 + y1. Then for some x2, y2 ∈ V2 there exists B ⊆ V2 such that (x1 + y1, x2 + y2) ∈ (A,B) where (A,B) ∈ M .
Since M is a binary linear topology, there exists (E1, E2) and (F1, F2) in M such that (x1, x2) ∈ (E1, E2), (y1, y2) ∈ (F1, F2)
and (E1, E2) + (F1, F2) ⊆ (A,B). Then x1 ∈ E1, y1 ∈ F1, and E1 + F1 ⊆ A by the definition of binary sets. Also E1 and
F1 ∈ τ(M) by the construction of τ(M). Similarly for λx ∈ A, where A ∈ τ(M) we can find a neighbourhood of x say U
such that λU ⊆ A. Thus τ(M) is a linear topology. In the same way we can prove that τ ′(M) is also a linear topology.
Definition 3.5. A local base of a binary linear topology (V1, V2,M) is the base consisting of the neighbourhood of a binary
point (x, y).
Definition 3.6. A set (A,B) ∈ ℘(V1)×℘(V2) is convex if for all pairs (x1, x2), (y1, y2) ∈ (A,B), λ(x1, x2)+(1−λ)(y1, y2) ∈
(A,B), ∀λ ∈ [0, 1].
Definition 3.7. A binary linear topology is called locally convex if there exists a local base at (0, 0) whose members are
convex.
Definition 3.8. A BLTS is locally bounded if (0, 0) has a bounded neighbourhood, i.e. a neighbourhood (E,F ) such that
∀(N,M) ∈ N0, the set of neighbourhoods of (0, 0), there exists s ∈ R such that ∀t > s, (E,F ) ⊆ t(N,M).
Proposition 3.9. Let (V1, V2,M) be a BLTS. Then for every (W1,W2) ∈ N0, ∃ balanced and symmetric sets
(X1, Y1), (X2, Y2) ∈ N0 such that (X1, Y1) + (X2, Y2) ⊂ (W1,W2).
Proof. If (W1,W2) ∈ N0, then W1 and W2 are neighbourhoods of 0 in (V1, τ(M)) and (V2, τ′(M)) respectively. By the
property of linear topologies there exists symmetric balanced neighbourhoods of 0, X1, X2 ∈ τ(M) and Y1, Y2 ∈ τ ′(M) such
that X1 + X2 ⊂ W1 and Y1 + Y2 ⊂ W2. Now X1, Y1 are balanced ⇒ ∀ α ∈ R with | α |≤ 1, αX1 ⊂ X1 and αY1 ⊂ Y1.
So α(X1, Y1) = (αX1, αY1) ⊂ (X1, Y1). Thus (X1, Y1) and (X2, Y2) are balanced. By the symmetry of X1 and Y1, we get
X1 = −X1, Y1 = −Y1 ⇒ (X1, Y1) = (−X1,−Y1) = −(X1, Y1). Thus (X1, Y1) is symmetric and similarly (X2, Y2) is also
symmetric. (X1, Y1) + (X2, Y2) = (X1 +X2, Y1 + Y2) ⊂ (W1,W2).
Proposition 3.10. Let V1 and V2 be real vector spaces and U1 be a convex set in V1 and U2 be a convex set in V2, then
(U1, U2) is convex in ℘(V1)× ℘(V2).
Proof. Let (xi, yi) ∈ (U1, U2) for i = 1, 2. Then xi ∈ U1 and yi ∈ U2 for i = 1, 2 ⇒ λx1 + (1 − λ)x2 ∈ U1 for
0 ≤ λ ≤ 1. And λy1 + (1 − λ)y2 ∈ U2 for 0 ≤ λ ≤ 1. So (λx1 + (1 − λ)x2, λy1 + (1 − λ)y2) ∈ (U1, U2). Consider
175

Binary Linear Topological Spaces
λ(x1, y1) + (1−λ)(x2, y2) = (λx1, λy1) + ((1−λ)x2, (1−λ)y2) = (λx1 + (1−λ)x2, λy1 + (1−λ)y2) ∈ (U1, U2) for 0 ≤ λ ≤ 1.
Thus (U1, U2) is convex.
Corollary 3.11. If (V1, τ1) and (V2, τ2) are both locally convex topological vector spaces, then their binary product,
(V1, V2, τ1 × τ2) is a locally convex BLTS.
Proposition 3.12. Let U1 and U2 be bounded sets in two real vector spaces V1 and V2 respectively, then (U1, U2) is also
bounded.
Proof. Since U1 is bounded, for every neighbourhood E1 ∈ N0(V1), ∃s1 ∈ R such that ∀t > s1, U1 ⊂ tE1. Similarly
for every neighbourhood E2 ∈ N0(V2), ∃s2 ∈ R such that ∀t > s2, U2 ⊂ tE2. Let (E,F ) ∈ N0. Then E ∈ N0(V1) and
F ∈ N0(V2). Let t1 ∈ R correspond to E and t2 ∈ R correspond to F . Then ∀t > t1, U1 ⊂ tE and ∀t > t2, U2 ⊂ tF . So
∀t > s, where s = maxt1, t2, U1 ⊂ tE and U2 ⊂ tF i.e. (U1, U2) ⊂ t(E,F ), ∀t > s. Thus (U1, U2) is bounded.
Corollary 3.13. If (V1, τ1) and (V2, τ2) are both locally bounded topological vector spaces, then their binary product,
(V1, V2, τ1 × τ2) is a locally bounded BLTS.
Proposition 3.14. Let (V1, τ1) be a topological vector space and V2 be another vector space such that the map T : V1 → V2
is an isomorphism. Then τ2 = T (A) : A ∈ τ1 is a linear topology in V2 and hence τ1 × τ2 is a binary linear topology from
V1 to V2.
Proof. Since T is an isomorphism, T (φ) = φ and T (V1) = V2 and so φ, V2 ∈ τ2. Let A,B ∈ τ2. Then A = T (A′) and
B = T (B′) for some A′ and B′ ∈ τ1. So A′∩B′ ∈ τ1 and T (A′∩B′) ∈ τ2.T (A′∩B′) = T (A′)∩T (B′) = A∩B. Thus A∩B ∈ τ2.
Now let Aαα∈I ∈ τ2 for some index set I. Then there exists Bαα∈I ∈ τ1 such that Aα = T (Bα) for each α ∈ I. Then
∪α∈IBα ∈ τ1 and ∪α∈IAα = ∪α∈IT (Bα) = T (∪α∈IBα) ∈ τ2. Thus τ2 is a topology on V2. Let x2, y2 ∈ V2 and there exists
B ∈ τ2 such that x2 + y2 ∈ B. Then there exist x1, y1 ∈ V1 such that T (x1) = x2 and T (y1) = y2. Let A = T−1(B) ∈ τ1.
So x1 + y1 ∈ A and there exists A1, A2 ∈ τ1 such that A1 + A2 ∈ A. This implies T (A1 + A2) ∈ T (A). Let B1 = T (A1)
and B2 = T (A2). Then B1, B2 ∈ τ2 and x1 ∈ A1 ⇒ x2 = T (x1) ∈ T (A1) = B1, y1 ∈ A2 ⇒ y2 = T (y1) ∈ T (A2) = B2. Also
B1 + B2 = T (A1) + T (A2) = T (A1 + A2) ⊆ T (A) = B. Let y ∈ V2 and λy ∈ U ∈ τ2 for some scalar λ. Then y = T (x) for
some x ∈ V1 and U = T (W ) for some W ∈ τ1. y = T (x) ⇒ λy = λT (x) = T (λx). So λy ∈ U ⇒ T (λx) ∈ U ⇒ λx ∈ W.
Since τ1 is a linear topology, there exists W ′ in τ1 such that λW ′ ⊆ W . So U ′ = T (W ′) ∈ τ2, y = T (x) ∈ T (W ′) = U ′ and
T (λW ′) = λT (W ′) = λU ′ ⊆ T (W ) = U . Thus τ2 is a linear topology and hence τ1 × τ2 is a binary linear topology.
4. Binary Metrizable and Binary Normable BLTS
Definition 4.1. A binary metric on two sets V1 and V2 is a map d : (V1 × V2) × (V1 × V2) → R satisfying the following
axioms: If (x1, x2), (y1, y2) ∈ V1 × V2 then
(1). d[(x1, x2), (y1, y2)] ≥ 0
(2). d[(x1, x2), (y1, y2)] = 0⇔ x1 = x2 and y1 = y2
(3). d[(x1, x2), (y1, y2)] = d[(y1, y2), (x1, x2)] and
(4). d[(x1, x2), (y1, y2)] ≤ d[(x1, x2), (z1, z2)] + d[(z1, z2), (y1, y2)] for every (z1, z2) ∈ V1 × V2.
Definition 4.2. Let (V1, V2,M) be a BLTS. A binary topology M is metrizable with a binary metric d if for any (x, y) in
some binary open set (A,B) ∈ M, ∃ r > 0 such that Br(x, y) ⊂ (A,B) i.e. π1(Br(x, y)) ⊂ A and π2(Br(x, y)) ⊂ B, where
πi is the projection map to Vi for i = 1, 2.
176

Tresa Mary Chacko and D. Susha
Proposition 4.3. If (V1, τ1) and (V2, τ2) are two linear topological spaces such that τ1 and τ2 are both metrizable with
metrics d1 and d2 respectively, then τ1 × τ2 is binary metrizable.
Proof. Consider the map d : (V1 × V2)× (V1 × V2)→ R defined by
d((x1, x2), (y1, y2)) =d1(x1, y1) + d2(x2, y2)
2, ∀(x1, x2), (y1, y2) ∈ (V1 × V2)
If (x1, x2), (y1, y2) ∈ V1 × V2 then
(1). d[(x1, x2), (y1, y2)] = d1(x1,y1)+d2(x2,y2)2
≥ 0, since d1(x1, y1) and d2(x2, y2) are both non-negative.
(2). d[(x1, x2), (y1, y2)] = d1(x1,y1)+d2(x2,y2)2
= 0 ⇔ d1(x1, y1) = 0 and d2(x2, y2) = 0. This happens if and only if x1 = x2
and y1 = y2 i.e. when (x1, y1) = (x2, y2).
(3). d((x1, x2), (y1, y2)) = d1(x1,y1)+d2(x2,y2)2
= d1(y1,x1)+d2(y2,x2)2
= d((y1, y2), (x1, x2)) and if (z1, z2) ∈ V1 × V2
(4). d[(x1, x2), (y1, y2)] = d1(x1,y1)+d2(x2,y2)2
≤ [d1(x1,z1)+d1(z1,y1)]+[d2(x2,z2)+d2(z2,y2)]2
= d1(x1,z1)+d2(x2,z2)2
+
d1(z1,y1)+d2(z2,y2)2
= d[(x1, x2), (z1, z2)] + d[(z1, z2), (y1, y2)]
Thus d is a binary metric. Let (A,B) ∈ τ1 × τ2 and (x, y) ∈ (A,B). Then x ∈ A ∈ τ1 and y ∈ B ∈ τ2. Since τ1 and τ2 are
metrizable, ∃r1, r2 > 0 with respect to d1 and d2 respectively such that Br1(x) ⊂ A and Br2(y) ⊂ B. i.e. if d1(x, x1) < r1,
then x1 ∈ Br1(x) and if d2(y, y1) < r2, then y1 ∈ Br2(y) ⇒ (x1, y1) ∈ (A,B). Let r = minr1, r2 and (u, v) ∈ Br/2(x, y).
Then d((x, y), (u, v)) < r2. i.e. d1(x,u)+d2(y,v)
2< r/2. So d1(x, u) + d2(y, v) < r ⇒ d1(x, u) < r < r1 and d2(y, v) < r < r2.
Hence u ∈ Br1(x) ⊂ A and v ∈ Br2(y) ⊂ B. Thus (u, v) ∈ (A,B) showing that Br/2(x, y) ⊂ (A,B).
Definition 4.4. A binary seminorm on two vector spaces V1 and V2 is a map, ‖ · ‖ : V1 × V2 → R such that for each
(x1, x2), (y1, y2) ∈ V1 × V2
(1). ‖(x1, x2)‖ ≥ 0
(2). ‖α(x1, x2)‖ =| α | ‖(x1, x2)‖
(3). ‖(x1, x2)+(y1, y2)‖ ≤ ‖(x1, x2)‖+‖(y1, y2)‖ A binary seminorm becomes a binary norm if the following condition holds.
(4). ‖(x1, x2)‖ = 0⇔ (x1, x2) = (0, 0)
Proposition 4.5. If (V1, τ1) and (V2, τ2) are both normable topological vector spaces, then their binary product is binary
normable.
Proof. Let ‖ · ‖1 and ‖ · ‖2 be the norms corresponding to τ1 and τ2 respectively. Then we get two metrics d1 and
d2, defined by di((x1, x2), (y1, y2)) = ‖(x1, x2) − (y1, y2)‖i, i = 1, 2 and (x1, x2), (y1, y2) ∈ V1 × V2, with which τ1 and
τ2 are metrizable respectively. So by Proposition 4.3 τ1 × τ2 is metrizable with the binary metric d((x1, x2), (y1, y2)) =
d1(x1,y1)+d2(x2,y2)2
, ∀(x1, x2), (y1, y2) ∈ (V1 × V2). Hence the binary norm ‖ · ‖ defined by ‖(x1, x2)‖ = d((x1, x2), (0, 0)) for
(x1, x2) ∈ V1×V2 corresponds to the topology τ1×τ2. But this norm is same as ‖·‖1+‖·‖22
since ‖(x1, x2)‖ = d((x1, x2), (0, 0)) =
d1(x1,0)+d2(x2,0)2
= ‖x1−0‖1+‖x2−0‖22
= ‖x1‖1+‖x2‖22
.
Lemma 4.6. Let V1 and V2 be two vector spaces and p be a binary seminorm on V1 × V2 Then there exists two seminorms
p1 and p2 on V1 and V2 respectively.
177
Binary Linear Topological Spaces
Proof. Let p1 : V1 → R be defined by p1(x) = infyp(x, y) : y ∈ V2. Since p(x, y) ≥ 0,∀(x, y) ∈ V1×V2, p1(x) ≥ 0∀x ∈ V1.
For x ∈ V1 and α ∈ K
p1(αx) = infyp(αx, y) : y ∈ V2
= infy| α | p(x, 1
αy) : y ∈ V2
=| α | infyp(x,
1
αy) : y ∈ V2
=| α | p1(x)
For x, y ∈ V1
p1(x+ y) = infzp(x+ y, z) : z ∈ V2
= infz=z1+z2
p(x+ y, z1 + z2) : z = z1 + z2 ∈ V2
= infz1,z2p[(x, z1) + (y, z2)] : z1, z2 ∈ V2
≤ infz1,z2p(x, z1) + p(y, z2) : z1, z2 ∈ V2
Thus p1(x+ y) ≤ p1(x) + p1(y)
Hence p1 is a seminorm on V1 and similarly p2 : V2 → R defined by p2(y) = infxp(x, y) : x ∈ V1 is a seminorm on V2.
Proposition 4.7. Given a family of binary seminorms on two vector spaces V1 and V2, then a locally convex binary linear
topology is formed between V1 and V2.
Proof. Let pαα∈J be a family of binary seminorms on V1 × V2. Corresponding to each pα, α ∈ J , there exists two
seminorms p1α and p2α on V1 and V2 respectively. Thus we get a family of seminorms piαα∈J on Vi, i = 1, 2. Hence by
theorem 2.7 there exists a locally convex linear topology, τi on Vi induced by piαα∈J , i = 1, 2. Then τ1 × τ2 is a locally
convex binary linear topology between V1 and V2.
5. Conclusion
In this paper we have introduced the concept of linear topological spaces to situations in which we have to deal with two
vector spaces and a topology between the spaces. This helps to study both the spaces simultaneously. The concept of
topological vector space is well used in mathematics, engineering and science and particularly in quantum mechanics. Hence
our theory of Binary Linear Topological Spaces helps in the further development of such areas.
Acknowledgement
The author is indebted to the University Grants Commission as the work is under the Faculty Development Programme of
UGC(XII plan).
References
[1] Christopher E. Heil, Lecture Notes:Topologies from seminorms, Comput. Math. Appl. Math., (2008).
178

Tresa Mary Chacko and D. Susha
[2] J.L. Kelley and Isaac Namioka, Linear Topological Spaces, D. Van Nostrand Company, (1968).
[3] S. Nithyanantha Jothi and P. Thangavelu, On Binary Topological Spaces, Pacific-Asian Journal of Mathematics,
5(2)(2011).
[4] S. Nithyanantha Jothi and P. Thangavelu, Topology between two sets, Journal of Mathematical Sciences and Computer
Applications 1(3)(2011), 95-107.
[5] Raz Kupferman, Lecture Notes: Basic Notions in Functional Analysis, TVS, (2013).
179
SEVERAL SEPARATION AXIOMS IN BINARY CECH CLOSURE SPACES
Tresa Mary Chacko
Dept. of Mathematics
Christian College, Chengannur-689122, Kerala. E-mail:[email protected]
and Dr. Susha D.
Dept. of Mathematics
Catholicate College, Pathanamthitta-689645, Kerala. E-mail:[email protected]
Abstract. In [11] we introduced and studied certian separation axioms. In this paper we study some semi higher separation axioms,
mild separation axioms and higher separation axioms in Binary Cech Closure Spaces.
Key Words and Phrases: Binary Cech Closure Space, b-Hausdorff, b-Urysohn, b-regular, b-
normal
AMS Subject Classification: 54A05
ˇ
1. Introduction
Closure spaces were introduced by E.Cech [1] and then studied by many authors
like David Niel Roth[2] .. Cech closure spaces, is a generalisation of the concept of
topological spaces. D. N. Roth and J.W. Carlson [2] studied a number of separation
properties in closure spaces. W. J. Thron studied some separation properties in closure
spaces. T. A. Sunitha[3] studied higher separation properties in closure spaces. P.
Thangavelu and Nithanantha Jothi introduced the concept of binary topology[5]. Tresa
Chacko and D. Susha introduced Binary Cech Closure Spaces in [9].In [11] Tresa Chacko
and D. Susha introduced and studied certian separation axioms.
In this paper we introduce higher separation axioms, some mild separation axioms and
semi separation axioms. The paper is divided as follows:
Section 2 contains the preliminaries.
In section 3 we describes binary point separation axioms and their properties.
Section 4 contains higher separation axioms and semi higher separation axioms.
©JGRMA 2018, All Rights Reserved 5

Section 5 deals with some mild separation axioms and their relation with each other
and with binary point separation axioms.
2. Preliminaries
Definition 2.1. [1] Let X be a set and ℘(X) be its powerset. A function c : ℘(X) →
℘(X) is called a Cech closure operator for X if
(1) c(φ) = φ
(2) A ⊆ c(A)
(3) c(A ∪B) = c(A) ∪ c(B),∀A,B ⊆ X
Then (X, c) is called Cech closure space or simply closure space.
If in addition
(4) c(c(A)) = c(A),∀A ⊆ X,
the space (X, c) is called a Kuratowski (topological) space.
If further
(5) for any family of subsets of X, Ai(i∈I), c(∪i∈IAi) = ∪i∈Ic(Ai), the space is called
a total closure space.
Definition 2.2. [1] A function c : ℘(X) → ℘(X)is called a monotone operator for X
if
(1) c(φ) = φ
(2) A ⊆ c(A)
(3) A ⊆ B ⇒ c(A) ⊆ c(B),∀A,B ⊆ X
Then (X, c) is called monotone space.
Definition 2.3. [5] Let X and Y be any two non-empty sets and ℘(X) and ℘(Y ) be
their power sets respectively. A binary topology from X to Y is a binary structure
M ⊆ ℘(X)× ℘(Y ) that satisfies the following axioms.
(1) (φ, φ) and (X, Y ) ∈M
Tresa Mary Chacko et. al. Journal of Global Research in Mathematical Archives, 5(10), 05-14
©JGRMA 2018, All Rights Reserved 6

(2) If (A1, B1) and (A2, B2) ∈M , then (A1 ∩ A2, B1 ∩B2) ∈M .
(3) If (Aα, Bα) : α ∈ ∆ is a family of members of M , then (∪α∈∆Aα,∪α∈∆Bα) ∈
M.
If M is a binary topology from X to Y then the triplet (X, Y,M) is called a binary
topological space and the members of M are called binary open sets. (C,D) is called
binary closed if (X \ C, Y \D) is binary open.
The elements of X × Y are called the binary points of the binary topological space
(X, Y,M).
Two binary points, (x1, y1) and (x2, y2) are distinct if either x1 6= x2 or y1 6= y2 or both.
They are jointly distinct if both x1 6= x2 and y1 6= y2.
Let (X, Y,M) be a binary topological space and let (x, y) ∈ X×Y . The binary open set
(A,B) is called a binary neighbourhood of (x, y) if x ∈ A and y ∈ B.
If X = Y then M is called a binary topology on X and we write (X,M) as a binary
space.
Note: ℘(X) denotes the power set of a set X.
Definition 2.4. [9] Let X and Y be two sets. A function b : ℘(X)× ℘(Y )→ ℘(X)×
℘(Y ) is called a binary closure (monotone) operator if
b(φ, φ) = (φ, φ)
(A,B) ⊆ b(A,B)
(A,B) ⊆ (C,D)⇒ b(A,B) ⊆ b(C,D).
Then (X, Y, b) is called a binary closure (monotone) space.
The binary closure operator is a binary Cech closure operator if it satisfies
b[(A,B) ∪ (C,D)] = b(A,B) ∪ b(C,D).
Definition 2.5. [9] A set (A,B) ∈ ℘(X)× ℘(Y ) is b-closed if b(A,B) = (A,B) and a
set (C,D) is b-open if b(X \ C, Y \D) = (X \ C, Y \D).
Tresa Mary Chacko et. al. Journal of Global Research in Mathematical Archives, 5(10), 05-14
©JGRMA 2018, All Rights Reserved 7

ˇ
ˇ
Proposition 2.1. [9] Let (X, Y, b) be a binary Cech closure space. Then (φ, φ) and
(X, Y ) are both open and closed.
Proposition 2.2. [9] If (X, c1) and (Y, c2) are two Cech closure spaces, then (X, Y, b)
where b : ℘(X)×℘(Y )→ ℘(X)×℘(Y ) is given by b(A,B) = (c1(A), c2(B)), is a binary
Cech closure operator.
Proposition 2.3. [9] Let (X, Y, b) be a binary Cech closure space. Then the set of all
b-open sets ,i.e. M(b) := (A,B) | b(X \A, Y \B) = (X \A, Y \B) is a binary topology.
3. Binary Separation Properties
Definition 3.1. Let (X, Y, b) be a binary Cech closure space. It is said to be b-T0 if
for every pair of distinct binary points (x1, y1) and (x2, y2) ∈ X × Y , either (x1, y1) /∈
b(x2, y2) or (x2, y2) /∈ b(x1, y1).
Proposition 3.1. If (X, Y, b) is a b-T0 BCCS, then (X, bX) and (Y, bY ) are T0 Cech
closure spaces.
Proof. Let x1, x2 be two distinct points in X and y1, y2 be two distinct points in Y .
Let (X, bX) be not a T0 Cech closure space.
Then there exists two distinct points x1, x2 ∈ X such that x1 ∈ bX(x2) and x2 ∈
bX(x1).
Then for any y ∈ Y, (x1, y) 6= (x2, y).
x2 ∈ bX(x1) and (bX(x1), φ) ⊆ b(x1, y)⇒
(x2, y) ∈ b(x1, y).
Similarly (x1, y) ∈ b(x2, y).ˇHence it contradicts that (X, Y, b) is a b-T0 BCCS. So (X, bX) is a T0 Cech closure
space.
The same case happens when (Y, bY ) is not a T0 Cech closure space.
Hence the theorem.
Tresa Mary Chacko et. al. Journal of Global Research in Mathematical Archives, 5(10), 05-14
©JGRMA 2018, All Rights Reserved 8

ˇ
Remark 3.1. (X, bX) and (Y, bY ) are both T0 Cech closure spaces, need not imply
(X, Y, b) is a b-T0 BCCS.
Definition 3.2. A binary Cech closure space (X, Y, b) is said to be b-T1 if for two
distinct binary points, (x1, y1) and (x2, y2) in X × Y, (x1, y1) /∈ b(x2, y2) and
(x2, y2) /∈ b(x1, y1).
Proposition 3.2. The following statements are equivalent in any binary Cech closure
space.
(1) The space (X, Y, b) is binary-T1.
(2) For any binary point (x, y) ∈ X × Y , (x, y) is b-closed.
(3) If A ⊆ X and B ⊆ Y are both finite sets then, (A,B) is b- closed.
Proof. (1)⇒ (2)
Let (X, Y, b) be T1.
Let (x, y) be not b-closed.
Then b(x, y) 6= (x, y).
i.e. ∃ (x′, y′)[6= (x, y)] ∈ X × Y, such that (x′, y′) ∈ b(x, y). This contradicts the
fact that (X, Y, b) is binary- T1.
(x, y) is b-closed.
(2)⇒ (3)
Since b(A1, B1)∪ b(A2, B2) = b(A1∪B1, A2∪B2), if A and B are finite, (A,B) is b-closed
by (2).
(3)⇒ (2)
Follows directly from (3).
(2)⇒ (1)
If (x1, y1) and (x2, y2) are two distinct binary points in X×Y, (x1, y1) /∈ b(x2, y2) =
Tresa Mary Chacko et. al. Journal of Global Research in Mathematical Archives, 5(10), 05-14
©JGRMA 2018, All Rights Reserved 9

(x2, y2) and (x2, y2) /∈ b(x1, y1) = (x1, y1).
Thus (X, Y, b) is b-T1.
ˇ
Remark 3.2. Every binary-T1 space is binary T0, but the converse is not true.
Proposition 3.3. If (X, Y, b) is a b-T1 BCCS, then (X, bX) and (Y, bY ) are T1 Cech
closure spaces.
Proof. Let (X, Y, b) be b-T1. Then for any (x, y) ∈ X × Y, b(x, y) = (x, y).
We have (bX(x), φ) ⊆ b(x, y)⇒
bX(x) ⊆ x.i.e.bX(x) = x.
Thus bX is a T1 Cech closure operator. Similarly bY is also a T1 Cech closure operator.
Remark 3.3. Converse of the above Proposition need not be true.
Definition 3.3. A binary closure space (X, Y, b) is said to be b-semi-Hausdorff if for
two distinct binary points (x1, y1) and (x2, y2), either there exists a b-open set (U1, V1)
such that (x1, y1) ∈ (U1, V1) and (x2, y2) /∈ b(U1, V1) or there exists a b-open set (U1, V1)
such that (x2, y2) ∈ (U2, V2) and (x1, y1) /∈ b(U2, V2).
If both conditions hold, then (X, Y, b) is called b-pseudo-Hausdorff.
Proposition 3.4. Let a binary closure space (X, Y, b) be b-pseudo-Hausdorff. Then
(X, Y, b) be b-T1.
Proof. Let (X, Y, b) be not b-T1.
Then there exists atleast one binary point (x, y) such that (x, y) 6= b(x, y).
i.e. ∃ a binary point (x′, y′) such that (x′, y′) ∈ b(x, y).
Then if (U, V ) is any b-open set containing (x, y), then (x′, y′) ∈ b(x, y) ⊆ b(U, V ),
showing that (X, Y, b) is not b-pseudo-Hausdorff.
Tresa Mary Chacko et. al. Journal of Global Research in Mathematical Archives, 5(10), 05-14
©JGRMA 2018, All Rights Reserved 10

Proposition 3.5. Let a binary closure space (X, Y, b) be b-pseudo-Hausdorff. Then
(X, bX) and (Y, bY ) are pseudo-Hausdorff Cech closure spaces.
Proof. Let (X, Y, b) be b-pseudo-Hausdorff and (X, bX) be not pseudo-Hausdorff.
Then there exists two distinct points x1, x2 ∈ X, such that, either for every neighbour-
hood U1 of x1, x2 ∈ bX(U1) or for every neighbourhood U2 of x2, x1 ∈ bX(U2).
Without loss of generality we may assume that for every neighbourhood U1 of x1,
x2 ∈ bX(U1) For any y ∈ Y, (x1, y) 6= (x2, y).
Then there exists b-open set (U, V ) such that (x1, y) ∈ (U, V ) and (x2, y) /∈ (U, V ).
Since (U, V ) is a binary neighbourhood of (x1, y), U is a bX-neighbourhood of x1. By
our assumption, x2 ∈ bX(U). Hence (x2, y) ∈ (bX(U), V ) ⊆ b(U, V ), which contradicts
that (X, Y, b) is b-pseudo-Hausdorff.
The same happens when Y is not bY -pseudo Hausdorff.
Definition 3.4. A binary closure space (X, Y, b) is said to be b- Hausdorff if for two
distinct binary points (x1, y1) and (x2, y2), there exists binary neighbourhoods (U1, V1)
and (U2, V2) of (x1, y1) and (x2, y2) respectively such that (U1, V1) ∩ (U2, V2) = (φ, φ).
Proposition 3.6. Let (X, Y, b) is said to be b- Hausdorff. Then (X, bX) and (Y, bY )
are Hausdorff Cech closure spaces.
Proof. Let x1 6= x2 ∈ X and y1 6= y2 ∈ Y .Then (x1, y1) 6= (x2, y2). Hence there exists
binary neighbourhoods (U1, V1) and (U2, V2) of (x1, y1) and (x2, y2) respectively such
that (U1, V1)∩ (U2, V2) = (φ, φ). Then U1, U2, V1, V2 are neighbourhoods of x1, x2, y1, y2
respectively. Also U1 ∩ U2 = φ and V1 ∩ V2 = φ, showing that (X, bX) and (Y, bY ) are
Hausdorff Cech closure spaces.
Tresa Mary Chacko et. al. Journal of Global Research in Mathematical Archives, 5(10), 05-14
©JGRMA 2018, All Rights Reserved 11

Definition 3.5. A binary closure space (X, Y, b) is said to be b-Urysohn space if for
two distinct binary points (x1, y1), (x2, y2) there exists binary open sets (U1, V1), (U2, V2)
such that (x1, y1) ∈ (U1, V1), (x2, y2) ∈ (U2, V2) and b(U1, V1) ∩ b(U2, V2) = (φ, φ).
4. Higher separation axioms
Definition 4.1. A binary closure space (X, Y, b) is said to be
(1) b-Urysohn space if for two distinct binary points (x1, y1), (x2, y2) there exists b-
open sets (U1, V1), (U2, V2) such that (x1, y1) ∈ (U1, V1), (x2, y2) ∈ (U2, V2) and
b(U1, V1) ∩ b(U2, V2) = (φ, φ).
(2) b-quasi regular if for every binary point (x, y) and a b-closed set (A,B) not
containing (x, y), there exists a b-open set (U, V ) such that (x, y) ∈ (U, V ) and
b(U, V ) ∩ (A,B) = (φ, φ).
(3) b-semi regular if for every binary point (x, y) and a b-closed set (A,B) not con-
taining (x, y), there exists a b-open set (U, V ) such that (A,B) ⊆ (U, V ) and
(x, y) /∈ b(U, V ).
(4) b-pseudo regular if both the above conditions hold.
(5) b-regular if for each binary point (x, y) and each binary set (A,B) such that
(x, y) /∈ b(A,B), there exists binary neighbourhoods (U1, V1) of (x, y) and (U2, V2)
of (A,B) such that (U1, V1) ∩ (U2, V2) = (φ, φ).
(6) b-semi normal if for each pair of jointly disjoint b-closed sets (A1, B1) and
(A2, B2), either there exists a b-open set (U1, V1) such that (A1, B1) ⊆ (U1, V1)
and b(U1, V1) ∩ (A2, B2) = (φ, φ) or there exists a b-open set (U2, V2) such that
(A2, B2) ⊆ (U2, V2) and b(U2, V2) ∩ (A1, B1) = (φ, φ)
(7) b-pseudo normal if both the conditions in 6 hold.
(8) b-normal if for any pair of jointly disjoint b-closed sets (A1, B1) and (A2, B2),
there exists disjoint b-neighbourhoods (U1, V1) and (U2, V2) containing (A1, B1)
and (A2, B2) respectively.
Tresa Mary Chacko et. al. Journal of Global Research in Mathematical Archives, 5(10), 05-14
©JGRMA 2018, All Rights Reserved 12

ˇProposition 4.1. A BCCS (X, Y, b) is
(1) b-Urysohn ⇒ b-Hausdorff
(2) b-regular and b-T1 ⇒ b-Hausdorff
(3) b-normal and b-T1 ⇒
ˇ
b-regular.
5. Mild binary separation axioms
Definition 5.1. Let (X, Y, b) be a BCCS. Then it is
(1) b- R0 if for each pair of binary points (x1, y1), (x2, y2), (x1, y1) ∈ b(x2, y2)⇒
(x2, y2) ∈ b(x1, y1).
(2) b-R1 if for each pair of binary points (x1, y1), (x2, y2), either b(x1, y1) ∩
b(x2, y2) = (φ, φ) or b(x1, y1) = b(x2, y2).
(3) b-Z0 if for each pair of distinct binary points (x1, y1), (x2, y2), b(x1, y1) ∩
b(x2, y2) = (φ, φ) or (x, y) for some x ∈ X and y ∈ Y .
(4) b-Z1 if for each pair of distinct binary points (x1, y1), (x2, y2), b(x1, y1) ∩
b(x2, y2) = (φ, φ) or (x1, y1) or (x2, y2).
(5) b-F0 if for each binary point (x, y) and a binary set (A,B) not containing (x, y),
either (x, y) /∈ b(A,B) or b(x, y) ∩ (A,B) = (φ, φ).
(6) b-F1 if for each pair of jointly disjoint binary sets (A,B) and (C,D), either
b(A,B) ∩ (C,D) = (φ, φ) or b(C,D) ∩ (A,B) = (φ, φ).
Proposition 5.1. A binary closure space (X, Y, b) is
(1) b-T1 ⇒ b-R1 ⇒ b-R0
(2) b-T1 ⇒ b-Z1 ⇒ b-Z0
(3) b-T1 ⇒ b-F1 ⇒ b-F0
6. Conclusion
Acknowledgement: The author is indebted to the University Grants Commission
as the work is under the Faculty Development Programme of UGC(XII plan).
Tresa Mary Chacko et. al. Journal of Global Research in Mathematical Archives, 5(10), 05-14
©JGRMA 2018, All Rights Reserved 13

References
[1] E. Cech, Topological spaces, Topological papers of Eduard Cech, Academia Prague, (1968)436-472
[2] D. N. Roth, Cech closure spaces, Ph. D. thesis, Emporia State University (1979)
https://esirc.emporia.edu/bitstream/handle/123456789/2287/Roth
[3] T. A. Sunitha, A study on Cech closure spaces, Ph. D. thesis, Cochin University (1994)
https://dyuthi.cusat.ac.in/xmlui/bitstream/handle/purl/1665/Dyuthi-T0272.pdf?sequence=3
[4] Nithyanantha Jothi S. and P. Thangavelu; On Binary Topological Spaces, Pacific-Asian Journal of Mathematics,
Vol. 5, No.2, Jul-Dec, 2011
[5] Nithyanantha Jothi S. and P. Thangavelu; Topology between two sets, Journal of Mathematical Sciences and Com-
puter Applications 1(3);95-107, 2011. https://doi.org/10.5147/jmsca.v1i3.96
[6] Tresa Chacko and D. Susha; Linear Ideals and Linear Grills in Topological Vector Spaces, International Journal of
Mathematics Trends and Technology , Vol 48(4);245-249,2017
[7] Tresa Chacko and D. Susha; Binary Linear Topological Spaces,International Journal of Mathematics And its Ap-
plications, Vol 6(2A);173179,2018
[8] Tresa Chacko and D. Susha; Linear Cech Closure Spaces, accepted by Journal of Linear and Topological Algebra.
[9] Tresa Chacko and D. Susha; Binary Cech Closure Spaces, communicated.
[10] Tresa Chacko and D. Susha; Binary Cech Closure Spaces using Binary Ideals and Binary Grills, communicated.
[11] Tresa Chacko and D. Susha; Separation, Connectedness and Compactness in Binary Cech Closure Spaces, com-
municated.
Tresa Mary Chacko et. al. Journal of Global Research in Mathematical Archives, 5(10), 05-14
©JGRMA 2018, All Rights Reserved 14


4440 Tresa Mary Chacko and D. Susha
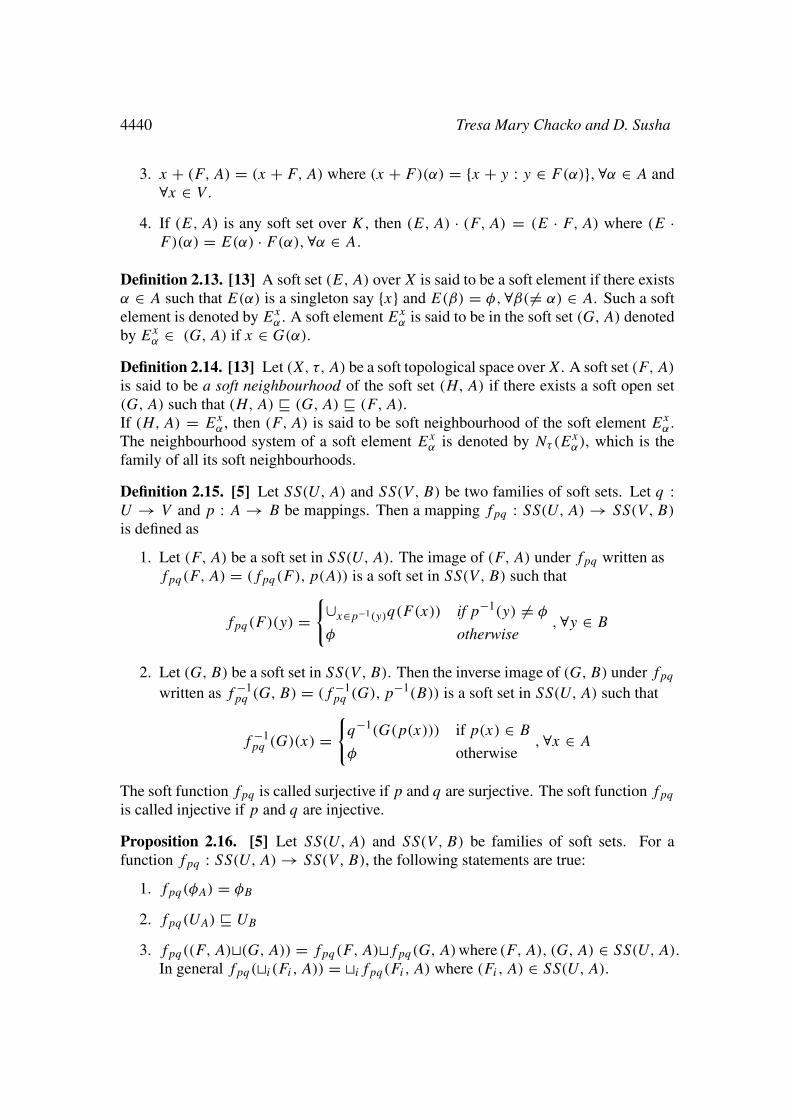
3. x + (F, A) = (x + F, A) where (x + F)(α) = x + y : y ∈ F(α), ∀α ∈ A and∀x ∈ V.
4. If (E, A) is any soft set over K , then (E, A) · (F, A) = (E · F, A) where (E ·F)(α) = E(α) · F(α), ∀α ∈ A.
Definition 2.13. [13] A soft set (E, A) over X is said to be a soft element if there existsα ∈ A such that E(α) is a singleton say x and E(β) = φ, ∀β(= α) ∈ A. Such a softelement is denoted by Ex
α . A soft element Exα is said to be in the soft set (G, A) denoted
by Exα ∈ (G, A) if x ∈ G(α).
Definition 2.14. [13] Let (X, τ, A) be a soft topological space over X. A soft set (F, A)
is said to be a soft neighbourhood of the soft set (H, A) if there exists a soft open set(G, A) such that (H, A) (G, A) (F, A).If (H, A) = Ex
α , then (F, A) is said to be soft neighbourhood of the soft element Exα .
The neighbourhood system of a soft element Exα is denoted by Nτ(E
xα), which is the
family of all its soft neighbourhoods.
Definition 2.15. [5] Let SS(U, A) and SS(V, B) be two families of soft sets. Let q :U → V and p : A → B be mappings. Then a mapping fpq : SS(U, A) → SS(V, B)
is defined as
1. Let (F, A) be a soft set in SS(U, A). The image of (F, A) under fpq written asfpq(F, A) = (fpq(F ), p(A)) is a soft set in SS(V, B) such that
fpq(F )(y) =
∪x∈p−1(y)q(F (x)) if p−1(y) = φ
φ otherwise, ∀y ∈ B
2. Let (G, B) be a soft set in SS(V, B). Then the inverse image of (G, B) under fpq
written as f −1pq (G, B) = (f −1
pq (G), p−1(B)) is a soft set in SS(U, A) such that
f −1pq (G)(x) =
q−1(G(p(x))) if p(x) ∈ B
φ otherwise, ∀x ∈ A
The soft function fpq is called surjective if p and q are surjective. The soft function fpq
is called injective if p and q are injective.
Proposition 2.16. [5] Let SS(U, A) and SS(V, B) be families of soft sets. For afunction fpq : SS(U, A) → SS(V, B), the following statements are true:
1. fpq(φA) = φB
2. fpq(UA) UB
3. fpq((F, A)(G, A)) = fpq(F, A)fpq(G, A)where (F, A), (G, A) ∈ SS(U, A).
In general fpq(i(Fi, A)) = ifpq(Fi, A) where (Fi, A) ∈ SS(U, A).

Scanned with CamScanner
Scanned with CamScanner
Scanned with CamScanner


Scanned by CamScanner

Scanned by CamScanner
Scanned by CamScanner

26th International Photovoltaic Science and Engineering26th International Photovoltaic Science and Engineering26th International Photovoltaic Science and Engineering26th International Photovoltaic Science and Engineering
Conference (PVSECConference (PVSECConference (PVSECConference (PVSEC----26) in Singapore26) in Singapore26) in Singapore26) in Singapore
34
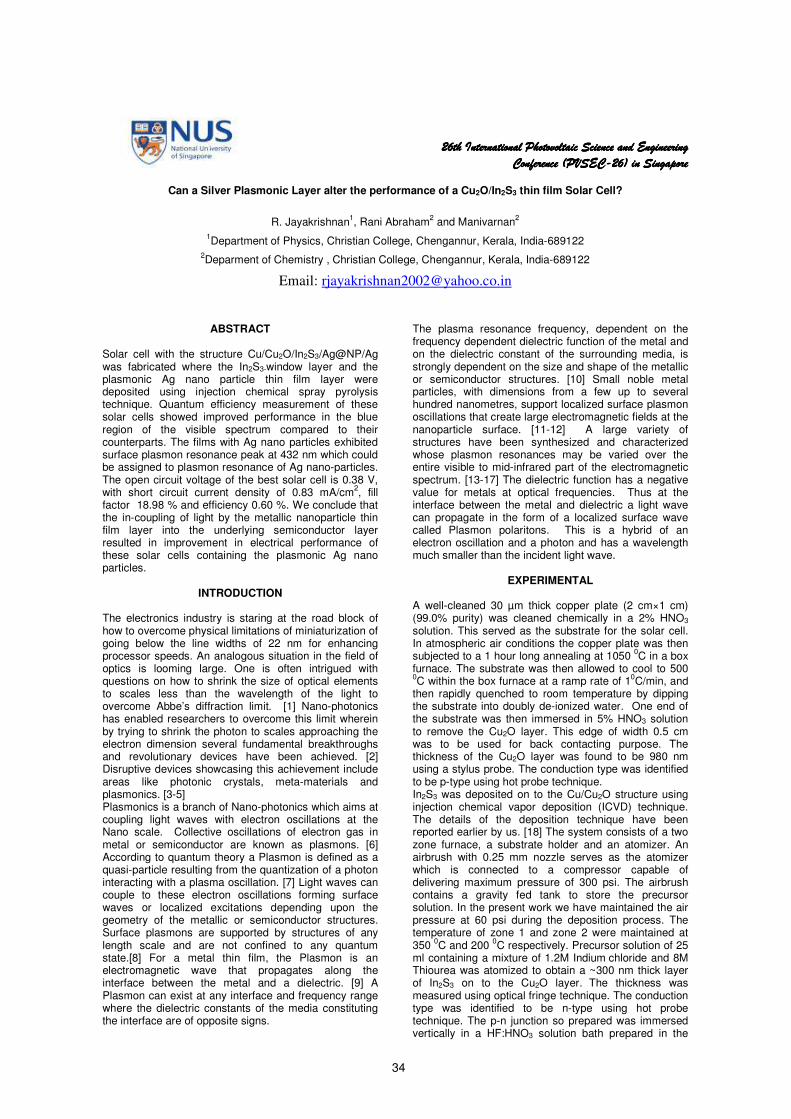
Can a Silver Plasmonic Layer alter the performance of a Cu2O/In2S3 thin film Solar Cell?
R. Jayakrishnan
1, Rani Abraham
2 and Manivarnan
2
1Department of Physics, Christian College, Chengannur, Kerala, India-689122
2Deparment of Chemistry , Christian College, Chengannur, Kerala, India-689122
Email: [email protected]
ABSTRACT
Solar cell with the structure Cu/Cu2O/In2S3/Ag@NP/Ag was fabricated where the In2S3-window layer and the plasmonic Ag nano particle thin film layer were deposited using injection chemical spray pyrolysis technique. Quantum efficiency measurement of these solar cells showed improved performance in the blue region of the visible spectrum compared to their counterparts. The films with Ag nano particles exhibited surface plasmon resonance peak at 432 nm which could be assigned to plasmon resonance of Ag nano-particles. The open circuit voltage of the best solar cell is 0.38 V, with short circuit current density of 0.83 mA/cm
2, fill
factor 18.98 % and efficiency 0.60 %. We conclude that the in-coupling of light by the metallic nanoparticle thin film layer into the underlying semiconductor layer resulted in improvement in electrical performance of these solar cells containing the plasmonic Ag nano particles.
INTRODUCTION The electronics industry is staring at the road block of how to overcome physical limitations of miniaturization of going below the line widths of 22 nm for enhancing processor speeds. An analogous situation in the field of optics is looming large. One is often intrigued with questions on how to shrink the size of optical elements to scales less than the wavelength of the light to overcome Abbe’s diffraction limit. [1] Nano-photonics has enabled researchers to overcome this limit wherein by trying to shrink the photon to scales approaching the electron dimension several fundamental breakthroughs and revolutionary devices have been achieved. [2] Disruptive devices showcasing this achievement include areas like photonic crystals, meta-materials and plasmonics. [3-5] Plasmonics is a branch of Nano-photonics which aims at coupling light waves with electron oscillations at the Nano scale. Collective oscillations of electron gas in metal or semiconductor are known as plasmons. [6] According to quantum theory a Plasmon is defined as a quasi-particle resulting from the quantization of a photon interacting with a plasma oscillation. [7] Light waves can couple to these electron oscillations forming surface waves or localized excitations depending upon the geometry of the metallic or semiconductor structures. Surface plasmons are supported by structures of any length scale and are not confined to any quantum state.[8] For a metal thin film, the Plasmon is an electromagnetic wave that propagates along the interface between the metal and a dielectric. [9] A Plasmon can exist at any interface and frequency range where the dielectric constants of the media constituting the interface are of opposite signs.
The plasma resonance frequency, dependent on the frequency dependent dielectric function of the metal and on the dielectric constant of the surrounding media, is strongly dependent on the size and shape of the metallic or semiconductor structures. [10] Small noble metal particles, with dimensions from a few up to several hundred nanometres, support localized surface plasmon oscillations that create large electromagnetic fields at the nanoparticle surface. [11-12] A large variety of structures have been synthesized and characterized whose plasmon resonances may be varied over the entire visible to mid-infrared part of the electromagnetic spectrum. [13-17] The dielectric function has a negative value for metals at optical frequencies. Thus at the interface between the metal and dielectric a light wave can propagate in the form of a localized surface wave called Plasmon polaritons. This is a hybrid of an electron oscillation and a photon and has a wavelength much smaller than the incident light wave.
EXPERIMENTAL A well-cleaned 30 µm thick copper plate (2 cm×1 cm) (99.0% purity) was cleaned chemically in a 2% HNO3 solution. This served as the substrate for the solar cell. In atmospheric air conditions the copper plate was then subjected to a 1 hour long annealing at 1050
0C in a box
furnace. The substrate was then allowed to cool to 500 0C within the box furnace at a ramp rate of 1
0C/min, and
then rapidly quenched to room temperature by dipping the substrate into doubly de-ionized water. One end of the substrate was then immersed in 5% HNO3 solution to remove the Cu2O layer. This edge of width 0.5 cm was to be used for back contacting purpose. The thickness of the Cu2O layer was found to be 980 nm using a stylus probe. The conduction type was identified to be p-type using hot probe technique. In2S3 was deposited on to the Cu/Cu2O structure using injection chemical vapor deposition (ICVD) technique. The details of the deposition technique have been reported earlier by us. [18] The system consists of a two zone furnace, a substrate holder and an atomizer. An airbrush with 0.25 mm nozzle serves as the atomizer which is connected to a compressor capable of delivering maximum pressure of 300 psi. The airbrush contains a gravity fed tank to store the precursor solution. In the present work we have maintained the air pressure at 60 psi during the deposition process. The temperature of zone 1 and zone 2 were maintained at 350
0C and 200
0C respectively. Precursor solution of 25
ml containing a mixture of 1.2M Indium chloride and 8M Thiourea was atomized to obtain a ~300 nm thick layer of In2S3 on to the Cu2O layer.
The thickness was
measured using optical fringe technique. The conduction type was identified to be n-type using hot probe technique. The p-n junction so prepared was immersed vertically in a HF:HNO3 solution bath prepared in the
26th International Photovoltaic Science and Engineering26th International Photovoltaic Science and Engineering26th International Photovoltaic Science and Engineering26th International Photovoltaic Science and Engineering
Conference (PVSECConference (PVSECConference (PVSECConference (PVSEC----26) in Singapore26) in Singapore26) in Singapore26) in Singapore
35
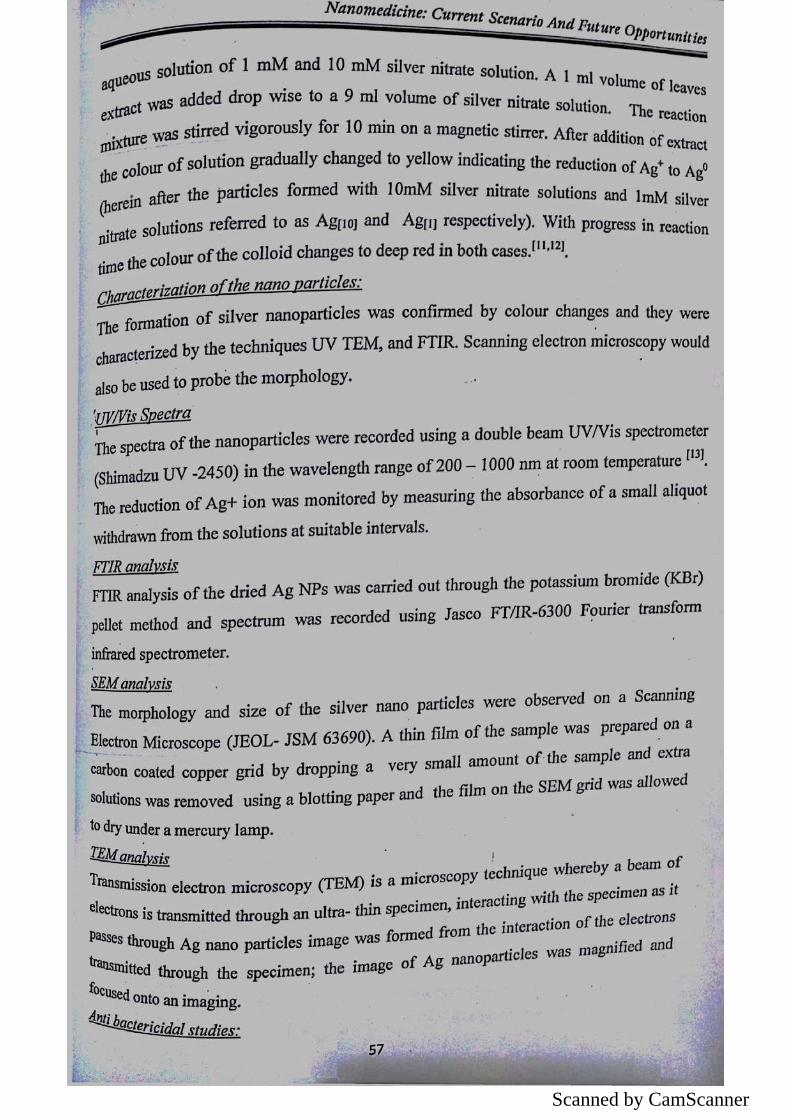
ratio 1:2 for 2 minutes. This was done to obtain a textured In2S3 surface which would support light trapping. Ag nanostructures were prepared by the reduction of Ag+ solution using cane sugar juice. The reducing sugars and phenolics present in the juice are primarily responsible for the reduction of Ag+ ions to Ag (0) and its subsequent capping. To an aqueous solution of AgNO3 (2ml, 0.1M) clarified cane sugar juice was added under vigorous stirring. A reddish sol started forming after 30 min. The stirring was continued for another 30 min and the obtained colloidal solution was left in the dark for 24 hours aimed at completion of the reaction. The particles were then centrifuged (14000 rpm, 10min) and purified by four cycles of repeated centrifugation and re-dispersion in double distilled water by sonication. The solution so prepared was used to deposit a thin film using ICVD technique as described above on to the Cu/Cu2O/In2S3 hetero-structure. The thickness of the Ag thin films deposited was ~ 80 nm. The thickness was measured using optical fringe technique. A Ag electrode of 5 mm
2 area was deposited on to this plasmonic layer.
The hetero-structure Cu/Cu2O/In2S3/Ag@NP/Ag fabricated herein is hereafter called as the “plasmonic solar cell” in this report. A schematic of the cell structure is given in figure 1. The effective area of the illuminated solar cell was 0.78 cm
2.
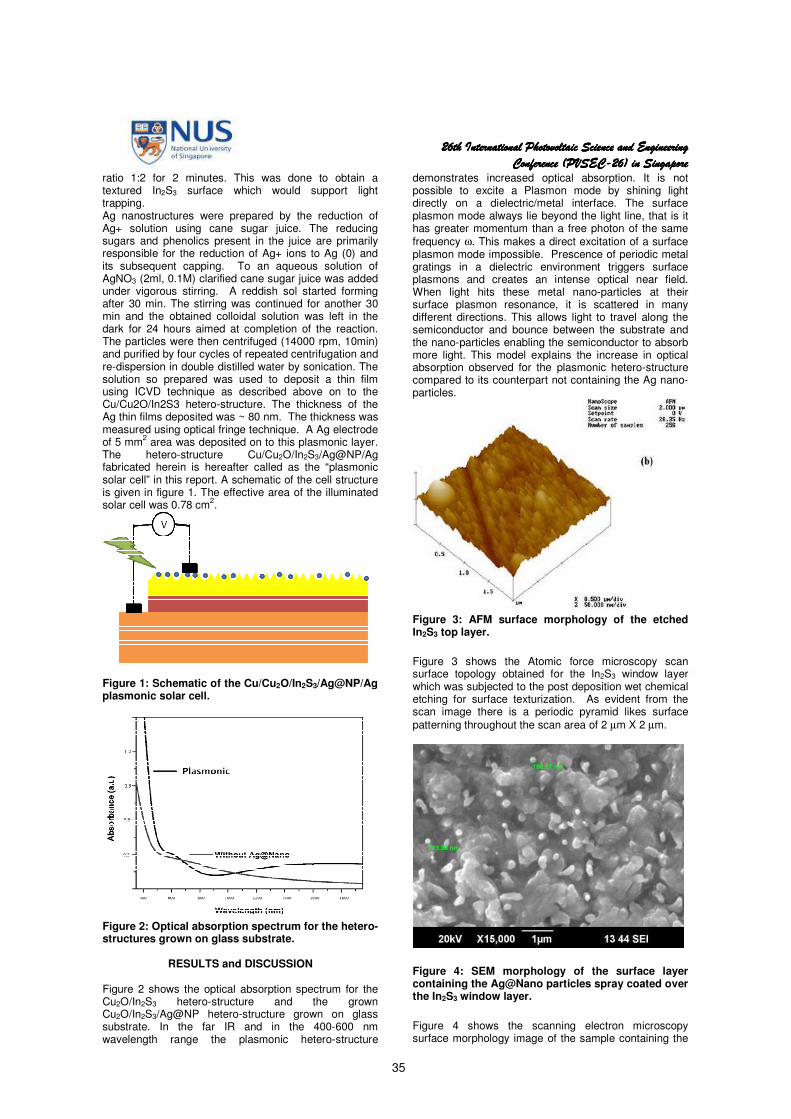
Figure 1: Schematic of the Cu/Cu2O/In2S3/Ag@NP/Ag plasmonic solar cell.
Figure 2: Optical absorption spectrum for the hetero-structures grown on glass substrate.
RESULTS and DISCUSSION
Figure 2 shows the optical absorption spectrum for the Cu2O/In2S3 hetero-structure and the grown Cu2O/In2S3/Ag@NP hetero-structure grown on glass substrate. In the far IR and in the 400-600 nm wavelength range the plasmonic hetero-structure
demonstrates increased optical absorption. It is not possible to excite a Plasmon mode by shining light directly on a dielectric/metal interface. The surface plasmon mode always lie beyond the light line, that is it has greater momentum than a free photon of the same
frequency ω. This makes a direct excitation of a surface plasmon mode impossible. Prescence of periodic metal gratings in a dielectric environment triggers surface plasmons and creates an intense optical near field. When light hits these metal nano-particles at their surface plasmon resonance, it is scattered in many different directions. This allows light to travel along the semiconductor and bounce between the substrate and the nano-particles enabling the semiconductor to absorb more light. This model explains the increase in optical absorption observed for the plasmonic hetero-structure compared to its counterpart not containing the Ag nano-particles.
Figure 3: AFM surface morphology of the etched In2S3 top layer.
Figure 3 shows the Atomic force microscopy scan surface topology obtained for the In2S3 window layer which was subjected to the post deposition wet chemical etching for surface texturization. As evident from the scan image there is a periodic pyramid likes surface
patterning throughout the scan area of 2 µm X 2 µm.
Figure 4: SEM morphology of the surface layer containing the Ag@Nano particles spray coated over the In2S3 window layer.
Figure 4 shows the scanning electron microscopy surface morphology image of the sample containing the
26th International Photovoltaic Science and Engineering26th International Photovoltaic Science and Engineering26th International Photovoltaic Science and Engineering26th International Photovoltaic Science and Engineering
Conference (PVSECConference (PVSECConference (PVSECConference (PVSEC----26) in Singapore26) in Singapore26) in Singapore26) in Singapore
36
Ag@Nano particle spray coated over the etched In2S3 layer. The image clearly shows that there are certain agglomerates distributed randomly over the surface. The average size of the agglomerates was found to be ~ 180 nm.
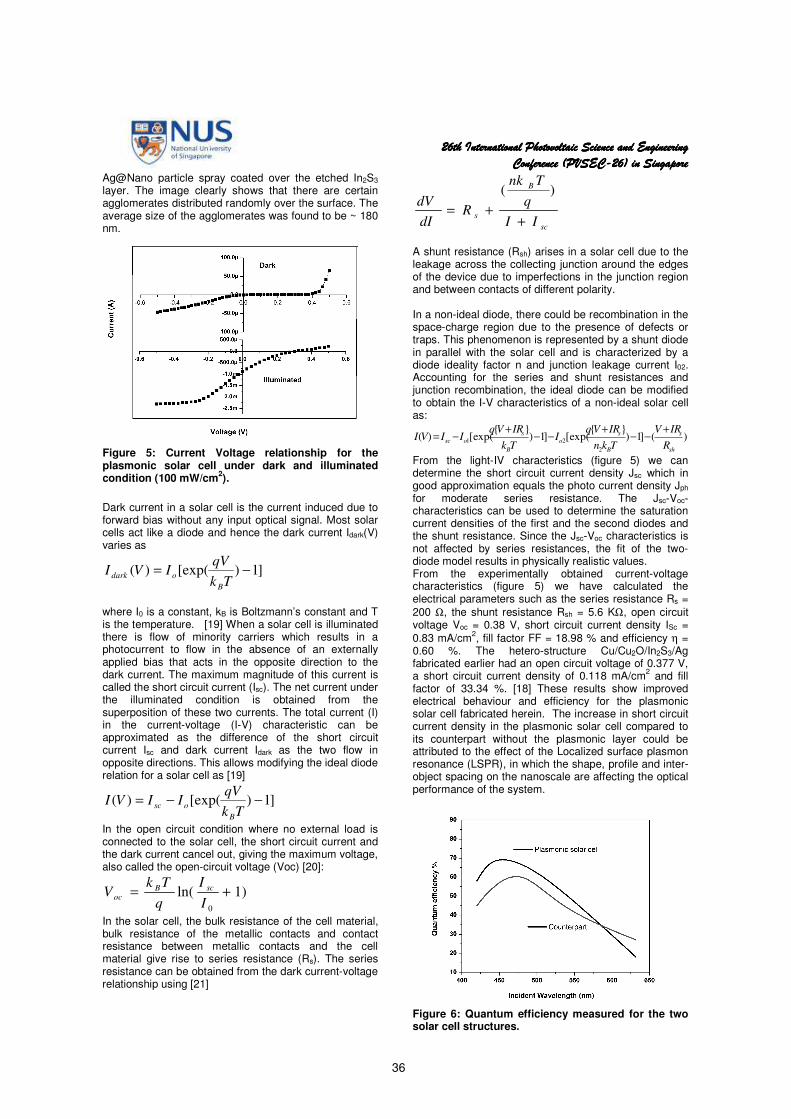
Figure 5: Current Voltage relationship for the plasmonic solar cell under dark and illuminated condition (100 mW/cm
2).
Dark current in a solar cell is the current induced due to forward bias without any input optical signal. Most solar cells act like a diode and hence the dark current Idark(V) varies as
]1)[exp()( −=Tk
qVIVI
B
odark
where I0 is a constant, kB is Boltzmann’s constant and T is the temperature. [19] When a solar cell is illuminated there is flow of minority carriers which results in a photocurrent to flow in the absence of an externally applied bias that acts in the opposite direction to the dark current. The maximum magnitude of this current is called the short circuit current (Isc). The net current under the illuminated condition is obtained from the superposition of these two currents. The total current (I) in the current-voltage (I-V) characteristic can be approximated as the difference of the short circuit current Isc and dark current Idark as the two flow in opposite directions. This allows modifying the ideal diode relation for a solar cell as [19]
]1)[exp()( −−=Tk
qVIIVI
B
osc
In the open circuit condition where no external load is connected to the solar cell, the short circuit current and the dark current cancel out, giving the maximum voltage, also called the open-circuit voltage (Voc) [20]:
)1ln(0
+=I
I
q
TkV scB
oc
In the solar cell, the bulk resistance of the cell material, bulk resistance of the metallic contacts and contact resistance between metallic contacts and the cell material give rise to series resistance (Rs). The series resistance can be obtained from the dark current-voltage relationship using [21]
sc
B
sII
q
Tnk
RdI
dV
++=
)(
A shunt resistance (Rsh) arises in a solar cell due to the leakage across the collecting junction around the edges of the device due to imperfections in the junction region and between contacts of different polarity. In a non-ideal diode, there could be recombination in the space-charge region due to the presence of defects or traps. This phenomenon is represented by a shunt diode in parallel with the solar cell and is characterized by a diode ideality factor n and junction leakage current I02. Accounting for the series and shunt resistances and junction recombination, the ideal diode can be modified to obtain the I-V characteristics of a non-ideal solar cell as:
)(]1)
[exp(]1)
[exp()(2
21
sh
s
B
s
o
B
s
oscR
IRV
Tkn
IRVqI
Tk
IRVqIIVI
+−−
+−−
+−=
From the light-IV characteristics (figure 5) we can determine the short circuit current density Jsc which in good approximation equals the photo current density Jph for moderate series resistance. The Jsc-Voc-characteristics can be used to determine the saturation current densities of the first and the second diodes and the shunt resistance. Since the Jsc-Voc characteristics is not affected by series resistances, the fit of the two-diode model results in physically realistic values. From the experimentally obtained current-voltage characteristics (figure 5) we have calculated the electrical parameters such as the series resistance Rs =
200 Ω, the shunt resistance Rsh = 5.6 KΩ, open circuit voltage Voc = 0.38 V, short circuit current density ISc =
0.83 mA/cm2, fill factor FF = 18.98 % and efficiency η =
0.60 %. The hetero-structure Cu/Cu2O/In2S3/Ag fabricated earlier had an open circuit voltage of 0.377 V, a short circuit current density of 0.118 mA/cm
2 and fill
factor of 33.34 %. [18] These results show improved electrical behaviour and efficiency for the plasmonic solar cell fabricated herein. The increase in short circuit current density in the plasmonic solar cell compared to its counterpart without the plasmonic layer could be attributed to the effect of the Localized surface plasmon resonance (LSPR), in which the shape, profile and inter-object spacing on the nanoscale are affecting the optical performance of the system.
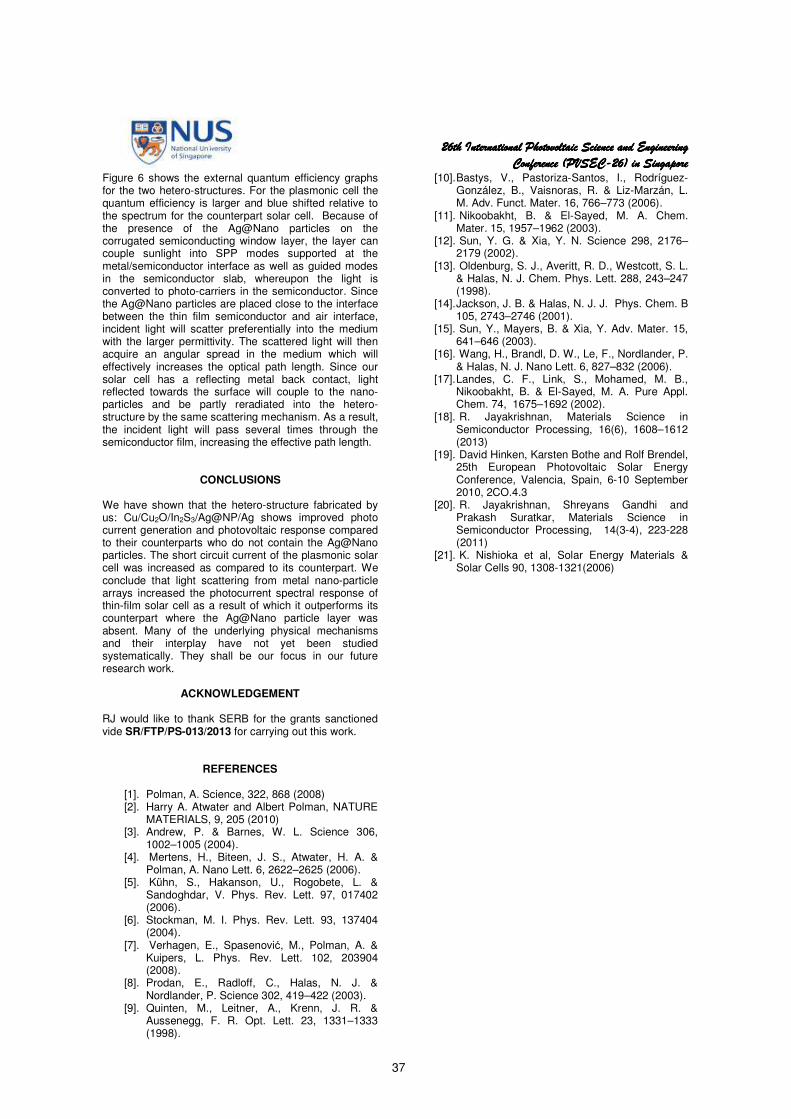
Figure 6: Quantum efficiency measured for the two solar cell structures.
26th International Photovoltaic Science and Engineering26th International Photovoltaic Science and Engineering26th International Photovoltaic Science and Engineering26th International Photovoltaic Science and Engineering
Conference (PVSECConference (PVSECConference (PVSECConference (PVSEC----26) in Singapore26) in Singapore26) in Singapore26) in Singapore
37
Figure 6 shows the external quantum efficiency graphs for the two hetero-structures. For the plasmonic cell the quantum efficiency is larger and blue shifted relative to the spectrum for the counterpart solar cell. Because of the presence of the Ag@Nano particles on the corrugated semiconducting window layer, the layer can couple sunlight into SPP modes supported at the metal/semiconductor interface as well as guided modes in the semiconductor slab, whereupon the light is converted to photo-carriers in the semiconductor. Since the Ag@Nano particles are placed close to the interface between the thin film semiconductor and air interface, incident light will scatter preferentially into the medium with the larger permittivity. The scattered light will then acquire an angular spread in the medium which will effectively increases the optical path length. Since our solar cell has a reflecting metal back contact, light reflected towards the surface will couple to the nano-particles and be partly reradiated into the hetero-structure by the same scattering mechanism. As a result, the incident light will pass several times through the semiconductor film, increasing the effective path length.
CONCLUSIONS
We have shown that the hetero-structure fabricated by us: Cu/Cu2O/In2S3/Ag@NP/Ag shows improved photo current generation and photovoltaic response compared to their counterparts who do not contain the Ag@Nano particles. The short circuit current of the plasmonic solar cell was increased as compared to its counterpart. We conclude that light scattering from metal nano-particle arrays increased the photocurrent spectral response of thin-film solar cell as a result of which it outperforms its counterpart where the Ag@Nano particle layer was absent. Many of the underlying physical mechanisms and their interplay have not yet been studied systematically. They shall be our focus in our future research work.
ACKNOWLEDGEMENT
RJ would like to thank SERB for the grants sanctioned vide SR/FTP/PS-013/2013 for carrying out this work.
REFERENCES
[1]. Polman, A. Science, 322, 868 (2008) [2]. Harry A. Atwater and Albert Polman, NATURE
MATERIALS, 9, 205 (2010) [3]. Andrew, P. & Barnes, W. L. Science 306,
1002–1005 (2004). [4]. Mertens, H., Biteen, J. S., Atwater, H. A. &
Polman, A. Nano Lett. 6, 2622–2625 (2006). [5]. Kühn, S., Hakanson, U., Rogobete, L. &
Sandoghdar, V. Phys. Rev. Lett. 97, 017402 (2006).
[6]. Stockman, M. I. Phys. Rev. Lett. 93, 137404 (2004).
[7]. Verhagen, E., Spasenović, M., Polman, A. & Kuipers, L. Phys. Rev. Lett. 102, 203904 (2008).
[8]. Prodan, E., Radloff, C., Halas, N. J. & Nordlander, P. Science 302, 419–422 (2003).
[9]. Quinten, M., Leitner, A., Krenn, J. R. & Aussenegg, F. R. Opt. Lett. 23, 1331–1333 (1998).
[10]. Bastys, V., Pastoriza-Santos, I., Rodríguez-González, B., Vaisnoras, R. & Liz-Marzán, L. M. Adv. Funct. Mater. 16, 766–773 (2006).
[11]. Nikoobakht, B. & El-Sayed, M. A. Chem. Mater. 15, 1957–1962 (2003).
[12]. Sun, Y. G. & Xia, Y. N. Science 298, 2176–2179 (2002).
[13]. Oldenburg, S. J., Averitt, R. D., Westcott, S. L. & Halas, N. J. Chem. Phys. Lett. 288, 243–247 (1998).
[14]. Jackson, J. B. & Halas, N. J. J. Phys. Chem. B 105, 2743–2746 (2001).
[15]. Sun, Y., Mayers, B. & Xia, Y. Adv. Mater. 15, 641–646 (2003).
[16]. Wang, H., Brandl, D. W., Le, F., Nordlander, P. & Halas, N. J. Nano Lett. 6, 827–832 (2006).
[17]. Landes, C. F., Link, S., Mohamed, M. B., Nikoobakht, B. & El-Sayed, M. A. Pure Appl. Chem. 74, 1675–1692 (2002).
[18]. R. Jayakrishnan, Materials Science in Semiconductor Processing, 16(6), 1608–1612 (2013)
[19]. David Hinken, Karsten Bothe and Rolf Brendel, 25th European Photovoltaic Solar Energy Conference, Valencia, Spain, 6-10 September 2010, 2CO.4.3
[20]. R. Jayakrishnan, Shreyans Gandhi and Prakash Suratkar, Materials Science in Semiconductor Processing, 14(3-4), 223-228 (2011)
[21]. K. Nishioka et al, Solar Energy Materials & Solar Cells 90, 1308-1321(2006)

www.ejpmr.com
Latha et al. European Journal of Pharmaceutical and Medical Research
180
THERAPEUTIC POTENTIAL OF THE PHYTOCHEMICALS IN CASSIA
OCCIDENTALIS-A REVIEW
Rekha U.1, Thomas J.
2, Thomas V.
3, Tiju J. M.
3, Prakash P.
2 and Latha M. S.*
4
1Department of Chemistry, Christian College Chengannur, Kerala India.
2Department of Chemistry, Thiagarajar College, Madurai, India.
3Department of Physics, Christian College Chengannur, Kerala India.
4Department of Chemistry, Sree Narayana College Chengannur, Kerala India.
Article Received on 12/07/2016 Article Revised on 01/08/2016 Article Accepted on 22/08/2016
INTRODUCTION Cassia is a genus of flowering plants in the legume
family, Fabaceae and the subfamily Caesalpinioideae.
Species are known commonly as cassias. There are
hundreds of Cassia species[1]
. Among them, Cassia
occidentalis Linn is an annual or perennial plant which is
used in several traditional medicines to cure various
diseases[2]
. It is distributed throughout India and in most
tropical countries[3]
. It is known by different names[4]
such as, Badikanodi, Chakunda and Kasonda in Hindi,
Coffee Senna, Foetid Cassia, Negro Coffee, Rubbish
Cassia, and Stinking Weed in English, Kasamarda in
Sanskrit, Chakundra Talka in Rajasthani , Payaverai, and
Nattam Takarai,Payaveri in Tamil.
It is worth to mention that, different parts of the plant
have similar properties such as purgative, tonic,
febrifugal, expectorant and diuretic property. The plant is
used to cure sore eyes, haematuria, rheumatism, typhoid,
asthma and disorders of hemoglobin. Its effective use for
curing leprosy has also been reported. A decoction of the
plant is used in hysteria, in dysentery and other stomach
troubles and also as an application to sores, itch and
inflammation of the rectum. The plant is employed in
dropsy and as a vermifuge, anticonvulsant and used
against chicken pox[5-6]. Along with other plants, it is
made into an ointment used for skin diseases. The herb is
reported to be used as condiment and in perfumery.
The herb forms an ingredient of the patented indigenous
herbal drug Liv 52‟(produced by Himalayan Drugs,
India) which shows marked effect in the early cases of
hepatic cirrhosis having steatorrhoea. Liv 52 reduced the
toxicity of cadmium and beryllium in experimentally
infected rats with SFV (Semiliki Forest Encephalitis
Virus)[5]
. In Unani and Ayurvedic medicine, the pods and
leaves are used as great tonic as an infusion. Women
who nurse develop milk in copious quantities after
consuming extracts of this plant. Besides this, it is used
to treat colitis and constipation. Cloves and ginger is
added to mark the odor that is disagreeable. It is effective
in treating vomiting, hiccups, cholera, gout, biliousness,
and jaundice. To dye the hair black, it is used with henna
leaves[7]
. The young leaves are eaten alone or cooked
along with unripe pods and eaten with rice. The leaf
when eaten is reported to act as a prophylactic against
leucorrhoea. Fresh leaves pounded with salt and onions
are applied as a poultice to guinea worm sores to extrude
the worms. They are used in the inflammatory swelling,
rheumatism, wounds, sprains and wrenches and also
given in jaundice pleurisy, head ache and toothache. A
paste of the leaves with calcium hydroxide is applied on
abscesses for quick opening and pus clearance. The leaf
paste is also applied externally for bone fracture. The
leaves are used in foot and mouth disease of cattle. Their
extract exhibits activity against earthworms[5]
.
SJIF Impact Factor 3.628
Review Article
ISSN 2394-3211
EJPMR
EUROPEAN JOURNAL OF PHARMACEUTICAL
AND MEDICAL RESEARCH www.ejpmr.com
ejpmr, 2016,3(9), 180-188.
Corresponding Author: Dr. Latha M. S.
Department of Chemistry, Sree Narayana College Chengannur, Kerala India.
ABSTRACT This article reviews the therapeutic potential of various phytochemicals present in Cassia occidentalis Linn, a
perennial plant of leguminosae family, which has been traditionally used as a medicine against various diseases. It
is commonly found in India and in many tropical countries. This plant has many pharmacological applications
which are attributed to the presence of active phytochemicals in leaves, stem, roots and seeds. Phytochemicals
present in Cassia Occidentalis Linn such as anthraquinones, anthraquinone glycosides, flavanoids and phyosterols
show analgesic, antipyretic, antimalarial, antioxidant, anticancer activity etc. These phytochemicals are good
reducing agents in the formation silver nano particles also. However, the presence of trace elements demands
attention due to their toxicity on continuous use.
KEY WORDS: Cassia occidentalis Linn, Phytochemicals, silver nano, trace metals.
www.ejpmr.com
Latha et al. European Journal of Pharmaceutical and Medical Research
181
In Senegal, the leaves are used to protect cowpea seeds,
vigna unguiculata Linn (walpers) against callosobruchus
maculates (coleoptera: Bruchidae). Both fresh and dry
leaves as well as whole and ground seeds had no contact
toxicity on the cowpea beetle. In contrast, seed oil
induced an increase in mortality of C. maculates eggs
and first larval in star at the concentration of 10ml/kg
cowpea.[8]
The seed is bitter and has tonic, febrifugal and purgative
properties. It is considered as blood tonic and excellent
diuretic. Seeds are useful in cough and whooping cough,
convulsions and in heat diseases. Their powder is
externally applied in cutaneous diseases and eruptions.
The extracts showed positive response on guinea pig-
ileum, rat uterus, rabbit-heart and depress or effect on
blood pressure of dogs and also activity against
earthworms[5]
and are used to treat hypertension[9]
. The
seeds are used as a cure of convulsion in children and are
used in West Africa to prepare a beverage which serves
as a substitute for coffee[10]
.
The roots are also bitter, purgative, anthelmintic and
diuretic. Roots are given with lime to treat dysentery and
diarrhoea associated with malaria. They are used for
relief in cramps, itches and sore throat. The root bark is
also used to cure malaria. Root bark decoction is an
effective remedy against gonorrhea and hepatic
malfunction. The Indians use the roots to treat fungal
infections of the skin[11]
. The medicinal activity of this
plant is due to the presence of phytochemicals whose
properties are analyzed in pharmacological
investigations. Pharmacological investigations have
revealed the presence of several herapeutic activities -
antioxidant, analgesic, antipyretic, anti-inflammatory,
hepatoprotective, anti-malarial, anti-diabetic, anticancer,
antidepressant[11]
, nephroprotective[12]
, antimicrobial[13]
,
anti-fertility[14]
, anti-plasmoidal[15]
, anti-mutagenic[16,17]
,
anti-allergic and anti-lipid peroxidation[18]
activities.
These activities are mainly due to the presence of organic
compounds. The presence of inorganic substances were
reported to enhance the activities of these natural organic
compounds[19]
. The presence of trace elements at low
concentrations in leaves increased attention due to their
toxicity[20]
.
Phytochemical constituents in leaves, seeds, stem and
flowers are[13,21-32]
Anthraquinones and their glycosides: Chrysophanol,
Chrysophanic acid, Chryso-obtusin, Aurantio-obtusin,
Chrysoeriol, Obtusifolin, Obtusin, Emodin, Physcion,
4,4‟,5,5‟-tetrahydroxy-2,2‟-dimethyl-1,1‟-
bianthraquinone, germichrysone, Occidentalins A&B,
1,8-dihydroxy-2-methyl anthraquinone, Rhein, Aloe-
emodin, Occidental-I, Occidental-II, α-hydroxy
anthraquinone, Pinselin or Cassiallin, Islandicin,
Helmithosporin, Xanthorine, Matteucinol-7-rhamnoside,
Jaceidin-7-rhamnoside, Questin, Torosachrysone,
Germitorosone, methyl germitorosone,
Helminthosoporin, N-methyl morpholine, Singueanol I
and Sennosoides A,B,C, and Chrysarobin.
Glycosides: 7-O Methyl-quercetin and 3,5,3‟-trimethoxy
quercetin,: O-alpha-d-galactopyranosyl-(1-6)-beta-d-
mannopyranosyl,O-alpha-d-mannopyranosyl- (1-4)-o-
beta-d-mannopyrasonyl
Flavanoids: Torosa flavon B, Cassia Occidentalin A, B,
C, Apigenin, Kaempferol
Poly Saccharides: Galactomannan, galactopyranosyl
Fatty acids: Lignoceric acid, Linoleic acid, Oleic acid
Phenanthracene derivative: Campesterol
Phytosterol: Sitosterols such as β-sitosterol-α-glucoside,
Alpha-3-sitosterol,
Sugar alcohol: Mannitol
Essential Oils
Trace metals identified are Calcium, Copper, Iron,
Magnesium, Mangenese, Potassium, Sodium, Zinc,
Chromium, Nickel, Cobalt, Lead, Aluminium,
Rubedium, Lanthanum, Scandium, Samarium,
Thorium[20,33]
and Silver[19]
.
Toxic Effects Acute toxicity test was conducted on Cassia
occidentalis Linn and found that this plant did not show
any hazardous symptoms or death[34]
. But the following
symptoms occur in animals when fed on excessive
amounts of the plant: lack of coordination, reluctance to
move, anorexia, muscle weakness, diarrhea, muscle
tremors, body weight loss and death. Those ingesting the
seeds show profound skeletal muscle degeneration also
degenerative myopathy of the cardiac muscle, congestion
and pulmonary oedema and necrosis. In human
indigestion of raw seeds will cause gastro-intestinal
symptoms. Roasted seeds do not seem to cause these
symptoms[35]
. The toxic compounds implicated for
poisoning are chrysarobin (3-methyl-1,8,9-
anthracenetriol), emodin (6-methyl-1,3,8-
trihydroxyanthraquinone) and a lectin (carbohydrate-
binding proteins).
The study of sub-acute oral administration of Cassia
occidentalis Linn during pregnancy in female wistar rats
found that there was no statistically significant changes
between control and test groups with respect to fetuses,
placentae and ovaries weights; number of implantation
and resorption sites; number of corpora lutea in the
ovaries and pre- and post-implantation loss rates, in both
does of (250 and 500mg/kg) Cassia occidentalis Linn .
This is enough to put a cautionary note on its use during
pregnancy[36]
.
Pharmacological Activities
Analgesic and Antipyretic activities: Ethanolic and
aqueous extract of leaves (150 and 300 mg / kg)
exhibited significant dose - dependent antinociceptive
and antipyretic effects in rats/mice models. Highest
inhibition dose was found to be 300 mg/kg. The report
clearly mentioned that both the ethanolic and water
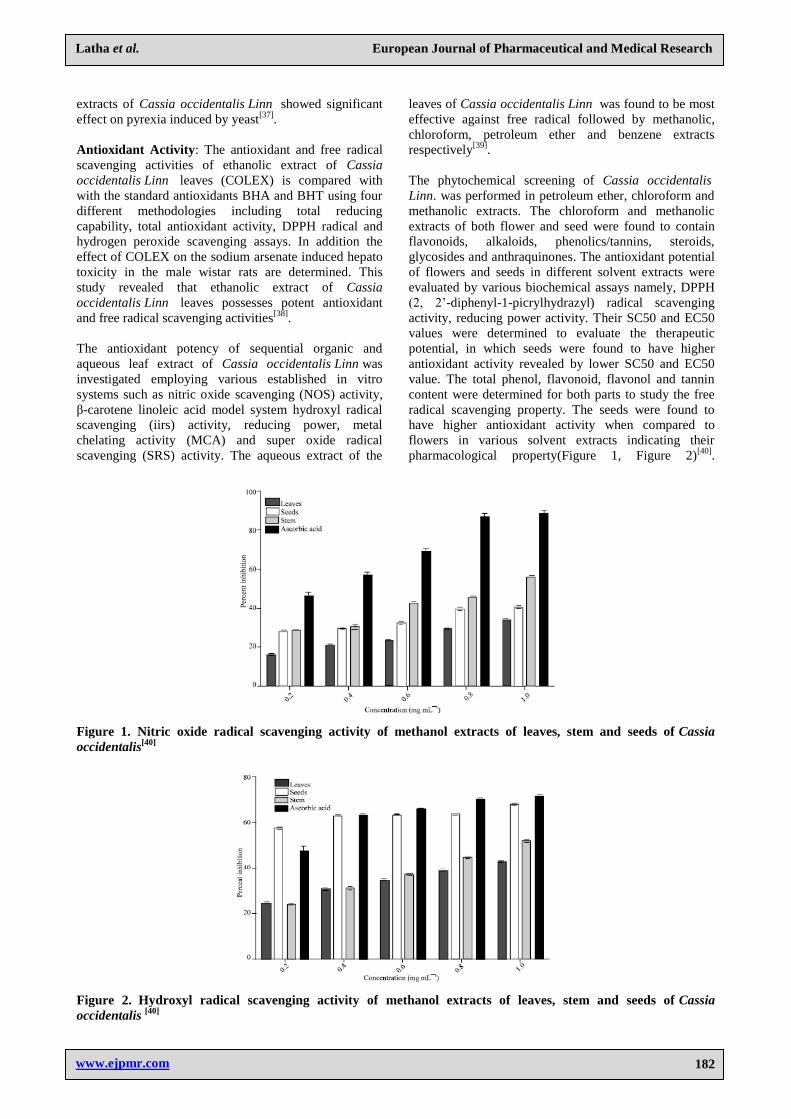
www.ejpmr.com
Latha et al. European Journal of Pharmaceutical and Medical Research
182
extracts of Cassia occidentalis Linn showed significant
effect on pyrexia induced by yeast[37]
.
Antioxidant Activity: The antioxidant and free radical
scavenging activities of ethanolic extract of Cassia
occidentalis Linn leaves (COLEX) is compared with
with the standard antioxidants BHA and BHT using four
different methodologies including total reducing
capability, total antioxidant activity, DPPH radical and
hydrogen peroxide scavenging assays. In addition the
effect of COLEX on the sodium arsenate induced hepato
toxicity in the male wistar rats are determined. This
study revealed that ethanolic extract of Cassia
occidentalis Linn leaves possesses potent antioxidant
and free radical scavenging activities[38]
.
The antioxidant potency of sequential organic and
aqueous leaf extract of Cassia occidentalis Linn was
investigated employing various established in vitro
systems such as nitric oxide scavenging (NOS) activity,
β-carotene linoleic acid model system hydroxyl radical
scavenging (iirs) activity, reducing power, metal
chelating activity (MCA) and super oxide radical
scavenging (SRS) activity. The aqueous extract of the
leaves of Cassia occidentalis Linn was found to be most
effective against free radical followed by methanolic,
chloroform, petroleum ether and benzene extracts
respectively[39]
.
The phytochemical screening of Cassia occidentalis
Linn. was performed in petroleum ether, chloroform and
methanolic extracts. The chloroform and methanolic
extracts of both flower and seed were found to contain
flavonoids, alkaloids, phenolics/tannins, steroids,
glycosides and anthraquinones. The antioxidant potential
of flowers and seeds in different solvent extracts were
evaluated by various biochemical assays namely, DPPH
(2, 2‟-diphenyl-1-picrylhydrazyl) radical scavenging
activity, reducing power activity. Their SC50 and EC50
values were determined to evaluate the therapeutic
potential, in which seeds were found to have higher
antioxidant activity revealed by lower SC50 and EC50
value. The total phenol, flavonoid, flavonol and tannin
content were determined for both parts to study the free
radical scavenging property. The seeds were found to
have higher antioxidant activity when compared to
flowers in various solvent extracts indicating their
pharmacological property(Figure 1, Figure 2)[40]
.
Figure 1. Nitric oxide radical scavenging activity of methanol extracts of leaves, stem and seeds of Cassia
occidentalis[40]
Figure 2. Hydroxyl radical scavenging activity of methanol extracts of leaves, stem and seeds of Cassia
occidentalis [40]
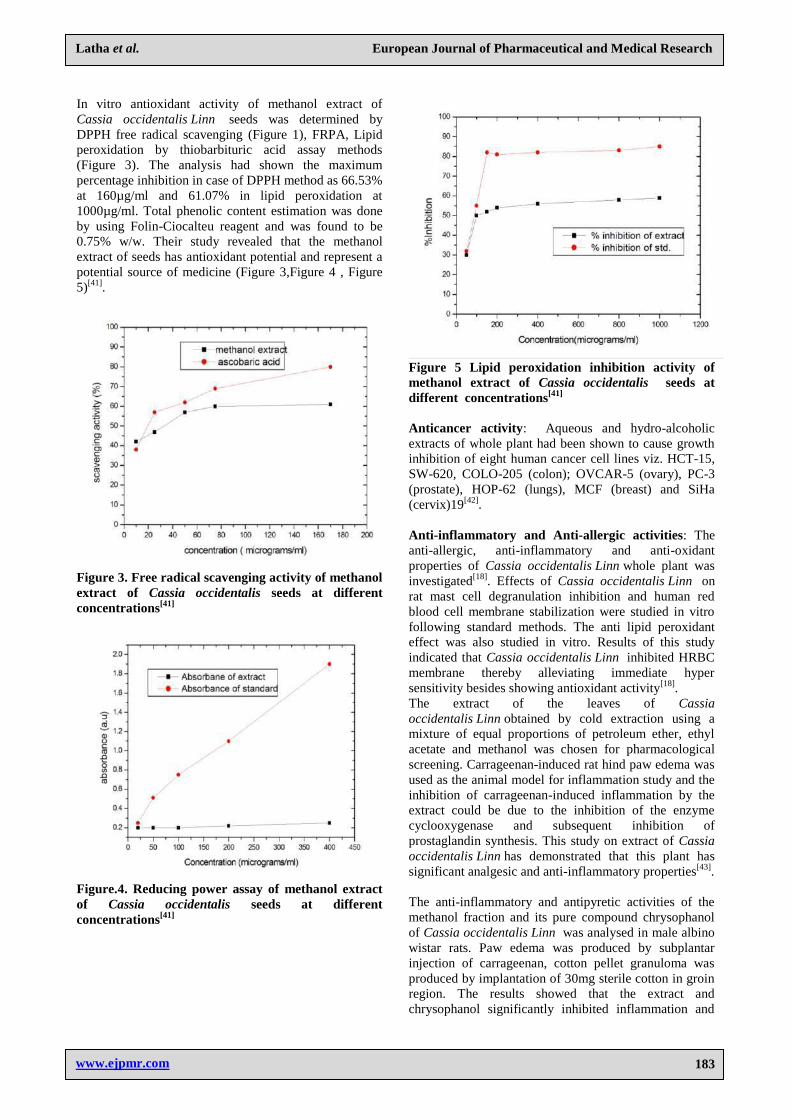
www.ejpmr.com
Latha et al. European Journal of Pharmaceutical and Medical Research
183
In vitro antioxidant activity of methanol extract of
Cassia occidentalis Linn seeds was determined by
DPPH free radical scavenging (Figure 1), FRPA, Lipid
peroxidation by thiobarbituric acid assay methods
(Figure 3). The analysis had shown the maximum
percentage inhibition in case of DPPH method as 66.53%
at 160µg/ml and 61.07% in lipid peroxidation at
1000µg/ml. Total phenolic content estimation was done
by using Folin-Ciocalteu reagent and was found to be
0.75% w/w. Their study revealed that the methanol
extract of seeds has antioxidant potential and represent a
potential source of medicine (Figure 3,Figure 4 , Figure
5)[41]
.
Figure 3. Free radical scavenging activity of methanol
extract of Cassia occidentalis seeds at different
concentrations[41]
Figure.4. Reducing power assay of methanol extract
of Cassia occidentalis seeds at different
concentrations[41]
Figure 5 Lipid peroxidation inhibition activity of
methanol extract of Cassia occidentalis seeds at
different concentrations[41]
Anticancer activity: Aqueous and hydro-alcoholic
extracts of whole plant had been shown to cause growth
inhibition of eight human cancer cell lines viz. HCT-15,
SW-620, COLO-205 (colon); OVCAR-5 (ovary), PC-3
(prostate), HOP-62 (lungs), MCF (breast) and SiHa
(cervix)19[42]
.
Anti-inflammatory and Anti-allergic activities: The
anti-allergic, anti-inflammatory and anti-oxidant
properties of Cassia occidentalis Linn whole plant was
investigated[18]
. Effects of Cassia occidentalis Linn on
rat mast cell degranulation inhibition and human red
blood cell membrane stabilization were studied in vitro
following standard methods. The anti lipid peroxidant
effect was also studied in vitro. Results of this study
indicated that Cassia occidentalis Linn inhibited HRBC
membrane thereby alleviating immediate hyper
sensitivity besides showing antioxidant activity[18]
.
The extract of the leaves of Cassia
occidentalis Linn obtained by cold extraction using a
mixture of equal proportions of petroleum ether, ethyl
acetate and methanol was chosen for pharmacological
screening. Carrageenan-induced rat hind paw edema was
used as the animal model for inflammation study and the
inhibition of carrageenan-induced inflammation by the
extract could be due to the inhibition of the enzyme
cyclooxygenase and subsequent inhibition of
prostaglandin synthesis. This study on extract of Cassia
occidentalis Linn has demonstrated that this plant has
significant analgesic and anti-inflammatory properties[43]
.
The anti-inflammatory and antipyretic activities of the
methanol fraction and its pure compound chrysophanol
of Cassia occidentalis Linn was analysed in male albino
wistar rats. Paw edema was produced by subplantar
injection of carrageenan, cotton pellet granuloma was
produced by implantation of 30mg sterile cotton in groin
region. The results showed that the extract and
chrysophanol significantly inhibited inflammation and
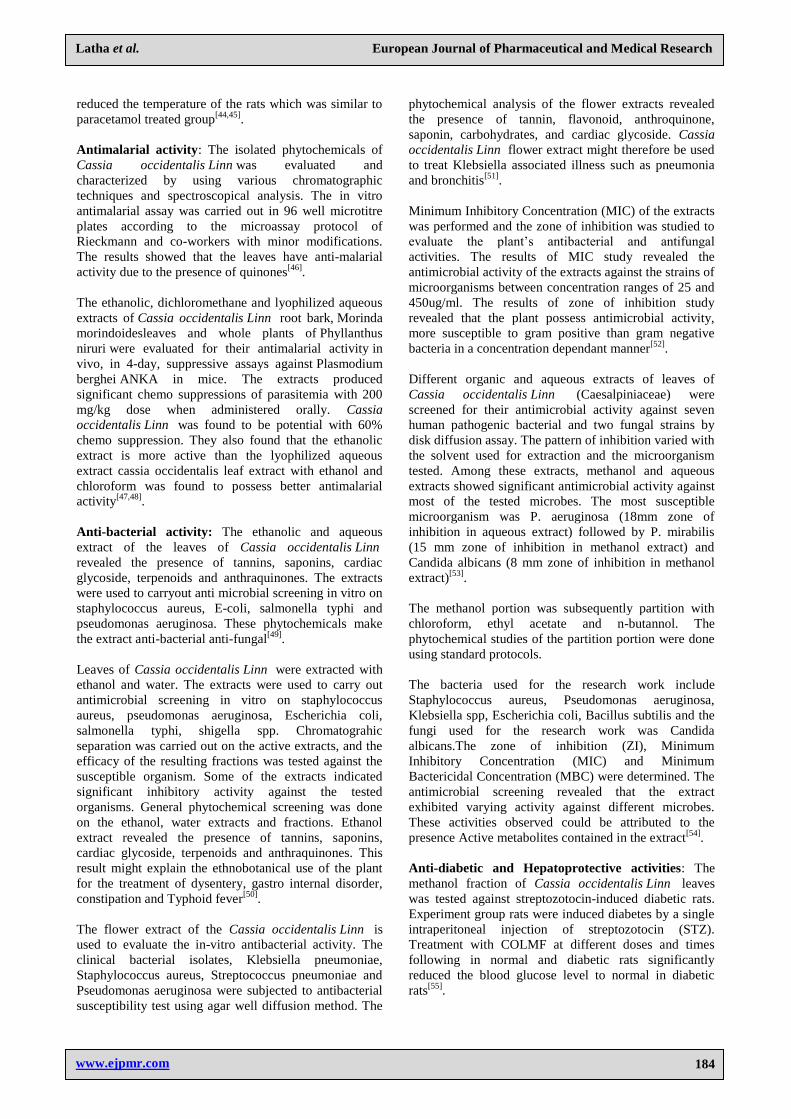
www.ejpmr.com
Latha et al. European Journal of Pharmaceutical and Medical Research
184
reduced the temperature of the rats which was similar to
paracetamol treated group[44,45]
.
Antimalarial activity: The isolated phytochemicals of
Cassia occidentalis Linn was evaluated and
characterized by using various chromatographic
techniques and spectroscopical analysis. The in vitro
antimalarial assay was carried out in 96 well microtitre
plates according to the microassay protocol of
Rieckmann and co-workers with minor modifications.
The results showed that the leaves have anti-malarial
activity due to the presence of quinones[46]
.
The ethanolic, dichloromethane and lyophilized aqueous
extracts of Cassia occidentalis Linn root bark, Morinda
morindoidesleaves and whole plants of Phyllanthus
niruri were evaluated for their antimalarial activity in
vivo, in 4-day, suppressive assays against Plasmodium
berghei ANKA in mice. The extracts produced
significant chemo suppressions of parasitemia with 200
mg/kg dose when administered orally. Cassia
occidentalis Linn was found to be potential with 60%
chemo suppression. They also found that the ethanolic
extract is more active than the lyophilized aqueous
extract cassia occidentalis leaf extract with ethanol and
chloroform was found to possess better antimalarial
activity[47,48]
.
Anti-bacterial activity: The ethanolic and aqueous
extract of the leaves of Cassia occidentalis Linn
revealed the presence of tannins, saponins, cardiac
glycoside, terpenoids and anthraquinones. The extracts
were used to carryout anti microbial screening in vitro on
staphylococcus aureus, E-coli, salmonella typhi and
pseudomonas aeruginosa. These phytochemicals make
the extract anti-bacterial anti-fungal[49]
.
Leaves of Cassia occidentalis Linn were extracted with
ethanol and water. The extracts were used to carry out
antimicrobial screening in vitro on staphylococcus
aureus, pseudomonas aeruginosa, Escherichia coli,
salmonella typhi, shigella spp. Chromatograhic
separation was carried out on the active extracts, and the
efficacy of the resulting fractions was tested against the
susceptible organism. Some of the extracts indicated
significant inhibitory activity against the tested
organisms. General phytochemical screening was done
on the ethanol, water extracts and fractions. Ethanol
extract revealed the presence of tannins, saponins,
cardiac glycoside, terpenoids and anthraquinones. This
result might explain the ethnobotanical use of the plant
for the treatment of dysentery, gastro internal disorder,
constipation and Typhoid fever[50]
.
The flower extract of the Cassia occidentalis Linn is
used to evaluate the in-vitro antibacterial activity. The
clinical bacterial isolates, Klebsiella pneumoniae,
Staphylococcus aureus, Streptococcus pneumoniae and
Pseudomonas aeruginosa were subjected to antibacterial
susceptibility test using agar well diffusion method. The
phytochemical analysis of the flower extracts revealed
the presence of tannin, flavonoid, anthroquinone,
saponin, carbohydrates, and cardiac glycoside. Cassia
occidentalis Linn flower extract might therefore be used
to treat Klebsiella associated illness such as pneumonia
and bronchitis[51]
.
Minimum Inhibitory Concentration (MIC) of the extracts
was performed and the zone of inhibition was studied to
evaluate the plant‟s antibacterial and antifungal
activities. The results of MIC study revealed the
antimicrobial activity of the extracts against the strains of
microorganisms between concentration ranges of 25 and
450ug/ml. The results of zone of inhibition study
revealed that the plant possess antimicrobial activity,
more susceptible to gram positive than gram negative
bacteria in a concentration dependant manner[52]
.
Different organic and aqueous extracts of leaves of
Cassia occidentalis Linn (Caesalpiniaceae) were
screened for their antimicrobial activity against seven
human pathogenic bacterial and two fungal strains by
disk diffusion assay. The pattern of inhibition varied with
the solvent used for extraction and the microorganism
tested. Among these extracts, methanol and aqueous
extracts showed significant antimicrobial activity against
most of the tested microbes. The most susceptible
microorganism was P. aeruginosa (18mm zone of
inhibition in aqueous extract) followed by P. mirabilis
(15 mm zone of inhibition in methanol extract) and
Candida albicans (8 mm zone of inhibition in methanol
extract)[53]
.
The methanol portion was subsequently partition with
chloroform, ethyl acetate and n-butannol. The
phytochemical studies of the partition portion were done
using standard protocols.
The bacteria used for the research work include
Staphylococcus aureus, Pseudomonas aeruginosa,
Klebsiella spp, Escherichia coli, Bacillus subtilis and the
fungi used for the research work was Candida
albicans.The zone of inhibition (ZI), Minimum
Inhibitory Concentration (MIC) and Minimum
Bactericidal Concentration (MBC) were determined. The
antimicrobial screening revealed that the extract
exhibited varying activity against different microbes.
These activities observed could be attributed to the
presence Active metabolites contained in the extract[54]
.
Anti-diabetic and Hepatoprotective activities: The
methanol fraction of Cassia occidentalis Linn leaves
was tested against streptozotocin-induced diabetic rats.
Experiment group rats were induced diabetes by a single
intraperitoneal injection of streptozotocin (STZ).
Treatment with COLMF at different doses and times
following in normal and diabetic rats significantly
reduced the blood glucose level to normal in diabetic
rats[55]
.
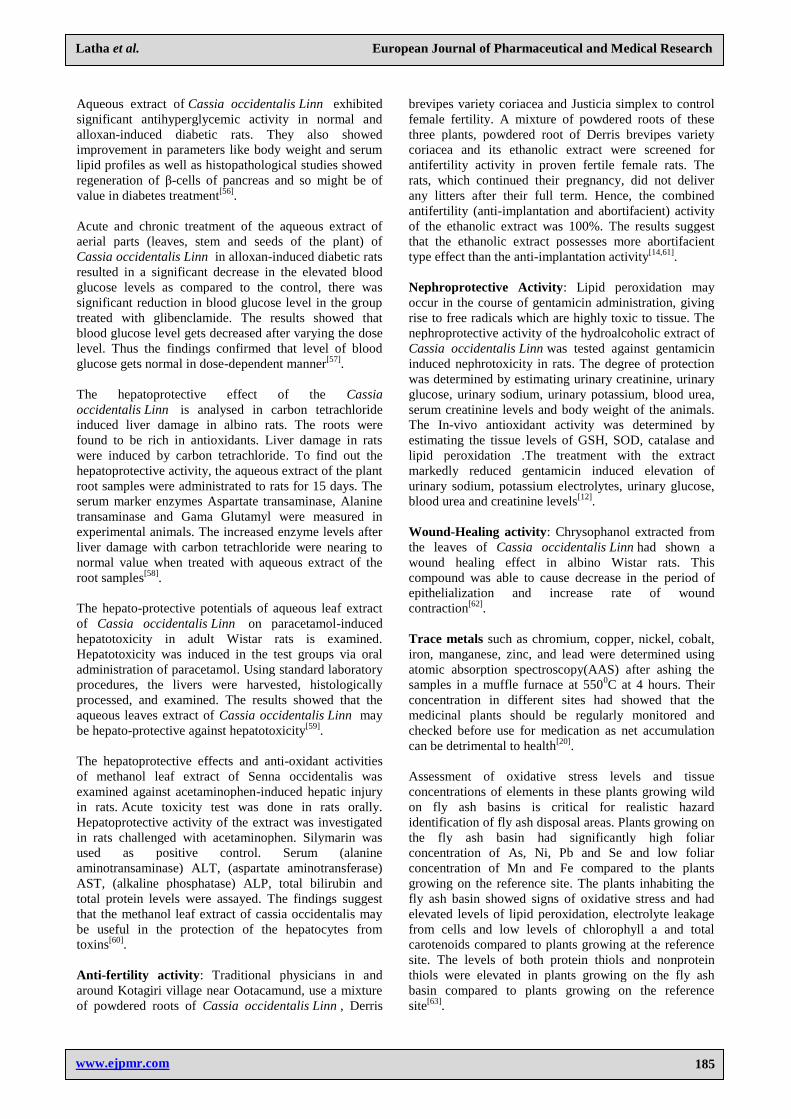
www.ejpmr.com
Latha et al. European Journal of Pharmaceutical and Medical Research
185
Aqueous extract of Cassia occidentalis Linn exhibited
significant antihyperglycemic activity in normal and
alloxan-induced diabetic rats. They also showed
improvement in parameters like body weight and serum
lipid profiles as well as histopathological studies showed
regeneration of β-cells of pancreas and so might be of
value in diabetes treatment[56]
.
Acute and chronic treatment of the aqueous extract of
aerial parts (leaves, stem and seeds of the plant) of
Cassia occidentalis Linn in alloxan-induced diabetic rats
resulted in a significant decrease in the elevated blood
glucose levels as compared to the control, there was
significant reduction in blood glucose level in the group
treated with glibenclamide. The results showed that
blood glucose level gets decreased after varying the dose
level. Thus the findings confirmed that level of blood
glucose gets normal in dose-dependent manner[57]
.
The hepatoprotective effect of the Cassia
occidentalis Linn is analysed in carbon tetrachloride
induced liver damage in albino rats. The roots were
found to be rich in antioxidants. Liver damage in rats
were induced by carbon tetrachloride. To find out the
hepatoprotective activity, the aqueous extract of the plant
root samples were administrated to rats for 15 days. The
serum marker enzymes Aspartate transaminase, Alanine
transaminase and Gama Glutamyl were measured in
experimental animals. The increased enzyme levels after
liver damage with carbon tetrachloride were nearing to
normal value when treated with aqueous extract of the
root samples[58]
.
The hepato-protective potentials of aqueous leaf extract
of Cassia occidentalis Linn on paracetamol-induced
hepatotoxicity in adult Wistar rats is examined.
Hepatotoxicity was induced in the test groups via oral
administration of paracetamol. Using standard laboratory
procedures, the livers were harvested, histologically
processed, and examined. The results showed that the
aqueous leaves extract of Cassia occidentalis Linn may
be hepato-protective against hepatotoxicity[59]
.
The hepatoprotective effects and anti-oxidant activities
of methanol leaf extract of Senna occidentalis was
examined against acetaminophen-induced hepatic injury
in rats. Acute toxicity test was done in rats orally.
Hepatoprotective activity of the extract was investigated
in rats challenged with acetaminophen. Silymarin was
used as positive control. Serum (alanine
aminotransaminase) ALT, (aspartate aminotransferase)
AST, (alkaline phosphatase) ALP, total bilirubin and
total protein levels were assayed. The findings suggest
that the methanol leaf extract of cassia occidentalis may
be useful in the protection of the hepatocytes from
toxins[60]
.
Anti-fertility activity: Traditional physicians in and
around Kotagiri village near Ootacamund, use a mixture
of powdered roots of Cassia occidentalis Linn , Derris
brevipes variety coriacea and Justicia simplex to control
female fertility. A mixture of powdered roots of these
three plants, powdered root of Derris brevipes variety
coriacea and its ethanolic extract were screened for
antifertility activity in proven fertile female rats. The
rats, which continued their pregnancy, did not deliver
any litters after their full term. Hence, the combined
antifertility (anti-implantation and abortifacient) activity
of the ethanolic extract was 100%. The results suggest
that the ethanolic extract possesses more abortifacient
type effect than the anti-implantation activity[14,61]
.
Nephroprotective Activity: Lipid peroxidation may
occur in the course of gentamicin administration, giving
rise to free radicals which are highly toxic to tissue. The
nephroprotective activity of the hydroalcoholic extract of
Cassia occidentalis Linn was tested against gentamicin
induced nephrotoxicity in rats. The degree of protection
was determined by estimating urinary creatinine, urinary
glucose, urinary sodium, urinary potassium, blood urea,
serum creatinine levels and body weight of the animals.
The In-vivo antioxidant activity was determined by
estimating the tissue levels of GSH, SOD, catalase and
lipid peroxidation .The treatment with the extract
markedly reduced gentamicin induced elevation of
urinary sodium, potassium electrolytes, urinary glucose,
blood urea and creatinine levels[12]
.
Wound-Healing activity: Chrysophanol extracted from
the leaves of Cassia occidentalis Linn had shown a
wound healing effect in albino Wistar rats. This
compound was able to cause decrease in the period of
epithelialization and increase rate of wound
contraction[62]
.
Trace metals such as chromium, copper, nickel, cobalt,
iron, manganese, zinc, and lead were determined using
atomic absorption spectroscopy(AAS) after ashing the
samples in a muffle furnace at 5500C at 4 hours. Their
concentration in different sites had showed that the
medicinal plants should be regularly monitored and
checked before use for medication as net accumulation
can be detrimental to health[20]
.
Assessment of oxidative stress levels and tissue
concentrations of elements in these plants growing wild
on fly ash basins is critical for realistic hazard
identification of fly ash disposal areas. Plants growing on
the fly ash basin had significantly high foliar
concentration of As, Ni, Pb and Se and low foliar
concentration of Mn and Fe compared to the plants
growing on the reference site. The plants inhabiting the
fly ash basin showed signs of oxidative stress and had
elevated levels of lipid peroxidation, electrolyte leakage
from cells and low levels of chlorophyll a and total
carotenoids compared to plants growing at the reference
site. The levels of both protein thiols and nonprotein
thiols were elevated in plants growing on the fly ash
basin compared to plants growing on the reference
site[63]
.
www.ejpmr.com
Latha et al. European Journal of Pharmaceutical and Medical Research
186
The 5 minerals namely; lead (Pb), cadmium (Cd),
aluminum (Al), mercury (Hg), and arsenic (As) in 10
common medicinal plants (Alchornia cordifolia, Alstonia
boonei, Cassia alata, Cassia occidentalis, Cymbopogon
citratus, Moringa oleifera, Ocimum gratissimum,
Paullinia pinnata, Rauwolfia vomitoria, and Taraxacum
officinale leaves) are analyzed used in the treatment,
prevention, and management of diseases and sampled
from 5 different geographical locations in Ghana. This
may help understand the importance of location in
collection and ultimately heavy metal toxicity of
medicinal plants[64]
.
The contents in Senna occidentalis Linn can be assessed
using neutron activation analysis (NAA). The analysis
shows that, Al, Ca, Fe, Na and K are the major
components, followed by Mn, Zn and Rb. The traces of
Co, Rb, La, Sc, Sm and Th are also identified. As it
contains, toxic metals (such as As) at low levels,
prolonged consumption of the plant may lead to their
bioaccumulation. The pattern of bioaccumulation of the
elements does not follow any particular trend among the
different parts of the plant [65]
.
CONCLUSION Cassia occidentalis Linn plant has remarkable medicinal
applications due to various active phytochemicals
present in it, which are experimentally verified.
However, prolonged consumption of the plant is not
advised because of the presence of toxic metals at low
levels, which may lead to its bioaccumulation.
REFERENCE
1. „Genus Cassia‟ International legume database and
information service. November 2005. Version 10.01.
2. J.P Yadav,Vedpriya Arya, Sanjay Yadav, Manju
Panghal, Sandeep kumar, Seema Dhankar, “Cassia
occidentalis L. A review on its ethnobotany,
phytochemical and pharmacological profile”,
Fitoterapia 2010; 81(4): 223-230.
3. L V Asolkar, KK Kakkar, O J Chakre, “Glossary of
Indian medicinal plants with active principles‟‟.
www.worldcat.org/title/glossary-of-indian-
medicinal-plants
4. India Biodiversity portal.
indiabiodiversity.org/species/list
5. Vedpriya Arya, J. P. Yadav comparative assessment
of relative antioxidant activity of sequential leaf
extracts of Cassia occidentalis l. and C. tora
Pharmacology online 2011; 1: 529-543.
6. Usman Idris NDA-UMAR, Mohammed GBATE,
Abdulkadir Nda UMAR. Ethnobotanical study of
medicinal plants used for the treatment of malaria in
Nupel and, North central Nigeria. Global J Res.
Med. Plants Indigen. Med. 2014; 3(4): 112–126.
7. http://www.101herbs.com/cassia-occidentalis.html
8. Lienard V Seck, D G Lognay, C Gaspar, M Severin,
“Biological Activity of Cassia occidentalis L against
calloso bruchus maculates(F)(Coleoptra:Bruchidae)”
J Stored Prod, 1993; 29(4): 311-318.
9. P. K. Warrier, V. P. K. Nambiar, C. Ramankutty
“Indian medicinal plants: a compendium of 500
species” Orient Longmans 1994; 19.
10. G N Medouna and CMF Mbofung, “Kinetics studies
of some physico chemical substances during
roasting and preparation of beverage made by Cassia
occidentalis seeds LWT”, Food Sci. Technol. 2007;
40(4): 730-736.
11. I Kaur, S Ahmad and S L Harikumar.”Review
article pharmacognosy phytochemistry and
pharmacology of C.Occidentalis.” Int. J.
Pharma.Phytochem. Research. 2014; 6(2): 151-155.
12. Ali Esmail Al-Snafi “The therapeutic importance of
Cassia occidentalis- an overview” Ind. J. Pharma.
Sci. Res. 2015; 5(3): 158-173.
13. J.C Chukwujckwu, P H Coomber, D A Mulholland,
J.Van Staden.Emodin,an antibacterial anthraquinone
from the roots of Cassia occidentalis, South African
J. Bot. 2006; 72: 295-297.
14. S Badami, R Aneesh, S Sankar, M N Sathish kumar,
B Suresh, S Rajan. “Antifertility activity of Derris
brevipes variety coriacea”. J Ethnopharmacol. 2003;
84(1): 99-104.
15. L Tona, R K Cimanga, K Mesia, C T Musamba, T
Bryne, S Apers. “Invitro antiplasmodial activity of
extracts and fractions from seven medicinal plants
used in Democratic Republic of Congo”. J
Ethnopharmacol. 2004; 9327-32.
16. N Sharma, P Trikha, M Athar, S Raisuddin.”In vitro
inhibition of carcinogen induced mutagenicity by
Cassia occidentalis and Embilica officinalis”. Drug
Chem Toxicol. 2000; 23: 477-484.
17. B Bin Hafeez, I Ahmad, R Haque and S Raisuddin,
Protective effect of Cassia occidentalis L on
cyclophosphamide induced suppression of humoral
immunity in mice. J Ethnopharmacol 2001; 75(1):
13-18.
18. G. Sreejith, P. GLatha, V. J Shine, G.I Anuja, S.R
Suja, S.Sini, S.Shyamal, S.Pradeep, P.Shikha,
S.Rajasekharan. “Antiallergy,anti-
inflammatory,antilipid peroxidatanto effect of
Cassia occidentalis Linn”. Ind. J Exp Biol. 2010; 48:
494-498.
19. A John De Britto, D Herin sheeba Gracelin and P.
Benjamin Jeya Rathna Kumar. “Green synthesis of
silver nano particles and their antibacterial activity”
UJPB 2014; 02(01): 51-55.
20. Fatima Binta Suleiman, “Trace metal contents in the
leaves of Cassia occidentalis Linn from some
selected sites in Katsina, Nigeria”. IOSR J. Appl.
Chem. 2014; 7: 3-7.
21. S. Vijayalakshmi , J . Ranjitha, V. Devi Rajeswari,
M. Bhagiyalakshmi “Pharmacological profile of
Cassia occidentalis L – a Review ‟‟. Int. J Pharm.
Pharm. Sci. 2013; 5(3): 29-33.
22. L Jawahar, P.G Gupta. “Two new anthraquinones
from the seeds of Cassia occidentalis Linn”. Cell
Mol Life Sci. 1974; 30(8): 850-851.
www.ejpmr.com
Latha et al. European Journal of Pharmaceutical and Medical Research
187
23. Hans Dieter Neuwinger: African ethnobotany :
Poisons and drugs ; Chemistry, Pharmacology,
Toxicology, Weinheim Chapman and Hall; 1996;
287-293.
24. Kee Cang Huang, Walter Michael Williams. “The
Pharmacology of Chinese herbs Boca Raton”. C R S
Press. 1999; 84.
25. Mahendra Rai, Maria Cecilia,Carpinella.in
“Naturally occurring bioactive compounds” Elsevier
B.V (2006).
26. Oyvind M. Andersen, Kenneth R. Markham.”
Flavanoids: Chemistry, Biochemistry and
Applications”. Boca Raton: CRC Press 2006; (871).
27. M.Daniel. “Medicinal Plants: Chemistry and
Properties”. New Hampshire; Science publishers.
2005; 174- 175.
28. M Sheeba, S Emmanuel, K Revathi and S
Ignacimuthu. “Wound healing activity of Cassia
occidentalis L in Albino wistar rats”.I J I B. 2009;
8(1): 1-6.
29. B Christ, T Poppinghaus, F Wirtz-Peitz. “Isolation
and structural definition of a new sennosoide from
cassia senna L”. Arzneimittelforschung. 1978; 28:
225-231.
30. C Purwar, R Rai, N Srivastava, J Singh. “New
flavanoid glycosides from Cassia occidentalis-
Organic Chemistry including Medicinal Chemistry”
Ind. J. Chem. 2003; 42: 434-436.
31. N.A Kudav, A B Kulkarni “Chemical investigation
of Cassia occidentalis”. Ind. J Chem. 1974; 12:
1042-1044.
32. H L Kim, B J Camp, R D Grigsby, “Isolation of N-
methyl morpholine from the seeds of cassia
occidentalis (coffee senna) J. Agr. Food Chem
1971; 19(1): 198-199,
33. U.S Gwarzo, C.E Gimba, DJ Adeyemo, E D Paul.
“Neutron Activation Analysis(NAA) of Senna
occidentalis Linn”.J. Nat. Sci. Res. 2014; 4(11):
2224-3186.
34. H Tanimu, A M Wudil. “Effect of oral
administration of aqueous leaves extract of Cassia
occidentalis on liver and kidney functions in rats”.
Bayero J Pure Appl. Sci. 2012; 5(2): 31-33.
35. Thomas Acamovic, S Colin., T.W Stewart.
Pennycott “Poisonous Plants and Related Toxins”.
Cambridge: CABI; 2004; 269–274.
36. S D da Silva, J C da Silva,M C Fraga,A G
Wanderley,S S Lafayette. “Toxicological
reproductive shedy of Cassia occidentalis L in
female wistar rats” .J Ethnopharmacol. 2009;
123(1): 163-166.
37. K R Sini, B N Sinha, M Karpakavalli, P T
Sangeetha. “Analgesic and antipyretic activity of
Cassia occidentalis Linn”. Ann. Bio. Res. 2011;
2(1): 195-200.
38. Michael A. Gbadegesin and Oyeronke A. Odunola
“In vitro antioxidantal Radical Scavenging
Activities and Heptoprotective Roles of Ethanolic
extract of C.Occidentalis Leaves in Sodium Arsenite
treated male wistar Rats”. British J. Med. Medical
Res. 2013; 3(4): 2141-2156.
39. Vedpriya Arya, Sanjay Yadav, Sandeep kumar, Jaya
Prakash Yadav. “Antioxidant activity of organic and
aq. Leaf extracts of C.Occidentalis L in relation to
their phenolic content” Nat. Prod. Res. 2011;
25(15): 1473-1479.
40. Vedpriya Arya , J.P. Yadav Antioxidant Properties
of the Methanol Extracts of the Leaves, Seeds and
Stem of Cassia occidentalis Res. J. Med. Plants
2011; 5(5): 547-556.
41. Sharuti Mehta, Pradeep Kamboj, Samriti
Faujdar,Jyotiram Sawale, A.N.Kalia. “In vitro
Antioxidant Activity of Cassia occidentalis
seeds”.Pharmacology online. 2010; 3: 217-224.
42. Madhulika Bhagat, Ajit Kumar Saxena. “Evaluation
of C.Occidentalis for invitro cyto toxicity against
human cancer cell lines and antibacterial
activity”.Ind. J. Pharm. 2010; 42(4): 234-237.
43. Kanakam Vijayabhaskar, Kala kota, Chaitanya
Prasad, K Srisailam, Naikal M, Arunadevi,S.
Swathi,Prameela Subhashini. “Analgesic and Anti-
inflammatory activities of the extract of
C.Occidentalis Linn Animal model”.Int. J. Res.
Pharm.Chem. 2013; 3(4): 2231-2781.
44. Rani M Sheeba,Emmanuel S, Sreekanth M Raja.
“Evaluation of the antipyretic anti-inflammatory
activities of methanolic fractions and chrysopanol of
C.Occidentalis Linn”.Res.J. Pharm. Tech. 2010;
3(3): 888-893.
45. O P Ajagbonna, F B O Mojminiyi, O A Sofola.
“Relaxant effects of the aqueous leaf extract of
Cassia Occidentalis on rat aortic rings”.African
J.Biomed. Res. 2001; 4: 127-129.
46. P.K Choudhary, B.P Nagori. “Evaluation of invitro
antimalarial activity of Cassia occidentalis”. World
J.Pharm. Pharmaceut. Sci. 2014; 3(2): 2241-2248.
47. Tona L,Mesia K. Ngimbi N P, Chirmwami B,
Ahoka O, Umanga K. “In-vivo antimalarial activity
of Cassia occidentalis, Morinda morindoides and
Phyllanthus niruri”. Ann Trop Med Parasitol. 2001;
95(1): 47-57.
48. J.O. Adebayo, A.U. Krettli “ Potential antimalarials
from Nigerian plants: A Review” J
Ethnopharmacol. 2011; 133: 289–302.
49. I.S.Sadiq, M.Shuaibu,
A.B.Bello,S.G.Tureta,Isha,T.Izuagie,S.Nasiru,M.BK
amaru. “Phytochemistry and Anti-microbial
activities of Cassia occidentalis used for Herbal
Remedies” J. Chem. Eng. 2012; 1(1): 38-41.
50. Daniyan S.Y. “Antibacterial activity of Cassia
occidentalis flower vegetable extract on selected
bacteria”.J. Biomed. Pharm. Sciences. 2011; 1(1):
23-27.
51. Krishna Mohan Chinnala, Jithendra Debtha, Vidya
Sagar Jenugu,S rinivas Ampati, “Evaluation of
antibacterial and antifungal activities of
C.Occidentalis Linn root extracts”.Scholars Res.
Library. 2010; 1(3): 81-84.
www.ejpmr.com
Latha et al. European Journal of Pharmaceutical and Medical Research
188
52. Vedpriya Arya,Sanjay Yadav,Sandeep Kumar,J.P
Yadav. “Antimicrobial activity of Cassia
Occidentalis L (Leaf) against various human
pathogenic microbes” Life Sci. Med. Res. 2010; 9: 1-
11.
53. M. Mohammed, M.A Aboki, H.M Saidu, O.Victor,
A.Tawakalitu, S.A.Maikano. “Phytochemical and
some antimicrobial activity of Cassia occidentalis L.
Int. J. Sci. Tech. 2012; 2(4): 2224-3577.
54. A Sathya, V. Ambikapathy , A. Panneer Selvam,
Studies on the phytochemistry, antimicrobial
activity and antioxidant properties of Cassia
occidentalis L. Asian.J. Plant Sci. Res. 2012; 2(4):
530-533.
55. S.Emmanuel, M.Sheeba Rani, M.Raja Sreekanth.
“Antidiabetic activity of C.Occidentalis Linn in
streptozoto cin-induced diabetic rats: A dose
dependent study”. Int.J. Pharm. Bio Sci. 2010; 1(4):
B14-B25.
56. Laxmi Verma, Anirudh Khatri, Rajesh S Pawar.
“Antidiabetic activity of Cassia occidentalis Linn in
normal and alloxam-induced diabetic rats”.Ind.
J.Pharmacology. 2010; 42(4): 224-228.
57. Saurabh Arya, Jogender Singh, Sumer Singh.
“Antidiabetic activities of Cassia Occidentalis”
Recent Res. Sci. Tech. 2013; 5(1): 51-53.
58. K.Usha G, Mary Kasturi, P.Hemalatha.
“Hepatoprotective Effect of hygrophila Spinosa and
Cassia occidentalis on carbon tetrachloride induced
liver damage in experimental rats”. Ind. J. Clinical
Biochem. 2013; 22(2): 132-135.
59. H O Uzzi, D B Grillo. “The hepatoprotective
potentials of aqueous leaf extract of Cassia
occidentalis against paracetamol induced hepato
toxicity in adult wistar rats”. Int. J. Herbs Pharm.
Res. 2013; 2(2): 6-13.
60. O Chinaka, Nwarhujor, J Okwoche, Dozie Nokoye.
“Hepato protective activity of leaves of C.
Occidentalis against paracetamol and ethyl alcohol
intoxication in rats”. J. Ethno pharmacology 1999;
66(3): 355-361.
61. Y.Govindraj,Vijayalakshmi Melanaphuru, Sandeep
Gupta, Vivek Agrahari, Rajesh K Nema.
“Antifertility of the ethanolic extract of Cassia
Occidentalis, Derris brevipes variety Brevipes and
Justicia simplex”.World J. Chem. 2009; 4(2): 118-
122.
62. M.Sheeba, S.Emmanuel, K.Revathi, S.Ignacimuthu.
“Wound healing activity of Cassia occidentalis L in
albino wistar rats. Int. J.Int. Bio. 2009; 8(1): 1-6.
63. A Love, B D Banerjee, C. R Babu. “Assessment of
oxidative stress markers and concentrations of
selected elements in the leaves of Cassia
occidentalis growing wild on a coal fly ash basin”.
Environ Monit Assers. 2013; 185(8): 6553-62.
64. Kofi Annan, Rita A Dickson, Isaac K Amponsah,
Isaac K Nooni. “The heavy metal contents of some
selected medicinal plants sample from different
geographical locations”. Pharmacognosy Res. 2013;
5(2): 103-108.
65. U S Gwarzo, C E Gumba, D S Adeyemo, E D Paul,
Neutron Activation Analysis (NAA) of Senna
Occidentalis Linn, J. Nat. Sci. Res. 2014; 4(11): 22-
28.
Reversible structural, optical and magnetic switching in crystalline
1-dimensional inorganic-organic hybrid polymers induced by H2O
Sujesh Baby1,3 Sajesh.P. Thomas2 and M. Padmanabhan*3,4
1Christian College, Chengannur, Kerala, 2Indian Institute of Science, Bangalore, India 3School of Chemical Sciences, Mahatma Gandhi University, Kottayam, 4Amrita University, Amritapuri, Kerala
Corresponding Author: [email protected] , [email protected]
Abstract- Metal-organic framework (MOF) materials and related inorganic-
organic hybrid polymers are recently highlighted as one of the most useful
and versatile category of functional materials not only because of their
potential applications in opto-electronics, NLO, ferroelectrics, sensors,
magnetic devices, gas separation and storage systems, catalytic and energy
conversion and storage purposes but also because of their unique and exciting
molecular architectures and topologies. In the present work we report the
design, synthesis, crystal structure, spectral and magnetic characterizations
of two new 1-dimensional coordination polymers 1 and 2 using rigid organic
linkers and having unique anionic Co(II) bis-phthalate based skeletal
framework and demonstrate their easy and highly reversible mutual
switching very specifically and uniquely brought about by H2O and not by
any another molecules. Associated with this structural transformation
between 1 and 2 we demonstrate reversible optical and magnetic switching
which again is induced only by H2O. The molecular structures and unique
crystal packing features of 1 and 2 could be revealed by single crystal XRD
studies 1, C28H44CoN2O10; P-1; (a = 5.9658 Å ,b = 7.4059 Å,c = 18.2727 Å,
α =95.661°, β = 91.079° and γ = 110.362°,V =751.97(12)Å3,ρ=1.386gcm-3 )
and 2 C28H40CoN2O8 ; I222; a = 11.039 Å, b = 18.498 Å , c =14.719 Å, α
=90°, β = 90° and γ = 90°;V=3005.6(19)Å3, ρ=1.153gcm-3).The H2O-
specific reversible structural, optical and magnetic switching between them,
optical properties including band-gap (Eg) variations, T-dependent χ
variations (up to 4K), thermally induced transformations, etc. have been
studied which will be presented and discussed with a view to highlight their
H2O sensor abilities.
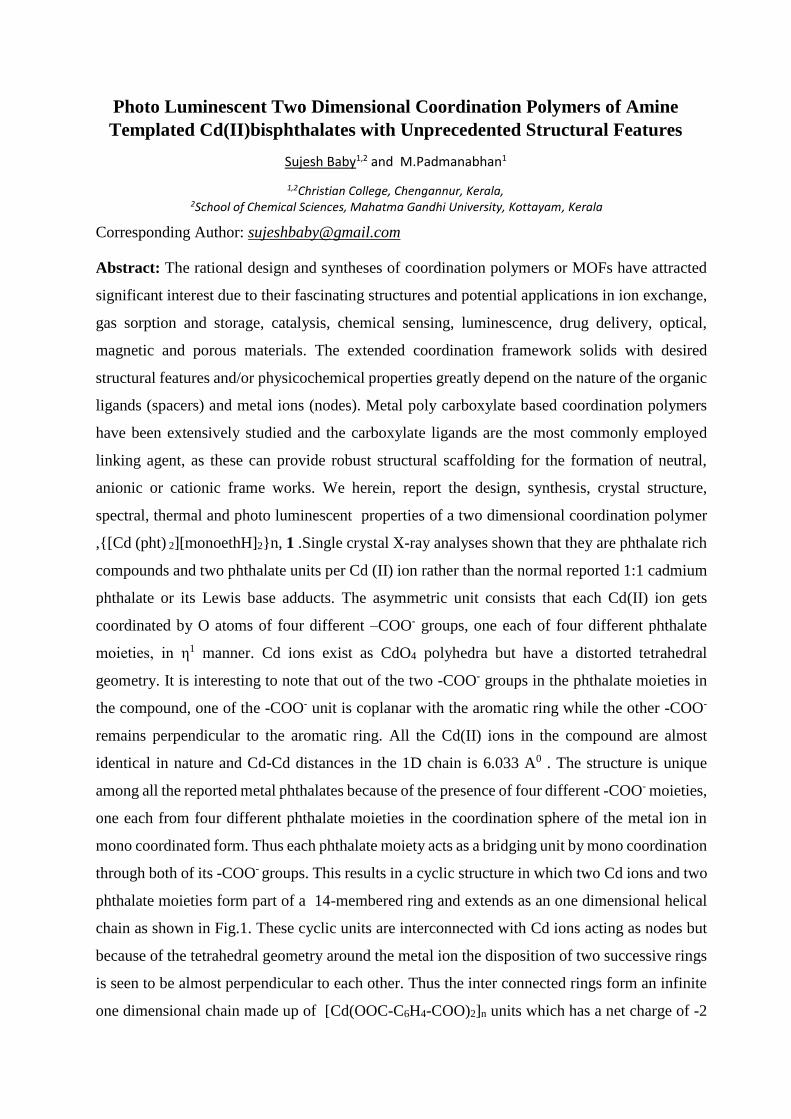
Photo Luminescent Two Dimensional Coordination Polymers of Amine
Templated Cd(II)bisphthalates with Unprecedented Structural Features
Sujesh Baby1,2 and M.Padmanabhan1
1,2Christian College, Chengannur, Kerala, 2School of Chemical Sciences, Mahatma Gandhi University, Kottayam, Kerala
Corresponding Author: [email protected]
Abstract: The rational design and syntheses of coordination polymers or MOFs have attracted
significant interest due to their fascinating structures and potential applications in ion exchange,
gas sorption and storage, catalysis, chemical sensing, luminescence, drug delivery, optical,
magnetic and porous materials. The extended coordination framework solids with desired
structural features and/or physicochemical properties greatly depend on the nature of the organic
ligands (spacers) and metal ions (nodes). Metal poly carboxylate based coordination polymers
have been extensively studied and the carboxylate ligands are the most commonly employed
linking agent, as these can provide robust structural scaffolding for the formation of neutral,
anionic or cationic frame works. We herein, report the design, synthesis, crystal structure,
spectral, thermal and photo luminescent properties of a two dimensional coordination polymer
,[Cd (pht) 2][monoethH]2n, 1 .Single crystal X-ray analyses shown that they are phthalate rich
compounds and two phthalate units per Cd (II) ion rather than the normal reported 1:1 cadmium
phthalate or its Lewis base adducts. The asymmetric unit consists that each Cd(II) ion gets
coordinated by O atoms of four different –COO- groups, one each of four different phthalate
moieties, in η1 manner. Cd ions exist as CdO4 polyhedra but have a distorted tetrahedral
geometry. It is interesting to note that out of the two -COO- groups in the phthalate moieties in
the compound, one of the -COO- unit is coplanar with the aromatic ring while the other -COO-
remains perpendicular to the aromatic ring. All the Cd(II) ions in the compound are almost
identical in nature and Cd-Cd distances in the 1D chain is 6.033 A0 . The structure is unique
among all the reported metal phthalates because of the presence of four different -COO- moieties,
one each from four different phthalate moieties in the coordination sphere of the metal ion in
mono coordinated form. Thus each phthalate moiety acts as a bridging unit by mono coordination
through both of its -COO- groups. This results in a cyclic structure in which two Cd ions and two
phthalate moieties form part of a 14-membered ring and extends as an one dimensional helical
chain as shown in Fig.1. These cyclic units are interconnected with Cd ions acting as nodes but
because of the tetrahedral geometry around the metal ion the disposition of two successive rings
is seen to be almost perpendicular to each other. Thus the inter connected rings form an infinite
one dimensional chain made up of [Cd(OOC-C6H4-COO)2]n units which has a net charge of -2
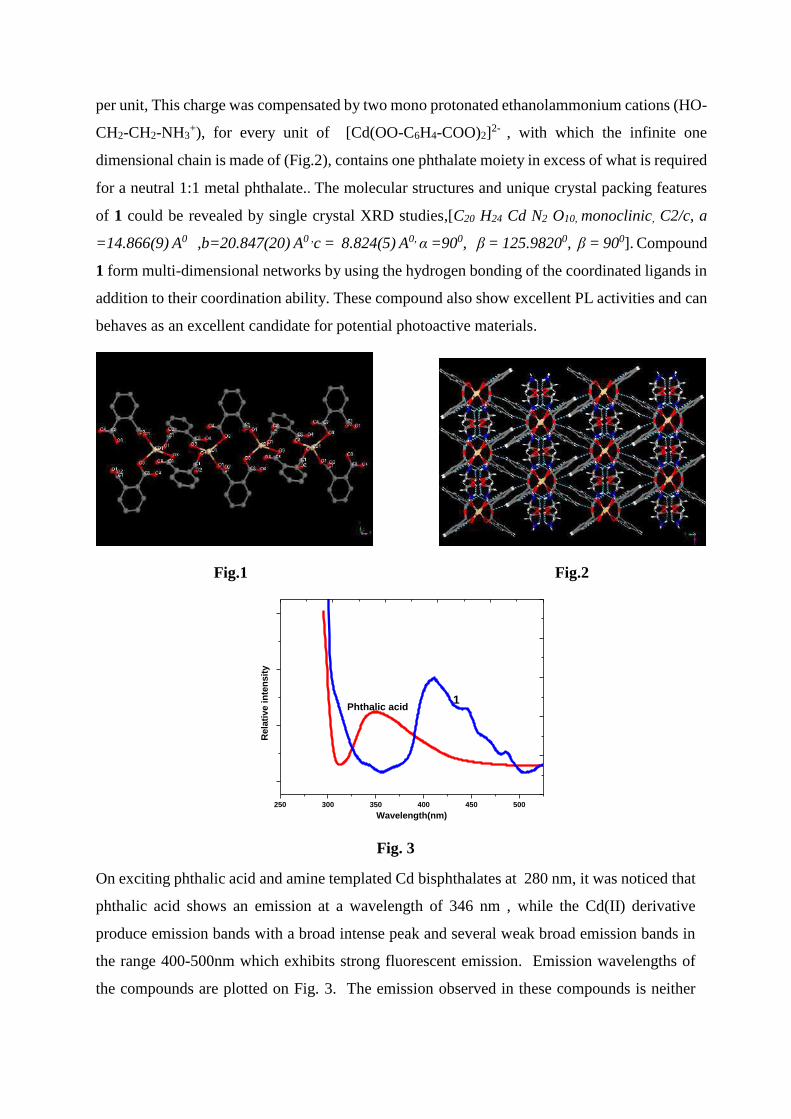
per unit, This charge was compensated by two mono protonated ethanolammonium cations (HO-
CH2-CH2-NH3+), for every unit of [Cd(OO-C6H4-COO)2]
2- , with which the infinite one
dimensional chain is made of (Fig.2), contains one phthalate moiety in excess of what is required
for a neutral 1:1 metal phthalate.. The molecular structures and unique crystal packing features
of 1 could be revealed by single crystal XRD studies,[C20 H24 Cd N2 O10, monoclinic, C2/c, a
=14.866(9) A0 ,b=20.847(20) A0 ,c = 8.824(5) A0, α =900, β = 125.98200, β = 900]. Compound
1 form multi-dimensional networks by using the hydrogen bonding of the coordinated ligands in
addition to their coordination ability. These compound also show excellent PL activities and can
behaves as an excellent candidate for potential photoactive materials.
Fig.1 Fig.2
Fig. 3
On exciting phthalic acid and amine templated Cd bisphthalates at 280 nm, it was noticed that
phthalic acid shows an emission at a wavelength of 346 nm , while the Cd(II) derivative
produce emission bands with a broad intense peak and several weak broad emission bands in
the range 400-500nm which exhibits strong fluorescent emission. Emission wavelengths of
the compounds are plotted on Fig. 3. The emission observed in these compounds is neither
250 300 350 400 450 500
Phthalic acid
Rela
tive in
ten
sit
y
Wavelength(nm)
1

MLCT (metal-to-ligand charge transfer) nor LMCT (ligand-to-metal charge transfer) in nature
and can probably be assigned to intra ligand (π-π*) fluorescent emission, since free phthalic
acid exhibits a similar fluorescent emission only at λmax = 346nm. The enhancement of
luminescence in complexes is perhaps a result of the coordination of those ligands to a metal
centre, effectively increasing the rigidity and asymmetry of the ligands, thereby reducing the
non radiative decay of the intraligand (π-π*) excited state.
Scanned by CamScanner

Scanned by CamScanner

Scanned by CamScanner

Scanned by CamScanner
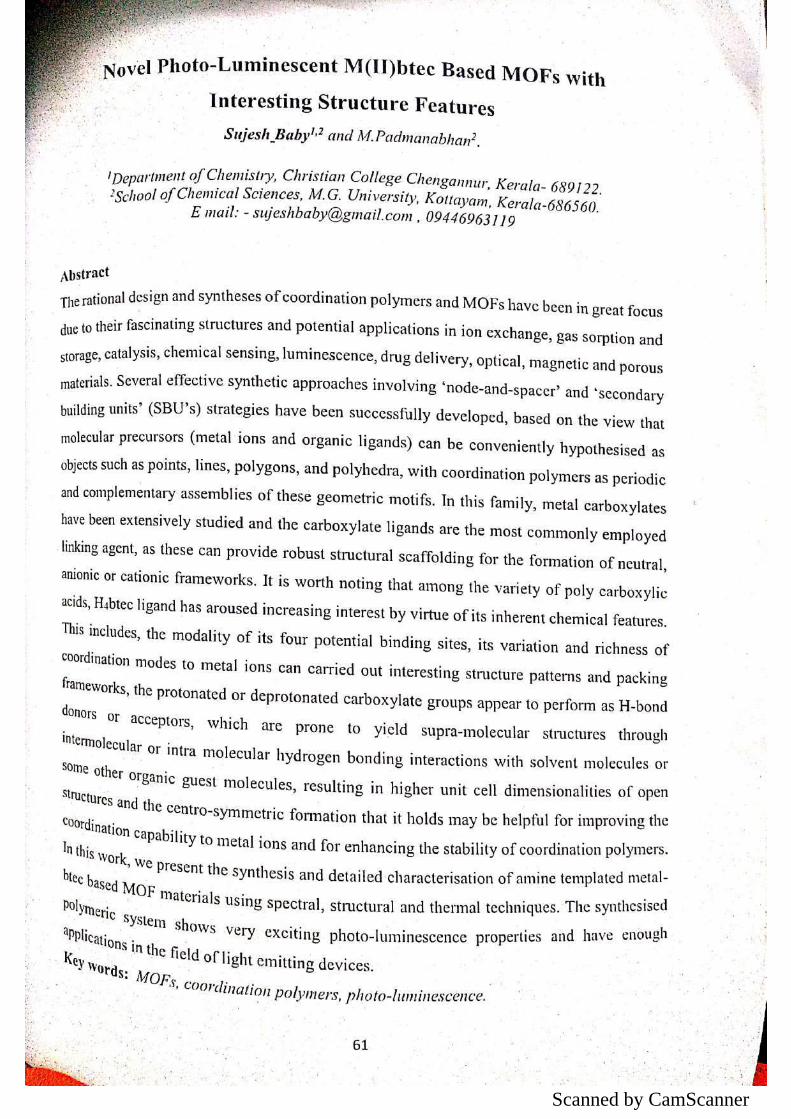
Scanned by CamScanner
Scanned by CamScanner
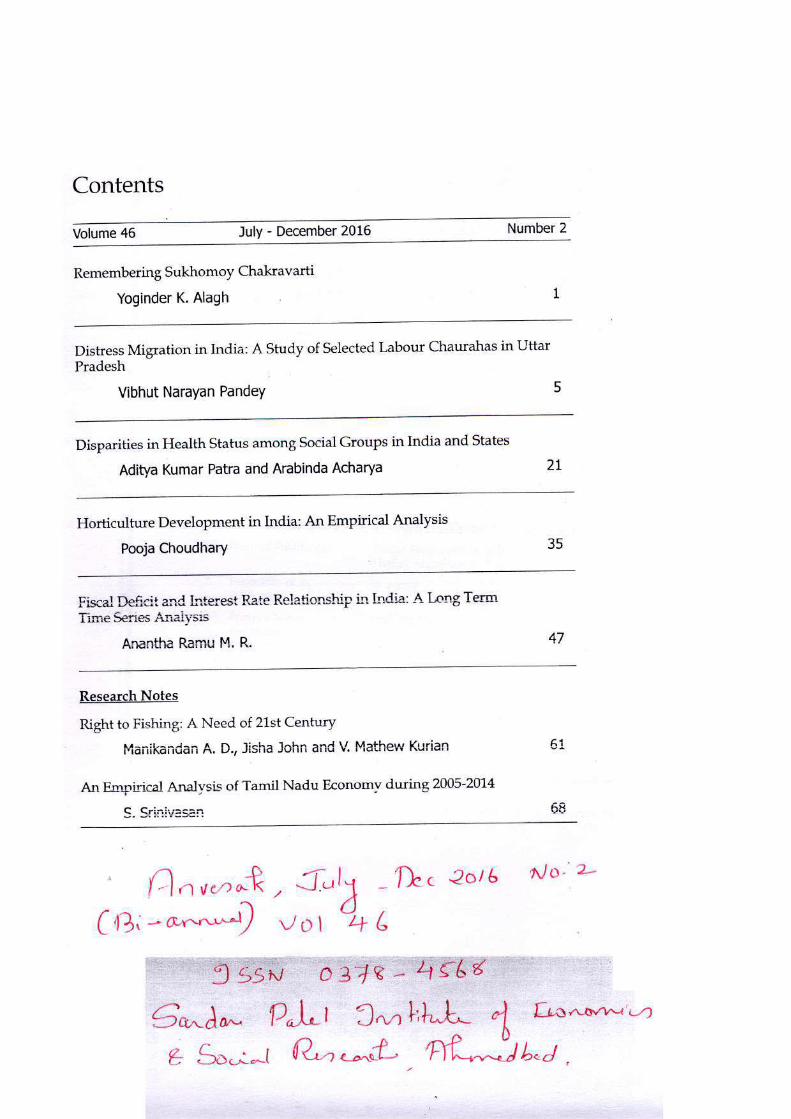

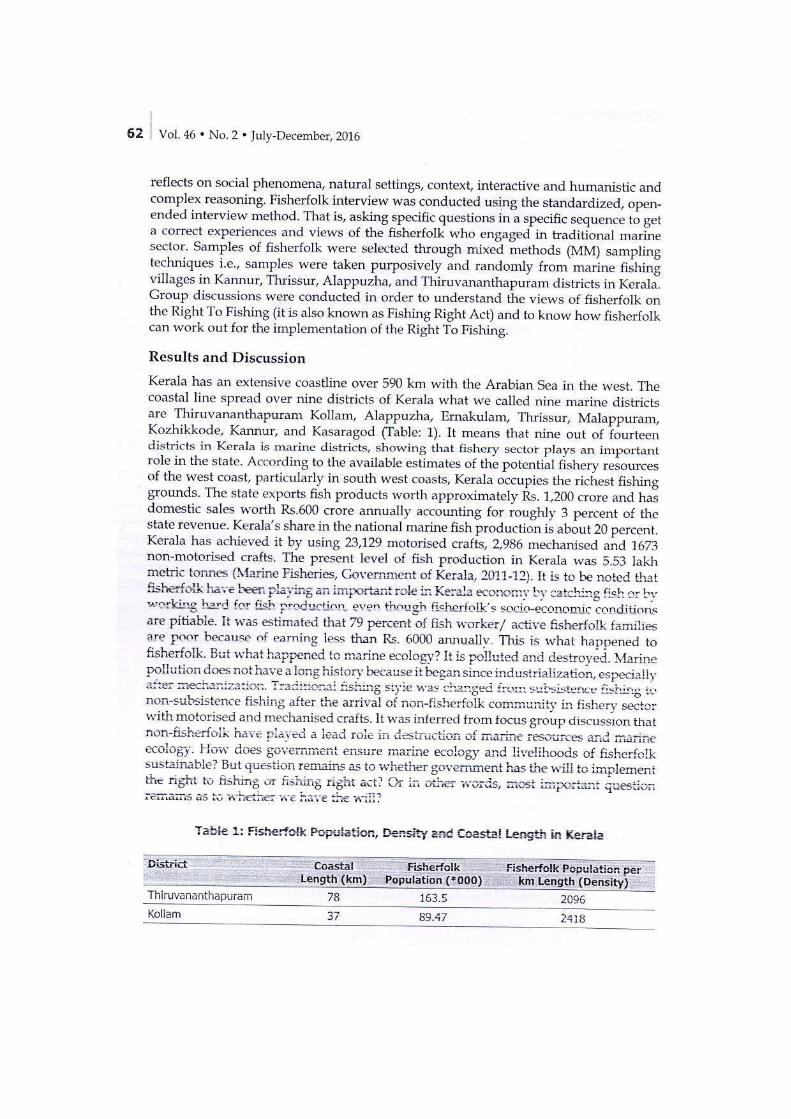
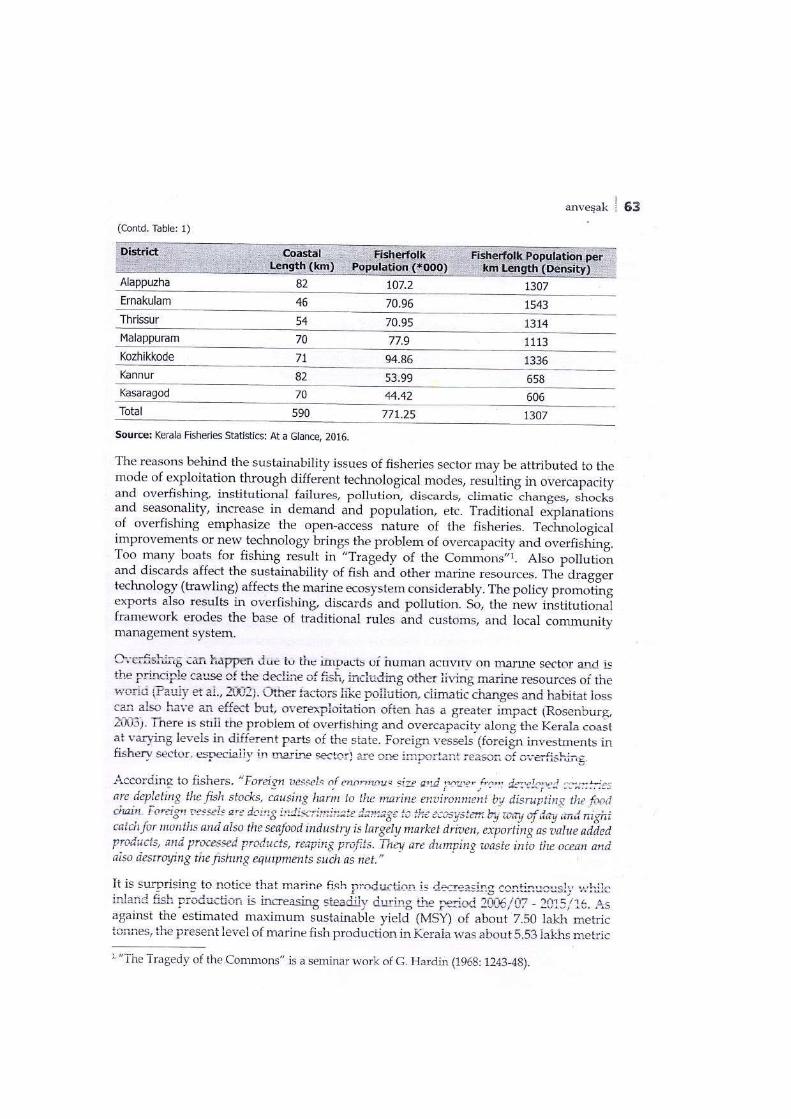
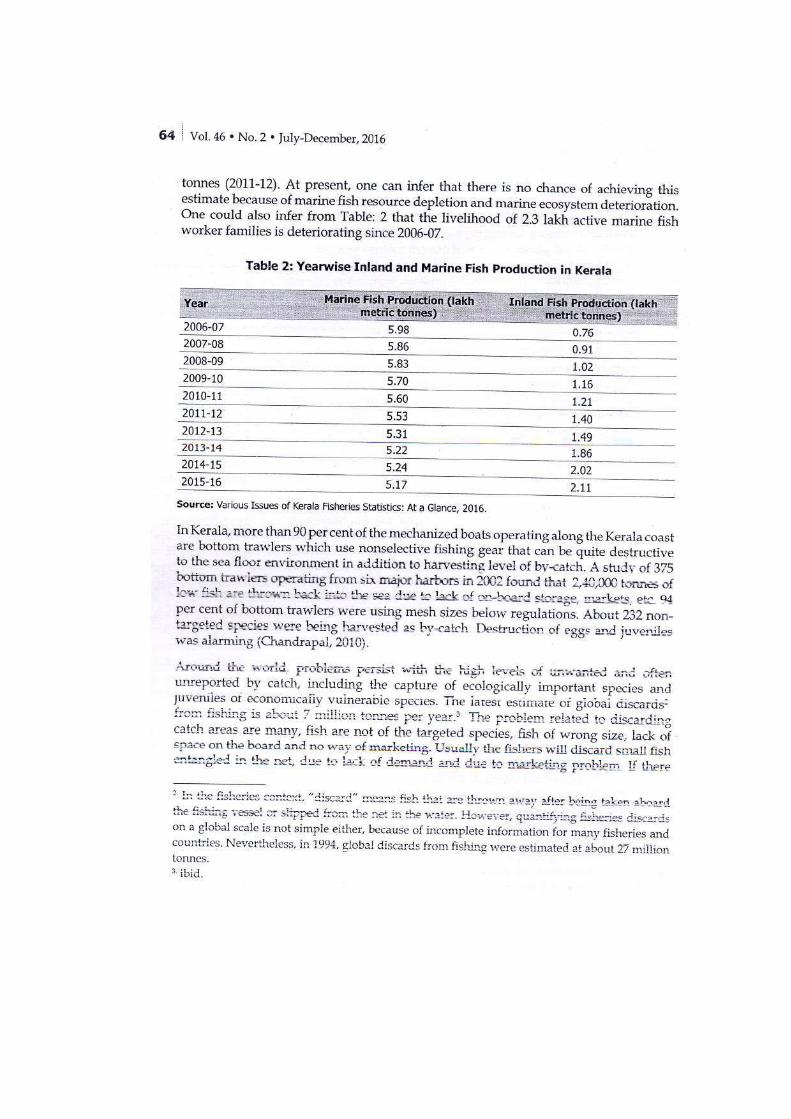

EMBODIMENT OF SYRIAN CHRISTIAN
CULTURE IN KERALA SETTINGS
Koshy Mathai, Research Scholar, ICKS, University of Kerala &
Assistant Professor, Dept. of History, Christian College, Chengannur
Kerala, the southern state of the Indian peninsula has been known as the God’s Own
Country because of its natural beauty and glorious culture. It has been showing toleration
towards all cultures and absorbing all cultures without any discrimination. Once it was a
second home for many religionists like the Buddhists, Jews, Jains etc. Consequently these
cultures had merged into the existing culture and there was a cultural evolution. It is generally
believed that the Christians in Kerala can trace back their origin from the beginning of the
religion itself. According to the tradition the Malankara Church or the Syrian Christian
church in Kerala was founded by St.Thomas, one of the disciples of Jesus Christ. Though the
Malankara Syrian Christians kept strong relations with different foreign churches particularly
with the Persian Church they had kept their identity and remained within the fold of the
Indian culture.
Religion has to do a lot in forming and shaping the culture of a particular community.
Religious values make people behave differently under identical circumstances. The usual
practice of the ordinary people is often to imitate whatever their leaders, whether in religion
or politics do, without examining their merits or demerits. Culture of a group of people is
closely interrelated with their customs, rituals, administration, social and religious life, art
forms, architecture, sculpture. In history we can see that the religion and culture are
interlinked and one cannot be separated one from the other. No art or cultural form is
considered to be an invention but only an innovation of a form already existing.1 Culture is an
image in which the whole experiences life is fully reflected. In other words culture is the
imaging of life and its living experiences in its surroundings. Syrian Christian culture is the
imaging of the life of the Syrian Christians in social settings of Kerala based on the principles
of Jesus Christ. So the objective of the study is to trace out how far the Syrian Christians in
Kerala could develop a culture based on the life and teachings of Jesus Christ in their living
circumstances? Did the Syrian Christians can promote humanity and reflect self expression
in their culture? How far the images in their culture have influenced the synthesis of Modern
Kerala culture?
Rituals and Practices
People celebrate all their occasions with some customs and rituals in order to give
colurs and cheers to them. The Syrian Christians in Kerala also observe such practices by
giving it to some Christian’s perspectives.
Ponnum Thenum and Christening
Ponnum Thenum is a practice in which a new born baby is given honey and gold.
Ponnum Thenum is a special food in which honey is mixed with grinded gold. Ponnu (gold)
represents fame and Thenu (honey) represents prosperity. The new born babies are given
names at the time of their baptism. Normally boys are given the names of their grandfathers
and girls are given the names of their grandmothers.2 Usually Biblical or the derived
Malayalam forms of the Biblical names are given. Examples
Abraham-Avirah, Oura, Avaran, Avarachan, Abu, Ittyavirah
Easow- Koshy, Koshychan, Koshi, Kochukoshy, Kunjoyi
Jacob -Yakob, Chacko , Chackochi, Ekkakko, Kunjakko
John—Yohannan, Yuhanon, Johnny, Jean, Johannas, Ivan
Joseph- Ouseph, Yauseph, Josepp, Joseeph, Outhepp, Uthup, Ittoop, Jossy, Jose, Joshi
Paul- Paulose, Pavuluse, Pylo, Pylee, Pauvolavchan
Philipose-Philip, Peeli, Pothen,
Zachariah - Zacherias, Skariah , Cherry, Cheriyan, kariayachan
Stephanos - Stephen, Steaphan, Esthappan, Punnose, Theppan
Thomas- Thomman, Thommi, Thoma, Thommichan, Oommen, Ommoomman, Kochummen
Alexanthrayos- Alexander, Alex, Alexiyos, Chandy
Mathai- Mathachan, Mathen, Mathias, Mathew
George –Geevarghese , Keevarithu, Varghese, Varkey, Kora, Koruth,
Behanan- Ninan, Nina, Ninachi
There was also a practice that some words like ‘Kochu’ and ‘Kunju’ were prefixed to
some names and the word ‘Achen’ and ‘Appan’ were suffixed.
Kochu + Chandy= Kochandy , Kochu + Itty=Kochitty, Kunju + Avirah= Kunjavirah
Kunju + Chandy= Kunchandy, Kunju + Kutty= Kunjootty, Kunjukutty,
Kunju + Achen= Kunjachen, Thomman + Achen+ Thommachen, Mathai + Achen=
Mathaichan
Ninan + Achen= Ninachan,Chacko + Achan= Chackochan, Kunju + Kunju= Kunjoonju
Kochu + Kunju= Kochukunju, Kochu + Appan= Kochappan,Chacko + Appan= Chackoppan
The prefixed terms denote the affection and the suffixed terms denote respect to the
name. Christian women were also given Biblical names. Usually some other Malayalam
words are attached to it like Amma, Kutty, Mol etc.
Marium- Mariamma, Mariakutty, Mirium, Mary, Merry, Mereena
Rahel- Rahelamma, Rachel, Raichi, Raimol, Rajeena
Elizabeth- Aleyamma, Aleykutty, Kunjeli, Kocheli, Elsy, Elsa
Soosanna- Soosamma, Susy, Sucykutty, Susan, Soo
Hannah- Anna, Annamma, Annaamma, Annakutty, Annie, Ann, Ancy, Anitha, Aneena
Besides, local names are also adopted like Unni, Unnoonny, Kuttappan, Kunjappan, Kunju,
Kunjukunju, Thankachen, Joy, Ammini, Omana, Usha, Kunjumol, Thankamma, Mini,
Remani, Laly etc.3
Chorroonu and Ezhuthinniruthu
The ceremony of Chorroonu, (giving the first rice meal to a child aged about six
months) was also celebrated by the Syrian Christians. It was observed in houses. In some
places, it was conducted in churches and the priest gave the first rice food.
The formal education is started at the age of 4. The practice Ezhuthinniruthu
(beginning the teaching of writing the letters of the alphabet) is held in houses. It is
conducted in front of a lighted lamp and cross. It is performed by an Asan (traditional
preceptor who teaches the alphabets to a new learner). The priest or the elder member in the
family makes the child to draw cross mark. Then the Asan hands over a palm leaf in which
prayer and alphabets are inscribed. The child offers Gurudakshina (a gift or money given to
the teacher for showing respect towards him) and receives the inscribed leaf. Then the
teacher, Asan makes the child to write the first letter on rice taken in a bowl. The child
regularly goes to the Kalari (traditional learning centre run by the Asan).4
Marriage Customs
The most colorful ritual of the Syrian Christian is their marriage. In the beginning
child marriage was common. Parents fixed the marriage. Usually bride and groom were
forbidden to enter in to the church in four days before of their marriage. Dowry was a
common practice and the details were kept in the church registers. A portion of the dowry
was also given to the church.
There were vivid rituals in connection with the marriage. There was Chantham
chartal in groom’s house and Mylanchi ideel in bride’s house in the day before the wedding
day. The groom sits in a special chair provided to him in the marriage pandal. The local
barber reaches their and makes shaving. The friends and cousins of the groom then smear him
with oil and take off him to bathing with a colorful and cheerful procession. This practice has
been known as Chantham chartal. Before starting the Chanthamchartal procession a special
song is also sung. It has been known as the Marthomman Pattu.
At the same time, Mylanchi ideel is being held in the bride’s house. The ornate and
well dressed bride sits on a white cushioned seat. The Mylanchi paste is placed before the
bride and they sing the Marthomman pattu. Thereafter they sing the Mylanchipattu and smear
the henna paste on the body of the bride as described in the Mylanchipattu. The
Mylanchipattu describes the story of the First Couple Adam and Eve. Mylanchi ideel is a
symbolic representation for the eating of the forbidden fruits by Adam and Eve.5
Marriages are conducted at church. It was a usual practice in the morning of the
wedding day that the groom’s sister carries Minnu and Mantrakodi in one tray and
Ayaniappam in another tray into the church. In some areas a splendid wedding procession
was arranged from house to the church. In front of the procession there is a band with the
instruments like different drums, clarinet etc. They also used Flags, cross, Muthukkuda
(decorated umberalla) etc. in the colourful procession. In case of the younger bride and
groom, they were taken by the elders in their shoulder. Normally rich bride and groom travel
in bullock carts or palanquin. Rich grooms wear some kind of colourful long coats with
embroidery works and hats. The rich brides wear a special pudaka (dhoti) given by her
grandmother, A broad silk lines kavani (long blouse) given by her father and silk shawls with
decorative works on their neck and hands. She holds a visari (fan) in her hands. A red
money purse and a small pearl pouch were kept in her pudaka (dhoti).6 Usually all Christian
male members wore a small knife known as penakathi. After the ring changing and Kireeda
vazhvu, the groom bound the thali on the neck of the bride. The Syrian Christians accepted
the Indian custom, the binding of the Thali, a flat triangular gold piece, inlaid with a tiny
cross. This is symbol of the marriage tie. This system is common among the Hindus. The
original Malayalam word for marriage is Pennukettu, which signifies the binding of thali on
the neck of the bride. The Minnu in Christian marriage is different from that of the Hindus in
which a cross is engraved on it.7 The thread taken from the Mantrakodi is used for
Minnukettu ritual.
The mother of the bride received the new couple in her home with a lighted lamp and
“Nellum Neerum”. The couples are asked to stand in circles drawn with rice. Then they were
given sweets. Then the couples are being sitting on special seats covered with black wool and
white cloth. This seating is known as Manar kolam. Special seats were also arranged for the
guests. Then some wedding songs are sung. These songs are related with faith and traditions of
Christianity. Herafter Vazhu Pattu is sung through which the relatives and the guests offer their
blessings to the couple.
After the marriage, there is a two-day celebration of with music and feast (pattum
oottum). Margamkali, Parichamuttukali, vattakkalikal etc. are performed. Then there is an
interesting ritual, called Adachuthura. After the supper the groom enters into the Manavara
(Special room arranged for the married couples) along with his friends and close the door.
Then the mother –in –law of the groom asks the groom to open the door by singing some
particular songs. This custom is known as Adachuthura. And these songs are known as
Adachuthurappattu.
There is also some other customs as well before their journey to bride’s house. Kacha
Thazhukuka is the main ritual in which the aunt of the bride (sister of the bride’s father)
wears a ring to the groom and receives a kacha (either dhoti or saree) from him. The groom
and his friends then sing the Marthomman Song around the hanging light in the wedding
reception pandal. The bride and her friends also do the same. It is called Vilakku Thodeel.
Hereafter there is Koodi Virunnu (common feast). Nal vathil is the last part of their marriage
celebration. It is the departure ceremony of the bride and groom into bride’s house.8
Christians mainly expose their social status and its symbols in their marriage occasions. The
Christian women usually wore full sleeved blouse extend to their waist and long dhoti. They
covered their head with an upper cloth (neriyathu) while going to the church. They wore
ornaments in ear, throat and hands. They never used ornaments on nose. Men were used
white cloth and tied a towel on their head. In the beginning the men wore kuduma (a tuft of
hair on the top or back of the head) like the upper caste Hindus. But they wore a cross on the
kuduma.9 They were not differed from the upper caste Hindus in their dress and language.
Rituals related to death
The body was buried at the cemetery of the church. No one in the family of the
deceased was eating before the burial. Cooking of any food was also prohibited. After the
burial, the funeral participants were given vegetarian food. There were some practices like
Pula, Chatham etc. The family members and the close relatives of the deceased were treated
as impure for a specific period. A special food was arranged on the 11th
or 16th
day of the
death. It is known as Pulakuli. Chatham (Sradham) is arranged on every death
anniversaries.10
The presence of the priests and prayer give a religious and spiritual colour.
Religious life
The religious life of the Syrian Christians is different from the rest of the Christians in
the world. They could develop their own religious culture and preserve their own identity
due to the geographical separation from the Christian countries western. Their social life was
deeply attached with the church. The churches were exempted from taxes like the temples.
The properties given to the churches were called Pallippuram and Pallichantham. The
churches were administered by Arcadiyioccans or Arch deacons. From 8th
century there were
Metropolitans. The Arch deacons administered both the spiritual and secular matters of the
church. The priests were generally called Kathanars. They have been respectfully called as
Achen. They could marry. Like the Nattukkoottam or Manram, each parishes had a
Edavakayogam (Parish general body) which consisting the elder members of the church. The
vicar was the head of the church body. This body had wide powers even punish a sinner. It
also resolved the issues among the members as well as the local issues within the church
limit. The church property was managed by the priest and the Pravarthikkarum elected by the
church general body.11
There were many instances which show that the local Hindu chiefs
had a significant role in many of the church dealings and vice versa. The representatives of
the churches assembled together and formed the general body of the church and took general
decisions.
Language and Literature
The language used in worship is perhaps Syriac. Malayalam is comparatively a
modern language. Tamil was the language of the common people for a long time. So the
Syrian Christians mostly produced their works in Tamil. The Syrian Christians contributed
much in the field of education particularly after the arrival of the English missionaries. It
resulted in a renaissance in the socio-cultural aspects of the Kerala society. In the field of
Literature much effort was taken in the field of music. But we can’t see much progress in the
field of poetry or drama. It had several reasons. The warning given by the Synod of Diampore
in associating with the regional poetry12
, the rigid observation of the Puritanism by the
protestants, use of Syriac as the religious and worship language, domination of the
priesthood, apprehension about writers, reluctance in involving traditional culture, aversion to
the theme of romance and comedy etc are some of the important reasons behind it. So the
Christians are failed to develop Syrian-Malayalam like the Arabi-Malayalam by the Muslims.
But the introduction of printing press by the missionaries and the importance given to
Malayalam as the worship language since the reformation in Malankara church helped the
steady growth of Malayalam language and literature.
Architecture
In the field of architecture, the Syrian Christians failed to develop a unique style. All
the ancient churches were built on the model of then temples. Its construction was based on
the Christian theology and the local architecture. Ancient churches are the best examples of
traditional Kerala architecture. There was a cross on the top roof of each and every church. It
had long flag posts and Dwarapalakanmars (gate keepers) like the temples. Same materials
were used in the construction of both the temples and churches. Also the same workers
engaged in both the construction. But everywhere there was a Nazranisthambam, a big stone
cross erected in front of the church. It resembled with the stambhams erected by the
Buddhists and Jains. These big crosses are still seen in such areas like kaduthuruthy
(St.Mary’s church-39 ft), Changanassery, Kanjoor, Kuravilangadu, Ankamali, Muttuchira,
Ankamali, Edappalli, Chengannur etc. The base of the stone cross is built in the model of an
altar in Hindu temples. In some temples we can see a Deepastambam (candelabrum). Apart
from the church buildings these churches had Padippura (Gate-house), Verandah, Kottupura,
Oottupura, Manimalika (bell-house), Ayudhappura, Nadakasala etc. These features are seen
in the ancient churches at Olloor, Parur, Kuravilangadu, Kothamangalam, Ramapuram,
Kallooppara, Niranam, Cheppad, Chengannur, Maramaon, Thumpamon, etc. These churches
have no lofty top towers in their Mukhavaram (front elevation). Normally these churches
were constructed on the top of hill and the people had to climb a number of steps in order to
reach the church. From 17th
century we can see the influence of the Portuguese influence in
Kerala church architecture.
The Syrian Christian Churches reveals the Christianization of the temple architecture
in its making. Melkkoora (top roof), Monthayam (girder), Melmach (Top ceiling) pillers,
Nirappalaka ( plank) etc are beautifully constructed. In temples these are made of stones, but
in churches mostly used wood. The most important part of the church is the Madhbaha
(Syrian word) and Thronos (Latin word meaning altare).Usually the Madhbahas are built in
three shapes, square, rectangular, and octagon. Its style was the combination of traditional
Kerala architecture and Persian theology. In big churches, there are three thronos, one main
thronos at the centre and two other on south and north sides of the side walls of the church.
There is also a big wooden box called sakrari for keeping the sacred goods. It was also built
with great beauty. The highest portion of the back side of the altare is known as Rathal
(derived from the French word retabla means table at the back side). The wooden pulpit or
rostrum is also called pushpam. Tableetha is a sacred wooden board placed on the thronos for
keeping the sacred things. A separate wooden stand is placed on the thronos for keeping the
Holy Bible. Carpenters built the altare, the crosses, and candle stands with great beauty and
skill. Churches at Olloor, Kanjoor, Alangad, Koratty, chengannur, Thumpamon
kaduthuruthy, Mulanthuruthy, Champakukam etc are best examples for it. Mukhavaram, side
and top portions of the doors and windows are also decorated with plaster reliefs of several
images with biblical and secular themes as well. Hunting scenes fight scenes, peacock dance,
tiger, dove, flora and fauna, angels, cock fight etc were beautifully imaged in this art. We can
notice the simplicity of the traditional and local art in these images rather than religious
rituals and piety. These pictures are seen both in white and other colours.
Beautiful and colourful mural painting on the walls of the church and Madbaha is a
unique feature of the Syrian Christian churches. These pictures include the themes of Bible
and the stories related to the beliefs and history of the church. They were mostly drawn with
black lines and painted with red, green, blue, yellow and white colours .Clarity, elegance,
nobility and attractiveness are the chief features of these pictures. Last supper, Sacrifice on
the cross, resurrection of Christ, Risen Lord, Ascension, Ark of Noah, Christmas, Baptism of
Christ, Jesus at Maria’s lap etc are the most common mural paintings. The churches in
Olloor, Koratty Ankamali, Kanjoor, Fort kochi, Niranam, Kuravilangadu, Paliekkara,
Cheppad, Niranam, Champakulam, Kadamattom, Ramapuram, Kandanad, ,Mulanthuruthy,
Kothamangalam etc are well known for its splendid mural paintings. Icons are also the part of
Christian spiritual life. They believe that icons are the images of God’s revelation to man.
Icons are mainly based on the Holy Bible and traditions. Icons like Holy Trinity, Christmas,
Baptism, appearance of Christ at Sinai Mount, feast of pass over, Sleeba (cross), resurrection
etc are beautifully depicted by the artists on the church walls.14
The Baptismal Fond (Mammodeesa Thotti), and church bells deserve significance for
its beauty. It was deeply influenced by the Persian art. The hanging lights, pulpits, doors,
windows etc were also so attractive for its charm. Some of the churches have padippuras
(gate-house) and some others have Padippuramalika (doubled storied gate-house building)
like the churches in Arthatt, Kundara, Thevalakkara, kaipattoor, chengannur etc. Big
churches were attached with pallimalika (house for the priests and guests). Façade or portico,
theatre hall and ponds were also the part of the big churches. 13
The erection of statues in
churches was begun only with the arrival of the Portuguese. The Indian sculptor imitated the
Europeans sculpture of the artists like Michael Angelo, Leonardo Da Vinci, and Raphael. The
sculpture, ‘Virgin Mary carries infant Jesus’ was the most common sculpture among them.
The Portuguese introduced a new architectural style in India. It was a combination of
different European architecture style like Domes with Byzantine style of the Greeks,
beautifully engraved Basilicas, cupola, pointed arch windows, rounded clustered columns,
Romanesque (Greek-Roman) styled arches and thick and heavy stone walls . Mainly the
architecture style of the Syrian Christians was influenced by four factors: the Vedic
Brahminic culture, the Persian culture in west Asia, the Budhist culture in Kerala and the
European Renaissance culture.15
The Gothic style adopted by the Christians in their
architecture was not belonged to the modern European, but the medieval European culture
introduced by the Portuguese. Only after the arrival of the British missionaries, the European
renaissance influenced the Syrian Christian culture.
Festivals
The festivals of the Christians are mainly attached to the churches. These festivals
have been known as Perunnals (great days) and have been influenced by the national
character. Really, it is the Christianized traditional festivals. Perunnals are celebrated on the
commemoration day of the parish or the day related to the name of a particular saint in
which the church is founded. Splendid procession or Rasa is the most attractive part of the
perunnal. Music band, flags, Muthukkuda (colourful umbrella decorated with pearls at the
rim), crosses, colour lights, fireworks, beasts like elephants etc were the part and parcel of
this event. Different art and cultural programmes were arranged in connection with the
perunnals. It included not only the Christian art forms like Margamkali, Chavittunadakam,
Parichamuttukali etc but also secular even Hindu cultural programmes like Thullal,
Njaninmelkali (tight-rope walking) , Valeru (sword throwing), drum beating etc.16
Christian Art Forms
Most of the Christian art forms are performed in connection with the special days of
the church and marriage celebrations. These art forms are closely connected with the martial
skills. Margamkali, Parichamuttukali, Vattakali, Chavittunadakam, Poovirkkam etc are
important art forms of the Syrian Christians. Margamkali is the ancient art form of the
Christians. It is a kind of dance in which twelve persons, either male or female represent the
twelve Disciples of Christ round a lighting lamp with rhythmic steps in accordance with the
music. The lamp denotes the presence of Jesus Christ. The works of Saint Thomas is the
theme of Margamkali song. Parichamuttukali is the artistic form of the martial art of the
Christians. It is closely related to the traditional Kalaripayattu system. At least twenty four
participants with a short sword in one hand and a shield in the other play the art form with
uniform steps of martial skills. Vattakalikali is related to the social life of the Christians
particularly with their marriage. There were different forms of this art form like Mangalyam
vattakali, Ettuthira vattakali, Adam-Havva vattakali, Moosayude vattakali, ,Poorva
ousephinte vattakali and Vadimanam vattakali (Stories related to Knaithommen). It was an
inevitable part of the ancient Syrian Christian marriage. Poovirakkam is another art form of
the Christians. A large paper flower-bud is arranged in the centre of the marriage pandal and
a thread from the flower petal is attached with toe of the leader of the singers. And each petal
is unfolded according to the movements of the lead singer’s toe in specific interval. Usually
there are 12-24 petals in a flower bud.17
Chavittunadakam is considered as the first popular
theatre art in Kerala. It was originated due to the influence of Portuguese. It is a mixture of
the styles of the Mudiyet and Kathakali on the one side and the European Opera on the other.
The actors act and sing simultaneously. The theme of the Chavittunadakam is a synthesis of
stories from Bible and contemporary social problems. Normally it was performed in
occasions like Christmas and Easter in high open stages.18
Colourful dresses used in this art
form are similar to the feudal kings in Europe. But most of the music instruments used in this
art form is Indian in character.
Conclusion
Christian culture is more or less acquired. They never wanted to become a lower
community in Kerala where a caste- ridden and discriminating society was prevailed. So they
tried to imitate the life style and culture of the upper caste Hindus in every walks of their life.
They deliberately accepted the images of the upper caste culture in their social and religious
expressions and tried to give Christian perspectives to it. The Christians did not create a
parallel culture or counter culture but they identified and integrated with the existing culture.
‘While in Rome, be a Roman’ is a familiar statement and like that the Christians in India are
bound to accept the customs and manners here with variations. The Syrian Christians in
Kerala are Indian in Culture, Christian in Religion, and Oriental in Worship. It was deeply
influenced by not only the native Hindu culture but Buddhism, Jainism, Persian and
European cultural images also. We can see the images of nationalism and traditional culture
in Christian social life. Though most of their traditional cultural symbols have been
disappeared due to the influence of modern culture some of them have been still prevailing
with modification or have been observed in one or another form. Jesus asked his followers to
become light and salt to the world through their life and witness. The Syrian Christians in
Kerala could develop a culture in Kerala which reflects the images of their social life rather
than their faith. But they tried to give a religious colour to it for keeping their social status
identity in their living circumstances. Images of the Syrian Christian culture have influenced
the synthesis of Modern Kerala culture in many aspects.

Bibliography
1. Balakrishnan V., History of the Syrian Christians of Kerala, p.143.
2. Mathew Daniel Dr., Kerala Kristhava Samskaram(Mal),p.71
3. Ibid, p.72-75.
4. Ibid, p.76
5. Rose Mary A.Dr, Keralathile Christianikalude Acharanushtanagal(Mal) p.17
6. Ibid, p.69.
7. Mathew K.V. Dr, Faith and Practice of the Mar Thoma Church.p.58.
8. Mathew Daniel Dr.,op.cit,p-76-81
9. Samuel Nellimukal, Keralathile Samoohya parivarthanam(Mal),p.76-78
10. Samuel Chandanapally, Kristava Samskaram (Mal) p.59
11. Mathew N.M.,Malankara Marthoma Sabhacharithram, vol.3,p.19
12. Kuriakose M.K., History of Christianity in India: Source Materials, P.40
13. Mathew Daniel Dr., op.cit, p-181-193.
14. Jipin Varghese, Dr., Keralathile Kristava Devalaya Chumar Chitrangalum
Altharachitrangalum (Mal), p.23-47
15. John K.J.Ed, Christian Heritage of Kerala, p.68.
16. Mathew P.V. Keralathile Nazrani Christianikal, p.34-37
17. Mathew Daniel Dr., op.cit, p-198-199.
18. Gangadharan T.K, History of Kerala,408-410


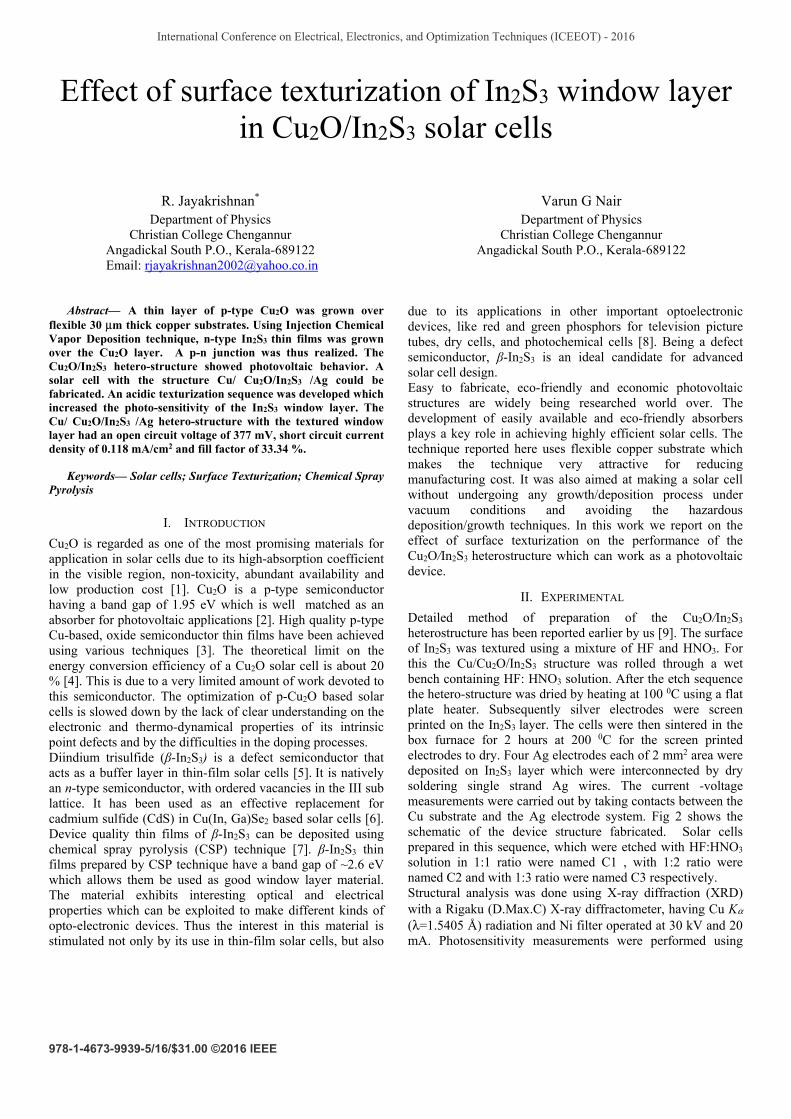
International Conference on Electrical, Electronics, and Optimization Techniques (ICEEOT) - 2016
978-1-4673-9939-5/16/$31.00 ©2016 IEEE
Effect of surface texturization of In2S3 window layer in Cu2O/In2S3 solar cells
R. Jayakrishnan* Department of Physics
Christian College Chengannur Angadickal South P.O., Kerala-689122 Email: [email protected]
Varun G Nair Department of Physics
Christian College Chengannur Angadickal South P.O., Kerala-689122
Abstract— A thin layer of p-type Cu2O was grown over flexible 30 μm thick copper substrates. Using Injection Chemical Vapor Deposition technique, n-type In2S3 thin films was grown over the Cu2O layer. A p-n junction was thus realized. The Cu2O/In2S3 hetero-structure showed photovoltaic behavior. A solar cell with the structure Cu/ Cu2O/In2S3 /Ag could be fabricated. An acidic texturization sequence was developed which increased the photo-sensitivity of the In2S3 window layer. The Cu/ Cu2O/In2S3 /Ag hetero-structure with the textured window layer had an open circuit voltage of 377 mV, short circuit current density of 0.118 mA/cm2 and fill factor of 33.34 %.
Keywords— Solar cells; Surface Texturization; Chemical Spray Pyrolysis
I. INTRODUCTION
Cu2O is regarded as one of the most promising materials for application in solar cells due to its high-absorption coefficient in the visible region, non-toxicity, abundant availability and low production cost [1]. Cu2O is a p-type semiconductor having a band gap of 1.95 eV which is well matched as an absorber for photovoltaic applications [2]. High quality p-type Cu-based, oxide semiconductor thin films have been achieved using various techniques [3]. The theoretical limit on the energy conversion efficiency of a Cu2O solar cell is about 20 % [4]. This is due to a very limited amount of work devoted to this semiconductor. The optimization of p-Cu2O based solar cells is slowed down by the lack of clear understanding on the electronic and thermo-dynamical properties of its intrinsic point defects and by the difficulties in the doping processes.
Diindium trisulfide (β-In2S3) is a defect semiconductor that acts as a buffer layer in thin-film solar cells [5]. It is natively an n-type semiconductor, with ordered vacancies in the III sub lattice. It has been used as an effective replacement for cadmium sulfide (CdS) in Cu(In, Ga)Se2 based solar cells [6]. Device quality thin films of β-In2S3 can be deposited using chemical spray pyrolysis (CSP) technique [7]. β-In2S3 thin films prepared by CSP technique have a band gap of ~2.6 eV which allows them be used as good window layer material. The material exhibits interesting optical and electrical properties which can be exploited to make different kinds of opto-electronic devices. Thus the interest in this material is stimulated not only by its use in thin-film solar cells, but also
due to its applications in other important optoelectronic devices, like red and green phosphors for television picture tubes, dry cells, and photochemical cells [8]. Being a defect semiconductor, β-In2S3 is an ideal candidate for advanced solar cell design.
Easy to fabricate, eco-friendly and economic photovoltaic structures are widely being researched world over. The development of easily available and eco-friendly absorbers plays a key role in achieving highly efficient solar cells. The technique reported here uses flexible copper substrate which makes the technique very attractive for reducing manufacturing cost. It was also aimed at making a solar cell without undergoing any growth/deposition process under vacuum conditions and avoiding the hazardous deposition/growth techniques. In this work we report on the effect of surface texturization on the performance of the Cu2O/In2S3 heterostructure which can work as a photovoltaic device.
II. EXPERIMENTAL
Detailed method of preparation of the Cu2O/In2S3
heterostructure has been reported earlier by us [9]. The surface of In2S3 was textured using a mixture of HF and HNO3. For this the Cu/Cu2O/In2S3 structure was rolled through a wet bench containing HF: HNO3 solution. After the etch sequence the hetero-structure was dried by heating at 100 0C using a flat plate heater. Subsequently silver electrodes were screen printed on the In2S3 layer. The cells were then sintered in the box furnace for 2 hours at 200 0C for the screen printed electrodes to dry. Four Ag electrodes each of 2 mm2 area were deposited on In2S3 layer which were interconnected by dry soldering single strand Ag wires. The current -voltage measurements were carried out by taking contacts between the Cu substrate and the Ag electrode system. Fig 2 shows the schematic of the device structure fabricated. Solar cells prepared in this sequence, which were etched with HF:HNO3 solution in 1:1 ratio were named C1 , with 1:2 ratio were named C2 and with 1:3 ratio were named C3 respectively. Structural analysis was done using X-ray diffraction (XRD) with a Rigaku (D.Max.C) X-ray diffractometer, having Cu Kα (λ=1.5405 Å) radiation and Ni filter operated at 30 kV and 20 mA. Photosensitivity measurements were performed using
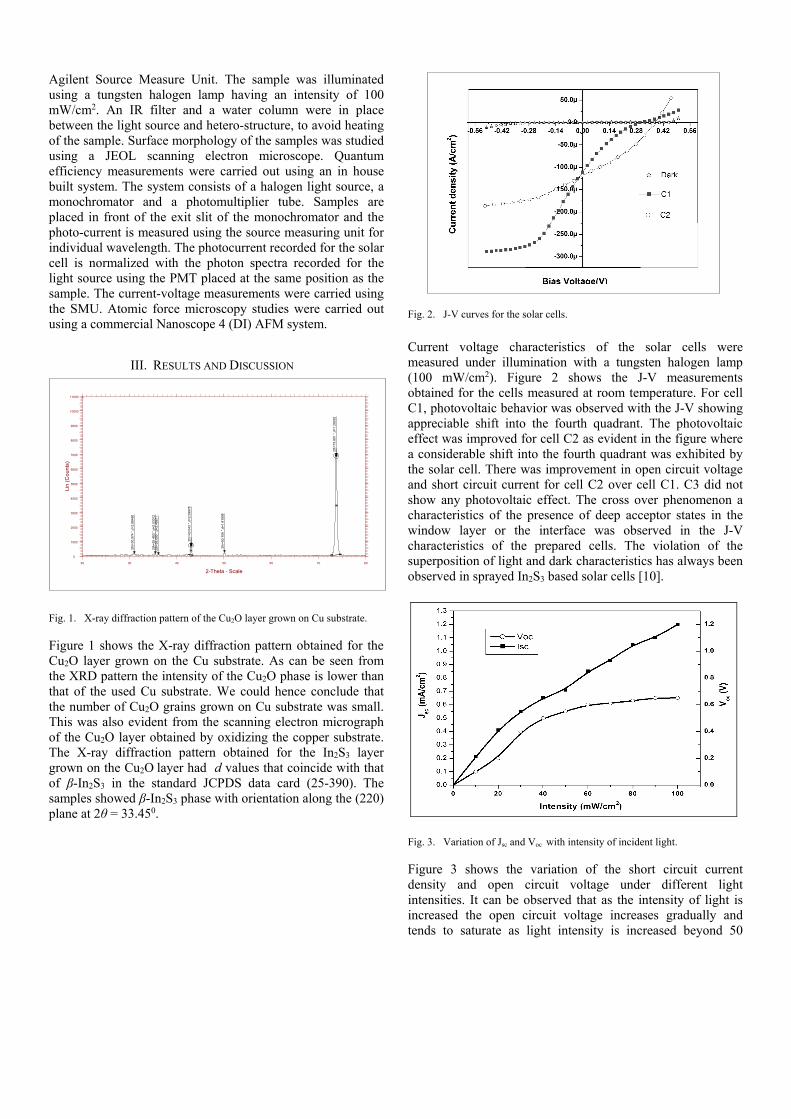
Agilent Source Measure Unit. The sample was illuminated using a tungsten halogen lamp having an intensity of 100 mW/cm2. An IR filter and a water column were in place between the light source and hetero-structure, to avoid heating of the sample. Surface morphology of the samples was studied using a JEOL scanning electron microscope. Quantum efficiency measurements were carried out using an in house built system. The system consists of a halogen light source, a monochromator and a photomultiplier tube. Samples are placed in front of the exit slit of the monochromator and the photo-current is measured using the source measuring unit for individual wavelength. The photocurrent recorded for the solar cell is normalized with the photon spectra recorded for the light source using the PMT placed at the same position as the sample. The current-voltage measurements were carried using the SMU. Atomic force microscopy studies were carried out using a commercial Nanoscope 4 (DI) AFM system.
III. RESULTS AND DISCUSSION
Fig. 1. X-ray diffraction pattern of the Cu2O layer grown on Cu substrate.
Figure 1 shows the X-ray diffraction pattern obtained for the Cu2O layer grown on the Cu substrate. As can be seen from the XRD pattern the intensity of the Cu2O phase is lower than that of the used Cu substrate. We could hence conclude that the number of Cu2O grains grown on Cu substrate was small. This was also evident from the scanning electron micrograph of the Cu2O layer obtained by oxidizing the copper substrate. The X-ray diffraction pattern obtained for the In2S3 layer grown on the Cu2O layer had d values that coincide with that of β-In2S3 in the standard JCPDS data card (25-390). The samples showed β-In2S3 phase with orientation along the (220) plane at 2θ = 33.450.
Fig. 2. J-V curves for the solar cells.
Current voltage characteristics of the solar cells were measured under illumination with a tungsten halogen lamp (100 mW/cm2). Figure 2 shows the J-V measurements obtained for the cells measured at room temperature. For cell C1, photovoltaic behavior was observed with the J-V showing appreciable shift into the fourth quadrant. The photovoltaic effect was improved for cell C2 as evident in the figure where a considerable shift into the fourth quadrant was exhibited by the solar cell. There was improvement in open circuit voltage and short circuit current for cell C2 over cell C1. C3 did not show any photovoltaic effect. The cross over phenomenon a characteristics of the presence of deep acceptor states in the window layer or the interface was observed in the J-V characteristics of the prepared cells. The violation of the superposition of light and dark characteristics has always been observed in sprayed In2S3 based solar cells [10].
Fig. 3. Variation of Jsc and Voc with intensity of incident light.
Figure 3 shows the variation of the short circuit current density and open circuit voltage under different light intensities. It can be observed that as the intensity of light is increased the open circuit voltage increases gradually and tends to saturate as light intensity is increased beyond 50
Lin
(Cou
nts)
0
1000
2000
3000
4000
5000
6000
7000
8000
9000
10000
11000
2-Theta - Scale
20 30 40 50 60 70 80
2th
=3
0.9
74 °
,d=
2.8
8480
2th
=35
.45
0 °
,d=
2.5
301
22t
h=3
6.0
90 °
,d=
2.4
8671
2th
=4
3.0
43 °
,d=
2.0
9978
2th
=50
.10
6 °,
d=1
.81
908
2th
=73
.80
1 °,
d=1
.282
92
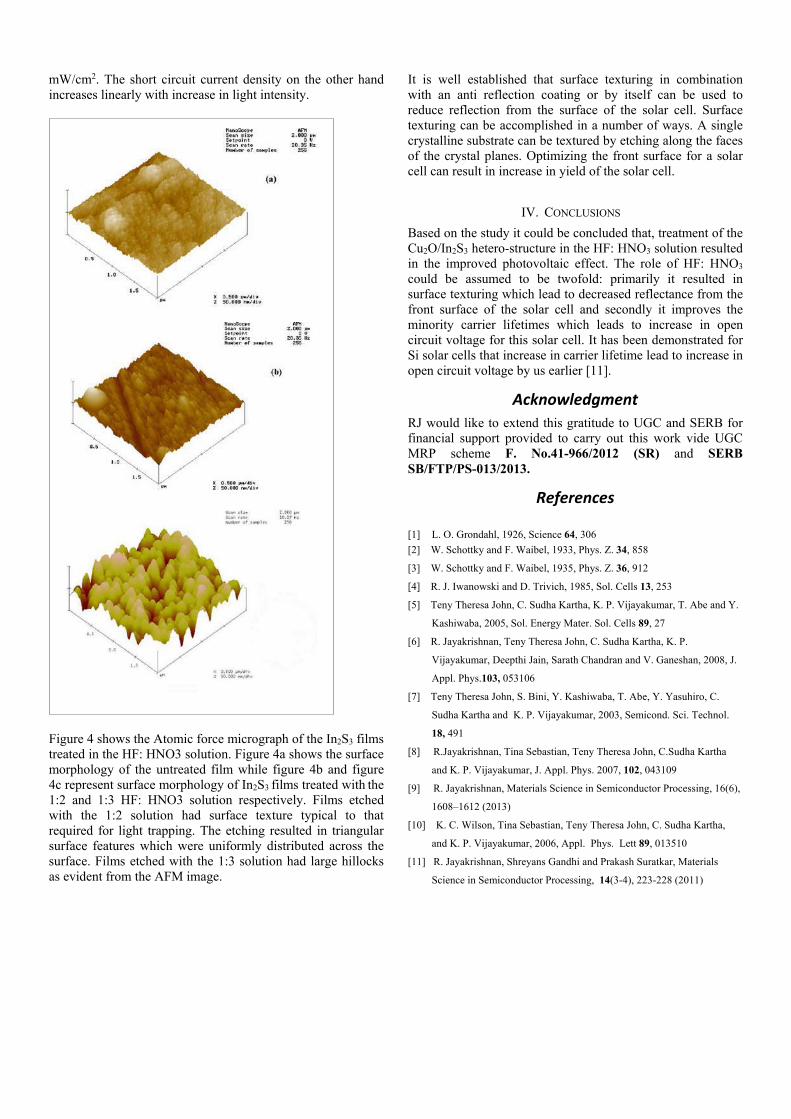
mW/cm2. The short circuit current density on the other hand increases linearly with increase in light intensity.
Figure 4 shows the Atomic force micrograph of the In2S3 films treated in the HF: HNO3 solution. Figure 4a shows the surface morphology of the untreated film while figure 4b and figure 4c represent surface morphology of In2S3 films treated with the 1:2 and 1:3 HF: HNO3 solution respectively. Films etched with the 1:2 solution had surface texture typical to that required for light trapping. The etching resulted in triangular surface features which were uniformly distributed across the surface. Films etched with the 1:3 solution had large hillocks as evident from the AFM image.
It is well established that surface texturing in combination with an anti reflection coating or by itself can be used to reduce reflection from the surface of the solar cell. Surface texturing can be accomplished in a number of ways. A single crystalline substrate can be textured by etching along the faces of the crystal planes. Optimizing the front surface for a solar cell can result in increase in yield of the solar cell.
IV. CONCLUSIONS
Based on the study it could be concluded that, treatment of the Cu2O/In2S3 hetero-structure in the HF: HNO3 solution resulted in the improved photovoltaic effect. The role of HF: HNO3 could be assumed to be twofold: primarily it resulted in surface texturing which lead to decreased reflectance from the front surface of the solar cell and secondly it improves the minority carrier lifetimes which leads to increase in open circuit voltage for this solar cell. It has been demonstrated for Si solar cells that increase in carrier lifetime lead to increase in open circuit voltage by us earlier [11].
Acknowledgment RJ would like to extend this gratitude to UGC and SERB for financial support provided to carry out this work vide UGC MRP scheme F. No.41-966/2012 (SR) and SERB SB/FTP/PS-013/2013.
References
[1] L. O. Grondahl, 1926, Science 64, 306
[2] W. Schottky and F. Waibel, 1933, Phys. Z. 34, 858
[3] W. Schottky and F. Waibel, 1935, Phys. Z. 36, 912
[4] R. J. Iwanowski and D. Trivich, 1985, Sol. Cells 13, 253
[5] Teny Theresa John, C. Sudha Kartha, K. P. Vijayakumar, T. Abe and Y.
Kashiwaba, 2005, Sol. Energy Mater. Sol. Cells 89, 27
[6] R. Jayakrishnan, Teny Theresa John, C. Sudha Kartha, K. P.
Vijayakumar, Deepthi Jain, Sarath Chandran and V. Ganeshan, 2008, J.
Appl. Phys.103, 053106
[7] Teny Theresa John, S. Bini, Y. Kashiwaba, T. Abe, Y. Yasuhiro, C.
Sudha Kartha and K. P. Vijayakumar, 2003, Semicond. Sci. Technol.
18, 491
[8] R.Jayakrishnan, Tina Sebastian, Teny Theresa John, C.Sudha Kartha
and K. P. Vijayakumar, J. Appl. Phys. 2007, 102, 043109
[9] R. Jayakrishnan, Materials Science in Semiconductor Processing, 16(6),
1608–1612 (2013)
[10] K. C. Wilson, Tina Sebastian, Teny Theresa John, C. Sudha Kartha,
and K. P. Vijayakumar, 2006, Appl. Phys. Lett 89, 013510
[11] R. Jayakrishnan, Shreyans Gandhi and Prakash Suratkar, Materials
Science in Semiconductor Processing, 14(3-4), 223-228 (2011)

Scanned with CamScanner
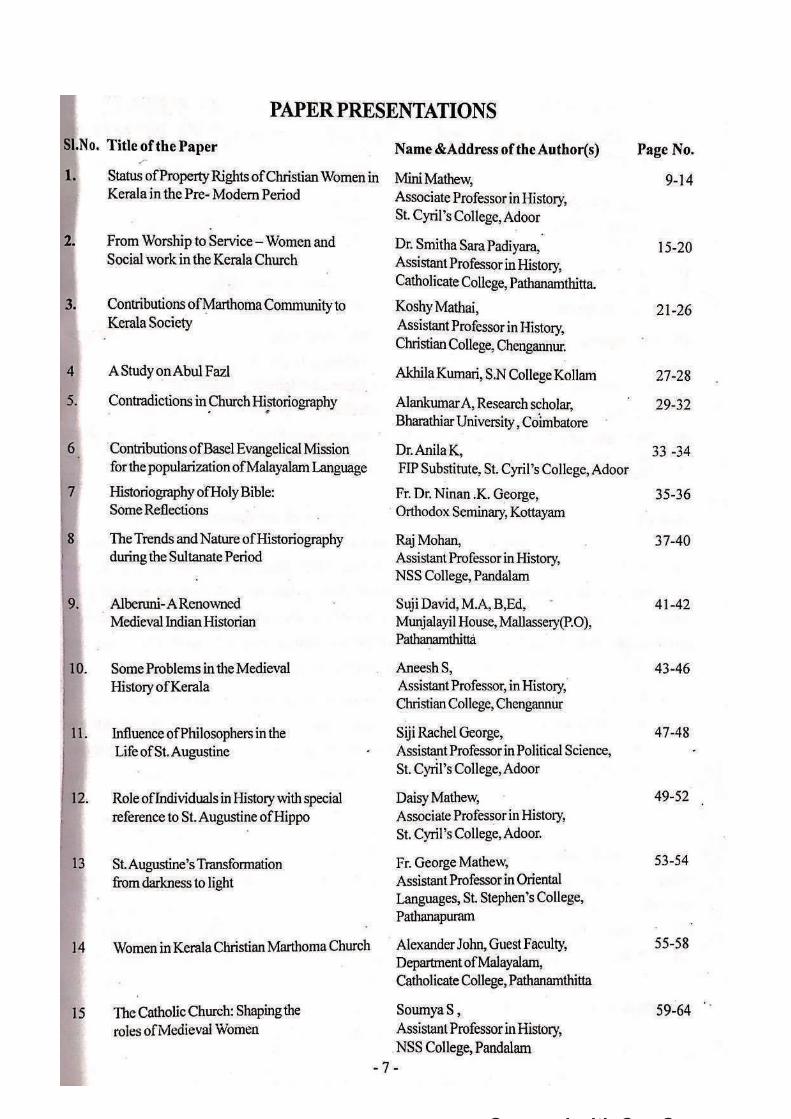
Scanned with CamScanner
Scanned with CamScanner
Scanned with CamScanner
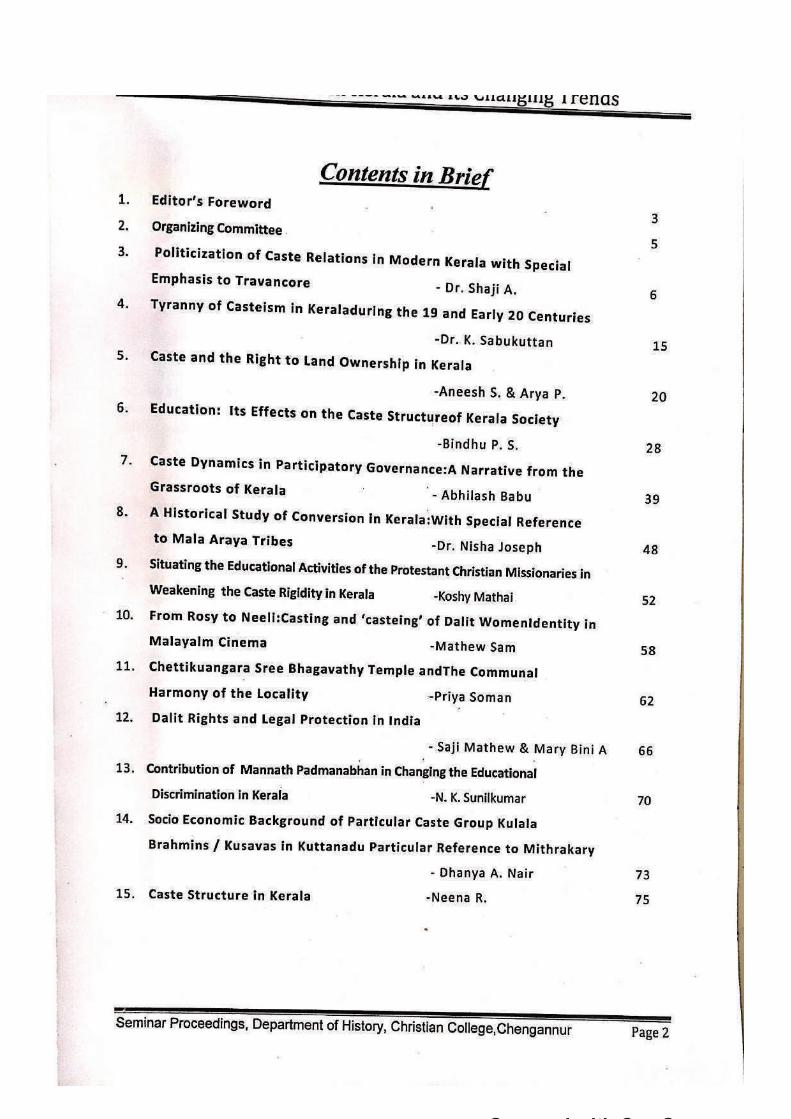
Scanned with CamScanner
Scanned with CamScanner

Designing coordination polymers; - A Green Chemistry Approach.
Sujesh Baby1,2 and M.Padmanabhan2.
1 ,Department of Chemistry, Christian College Chengannur, Kerala- 689122.
2, School of Chemical Sciences, M.G. University, Kottayam, Kerala-686560.
E mail: - [email protected] , 09446963119
Key words : coordination polymer, tartrate, green route.
Abstract :- Current interest in metal-organic frameworks (MOFs) and coordination
polymers not only stems from their potential applications in ferroelectrics, nonlinear optics,
porous materials, and catalysis but also from their intriguing varieties of molecular
architectures and topologies. The extensive research has led to numerous practical and
conceptual developments in design and synthesis of coordination polymers, such as the “node
and spacer” approach, secondary building unit (SBU), secondary building blocks (SBB), and
reticular synthesis. In this family, metal carboxylates have been extensively studied and the
carboxylate ligands are the most commonly employed linking agent, as these can provide
robust structural scaffolding for the formation of neutral, anionic or cationic frameworks.The
capacity of hydroxy carboxylic acids to act as ligands is an important property relevant in
several areas of chemistry because of the chirality and multiplicity of bonding possibilities..
Solvothermal synthesis is the most common synthetic approach for the synthesis of
coordination polymers using organic solvents such as DMF, methanol, DMSO, etc. But in the
present work, we have employed the green chemistry route and only water, the green solvent,
used as the solvent for the synthesis of coordination polymers We have successfully
synthesised and structurally characterised the coordination polymer:-[Co(phen)(C4H4O6)]n
1 through green chemistry route. The phen- moiety act as a chelating ligand and the tartrate
moiety act as a bridging ligand between two Co(II) centres and extends as an one
dimensional polymeric chain. Strong hydrogen bonding between the successive chains makes
it as a three dimensional coordination architecture. These compounds show high thermal
stability. Furthermore, the salient features of the structural aspects of these systems and also
their spectral, magnetic and thermal properties were also investigated.
Synthesis and structural characterization of [Cu(phen) (C4H4O6)].2H2On
Sujesh Baby1,2 K.Drishya1, K.Roshna 1 and M.Padmanabhan2
1,Department of Chemistry, Christian College Chengannur, Kerala- 689122.
2,School of Chemical Sciences, M.G. University, Kottayam, Kerala-686560.
Email: - [email protected] , 09446963119
Key words : coordination polymers,1,10-phen, tartrate, chiral.
Abstract :- A new Cu(II) complex, [Cu(phen)(C4H4O6)].2H2On, 1 was synthesised through soft solution
route and its structure has been determined by elemental analysis, IR, electronic and EPR spectroscopy. The
results shows that in compound 1, 1,10 phen- moiety act as a chelating ligand and the tartrate moiety act as a
bridging ligand between two Cu(II) centres and extends as an one dimensional polymeric chain. Strong hydrogen
bonding between the successive chains makes it as a three dimensional coordination polymer.Furthermore, the
salient features of the structural aspects of these system and also their spectral, magnetic and thermal properties
were also investigated.
Introduction
Coordination polymers are an important class of functional materials in which strong
coordinative chemical bonds exist in between metal centres and organic bridging ligands. The
resulting metal-organic hybrid systems can be of varying dimensionality (from zero to three)
and often will have interesting topology which will lead to diverse and unique supra-molecular
assemblies through weak non-bonding interactions involving H-bonding, van der Waals forces,
π-π stacking, dipole-dipole interactions, etc. There is enormous research activity in the design
and synthesis of these coordination polymers because of their potential applications in the field
of gas storage, magnetism, photoluminescence and catalysis.1-4 In recent years, great efforts
have been dedicated to the design and synthesis of complexes with carboxylate ligands as
bridging units and transition metals as nodes.5-8 The reason behind it is the versatile
coordination modes and strong coordination tendency of carboxylate moieties with transition-
metal ions producing multidimensional polymeric systems with interesting structural features
and functional properties. A large number of complexes with aliphatic polycarboxylic acids
have been reported and among these, (+)tartaric acid, a chiral dihydroxy dicarboxylic acid, is
particularly interesting because of the fact that the coordinated ligand has a side chain with
additional functional groups, which could be influential in the stereochemistry of the product
obtained. Chirality is a property of molecules, and thus, the use of chiral molecules as building
blocks constitutes a convenient strategy for the preparation of chiral coordination compounds.
In this work, we are reporting a one dimensional polymeric system, [Cu(phen)
(C4H4O6)].2H2On (1) in which Cu(II) adopt a distorted octahedral geometry. We have also
investigated the spectral, thermal and magnetic properties in detail.
Materials and Methods
All commercially available solvents and reagents for synthesis were of reagent grade and used
as received without further purification. Elemental analyses for C, H and N were carried out
using an Elementar Vario EL III analyzer. FTIR spectra were recorded in the range 400-
4000cm-1 on a Shimadzu FTIR 8400 S spectrophotometer using KBr pellets. Thermal analysis
was done using a Shimadzu DTG-60 instrument in the flowing nitrogen atmosphere at a heating
rate of 100C/minute and the solid state UV spectral analysis by a Shimadzu UV-160A
spectrophotometer operating in the range 200-900nm at room temperature.
Results and Discussion
Synthesis of [Cu(phen) (C4H4O6)].2H2On , 1
On reacting a copper tartrate (0.2g,10mM) suspension in hot water with a hot
methanolic suspension of 1,10-phenanthroline in equi-molar ratio a clear blue coloured solution
gets formed which on keeping for 3 days blue needle-like crystals of 1 get formed which are
washed and dried. (Yield 70%). Anal.calc.for compound 1 : C, 43.06; H, 3.58; N, 6.28%.
Found: C, 43.93; H, 3.33; N, 6.04 %.
Infrared spectra
Infrared spectra of L (+) tartaric acid and the Lewis base incorporated copper(II) tartrate
were obtained in the solid state (KBr pellet) in the range 400–4000 cm-1. In compound 1,the
as(CO2) and s(CO2) appear at 1601 and 1361cm-1 respectively with a Δ value of 240cm-1
showing the monodentate nature of the carboxylate group.9 The bands at 501 and 670 cm-1 are due
to aromatic ring deformation modes and the C=C and C=N stretching vibrations were found at
1519 and 1497cm-1 respectively which are characteristic of coordinated phen moiety.9,10
Broadband seen at 3417cm-1 indicates the presence of lattice water and the sharp bands at 428 and
605cm-1 are M-O and M-N respectively.The band seen at 3390cm-1 is due to the -OH
stretching of tartrate moiety.9
Electronic Spectra
Electronic spectra of compound 1 was recorded in the solid state and because of the d9
configuration of Cu(II) complexes it is not often possible to predict their structure based only on
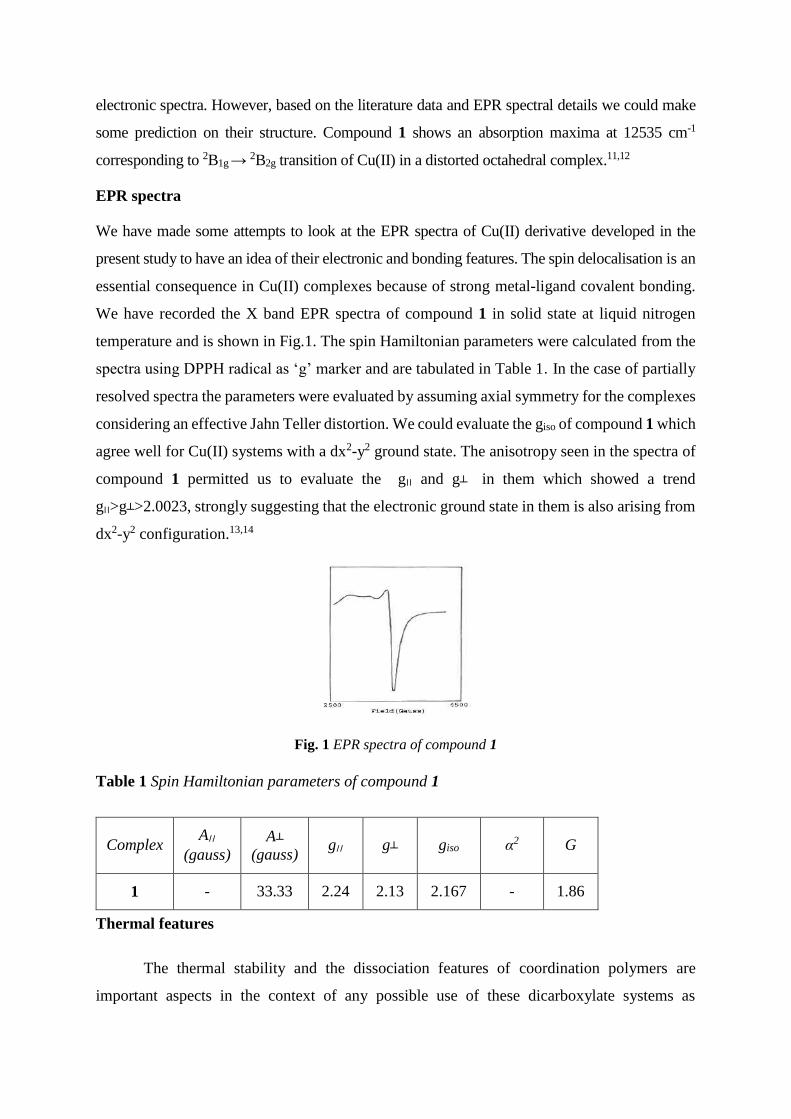
electronic spectra. However, based on the literature data and EPR spectral details we could make
some prediction on their structure. Compound 1 shows an absorption maxima at 12535 cm-1
corresponding to 2B1g → 2B2g transition of Cu(II) in a distorted octahedral complex.11,12
EPR spectra
We have made some attempts to look at the EPR spectra of Cu(II) derivative developed in the
present study to have an idea of their electronic and bonding features. The spin delocalisation is an
essential consequence in Cu(II) complexes because of strong metal-ligand covalent bonding.
We have recorded the X band EPR spectra of compound 1 in solid state at liquid nitrogen
temperature and is shown in Fig.1. The spin Hamiltonian parameters were calculated from the
spectra using DPPH radical as ‘g’ marker and are tabulated in Table 1. In the case of partially
resolved spectra the parameters were evaluated by assuming axial symmetry for the complexes
considering an effective Jahn Teller distortion. We could evaluate the giso of compound 1 which
agree well for Cu(II) systems with a dx2-y2 ground state. The anisotropy seen in the spectra of
compound 1 permitted us to evaluate the g׀׀ and g in them which showed a trend
g׀׀>g>2.0023, strongly suggesting that the electronic ground state in them is also arising from
dx2-y2 configuration.13,14
Fig. 1 EPR spectra of compound 1
Table 1 Spin Hamiltonian parameters of compound 1
Thermal features
The thermal stability and the dissociation features of coordination polymers are
important aspects in the context of any possible use of these dicarboxylate systems as
Complex A׀׀
(gauss)
A
(gauss) g׀׀ g giso α2 G
1 - 33.33 2.24 2.13 2.167 - 1.86
framework or sorption materials. With this in view we have made an attempt to look into the
thermal characteristics of these compounds in some detail. The thermal decomposition was
studied in N2 atmosphere with a heating rate of 10oC/min. First stage decomposition of
compound 1 starts at 70oC and progresses till 90oC. The loss in mass during this stage is 8.92%
which is in close agreement with the theoretical value of 8.07% for the loss of two moles of lattice
water. The anhydrous product is seen to be stable up to 280oC which then decomposes to give mass
loss up to 310oC with a weight loss of 50.12%. This is in close agreement with the mass loss
expected (50.28%) for one mole of 1,10 phenanthroline moiety and a CO2 unit. In the third stage,
the dissociation of the remaining organic moiety and yields CuO as the final residue. We attribute
this to the decomposition leading to the final residue of CuO as expected value for this mass
loss is 17.84% and the observed value is 17.55%.
The kinetic parameters for different stages of the decompositions are evaluated from the slope
and intercept of the linear plots. Using Coats-Redfern method,15,16 we have evaluated the
activation energy (Ea), Frequency factor (A) and the entropy change (ΔS) for various thermal
steps involved and the values are represented in Table 2.
Table 2 Activation energy (Ea), Frequency factor (A) and the entropy change (ΔS) values
Comp
lex
Stage I Stage II Stage III
Ea
KJ/mole
A
(sec-1)
ΔS
J/K/mole
Ea
KJ/mole
A
(sec-1)
ΔS
J/K/
mole
Ea
KJ/mole A (sec-1)
ΔS
J/K/mole
1 77.66 134.72 -206.69 200.16 758 -
117.7 234.77 1977589 -130.887
For studying the mechanism of the reactions corresponding to three possible types of rate
determining steps during thermal decomposition viz., nucleation and growth, diffusion and
phase boundary reactions. The kinetic equations which govern the reaction mechanisms are
based on the assumption that the form of g(α) depends on the reaction mechanism. Out of the
nine forms g(α) proposed by Satava, the form of g(α) which gives the best representation of
the experimental data is considered as the mechanism of the reaction. From the studies it is
evident that the form of g(α) with the highest value of correlation coefficient is –ln(1- α),
corresponding to random nucleation, one nucleus on each particle; obeying Mampel equation.
Magnetic properties at room temperature
Magnetic susceptibility measurements of the prepared Cu(II) complex was carried out to
determine the spin state and structure of the complexes. The µeff value of compound 1 is found
to be 1.79 BM. The measured values are very close to the reported values of 1.7-2.2 BM for
one unpaired electron.17
Structure characteristics
From the elemental, spectral and magnetic moment measurements shows that in compound
1 ,Cu(II) is octahedrally coordinated. The octahedral coordination is satisfied in the following
way .Two sites are occupied by chelating 1,10 phenanthroline moiety through N- atoms , two
coordination sites are occupied by –OH group (alcoholic OH) and deprotonated carboxylate
group (monodentate η1 coordination mode) of one tartrate moiety. The rest of the two
coordination sites are occupied by the –OH and deprotonated carboxylate group (monodentate
mode) of the second tartrate moiety. Each tartrate moiety acts as a bridging ligand between two
metal atoms and extends as a one dimensional polymeric chain. There exists strong hydrogen
bonding between the one dimensional polymeric chains and brings an overall three dimensional
polymeric structure to compound 1. Lattice water molecules present in the complex are also
involved in strong hydrogen bonding.
Summary & Conclusion
In recent years there is an intense research activity in the preparation of chiral
coordination polymers using chiral ligands. We have successfully synthesized and structurally
characterized a one dimensional coordination polymer, [Cu(phen)(C4H4O6)].2H2On 1,
using the green solvent water through green chemistry route instead of the solvothermal
method. Tartrate act as a bridging ligand between the Cu(II) centers and the chelating 1,10
phenanthroline moiety satisfies the rest of the coordination sites forms an one dimensional
coordination polymer. Strong hydrogen bonding interactions between the chains makes them
a three dimensional coordination architecture. The complex could be of great interest in terms
of the characteristics of inorganic-organic compounds as well as their rational synthesis. The
spectral, magnetic and thermal features were also studied.
References
1, 1, L. B. Sun, J. R. Li, J. Park and H. C. Zhou, J. Am. Chem.Soc., 2012, 134, 126
2, L. Zhang and W. Schmitt, J. Am.Chem. Soc., 2011, 133, 11240
3, R. Luo, H. Xu, H.X. Gu, X. Wang, Y. Xu, X. Shen, W.W. Bao, D.R. Zhu,
Cryst.Eng.Comm. 2014, 16, 784.
4, Yaghi, O. M.; O’Keeffe,M.; Ockwing, N. W.; Chae, H. K.; Eddaoudi, M.; Kim, J. Nature
2003,423, 705.
5, R. Bystricky, P.Antal, J. Tatiersky, P. Schwendt, R. Gyepes, Z. Zak, Inorg. Chem. 2014, 53,
5037.
6, M. Kose, V. McKee, Polyhedron 2014, 75, 30.
7, J. R. Long and O.M. Yaghi, Chem. Soc. Rev., 2009, 38, 1213.
8, S. Kitagawa, R. Kitaura and S. Noro, Angew. Chem., Int. Ed., 2004, 43, 2334.
9, K. Nakamoto, Infrared and Raman Spectra of Inorganic and Coordination Compounds, 4th
ed., John Wiley Interscience, New York, 1986.
10, Silverstein, Bassler and Morril, Spectroscopic identification of organic compounds 5th EDn.
1964, John Wiley and sons.
11, B.P. Lever, Inorganic electronic spectroscopy, 2nd ed., Elsevier, New York,1984.
12, D. N. Sathyanarayana, Electronic Absorption Spectroscopy and Related Techniques, I ed.
Universities Press (India) Limited, 2001.
13, B.J. Hathaway, D.E. Billing, Coord. Chem. Rev. 1970, 5, 143.
14, J.C. Einstein, J. Chem. Phys. 1958, 28, 323.
15, W.W Wendlandt “Thermal analysis” 3rd edition John Wiley and sons, Newyork 1984.
16, A.W.Coats and J.P Redfern, nature, 1964, 201, 68.
17, R.S. Drago, “Physical Methods in Inorganic Chemistry” Affiliated East-West Press 1971.

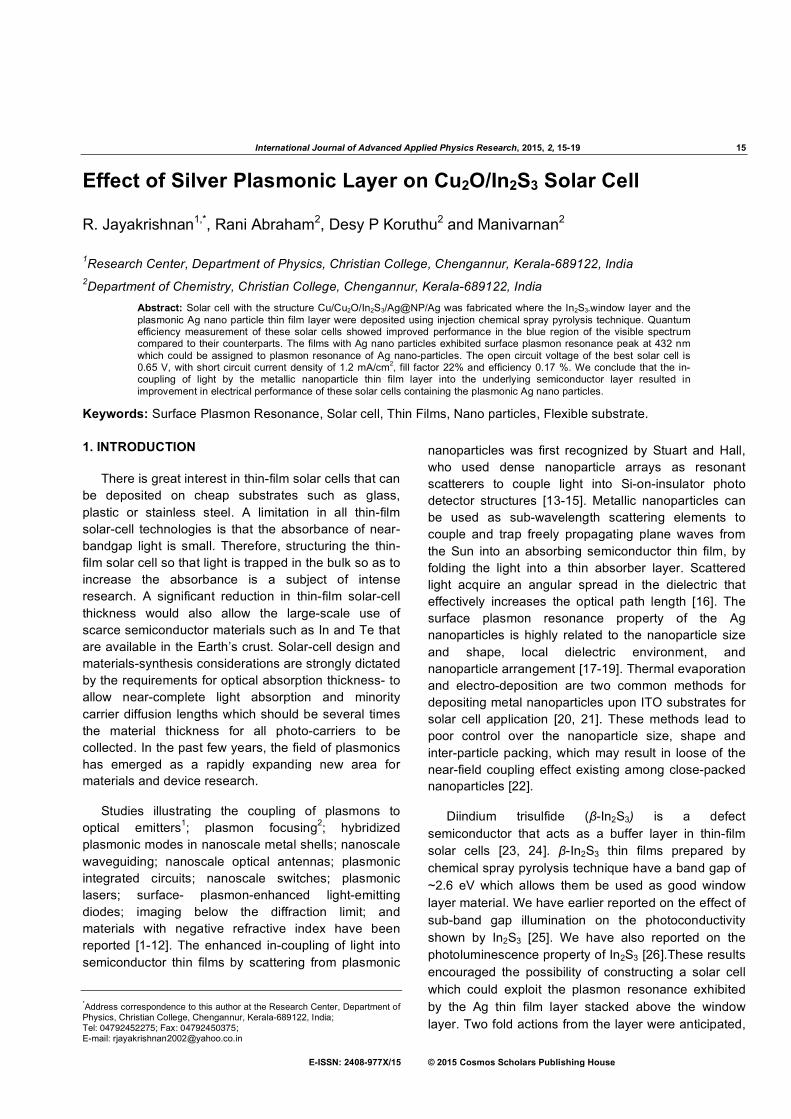
International Journal of Advanced Applied Physics Research, 2015, 2, 15-19 15
E-ISSN: 2408-977X/15 © 2015 Cosmos Scholars Publishing House
Effect of Silver Plasmonic Layer on Cu2O/In2S3 Solar Cell
R. Jayakrishnan1,*, Rani Abraham2, Desy P Koruthu2 and Manivarnan2
1Research Center, Department of Physics, Christian College, Chengannur, Kerala-689122, India 2Department of Chemistry, Christian College, Chengannur, Kerala-689122, India
Abstract: Solar cell with the structure Cu/Cu2O/In2S3/Ag@NP/Ag was fabricated where the In2S3-window layer and the plasmonic Ag nano particle thin film layer were deposited using injection chemical spray pyrolysis technique. Quantum efficiency measurement of these solar cells showed improved performance in the blue region of the visible spectrum compared to their counterparts. The films with Ag nano particles exhibited surface plasmon resonance peak at 432 nm which could be assigned to plasmon resonance of Ag nano-particles. The open circuit voltage of the best solar cell is 0.65 V, with short circuit current density of 1.2 mA/cm2, fill factor 22% and efficiency 0.17 %. We conclude that the in-coupling of light by the metallic nanoparticle thin film layer into the underlying semiconductor layer resulted in improvement in electrical performance of these solar cells containing the plasmonic Ag nano particles.
Keywords: Surface Plasmon Resonance, Solar cell, Thin Films, Nano particles, Flexible substrate.
1. INTRODUCTION
There is great interest in thin-film solar cells that can be deposited on cheap substrates such as glass, plastic or stainless steel. A limitation in all thin-film solar-cell technologies is that the absorbance of near-bandgap light is small. Therefore, structuring the thin-film solar cell so that light is trapped in the bulk so as to increase the absorbance is a subject of intense research. A significant reduction in thin-film solar-cell thickness would also allow the large-scale use of scarce semiconductor materials such as In and Te that are available in the Earth’s crust. Solar-cell design and materials-synthesis considerations are strongly dictated by the requirements for optical absorption thickness- to allow near-complete light absorption and minority carrier diffusion lengths which should be several times the material thickness for all photo-carriers to be collected. In the past few years, the field of plasmonics has emerged as a rapidly expanding new area for materials and device research.
Studies illustrating the coupling of plasmons to optical emitters1; plasmon focusing2; hybridized plasmonic modes in nanoscale metal shells; nanoscale waveguiding; nanoscale optical antennas; plasmonic integrated circuits; nanoscale switches; plasmonic lasers; surface- plasmon-enhanced light-emitting diodes; imaging below the diffraction limit; and materials with negative refractive index have been reported [1-12]. The enhanced in-coupling of light into semiconductor thin films by scattering from plasmonic
*Address correspondence to this author at the Research Center, Department of Physics, Christian College, Chengannur, Kerala-689122, India; Tel: 04792452275; Fax: 04792450375; E-mail: [email protected]
nanoparticles was first recognized by Stuart and Hall, who used dense nanoparticle arrays as resonant scatterers to couple light into Si-on-insulator photo detector structures [13-15]. Metallic nanoparticles can be used as sub-wavelength scattering elements to couple and trap freely propagating plane waves from the Sun into an absorbing semiconductor thin film, by folding the light into a thin absorber layer. Scattered light acquire an angular spread in the dielectric that effectively increases the optical path length [16]. The surface plasmon resonance property of the Ag nanoparticles is highly related to the nanoparticle size and shape, local dielectric environment, and nanoparticle arrangement [17-19]. Thermal evaporation and electro-deposition are two common methods for depositing metal nanoparticles upon ITO substrates for solar cell application [20, 21]. These methods lead to poor control over the nanoparticle size, shape and inter-particle packing, which may result in loose of the near-field coupling effect existing among close-packed nanoparticles [22].
Diindium trisulfide (β-In2S3) is a defect semiconductor that acts as a buffer layer in thin-film solar cells [23, 24]. β-In2S3 thin films prepared by chemical spray pyrolysis technique have a band gap of ~2.6 eV which allows them be used as good window layer material. We have earlier reported on the effect of sub-band gap illumination on the photoconductivity shown by In2S3 [25]. We have also reported on the photoluminescence property of In2S3 [26].These results encouraged the possibility of constructing a solar cell which could exploit the plasmon resonance exhibited by the Ag thin film layer stacked above the window layer. Two fold actions from the layer were anticipated,
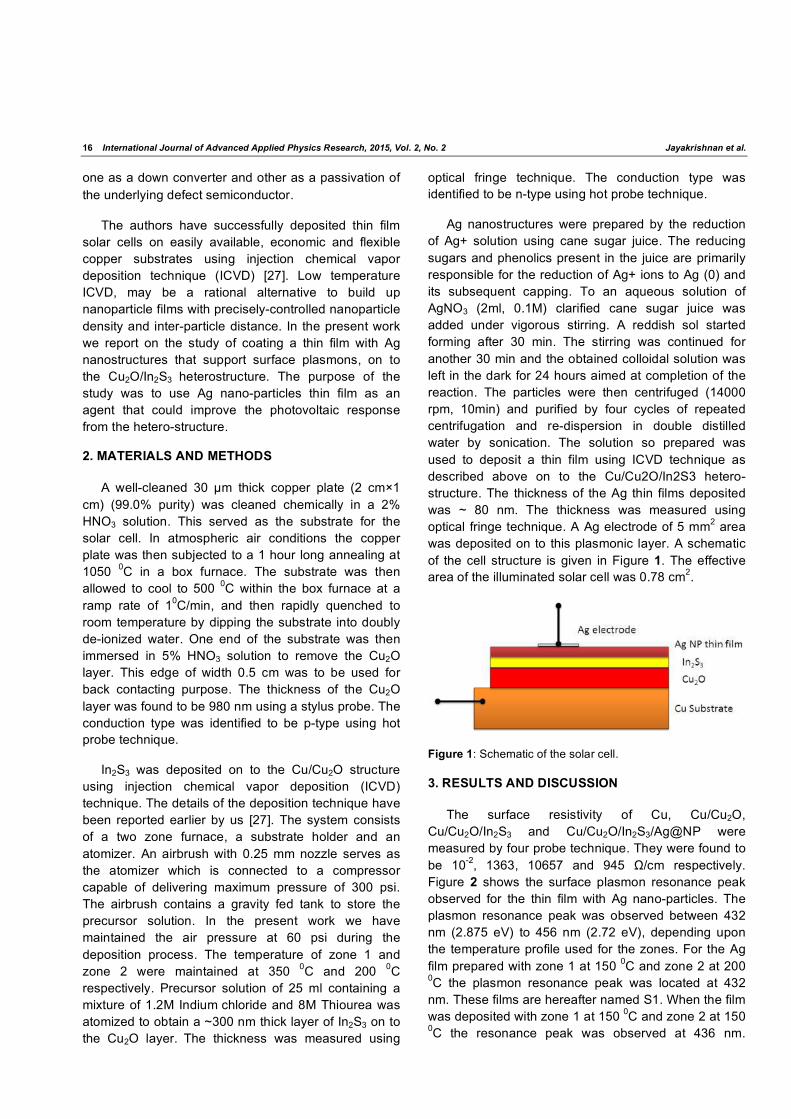
16 International Journal of Advanced Applied Physics Research, 2015, Vol. 2, No. 2 Jayakrishnan et al.
one as a down converter and other as a passivation of the underlying defect semiconductor.
The authors have successfully deposited thin film solar cells on easily available, economic and flexible copper substrates using injection chemical vapor deposition technique (ICVD) [27]. Low temperature ICVD, may be a rational alternative to build up nanoparticle films with precisely-controlled nanoparticle density and inter-particle distance. In the present work we report on the study of coating a thin film with Ag nanostructures that support surface plasmons, on to the Cu2O/In2S3 heterostructure. The purpose of the study was to use Ag nano-particles thin film as an agent that could improve the photovoltaic response from the hetero-structure.
2. MATERIALS AND METHODS
A well-cleaned 30 µm thick copper plate (2 cm×1 cm) (99.0% purity) was cleaned chemically in a 2% HNO3 solution. This served as the substrate for the solar cell. In atmospheric air conditions the copper plate was then subjected to a 1 hour long annealing at 1050 0C in a box furnace. The substrate was then allowed to cool to 500 0C within the box furnace at a ramp rate of 10C/min, and then rapidly quenched to room temperature by dipping the substrate into doubly de-ionized water. One end of the substrate was then immersed in 5% HNO3 solution to remove the Cu2O layer. This edge of width 0.5 cm was to be used for back contacting purpose. The thickness of the Cu2O layer was found to be 980 nm using a stylus probe. The conduction type was identified to be p-type using hot probe technique.
In2S3 was deposited on to the Cu/Cu2O structure using injection chemical vapor deposition (ICVD) technique. The details of the deposition technique have been reported earlier by us [27]. The system consists of a two zone furnace, a substrate holder and an atomizer. An airbrush with 0.25 mm nozzle serves as the atomizer which is connected to a compressor capable of delivering maximum pressure of 300 psi. The airbrush contains a gravity fed tank to store the precursor solution. In the present work we have maintained the air pressure at 60 psi during the deposition process. The temperature of zone 1 and zone 2 were maintained at 350 0C and 200 0C respectively. Precursor solution of 25 ml containing a mixture of 1.2M Indium chloride and 8M Thiourea was atomized to obtain a ~300 nm thick layer of In2S3 on to the Cu2O layer. The thickness was measured using
optical fringe technique. The conduction type was identified to be n-type using hot probe technique.
Ag nanostructures were prepared by the reduction of Ag+ solution using cane sugar juice. The reducing sugars and phenolics present in the juice are primarily responsible for the reduction of Ag+ ions to Ag (0) and its subsequent capping. To an aqueous solution of AgNO3 (2ml, 0.1M) clarified cane sugar juice was added under vigorous stirring. A reddish sol started forming after 30 min. The stirring was continued for another 30 min and the obtained colloidal solution was left in the dark for 24 hours aimed at completion of the reaction. The particles were then centrifuged (14000 rpm, 10min) and purified by four cycles of repeated centrifugation and re-dispersion in double distilled water by sonication. The solution so prepared was used to deposit a thin film using ICVD technique as described above on to the Cu/Cu2O/In2S3 hetero-structure. The thickness of the Ag thin films deposited was ~ 80 nm. The thickness was measured using optical fringe technique. A Ag electrode of 5 mm2 area was deposited on to this plasmonic layer. A schematic of the cell structure is given in Figure 1. The effective area of the illuminated solar cell was 0.78 cm2.
Figure 1: Schematic of the solar cell.
3. RESULTS AND DISCUSSION
The surface resistivity of Cu, Cu/Cu2O, Cu/Cu2O/In2S3 and Cu/Cu2O/In2S3/Ag@NP were measured by four probe technique. They were found to be 10-2, 1363, 10657 and 945 Ω/cm respectively. Figure 2 shows the surface plasmon resonance peak observed for the thin film with Ag nano-particles. The plasmon resonance peak was observed between 432 nm (2.875 eV) to 456 nm (2.72 eV), depending upon the temperature profile used for the zones. For the Ag film prepared with zone 1 at 150 0C and zone 2 at 200 0C the plasmon resonance peak was located at 432 nm. These films are hereafter named S1. When the film was deposited with zone 1 at 150 0C and zone 2 at 150 0C the resonance peak was observed at 436 nm.
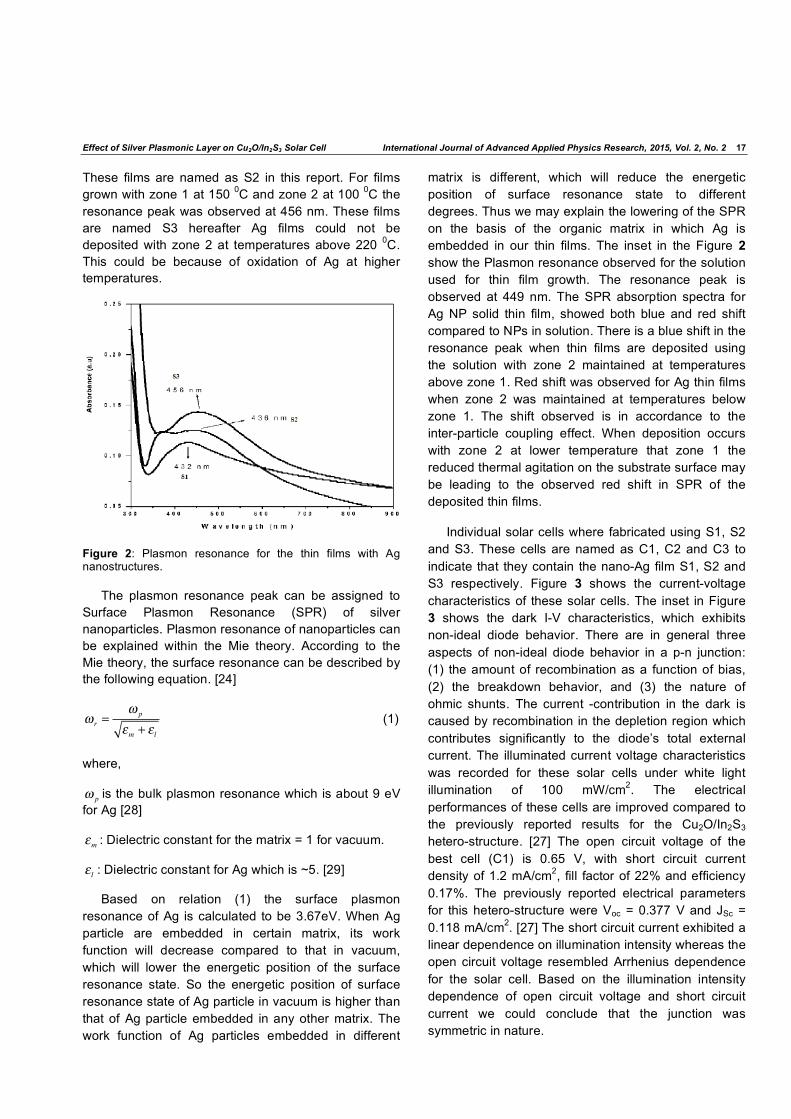
Effect of Silver Plasmonic Layer on Cu2O/In2S3 Solar Cell International Journal of Advanced Applied Physics Research, 2015, Vol. 2, No. 2 17
These films are named as S2 in this report. For films grown with zone 1 at 150 0C and zone 2 at 100 0C the resonance peak was observed at 456 nm. These films are named S3 hereafter Ag films could not be deposited with zone 2 at temperatures above 220 0C. This could be because of oxidation of Ag at higher temperatures.
Figure 2: Plasmon resonance for the thin films with Ag nanostructures.
The plasmon resonance peak can be assigned to Surface Plasmon Resonance (SPR) of silver nanoparticles. Plasmon resonance of nanoparticles can be explained within the Mie theory. According to the Mie theory, the surface resonance can be described by the following equation. [24]
! r =! p
"m + " l (1)
where,
! p is the bulk plasmon resonance which is about 9 eV for Ag [28]
!m : Dielectric constant for the matrix = 1 for vacuum.
! l : Dielectric constant for Ag which is ~5. [29]
Based on relation (1) the surface plasmon resonance of Ag is calculated to be 3.67eV. When Ag particle are embedded in certain matrix, its work function will decrease compared to that in vacuum, which will lower the energetic position of the surface resonance state. So the energetic position of surface resonance state of Ag particle in vacuum is higher than that of Ag particle embedded in any other matrix. The work function of Ag particles embedded in different
matrix is different, which will reduce the energetic position of surface resonance state to different degrees. Thus we may explain the lowering of the SPR on the basis of the organic matrix in which Ag is embedded in our thin films. The inset in the Figure 2 show the Plasmon resonance observed for the solution used for thin film growth. The resonance peak is observed at 449 nm. The SPR absorption spectra for Ag NP solid thin film, showed both blue and red shift compared to NPs in solution. There is a blue shift in the resonance peak when thin films are deposited using the solution with zone 2 maintained at temperatures above zone 1. Red shift was observed for Ag thin films when zone 2 was maintained at temperatures below zone 1. The shift observed is in accordance to the inter-particle coupling effect. When deposition occurs with zone 2 at lower temperature that zone 1 the reduced thermal agitation on the substrate surface may be leading to the observed red shift in SPR of the deposited thin films.
Individual solar cells where fabricated using S1, S2 and S3. These cells are named as C1, C2 and C3 to indicate that they contain the nano-Ag film S1, S2 and S3 respectively. Figure 3 shows the current-voltage characteristics of these solar cells. The inset in Figure 3 shows the dark I-V characteristics, which exhibits non-ideal diode behavior. There are in general three aspects of non-ideal diode behavior in a p-n junction: (1) the amount of recombination as a function of bias, (2) the breakdown behavior, and (3) the nature of ohmic shunts. The current -contribution in the dark is caused by recombination in the depletion region which contributes significantly to the diode’s total external current. The illuminated current voltage characteristics was recorded for these solar cells under white light illumination of 100 mW/cm2. The electrical performances of these cells are improved compared to the previously reported results for the Cu2O/In2S3 hetero-structure. [27] The open circuit voltage of the best cell (C1) is 0.65 V, with short circuit current density of 1.2 mA/cm2, fill factor of 22% and efficiency 0.17%. The previously reported electrical parameters for this hetero-structure were Voc = 0.377 V and JSc = 0.118 mA/cm2. [27] The short circuit current exhibited a linear dependence on illumination intensity whereas the open circuit voltage resembled Arrhenius dependence for the solar cell. Based on the illumination intensity dependence of open circuit voltage and short circuit current we could conclude that the junction was symmetric in nature.
18 International Journal of Advanced Applied Physics Research, 2015, Vol. 2, No. 2 Jayakrishnan et al.
Figure 3: Illuminated current voltage characteristic of the three solar cells.
Figure 4 shows the results of the relative quantum efficiency (QE) measurement carried out for the solar cells. The relative efficiency is low for the long wavelength region and improves for the shorter wavelength region. From the figure it is observed that the maximum quantum efficiency for cell C1 is measured for ~2.74 eV. For cells C2 and C3 the peak QE is shifted towards the red region compared to the cell C1. In general there is a significant shift to the blue wavelength region for the cells as compared to the quantum efficiency measurements reported for the Cu2O/In2S3 solar cell without the plasmonic layer [27]. The shift can be explained in terms of the strong local field enhancement around the Ag nanoparticles. In our solar cell the strong local field enhancement around the Ag nanoparticles embedded in the organic matrix may
be increasing the absorption in the semiconductor material. This is supported by the observed increase in short circuit current density for the cell. This is also supported by the observation that cell C1 has larger short circuit current compared to the other cells.
4. CONCLUSIONS
We have been able to grow thin films with Ag nanoparticles confined in an organic matrix using injection chemical vapor deposition technique. The plasmon resonance in the film was blue shifted compared to the plasmon resonance in the precursor solution for the Ag nanoparticles. These thin films when coated over the Cu2O/In2S3 solar cell resulted in enhanced electrical performance. The current density in these solar cells having the plasmonic layer increased as compared to their counterparts where the plasmonic layer was absent. We conclude that plasmonic near-field in the Ag nanoparticles thin film was coupled to the hetero-junction, which increased the effective absorption cross-section for the blue region of the spectrum in the buffer layer and in the solar cell. This was supported by the observed shift to blue region and increase in quantum efficiency for the solar cell compared to their counterparts. Thus we have been able to demonstrate improvement in photovoltaic effect in the Cu2O/In2S3 solar cell using silver nanoparticles.
ACKNOWLEDGEMENT
RJ would like to thank UGC for supporting this work vide UGC-MRP scheme F. No.41-966/2012 (SR). The authors would also like to thank SERB for the grants sanctioned vide SR/FTP/PS-013/2013.
REFERENCE
[1] Kühn S, Hakanson U, Rogobete L, Sandoghdar V. 2006, Phys. Rev. Lett. 97, 017402. http://dx.doi.org/10.1103/PhysRevLett.97.017402
[2] Verhagen E, Spasenović M, Polman A, Kuipers L. 2008, Phys. Rev. Lett. 102, 203904. http://dx.doi.org/10.1103/PhysRevLett.102.203904
[3] Prodan E, Radloff C, Halas NJ, Nordlander P. 2003, Science, 302, 419. http://dx.doi.org/10.1126/science.1089171
[4] Zia R, Selker MD, Catrysse PB, Brongersma ML. 2004, J. Opt. Soc. Am. A 21, 2442. http://dx.doi.org/10.1364/JOSAA.21.002442
[5] Mühlschlegel P, Eisler HJ, Martin OJF, Hecht B, Pohl DW. 2005, Science 308, 1607. http://dx.doi.org/10.1126/science.1111886
[6] Bozhevolnyi SI, Volkov VS, Devaux E, Laluet JY, Ebbesen. 2006, T.W. Nature, 440, 508. http://dx.doi.org/10.1038/nature04594
Figure 4: Quantum efficiency measured for the three solar cells.
Effect of Silver Plasmonic Layer on Cu2O/In2S3 Solar Cell International Journal of Advanced Applied Physics Research, 2015, Vol. 2, No. 2 19
[7] Krasavin AV, Zheludev NI. 2004, Appl. Phys. Lett. 84, 1416. http://dx.doi.org/10.1063/1.1650904
[8] Oulton RF. 2009, Nature 461, 629. http://dx.doi.org/10.1038/nature08364
[9] Okamoto K. 2004, Nature Mater. 3, 601. http://dx.doi.org/10.1038/nmat1198
[10] Pendry JB. 2000, Phys. Rev. Lett. 85, 3966. http://dx.doi.org/10.1103/PhysRevLett.85.3966
[11] Shelby RA., Smith DR, Schultz S. 2001, Science 292, 77. http://dx.doi.org/10.1126/science.1058847
[12] Linden S. 2004, Science 306, 1351. http://dx.doi.org/10.1126/science.1105371
[13] Stuart HR, Hall DG. 1996, Appl Phys Lett 69, 2327. http://dx.doi.org/10.1063/1.117513
[14] Stuart HR, Hall DG. 1998, Appl Phys Lett 73, 3815. http://dx.doi.org/10.1063/1.122903
[15] Harry A. Atwater, Albert Polman. 2010, Nature Materials, 9,205. http://dx.doi.org/10.1038/nmat2629
[16] Kelly KL, Coronado E, Zhao LL, Schatz GC. 2002, Journal of Physical Chemistry B 107,668. http://dx.doi.org/10.1021/jp026731y
[17] Cheng YN, Wang M, Borghs G, Chen HZ. 2011, Langmuir 27,7884. http://dx.doi.org/10.1021/la200840m
[18] Yang Y, Matsubara S, Nogami M, Shi JL. 2007, Materials Science and Engineering B 140, 172. http://dx.doi.org/10.1016/j.mseb.2007.03.021
[19] Morfa AJ, Rowlen KL, Reilly TH, Romero MJ, Lagemaat JVD. 2008, Applied Physics Letters 92, 013504. http://dx.doi.org/10.1063/1.2823578
[20] Kim SS, Na SI, Jo J, Kim DY, Nah YC. 2008, Applied Physics Letters 92, 073307. http://dx.doi.org/10.1063/1.2967471
[21] Yoon WJ, Jung KY, Liu J, Duraisamy T, Revur R, Teixeira, S. Sengupta, P.R. Berger, 2010, Solar Energy Materials FL, Solar Cells 94,128. http://dx.doi.org/10.1016/j.solmat.2009.08.006
[22] Rocca M. 1995, Surf. Sci. Rep., 22, 1. http://dx.doi.org/10.1016/0167-5729(95)00004-6
[23] Teny Theresa John, Sudha Kartha C, Vijayakumar KP, Abe T, Kashiwaba Y. 2005, Sol. Energy Mater. Sol. Cells 89, 27 http://dx.doi.org/10.1016/j.solmat.2004.12.005
[24] Jayakrishnan R, Teny Theresa John Sudha Kartha C, Vijayakumar KP, Deepthi Jain, Sarath Chandran, Ganeshan V. 2008, J Appl Phys 103, 053106 http://dx.doi.org/10.1063/1.2841488
[25] Jayakrishnan R, Tina Sebastian, Teny Theresa John, C.Sudha Kartha Vijayakumar KP. 2007, J Appl Phys 102, 043109 http://dx.doi.org/10.1063/1.2770830
[26] Jayakrishnan R, Teny Theresa John, Sudha Kartha CVijayakumar KP, Abe T, Kashiwaba Y. 2005, Semi. Cond. Sci. and Tech. 20, 1162 http://dx.doi.org/10.1088/0268-1242/20/12/003
[27] Jayakrishnan R. 2013, Materials Science in Semiconductor Processing, 16 (6), 1608. http://dx.doi.org/10.1016/j.mssp.2013.04.018
[28] Ehrenreich E, Philipp H. 1962, Phys. Rev., 128, 1622. http://dx.doi.org/10.1103/PhysRev.128.1622
[29] Chen CF, Tzeng SD, Chen HY, Lin KJ, Gwo S. 2008, Journal of the American Chemical Society 130, 824. http://dx.doi.org/10.1021/ja0773610
Received on 14-10-2015 Accepted on 12-11-2015 Published on 01-12-2015 http://dx.doi.org/10.15379/2408-977X.2015.02.02.3
© 2015 Jayakrishnan et al.; Licensee Cosmos Scholars Publishing House. This is an open access article licensed under the terms of the Creative Commons Attribution Non-Commercial License (http://creativecommons.org/licenses/by-nc/3.0/), which permits unrestricted, non-commercial use, distribution and reproduction in any medium, provided the work is properly cited.
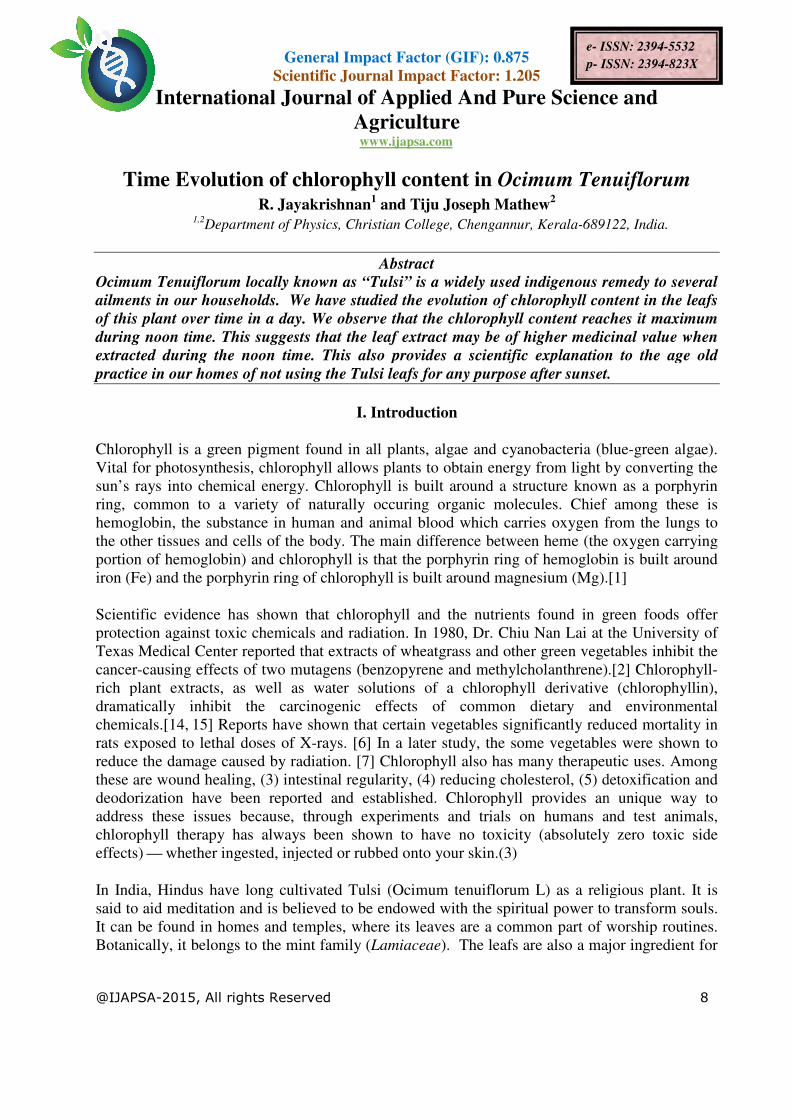
General Impact Factor (GIF): 0.875
Scientific Journal Impact Factor: 1.205
International Journal of Applied And Pure Science and
@IJAPSA-2015, All rights Reserved
Time Evolution of chlorophyll content in R. Jayakrishnan
1,2Department of Physics, Christian College, Chengannur, Kerala
Ocimum Tenuiflorum locally known as
ailments in our households. We have studied the evolution of chlorophyll content in the leafs
of this plant over time in a day. We observe that the chlorophyll conte
during noon time. This suggests that the leaf
extracted during the noon time. This also provides a scientific explanation to the age old
practice in our homes of not using the T
Chlorophyll is a green pigment found in all plants, algae and cyanobacteria (blue
Vital for photosynthesis, chlorophyll allows plants to obtain energy from light by converting the
sun’s rays into chemical energy.
ring, common to a variety of naturally occuring organic molecules. Chief among these is
hemoglobin, the substance in human and animal blood which carries oxygen from the lungs t
the other tissues and cells of the body. The main difference between heme (the oxygen carrying
portion of hemoglobin) and chlorophyll is that the porphyrin ring of hemoglobin is built around
iron (Fe) and the porphyrin ring of chlorophyll is built around
Scientific evidence has shown that chlorophyll and the nutrients found in green foods offer
protection against toxic chemicals and radiation. In 1980, Dr. Chiu Nan Lai at the University of
Texas Medical Center reported that extracts of
cancer-causing effects of two mutagens (benzopyrene and methylcholanthrene).[2]
rich plant extracts, as well as water solutions of a chlorophyll derivative (chlorophyllin),
dramatically inhibit the carcinogenic effects of common dietary and
chemicals.[14, 15] Reports have shown that certain vegetables significantly reduced mortality in
rats exposed to lethal doses of X
reduce the damage caused by radiation. [7]
these are wound healing, (3) intestinal regularity, (4) reducing cholesterol, (5) detoxification and
deodorization have been reported and established. Chlorophyll pr
address these issues because, through experiments and trials on humans and test animals,
chlorophyll therapy has always been shown to have no toxicity (absolutely zero toxic side
effects) — whether ingested, injected or rubbed onto
In India, Hindus have long cultivated Tulsi (Ocimum tenuiflorum L) as a religious plant. It is
said to aid meditation and is believed to be endowed with the spiritual power to transform souls.
It can be found in homes and temples, where its
Botanically, it belongs to the mint family (
General Impact Factor (GIF): 0.875
Scientific Journal Impact Factor: 1.205
International Journal of Applied And Pure Science and
Agriculture
www.ijapsa.com
2015, All rights Reserved
e- ISSN: 2394
p- ISSN:
Time Evolution of chlorophyll content in Ocimum TenuiflorumR. Jayakrishnan
1 and Tiju Joseph Mathew
2
Department of Physics, Christian College, Chengannur, Kerala-689122, India.
Abstract
Ocimum Tenuiflorum locally known as “Tulsi” is a widely used indigenous remedy to several
We have studied the evolution of chlorophyll content in the leafs
of this plant over time in a day. We observe that the chlorophyll content reaches it maximum
during noon time. This suggests that the leaf extract may be of higher medicinal value when
extracted during the noon time. This also provides a scientific explanation to the age old
in our homes of not using the Tulsi leafs for any purpose after sunset.
I. Introduction
Chlorophyll is a green pigment found in all plants, algae and cyanobacteria (blue
Vital for photosynthesis, chlorophyll allows plants to obtain energy from light by converting the
chemical energy. Chlorophyll is built around a structure known as a porphyrin
ring, common to a variety of naturally occuring organic molecules. Chief among these is
hemoglobin, the substance in human and animal blood which carries oxygen from the lungs t
the other tissues and cells of the body. The main difference between heme (the oxygen carrying
portion of hemoglobin) and chlorophyll is that the porphyrin ring of hemoglobin is built around
iron (Fe) and the porphyrin ring of chlorophyll is built around magnesium (Mg).[1]
Scientific evidence has shown that chlorophyll and the nutrients found in green foods offer
protection against toxic chemicals and radiation. In 1980, Dr. Chiu Nan Lai at the University of
Texas Medical Center reported that extracts of wheatgrass and other green vegetables inhibit the
causing effects of two mutagens (benzopyrene and methylcholanthrene).[2]
rich plant extracts, as well as water solutions of a chlorophyll derivative (chlorophyllin),
the carcinogenic effects of common dietary and
15] Reports have shown that certain vegetables significantly reduced mortality in
rats exposed to lethal doses of X-rays. [6] In a later study, the some vegetables were shown to
duce the damage caused by radiation. [7] Chlorophyll also has many therapeutic uses. Among
these are wound healing, (3) intestinal regularity, (4) reducing cholesterol, (5) detoxification and
deodorization have been reported and established. Chlorophyll provides an unique way to
address these issues because, through experiments and trials on humans and test animals,
chlorophyll therapy has always been shown to have no toxicity (absolutely zero toxic side
whether ingested, injected or rubbed onto your skin.(3)
In India, Hindus have long cultivated Tulsi (Ocimum tenuiflorum L) as a religious plant. It is
said to aid meditation and is believed to be endowed with the spiritual power to transform souls.
It can be found in homes and temples, where its leaves are a common part of worship routines.
Botanically, it belongs to the mint family (Lamiaceae). The leafs are also a major ingredient for
International Journal of Applied And Pure Science and
8
ISSN: 2394-5532
ISSN: 2394-823X
enuiflorum
689122, India.
used indigenous remedy to several
We have studied the evolution of chlorophyll content in the leafs
nt reaches it maximum
may be of higher medicinal value when
extracted during the noon time. This also provides a scientific explanation to the age old
for any purpose after sunset.
Chlorophyll is a green pigment found in all plants, algae and cyanobacteria (blue-green algae).
Vital for photosynthesis, chlorophyll allows plants to obtain energy from light by converting the
Chlorophyll is built around a structure known as a porphyrin
ring, common to a variety of naturally occuring organic molecules. Chief among these is
hemoglobin, the substance in human and animal blood which carries oxygen from the lungs to
the other tissues and cells of the body. The main difference between heme (the oxygen carrying
portion of hemoglobin) and chlorophyll is that the porphyrin ring of hemoglobin is built around
magnesium (Mg).[1]
Scientific evidence has shown that chlorophyll and the nutrients found in green foods offer
protection against toxic chemicals and radiation. In 1980, Dr. Chiu Nan Lai at the University of
wheatgrass and other green vegetables inhibit the
causing effects of two mutagens (benzopyrene and methylcholanthrene).[2] Chlorophyll-
rich plant extracts, as well as water solutions of a chlorophyll derivative (chlorophyllin),
the carcinogenic effects of common dietary and environmental
15] Reports have shown that certain vegetables significantly reduced mortality in
rays. [6] In a later study, the some vegetables were shown to
Chlorophyll also has many therapeutic uses. Among
these are wound healing, (3) intestinal regularity, (4) reducing cholesterol, (5) detoxification and
ovides an unique way to
address these issues because, through experiments and trials on humans and test animals,
chlorophyll therapy has always been shown to have no toxicity (absolutely zero toxic side
In India, Hindus have long cultivated Tulsi (Ocimum tenuiflorum L) as a religious plant. It is
said to aid meditation and is believed to be endowed with the spiritual power to transform souls.
leaves are a common part of worship routines.
The leafs are also a major ingredient for
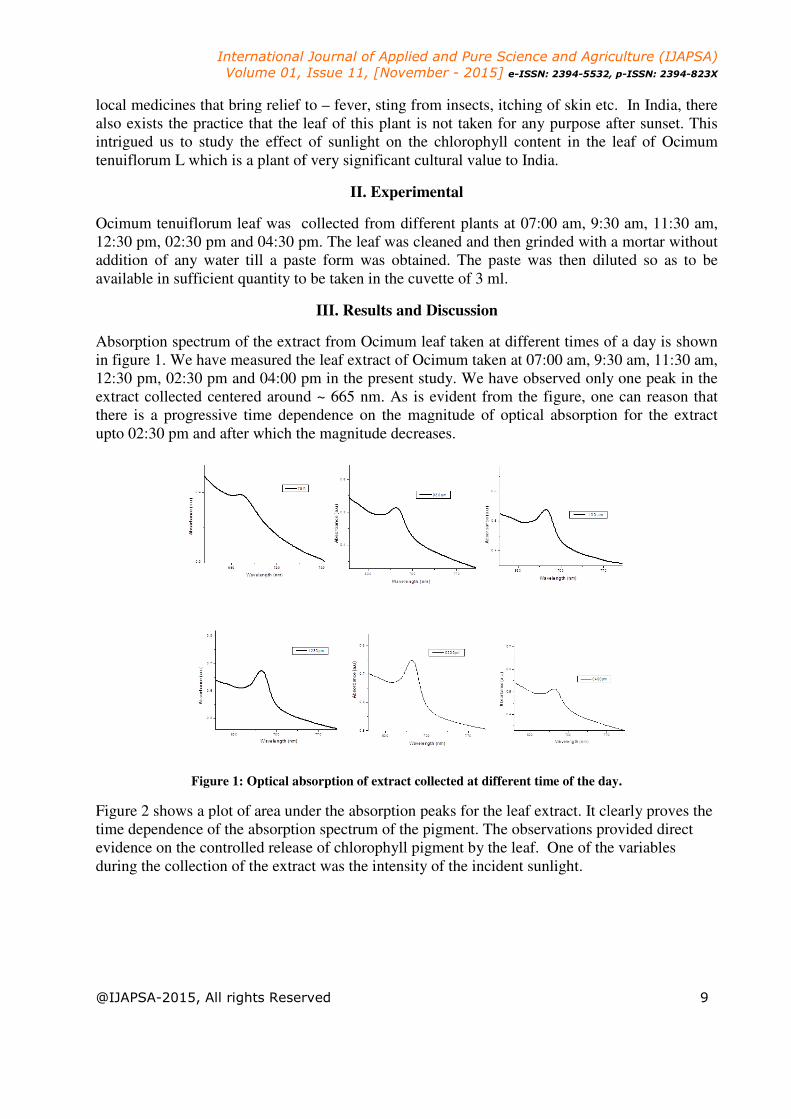
International Journal of Applied and Pure Science and Agriculture (IJAPSA)
Volume 01, Issue
@IJAPSA-2015, All rights Reserved
local medicines that bring relief to
also exists the practice that the leaf of this plant is not taken for any purpose after sunset. This
intrigued us to study the effect of sunlight on the chlorophyll content in the leaf of
tenuiflorum L which is a plant of very significant cultural value to
Ocimum tenuiflorum leaf was collected from different plants
12:30 pm, 02:30 pm and 04:30 pm
addition of any water till a paste form was
available in sufficient quantity to be taken in the cuvette
Absorption spectrum of the extract from
in figure 1. We have measured the leaf extract of Ocimum taken at 07:00 am, 9:30 am, 11:30 am,
12:30 pm, 02:30 pm and 04:00 pm in the present study.
extract collected centered around ~ 665 nm.
there is a progressive time dependence on the magnitude of optical absorption
upto 02:30 pm and after which the magnitude decreases
Figure 1: Optical absorption of extract collected at
Figure 2 shows a plot of area under the absorption peaks
time dependence of the absorption spectrum of the pigment.
evidence on the controlled release o
during the collection of the extract was the intensity of the incident sunlight.
International Journal of Applied and Pure Science and Agriculture (IJAPSA)
01, Issue 11, [November - 2015] e-ISSN: 2394-5532, p
2015, All rights Reserved
local medicines that bring relief to – fever, sting from insects, itching of skin etc.
ists the practice that the leaf of this plant is not taken for any purpose after sunset. This
intrigued us to study the effect of sunlight on the chlorophyll content in the leaf of
which is a plant of very significant cultural value to India.
II. Experimental
leaf was collected from different plants at 07:00 am, 9:30 am, 11:30 am,
12:30 pm, 02:30 pm and 04:30 pm. The leaf was cleaned and then grinded with a mortar without
addition of any water till a paste form was obtained. The paste was then diluted so as to be
available in sufficient quantity to be taken in the cuvette of 3 ml.
III. Results and Discussion
Absorption spectrum of the extract from Ocimum leaf taken at different times of a day is shown
e have measured the leaf extract of Ocimum taken at 07:00 am, 9:30 am, 11:30 am,
0 pm in the present study. We have observed only one peak in the
extract collected centered around ~ 665 nm. As is evident from the figure, one can reason that
time dependence on the magnitude of optical absorption
30 pm and after which the magnitude decreases.
Figure 1: Optical absorption of extract collected at different time of the day.
Figure 2 shows a plot of area under the absorption peaks for the leaf extract. It clearly proves the
time dependence of the absorption spectrum of the pigment. The observations provided direct
evidence on the controlled release of chlorophyll pigment by the leaf. One of the variables
during the collection of the extract was the intensity of the incident sunlight.
International Journal of Applied and Pure Science and Agriculture (IJAPSA)
5532, p-ISSN: 2394-823X
9
itching of skin etc. In India, there
ists the practice that the leaf of this plant is not taken for any purpose after sunset. This
intrigued us to study the effect of sunlight on the chlorophyll content in the leaf of Ocimum
at 07:00 am, 9:30 am, 11:30 am,
. The leaf was cleaned and then grinded with a mortar without
obtained. The paste was then diluted so as to be
Ocimum leaf taken at different times of a day is shown
e have measured the leaf extract of Ocimum taken at 07:00 am, 9:30 am, 11:30 am,
We have observed only one peak in the
As is evident from the figure, one can reason that
time dependence on the magnitude of optical absorption for the extract
different time of the day.
for the leaf extract. It clearly proves the
The observations provided direct
f chlorophyll pigment by the leaf. One of the variables
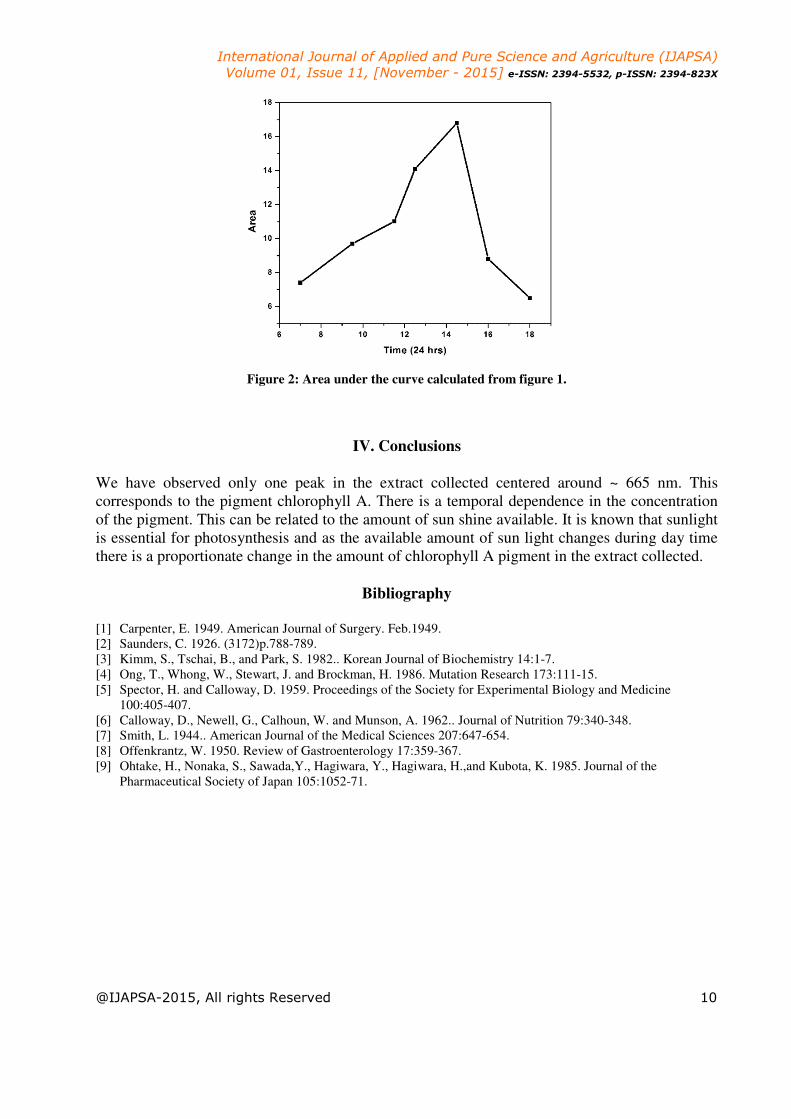
International Journal of Applied and Pure Science and Agriculture (IJAPSA)
Volume 01, Issue 11, [November - 2015] e-ISSN: 2394-5532, p-ISSN: 2394-823X
@IJAPSA-2015, All rights Reserved 10
Figure 2: Area under the curve calculated from figure 1.
IV. Conclusions
We have observed only one peak in the extract collected centered around ~ 665 nm. This
corresponds to the pigment chlorophyll A. There is a temporal dependence in the concentration
of the pigment. This can be related to the amount of sun shine available. It is known that sunlight
is essential for photosynthesis and as the available amount of sun light changes during day time
there is a proportionate change in the amount of chlorophyll A pigment in the extract collected.
Bibliography
[1] Carpenter, E. 1949. American Journal of Surgery. Feb.1949.
[2] Saunders, C. 1926. (3172)p.788-789.
[3] Kimm, S., Tschai, B., and Park, S. 1982.. Korean Journal of Biochemistry 14:1-7.
[4] Ong, T., Whong, W., Stewart, J. and Brockman, H. 1986. Mutation Research 173:111-15.
[5] Spector, H. and Calloway, D. 1959. Proceedings of the Society for Experimental Biology and Medicine
100:405-407.
[6] Calloway, D., Newell, G., Calhoun, W. and Munson, A. 1962.. Journal of Nutrition 79:340-348.
[7] Smith, L. 1944.. American Journal of the Medical Sciences 207:647-654.
[8] Offenkrantz, W. 1950. Review of Gastroenterology 17:359-367.
[9] Ohtake, H., Nonaka, S., Sawada,Y., Hagiwara, Y., Hagiwara, H.,and Kubota, K. 1985. Journal of the
Pharmaceutical Society of Japan 105:1052-71.
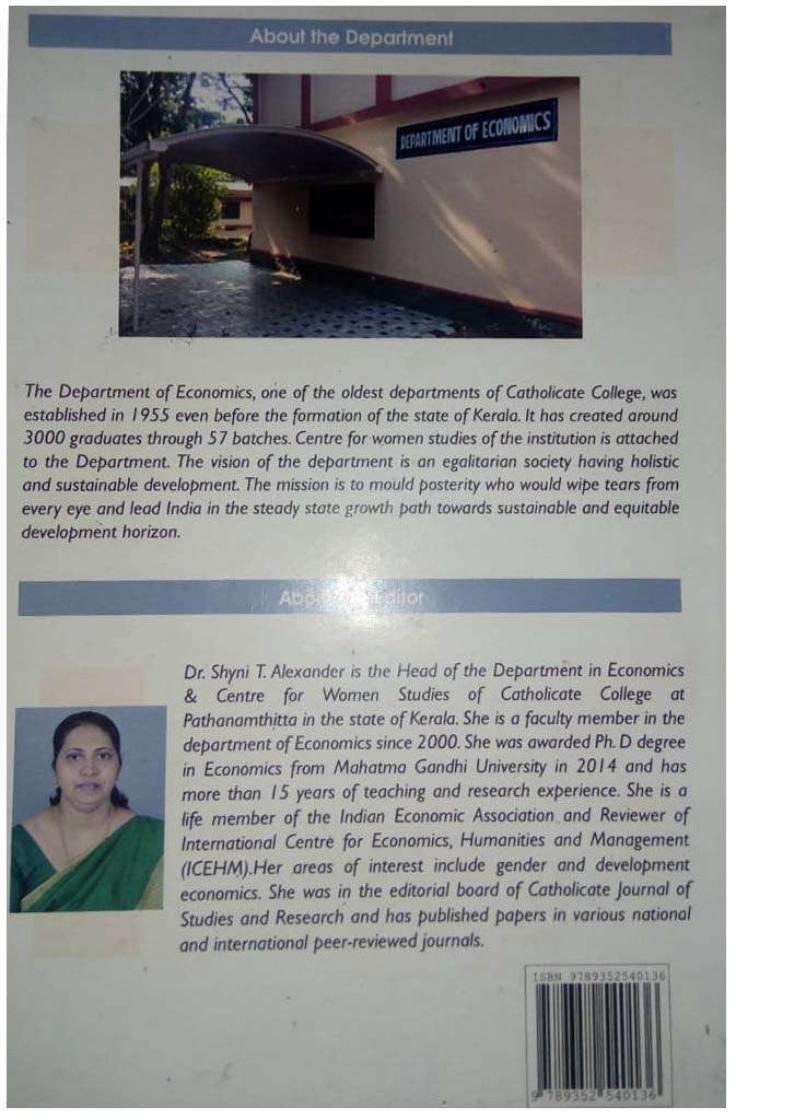

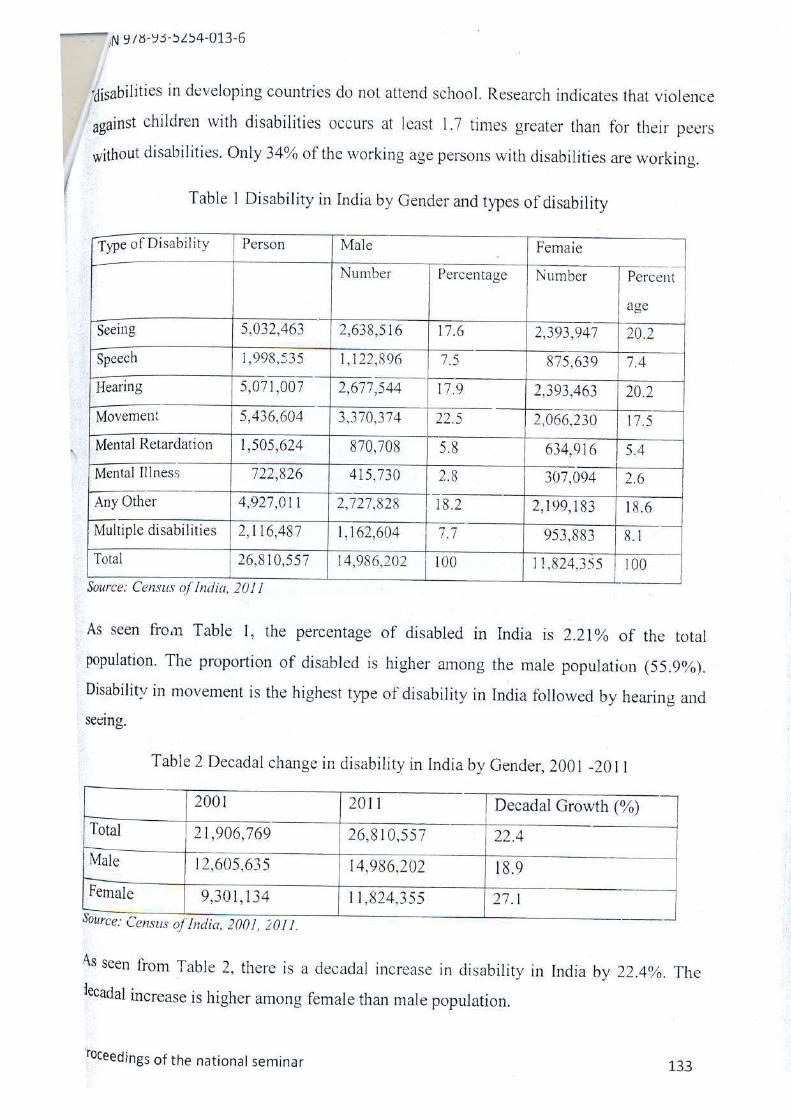


SITUATING THE EDUCATIONAL ACTIVITIES OF THE PROTESTANT CHRISTIAN
MISSIONARIES IN WEAKENING THE CASTE
RIGIDITY IN KERALA
Educational attainment is one of the main criteria in indexing human development. Among
Indian States, Kerala stands at the top in the Human Development Index. It is an acknowledged
fact that the Churches of Kerala contributed substantially to the educational development of the
State. Even prior to the European influence, the enlightened members of the Church in Kerala
served the educational needs of the then traditional society. There were enlightened Christian
teachers running ‘Kalaris’ to impart the ‘three Rs’ as well as the martial arts. The learned priests
(Malpans) provided the scriptural lessons and knowledge in some secular subjects. Nevertheless,
the most acknowledged contribution of Churches to the Kerala society is in the promotion of
modern education. It was first brought into this territory by the Protestant missionaries in the
eighteenth century. Kerala was privileged to enjoy the educational and other services of various
Protestant missions from the extreme north to the south.
During the 19th century the services rendered by societies like London Missionary Society
(LMS), Church Missionary Society (CMS) and Basel Missionary to the society was very
significant. The activities of the LMS extended to the Tamil speaking and a portion of the
Malayalam speaking area of Travancore, whereas the activities of the CMS were limited to
Travancore and Cochin. The missionaries set their foot on Travancore with the support of
Munro, the resident Dewan of Travancore.1 These missionaries also played a pivotal role in the
educational sector of Kerala. Cutting the barriers of caste they were the first to provide education
for all. Along with it the missionaries provided the strength to fight against the social evils
prevalent in the society.
Active Protestant engagement in India dates back to the early eighteenth century when German
and Danish Evangelicals established missions in South India and set up schools for men and
women of all social classes. Colonial education policy changed over time under pressure from
Evangelical missionaries, who were part of the nineteenth century transatlantic ecumenical
movement of revivalist Protestant Christianity. In the mid-nineteenth century, the British
introduced a grants-in-aid system whereby private schools for boys and girls, a large share of
which had come to be missionary-run, received subsidy Kerala, which comprises the Malayalam-
speaking Malabar, formerly part of the British Madras Presidency, and districts formerly in the
Travancore and Cochin princely states, has been lauded for its progressive education policies.2
.
The Church, which practiced existing caste taboos and hierarchies, until the end of the nineteenth
century did not actively promote mass literacy. Neither the Syrian Catholic Church, comprised of
converts from Syrian Christianity, nor the Roman Catholic (Latin) Church, dating back to
sixteenth century Portuguese conquests, showed no interest in the promotion of mass education
either until the 1880s. The Cochin and Travancore governments actively obstructed low status
boys and girls education. As late as 1889, the Cochin government sided with Hindu upper castes
in their opposition to the admission of low caste children into a mission school in Thrissur.3
While Protestant missionaries were motivated to promote mass education as part of their
objective to propagate the Gospel to all social groups, their education policy showed skillful
strategic adaptation to native environments that would solidify their footing in local societies.
These adaptation strategies were evident in their choice of types of schooling; the social strata
that they targeted in their caste education initiatives; and the incentives that they provided to
various segments of the caste population to embrace education. These educational institutions
were often the Protestants’ preferred option as a matter of policy that stressed educational
equality. Protestant missionaries expended considerable energy devising strategies for winning
over the traditionally elite segments of society also.
The Protestant Missionaries began their activities in Travancore and Cochin during the beginning
of the 19th
Century. Before that a Danish missionary, Dr. John started the Free School, a
schooling system which was open to all irrespective of caste or class.4 Within ten years the
number of school was increased to 20. Brahmin, Sudra, Christian, and Muslim students were
admitted to these schools. After his death, the movement was carried on by the C.M.S.
missionaries Rev. Shnarre and Rev. Rhenius. William Tobias Ringeltaube, the first London
Missionary Society's missionary in Kerala established many schools in different places of South
Travancore. His works were later on carried out by the L.M.S. missionaries like Charles Mead,
John Cox and Samuel Mateer who contributed much in the social and educational fields of

Kerala. By 1865, they had nearly 50 schools in Trivandrum and Kollam region which imparted
secular education to all students without any caste distinction.5
The Church Missionary Society and colonel John Monroe were responsible for opening
Malayalam schools and higher education in Kerala. Rev. Thomas Norton and Rev. Benjamin
Bailey started schools at Allappuzha (1816) and Kottayam (1817) respectively. Within one year
the missionaries established schools at Kottayam, Manroe Island, Mulamthuruthy, Niranam,
Chengannur, Thumpamon, Kandanad, Manarcaud, Mavelikkara and Puthuppally.6 By 1821, the
number of schools rose to 35. It was increased to 50 in 1822. Both the Hindus and the Christians
were appointed as teachers and headmasters. And out of the 50 schools 33 schools had
headmasters who were either Hindus or Muslims. It is a clear evidence for the objective of the
missionaries that they tried to make the general education stream purely as secular and there
were no evidences for any attempt of conversion. All the major subjects and languages were
taught including Sanskrit, the exclusive language of the Brahmins. A Grammar School
established at Kottayam then developed as the present CMS College. Among the missionaries
who worked at Kottayam, the names of Benjamin Bailey, Henry Baker and Joseph Finn deserve
special mention. The missionaries also started schools exclusively for the Nair, Konkini
Brahmins, and the Araya Communities on their requests. In 1836, January 26, Rev. Thomas
Norton banned any kind of untouchability or caste distinction in their schools. During 1828-
1829, the C.M.S. ran 5 schools in Tellicherry region. In 1818 itself the C.M.S. started their
educational activities in Kannur region also. J. Dawsan, a British missionary started an English
School in Mattanchari in 1818.7
The modern and popular education started by the Missionaries soon attracted various
communities like the Nair, Christians, Muslims, Channar, Ezhabvas, Arayas etc. After
sometimes the elders also showed interest in getting education and L.M.S. established a number
of evening schools which admitted them without any caste distinction. In 1815, the C.M.S. alone
had 46 schools in Tamilnadu region. There were 83 Brahmins, 1118 sudras, 259 Christians, 32
Muslims, and 238 scheduled caste students in these schools.8 Thus they introduced a uniform
education system in Kerala. It was the first attempt in Kerala society to bring together all those
who were placed in the water-tight compartments of caste system in Kerala. In the first step, they
brought the Nairs and the Syrian Christian together in the class rooms and later on the

untouchables or the lower castes. Thus the educational reforms of the missionaries developed in
Kerala through different phases. It attracted firstly the Syrians Christians secondly the Nairs and
then Ezhavas, Nadars, and so on. The Ezhavas showed more interest in sending their children in
schools and promoted the educational activities of the missionaries in comparison with the other
communities.
Another most effective and notable work on the part of the missionaries was their effort to impart
education to the slaves. The slaves were mostly poor, illiterate, neglected and even could not live
like human beings because of the caste and social structure prevailing here. It was not an easy
task for the missionaries to teach the slaves. It was a strenuous effort in bringing the entire slaves
to the learning centers. This movement was initiated by Rev. T.G. Ragland, the Chaplain of
madras Anglican Bishop, Rev. George Mathen and Rev. John Hawksworth. As a first step they
established a Slave Liberation Mission at Mallappally. The slaves were reluctant to come to
schools for mainly two reasons. Firstly, the slave owners did not allow them to go to schools and
secondly, the fear and ignorance of the slaves. These missionaries visited their houses
continuously to make them aware about it and requested the slave owners to grant permission.
They introduced a strategy of “Soap, Soup, and Salvation”.9 The missionaries also started their
work among the slaves in Thrissur region also and the first school was started at Moolicherry
(1849).10
The Syrian Christians and the Brahmins raised a vehement opposition against it. The
Travancore and Kochi rulers also discouraged and even opposed the slave education of the
missionaries. The upper castes and the Syrian Christians threatened and even physically harassed
the slaves who sent their children to schools. They burnt the school sheds in some areas.
Despite of the strong opposition, the missionaries continued their work and set up more slave
schools in Thiruvalla, Kaviyoor, Pallam, Eraviperoor, Perumthuruthi, Kumarakom, Veloor
Nalunnakkal, Mamunda, Mangala, Peerumedu and Mundakkayam.11
But some protestant
Christians supported the works of the missionaries. The upper castes banned the professionals
like carpenter, barber, washer men, mason etc. in serving the protestant Christians who supported
the slave education. However, the missionaries did not withdraw from their attempt and more
slaves came forward for education. Missionaries encouraged the teachers and others for bringing
more slave children into schools by giving incentives in addition to their salary. As a result,
within one year the teachers enrolled more than thousand slave boys and girls in their schools.12

The work of missionaries among the tribes and the fisher folk communities in Kerala was also
praise worthy. Henry Baker Junior was the first protestant missionary who started the
educational work among the tribes. It was begun at Thevermala in Melukavu village in
Thodupuzha taluk. Baker responded to the request from the chieftains of the Malaaraya tribal
people in this area and initiated the work. Hundreds of tribal people both children and elders
came forward. The Araya Mission was begun to organize the work among them. Within one year
190 students joined the school. The work then extended to other tribal areas and communities
like the Ooralas, Mannanmars, Vedars, Ulladars, Paniyars, Malampandarangals, Nayadis,
Muthuvas etc.13
This work empowered the tribal sections to come into the main stream of our
society. The missionaries also did effective and useful work among the fishermen in coastal
areas in Alappuzha and Thrissur .The first school was opened by Rev. Thomas Norton at
Alappuzha in 1835. Schools were also opened in various coastal areas like Mavelikkara, Thrissur
etc. It provided the lower castes particularly the Dheevara community to become educated.14
The protestant missionaries established a network of primary and secondary schools, providing
education both in English and regional languages. The beginning of printing presses and wider
circulation of reading material allowed many caste groups to voice their demands in the open and
petition the government directly. The dissemination of religious and secular literature also
contributed towards a greater political awakening in Kerala. This, coupled with anti-caste
ideology, propagated through popular religious idioms by philosophers such as Narayana Guru
played a significant apart in self-respect campaigns. Narayana Guru, led community reform
initiatives by challenging Brahmin monopoly over temple worship and access to public
institutions. These attempts at democratizing knowledge have had a far reaching impact on
Kerala. For the Ezhavas, it meant a greater share of administrative jobs and distancing from past
selves as ‘toddy tappers’ and ‘manual labourers’.15
In short, education became the site for the
project of modernity for these social groups. Changing notions of ‘status and ‘work’ were
centered on educational practices.
The missionaries provided education to the people irrespective of caste or creed. So the lower
caste people who had no opportunities to enter into traditional schools (kudi pallikoodams),
utilized this opportunity to get knowledge. As a result, a large number of Nadars, Dalits and
Ezhavas were attracted to Christianity. They disregarded the authority of the landlords and sent
their children to the schools established by the missionaries. These children, when grown up,
could reach to high levels of government service. This prompted many other non-Christians also
to start schools providing western education. It was the beginning of social awakening in Kerala,
which produced leaders like Sri Narayana Guru (1856-1924), Chattambi Swamikal (1853-1924),
Mannathu Padmanabhan (1878-1970), V.T. Bhattathiripad (1896-1982) and Ayyankali (1863-
1941).16
It is to be noted that all these leaders exhorted their community members to get
education, besides striving to abolish the superstitions and rotten social customs of their own
communities. Thus, we can rightly say that the modern Kerala society was shaped by the
Christian missionaries. The leaders of this soil preserved this spirit and carried it forward.
Protestant missionaries’ initiatives encouraging caste integration in schooling, as indeed their
campaigns to abolish such practices as the prohibition for shanar women to wear a breast cloth,
were bound to attract converts from amongst these disadvantaged communities because of
instant rewards of status elevation. As elsewhere in India, conversion proceeded from a handful
of socially marginal individuals to voluntary petitions of entire villages to convert. Conversions
in turn not only helped introduce literacy to low caste females, but to ensure literacy retention
over time and the likelihood of progression to higher levels of schooling. The alarmingly high
rates of low status conversions in turn fuelled competition among established religious groups
for adherents.
Christianity provided a ‘set of bargaining counters’ to low caste ‘contestants.’ If a group failed to
win new rights and shares in a locality’s ranking scheme as Hindus, they could convert to
Christianity, restage their campaign for new honors, and hope to win on the next round. While
the shanars converted en masse to Christianity, others like the Ezhavas, threatened conversion if
caste Hindus would not address their social integration demands. Education was central to
religious competition strategies. Eventually, competing religious groups, particularly Hindus
alarmed by Christian conversions, lobbied the government to open more low caste native
schools. Low caste social movements like the Sree Narayana Dharma Paripalana (SNDP) Yogam
and Sadhu Jana Paripalana (SJP) Sanghom, fuelled by missionaries’ modernization initiatives,
also became active lobbyists for inclusive schooling. In 1909-10, the Travancore government
adopted an Education Code, which stipulated that schooling provision would be “without
distinction of class or creed”. By 1929-1930, only twelve of Travancore’s 3641 schools banned
the untouchables.17
Despite their evangelical agenda, mission schools became an important factor in local societies
by enabling formal schooling opportunities to hitherto excluded groups. These mission schools
provided instruction in the three Rs as well as subjects such as History, Geography, Elementary
Science and basic vocational training. For labouring populations, this opened up new
opportunities to develop new modes of expression, participation in the literate public sphere and
to aspire for social mobility through new jobs. Missionary schooling, particularly for Christian
converts also had a dual objective. European protestant missionaries aimed at moulding a new
sense of self amongst their converts by attempting to break down caste markers. Education was
the domain to introduce new habits, patterns of work, social organization, gender roles and
language for Christian converts.
Wherever the Christian community is there, they do a lot of charitable service for the uplift of the
down-trodden. They do a lot of social activities to help the poor and needy. The missionaries
went into the homes of the poor, lifting their living standards. The Christian Missionaries
influenced the British Government to pressure the Travancore leaders to challenge the special
privilege and authorities of the upper caste and to give more priority to solve the grievances of
the lower caste. The English educational institutions, libraries, news papers and the printing press
introduced by the missionaries also paved the way for reforming our society from the clutches of
caste evils.Thus the Protestant missionaries were able to create social harmony in our society by
narrowing the ill- feelings and differences of strong and rigid caste- system. This silent but the
most effective revolution was started in the class rooms.
Bibliography
1. Warrier, Ragava and Gurukkal,Rajan, Kerala Charithram, vol.2, (mal) Vallathol
Vidyapeedam, Edappal p.145
2. Firth, C.B.., An Introduction to Indian Christianity, ISPCKNew Delhi, , 1961, p.130
3. Ibid, p.21.
4. Kuriakose, M.K., History of Christianity in India: Source Materials, ISPCK New Delhi,
2011, p.147.
5. Ninan.K.,G, Sabhacharithra Vichithanagal-Anglican Kalaghattam,(Mal),CSS Book House,
Thiruvalla, 1997 p.26.
6. Nellimukal, Samuel, Keralathile Samuhyaparivarthanam, , K.S.Books,Kottayam, 2003,
p.177.
7. Ibid, p.p.178-181
8. Ibid, p.183
9. Ibid, p185
10. Ninan.K.,G.,opp.cit,p.113
11. Nellimukal. Samuel,opp.cit,p.194
12. Menon.Sreedhara ,A, A Survey of Kerala History, D.C.Books, Kottayam,1967, p.311
13. Nellimukal. Samuel,opp.cit,p.195
14. Nellimukal. Samuel,opp.cit,p.197
15. Nadar.Krishnan ,G, History of Kerala, Learner’s Book House, Kottayam, 2007,p.265.
16. Gangadharan.T.K., , History of Kerala, Central Co-Operative Stores, Calicut, 2008
Kottayam, p.312.
17. Balakrishnan.P.K., Jativyavastahdiyum Keralacharithravum,(Mal) D.C.Books Kottayam,
1983, p.303.


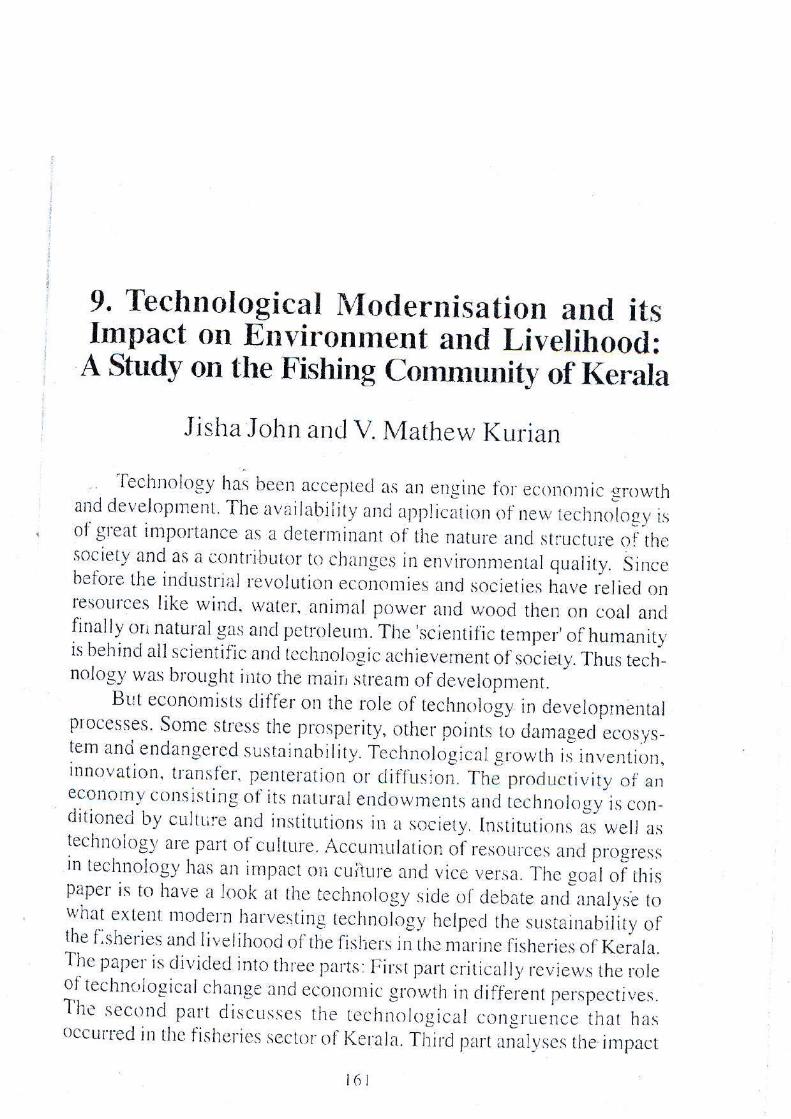
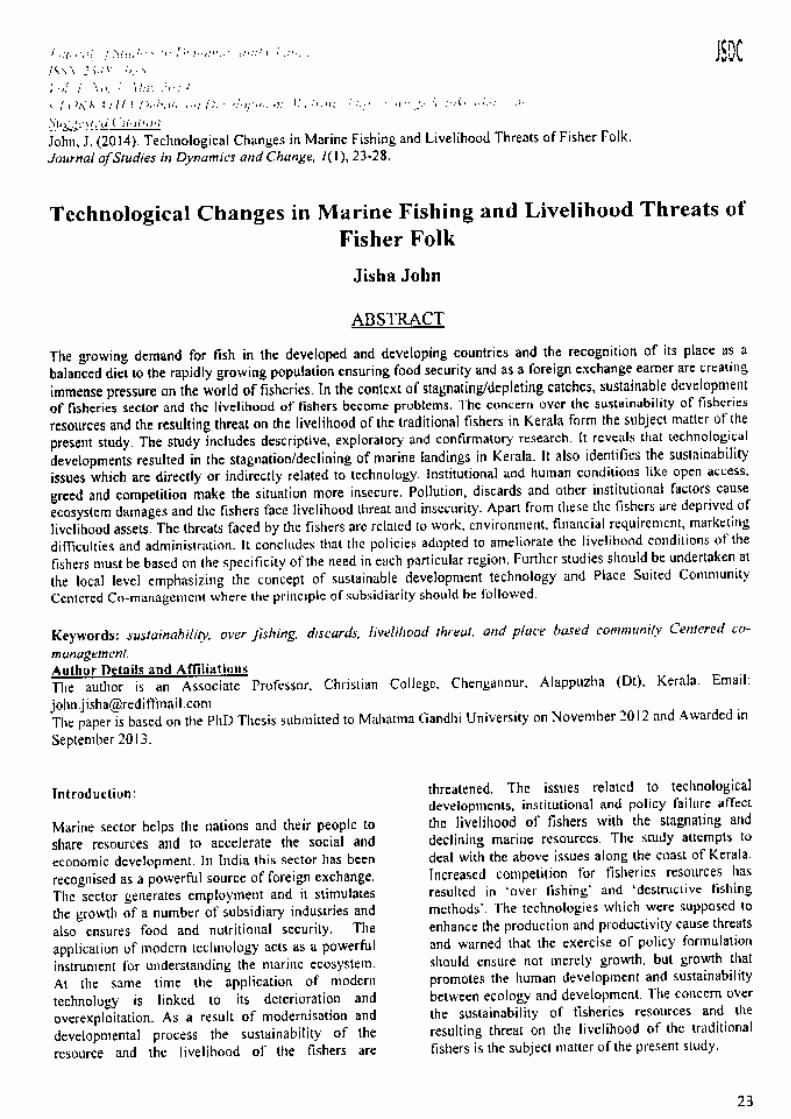
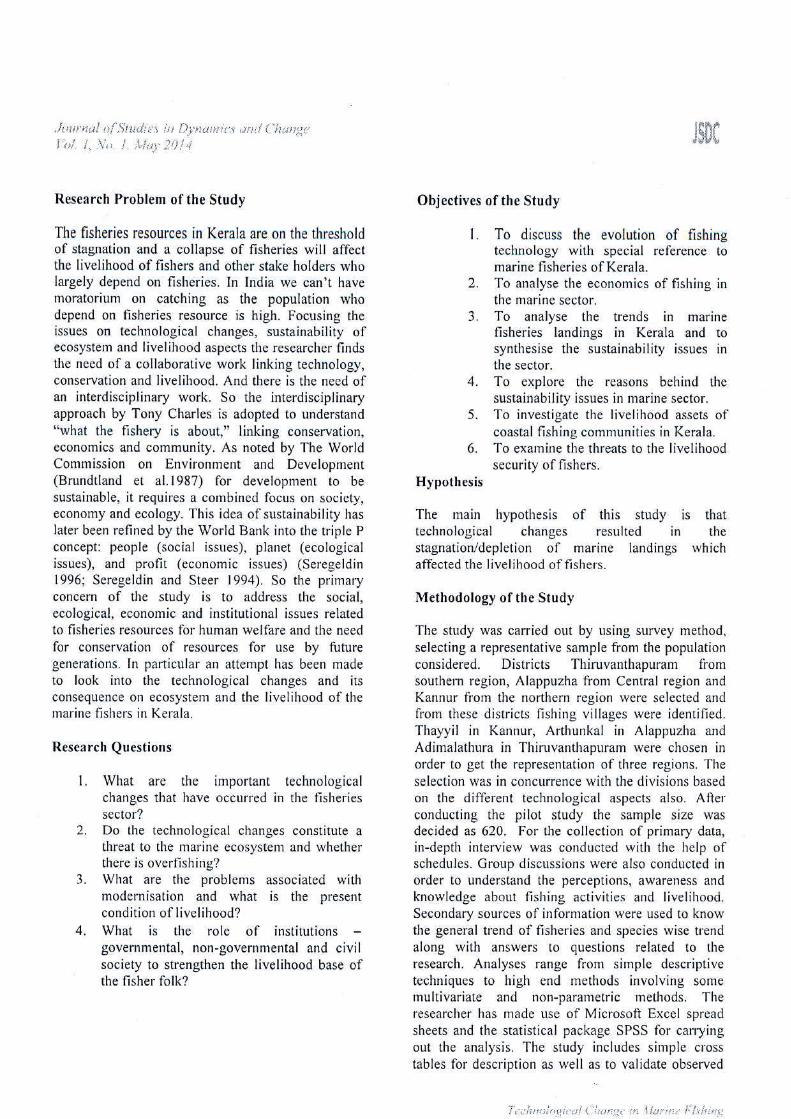
Preface
Biodiversity as the diverse species of life forms is not just a conservation issue. It isalso related to the production and consumption patterns on which the poor dependdirectly. Biodiversity is the means of livelihood and the “means of production” ofthe poor who have no access to other means of production or assets. For food andmedicine, for energy and fibre, for ceremony and craft, the poor depend on thewealth of biological resources and their knowledge and skills related to biodiversity.It is thus the basis of both the production and consumption patterns of the poor.
Biodiversity erosion therefore does not merely have ecological consequences. Italso translates into destruction of livelihoods and lack of fulfilment of basic needsfor the poorer two thirds of humanity which lives in a biodiversity based economy.The consumption patterns of the rich can undermine the consumption patterns ofthe poor by contributing to biodiversity erosion. Indians have stewardship of abeautiful, diverse and unique environment and Indian culture and philosophy arestrongly rooted in our rich and unique natural heritage. The continued growth ofhuman populations and of consumption patterns, exacerbated with habitatdestruction, land conversion for agriculture and development, climate change,pollution and the spread of invasive species have resulted in unsustainable exploitationof our biological diversity.
A mono-agriculture society - where trees are seen as nothing more than timber andcrop yield is the only measure for economic value of cereals - reflects a mental andpolitical system that will lack in vision and complexity in general. However, diverseknowledge systems are necessary to address the challenges ahead of us. For example,in traditional societies, trees have multiple purposes, from food, water reservoir andshelter to nutrients of the soil around them. Timber value is only one (small) part ofthe whole. Traditional knowledge systems contribute in major ways to theunderstanding of biodiversity, ecological sustainability and cultural, includingagricultural, diversity. This attitude is truly an important concept to improve yourcritical thinking and, therefore, decision making skills. This shift in perspective providesone with some of the foundations required for independent and intelligent thinking.
Since the World Summit on Sustainable Development in 2002, 193 parties to theConvention on Biodiversity (CBD) have committed themselves to substantiallyreducing rates of biodiversity loss by 2010 (‘Biodiversity Target’) and this goal wasincorporated into the UN Millennium Development Goals (MDG) in 2005. Followingthis, a wide array of international, national and regional strategies and action planshave been forwarded to achieve the goals of biodiversity conservation. There arealso a series of conservation initiatives by civil society organisations across theglobe. India also prepared the National Biodiversity Strategies and Action Plan(NBSAP) and enacted the Biological Diversity Act (2002) and the Biological DiversityRules (2004). The United Nations has declared 2010 as the International Year of
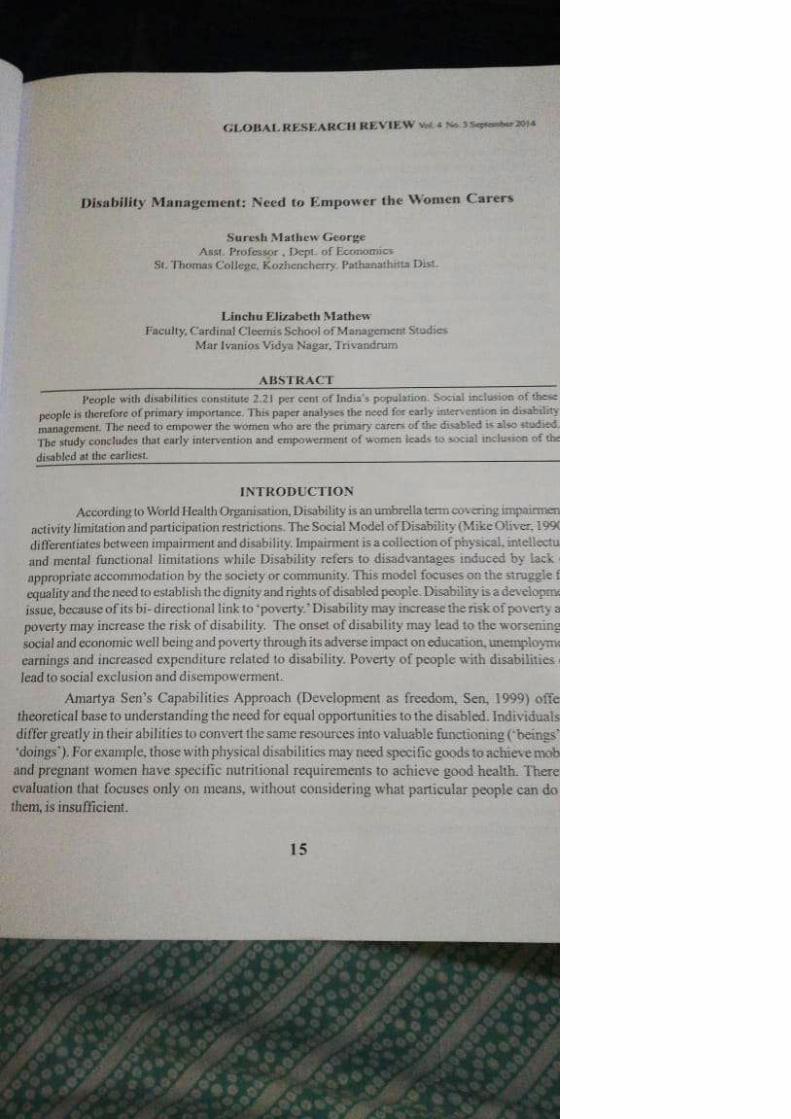
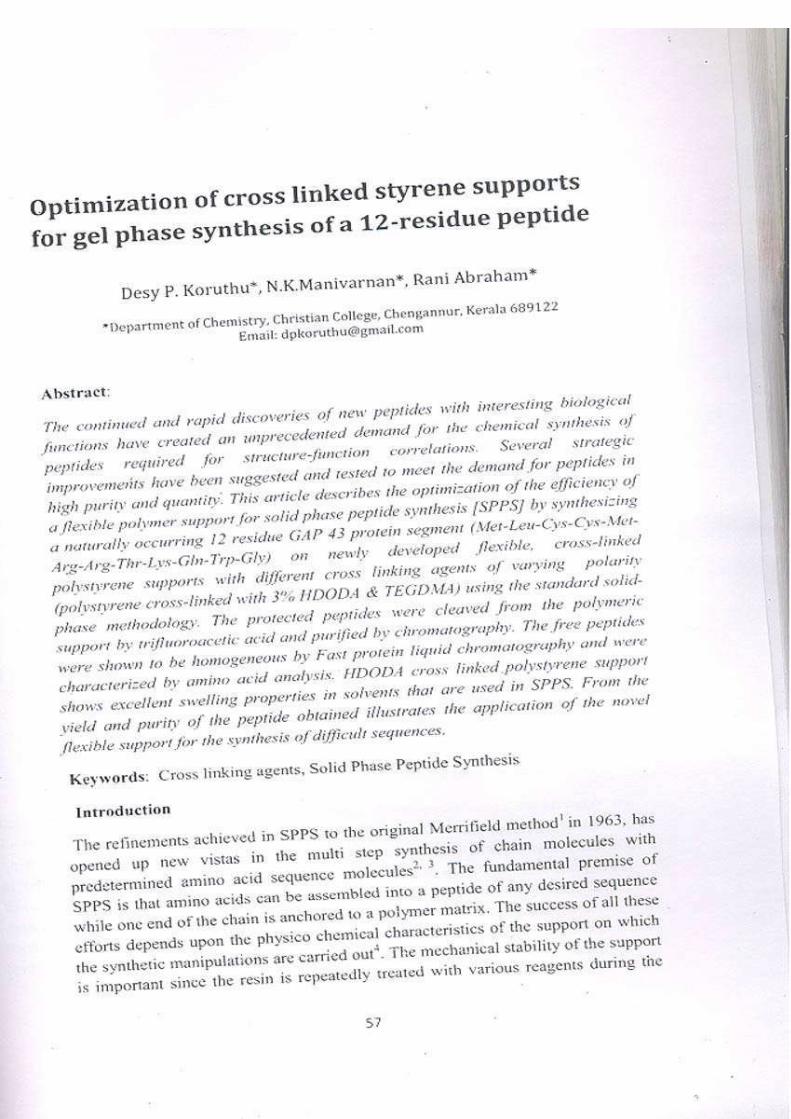
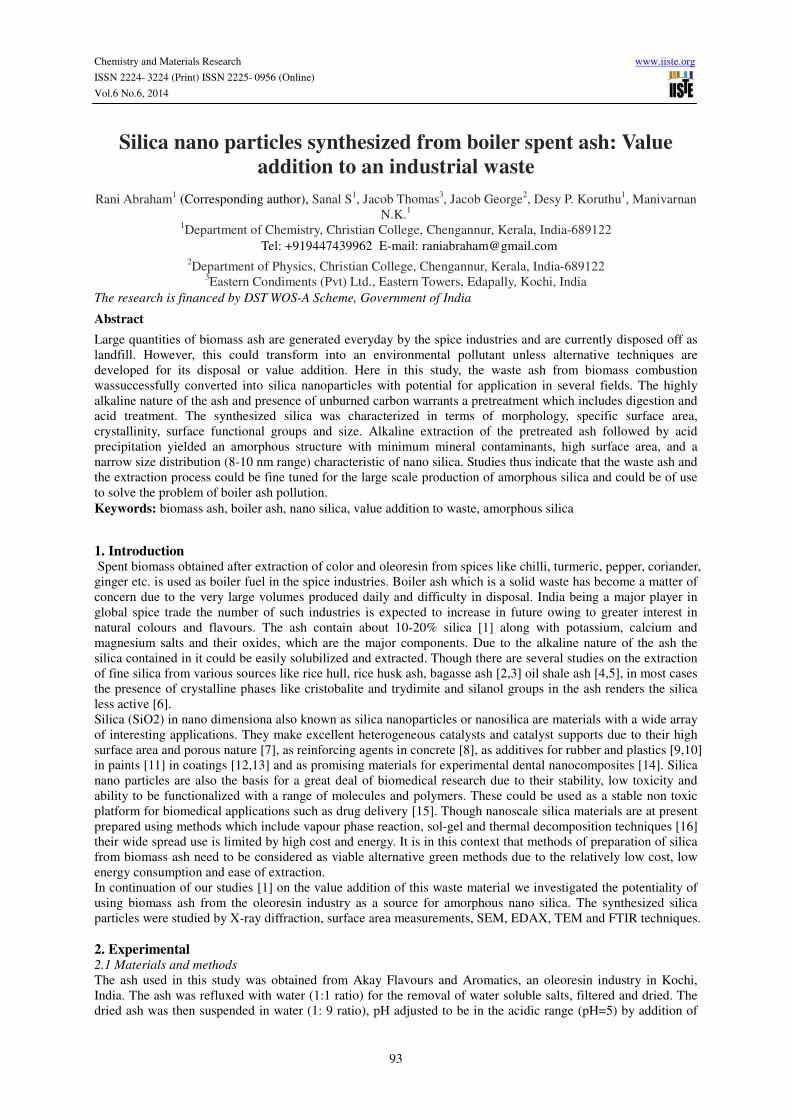
Chemistry and Materials Research www.iiste.org
ISSN 2224- 3224 (Print) ISSN 2225- 0956 (Online)
Vol.6 No.6, 2014
93
Silica nano particles synthesized from boiler spent ash: Value
addition to an industrial waste
Rani Abraham1 (Corresponding author), Sanal S1, Jacob Thomas3, Jacob George2, Desy P. Koruthu1, Manivarnan N.K.1
1Department of Chemistry, Christian College, Chengannur, Kerala, India-689122 Tel: +919447439962 E-mail: [email protected]
2Department of Physics, Christian College, Chengannur, Kerala, India-689122 3Eastern Condiments (Pvt) Ltd., Eastern Towers, Edapally, Kochi, India
The research is financed by DST WOS-A Scheme, Government of India
Abstract
Large quantities of biomass ash are generated everyday by the spice industries and are currently disposed off as landfill. However, this could transform into an environmental pollutant unless alternative techniques are developed for its disposal or value addition. Here in this study, the waste ash from biomass combustion wassuccessfully converted into silica nanoparticles with potential for application in several fields. The highly alkaline nature of the ash and presence of unburned carbon warrants a pretreatment which includes digestion and acid treatment. The synthesized silica was characterized in terms of morphology, specific surface area, crystallinity, surface functional groups and size. Alkaline extraction of the pretreated ash followed by acid precipitation yielded an amorphous structure with minimum mineral contaminants, high surface area, and a narrow size distribution (8-10 nm range) characteristic of nano silica. Studies thus indicate that the waste ash and the extraction process could be fine tuned for the large scale production of amorphous silica and could be of use to solve the problem of boiler ash pollution. Keywords: biomass ash, boiler ash, nano silica, value addition to waste, amorphous silica
1. Introduction Spent biomass obtained after extraction of color and oleoresin from spices like chilli, turmeric, pepper, coriander, ginger etc. is used as boiler fuel in the spice industries. Boiler ash which is a solid waste has become a matter of concern due to the very large volumes produced daily and difficulty in disposal. India being a major player in global spice trade the number of such industries is expected to increase in future owing to greater interest in natural colours and flavours. The ash contain about 10-20% silica [1] along with potassium, calcium and magnesium salts and their oxides, which are the major components. Due to the alkaline nature of the ash the silica contained in it could be easily solubilized and extracted. Though there are several studies on the extraction of fine silica from various sources like rice hull, rice husk ash, bagasse ash [2,3] oil shale ash [4,5], in most cases the presence of crystalline phases like cristobalite and trydimite and silanol groups in the ash renders the silica less active [6]. Silica (SiO2) in nano dimensiona also known as silica nanoparticles or nanosilica are materials with a wide array of interesting applications. They make excellent heterogeneous catalysts and catalyst supports due to their high surface area and porous nature [7], as reinforcing agents in concrete [8], as additives for rubber and plastics [9,10] in paints [11] in coatings [12,13] and as promising materials for experimental dental nanocomposites [14]. Silica nano particles are also the basis for a great deal of biomedical research due to their stability, low toxicity and ability to be functionalized with a range of molecules and polymers. These could be used as a stable non toxic platform for biomedical applications such as drug delivery [15]. Though nanoscale silica materials are at present prepared using methods which include vapour phase reaction, sol-gel and thermal decomposition techniques [16] their wide spread use is limited by high cost and energy. It is in this context that methods of preparation of silica from biomass ash need to be considered as viable alternative green methods due to the relatively low cost, low energy consumption and ease of extraction. In continuation of our studies [1] on the value addition of this waste material we investigated the potentiality of using biomass ash from the oleoresin industry as a source for amorphous nano silica. The synthesized silica particles were studied by X-ray diffraction, surface area measurements, SEM, EDAX, TEM and FTIR techniques. 2. Experimental 2.1 Materials and methods
The ash used in this study was obtained from Akay Flavours and Aromatics, an oleoresin industry in Kochi, India. The ash was refluxed with water (1:1 ratio) for the removal of water soluble salts, filtered and dried. The dried ash was then suspended in water (1: 9 ratio), pH adjusted to be in the acidic range (pH=5) by addition of
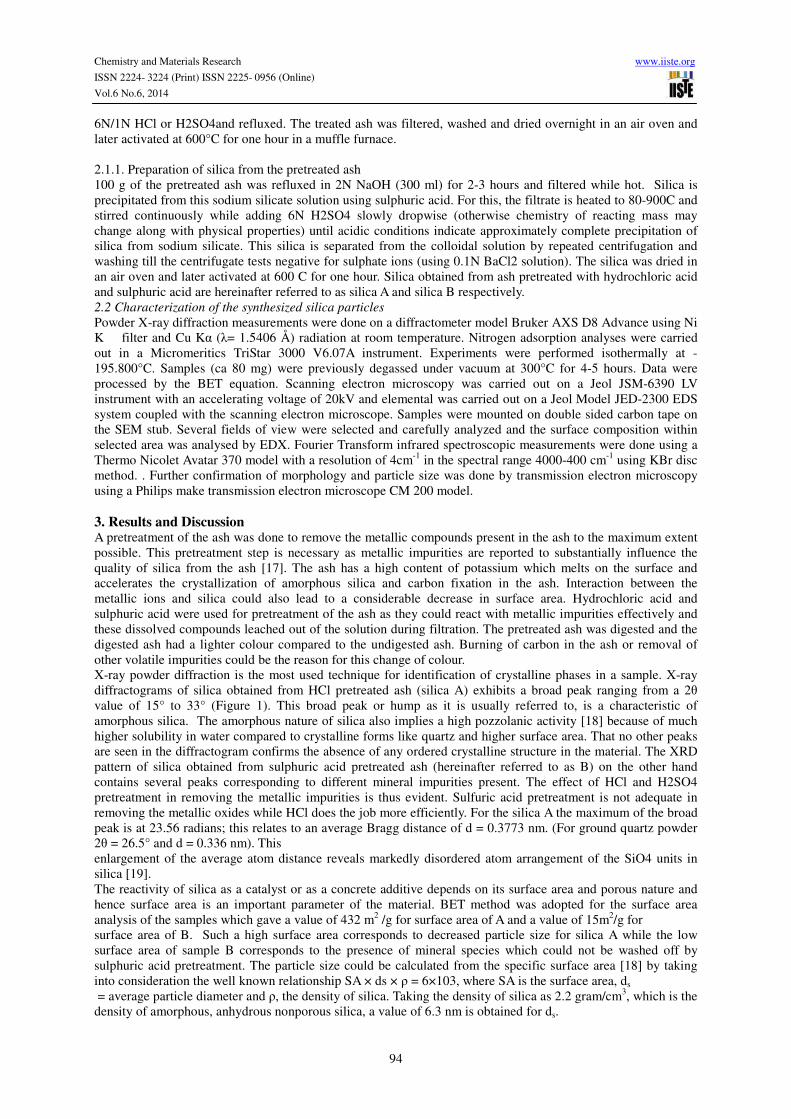
Chemistry and Materials Research www.iiste.org
ISSN 2224- 3224 (Print) ISSN 2225- 0956 (Online)
Vol.6 No.6, 2014
94
6N/1N HCl or H2SO4and refluxed. The treated ash was filtered, washed and dried overnight in an air oven and later activated at 600°C for one hour in a muffle furnace. 2.1.1. Preparation of silica from the pretreated ash 100 g of the pretreated ash was refluxed in 2N NaOH (300 ml) for 2-3 hours and filtered while hot. Silica is precipitated from this sodium silicate solution using sulphuric acid. For this, the filtrate is heated to 80-900C and stirred continuously while adding 6N H2SO4 slowly dropwise (otherwise chemistry of reacting mass may change along with physical properties) until acidic conditions indicate approximately complete precipitation of silica from sodium silicate. This silica is separated from the colloidal solution by repeated centrifugation and washing till the centrifugate tests negative for sulphate ions (using 0.1N BaCl2 solution). The silica was dried in an air oven and later activated at 600 C for one hour. Silica obtained from ash pretreated with hydrochloric acid and sulphuric acid are hereinafter referred to as silica A and silica B respectively. 2.2 Characterization of the synthesized silica particles
Powder X-ray diffraction measurements were done on a diffractometer model Bruker AXS D8 Advance using Ni K filter and Cu Kα (λ= 1.5406 Å) radiation at room temperature. Nitrogen adsorption analyses were carried
out in a Micromeritics TriStar 3000 V6.07A instrument. Experiments were performed isothermally at -195.800°C. Samples (ca 80 mg) were previously degassed under vacuum at 300°C for 4-5 hours. Data were processed by the BET equation. Scanning electron microscopy was carried out on a Jeol JSM-6390 LV instrument with an accelerating voltage of 20kV and elemental was carried out on a Jeol Model JED-2300 EDS system coupled with the scanning electron microscope. Samples were mounted on double sided carbon tape on the SEM stub. Several fields of view were selected and carefully analyzed and the surface composition within selected area was analysed by EDX. Fourier Transform infrared spectroscopic measurements were done using a Thermo Nicolet Avatar 370 model with a resolution of 4cm-1 in the spectral range 4000-400 cm-1 using KBr disc method. . Further confirmation of morphology and particle size was done by transmission electron microscopy using a Philips make transmission electron microscope CM 200 model. 3. Results and Discussion A pretreatment of the ash was done to remove the metallic compounds present in the ash to the maximum extent possible. This pretreatment step is necessary as metallic impurities are reported to substantially influence the quality of silica from the ash [17]. The ash has a high content of potassium which melts on the surface and accelerates the crystallization of amorphous silica and carbon fixation in the ash. Interaction between the metallic ions and silica could also lead to a considerable decrease in surface area. Hydrochloric acid and sulphuric acid were used for pretreatment of the ash as they could react with metallic impurities effectively and these dissolved compounds leached out of the solution during filtration. The pretreated ash was digested and the digested ash had a lighter colour compared to the undigested ash. Burning of carbon in the ash or removal of other volatile impurities could be the reason for this change of colour. X-ray powder diffraction is the most used technique for identification of crystalline phases in a sample. X-ray diffractograms of silica obtained from HCl pretreated ash (silica A) exhibits a broad peak ranging from a 2θ value of 15° to 33° (Figure 1). This broad peak or hump as it is usually referred to, is a characteristic of amorphous silica. The amorphous nature of silica also implies a high pozzolanic activity [18] because of much higher solubility in water compared to crystalline forms like quartz and higher surface area. That no other peaks are seen in the diffractogram confirms the absence of any ordered crystalline structure in the material. The XRD pattern of silica obtained from sulphuric acid pretreated ash (hereinafter referred to as B) on the other hand contains several peaks corresponding to different mineral impurities present. The effect of HCl and H2SO4 pretreatment in removing the metallic impurities is thus evident. Sulfuric acid pretreatment is not adequate in removing the metallic oxides while HCl does the job more efficiently. For the silica A the maximum of the broad peak is at 23.56 radians; this relates to an average Bragg distance of d = 0.3773 nm. (For ground quartz powder 2θ = 26.5° and d = 0.336 nm). This enlargement of the average atom distance reveals markedly disordered atom arrangement of the SiO4 units in silica [19]. The reactivity of silica as a catalyst or as a concrete additive depends on its surface area and porous nature and hence surface area is an important parameter of the material. BET method was adopted for the surface area analysis of the samples which gave a value of 432 m2 /g for surface area of A and a value of 15m2/g for surface area of B. Such a high surface area corresponds to decreased particle size for silica A while the low surface area of sample B corresponds to the presence of mineral species which could not be washed off by sulphuric acid pretreatment. The particle size could be calculated from the specific surface area [18] by taking into consideration the well known relationship SA × ds × ρ = 6×10³, where SA is the surface area, ds = average particle diameter and ρ, the density of silica. Taking the density of silica as 2.2 gram/cm3, which is the density of amorphous, anhydrous nonporous silica, a value of 6.3 nm is obtained for ds.
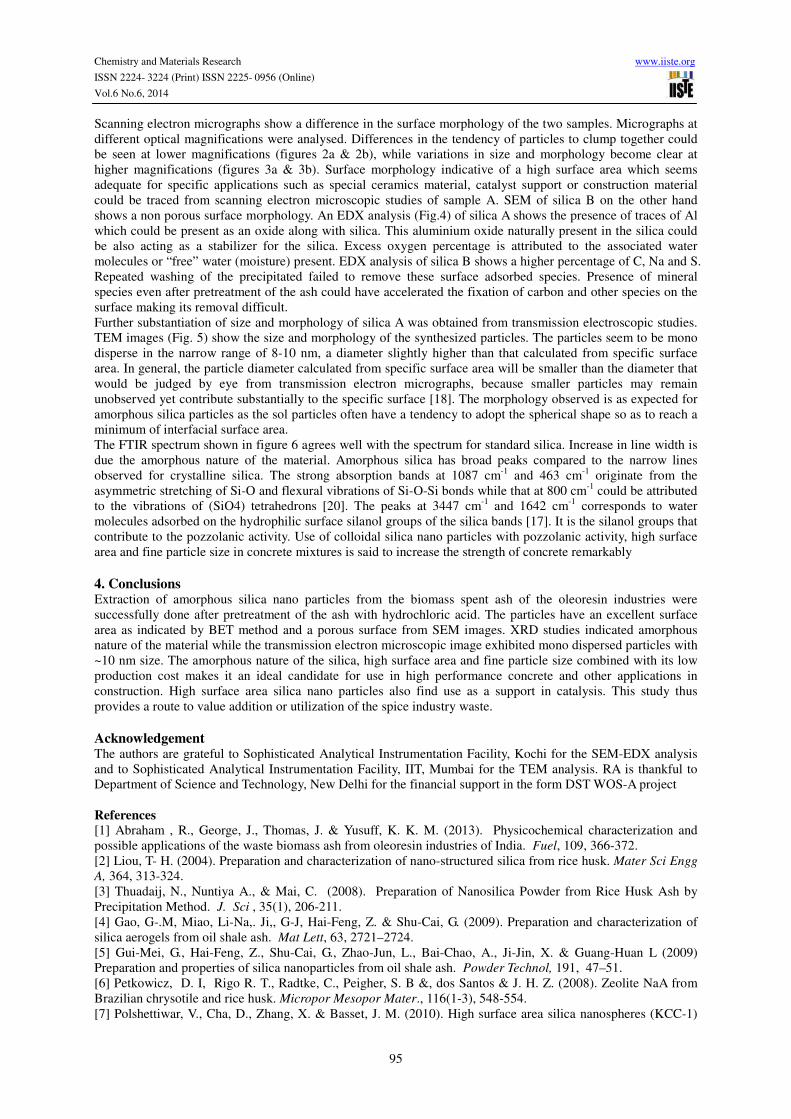
Chemistry and Materials Research www.iiste.org
ISSN 2224- 3224 (Print) ISSN 2225- 0956 (Online)
Vol.6 No.6, 2014
95
Scanning electron micrographs show a difference in the surface morphology of the two samples. Micrographs at different optical magnifications were analysed. Differences in the tendency of particles to clump together could be seen at lower magnifications (figures 2a & 2b), while variations in size and morphology become clear at higher magnifications (figures 3a & 3b). Surface morphology indicative of a high surface area which seems adequate for specific applications such as special ceramics material, catalyst support or construction material could be traced from scanning electron microscopic studies of sample A. SEM of silica B on the other hand shows a non porous surface morphology. An EDX analysis (Fig.4) of silica A shows the presence of traces of Al which could be present as an oxide along with silica. This aluminium oxide naturally present in the silica could be also acting as a stabilizer for the silica. Excess oxygen percentage is attributed to the associated water molecules or “free” water (moisture) present. EDX analysis of silica B shows a higher percentage of C, Na and S. Repeated washing of the precipitated failed to remove these surface adsorbed species. Presence of mineral species even after pretreatment of the ash could have accelerated the fixation of carbon and other species on the surface making its removal difficult. Further substantiation of size and morphology of silica A was obtained from transmission electroscopic studies. TEM images (Fig. 5) show the size and morphology of the synthesized particles. The particles seem to be mono disperse in the narrow range of 8-10 nm, a diameter slightly higher than that calculated from specific surface area. In general, the particle diameter calculated from specific surface area will be smaller than the diameter that would be judged by eye from transmission electron micrographs, because smaller particles may remain unobserved yet contribute substantially to the specific surface [18]. The morphology observed is as expected for amorphous silica particles as the sol particles often have a tendency to adopt the spherical shape so as to reach a minimum of interfacial surface area. The FTIR spectrum shown in figure 6 agrees well with the spectrum for standard silica. Increase in line width is due the amorphous nature of the material. Amorphous silica has broad peaks compared to the narrow lines observed for crystalline silica. The strong absorption bands at 1087 cm-1 and 463 cm-1 originate from the asymmetric stretching of Si-O and flexural vibrations of Si-O-Si bonds while that at 800 cm-1 could be attributed to the vibrations of (SiO4) tetrahedrons [20]. The peaks at 3447 cm-1 and 1642 cm-1 corresponds to water molecules adsorbed on the hydrophilic surface silanol groups of the silica bands [17]. It is the silanol groups that contribute to the pozzolanic activity. Use of colloidal silica nano particles with pozzolanic activity, high surface area and fine particle size in concrete mixtures is said to increase the strength of concrete remarkably
4. Conclusions Extraction of amorphous silica nano particles from the biomass spent ash of the oleoresin industries were successfully done after pretreatment of the ash with hydrochloric acid. The particles have an excellent surface area as indicated by BET method and a porous surface from SEM images. XRD studies indicated amorphous nature of the material while the transmission electron microscopic image exhibited mono dispersed particles with ~10 nm size. The amorphous nature of the silica, high surface area and fine particle size combined with its low production cost makes it an ideal candidate for use in high performance concrete and other applications in construction. High surface area silica nano particles also find use as a support in catalysis. This study thus provides a route to value addition or utilization of the spice industry waste.
Acknowledgement The authors are grateful to Sophisticated Analytical Instrumentation Facility, Kochi for the SEM-EDX analysis and to Sophisticated Analytical Instrumentation Facility, IIT, Mumbai for the TEM analysis. RA is thankful to Department of Science and Technology, New Delhi for the financial support in the form DST WOS-A project
References
[1] Abraham , R., George, J., Thomas, J. & Yusuff, K. K. M. (2013). Physicochemical characterization and possible applications of the waste biomass ash from oleoresin industries of India. Fuel, 109, 366-372. [2] Liou, T- H. (2004). Preparation and characterization of nano-structured silica from rice husk. Mater Sci Engg
A, 364, 313-324. [3] Thuadaij, N., Nuntiya A., & Mai, C. (2008). Preparation of Nanosilica Powder from Rice Husk Ash by Precipitation Method. J. Sci , 35(1), 206-211. [4] Gao, G-.M, Miao, Li-Na,. Ji,, G-J, Hai-Feng, Z. & Shu-Cai, G. (2009). Preparation and characterization of silica aerogels from oil shale ash. Mat Lett, 63, 2721–2724. [5] Gui-Mei, G., Hai-Feng, Z., Shu-Cai, G., Zhao-Jun, L., Bai-Chao, A., Ji-Jin, X. & Guang-Huan L (2009) Preparation and properties of silica nanoparticles from oil shale ash. Powder Technol, 191, 47–51. [6] Petkowicz, D. I, Rigo R. T., Radtke, C., Peigher, S. B &, dos Santos & J. H. Z. (2008). Zeolite NaA from Brazilian chrysotile and rice husk. Micropor Mesopor Mater., 116(1-3), 548-554. [7] Polshettiwar, V., Cha, D., Zhang, X. & Basset, J. M. (2010). High surface area silica nanospheres (KCC-1)
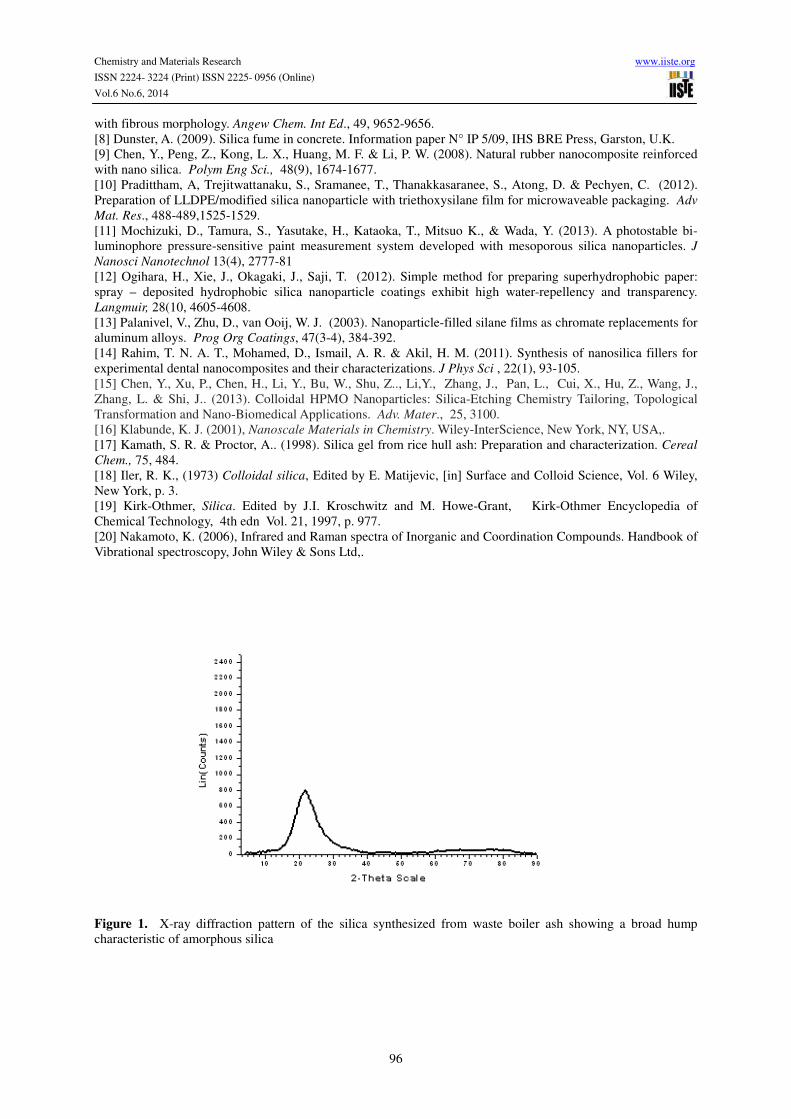
Chemistry and Materials Research www.iiste.org
ISSN 2224- 3224 (Print) ISSN 2225- 0956 (Online)
Vol.6 No.6, 2014
96
with fibrous morphology. Angew Chem. Int Ed., 49, 9652-9656. [8] Dunster, A. (2009). Silica fume in concrete. Information paper N° IP 5/09, IHS BRE Press, Garston, U.K. [9] Chen, Y., Peng, Z., Kong, L. X., Huang, M. F. & Li, P. W. (2008). Natural rubber nanocomposite reinforced with nano silica. Polym Eng Sci., 48(9), 1674-1677. [10] Pradittham, A, Trejitwattanaku, S., Sramanee, T., Thanakkasaranee, S., Atong, D. & Pechyen, C. (2012). Preparation of LLDPE/modified silica nanoparticle with triethoxysilane film for microwaveable packaging. Adv
Mat. Res., 488-489,1525-1529. [11] Mochizuki, D., Tamura, S., Yasutake, H., Kataoka, T., Mitsuo K., & Wada, Y. (2013). A photostable bi-luminophore pressure-sensitive paint measurement system developed with mesoporous silica nanoparticles. J
Nanosci Nanotechnol 13(4), 2777-81 [12] Ogihara, H., Xie, J., Okagaki, J., Saji, T. (2012). Simple method for preparing superhydrophobic paper: spray – deposited hydrophobic silica nanoparticle coatings exhibit high water-repellency and transparency. Langmuir, 28(10, 4605-4608. [13] Palanivel, V., Zhu, D., van Ooij, W. J. (2003). Nanoparticle-filled silane films as chromate replacements for aluminum alloys. Prog Org Coatings, 47(3-4), 384-392. [14] Rahim, T. N. A. T., Mohamed, D., Ismail, A. R. & Akil, H. M. (2011). Synthesis of nanosilica fillers for experimental dental nanocomposites and their characterizations. J Phys Sci , 22(1), 93-105. [15] Chen, Y., Xu, P., Chen, H., Li, Y., Bu, W., Shu, Z.., Li,Y., Zhang, J., Pan, L., Cui, X., Hu, Z., Wang, J., Zhang, L. & Shi, J.. (2013). Colloidal HPMO Nanoparticles: Silica-Etching Chemistry Tailoring, Topological Transformation and Nano-Biomedical Applications. Adv. Mater., 25, 3100. [16] Klabunde, K. J. (2001), Nanoscale Materials in Chemistry. Wiley-InterScience, New York, NY, USA,. [17] Kamath, S. R. & Proctor, A.. (1998). Silica gel from rice hull ash: Preparation and characterization. Cereal
Chem., 75, 484. [18] Iler, R. K., (1973) Colloidal silica, Edited by E. Matijevic, [in] Surface and Colloid Science, Vol. 6 Wiley, New York, p. 3. [19] Kirk-Othmer, Silica. Edited by J.I. Kroschwitz and M. Howe-Grant, Kirk-Othmer Encyclopedia of Chemical Technology, 4th edn Vol. 21, 1997, p. 977. [20] Nakamoto, K. (2006), Infrared and Raman spectra of Inorganic and Coordination Compounds. Handbook of Vibrational spectroscopy, John Wiley & Sons Ltd,.
Figure 1. X-ray diffraction pattern of the silica synthesized from waste boiler ash showing a broad hump characteristic of amorphous silica
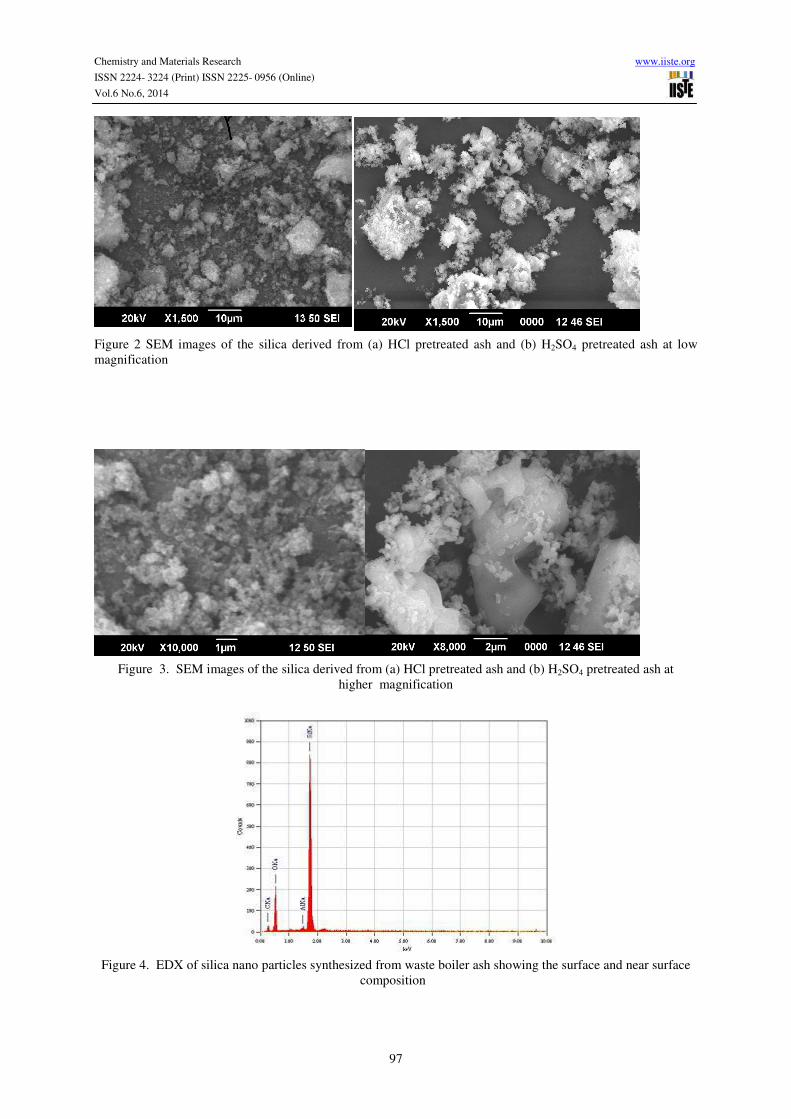
Chemistry and Materials Research www.iiste.org
ISSN 2224- 3224 (Print) ISSN 2225- 0956 (Online)
Vol.6 No.6, 2014
97
Figure 2 SEM images of the silica derived from (a) HCl pretreated ash and (b) H2SO4 pretreated ash at low magnification
Figure 3. SEM images of the silica derived from (a) HCl pretreated ash and (b) H2SO4 pretreated ash at
higher magnification
Figure 4. EDX of silica nano particles synthesized from waste boiler ash showing the surface and near surface
composition
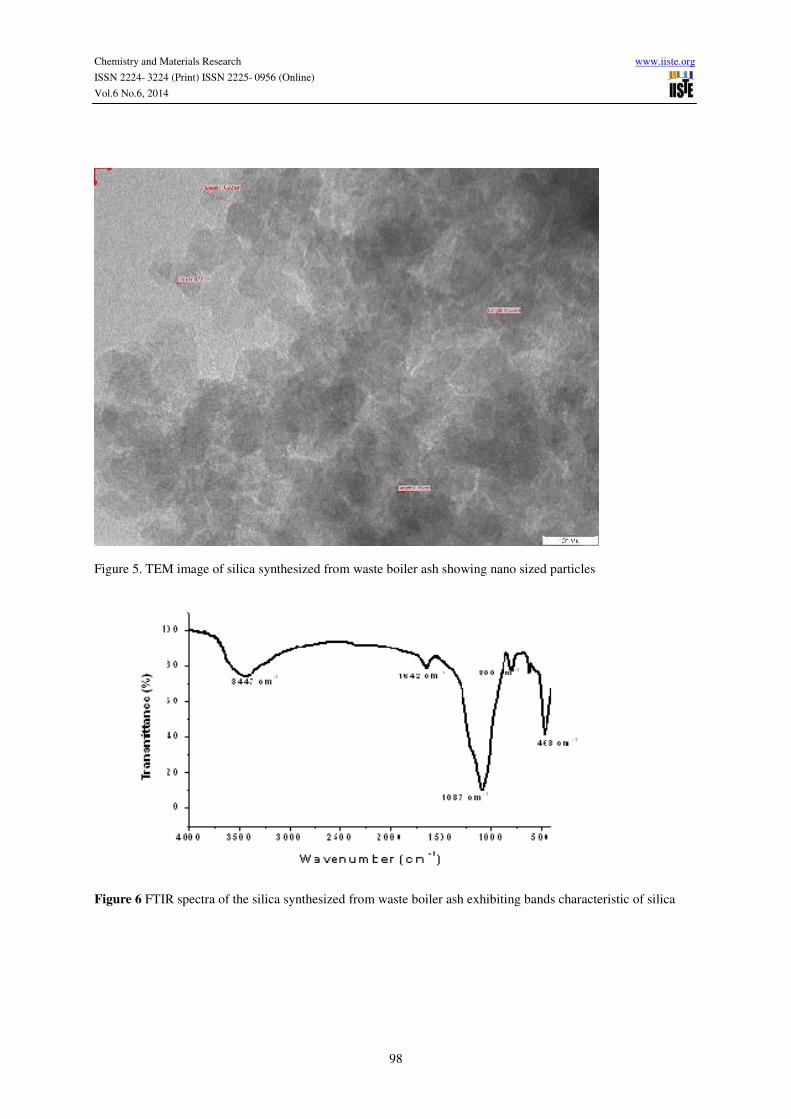
Chemistry and Materials Research www.iiste.org
ISSN 2224- 3224 (Print) ISSN 2225- 0956 (Online)
Vol.6 No.6, 2014
98
Figure 5. TEM image of silica synthesized from waste boiler ash showing nano sized particles
Figure 6 FTIR spectra of the silica synthesized from waste boiler ash exhibiting bands characteristic of silica
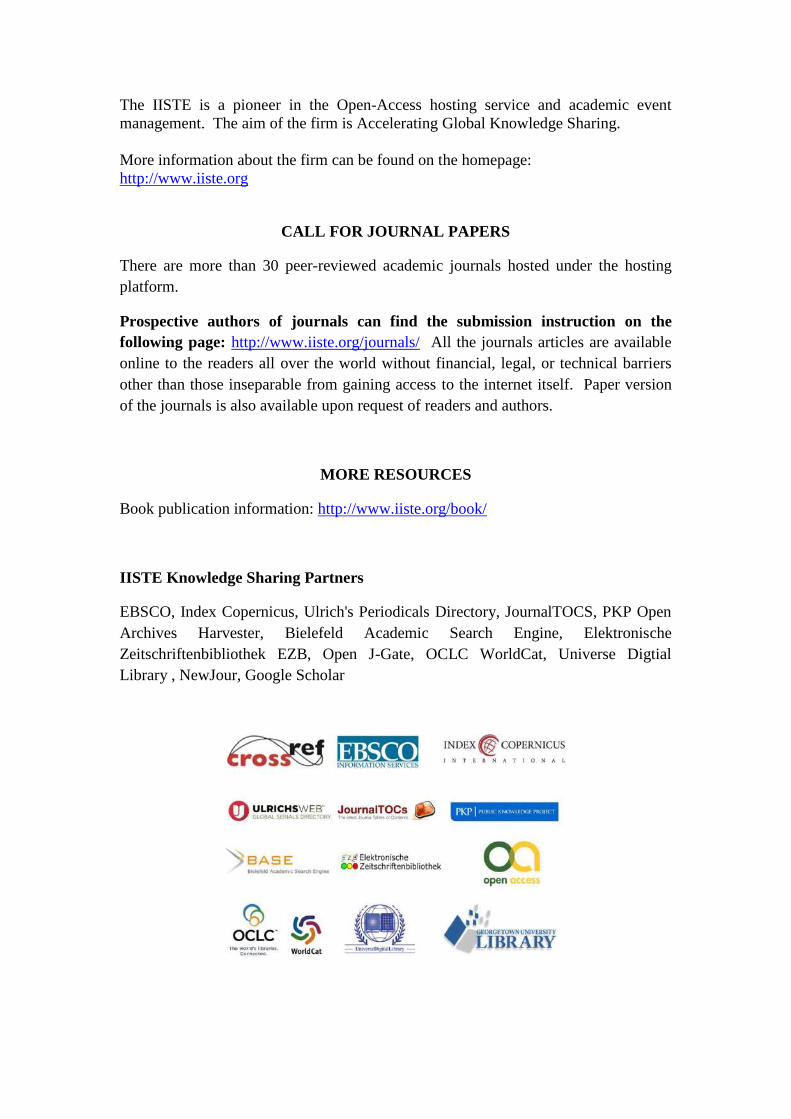
The IISTE is a pioneer in the Open-Access hosting service and academic event
management. The aim of the firm is Accelerating Global Knowledge Sharing.
More information about the firm can be found on the homepage:
http://www.iiste.org
CALL FOR JOURNAL PAPERS
There are more than 30 peer-reviewed academic journals hosted under the hosting
platform.
Prospective authors of journals can find the submission instruction on the
following page: http://www.iiste.org/journals/ All the journals articles are available
online to the readers all over the world without financial, legal, or technical barriers
other than those inseparable from gaining access to the internet itself. Paper version
of the journals is also available upon request of readers and authors.
MORE RESOURCES
Book publication information: http://www.iiste.org/book/
IISTE Knowledge Sharing Partners
EBSCO, Index Copernicus, Ulrich's Periodicals Directory, JournalTOCS, PKP Open
Archives Harvester, Bielefeld Academic Search Engine, Elektronische
Zeitschriftenbibliothek EZB, Open J-Gate, OCLC WorldCat, Universe Digtial
Library , NewJour, Google Scholar
Scanned by CamScanner
Scanned by CamScanner
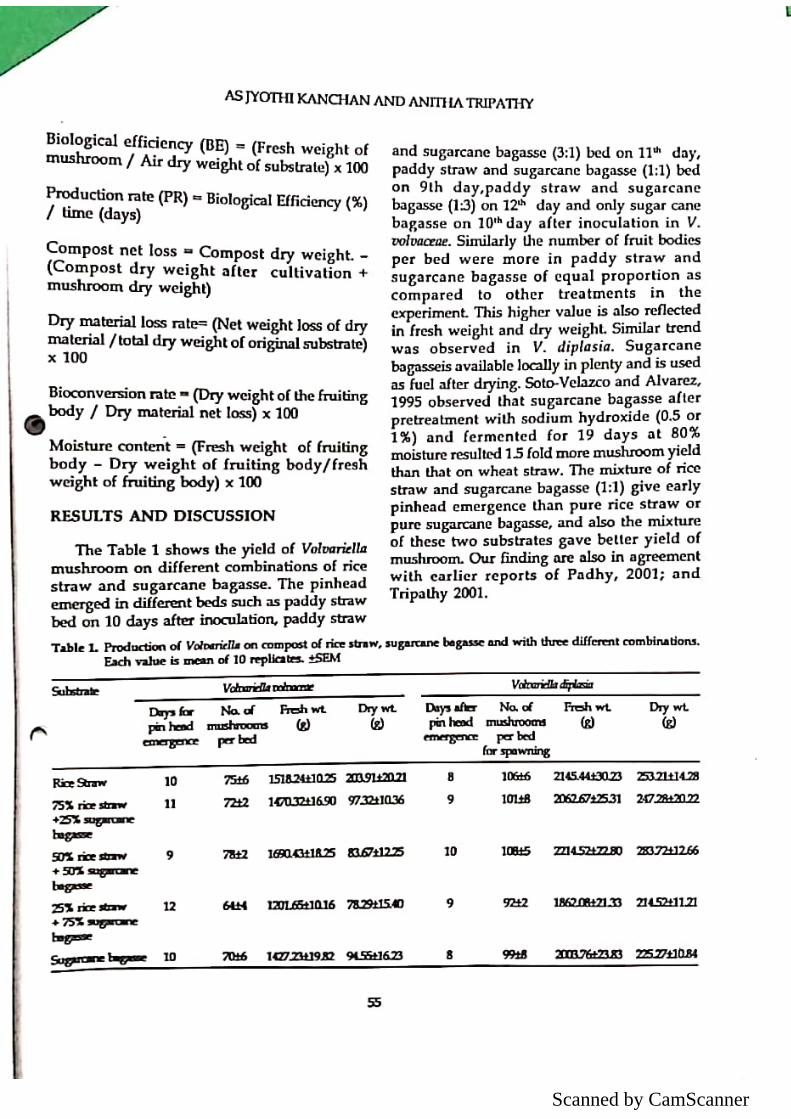
Scanned by CamScanner
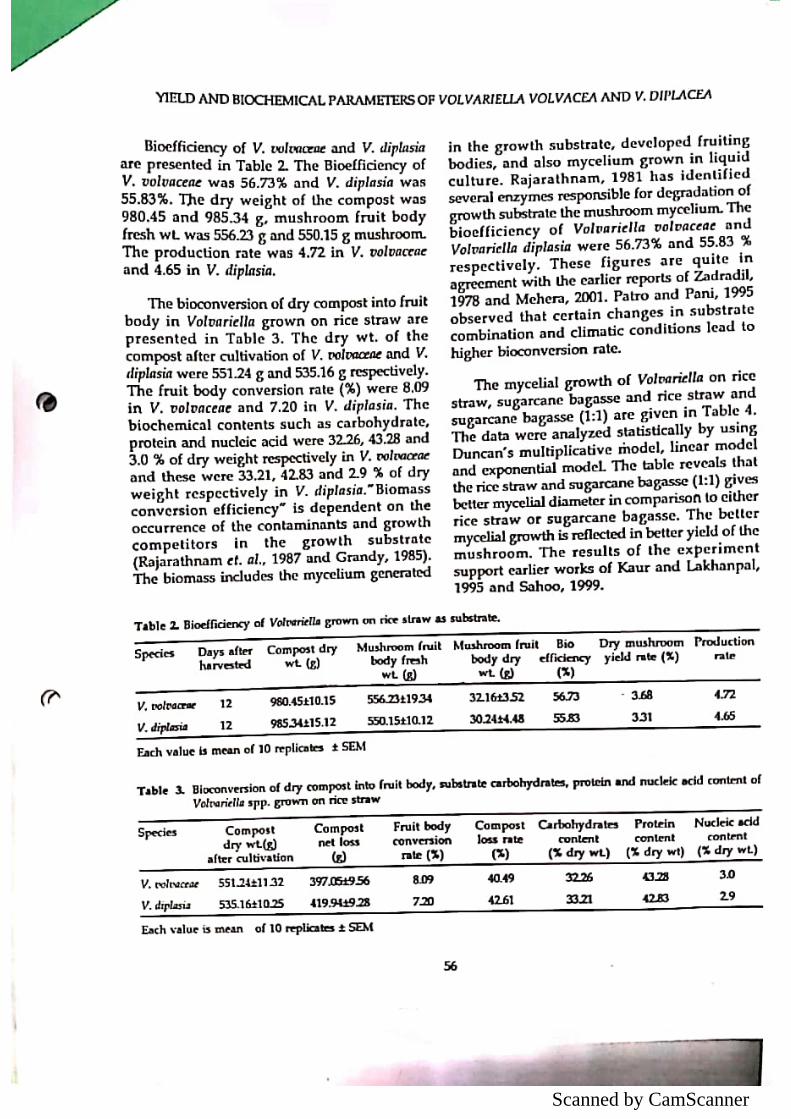
Scanned by CamScanner
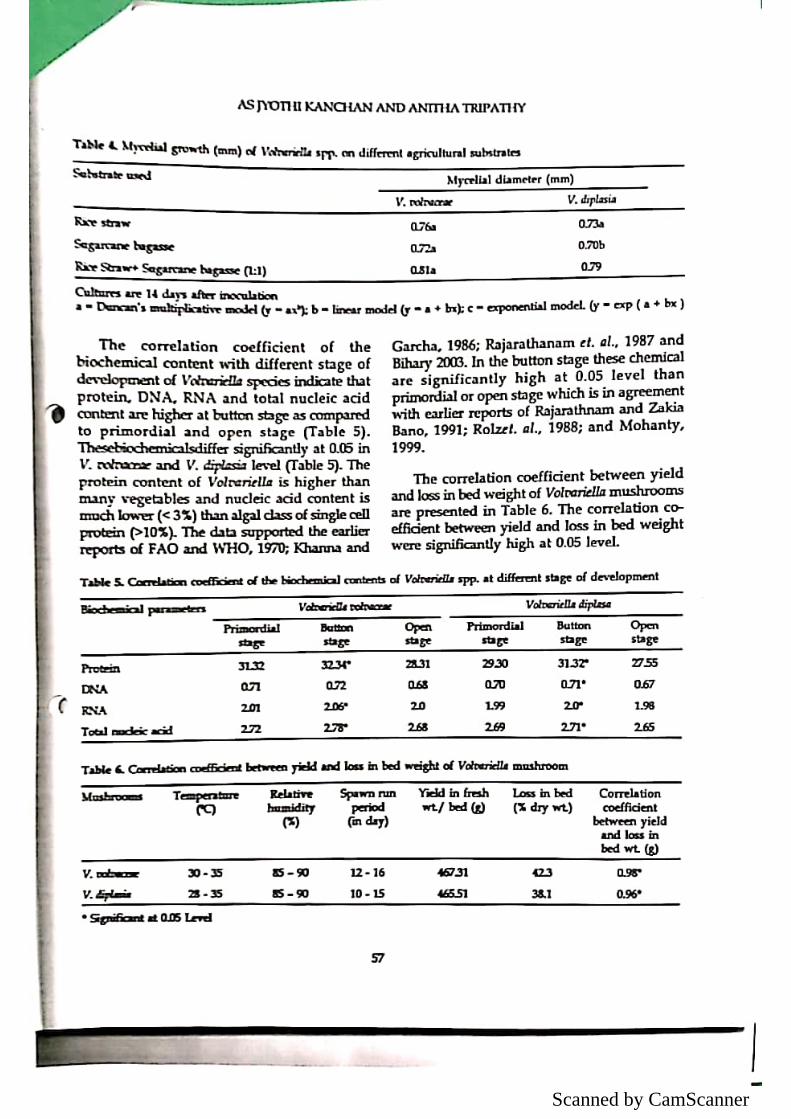
Scanned by CamScanner
Scanned by CamScanner
Scanned by CamScanner
Scanned by CamScanner
Scanned by CamScanner
Scanned by CamScanner
Scanned by CamScanner

Scanned by CamScanner
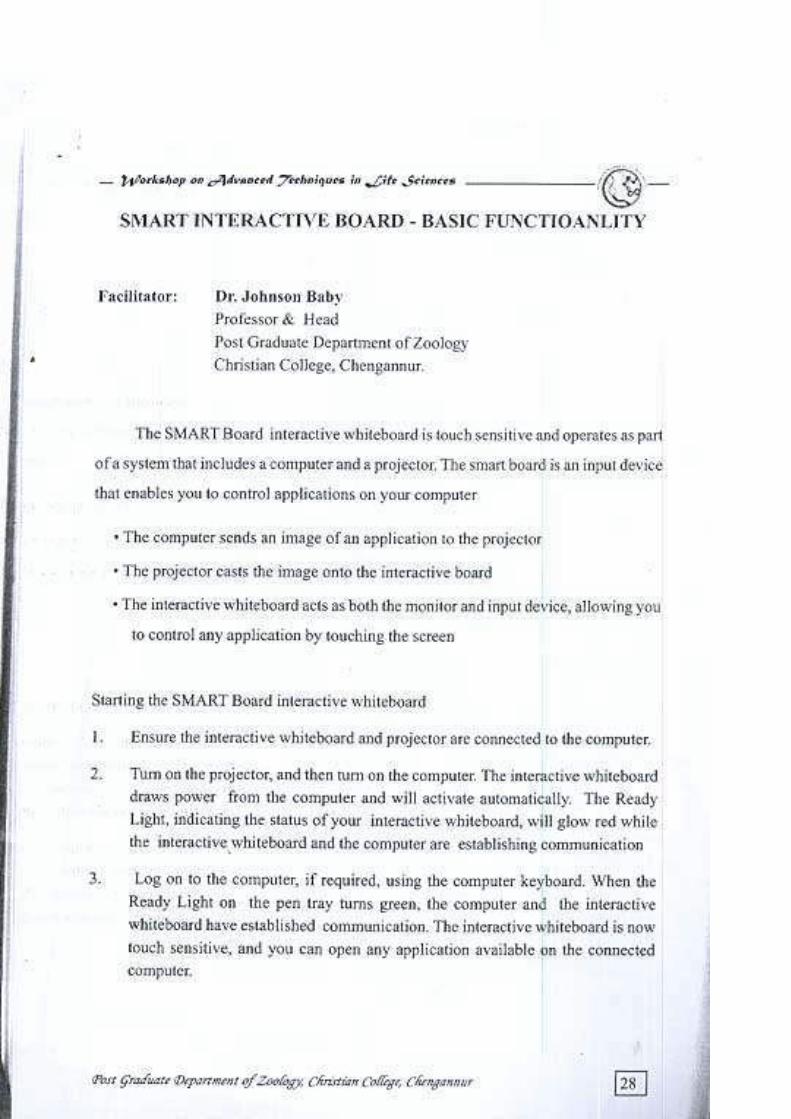
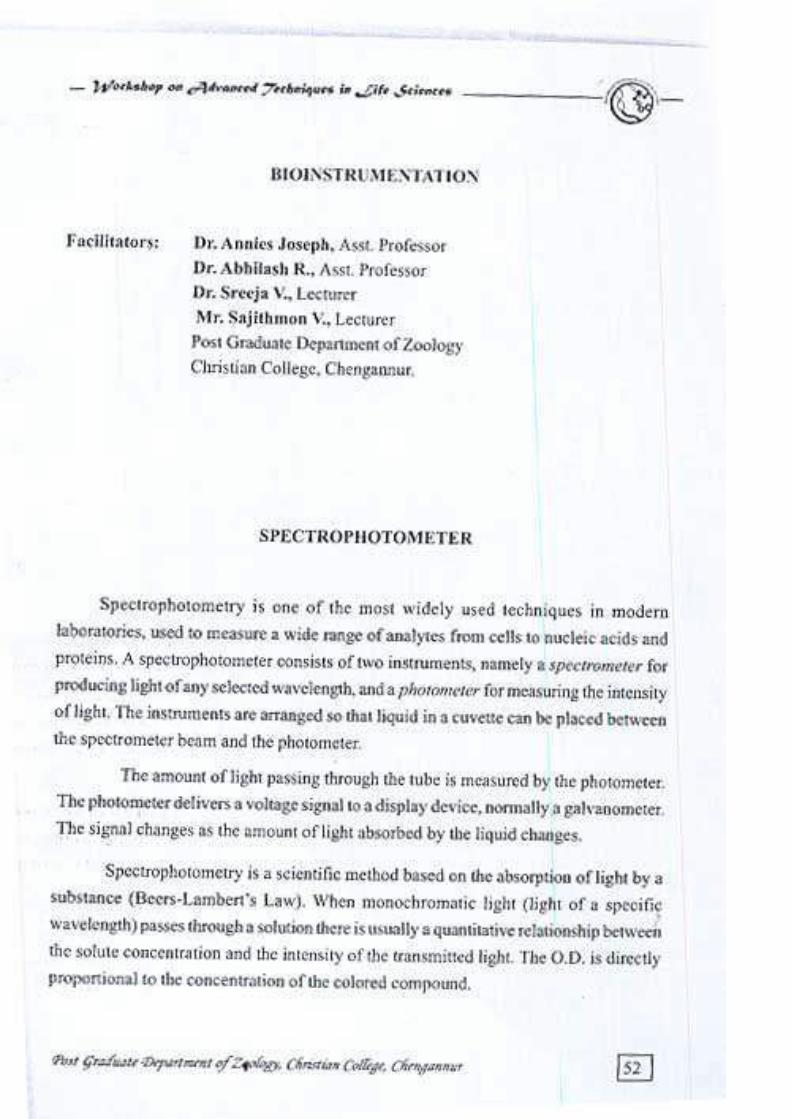
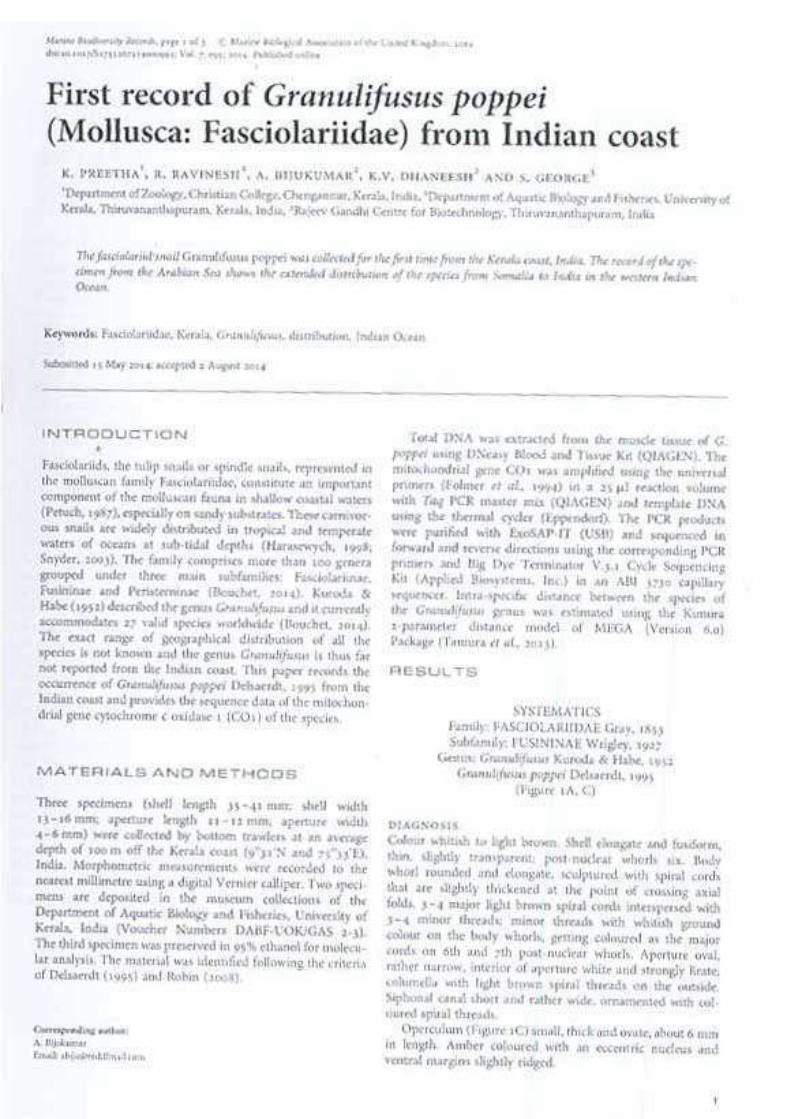
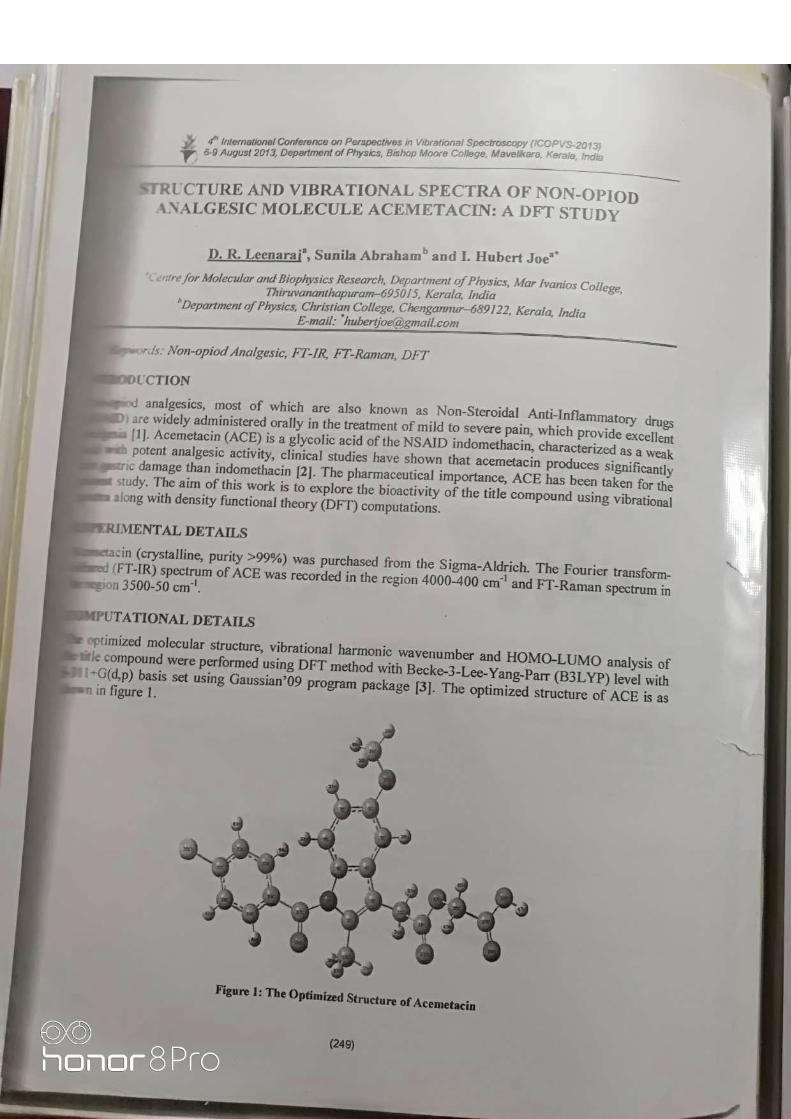

This content has been downloaded from IOPscience. Please scroll down to see the full text.
Download details:
IP Address: 117.211.57.221
This content was downloaded on 04/01/2016 at 04:36
Please note that terms and conditions apply.
Effect of Thermal Radiations on Performance of Solar Cells
View the table of contents for this issue, or go to the journal homepage for more
2013 IOP Conf. Ser.: Mater. Sci. Eng. 43 012008
(http://iopscience.iop.org/1757-899X/43/1/012008)
Home Search Collections Journals About Contact us My IOPscience
Effect of Thermal Radiations on Performance of Solar Cells Jacob George, Jiju Sasikumar and R. Jayakrishnan* Department of Physics, Christian College, Angadical P.O., Chengannur, Kerala-689122, India E-mail: [email protected]
Abstract. The effect of grain boundaries on the photovoltaic effect across the grain boundary of two different materials constituting a p-n junction has been studied theoretically. It is found theoretically that the presence of the grain boundary affect the open circuit voltage of the solar cell. It is observed that as the grain boundary potential increases the open circuit voltage decreases.
1. Introduction As made clear by numerous electron microscope studies, an important structural characteristic of a polycrystalline film is the presence of 'grain boundaries' which separate small single crystal regions with in the film. [1-3] In other words, the film consists of a conglomeration of tiny single crystals with sizes which lie typically within the range 10 nano-meter to 10 micro-meter. Generally the individual crystallizes are slightly misaligned with respect to each other so that the boundaries contain high densities of dislocations and so-called 'dangling bonds ( atoms not properly chemically bonded).[4-6] These interface regions contain a high density of electron states which trap electron charge and result in band-bending within the crystal grains. At normal temperatures where the shallow donor atoms are thermally ionized, free electrons exist in the conduction band of the grain material and are able to move freely with in the grains. [7] Some of these will reach the grain boundaries where they may be captured by interface states, becoming spatially localized in the process. [8] This fixed negative charge has the property of repelling free electrons from the region of the grain close to the interface and give rise to a depletion region similar to that associated with a Schottky barrier contact to a semiconductor. In terms of the conduction band energy, the depleted region is characterized by the band-bending. [8, 9] The separation between the conduction band E c and the Fermi level E f increases consistent with the reduction in free carrier density in this region-remember that
n = N c exp – ( E c –E f)/ kT (1)
If N is the density of donors and Nô is the interface trap states then band bending Φ b is given by
Φ b = e 2 NW2/2 εε0 (2)
where W is the extend of the depletion region because of the grain boundary potential. [10, 11] 2. Modelling We consider a p type and n type semiconductor material fused to form a p-n junction. Along the junction we can assume a spatial homogeneity in the formation of the dead layer. The grains of the p-type and n-type material can be assumed to have potentials of their own. We can assume that the transport across the barrier set up by the grain boundary in this hetero-structure potential is composed of 3 sequential steps: 1) Drift diffusion in the depletion region of the grain boundary potential 2) Thermionic emission at the boundary plain and 3) followed by drift diffusion into the depletion layer of the junction.
The relation for band bending at an interface is given by equation (1). First when there is a drift diffusion transport in the grain the steady state current under these condition depend on the quasi fermi
National Seminar on Current Trends in Materials Science (CTMS-2011) IOP PublishingIOP Conf. Series: Materials Science and Engineering 43 (2013) 012008 doi:10.1088/1757-899X/43/1/012008
Published under licence by IOP Publishing Ltd 1
level on the either side of the depletion region namely Enn & Epn .This is followed by thermionic transfer across the boundary plane which depends on the quasi-fermi level on either side of the plane namely Enn and Epn.. Finally there is a drift diffusion transport depending on the quasi fermi levels and Epn . These 3 solutions coupled by the unknown quasi fermi level on either sides of the boundary are limited by the same current density in all 3 regions. Transport in the n type material can be expressed in terms of the gradient
Jd =en µn (dEnn / db) (3)
where Jd is the conventional current density following from right to left. The concentration of electrons n can be expressed in terms of quasi fermi level and the effective density of states in the C.B. by the results
n = Nc exp(-e[ Epn(x ) –Ef (x)] / kT ) (4)
Using equation (4) in equation (3) and integrating between the limit 0 to b, we can write
Jd’ = (µNckT/ I’) [exp( e Φ b / kT) – exp(eEf’ / kT)] (5)
Where Jd’ is the diffusion current density in the n type material and is I’ is defined by,
I’=0∫b exp(e Enn (x ) / kT)dx (6)
Similarly for the p type material we can write that,
Jd’’=( µNckT/ I’’)[ exp(eEf” / kT) –1)] (7)
Where Jd’’ is the diffusion current density on the p type material and
I”=0∫a exp(e Epn(x ) / kT)dx (8)
3. Results and Discussion Elementary kinetic theory tells that flux incident on a boundary plane is (nÛ/4),where Û is the electron mean thermal velocity. The next thermionic current density is directed from the n type material to the p type material and can be given by (Û(nn– np)e/4),where nn and np are concentration of electrons on the right and left side of the grain boundary potential. The next thermionic current density can be approximated to
J t = (1–c/2) eNc û /4 exp(-e Φ b / kT) [exp( eEf ‘ / kT) – exp(eEf
”/kT)] (9)
where c is the fraction of thermionic flux from the either side of the boundary which is trapped at the grain boundary. Continuity equation requires that,
J t=J=[eNc V’/(1+ V’/ V d)] exp(-e Φ b / kT) (10)
where V’= (1–c/2)û /4 ) is termed the re combination velocity and Vd is defined as
V d=[(e/ µkT) (I”+I’)exp(-e Φ b / kT)]-1 (11)
National Seminar on Current Trends in Materials Science (CTMS-2011) IOP PublishingIOP Conf. Series: Materials Science and Engineering 43 (2013) 012008 doi:10.1088/1757-899X/43/1/012008
2
Equation (10) represents the current density through a grain boundary because of a voltage drop across it. This includes both drift diffusion and thermionic emission. It also shows that the current density is reduced because of the presence of a grain boundary potential. This shows that the total current density is the sum of the conventional current density Jd and thermionic current density J t. The maximum current density is achieved when the band bending is equal to Ô b max. Under this condition the photovoltaic effect is increased. We have shown that the current through the junction is reduced considerably compared to that of the current produced due to the thermo photo voltaic effect of the grain boundary. For sufficiently large grain boundary potential the drift velocity can be approximated as
V d=µe N d / ε(ab/a+b) (12)
This equation can be expressed in terms of the barrier height Φ b and the open circuit voltage for solar cell as
V d=µ (2e N d/ å) 1/2 (Φ b) 1/2(Φ b+ Voc) 1/2/ (Φ b) 1/2+( Φ b + Voc) ½ (13)
The open circuit voltage,
Voc =(kT/q) ln Δn(0)[ N d + Δp(0)] / n i 2 (14)
where n i is the intrinsic carrier concentration and Än & Äp represent the change in carrier concentration because of illumination by a flux. We know that,
Φ b = Q b 2
/8ε q N d (15)
So that (14) can be rewritten as
Voc = (kT/q) ln Δn(0) [ Q b 2
/8εq Ô b + Δp(0)] / n i 2 (16)
The above equation shows that as the grain boundary potential increases Voc is reduced.
4. Conclusions The effect of grain boundary potential on the electrical parameters of the solar cells was studied in this work. In this work it has been theoretically proved that the total current density was reduced because of the presence of grain boundary potential. We have shown that the current through the junction is reduced considerably compared to that of the current produced due to the thermo photo voltaic effect of the grain boundary. Therefore we conclude that to increase the efficiency of the solar cell, the thermal radiation must be reflected from the solar cell.
References 1. A.J. Diefenderfer, Principles of Electronic Instrumentation, Saunders, 1979 (Chapter 5). 2. H.V. Malmstadt et al., Electronic Measurements for Scientists, Benjamin, Menlo Park, 1974
(Section 2-1). 3. J. Millman and C.C. Halkias, Integrated Electronics: Analog and Digital Circuits and Systems,
McGraw-Hill, N.Y., 1972 (Chapters 1 and 2). 4. R.J. Smith, Electronics: Circuits and Devices, Wiley, N.Y., 1973 (Chapter 5). 5. Y. Zohta, Solid-State Electron.16, 1029-1034 (1973) 6. R. J. Tocci and M.E. Oliver, Fundamentals of Electronic Devices, Fourth Edition, Merrill,
N.Y., 1991, (Chapter 5) p. 143
National Seminar on Current Trends in Materials Science (CTMS-2011) IOP PublishingIOP Conf. Series: Materials Science and Engineering 43 (2013) 012008 doi:10.1088/1757-899X/43/1/012008
3

7. FJ Humphreys, M Hatherly (2004). Recrystallisation and related anealing phenomena. Elsevier. AP Sutton, RW Balluffi (1987). "Overview no. 61: On geometric criteria for low interfacial energy". Acta Metallurgica 35 (9): 2177–2201.
8. RD Doherty; DA Hughes; FJ Humphreys; JJ Jonas; D Juul Jenson; ME Kassner; WE King; TR McNelley; HJ McQueen; AD Rollett, "Current Issues In Recrystallisation: A Review". Materials Science and Engineering A238: 219–274 (1997).
9. G Gottstein, LS Shvindlerman, Grain Boundary Migration in Metals: Thermodynamics, Kinetics, Applications, 2nd Edition. CRC Press(2009) p. 245
10. S. S. Simeonov, Phy. Rev.B 36, 9171-79 (1987) 11. P. de Mierry, O.Ambacher, H.Kratzer and M.Stutzmann, Phys. Status Solidi A158, 597-603
(1996).
National Seminar on Current Trends in Materials Science (CTMS-2011) IOP PublishingIOP Conf. Series: Materials Science and Engineering 43 (2013) 012008 doi:10.1088/1757-899X/43/1/012008
4

Scanned by CamScanner
Scanned by CamScanner
Scanned by CamScanner
Scanned by CamScanner
Scanned by CamScanner
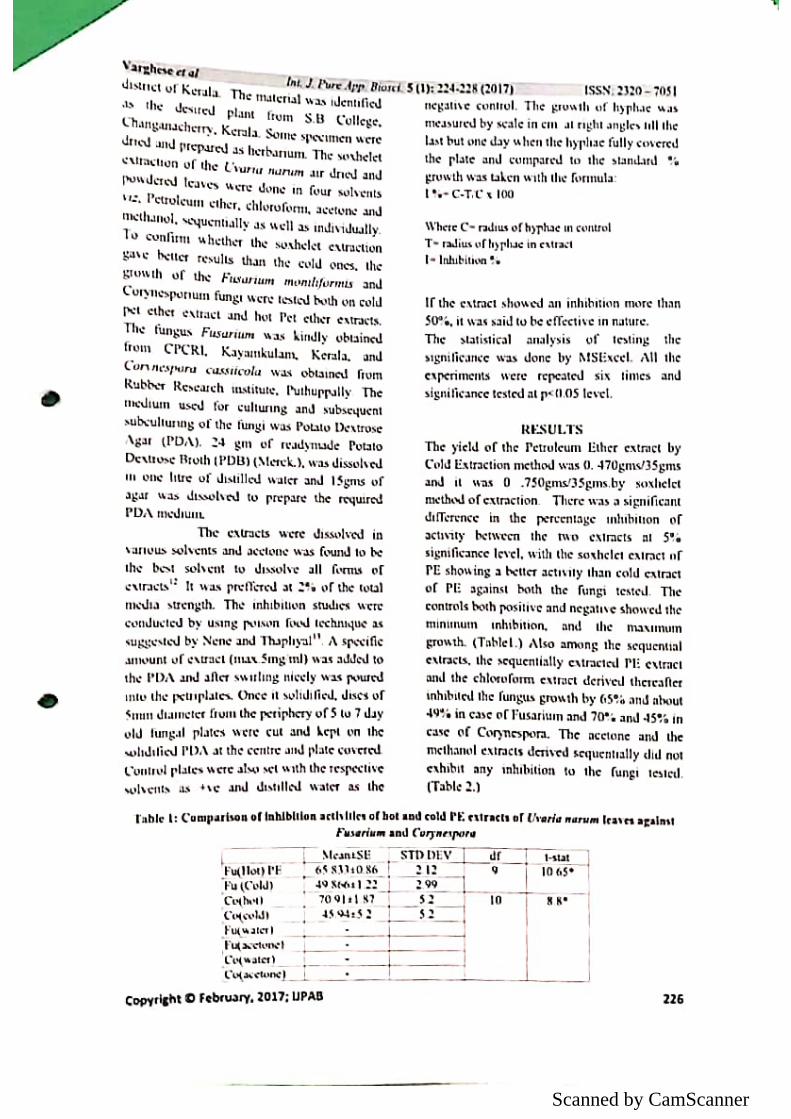
Scanned by CamScanner
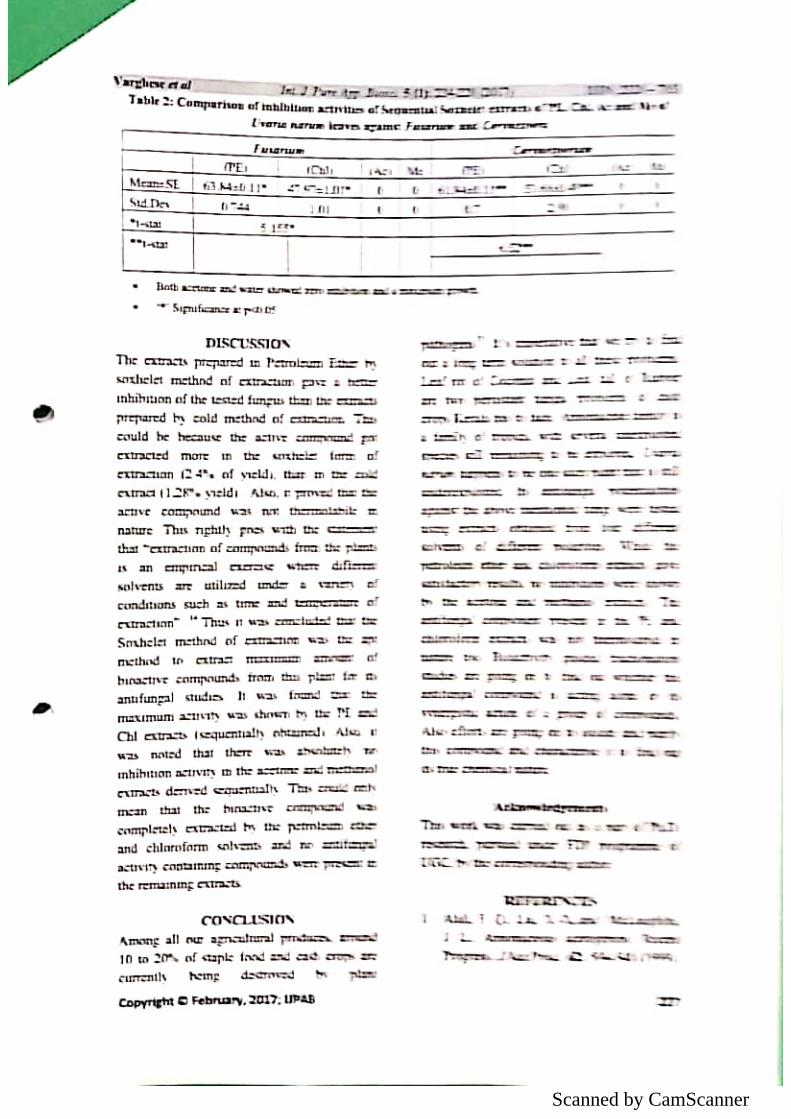
Scanned by CamScanner
Scanned by CamScanner
Scanned by CamScanner
Scanned by CamScanner
Scanned by CamScanner
Scanned by CamScanner
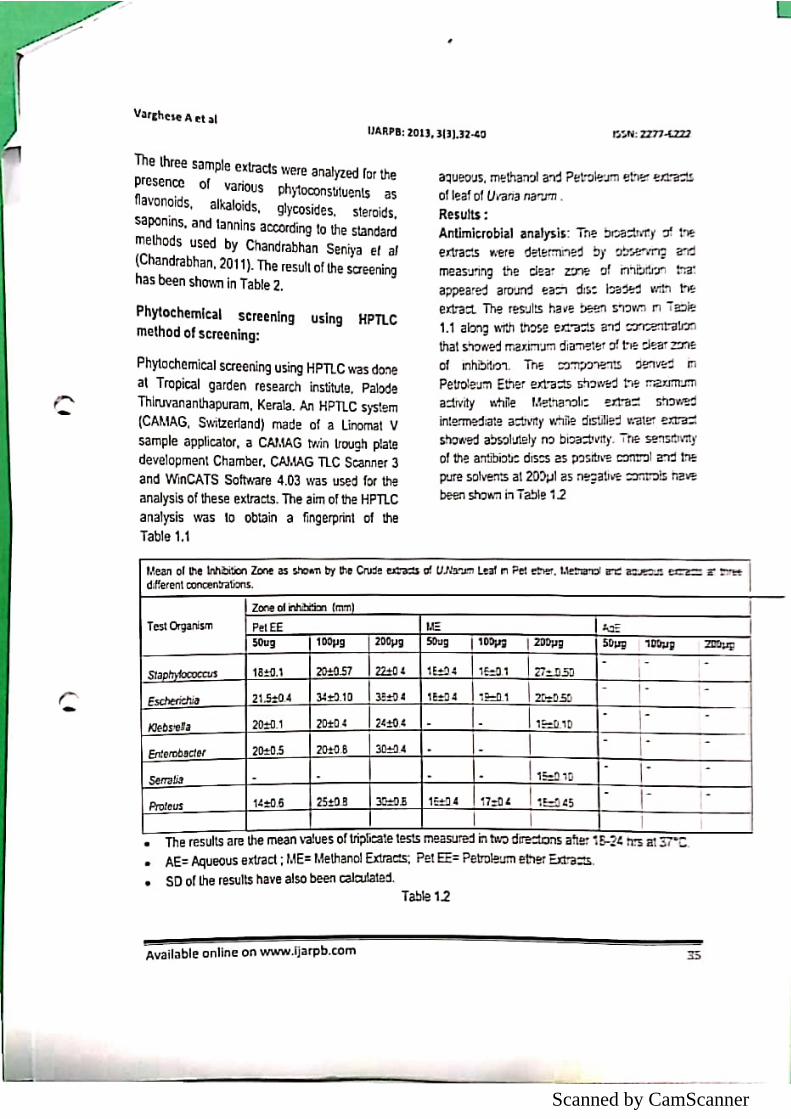
Scanned by CamScanner
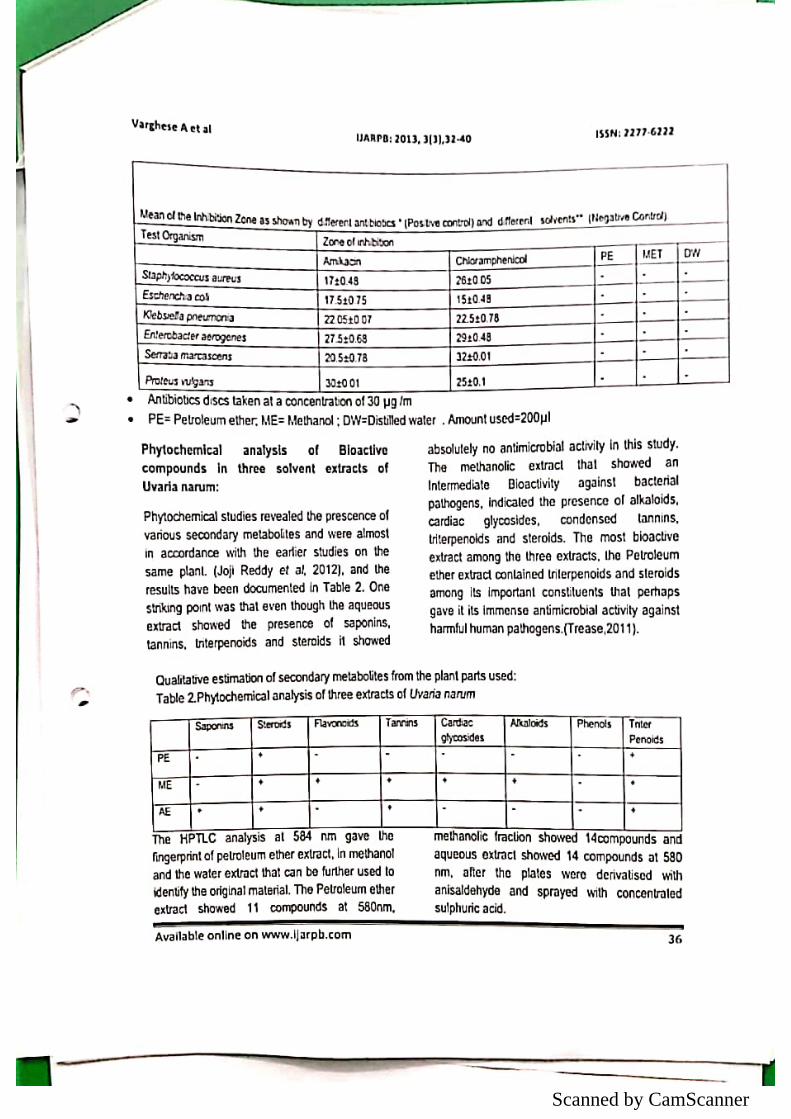
Scanned by CamScanner
Scanned by CamScanner
Scanned by CamScanner
Open Access Library Journal
How to cite this paper: Jayakrishnan, R. (2015) Aluminum Doped ZnO Thin Films Using Chemical Spray Pyrolysis. Open Access Library Journal, 2: e2108. http://dx.doi.org/10.4236/oalib.1102108
Aluminum Doped ZnO Thin Films Using Chemical Spray Pyrolysis Ramakrishnan Jayakrishnan Department of Physics, Christian College, Kerala, India
Received 12 November 2015; accepted 27 November 2015; published 2 December 2015
Copyright © 2015 by author and OALib. This work is licensed under the Creative Commons Attribution International License (CC BY). http://creativecommons.org/licenses/by/4.0/
Abstract Aluminum doped ZnO thin films were grown using chemical spray pyrolysis. The doped films showed only blue and UV photoluminescence at room temperature. The position of the near band edge emission was found to agree with the theoretical value of ZnO nanocrystal band gap. The full width at half maximum for the near band edge emission at room temperature was found to be ~ 100 meV, which indicated films to be of very good device quality. The presence of a weak photo-luminescence at 3.08 ± 0.02 eV in the films was assigned to defect related emission. We had shown in this report that it was possible to increase the efficiency of the photoluminescence by increasing the substrate temperature used for film growth. The optimized films showed resistivity of 1.5 × 10⁻² Ω∙cm.
Keywords Thin films, Chemical Spray Pyrolysis, ZnO, Photoluminescence, Excitons Subject Areas: Analytical Chemistry
1. Introduction The past decade has witnessed a significant improvement in the quality of zinc oxide (ZnO) single-crystal sub-strates and epitaxial films as result of revival and rapid expansion of research on ZnO as a semiconductor [1]-[5]. The high electron mobility, high thermal conductivity, wide and direct band gap and large exciton binding energy make ZnO ideal for a wide range of device applications like transparent thin-film transistors, photode-tectors, light-emitting diodes and laser diodes that operate in the blue and ultraviolet region of the spectrum [6]-[12]. The free-exciton binding energy in ZnO is 60 meV [11] [12]. This large exciton binding energy indi-cates that efficient exciton emission in ZnO can persist at room temperature and higher [11] [12]. Since the os-cillator strength of excitons is typically much larger than that of direct electron-hole transitions in direct gap semiconductors, the large exciton binding energy makes ZnO a promising material for optical devices that are
R. Jayakrishnan
OALibJ | DOI:10.4236/oalib.1102108 2 December 2015 | Volume 2 | e2108
based on exciton effects [13]. Due to a strong luminescence in the green-white region of the spectrum, ZnO is also a suitable material for phosphor applications. The emission spectrum has a peak at 495 nm and a very broad half-width of 0.4 eV [14]. The origin of the luminescence center and the luminescence mechanism are not really understood, being frequently attributed to oxygen vacancies or zinc interstitials, without any clear evidence [14].
Most of the current technological applications of ZnO, such as varistors, transparent conductive electrodes for solar cells, piezoelectric devices and gas sensors, have made use of polycrystalline films that are grown by a va-riety of deposition techniques, mostly on glass substrates [15]. These techniques include chemical spray pyroly-sis, screen painting, electrochemical deposition, sol-gel synthesis and oxidation of Zn films, which are characte-rized by requiring relatively low temperatures for film growth [5] [8]-[14]. However, for electronic and optoe-lectronic applications, high-quality single-crystal epitaxial films with minimal concentrations of native defects and controlled impurity incorporation are required [16]. For these, optimized growth and processing environ-ments (partial pressures and temperature) are necessary. Current techniques that are recognized for this level of control include pulsed laser deposition (PLD), chemicalvapor deposition (CVD), metal-organic CVD (MOCVD) and molecular-beam epitaxy (MBE), and to a lesser extentsputtering [17]-[22]. Magnetron sputtering is recog-nized to be the most scalable technique, at the expense of lower crystalline quality, often resulting in columnar structures [15].
We have been optimizing Chemical Spray Pyrolysis (CSP) technique for the growth of different binary and ternary semiconductor thin films for solar cell applications [23] [24]. The (002) plane in ZnO is considered to be the most ideal growth plane for opto-electronic device fabrication [25]. In the present work, we report on the ef-fect of optimizing the substrate temperature, while maintaining the doping concentration and the spray rate to grow ZnO thin films with preferential orientation along the (002) plane using this technique. The optimized doping concentration is obtained through a detailed investigation reported earlier by us [5]. In the present work, we report on how we are able to improve the efficiency of near band edge (NBE) PL emission at room tempera-tureon optimally doped ZnO thin films. The full width at half maximum of the PL spectra gives characteristic information, which can be used to judge the sample quality [24]. Our results prove that CSP technique can be used to grow device quality ZnO films.
2. Experimental ZnO thin films were prepared by spraying a solution containing a mixture of zinc acetate (99.9%) dissolved in distilled water, propanol and acetic acid in the ratio 50:47.5:2.5 on to glass substrates maintained at a suitable temperature. All chemicals used were from Sigma Aldrich of AR grade. In our previous report we had con-cluded that Al doped ZnO thin films can be grown using CSP technique with preferential orientation along (002) plane when the spray rate was maintained at 1 ml/min and the doping concentration was 1% [5]. There, however, the films were of poor crystalline quality. The spray rate of 1 ml/min was hence used for injecting the precursor solution onto the substrate for all trials reported in this report. Doping of ZnO films was carried out by mixing suitable quantity of Al (NO3)3∙9H2O (99.90%) solution to the spray precursor solution. Al (NO3)3∙9H2O solution was prepared in the same molarity as the spray precursor solution and 1% volumetric doping of the spray pre-cursor solution was carried out for preparing all of the samples. Chemical Spray Pyrolysis was carried out using a unit developed in-house. The details of the experimental set up have been reported in detail by us [5] [24]. In each trail a sample was loaded with a mask so as to obtain a step profile. Then the thickness of the films was measuresd using a stylus surface profilometer (Dektak 6 M).
Structural analysis was done using X-ray diffraction (XRD) with a Rigaku (D.Max.C) X-ray diffractometer, having Cu Kα (λ = 1.5405 Å) radiation and Ni filter operated at 30 kV and 20 mA. Optical absorption and transmission studies were carried out using UV-Vis-NIR spectrophotometer (Hitachi U-3410 Model). Photolu-minescence studies were performed in an in-house assembled PL scanning system, by exciting the samples with 325 nm line of a He-Cd laser (Kimmon) and the emission spectrum was recorded using a USB2000 spectropho-tometer. Details of the PL system were reported by us [26]-[28]. Electrical measurements were carried out using silver contacts separated by a distance of 1 cm. In this study, the sheet resistivity is calculated by the following equation:
sR dρ = (1)
where ρ is the resistivity, Rs is the sheet resistance (Ω/sq) and d is the sample thickness.
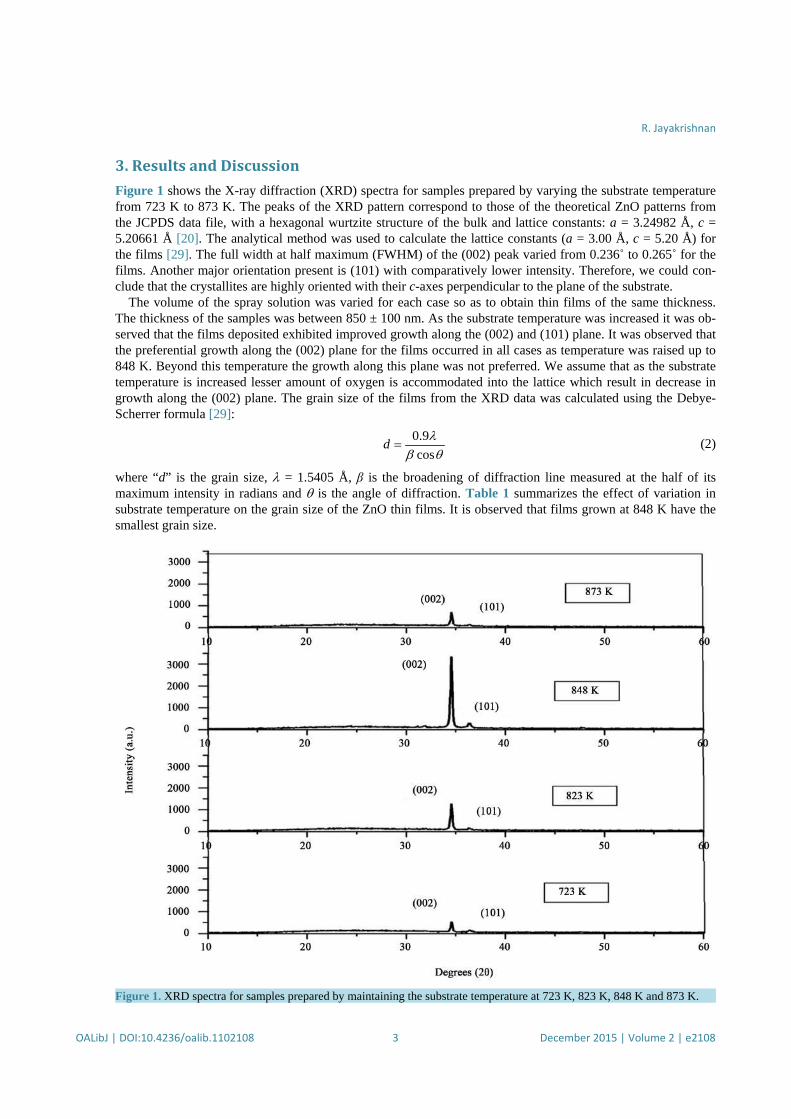
R. Jayakrishnan
OALibJ | DOI:10.4236/oalib.1102108 3 December 2015 | Volume 2 | e2108
3. Results and Discussion Figure 1 shows the X-ray diffraction (XRD) spectra for samples prepared by varying the substrate temperature from 723 K to 873 K. The peaks of the XRD pattern correspond to those of the theoretical ZnO patterns from the JCPDS data file, with a hexagonal wurtzite structure of the bulk and lattice constants: a = 3.24982 Å, c = 5.20661 Å [20]. The analytical method was used to calculate the lattice constants (a = 3.00 Å, c = 5.20 Å) for the films [29]. The full width at half maximum (FWHM) of the (002) peak varied from 0.236˚ to 0.265˚ for the films. Another major orientation present is (101) with comparatively lower intensity. Therefore, we could con-clude that the crystallites are highly oriented with their c-axes perpendicular to the plane of the substrate.
The volume of the spray solution was varied for each case so as to obtain thin films of the same thickness. The thickness of the samples was between 850 ± 100 nm. As the substrate temperature was increased it was ob-served that the films deposited exhibited improved growth along the (002) and (101) plane. It was observed that the preferential growth along the (002) plane for the films occurred in all cases as temperature was raised up to 848 K. Beyond this temperature the growth along this plane was not preferred. We assume that as the substrate temperature is increased lesser amount of oxygen is accommodated into the lattice which result in decrease in growth along the (002) plane. The grain size of the films from the XRD data was calculated using the Debye- Scherrer formula [29]:
0.9cos
d λβ θ
= (2)
where “d” is the grain size, λ = 1.5405 Å, β is the broadening of diffraction line measured at the half of its maximum intensity in radians and θ is the angle of diffraction. Table 1 summarizes the effect of variation in substrate temperature on the grain size of the ZnO thin films. It is observed that films grown at 848 K have the smallest grain size.
Figure 1. XRD spectra for samples prepared by maintaining the substrate temperature at 723 K, 823 K, 848 K and 873 K.
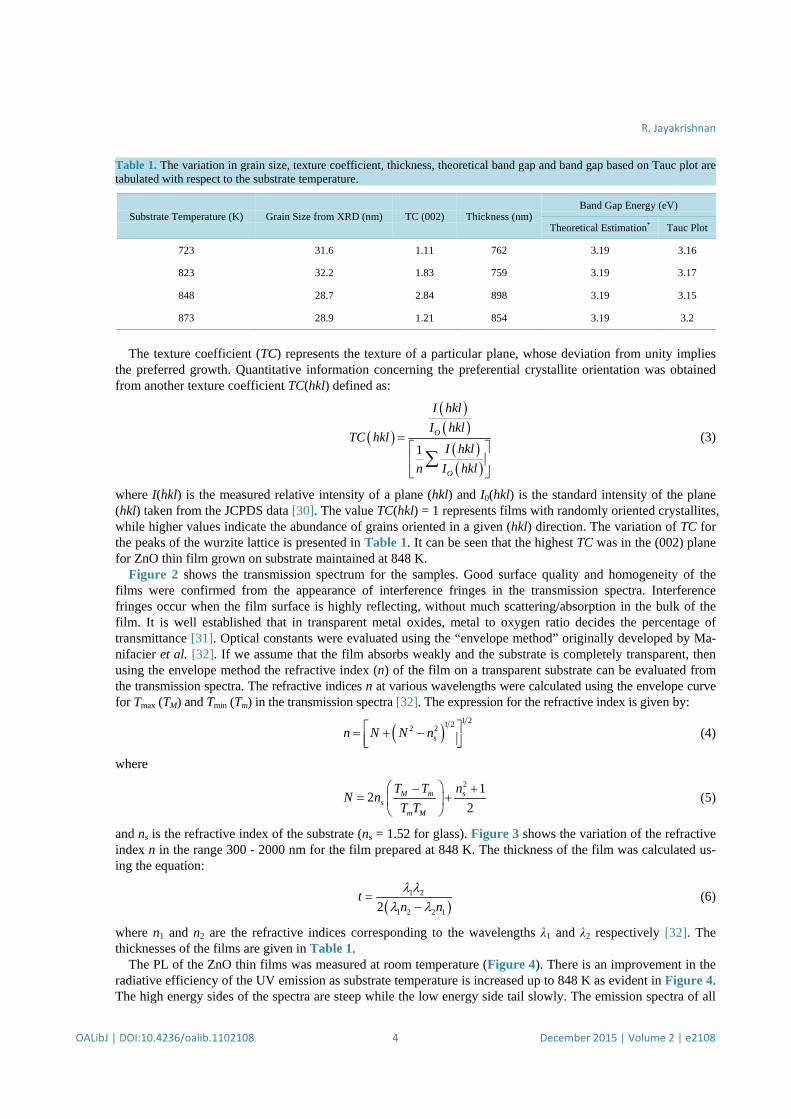
R. Jayakrishnan
OALibJ | DOI:10.4236/oalib.1102108 4 December 2015 | Volume 2 | e2108
Table 1. The variation in grain size, texture coefficient, thickness, theoretical band gap and band gap based on Tauc plot are tabulated with respect to the substrate temperature.
Substrate Temperature (K) Grain Size from XRD (nm) TC (002) Thickness (nm) Band Gap Energy (eV)
Theoretical Estimation* Tauc Plot
723 31.6 1.11 762 3.19 3.16
823 32.2 1.83 759 3.19 3.17
848 28.7 2.84 898 3.19 3.15
873 28.9 1.21 854 3.19 3.2
The texture coefficient (TC) represents the texture of a particular plane, whose deviation from unity implies
the preferred growth. Quantitative information concerning the preferential crystallite orientation was obtained from another texture coefficient TC(hkl) defined as:
( )
( )( )( )( )
1O
O
I hklI hkl
TC hklI hkl
n I hkl
= ∑
(3)
where I(hkl) is the measured relative intensity of a plane (hkl) and I0(hkl) is the standard intensity of the plane (hkl) taken from the JCPDS data [30]. The value TC(hkl) = 1 represents films with randomly oriented crystallites, while higher values indicate the abundance of grains oriented in a given (hkl) direction. The variation of TC for the peaks of the wurzite lattice is presented in Table 1. It can be seen that the highest TC was in the (002) plane for ZnO thin film grown on substrate maintained at 848 K.
Figure 2 shows the transmission spectrum for the samples. Good surface quality and homogeneity of the films were confirmed from the appearance of interference fringes in the transmission spectra. Interference fringes occur when the film surface is highly reflecting, without much scattering/absorption in the bulk of the film. It is well established that in transparent metal oxides, metal to oxygen ratio decides the percentage of transmittance [31]. Optical constants were evaluated using the “envelope method” originally developed by Ma-nifacier et al. [32]. If we assume that the film absorbs weakly and the substrate is completely transparent, then using the envelope method the refractive index (n) of the film on a transparent substrate can be evaluated from the transmission spectra. The refractive indices n at various wavelengths were calculated using the envelope curve for Tmax (TM) and Tmin (Tm) in the transmission spectra [32]. The expression for the refractive index is given by:
( )1 21 22 2
sn N N n = + − (4)
where 2 1
22
M m ss
m M
T T nN nT T
− += +
(5)
and ns is the refractive index of the substrate (ns = 1.52 for glass). Figure 3 shows the variation of the refractive index n in the range 300 - 2000 nm for the film prepared at 848 K. The thickness of the film was calculated us-ing the equation:
( )1 2
1 2 2 12t
n nλ λ
λ λ=
− (6)
where n1 and n2 are the refractive indices corresponding to the wavelengths λ1 and λ2 respectively [32]. The thicknesses of the films are given in Table 1.
The PL of the ZnO thin films was measured at room temperature (Figure 4). There is an improvement in the radiative efficiency of the UV emission as substrate temperature is increased up to 848 K as evident in Figure 4. The high energy sides of the spectra are steep while the low energy side tail slowly. The emission spectra of all
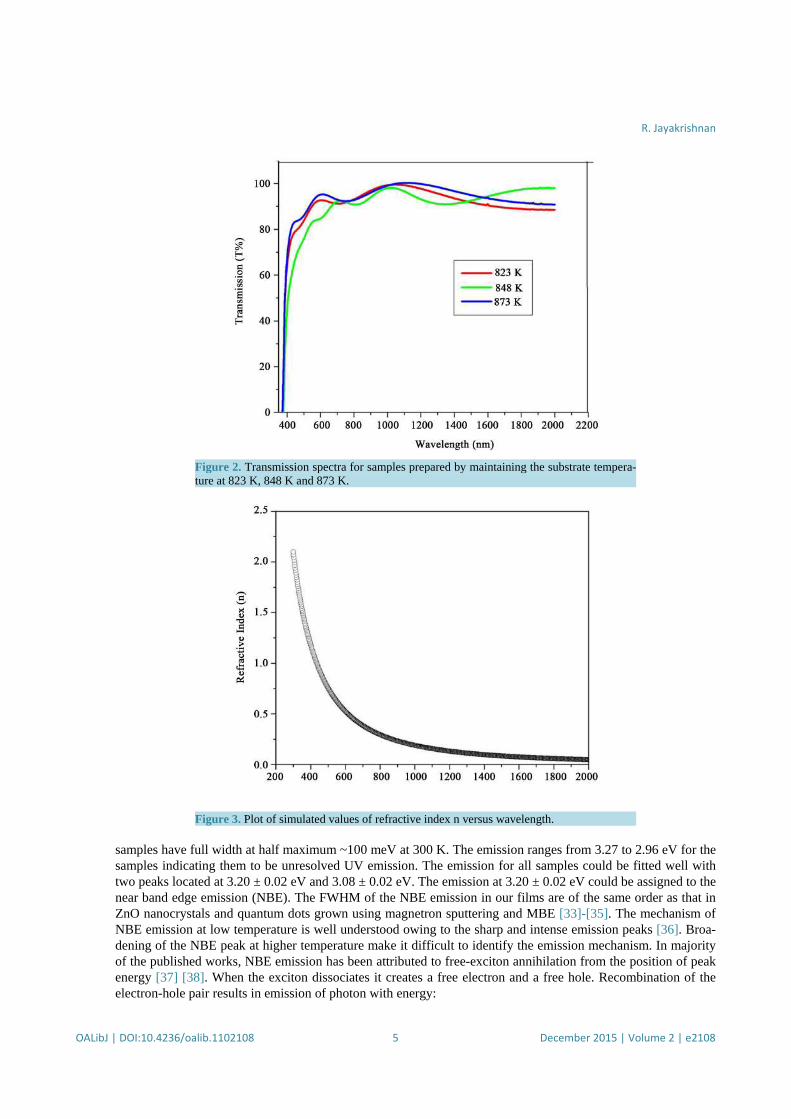
R. Jayakrishnan
OALibJ | DOI:10.4236/oalib.1102108 5 December 2015 | Volume 2 | e2108
Figure 2. Transmission spectra for samples prepared by maintaining the substrate tempera-ture at 823 K, 848 K and 873 K.
Figure 3. Plot of simulated values of refractive index n versus wavelength.
samples have full width at half maximum ~100 meV at 300 K. The emission ranges from 3.27 to 2.96 eV for the samples indicating them to be unresolved UV emission. The emission for all samples could be fitted well with two peaks located at 3.20 ± 0.02 eV and 3.08 ± 0.02 eV. The emission at 3.20 ± 0.02 eV could be assigned to the near band edge emission (NBE). The FWHM of the NBE emission in our films are of the same order as that in ZnO nanocrystals and quantum dots grown using magnetron sputtering and MBE [33]-[35]. The mechanism of NBE emission at low temperature is well understood owing to the sharp and intense emission peaks [36]. Broa-dening of the NBE peak at higher temperature make it difficult to identify the emission mechanism. In majority of the published works, NBE emission has been attributed to free-exciton annihilation from the position of peak energy [37] [38]. When the exciton dissociates it creates a free electron and a free hole. Recombination of the electron-hole pair results in emission of photon with energy:
PERSPECTIVES ONBIODIVERSITY OF INDIA
Volume I
Chief EditorsBiju Kumar, A., Rajendran, P.G. and Peethambaran, C.K.
Editors
Ajitkumar, K.G. and Pradeep, N.S.
Centre for Innovation in Science and Social Action
Perspectives on Biodiversity of IndiaVolume I
Chief EditorsBiju Kumar, A., Rajendran, P.G. and Peethambaran, C.K.
EditorsAjitkumar, K.G. and Pradeep, N.S.
Copyright © 2014, CISSA
The information contained in this book has been obtained from the papers presented in theSecond Indian Biodiversity Congress organised by Centre for Innovation in Science and SocialAction (CISSA) (Thiruvananthapuram), Institute of Ayurveda and Integrative Medicine (I-AIM)(Bangalore) and Navdanya (New Delhi) during 10-12 December 2012 at Indian Institute ofScience, Bangalore. But the authors/publisher cannot assume responsibility for the validity of allmaterials or the consequences of their use. The authors/ publisher have attempted to trace andacknowledge the materials reproduced in this publication and apologize if permission andacknowledgements to publish in this form have not been given. If any material has not beenacknowledged please write and let us know so we may rectify it.
First Published in 2014
ISBN 978-81-929896-0-0
Published by:
Centre for Innovation in Science and Social Action (CISSA),MBC-27, Museum Bains Compound, Nanthancode,Kowdiar P.O, Thiruvananthapuram- 695 003, Kerala, IndiaTelefax: +91 471-2722151Email: [email protected]; www.cissa.co.in
Citation for papers: Badheka, A.R., Parmar, M.J. and Jasari, Y.T. (2014). Diverse traditional utilitiesof plants belonging to family Poaceae in Gujarat State. In: Perspectives on Biodiversity of India.Volume I. (Biju Kumar, A., Rajendran, P., Peethambaran, C.K., Eds), (Centre for Innovation inScience and Social Action, Thiruvananthapuram, India, pp. 1-4.
Design: Geosolutions
Printed at: Arsha Offset, Thiruvananthapuram, India
Preface
Biodiversity as the diverse species of life forms is not just a conservation issue. It isalso related to the production and consumption patterns on which the poor dependdirectly. Biodiversity is the means of livelihood and the “means of production” ofthe poor who have no access to other means of production or assets. For food andmedicine, for energy and fibre, for ceremony and craft, the poor depend on thewealth of biological resources and their knowledge and skills related to biodiversity.It is thus the basis of both the production and consumption patterns of the poor.
Biodiversity erosion therefore does not merely have ecological consequences. Italso translates into destruction of livelihoods and lack of fulfilment of basic needsfor the poorer two thirds of humanity which lives in a biodiversity based economy.The consumption patterns of the rich can undermine the consumption patterns ofthe poor by contributing to biodiversity erosion. Indians have stewardship of abeautiful, diverse and unique environment and Indian culture and philosophy arestrongly rooted in our rich and unique natural heritage. The continued growth ofhuman populations and of consumption patterns, exacerbated with habitatdestruction, land conversion for agriculture and development, climate change,pollution and the spread of invasive species have resulted in unsustainable exploitationof our biological diversity.
A mono-agriculture society - where trees are seen as nothing more than timber andcrop yield is the only measure for economic value of cereals - reflects a mental andpolitical system that will lack in vision and complexity in general. However, diverseknowledge systems are necessary to address the challenges ahead of us. For example,in traditional societies, trees have multiple purposes, from food, water reservoir andshelter to nutrients of the soil around them. Timber value is only one (small) part ofthe whole. Traditional knowledge systems contribute in major ways to theunderstanding of biodiversity, ecological sustainability and cultural, includingagricultural, diversity. This attitude is truly an important concept to improve yourcritical thinking and, therefore, decision making skills. This shift in perspective providesone with some of the foundations required for independent and intelligent thinking.
Since the World Summit on Sustainable Development in 2002, 193 parties to theConvention on Biodiversity (CBD) have committed themselves to substantiallyreducing rates of biodiversity loss by 2010 (‘Biodiversity Target’) and this goal wasincorporated into the UN Millennium Development Goals (MDG) in 2005. Followingthis, a wide array of international, national and regional strategies and action planshave been forwarded to achieve the goals of biodiversity conservation. There arealso a series of conservation initiatives by civil society organisations across theglobe. India also prepared the National Biodiversity Strategies and Action Plan(NBSAP) and enacted the Biological Diversity Act (2002) and the Biological DiversityRules (2004). The United Nations has declared 2010 as the International Year of
Biodiversity (IYB) to create awareness about the crucial importance ofbiodiversity to society, to communicate the human costs of biodiversity loss,and to enthuse people, particularly youth, throughout the world in the fightto protect all variety of life on Earth, the gripping biodiversity. Of late, UnitedNations declared 2011-2020 as the “United Nations Decade on Biodiversity”,with a view to contributing to the implementation of the Strategic Plan forBiodiversity 2011-2020.
Despite some conservation successes (especially at local scales) and increasingpublic and government interest in living sustainably, biodiversity continues todecline. Radical changes are required that recognize biodiversity as a globalpublic good, that integrate biodiversity conservation into policies and decisionframeworks for resource production and consumption, and that focus onwider institutional and societal changes to enable more effectiveimplementation of policy. There is also a need to include more areas asprotected and plan effective conservation through people’s participation.Filling gaps in our knowledge and building on success, through scaling up andfurther investment in participatory conservation paradigms, are critical inmanaging biodiversity for long term.
There is an urgent need for implementation of CBD’s proposed 2011-2020Strategic Plan and for updating of national strategies and action plans. Eachcountry in the world, therefore, should work with urgency to develop strategicaction plans for conservation and sustainable management of biodiversity.Sustainable management of our ecosystems and the rich life within themremains one of the key natural resource management challenges. The successof biodiversity conservation in any region is linked to the economic and socialsustainability of the region.
In this context, Indian Biodiversity Congress (IBC) serves to compile informationon various perspectives of biodiversity of India in every two years. This editedbook consists of 95 research papers, presented at the IBC in 2012, categorisedunder the broad themes, Agro-biodiversity and Food Security, Biodiversity,Culture and Education; Biodiversity, Development and Climate change;Biodiversity Documentation and Taxonomy and Medicinal Conservation andUtilisation. We wish to express our deep gratitude to all those who havededicated time and contributed papers for this publication.
We welcome suggestions from the readers.
31 July 2014 Dr. Vandana ShivaChairperson, IBC
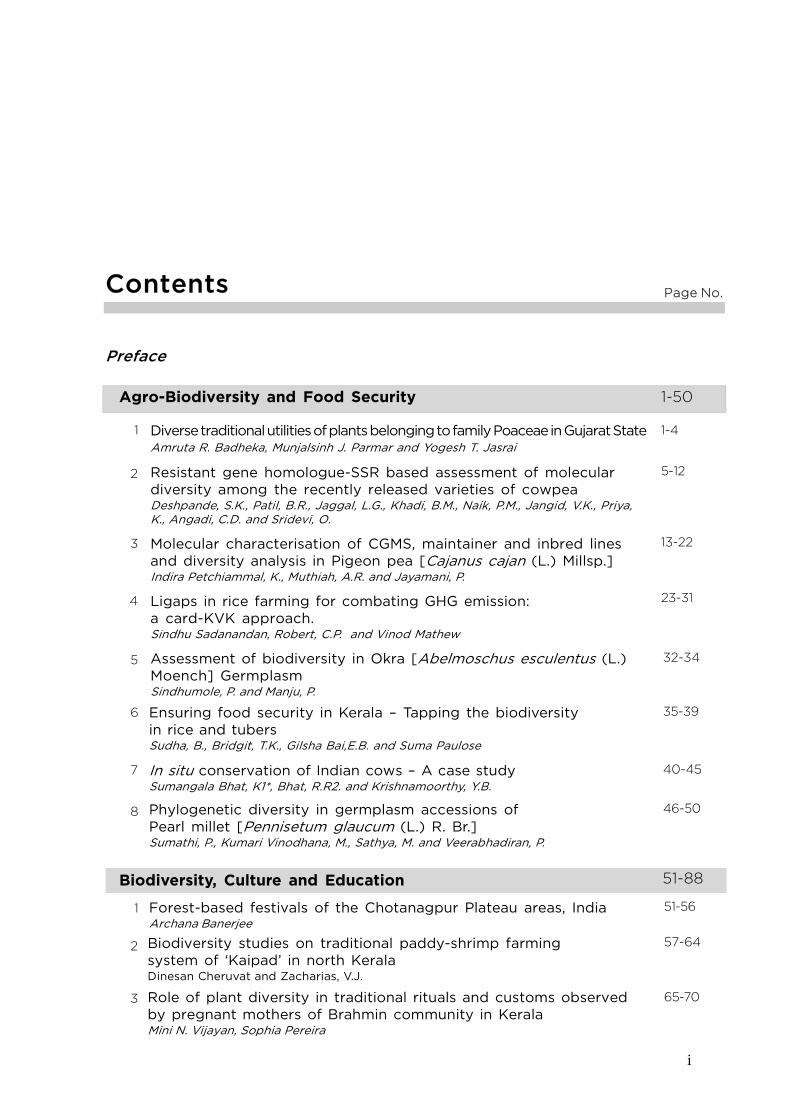
i
Contents
Preface
Agro-Biodiversity and Food Security
Diverse traditional utilities of plants belonging to family Poaceae in Gujarat StateAmruta R. Badheka, Munjalsinh J. Parmar and Yogesh T. Jasrai
Resistant gene homologue-SSR based assessment of moleculardiversity among the recently released varieties of cowpeaDeshpande, S.K., Patil, B.R., Jaggal, L.G., Khadi, B.M., Naik, P.M., Jangid, V.K., Priya,K., Angadi, C.D. and Sridevi, O.
Molecular characterisation of CGMS, maintainer and inbred linesand diversity analysis in Pigeon pea [Cajanus cajan (L.) Millsp.]Indira Petchiammal, K., Muthiah, A.R. and Jayamani, P.
Ligaps in rice farming for combating GHG emission:a card-KVK approach.Sindhu Sadanandan, Robert, C.P. and Vinod Mathew
Assessment of biodiversity in Okra [Abelmoschus esculentus (L.)Moench] GermplasmSindhumole, P. and Manju, P.
Page No.
32-34
Ensuring food security in Kerala – Tapping the biodiversityin rice and tubersSudha, B., Bridgit, T.K., Gilsha Bai,E.B. and Suma Paulose
35-39
In situ conservation of Indian cows – A case studySumangala Bhat, K1*, Bhat, R.R2. and Krishnamoorthy, Y.B.
40-45
Phylogenetic diversity in germplasm accessions ofPearl millet [Pennisetum glaucum (L.) R. Br.]Sumathi, P., Kumari Vinodhana, M., Sathya, M. and Veerabhadiran, P.
46-50
Forest-based festivals of the Chotanagpur Plateau areas, IndiaArchana Banerjee
51-56
Biodiversity studies on traditional paddy-shrimp farmingsystem of ‘Kaipad’ in north KeralaDinesan Cheruvat and Zacharias, V.J.
57-64
Biodiversity, Culture and Education
1-50
51-88
1-4
5-12
13-22
23-31
Role of plant diversity in traditional rituals and customs observedby pregnant mothers of Brahmin community in KeralaMini N. Vijayan, Sophia Pereira
65-70
1
2
3
4
5
6
7
8
1
2
3
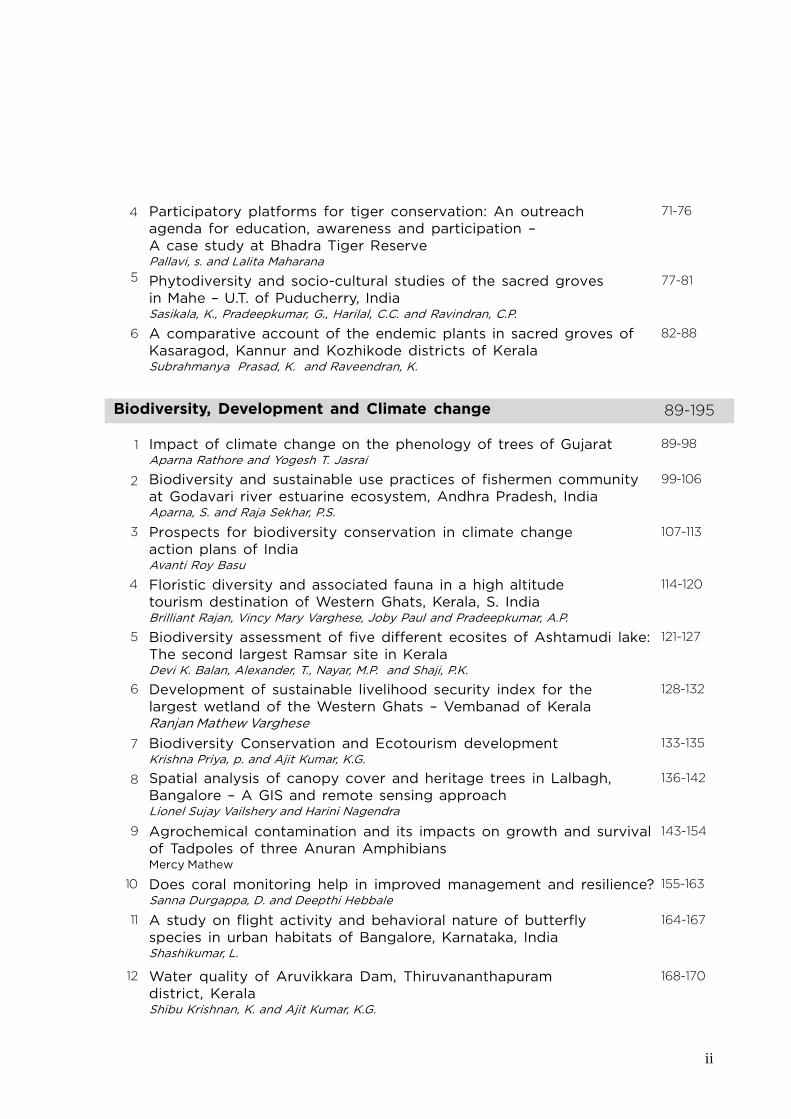
ii
A study on flight activity and behavioral nature of butterflyspecies in urban habitats of Bangalore, Karnataka, IndiaShashikumar, L.
164-167
Water quality of Aruvikkara Dam, Thiruvananthapuramdistrict, KeralaShibu Krishnan, K. and Ajit Kumar, K.G.
168-170
Participatory platforms for tiger conservation: An outreachagenda for education, awareness and participation –A case study at Bhadra Tiger ReservePallavi, s. and Lalita Maharana
71-76
Phytodiversity and socio-cultural studies of the sacred grovesin Mahe – U.T. of Puducherry, IndiaSasikala, K., Pradeepkumar, G., Harilal, C.C. and Ravindran, C.P.
77-81
A comparative account of the endemic plants in sacred groves ofKasaragod, Kannur and Kozhikode districts of KeralaSubrahmanya Prasad, K. and Raveendran, K.
82-88
Impact of climate change on the phenology of trees of GujaratAparna Rathore and Yogesh T. Jasrai
89-98
Biodiversity, Development and Climate change
Biodiversity and sustainable use practices of fishermen communityat Godavari river estuarine ecosystem, Andhra Pradesh, IndiaAparna, S. and Raja Sekhar, P.S.
99-106
Prospects for biodiversity conservation in climate changeaction plans of IndiaAvanti Roy Basu
107-113
Floristic diversity and associated fauna in a high altitudetourism destination of Western Ghats, Kerala, S. IndiaBrilliant Rajan, Vincy Mary Varghese, Joby Paul and Pradeepkumar, A.P.
114-120
Biodiversity assessment of five different ecosites of Ashtamudi lake:The second largest Ramsar site in KeralaDevi K. Balan, Alexander, T., Nayar, M.P. and Shaji, P.K.
121-127
Development of sustainable livelihood security index for thelargest wetland of the Western Ghats – Vembanad of KeralaRanjan Mathew Varghese
128-132
Biodiversity Conservation and Ecotourism developmentKrishna Priya, p. and Ajit Kumar, K.G.
133-135
Spatial analysis of canopy cover and heritage trees in Lalbagh,Bangalore – A GIS and remote sensing approachLionel Sujay Vailshery and Harini Nagendra
136-142
Does coral monitoring help in improved management and resilience?Sanna Durgappa, D. and Deepthi Hebbale
155-163
Agrochemical contamination and its impacts on growth and survivalof Tadpoles of three Anuran AmphibiansMercy Mathew
143-154
89-195
4
5
6
1
2
3
4
5
6
7
8
9
10
11
12
iii
Temporal urban vegetation pattern of Mumbai using satellite dataShirish Kumar and M. A. Mohammed-Aslam
171-174
Pallikaranai wetland: A quandary between biodiversity conservationand urban developmentSridevi Karpagavalli, M., Dhanya, P. and Ramachandran, A.
175-180
Effect of TTP effluents on the biological productivity with emphasison biodiversity at Veli coast, TrivandrumVishnu. S .Raj, Sudanandh, V.S., Shibu, R., Ratheesh Kumar, M., Faisal, A.K., Ajmal, K.,Vimexen. V., Aneesh, K.S., Baiju, R.S., Benno Pereira, F.G. and Anoop Krishnan, K.
181-187
Estimation of the economic value of ThenmalaEcotourism Park, KeralaSusan Abraham, Aryaa, P. and Biji Abrahamnan, K.
188-195
Biodiversity Documentation and Taxonomy
Molecular characterization of three species of Clarias(Pisces: Siluriformes, Clariidae) using RAPD markersAneesha Devassy, Linu Mathew, Padmakumar, K.G., Gopalakrishnan, A.,Basheer, V.S.and Raj Kumar.
197-201
Habit and habitat studies on Orilathamara (Nervilia aragoana Gaud.)Anulakshmi Sankar, Mini Raj,N., Nybe, E.V. and Deepa,E.T
202-211
Orchids of Vellingiri Hills, Nilgiris Biosphere Reserve- Survey andbiotechnological approaches for the conservation of Aphyllorchismontana Rchb. f.Narmatha Bai. V., Gopalan, R., Mahendran, G. and Saranya, B.
212-221
Invasive alien plants along the Ithikkara river banks, SouthernWestern GhatsAravind, M., Madhusoodanan Pillai, G. and Aji, A.T.
222-228
Isolation and characterization of Lysinibacillus sphaericus DSLS5from marine spongePraveena Pothuraju Lakshmi, Balasubiramani Soundharya, Visamsetti Amarendra,Kandasamy Dhevendaran and Ramachandran Sarojini Santhosh
229-236
Diversity of seed - producing plants in Assam, IndiaBarooah, C., Iftikher Ahmed and Rupam Sankar Baruah
237-244
Monitoring to assess plant diversity in the surroundings of KMMLindustrial area in Chavara, Kollam district, South IndiaBeena, K.N. and Jaya, D.S.
245-253
A study on the Vayals of Mudumalai Tiger Reserve - A unique wetlandecosystemBinitha Pushpakaran and Gopalan, R.
254-258
197-524
Ex situ conservation and evaluation: A method for selectionof indigenous varieties of mangoVasugi, C., Dinesh, M.R., Ravishankar, K.V. and Chithiraichelvan, R.
259-265
Culture based observation of beneficial microorganisms fromspecies of Ficus syconia.Vijayakumari, U. and Thamizhseran, N
266-273
13
14
15
16
1
2
3
4
5
6
7
8
9
10
iv
Tree species diversity of Gibbon Wildlife Sanctuary, Assam and itsconservation perspectivesMoumita Sarkar and Ashalata Devi
355-361
Evergreen forests - A hot spot of rare, endemic and threatenedtrees - A study from Wayanad DistrictNandakumar, M., Jayesh P. Joseph, Jithin, M.M., Volga, V.R., Mini, V.,Asalatha, P.K. and Anilkumar, N.
362-366
Plant endemism in the Western Ghats and identification of criticaltree species and habitatsNayar, M.P.
367-372
Molecular marker based assessment of coconut geneticdiversity in Sri LankaDasanayaka P.N., Everard, J.M.D.T., Karunanayake, E.H. and Weerasena O.V.D.S.J.
274-279
Diversified role of detoxifying enzymes in imparting resistancein Plutella xylostella (L.) against flubendiamideDipali B. Borkar, Rathod, D.R., Bagde, V.L., Munje, S.S., Moharil , M.P. and Mohod, S.B.
280-284
Distribution of marine Actinomycetes along the SouthAndaman coastSumitha Gopalakrishnan, Jai Sunder, Venu, S., Ranjeet, K. and Sureshkumar, S.
285-291
Collection, conservation and characterization of Jasmine typesGanga,M., Jawaharlal, M., Kannan, M. and Ranchana, P
292-294
Inventory of floristic diversity in protected area of tropical forestsof Assam, northeast IndiaGitamani Dutta and Ashalata Devi
295-303
Current status of selected endemic species of Kalakad MundanthuraiTiger Reserve (KMTR), Tamil NaduArunkumar, G., Saranya, B.and Gopalan, R.
304-306
A study on hydrocarbon degrading marine Actinomycetes fromcoastal areas of Kanyakumari DistrictChandraja, C.V., Immanuel, G., Sangeetha, V.S., Greeshma, S.U., Anupa, M.P., ShabiRuskin, Praseetha, P.K. and Dhanya, R.P.
307-310
Saltwater Crocodile Crocodylus porosus (Schneider 1801), Reptilia:Crocodilia) from the Madras Crocodile Bank Trust, Tamil NaduChandrasekar, K*., Srinivasan, M. and Nikhil Whitaker
311-316
The diversity of earthworm resources in the central Keralastretch of Western GhatsJaya Manazhy, Aja Manazhy and Vijayakumaran Nair, K.
317-325
Freshwater malacofauna of Hyderabad, Andhra PradeshKaruthapandi, M. and Rao, D.V.
326-331
Home garden and insect studies in Bangalore, India.Madhumitha Jaganmohan, Lionel Sujay Vailshery and Harini Nagendra
332-336
Systematic studies on mosses of Southern Western Ghatsin Kerala, IndiaManju, C.N. and Rajesh, K.P.
337-346
Spatial and temporal variability in the occurrence of microalgaeat Chalakkudy river basin, Western Ghats, KeralaMohamed Nasser, K.M. and Sureshkumar, S.
347-354
11
12
13
14
15
16
17
18
19
20
21
22
23
24
25
26
v
Benthic fauna and water quality parameters in Canoli Canal,Thrissur district, KeralaNimisha, P. and Sheeba, S.
373-377
One new and some known species of Dorylaimoidea (Nematoda)associated with Guava from West Bengal, IndiaDebabrata Sen
378-384
Fauna of Drosophilid flies (Diptera: Drosophilidae) at Nandi Hills,Karnataka, India.Pranesh Sujaymeendra, D.S. and Harini, B.P.
385-391
Patterns of butterfly diversity in three tropical habitats ofthe Eastern Ghats in Southern Andhra PradeshPrasanna Kumar, V., Harinath, P., Meerrabai, G. and Venkata Ramana, S. P.
392-397
Cryobanking and sustainable utilization of zygotic embryosof an economic rattan palm Calamus thwaitesii Becc.in Southern Western GhatsPreetha T.S., Hemanthakumar, A.S., Krishnan, P.N. and Seeni S.
398-402
Spathodea campanulata as a bio-indicator of faunal biodiversityat Kaiga, KarnatakaPuttaraju, K. and Hanumantharayappa, S.K.
403-408
Studies on diversity, endemism and rarity in the genus Impatiens inSouthern Western GhatsRamasubbu, R.
409-416
Geographical distribution, present status and characteristics andhematology of Malnad Gidda cattle – An unique dwarf cattle ofWestern Ghats in KarnatakaRamesha, K.P.. Jeyakumar,S., Kataktalware, M.A.. Das, D.N. and Nagaraj, K.M.
417-422
An investigation on phytoplankton community structure andspecies diversity along Southwest coast of IndiaRatheesh Kumar, M., Shibu, R., Sudhanandh. V.S., Vishnu S. Raj., Faisal, A.K., Vimexen, V.,Ajmal, K., Aneesh, K.S., Sooraj Krishna, R., Baiju, R.S and Anoop Krishnan, R.
423-431
An arboretum for the endemic and endangered flora of the NilgiriBiosphere Reserve at Anaikatti, Coimbatore, Tamil Nadu, India.Rathinasabapathy, B. and Kumaraguru, A.
432-435
A report on the population trends of butterflies in thebutterfly garden at Nilambur, Kerala (India)Revathy, V.S. and George Mathew
436-443
Conservation of Zeuxine flava (Orchidacea) through tissue cultureHewage, S. and Senarath, W.T.P.S.K.
444-449
Structure and floristic composition of tree diversity in AndamanSemi Evergreen Forest of South Andaman, IndiaSaravanan, S., Ravichandran, K., Balasubramanian, A., Paneerselvam, K., Mahesh, S.,Sathish kumar, P., Veeramani, T. and Vijayaraghavan, A.
450-455
Orchid diversity of Western Ghats: Conservation initiativesSharief, M.U.
456-464
Biodiversity of benthic species in Kavaratti Lagoon-a case study from 2010-2012Shibu, R., Sudanandh, V.S., Vishnu S. Raj, Ratheesh Kumar, M., Faisal, A.K., Ajmal, K.,Vimexen, V., Aneesh, K.S., Baiju, R.S., Sooraj Krishna, R. and Anoop Krishnan, K.
465-471
27
28
29
30
31
32
33
34
35
36
37
38
39
40
41
vi
Use of participatory method in preparation of inventory ofeconomically and medicinally important plants.Jakhi, P.S., Kal kar, S.K. and Jagtap, D.K.
539-544
Evaluation of phytotoxic potential of Murayya koenigii L. andBambusa tulda Roxb. aqueous leaf extracts on Lactuca sativa L.Meera, I., Siva Kumar C.V. and Chandrakala, G.
545-551
Cold storage, regrowth and genetic stability assessment in Bacopamonnieri (L.) – An Ayurvedic important medicinal plantJoe Virgin Largia, M., Lakkakul a Satish and Ramesh, M.
552-557
Impact of domestication on phytochemical composition of themedicinal orchid Jeevakom (Seidenfia rheedii sw. Szkch.)Mini Raj, N., Nybe, E.V., Asha Sankar, M. and Deepa, E.T.
558-565
Tree diversity assessment of Bangalore using object basedclassificationShivani Agarwal, Lionel Sujay Vailshery, Madhumitha Jaganmohan and Harini Nagendra
472-476
Peripheral haematology of the suckermouth armoured catfish(Hypostomus plecostomus)Shyni, G.B. and Radhakrishnan, S.
477-481
Biodiversity assessment of seaweed resources fromKudankulam Coast, Gulf of Mannar, Southeastern India.Srinivasan, M. and Gnanamoorthy, P.
482-486
Investigation on the anti-inflammatory and analgesic effects ofan extract of jellyfish, Chrysaora quinquecirrha.Suganthi, K., Tufail Ahmed, M., Bragadeeswaran, S. and Perumal, P.
487-492
Arthropod bio-diversity in Gloriosa superba Linn.- The state flower of Tamil NaduSuganthy, M., Nalina, N., Sakthivel, P. and Vijayakumar, R.M.
493-498
Diversity of odonates among selected urban, rural and forestedarea in CoimbatoreSuhirtha Muhil, M. and Pramod, P.
499-502
Biodiversity of phyllosphere fungi on Avicennia marina frommangroves near Marakkanam, Kancheepuram district, Tamil Nadu,East coast of IndiaTausif Raza and Sarma, V.V.
503-506
Seri-biodiversity of host plants in IndiaTikader, A. and Saratchandra, B.
507-517
Diversity of macrofungi from Western Ghats ofKarnataka State (India)Usha, N. and Janardhana,G.R.
518-524
Efforts in conservation of ret medicinal plant species through invitro clonal propagationBandana Padhan, Kartik Charan Lenka and Swain, S.
525-530
Ethno-medicinal survey of some plants from villages of Satara district(M.S.) – A participatory effortJagtap, D.K. and Jakhi, P.S.
531-538
Medicinal Plant Conservation and Utilisation 525-587
42
43
44
45
46
47
48
49
50
1
2
3
4
5
6

vii
Biodiversity in Plumbago zeylanica Linn.Nalina, L., Suganthy, M., Rajamani, K., Vijayakumar, R. M. and Ammaan, M.
566-570
Routinely practiced wound healing plants by local tribal of Chhindwaradistrict of Madhya PradeshNikhil Kanungo
571-574
‘Herbs for all and health for all’ - Empowering rural women in primaryhealth care utilizing local biodiversityRajasekharan, S., Navas, M., Vinodkumar Nair, T.G., Subash Baby, C.K., Asharf, A.K. andSeena, G.R.
575-576
Effect of elevated CO2 on germination, growth, photosyntheticbehaviour and bio-chemical changes in Catharanths roseus LinnA medicinal herbSaravanan, S., Karthi, S., Saranya, S. and Jayaraj, R.C.S.
577-583
Evaluation of anticancer activity of two medicinal plants from Western GhatsVishnu, K.V., Parvathy, P. and Julie Jacob
584-587
7
8
9
10
11
Author Index 588-590

viii
Indian Biodiversity Congress 2013
Biodiversity Culture and Education
Estimation of the Economic Value of Thenmala Ecotourism Park
Susan Abraham*, P. Arya and Biji Abraham Department of Economics, Christian College, Chengannur- 689122 Received: January 2013 Accepted: April 2013 Keywords: Eco-tourism, Valuation, Travel Cost Method
A B S T R A C T Forest biodiversity is often subject to degradation due to the absence of well func-
tioning markets. Economic theory postulates that one way to prevent this is by
generating awareness among the public regarding their importance and value to
mankind. If correct estimates of the economic values of ecotourism parks and forest
resources are not made, it is difficult to calculate and generate sustainable revenue
from internal sources to support the endeavors needed to be made towards the
protection of forest biodiversity. In practice, economic values of forest resources are
rarely examined with appropriate scientific approaches. The Thenmala Ecotourism
Park which is part of the Shendurney Wildlife Sanctuary was intended as a small
scale alternative to standard commercial tourism, which would generate sufficient
revenue for forest biodiversity conservation and management. The current study
attempts an economic valuation of the Thenmala Ecotourism Park using the Travel
Cost Method. The total annual benefit generated by the Park was estimated at
Rs.4.42 crores. A comparison of the recreational benefits of the Park and the actual
revenue collected by the Park authorities indicate that the project underestimates the
true value of the ecosystem services provided by the park and that it may be possible
to further augment the actual revenue collected from the Park, which could be
reinvested in improving the quality and the conservation of the site.
1. Introduction
As part of the Agasthyamalai Biosphere Reserve,
the Shendurney Wildlife Sanctuary has an important
role to play in conserving the rich biological diversity
of the Western Ghats. The significance of the
Sanctuary lies in its ecological, faunal, floral and geo-
morphological importance. The sanctuary comprises
three zones namely the Core Zone, the Buffer Zone
and the Tourism Zone. The Core Zone is a protected
area rich in biodiversity, where all forms of
anthropogenic interference is regulated. It supports
* Corresponding author at: Department of Economics, Christian College,
Chengannur- 689122 E-mail : [email protected]
prime wildlife habitats and dense vegetation. It is
a treasure cove of plant diversity with nearly 951
species of flowering plants of which 309 are
endemic to the Western Ghats, 245 species of
avifaunal wealth including migratory, endemic and
endangered species, unique vegetation, and the
watershed of the Kallada Reservoir. It is situated
in the eastern portion of the sanctuary extending
over 75.5 sq. km. (44.2% of the total sanctuary
area). The buffer zone covering an area of 47.13
sq. km. (27.6%) is sandwiched between the core
zone in the east and the tourism zone in the west
201
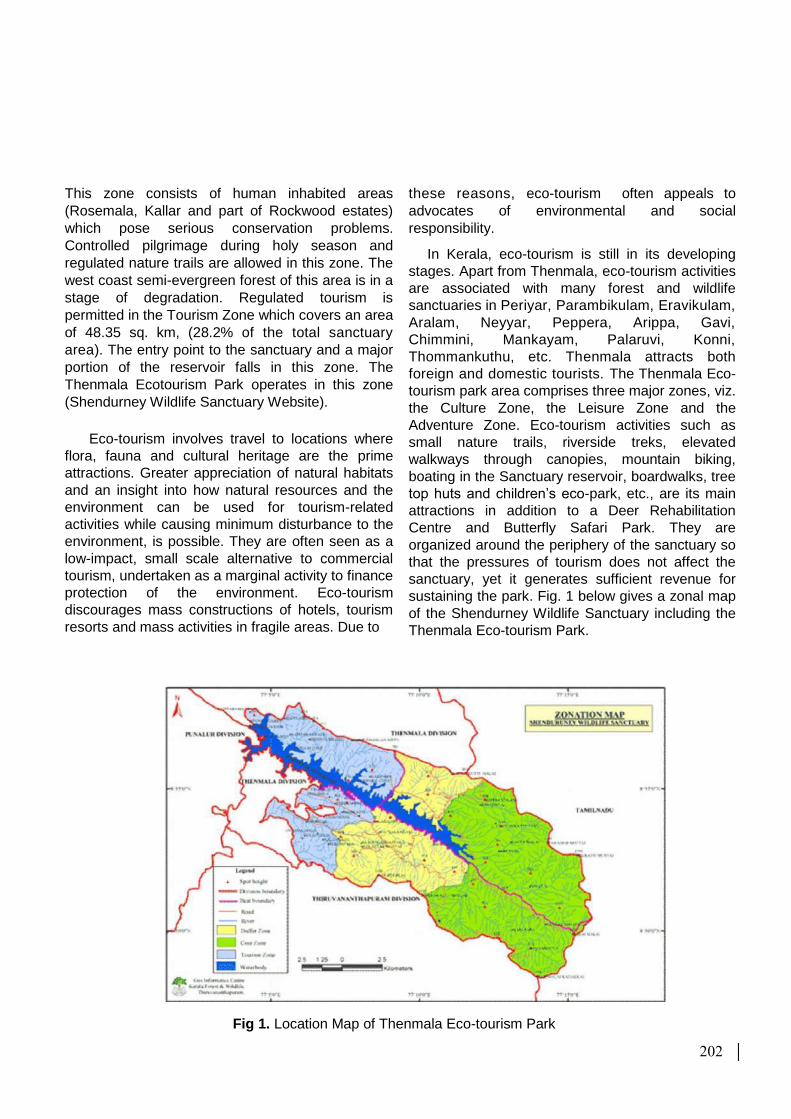
This zone consists of human inhabited areas
(Rosemala, Kallar and part of Rockwood estates)
which pose serious conservation problems.
Controlled pilgrimage during holy season and
regulated nature trails are allowed in this zone. The
west coast semi-evergreen forest of this area is in a
stage of degradation. Regulated tourism is
permitted in the Tourism Zone which covers an area
of 48.35 sq. km, (28.2% of the total sanctuary
area). The entry point to the sanctuary and a major
portion of the reservoir falls in this zone. The
Thenmala Ecotourism Park operates in this zone (Shendurney Wildlife Sanctuary Website).
Eco-tourism involves travel to locations where
flora, fauna and cultural heritage are the prime
attractions. Greater appreciation of natural habitats
and an insight into how natural resources and the
environment can be used for tourism-related
activities while causing minimum disturbance to the
environment, is possible. They are often seen as a
low-impact, small scale alternative to commercial
tourism, undertaken as a marginal activity to finance
protection of the environment. Eco-tourism
discourages mass constructions of hotels, tourism
resorts and mass activities in fragile areas. Due to
these reasons, eco-tourism often appeals to
advocates of environmental and social
responsibility.
In Kerala, eco-tourism is still in its developing
stages. Apart from Thenmala, eco-tourism activities
are associated with many forest and wildlife
sanctuaries in Periyar, Parambikulam, Eravikulam,
Aralam, Neyyar, Peppera, Arippa, Gavi,
Chimmini, Mankayam, Palaruvi, Konni,
Thommankuthu, etc. Thenmala attracts both
foreign and domestic tourists. The Thenmala Eco-
tourism park area comprises three major zones, viz.
the Culture Zone, the Leisure Zone and the
Adventure Zone. Eco-tourism activities such as
small nature trails, riverside treks, elevated
walkways through canopies, mountain biking,
boating in the Sanctuary reservoir, boardwalks, tree
top huts and children’s eco-park, etc., are its main
attractions in addition to a Deer Rehabilitation
Centre and Butterfly Safari Park. They are
organized around the periphery of the sanctuary so
that the pressures of tourism does not affect the
sanctuary, yet it generates sufficient revenue for
sustaining the park. Fig. 1 below gives a zonal map
of the Shendurney Wildlife Sanctuary including the
Thenmala Eco-tourism Park.
Fig 1. Location Map of Thenmala Eco-tourism Park
202
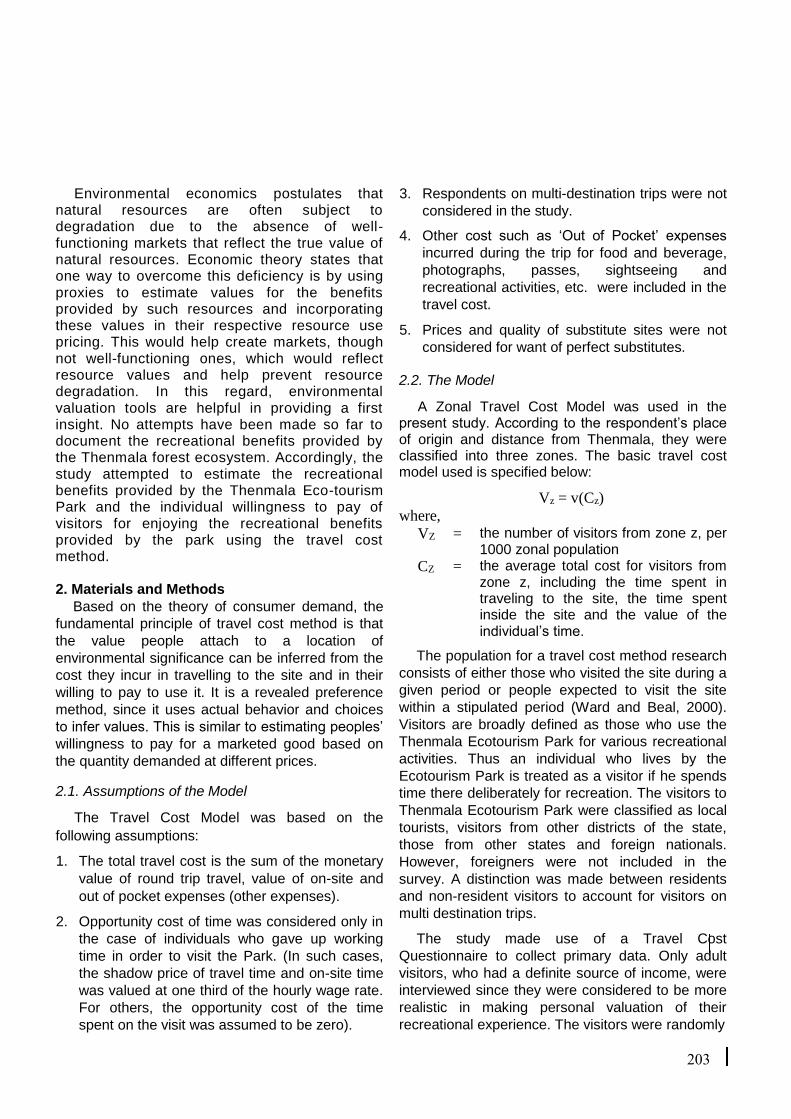
Environmental economics postulates that natural resources are often subject to degradation due to the absence of well-functioning markets that reflect the true value of natural resources. Economic theory states that one way to overcome this deficiency is by using proxies to estimate values for the benefits provided by such resources and incorporating these values in their respective resource use pricing. This would help create markets, though not well-functioning ones, which would reflect resource values and help prevent resource degradation. In this regard, environmental valuation tools are helpful in providing a first insight. No attempts have been made so far to document the recreational benefits provided by the Thenmala forest ecosystem. Accordingly, the study attempted to estimate the recreational benefits provided by the Thenmala Eco-tourism Park and the individual willingness to pay of visitors for enjoying the recreational benefits provided by the park using the travel cost method. 2. Materials and Methods
Based on the theory of consumer demand, the
fundamental principle of travel cost method is that
the value people attach to a location of
environmental significance can be inferred from the
cost they incur in travelling to the site and in their
willing to pay to use it. It is a revealed preference
method, since it uses actual behavior and choices
to infer values. This is similar to estimating peoples’
willingness to pay for a marketed good based on
the quantity demanded at different prices. 2.1. Assumptions of the Model
The Travel Cost Model was based on the
following assumptions: 1. The total travel cost is the sum of the monetary
value of round trip travel, value of on-site and
out of pocket expenses (other expenses). 2. Opportunity cost of time was considered only in
the case of individuals who gave up working
time in order to visit the Park. (In such cases,
the shadow price of travel time and on-site time
was valued at one third of the hourly wage rate.
For others, the opportunity cost of the time
spent on the visit was assumed to be zero).
3. Respondents on multi-destination trips were not
considered in the study. 4. Other cost such as ‘Out of Pocket’ expenses
incurred during the trip for food and beverage,
photographs, passes, sightseeing and
recreational activities, etc. were included in the
travel cost.
5. Prices and quality of substitute sites were not
considered for want of perfect substitutes.
2.2. The Model
A Zonal Travel Cost Model was used in the present study. According to the respondent’s place of origin and distance from Thenmala, they were classified into three zones. The basic travel cost model used is specified below: Vz = v(Cz)
where,
VZ = the number of visitors from zone z, per 1000 zonal population
CZ = the average total cost for visitors from zone z, including the time spent in traveling to the site, the time spent inside the site and the value of the individual’s time.
The population for a travel cost method research
consists of either those who visited the site during a
given period or people expected to visit the site
within a stipulated period (Ward and Beal, 2000).
Visitors are broadly defined as those who use the
Thenmala Ecotourism Park for various recreational
activities. Thus an individual who lives by the
Ecotourism Park is treated as a visitor if he spends
time there deliberately for recreation. The visitors to
Thenmala Ecotourism Park were classified as local
tourists, visitors from other districts of the state,
those from other states and foreign nationals.
However, foreigners were not included in the
survey. A distinction was made between residents
and non-resident visitors to account for visitors on
multi destination trips. The study made use of a Travel Cost
Questionnaire to collect primary data. Only adult
visitors, who had a definite source of income, were
interviewed since they were considered to be more
realistic in making personal valuation of their
recreational experience. The visitors were randomly
203
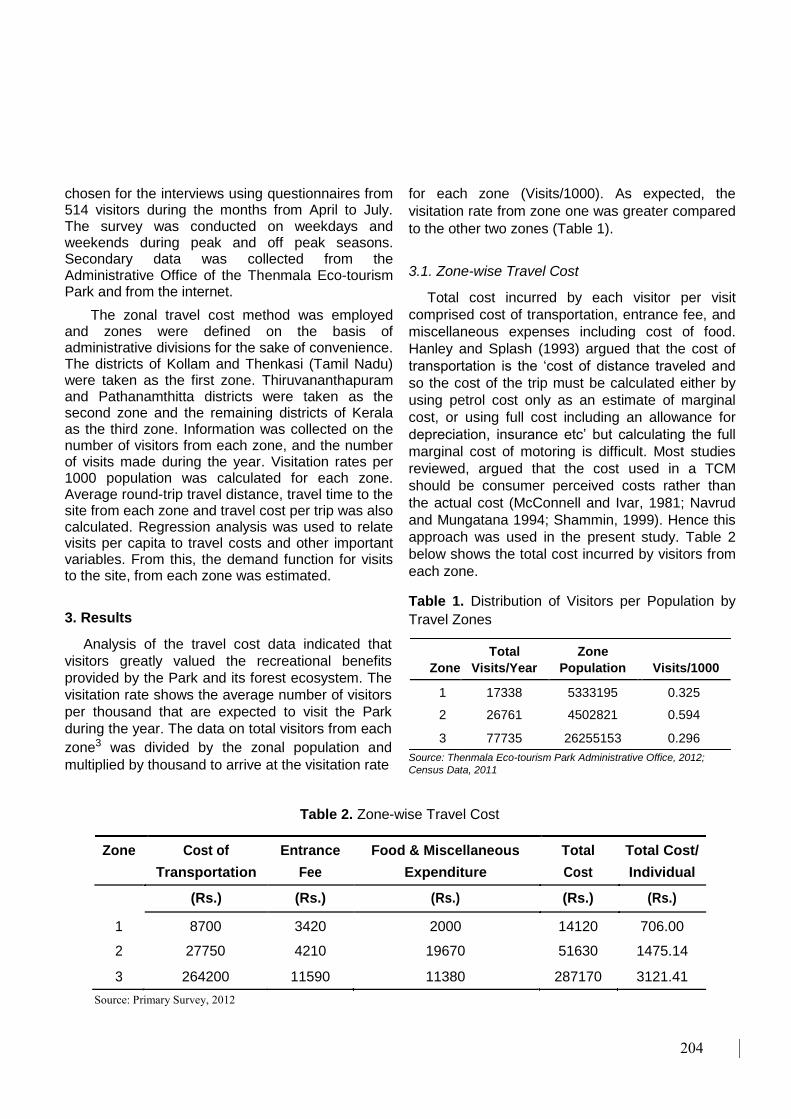
chosen for the interviews using questionnaires from 514 visitors during the months from April to July. The survey was conducted on weekdays and weekends during peak and off peak seasons. Secondary data was collected from the Administrative Office of the Thenmala Eco-tourism Park and from the internet. The zonal travel cost method was employed and zones were defined on the basis of administrative divisions for the sake of convenience. The districts of Kollam and Thenkasi (Tamil Nadu) were taken as the first zone. Thiruvananthapuram and Pathanamthitta districts were taken as the second zone and the remaining districts of Kerala as the third zone. Information was collected on the number of visitors from each zone, and the number of visits made during the year. Visitation rates per 1000 population was calculated for each zone. Average round-trip travel distance, travel time to the site from each zone and travel cost per trip was also calculated. Regression analysis was used to relate visits per capita to travel costs and other important variables. From this, the demand function for visits to the site, from each zone was estimated.
3. Results
Analysis of the travel cost data indicated that
visitors greatly valued the recreational benefits
provided by the Park and its forest ecosystem. The
visitation rate shows the average number of visitors
per thousand that are expected to visit the Park
during the year. The data on total visitors from each
zone3 was divided by the zonal population and
multiplied by thousand to arrive at the visitation rate
for each zone (Visits/1000). As expected, the
visitation rate from zone one was greater compared
to the other two zones (Table 1).
3.1. Zone-wise Travel Cost
Total cost incurred by each visitor per visit
comprised cost of transportation, entrance fee, and
miscellaneous expenses including cost of food.
Hanley and Splash (1993) argued that the cost of
transportation is the ‘cost of distance traveled and
so the cost of the trip must be calculated either by
using petrol cost only as an estimate of marginal
cost, or using full cost including an allowance for
depreciation, insurance etc’ but calculating the full
marginal cost of motoring is difficult. Most studies
reviewed, argued that the cost used in a TCM
should be consumer perceived costs rather than
the actual cost (McConnell and Ivar, 1981; Navrud
and Mungatana 1994; Shammin, 1999). Hence this
approach was used in the present study. Table 2
below shows the total cost incurred by visitors from
each zone. Table 1. Distribution of Visitors per Population by
Travel Zones
Zone Total Zone
Visits/1000
Visits/Year Population
1 17338 5333195 0.325
2 26761 4502821 0.594
3 77735 26255153 0.296
Source: Thenmala Eco-tourism Park Administrative Office, 2012; Census Data, 2011
Table 2. Zone-wise Travel Cost
Zone Cost of Entrance Food & Miscellaneous Total Total Cost/
Transportation Fee Expenditure Cost Individual
(Rs.) (Rs.) (Rs.) (Rs.) (Rs.)
1 8700 3420 2000 14120 706.00
2 27750 4210 19670 51630 1475.14
3 264200 11590 11380 287170 3121.41 Source: Primary Survey, 2012
204
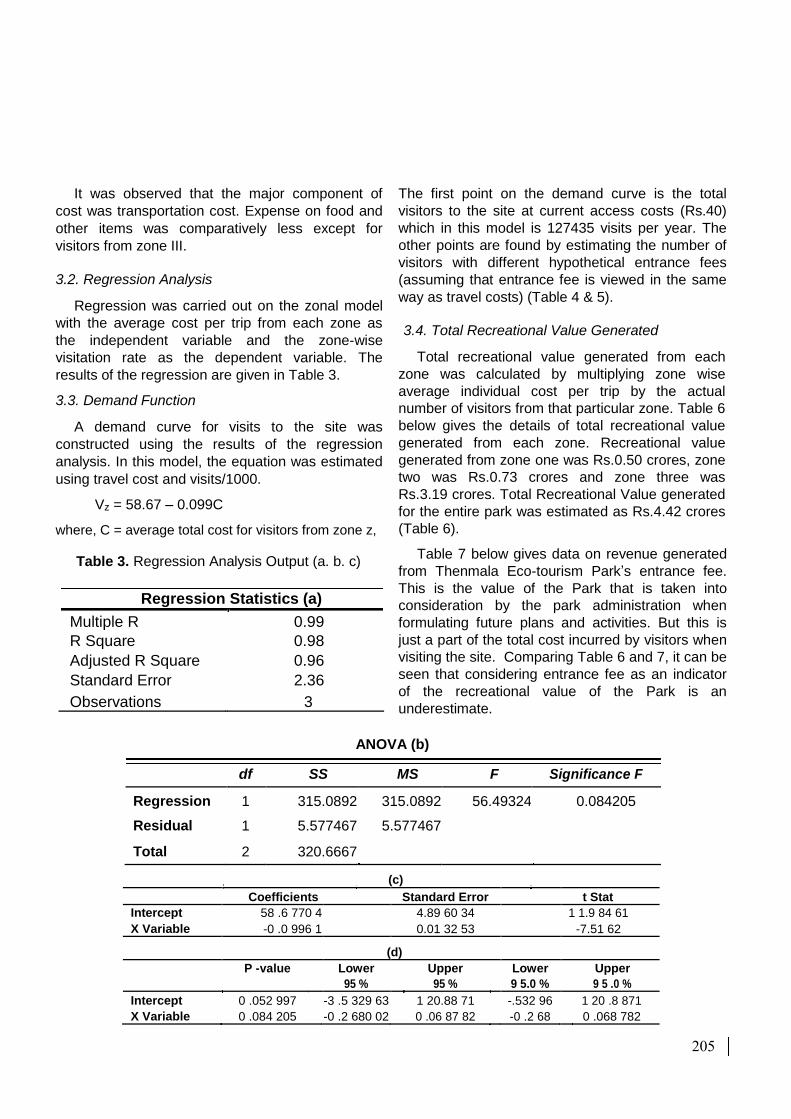
It was observed that the major component of
cost was transportation cost. Expense on food and
other items was comparatively less except for
visitors from zone III. 3.2. Regression Analysis
Regression was carried out on the zonal model
with the average cost per trip from each zone as
the independent variable and the zone-wise
visitation rate as the dependent variable. The
results of the regression are given in Table 3. 3.3. Demand Function
A demand curve for visits to the site was
constructed using the results of the regression
analysis. In this model, the equation was estimated
using travel cost and visits/1000.
Vz = 58.67 – 0.099C where, C = average total cost for visitors from zone z,
Table 3. Regression Analysis Output (a. b. c)
Regression Statistics (a)
Multiple R 0.99
R Square 0.98
Adjusted R Square 0.96
Standard Error 2.36
Observations 3
The first point on the demand curve is the total
visitors to the site at current access costs (Rs.40)
which in this model is 127435 visits per year. The
other points are found by estimating the number of
visitors with different hypothetical entrance fees
(assuming that entrance fee is viewed in the same
way as travel costs) (Table 4 & 5). 3.4. Total Recreational Value Generated
Total recreational value generated from each
zone was calculated by multiplying zone wise
average individual cost per trip by the actual
number of visitors from that particular zone. Table 6
below gives the details of total recreational value
generated from each zone. Recreational value
generated from zone one was Rs.0.50 crores, zone
two was Rs.0.73 crores and zone three was
Rs.3.19 crores. Total Recreational Value generated
for the entire park was estimated as Rs.4.42 crores
(Table 6).
Table 7 below gives data on revenue generated
from Thenmala Eco-tourism Park’s entrance fee.
This is the value of the Park that is taken into
consideration by the park administration when
formulating future plans and activities. But this is
just a part of the total cost incurred by visitors when
visiting the site. Comparing Table 6 and 7, it can be
seen that considering entrance fee as an indicator
of the recreational value of the Park is an
underestimate.
ANOVA (b) df SS MS F Significance F
Regression 1 315.0892 315.0892 56.49324 0.084205
Residual 1 5.577467 5.577467
Total 2 320.6667
(c)
Coefficients Standard Error t Stat Intercept 58 .6 770 4 4.89 60 34 1 1.9 84 61 X Variable -0 .0 996 1 0.01 32 53 -7.51 62
(d) P -value Lower Upper Lower Upper 95 % 95 % 9 5.0 % 9 5 .0 %
Intercept 0 .052 997 -3 .5 329 63 1 20.88 71 -.532 96 1 20 .8 871 X Variable 0 .084 205 -0 .2 680 02 0 .06 87 82 -0 .2 68 0 .068 782
205
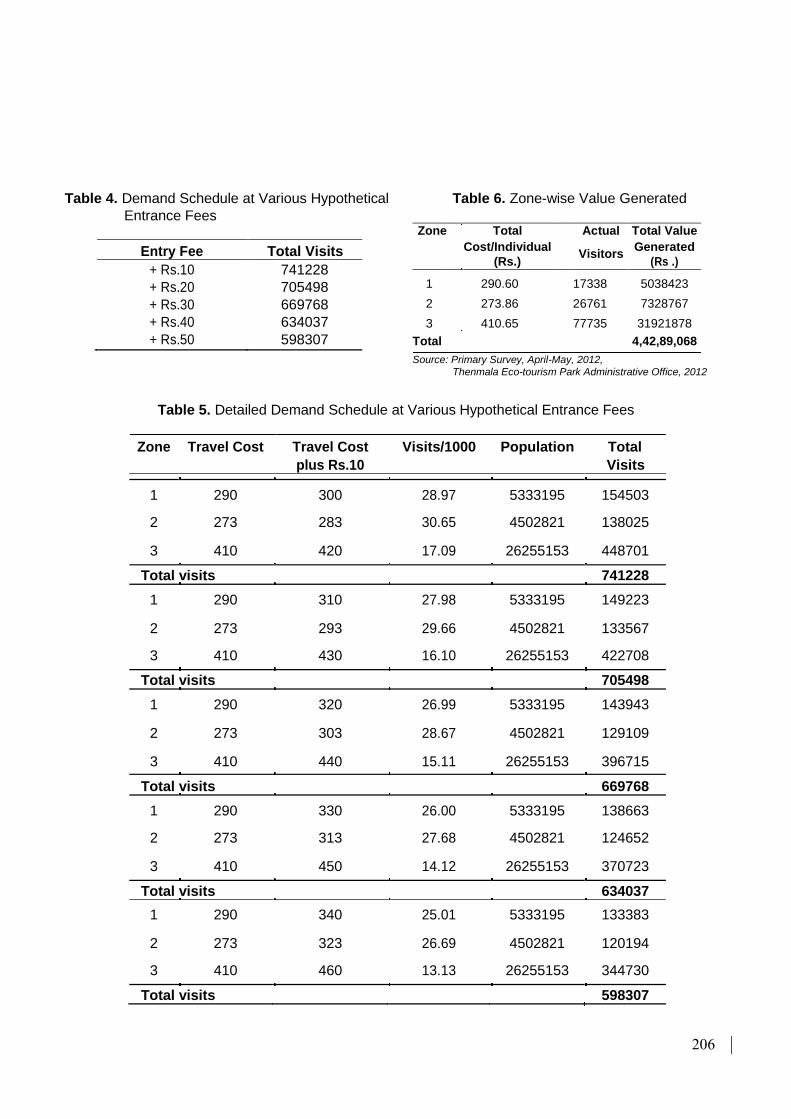
Table 4. Demand Schedule at Various Hypothetical Entrance Fees
Entry Fee Total Visits
+ Rs.10 741228 + Rs.20 705498 + Rs.30 669768 + Rs.40 634037 + Rs.50 598307
Table 6. Zone-wise Value Generated
Zone Total Actual Total Value
Cost/Individual Generated
Visitors
(Rs.) (Rs .)
1 290.60 17338 5038423
2 273.86 26761 7328767
3 410.65 77735 31921878
Total 4,42,89,068
Source: Primary Survey, April-May, 2012,
Thenmala Eco-tourism Park Administrative Office, 2012
Table 5. Detailed Demand Schedule at Various Hypothetical Entrance Fees
Zone Travel Cost Travel Cost Visits/1000 Population Total plus Rs.10 Visits
1 290 300 28.97 5333195 154503
2 273 283 30.65 4502821 138025
3 410 420 17.09 26255153 448701
Total visits 741228
1 290 310 27.98 5333195 149223
2 273 293 29.66 4502821 133567
3 410 430 16.10 26255153 422708
Total visits 705498
1 290 320 26.99 5333195 143943
2 273 303 28.67 4502821 129109
3 410 440 15.11 26255153 396715
Total visits 669768
1 290 330 26.00 5333195 138663
2 273 313 27.68 4502821 124652
3 410 450 14.12 26255153 370723
Total visits 634037
1 290 340 25.01 5333195 133383
2 273 323 26.69 4502821 120194
3 410 460 13.13 26255153 344730
Total visits 598307 206
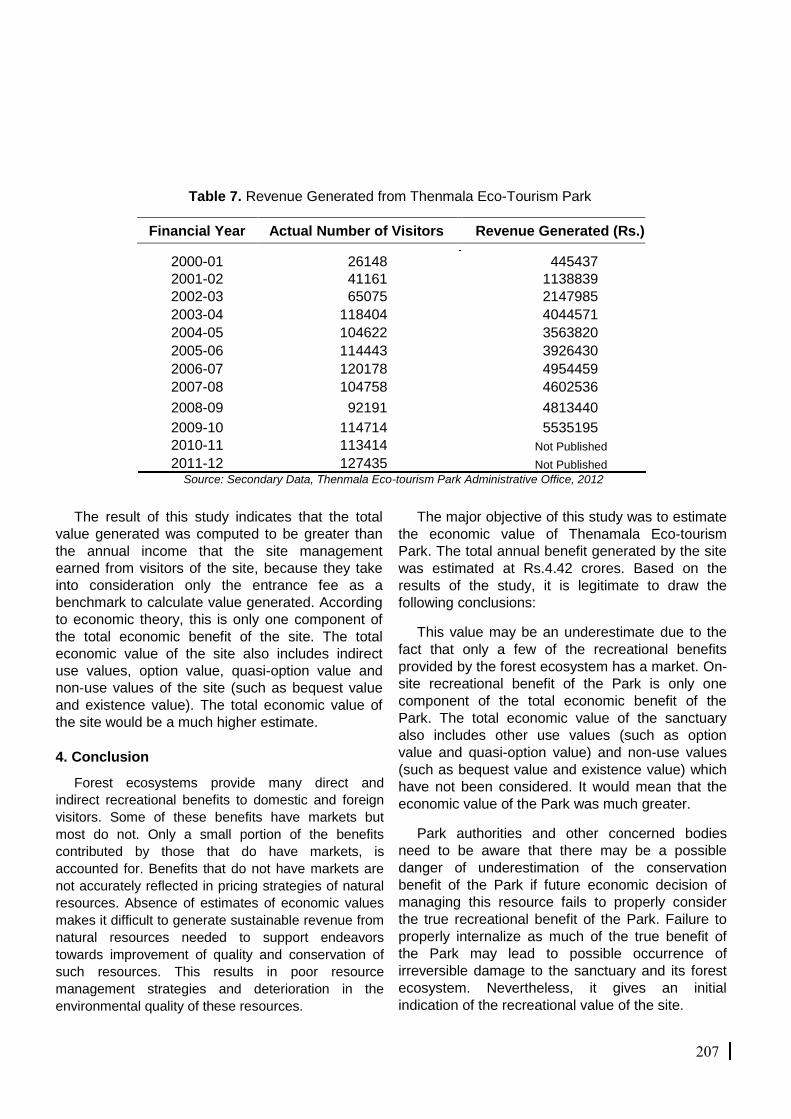
Table 7. Revenue Generated from Thenmala Eco-Tourism Park
Financial Year Actual Number of Visitors Revenue Generated (Rs.)
2000-01 26148 445437 2001-02 41161 1138839 2002-03 65075 2147985
2003-04 118404 4044571
2004-05 104622 3563820
2005-06 114443 3926430
2006-07 120178 4954459
2007-08 104758 4602536
2008-09 92191 4813440
2009-10 114714 5535195 2010-11 113414 Not Published
2011-12 127435 Not Published Source: Secondary Data, Thenmala Eco-tourism Park Administrative Office, 2012
The result of this study indicates that the total
value generated was computed to be greater than
the annual income that the site management
earned from visitors of the site, because they take
into consideration only the entrance fee as a
benchmark to calculate value generated. According
to economic theory, this is only one component of
the total economic benefit of the site. The total
economic value of the site also includes indirect
use values, option value, quasi-option value and
non-use values of the site (such as bequest value
and existence value). The total economic value of
the site would be a much higher estimate.
4. Conclusion
Forest ecosystems provide many direct and
indirect recreational benefits to domestic and foreign
visitors. Some of these benefits have markets but
most do not. Only a small portion of the benefits
contributed by those that do have markets, is
accounted for. Benefits that do not have markets are
not accurately reflected in pricing strategies of natural
resources. Absence of estimates of economic values
makes it difficult to generate sustainable revenue from
natural resources needed to support endeavors
towards improvement of quality and conservation of
such resources. This results in poor resource
management strategies and deterioration in the
environmental quality of these resources.
The major objective of this study was to estimate
the economic value of Thenamala Eco-tourism
Park. The total annual benefit generated by the site
was estimated at Rs.4.42 crores. Based on the
results of the study, it is legitimate to draw the
following conclusions: This value may be an underestimate due to the
fact that only a few of the recreational benefits
provided by the forest ecosystem has a market. On-
site recreational benefit of the Park is only one
component of the total economic benefit of the
Park. The total economic value of the sanctuary
also includes other use values (such as option
value and quasi-option value) and non-use values
(such as bequest value and existence value) which
have not been considered. It would mean that the
economic value of the Park was much greater. Park authorities and other concerned bodies
need to be aware that there may be a possible
danger of underestimation of the conservation
benefit of the Park if future economic decision of
managing this resource fails to properly consider
the true recreational benefit of the Park. Failure to
properly internalize as much of the true benefit of
the Park may lead to possible occurrence of
irreversible damage to the sanctuary and its forest
ecosystem. Nevertheless, it gives an initial
indication of the recreational value of the site.
207
Total value generated was computed to be greater
than the annual income that the site management
earned from visitors of the site, because they take
into consideration only the entrance fee as a
benchmark to calculate value generated. Thus, the
site management was able to capture only a part of
the true recreational benefits provided by the site.
This implies that the amount of revenue that the site
authorities collect from the service is far from the
true recreational value of the site.
A comparison of the recreational benefits of the
site and the actual revenue collected by the site
authorities indicates that it may be possible to
further augment actual revenue, which could
possibly be reinvested to improve the quality and
the conservation benefit of the site.
Policy makers and decision makers need to have
strong idea about economic values of
environmental resources before they plan to launch
similar projects. By any measure, decision on
allocation of environmental resources would be
appropriate if it is based on an economic estimate
obtained through accepted estimation techniques
than valuing resources on the basis of revenue
realized alone. It would, therefore, be of great
importance if environmental authorities base their
future economic decisions on the economic value of
these resources estimated using environmental
valuation techniques.
5. References Hanley, N. and Spash, C. 1993. Cost-Benefit
Analysis and the Environment, Cheltenhan,
UK: Edward Elgar.
McConnell, K.E. and Ivar, E. Strand Jr. 1981.
‘Measuring the Cost of Time in Recreation
Demand Analysis,’ American Journal of
Agricultural Economics. 63: 153-156.
Navrud, S. and Mungatana, E. 1994. Environmental
Valuation in Developing Countries: The
Recreation Value of Wildlife Viewing, Ecological Economics, 11: 135-151.
Shammin, R. 1999 Application of the Travel Cost
Method (TCM): A Case Study of Environmental
Valuation of Dhaka Zoological Garden In:
Hecht, J.E (ed.) ‘The Economic Value of the
Environment: Cases from South Asia,’ IUCN –
International Union for Conservation of Nature. Ward, F.A. and Beal, D. 2000. Valuing Nature with
Travel Costs: A Manual, Cheltenham: Edward
Elgar Publishing Limited, UK.
208
Related Documents