3/23/2005 © Dr. Zachary Wartell 1 Eyes and Displays: 2D Images ITCS 6125/8125 Virtual Environments © Dr. Zachary Wartell UNC Charlotte 2011 Contributors: Bill Ribarsky, Larry F. Hodges, Ben Watson, Drew Kessler

3/23/2005 © Dr. Zachary Wartell 1 Eyes and Displays: 2D Images ITCS 6125/8125 Virtual Environments © Dr. Zachary Wartell UNC Charlotte 2011 Contributors:
Dec 19, 2015
Welcome message from author
This document is posted to help you gain knowledge. Please leave a comment to let me know what you think about it! Share it to your friends and learn new things together.
Transcript

3/23/2005© Dr. Zachary Wartell 1
Eyes and Displays: 2D Images
ITCS 6125/8125 Virtual Environments
© Dr. Zachary WartellUNC Charlotte 2011
Contributors: Bill Ribarsky, Larry F. Hodges, Ben Watson, Drew Kessler

3/23/2005© Dr. Zachary Wartell 2
Light
© Kessler , Watson, Hodges, Ribarsky
• Vision is perception of electromagnetic energy (EM radiation).
• Humans can only perceive a very small portion of the EM spectrum:
Wavelength (nm)
Gamma X UV Infra Radar FM TV AM AC
Violet Blue Green Yellow Red 400 500 600 700

3/23/2005© Dr. Zachary Wartell 3
Radiant-EnergyEmission Spectrum
Wavelength
Ene
rgy
or P
ower
,
Energy [ joules]:
, ( :Plank's Constant)
Power[Watts=J/s] :
, radiant flux, radiant power
photon f
fall photons
sourcef all photons
E h f h
E h f
E h f
dE
dt

3/23/2005© Dr. Zachary Wartell 4
Light in real world
medium
emission spectrum
reflection spectrum
phototopic curve(eye sensitivity)

3/23/2005© Dr. Zachary Wartell 5
Light in graphics
medium
emission spectrum
reflection spectrum
Display
RGB
RGB
RGB
RGBRGB
RGBpixels
space “outside”display typically
not computationallymodeled

3/23/2005© Dr. Zachary Wartell 6
Light interactions
Light interacts with a surface in some combination of:
• emission• reflection
– on surface : mirror, specular or diffuse– suspended particles: random scattering
• transmission– transparent, translucent, refraction
• absorption

3/23/2005 7
ciliary muscle
Eye Structure• The eye can be viewed as a dynamic, biological camera: it
has a lens, a focal length, and an equivalent of film.
• A simple diagram of the eye's structure:
retina
lens
cornea
suspensory ligments
iris
pupil
3/23/2005© Dr. Zachary Wartell 8
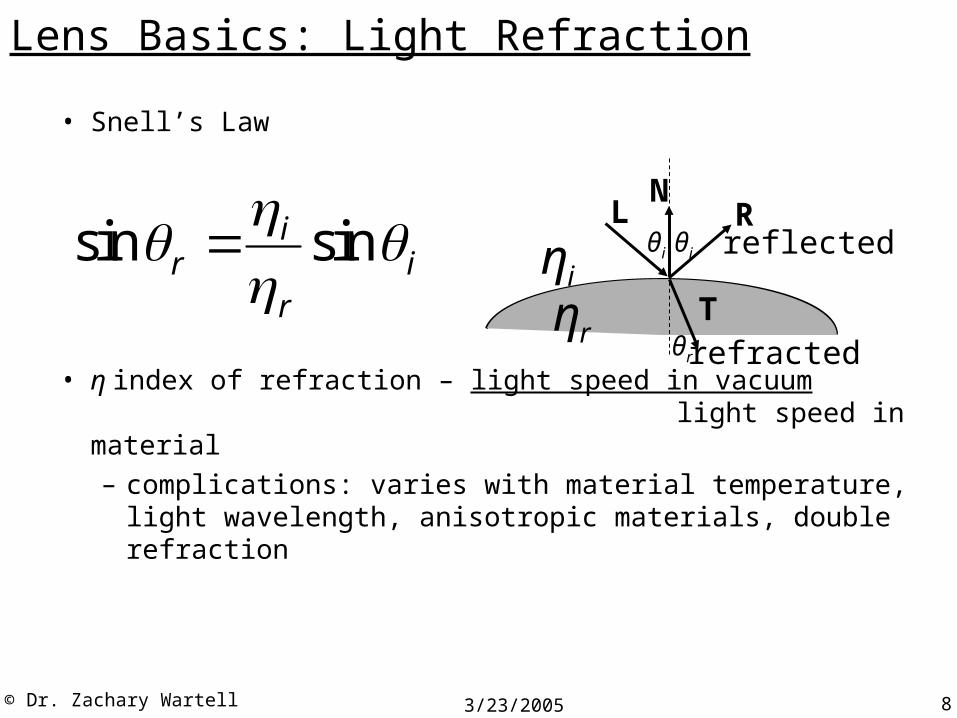
Lens Basics: Light Refraction
• Snell’s Law
• η index of refraction – light speed in vacuum light speed in material– complications: varies with material temperature, light
wavelength, anisotropic materials, double refraction
NL
T
Rθiθi
θr
reflected
refracted
ηiηr
sin sinir i
r

3/23/2005© Dr. Zachary Wartell 9
Thin Lens Equation
:object distance1 1 1
:image distance
:focal distance
o
so i f
f
ff
o i

3/23/2005© Dr. Zachary Wartell 10
Thin Lens Equation
• If the incident light comes from the object, we say it is a real object, and define the distance from the lens to it as positive. Otherwise, it is virtual and the distance is negative.
• If the emergent light goes toward the image, we say it is a real image, and define the distance from the lens to it as positive.
• f = positive for a converging lens• f often cited in measured in diopters (1/m)• A light ray through the center of the lens is undeflected.
, Dr. Larry Hodges
ff
o i
ff
o i

3/23/2005© Dr. Zachary Wartell 11
Eye: The Lens
• The lens must focus (accommodation) on directly on the retina for perfect vision:
• But age, genetic factors, malnutrition and disease can unfocus the eye, leading to near- and farsightedness:
Farsighted
Nearsighted
© Kessler , Watson, Hodges, Ribarsky, Wartell
Normal
Normal

3/23/2005© Dr. Zachary Wartell 12
Eye: The Retina
• The retina functions as the eye's "film".
• It is covered with cells sensitive to light. These cells turn the light into electrochemical impulses that are sent to the brain.
• There are two types of cells, rods and cones
Retina
© Kessler , Watson, Hodges, Ribarsky

3/23/2005© Dr. Zachary Wartell 13
The Retina: Cell Distribution
© Kessler , Watson, Hodges, Ribarsky
20,000
100,000
60,000
180,000
140,000
cones
rods
Blind spot
Num
bers
of r
ods
or c
ones
pe
r m
m2
Temporal periphery
Fov
ea
Opt
ic d
isk
Nasal
periphery
(Right Eye)
20,000
100,000
60,000
180,000
140,000
cones
rods
Blind spot
Num
bers
of r
ods
or c
ones
pe
r m
m2
Temporal periphery
Fov
ea
Opt
ic d
isk
Nasal
periphery
(Right Eye)“Blind Spot Trick”
3/23/2005© Dr. Zachary Wartell 14
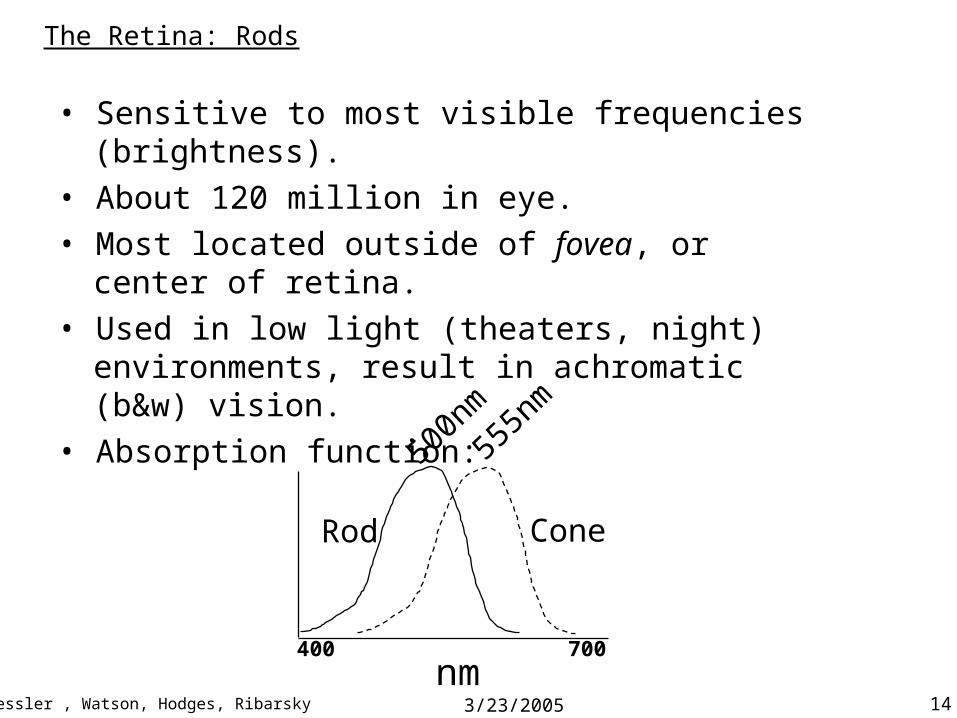
The Retina: Rods
© Kessler , Watson, Hodges, Ribarsky
• Sensitive to most visible frequencies (brightness).
• About 120 million in eye.
• Most located outside of fovea, or center of retina.
• Used in low light (theaters, night) environments, result in achromatic (b&w) vision.
• Absorption function:
400 700nm
500n
m
Rod
555n
m
Cone

3/23/2005© Dr. Zachary Wartell 15
The Retina: Cones
© Kessler , Watson, Hodges, Ribarsky
• R cones are sensitive to long wavelengths (nm), G to middle nm, and B to short nm.
• R: 64%, 32% G, 2% B• About 8 million in eye.• Highly concentrated in fovea, with B cones more evenly
distributed than the others (hence less in fovea).• Used for high detail color vision (CRTs!), so they will
concern us most.

3/23/2005© Dr. Zachary Wartell 16
The Retina: Cones
© Kessler , Watson, Hodges, Ribarsky
• The absorption functions of the cones are:
400 700
B G R445 nm 535 nm
575 nm

3/23/2005© Dr. Zachary Wartell 17
Colorimetry: Measuring Color
• Colorimeter: adjust primaries so that:
R[R]
G[G]
B[B]
eye
C[C]
white screen
black partition
view holewith surround
“C[C] = R[R] + B[B] + G[G]”


3/23/2005© Dr. Zachary Wartell 19
Negative tristimulus values
• very pure target color may be unmatchable
C[C] ≠ R[R]+ G[G]+ B[B] for any (R,G,B)
• all we can do is de-saturate the target color C[C] + R[R] = G[G]+ B[B]
• this could be formulated as negative coordinates C[C] = -R[R] + G[G]+ B[B]
• No set of real primaries will allow for positive coordinates to match all real colors!

3/23/2005© Dr. Zachary Wartell 20
An Early Experiment (1931)
• Primaries: [R]=700nm, [G] = 546.1, [B] = 435.8• Determine tristimulus values (R,G,B) for set of target
stimulus {[Ci]} where [Ci] is a single spectral color (i.e. SPD contains 1 wavelength)
• Use (R,G,B)λ to definedistribution curves
, ,r g b 435.8 546.1 700

3/23/2005© Dr. Zachary Wartell 21
Vision: Metamers
© Kessler , Watson, Hodges, Ribarsky,Wartell
• Because all colors are represented to the brain as ratios of three signals it is possible for different frequency combinations to appear as the same color. These combinations are called metamers.
This is why RGB color works!• Example – [Goldstein,pg143]
mix 620nm red light with 530nm green light matches color percept of 580 nm yellow
BG
R
1.05.0 8.0
BG
R
1.05.0 8.0
530 + 620 580

3/23/2005© Dr. Zachary Wartell 22
Color Constancy
© Kessler , Watson, Hodges, Ribarsky
• If color is just light of a certain wavelength, why does a yellow object always look yellow under different lighting (e.g. interior/exterior)?
• This is the phenomenon of color constancy.• Colors are constant under different lighting
because the brain responds to ratios between the R, G and B cones, and not magnitudes.

3/23/2005© Dr. Zachary Wartell 23
Sensitivity vs Acuity
© Kessler , Watson, Hodges, Ribarsky
• Sensitivity is a measure of the dimmest light the eye can detect.
• Acuity is a measure of the smallest object the eye can see.
• These two capabilities are in competition.
– In the fovea, cones are closely packed. Acuity is at its highest, sensitivity is at its lowest (30 cycles per degree).
– Outside the fovea, acuity decreases rapidly. Sensitivity increases correspondingly.

Field of View
Approximate:
• 120 degrees vertical• 150 degrees horizontal (one eye)• 200 degrees horizontal (both eyes)
3/23/2005© Dr. Zachary Wartell 24

3/23/2005© Dr. Zachary Wartell 25
Displays: Pixel
• Pixel - The most basic addressable element in a image or on a display
– CRT - Color triad (RGB phosphor dots)– LCD - Single color element
• Resolution - measure of number of pixels on a image (m by n)
– m - Horizontal image resolution– n - Vertical image resolution
©Larry F. Hodges, Zachary Wartell
3/23/2005© Dr. Zachary Wartell 26
Other meanings of resolution
• Dot Pitch [Display] - Size of a display pixel, distance from center to center of individual pixels on display
• Cycles per degree [Display] - Addressable elements (pixels) divided by twice the FOV measured in degrees.
• Cycles per degree [Eye] - The human eye can resolve 30 cycles per degree (20/20 Snellen acuity).
©Larry F. Hodges, Zachary Wartell

3/23/2005© Dr. Zachary Wartell 27
Raster – Bit Depth
• A raster image may be thought of as computer memory organized as a two-dimensional array with each (x,y) addressable location corresponding to one pixel.
• Bit Planes or Bit Depth is the number of bits corresponding to each pixel.
• A typical framebuffer resolution might be
1280 x 1024 x 8
1280 x 1024 x 24
1600 x 1200 x 24
©Larry F. Hodges, Zachary Wartell

3/23/2005© Dr. Zachary Wartell 28
Displaying Color
• There are no commercially available small pixel technologies that can individually change color.
• spatial integration – place “mini”-pixels of a few fixed colors very close together. The eye & brain spatially integrate the “mini”-pixel cluster into a perception of a pixel of arbitrary color
• temporal integration - field sequential color uses red, blue and green liquid crystal shutters to change color in front of a monochrome light source. The eye & brain temporally integrate the result into a perception of pixels of arbitrary color
©Larry F. Hodges, Zachary Wartell

3/23/2005© Dr. Zachary Wartell 29
CRT Display
©Larry F. Hodges, Zachary Wartell
Focusing System
Electron Guns
Red Input
GreenInput
Blue Input
Deflection Yoke
Shadow Mask
Red, Blue, and Green
Phosphor Dots
CRT

3/23/2005© Dr. Zachary Wartell 30
Electron Gun
•Contains a filament that, when heated, emits a stream of electrons.
•Electrons are focused with an electromagnet into a sharp beam and directed to a specific point of the face of the picture tube.
•The front surface of the picture tube is coated with small phosphor dots.
•When the beam hits a phosphor dot it glows with a brightness proportional to the strength of the beam and how often it is excited by the beam.
©Larry F. Hodges, Zachary Wartell

3/23/2005© Dr. Zachary Wartell 31
•Red, Green and Blue electron guns.
•Screen coated with phosphor triads.
•Each triad is composed of a red, blue and green phosphor dot.
•Typically 2.3 to 2.5 triads per pixel.
FLUORESCENCE - Light emitted while the phosphor is being struck by electrons.
PHOSPHORESCENCE - Light given off once the electron beam is removed.
PERSISTENCE - Is the time from the removal of excitation to the moment when phosphorescence has decayed to 10% of the initial light output.
Color CRT
©Larry F. Hodges, Zachary Wartell
G R B G
B G R B
G R B G
3/23/2005© Dr. Zachary Wartell 32©Larry F. Hodges, Zachary Wartell
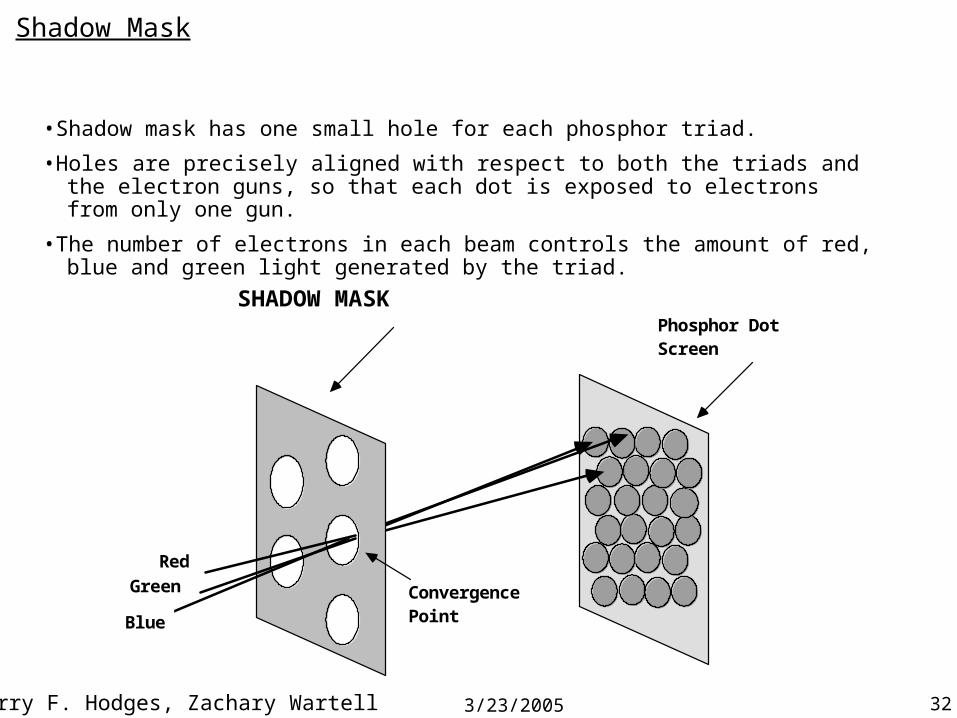
•Shadow mask has one small hole for each phosphor triad.
•Holes are precisely aligned with respect to both the triads and the electron guns, so that each dot is exposed to electrons from only one gun.
•The number of electrons in each beam controls the amount of red, blue and green light generated by the triad.
Shadow Mask
SHADOW MASK
RedGreen
Blue
Convergence Point
Phosphor Dot Screen

3/23/2005© Dr. Zachary Wartell 33
CRITICAL FUSION FREQUENCY
•Typically 60-85 times per second for raster displays.
•Varies with intensity, individuals, phosphor persistence, room lighting.
Frame: The image to be scanned out on the CRT.
•Some minimum number of frames must be displayed each second to eliminate flicker in the image.
Scanning An Image
©Larry F. Hodges, Zachary Wartell

3/23/2005© Dr. Zachary Wartell 34
•Display frame rate 30 times per second
•To reduce flicker at lesser bandwidths (Bits/sec.), divide frame into two fields—one consisting of the even scan lines and the other of the odd scan lines.
•Even and odd fields are scanned out alternately to produce an interlaced image.
•non-interlaced also called “progressive”
©Larry F. Hodges, Zachary Wartell
Time
Interlaced Scanning
1/30 SEC
1/60 SEC
FIELD 1 FIELD 2
FRAME
1/60 SEC
1/30 SEC
1/60 SEC
FIELD 1 FIELD 2
FRAME
1/60 SEC

3/23/2005© Dr. Zachary Wartell 35
(0,0)
VERTICAL SYNC PULSE — Signals the start of the next field.
VERTICAL RETRACE — Time needed to get from the bottom of the current field to the top of the next field.
HORIZONTAL SYNC PULSE — Signals the start of the new scan line.
HORIZONTAL RETRACE — Time needed to get from the end of the current scan line to the start of the next scan line.
Scanning
©Larry F. Hodges, Zachary Wartell
Device CS(alternate conventions)
(0,0)

3/23/2005© Dr. Zachary Wartell 36
NTSC – ? x 525, 30f/s, interlaced (60 fld/s)PAL – ? x 625, 25f/s, interlaced (50 fld/s)HDTV – 1920 x 1080i, 1280 x 720pXVGA – 1024x768, 60+ f/s, non-interlacedgeneric RGB – 3 independent video signals and synchronization signal, vary in resolution and refresh rategeneric time-multiplexed color – R,G,B one after another on a single signal, vary in resolution and refresh rate
Example Video Formats
©Larry F. Hodges, Zachary Wartell

3/23/2005© Dr. Zachary Wartell 37
Calligraphic/Vector CRT
older technologyvector file instead of framebufferwireframe engineering drawings flight simulators: combined raster-vector CRT
P0
P1
P0
P1
Line (P0,P1)Video
Controller

3/23/2005© Dr. Zachary Wartell 38
Flat-Panel Displays
Flat-Panel
Emissive Non-Emissive
LED
CRT(90°deflected)
Plasma
Thin-Filmelectroluminescent
LCD DMD
Active-Matrix(TFT)
Passive-Matrix

3/23/2005© Dr. Zachary Wartell 39
Flat-Panel Displays (Plasma)
Flat-Panel
Emissive Non-Emissive
LED
CRT(90°deflected)
Plasma
Thin-Filmelectroluminescent
LCD DMD
Active-Matrix
Passive-Matrix
ToshibaTM, 42”, Plasma HTDV$4,500 (circa 2005)

3/23/2005© Dr. Zachary Wartell 40
Flat-Panel Displays (Plasma)
[Hearn&Baker,pg 45]

3/23/2005© Dr. Zachary Wartell 41
Flat-Panel Displays (thin-film electroluminescent)
[Hearn&Baker,pg 45]
3/23/2005© Dr. Zachary Wartell 42
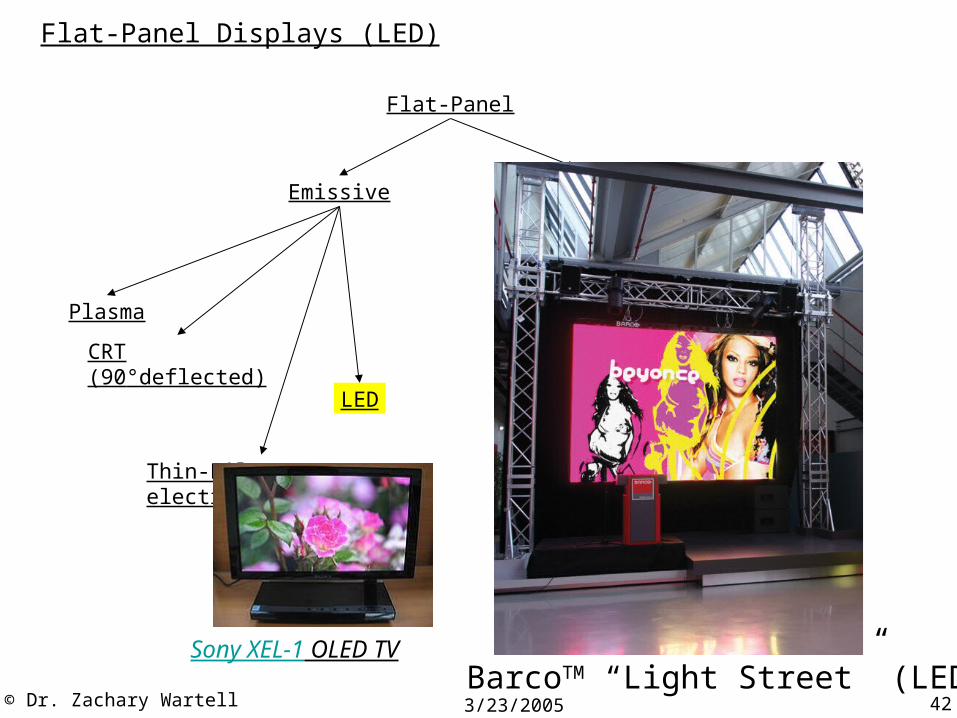
Flat-Panel Displays (LED)
Flat-Panel
Emissive Non-Emissive
LED
CRT(90°deflected)
Plasma
Thin-Filmelectroluminescent
LCD DMD
Active-Matrix
Passive-Matrix
BarcoTM “Light Street” (LED)Sony XEL-1 OLED TV

3/23/2005© Dr. Zachary Wartell 43
Flat-Panel Displays (DMD)
Flat-Panel
Emissive Non-Emissive
LED
CRT(90°deflected)
Plasma
Thin-Filmelectroluminescent
LCD DMD
Active-Matrix
Passive-Matrix
Digital Micro-mirror (DMD)
4 μm

3/23/2005© Dr. Zachary Wartell 44
LCD
©Larry F. Hodges, Zachary Wartell
• Liquid crystal displays use small flat chips which change their transparency properties when a voltage is applied.
• LCD elements are arranged in an n x m array call the LCD matrix
• Level of voltage controls gray levels.• LCDs elements do not emit light, use backlights behind the LCD
matrix

3/23/2005© Dr. Zachary Wartell 45
LCD nematic liquid crystal details
[Hearn&Baker,pg 46]

3/23/2005© Dr. Zachary Wartell 46
LCD Components
©Larry F. Hodges, Zachary Wartell
Small fluorescent tubes
Diffuser
Linear Polarizer
LCD Module Color
Filter
Linear Polarizer
Wavefront distortion
filter

3/23/2005© Dr. Zachary Wartell 47
LCD Resolution
©Larry F. Hodges, Zachary Wartell
LCD resolution is occasionally quoted as number of pixel elements not number of RGB pixels.
Example: 3840 horizontal by 1024 vertical pixel elements = 4M elements
Equivalent to 4M/3 = 1M RGB pixels
"Pixel Resolution" is 1280x1024
dot pitch

3/23/2005© Dr. Zachary Wartell 48
LCD Types
©Larry F. Hodges, Zachary Wartell
• Passive LCD screens– Cycle through each
element of the LCD matrix applying the voltage required for that element.
– Once aligned with the electric field the molecules in the LCD will hold their alignment for a short time
• Active LCD (TFT)– Each element contains
a small transistor that maintains the voltage until the next refresh cycle.
– Higher contrast and much faster response than passive LCD
– Circa 2005 this is the commodity technology

3/23/2005© Dr. Zachary Wartell 49
Example Comparison: LCD vs CRT
©Larry F. Hodges, Zachary Wartell
flat & Lightweight
low power consumption
always some light
pixel response-time (8-30ms)
view angle limitations
resolution interpolation required
heavy & bulky
strong EM field & high voltage
true black
better contrast
pixel response-time not noticeable
inherent multi-resolution support

Projected Displays
• Bigger screen for less money (vs tiled displays)– wider audience– wider FOV
• Emissive– CRT– Laser
• Non-emissive– LCD - light transmits through LCD to exit lens– DMD - light reflects from DMD to exit lens
3/23/2005© Dr. Zachary Wartell 50

Projected Displays
3/23/2005© Dr. Zachary Wartell 51

Back projected vs Front projected• Back-projected
– need large room or cabinet(folded optics helpful!)
– screen transmits projected image– low contrast from backscreen ambient light
• Front-projected– need smaller room + screen/wall– reflective screen reflects projected image
• problem: screen also strongly reflects ambient room light!
– mobile VR users can cast ugly shadow • short-throw projectors can help
3/23/2005© Dr. Zachary Wartell 52

3/23/2005© Dr. Zachary Wartell 53
Eye Versus 1280 x 1024 Display
28° 1280 pixel = 640 cycles
33 cm
Pictured: 22.8 c/d (cycles/degree with Vres=600/x → 26.25→ 20/26.25 vision (Snellen acuity)Widescreen at 60° → 20/56.25 vision
66 cm
Related Documents


![Whirlpool Awm 8125 [ET]](https://static.cupdf.com/doc/110x72/542f4a5d219acdf4478b58e6/whirlpool-awm-8125-et.jpg)


