Sources of error • Random error – Random error plays a role in all epidemiologic studies – We use statistics to quantify the role of chance (to be discussed in statistical inference module) – Random error relates to the concept of precision

Welcome message from author
This document is posted to help you gain knowledge. Please leave a comment to let me know what you think about it! Share it to your friends and learn new things together.
Transcript

1
Sources of error• Random error
– Random error plays a role in all epidemiologic studies– We use statistics to quantify the role of chance (to be
discussed in statistical inference module)– Random error relates to the concept of precision

2
Sources of error• Random error
– Random error based on the concept of hypothetical study repetitions
– Even if you conduct your study perfectly, your measure of association can still differ from the true measure of association in the source population due to chance
– This is because your sample is only one of innumerable samples you could have selected by chance
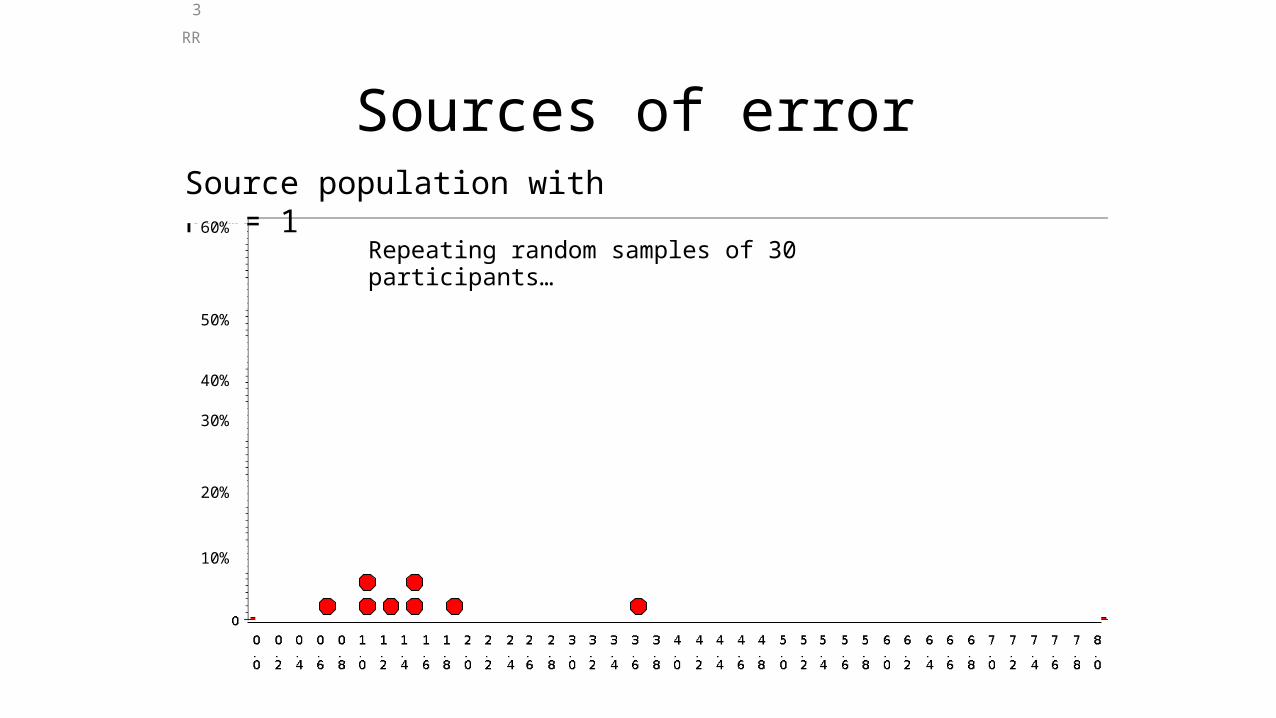
Sources of errorSource population with RR = 1
20%
10%
30%
60%Repeating random samples of 30 participants…
50%
40%
3RR
Sources of error
Many of the samples found RR much different from truth in source population of RR = 1
If you could repeat your study many hundreds of times with new random samples of 30 participants these are the measures of association you would observe
Obviously you never get to do this in real life, but this is conceptually what random error captures
10%
20%
30%
40%
50%
60%
Source population with RR = 1
4RR
5
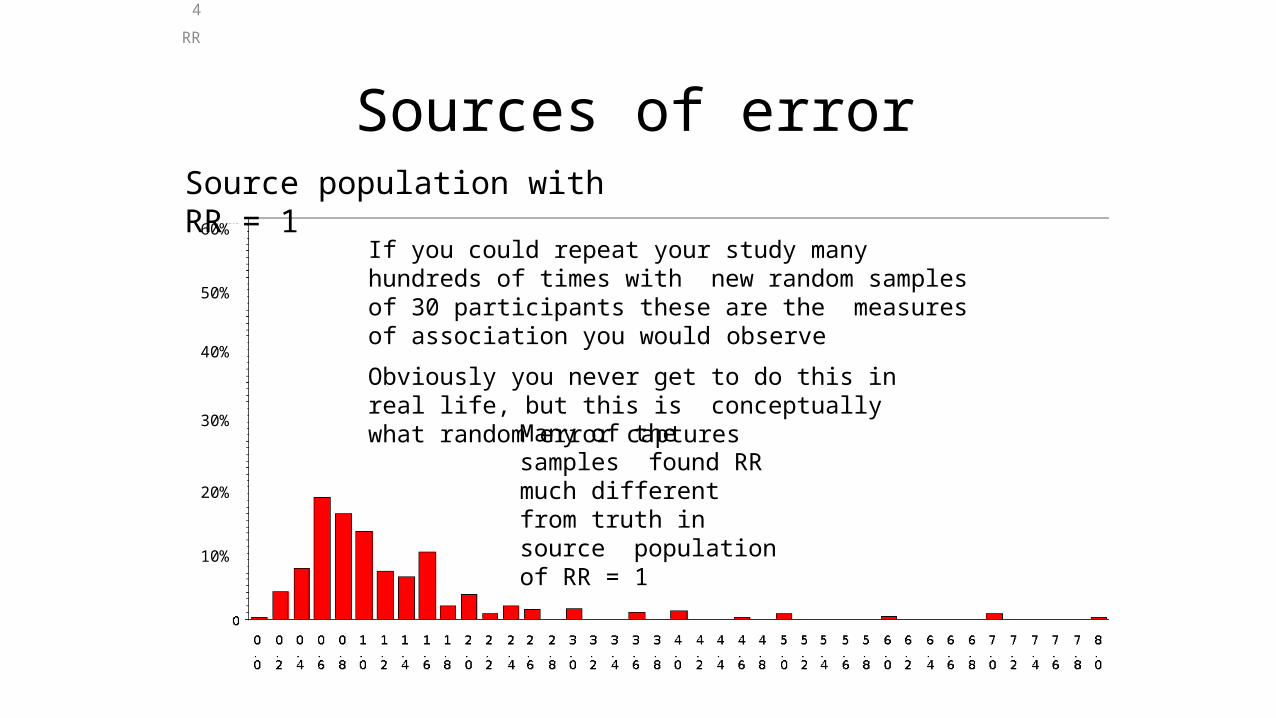
Sources of error• Systematic error or bias
– Systematic error also plays a role in all epidemiologic studies
– Systematic error or bias is a systematic difference between association observed and causal effect
– It is difficult to quantify the exact effect of bias on study findings
– Therefore must try to design studies and collect data in a manner that avoids/minimizes introducing bias
– Systematic error relates to the concept of validity
6
Sources of error• Random error
– Precision is the lack of random error– If there is only random error, over many study
repetitions your estimates of association will center around the truth in the source population
• Systematic error or bias– Validity is the lack of systematic error– If there is systematic error, over many study
repetitions your estimates of association will not center around the truth in the source population
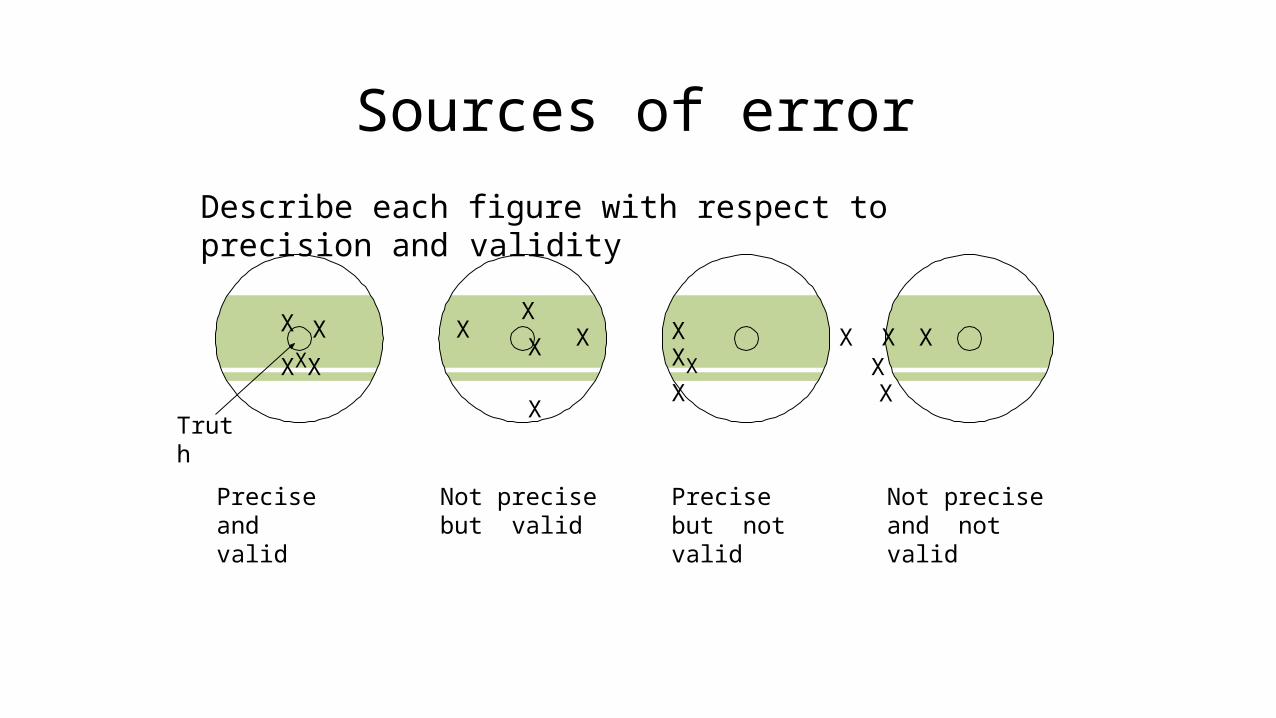
Sources of error
X
XX
X
X X
X
X X XXXX
Precise and valid
Not precise but valid
Precise but not valid
Not precise and not valid
X XXX
Describe each figure with respect to precision and validity
XX
Truth
7
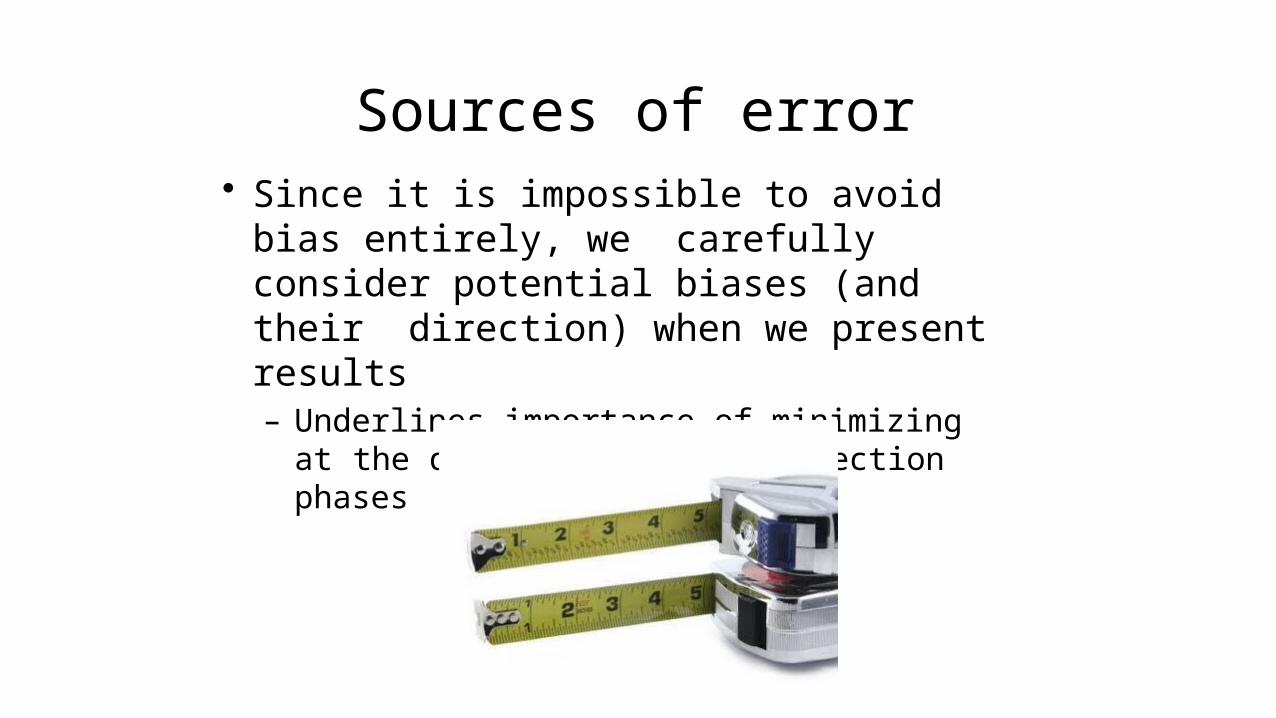
Sources of error• Since it is impossible to avoid bias entirely, we
carefully consider potential biases (and their direction) when we present results– Underlines importance of minimizing at the design
and data collection phases
8

Sources of error• Like associations between variables, bias has a
direction and a magnitude– Direction refers to how the bias changes the effect
estimate• Bias toward the null (conservative bias)• Bias away from the null exaggerates the association
– Magnitude refers to the strength of the bias – the extent to which it distorts the association
9

10
Sources of error• Direction (either towards or away from null)
– Towards the null• For relative measures, closer to 1 than true measure• For absolute measures, closer to 0 than true measure• Examples:
– Study RR = 2.0, true RR = 3.0– Study RR = 0.7, true RR = 0.5– Study RD = 0.011, true RD = 0.022– Study RD = -0.03, true RD = -0.09
11
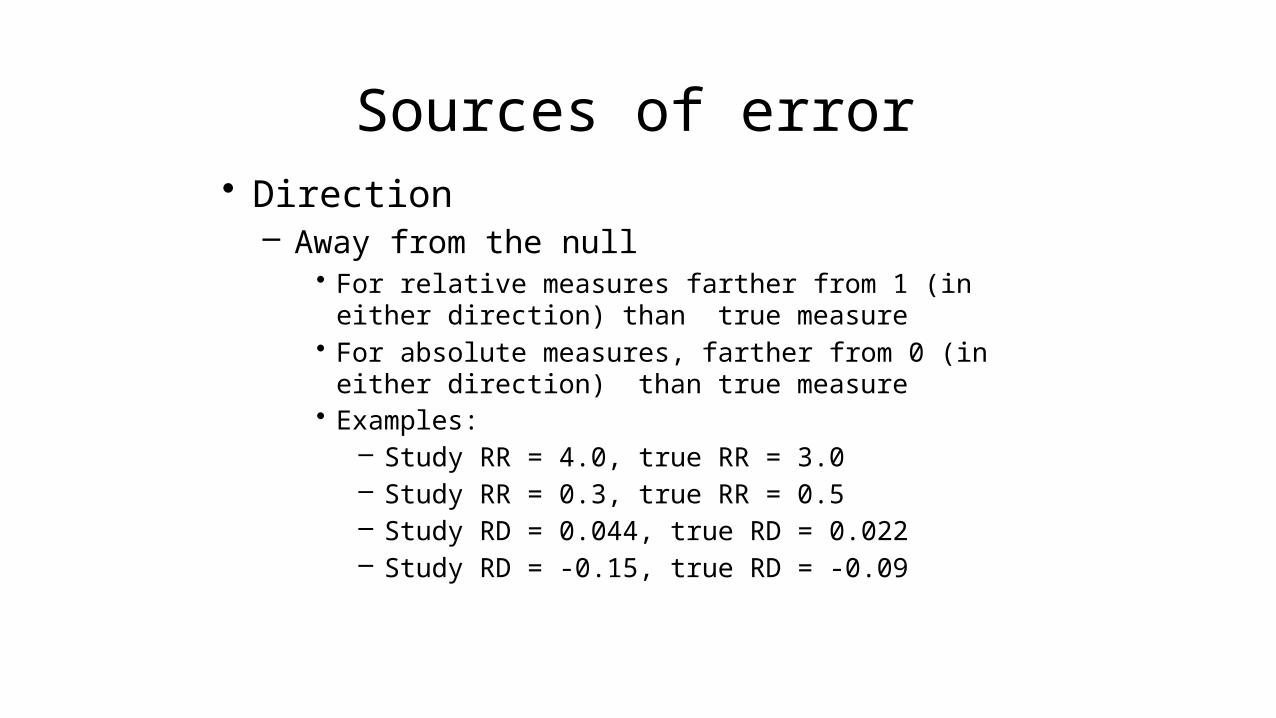
Sources of error• Direction
– Away from the null• For relative measures farther from 1 (in either direction) than
true measure• For absolute measures, farther from 0 (in either direction)
than true measure• Examples:
– Study RR = 4.0, true RR = 3.0– Study RR = 0.3, true RR = 0.5– Study RD = 0.044, true RD = 0.022– Study RD = -0.15, true RD = -0.09
Sources of error• Magnitude
– Strong bias – major distortion of the true association• Example: study RR = 10.0, true RR = 1.0
– Weak bias – minor distortion of the true association• Example: study RD = 0.011, true RD = 0.012
– Extremes are obvious but middle range is subjective
12
Sources of error• Typically epidemiologic associations will
represent a combination of causal association and error (random and systematic)
13

14
Sources of error• Example illustrating bias/validity versus random
error/precision– A tape measure with only hash-marks for feet (not
inches or any smaller unit) will give imprecise measures of height
– You would be unable to measure people’s height with more precision than feet: 5 to 6 feet, 4 to 5 feet, etc.
– The instrument would not introduce a systematic error in any direction—just random error around the true value
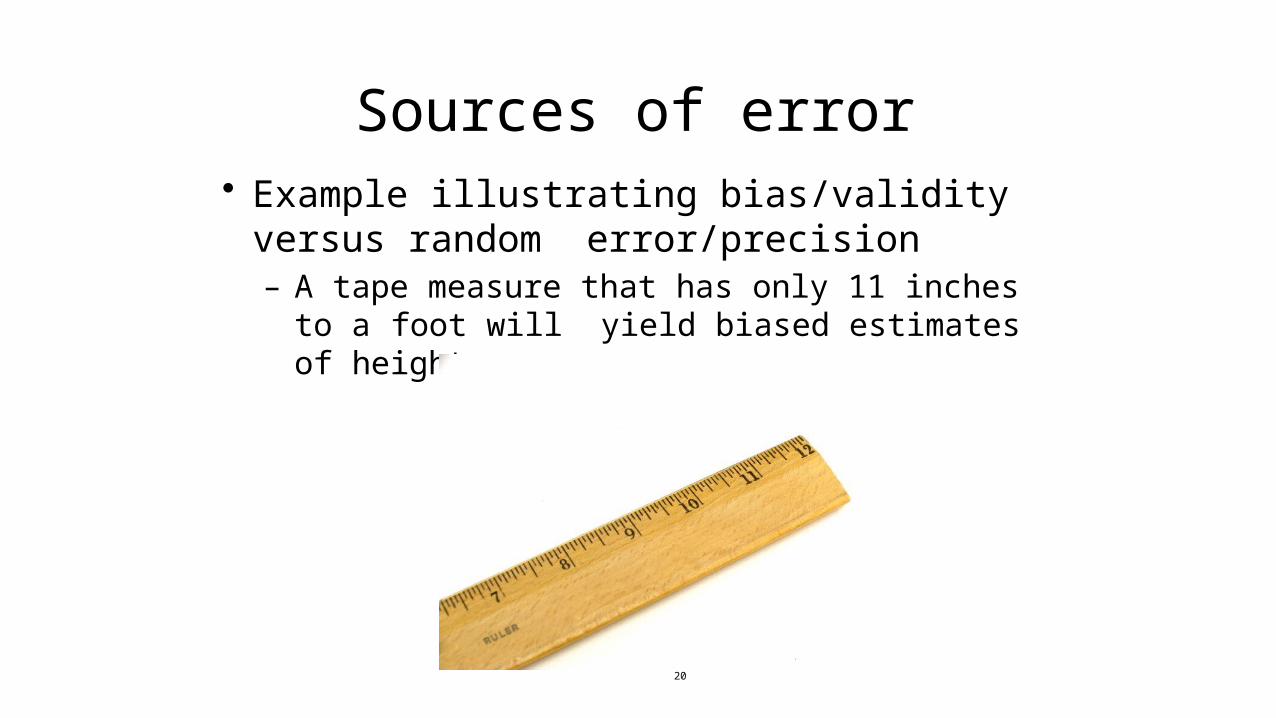
Sources of error• Example illustrating bias/validity versus random
error/precision– A tape measure that has only 11 inches to a foot will
yield biased estimates of height
20

16
Sources of error– Any height greater than 11 inches will be incorrect,
and the error introduced is systematic – it has a direction and a magnitude
• For example, someone who is 5’10” will be measured on average as 6’4” whenever you use this tape measure, systematically
Related Documents