Name _______________________________________________________ Date ___________________ Block _____ 3.1 Assignment – Graphing Linear Functions & Quadratics in (ℎ, ) Graph the following equations and answer the corresponding questions. 1. =− 1 2 −1 2. 3 − 4 = −12 Slope: _______ -int: _______ Slope: _______ -int: _______ Domain: _______ -int: _______ Domain: _______ -int: _______ Range: _______ Range: _______ 3. = −( + 3) 2 + 16 Vertex: _______ is ______________ so the graph ________________________ -int: _______ -int(s): _______ Reflection of the -int: _______ Axis of symmetry: _______ Extrema: _________________________________________ End Behavior: As → ∞ , → ___ As → −∞ , → ___ Increasing interval: _______ Decreasing interval: _______ Domain: ______________ Range: ______________ Transformations from the parent function ( = 2 ): 4. = 2 2 − 50 Vertex: _______ is ______________ so the graph ________________________ -int: _______ -int(s): _______ Reflection of the -int: _______ Axis of symmetry: _______ Extrema: _________________________________________ End Behavior: As → ∞ , → ___ As → −∞ , → ___ Increasing interval: _______ Decreasing interval: _______ Domain: ______________ Range: ______________ Transformations from the parent function ( = 2 ):

Welcome message from author
This document is posted to help you gain knowledge. Please leave a comment to let me know what you think about it! Share it to your friends and learn new things together.
Transcript
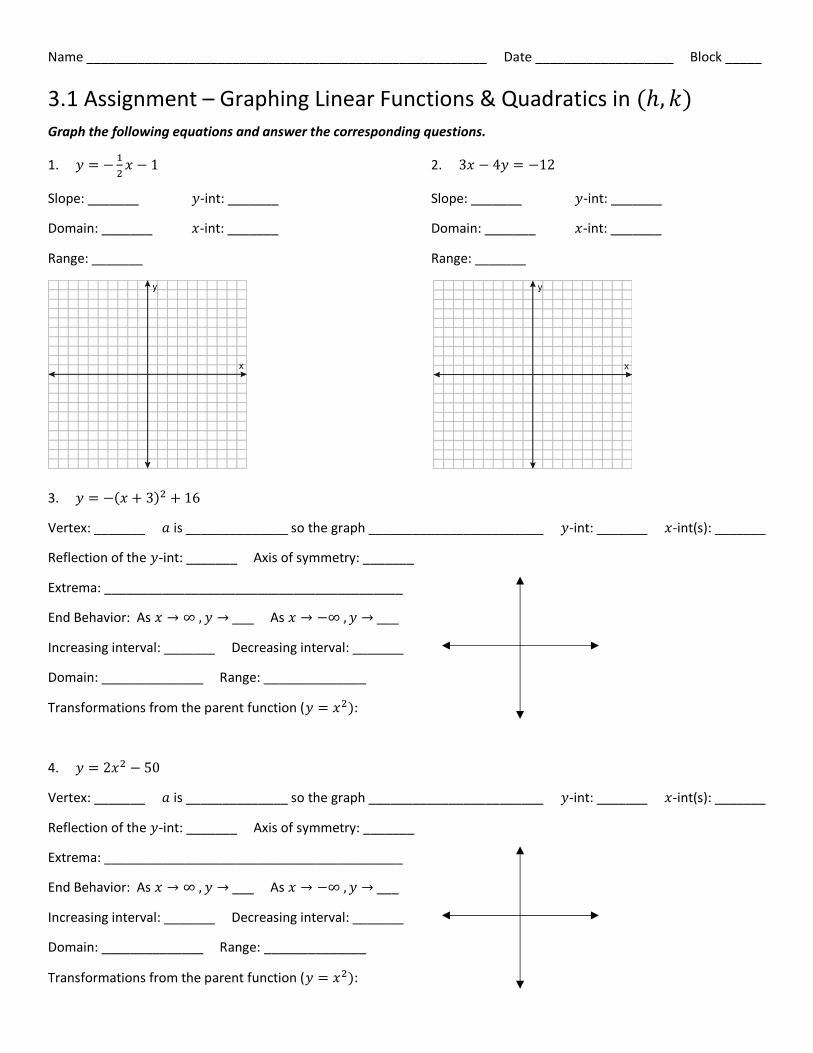
Name _______________________________________________________ Date ___________________ Block _____
3.1 Assignment – Graphing Linear Functions & Quadratics in (ℎ, 𝑘)
Graph the following equations and answer the corresponding questions.
1. 𝑦 = −1
2𝑥 − 1 2. 3𝑥 − 4𝑦 = −12
Slope: _______ 𝑦-int: _______ Slope: _______ 𝑦-int: _______
Domain: _______ 𝑥-int: _______ Domain: _______ 𝑥-int: _______
Range: _______ Range: _______
3. 𝑦 = −(𝑥 + 3)2 + 16
Vertex: _______ 𝑎 is ______________ so the graph ________________________ 𝑦-int: _______ 𝑥-int(s): _______
Reflection of the 𝑦-int: _______ Axis of symmetry: _______
Extrema: _________________________________________
End Behavior: As 𝑥 → ∞ , 𝑦 → ___ As 𝑥 → −∞ , 𝑦 → ___
Increasing interval: _______ Decreasing interval: _______
Domain: ______________ Range: ______________
Transformations from the parent function (𝑦 = 𝑥2):
4. 𝑦 = 2𝑥2 − 50
Vertex: _______ 𝑎 is ______________ so the graph ________________________ 𝑦-int: _______ 𝑥-int(s): _______
Reflection of the 𝑦-int: _______ Axis of symmetry: _______
Extrema: _________________________________________
End Behavior: As 𝑥 → ∞ , 𝑦 → ___ As 𝑥 → −∞ , 𝑦 → ___
Increasing interval: _______ Decreasing interval: _______
Domain: ______________ Range: ______________
Transformations from the parent function (𝑦 = 𝑥2):
5. 𝑥 = 6 6. 𝑦 + 6 = 3
2 (𝑥 + 2)
Slope: _______ 𝑦-int: _______ Slope: _______ 𝑦-int: _______
Domain: _______ 𝑥-int: _______ Domain: _______ 𝑥-int: _______
Range: _______ Range: _______
7. 𝑔(𝑥) = −1
4(𝑥 + 2)2 + 4
Vertex: _______ 𝑎 is ______________ so the graph ________________________ 𝑦-int: _______ 𝑥-int(s): _______
Reflection of the 𝑦-int: _______ Axis of symmetry: _______
Extrema: _________________________________________
End Behavior: As 𝑥 → ∞ , 𝑦 → ___ As 𝑥 → −∞ , 𝑦 → ___
Increasing interval: _______ Decreasing interval: _______
Domain: ______________ Range: ______________
Transformations from the parent function (𝑦 = 𝑥2):
8. 𝑦 =1
2(𝑥 − 3)2 − 8
Vertex: _______ 𝑎 is ______________ so the graph ________________________ 𝑦-int: _______ 𝑥-int(s): _______
Reflection of the 𝑦-int: _______ Axis of symmetry: _______
Extrema: _________________________________________
End Behavior: As 𝑥 → ∞ , 𝑦 → ___ As 𝑥 → −∞ , 𝑦 → ___
Increasing interval: _______ Decreasing interval: _______
Domain: ______________ Range: ______________
Transformations from the parent function (𝑦 = 𝑥2):
Name _______________________________________________________ Date ___________________ Block _____
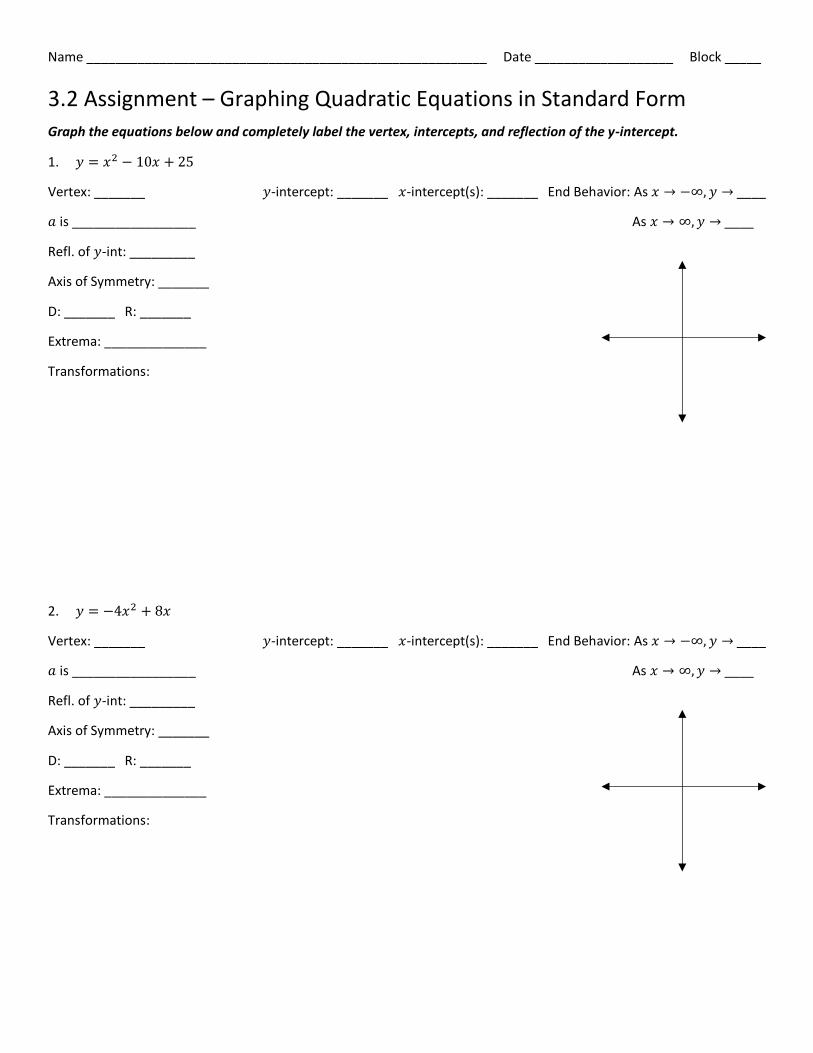
3.2 Assignment – Graphing Quadratic Equations in Standard Form
Graph the equations below and completely label the vertex, intercepts, and reflection of the y-intercept.
1. 𝑦 = 𝑥2 − 10𝑥 + 25
Vertex: _______ 𝑦-intercept: _______ 𝑥-intercept(s): _______ End Behavior: As 𝑥 → −∞, 𝑦 → ____
𝑎 is _________________ As 𝑥 → ∞, 𝑦 → ____
Refl. of 𝑦-int: _________
Axis of Symmetry: _______
D: _______ R: _______
Extrema: ______________
Transformations:
2. 𝑦 = −4𝑥2 + 8𝑥
Vertex: _______ 𝑦-intercept: _______ 𝑥-intercept(s): _______ End Behavior: As 𝑥 → −∞, 𝑦 → ____
𝑎 is _________________ As 𝑥 → ∞, 𝑦 → ____
Refl. of 𝑦-int: _________
Axis of Symmetry: _______
D: _______ R: _______
Extrema: ______________
Transformations:
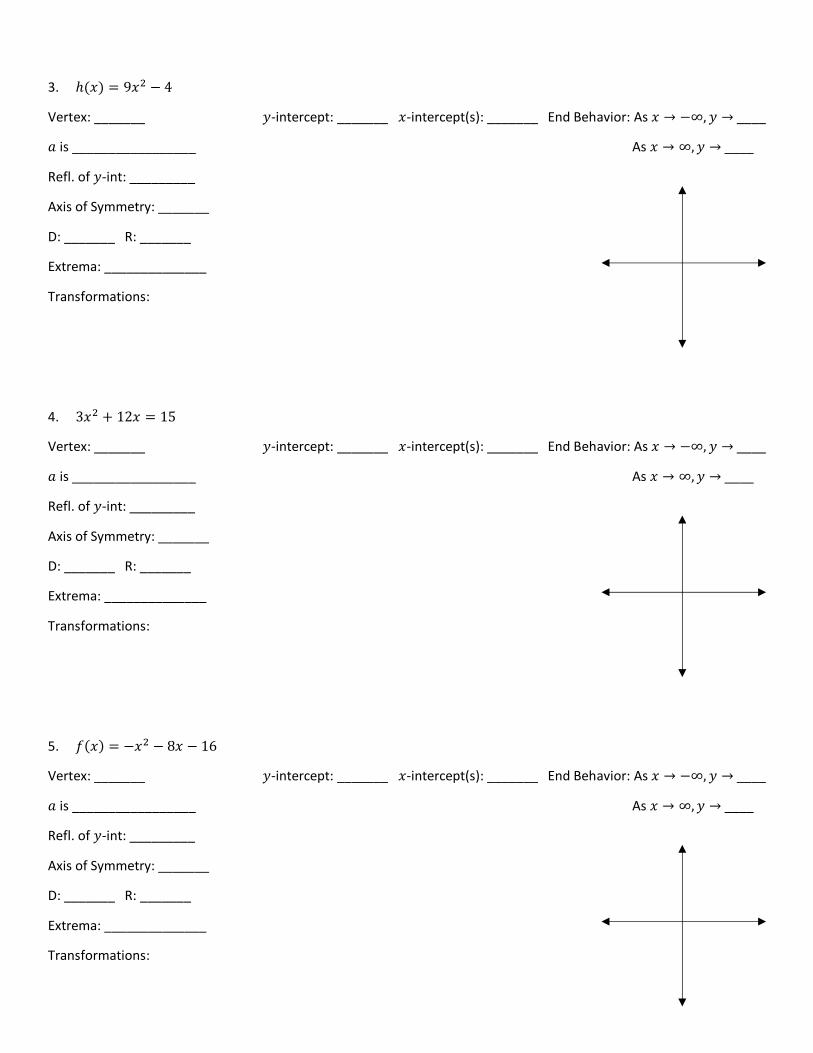
3. ℎ(𝑥) = 9𝑥2 − 4
Vertex: _______ 𝑦-intercept: _______ 𝑥-intercept(s): _______ End Behavior: As 𝑥 → −∞, 𝑦 → ____
𝑎 is _________________ As 𝑥 → ∞, 𝑦 → ____
Refl. of 𝑦-int: _________
Axis of Symmetry: _______
D: _______ R: _______
Extrema: ______________
Transformations:
4. 3𝑥2 + 12𝑥 = 15
Vertex: _______ 𝑦-intercept: _______ 𝑥-intercept(s): _______ End Behavior: As 𝑥 → −∞, 𝑦 → ____
𝑎 is _________________ As 𝑥 → ∞, 𝑦 → ____
Refl. of 𝑦-int: _________
Axis of Symmetry: _______
D: _______ R: _______
Extrema: ______________
Transformations:
5. 𝑓(𝑥) = −𝑥2 − 8𝑥 − 16
Vertex: _______ 𝑦-intercept: _______ 𝑥-intercept(s): _______ End Behavior: As 𝑥 → −∞, 𝑦 → ____
𝑎 is _________________ As 𝑥 → ∞, 𝑦 → ____
Refl. of 𝑦-int: _________
Axis of Symmetry: _______
D: _______ R: _______
Extrema: ______________
Transformations:
Name _______________________________________________________ Date ___________________ Block _____
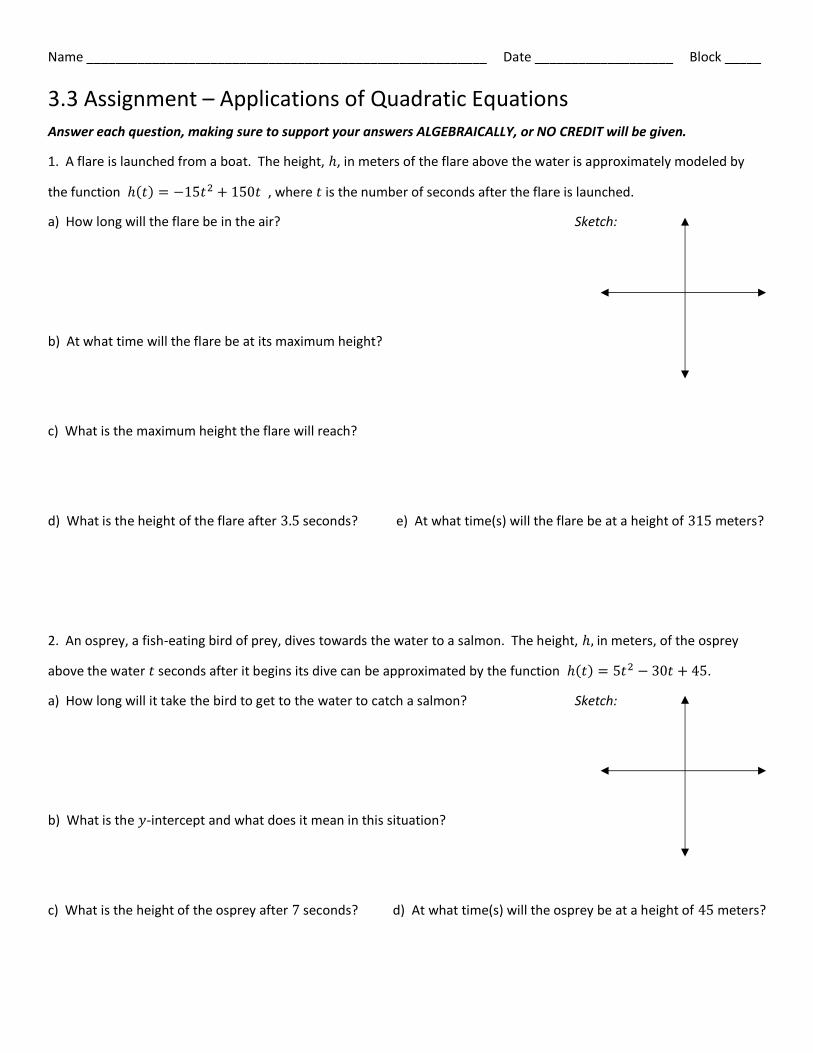
3.3 Assignment – Applications of Quadratic Equations
Answer each question, making sure to support your answers ALGEBRAICALLY, or NO CREDIT will be given.
1. A flare is launched from a boat. The height, ℎ, in meters of the flare above the water is approximately modeled by
the function ℎ(𝑡) = −15𝑡2 + 150𝑡 , where 𝑡 is the number of seconds after the flare is launched.
a) How long will the flare be in the air? Sketch:
b) At what time will the flare be at its maximum height?
c) What is the maximum height the flare will reach?
d) What is the height of the flare after 3.5 seconds? e) At what time(s) will the flare be at a height of 315 meters?
2. An osprey, a fish-eating bird of prey, dives towards the water to a salmon. The height, ℎ, in meters, of the osprey
above the water 𝑡 seconds after it begins its dive can be approximated by the function ℎ(𝑡) = 5𝑡2 − 30𝑡 + 45.
a) How long will it take the bird to get to the water to catch a salmon? Sketch:
b) What is the 𝑦-intercept and what does it mean in this situation?
c) What is the height of the osprey after 7 seconds? d) At what time(s) will the osprey be at a height of 45 meters?
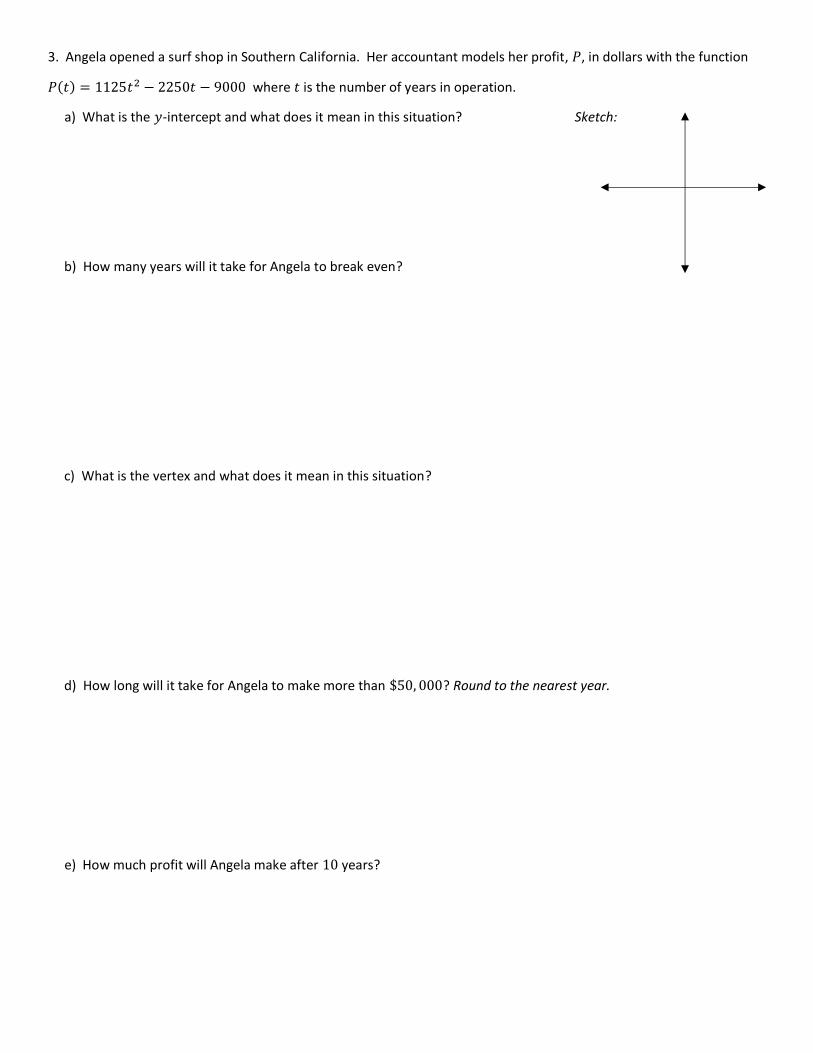
3. Angela opened a surf shop in Southern California. Her accountant models her profit, 𝑃, in dollars with the function
𝑃(𝑡) = 1125𝑡2 − 2250𝑡 − 9000 where 𝑡 is the number of years in operation.
a) What is the 𝑦-intercept and what does it mean in this situation? Sketch:
b) How many years will it take for Angela to break even?
c) What is the vertex and what does it mean in this situation?
d) How long will it take for Angela to make more than $50, 000? Round to the nearest year.
e) How much profit will Angela make after 10 years?
Name ________________________________________________ Date _____________________ Block __________
3.4 Assignment – Graphing Square Root Functions
Graph the following functions and answer the corresponding questions.
1. 𝒚 = √𝒙 + 𝟑
(ℎ, 𝑘): _____ 𝑎 = _____ 𝑥-int: _____ 𝑦-int: _____ Three points on the graph: ______________________
D: __________ R: ________
Increasing: _______ Decreasing: _______
Transformations:
2. 𝒚 = 𝟐𝒙𝟐 + 𝟒𝒙 + 𝟐
Vertex: _______ 𝑦-int: _______ 𝑥-int(s): _______ 𝑎 is _________________ Reflection of 𝑦-int: _______
Axis of Symmetry: _______
Extrema: ______________
D: _______ R: _______
Increasing Interval: ______
Decreasing Interval: ______
End Behavior: As 𝑥 → −∞, 𝑦 → ____
As 𝑥 → ∞, 𝑦 → ____
Transformations:
3. 𝒚 = −√𝒙 + 𝟏
(ℎ, 𝑘): _____ 𝑎 = _____ 𝑥-int: _____ 𝑦-int: _____ Three points on the graph: ______________________
D: __________ R: ________
Increasing: _______ Decreasing: _______
Transformations:
4. 𝒚 = 𝟑𝒙𝟐 + 𝟔𝒙
Vertex: _______ 𝑦-int: _______ 𝑥-int(s): _______ 𝑎 is _________________ Reflection of 𝑦-int: _______
Axis of Symmetry: _______
Extrema: ______________
D: _______ R: _______
Increasing Interval: ______
Decreasing Interval: ______
End Behavior: As 𝑥 → −∞, 𝑦 → ____
As 𝑥 → ∞, 𝑦 → ____
Transformations:
5. 𝒚 = −𝟐(𝒙 + 𝟐)𝟐 + 𝟏𝟖
Vertex: _______ 𝑦-int: _______ 𝑥-int(s): _______ 𝑎 is _________________ Reflection of 𝑦-int: _______
Axis of Symmetry: _______
Extrema: ______________
D: _______ R: _______
Increasing Interval: ______
Decreasing Interval: ______
End Behavior: As 𝑥 → −∞, 𝑦 → ____
As 𝑥 → ∞, 𝑦 → ____
Transformations:
6. 𝒚 = 𝟐√𝒙
(ℎ, 𝑘): _____ 𝑎 = _____ 𝑥-int: _____ 𝑦-int: _____ Three points on the graph: ______________________
D: __________ R: ________
Increasing: _______ Decreasing: _______
Transformations:
Name _______________________________________________________ Date ___________________ Block _____
3.5 Assignment – Graphing Polynomial Functions
Using a graphing utility, answer the questions for each polynomial and sketch the graph. Label all points.
1. 𝑦 = 6𝑥4 − 𝑥3 − 9𝑥2 − 2𝑥 − 2 𝑎 is ______________ The equation is even / odd Same / Opposite end behavior
𝑥-int: ______________________________________ 𝑦-int: _______
As 𝑥 → −∞ , 𝑦 → _____ As 𝑥 → ∞, 𝑦 → _____
Increasing interval: ___________________________
Decreasing interval: ___________________________
Minimum / Maximum:
___________________________________________
___________________________________________
2. ℎ(𝑥) = −3𝑥3 + 3𝑥 − 1 𝑎 is ______________ The equation is even / odd Same / Opposite end behavior
𝑥-int: ______________________________________ 𝑦-int: _______
As 𝑥 → −∞ , 𝑦 → _____ As 𝑥 → ∞, 𝑦 → _____
Increasing interval: ___________________________
Decreasing interval: ___________________________
Minimum / Maximum:
___________________________________________
___________________________________________
3. 𝑓(𝑥) = 𝑥7 + 𝑥6 − 3𝑥5 + 5𝑥3 − 𝑥 + 2
𝑎 is ______________ The equation is even / odd Same / Opposite end behavior
𝑥-int: ______________________________________ 𝑦-int: _______
As 𝑥 → −∞ , 𝑦 → _____ As 𝑥 → ∞, 𝑦 → _____
Increasing interval: ___________________________
Decreasing interval: ___________________________
Minimum / Maximum:
___________________________________________
___________________________________________
Name ___________________________________________________ Date ___________________ Block _________
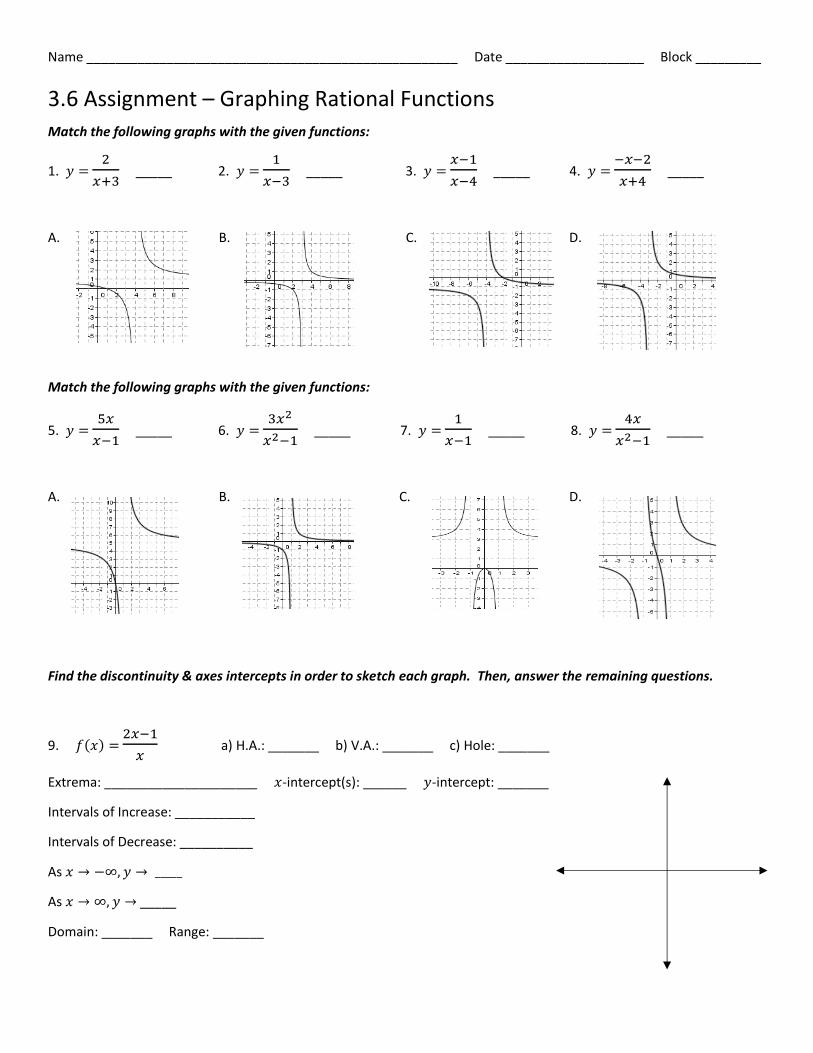
3.6 Assignment – Graphing Rational Functions
Match the following graphs with the given functions:
1. 𝑦 = 2
𝑥+3 _____ 2. 𝑦 =
1
𝑥−3 _____ 3. 𝑦 =
𝑥−1
𝑥−4 _____ 4. 𝑦 =
−𝑥−2
𝑥+4 _____
A. B. C. D.
Match the following graphs with the given functions:
5. 𝑦 = 5𝑥
𝑥−1 _____ 6. 𝑦 =
3𝑥2
𝑥2−1 _____ 7. 𝑦 =
1
𝑥−1 _____ 8. 𝑦 =
4𝑥
𝑥2−1 _____
A. B. C. D.
Find the discontinuity & axes intercepts in order to sketch each graph. Then, answer the remaining questions.
9. 𝑓(𝑥) = 2𝑥−1
𝑥 a) H.A.: _______ b) V.A.: _______ c) Hole: _______
Extrema: _____________________ 𝑥-intercept(s): ______ 𝑦-intercept: _______
Intervals of Increase: ___________
Intervals of Decrease: __________
As 𝑥 → −∞, 𝑦 → _____
As 𝑥 → ∞, 𝑦 → _____
Domain: _______ Range: _______
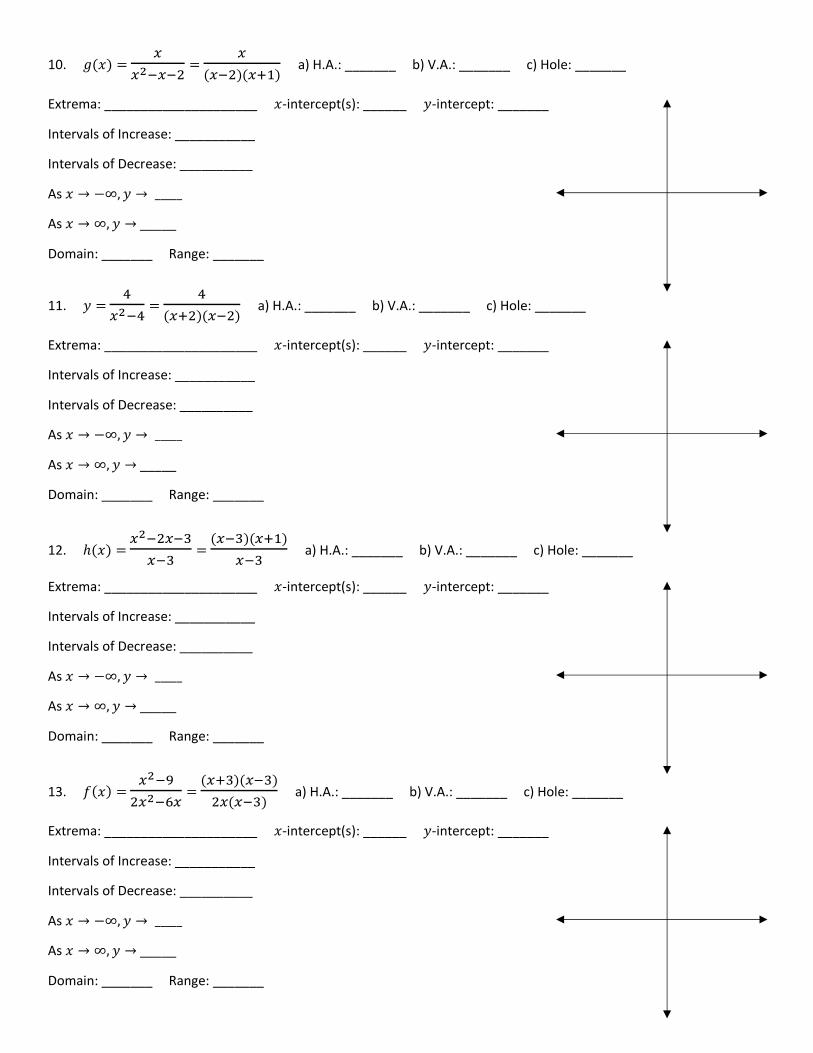
10. 𝑔(𝑥) = 𝑥
𝑥2−𝑥−2 =
𝑥
(𝑥−2)(𝑥+1) a) H.A.: _______ b) V.A.: _______ c) Hole: _______
Extrema: _____________________ 𝑥-intercept(s): ______ 𝑦-intercept: _______
Intervals of Increase: ___________
Intervals of Decrease: __________
As 𝑥 → −∞, 𝑦 → _____
As 𝑥 → ∞, 𝑦 → _____
Domain: _______ Range: _______
11. 𝑦 = 4
𝑥2−4 =
4
(𝑥+2)(𝑥−2) a) H.A.: _______ b) V.A.: _______ c) Hole: _______
Extrema: _____________________ 𝑥-intercept(s): ______ 𝑦-intercept: _______
Intervals of Increase: ___________
Intervals of Decrease: __________
As 𝑥 → −∞, 𝑦 → _____
As 𝑥 → ∞, 𝑦 → _____
Domain: _______ Range: _______
12. ℎ(𝑥) = 𝑥2−2𝑥−3
𝑥−3 =
(𝑥−3)(𝑥+1)
𝑥−3 a) H.A.: _______ b) V.A.: _______ c) Hole: _______
Extrema: _____________________ 𝑥-intercept(s): ______ 𝑦-intercept: _______
Intervals of Increase: ___________
Intervals of Decrease: __________
As 𝑥 → −∞, 𝑦 → _____
As 𝑥 → ∞, 𝑦 → _____
Domain: _______ Range: _______
13. 𝑓(𝑥) = 𝑥2−9
2𝑥2−6𝑥 =
(𝑥+3)(𝑥−3)
2𝑥(𝑥−3) a) H.A.: _______ b) V.A.: _______ c) Hole: _______
Extrema: _____________________ 𝑥-intercept(s): ______ 𝑦-intercept: _______
Intervals of Increase: ___________
Intervals of Decrease: __________
As 𝑥 → −∞, 𝑦 → _____
As 𝑥 → ∞, 𝑦 → _____
Domain: _______ Range: _______
Name ___________________________________________________ Date _____________________ Block _______
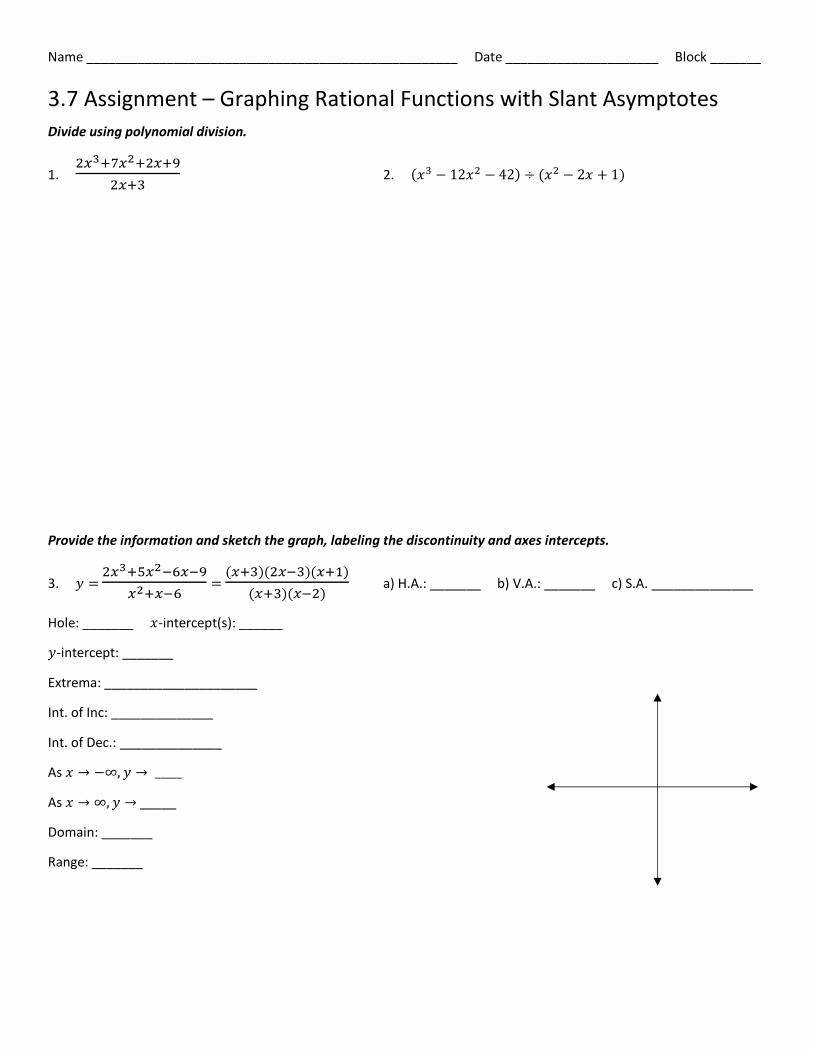
3.7 Assignment – Graphing Rational Functions with Slant Asymptotes
Divide using polynomial division.
1. 2𝑥3+7𝑥2+2𝑥+9
2𝑥+3 2. (𝑥3 − 12𝑥2 − 42) ÷ (𝑥2 − 2𝑥 + 1)
Provide the information and sketch the graph, labeling the discontinuity and axes intercepts.
3. 𝑦 = 2𝑥3+5𝑥2−6𝑥−9
𝑥2+𝑥−6 =
(𝑥+3)(2𝑥−3)(𝑥+1)
(𝑥+3)(𝑥−2) a) H.A.: _______ b) V.A.: _______ c) S.A. ______________
Hole: _______ 𝑥-intercept(s): ______
𝑦-intercept: _______
Extrema: _____________________
Int. of Inc: ______________
Int. of Dec.: ______________
As 𝑥 → −∞, 𝑦 → _____
As 𝑥 → ∞, 𝑦 → _____
Domain: _______
Range: _______
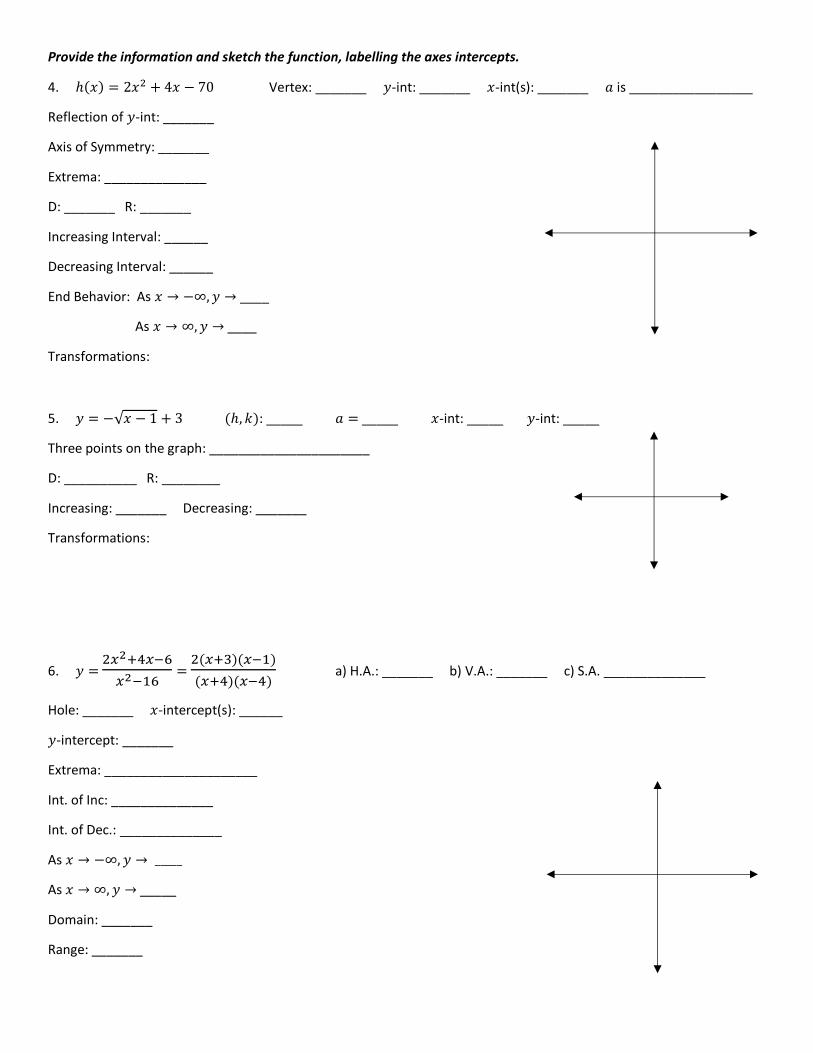
Provide the information and sketch the function, labelling the axes intercepts.
4. ℎ(𝑥) = 2𝑥2 + 4𝑥 − 70 Vertex: _______ 𝑦-int: _______ 𝑥-int(s): _______ 𝑎 is _________________
Reflection of 𝑦-int: _______
Axis of Symmetry: _______
Extrema: ______________
D: _______ R: _______
Increasing Interval: ______
Decreasing Interval: ______
End Behavior: As 𝑥 → −∞, 𝑦 → ____
As 𝑥 → ∞, 𝑦 → ____
Transformations:
5. 𝑦 = −√𝑥 − 1 + 3 (ℎ, 𝑘): _____ 𝑎 = _____ 𝑥-int: _____ 𝑦-int: _____
Three points on the graph: ______________________
D: __________ R: ________
Increasing: _______ Decreasing: _______
Transformations:
6. 𝑦 = 2𝑥2+4𝑥−6
𝑥2−16 =
2(𝑥+3)(𝑥−1)
(𝑥+4)(𝑥−4) a) H.A.: _______ b) V.A.: _______ c) S.A. ______________
Hole: _______ 𝑥-intercept(s): ______
𝑦-intercept: _______
Extrema: _____________________
Int. of Inc: ______________
Int. of Dec.: ______________
As 𝑥 → −∞, 𝑦 → _____
As 𝑥 → ∞, 𝑦 → _____
Domain: _______
Range: _______
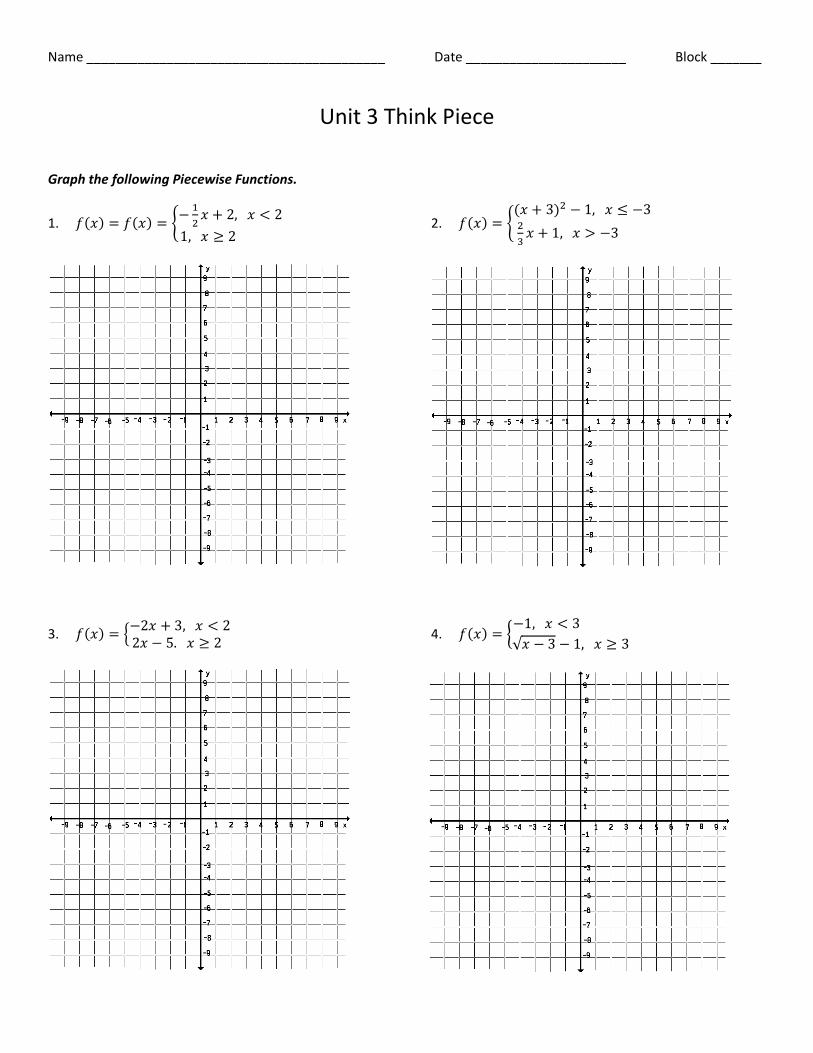
Name _________________________________________ Date ______________________ Block _______
Unit 3 Think Piece
Graph the following Piecewise Functions.
1. 𝑓(𝑥) = 𝑓(𝑥) = {−
1
2𝑥 + 2, 𝑥 < 2
1, 𝑥 ≥ 2 2. 𝑓(𝑥) = {
(𝑥 + 3)2 − 1, 𝑥 ≤ −32
3𝑥 + 1, 𝑥 > −3
3. 𝑓(𝑥) = {−2𝑥 + 3, 𝑥 < 22𝑥 − 5. 𝑥 ≥ 2
4. 𝑓(𝑥) = {−1, 𝑥 < 3
√𝑥 − 3 − 1, 𝑥 ≥ 3
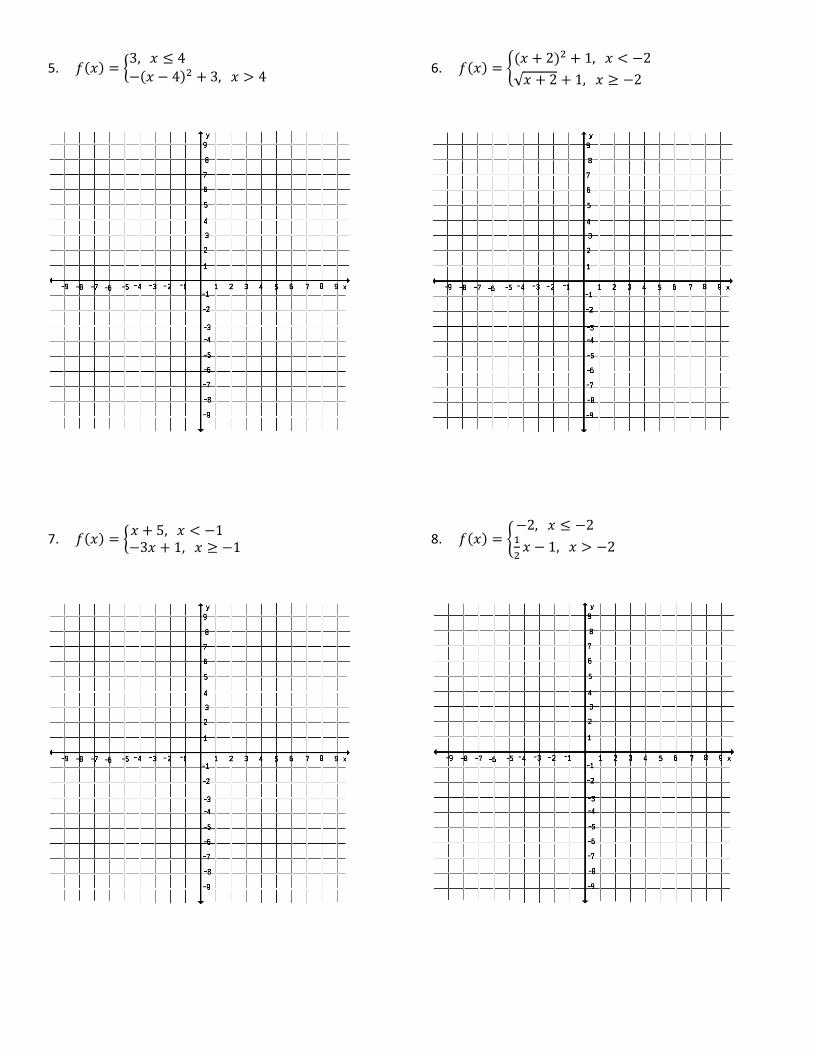
5. 𝑓(𝑥) = {3, 𝑥 ≤ 4
−(𝑥 − 4)2 + 3, 𝑥 > 4 6. 𝑓(𝑥) = {
(𝑥 + 2)2 + 1, 𝑥 < −2
√𝑥 + 2 + 1, 𝑥 ≥ −2
7. 𝑓(𝑥) = {𝑥 + 5, 𝑥 < −1 −3𝑥 + 1, 𝑥 ≥ −1
8. 𝑓(𝑥) = {−2, 𝑥 ≤ −2 1
2𝑥 − 1, 𝑥 > −2
Name ___________________________________________________ Date _____________________ Block _______
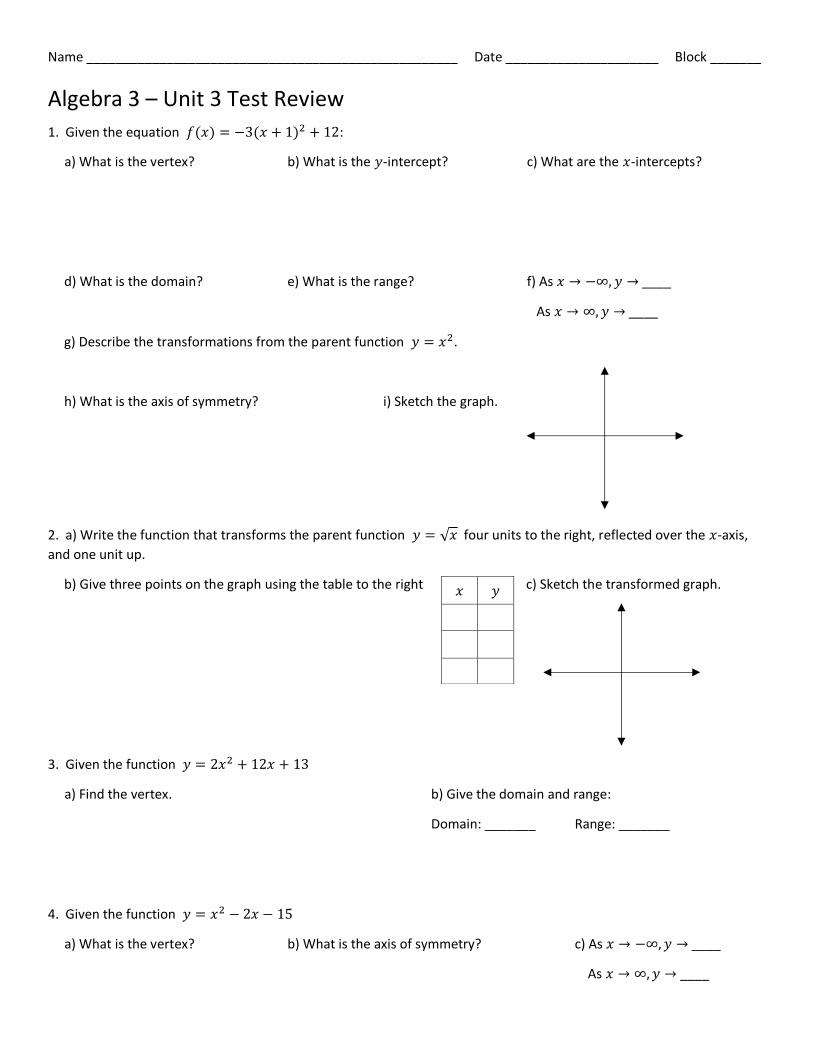
Algebra 3 – Unit 3 Test Review
1. Given the equation 𝑓(𝑥) = −3(𝑥 + 1)2 + 12:
a) What is the vertex? b) What is the 𝑦-intercept? c) What are the 𝑥-intercepts?
d) What is the domain? e) What is the range? f) As 𝑥 → −∞, 𝑦 → ____
As 𝑥 → ∞, 𝑦 → ____
g) Describe the transformations from the parent function 𝑦 = 𝑥2.
h) What is the axis of symmetry? i) Sketch the graph.
2. a) Write the function that transforms the parent function 𝑦 = √𝑥 four units to the right, reflected over the 𝑥-axis,
and one unit up.
b) Give three points on the graph using the table to the right c) Sketch the transformed graph.
3. Given the function 𝑦 = 2𝑥2 + 12𝑥 + 13
a) Find the vertex. b) Give the domain and range:
Domain: _______ Range: _______
4. Given the function 𝑦 = 𝑥2 − 2𝑥 − 15
a) What is the vertex? b) What is the axis of symmetry? c) As 𝑥 → −∞, 𝑦 → ____
As 𝑥 → ∞, 𝑦 → ____
𝑥 𝑦
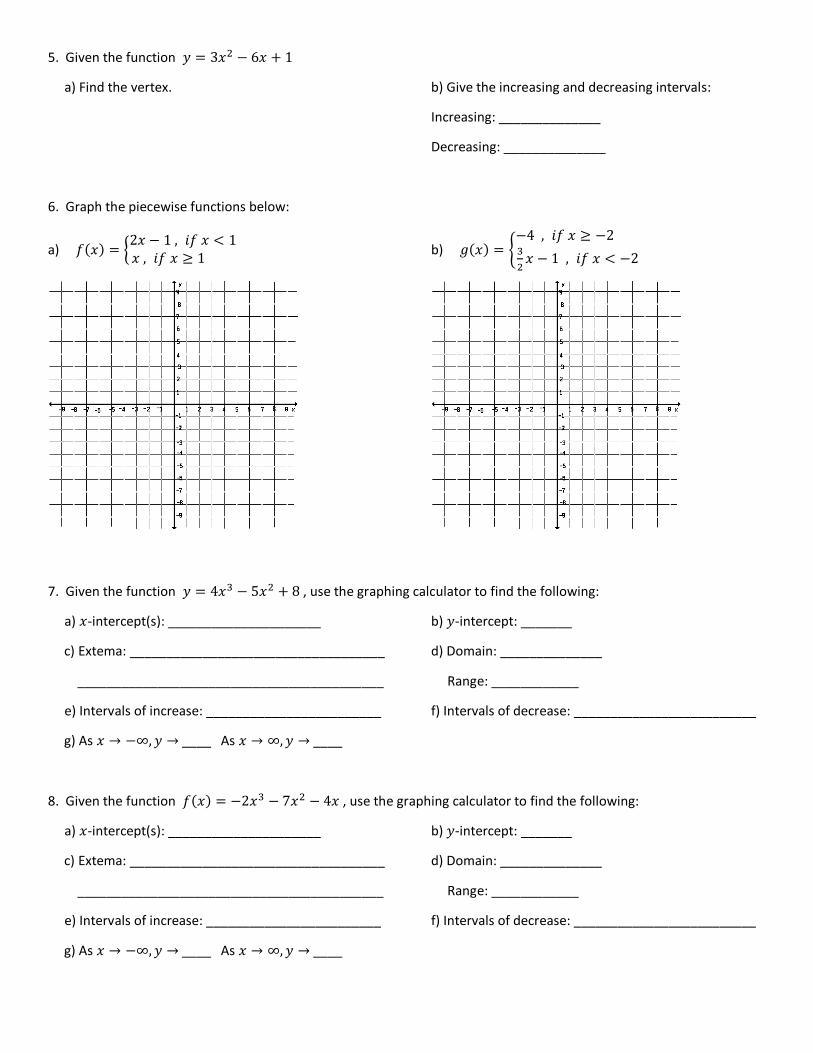
5. Given the function 𝑦 = 3𝑥2 − 6𝑥 + 1
a) Find the vertex. b) Give the increasing and decreasing intervals:
Increasing: ______________
Decreasing: ______________
6. Graph the piecewise functions below:
a) 𝑓(𝑥) = {2𝑥 − 1 , 𝑖𝑓 𝑥 < 1𝑥 , 𝑖𝑓 𝑥 ≥ 1
b) 𝑔(𝑥) = {−4 , 𝑖𝑓 𝑥 ≥ −2 3
2𝑥 − 1 , 𝑖𝑓 𝑥 < −2
7. Given the function 𝑦 = 4𝑥3 − 5𝑥2 + 8 , use the graphing calculator to find the following:
a) 𝑥-intercept(s): _____________________ b) 𝑦-intercept: _______
c) Extema: ___________________________________ d) Domain: ______________
__________________________________________ Range: ____________
e) Intervals of increase: ________________________ f) Intervals of decrease: _________________________
g) As 𝑥 → −∞, 𝑦 → ____ As 𝑥 → ∞, 𝑦 → ____
8. Given the function 𝑓(𝑥) = −2𝑥3 − 7𝑥2 − 4𝑥 , use the graphing calculator to find the following:
a) 𝑥-intercept(s): _____________________ b) 𝑦-intercept: _______
c) Extema: ___________________________________ d) Domain: ______________
__________________________________________ Range: ____________
e) Intervals of increase: ________________________ f) Intervals of decrease: _________________________
g) As 𝑥 → −∞, 𝑦 → ____ As 𝑥 → ∞, 𝑦 → ____
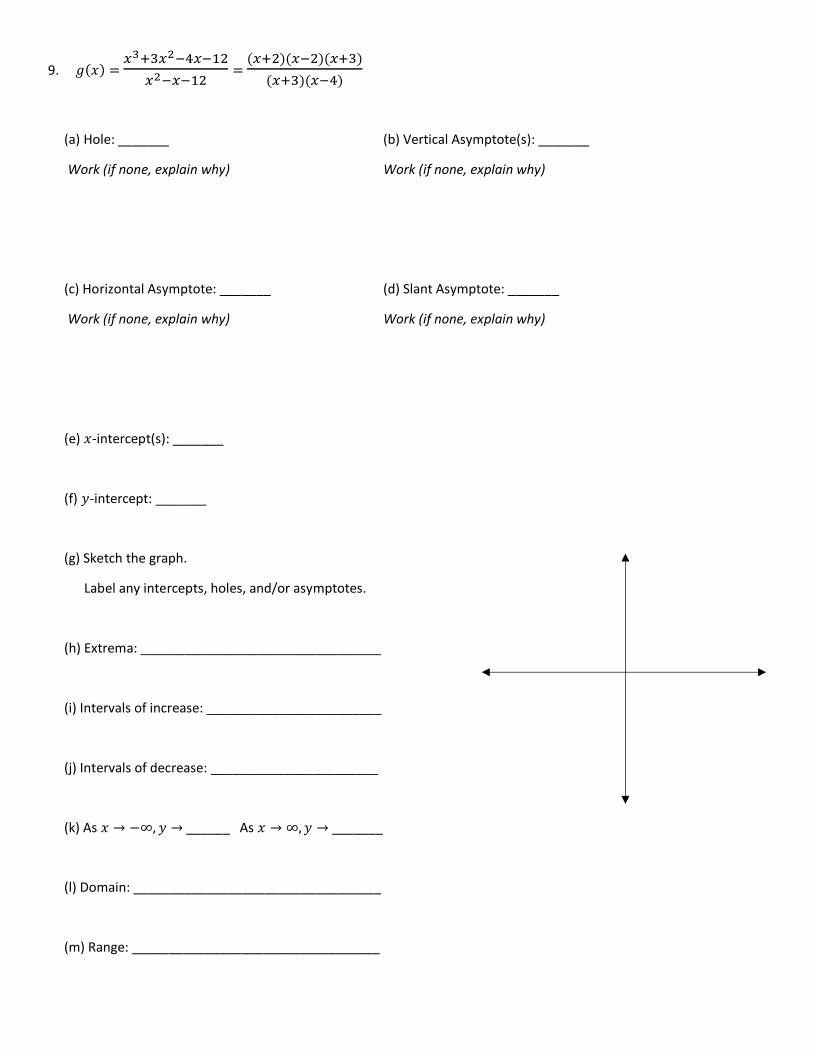
9. 𝑔(𝑥) = 𝑥3+3𝑥2−4𝑥−12
𝑥2−𝑥−12 =
(𝑥+2)(𝑥−2)(𝑥+3)
(𝑥+3)(𝑥−4)
(a) Hole: _______ (b) Vertical Asymptote(s): _______
Work (if none, explain why) Work (if none, explain why)
(c) Horizontal Asymptote: _______ (d) Slant Asymptote: _______
Work (if none, explain why) Work (if none, explain why)
(e) 𝑥-intercept(s): _______
(f) 𝑦-intercept: _______
(g) Sketch the graph.
Label any intercepts, holes, and/or asymptotes.
(h) Extrema: _________________________________
(i) Intervals of increase: ________________________
(j) Intervals of decrease: _______________________
(k) As 𝑥 → −∞, 𝑦 → ______ As 𝑥 → ∞, 𝑦 → _______
(l) Domain: __________________________________
(m) Range: __________________________________
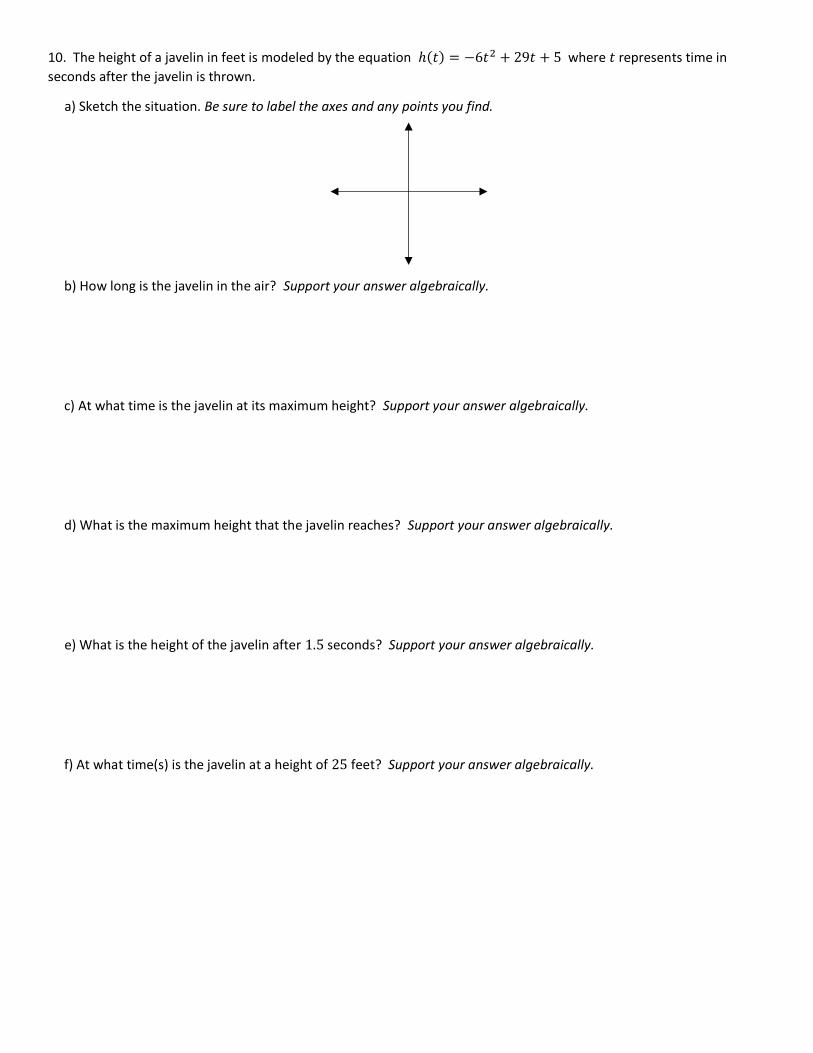
10. The height of a javelin in feet is modeled by the equation ℎ(𝑡) = −6𝑡2 + 29𝑡 + 5 where 𝑡 represents time in
seconds after the javelin is thrown.
a) Sketch the situation. Be sure to label the axes and any points you find.
b) How long is the javelin in the air? Support your answer algebraically.
c) At what time is the javelin at its maximum height? Support your answer algebraically.
d) What is the maximum height that the javelin reaches? Support your answer algebraically.
e) What is the height of the javelin after 1.5 seconds? Support your answer algebraically.
f) At what time(s) is the javelin at a height of 25 feet? Support your answer algebraically.
Name ____________________________________________________ Date ___________________ Block ________
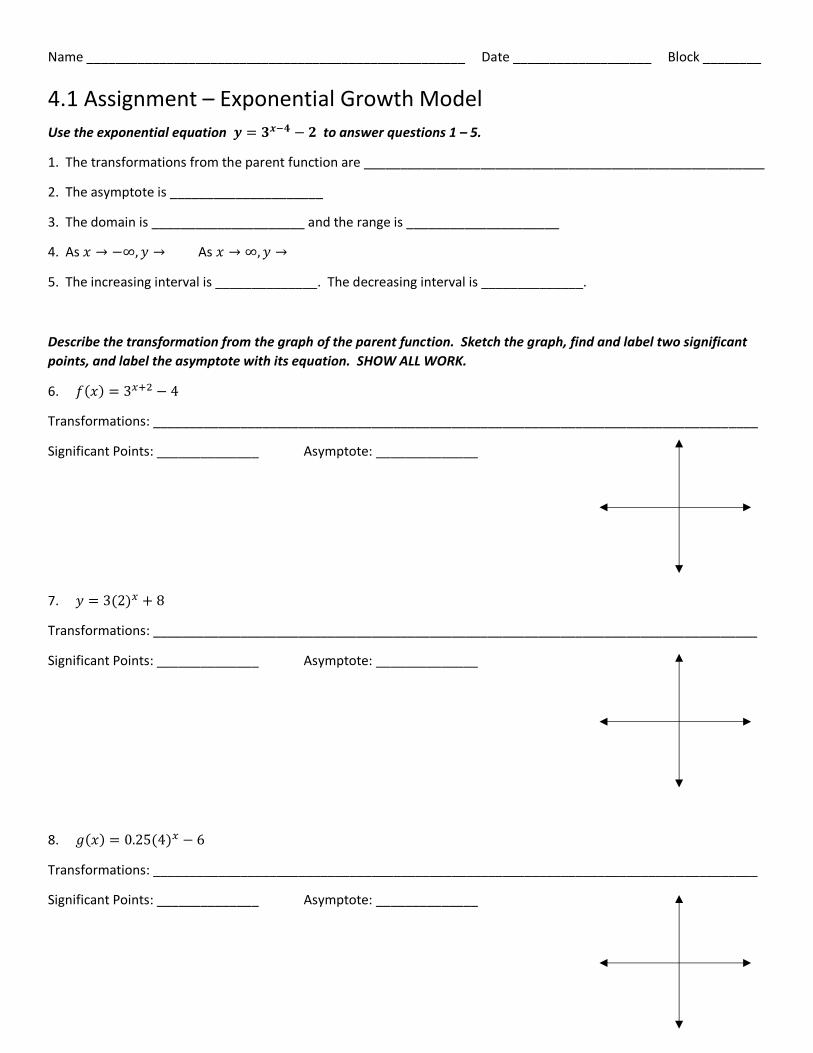
4.1 Assignment – Exponential Growth Model
Use the exponential equation 𝒚 = 𝟑𝒙−𝟒 − 𝟐 to answer questions 1 – 5.
1. The transformations from the parent function are _______________________________________________________
2. The asymptote is _____________________
3. The domain is _____________________ and the range is _____________________
4. As 𝑥 → −∞, 𝑦 → As 𝑥 → ∞, 𝑦 →
5. The increasing interval is ______________. The decreasing interval is ______________.
Describe the transformation from the graph of the parent function. Sketch the graph, find and label two significant
points, and label the asymptote with its equation. SHOW ALL WORK.
6. 𝑓(𝑥) = 3𝑥+2 − 4
Transformations: ___________________________________________________________________________________
Significant Points: ______________ Asymptote: ______________
7. 𝑦 = 3(2)𝑥 + 8
Transformations: ___________________________________________________________________________________
Significant Points: ______________ Asymptote: ______________
8. 𝑔(𝑥) = 0.25(4)𝑥 − 6
Transformations: ___________________________________________________________________________________
Significant Points: ______________ Asymptote: ______________
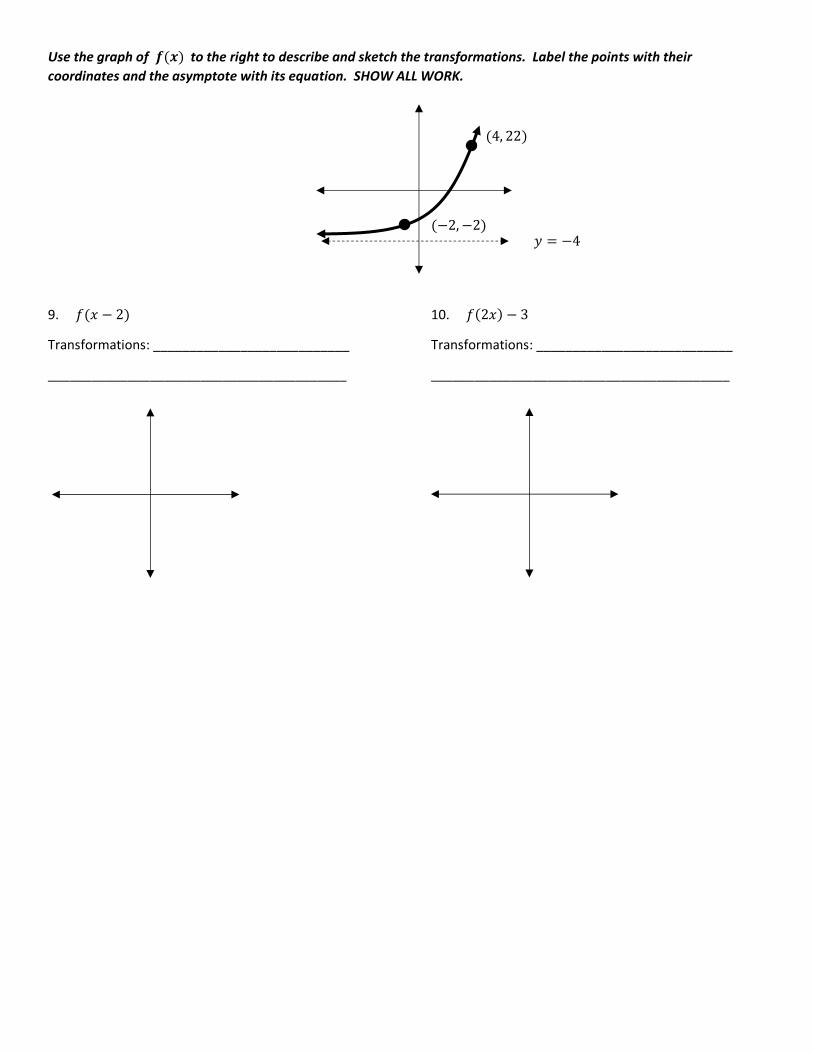
Use the graph of 𝒇(𝒙) to the right to describe and sketch the transformations. Label the points with their
coordinates and the asymptote with its equation. SHOW ALL WORK.
(4, 22)
(−2, −2)
9. 𝑓(𝑥 − 2) 10. 𝑓(2𝑥) − 3
Transformations: ___________________________ Transformations: ___________________________
_________________________________________ _________________________________________
𝑦 = −4
Name ____________________________________________________ Date ___________________ Block ________
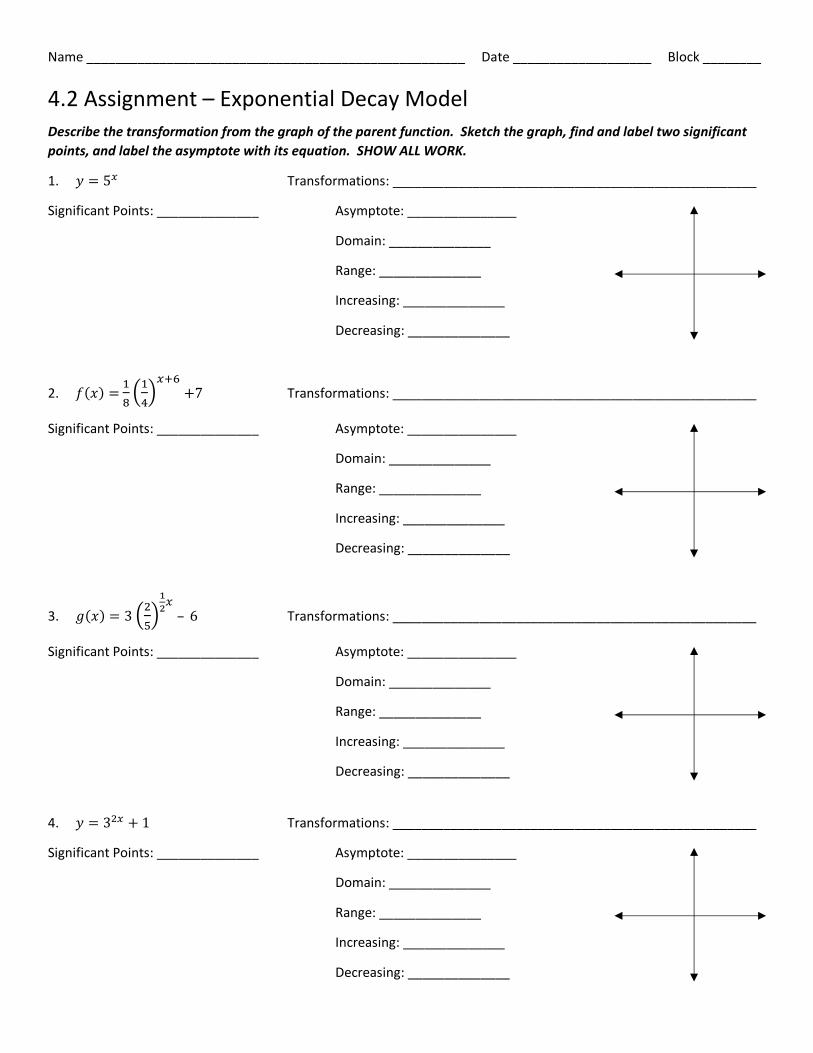
4.2 Assignment – Exponential Decay Model
Describe the transformation from the graph of the parent function. Sketch the graph, find and label two significant
points, and label the asymptote with its equation. SHOW ALL WORK.
1. 𝑦 = 5𝑥 Transformations: __________________________________________________
Significant Points: ______________ Asymptote: _______________
Domain: ______________
Range: ______________
Increasing: ______________
Decreasing: ______________
2. 𝑓(𝑥) = 1
8(
1
4)
𝑥+6
+7 Transformations: __________________________________________________
Significant Points: ______________ Asymptote: _______________
Domain: ______________
Range: ______________
Increasing: ______________
Decreasing: ______________
3. 𝑔(𝑥) = 3 (2
5)
1
2𝑥
– 6 Transformations: __________________________________________________
Significant Points: ______________ Asymptote: _______________
Domain: ______________
Range: ______________
Increasing: ______________
Decreasing: ______________
4. 𝑦 = 32𝑥 + 1 Transformations: __________________________________________________
Significant Points: ______________ Asymptote: _______________
Domain: ______________
Range: ______________
Increasing: ______________
Decreasing: ______________
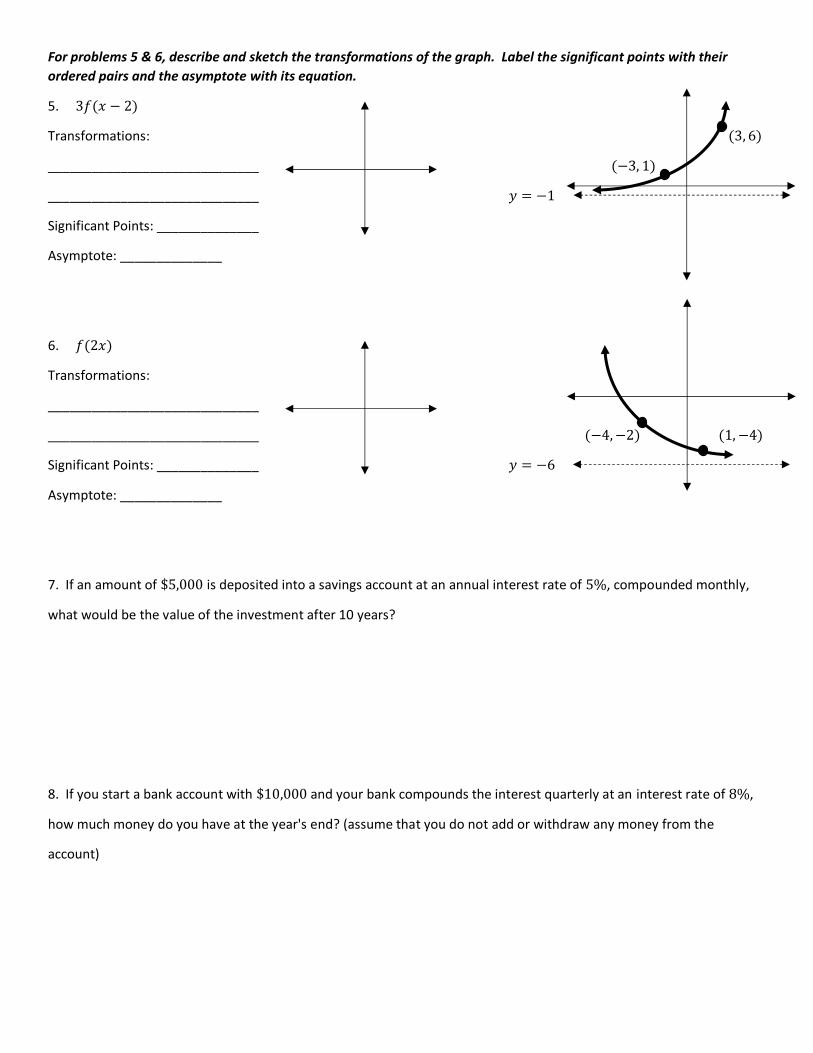
For problems 5 & 6, describe and sketch the transformations of the graph. Label the significant points with their
ordered pairs and the asymptote with its equation.
5. 3𝑓(𝑥 − 2)
Transformations: (3, 6)
_____________________________ (−3, 1)
_____________________________ 𝑦 = −1
Significant Points: ______________
Asymptote: ______________
6. 𝑓(2𝑥)
Transformations:
_____________________________
_____________________________ (−4, −2) (1, −4)
Significant Points: ______________ 𝑦 = −6
Asymptote: ______________
7. If an amount of $5,000 is deposited into a savings account at an annual interest rate of 5%, compounded monthly,
what would be the value of the investment after 10 years?
8. If you start a bank account with $10,000 and your bank compounds the interest quarterly at an interest rate of 8%,
how much money do you have at the year's end? (assume that you do not add or withdraw any money from the
account)
Name ___________________________________________________ Date ___________________ Block _________
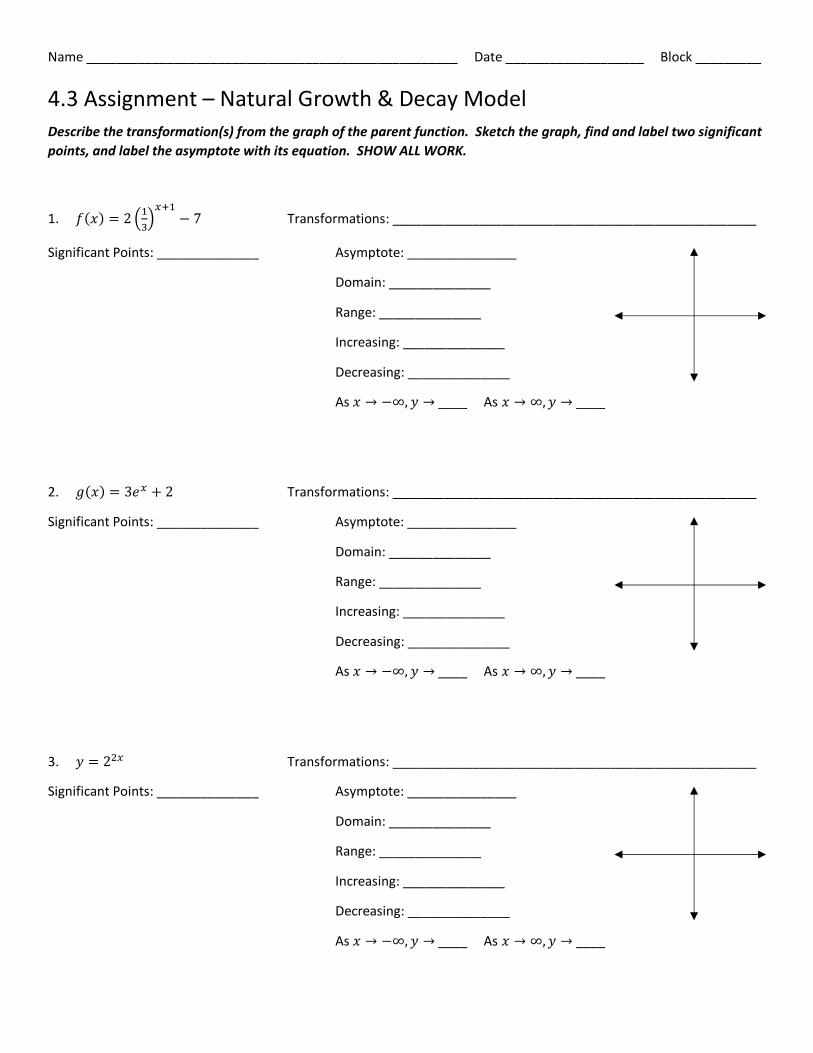
4.3 Assignment – Natural Growth & Decay Model
Describe the transformation(s) from the graph of the parent function. Sketch the graph, find and label two significant
points, and label the asymptote with its equation. SHOW ALL WORK.
1. 𝑓(𝑥) = 2 (1
3)
𝑥+1− 7 Transformations: __________________________________________________
Significant Points: ______________ Asymptote: _______________
Domain: ______________
Range: ______________
Increasing: ______________
Decreasing: ______________
As 𝑥 → −∞, 𝑦 → ____ As 𝑥 → ∞, 𝑦 → ____
2. 𝑔(𝑥) = 3𝑒𝑥 + 2 Transformations: __________________________________________________
Significant Points: ______________ Asymptote: _______________
Domain: ______________
Range: ______________
Increasing: ______________
Decreasing: ______________
As 𝑥 → −∞, 𝑦 → ____ As 𝑥 → ∞, 𝑦 → ____
3. 𝑦 = 22𝑥 Transformations: __________________________________________________
Significant Points: ______________ Asymptote: _______________
Domain: ______________
Range: ______________
Increasing: ______________
Decreasing: ______________
As 𝑥 → −∞, 𝑦 → ____ As 𝑥 → ∞, 𝑦 → ____
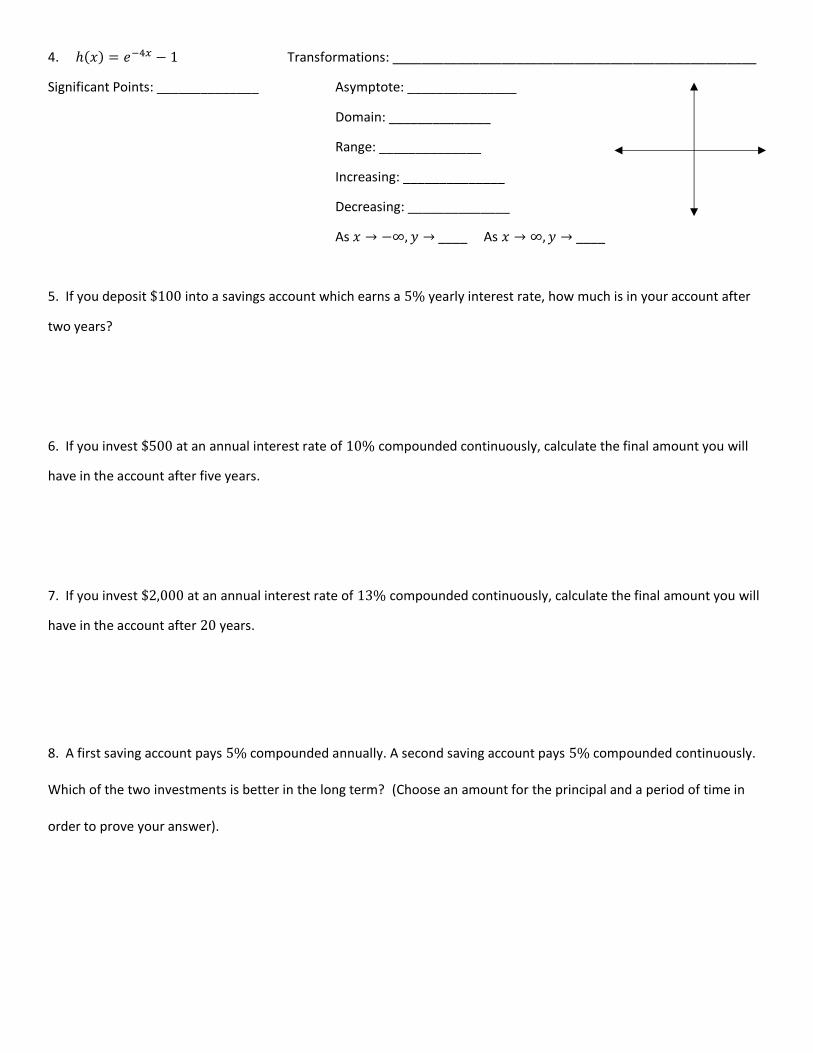
4. ℎ(𝑥) = 𝑒−4𝑥 − 1 Transformations: __________________________________________________
Significant Points: ______________ Asymptote: _______________
Domain: ______________
Range: ______________
Increasing: ______________
Decreasing: ______________
As 𝑥 → −∞, 𝑦 → ____ As 𝑥 → ∞, 𝑦 → ____
5. If you deposit $100 into a savings account which earns a 5% yearly interest rate, how much is in your account after
two years?
6. If you invest $500 at an annual interest rate of 10% compounded continuously, calculate the final amount you will
have in the account after five years.
7. If you invest $2,000 at an annual interest rate of 13% compounded continuously, calculate the final amount you will
have in the account after 20 years.
8. A first saving account pays 5% compounded annually. A second saving account pays 5% compounded continuously.
Which of the two investments is better in the long term? (Choose an amount for the principal and a period of time in
order to prove your answer).
Related Documents