2016 Impaired Waters - 303(d) List Category 5 - Waters needing Total Maximum Daily Load Study Potomac and Shenandoah River Basins Cause Group Code Cause Category TMDL Dev. Priority Estuary (Sq. Miles) Reservoir (Acres) River (Miles) Initial List Date Impaired Use Water Name Cause A02R-02-BEN North Fork Catoctin Creek Aquatic Life Benthic-Macroinvertebrate Bioassessments 5A 4.42 H, 2yr 2008 A02R-04-BEN North Fork Catoctin Creek Aquatic Life Benthic-Macroinvertebrate Bioassessments 5A 2.54 L 2014 A03R-02-BAC Clarks Run Recreation Escherichia coli 5A 5.46 L 2008 A05R-01-BEN Wancopin Creek Aquatic Life Benthic-Macroinvertebrate Bioassessments 5A 3.44 L 2008 A05R-02-BEN Jeffries Branch Aquatic Life Benthic-Macroinvertebrate Bioassessments 5A 6.19 L 2012 A06R-01-BEN North Fork Goose Creek Aquatic Life Benthic-Macroinvertebrate Bioassessments 5A 4.69 L 2010 A07R-02-BEN North Fork Beaverdam Creek Aquatic Life Benthic-Macroinvertebrate Bioassessments 5A 4.81 L 2008 A08R-01-PCB Broad Run, Difficult Run, Goose Creek Fish Consumption PCB in Fish Tissue 5A 39.63 15.34 L 2006 A08R-04-BEN Tuscarora Creek Aquatic Life Benthic-Macroinvertebrate Bioassessments 5A 3.89 L 2014 A08R-05-BEN Dry Mill Branch Aquatic Life Benthic-Macroinvertebrate Bioassessments 5A 2.97 L 2016 A09R-01-BAC Unnamed tributary to the Potomac River Recreation Escherichia coli 5A 1.74 M 2010 A09R-01-BEN Broad Run Aquatic Life Benthic-Macroinvertebrate Bioassessments 5A 2.93 M 2006 Benthic-Macroinvertebrate Bioassessments 5A 5.49 M 2008 A09R-01-HG Broad Run Fish Consumption Mercury in Fish Tissue 5A 2.93 L 2010 A09R-02-BAC Broad Run Recreation Escherichia coli 5A 3.22 M 2010 Escherichia coli 5A 2.93 M 2014 A09R-02-BEN Broad Run Aquatic Life Benthic-Macroinvertebrate Bioassessments 5A 1.42 M 2008 A09R-03-BAC Broad Run Recreation Escherichia coli 5A 1.42 M 2012 A09R-03-BEN Horsepen Run Aquatic Life Benthic-Macroinvertebrate Bioassessments 5A 8.17 M 2016 A09R-04-BAC South Fork Broad Run Recreation Escherichia coli 5A 5.28 M 2014 Appendix 1a - 1 Final 2016

Welcome message from author
This document is posted to help you gain knowledge. Please leave a comment to let me know what you think about it! Share it to your friends and learn new things together.
Transcript

2016 Impaired Waters - 303(d) List
Category 5 - Waters needing Total Maximum Daily Load Study
Potomac and Shenandoah River Basins
Cause Group Code CauseCategory
TMDLDev.
Priority
Estuary(Sq. Miles)
Reservoir(Acres)
River(Miles)
InitialListDateImpaired Use
Water Name
Cause
A02R-02-BEN North Fork Catoctin Creek
Aquatic Life Benthic-Macroinvertebrate Bioassessments 5A 4.42 H, 2yr2008
A02R-04-BEN North Fork Catoctin Creek
Aquatic Life Benthic-Macroinvertebrate Bioassessments 5A 2.54 L2014
A03R-02-BAC Clarks Run
Recreation Escherichia coli 5A 5.46 L2008
A05R-01-BEN Wancopin Creek
Aquatic Life Benthic-Macroinvertebrate Bioassessments 5A 3.44 L2008
A05R-02-BEN Jeffries Branch
Aquatic Life Benthic-Macroinvertebrate Bioassessments 5A 6.19 L2012
A06R-01-BEN North Fork Goose Creek
Aquatic Life Benthic-Macroinvertebrate Bioassessments 5A 4.69 L2010
A07R-02-BEN North Fork Beaverdam Creek
Aquatic Life Benthic-Macroinvertebrate Bioassessments 5A 4.81 L2008
A08R-01-PCB Broad Run, Difficult Run, Goose Creek
Fish Consumption PCB in Fish Tissue 5A 39.63 15.34 L2006
A08R-04-BEN Tuscarora Creek
Aquatic Life Benthic-Macroinvertebrate Bioassessments 5A 3.89 L2014
A08R-05-BEN Dry Mill Branch
Aquatic Life Benthic-Macroinvertebrate Bioassessments 5A 2.97 L2016
A09R-01-BAC Unnamed tributary to the Potomac River
Recreation Escherichia coli 5A 1.74 M2010
A09R-01-BEN Broad Run
Aquatic Life Benthic-Macroinvertebrate Bioassessments 5A 2.93 M2006
Benthic-Macroinvertebrate Bioassessments 5A 5.49 M2008
A09R-01-HG Broad Run
Fish Consumption Mercury in Fish Tissue 5A 2.93 L2010
A09R-02-BAC Broad Run
Recreation Escherichia coli 5A 3.22 M2010
Escherichia coli 5A 2.93 M2014
A09R-02-BEN Broad Run
Aquatic Life Benthic-Macroinvertebrate Bioassessments 5A 1.42 M2008
A09R-03-BAC Broad Run
Recreation Escherichia coli 5A 1.42 M2012
A09R-03-BEN Horsepen Run
Aquatic Life Benthic-Macroinvertebrate Bioassessments 5A 8.17 M2016
A09R-04-BAC South Fork Broad Run
Recreation Escherichia coli 5A 5.28 M2014
Appendix 1a - 1Final 2016
2016 Impaired Waters - 303(d) List
Category 5 - Waters needing Total Maximum Daily Load Study
Potomac and Shenandoah River Basins
Cause Group Code CauseCategory
TMDLDev.
Priority
Estuary(Sq. Miles)
Reservoir(Acres)
River(Miles)
InitialListDateImpaired Use
Water Name
Cause
A09R-04-BEN South Fork Broad Run
Aquatic Life Benthic-Macroinvertebrate Bioassessments 5A 5.28 M2014
A09R-05-BAC Beaverdam Run
Recreation Escherichia coli 5A 3.85 M2014
A09R-05-BEN Beaverdam Run
Aquatic Life Benthic-Macroinvertebrate Bioassessments 5A 3.85 L2016
A09R-06-BAC Indian Creek
Recreation Escherichia coli 5A 3.48 M2014
A09R-07-BAC Horsepen Run
Recreation Escherichia coli 5A 8.17 L2016
A10R-01-BEN Sugarland Run
Aquatic Life Benthic-Macroinvertebrate Bioassessments 5A 9.71 L2012
A11R-01-HEPOXID Difficult Run
Fish Consumption Heptachlor epoxide 5A 3.17 L2006
A11R-02-BEN Captain Hickory Run
Aquatic Life Benthic-Macroinvertebrate Bioassessments 5A 3.27 L2008
A11R-03-BEN Difficult Run
Aquatic Life Benthic-Macroinvertebrate Bioassessments 5A 6.37 L2008
A11R-04-BEN Colvin Run
Aquatic Life Benthic-Macroinvertebrate Bioassessments 5A 2.09 L2010
A11R-05-BEN Snakeden Branch
Aquatic Life Benthic-Macroinvertebrate Bioassessments 5A 0.97 L2010
A11R-06-BEN Little Difficult Run
Aquatic Life Benthic-Macroinvertebrate Bioassessments 5A 1.75 L2010
A11R-07-BEN Old Courthouse Spring Branch
Aquatic Life Benthic-Macroinvertebrate Bioassessments 5A 2.11 L2010
A11R-08-BAC Nichols Run
Recreation Escherichia coli 5A 4.56 L2012
A11R-08-BEN Turkey Run
Aquatic Life Benthic-Macroinvertebrate Bioassessments 5A 1.34 L2012
A11R-09-BEN Dead Run
Aquatic Life Benthic-Macroinvertebrate Bioassessments 5A 2.82 L2012
A12E-01-CDANE Four Mile Run
Fish Consumption Chlordane 5A 0.050 L2010
A12R-01-BEN Pimmit Run
Aquatic Life Benthic-Macroinvertebrate Bioassessments 5A 2.76 L2012
A12R-03-CDANE Pimmit Run
Fish Consumption Chlordane 5A 1.64 L2006
Appendix 1a - 2Final 2016

2016 Impaired Waters - 303(d) List
Category 5 - Waters needing Total Maximum Daily Load Study
Potomac and Shenandoah River Basins
Cause Group Code CauseCategory
TMDLDev.
Priority
Estuary(Sq. Miles)
Reservoir(Acres)
River(Miles)
InitialListDateImpaired Use
Water Name
Cause
A12R-03-HEPOXID Pimmit Run
Fish Consumption Heptachlor epoxide 5A 1.64 L2006
A13R-01-PCB Indian Run
Fish Consumption PCB in Fish Tissue 5A 3.18 L2006
A13R-03-BEN Holmes Run
Aquatic Life Benthic-Macroinvertebrate Bioassessments 5A 6.09 M2004
A13R-04-BEN Tripps Run
Aquatic Life Benthic-Macroinvertebrate Bioassessments 5A 3.70 M2004
A14R-01-BAC Paul Springs Branch
Recreation Escherichia coli 5A 3.38 L2010
A14R-01-BEN Paul Springs Branch
Aquatic Life Benthic-Macroinvertebrate Bioassessments 5A 3.38 L2010
A14R-01-DO Paul Springs Branch
Aquatic Life Oxygen, Dissolved 5A 3.38 L2014
A14R-02-BAC Dogue Creek
Recreation Escherichia coli 5A 1.41 L2014
A15E-01-PH Pohick Bay
Aquatic Life pH 5A 0.619 L2012
A15L-01-HG Lake Accotink
Fish Consumption Mercury in Fish Tissue 5A 73.93 L2010
A15L-01-PCB Lake Accotink
Fish Consumption PCB in Fish Tissue 5A 73.93 L2010
A15R-01-BEN Accotink Creek
Aquatic Life Benthic-Macroinvertebrate Bioassessments 5A 7.47 H1996
Benthic-Macroinvertebrate Bioassessments 5A 2.62 H2010
A15R-01-CHLR Accotink Creek
Aquatic Life Chloride 5A 5.22 L2016
Wildlife Chloride 5A 5.22 L2016
A15R-01-PCB Accotink Creek
Fish Consumption PCB in Fish Tissue 5A 10.09 L2010
A15R-04-BEN Accotink Creek
Aquatic Life Benthic-Macroinvertebrate Bioassessments 5A 3.34 H2008
Benthic-Macroinvertebrate Bioassessments 5A 8.25 H2010
A15R-05-BEN Long Branch
Aquatic Life Benthic-Macroinvertebrate Bioassessments 5A 2.37 H2008
A16E-01-BZOKFL Pohick Creek
Fish Consumption Benzo[k]fluoranthene 5A 0.292 L2002
Appendix 1a - 3Final 2016

2016 Impaired Waters - 303(d) List
Category 5 - Waters needing Total Maximum Daily Load Study
Potomac and Shenandoah River Basins
Cause Group Code CauseCategory
TMDLDev.
Priority
Estuary(Sq. Miles)
Reservoir(Acres)
River(Miles)
InitialListDateImpaired Use
Water Name
Cause
A16R-01-BAC Pohick Creek
Recreation Escherichia coli 5A 3.78 M2006
A16R-01-BEN Pohick Creek
Aquatic Life Benthic-Macroinvertebrate Bioassessments 5A 2.61 M2014
A16R-02-BAC Pohick Creek
Recreation Escherichia coli 5A 1.77 M2006
Escherichia coli 5A 5.41 M2012
Escherichia coli 5A 2.61 M2016
A16R-03-BAC South Run
Recreation Escherichia coli 5A 4.16 L2016
A16R-04-BAC Middle Run
Recreation Escherichia coli 5A 2.85 L2016
A18R-02-BEN Lucky Run
Aquatic Life Benthic-Macroinvertebrate Bioassessments 5A 3.48 L2008
A21R-01-BEN Catharpin Creek
Aquatic Life Benthic-Macroinvertebrate Bioassessments 5A 6.80 M2012
A21R-01-PCB Bull Run
Fish Consumption PCB in Fish Tissue 5A 5.81 L2004
PCB in Fish Tissue 5A 63.12 5.72 L2006
A21R-02-BEN Bull Run
Aquatic Life Benthic-Macroinvertebrate Bioassessments 5A 4.66 L2016
A22R-01-BEN Flatlick Branch
Aquatic Life Benthic-Macroinvertebrate Bioassessments 5A 3.22 M2008
A22R-02-BEN Big Rocky Run
Aquatic Life Benthic-Macroinvertebrate Bioassessments 5A 4.34 M2010
A22R-03-BEN Cub Run
Aquatic Life Benthic-Macroinvertebrate Bioassessments 5A 6.89 M2012
Benthic-Macroinvertebrate Bioassessments 5A 6.34 M2016
A22R-04-BEN Elklick Run
Aquatic Life Benthic-Macroinvertebrate Bioassessments 5A 2.27 M2014
A23R-03-BEN Little Rocky Run
Aquatic Life Benthic-Macroinvertebrate Bioassessments 5A 5.23 M2010
A24R-01-BAC Wolf Run
Recreation Escherichia coli 5A 2.50 L2006
A24R-02-BAC Sandy Run
Recreation Escherichia coli 5A 6.08 L2008
A24R-03-BAC Hooes Run
Recreation Escherichia coli 5A 0.98 L2012
Appendix 1a - 4Final 2016

2016 Impaired Waters - 303(d) List
Category 5 - Waters needing Total Maximum Daily Load Study
Potomac and Shenandoah River Basins
Cause Group Code CauseCategory
TMDLDev.
Priority
Estuary(Sq. Miles)
Reservoir(Acres)
River(Miles)
InitialListDateImpaired Use
Water Name
Cause
A25E-02-BAC Neabsco Creek
Recreation Escherichia coli 5A 0.545 L2004
A25E-03-BAC Occoquan River
Recreation Escherichia coli 5A 0.074 L2014
A25E-04-BAC Marumsco Creek
Recreation Escherichia coli 5A 0.025 L2012
A25E-04-EBEN Occoquan River
Aquatic Life Estuarine Bioassessments 5A 0.286 L2006
A25R-01-BEN Giles Run
Aquatic Life Benthic-Macroinvertebrate Bioassessments 5A 6.48 L2012
A25R-02-BAC Mills Branch
Recreation Escherichia coli 5A 1.72 L2014
A25R-03-BAC Giles Run
Recreation Escherichia coli 5A 6.48 L2014
A25R-04-BAC Marumsco Creek
Recreation Escherichia coli 5A 0.53 L2014
A25R-05-BAC Unnamed Tributary to Occoquan River
Recreation Escherichia coli 5A 1.11 L2016
A26E-01-BZOKFL Powells Creek
Fish Consumption Benzo[k]fluoranthene 5A 0.402 L2002
A26E-03-EBEN Quantico Creek
Aquatic Life Estuarine Bioassessments 5A 0.419 L2006
A26E-03-EBTOX Quantico Creek
Aquatic Life Sediment Bioassays for Estuarine and Marine Water
5A 0.419 L2006
A26L-01-HG Lake Montclair
Fish Consumption Mercury in Fish Tissue 5A 103.54 L2010
A26R-02-PH Unnamed tributary to Potomac River
Aquatic Life pH 5A 3.67 L2014
A27R-01-BAC Aquia Creek
Recreation Escherichia coli 5A 6.36 L2006
A27R-01-DO Unnamed tributary to Aquia Creek
Aquatic Life Oxygen, Dissolved 5A 2.25 L2010
A27R-02-BAC Aquia Creek
Recreation Escherichia coli 5A 8.81 L2012
A29E-01-PH Potomac Creek
Aquatic Life pH 5A 0.587 L2014
Appendix 1a - 5Final 2016

2016 Impaired Waters - 303(d) List
Category 5 - Waters needing Total Maximum Daily Load Study
Potomac and Shenandoah River Basins
Cause Group Code CauseCategory
TMDLDev.
Priority
Estuary(Sq. Miles)
Reservoir(Acres)
River(Miles)
InitialListDateImpaired Use
Water Name
Cause
A29E-02-BAC Fairview Beach (Potomac River)
Recreation Enterococcus 5R 0.005 L2006
A29E-03-BAC Chotank Creek
Recreation Enterococcus 5A 0.054 L2012
A29R-01-BEN Unnamed tributary to Long Branch
Aquatic Life Benthic-Macroinvertebrate Bioassessments 5A 2.30 L2016
A29R-03-DO Potomac Run
Aquatic Life Oxygen, Dissolved 5A 6.59 L2014
A30R-01-DO Pepper Mill Creek
Aquatic Life Oxygen, Dissolved 5C 8.66 L2010
A30R-01-PH Pepper Mill Creek
Aquatic Life pH 5C 8.66 L2010
A30R-02-DO Gambo Creek
Aquatic Life Oxygen, Dissolved 5C 0.50 L2016
A30R-02-PH Gambo Creek
Aquatic Life pH 5C 0.177 0.50 L2016
A31E-01-BAC Rosier Creek
Recreation Enterococcus 5A 0.274 L2010
A31E-11-BAC Bridges Creek
Recreation Enterococcus 5A 0.182 L2012
A31R-01-BAC Pine Hill Creek Watershed
Recreation Escherichia coli 5A 34.91 L2014
A32E-09-EBEN Lower Machodoc Creek
Aquatic Life Estuarine Bioassessments 5A 0.687 L2016
A32R-01-DO Thompson Branch
Aquatic Life Oxygen, Dissolved 5C 1.60 L2006
A32R-01-PH Thompson Branch
Aquatic Life pH 5C 1.60 L2006
A32R-03-PH XLK - Nomini Creek, UT
Aquatic Life pH 5C 1.45 L2010
A32R-05-PH Tavern Run
Aquatic Life pH 5C 3.27 L2012
A32R-06-PH Nontidal Nomini Creek Tributaries
Aquatic Life pH 5C 16.36 L2014
A32R-07-DO Marshall Creek
Aquatic Life Oxygen, Dissolved 5C 2.88 L2014
A32R-08-DO Barnes Creek
Aquatic Life Oxygen, Dissolved 5C 1.94 L2014
Appendix 1a - 6Final 2016

2016 Impaired Waters - 303(d) List
Category 5 - Waters needing Total Maximum Daily Load Study
Potomac and Shenandoah River Basins
Cause Group Code CauseCategory
TMDLDev.
Priority
Estuary(Sq. Miles)
Reservoir(Acres)
River(Miles)
InitialListDateImpaired Use
Water Name
Cause
A32R-08-PH Barnes Creek
Aquatic Life pH 5C 1.94 L2014
A32R-09-DO Mount Pleasant Creek
Aquatic Life Oxygen, Dissolved 5C 2.26 L2014
A32R-09-PH Mount Pleasant Creek
Aquatic Life pH 5C 2.26 L2014
A33E-04-BAC Lodge Creek
Recreation Enterococcus 5A 0.301 L2006
A33L-01-DO Hampton Hall, Gardy Millpond
Aquatic Life Oxygen, Dissolved 5C 45.86 L2016
A33R-02-BAC Lodge Creek
Recreation Escherichia coli 5A 3.44 L2014
A33R-02-DO Lodge Creek
Aquatic Life Oxygen, Dissolved 5C 3.44 L2010
A33R-03-DO Gardner Creek
Aquatic Life Oxygen, Dissolved 5C 1.40 L2010
A33R-03-PH Gardner Creek
Aquatic Life pH 5C 1.40 L2010
A33R-04-DO XMB - Hampton Hall Creek, UT
Aquatic Life Oxygen, Dissolved 5C 3.48 L2014
A33R-04-PH XMB - Hampton Hall Creek, UT
Aquatic Life pH 5C 3.48 L2014
A33R-05-PH XLZ - Hampton Hall Creek, UT
Aquatic Life pH 5C 3.13 L2014
A33R-07-BAC XMC - Lodge Creek, UT
Recreation Escherichia coli 5A 1.69 L2014
A34R-02-PH Little Wicomico River
Aquatic Life pH 5C 2.33 L2006
A34R-03-DO XLL - Coan Mill Stream, UT
Aquatic Life Oxygen, Dissolved 5C 2.10 L2010
B02R-01-BAC West Strait Creek
Recreation Escherichia coli 5A 0.87 L2010
B02R-06-BAC Strait Creek
Recreation Escherichia coli 5A 2.77 L2006
B03R-03-BAC South Fork South Branch Potomac River
Recreation Escherichia coli 5A 2.71 L2012
B04R-01-BAC Middle Fork Sleepy Creek
Recreation Escherichia coli 5A 2.93 L2014
Appendix 1a - 7Final 2016

2016 Impaired Waters - 303(d) List
Category 5 - Waters needing Total Maximum Daily Load Study
Potomac and Shenandoah River Basins
Cause Group Code CauseCategory
TMDLDev.
Priority
Estuary(Sq. Miles)
Reservoir(Acres)
River(Miles)
InitialListDateImpaired Use
Water Name
Cause
B04R-02-BAC Sleepy Creek
Recreation Escherichia coli 5A 7.72 L2016
B05R-01-BAC Back Creek
Recreation Escherichia coli 5A 17.61 L2010
B05R-02-BAC Little Isaacs Creek
Recreation Escherichia coli 5A 9.93 L2008
B05R-03-BAC Isaacs Creek
Recreation Escherichia coli 5A 2.84 L2016
B12R-01-PCB Lewis Creek
Fish Consumption PCB in Fish Tissue 5A 10.06 H2004
B14R-03-TEMP Long Meadow Run
Aquatic Life Temperature, water 5C 11.06 L2006
B16L-01-TEMP Elkhorn Lake
Aquatic Life Temperature, water 5A 52.66 L2010
B16R-01-PH North River
Aquatic Life pH 5A 4.46 L2002
B18R-01-BEN Wolf Run
Aquatic Life Benthic-Macroinvertebrate Bioassessments 5A 1.18 L2002
Benthic-Macroinvertebrate Bioassessments 5A 2.11 L2004
B18R-01-PH Wolf Run
Aquatic Life pH 5A 3.29 L2006
B18R-02-PH Briery Branch
Aquatic Life pH 5C 7.18 L2002
B18R-06-PH Rocky Run
Aquatic Life pH 5A 1.93 L2006
B18R-07-PH Union Springs Run
Aquatic Life pH 5A 3.73 L2006
B20L-01-TEMP Switzer Lake
Aquatic Life Temperature, water 5A 100.81 L2006
B20R-01-PH Dry River
Aquatic Life pH 5A 9.54 L2002
pH 5A 0.64 L2008
B30R-02-PH Loves Run
Aquatic Life pH 5A 5.63 M2006
B30R-03-BEN Pine Run
Aquatic Life Benthic-Macroinvertebrate Bioassessments 5A 20.38 L2014
B31L-01-PH Coles Run Reservoir
Aquatic Life pH 5A 10.84 L2008
Appendix 1a - 8Final 2016

2016 Impaired Waters - 303(d) List
Category 5 - Waters needing Total Maximum Daily Load Study
Potomac and Shenandoah River Basins
Cause Group Code CauseCategory
TMDLDev.
Priority
Estuary(Sq. Miles)
Reservoir(Acres)
River(Miles)
InitialListDateImpaired Use
Water Name
Cause
B31R-01-BAC Back Creek
Recreation Escherichia coli 5A 12.85 L2012
B31R-01-BEN Back Creek
Aquatic Life Benthic-Macroinvertebrate Bioassessments 5A 12.85 L2002
B31R-02-BEN Mills Creek
Aquatic Life Benthic-Macroinvertebrate Bioassessments 5A 9.12 L2002
B31R-04-PH Coles Run
Aquatic Life pH 5A 6.88 M2006
B31R-05-PH Johns Run
Aquatic Life pH 5A 5.45 M2006
B31R-06-PH Kennedy Creek
Aquatic Life pH 5A 15.47 M2006
B31R-07-PH Orebank Creek
Aquatic Life pH 5A 3.55 M2006
B32R-02-PCB South River
Fish Consumption PCB in Fish Tissue 5A 5.37 L2008
B32R-03-PH Paine Run
Aquatic Life pH 5A 6.73 M2004
B32R-04-PH Meadow Run
Aquatic Life pH 5A 8.82 M2004
B33R-02-PH Deep Run
Aquatic Life pH 5A 4.49 M2004
B33R-03-PH Lower Lewis Run
Aquatic Life pH 5A 3.93 M2006
B35R-01-BAC Boone Run
Recreation Fecal Coliform 5A 13.81 L2002
Escherichia coli 5A 13.81 L2010
B35R-02-BAC Quail Run
Recreation Fecal Coliform 5A 5.12 L2004
Escherichia coli 5A 5.12 L2008
Escherichia coli 5A 1.46 L2010
B35R-03-BEN Quail Run
Aquatic Life Benthic-Macroinvertebrate Bioassessments 5C 1.46 L2002
B35R-04-PH Two Mile Run
Aquatic Life pH 5A 5.05 M2006
B35R-05-PH One Mile Run
Aquatic Life pH 5A 9.16 M2010
Appendix 1a - 9Final 2016

2016 Impaired Waters - 303(d) List
Category 5 - Waters needing Total Maximum Daily Load Study
Potomac and Shenandoah River Basins
Cause Group Code CauseCategory
TMDLDev.
Priority
Estuary(Sq. Miles)
Reservoir(Acres)
River(Miles)
InitialListDateImpaired Use
Water Name
Cause
B37R-01-PCB South Fork Shenandoah River
Fish Consumption PCB in Fish Tissue 5A 19.12 L2010
B37R-02-BAC Line Run
Recreation Escherichia coli 5A 4.93 L2006
B37R-03-BAC Honey Run
Recreation Escherichia coli 5A 5.10 L2008
B37R-04-TEMP Cub Run
Aquatic Life Temperature, water 5A 9.79 L2012
B38R-02-BAC Big Run
Recreation Escherichia coli 5A 6.40 L2006
B39R-03-BEN East Hawksbill Creek
Aquatic Life Benthic-Macroinvertebrate Bioassessments 5A 9.38 L2008
B39R-03-PH Rocky Branch
Aquatic Life pH 5A 4.25 L2004
B39R-03-TEMP Pass Run
Aquatic Life Temperature, water 5A 9.47 L2010
B39R-04-BEN Dry Run
Aquatic Life Benthic-Macroinvertebrate Bioassessments 5A 5.52 L2012
B40R-01-BAC Jeremys Run
Recreation Escherichia coli 5A 11.69 H2012
B40R-02-BAC Flint Run
Recreation Fecal Coliform 5A 12.58 H2004
Escherichia coli 5A 12.58 H2016
B40R-03-BAC Gooney Run
Recreation Escherichia coli 5A 20.17 H2010
B40R-04-TEMP Flint Run
Aquatic Life Temperature, water 5A 4.10 L2010
B41R-04-BAC South Fork Shenandoah River
Recreation Escherichia coli 5A 4.47 H2010
Escherichia coli 5A 5.84 H2012
B42R-01-BAC Crab Run
Recreation Escherichia coli 5A 3.93 L2010
B42R-01-BEN North Fork Shenandoah River
Aquatic Life Benthic-Macroinvertebrate Bioassessments 5A 2.59 L2010
B45R-01-BEN Long Meadow Run
Aquatic Life Benthic-Macroinvertebrate Bioassessments 5A 9.85 H2002
B45R-02-BEN Turley Creek
Aquatic Life Benthic-Macroinvertebrate Bioassessments 5A 4.03 H2002
Appendix 1a - 10Final 2016

2016 Impaired Waters - 303(d) List
Category 5 - Waters needing Total Maximum Daily Load Study
Potomac and Shenandoah River Basins
Cause Group Code CauseCategory
TMDLDev.
Priority
Estuary(Sq. Miles)
Reservoir(Acres)
River(Miles)
InitialListDateImpaired Use
Water Name
Cause
B45R-05-BEN North Fork Shenandoah River
Aquatic Life Benthic-Macroinvertebrate Bioassessments 5A 11.54 L2008
Benthic-Macroinvertebrate Bioassessments 5A 1.98 L2012
B47R-01-BEN Fridley Run
Aquatic Life Benthic-Macroinvertebrate Bioassessments 5A 2.38 L2002
B47R-01-PH Fridley Run
Aquatic Life pH 5A 2.38 L2006
B47R-07-BEN Dry Fork
Aquatic Life Benthic-Macroinvertebrate Bioassessments 5A 10.85 L2006
B48R-02-BEN Crooked Run
Aquatic Life Benthic-Macroinvertebrate Bioassessments 5A 4.07 L2008
B49R-01-BEN Stony Creek
Aquatic Life Benthic-Macroinvertebrate Bioassessments 5A 5.85 L2008
Benthic-Macroinvertebrate Bioassessments 5A 3.43 L2016
B49R-05-TEMP Little Stony Creek
Aquatic Life Temperature, water 5A 4.91 L2012
B49R-07-TEMP Stony Creek
Aquatic Life Temperature, water 5A 4.70 L2002
Temperature, water 5A 4.68 L2004
Temperature, water 5A 9.46 L2006
B50R-03-BAC Pughs Run
Recreation Fecal Coliform 5A 7.00 L2004
Escherichia coli 5A 7.00 L2008
B50R-03-BEN Pughs Run
Aquatic Life Benthic-Macroinvertebrate Bioassessments 5A 7.00 L2012
B51R-01-BAC Tumbling Run
Recreation Fecal Coliform 5A 4.24 H2004
Escherichia coli 5A 4.24 H2008
B51R-02-BAC North Fork Shenandoah River
Recreation Escherichia coli 5A 5.42 H2008
Escherichia coli 5A 6.27 H2010
B52R-01-PH Cedar Creek
Aquatic Life pH 5A 4.82 M2014
pH 5A 3.45 M2016
B52R-04-BAC Cedar Creek
Recreation Escherichia coli 5A 7.58 H2012
Escherichia coli 5A 9.22 H2014
B52R-05-BAC Fall Run
Recreation Escherichia coli 5A 15.17 H2014
Appendix 1a - 11Final 2016

2016 Impaired Waters - 303(d) List
Category 5 - Waters needing Total Maximum Daily Load Study
Potomac and Shenandoah River Basins
Cause Group Code CauseCategory
TMDLDev.
Priority
Estuary(Sq. Miles)
Reservoir(Acres)
River(Miles)
InitialListDateImpaired Use
Water Name
Cause
B52R-06-BAC Gravel Springs
Recreation Escherichia coli 5A 3.29 L2016
B53R-01-BAC Cedar Creek
Recreation Escherichia coli 5A 3.75 H2014
B54R-01-BAC Passage Creek
Recreation Fecal Coliform 5A 10.42 H2006
Escherichia coli 5A 10.42 H2008
B54R-01-PH Passage Creek
Aquatic Life pH 5A 5.44 L2010
B56R-01-DO Crooked Run
Aquatic Life Oxygen, Dissolved 5A 2.32 L2008
B56R-02-BEN Stephens Run
Aquatic Life Benthic-Macroinvertebrate Bioassessments 5A 0.99 L2016
B57R-03-BAC Chapel Run
Recreation Escherichia coli 5A 11.74 H2008
B57R-03-BEN Chapel Run
Aquatic Life Benthic-Macroinvertebrate Bioassessments 5A 11.74 L2006
B57R-05-BAC Shenandoah River
Recreation Escherichia coli 5A 5.40 L2014
B58R-02-BAC Dog Run
Recreation Escherichia coli 5A 6.13 H2008
B58R-03-BAC Wheat Spring Branch
Recreation Escherichia coli 5A 4.69 H2008
B58R-04-BAC Long Marsh Run
Recreation Escherichia coli 5A 7.09 L2012
B58R-05-BAC Shenandoah River
Recreation Escherichia coli 5A 7.90 L2012
VA DEQ is transitioning from Fecal Coliform bacteria to Escherichia coli (fresh water) and Enterococci (salt water) for assessing the Recreation Use.
TMDL Development Priorities are: H (High) = formal EPA priority to be addressed with a plan by 2022; M (Medium) = DEQ priority that may be addressed with a plan by 2022; or L (Low) = not prioritized to be addressed with a plan by 2022. Within the H or M priority there may be "2yr" noted which means the priority is to be addressed within the two next years.
Multiple listings are due to the same impairments for different uses and/or different initial listing dates for adjacent waters.
Appendix 1a - 12Final 2016

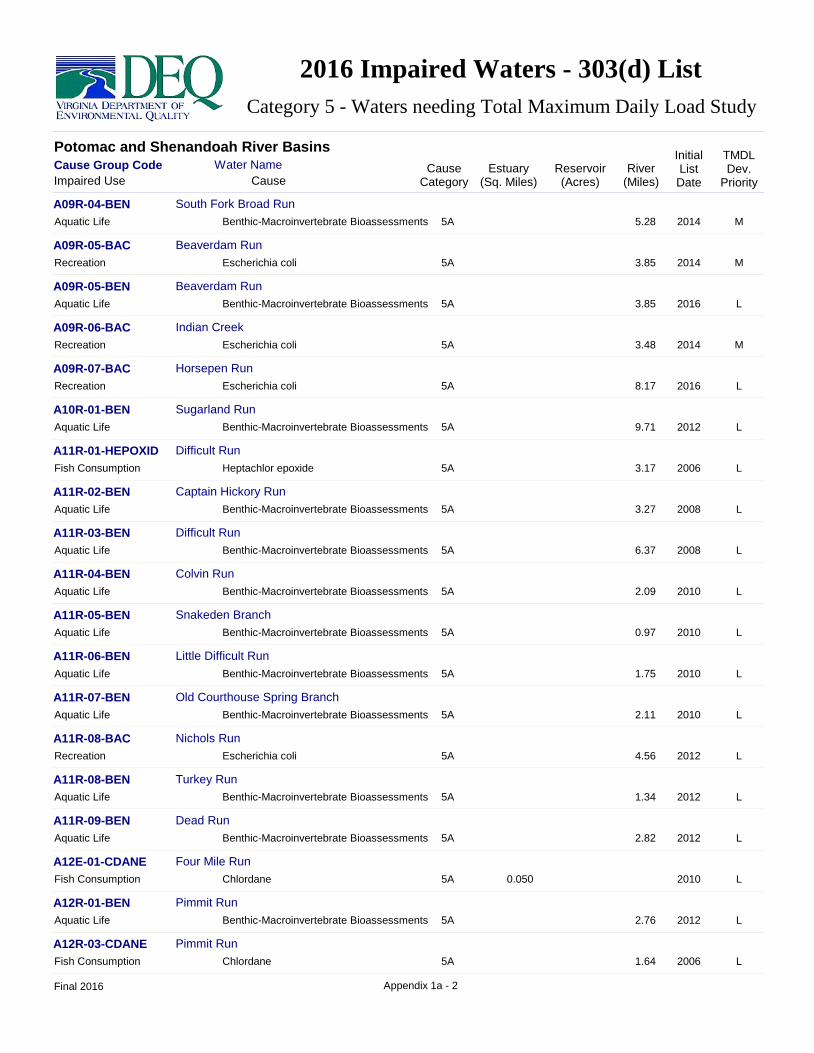
2016 Impaired Waters - 303(d) List
Category 5 - Waters needing Total Maximum Daily Load Study
James River Basin
Cause Group Code CauseCategory
TMDLDev.
Priority
Estuary(Sq. Miles)
Reservoir(Acres)
River(Miles)
InitialListDateImpaired Use
Water Name
Cause
G01E-02-EBEN James River
Aquatic Life Estuarine Bioassessments 5A 31.358 L2012
G01E-03-PCB James River and Various Tributaries
Fish Consumption PCB in Fish Tissue 5A 62.904 H, 2yr2002
PCB in Fish Tissue 5A 1.914 H, 2yr2004
PCB in Fish Tissue 5A 183.259 7.51 H, 2yr2006
PCB in Fish Tissue 5A 0.002 H, 2yr2008
G01L-01-DO Falling Creek Reservoir
Aquatic Life Oxygen, Dissolved 5A 88.37 L2012
G01R-01-PCB Goode Creek
Fish Consumption PCB in Water Column 5A 1.21 H, 2yr2012
G01R-02-PCB Almond Creek
Fish Consumption PCB in Water Column 5A 2.10 H, 2yr2012
G01R-02-PH XVO and XVP - Almond Creek, UT
Aquatic Life pH 5A 0.82 L2004
G01R-04-DO Falling Creek
Aquatic Life Oxygen, Dissolved 5A 0.98 L2008
G01R-05-PH Kingsland Creek
Aquatic Life pH 5C 8.54 L2006
G01R-06-PCB Gillies Creek
Fish Consumption PCB in Water Column 5A 5.88 H, 2yr2012
G01R-06-PH Gillies Creek
Aquatic Life pH 5A 5.88 L2004
G01R-07-DO Redwater Creek
Aquatic Life Oxygen, Dissolved 5C 2.96 L2010
G01R-09-DO UT to James River - XPF
Aquatic Life Oxygen, Dissolved 5C 0.39 L2004
G01R-09-PH UT to James River - XPF
Aquatic Life pH 5C 0.39 L2004
G01R-12-PH XYI - Coles Run, UT
Aquatic Life pH 5C 0.94 L2006
G01R-15-BEN Proctors Creek
Aquatic Life Benthic-Macroinvertebrate Bioassessments 5A 8.26 L2010
G01R-21-DO Great Branch
Aquatic Life Oxygen, Dissolved 5C 4.38 L2014
G01R-22-CU XVP - Almond Creek, UT
Aquatic Life Copper 5A 0.36 L2012
Wildlife Copper 5A 0.36 L2012
Appendix 1a - 13Final 2016

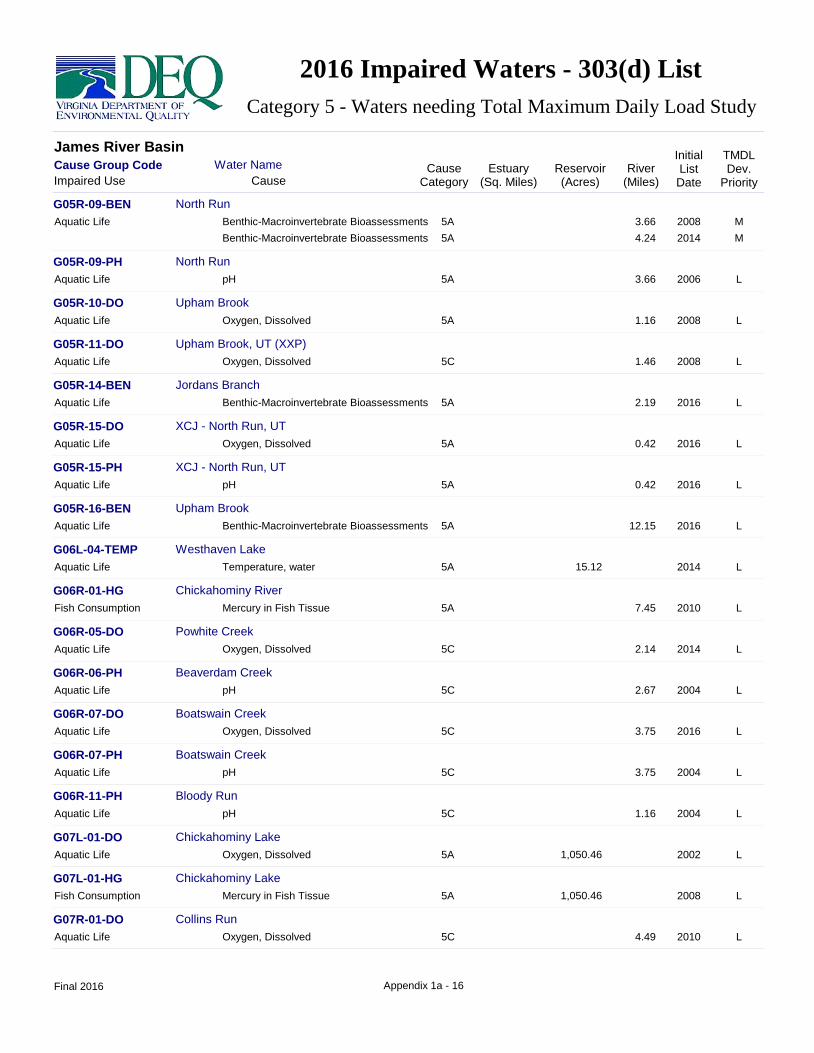
2016 Impaired Waters - 303(d) List
Category 5 - Waters needing Total Maximum Daily Load Study
James River Basin
Cause Group Code CauseCategory
TMDLDev.
Priority
Estuary(Sq. Miles)
Reservoir(Acres)
River(Miles)
InitialListDateImpaired Use
Water Name
Cause
G01R-22-ZN XVP - Almond Creek, UT
Aquatic Life Zinc 5A 0.36 L2012
Wildlife Zinc 5A 0.36 L2012
G01R-23-PH XFU - Pocoshock Creek, UT
Aquatic Life pH 5A 3.83 L2016
G02E-04-PCB James River
Fish Consumption PCB in Water Column 5A 3.972 L2012
Public Water Supply PCB in Water Column 5A 3.972 L2012
G02R-03-DO Johnson Creek Watershed
Aquatic Life Oxygen, Dissolved 5C 16.27 L2004
G02R-03-PH Johnson Creek Watershed
Aquatic Life pH 5C 16.27 L2004
G02R-05-DO Crewes Channel
Aquatic Life Oxygen, Dissolved 5C 3.24 L2012
G02R-09-DO Roundabout Creek
Aquatic Life Oxygen, Dissolved 5C 3.96 L2014
G02R-09-PH Roundabout Creek
Aquatic Life pH 5C 3.96 L2014
G02R-10-PH XBE - Roundabout Creek, UT
Aquatic Life pH 5C 1.43 L2014
G02R-11-PH Turkey Island Creek
Aquatic Life pH 5C 7.03 L2016
G03E-01-PCB Bailey Creek (tidal), Cattail Creek (tidal)
Fish Consumption PCB in Water Column 5A 0.114 L2012
G03E-01-PH Bailey Creek (tidal), Cattail Creek (tidal)
Aquatic Life pH 5A 0.114 L2004
G03E-03-PH James River
Aquatic Life pH 5A 10.194 L2014
G03L-01-DO Harrison Lake
Aquatic Life Oxygen, Dissolved 5A 60.16 L2006
G03L-01-HG Harrison Lake
Fish Consumption Mercury in Fish Tissue 5A 60.16 L2008
G03L-01-PH Harrison Lake
Aquatic Life pH 5A 60.16 L2006
G03R-02-ALD Bailey Creek
Fish Consumption Aldrin 5A 6.47 L2002
G03R-02-BEN Bailey Creek
Aquatic Life Benthic-Macroinvertebrate Bioassessments 5A 6.47 L2014
Appendix 1a - 14Final 2016

2016 Impaired Waters - 303(d) List
Category 5 - Waters needing Total Maximum Daily Load Study
James River Basin
Cause Group Code CauseCategory
TMDLDev.
Priority
Estuary(Sq. Miles)
Reservoir(Acres)
River(Miles)
InitialListDateImpaired Use
Water Name
Cause
G03R-02-PCB Bailey Creek
Fish Consumption PCB in Fish Tissue 5A 6.47 H, 2yr2002
G03R-03-PCB Poythress Run
Aquatic Life PCB in Water Column 5A 0.70 H, 2yr2012
Fish Consumption PCB in Water Column 5A 0.70 H, 2yr2012
Wildlife PCB in Water Column 5A 0.70 H, 2yr2012
G03R-04-PH West Run
Aquatic Life pH 5C 1.86 L2004
G03R-05-PCB XYO - Cattail Creek, UT
Fish Consumption PCB in Water Column 5A 0.34 H, 2yr2012
G03R-06-BEN XUD - West Run, UT
Aquatic Life Benthic-Macroinvertebrate Bioassessments 5A 1.57 L2008
G03R-06-DO Upper West Run / East Run Watershed
Aquatic Life Oxygen, Dissolved 5C 45.27 L2016
G03R-06-PH Upper West Run / East Run Watershed
Aquatic Life pH 5C 1.57 L2006
pH 5C 43.70 L2016
G04E-02-EBEN James River
Aquatic Life Estuarine Bioassessments 5A 20.409 L2004
G04L-01-BAC Sunken Meadow Pond
Recreation Escherichia coli 5A 172.85 L2016
G04L-01-DO Sunken Meadow Pond
Aquatic Life Oxygen, Dissolved 5C 172.85 L2010
G04R-03-MIREX Bailey Branch
Aquatic Life Mirex 5A 5.69 L2010
Wildlife Mirex 5A 5.69 L2010
G05R-01-NH3 Chickahominy River, UT - Unnamed Tributary
Aquatic Life Ammonia (Un-ionized) 5A 1.17 L2008
Wildlife Ammonia (Un-ionized) 5A 1.17 L2008
G05R-04-PH Chickahominy River
Aquatic Life pH 5C 2.30 L2012
G05R-06-DO Grassy Swamp Creek
Aquatic Life Oxygen, Dissolved 5C 1.02 L2008
G05R-07-DO Chickahominy River, UT (XDD)
Aquatic Life Oxygen, Dissolved 5C 0.56 L2006
G05R-07-PH Chickahominy River, UT (XDD)
Aquatic Life pH 5C 0.56 L2006
Appendix 1a - 15Final 2016
2016 Impaired Waters - 303(d) List
Category 5 - Waters needing Total Maximum Daily Load Study
James River Basin
Cause Group Code CauseCategory
TMDLDev.
Priority
Estuary(Sq. Miles)
Reservoir(Acres)
River(Miles)
InitialListDateImpaired Use
Water Name
Cause
G05R-09-BEN North Run
Aquatic Life Benthic-Macroinvertebrate Bioassessments 5A 3.66 M2008
Benthic-Macroinvertebrate Bioassessments 5A 4.24 M2014
G05R-09-PH North Run
Aquatic Life pH 5A 3.66 L2006
G05R-10-DO Upham Brook
Aquatic Life Oxygen, Dissolved 5A 1.16 L2008
G05R-11-DO Upham Brook, UT (XXP)
Aquatic Life Oxygen, Dissolved 5C 1.46 L2008
G05R-14-BEN Jordans Branch
Aquatic Life Benthic-Macroinvertebrate Bioassessments 5A 2.19 L2016
G05R-15-DO XCJ - North Run, UT
Aquatic Life Oxygen, Dissolved 5A 0.42 L2016
G05R-15-PH XCJ - North Run, UT
Aquatic Life pH 5A 0.42 L2016
G05R-16-BEN Upham Brook
Aquatic Life Benthic-Macroinvertebrate Bioassessments 5A 12.15 L2016
G06L-04-TEMP Westhaven Lake
Aquatic Life Temperature, water 5A 15.12 L2014
G06R-01-HG Chickahominy River
Fish Consumption Mercury in Fish Tissue 5A 7.45 L2010
G06R-05-DO Powhite Creek
Aquatic Life Oxygen, Dissolved 5C 2.14 L2014
G06R-06-PH Beaverdam Creek
Aquatic Life pH 5C 2.67 L2004
G06R-07-DO Boatswain Creek
Aquatic Life Oxygen, Dissolved 5C 3.75 L2016
G06R-07-PH Boatswain Creek
Aquatic Life pH 5C 3.75 L2004
G06R-11-PH Bloody Run
Aquatic Life pH 5C 1.16 L2004
G07L-01-DO Chickahominy Lake
Aquatic Life Oxygen, Dissolved 5A 1,050.46 L2002
G07L-01-HG Chickahominy Lake
Fish Consumption Mercury in Fish Tissue 5A 1,050.46 L2008
G07R-01-DO Collins Run
Aquatic Life Oxygen, Dissolved 5C 4.49 L2010
Appendix 1a - 16Final 2016

2016 Impaired Waters - 303(d) List
Category 5 - Waters needing Total Maximum Daily Load Study
James River Basin
Cause Group Code CauseCategory
TMDLDev.
Priority
Estuary(Sq. Miles)
Reservoir(Acres)
River(Miles)
InitialListDateImpaired Use
Water Name
Cause
G07R-01-PH Collins Run
Aquatic Life pH 5C 4.49 L2012
G07R-02-DO Rumley Marsh
Aquatic Life Oxygen, Dissolved 5A 1.31 L2002
G07R-02-PH Rumley Marsh
Aquatic Life pH 5A 1.31 L2010
G07R-04-DO Schiminoe Creek
Aquatic Life Oxygen, Dissolved 5C 6.22 L2012
G07R-04-PH Schiminoe Creek
Aquatic Life pH 5C 6.22 L2012
G07R-06-DO XWS - Rumley Marsh, UT
Aquatic Life Oxygen, Dissolved 5A 2.17 L2012
G07R-06-PH XWS - Rumley Marsh, UT
Aquatic Life pH 5A 2.17 L2012
G07R-07-PH XAB - Collins Run, UT
Aquatic Life pH 5C 1.72 L2012
G08E-03-BAC Diascund Creek
Recreation Enterococcus 5A 0.271 H2010
G08E-07-EBEN XAC - Chickahominy River, UT
Aquatic Life Estuarine Bioassessments 5A 0.017 L2010
G08R-02-BAC Mill Creek
Recreation Escherichia coli 5A 4.81 H2012
G08R-04-DO Yarmouth Creek
Aquatic Life Oxygen, Dissolved 5C 4.09 L2012
G08R-05-BAC Barrows Creek
Recreation Escherichia coli 5A 6.93 H2014
G08R-05-DO Barrows Creek
Aquatic Life Oxygen, Dissolved 5C 6.93 L2014
G09L-01-HG Diascund Creek Reservoir
Fish Consumption Mercury in Fish Tissue 5A 1,056.13 L2010
G09R-01-BAC Beaverdam Creek
Recreation Escherichia coli 5A 4.34 H2012
G09R-01-DO Beaverdam Creek
Aquatic Life Oxygen, Dissolved 5A 4.34 L2002
G09R-01-PH Beaverdam Creek
Aquatic Life pH 5A 4.34 L2012
G09R-02-DO Diascund Creek
Aquatic Life Oxygen, Dissolved 5C 6.88 L2008
Appendix 1a - 17Final 2016
2016 Impaired Waters - 303(d) List
Category 5 - Waters needing Total Maximum Daily Load Study
James River Basin
Cause Group Code CauseCategory
TMDLDev.
Priority
Estuary(Sq. Miles)
Reservoir(Acres)
River(Miles)
InitialListDateImpaired Use
Water Name
Cause
G09R-02-PH Diascund Creek
Aquatic Life pH 5C 6.88 L2012
G09R-03-DO XAL - Diascund Creek, UT
Aquatic Life Oxygen, Dissolved 5C 1.22 L2012
G09R-03-PH XAL - Diascund Creek, UT
Aquatic Life pH 5C 1.22 L2012
G09R-04-DO XAK - Diascund Creek, UT
Aquatic Life Oxygen, Dissolved 5C 2.91 L2012
G09R-05-DO XAJ - Diascund Creek, UT
Aquatic Life Oxygen, Dissolved 5C 2.93 L2012
G09R-06-BAC XAH - Beaverdam Creek, UT
Recreation Escherichia coli 5A 2.23 H2012
G09R-06-DO XAH - Beaverdam Creek, UT
Aquatic Life Oxygen, Dissolved 5A 2.23 L2012
G09R-07-DO Wahrani Swamp
Aquatic Life Oxygen, Dissolved 5C 3.66 L2014
G09R-08-DO XBY - Beaverdam Creek, UT
Aquatic Life Oxygen, Dissolved 5A 1.08 L2016
G10E-05-EBEN James River (Oligohaline)
Aquatic Life Estuarine Bioassessments 5A 26.412 L2004
Estuarine Bioassessments 5A 0.578 L2012
Estuarine Bioassessments 5A 1.129 L2016
G10R-01-BAC College Run
Recreation Fecal Coliform 5A 2.61 L2002
G10R-02-BEN Powhatan Creek
Aquatic Life Benthic-Macroinvertebrate Bioassessments 5A 5.36 L2002
G10R-03-BAC Dark Swamp, UT (XHC)
Recreation Escherichia coli 5A 1.30 L2012
G10R-03-DO Dark Swamp, UT (XHC)
Aquatic Life Oxygen, Dissolved 5A 1.30 L2010
G10R-04-BAC Unnamed tributary to Mill Creek
Recreation Escherichia coli 5A 1.22 L2012
G10R-05-BAC Dark Swamp
Recreation Escherichia coli 5A 3.15 L2014
G11E-20-BAC James River - Hilton Beach Area
Recreation Enterococcus 5A 0.110 L2012
G11E-21-BAC James River - Huntington Beach Area
Recreation Enterococcus 5A 0.008 L2006
Appendix 1a - 18Final 2016

2016 Impaired Waters - 303(d) List
Category 5 - Waters needing Total Maximum Daily Load Study
James River Basin
Cause Group Code CauseCategory
TMDLDev.
Priority
Estuary(Sq. Miles)
Reservoir(Acres)
River(Miles)
InitialListDateImpaired Use
Water Name
Cause
G11L-01-CU Lee Hall Reservoir
Aquatic Life Copper 5A 292.14 L2004
Wildlife Copper 5A 292.14 L2004
G11L-01-HG Lee Hall Reservoir
Fish Consumption Mercury in Fish Tissue 5A 292.14 L2010
G11L-01-PCB Lee Hall Reservoir
Fish Consumption PCB in Fish Tissue 5A 292.14 L2010
G11L-05-DO Lee Hall Reservoir
Aquatic Life Oxygen, Dissolved 5A 292.14 L2008
G11L-06-DO Scotts Factory Pond
Aquatic Life Oxygen, Dissolved 5A 14.83 L2016
G11R-02-BEN Chuckatuck Creek
Aquatic Life Benthic-Macroinvertebrate Bioassessments 5A 1.53 L2004
G11R-03-BAC Champion Swamp
Recreation Escherichia coli 5A 3.16 L2010
G11R-04-BAC Pagan River (including Wrenns Millpond)
Recreation Escherichia coli 5A 1.35 L2012
G12L-01-DO Lake Cahoon
Aquatic Life Oxygen, Dissolved 5A 454.16 L2006
G12L-02-DO Lake Meade
Aquatic Life Oxygen, Dissolved 5A 489.49 L2006
G12L-02-TP Lake Meade
Aquatic Life Phosphorus (Total) 5A 489.49 L2012
G12L-03-CHLA Speights Run Lake
Aquatic Life Chlorophyll-a 5A 120.87 L2010
G12L-03-DO Speights Run Lake
Aquatic Life Oxygen, Dissolved 5A 120.87 L2006
G12L-04-DO Lake Kilby
Aquatic Life Oxygen, Dissolved 5A 200.03 L2006
G12L-04-TP Lake Kilby
Aquatic Life Phosphorus (Total) 5A 200.03 L2014
G13E-07-PH Shingle Creek - Tributary to Nansemond R.
Aquatic Life pH 5A 0.040 L2002
G14L-01-DO Lake Burnt Mills
Aquatic Life Oxygen, Dissolved 5A 637.99 L2006
G14L-01-PH Lake Burnt Mills
Aquatic Life pH 5A 637.99 L2016
Appendix 1a - 19Final 2016

2016 Impaired Waters - 303(d) List
Category 5 - Waters needing Total Maximum Daily Load Study
James River Basin
Cause Group Code CauseCategory
TMDLDev.
Priority
Estuary(Sq. Miles)
Reservoir(Acres)
River(Miles)
InitialListDateImpaired Use
Water Name
Cause
G14L-02-DO Western Branch Reservoir
Aquatic Life Oxygen, Dissolved 5A 1,209.67 L2006
G14L-02-TP Western Branch Reservoir
Aquatic Life Phosphorus (Total) 5A 1,209.67 L2012
G14L-03-DO Lake Prince Reservoir
Aquatic Life Oxygen, Dissolved 5A 715.37 L2006
G14R-01-PH Carbell Swamp - Upper
Aquatic Life pH 5C 2.95 L2002
G14R-02-BAC Carbell Swamp - Lower
Recreation Escherichia coli 5A 2.88 L2010
G14R-02-DO Carbell Swamp - Lower
Aquatic Life Oxygen, Dissolved 5A 2.88 L2008
G15E-01-01-TCDD Elizabeth River Southern Branch and its tidal tributaries. CBP segment SBEMH.
Fish Consumption Dioxin (including 2,3,7,8-TCDD) 5A 3.147 L2010
G15E-02-04-EBEN Eastern Branch Elizabeth River, Broad Creek and Unsegmented estuaries in EBEMH
Aquatic Life Estuarine Bioassessments 5A 1.764 L2004
Estuarine Bioassessments 5A 0.587 L2006
G15E-03-01-EBEN Elizabeth River Mainstem
Aquatic Life Estuarine Bioassessments 5A 4.473 L2004
Estuarine Bioassessments 5A 3.445 L2010
G15E-03-03-EBEN Scott Creek
Aquatic Life Estuarine Bioassessments 5A 0.194 L2016
G15E-04-02-EBEN Western Branch Elizabeth River and Unsegmented estuaries in WBEMH
Aquatic Life Estuarine Bioassessments 5A 0.561 L2006
Estuarine Bioassessments 5A 2.164 L2010
G15E-06-01-BAC James River - King/Lincoln Park Beach Area
Recreation Enterococcus 5A 0.009 L2006
G15E-06-02-BAC James River - Anderson Park Beach Area
Recreation Enterococcus 5A 0.011 L2012
G15E-06-04-BAC Willoughby Bay - Beach Area
Recreation Enterococcus 5A 0.142 M2014
H01R-01-HG James River
Fish Consumption Mercury in Fish Tissue 5A 15.83 L2010
H01R-02-BAC James River
Recreation Escherichia coli 5A 7.42 L2014
H01R-03-BAC James River
Recreation Escherichia coli 5A 5.36 L2016
Appendix 1a - 20Final 2016

2016 Impaired Waters - 303(d) List
Category 5 - Waters needing Total Maximum Daily Load Study
James River Basin
Cause Group Code CauseCategory
TMDLDev.
Priority
Estuary(Sq. Miles)
Reservoir(Acres)
River(Miles)
InitialListDateImpaired Use
Water Name
Cause
H03R-01-BEN Blackwater Creek
Aquatic Life Benthic-Macroinvertebrate Bioassessments 5A 10.54 L2010
H03R-03-BEN Ivy Creek
Aquatic Life Benthic-Macroinvertebrate Bioassessments 5A 21.44 L2010
H03R-04-PCB James River
Fish Consumption PCB in Fish Tissue 5A 10.74 H2004
PCB in Fish Tissue 5A 158.36 H2006
PCB in Fish Tissue 5A 3.89 H2008
PCB in Fish Tissue 5A 23.24 H2008
PCB in Fish Tissue 5A 3.05 H2014
H03R-05-BEN Burton Creek
Aquatic Life Benthic-Macroinvertebrate Bioassessments 5A 3.47 L2010
H03R-06-BEN Judith Creek
Aquatic Life Benthic-Macroinvertebrate Bioassessments 5A 11.08 L2010
H03R-07-BEN Tomahawk Creek
Aquatic Life Benthic-Macroinvertebrate Bioassessments 5A 6.06 L2010
H05R-01-BAC James River
Recreation Escherichia coli 5A 15.93 L2010
H05R-03-BAC Beaver Creek
Recreation Escherichia coli 5A 8.67 H2004
H05R-06-BAC Little Beaver Creek
Recreation Escherichia coli 5A 7.13 L2010
H05R-08-BAC Beck Creek
Recreation Escherichia coli 5A 6.28 L2012
H05R-09-BAC Partridge Creek
Recreation Escherichia coli 5A 10.40 L2012
H05R-10-BAC Archer Creek
Recreation Escherichia coli 5A 7.46 L2016
H05R-11-BAC Allens Creek
Recreation Escherichia coli 5A 7.18 L2016
H08R-01-BAC Davids Creek
Recreation Escherichia coli 5A 5.18 L2012
H09R-01-PH Montebello Spring Branch
Aquatic Life pH 5A 0.13 L2004
H09R-02-BEN Hat Creek
Aquatic Life Benthic-Macroinvertebrate Bioassessments 5A 9.51 H2012
H09R-04-BEN Tye River
Aquatic Life Benthic-Macroinvertebrate Bioassessments 5A 7.70 H2012
Appendix 1a - 21Final 2016

2016 Impaired Waters - 303(d) List
Category 5 - Waters needing Total Maximum Daily Load Study
James River Basin
Cause Group Code CauseCategory
TMDLDev.
Priority
Estuary(Sq. Miles)
Reservoir(Acres)
River(Miles)
InitialListDateImpaired Use
Water Name
Cause
H09R-05-BEN Black Creek
Aquatic Life Benthic-Macroinvertebrate Bioassessments 5A 1.95 H2014
H11L-01-DO Stonehouse Creek Reservoir
Aquatic Life Oxygen, Dissolved 5A 33.53 L2008
H11L-01-PH Stonehouse Creek Reservoir
Aquatic Life pH 5A 33.53 L2006
H11L-02-CHLA Thrashers Creek Reservoir
Aquatic Life Chlorophyll-a 5A 31.95 L2014
H11L-02-PH Thrashers Creek Reservoir
Aquatic Life pH 5A 31.95 L2006
H11L-03-PH Mill Creek Reservoir
Aquatic Life pH 5A 186.40 L2014
H12R-01-BEN Rutledge Creek
Aquatic Life Benthic-Macroinvertebrate Bioassessments 5A 3.32 L2010
H13L-01-DO Lake Nelson
Aquatic Life Oxygen, Dissolved 5A 40.62 L2016
H14R-01-BEN Mallorys Creek
Aquatic Life Benthic-Macroinvertebrate Bioassessments 5A 8.75 L2016
H14R-01-HG James River
Fish Consumption Mercury in Fish Tissue 5A 18.57 L2010
H15R-03-BEN Taylor Creek
Aquatic Life Benthic-Macroinvertebrate Bioassessments 5A 4.99 L2008
H16R-02-BAC Beaver Creek
Recreation Escherichia coli 5A 7.41 L2012
H16R-03-BAC Cove Creek
Recreation Escherichia coli 5A 10.46 L2012
H16R-04-BAC Rockfish River
Recreation Escherichia coli 5A 17.28 L2012
H16R-05-BAC Rockfish River UT
Recreation Escherichia coli 5A 2.69 L2016
H17L-01-DO Totier Creek Reservoir
Aquatic Life Oxygen, Dissolved 5A 37.23 L2012
H17R-02-BAC James River
Recreation Escherichia coli 5A 18.69 L2008
Escherichia coli 5A 16.32 L2012
H17R-05-BEN Totier Creek
Aquatic Life Benthic-Macroinvertebrate Bioassessments 5A 0.71 L2006
Appendix 1a - 22Final 2016

2016 Impaired Waters - 303(d) List
Category 5 - Waters needing Total Maximum Daily Load Study
James River Basin
Cause Group Code CauseCategory
TMDLDev.
Priority
Estuary(Sq. Miles)
Reservoir(Acres)
River(Miles)
InitialListDateImpaired Use
Water Name
Cause
H20R-02-BAC South Creek
Recreation Escherichia coli 5A 6.66 L2014
H21L-01-DO Troublesome Reservoir
Aquatic Life Oxygen, Dissolved 5A 52.68 L2010
H21R-01-BEN Horsepen Creek
Aquatic Life Benthic-Macroinvertebrate Bioassessments 5A 5.86 L2014
H21R-02-BEN Walton Fork
Aquatic Life Benthic-Macroinvertebrate Bioassessments 5A 2.99 L2016
H23L-01-CHLA Lake Albemarle
Aquatic Life Chlorophyll-a 5A 37.01 L2016
H23L-01-DO Lake Albemarle
Aquatic Life Oxygen, Dissolved 5A 37.01 L2016
H23R-01-BEN Broad Axe Run
Aquatic Life Benthic-Macroinvertebrate Bioassessments 5A 8.31 H2004
H23R-02-BEN Lickinghole Creek
Aquatic Life Benthic-Macroinvertebrate Bioassessments 5A 8.93 H2010
H23R-03-BEN Mechums River
Aquatic Life Benthic-Macroinvertebrate Bioassessments 5A 15.16 H2004
H23R-04-BEN Slabtown Branch
Aquatic Life Benthic-Macroinvertebrate Bioassessments 5A 4.92 H2010
H23R-06-BEN Parrott Branch X-trib
Aquatic Life Benthic-Macroinvertebrate Bioassessments 5A 1.15 H2010
H23R-07-BEN Spring Creek
Aquatic Life Benthic-Macroinvertebrate Bioassessments 5A 3.48 H2012
H23R-08-BAC Stockton Creek
Recreation Escherichia coli 5A 12.06 L2014
H24R-01-TEMP Moormans River North Fork/Pond Ridge Branch
Aquatic Life Temperature, water 5A 21.10 L2014
H24R-02-BEN X-trib to Doyles River
Aquatic Life Benthic-Macroinvertebrate Bioassessments 5A 4.74 H2012
H25R-01-BAC Buck Mountain Creek
Recreation Escherichia coli 5A 10.59 L2010
H25R-02-BEN Piney Creek X-trib
Aquatic Life Benthic-Macroinvertebrate Bioassessments 5A 3.22 H2012
H26R-01-BAC Ivy Creek
Recreation Escherichia coli 5A 9.51 H2014
H26R-02-PH Ivy Creek
Aquatic Life pH 5A 5.49 L2006
Appendix 1a - 23Final 2016

2016 Impaired Waters - 303(d) List
Category 5 - Waters needing Total Maximum Daily Load Study
James River Basin
Cause Group Code CauseCategory
TMDLDev.
Priority
Estuary(Sq. Miles)
Reservoir(Acres)
River(Miles)
InitialListDateImpaired Use
Water Name
Cause
H26R-03-BEN Ivy Creek
Aquatic Life Benthic-Macroinvertebrate Bioassessments 5A 6.58 H2008
Benthic-Macroinvertebrate Bioassessments 5A 5.49 H2010
H26R-04-BEN South Fork Rivanna River
Aquatic Life Benthic-Macroinvertebrate Bioassessments 5A 3.47 H2010
H26R-05-BEN Powell Creek
Aquatic Life Benthic-Macroinvertebrate Bioassessments 5A 10.36 H2010
H26R-06-BEN Naked Creek
Aquatic Life Benthic-Macroinvertebrate Bioassessments 5A 9.82 H2010
H26R-07-BEN South Fork Rivanna River X-trib
Aquatic Life Benthic-Macroinvertebrate Bioassessments 5A 3.20 H2010
H26R-08-BEN Fishing Creek
Aquatic Life Benthic-Macroinvertebrate Bioassessments 5A 12.53 H2012
H26R-09-BEN Little Ivy Creek X-trib
Aquatic Life Benthic-Macroinvertebrate Bioassessments 5A 4.44 L2016
H27R-01-BEN Flat Branch X-trib
Aquatic Life Benthic-Macroinvertebrate Bioassessments 5A 2.03 H2010
H27R-02-BAC Swift Run
Recreation Escherichia coli 5A 1.91 H2010
H27R-02-BEN Swift Run
Aquatic Life Benthic-Macroinvertebrate Bioassessments 5A 1.91 H, 2yr2012
H27R-03-BEN Preddy Creek North Branch
Aquatic Life Benthic-Macroinvertebrate Bioassessments 5A 6.24 H, 2yr2010
H27R-05-BEN Marsh Run
Aquatic Life Benthic-Macroinvertebrate Bioassessments 5A 3.65 H2010
H27R-06-BEN Blue Run
Aquatic Life Benthic-Macroinvertebrate Bioassessments 5A 8.72 H2012
H27R-07-BEN Stanardsville Run
Aquatic Life Benthic-Macroinvertebrate Bioassessments 5A 5.70 H2014
H27R-08-BEN Preddy Creek
Aquatic Life Benthic-Macroinvertebrate Bioassessments 5A 7.48 L2016
H27R-09-BEN North Fork Rivanna River
Aquatic Life Benthic-Macroinvertebrate Bioassessments 5A 7.33 L2016
H27R-10-BEN Quarter Creek
Aquatic Life Benthic-Macroinvertebrate Bioassessments 5A 1.58 L2016
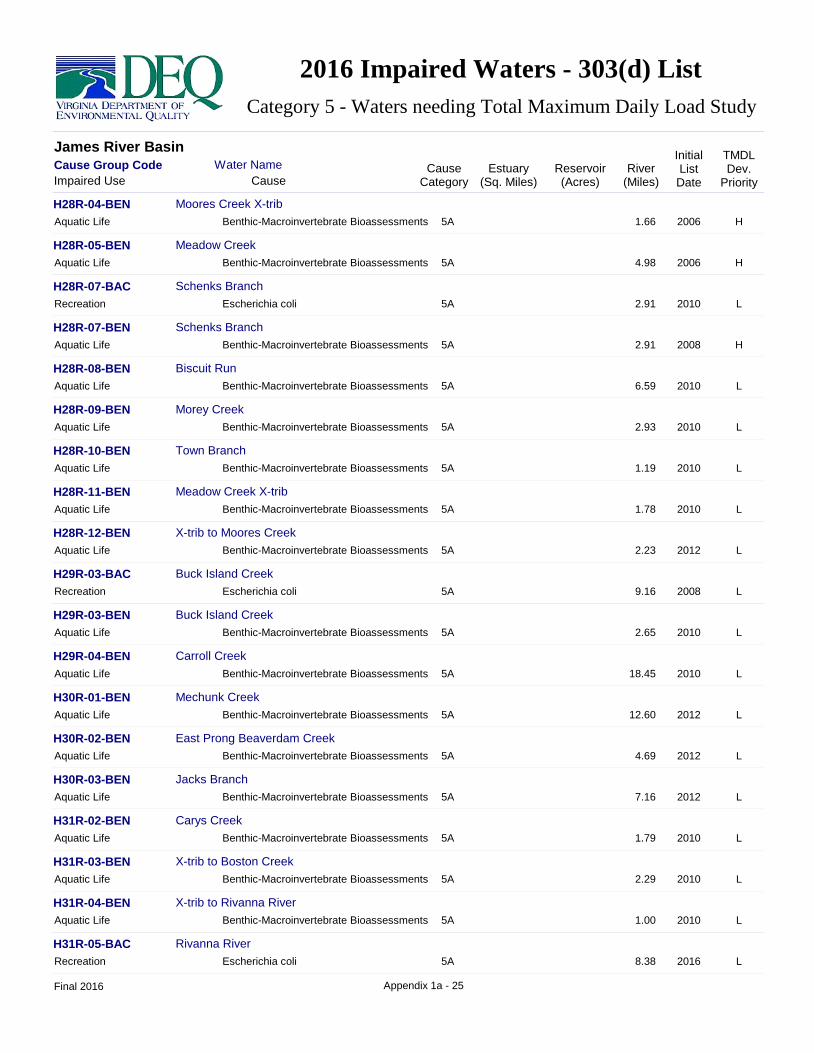
H28R-02-BEN Moores Creek
Aquatic Life Benthic-Macroinvertebrate Bioassessments 5A 6.32 H2008
Appendix 1a - 24Final 2016
2016 Impaired Waters - 303(d) List
Category 5 - Waters needing Total Maximum Daily Load Study
James River Basin
Cause Group Code CauseCategory
TMDLDev.
Priority
Estuary(Sq. Miles)
Reservoir(Acres)
River(Miles)
InitialListDateImpaired Use
Water Name
Cause
H28R-04-BEN Moores Creek X-trib
Aquatic Life Benthic-Macroinvertebrate Bioassessments 5A 1.66 H2006
H28R-05-BEN Meadow Creek
Aquatic Life Benthic-Macroinvertebrate Bioassessments 5A 4.98 H2006
H28R-07-BAC Schenks Branch
Recreation Escherichia coli 5A 2.91 L2010
H28R-07-BEN Schenks Branch
Aquatic Life Benthic-Macroinvertebrate Bioassessments 5A 2.91 H2008
H28R-08-BEN Biscuit Run
Aquatic Life Benthic-Macroinvertebrate Bioassessments 5A 6.59 L2010
H28R-09-BEN Morey Creek
Aquatic Life Benthic-Macroinvertebrate Bioassessments 5A 2.93 L2010
H28R-10-BEN Town Branch
Aquatic Life Benthic-Macroinvertebrate Bioassessments 5A 1.19 L2010
H28R-11-BEN Meadow Creek X-trib
Aquatic Life Benthic-Macroinvertebrate Bioassessments 5A 1.78 L2010
H28R-12-BEN X-trib to Moores Creek
Aquatic Life Benthic-Macroinvertebrate Bioassessments 5A 2.23 L2012
H29R-03-BAC Buck Island Creek
Recreation Escherichia coli 5A 9.16 L2008
H29R-03-BEN Buck Island Creek
Aquatic Life Benthic-Macroinvertebrate Bioassessments 5A 2.65 L2010
H29R-04-BEN Carroll Creek
Aquatic Life Benthic-Macroinvertebrate Bioassessments 5A 18.45 L2010
H30R-01-BEN Mechunk Creek
Aquatic Life Benthic-Macroinvertebrate Bioassessments 5A 12.60 L2012
H30R-02-BEN East Prong Beaverdam Creek
Aquatic Life Benthic-Macroinvertebrate Bioassessments 5A 4.69 L2012
H30R-03-BEN Jacks Branch
Aquatic Life Benthic-Macroinvertebrate Bioassessments 5A 7.16 L2012
H31R-02-BEN Carys Creek
Aquatic Life Benthic-Macroinvertebrate Bioassessments 5A 1.79 L2010
H31R-03-BEN X-trib to Boston Creek
Aquatic Life Benthic-Macroinvertebrate Bioassessments 5A 2.29 L2010
H31R-04-BEN X-trib to Rivanna River
Aquatic Life Benthic-Macroinvertebrate Bioassessments 5A 1.00 L2010
H31R-05-BAC Rivanna River
Recreation Escherichia coli 5A 8.38 L2016
Appendix 1a - 25Final 2016
2016 Impaired Waters - 303(d) List
Category 5 - Waters needing Total Maximum Daily Load Study
James River Basin
Cause Group Code CauseCategory
TMDLDev.
Priority
Estuary(Sq. Miles)
Reservoir(Acres)
River(Miles)
InitialListDateImpaired Use
Water Name
Cause
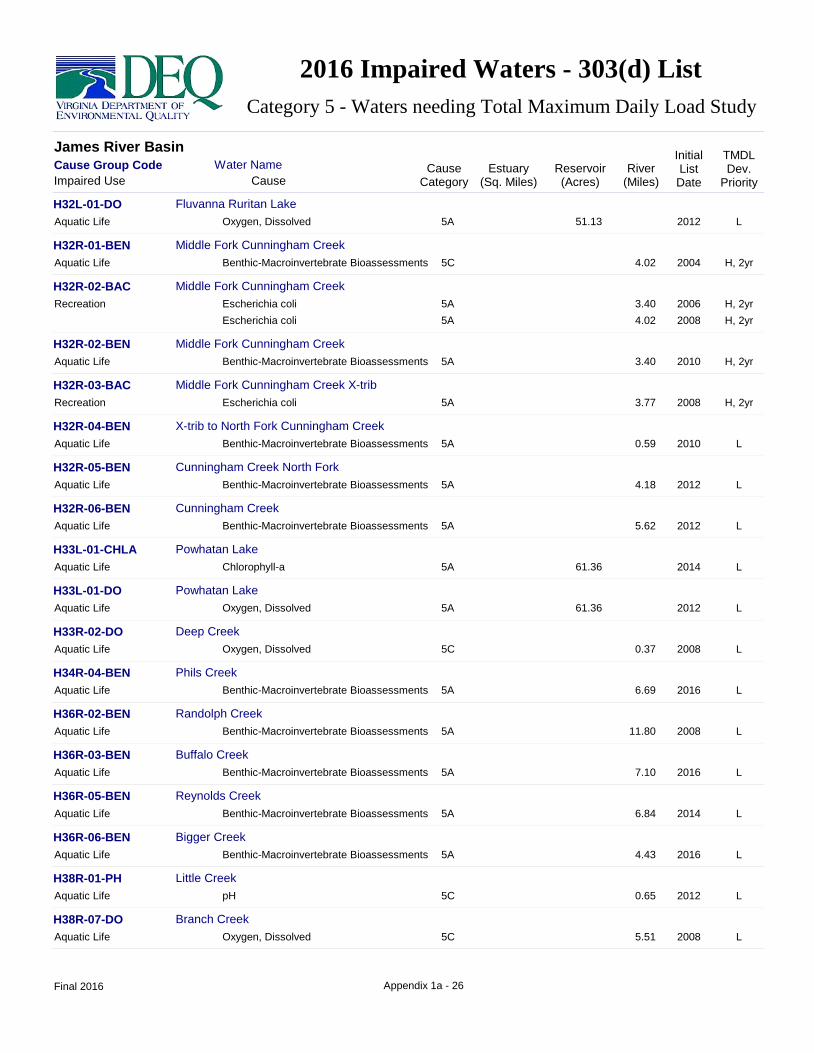
H32L-01-DO Fluvanna Ruritan Lake
Aquatic Life Oxygen, Dissolved 5A 51.13 L2012
H32R-01-BEN Middle Fork Cunningham Creek
Aquatic Life Benthic-Macroinvertebrate Bioassessments 5C 4.02 H, 2yr2004
H32R-02-BAC Middle Fork Cunningham Creek
Recreation Escherichia coli 5A 3.40 H, 2yr2006
Escherichia coli 5A 4.02 H, 2yr2008
H32R-02-BEN Middle Fork Cunningham Creek
Aquatic Life Benthic-Macroinvertebrate Bioassessments 5A 3.40 H, 2yr2010
H32R-03-BAC Middle Fork Cunningham Creek X-trib
Recreation Escherichia coli 5A 3.77 H, 2yr2008
H32R-04-BEN X-trib to North Fork Cunningham Creek
Aquatic Life Benthic-Macroinvertebrate Bioassessments 5A 0.59 L2010
H32R-05-BEN Cunningham Creek North Fork
Aquatic Life Benthic-Macroinvertebrate Bioassessments 5A 4.18 L2012
H32R-06-BEN Cunningham Creek
Aquatic Life Benthic-Macroinvertebrate Bioassessments 5A 5.62 L2012
H33L-01-CHLA Powhatan Lake
Aquatic Life Chlorophyll-a 5A 61.36 L2014
H33L-01-DO Powhatan Lake
Aquatic Life Oxygen, Dissolved 5A 61.36 L2012
H33R-02-DO Deep Creek
Aquatic Life Oxygen, Dissolved 5C 0.37 L2008
H34R-04-BEN Phils Creek
Aquatic Life Benthic-Macroinvertebrate Bioassessments 5A 6.69 L2016
H36R-02-BEN Randolph Creek
Aquatic Life Benthic-Macroinvertebrate Bioassessments 5A 11.80 L2008
H36R-03-BEN Buffalo Creek
Aquatic Life Benthic-Macroinvertebrate Bioassessments 5A 7.10 L2016
H36R-05-BEN Reynolds Creek
Aquatic Life Benthic-Macroinvertebrate Bioassessments 5A 6.84 L2014
H36R-06-BEN Bigger Creek
Aquatic Life Benthic-Macroinvertebrate Bioassessments 5A 4.43 L2016
H38R-01-PH Little Creek
Aquatic Life pH 5C 0.65 L2012
H38R-07-DO Branch Creek
Aquatic Life Oxygen, Dissolved 5C 5.51 L2008
Appendix 1a - 26Final 2016

2016 Impaired Waters - 303(d) List
Category 5 - Waters needing Total Maximum Daily Load Study
James River Basin
Cause Group Code CauseCategory
TMDLDev.
Priority
Estuary(Sq. Miles)
Reservoir(Acres)
River(Miles)
InitialListDateImpaired Use
Water Name
Cause
H39R-01-PH Broad Branch
Aquatic Life pH 5A 2.63 L2006
H39R-05-BEN Powhite Creek
Aquatic Life Benthic-Macroinvertebrate Bioassessments 5A 8.13 L2008
H39R-06-PH Reedy Creek
Aquatic Life pH 5A 0.35 L2010
H39R-07-DO XZE - James River, UT
Aquatic Life Oxygen, Dissolved 5A 1.30 L2010
H39R-08-DO XAB - Salles Creek, UT
Aquatic Life Oxygen, Dissolved 5A 0.10 L2010
H39R-08-PH XAB - Salles Creek, UT
Aquatic Life pH 5A 0.10 L2010
H39R-09-DO James River - South Channel
Aquatic Life Oxygen, Dissolved 5A 0.94 L2012
H39R-10-DO Bernards Creek
Aquatic Life Oxygen, Dissolved 5A 8.12 L2014
H39R-11-HG James River
Fish Consumption Mercury in Fish Tissue 5A 4.37 L2010
H39R-13-BEN Stony Run
Aquatic Life Benthic-Macroinvertebrate Bioassessments 5A 1.01 M2008
H39R-14-BEN Jones Creek
Aquatic Life Benthic-Macroinvertebrate Bioassessments 5A 8.19 L2008
H39R-15-BEN Stony Run, UT (XYT)
Aquatic Life Benthic-Macroinvertebrate Bioassessments 5A 1.27 M2008
H39R-16-HG James River
Fish Consumption Mercury in Fish Tissue 5A 3.88 L2010
H39R-17-CDANE James River
Fish Consumption Chlordane 5A 3.88 L2010
H39R-17-DDE James River
Fish Consumption DDE 5A 3.88 L2010
H39R-17-DDT James River
Fish Consumption DDT 5A 3.88 L2010
H39R-19-DO Deep Run
Aquatic Life Oxygen, Dissolved 5C 1.49 L2012
H39R-24-DO Little Tuckahoe Creek
Aquatic Life Oxygen, Dissolved 5C 6.02 L2014
H39R-27-BEN Deep Run
Aquatic Life Benthic-Macroinvertebrate Bioassessments 5A 4.16 L2016
Appendix 1a - 27Final 2016

2016 Impaired Waters - 303(d) List
Category 5 - Waters needing Total Maximum Daily Load Study
James River Basin
Cause Group Code CauseCategory
TMDLDev.
Priority
Estuary(Sq. Miles)
Reservoir(Acres)
River(Miles)
InitialListDateImpaired Use
Water Name
Cause
H39R-28-BEN Stony Run
Aquatic Life Benthic-Macroinvertebrate Bioassessments 5A 1.35 L2016
H39R-29-DO XBH - Reedy Creek, UT
Aquatic Life Oxygen, Dissolved 5A 0.11 L2016
I01R-01-TEMP Jackson River
Aquatic Life Temperature, water 5C 13.49 L2004
Temperature, water 5C 15.37 L2010
I01R-02-TEMP Bolar Run
Aquatic Life Temperature, water 5C 2.09 L2006
I02R-02-BAC Back Creek
Recreation Escherichia coli 5A 15.05 L2010
I04R-01-BAC Falling Spring
Recreation Escherichia coli 5A 5.10 H2008
I09R-01-BAC Smith Creek
Recreation Fecal Coliform 5A 1.21 H2004
I09R-01-DO Jackson River
Aquatic Life Oxygen, Dissolved 5A 11.36 H1996
I09R-01-PCB Jackson River
Fish Consumption PCB in Fish Tissue 5A 12.63 L2008
I09R-02-BAC Jackson River
Recreation Escherichia coli 5A 3.40 H2008
Escherichia coli 5A 9.23 H2010
I09R-02-TEMP Wilson Creek
Aquatic Life Temperature, water 5C 6.74 L2004
I10R-01-TEMP Potts Creek
Aquatic Life Temperature, water 5C 5.66 L2006
I12R-01-BAC Cowpasture River
Recreation Escherichia coli 5A 8.30 L2016
I13R-01-BAC Bullpasture River
Recreation Escherichia coli 5A 11.94 H, 2yr2006
I13R-02-TEMP Bullpasture River
Aquatic Life Temperature, water 5A 24.56 L2012
I14R-04-PH Laurel Run
Aquatic Life pH 5A 2.03 L2006
I16R-01-PH Porters Mill Creek
Aquatic Life pH 5A 4.85 L2006
I18R-01-BAC James River
Recreation Escherichia coli 5A 7.63 H, 2yr2014
Appendix 1a - 28Final 2016

2016 Impaired Waters - 303(d) List
Category 5 - Waters needing Total Maximum Daily Load Study
James River Basin
Cause Group Code CauseCategory
TMDLDev.
Priority
Estuary(Sq. Miles)
Reservoir(Acres)
River(Miles)
InitialListDateImpaired Use
Water Name
Cause
I18R-03-BAC Sinking Creek
Recreation Escherichia coli 5A 6.42 H, 2yr2014
I19R-01-BAC Craig Creek
Recreation Escherichia coli 5A 7.90 H, 2yr2004
I22R-01-BAC Barbours Creek
Recreation Fecal Coliform 5A 7.15 H, 2yr2004
I22R-01-PH Mill Creek
Aquatic Life pH 5A 4.24 L2012
I22R-01-TEMP Barbours Creek
Aquatic Life Temperature, water 5C 7.15 L2002
I22R-02-BAC Craig Creek
Recreation Escherichia coli 5A 11.43 H, 2yr2012
I22R-04-BAC Little Patterson Creek
Recreation Escherichia coli 5A 4.24 H, 2yr2012
I22R-05-BAC Craig Creek
Recreation Escherichia coli 5A 10.70 L2016
Escherichia coli 5A 16.86 L2016
I24R-01-BAC Lapsley Run
Recreation Escherichia coli 5A 9.01 H, 2yr2008
I25R-01-BAC Catawba Creek
Recreation Escherichia coli 5A 13.46 H, 2yr2010
I25R-01-BEN Catawba Creek
Aquatic Life Benthic-Macroinvertebrate Bioassessments 5A 3.23 H, 2yr2008
I26R-01-BEN Mill Creek, UT (XUL)
Aquatic Life Benthic-Macroinvertebrate Bioassessments 5A 5.37 L2010
I27R-01-BAC James River
Recreation Escherichia coli 5A 7.15 L2014
Escherichia coli 5A 9.52 L2016
I28R-02-BAC Elk Creek
Recreation Escherichia coli 5A 3.98 L2014
I29R-01-TEMP Ramseys Draft
Aquatic Life Temperature, water 5A 10.29 L2016
I30R-01-BAC Calfpasture River
Recreation Escherichia coli 5A 2.83 L2006
I30R-03-BAC Hamilton Branch
Recreation Escherichia coli 5A 6.28 L2016
I30R-03-PH Piney Branch
Aquatic Life pH 5A 2.33 L2006
Appendix 1a - 29Final 2016

2016 Impaired Waters - 303(d) List
Category 5 - Waters needing Total Maximum Daily Load Study
James River Basin
Cause Group Code CauseCategory
TMDLDev.
Priority
Estuary(Sq. Miles)
Reservoir(Acres)
River(Miles)
InitialListDateImpaired Use
Water Name
Cause
I32R-03-BAC Little Calfpasture River
Recreation Fecal Coliform 5A 12.35 L2004
Escherichia coli 5A 12.35 L2010
I33R-01-BAC Cedar Grove Branch
Recreation Fecal Coliform 5A 4.62 L2004
Escherichia coli 5A 4.62 L2008
I33R-03-BAC Kerrs Creek
Recreation Escherichia coli 5A 11.86 L2012
I35R-02-BAC Mill Creek
Recreation Fecal Coliform 5A 9.13 L2006
Escherichia coli 5A 9.13 L2008
I35R-02-BEN Mill Creek
Aquatic Life Benthic-Macroinvertebrate Bioassessments 5A 9.13 L2016
I35R-03-BAC Woods Creek
Recreation Escherichia coli 5A 6.05 H2012
I35R-03-BEN Woods Creek
Aquatic Life Benthic-Macroinvertebrate Bioassessments 5A 6.05 H2008
I36R-02-BEN Moores Creek
Aquatic Life Benthic-Macroinvertebrate Bioassessments 5A 9.09 L2006
I36R-03-PH Saint Marys River
Aquatic Life pH 5A 1.97 L2006
I36R-03-TEMP Saint Marys River
Aquatic Life Temperature, water 5A 1.97 L2010
I36R-05-BEN Marl Creek
Aquatic Life Benthic-Macroinvertebrate Bioassessments 5A 7.74 L2012
I36R-06-BAC South River
Recreation Escherichia coli 5A 7.95 L2012
I37R-02-PCB Maury River
Fish Consumption PCB in Fish Tissue 5A 4.58 H2004
PCB in Fish Tissue 5A 12.34 H2006
I37R-03-BAC Poague Run
Recreation Escherichia coli 5A 17.12 L2014
I38L-01-PH Lexington Reservoir
Aquatic Life pH 5A 22.60 L2010
J01R-02-BEN Horsepen Creek
Aquatic Life Benthic-Macroinvertebrate Bioassessments 5A 4.00 L2016
J01R-09-BEN Crane Creek
Aquatic Life Benthic-Macroinvertebrate Bioassessments 5A 5.18 M, 2yr2010
Appendix 1a - 30Final 2016

2016 Impaired Waters - 303(d) List
Category 5 - Waters needing Total Maximum Daily Load Study
James River Basin
Cause Group Code CauseCategory
TMDLDev.
Priority
Estuary(Sq. Miles)
Reservoir(Acres)
River(Miles)
InitialListDateImpaired Use
Water Name
Cause
J03R-06-BEN Sandy River
Aquatic Life Benthic-Macroinvertebrate Bioassessments 5A 4.08 L2014
J04R-01-BEN Bush River
Aquatic Life Benthic-Macroinvertebrate Bioassessments 5A 11.48 L2010
J04R-02-BEN Mountain Creek
Aquatic Life Benthic-Macroinvertebrate Bioassessments 5A 8.97 M, 2yr2010
J05R-01-BEN Briery Creek
Aquatic Life Benthic-Macroinvertebrate Bioassessments 5A 10.48 M, 2yr2008
J05R-03-BEN Rice Creek
Aquatic Life Benthic-Macroinvertebrate Bioassessments 5A 4.59 L2014
J06R-03-BEN Horsepen Creek
Aquatic Life Benthic-Macroinvertebrate Bioassessments 5A 3.99 L2014
J07L-01-PH Amelia Lake
Aquatic Life pH 5C 98.31 L2014
J09R-04-BEN Nibbs Creek South Branch
Aquatic Life Benthic-Macroinvertebrate Bioassessments 5A 5.86 L2014
J10R-01-BEN UT to Appomattox River
Aquatic Life Benthic-Macroinvertebrate Bioassessments 5A 1.49 L2008
J10R-02-DO Goodes Creek
Aquatic Life Oxygen, Dissolved 5C 2.91 L2010
J10R-03-DO Smacks Creek
Aquatic Life Oxygen, Dissolved 5C 9.06 L2012
J11R-03-DO Bland Creek
Aquatic Life Oxygen, Dissolved 5C 6.51 L2010
J11R-04-DO Cellar Creek
Aquatic Life Oxygen, Dissolved 5C 2.70 L2012
J11R-05-DO Woody Creek
Aquatic Life Oxygen, Dissolved 5C 7.97 L2014
J12R-01-BEN Winticomack Creek
Aquatic Life Benthic-Macroinvertebrate Bioassessments 5A 4.07 L2010
J12R-06-PH Horsepen Branch
Aquatic Life pH 5C 4.44 L2006
J13R-01-DO Namozine Creek
Aquatic Life Oxygen, Dissolved 5C 12.91 L2016
J14R-02-PH Stoney Creek
Aquatic Life pH 5C 2.59 L2010
J14R-03-DO Whipponock Creek
Aquatic Life Oxygen, Dissolved 5C 6.82 L2016
Appendix 1a - 31Final 2016
2016 Impaired Waters - 303(d) List
Category 5 - Waters needing Total Maximum Daily Load Study
James River Basin
Cause Group Code CauseCategory
TMDLDev.
Priority
Estuary(Sq. Miles)
Reservoir(Acres)
River(Miles)
InitialListDateImpaired Use
Water Name
Cause
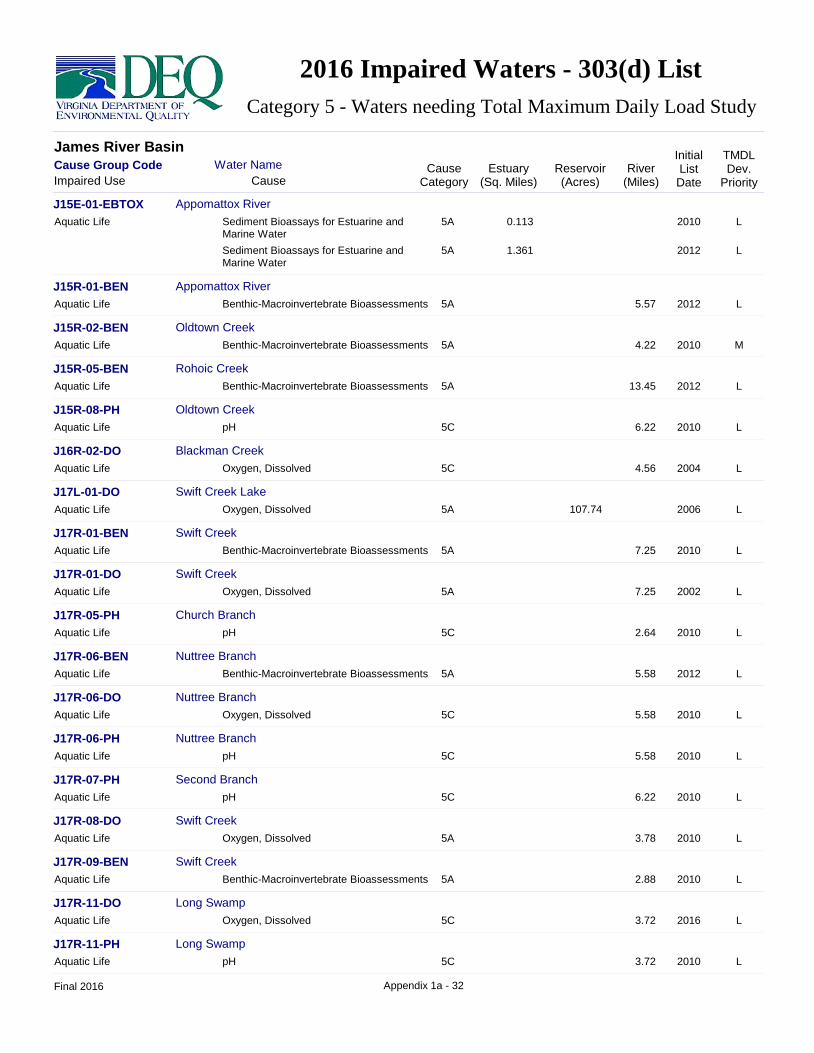
J15E-01-EBTOX Appomattox River
Aquatic Life Sediment Bioassays for Estuarine and Marine Water
5A 0.113 L2010
Sediment Bioassays for Estuarine and Marine Water
5A 1.361 L2012
J15R-01-BEN Appomattox River
Aquatic Life Benthic-Macroinvertebrate Bioassessments 5A 5.57 L2012
J15R-02-BEN Oldtown Creek
Aquatic Life Benthic-Macroinvertebrate Bioassessments 5A 4.22 M2010
J15R-05-BEN Rohoic Creek
Aquatic Life Benthic-Macroinvertebrate Bioassessments 5A 13.45 L2012
J15R-08-PH Oldtown Creek
Aquatic Life pH 5C 6.22 L2010
J16R-02-DO Blackman Creek
Aquatic Life Oxygen, Dissolved 5C 4.56 L2004
J17L-01-DO Swift Creek Lake
Aquatic Life Oxygen, Dissolved 5A 107.74 L2006
J17R-01-BEN Swift Creek
Aquatic Life Benthic-Macroinvertebrate Bioassessments 5A 7.25 L2010
J17R-01-DO Swift Creek
Aquatic Life Oxygen, Dissolved 5A 7.25 L2002
J17R-05-PH Church Branch
Aquatic Life pH 5C 2.64 L2010
J17R-06-BEN Nuttree Branch
Aquatic Life Benthic-Macroinvertebrate Bioassessments 5A 5.58 L2012
J17R-06-DO Nuttree Branch
Aquatic Life Oxygen, Dissolved 5C 5.58 L2010
J17R-06-PH Nuttree Branch
Aquatic Life pH 5C 5.58 L2010
J17R-07-PH Second Branch
Aquatic Life pH 5C 6.22 L2010
J17R-08-DO Swift Creek
Aquatic Life Oxygen, Dissolved 5A 3.78 L2010
J17R-09-BEN Swift Creek
Aquatic Life Benthic-Macroinvertebrate Bioassessments 5A 2.88 L2010
J17R-11-DO Long Swamp
Aquatic Life Oxygen, Dissolved 5C 3.72 L2016
J17R-11-PH Long Swamp
Aquatic Life pH 5C 3.72 L2010
Appendix 1a - 32Final 2016

2016 Impaired Waters - 303(d) List
Category 5 - Waters needing Total Maximum Daily Load Study
James River Basin
Cause Group Code CauseCategory
TMDLDev.
Priority
Estuary(Sq. Miles)
Reservoir(Acres)
River(Miles)
InitialListDateImpaired Use
Water Name
Cause
VA DEQ is transitioning from Fecal Coliform bacteria to Escherichia coli (fresh water) and Enterococci (salt water) for assessing the Recreation Use.
TMDL Development Priorities are: H (High) = formal EPA priority to be addressed with a plan by 2022; M (Medium) = DEQ priority that may be addressed with a plan by 2022; or L (Low) = not prioritized to be addressed with a plan by 2022. Within the H or M priority there may be "2yr" noted which means the priority is to be addressed within the two next years.
Multiple listings are due to the same impairments for different uses and/or different initial listing dates for adjacent waters.
Appendix 1a - 33Final 2016

2016 Impaired Waters - 303(d) List
Category 5 - Waters needing Total Maximum Daily Load Study
Rappahannock River Basin
Cause Group Code CauseCategory
TMDLDev.
Priority
Estuary(Sq. Miles)
Reservoir(Acres)
River(Miles)
InitialListDateImpaired Use
Water Name
Cause
E01R-01-BEN Thumb Run, East Branch
Aquatic Life Benthic-Macroinvertebrate Bioassessments 5A 6.59 L2012
E01R-02-BEN Unnamed Tributary to Thumb Run, West Branch
Aquatic Life Benthic-Macroinvertebrate Bioassessments 5A 0.80 L2014
E02R-01-BEN Great Run
Aquatic Life Benthic-Macroinvertebrate Bioassessments 5A 4.38 L2010
Benthic-Macroinvertebrate Bioassessments 5A 2.81 L2012
E03R-01-TEMP Hughes River
Aquatic Life Temperature, water 5A 3.20 L2008
E04R-01-TEMP Hazel River
Aquatic Life Temperature, water 5A 3.63 L2016
E05R-01-BEN Thornton River
Aquatic Life Benthic-Macroinvertebrate Bioassessments 5A 0.86 L2010
E08R-01-BEN Marsh Run
Aquatic Life Benthic-Macroinvertebrate Bioassessments 5A 6.01 L2012
E09R-01-BEN Mountain Run
Aquatic Life Benthic-Macroinvertebrate Bioassessments 5A 19.90 M2008
E09R-01-PCB Mountain Run
Fish Consumption PCB in Fish Tissue 5A 19.90 H, 2yr2006
E09R-02-BEN Jonas Run
Aquatic Life Benthic-Macroinvertebrate Bioassessments 5A 3.78 M2012
E09R-02-PCB Mountain Run
Fish Consumption PCB in Fish Tissue 5A 4.63 L2016
E10R-01-BEN Sumerduck Run
Aquatic Life Benthic-Macroinvertebrate Bioassessments 5A 1.85 M2012
E10R-04-BAC Sumerduck Run
Recreation Escherichia coli 5A 1.85 L2016
E11R-01-BEN Conway River
Aquatic Life Benthic-Macroinvertebrate Bioassessments 5A 2.98 L2010
E12R-01-BEN Rippin Run
Aquatic Life Benthic-Macroinvertebrate Bioassessments 5A 0.60 L2012
E13R-01-BEN Beautiful Run
Aquatic Life Benthic-Macroinvertebrate Bioassessments 5A 2.50 L2012
E14R-01-TEMP Robinson River
Aquatic Life Temperature, water 5A 3.00 L2004
E14R-02-TEMP Rose River
Aquatic Life Temperature, water 5A 2.58 L2006
Appendix 1a - 34Final 2016

2016 Impaired Waters - 303(d) List
Category 5 - Waters needing Total Maximum Daily Load Study
Rappahannock River Basin
Cause Group Code CauseCategory
TMDLDev.
Priority
Estuary(Sq. Miles)
Reservoir(Acres)
River(Miles)
InitialListDateImpaired Use
Water Name
Cause
E17R-01-BEN Brook Run
Aquatic Life Benthic-Macroinvertebrate Bioassessments 5A 2.51 L2012
E18R-01-HG Rapidan River
Fish Consumption Mercury in Fish Tissue 5A 9.79 L2010
E19L-01-HG Motts Run Reservoir
Fish Consumption Mercury in Fish Tissue 5A 137.17 L2008
E19R-01-BAC Horsepen Run
Recreation Escherichia coli 5A 5.70 L2014
E19R-02-BAC Mine Run
Recreation Escherichia coli 5A 4.01 L2014
E20E-03-PCB Rappahannock River
Fish Consumption PCB in Fish Tissue 5A 0.139 L2002
PCB in Fish Tissue 5A 3.782 L2004
PCB in Fish Tissue 5A 124.983 9.24 L2006
PCB in Fish Tissue 5A 0.042 L2008
E20R-01-BEN Falls Run
Aquatic Life Benthic-Macroinvertebrate Bioassessments 5A 7.35 L2012
E20R-02-BEN Hazel Run
Aquatic Life Benthic-Macroinvertebrate Bioassessments 5A 4.72 L2012
E20R-03-BEN Little Falls Run
Aquatic Life Benthic-Macroinvertebrate Bioassessments 5A 4.92 L2016
E20R-03-PH Massaponax Creek
Aquatic Life pH 5A 5.19 L2006
E20R-04-PH Deep Run
Aquatic Life pH 5A 1.56 L2012
E20R-05-PH Unnamed tributary to Massaponax Creek
Aquatic Life pH 5A 1.27 L2016
E21R-01-BEN Muddy Creek
Aquatic Life Benthic-Macroinvertebrate Bioassessments 5A 3.58 L2010
E21R-02-BEN Ware Creek
Aquatic Life Benthic-Macroinvertebrate Bioassessments 5A 3.06 L2008
E21R-02-PH Ware Creek
Aquatic Life pH 5C 3.06 L2004
pH 5C 4.50 L2008
E21R-03-BAC Gingoteague Creek
Recreation Escherichia coli 5A 1.49 L2008
E21R-03-BEN Gingoteague Creek
Aquatic Life Benthic-Macroinvertebrate Bioassessments 5A 1.49 L2012
Appendix 1a - 35Final 2016

2016 Impaired Waters - 303(d) List
Category 5 - Waters needing Total Maximum Daily Load Study
Rappahannock River Basin
Cause Group Code CauseCategory
TMDLDev.
Priority
Estuary(Sq. Miles)
Reservoir(Acres)
River(Miles)
InitialListDateImpaired Use
Water Name
Cause
E21R-03-PH Gingoteague Creek
Aquatic Life pH 5C 1.49 L2008
E21R-04-BEN Mill Creek
Aquatic Life Benthic-Macroinvertebrate Bioassessments 5A 3.59 L2008
E21R-05-BEN White Oak Run
Aquatic Life Benthic-Macroinvertebrate Bioassessments 5A 6.51 L2014
E21R-05-PH Mount Creek
Aquatic Life pH 5C 4.46 L2008
E21R-07-BAC Mill Creek
Recreation Escherichia coli 5A 4.58 L2008
E21R-07-PH Mill Creek
Aquatic Life pH 5C 4.58 L2008
E21R-08-PH Goldenvale Creek
Aquatic Life pH 5C 5.31 L2008
E21R-09-PH Hugh Run
Aquatic Life pH 5C 2.45 L2010
E21R-10-BAC Jetts Creek
Recreation Escherichia coli 5A 1.85 L2010
E21R-10-PH White Oak Run
Aquatic Life pH 5C 6.51 L2014
E21R-11-BAC Portobago Creek
Recreation Escherichia coli 5A 7.00 L2010
E21R-11-DO Portobago Creek
Aquatic Life Oxygen, Dissolved 5C 7.00 L2010
E22E-01-EBEN Rappahannock River
Aquatic Life Estuarine Bioassessments 5A 6.302 L2010
E22E-02-EBEN Rappahannock River
Aquatic Life Estuarine Bioassessments 5A 110.178 L2006
Estuarine Bioassessments 5A 0.014 L2008
Estuarine Bioassessments 5A 0.028 L2008
E22E-03-BAC Peedee Creek
Recreation Enterococcus 5A 0.150 L2014
E22E-05-BAC Rappahannock River
Recreation Enterococcus 5A 1.344 L2014
E22E-08-CHLR Rappahannock River
Aquatic Life Chloride 5C 5.133 L2004
Wildlife Chloride 5C 5.133 L2004
Appendix 1a - 36Final 2016

2016 Impaired Waters - 303(d) List
Category 5 - Waters needing Total Maximum Daily Load Study
Rappahannock River Basin
Cause Group Code CauseCategory
TMDLDev.
Priority
Estuary(Sq. Miles)
Reservoir(Acres)
River(Miles)
InitialListDateImpaired Use
Water Name
Cause
E22R-02-DO Farmers Hall Creek
Aquatic Life Oxygen, Dissolved 5C 4.00 L2012
E22R-02-PH Farmers Hall Creek
Aquatic Life pH 5C 4.00 L2006
E22R-03-MIREX Occupacia Creek and Tributaries
Aquatic Life Mirex 5A 74.69 L2010
Wildlife Mirex 5A 74.69 L2010
E22R-04-BAC Elmwood Creek and Tributary XHY
Recreation Escherichia coli 5A 9.07 M, 2yr2014
E22R-04-DO Elmwood Creek and Tributary XHY
Aquatic Life Oxygen, Dissolved 5C 9.07 L2014
E22R-04-PH Elmwood Creek and Tributary XHY
Aquatic Life pH 5C 9.07 L2006
E22R-05-BAC Baylors Creek
Recreation Escherichia coli 5A 5.89 M, 2yr2008
E22R-05-PH Baylors Creek
Aquatic Life pH 5C 5.89 L2008
E22R-06-BAC Peedee Creek
Recreation Escherichia coli 5A 3.29 L2008
E22R-06-DO Peedee Creek
Aquatic Life Oxygen, Dissolved 5C 3.29 L2010
E22R-06-PH Peedee Creek
Aquatic Life pH 5C 3.29 L2008
E22R-08-BAC Stillwater Creek
Recreation Escherichia coli 5A 3.52 M, 2yr2014
E22R-08-DO Stillwater Creek
Aquatic Life Oxygen, Dissolved 5C 3.52 L2014
E22R-08-PH Stillwater Creek
Aquatic Life pH 5C 3.52 L2014
E22R-09-BAC XHW - UT to Peedee Creek, UT (XHV)
Recreation Escherichia coli 5A 0.47 L2014
E22R-10-PH Mill Swamp
Aquatic Life pH 5C 0.72 L2014
E22R-11-DO Smoots Mill Run, UT
Aquatic Life Oxygen, Dissolved 5C 1.67 L2014
E22R-11-PH Smoots Mill Run, UT
Aquatic Life pH 5C 1.67 L2014
Appendix 1a - 37Final 2016

2016 Impaired Waters - 303(d) List
Category 5 - Waters needing Total Maximum Daily Load Study
Rappahannock River Basin
Cause Group Code CauseCategory
TMDLDev.
Priority
Estuary(Sq. Miles)
Reservoir(Acres)
River(Miles)
InitialListDateImpaired Use
Water Name
Cause
E23L-01-HG Chandlers Millpond
Fish Consumption Mercury in Fish Tissue 5A 47.99 L2008
E23R-04-DO Hoskins Creek
Aquatic Life Oxygen, Dissolved 5C 13.16 L2014
E23R-07-BEN Ruin Branch
Aquatic Life Benthic-Macroinvertebrate Bioassessments 5A 2.53 L2014
E23R-12-DO Mussell Swamp
Aquatic Life Oxygen, Dissolved 5C 5.13 L2006
E23R-16-BEN Church Swamp
Aquatic Life Benthic-Macroinvertebrate Bioassessments 5A 3.24 L2008
E23R-20-DO Scates Millstream
Aquatic Life Oxygen, Dissolved 5C 2.89 L2014
E23R-20-PH Scates Millstream
Aquatic Life pH 5C 2.89 L2014
E24E-02-EBTOX Totuskey Creek
Aquatic Life Sediment Bioassays for Estuarine and Marine Water
5A 1.068 L2006
E24E-05-PH Little Totuskey Creek
Aquatic Life pH 5C 0.055 L2012
E24R-01-DO Bookers Mill Stream
Aquatic Life Oxygen, Dissolved 5C 6.53 L2012
E24R-03-PH Muddy Gut
Aquatic Life pH 5C 2.63 L2008
E24R-05-PH Branham Mill Swamp
Aquatic Life pH 5C 3.66 L2012
E24R-06-DO Richardson Creek and Tributaries
Aquatic Life Oxygen, Dissolved 5C 17.21 L2012
E24R-06-PH Richardson Creek and Tributaries
Aquatic Life pH 5C 17.21 L2012
E24R-08-PH XHL - Bookers Mill Stream, UT
Aquatic Life pH 5C 2.01 L2012
E24R-09-DO Marshy Swamp
Aquatic Life Oxygen, Dissolved 5C 9.53 L2012
E25R-02-DO Lagrange Creek
Aquatic Life Oxygen, Dissolved 5C 2.49 L2010
E25R-04-DO South Branch Lagrange Creek
Aquatic Life Oxygen, Dissolved 5A 0.40 L2012
Appendix 1a - 38Final 2016
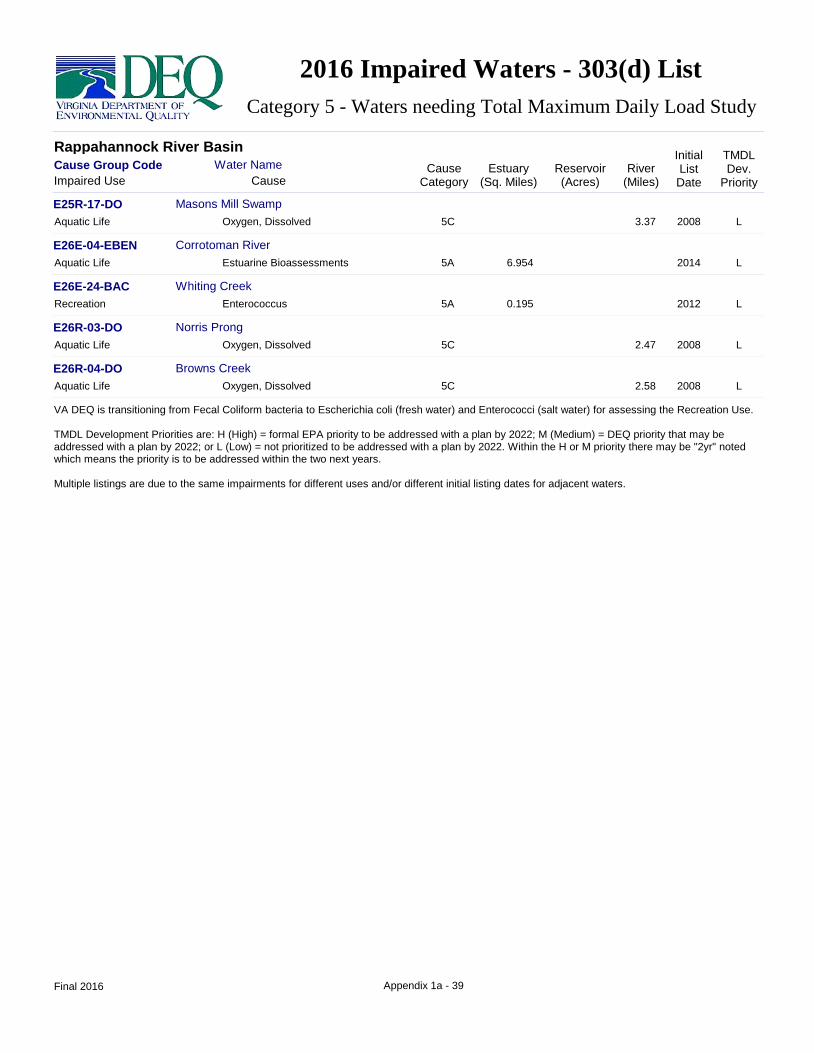
2016 Impaired Waters - 303(d) List
Category 5 - Waters needing Total Maximum Daily Load Study
Rappahannock River Basin
Cause Group Code CauseCategory
TMDLDev.
Priority
Estuary(Sq. Miles)
Reservoir(Acres)
River(Miles)
InitialListDateImpaired Use
Water Name
Cause
E25R-17-DO Masons Mill Swamp
Aquatic Life Oxygen, Dissolved 5C 3.37 L2008
E26E-04-EBEN Corrotoman River
Aquatic Life Estuarine Bioassessments 5A 6.954 L2014
E26E-24-BAC Whiting Creek
Recreation Enterococcus 5A 0.195 L2012
E26R-03-DO Norris Prong
Aquatic Life Oxygen, Dissolved 5C 2.47 L2008
E26R-04-DO Browns Creek
Aquatic Life Oxygen, Dissolved 5C 2.58 L2008
VA DEQ is transitioning from Fecal Coliform bacteria to Escherichia coli (fresh water) and Enterococci (salt water) for assessing the Recreation Use.
TMDL Development Priorities are: H (High) = formal EPA priority to be addressed with a plan by 2022; M (Medium) = DEQ priority that may be addressed with a plan by 2022; or L (Low) = not prioritized to be addressed with a plan by 2022. Within the H or M priority there may be "2yr" noted which means the priority is to be addressed within the two next years.
Multiple listings are due to the same impairments for different uses and/or different initial listing dates for adjacent waters.
Appendix 1a - 39Final 2016

2016 Impaired Waters - 303(d) List
Category 5 - Waters needing Total Maximum Daily Load Study
Roanoke and Yadkin River Basins
Cause Group Code CauseCategory
TMDLDev.
Priority
Estuary(Sq. Miles)
Reservoir(Acres)
River(Miles)
InitialListDateImpaired Use
Water Name
Cause
L01R-01-TEMP Roanoke River, South Fork
Aquatic Life Temperature, water 5C 6.27 L2004
Temperature, water 5C 6.43 L2010
Temperature, water 5C 4.61 L2012
L01R-02-TEMP Bottom Creek
Aquatic Life Temperature, water 5C 4.49 L2008
L02R-01-PH Bradshaw Creek
Aquatic Life pH 5C 10.36 L2010
L03R-01-TEMP Roanoke River
Aquatic Life Temperature, water 5C 13.09 L2002
L04R-01-HG Roanoke River
Fish Consumption Mercury in Fish Tissue 5A 10.28 L2010
L04R-03-BEN Roanoke River
Aquatic Life Benthic-Macroinvertebrate Bioassessments 5A 3.16 H, 2yr2008
L05R-01-BEN Tinker Creek
Aquatic Life Benthic-Macroinvertebrate Bioassessments 5A 5.37 H, 2yr2010
L05R-01-TEMP Tinker Creek
Aquatic Life Temperature, water 5C 11.87 L2002
L05R-02-BEN Deer Branch
Aquatic Life Benthic-Macroinvertebrate Bioassessments 5A 1.38 H, 2yr2014
L06R-01-BEN Back Creek
Aquatic Life Benthic-Macroinvertebrate Bioassessments 5A 6.92 H, 2yr2014
L07L-01-PH Beaverdam Reservoir
Aquatic Life pH 5C 66.93 L2012
L07R-01-BEN Beaverdam Creek
Aquatic Life Benthic-Macroinvertebrate Bioassessments 5A 10.33 M2010
L07R-02-BEN Merriman Run, UT (XUO)
Aquatic Life Benthic-Macroinvertebrate Bioassessments 5A 0.88 M2010
L08R-01-TEMP Green Creek
Aquatic Life Temperature, water 5C 4.09 L2012
L08R-02-TEMP Blackwater River, South Fork
Aquatic Life Temperature, water 5C 6.20 L2016
L08R-05-BEN Little Creek
Aquatic Life Benthic-Macroinvertebrate Bioassessments 5A 7.85 M2002
L08R-06-BEN Teels Creek
Aquatic Life Benthic-Macroinvertebrate Bioassessments 5A 4.76 M2002
L08R-07-BEN Buck Run
Aquatic Life Benthic-Macroinvertebrate Bioassessments 5A 3.77 M2008
Appendix 1a - 40Final 2016

2016 Impaired Waters - 303(d) List
Category 5 - Waters needing Total Maximum Daily Load Study
Roanoke and Yadkin River Basins
Cause Group Code CauseCategory
TMDLDev.
Priority
Estuary(Sq. Miles)
Reservoir(Acres)
River(Miles)
InitialListDateImpaired Use
Water Name
Cause
L09R-01-BEN Maggodee Creek
Aquatic Life Benthic-Macroinvertebrate Bioassessments 5A 7.47 M2002
L09R-01-TEMP Maggodee Creek
Aquatic Life Temperature, water 5C 4.43 L2008
L09R-02-BEN Maggodee Creek
Aquatic Life Benthic-Macroinvertebrate Bioassessments 5A 5.42 L2016
L10L-01-HG Blackwater River
Fish Consumption Mercury in Fish Tissue 5A 524.78 8.21 L2010
L10L-05-BAC Smith Mountain Lake - Crazy Horse Camp Ground
Recreation Escherichia coli 5A 30.27 L2004
L10R-01-BEN Blackwater River
Aquatic Life Benthic-Macroinvertebrate Bioassessments 5A 8.21 M2008
L11R-01-BEN North Fork Gills Creek, UT (XML)
Aquatic Life Benthic-Macroinvertebrate Bioassessments 5A 1.43 M2008
L12L-01-HG Smith Mountain Lake
Fish Consumption Mercury in Fish Tissue 5A 6,480.10 L2010
L12R-01-BAC Craddock Creek (XME)
Recreation Escherichia coli 5A 1.23 M2012
L14R-01-BEN Pigg River
Aquatic Life Benthic-Macroinvertebrate Bioassessments 5A 4.43 M2012
L14R-02-BEN Storey Creek
Aquatic Life Benthic-Macroinvertebrate Bioassessments 5A 9.82 L2016
L17R-01-BEN Poplar Branch
Aquatic Life Benthic-Macroinvertebrate Bioassessments 5A 2.56 M2008
L18R-01-BEN Fryingpan Creek
Aquatic Life Benthic-Macroinvertebrate Bioassessments 5A 2.56 M2006
L19R-01-HG Roanoke (Staunton) River, Cub Creek, Kerr Reservoir
Fish Consumption Mercury in Fish Tissue 5A 31,884.59 102.09 L2008
L19R-02-BEN Lynch Creek
Aquatic Life Benthic-Macroinvertebrate Bioassessments 5A 3.90 M2010
L19R-03-BEN Reed Creek
Aquatic Life Benthic-Macroinvertebrate Bioassessments 5A 8.90 M2010
L19R-04-BEN Roanoke (Staunton) River, Unnamed tributary
Aquatic Life Benthic-Macroinvertebrate Bioassessments 5A 4.10 M2010
L21R-01-BEN Wolf Creek
Aquatic Life Benthic-Macroinvertebrate Bioassessments 5A 7.13 M2012
L21R-02-BEN Bore Auger Creek
Aquatic Life Benthic-Macroinvertebrate Bioassessments 5A 9.56 M2014
Appendix 1a - 41Final 2016
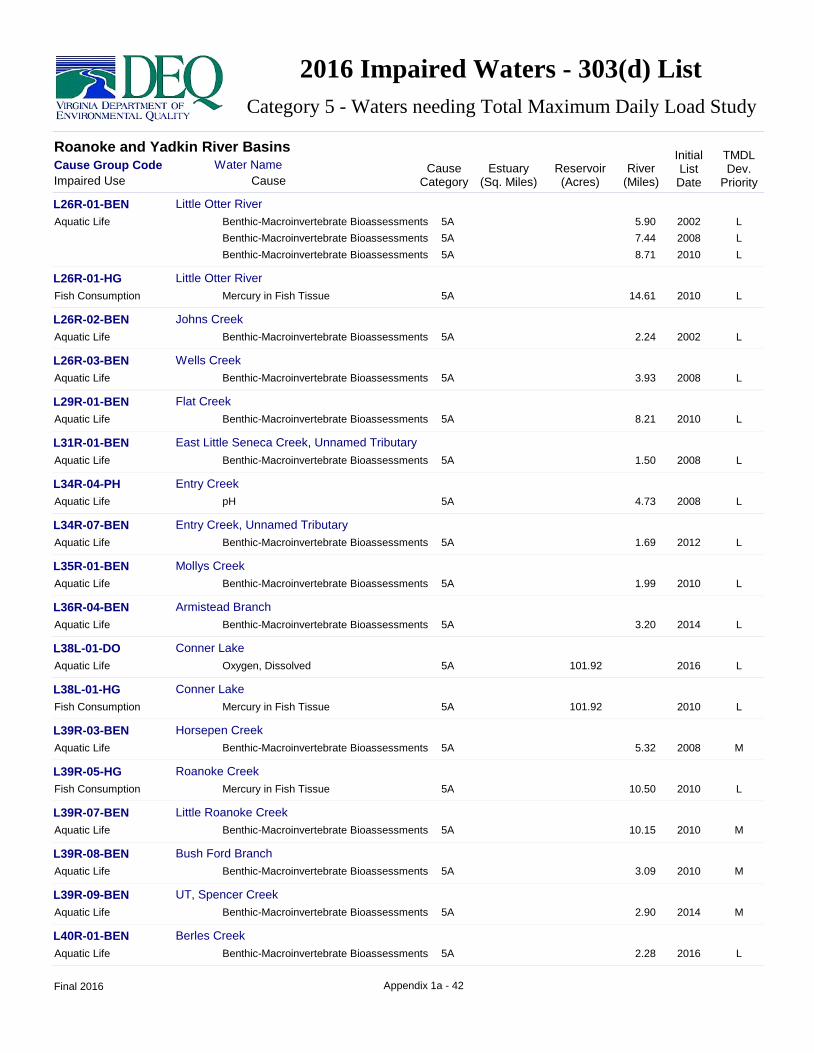
2016 Impaired Waters - 303(d) List
Category 5 - Waters needing Total Maximum Daily Load Study
Roanoke and Yadkin River Basins
Cause Group Code CauseCategory
TMDLDev.
Priority
Estuary(Sq. Miles)
Reservoir(Acres)
River(Miles)
InitialListDateImpaired Use
Water Name
Cause
L26R-01-BEN Little Otter River
Aquatic Life Benthic-Macroinvertebrate Bioassessments 5A 5.90 L2002
Benthic-Macroinvertebrate Bioassessments 5A 7.44 L2008
Benthic-Macroinvertebrate Bioassessments 5A 8.71 L2010
L26R-01-HG Little Otter River
Fish Consumption Mercury in Fish Tissue 5A 14.61 L2010
L26R-02-BEN Johns Creek
Aquatic Life Benthic-Macroinvertebrate Bioassessments 5A 2.24 L2002
L26R-03-BEN Wells Creek
Aquatic Life Benthic-Macroinvertebrate Bioassessments 5A 3.93 L2008
L29R-01-BEN Flat Creek
Aquatic Life Benthic-Macroinvertebrate Bioassessments 5A 8.21 L2010
L31R-01-BEN East Little Seneca Creek, Unnamed Tributary
Aquatic Life Benthic-Macroinvertebrate Bioassessments 5A 1.50 L2008
L34R-04-PH Entry Creek
Aquatic Life pH 5A 4.73 L2008
L34R-07-BEN Entry Creek, Unnamed Tributary
Aquatic Life Benthic-Macroinvertebrate Bioassessments 5A 1.69 L2012
L35R-01-BEN Mollys Creek
Aquatic Life Benthic-Macroinvertebrate Bioassessments 5A 1.99 L2010
L36R-04-BEN Armistead Branch
Aquatic Life Benthic-Macroinvertebrate Bioassessments 5A 3.20 L2014
L38L-01-DO Conner Lake
Aquatic Life Oxygen, Dissolved 5A 101.92 L2016
L38L-01-HG Conner Lake
Fish Consumption Mercury in Fish Tissue 5A 101.92 L2010
L39R-03-BEN Horsepen Creek
Aquatic Life Benthic-Macroinvertebrate Bioassessments 5A 5.32 M2008
L39R-05-HG Roanoke Creek
Fish Consumption Mercury in Fish Tissue 5A 10.50 L2010
L39R-07-BEN Little Roanoke Creek
Aquatic Life Benthic-Macroinvertebrate Bioassessments 5A 10.15 M2010
L39R-08-BEN Bush Ford Branch
Aquatic Life Benthic-Macroinvertebrate Bioassessments 5A 3.09 M2010
L39R-09-BEN UT, Spencer Creek
Aquatic Life Benthic-Macroinvertebrate Bioassessments 5A 2.90 M2014
L40R-01-BEN Berles Creek
Aquatic Life Benthic-Macroinvertebrate Bioassessments 5A 2.28 L2016
Appendix 1a - 42Final 2016

2016 Impaired Waters - 303(d) List
Category 5 - Waters needing Total Maximum Daily Load Study
Roanoke and Yadkin River Basins
Cause Group Code CauseCategory
TMDLDev.
Priority
Estuary(Sq. Miles)
Reservoir(Acres)
River(Miles)
InitialListDateImpaired Use
Water Name
Cause
L40R-06-BEN Buffalo Creek
Aquatic Life Benthic-Macroinvertebrate Bioassessments 5A 2.35 L2014
L42L-01-HG Talbott Reservoir
Fish Consumption Mercury in Fish Tissue 5A 140.51 L2010
L42R-01-TEMP Dan River
Aquatic Life Temperature, water 5C 9.66 L2002
Temperature, water 5C 5.81 L2008
L43R-01-TEMP South Mayo River
Aquatic Life Temperature, water 5C 4.73 L2010
L45R-01-HG South Mayo River
Fish Consumption Mercury in Fish Tissue 5A 10.97 L2010
L47R-01-BEN Horse Pasture Creek
Aquatic Life Benthic-Macroinvertebrate Bioassessments 5A 7.44 L2010
L50R-01-TEMP Smith River
Aquatic Life Temperature, water 5C 9.48 L2002
L51L-01-HG Philpott Reservoir
Fish Consumption Mercury in Fish Tissue 5A 2,813.52 L2010
L51R-01-HG Goblintown Creek
Fish Consumption Mercury in Fish Tissue 5A 6.80 L2010
L51R-01-TEMP Rennet Bag Creek
Aquatic Life Temperature, water 5C 11.54 L2002
L51R-02-TEMP Shooting Creek
Aquatic Life Temperature, water 5C 7.32 L2008
L51R-03-TEMP Smith River
Aquatic Life Temperature, water 5C 6.43 L2016
Temperature, water 5C 2.55 L2016
L53R-01-TEMP Smith River
Aquatic Life Temperature, water 5A 6.50 L2016
L53R-03-BEN Beaver Creek
Aquatic Life Benthic-Macroinvertebrate Bioassessments 5A 6.97 L2008
L53R-04-BEN Jones Creek, UT (XMP)
Aquatic Life Benthic-Macroinvertebrate Bioassessments 5A 2.00 L2006
L53R-05-BEN Beaver Creek
Aquatic Life Benthic-Macroinvertebrate Bioassessments 5A 5.30 L2016
L53R-06-BEN Daniels Creek
Aquatic Life Benthic-Macroinvertebrate Bioassessments 5A 3.99 L2016
L53R-07-BEN Jones Creek
Aquatic Life Benthic-Macroinvertebrate Bioassessments 5A 2.36 L2016
Appendix 1a - 43Final 2016
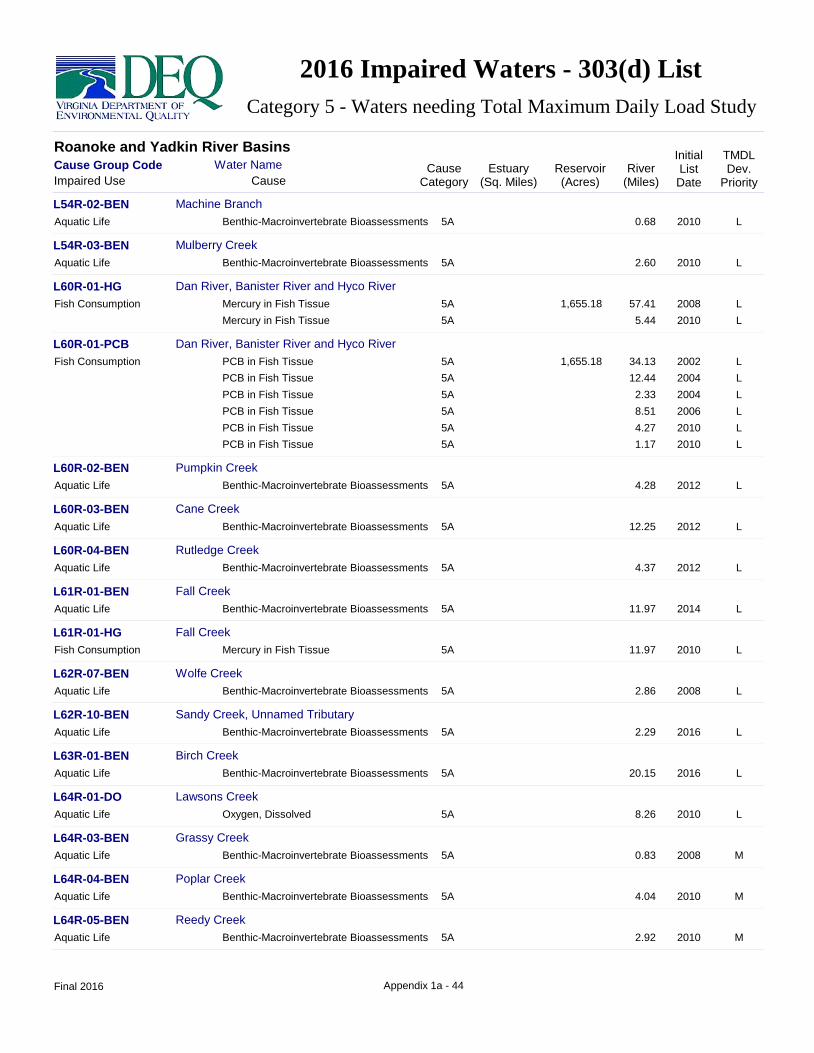
2016 Impaired Waters - 303(d) List
Category 5 - Waters needing Total Maximum Daily Load Study
Roanoke and Yadkin River Basins
Cause Group Code CauseCategory
TMDLDev.
Priority
Estuary(Sq. Miles)
Reservoir(Acres)
River(Miles)
InitialListDateImpaired Use
Water Name
Cause
L54R-02-BEN Machine Branch
Aquatic Life Benthic-Macroinvertebrate Bioassessments 5A 0.68 L2010
L54R-03-BEN Mulberry Creek
Aquatic Life Benthic-Macroinvertebrate Bioassessments 5A 2.60 L2010
L60R-01-HG Dan River, Banister River and Hyco River
Fish Consumption Mercury in Fish Tissue 5A 1,655.18 57.41 L2008
Mercury in Fish Tissue 5A 5.44 L2010
L60R-01-PCB Dan River, Banister River and Hyco River
Fish Consumption PCB in Fish Tissue 5A 1,655.18 34.13 L2002
PCB in Fish Tissue 5A 12.44 L2004
PCB in Fish Tissue 5A 2.33 L2004
PCB in Fish Tissue 5A 8.51 L2006
PCB in Fish Tissue 5A 4.27 L2010
PCB in Fish Tissue 5A 1.17 L2010
L60R-02-BEN Pumpkin Creek
Aquatic Life Benthic-Macroinvertebrate Bioassessments 5A 4.28 L2012
L60R-03-BEN Cane Creek
Aquatic Life Benthic-Macroinvertebrate Bioassessments 5A 12.25 L2012
L60R-04-BEN Rutledge Creek
Aquatic Life Benthic-Macroinvertebrate Bioassessments 5A 4.37 L2012
L61R-01-BEN Fall Creek
Aquatic Life Benthic-Macroinvertebrate Bioassessments 5A 11.97 L2014
L61R-01-HG Fall Creek
Fish Consumption Mercury in Fish Tissue 5A 11.97 L2010
L62R-07-BEN Wolfe Creek
Aquatic Life Benthic-Macroinvertebrate Bioassessments 5A 2.86 L2008
L62R-10-BEN Sandy Creek, Unnamed Tributary
Aquatic Life Benthic-Macroinvertebrate Bioassessments 5A 2.29 L2016
L63R-01-BEN Birch Creek
Aquatic Life Benthic-Macroinvertebrate Bioassessments 5A 20.15 L2016
L64R-01-DO Lawsons Creek
Aquatic Life Oxygen, Dissolved 5A 8.26 L2010
L64R-03-BEN Grassy Creek
Aquatic Life Benthic-Macroinvertebrate Bioassessments 5A 0.83 M2008
L64R-04-BEN Poplar Creek
Aquatic Life Benthic-Macroinvertebrate Bioassessments 5A 4.04 M2010
L64R-05-BEN Reedy Creek
Aquatic Life Benthic-Macroinvertebrate Bioassessments 5A 2.92 M2010
Appendix 1a - 44Final 2016
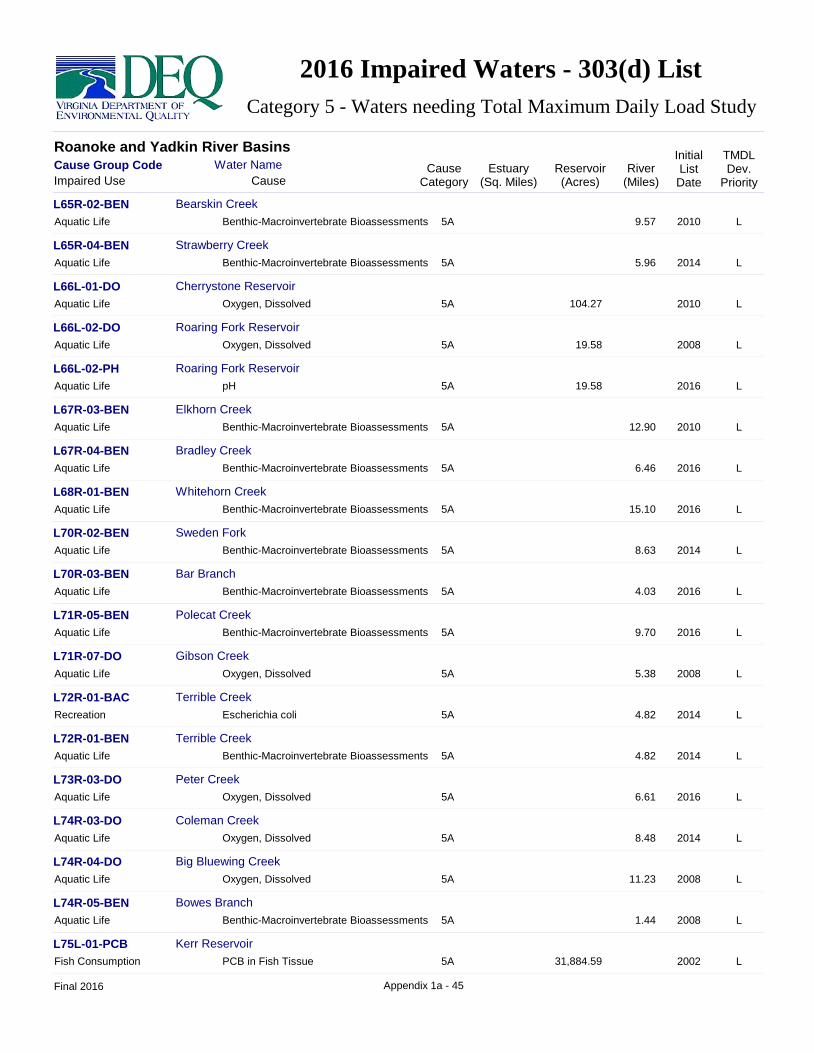
2016 Impaired Waters - 303(d) List
Category 5 - Waters needing Total Maximum Daily Load Study
Roanoke and Yadkin River Basins
Cause Group Code CauseCategory
TMDLDev.
Priority
Estuary(Sq. Miles)
Reservoir(Acres)
River(Miles)
InitialListDateImpaired Use
Water Name
Cause
L65R-02-BEN Bearskin Creek
Aquatic Life Benthic-Macroinvertebrate Bioassessments 5A 9.57 L2010
L65R-04-BEN Strawberry Creek
Aquatic Life Benthic-Macroinvertebrate Bioassessments 5A 5.96 L2014
L66L-01-DO Cherrystone Reservoir
Aquatic Life Oxygen, Dissolved 5A 104.27 L2010
L66L-02-DO Roaring Fork Reservoir
Aquatic Life Oxygen, Dissolved 5A 19.58 L2008
L66L-02-PH Roaring Fork Reservoir
Aquatic Life pH 5A 19.58 L2016
L67R-03-BEN Elkhorn Creek
Aquatic Life Benthic-Macroinvertebrate Bioassessments 5A 12.90 L2010
L67R-04-BEN Bradley Creek
Aquatic Life Benthic-Macroinvertebrate Bioassessments 5A 6.46 L2016
L68R-01-BEN Whitehorn Creek
Aquatic Life Benthic-Macroinvertebrate Bioassessments 5A 15.10 L2016
L70R-02-BEN Sweden Fork
Aquatic Life Benthic-Macroinvertebrate Bioassessments 5A 8.63 L2014
L70R-03-BEN Bar Branch
Aquatic Life Benthic-Macroinvertebrate Bioassessments 5A 4.03 L2016
L71R-05-BEN Polecat Creek
Aquatic Life Benthic-Macroinvertebrate Bioassessments 5A 9.70 L2016
L71R-07-DO Gibson Creek
Aquatic Life Oxygen, Dissolved 5A 5.38 L2008
L72R-01-BAC Terrible Creek
Recreation Escherichia coli 5A 4.82 L2014
L72R-01-BEN Terrible Creek
Aquatic Life Benthic-Macroinvertebrate Bioassessments 5A 4.82 L2014
L73R-03-DO Peter Creek
Aquatic Life Oxygen, Dissolved 5A 6.61 L2016
L74R-03-DO Coleman Creek
Aquatic Life Oxygen, Dissolved 5A 8.48 L2014
L74R-04-DO Big Bluewing Creek
Aquatic Life Oxygen, Dissolved 5A 11.23 L2008
L74R-05-BEN Bowes Branch
Aquatic Life Benthic-Macroinvertebrate Bioassessments 5A 1.44 L2008
L75L-01-PCB Kerr Reservoir
Fish Consumption PCB in Fish Tissue 5A 31,884.59 L2002
Appendix 1a - 45Final 2016

2016 Impaired Waters - 303(d) List
Category 5 - Waters needing Total Maximum Daily Load Study
Roanoke and Yadkin River Basins
Cause Group Code CauseCategory
TMDLDev.
Priority
Estuary(Sq. Miles)
Reservoir(Acres)
River(Miles)
InitialListDateImpaired Use
Water Name
Cause
L75R-03-BEN Beech Creek
Aquatic Life Benthic-Macroinvertebrate Bioassessments 5A 4.69 L2016
L76R-01-BAC Little Buffalo Creek
Recreation Escherichia coli 5A 2.51 L2004
L76R-01-BEN Little Buffalo Creek
Aquatic Life Benthic-Macroinvertebrate Bioassessments 5A 2.51 L2012
L77R-01-BAC Little Bluestone Creek
Recreation Escherichia coli 5A 9.38 H2006
L77R-02-BAC Bluestone Creek
Recreation Escherichia coli 5A 8.25 H2006
L77R-02-BEN Bluestone Creek
Aquatic Life Benthic-Macroinvertebrate Bioassessments 5A 13.73 L2014
L78R-02-BAC Unnamed Tributary to Allen Creek
Recreation Fecal Coliform 5A 1.27 H2004
L78R-03-BAC Allen Creek
Recreation Escherichia coli 5A 8.97 H2006
Escherichia coli 5A 15.27 H2012
L78R-03-BEN Allen Creek
Aquatic Life Benthic-Macroinvertebrate Bioassessments 5A 15.27 L2016
L78R-04-BEN Cox Creek
Aquatic Life Benthic-Macroinvertebrate Bioassessments 5A 10.80 M2008
L78R-04-DO Cox Creek
Aquatic Life Oxygen, Dissolved 5A 10.80 M2004
L78R-04-PH Cox Creek
Aquatic Life pH 5A 10.80 M2006
L78R-05-BAC Cotton Creek
Recreation Escherichia coli 5A 4.39 H2008
L78R-06-BAC Layton Creek
Recreation Escherichia coli 5A 8.64 H2012
L78R-06-BEN Layton Creek
Aquatic Life Benthic-Macroinvertebrate Bioassessments 5A 8.64 M2012
L78R-07-BAC Kettles Creek
Recreation Escherichia coli 5A 5.48 H2012
L78R-07-DO Kettles Creek
Aquatic Life Oxygen, Dissolved 5A 5.48 M2012
L79L-02-CHLA Lake Gordon
Aquatic Life Chlorophyll-a 5A 107.48 L2016
Appendix 1a - 46Final 2016

2016 Impaired Waters - 303(d) List
Category 5 - Waters needing Total Maximum Daily Load Study
Roanoke and Yadkin River Basins
Cause Group Code CauseCategory
TMDLDev.
Priority
Estuary(Sq. Miles)
Reservoir(Acres)
River(Miles)
InitialListDateImpaired Use
Water Name
Cause
L79L-02-HG Lake Gordon
Fish Consumption Mercury in Fish Tissue 5A 107.48 L2010
L79R-01-DO Flat Creek
Aquatic Life Oxygen, Dissolved 5A 1.69 L2006
L79R-02-BAC Smith Creek
Recreation Escherichia coli 5A 1.90 H2008
L79R-03-BAC Miles Creek
Recreation Escherichia coli 5A 5.97 L2016
L80L-01-PCB Lake Gaston
Fish Consumption PCB in Fish Tissue 5A 4,440.93 5.69 L2004
L81R-02-BAC Lizard Creek
Recreation Escherichia coli 5A 2.73 H2010
L81R-03-BAC Little Poplar Creek
Recreation Escherichia coli 5A 6.51 L2016
L82R-01-BAC Pea Hill Creek
Recreation Escherichia coli 5A 4.86 L2016
M02L-01-DDD Lovills Creek Lake
Fish Consumption DDD 5A 42.46 L2010
M02L-01-DDE Lovills Creek Lake
Fish Consumption DDE 5A 42.46 L2010
M02L-01-DDT Lovills Creek Lake
Fish Consumption DDT in Fish Tissue 5A 42.46 L2010
M02L-01-HG Lovills Creek Lake
Fish Consumption Mercury in Fish Tissue 5A 42.46 L2010
M02R-01-BAC Lovills Creek
Recreation Escherichia coli 5A 2.15 M2008
M02R-01-DDE Lovills Creek
Fish Consumption DDE 5A 2.15 L2010
M02R-01-DDT Lovills Creek
Fish Consumption DDT in Fish Tissue 5A 2.15 L2010
M02R-01-TEMP Lovills Creek and Stewarts Creek
Aquatic Life Temperature, water 5A 2.15 M2008
Temperature, water 5A 2.05 M2016
M03R-01-BAC Ararat River
Recreation Escherichia coli 5A 6.13 H2010
M03R-01-HG Ararat River
Fish Consumption Mercury in Fish Tissue 5A 6.13 L2010
Appendix 1a - 47Final 2016

2016 Impaired Waters - 303(d) List
Category 5 - Waters needing Total Maximum Daily Load Study
Roanoke and Yadkin River Basins
Cause Group Code CauseCategory
TMDLDev.
Priority
Estuary(Sq. Miles)
Reservoir(Acres)
River(Miles)
InitialListDateImpaired Use
Water Name
Cause
M03R-01-TEMP Johnson Creek
Aquatic Life Temperature, water 5C 9.15 L2008
M03R-02-BAC Johnson Creek
Recreation Escherichia coli 5A 9.15 H2014
VA DEQ is transitioning from Fecal Coliform bacteria to Escherichia coli (fresh water) and Enterococci (salt water) for assessing the Recreation Use.
TMDL Development Priorities are: H (High) = formal EPA priority to be addressed with a plan by 2022; M (Medium) = DEQ priority that may be addressed with a plan by 2022; or L (Low) = not prioritized to be addressed with a plan by 2022. Within the H or M priority there may be "2yr" noted which means the priority is to be addressed within the two next years.
Multiple listings are due to the same impairments for different uses and/or different initial listing dates for adjacent waters.
Appendix 1a - 48Final 2016

2016 Impaired Waters - 303(d) List
Category 5 - Waters needing Total Maximum Daily Load Study
Chowan River and Dismal Swamp Basins
Cause Group Code CauseCategory
TMDLDev.
Priority
Estuary(Sq. Miles)
Reservoir(Acres)
River(Miles)
InitialListDateImpaired Use
Water Name
Cause
K01R-01-BEN Middle Meherrin River
Aquatic Life Benthic-Macroinvertebrate Bioassessments 5A 11.25 M2014
K01R-03-BEN Finneywood Creek
Aquatic Life Benthic-Macroinvertebrate Bioassessments 5A 5.11 M2008
K02R-01-BEN North Meherrin River
Aquatic Life Benthic-Macroinvertebrate Bioassessments 5A 7.54 L2010
Benthic-Macroinvertebrate Bioassessments 5A 2.63 L2014
K02R-03-BEN Kits Creek
Aquatic Life Benthic-Macroinvertebrate Bioassessments 5A 4.82 H2008
K02R-04-BEN Couches Creek
Aquatic Life Benthic-Macroinvertebrate Bioassessments 5A 7.37 L2010
K02R-04-PH Couches Creek
Aquatic Life pH 5A 7.37 L2014
K02R-05-DO Ledbetter Creek
Aquatic Life Oxygen, Dissolved 5A 9.08 L2010
K03R-01-BEN Flat Rock Creek
Aquatic Life Benthic-Macroinvertebrate Bioassessments 5A 15.99 L2014
K03R-06-BEN Mason Creek
Aquatic Life Benthic-Macroinvertebrate Bioassessments 5A 8.05 L2014
K05R-05-DO Hays Creek
Aquatic Life Oxygen, Dissolved 5C 6.39 L2010
K05R-06-BEN Little Genito Creek
Aquatic Life Benthic-Macroinvertebrate Bioassessments 5A 12.05 L2010
K07R-03-BEN Rocky Run
Aquatic Life Benthic-Macroinvertebrate Bioassessments 5A 21.27 L2008
K08L-01-HG Emporia Lake (Meherrin Reservoir)
Fish Consumption Mercury in Fish Tissue 5A 263.68 L2014
K08L-02-CHLA Brunswick Lake
Aquatic Life Chlorophyll-a 5A 160.33 L2016
K08L-02-DO Brunswick Lake
Aquatic Life Oxygen, Dissolved 5A 160.33 L2006
K08R-03-BAC Wilson Creek
Recreation Escherichia coli 5A 2.74 M, 2yr2012
K08R-03-BEN Wilson Creek
Aquatic Life Benthic-Macroinvertebrate Bioassessments 5A 2.74 L2010
K08R-04-BAC UT to Dukes Branch
Recreation Escherichia coli 5A 1.71 L2016
Appendix 1a - 49Final 2016

2016 Impaired Waters - 303(d) List
Category 5 - Waters needing Total Maximum Daily Load Study
Chowan River and Dismal Swamp Basins
Cause Group Code CauseCategory
TMDLDev.
Priority
Estuary(Sq. Miles)
Reservoir(Acres)
River(Miles)
InitialListDateImpaired Use
Water Name
Cause
K08R-05-BAC Dukes Branch
Recreation Escherichia coli 5A 2.41 L2016
K09R-01-BAC Meherrin River
Recreation Escherichia coli 5A 26.75 L2016
K09R-01-HG Meherrin River, Fontaine Creek, Mill Swamp
Fish Consumption Mercury in Fish Tissue 5A 67.74 L2010
K09R-01-PCB Meherrin River
Fish Consumption PCB in Fish Tissue 5A 26.75 L2004
K10R-01-DO Rattlesnake Creek
Aquatic Life Oxygen, Dissolved 5C 17.18 L2010
K10R-02-DO Fontaine Creek (Fountains Creek)(Partial delist16 .56 miles)
Aquatic Life Oxygen, Dissolved 5C 16.64 L2010
K10R-03-DO Quarrel Creek
Aquatic Life Oxygen, Dissolved 5C 3.34 L2010
K10R-03-PH Quarrel Creek
Aquatic Life pH 5C 3.34 L2016
K10R-04-DO Beddingfield Creek
Aquatic Life Oxygen, Dissolved 5C 4.18 L2010
K10R-06-PH Rocky Run
Aquatic Life pH 5C 0.86 L2010
K11R-04-DO Fontaine Creek
Aquatic Life Oxygen, Dissolved 5C 7.30 L2012
K11R-05-DO Beaverpond Creek
Aquatic Life Oxygen, Dissolved 5C 3.35 L2010
K11R-06-PH XGV - Fontaine Creek, UT
Aquatic Life pH 5C 1.95 L2010
K11R-08-DO XGU - Fontaine Creek, UT
Aquatic Life Oxygen, Dissolved 5C 1.82 L2010
K11R-08-PH XGU - Fontaine Creek, UT
Aquatic Life pH 5C 1.82 L2010
K13R-04-BAC Flat Swamp
Recreation Escherichia coli 5A 8.48 L2016
K14L-02-BAC Nottoway Falls Lake
Recreation Escherichia coli 5A 32.19 L2014
K14L-02-DO Nottoway Falls Lake
Aquatic Life Oxygen, Dissolved 5A 32.19 L2004
K14L-02-HG Nottoway Falls Lake
Fish Consumption Mercury in Fish Tissue 5A 32.19 L2010
Appendix 1a - 50Final 2016

2016 Impaired Waters - 303(d) List
Category 5 - Waters needing Total Maximum Daily Load Study
Chowan River and Dismal Swamp Basins
Cause Group Code CauseCategory
TMDLDev.
Priority
Estuary(Sq. Miles)
Reservoir(Acres)
River(Miles)
InitialListDateImpaired Use
Water Name
Cause
K14R-01-BEN Nottoway River
Aquatic Life Benthic-Macroinvertebrate Bioassessments 5A 7.26 M2010
K15L-01-HG Nottoway Pond
Fish Consumption Mercury in Fish Tissue 5A 50.70 L2010
K15R-03-DO Lazaretto Creek
Aquatic Life Oxygen, Dissolved 5A 4.97 L2010
K15R-04-BEN Mallorys Creek
Aquatic Life Benthic-Macroinvertebrate Bioassessments 5A 7.11 L2014
K16L-01-TP Fort Pickett Reservoir
Aquatic Life Phosphorus (Total) 5A 318.95 L2012
K16R-04-BAC Nottoway River
Recreation Escherichia coli 5A 3.39 H, 2yr2006
K16R-06-BAC Tommeheton Creek
Recreation Escherichia coli 5A 7.84 L2016
K16R-06-DO Tommeheton Creek
Aquatic Life Oxygen, Dissolved 5A 7.84 M2010
K16R-07-BEN Seay Creek
Aquatic Life Benthic-Macroinvertebrate Bioassessments 5A 7.48 M2014
K17R-01-BAC Nottoway River
Recreation Escherichia coli 5A 9.99 M, 2yr2010
K17R-02-BAC Waqua Creek
Recreation Escherichia coli 5A 3.57 M, 2yr2012
K17R-03-BAC Waqua Creek
Recreation Escherichia coli 5A 5.59 L2016
K17R-04-BAC Great Creek
Recreation Escherichia coli 5A 5.45 L2016
K17R-05-BAC Reedy Creek
Recreation Escherichia coli 5A 6.02 L2016
K17R-05-DO Reedy Creek
Aquatic Life Oxygen, Dissolved 5C 6.02 L2016
K17R-06-BAC Turkey Egg Creek
Recreation Escherichia coli 5A 5.64 L2016
K17R-07-BAC Waqua Creek
Recreation Escherichia coli 5A 1.09 L2016
K17R-07-DO Hickory Run
Aquatic Life Oxygen, Dissolved 5C 4.94 L2016
K17R-07-PH Hickory Run
Aquatic Life pH 5C 4.94 L2016
Appendix 1a - 51Final 2016

2016 Impaired Waters - 303(d) List
Category 5 - Waters needing Total Maximum Daily Load Study
Chowan River and Dismal Swamp Basins
Cause Group Code CauseCategory
TMDLDev.
Priority
Estuary(Sq. Miles)
Reservoir(Acres)
River(Miles)
InitialListDateImpaired Use
Water Name
Cause
K18R-01-DO Sturgeon Creek
Aquatic Life Oxygen, Dissolved 5C 12.96 L2014
K19R-01-BAC Masons Branch
Recreation Escherichia coli 5A 4.89 M, 2yr2012
K19R-03-BAC Buckskin Creek
Recreation Escherichia coli 5A 11.90 M, 2yr2010
K19R-03-DO Buckskin Creek
Aquatic Life Oxygen, Dissolved 5A 1.96 L2012
K19R-04-HG Nottoway River and Tributaries
Fish Consumption Mercury in Fish Tissue 5A 113.57 L2008
Mercury in Fish Tissue 5A 53.09 L2010
Mercury in Fish Tissue 5A 19.84 L2010
K19R-05-BEN XEJ - Nottoway River, UT
Aquatic Life Benthic-Macroinvertebrate Bioassessments 5A 2.88 L2008
K19R-06-BEN Nottoway River
Aquatic Life Benthic-Macroinvertebrate Bioassessments 5A 1.04 L2008
K19R-07-DO XAD - Buckskin Creek, UT
Aquatic Life Oxygen, Dissolved 5C 2.90 L2012
K19R-08-DO XHW - Buckskin Creek, UT
Aquatic Life Oxygen, Dissolved 5A 1.63 L2012
K19R-09-BAC XHX - Buckskin Creek, UT
Recreation Escherichia coli 5A 2.66 M, 2yr2012
K19R-10-BAC XHY - Buckskin Creek, UT
Recreation Escherichia coli 5A 1.61 M, 2yr2012
K19R-11-BAC Moores Swamp
Recreation Escherichia coli 5A 5.08 L2016
K21R-03-HG Stony Creek
Fish Consumption Mercury in Fish Tissue 5A 8.35 L2010
K21R-05-BAC Mortar Branch
Recreation Escherichia coli 5A 6.12 M, 2yr2014
K21R-05-DO Mortar Branch
Aquatic Life Oxygen, Dissolved 5C 6.12 L2014
K21R-05-PH Mortar Branch
Aquatic Life pH 5C 6.12 L2014
K21R-06-BAC Stony Creek
Recreation Escherichia coli 5A 2.60 L2016
K21R-07-PH Chamberlains Bed
Aquatic Life pH 5C 1.32 L2016
Appendix 1a - 52Final 2016

2016 Impaired Waters - 303(d) List
Category 5 - Waters needing Total Maximum Daily Load Study
Chowan River and Dismal Swamp Basins
Cause Group Code CauseCategory
TMDLDev.
Priority
Estuary(Sq. Miles)
Reservoir(Acres)
River(Miles)
InitialListDateImpaired Use
Water Name
Cause
K21R-08-DO Chamberlains Bed
Aquatic Life Oxygen, Dissolved 5C 2.82 L2016
K21R-08-PH Chamberlains Bed
Aquatic Life pH 5C 2.82 L2016
K22R-03-BAC Sappony Creek (partial Delist 9.18mi(upper portion)
Recreation Escherichia coli 5A 11.86 M, 2yr2006
K22R-04-BAC Sappony Creek
Recreation Escherichia coli 5A 4.35 L2016
K23R-01-BAC Arthur Swamp
Recreation Escherichia coli 5A 8.38 L2008
K23R-02-BAC Joseph Swamp
Recreation Escherichia coli 5A 11.22 M, 2yr2010
K23R-04-BAC Jones Hole Sw/Moores Sw and all tribs(ptl Delist 4.2&9.11mi)
Recreation Escherichia coli 5A 70.67 M, 2yr2010
K23R-05-BAC Gosee Swamp and Tributaries
Recreation Escherichia coli 5A 27.71 M, 2yr2014
K23R-10-BAC Rowanty Creek
Recreation Escherichia coli 5A 14.07 M, 2yr2012
K24R-03-BAC Hunting Quarter Swamp
Recreation Escherichia coli 5A 16.67 L2008
K24R-04-BAC Nottoway River
Recreation Escherichia coli 5A 15.61 L2016
K24R-05-BAC Thweatt Branch Tributaries
Recreation Escherichia coli 5A 7.26 L2016
K27R-03-BEN Applewhite Swamp
Aquatic Life Benthic-Macroinvertebrate Bioassessments 5A 8.16 L2008
K27R-05-BEN Three Creek - Upper
Aquatic Life Benthic-Macroinvertebrate Bioassessments 5A 9.17 L2006
K28R-01-DO Mill Swamp
Aquatic Life Oxygen, Dissolved 5C 10.49 L2006
K28R-02-BEN Buckhorn Swamp
Aquatic Life Benthic-Macroinvertebrate Bioassessments 5A 5.68 L2008
K28R-04-BEN Unnamed Tributary to Mill Swamp
Aquatic Life Benthic-Macroinvertebrate Bioassessments 5A 1.85 L2014
K28R-05-BAC Buckhorn Swamp
Recreation Escherichia coli 5A 4.22 H2012
K28R-05-DO Buckhorn Swamp
Aquatic Life Oxygen, Dissolved 5C 4.22 M2014
Appendix 1a - 53Final 2016

2016 Impaired Waters - 303(d) List
Category 5 - Waters needing Total Maximum Daily Load Study
Chowan River and Dismal Swamp Basins
Cause Group Code CauseCategory
TMDLDev.
Priority
Estuary(Sq. Miles)
Reservoir(Acres)
River(Miles)
InitialListDateImpaired Use
Water Name
Cause
K28R-05-PH Buckhorn Swamp
Aquatic Life pH 5C 4.22 L2016
K28R-06-DO Nottoway Swamp
Aquatic Life Oxygen, Dissolved 5C 8.12 L2012
K28R-06-PH Nottoway Swamp
Aquatic Life pH 5C 8.12 L2012
K29R-02-BAC Assamoosick Swamp
Recreation Escherichia coli 5A 2.46 L2010
K29R-03-BAC XGT - Assamoosick Swamp, UT
Recreation Escherichia coli 5A 1.93 L2010
K30R-01-DO Darden Mill Run
Aquatic Life Oxygen, Dissolved 5C 10.72 L2002
K30R-01-PH Darden Mill Run
Aquatic Life pH 5C 10.72 L2004
K30R-02-DO Nottoway River - Lower
Aquatic Life Oxygen, Dissolved 5A 4.54 L2014
K30R-04-BAC Nottoway River - Upper
Recreation Escherichia coli 5A 0.45 L2008
K32R-01-BEN Blackwater River - Lower
Aquatic Life Benthic-Macroinvertebrate Bioassessments 5A 2.32 L2008
K32R-13-HG Blackwater River Basin
Fish Consumption Mercury in Fish Tissue 5A 36.91 L2004
Mercury in Fish Tissue 5A 26.81 L2006
Mercury in Fish Tissue 5A 701.67 L2008
Mercury in Fish Tissue 5A 611.63 L2008
Mercury in Fish Tissue 5A 1.45 L2010
Mercury in Fish Tissue 5A 417.95 L2010
Mercury in Fish Tissue 5A 3.98 L2012
K32R-18-BEN Blackwater River, UT
Aquatic Life Benthic-Macroinvertebrate Bioassessments 5A 3.13 L2008
K33R-02-BAC Blackwater River - Middle
Recreation Escherichia coli 5A 1.04 H2012
K33R-02-BEN Blackwater River - Upper
Aquatic Life Benthic-Macroinvertebrate Bioassessments 5A 19.10 L2008
K33R-03-BEN Blackwater River - Lower and Burnt Mills Swamp
Aquatic Life Benthic-Macroinvertebrate Bioassessments 5A 4.18 L2008
Benthic-Macroinvertebrate Bioassessments 5A 5.16 L2012
K35L-01-DO Airfield Pond
Aquatic Life Oxygen, Dissolved 5C 120.07 L2008
Appendix 1a - 54Final 2016
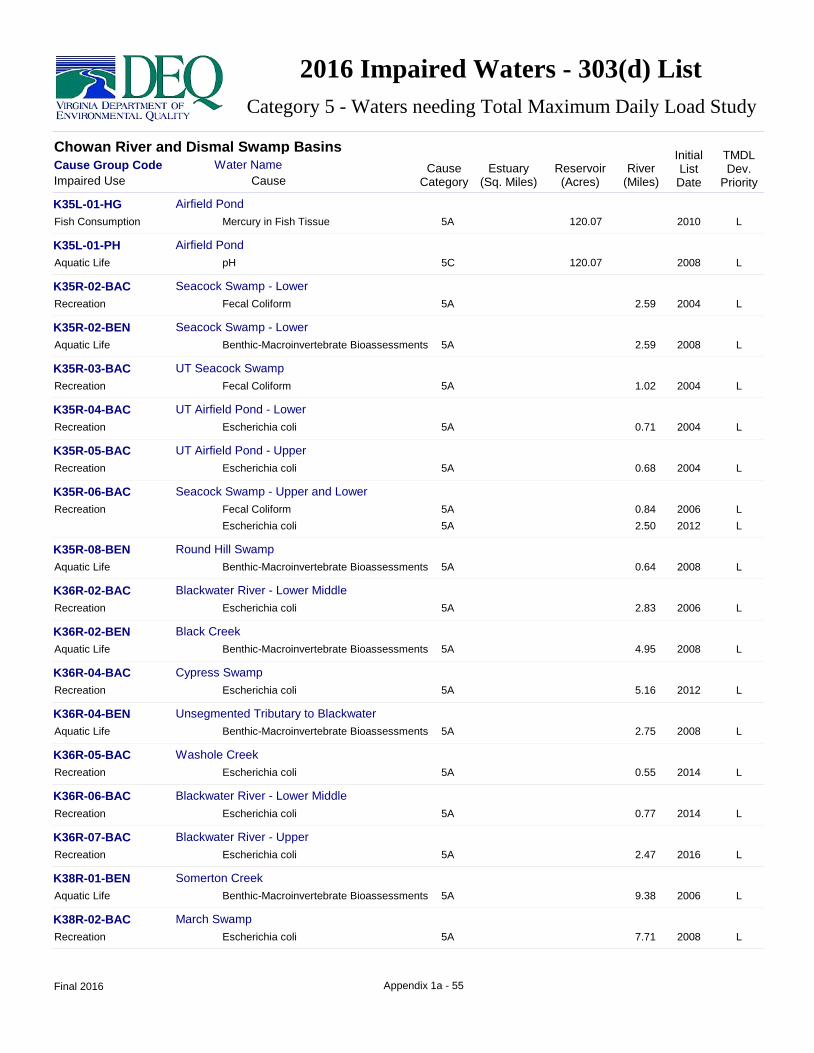
2016 Impaired Waters - 303(d) List
Category 5 - Waters needing Total Maximum Daily Load Study
Chowan River and Dismal Swamp Basins
Cause Group Code CauseCategory
TMDLDev.
Priority
Estuary(Sq. Miles)
Reservoir(Acres)
River(Miles)
InitialListDateImpaired Use
Water Name
Cause
K35L-01-HG Airfield Pond
Fish Consumption Mercury in Fish Tissue 5A 120.07 L2010
K35L-01-PH Airfield Pond
Aquatic Life pH 5C 120.07 L2008
K35R-02-BAC Seacock Swamp - Lower
Recreation Fecal Coliform 5A 2.59 L2004
K35R-02-BEN Seacock Swamp - Lower
Aquatic Life Benthic-Macroinvertebrate Bioassessments 5A 2.59 L2008
K35R-03-BAC UT Seacock Swamp
Recreation Fecal Coliform 5A 1.02 L2004
K35R-04-BAC UT Airfield Pond - Lower
Recreation Escherichia coli 5A 0.71 L2004
K35R-05-BAC UT Airfield Pond - Upper
Recreation Escherichia coli 5A 0.68 L2004
K35R-06-BAC Seacock Swamp - Upper and Lower
Recreation Fecal Coliform 5A 0.84 L2006
Escherichia coli 5A 2.50 L2012
K35R-08-BEN Round Hill Swamp
Aquatic Life Benthic-Macroinvertebrate Bioassessments 5A 0.64 L2008
K36R-02-BAC Blackwater River - Lower Middle
Recreation Escherichia coli 5A 2.83 L2006
K36R-02-BEN Black Creek
Aquatic Life Benthic-Macroinvertebrate Bioassessments 5A 4.95 L2008
K36R-04-BAC Cypress Swamp
Recreation Escherichia coli 5A 5.16 L2012
K36R-04-BEN Unsegmented Tributary to Blackwater
Aquatic Life Benthic-Macroinvertebrate Bioassessments 5A 2.75 L2008
K36R-05-BAC Washole Creek
Recreation Escherichia coli 5A 0.55 L2014
K36R-06-BAC Blackwater River - Lower Middle
Recreation Escherichia coli 5A 0.77 L2014
K36R-07-BAC Blackwater River - Upper
Recreation Escherichia coli 5A 2.47 L2016
K38R-01-BEN Somerton Creek
Aquatic Life Benthic-Macroinvertebrate Bioassessments 5A 9.38 L2006
K38R-02-BAC March Swamp
Recreation Escherichia coli 5A 7.71 L2008
Appendix 1a - 55Final 2016

2016 Impaired Waters - 303(d) List
Category 5 - Waters needing Total Maximum Daily Load Study
Chowan River and Dismal Swamp Basins
Cause Group Code CauseCategory
TMDLDev.
Priority
Estuary(Sq. Miles)
Reservoir(Acres)
River(Miles)
InitialListDateImpaired Use
Water Name
Cause
K38R-02-DO March Swamp
Aquatic Life Oxygen, Dissolved 5C 7.71 L2004
K38R-02-PH March Swamp
Aquatic Life pH 5C 7.71 L2004
K38R-03-DO Chapel Swamp
Aquatic Life Oxygen, Dissolved 5C 8.28 L2004
K38R-03-PH Chapel Swamp
Aquatic Life pH 5C 8.28 L2004
K38R-04-BAC Unsegmented rivers in K38R
Recreation Escherichia coli 5A 1.80 L2014
K38R-05-BAC Chapel Swamp
Recreation Escherichia coli 5A 8.28 L2014
K38R-06-BAC Somerton Creek
Recreation Escherichia coli 5A 9.38 L2016
K39L-01-HG Lake Drummond
Fish Consumption Mercury in Fish Tissue 5A 3,241.96 L2006
K39L-01-PH Lake Drummond
Aquatic Life pH 5C 3,241.96 L2008
K39R-01-HG Dismal Swamp Canal & Feeder Ditch to Lake Drummond
Fish Consumption Mercury in Fish Tissue 5A 13.21 L2004
K39R-02-HG Unsegmented rivers in K39R
Fish Consumption Mercury in Fish Tissue 5A 15.28 L2010
K40R-02-BAC Northwest River - Middle (PWS)
Recreation Escherichia coli 5A 6.33 L2006
K40R-04-BAC Northwest River - Lower (PWS)
Recreation Escherichia coli 5A 1.70 L2016
K40R-04-HG Northwest River - Middle
Fish Consumption Mercury in Fish Tissue 5A 6.33 L2010
K40R-09-BAC Indian Creek tributary to Northwest River
Recreation Escherichia coli 5A 3.46 L2006
K41R-01-BEN Pocaty River
Aquatic Life Benthic-Macroinvertebrate Bioassessments 5A 7.43 L2010
K41R-05-PCB West Neck Creek - Middle
Fish Consumption PCB in Fish Tissue 5A 2.74 L2010
K41R-12-BEN Unnamed Trib to Milldam Creek
Aquatic Life Benthic-Macroinvertebrate Bioassessments 5A 0.66 L2012
K41R-12-DO Unnamed Trib to Milldam Creek
Aquatic Life Oxygen, Dissolved 5A 0.66 L2014
Appendix 1a - 56Final 2016
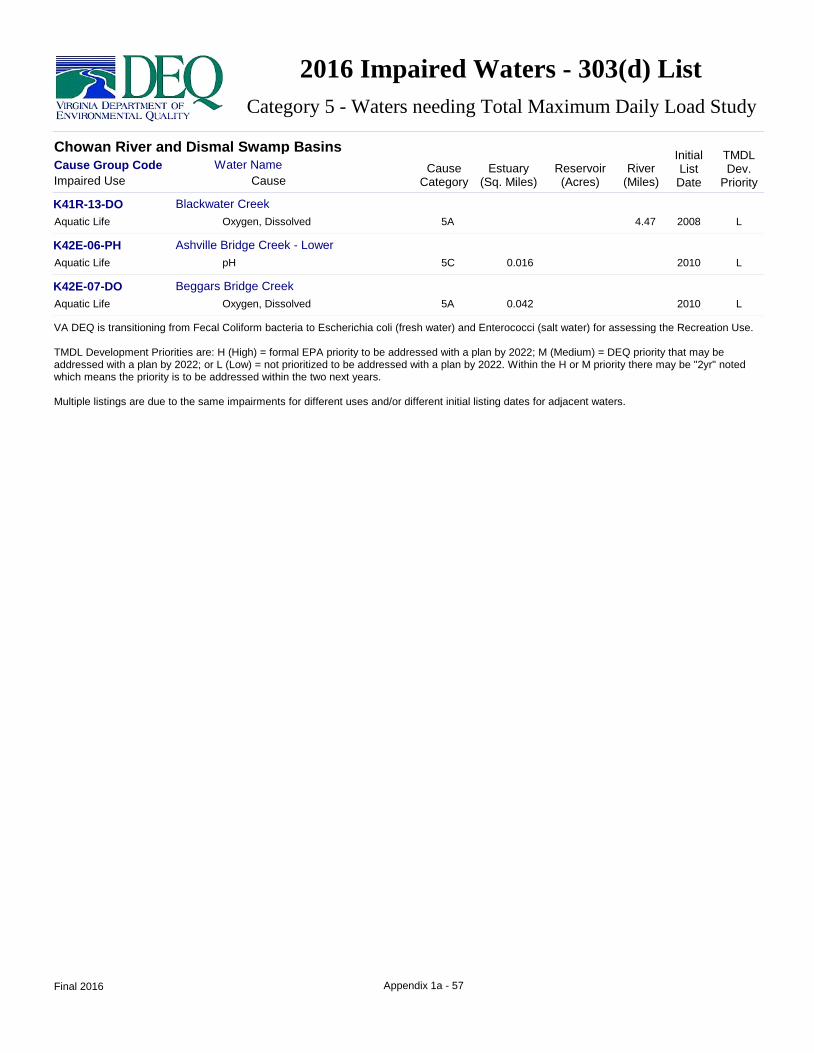
2016 Impaired Waters - 303(d) List
Category 5 - Waters needing Total Maximum Daily Load Study
Chowan River and Dismal Swamp Basins
Cause Group Code CauseCategory
TMDLDev.
Priority
Estuary(Sq. Miles)
Reservoir(Acres)
River(Miles)
InitialListDateImpaired Use
Water Name
Cause
K41R-13-DO Blackwater Creek
Aquatic Life Oxygen, Dissolved 5A 4.47 L2008
K42E-06-PH Ashville Bridge Creek - Lower
Aquatic Life pH 5C 0.016 L2010
K42E-07-DO Beggars Bridge Creek
Aquatic Life Oxygen, Dissolved 5A 0.042 L2010
VA DEQ is transitioning from Fecal Coliform bacteria to Escherichia coli (fresh water) and Enterococci (salt water) for assessing the Recreation Use.
TMDL Development Priorities are: H (High) = formal EPA priority to be addressed with a plan by 2022; M (Medium) = DEQ priority that may be addressed with a plan by 2022; or L (Low) = not prioritized to be addressed with a plan by 2022. Within the H or M priority there may be "2yr" noted which means the priority is to be addressed within the two next years.
Multiple listings are due to the same impairments for different uses and/or different initial listing dates for adjacent waters.
Appendix 1a - 57Final 2016
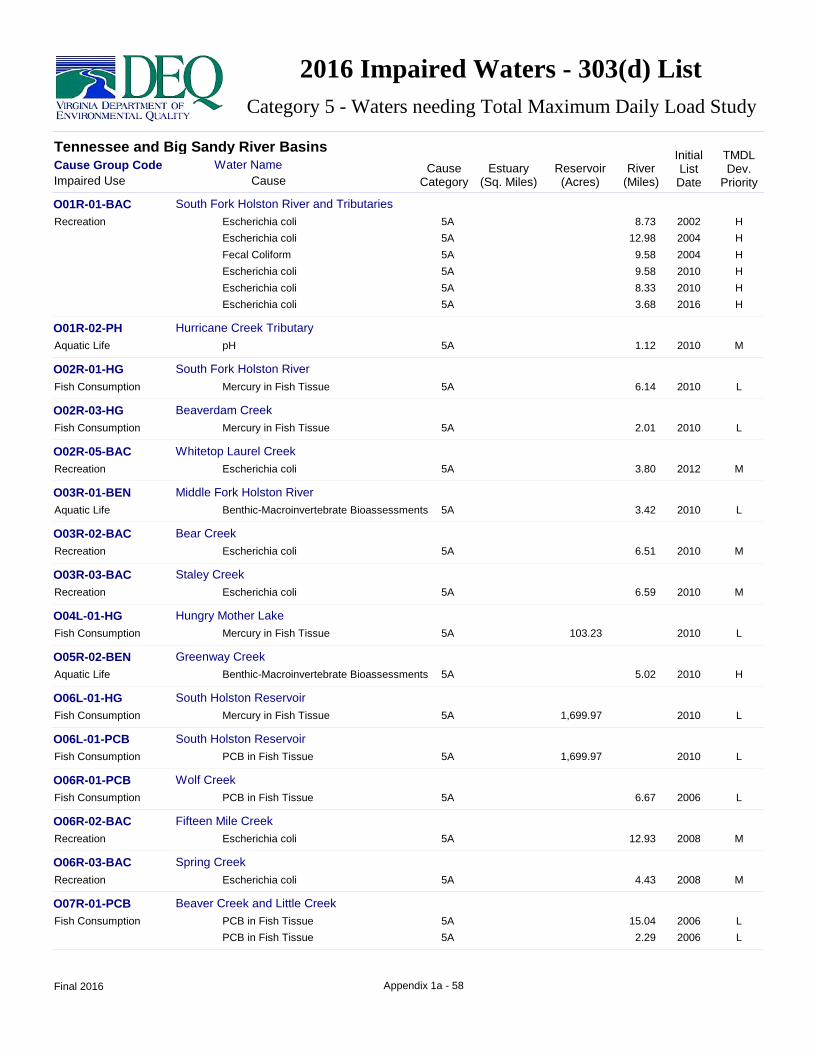
2016 Impaired Waters - 303(d) List
Category 5 - Waters needing Total Maximum Daily Load Study
Tennessee and Big Sandy River Basins
Cause Group Code CauseCategory
TMDLDev.
Priority
Estuary(Sq. Miles)
Reservoir(Acres)
River(Miles)
InitialListDateImpaired Use
Water Name
Cause
O01R-01-BAC South Fork Holston River and Tributaries
Recreation Escherichia coli 5A 8.73 H2002
Escherichia coli 5A 12.98 H2004
Fecal Coliform 5A 9.58 H2004
Escherichia coli 5A 9.58 H2010
Escherichia coli 5A 8.33 H2010
Escherichia coli 5A 3.68 H2016
O01R-02-PH Hurricane Creek Tributary
Aquatic Life pH 5A 1.12 M2010
O02R-01-HG South Fork Holston River
Fish Consumption Mercury in Fish Tissue 5A 6.14 L2010
O02R-03-HG Beaverdam Creek
Fish Consumption Mercury in Fish Tissue 5A 2.01 L2010
O02R-05-BAC Whitetop Laurel Creek
Recreation Escherichia coli 5A 3.80 M2012
O03R-01-BEN Middle Fork Holston River
Aquatic Life Benthic-Macroinvertebrate Bioassessments 5A 3.42 L2010
O03R-02-BAC Bear Creek
Recreation Escherichia coli 5A 6.51 M2010
O03R-03-BAC Staley Creek
Recreation Escherichia coli 5A 6.59 M2010
O04L-01-HG Hungry Mother Lake
Fish Consumption Mercury in Fish Tissue 5A 103.23 L2010
O05R-02-BEN Greenway Creek
Aquatic Life Benthic-Macroinvertebrate Bioassessments 5A 5.02 H2010
O06L-01-HG South Holston Reservoir
Fish Consumption Mercury in Fish Tissue 5A 1,699.97 L2010
O06L-01-PCB South Holston Reservoir
Fish Consumption PCB in Fish Tissue 5A 1,699.97 L2010
O06R-01-PCB Wolf Creek
Fish Consumption PCB in Fish Tissue 5A 6.67 L2006
O06R-02-BAC Fifteen Mile Creek
Recreation Escherichia coli 5A 12.93 M2008
O06R-03-BAC Spring Creek
Recreation Escherichia coli 5A 4.43 M2008
O07R-01-PCB Beaver Creek and Little Creek
Fish Consumption PCB in Fish Tissue 5A 15.04 L2006
PCB in Fish Tissue 5A 2.29 L2006
Appendix 1a - 58Final 2016

2016 Impaired Waters - 303(d) List
Category 5 - Waters needing Total Maximum Daily Load Study
Tennessee and Big Sandy River Basins
Cause Group Code CauseCategory
TMDLDev.
Priority
Estuary(Sq. Miles)
Reservoir(Acres)
River(Miles)
InitialListDateImpaired Use
Water Name
Cause
O07R-04-BAC Sinking Creek
Recreation Escherichia coli 5A 3.79 M2012
O07R-05-BAC Stoffel Creek
Recreation Escherichia coli 5A 5.22 M2012
O08R-01-BAC Boozy Creek
Recreation Escherichia coli 5A 2.53 M2012
O10R-01-PCB North Fork Holston River
Fish Consumption PCB in Fish Tissue 5A 15.27 L1996
O10R-05-BEN Laurel Creek
Aquatic Life Benthic-Macroinvertebrate Bioassessments 5A 2.65 L2002
O11L-01-TEMP Hidden Valley Lake
Aquatic Life Temperature, water 5C 61.10 L2010
O11L-02-PH Laurel Bed Lake
Aquatic Life pH 5C 359.43 L2006
O11L-02-TEMP Laurel Bed Lake
Aquatic Life Temperature, water 5C 359.43 L2010
O12R-03-BEN Greendale Creek
Aquatic Life Benthic-Macroinvertebrate Bioassessments 5A 5.03 M2010
P01L-03-HG Lake Witten
Fish Consumption Mercury in Fish Tissue 5A 53.17 L2010
P01R-02-BEN Plum Creek
Aquatic Life Benthic-Macroinvertebrate Bioassessments 5A 2.88 L2010
P03R-01-BEN Clinch River Tributaries
Aquatic Life Benthic-Macroinvertebrate Bioassessments 5A 3.12 L2008
Benthic-Macroinvertebrate Bioassessments 5A 3.75 L2010
P03R-02-HG Clinch River
Fish Consumption Mercury in Fish Tissue 5A 5.55 L2010
P04R-02-BEN Swords Creek
Aquatic Life Benthic-Macroinvertebrate Bioassessments 5A 2.91 L2006
P04R-03-BEN Mill Creek
Aquatic Life Benthic-Macroinvertebrate Bioassessments 5A 3.22 M2014
P06R-01-BEN Big Cedar Creek
Aquatic Life Benthic-Macroinvertebrate Bioassessments 5A 4.20 L2016
P07R-02-BEN Mill Creek
Aquatic Life Benthic-Macroinvertebrate Bioassessments 5A 1.84 M2014
P09L-01-HG Bark Camp Lake
Fish Consumption Mercury in Fish Tissue 5A 41.06 L2010
Appendix 1a - 59Final 2016

2016 Impaired Waters - 303(d) List
Category 5 - Waters needing Total Maximum Daily Load Study
Tennessee and Big Sandy River Basins
Cause Group Code CauseCategory
TMDLDev.
Priority
Estuary(Sq. Miles)
Reservoir(Acres)
River(Miles)
InitialListDateImpaired Use
Water Name
Cause
P09R-02-BAC Clinch River
Recreation Escherichia coli 5A 11.96 M2012
P11R-03-PCB Guest River and Bear Creek
Fish Consumption PCB in Fish Tissue 5A 1.94 L2004
PCB in Fish Tissue 5A 4.15 L2004
PCB in Fish Tissue 5A 19.87 L2006
P11R-05-BEN Eastland Creek
Aquatic Life Benthic-Macroinvertebrate Bioassessments 5A 2.00 L2010
P12R-01-BEN Bark Camp Branch
Aquatic Life Benthic-Macroinvertebrate Bioassessments 5A 3.07 M2004
P12R-01-PH Bark Camp Branch
Aquatic Life pH 5A 3.07 M2010
P12R-02-BEN Devil Fork
Aquatic Life Benthic-Macroinvertebrate Bioassessments 5A 4.40 M2006
P12R-02-pH Devil Fork
Aquatic Life pH 5A 4.40 M2014
P13R-02-PCB Stock Creek
Fish Consumption PCB in Fish Tissue 5A 4.78 L2004
P14R-02-BEN Blackoak Branch Tributary
Aquatic Life Benthic-Macroinvertebrate Bioassessments 5A 0.76 M2012
P17R-00-PH Dark Hollow
Aquatic Life pH 5A 1.40 H2012
P17R-04-BEN Unnamed tributary to Callahan Creek
Aquatic Life Benthic-Macroinvertebrate Bioassessments 5A 0.58 L2016
P17R-09-BEN Roaring Fork and Potcamp Fork
Aquatic Life Benthic-Macroinvertebrate Bioassessments 5A 5.04 H2010
Benthic-Macroinvertebrate Bioassessments 5A 21.73 H2014
P17R-12-BEN Powell River
Aquatic Life Benthic-Macroinvertebrate Bioassessments 5A 1.00 L2010
P17R-13-BEN Looney Creek
Aquatic Life Benthic-Macroinvertebrate Bioassessments 5A 8.54 H2014
P18L-01-HG Big Cherry Reservoir
Fish Consumption Mercury in Fish Tissue 5A 104.00 L2010
P18L-01-PH Big Cherry Reservoir
Aquatic Life pH 5C 104.00 M2002
P18R-01-PH South Fork Powell River
Aquatic Life pH 5A 3.83 L2016
Appendix 1a - 60Final 2016

2016 Impaired Waters - 303(d) List
Category 5 - Waters needing Total Maximum Daily Load Study
Tennessee and Big Sandy River Basins
Cause Group Code CauseCategory
TMDLDev.
Priority
Estuary(Sq. Miles)
Reservoir(Acres)
River(Miles)
InitialListDateImpaired Use
Water Name
Cause
P20L-01-HG Lake Keokee
Fish Consumption Mercury in Fish Tissue 5A 96.21 L2010
P20R-01-TEMP North Fork Powell River
Aquatic Life Temperature, water 5A 2.98 M2014
Temperature, water 5A 7.67 M2016
P20R-04-BEN North Fork Powell River Tributaries
Aquatic Life Benthic-Macroinvertebrate Bioassessments 5A 8.23 L2014
P21R-02-BAC Hardy Creek
Recreation Escherichia coli 5A 12.52 M2006
P21R-03-BAC Powell River and Town Creek
Recreation Escherichia coli 5A 2.69 M2006
Escherichia coli 5A 3.73 M2012
P21R-04-BAC Dry Creek
Recreation Escherichia coli 5A 8.87 M2012
P22R-01-TEMP Wallen Creek
Aquatic Life Temperature, water 5A 42.90 M2012
P23R-02-BAC Martin Creek
Recreation Escherichia coli 5A 9.66 M2008
P23R-03-BAC Fourmile Creek
Recreation Escherichia coli 5A 2.36 M2014
P24R-01-BAC Indian Creek
Recreation Escherichia coli 5A 8.18 M2008
Escherichia coli 5A 4.44 M2014
Q03R-02-PCB Knox Creek and Tributaries
Fish Consumption PCB in Fish Tissue 5A 186.05 L2004
PCB in Fish Tissue 5A 8.70 L2006
PCB in Fish Tissue 5A 6.00 L2006
Q03R-03-BAC Pawpaw Creek and Jacobs Fork
Recreation Escherichia coli 5A 6.57 M2010
Q05R-00-TEMP Dismal Creek
Aquatic Life Temperature, water 5A 5.38 M2008
Q08R-05-BEN Conaway Creek
Aquatic Life Benthic-Macroinvertebrate Bioassessments 5A 2.62 L2014
Q08R-06-BEN State Line Branch
Aquatic Life Benthic-Macroinvertebrate Bioassessments 5A 1.35 M2014
Q08R-07-BEN Home Creek Headwaters
Aquatic Life Benthic-Macroinvertebrate Bioassessments 5A 0.80 M2014
Q08R-08-BEN Conaway Creek and Tributaries
Aquatic Life Benthic-Macroinvertebrate Bioassessments 5A 6.99 M2014
Appendix 1a - 61Final 2016

2016 Impaired Waters - 303(d) List
Category 5 - Waters needing Total Maximum Daily Load Study
Tennessee and Big Sandy River Basins
Cause Group Code CauseCategory
TMDLDev.
Priority
Estuary(Sq. Miles)
Reservoir(Acres)
River(Miles)
InitialListDateImpaired Use
Water Name
Cause
Q08R-09-BEN Poplar Creek
Aquatic Life Benthic-Macroinvertebrate Bioassessments 5A 3.03 L2014
Q09R-01-BAC Russell Fork
Recreation Escherichia coli 5A 8.87 H, 2yr2004
Escherichia coli 5A 2.25 H, 2yr2006
Escherichia coli 5A 15.34 H, 2yr2010
Escherichia coli 5A 3.90 H, 2yr2012
Escherichia coli 5A 4.12 H, 2yr2016
Q09R-01-BEN Indian Creek
Aquatic Life Benthic-Macroinvertebrate Bioassessments 5A 2.69 M2012
Q09R-02-BEN Sullivan Branch
Aquatic Life Benthic-Macroinvertebrate Bioassessments 5A 1.62 M2008
Q10R-01-BEN Fryingpan Creek
Aquatic Life Benthic-Macroinvertebrate Bioassessments 5A 9.45 H2012
Q11R-02-BAC McClure River and Tributaries
Recreation Escherichia coli 5A 9.68 H2006
Escherichia coli 5A 3.38 H2006
Escherichia coli 5A 3.25 H2008
Escherichia coli 5A 11.01 H2012
Escherichia coli 5A 1.08 H2014
Q11R-02-BEN McClure River and Tributaries
Aquatic Life Benthic-Macroinvertebrate Bioassessments 5A 1.80 M2014
Q11R-04-BEN Cowan Rose Branch
Aquatic Life Benthic-Macroinvertebrate Bioassessments 5A 3.30 M2014
Q11R-05-BEN Dismal Fork
Aquatic Life Benthic-Macroinvertebrate Bioassessments 5A 4.51 M2014
Q12R-01-BAC Russell Prater Creek
Recreation Escherichia coli 5A 11.72 L2008
Q12R-05-BEN Middle Fork (Hunts Creek)
Aquatic Life Benthic-Macroinvertebrate Bioassessments 5A 2.93 M2014
Q13L-01-HG John Flannagan Reservoir
Fish Consumption Mercury in Fish Tissue 5A 1,177.21 L2010
Q13R-02-TEMP North Fork Pound River
Aquatic Life Temperature, water 5C 10.25 H2012
Q13R-03-BAC Pound River
Recreation Escherichia coli 5A 16.94 H2008
Q13R-03-TEMP North Fork Pound River
Aquatic Life Temperature, water 5C 1.29 L2010
Appendix 1a - 62Final 2016

2016 Impaired Waters - 303(d) List
Category 5 - Waters needing Total Maximum Daily Load Study
Tennessee and Big Sandy River Basins
Cause Group Code CauseCategory
TMDLDev.
Priority
Estuary(Sq. Miles)
Reservoir(Acres)
River(Miles)
InitialListDateImpaired Use
Water Name
Cause
Q13R-04-BEN Indian Creek
Aquatic Life Benthic-Macroinvertebrate Bioassessments 5A 2.98 H2012
Q13R-06-BEN Pound River
Aquatic Life Benthic-Macroinvertebrate Bioassessments 5A 16.94 H2004
Q13R-07-BEN Bear Pen Branch
Aquatic Life Benthic-Macroinvertebrate Bioassessments 5A 3.30 M2010
Q13R-09-BAC Big Branch
Recreation Escherichia coli 5A 1.46 M2014
Q13R-09-BEN North Fork Pound River
Aquatic Life Benthic-Macroinvertebrate Bioassessments 5A 4.29 H2010
Q13R-10-BAC South Fork Pound River
Recreation Escherichia coli 5A 5.80 L2014
Escherichia coli 5A 3.44 L2016
Q14R-01-BAC Cranesnest River
Recreation Escherichia coli 5A 7.52 H, 2yr2004
Escherichia coli 5A 12.93 H, 2yr2010
Q14R-01-BEN Birchfield Creek and Cranesnest River
Aquatic Life Benthic-Macroinvertebrate Bioassessments 5A 15.45 H, 2yr2010
Q14R-02-BEN Dotson Creek
Aquatic Life Benthic-Macroinvertebrate Bioassessments 5A 3.81 H, 2yr2012
VA DEQ is transitioning from Fecal Coliform bacteria to Escherichia coli (fresh water) and Enterococci (salt water) for assessing the Recreation Use.
TMDL Development Priorities are: H (High) = formal EPA priority to be addressed with a plan by 2022; M (Medium) = DEQ priority that may be addressed with a plan by 2022; or L (Low) = not prioritized to be addressed with a plan by 2022. Within the H or M priority there may be "2yr" noted which means the priority is to be addressed within the two next years.
Multiple listings are due to the same impairments for different uses and/or different initial listing dates for adjacent waters.
Appendix 1a - 63Final 2016

2016 Impaired Waters - 303(d) List
Category 5 - Waters needing Total Maximum Daily Load Study
Chesapeake Bay/Atlantic/Small Coastal Basins
Cause Group Code CauseCategory
TMDLDev.
Priority
Estuary(Sq. Miles)
Reservoir(Acres)
River(Miles)
InitialListDateImpaired Use
Water Name
Cause
AO23-01-BAC Atlantic Ocean Beaches - Croatan
Recreation Enterococcus 5A 0.410 L2016
C01E-17-PCB Chesapeake Bay and Tidal Tributaries
Fish Consumption PCB in Fish Tissue 5A 1,825.564 L2006
PCB in Fish Tissue 5A 0.025 L2010
PCB in Fish Tissue 5A 0.003 L2012
C01R-01-BAC Crabbe Mill Stream
Recreation Escherichia coli 5A 3.90 L2012
C01R-01-DO Crabbe Mill Stream
Aquatic Life Oxygen, Dissolved 5C 3.90 L2012
C01R-01-PH Crabbe Mill Stream
Aquatic Life pH 5C 3.90 L2012
C01R-02-BEN Dymer Creek
Aquatic Life Benthic-Macroinvertebrate Bioassessments 5A 2.06 L2014
C02R-03-HG Dragon Swamp/Piankatank River
Fish Consumption Mercury in Fish Tissue 5A 2.661 L2004
Mercury in Fish Tissue 5A 31.97 L2006
Mercury in Fish Tissue 5A 0.062 L2008
C03E-10-EBEN Piankatank River
Aquatic Life Estuarine Bioassessments 5A 1.167 L2006
Estuarine Bioassessments 5A 0.785 L2008
Estuarine Bioassessments 5A 17.545 L2014
C03E-16-BAC Piankatank River
Recreation Enterococcus 5A 0.785 L2014
C03E-17-BAC Piankatank River
Recreation Escherichia coli 5A 1.167 L2016
C04E-53-BAC Whites Creek - Festival Beach
Recreation Enterococcus 5A 0.046 L2012
C04R-01-DO East River
Aquatic Life Oxygen, Dissolved 5C 0.59 L2012
C04R-01-PH East River
Aquatic Life pH 5C 0.59 L2012
C07E-01-PCB Chesapeake Bay & Tidal Tributaries VDH Fish Consumption Advisory for PCBs
Fish Consumption PCB in Fish Tissue 5A 16.028 L2006
C07E-33-EBEN Northwest Br. Back River - Upper near Marsh Point
Aquatic Life Estuarine Bioassessments 5A 0.248 L2010
C07E-38-SF Bennett Creek - Upper (DSS_06-IR)
Shellfishing Fecal Coliform 5B 0.039 L2012
Appendix 1a - 64Final 2016

2016 Impaired Waters - 303(d) List
Category 5 - Waters needing Total Maximum Daily Load Study
Chesapeake Bay/Atlantic/Small Coastal Basins
Cause Group Code CauseCategory
TMDLDev.
Priority
Estuary(Sq. Miles)
Reservoir(Acres)
River(Miles)
InitialListDateImpaired Use
Water Name
Cause
C07E-41-SF Unsegmented estuaries in Back River - DSS
Shellfishing Fecal Coliform 5B 0.097 L2012
C07E-43-BAC Buckroe Beaches
Recreation Enterococcus 5A 0.224 L2016
C07L-01-CU Harwood Mills Reservoir
Aquatic Life Copper 5A 257.68 L2004
Wildlife Copper 5A 257.68 L2004
C07L-02-DO Harwoods Mill Reservoir (PWS)
Aquatic Life Oxygen, Dissolved 5A 257.68 L2004
C07R-01-DO Newmarket Creek - Lower Riverine
Aquatic Life Oxygen, Dissolved 5A 2.01 L2006
C08E-01-EBEN London Bridge Creek
Aquatic Life Estuarine Bioassessments 5A 7.976 L2008
C08E-01-PCB Eastern Branch -Lynnhaven River System VDH Fish Consumption Advisory
Fish Consumption PCB in Fish Tissue 5A 3.833 L2006
C08E-14-BAC Sara Constance Park, East End
Recreation Enterococcus 5A 0.140 M2014
C08E-15-BAC 13th View Beach
Recreation Enterococcus 5A 0.353 L2016
C08E-16-BAC Chicks Beach
Recreation Enterococcus 5A 0.433 L2016
C08L-01-CHLA Lake Whitehurst
Aquatic Life Chlorophyll-a 5A 482.28 L2010
C08L-01-DO Lake Whitehurst
Aquatic Life Oxygen, Dissolved 5A 482.28 L2008
C08L-01-HG Lake Whitehurst
Fish Consumption Mercury in Fish Tissue 5A 482.28 L2008
C08L-01-PCB Lake Whitehurst VDH Fish Consumption Advisory
Fish Consumption PCB in Fish Tissue 5A 482.28 L2006
C08L-01-TP Lake Whitehurst
Aquatic Life Phosphorus (Total) 5A 482.28 L2010
C08L-03-CHLA Little Creek Reservoir
Aquatic Life Chlorophyll-a 5A 199.79 L2010
C08L-03-PCB Little Creek Reservoir VDH Fish Consumption Advisory
Fish Consumption PCB in Fish Tissue 5A 199.79 L2008
C08L-03-TP Little Creek Reservoir
Aquatic Life Phosphorus (Total) 5A 199.79 L2010
Appendix 1a - 65Final 2016

2016 Impaired Waters - 303(d) List
Category 5 - Waters needing Total Maximum Daily Load Study
Chesapeake Bay/Atlantic/Small Coastal Basins
Cause Group Code CauseCategory
TMDLDev.
Priority
Estuary(Sq. Miles)
Reservoir(Acres)
River(Miles)
InitialListDateImpaired Use
Water Name
Cause
C08L-04-CHLA Lake Smith
Aquatic Life Chlorophyll-a 5A 184.89 L2010
C08L-04-DO Lake Smith
Aquatic Life Oxygen, Dissolved 5A 184.89 L2002
C08L-04-TP Lake Smith
Aquatic Life Phosphorus (Total) 5A 184.89 L2010
C08L-06-HG Lake Trashmore - Western Pond VDH Fish Consumption Advisory for Mercury
Fish Consumption Mercury in Fish Tissue 5A 54.39 L2006
C08L-06-PCB Lake Trashmore - Western Pond VDH Fish Consumption Advisory for PCBs
Fish Consumption PCB in Fish Tissue 5A 54.39 L2006
C08L-07-DO Lake Wright
Aquatic Life Oxygen, Dissolved 5A 15.62 L2014
C09R-02-PH Unnamed tributary to Pitts Creek
Aquatic Life pH 5A 7.50 L2006
C10E-02-BAC Muddy Creek - Upper
Recreation Enterococcus 5A 0.214 L2006
C10R-03-BEN Guilford Creek
Aquatic Life Benthic-Macroinvertebrate Bioassessments 5A 0.85 L2008
C11E-15-SF Matchotank Creek - Upper
Shellfishing Fecal Coliform 5B 0.069 H2006
C11R-01-BAC Joynes Branch
Recreation Escherichia coli 5A 2.37 H2008
C12R-01-BEN Taylor Creek
Aquatic Life Benthic-Macroinvertebrate Bioassessments 5A 0.90 L2004
C12R-02-BEN Bull Branch
Aquatic Life Benthic-Macroinvertebrate Bioassessments 5A 2.25 L2008
C13E-02-BAC Nassawadox Creek - Lower
Recreation Enterococcus 5A 2.108 H2008
C13E-11-SF2 Church Creek - Middle, UT North Cove [No TMDL]
Shellfishing Fecal Coliform 5B 0.059 H2004
C13E-20-SF Nassawadox Creek - Middle, N. Shore Tribs
Shellfishing Fecal Coliform 5B 0.140 H2008
C13R-01-BEN Taylor Branch - Occohannock Creek
Aquatic Life Benthic-Macroinvertebrate Bioassessments 5A 2.31 L2008
D01E-02-DO Little Mosquito Creek
Aquatic Life Oxygen, Dissolved 5A 0.138 H2004
Oxygen, Dissolved 5A 0.071 H2008
Appendix 1a - 66Final 2016

2016 Impaired Waters - 303(d) List
Category 5 - Waters needing Total Maximum Daily Load Study
Chesapeake Bay/Atlantic/Small Coastal Basins
Cause Group Code CauseCategory
TMDLDev.
Priority
Estuary(Sq. Miles)
Reservoir(Acres)
River(Miles)
InitialListDateImpaired Use
Water Name
Cause
D01E-03-BAC Powells Bay
Recreation Enterococcus 5A 0.596 H2006
D01E-04-DO Swan Gut Creek
Aquatic Life Oxygen, Dissolved 5A 0.100 L2004
D02E-01-DO Assawoman Creek
Aquatic Life Oxygen, Dissolved 5A 0.063 H2004
Oxygen, Dissolved 5A 0.073 H2008
D02E-11-SF Little Cat Creek
Shellfishing Fecal Coliform 5B 0.096 L2006
D03E-07-BAC Wachapreague Channel
Recreation Enterococcus 5A 0.055 L2008
D03E-08-DO Northam Creek
Aquatic Life Oxygen, Dissolved 5A 0.028 L2004
D03R-03-BEN Ross Branch
Aquatic Life Benthic-Macroinvertebrate Bioassessments 5A 3.20 L2002
D03R-04-BEN Unnamed tributary to Folly Creek
Aquatic Life Benthic-Macroinvertebrate Bioassessments 5A 1.53 L2002
D03R-05-BEN Rattrap Creek
Aquatic Life Benthic-Macroinvertebrate Bioassessments 5A 2.73 L2012
D03R-06-BEN North Fork
Aquatic Life Benthic-Macroinvertebrate Bioassessments 5A 3.13 L2016
D03R-07-BEN Custis Creek
Aquatic Life Benthic-Macroinvertebrate Bioassessments 5A 1.22 L2016
D04E-01-DO Red Bank Creek
Aquatic Life Oxygen, Dissolved 5A 0.003 L2004
D04E-02-DO Unnamed tributary to Red Bank Creek
Aquatic Life Oxygen, Dissolved 5A 0.009 L2004
D04R-01-DO Red Bank Creek
Aquatic Life Oxygen, Dissolved 5C 1.36 L2016
D04R-03-BEN Frogstool Branch
Aquatic Life Benthic-Macroinvertebrate Bioassessments 5A 4.27 L2012
D04R-04-BEN UT to Mill Creek
Aquatic Life Benthic-Macroinvertebrate Bioassessments 5A 1.48 L2014
D05E-01-HG Oyster Slip (Harbor) - Upper
Fish Consumption Mercury in Fish Tissue 5A 0.034 L2010
D05R-01-BAC Taylor Creek
Recreation Fecal Coliform 5A 1.26 L2002
Appendix 1a - 67Final 2016

2016 Impaired Waters - 303(d) List
Category 5 - Waters needing Total Maximum Daily Load Study
Chesapeake Bay/Atlantic/Small Coastal Basins
Cause Group Code CauseCategory
TMDLDev.
Priority
Estuary(Sq. Miles)
Reservoir(Acres)
River(Miles)
InitialListDateImpaired Use
Water Name
Cause
D05R-02-BAC Holt Creek
Recreation Escherichia coli 5A 1.74 L2004
D05R-03-BAC Holt Creek Unnamed Tributary
Recreation Escherichia coli 5A 1.42 L2004
D05R-03-BEN Holt Creek Unnamed Tributary
Aquatic Life Benthic-Macroinvertebrate Bioassessments 5A 1.42 L2012
D06E-01-DO Magothy Bay - Lower
Aquatic Life Oxygen, Dissolved 5A 0.037 L2004
D06E-02-PCB Raccoon Creek
Fish Consumption PCB in Fish Tissue 5A 0.004 L2010
D06R-01-PH Mill Creek
Aquatic Life pH 5A 2.23 L1998
D06R-02-BAC Narrow Channel Branch
Recreation Escherichia coli 5A 1.84 L2004
D06R-02-BEN Narrow Channel Branch
Aquatic Life Benthic-Macroinvertebrate Bioassessments 5A 1.84 L2004
D06R-02-DO Narrow Channel Branch
Aquatic Life Oxygen, Dissolved 5A 1.84 L2014
D06R-03-BAC Tommy's Ditch
Recreation Escherichia coli 5A 1.44 L2008
D07E-02-BAC Lake Rudee - Upper
Recreation Enterococcus 5A 0.099 H, 2yr2004
D07E-02-SF Lake Rudee - Upper
Shellfishing Fecal Coliform 5B 0.099 H, 2yr2006
D07E-04-BAC Owl Creek - Upper & Lower
Recreation Enterococcus 5A 0.005 H, 2yr2002
Enterococcus 5A 0.019 H, 2yr2008
D07E-04-DO Owl Creek - Upper
Aquatic Life Oxygen, Dissolved 5A 0.005 M, 2yr2006
D07E-04-SF Owl Creek - Upper & Lower
Shellfishing Fecal Coliform 5B 0.025 H, 2yr2006
D07E-10-SF Lake Rudee - Lower and Lake Wesley
Shellfishing Fecal Coliform 5B 0.060 H, 2yr2006
Appendix 1a - 68Final 2016

2016 Impaired Waters - 303(d) List
Category 5 - Waters needing Total Maximum Daily Load Study
Chesapeake Bay/Atlantic/Small Coastal Basins
Cause Group Code CauseCategory
TMDLDev.
Priority
Estuary(Sq. Miles)
Reservoir(Acres)
River(Miles)
InitialListDateImpaired Use
Water Name
Cause
VA DEQ is transitioning from Fecal Coliform bacteria to Escherichia coli (fresh water) and Enterococci (salt water) for assessing the Recreation Use.
TMDL Development Priorities are: H (High) = formal EPA priority to be addressed with a plan by 2022; M (Medium) = DEQ priority that may be addressed with a plan by 2022; or L (Low) = not prioritized to be addressed with a plan by 2022. Within the H or M priority there may be "2yr" noted which means the priority is to be addressed within the two next years.
Multiple listings are due to the same impairments for different uses and/or different initial listing dates for adjacent waters.
Appendix 1a - 69Final 2016

2016 Impaired Waters - 303(d) List
Category 5 - Waters needing Total Maximum Daily Load Study
York River Basin
Cause Group Code CauseCategory
TMDLDev.
Priority
Estuary(Sq. Miles)
Reservoir(Acres)
River(Miles)
InitialListDateImpaired Use
Water Name
Cause
F01L-01-HG Lake Gordonsville
Fish Consumption Mercury in Fish Tissue 5A 77.31 L2006
F01R-01-BEN South Anna River
Aquatic Life Benthic-Macroinvertebrate Bioassessments 5A 1.90 L2010
F01R-02-BEN Wheeler Creek
Aquatic Life Benthic-Macroinvertebrate Bioassessments 5A 6.00 L2008
F01R-03-BEN Camp Creek
Aquatic Life Benthic-Macroinvertebrate Bioassessments 5A 2.01 L2012
F03R-01-BEN Cub Creek
Aquatic Life Benthic-Macroinvertebrate Bioassessments 5A 3.10 L2014
F03R-02-BEN Taylors Creek
Aquatic Life Benthic-Macroinvertebrate Bioassessments 5A 16.54 L2016
F03R-03-DO Cub Creek
Aquatic Life Oxygen, Dissolved 5A 3.10 L2008
F04R-03-DO Stagg Creek
Aquatic Life Oxygen, Dissolved 5C 6.56 L2008
F04R-03-PH Stagg Creek
Aquatic Life pH 5C 6.56 L2016
F06R-04-BAC North Anna River
Recreation Escherichia coli 5A 3.78 H, 2yr2006
Escherichia coli 5A 2.79 H, 2yr2010
F06R-05-BAC Christopher Creek
Recreation Escherichia coli 5A 1.98 H, 2yr2010
F06R-06-BAC Hickory Creek
Recreation Escherichia coli 5A 1.72 H, 2yr2012
F06R-08-BAC Duckinghoe Creek
Recreation Escherichia coli 5A 6.98 L2016
F06R-09-BAC South Fork Hickory Creek
Recreation Escherichia coli 5A 4.63 L2016
F07L-01-BAC Goldmine Creek/Lake Anna
Recreation Escherichia coli 5A 91.62 L2008
F07L-01-BZOKFL Gold Mine Creek
Fish Consumption Benzo[k]fluoranthene 5A 91.62 7.53 L2010
F07L-01-HG Lake Anna
Fish Consumption Mercury in Fish Tissue 5A 1,563.36 L2010
F07L-01-PAHHMW Gold Mine Creek
Fish Consumption Benzo(a)pyrene (PAHs) 5A 91.62 7.53 L2010
Appendix 1a - 70Final 2016

2016 Impaired Waters - 303(d) List
Category 5 - Waters needing Total Maximum Daily Load Study
York River Basin
Cause Group Code CauseCategory
TMDLDev.
Priority
Estuary(Sq. Miles)
Reservoir(Acres)
River(Miles)
InitialListDateImpaired Use
Water Name
Cause
F07L-01-PCB Lake Anna and Contrary Creek, Goldmine Creek, and Terrys Run tributaries
Fish Consumption PCB in Fish Tissue 5A 2,128.04 L2002
PCB in Fish Tissue 5A 7,468.77 23.06 L2006
PCB in Water Column 5A 1,233.83 L2010
F07L-02-HG Terrys Run/Lake Anna
Fish Consumption Mercury in Fish Tissue 5A 431.09 L2010
F07L-02-PAHHMW Gold Mine Creek
Fish Consumption Benzo[b]fluoranthene 5A 91.62 7.53 L2010
F07R-01-BEN Pamunkey Creek
Aquatic Life Benthic-Macroinvertebrate Bioassessments 5A 7.21 L2012
F08R-01-CD Contrary Creek
Aquatic Life Cadmium 5A 27.87 5.52 M2008
Wildlife Cadmium 5A 27.87 5.52 M2008
F08R-01-CU Contrary Creek
Aquatic Life Copper 5A 27.87 5.52 M2008
Wildlife Copper 5A 27.87 5.52 M2008
F08R-01-PH Contrary Creek
Aquatic Life pH 5A 5.52 M2002
pH 5A 27.87 M2008
F08R-01-TEMP Contrary Creek
Aquatic Life Temperature, water 5A 5.52 L2016
F08R-01-ZN Contrary Creek
Aquatic Life Zinc 5A 27.87 5.52 M2008
Wildlife Zinc 5A 27.87 5.52 M2008
F09R-02-BEN North Anna River, UT (XHS)
Aquatic Life Benthic-Macroinvertebrate Bioassessments 5A 1.09 L2008
F09R-03-PH North Anna River, UT (XIM)
Aquatic Life pH 5C 0.70 L2010
F09R-04-PH Mill Creek
Aquatic Life pH 5C 4.37 L2012
F09R-05-PH North Anna River, UT - XJP
Aquatic Life pH 5C 1.01 L2016
F10R-01-BAC Little River
Recreation Escherichia coli 5A 4.17 L2006
F10R-02-BAC Little River
Recreation Escherichia coli 5A 1.29 L2014
F10R-02-DO Long Creek
Aquatic Life Oxygen, Dissolved 5C 5.15 L2014
Appendix 1a - 71Final 2016

2016 Impaired Waters - 303(d) List
Category 5 - Waters needing Total Maximum Daily Load Study
York River Basin
Cause Group Code CauseCategory
TMDLDev.
Priority
Estuary(Sq. Miles)
Reservoir(Acres)
River(Miles)
InitialListDateImpaired Use
Water Name
Cause
F10R-03-BAC Long Creek
Recreation Escherichia coli 5A 5.15 L2014
F11R-01-BEN Locust Creek
Aquatic Life Benthic-Macroinvertebrate Bioassessments 5A 6.59 L2010
F11R-01-DO Little River
Aquatic Life Oxygen, Dissolved 5A 6.29 L2008
F11R-02-PH Beaverdam Creek
Aquatic Life pH 5A 8.47 L2012
F12R-05-DO Mechumps Creek
Aquatic Life Oxygen, Dissolved 5A 1.05 L2010
F12R-05-PH Mechumps Creek
Aquatic Life pH 5A 1.05 L2006
F12R-07-PH Crump Creek
Aquatic Life pH 5C 10.00 L2010
F12R-10-PH Millpond Creek
Aquatic Life pH 5C 3.02 L2012
F12R-11-PH Kersey Creek
Aquatic Life pH 5C 3.32 L2012
F12R-12-PH XJC - Crump Creek, UT
Aquatic Life pH 5C 1.96 L2012
F12R-13-PH Pollard Creek
Aquatic Life pH 5C 4.20 L2012
F13R-04-PCB Moncuin Creek, Webb Creek
Fish Consumption PCB in Fish Tissue 5A 12.12 L2010
F13R-06-DO Sullens Creek
Aquatic Life Oxygen, Dissolved 5C 4.60 L2012
F13R-06-PH Sullens Creek
Aquatic Life pH 5C 4.60 L2004
F13R-09-PH XDX - UT to XDW (Pamunkey River, UT)
Aquatic Life pH 5C 3.85 L2012
F13R-11-PH XDW - UT to Pamunkey River
Aquatic Life pH 5C 5.51 L2012
F13R-12-PH Judy Swamp
Aquatic Life pH 5C 3.33 L2012
F13R-13-HG Pamunkey River
Fish Consumption Mercury in Fish Tissue 5A 1.090 11.55 L2006
Mercury in Fish Tissue 5A 9.424 L2010
Appendix 1a - 72Final 2016

2016 Impaired Waters - 303(d) List
Category 5 - Waters needing Total Maximum Daily Load Study
York River Basin
Cause Group Code CauseCategory
TMDLDev.
Priority
Estuary(Sq. Miles)
Reservoir(Acres)
River(Miles)
InitialListDateImpaired Use
Water Name
Cause
F13R-13-PCB Pamunkey River
Fish Consumption PCB in Fish Tissue 5A 10.513 11.55 L2010
F13R-14-PH Mehixen Creek and tributary XIV
Aquatic Life pH 5C 6.44 L2012
F14E-05-EBEN Pamunkey River
Aquatic Life Estuarine Bioassessments 5A 5.272 L2010
F14R-01-DO Cohoke Mill Creek
Aquatic Life Oxygen, Dissolved 5C 7.38 L2010
F14R-02-DO Harrison Creek
Aquatic Life Oxygen, Dissolved 5C 2.80 L2014
F14R-04-PH XJD - Harrison Creek, UT
Aquatic Life pH 5C 0.16 L2012
F15R-01-BEN Ni River
Aquatic Life Benthic-Macroinvertebrate Bioassessments 5A 5.68 L2010
F15R-01-DO Brock Run
Aquatic Life Oxygen, Dissolved 5A 2.56 L2012
F15R-01-PH Brock Run
Aquatic Life pH 5A 3.21 L2014
F15R-02-DO Lewis Run
Aquatic Life Oxygen, Dissolved 5A 1.46 L2012
F15R-02-PH Unnamed tributary to Cool Spring Lake
Aquatic Life pH 5A 1.29 L2016
F15R-03-DO Unnamed tributary to Cool Spring Lake
Aquatic Life Oxygen, Dissolved 5A 1.29 L2012
F17L-01-HG Bowies Pond
Fish Consumption Mercury in Fish Tissue 5A 25.71 L2008
F18R-01-DO Ta River
Aquatic Life Oxygen, Dissolved 5C 3.76 L2010
F18R-02-PH Ta River
Aquatic Life pH 5C 3.76 L2010
F18R-03-BEN Matta River
Aquatic Life Benthic-Macroinvertebrate Bioassessments 5A 1.24 L2008
F20R-01-BEN Polecat Creek
Aquatic Life Benthic-Macroinvertebrate Bioassessments 5A 6.97 L2014
F20R-01-DO Polecat Creek
Aquatic Life Oxygen, Dissolved 5C 6.97 L2010
F20R-02-PH Polecat Creek
Aquatic Life pH 5C 5.31 L2014
Appendix 1a - 73Final 2016

2016 Impaired Waters - 303(d) List
Category 5 - Waters needing Total Maximum Daily Load Study
York River Basin
Cause Group Code CauseCategory
TMDLDev.
Priority
Estuary(Sq. Miles)
Reservoir(Acres)
River(Miles)
InitialListDateImpaired Use
Water Name
Cause
F21R-01-BEN Herring Creek
Aquatic Life Benthic-Macroinvertebrate Bioassessments 5A 4.75 L2008
F21R-01-HG Herring Creek
Fish Consumption Mercury in Fish Tissue 5A 7.23 L2006
F21R-02-BEN Reedy Creek
Aquatic Life Benthic-Macroinvertebrate Bioassessments 5A 12.69 L2014
F21R-02-HG Mattaponi River
Fish Consumption Mercury in Fish Tissue 5A 3.723 15.70 L2006
Mercury in Fish Tissue 5A 3.242 L2010
F21R-03-HG Reedy Creek and Reedy Millpond
Fish Consumption Mercury in Fish Tissue 5A 41.25 12.82 L2010
F21R-04-PH Chapel Creek
Aquatic Life pH 5C 4.64 L2008
F21R-05-BAC Herring Creek
Recreation Escherichia coli 5A 5.09 L2016
F21R-06-BAC Mattaponi River
Recreation Escherichia coli 5A 8.00 L2016
F22L-01-HG Collins Pond
Fish Consumption Mercury in Fish Tissue 5A 63.93 L2010
F22R-02-PH Root Swamp
Aquatic Life pH 5C 7.83 L2006
F22R-03-DO Unnamed tributary to Root Swamp
Aquatic Life Oxygen, Dissolved 5C 0.70 L2006
F22R-03-PH Unnamed tributary to Root Swamp
Aquatic Life pH 5C 0.70 L2006
F22R-04-PH Beverly Run
Aquatic Life pH 5C 3.31 L2008
F22R-05-PH Doctors Creek
Aquatic Life pH 5C 2.32 L2008
F23E-02-BAC Mattaponi River
Recreation Escherichia coli 5A 1.756 L2016
F23R-01-BAC Garnetts Creek
Recreation Escherichia coli 5A 2.83 M, 2yr2010
F23R-03-DO Walkerton Branch
Aquatic Life Oxygen, Dissolved 5C 4.62 L2006
F23R-03-PH Walkerton Branch
Aquatic Life pH 5C 4.62 L2004
Appendix 1a - 74Final 2016

2016 Impaired Waters - 303(d) List
Category 5 - Waters needing Total Maximum Daily Load Study
York River Basin
Cause Group Code CauseCategory
TMDLDev.
Priority
Estuary(Sq. Miles)
Reservoir(Acres)
River(Miles)
InitialListDateImpaired Use
Water Name
Cause
F23R-04-BAC Aylett Creek
Recreation Escherichia coli 5A 6.83 M, 2yr2012
F23R-04-PH Aylett Creek
Aquatic Life pH 5C 6.83 L2012
F23R-06-PCB Mattaponi River
Fish Consumption PCB in Fish Tissue 5A 0.159 4.72 L2006
PCB in Fish Tissue 5A 6.806 L2010
PCB in Fish Tissue 5A 10.98 L2010
F23R-08-BAC Dickeys Swamp
Recreation Escherichia coli 5A 4.33 L2014
F23R-09-BAC Market Swamp
Recreation Escherichia coli 5A 2.01 L2014
F23R-10-BAC XJG - Dickeys Swamp, UT
Recreation Escherichia coli 5A 1.99 L2014
F23R-11-BAC Dogwood Fork
Recreation Escherichia coli 5A 2.91 L2014
F23R-12-BAC XDN - Garnetts Creek, UT
Recreation Escherichia coli 5A 2.53 L2016
F24R-03-BAC Courthouse Creek
Recreation Escherichia coli 5A 0.72 L2016
F24R-03-DO Courthouse Creek
Aquatic Life Oxygen, Dissolved 5A 0.72 L2014
F25R-01-DO Tastine Swamp and Little Tastine Swamp
Aquatic Life Oxygen, Dissolved 5C 6.25 L2016
F25R-02-DO Tastine Swamp
Aquatic Life Oxygen, Dissolved 5C 2.15 L2010
F26E-01-PCB York River, Queens Creek, Kings Creek
Fish Consumption PCB in Fish Tissue 5A 0.503 L2002
PCB in Fish Tissue 5A 57.392 L2006
F26E-06-SF Fox Creek
Shellfishing Fecal Coliform 5B 0.016 L2006
F26E-10-SF Carter Creek
Shellfishing Fecal Coliform 5B 0.025 L2004
Fecal Coliform 5B 0.023 L2012
F26L-01-DO Waller Mill Reservoir
Aquatic Life Oxygen, Dissolved 5A 287.70 L2006
F26R-01-BAC Carter Creek
Recreation Fecal Coliform 5A 3.38 L2004
Appendix 1a - 75Final 2016

2016 Impaired Waters - 303(d) List
Category 5 - Waters needing Total Maximum Daily Load Study
York River Basin
Cause Group Code CauseCategory
TMDLDev.
Priority
Estuary(Sq. Miles)
Reservoir(Acres)
River(Miles)
InitialListDateImpaired Use
Water Name
Cause
F26R-01-BEN Carter Creek
Aquatic Life Benthic-Macroinvertebrate Bioassessments 5A 3.38 L2004
F26R-02-BEN XEA - Bland Creek, UT
Aquatic Life Benthic-Macroinvertebrate Bioassessments 5A 1.23 L2008
F26R-04-BEN Bird Creek
Aquatic Life Benthic-Macroinvertebrate Bioassessments 5A 2.47 L2012
F27E-06-BAC York River - Yorktown Beach
Recreation Enterococcus 5A 0.024 L2016
F27E-07-BAC York River - Gloucester Point Beach
Recreation Enterococcus 5A 0.018 L2016
VA DEQ is transitioning from Fecal Coliform bacteria to Escherichia coli (fresh water) and Enterococci (salt water) for assessing the Recreation Use.
TMDL Development Priorities are: H (High) = formal EPA priority to be addressed with a plan by 2022; M (Medium) = DEQ priority that may be addressed with a plan by 2022; or L (Low) = not prioritized to be addressed with a plan by 2022. Within the H or M priority there may be "2yr" noted which means the priority is to be addressed within the two next years.
Multiple listings are due to the same impairments for different uses and/or different initial listing dates for adjacent waters.
Appendix 1a - 76Final 2016

2016 Impaired Waters - 303(d) List
Category 5 - Waters needing Total Maximum Daily Load Study
New River Basin
Cause Group Code CauseCategory
TMDLDev.
Priority
Estuary(Sq. Miles)
Reservoir(Acres)
River(Miles)
InitialListDateImpaired Use
Water Name
Cause
N01R-01-BAC Big Horse Creek
Recreation Escherichia coli 5A 7.90 M2004
Fecal Coliform 5A 7.90 M2004
N01R-02-BAC Little Helton Creek
Recreation Fecal Coliform 5A 6.30 M2004
Escherichia coli 5A 6.30 M2010
N02R-02-BAC New River and Grassy Creek
Recreation Fecal Coliform 5A 8.92 M2004
Escherichia coli 5A 12.56 M2010
Escherichia coli 5A 5.98 M2012
Escherichia coli 5A 1.13 M2014
N02R-02-HG New River
Fish Consumption Mercury in Fish Tissue 5A 25.04 L2006
Mercury in Fish Tissue 5A 1.47 L2008
Mercury in Fish Tissue 5A 3.61 L2010
N02R-03-BAC Wilson Creek
Recreation Fecal Coliform 5A 8.90 M2004
Escherichia coli 5A 8.90 M2010
N03R-01-BAC Fox Creek
Recreation Fecal Coliform 5A 7.65 M2004
Escherichia coli 5A 19.11 M2010
N04R-02-BAC Little River
Recreation Escherichia coli 5A 6.55 M2012
N04R-03-BAC Peach Bottom Creek
Recreation Fecal Coliform 5A 2.81 M2004
Escherichia coli 5A 2.81 M2006
Escherichia coli 5A 13.86 M2012
Escherichia coli 5A 5.34 M2016
N04R-07-BAC Saddle Creek
Recreation Escherichia coli 5A 3.17 M2006
N05R-01-BEN Elk Creek
Aquatic Life Benthic-Macroinvertebrate Bioassessments 5A 9.38 L2008
N06R-03-BAC Meadow Creek & New River
Recreation Escherichia coli 5A 5.38 M2004
Escherichia coli 5A 10.53 M2010
Escherichia coli 5A 5.03 M2014
N06R-04-BAC Brush Creek
Recreation Escherichia coli 5A 7.29 M2014
N07R-01-BAC Crooked Creek
Recreation Fecal Coliform 5A 23.54 M2004
Escherichia coli 5A 27.90 M2010
Appendix 1a - 77Final 2016

2016 Impaired Waters - 303(d) List
Category 5 - Waters needing Total Maximum Daily Load Study
New River Basin
Cause Group Code CauseCategory
TMDLDev.
Priority
Estuary(Sq. Miles)
Reservoir(Acres)
River(Miles)
InitialListDateImpaired Use
Water Name
Cause
N07R-01-TEMP Crooked Creek
Aquatic Life Temperature, water 5A 4.36 M2010
N08R-01-BAC New River
Recreation Fecal Coliform 5A 4.37 M2004
Escherichia coli 5A 0.61 M2006
Escherichia coli 5A 4.37 M2010
Escherichia coli 5A 1.43 M2010
Escherichia coli 5A 13.08 M2016
N08R-03-BAC Shorts Creek and Unnamed Tributary
Recreation Fecal Coliform 5A 7.07 M2004
Fecal Coliform 5A 3.88 M2006
Escherichia coli 5A 10.95 M2010
Escherichia coli 5A 3.31 M2012
N09R-03-BEN Dean Branch
Aquatic Life Benthic-Macroinvertebrate Bioassessments 5A 1.92 L2016
N10R-01-TEMP Reed Creek
Aquatic Life Temperature, water 5A 1.43 L2012
N11R-02-BEN Reed Creek tributary
Aquatic Life Benthic-Macroinvertebrate Bioassessments 5A 2.67 M2010
N13R-01-BAC Big Reed Island Creek
Recreation Escherichia coli 5A 19.85 M, 2yr2008
N13R-01-BEN Big Reed Island Creek
Aquatic Life Benthic-Macroinvertebrate Bioassessments 5A 19.85 H, 2yr2008
N13R-02-BAC Snake Creek
Recreation Escherichia coli 5A 3.54 M, 2yr2014
N14R-01-BAC Big Reed Island Creek
Recreation Fecal Coliform 5A 7.55 H, 2yr2004
Escherichia coli 5A 13.81 H, 2yr2010
Fecal Coliform 5A 13.81 H, 2yr2014
N14R-02-BAC Greasy Creek
Recreation Escherichia coli 5A 13.63 H, 2yr2008
N14R-03-BAC Big Reed Island Creek
Recreation Escherichia coli 5A 9.85 L2008
N14R-03-BEN Island Creek
Aquatic Life Benthic-Macroinvertebrate Bioassessments 5A 13.35 H, 2yr2012
N15R-01-BAC Little Reed Island Creek
Recreation Escherichia coli 5A 35.98 H, 2yr2008
N15R-01-TEMP Little Reed Island Creek
Aquatic Life Temperature, water 5A 19.70 H, 2yr2008
Appendix 1a - 78Final 2016

2016 Impaired Waters - 303(d) List
Category 5 - Waters needing Total Maximum Daily Load Study
New River Basin
Cause Group Code CauseCategory
TMDLDev.
Priority
Estuary(Sq. Miles)
Reservoir(Acres)
River(Miles)
InitialListDateImpaired Use
Water Name
Cause
N16R-01-BAC Big Macks Creek
Recreation Escherichia coli 5A 3.78 H, 2yr2014
N18R-02-BAC Connellys Run
Recreation Escherichia coli 5A 2.85 H, 2yr2010
N18R-03-BAC Plum Creek
Recreation Escherichia coli 5A 4.72 H, 2yr2010
N22R-02-BAC Stroubles Creek
Recreation Escherichia coli 5A 5.08 H, 2yr2006
Escherichia coli 5A 2.11 H, 2yr2010
N22R-04-BAC Toms Creek
Recreation Escherichia coli 5A 6.13 H, 2yr2014
N22R-04-TEMP Toms Creek
Aquatic Life Temperature, water 5C 5.71 L2008
Temperature, water 5C 6.13 L2012
Temperature, water 5C 4.56 L2014
N22R-05-BAC New River
Recreation Escherichia coli 5A 9.78 L2016
N22R-06-BEN Unnamed Tributaries XEJ and XEH to Slate Branch
Aquatic Life Benthic-Macroinvertebrate Bioassessments 5A 2.51 M2008
N23R-01-BAC Sinking Creek
Recreation Escherichia coli 5A 21.03 H, 2yr2010
N25R-01-BAC Walker Creek
Recreation Escherichia coli 5A 33.53 H2006
Fecal Coliform 5A 25.07 H2006
Escherichia coli 5A 4.40 H2010
N26R-01-BAC East Wilderness Creek, Nobusiness Creek and Kimberling Creek
Recreation Fecal Coliform 5A 6.83 H2002
Escherichia coli 5A 10.23 H2010
Escherichia coli 5A 6.83 H2014
Escherichia coli 5A 2.53 H2016
N27R-01-BAC Little Walker Creek
Recreation Escherichia coli 5A 17.48 H, 2yr2006
N29R-01-BAC New River
Recreation Escherichia coli 5A 13.67 H, 2yr2014
Appendix 1a - 79Final 2016

2016 Impaired Waters - 303(d) List
Category 5 - Waters needing Total Maximum Daily Load Study
New River Basin
Cause Group Code CauseCategory
TMDLDev.
Priority
Estuary(Sq. Miles)
Reservoir(Acres)
River(Miles)
InitialListDateImpaired Use
Water Name
Cause
N29R-01-PCB New River, Reed Creek, Claytor Lake, Peak Creek, Stony Creek, Walker Creek, And Unknown Tributary XAG.
Fish Consumption PCB in Fish Tissue 5A 295.02 55.92 H2002
PCB in Fish Tissue 5A 0.51 H2006
PCB in Fish Tissue 5A 4,009.54 34.38 H2006
PCB in Fish Tissue 5A 8.37 H2010
PCB in Water Column 5A 8.39 H2014
PCB in Water Column 5A 3.20 H2016
PCB in Water Column 5A 3.49 H2016
PCB in Fish Tissue 5A 5.85 H2016
N30R-01-BAC Wolf Creek and Tributaries
Recreation Fecal Coliform 5A 9.11 H2002
Escherichia coli 5A 14.36 H2006
Escherichia coli 5A 3.80 H2006
Escherichia coli 5A 9.11 H2006
Escherichia coli 5A 1.89 H2010
Escherichia coli 5A 1.89 H2014
N30R-01-BEN Little Creek
Aquatic Life Benthic-Macroinvertebrate Bioassessments 5A 1.89 M2010
N32R-00-BAC Clear Fork
Recreation Escherichia coli 5A 8.94 M2012
N32R-01-BAC Wolf Creek
Recreation Escherichia coli 5A 5.61 H2006
Escherichia coli 5A 16.71 H2006
N32R-01-TEMP Wolf Creek
Aquatic Life Temperature, water 5C 7.91 M2014
N33R-01-BAC Laurel Creek
Recreation Fecal Coliform 5A 1.64 H2002
Escherichia coli 5A 1.64 H2006
Escherichia coli 5A 6.56 H2012
N33R-01-TEMP Dry Fork
Aquatic Life Temperature, water 5A 5.24 M2012
N34R-01-BAC Rich Creek
Recreation Escherichia coli 5A 2.85 H, 2yr2008
N35R-01-BAC Adair Run
Recreation Escherichia coli 5A 0.37 H, 2yr2010
N36R-01-CDANE Bluestone River
Fish Consumption Chlordane 5A 0.62 L2004
N36R-01-PCB Bluestone River
Fish Consumption PCB in Fish Tissue 5A 13.62 H, 2yr2002
PCB in Water Column 5A 1.48 H, 2yr2010
PCB in Water Column 5A 2.99 H, 2yr2012
Appendix 1a - 80Final 2016

2016 Impaired Waters - 303(d) List
Category 5 - Waters needing Total Maximum Daily Load Study
New River Basin
Cause Group Code CauseCategory
TMDLDev.
Priority
Estuary(Sq. Miles)
Reservoir(Acres)
River(Miles)
InitialListDateImpaired Use
Water Name
Cause
N37R-02-BEN Laurel Fork
Aquatic Life Benthic-Macroinvertebrate Bioassessments 5C 8.30 L2014
N37R-02-DO Laurel Fork
Aquatic Life Oxygen, Dissolved 5C 8.30 L2010
VA DEQ is transitioning from Fecal Coliform bacteria to Escherichia coli (fresh water) and Enterococci (salt water) for assessing the Recreation Use.
TMDL Development Priorities are: H (High) = formal EPA priority to be addressed with a plan by 2022; M (Medium) = DEQ priority that may be addressed with a plan by 2022; or L (Low) = not prioritized to be addressed with a plan by 2022. Within the H or M priority there may be "2yr" noted which means the priority is to be addressed within the two next years.
Multiple listings are due to the same impairments for different uses and/or different initial listing dates for adjacent waters.
Appendix 1a - 81Final 2016
Related Documents