30/08/2020-03/09/2020

Welcome message from author
This document is posted to help you gain knowledge. Please leave a comment to let me know what you think about it! Share it to your friends and learn new things together.
Transcript

30/08/2020-03/09/2020
Market Indices 1
Market Capitalization 2
Trading Aggregates 3
Investors' Trading Activity 4
Corporate Actions 7
Annex (1) 9
Annex (2) 10
Annex (3) 11
Annex (4) 12
Annex (5) 13
Page 1 Period: 30/08/2020-03/09/2020 Issued at 03/09/2020 19:48:49
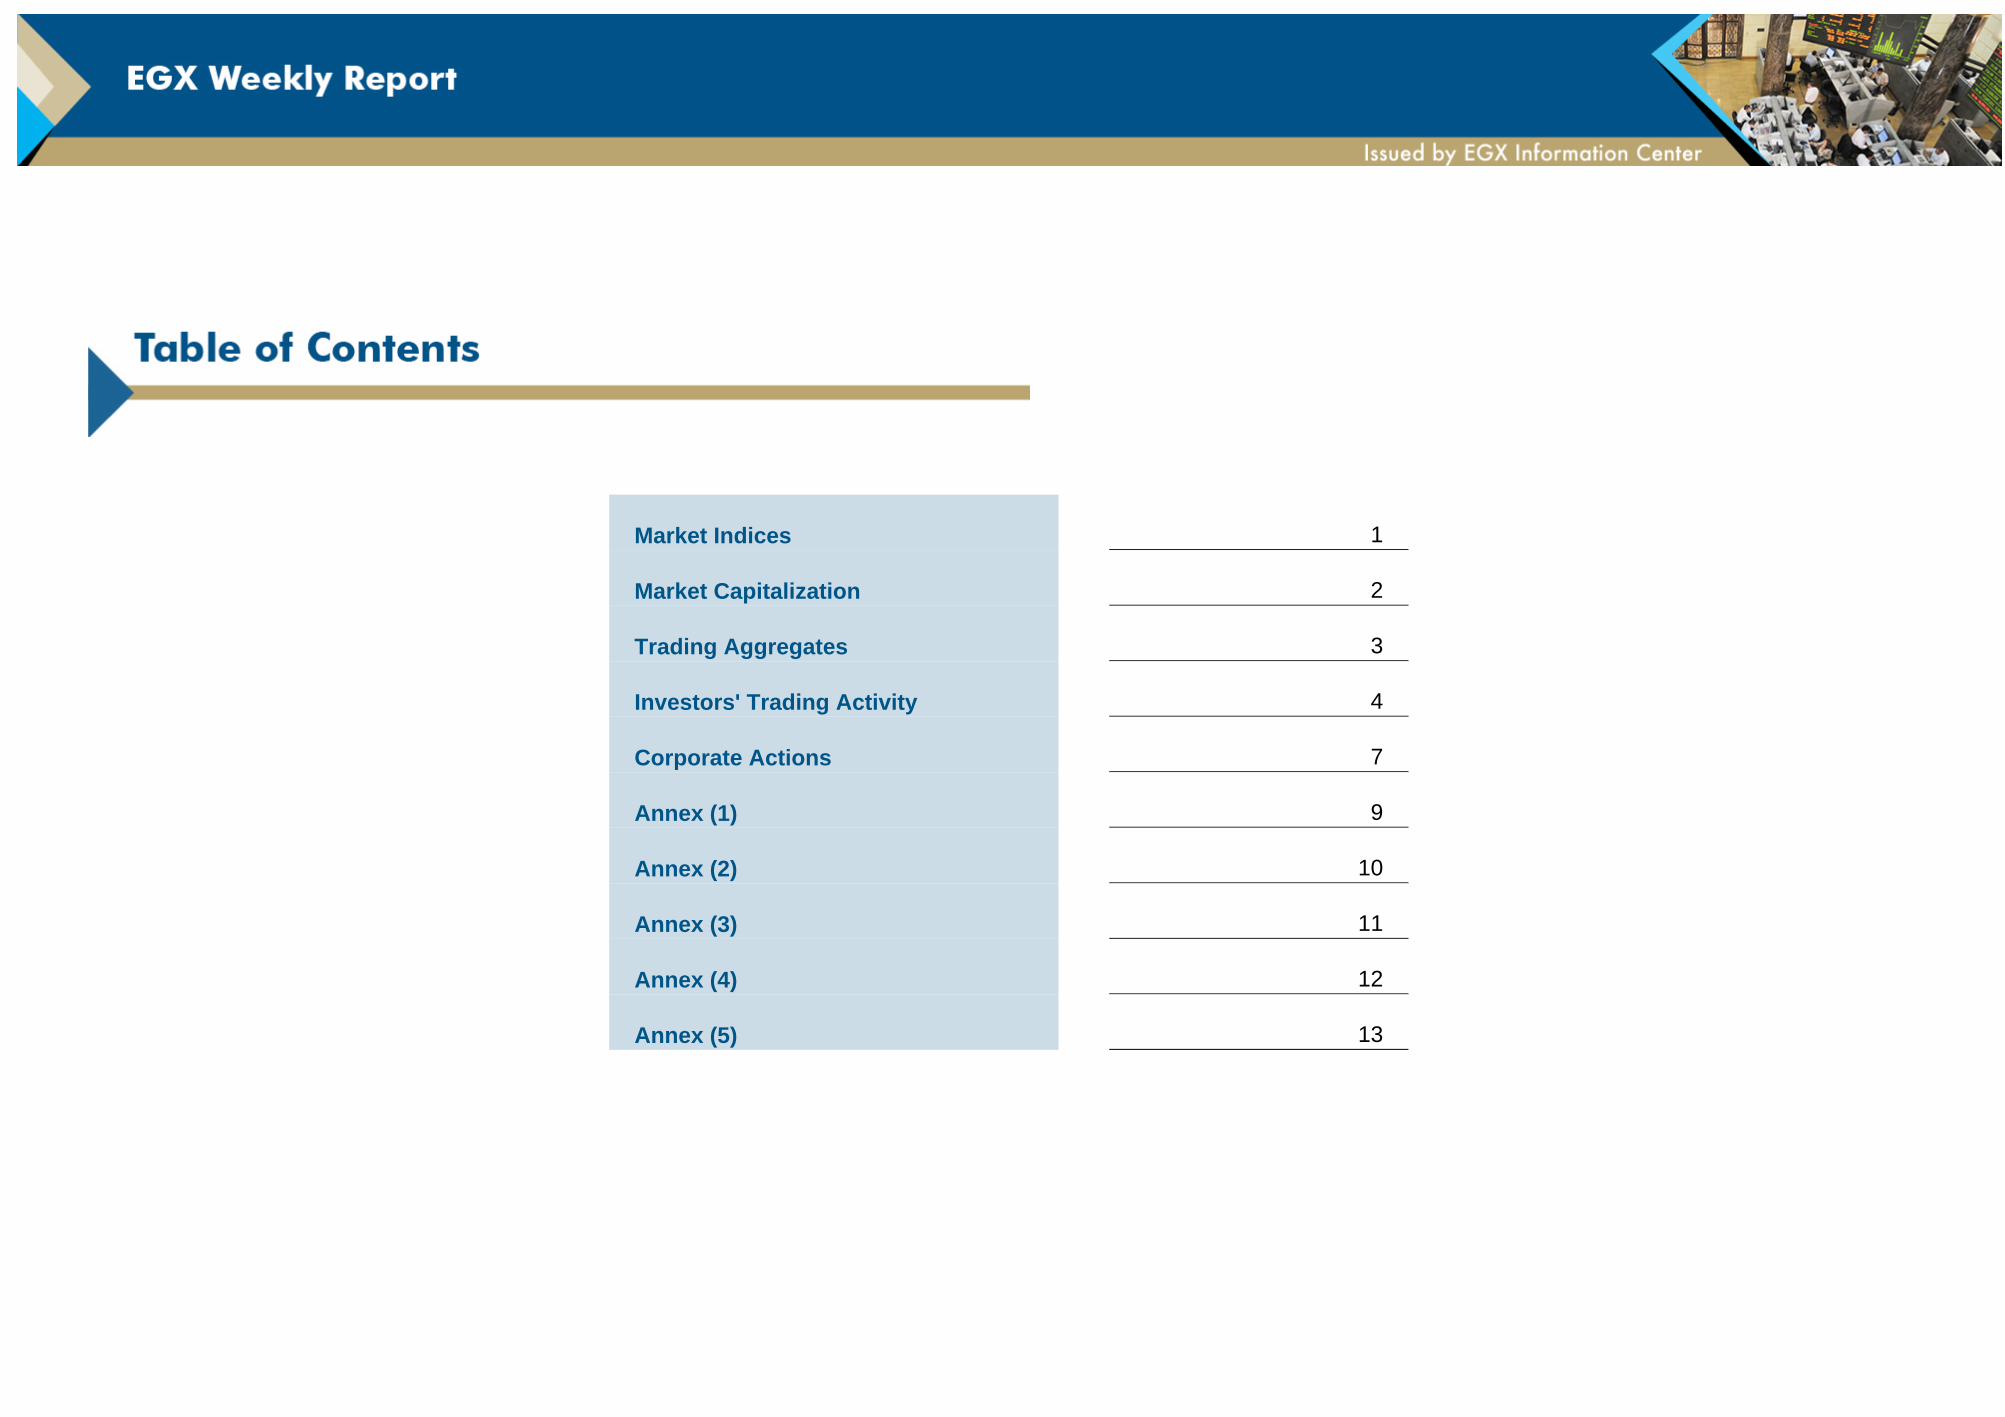
EGX 30 index closed at 11,180.81 points, recording a decline of 2.46%. EGX70 EWIindex posted 1.6% gain concluding the period at 1,849.26 points, while S&P index declined by 1.95% and concluded the period at 1,696.41 points.
EGX 30 index capped declined by 2.21% and concluded at 13,091.84 points, while EGX 100 EWI index rose by 0.6% and concluded the period at 2,748.22 points.
Index Open High Low Close Change
EGX30 (EGP) 11,462.45 11,490.42 11,180.09 11,180.81 -2.46%
EGX70 EWI 1,820.16 1,878.66 1,820.16 1,849.26 1.60%
EGX100 EWI 2,731.76 2,806.79 2,730.72 2,748.22 0.60%
S&P / EGX ESG 1,730.18 1,758.12 1,686.53 1,696.41 -1.95%
Nile Index 898.54 1,027.39 898.54 951.94 5.94%
EGX30 Capped 13,387.30 13,469.03 13,090.58 13,091.84 -2.21%
EGX50 EWI 2,038.93 2,076.83 2,009.14 2,013.09 -1.27%
EGX 30 Index
Date
24 25 26 27 28 29 30 31 01 02 03August 2020 September
11,150
11,200
11,250
11,300
11,350
11,400
11,450
11,500
Performance of sectoral indices
IT , Media & Communication Services
Contracting & Construction Engineering
Trade & Distributors
Paper & Packaging
Textile & Durables
Shipping & Transportation Services
Basic Resources
Industrial Goods , Services and Automobiles
Education Services
Banks
Building Materials
Health Care & Pharmaceuticals
Real Estate
Non-bank financial services
Travel & Leisure
Food, Beverages and Tobacco
8.3%
5.3%
5.2%
4.9%
1.9%
1.3%
1.2%
0.3%
-0.9%
-0.9%
-1.1%
-1.5%
-2.5%
-2.9%
-4.4%

Page 2 Period: 30/08/2020-03/09/2020 Issued at 03/09/2020 19:48:49
Total market capitalization reached EGP 627.4 billion at end of period, representing a decrease of 0.5% over the period, as presented in the below table.
The below pie chart represents the market capitalization breakdown of listed stocks per sector.
Market Capitalization in EGP Billion Close Open % Change
Listed Stocks 627.4 630.5 -0.5%
- EGX 30 Stocks 321.8 329.2 -2.2%
- EGX 70 EWI Stocks 192.0 188.3 2.0%
- EGX 100 EWI Stocks 513.8 517.5 -0.7%
SME/NILEX Stocks 2.1 2.0 5.1%
Paid Capitalization in EGP Billion Close Open % Change
Listed Stocks 239.5 239.6 -0.0%
- EGX 30 Stocks 109.1 109.1 -0.0%
- EGX 70 EWI Stocks 63.9 63.9 -0.0%
- EGX 100 EWI Stocks 173.1 173.1 -0.0%
SME/NILEX Stocks 0.6 0.6 0.0%
Market Capitalization in EGP
23/08
/2020
24/08
/2020
25/08
/2020
26/08
/2020
27/08
/2020
30/08
/2020
31/08
/2020
01/09
/2020
02/09
/2020
03/09
/2020
Bar
s: L
iste
d S
tock
s
624B
626B
627B
628B
630B
632B
633B
634B
636B
Lin
e: SM
E S
tocks
1,800M
1,850M
1,900M
1,950M
2,000M
2,050M
2,100M
2,150M
2,200M
Breakdown of Market Capitalization
Banks, 27.52%
Real Estate, 10.44%
Basic Resources, 10.22%Non-bank financial services, 9.49%
Food, Beverages and Tobacco, 9.02%
IT , Media & Communication Servic...
Travel & Leisure, 4.66%
Health Care & Pharmaceuticals, 4....
Industrial Goods , Services and A...
Contracting & Construction Engine...
Shipping & Transportation Services...
Education Services, 1.87%
Building Materials, 1.80%
Textile & Durables, 1.29%
Trade & Distributors, 1.13%
Energy & Support Services, 0.90%
Utilities, 0.23%
Paper & Packaging, 0.19%
Main Stocks

Page 3 Period: 30/08/2020-03/09/2020 Issued at 03/09/2020 19:48:49
The total value traded recorded EGP 11.3 billion, while the total volume traded reached 2,741 million securities executed over 225 thousand transactions this week.
For the last week, the total value traded recorded EGP 9.9 billion, while the total volume traded reached 3,017 million securities executed over 250 thousand transactions.
Stocks trading accounted for 74.28% of the total value traded of the main market, while the remaining 25.72% were captured by bonds over the week.
Date
23/08/202024/08/2020
25/08/202026/08/2020
27/08/202030/08/2020
31/08/202001/09/2020
02/09/202003/09/2020
Dai
ly V
alue
Tra
ded
in E
GP
800M
1,200M
1,600M
2,000M
2,400M
2,800M
3,200M
3,600M
1, Listed Stocks 2, Unlisted Stocks (OTC) 3, Bonds 4, ETF
Week from 30/08/2020 to 03/09/2020 Week from 23/08/2020 to 27/08/2020
Markets EGP Value Trading Volume # of Trades EGP Value Trading Volume # of Trades
Listed Stocks incl. Nilex 8,198,430,435 2,725,077,763 224,353 8,209,153,155 2,886,584,296 249,116
Unlisted Stocks (OTC) 309,473,937 12,896,727 862 298,331,108 128,964,956 852
Bonds 2,812,752,882 2,736,148 29 1,389,760,421 1,339,999 27
ETF 1,215 100 1
Nilex 75,967,359 92,796,793 2,626 18,378,090 12,512,479 1,355
Total 11,320,658,469 2,740,710,738 225,245 9,897,244,684 3,016,889,251 249,995
Page 4 Period: 30/08/2020-03/09/2020 Issued at 03/09/2020 19:48:49
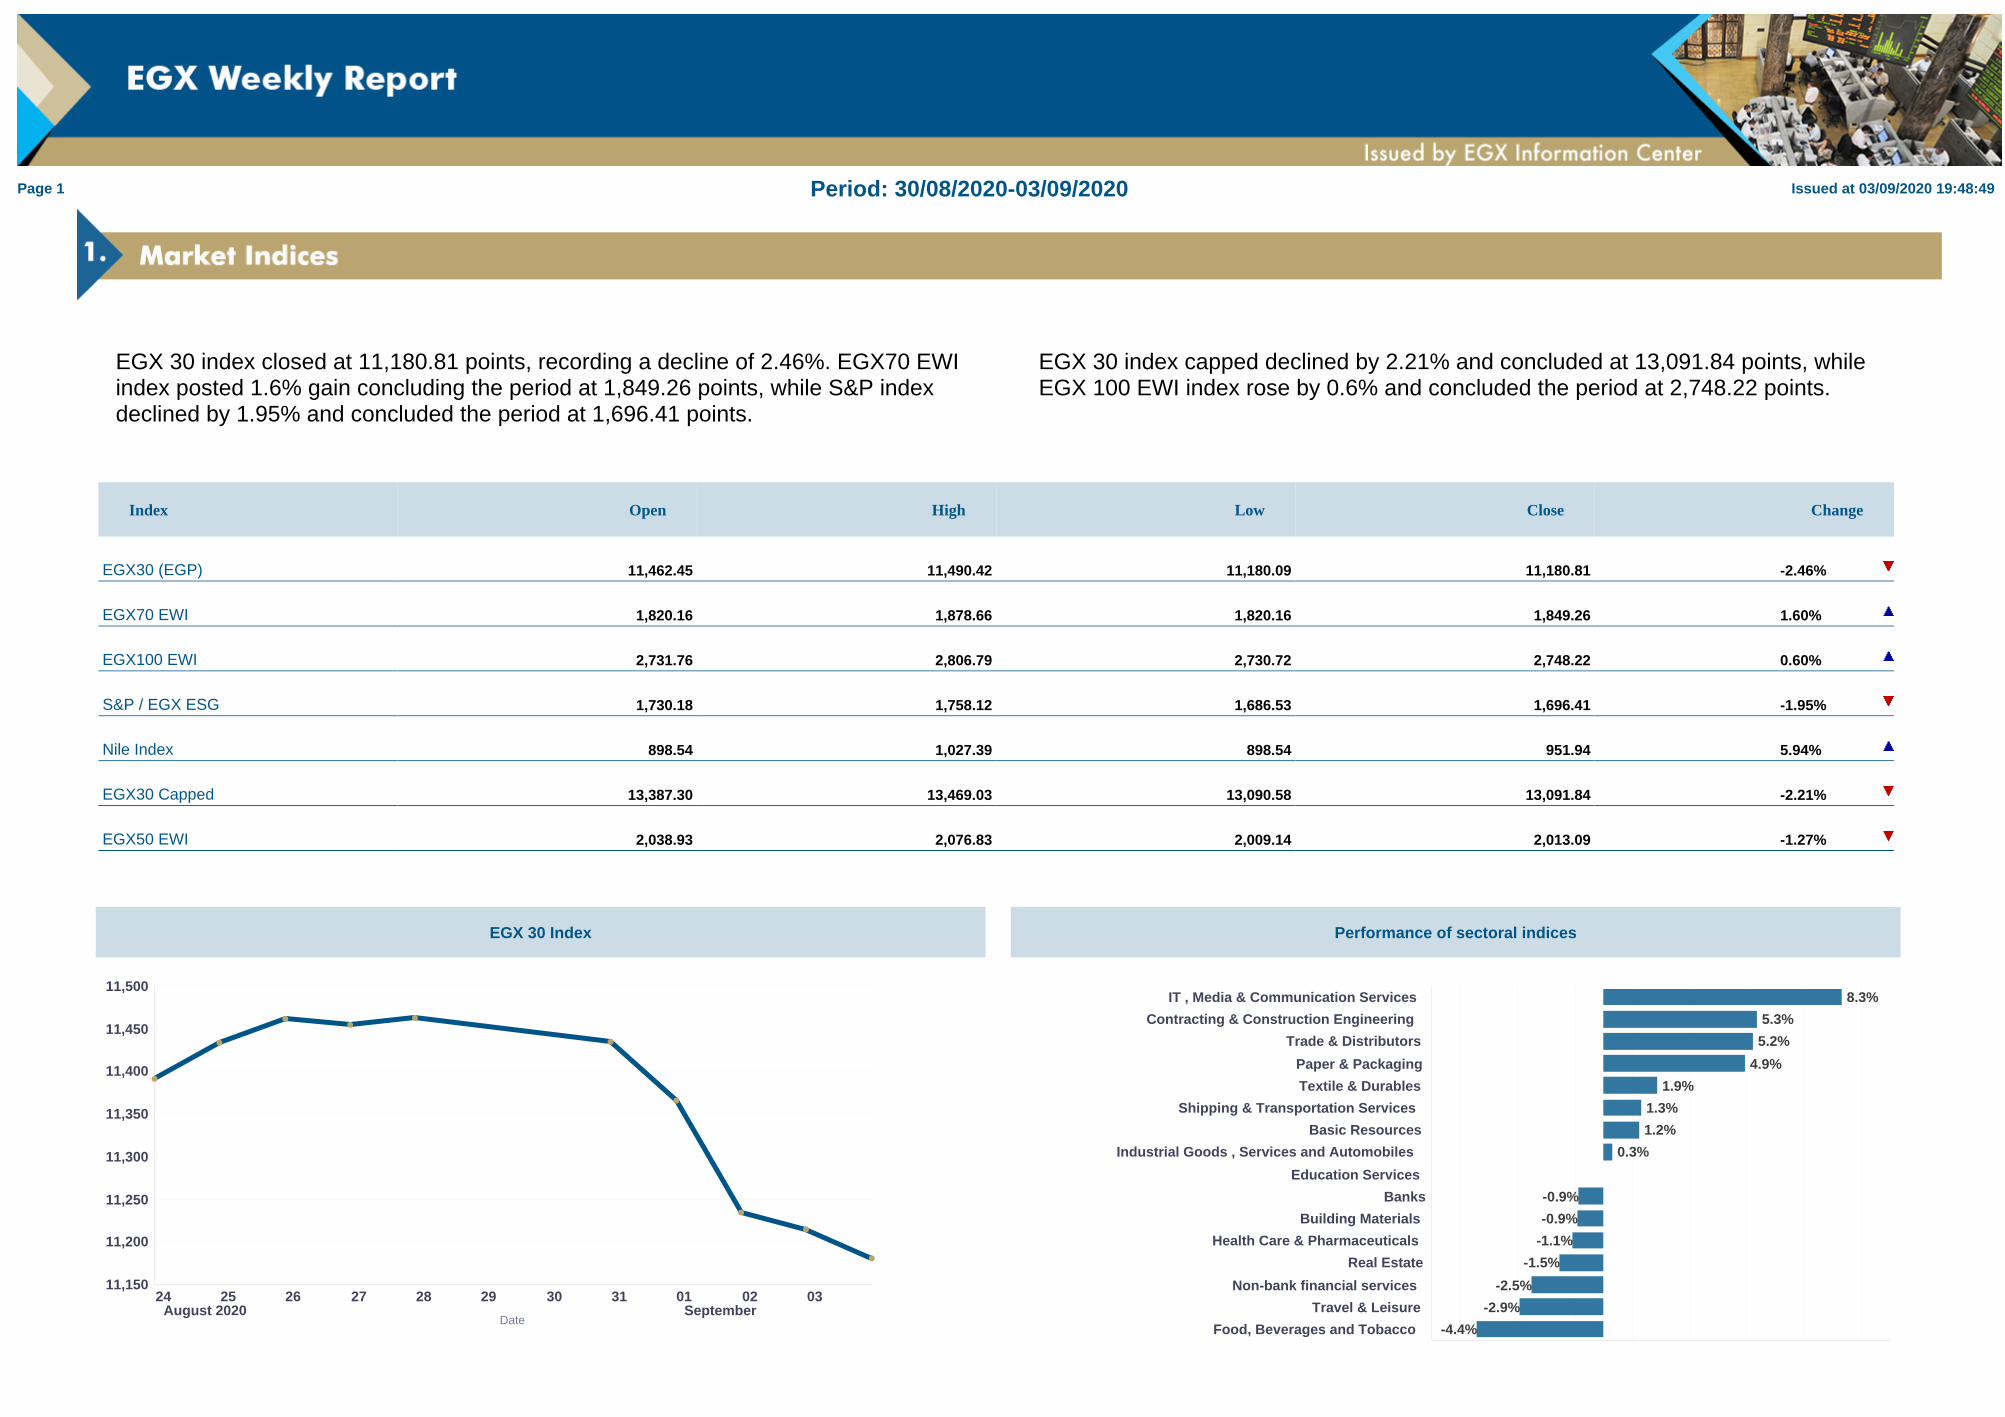
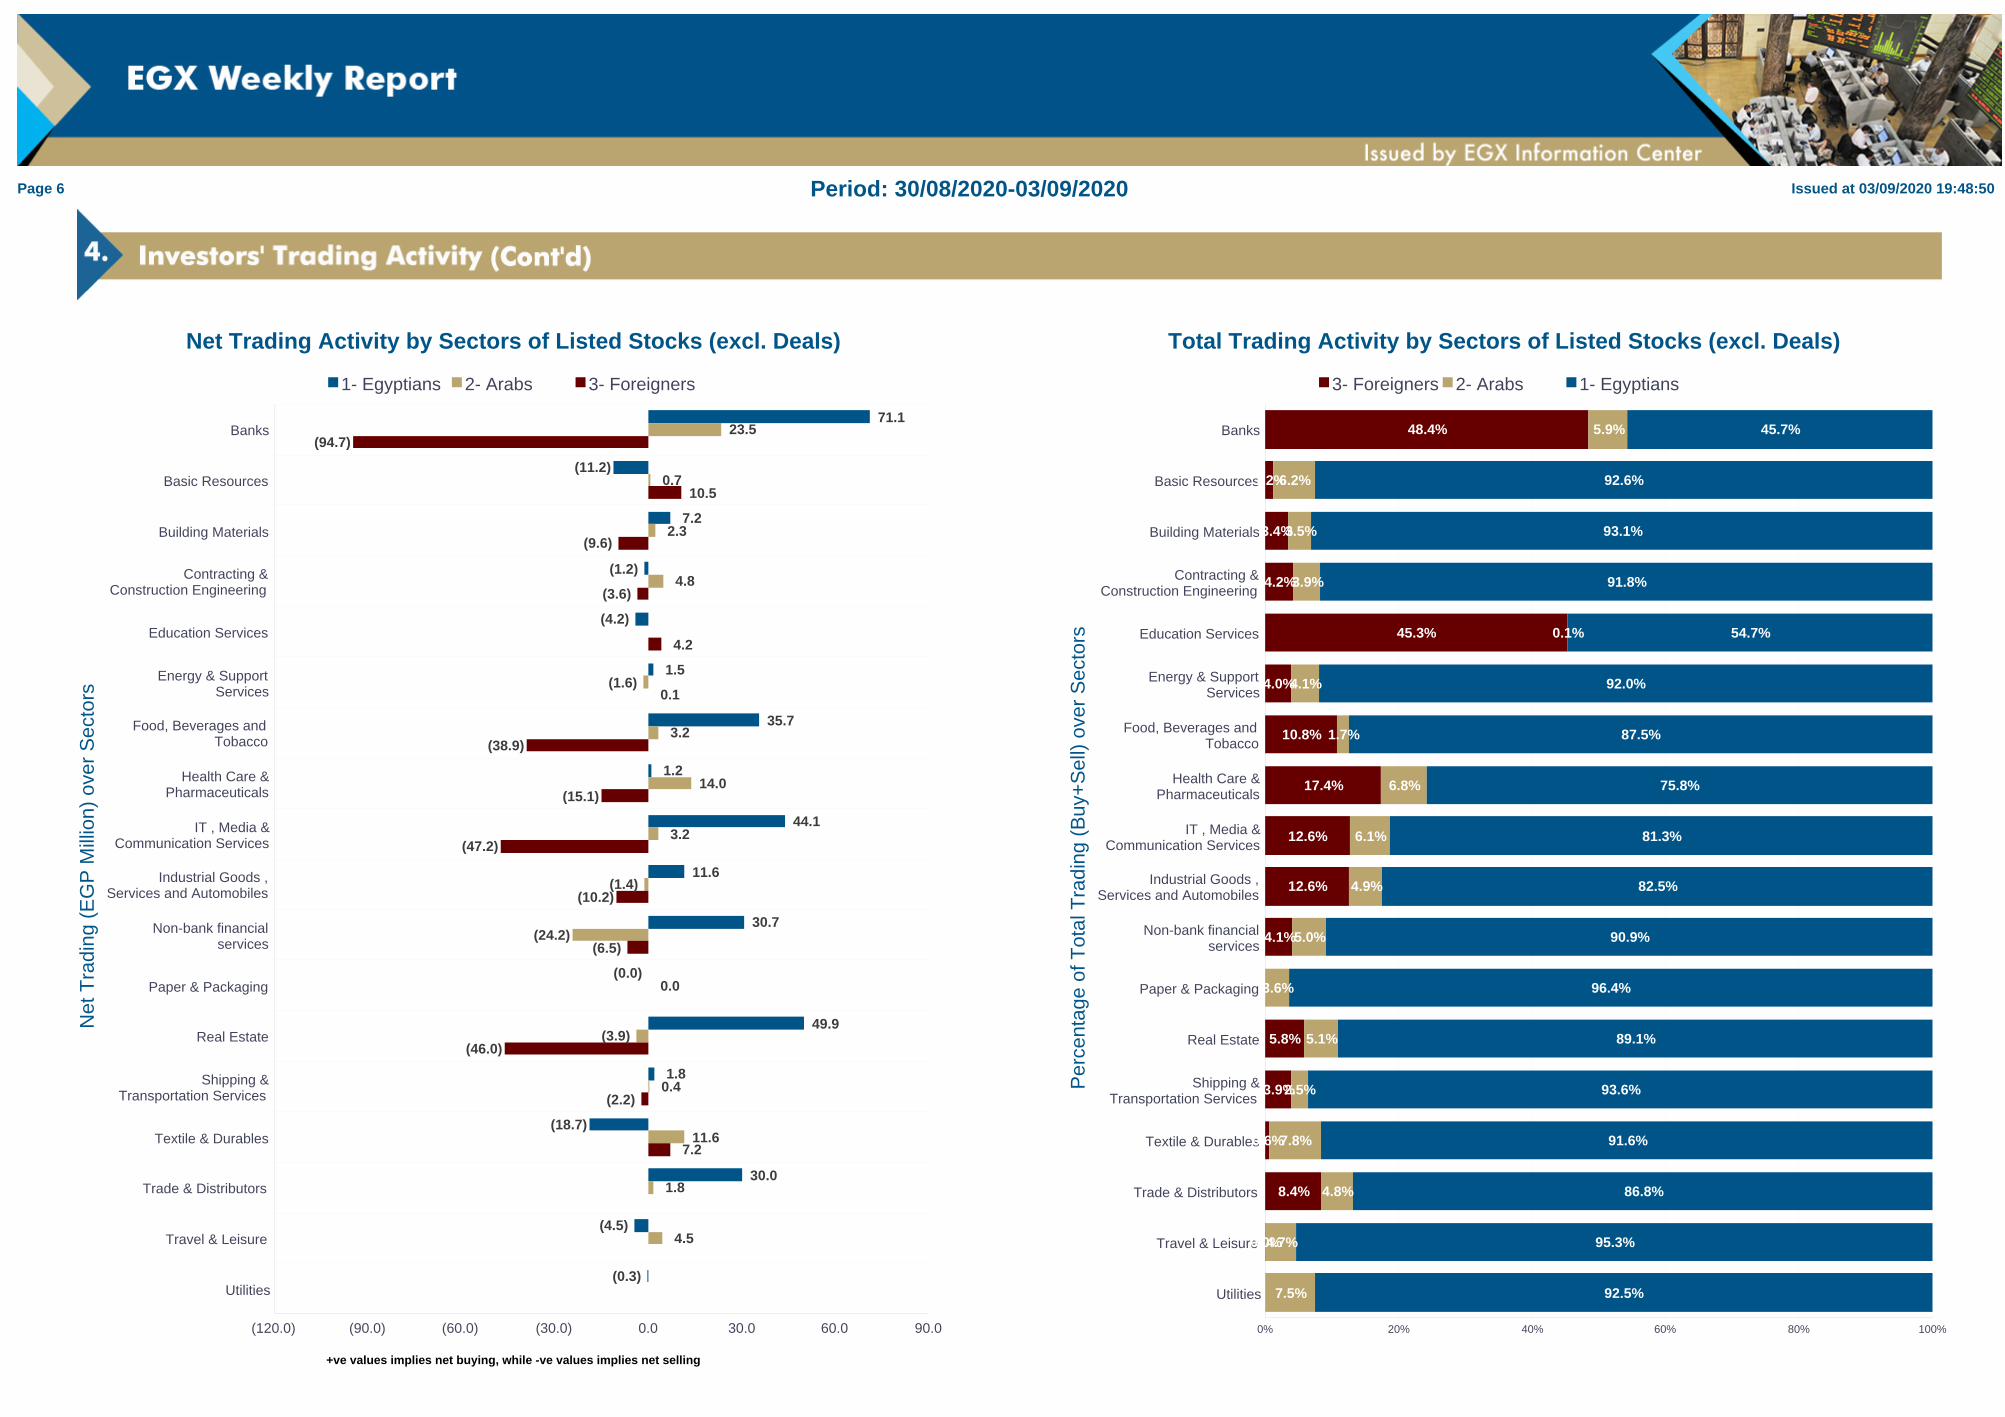
Egyptians represented 86.2% of the value traded in listed stocks after excluding deals during the period. Foreigners accounted for 8.4%, while Arabs captured 5.4%. Foreigners were net sellers, with a net of EGP 283.8 million, and Arabs were net buyers, with a net of EGP 39.2 million, after excluding deals in listed stocks.
Since the beginning of the year Egyptians represented 72.9% of the value traded in listed stocks after excluding deals, Foreigners accounted for 20.4%, while Arabs captured 6.7%. Foreigners were net sellers by EGP 11,574.1 million, and Arabs were net sellers by EGP 1,787.2 million, after excluding deals in listed stocks during this year since started.
- Institutional Trades in Listed Stocks Including Deals
Egyptians Arabs Foreigners
Institutions Buy Sell Net Buy Buy Sell Net Buy Buy Sell Net Buy
Banks 85.5 42.5 43.0 26.8 (26.8) 49.9 127.0 (77.1)
Companies 581.9 284.3 297.6 478.4 63.3 415.1 385.3 1,829.5 (1,444.2)
Funds 27.4 34.8 (7.4) 5.4 5.4 215.8 377.2 (161.4)
Others 4.7 5.7 (1.0) 8.8 (8.8) 8.4 7.8 0.6
Portfolio 323.0 364.5 (41.5)
Total 1,022.7 731.8 290.9 483.8 98.9 384.9 659.4 2,341.6 (1,682.1)
Listed Stocks Excluding Deals
Institutions Retail
Nationalities Buy Sell Buy + Sell Net Buy Buy Sell Buy + Sell Net Buy
Egyptians 821.1 731.8 1,552.9 89.3 4,939.2 4,784.0 9,723.1 155.2
Arabs 77.2 98.9 176.1 (21.8) 295.3 234.3 529.6 61.0
Foreigners 401.0 683.6 1,084.6 (282.6) 6.8 7.9 14.7 (1.1)
Total 1,299.3 1,514.3 2,813.6 (215.1) 5,241.2 5,026.1 10,267.4 215.1
Trading by Categories of Investors in EGP MillionListed Stocks including Deals
Institutions Retail
Nationalities Buy Sell Buy + Sell Net Buy Buy Sell Buy + Sell Net Buy
Egyptians 1,022.7 731.8 1,754.4 290.9 5,684.9 4,784.0 10,468.8 900.9
Arabs 483.8 98.9 582.8 384.9 310.1 234.3 544.4 75.8
Foreigners 659.4 2,341.6 3,001.0 (1,682.1) 37.6 7.9 45.5 29.7
Total 2,165.9 3,172.3 5,338.2 (1,006.4) 6,032.5 5,026.1 11,058.7 1,006.4
Bonds
Institutions Retail
Nationalities Buy Sell Buy + Sell Net Buy Buy Sell Buy + Sell Net Buy
Egyptians 1,602.0 2,727.2 4,329.2 (1,125.2) 5.2 5.2 (5.2)
Arabs 25.5 25.5 25.5 0.0
Foreigners 1,185.3 80.4 1,265.6 1,104.9 0.0
Total 2,812.8 2,807.6 5,620.3 5.2 5.2 5.2 (5.2)
OTC
Institutions Retail
Nationalities Buy Sell Buy + Sell Net Buy Buy Sell Buy + Sell Net Buy
Egyptians 211.2 168.4 379.5 42.8 88.0 128.6 216.6 (40.7)
Arabs 0.0 1.2 4.0 5.2 (2.8)
Foreigners 5.1 8.4 13.6 (3.3) 4.0 0.0 4.0 3.9
Total 216.3 176.8 393.1 39.5 93.1 132.7 225.8 (39.5)
Listed Stocks incl. Deals + Bonds + OTC
Institutions Retail
Nationalities Buy Sell Buy + Sell Net Buy Buy Sell Buy + Sell Net Buy
Egyptians 2,835.9 3,627.3 6,463.2 (791.5) 5,772.8 4,917.8 10,690.6 855.0
Arabs 509.3 98.9 608.2 410.4 311.4 238.3 549.7 73.1
Foreigners 1,849.8 2,430.4 4,280.2 (580.6) 41.5 7.9 49.5 33.6
Total 5,195.0 6,156.6 11,351.6 (961.7) 6,125.7 5,164.0 11,289.7 961.7

Page 5 Period: 30/08/2020-03/09/2020 Issued at 03/09/2020 19:48:49
Net Trading Activity by Markets (incl. Deals) Total Trading Activity by Markets (incl. Deals)
1- Listed Stocks 2- Bonds 3- OTC
Tot
al N
et A
ctiv
ity in
EG
P M
illio
n
(2,000.0)
(1,500.0)
(1,000.0)
(500.0)
0.0
500.0
1,000.0
1,500.01,191.8
(1,130.4)
2.1
460.7
(2.8)
(1,652.5)
1,104.9
0.6
1- Egyptians 2- Arabs 3- Non Arabs
Total Net Activity in EGP Million
Mar
ket
1-Listed
Stocks
2-Bonds
3- OTC
0% 20% 40% 60% 80% 100%
18.6%
22.5%
2.8%
6.9%
0.5%
0.8%
74.5%
77.0%
96.3%
3- Non Arabs 2- Arabs 1- Egyptians
Total Buy+Sell
1- Listed Stocks 2- Bonds 3- OTC
Ret
ail N
et A
ctiv
ity in
EG
P M
illio
n
-200
0
200
400
600
800
1,000900.9
(40.7)
75.8
(2.8)29.7 3.9
1- Egyptians 2- Arabs 3- Non Arabs
Retail Net Activity in EGP Million
Mar
ket
1-Listed
Stocks
2-Bonds
3- OTC
0% 20% 40% 60% 80% 100%
0.4%
1.8%
4.9%
2.3%
94.7%
100.0%
95.9%
3- Non Arabs 2- Arabs 1- Egyptians
Retail Buy+Sell
1- Listed Stocks 2- Bonds 3- OTC
Inst
itutio
nal N
et A
ctiv
ity in
EG
P M
illio
n
-2,000
-1,500
-1,000
-500
0
500
1,000
1,500
290.9
(1,125.2)
42.8
384.9
(1,682.1)
1,104.9
(3.3)
1- Egyptians 2- Arabs 3- Non Arabs
Institutional Net Activity in EGP Million
Mar
ket
1-Listed
Stocks
2-Bonds
3- OTC
0% 20% 40% 60% 80% 100%
56.2%
22.5%
3.4%
10.9%
0.5%
32.9%
77.0%
96.6%
3- Non Arabs 2- Arabs 1- Egyptians
Institutional Buy+Sell
+ve values implies net buying, while -ve values implies net selling
Page 6 Period: 30/08/2020-03/09/2020 Issued at 03/09/2020 19:48:50
Net Trading Activity by Sectors of Listed Stocks (excl. Deals) Total Trading Activity by Sectors of Listed Stocks (excl. Deals)
Net
Tra
ding
(E
GP
Mill
ion)
ove
r S
ecto
rs
Banks
Basic Resources
Building Materials
Contracting &Construction Engineering
Education Services
Energy & SupportServices
Food, Beverages andTobacco
Health Care &Pharmaceuticals
IT , Media &Communication Services
Industrial Goods ,Services and Automobiles
Non-bank financialservices
Paper & Packaging
Real Estate
Shipping &Transportation Services
Textile & Durables
Trade & Distributors
Travel & Leisure
Utilities
(120.0) (90.0) (60.0) (30.0) 0.0 30.0 60.0 90.0
71.1
(11.2)
7.2
(1.2)
(4.2)
1.5
35.7
1.2
44.1
11.6
30.7
(0.0)
49.9
1.8
(18.7)
30.0
(4.5)
(0.3)
23.5
0.7
2.3
4.8
(1.6)
3.2
14.0
3.2
(1.4)
(24.2)
0.0
(3.9)
0.4
11.6
1.8
4.5
(94.7)
10.5
(9.6)
(3.6)
4.2
0.1
(38.9)
(15.1)
(47.2)
(10.2)
(6.5)
(46.0)
(2.2)
7.2
1- Egyptians 2- Arabs 3- Foreigners
Per
cent
age
of T
otal
Tra
ding
(B
uy+
Sel
l) ov
er S
ecto
rs
Banks
Basic Resources
Building Materials
Contracting &Construction Engineering
Education Services
Energy & SupportServices
Food, Beverages andTobacco
Health Care &Pharmaceuticals
IT , Media &Communication Services
Industrial Goods ,Services and Automobiles
Non-bank financialservices
Paper & Packaging
Real Estate
Shipping &Transportation Services
Textile & Durables
Trade & Distributors
Travel & Leisure
Utilities
0% 20% 40% 60% 80% 100%
48.4%
1.2%
3.4%
4.2%
45.3%
4.0%
10.8%
17.4%
12.6%
12.6%
4.1%
5.8%
3.9%
0.6%
8.4%
0.0%
5.9%
6.2%
3.5%
3.9%
0.1%
4.1%
1.7%
6.8%
6.1%
4.9%
5.0%
3.6%
5.1%
2.5%
7.8%
4.8%
4.7%
7.5%
45.7%
92.6%
93.1%
91.8%
54.7%
92.0%
87.5%
75.8%
81.3%
82.5%
90.9%
96.4%
89.1%
93.6%
91.6%
86.8%
95.3%
92.5%
3- Foreigners 2- Arabs 1- Egyptians
+ve values implies net buying, while -ve values implies net selling

Page 7 Period: 30/08/2020-03/09/2020 Issued at 03/09/2020 19:48:50
Weekly Cash Dividends in EGP millionLast 12 weeks with dividends
Week Start Date (Last 12 weeks with dividends)
31/0
5/20
20
07/0
6/20
20
14/0
6/20
20
21/0
6/20
20
28/0
6/20
20
05/0
7/20
20
12/0
7/20
20
19/0
7/20
20
26/0
7/20
20
02/0
8/20
20
23/0
8/20
20
30/0
8/20
20
EG
P M
illio
n
0
400
800
1,200
1,600
2,000
2,400
198
43 20 74 64
2,155
20158
441 405
28 42
Weekly Capital Increase in EGP millionIncludes all types of capital increase
Week Start Date (Last 12 weeks with capital increase)
01/0
3/20
20
15/0
3/20
20
05/0
4/20
20
26/0
4/20
20
31/0
5/20
20
14/0
6/20
20
21/0
6/20
20
05/0
7/20
20
12/0
7/20
20
26/0
7/20
20
16/0
8/20
20
23/0
8/20
20
EG
P M
illio
n
0
200
400
600
800
1,000
1,200
25
222
553
5
980
615
17
227
145
740
0
100
Monthly Cash Dividends in EGP millionLast 12 months with dividends
Month (Last 12 months with dividends)
2019
-10
2019
-11
2019
-12
2020
-01
2020
-02
2020
-03
2020
-04
2020
-05
2020
-06
2020
-07
2020
-08
2020
-09
EG
P M
illio
n
0K
2K
4K
6K
8K
10K
12K
14K
16K
2,706 2,9642,295
83 45 206
13,518
487 299
2,774
433 42
Monthly Capital Increase in EGP millionIncludes all types of capital increase
Month (Last 12 months with capital increase)
2019
-08
2019
-09
2019
-10
2019
-11
2019
-12
2020
-01
2020
-02
2020
-03
2020
-04
2020
-06
2020
-07
2020
-08
EG
P M
illio
n
0
500
1,000
1,500
2,000
2,500
3,000
3,500
4,000
215 264
2,548
325
865
86
3,625
247
558
1,611
1,111
100
Page 8 Period: 30/08/2020-03/09/2020 Issued at 03/09/2020 19:48:50
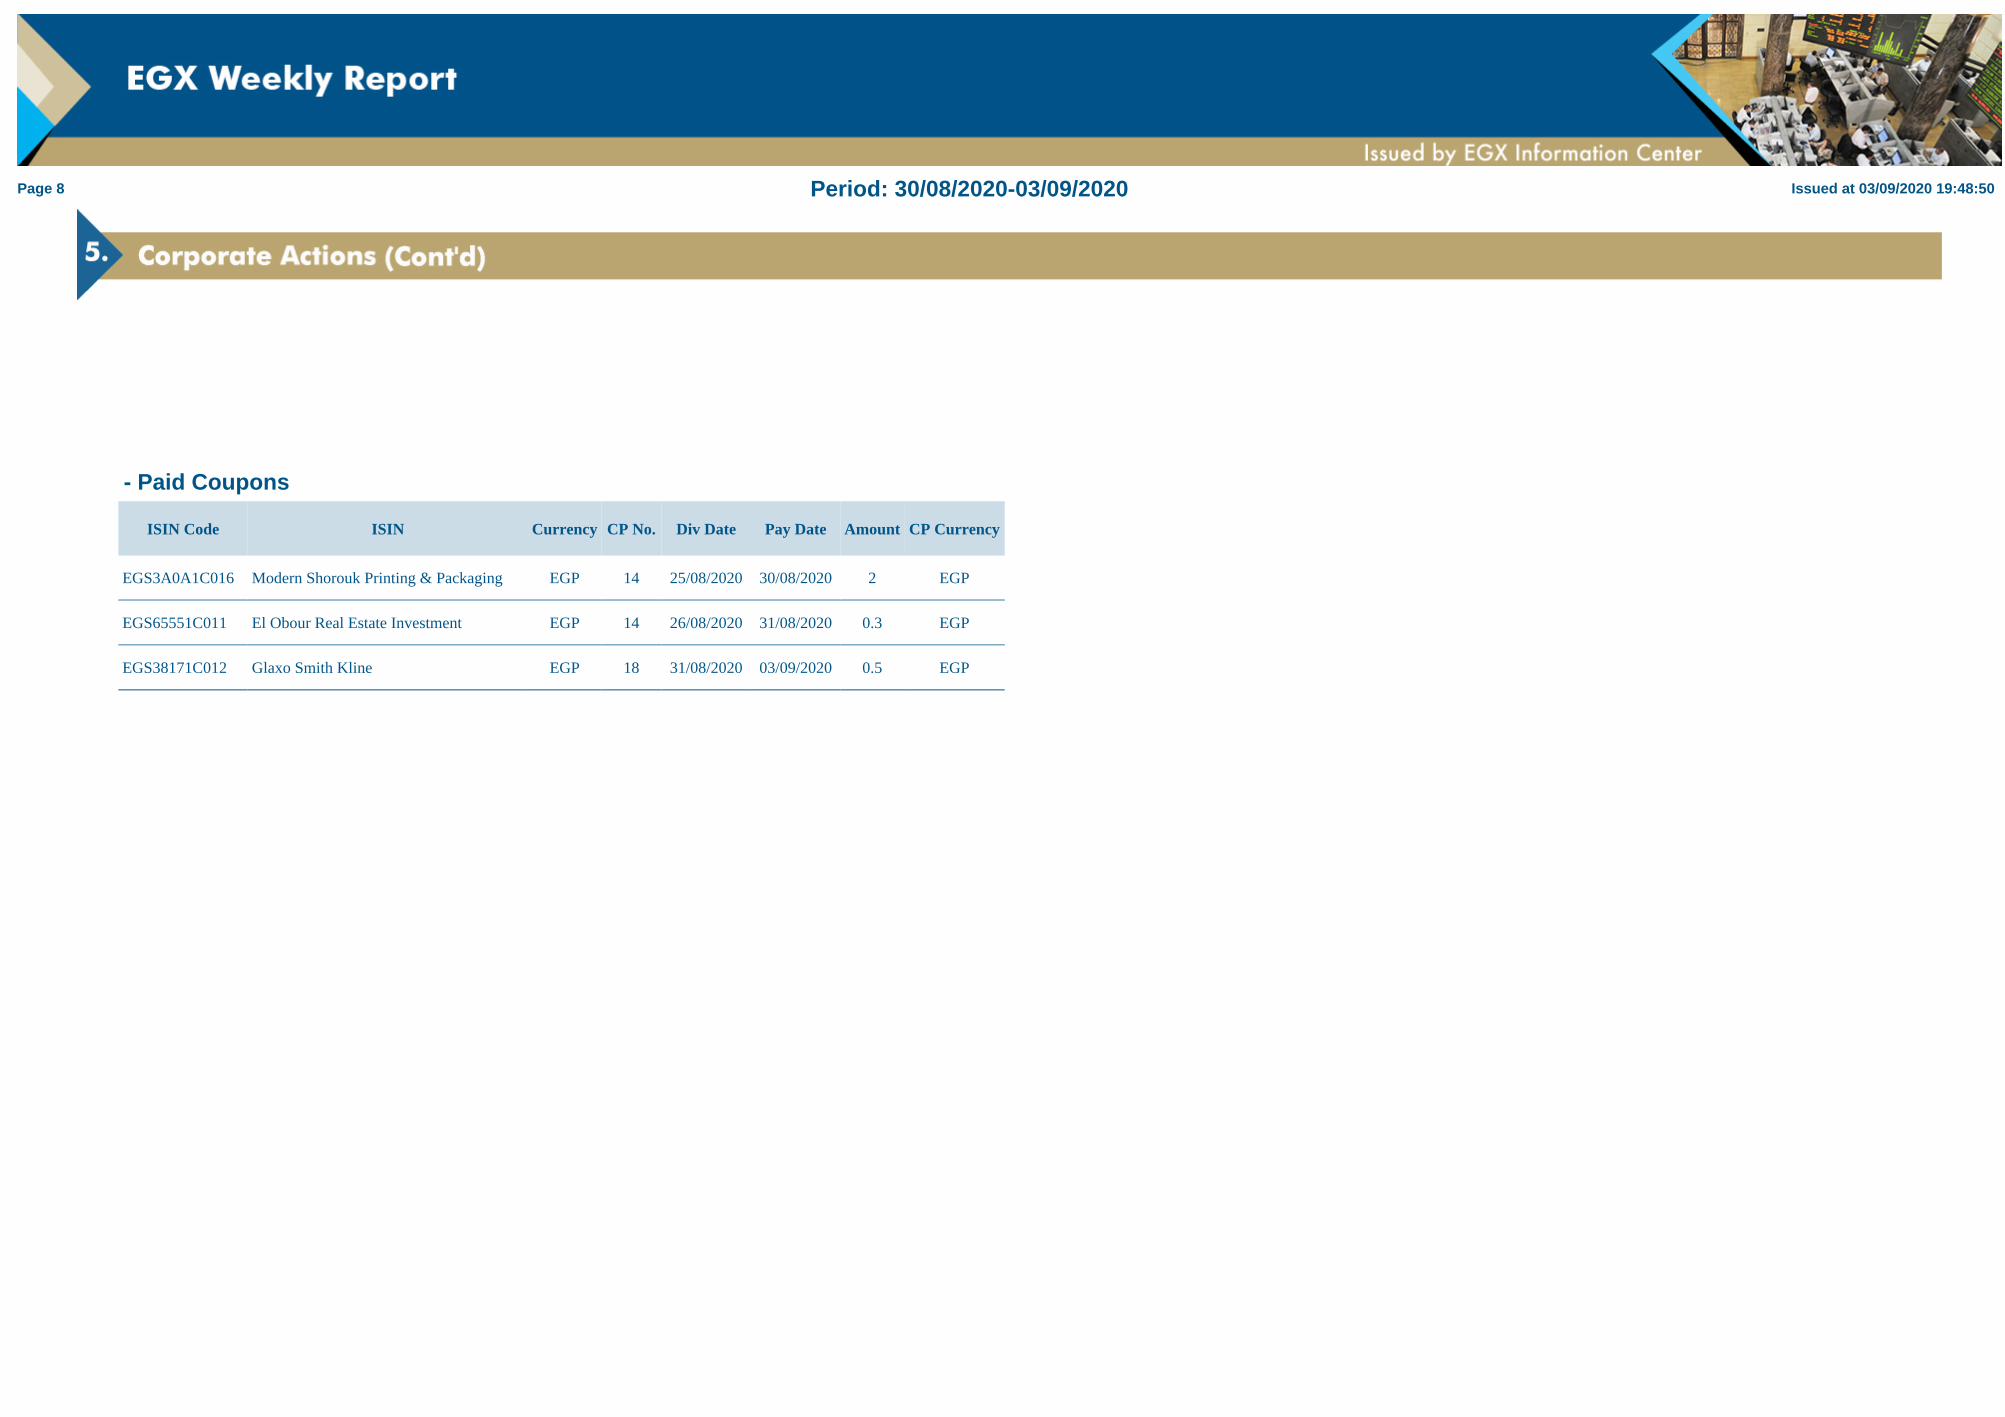
- Paid Coupons
ISIN Code ISIN Currency CP No. Div Date Pay Date Amount CP Currency
EGS3A0A1C016 Modern Shorouk Printing & Packaging EGP 14 25/08/2020 30/08/2020 2 EGP
EGS65551C011 El Obour Real Estate Investment EGP 14 26/08/2020 31/08/2020 0.3 EGP
EGS38171C012 Glaxo Smith Kline EGP 18 31/08/2020 03/09/2020 0.5 EGP

Page 9 Period: 30/08/2020-03/09/2020 Issued at 03/09/2020 19:48:50
- Trading of Listed Securities including Deals
Listed Stocks by Sectors
Sectors Trading Value in EGP Trading Volume # of Trades
Health Care & Pharmaceuticals 1,868,360,134 454,241,453 7,260
Textile & Durables 1,143,597,744 546,296,528 31,323
Real Estate 1,008,786,998 407,694,177 38,873
Non-bank financial services 971,026,270 627,558,924 29,822
Basic Resources 712,723,025 133,728,552 27,247
Food, Beverages and Tobacco 575,851,598 140,380,455 23,046
Banks 462,274,719 16,124,524 5,563
IT , Media & Communication Services 356,365,377 28,218,920 11,242
Travel & Leisure 256,016,919 83,149,986 10,921
Industrial Goods , Services and Automobiles 203,516,427 51,120,555 8,253
Trade & Distributors 189,838,677 56,943,586 6,220
Contracting & Construction Engineering 143,501,566 76,273,966 7,061
Building Materials 141,085,647 47,659,396 8,732
Energy & Support Services 65,718,530 21,761,772 2,931
Shipping & Transportation Services 51,086,928 26,139,100 3,428
Education Services 24,495,372 3,001,318 248
Paper & Packaging 21,914,523 4,746,887 2,018
Utilities 2,269,981 37,664 165
Total 8,198,430,435 2,725,077,763 224,353
Listed Securities by Types
Listed Securities Trading Value in EGP Trading Volume # of Trades
Stocks 8,198,430,435 2,725,077,763 224,353
Bonds 2,812,752,882 2,736,148 29
ETFs 1,215 100 1
Total 11,011,184,532 2,727,814,011 224,383
Listed Stocks By Indices
Indices Trading Value in EGP Trading Volume # of Trades
EGX 30 2,945,678,926 961,634,009 75,627
EGX 70 EWI 4,597,127,111 1,495,061,107 112,109
EGX100 EWI 7,542,806,037 2,456,695,116 187,736
Nile Index 75,866,971 92,760,123 2,608
S&P / EGX ESG 2,363,872,482 672,371,181 61,862
Listed Bonds by Types
Bond Types Trading Value in EGP Trading Volume # of Trades
Treasury (Primary Dealer) 2,812,752,882 2,736,148 29
Total 2,812,752,882 2,736,148 29
Page 10 Period: 30/08/2020-03/09/2020 Issued at 03/09/2020 19:48:50
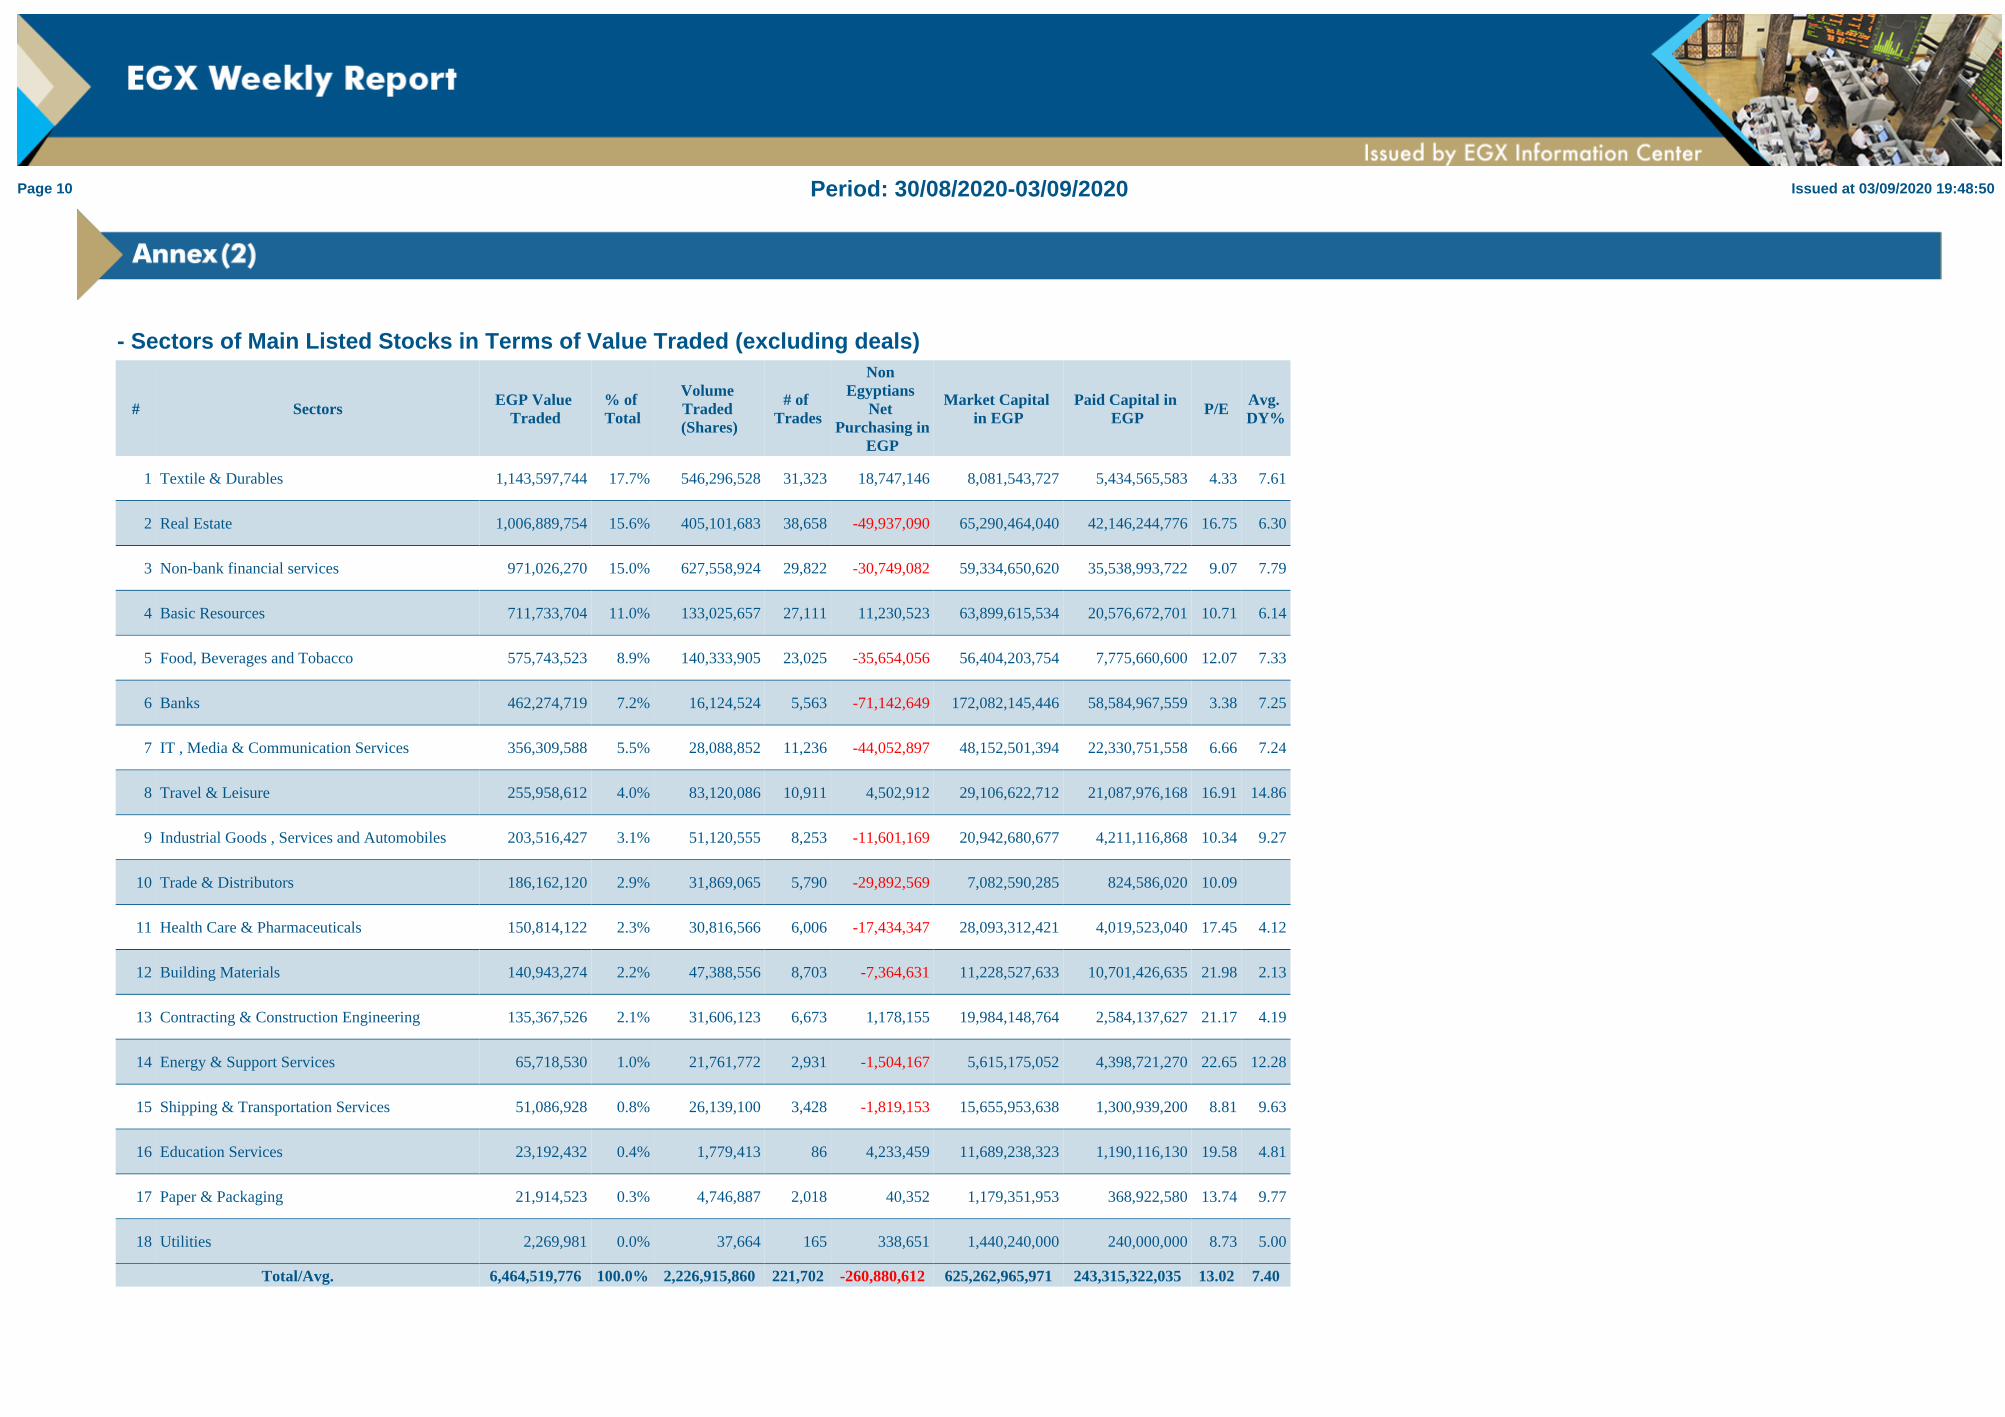
- Sectors of Main Listed Stocks in Terms of Value Traded (excluding deals)
# Sectors EGP Value Traded
% of Total
Volume Traded (Shares)
# of Trades
Non Egyptians
Net Purchasing in
EGP
Market Capital in EGP
Paid Capital in EGP
P/E Avg. DY%
1 Textile & Durables 1,143,597,744 17.7% 546,296,528 31,323 18,747,146 8,081,543,727 5,434,565,583 4.33 7.61
2 Real Estate 1,006,889,754 15.6% 405,101,683 38,658 -49,937,090 65,290,464,040 42,146,244,776 16.75 6.30
3 Non-bank financial services 971,026,270 15.0% 627,558,924 29,822 -30,749,082 59,334,650,620 35,538,993,722 9.07 7.79
4 Basic Resources 711,733,704 11.0% 133,025,657 27,111 11,230,523 63,899,615,534 20,576,672,701 10.71 6.14
5 Food, Beverages and Tobacco 575,743,523 8.9% 140,333,905 23,025 -35,654,056 56,404,203,754 7,775,660,600 12.07 7.33
6 Banks 462,274,719 7.2% 16,124,524 5,563 -71,142,649 172,082,145,446 58,584,967,559 3.38 7.25
7 IT , Media & Communication Services 356,309,588 5.5% 28,088,852 11,236 -44,052,897 48,152,501,394 22,330,751,558 6.66 7.24
8 Travel & Leisure 255,958,612 4.0% 83,120,086 10,911 4,502,912 29,106,622,712 21,087,976,168 16.91 14.86
9 Industrial Goods , Services and Automobiles 203,516,427 3.1% 51,120,555 8,253 -11,601,169 20,942,680,677 4,211,116,868 10.34 9.27
10 Trade & Distributors 186,162,120 2.9% 31,869,065 5,790 -29,892,569 7,082,590,285 824,586,020 10.09
11 Health Care & Pharmaceuticals 150,814,122 2.3% 30,816,566 6,006 -17,434,347 28,093,312,421 4,019,523,040 17.45 4.12
12 Building Materials 140,943,274 2.2% 47,388,556 8,703 -7,364,631 11,228,527,633 10,701,426,635 21.98 2.13
13 Contracting & Construction Engineering 135,367,526 2.1% 31,606,123 6,673 1,178,155 19,984,148,764 2,584,137,627 21.17 4.19
14 Energy & Support Services 65,718,530 1.0% 21,761,772 2,931 -1,504,167 5,615,175,052 4,398,721,270 22.65 12.28
15 Shipping & Transportation Services 51,086,928 0.8% 26,139,100 3,428 -1,819,153 15,655,953,638 1,300,939,200 8.81 9.63
16 Education Services 23,192,432 0.4% 1,779,413 86 4,233,459 11,689,238,323 1,190,116,130 19.58 4.81
17 Paper & Packaging 21,914,523 0.3% 4,746,887 2,018 40,352 1,179,351,953 368,922,580 13.74 9.77
18 Utilities 2,269,981 0.0% 37,664 165 338,651 1,440,240,000 240,000,000 8.73 5.00
Total/Avg. 6,464,519,776 100.0% 2,226,915,860 221,702 -260,880,612 625,262,965,971 243,315,322,035 13.02 7.40
Page 11 Period: 30/08/2020-03/09/2020 Issued at 03/09/2020 19:48:50
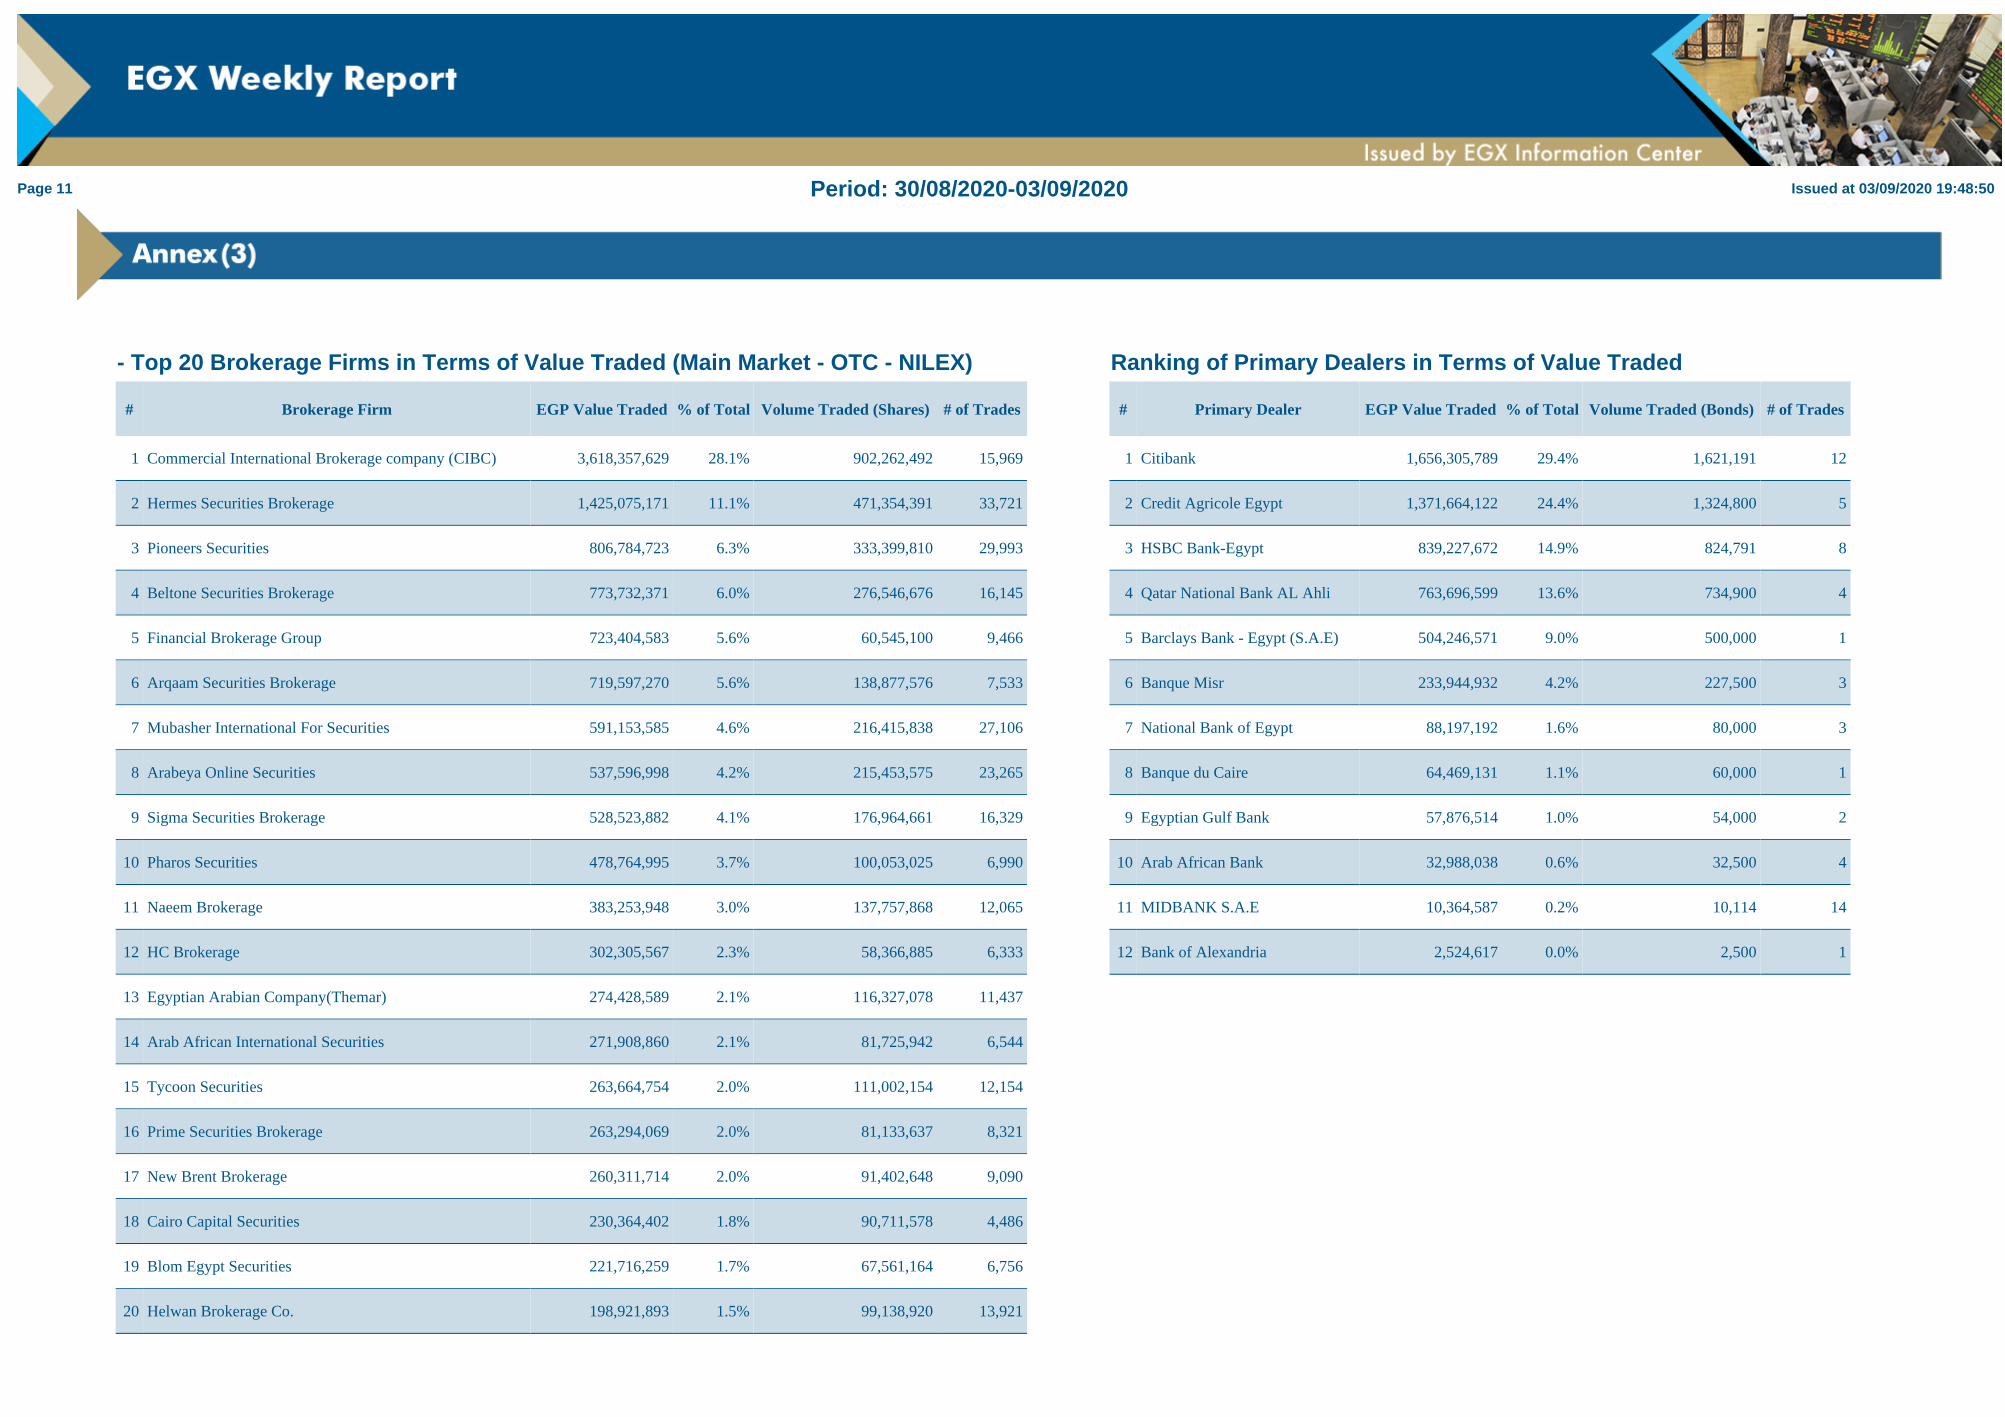
- Top 20 Brokerage Firms in Terms of Value Traded (Main Market - OTC - NILEX)
# Brokerage Firm EGP Value Traded % of Total Volume Traded (Shares) # of Trades
1 Commercial International Brokerage company (CIBC) 3,618,357,629 28.1% 902,262,492 15,969
2 Hermes Securities Brokerage 1,425,075,171 11.1% 471,354,391 33,721
3 Pioneers Securities 806,784,723 6.3% 333,399,810 29,993
4 Beltone Securities Brokerage 773,732,371 6.0% 276,546,676 16,145
5 Financial Brokerage Group 723,404,583 5.6% 60,545,100 9,466
6 Arqaam Securities Brokerage 719,597,270 5.6% 138,877,576 7,533
7 Mubasher International For Securities 591,153,585 4.6% 216,415,838 27,106
8 Arabeya Online Securities 537,596,998 4.2% 215,453,575 23,265
9 Sigma Securities Brokerage 528,523,882 4.1% 176,964,661 16,329
10 Pharos Securities 478,764,995 3.7% 100,053,025 6,990
11 Naeem Brokerage 383,253,948 3.0% 137,757,868 12,065
12 HC Brokerage 302,305,567 2.3% 58,366,885 6,333
13 Egyptian Arabian Company(Themar) 274,428,589 2.1% 116,327,078 11,437
14 Arab African International Securities 271,908,860 2.1% 81,725,942 6,544
15 Tycoon Securities 263,664,754 2.0% 111,002,154 12,154
16 Prime Securities Brokerage 263,294,069 2.0% 81,133,637 8,321
17 New Brent Brokerage 260,311,714 2.0% 91,402,648 9,090
18 Cairo Capital Securities 230,364,402 1.8% 90,711,578 4,486
19 Blom Egypt Securities 221,716,259 1.7% 67,561,164 6,756
20 Helwan Brokerage Co. 198,921,893 1.5% 99,138,920 13,921
Ranking of Primary Dealers in Terms of Value Traded
# Primary Dealer EGP Value Traded % of Total Volume Traded (Bonds) # of Trades
1 Citibank 1,656,305,789 29.4% 1,621,191 12
2 Credit Agricole Egypt 1,371,664,122 24.4% 1,324,800 5
3 HSBC Bank-Egypt 839,227,672 14.9% 824,791 8
4 Qatar National Bank AL Ahli 763,696,599 13.6% 734,900 4
5 Barclays Bank - Egypt (S.A.E) 504,246,571 9.0% 500,000 1
6 Banque Misr 233,944,932 4.2% 227,500 3
7 National Bank of Egypt 88,197,192 1.6% 80,000 3
8 Banque du Caire 64,469,131 1.1% 60,000 1
9 Egyptian Gulf Bank 57,876,514 1.0% 54,000 2
10 Arab African Bank 32,988,038 0.6% 32,500 4
11 MIDBANK S.A.E 10,364,587 0.2% 10,114 14
12 Bank of Alexandria 2,524,617 0.0% 2,500 1

Page 12 Period: 30/08/2020-03/09/2020 Issued at 03/09/2020 19:48:50
- SME/Nilex Stocks Traded in Terms of Value Traded (excluding deals)
# Stock Name CRClose Price
% Chg.
Max Price
Min Price
Max in52Wks
Min in52Wks
EGP Value Traded
% of Total
Volume Traded (Shares)
# of Trades
No. Listed Shares
Market Capital in
EGP
Paid Capital in
EGP
Trailing P/E
SectorP/E
DY%EGP Net
ProfitNet Profit
DateLast Coupon Pay Date
1 Speed Medical EGP 3.390 5.61 3.82 3.3 3.82 1.02 58,939,715 77.6% 17,197,487 1,166 356,638,095 1,209,003,142 71,327,619 70.74 70.74 17,090,644 31/12/2019
2Integrated Engineering Group S.A.E
EGP 0.193 1.58 0.195 0.164 0.52 0.164 8,054,117 10.6% 44,600,191 372 150,000,000 28,950,000 15,000,000 9.54 -2,504,431 31/12/2019
3Barbary Investment Group ( BIG)
EGP 0.153 14.18 0.154 0.133 1.065 0.113 3,643,547 4.8% 25,060,881 426 150,820,370 23,075,517 30,164,074 6.59 -3,273,156 31/12/2019
4
Arab Development & Real Estate Investment
EGP 0.733 15.43 0.748 0.66 0.915 0.276 1,826,269 2.4% 2,569,983 207 59,149,846 43,356,837 29,574,923 21.75 15.50 1,993,735 31/12/2019 0.03 EGP 03/05/2018
5
The Egyptian Modern Education Systems
EGP 1.097 9.70 1.123 0.953 1.17 0.605 1,302,940 1.7% 1,221,905 162 85,659,512 93,968,485 85,659,512 38.48 38.48 2,441,706 30/06/2020
6
International Company For Fertilizers & Chemicals
EGP 1.521 25.50 1.544 1.272 1.471 0.782 982,893 1.3% 689,786 133 22,500,000 34,222,500 45,000,000 4.31 -8,998,865 31/12/2019 0.20 EGP 30/09/2014
7
International company For Medical Industries -ICMI
EGP 0.784 10.11 0.784 0.701 0.832 0.499 609,515 0.8% 809,174 44 24,189,788 18,964,794 24,189,788 403.46 70.74 47,005 31/12/2019
8 Arabian Rocks Plastic Industries EGP 0.535 3.28 0.54 0.497 0.548 0.16 142,374 0.2% 270,840 29 100,000,000 53,500,000 20,000,000 -648,773 31/12/2019
9
Brothers Solidarity For Real Estate Investment&Food Security
EGP 2.720 -1.45 2.89 2.63 4 2.63 100,388 0.1% 36,670 18 4,000,000 10,880,000 4,000,000 126.58 85,956 31/12/2019 0.05 EGP 05/05/2016
10
Al Fanar Contracting Construction Trade Import And Export Co
EGP 1.159 -9.59 1.219 1.158 1.346 1.188 79,923 0.1% 67,652 16 8,000,000 9,272,000 8,000,000 9.54 9.54 971,560 31/12/2019
11 Genial Tours EGP 1.983 4.31 1.996 1.9 2.39 1.249 58,308 0.1% 29,900 10 4,749,647 9,418,550 4,749,647 -30,156 31/12/2019
12
Marseille Almasreia Alkhalegeya For Holding Investment
EGP 2.750 4.56 2.76 2.75 2.76 2.14 55,849 0.1% 20,302 3 72,000,000 198,000,000 72,000,000 16.34 15.50 12,120,515 31/12/2019
13
Al Moasher for Programming and Information Dissemination
EGP 0.422 4.98 0.443 0.422 0.43 0.301 55,790 0.1% 130,068 6 9,924,028 4,187,940 9,924,028 10.01 12.98 418,566 31/12/2019
14 Union Pharmacist EGP 1.015 0.00 1.049 0.97 1.32 0.947 53,483 0.1% 53,116 19 13,661,400 13,866,321 13,661,400 152.96 70.74 90,652 31/12/2019 0.07 EGP 12/12/2017

# Stock Name CR Close Price
% Chg.
Max Price
Min Price
Max in52Wks
Min in52Wks
EGP Value Traded
% of Total
Volume Traded (Shares)
# of Trades
No. Listed Shares
Market Capital in
EGP
Paid Capital in
EGP
Trailing P/E
SectorP/E
DY% EGP Net Profit
Net Profit Date
Last Coupon Pay Date
Company For Medical Servicesand Investment
15 Vertika for Industry & Trade
EGP 2.420 4.76 2.42 2.42 2.61 1.51 33,009 0.0% 13,640 4 2,353,000 5,694,260 2,353,000 6.59 6.59 11.78 864,095 31/12/2019 0.29 EGP 10/05/2020
16 UTOPIA EGP 6.550 0.00 6.87 6.86 8.69 4.87 15,105 0.0% 2,199 4 3,000,000 19,650,000 15,000,000 8.42 15.50 22.90 2,332,612 31/12/2019 1.50 EGP 16/04/2020
17Misr Kuwait Investment & Trading Co.
EGP 0.818 0.00 0.778 0.778 0.945 0.778 7,687 0.0% 9,880 3 20,000,000 16,360,000 20,000,000 -541,978 31/12/2019
18 Al Bader Plastic EGP 0.515 0.00 0.494 0.49 0.647 0.472 6,428 0.0% 13,109 3 7,650,000 3,939,750 7,650,000 4.31 -1,416,526 31/12/2019
19
First Investment Company And Real Estate Development
EGP 2.180 0.00 2.08 2.08 2.54 1.95 21 0.0% 10 1 5,500,000 11,990,000 5,500,000 349.07 15.50 34,348 31/12/2019
Page 13 Period: 30/08/2020-03/09/2020 Issued at 03/09/2020 19:48:51
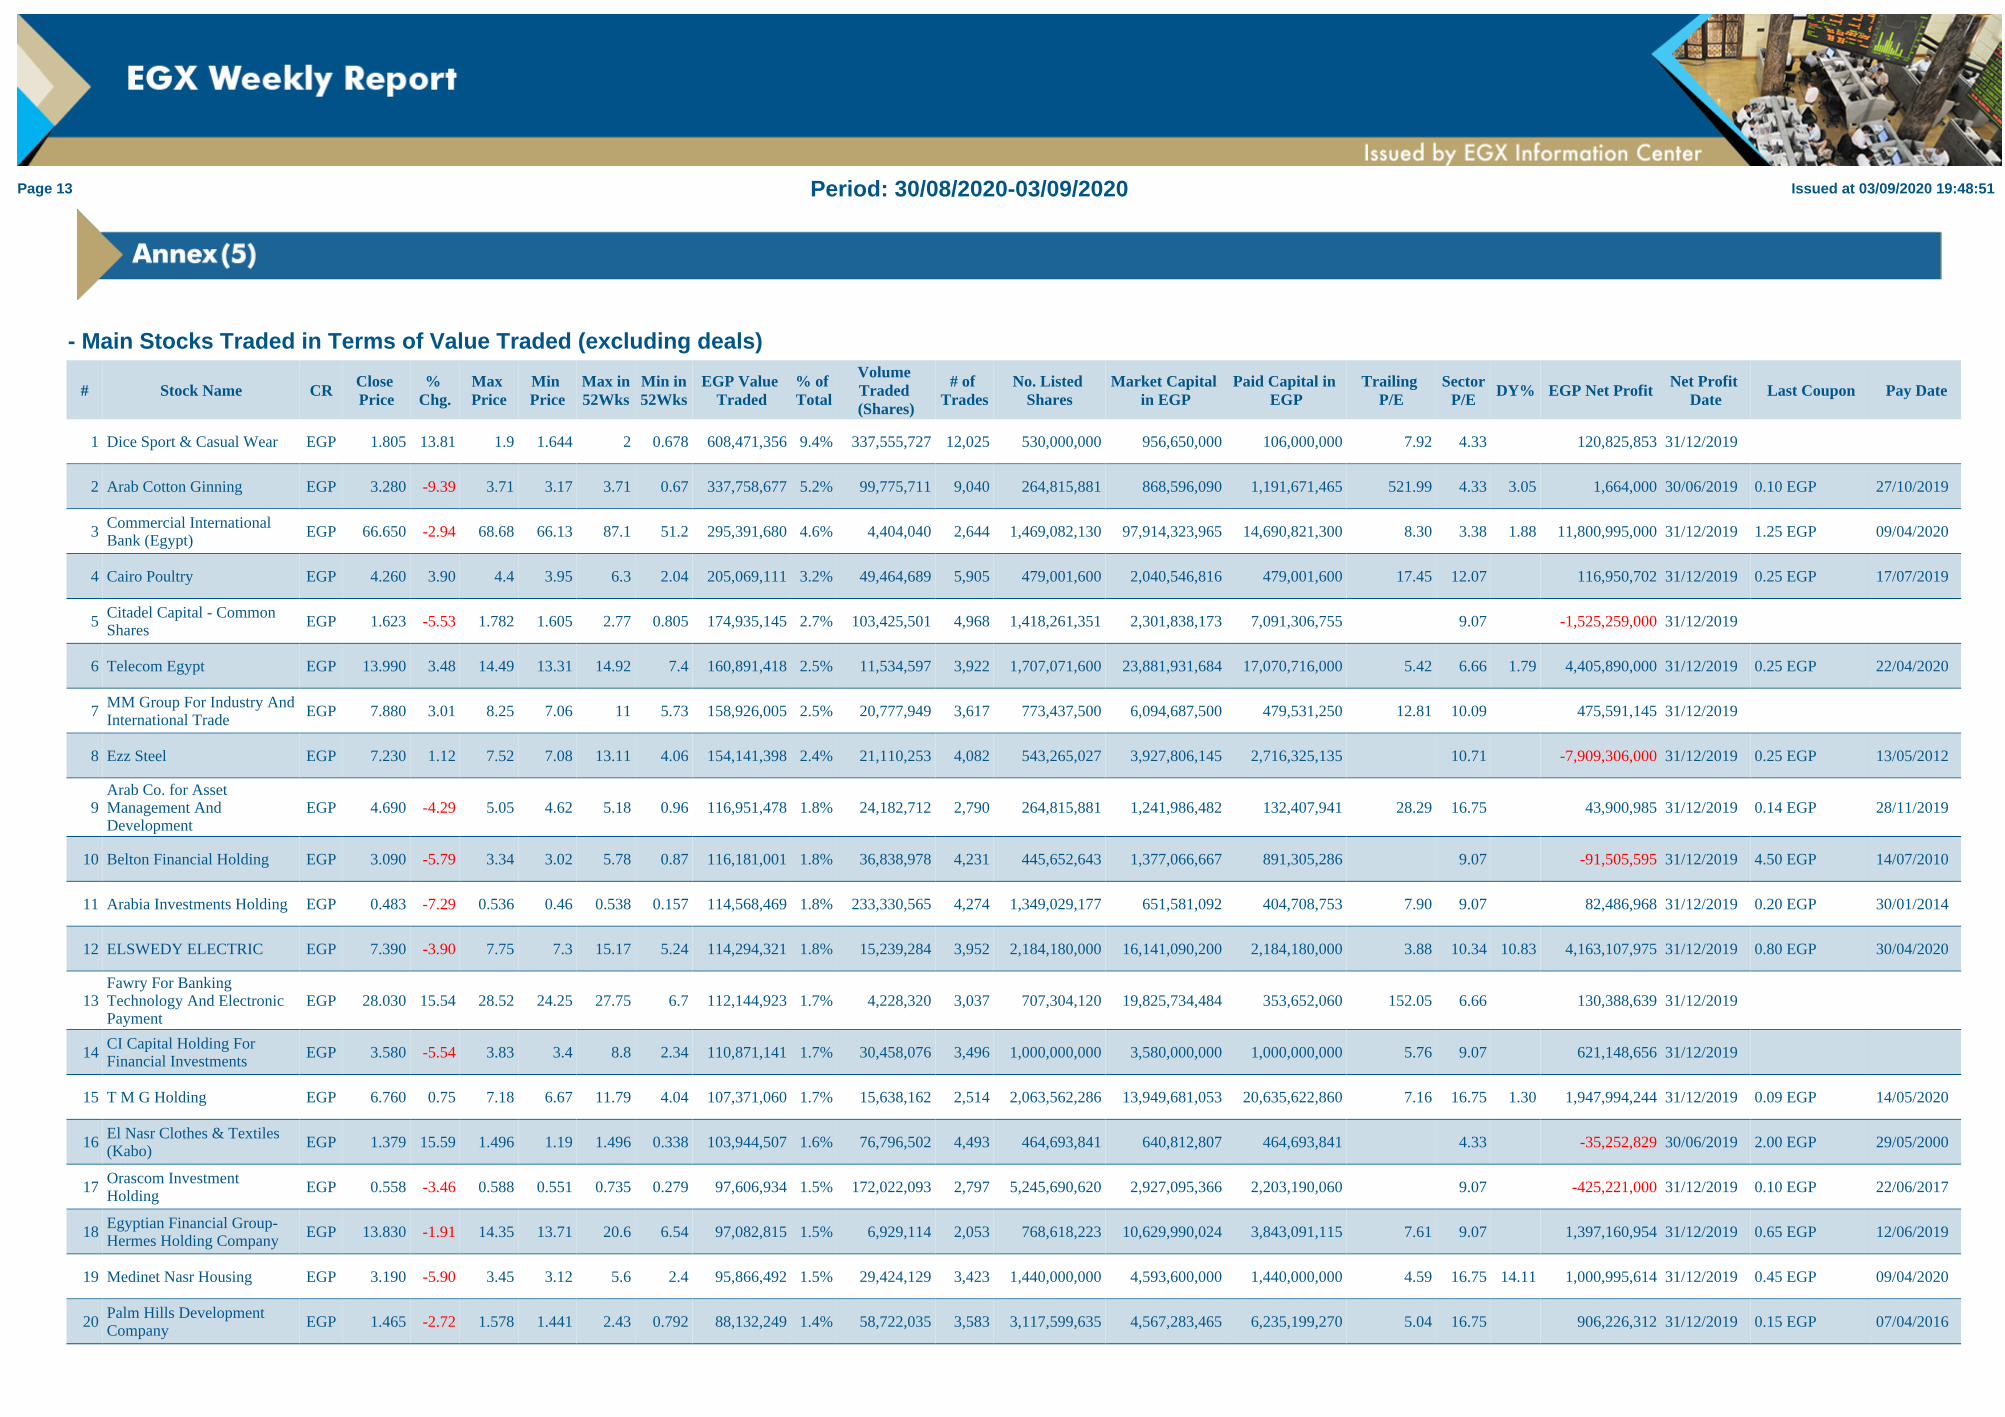
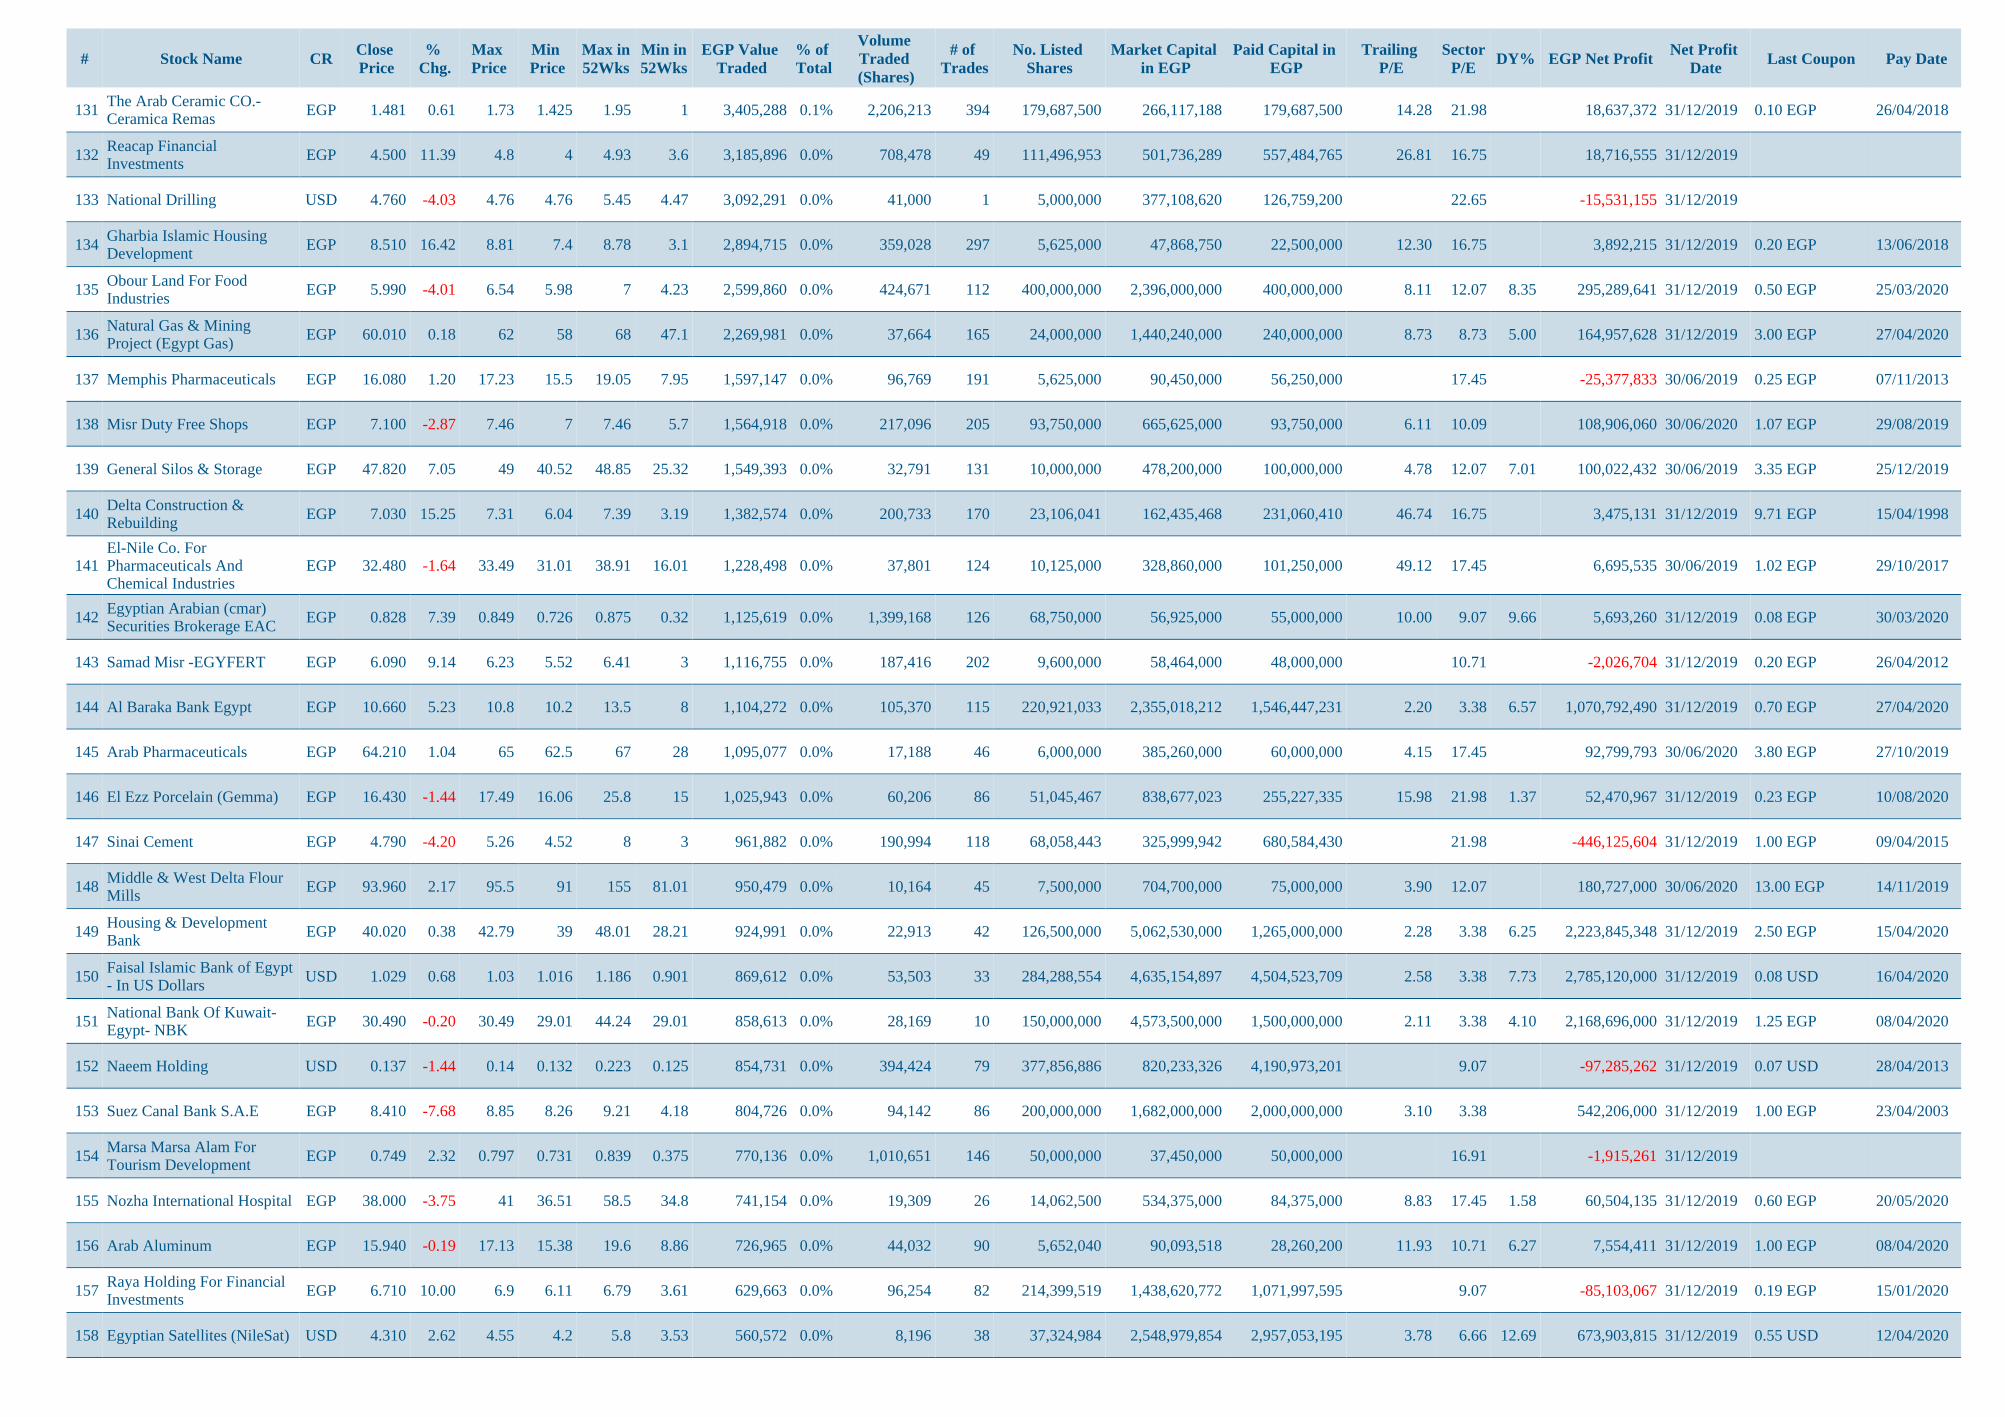
- Main Stocks Traded in Terms of Value Traded (excluding deals)
# Stock Name CRClose Price
% Chg.
Max Price
Min Price
Max in52Wks
Min in52Wks
EGP Value Traded
% of Total
Volume Traded (Shares)
# of Trades
No. Listed Shares
Market Capital in EGP
Paid Capital in EGP
Trailing P/E
SectorP/E
DY% EGP Net ProfitNet Profit
DateLast Coupon Pay Date
1 Dice Sport & Casual Wear EGP 1.805 13.81 1.9 1.644 2 0.678 608,471,356 9.4% 337,555,727 12,025 530,000,000 956,650,000 106,000,000 7.92 4.33 120,825,853 31/12/2019
2 Arab Cotton Ginning EGP 3.280 -9.39 3.71 3.17 3.71 0.67 337,758,677 5.2% 99,775,711 9,040 264,815,881 868,596,090 1,191,671,465 521.99 4.33 3.05 1,664,000 30/06/2019 0.10 EGP 27/10/2019
3Commercial International Bank (Egypt) EGP 66.650 -2.94 68.68 66.13 87.1 51.2 295,391,680 4.6% 4,404,040 2,644 1,469,082,130 97,914,323,965 14,690,821,300 8.30 3.38 1.88 11,800,995,000 31/12/2019 1.25 EGP 09/04/2020
4 Cairo Poultry EGP 4.260 3.90 4.4 3.95 6.3 2.04 205,069,111 3.2% 49,464,689 5,905 479,001,600 2,040,546,816 479,001,600 17.45 12.07 116,950,702 31/12/2019 0.25 EGP 17/07/2019
5Citadel Capital - Common Shares EGP 1.623 -5.53 1.782 1.605 2.77 0.805 174,935,145 2.7% 103,425,501 4,968 1,418,261,351 2,301,838,173 7,091,306,755 9.07 -1,525,259,000 31/12/2019
6 Telecom Egypt EGP 13.990 3.48 14.49 13.31 14.92 7.4 160,891,418 2.5% 11,534,597 3,922 1,707,071,600 23,881,931,684 17,070,716,000 5.42 6.66 1.79 4,405,890,000 31/12/2019 0.25 EGP 22/04/2020
7 MM Group For Industry AndInternational Trade
EGP 7.880 3.01 8.25 7.06 11 5.73 158,926,005 2.5% 20,777,949 3,617 773,437,500 6,094,687,500 479,531,250 12.81 10.09 475,591,145 31/12/2019
8 Ezz Steel EGP 7.230 1.12 7.52 7.08 13.11 4.06 154,141,398 2.4% 21,110,253 4,082 543,265,027 3,927,806,145 2,716,325,135 10.71 -7,909,306,000 31/12/2019 0.25 EGP 13/05/2012
9Arab Co. for Asset Management And Development
EGP 4.690 -4.29 5.05 4.62 5.18 0.96 116,951,478 1.8% 24,182,712 2,790 264,815,881 1,241,986,482 132,407,941 28.29 16.75 43,900,985 31/12/2019 0.14 EGP 28/11/2019
10 Belton Financial Holding EGP 3.090 -5.79 3.34 3.02 5.78 0.87 116,181,001 1.8% 36,838,978 4,231 445,652,643 1,377,066,667 891,305,286 9.07 -91,505,595 31/12/2019 4.50 EGP 14/07/2010
11 Arabia Investments Holding EGP 0.483 -7.29 0.536 0.46 0.538 0.157 114,568,469 1.8% 233,330,565 4,274 1,349,029,177 651,581,092 404,708,753 7.90 9.07 82,486,968 31/12/2019 0.20 EGP 30/01/2014
12 ELSWEDY ELECTRIC EGP 7.390 -3.90 7.75 7.3 15.17 5.24 114,294,321 1.8% 15,239,284 3,952 2,184,180,000 16,141,090,200 2,184,180,000 3.88 10.34 10.83 4,163,107,975 31/12/2019 0.80 EGP 30/04/2020
13Fawry For Banking Technology And Electronic Payment
EGP 28.030 15.54 28.52 24.25 27.75 6.7 112,144,923 1.7% 4,228,320 3,037 707,304,120 19,825,734,484 353,652,060 152.05 6.66 130,388,639 31/12/2019
14CI Capital Holding For Financial Investments EGP 3.580 -5.54 3.83 3.4 8.8 2.34 110,871,141 1.7% 30,458,076 3,496 1,000,000,000 3,580,000,000 1,000,000,000 5.76 9.07 621,148,656 31/12/2019
15 T M G Holding EGP 6.760 0.75 7.18 6.67 11.79 4.04 107,371,060 1.7% 15,638,162 2,514 2,063,562,286 13,949,681,053 20,635,622,860 7.16 16.75 1.30 1,947,994,244 31/12/2019 0.09 EGP 14/05/2020
16El Nasr Clothes & Textiles (Kabo) EGP 1.379 15.59 1.496 1.19 1.496 0.338 103,944,507 1.6% 76,796,502 4,493 464,693,841 640,812,807 464,693,841 4.33 -35,252,829 30/06/2019 2.00 EGP 29/05/2000
17Orascom Investment Holding EGP 0.558 -3.46 0.588 0.551 0.735 0.279 97,606,934 1.5% 172,022,093 2,797 5,245,690,620 2,927,095,366 2,203,190,060 9.07 -425,221,000 31/12/2019 0.10 EGP 22/06/2017
18Egyptian Financial Group-Hermes Holding Company EGP 13.830 -1.91 14.35 13.71 20.6 6.54 97,082,815 1.5% 6,929,114 2,053 768,618,223 10,629,990,024 3,843,091,115 7.61 9.07 1,397,160,954 31/12/2019 0.65 EGP 12/06/2019
19 Medinet Nasr Housing EGP 3.190 -5.90 3.45 3.12 5.6 2.4 95,866,492 1.5% 29,424,129 3,423 1,440,000,000 4,593,600,000 1,440,000,000 4.59 16.75 14.11 1,000,995,614 31/12/2019 0.45 EGP 09/04/2020
20Palm Hills Development Company EGP 1.465 -2.72 1.578 1.441 2.43 0.792 88,132,249 1.4% 58,722,035 3,583 3,117,599,635 4,567,283,465 6,235,199,270 5.04 16.75 906,226,312 31/12/2019 0.15 EGP 07/04/2016

# Stock Name CR Close Price
% Chg.
Max Price
Min Price
Max in52Wks
Min in52Wks
EGP Value Traded
% of Total
Volume Traded (Shares)
# of Trades
No. Listed Shares
Market Capital in EGP
Paid Capital in EGP
Trailing P/E
SectorP/E
DY% EGP Net Profit Net Profit Date
Last Coupon Pay Date
21Egyptians Housing Development & Reconstruction
EGP 9.510 14.58 9.67 8.05 9.46 1.46 88,060,481 1.4% 9,939,757 1,862 113,500,000 1,079,385,000 227,000,000 36.84 16.75 29,302,433 31/12/2019 0.40 EGP 27/04/2003
22 Egyptian Iron & Steel EGP 2.660 1.14 2.79 2.55 3.5 0.82 86,791,602 1.3% 32,481,717 4,262 976,872,278 2,598,480,259 1,953,744,556 10.71 -1,526,885,340 30/06/2019 0.40 EGP 20/11/2008
23 Egyptian for Tourism Resorts
EGP 1.525 -4.51 1.65 1.5 3.25 0.964 80,219,702 1.2% 51,151,757 2,380 1,050,000,000 1,601,250,000 1,050,000,000 16.91 -52,411,893 31/12/2019 0.20 EGP 05/06/2008
24 Egyptian Financial & Industrial
EGP 11.080 7.99 11.5 10.53 13 6.99 73,786,556 1.1% 6,655,320 2,984 72,766,714 806,255,191 727,667,140 3.96 10.71 6.77 203,721,643 31/12/2019 0.75 EGP 14/05/2020
25 Sidi Kerir Petrochemicals EGP 7.920 2.33 8.25 7.65 14.07 4.44 73,590,758 1.1% 9,201,298 2,481 525,000,000 4,158,000,000 1,050,000,000 8.53 10.71 3.79 487,184,363 31/12/2019 0.30 EGP 22/07/2020
26 AJWA for Food Industries company Egypt
EGP 3.390 -0.59 3.79 3.3 4.13 0.9 72,935,482 1.1% 20,541,461 3,364 100,476,500 340,615,335 200,953,000 12.07 -107,323,112 31/12/2019 2.50 EGP 17/05/1998
27 Atlas For Investment and Food Industries
EGP 6.040 9.62 6.37 5.41 15.98 1.24 70,819,757 1.1% 12,157,521 2,456 65,128,540 393,376,382 65,128,540 113,857.13 16.75 3,455 31/12/2019
28 Export Development Bank ofEgypt (EDBE)
EGP 11.230 -8.33 12.35 11.07 12.5 6.35 66,412,110 1.0% 5,562,046 1,387 272,800,000 3,063,544,000 2,728,000,000 2.78 3.38 1,103,550,000 30/06/2020 1.00 EGP 28/10/2019
29 Abou Kir Fertilizers EGP 18.250 2.07 18.6 17.5 24.4 10.85 65,065,047 1.0% 3,623,565 1,531 1,261,875,720 23,029,231,890 1,892,813,580 8.55 10.71 2,694,886,008 30/06/2020 1.30 EGP 24/10/2019
30 Remco for Touristic VillagesConstruction
EGP 3.520 -5.88 3.78 3.34 3.85 1.25 62,001,128 1.0% 17,275,770 2,658 246,797,813 868,728,302 2,467,978,130 3.98 16.91 218,320,969 31/12/2019 1.25 EGP 07/08/2008
31 Pioneers Holding EGP 4.100 -0.49 4.34 4.03 6.16 2.38 60,545,323 0.9% 14,454,043 2,118 1,054,805,160 4,324,701,156 5,274,025,800 3.20 9.07 1,353,282,949 31/12/2019 0.05 EGP 11/05/2010
32 Alexandria Mineral Oils Company
EGP 2.850 2.15 2.94 2.72 4.98 1.41 57,346,661 0.9% 20,109,917 2,652 1,291,500,000 3,680,775,000 1,291,500,000 8.18 22.65 12.28 450,023,993 30/06/2019 0.35 EGP 24/10/2019
33 Eastern Company EGP 12.280 -3.69 12.9 12.05 17.8 9.99 54,900,215 0.8% 4,400,055 1,356 2,250,000,000 27,630,000,000 2,250,000,000 7.40 12.07 8.14 3,733,304,000 30/06/2019 1.00 EGP 14/11/2019
34 Heliopolis Housing EGP 6.150 -6.68 6.7 6.05 29.2 2.61 54,375,675 0.8% 8,633,636 2,092 1,335,085,200 8,210,773,980 333,771,300 21.81 16.75 1.63 376,390,158 30/06/2019 0.10 EGP 19/02/2020
35 Ibnsina Pharma EGP 7.540 -2.33 7.78 7.47 11.15 5.99 53,755,645 0.8% 7,097,338 1,620 820,000,000 6,182,800,000 205,000,000 18.81 17.45 0.93 328,770,981 31/12/2019 0.07 EGP 26/04/2020
36 Misr National Steel - Ataqa EGP 1.404 15.94 1.439 1.22 1.419 0.311 53,698,169 0.8% 39,648,886 2,415 1,200,000,000 1,684,800,000 600,000,000 121.24 10.71 13,896,434 31/12/2019 5.00 EGP 30/04/2014
37 Egyptian Kuwaiti Holding USD 1.111 -1.68 1.14 1.106 1.519 0.821 52,921,302 0.8% 2,974,404 725 1,024,441,170 18,033,938,531 4,058,041,974 9.85 9.07 5.37 1,831,690,848 31/12/2019 0.06 USD 28/04/2020
38 Raya Contact Center EGP 7.380 -0.27 7.69 6.9 11.39 4 52,612,815 0.8% 7,222,823 2,782 106,060,606 782,727,272 53,030,303 6.83 6.66 114,574,924 31/12/2019 0.85 EGP 12/06/2019
39Northern Upper Egypt Development & Agricultural Production
EGP 1.546 8.64 1.674 1.44 11.3 0.94 51,624,906 0.8% 33,077,115 2,991 63,496,550 98,165,666 63,496,550 31.28 12.07 3,138,334 31/12/2019
40 GB AUTO EGP 2.680 -4.96 2.88 2.6 4.85 1.41 50,219,846 0.8% 18,350,132 1,936 1,094,009,733 2,931,946,084 1,094,009,733 13.12 10.34 223,556,000 31/12/2019 1.25 EGP 28/04/2013
41 Delta Insurance EGP 23.000 6.48 24 19.5 23.19 18.2 48,771,396 0.8% 2,122,180 39 31,500,000 724,500,000 126,000,000 3.95 9.07 183,567,870 30/06/2020 1.20 EGP 30/10/2017
42 Credit Agricole Egypt EGP 25.440 1.76 26 24.5 45 24.5 48,094,002 0.7% 1,913,057 579 310,917,000 7,909,728,480 1,243,668,000 3.35 3.38 13.44 2,359,696,000 31/12/2019 3.42 EGP 30/04/2020
43 Juhayna Food Industries EGP 6.850 -6.42 7.25 6.8 10.1 5.13 47,801,501 0.7% 6,820,409 922 941,405,082 6,448,624,812 941,405,082 19.61 12.07 2.92 328,761,115 31/12/2019 0.20 EGP 15/04/2020
44The Egyptian Company for Construction Development-Lift Slab
EGP 4.710 7.05 4.83 4.25 10.78 0.96 46,689,499 0.7% 10,287,881 2,130 45,262,560 213,186,658 56,125,574 58.91 21.17 3,618,919 31/12/2019
45 Arabian Cement Company EGP 3.920 2.89 4.14 3.76 4.2 2.09 45,299,227 0.7% 11,438,040 2,327 378,739,700 1,484,659,624 757,479,400 51.30 21.98 28,938,584 31/12/2019 0.47 EGP 19/12/2019
46El Wadi For International and Investement Development
EGP 13.230 2.00 13.69 12.8 14.48 4.68 42,301,220 0.7% 3,180,826 1,689 18,200,000 240,786,000 182,000,000 5.51 16.91 43,690,756 31/12/2019 0.44 EGP 02/06/2013
47Elsaeed Contracting& Real Estate Investment Company SCCD
EGP 0.730 8.96 0.747 0.671 0.727 0.294 41,276,064 0.6% 58,218,080 2,521 761,915,221 556,198,111 761,915,221 12.85 16.75 43,295,127 31/12/2019 0.10 EGP 23/11/2014

# Stock Name CR Close Price
% Chg.
Max Price
Min Price
Max in52Wks
Min in52Wks
EGP Value Traded
% of Total
Volume Traded (Shares)
# of Trades
No. Listed Shares
Market Capital in EGP
Paid Capital in EGP
Trailing P/E
SectorP/E
DY% EGP Net Profit Net Profit Date
Last Coupon Pay Date
48 Porto Group EGP 0.524 -1.13 0.55 0.501 0.805 0.35 41,051,876 0.6% 77,634,743 1,799 1,170,283,125 613,228,358 702,169,875 5.25 16.75 116,885,313 31/12/2019 0.02 EGP 24/04/2016
49 Egyptian Chemical Industries (Kima) EGP 4.180 -4.57 4.59 4.08 6.23 2.43 40,192,748 0.6% 9,278,825 2,520 892,988,274 3,732,690,985 4,464,941,370 115.42 10.71 32,339,000 30/06/2019 5.00 EGP 19/11/2009
50 Misr Fretilizers Production Company - Mopco EGP 50.020 -2.91 55 48.02 75 24.73 40,053,338 0.6% 775,864 1,218 229,117,232 11,460,443,945 2,291,172,320 6.97 10.71 5.00 1,645,040,161 31/12/2019 2.50 EGP 26/04/2020
51ARAB POLVARA SPINNING & WEAVING CO.
EGP 4.090 15.21 4.35 3.58 4.35 1.44 38,242,344 0.6% 9,462,753 2,389 93,686,560 383,178,030 468,432,800 4.33 -5,266,693 31/12/2019 0.23 EGP 10/05/2007
52 Asek Company for Mining - Ascom
EGP 8.140 -0.73 8.74 7.73 9 2.86 37,652,892 0.6% 4,522,189 1,614 55,000,000 447,700,000 550,000,000 10.71 -52,571,849 31/12/2019
53 Orascom Development Egypt
EGP 4.580 0.00 4.76 4.4 7.92 2.01 36,226,730 0.6% 7,874,258 1,357 1,130,473,523 5,177,568,735 1,130,473,523 7.34 16.75 705,549,217 31/12/2019 0.20 EGP 04/06/2018
54 Arab Real Estate Investment CO.-ALICO
EGP 0.767 19.28 0.8 0.634 0.8 0.224 35,308,247 0.5% 48,750,499 2,073 246,400,000 188,988,800 246,400,000 36.85 16.75 5,128,140 31/12/2019 14.50 EGP 18/04/2000
55 Emaar Misr for Development EGP 2.460 -3.15 2.62 2.43 3.23 2.13 35,121,541 0.5% 13,886,923 1,012 4,529,338,000 11,142,171,480 4,529,338,000 6.41 16.75 1,739,273,874 31/12/2019
56 Sharm Dreams Co. for Tourism Investment
EGP 4.880 -2.01 5.45 4.75 5.9 1.97 34,342,005 0.5% 6,709,670 1,985 52,985,460 258,569,045 529,854,600 3.95 16.91 65,444,000 31/12/2019 0.50 EGP 18/08/2010
57 Qatar National Bank Alahly EGP 14.740 3.08 15.2 14.3 53.9 14.21 31,565,353 0.5% 2,154,900 86 2,154,822,966 31,762,090,519 10,774,114,830 3.73 3.38 6.78 8,522,095,727 31/12/2019 1.00 EGP 08/07/2020
58 South Valley Cement EGP 2.000 -3.85 2.18 1.95 2.18 0.6 30,810,562 0.5% 14,990,411 1,802 482,256,840 964,513,680 2,411,284,200 21.98 -316,348,814 31/12/2019 0.20 EGP 27/07/2014
59 Egypt Aluminum EGP 12.320 1.07 13.15 12.06 15.79 6.29 30,200,010 0.5% 2,394,942 1,408 412,500,000 5,082,000,000 1,650,000,000 8.90 10.71 6.09 570,927,229 30/06/2019 0.75 EGP 14/11/2019
60 Egyptian Media Production City
EGP 5.870 7.90 6.23 5.6 6.23 2.25 30,099,859 0.5% 5,094,916 1,457 189,630,000 1,113,128,100 1,896,300,000 10.59 6.66 105,130,359 31/12/2019 0.20 EGP 02/02/2017
61 Giza General Contracting EGP 1.893 35.31 1.95 1.467 1.816 0.583 28,829,432 0.4% 16,826,227 1,415 292,892,624 554,445,737 292,892,624 10.37 21.17 53,460,647 31/12/2019 0.60 EGP 12/02/2009
62 Alexandria Spinning & Weaving (SPINALEX)
EGP 1.604 11.39 1.75 1.45 1.94 0.976 28,526,910 0.4% 17,589,572 1,673 320,640,809 514,307,858 641,281,618 4.33 -62,462,875 30/06/2019 0.03 EGP 31/01/2013
63 Electro Cable Egypt EGP 1.768 13.70 1.884 1.57 1.884 0.95 28,278,073 0.4% 16,360,426 1,635 711,447,385 1,257,838,977 711,447,385 7.54 10.34 166,778,241 31/12/2019 0.05 EGP 18/09/2014
64 Medical Packaging Company
EGP 1.958 0.98 2.15 1.91 2.15 0.54 28,214,692 0.4% 13,935,352 1,591 69,000,000 135,102,000 69,000,000 24.34 17.45 5,549,826 31/12/2019
65 Emerald Real Estate Investment
EGP 2.990 -5.68 3.25 2.93 6.29 2.38 26,824,347 0.4% 8,699,761 1,594 250,000,000 747,500,000 250,000,000 28.58 16.75 26,150,591 31/12/2019
66 Ismailia Development and Real Estate Co
EGP 20.120 6.34 20.9 18.01 31.07 3.17 26,310,296 0.4% 1,343,846 1,460 36,838,250 741,185,590 147,353,000 16.75 -1,628,743 31/12/2019
67 Oriental Weavers EGP 5.340 0.38 5.44 5.25 11.7 4.5 26,299,988 0.4% 4,926,789 1,669 665,107,268 3,551,672,811 665,107,268 4.15 4.33 12.17 855,078,677 31/12/2019 0.65 EGP 29/07/2020
68 El Ahli Investment and Development
EGP 11.790 -7.89 13.87 11.01 13.87 2.95 26,283,369 0.4% 2,106,222 1,111 18,000,000 212,220,000 180,000,000 14.17 9.07 14,980,295 31/12/2019 1.70 EGP 04/04/1999
69 Gulf Canadian Real Estate Investment Co.
EGP 42.600 5.00 44.15 37.13 44.17 4.8 25,138,614 0.4% 609,054 782 5,000,000 213,000,000 30,000,000 16.75 -870,061 31/12/2019 0.24 EGP 28/04/2016
70 Ismailia Misr Poultry EGP 4.360 4.06 4.43 3.96 5.68 1.47 24,935,935 0.4% 5,920,374 1,878 89,856,499 391,774,336 359,425,996 12.07 -5,162,945 31/12/2019 0.20 EGP 15/04/2019
71 Paint & Chemicals Industries(Pachin)
EGP 20.360 1.19 21.5 18.63 24.5 7.84 24,488,023 0.4% 1,232,028 880 24,000,000 488,640,000 240,000,000 29.13 10.71 8.60 16,775,444 30/06/2019 1.75 EGP 30/01/2020
72 Orascom Construction PLC EGP 73.950 -2.10 77.5 73 111 50.05 24,402,207 0.4% 323,765 682 116,761,379 8,634,503,977 888,904,378 4.16 21.17 4.55 2,077,266,390 31/12/2019 3.37 EGP 12/08/2020
73 Cleopatra Hospital Company EGP 4.930 0.41 5.08 4.86 6.6 3.78 24,350,303 0.4% 4,917,315 680 1,600,000,000 7,888,000,000 800,000,000 29.73 17.45 265,358,081 31/12/2019
74 Al Tawfeek Leasing Company-A.T.LEASE
EGP 3.200 -5.04 3.47 3.15 3.95 2.31 23,522,425 0.4% 7,157,094 1,263 114,931,671 367,781,347 287,329,178 5.48 9.07 67,159,357 31/12/2019 0.25 EGP 24/04/2019
75 Cairo For Investment And Real Estate Development
EGP 13.300 0.00 13.3 12.61 14 9.16 23,190,310 0.4% 1,779,205 81 582,790,325 7,751,111,323 233,116,130 40.25 19.58 0.32 192,574,776 31/08/2019 0.04 EGP 31/12/2019

# Stock Name CR Close Price
% Chg.
Max Price
Min Price
Max in52Wks
Min in52Wks
EGP Value Traded
% of Total
Volume Traded (Shares)
# of Trades
No. Listed Shares
Market Capital in EGP
Paid Capital in EGP
Trailing P/E
SectorP/E
DY% EGP Net Profit Net Profit Date
Last Coupon Pay Date
76 International Agricultural Products EGP 3.420 17.53 3.54 2.89 3.48 1.1 22,134,002 0.3% 6,660,766 1,570 84,036,052 287,403,298 168,072,104 11.33 10.09 25,360,292 30/06/2020 0.20 EGP 30/06/2013
77 Six of October Development & Investment (SODIC) EGP 12.250 -2.39 12.75 12 17.75 6.1 22,053,981 0.3% 1,802,019 764 349,178,872 4,277,441,182 1,396,715,488 5.93 16.75 4.49 721,244,755 31/12/2019 0.55 EGP 30/04/2020
78 Golden Coast Company EGP 9.390 2.85 10.48 9.01 14.7 2.54 21,614,060 0.3% 2,196,024 858 17,152,169 161,058,867 68,608,676 16.48 16.91 9,770,750 31/12/2019 0.40 EGP 09/08/2018
79 United Arab Shipping EGP 0.898 5.03 0.95 0.85 0.95 0.276 20,887,743 0.3% 23,136,204 1,590 200,000,000 179,600,000 200,000,000 8.81 -22,701,084 30/06/2019 2.80 EGP 18/11/1998
80 Delta Sugar EGP 8.030 -7.17 8.89 7.97 12.23 5.12 19,441,498 0.3% 2,419,449 396 142,198,075 1,141,850,542 710,990,375 26.62 12.07 42,891,334 31/12/2019 2.00 EGP 30/05/2019
81 El Shams Housing & Urbanization EGP 4.450 1.83 4.8 4.35 4.77 1.52 19,318,454 0.3% 4,253,712 1,078 181,500,000 807,675,000 181,500,000 5.96 16.75 4.49 135,586,889 31/12/2019 0.20 EGP 04/06/2020
82 Edita Food Industries S.A.E EGP 10.110 -8.75 11.35 10.02 18 7.76 18,662,224 0.3% 1,715,452 392 725,362,900 7,333,418,919 145,072,580 17.91 12.07 1.98 409,468,406 31/12/2019 0.20 EGP 26/04/2020
83 ODIN Investments EGP 4.410 -1.56 4.75 4.15 4.75 1.5 18,221,285 0.3% 4,012,874 1,050 99,520,000 438,883,200 248,800,000 9.07 -1,201,586 31/12/2019 0.13 EGP 27/04/2010
84 Arab Valves Company EGP 1.620 2.66 1.8 1.551 1.8 0.45 16,633,295 0.3% 10,000,565 974 74,942,787 121,407,315 74,942,787 17.92 21.98 6,776,013 31/12/2019 0.05 EGP 28/07/2016
85 EL Ezz Aldekhela Steel - Alexandria EGP 280.930 3.12 294 273 697 267.5 16,546,611 0.3% 58,025 619 19,512,037 5,481,516,554 1,951,203,700 10.71 -4,643,494,957 31/12/2019 20.00 EGP 09/05/2019
86 Egyptian International Pharmaceuticals (EIPICO) EGP 46.230 -1.64 47 45 76.49 45 16,455,480 0.3% 356,892 232 99,170,500 4,584,652,215 991,705,000 6.83 17.45 8.80 671,447,579 31/12/2019 4.07 EGP 27/04/2020
87 B Investments Holding EGP 11.080 -0.18 11.45 9.89 11.5 5.22 16,223,108 0.3% 1,514,532 483 160,024,416 1,773,070,529 800,122,080 10.20 9.07 3.61 173,762,695 31/12/2019 0.40 EGP 02/07/2020
88 Mansourah Poultry EGP 9.680 -1.02 10.18 9.21 11.66 1.96 16,204,656 0.3% 1,660,415 1,070 20,300,921 196,512,915 81,203,684 601.45 12.07 326,731 31/12/2019 0.60 EGP 31/05/2017
89 Egyptians For Investment & Urban Development EGP 2.770 7.36 2.82 2.38 2.7 0.39 16,038,252 0.2% 6,108,743 1,255 40,000,000 110,800,000 40,000,000 5,838.95 16.75 18,976 31/12/2019 0.08 EGP 10/08/2011
90
Tenth Of Ramadan Pharmaceutical Industries&Diagnostic-Rameda
EGP 4.010 -2.43 4.18 3.9 4.94 3.5 15,945,271 0.2% 3,914,779 1,011 768,600,000 3,082,086,000 192,150,000 37.73 17.45 81,679,716 31/12/2019
91 Engineering Industries (ICON) EGP 5.250 5.85 5.58 4.86 5.7 2.49 15,486,262 0.2% 2,948,186 1,148 121,250,000 636,562,500 485,000,000 4.24 21.17 5.71 150,043,079 31/12/2019 0.30 EGP 03/06/2020
92 Rakta Paper Manufacturing EGP 7.940 4.89 8.44 7.61 8.44 2.45 13,819,484 0.2% 1,718,398 1,094 30,000,000 238,200,000 150,000,000 13.74 -123,261,753 30/06/2019 0.25 EGP 31/12/2009
93 Misr Chemical Industries EGP 7.520 -0.13 7.84 7.2 8.53 2.87 13,563,661 0.2% 1,806,581 788 73,125,000 549,900,000 292,500,000 7.10 10.71 6.65 77,459,000 30/06/2019 0.50 EGP 30/10/2019
94 Suez Cement EGP 7.720 -5.85 8.43 7.54 10.03 4.06 13,389,271 0.2% 1,682,400 672 181,856,507 1,403,932,234 909,282,535 21.98 -1,178,584,910 31/12/2019 1.00 EGP 14/07/2016
95 Canal Shipping Agencies EGP 12.160 -1.54 12.9 12.01 15.45 5.06 12,859,337 0.2% 1,034,268 744 200,000,000 2,432,000,000 200,000,000 10.78 8.81 6.54 225,541,669 30/06/2019 0.80 EGP 04/12/2019
96 Alexandria Containers and goods EGP 8.570 0.71 9.13 8.35 12.7 5.15 11,948,497 0.2% 1,360,462 746 1,489,753,400 12,767,186,638 744,876,700 6.96 8.81 11.10 1,833,363,458 30/06/2019 0.95 EGP 10/12/2019
97 Extracted Oils EGP 1.435 -5.16 1.55 1.401 1.55 0.68 11,420,752 0.2% 7,752,152 780 200,000,000 287,000,000 200,000,000 12.44 12.07 3.48 23,077,000 30/06/2019 0.05 EGP 27/11/2019
98 Nasr Company for Civil Works EGP 21.690 10.44 23.08 19 23.08 4.88 11,223,737 0.2% 523,926 672 10,980,750 238,172,468 54,903,750 5.62 21.17 2.31 42,371,612 31/12/2019 0.50 EGP 29/04/2020
99 Development & Engineering Consultants EGP 14.470 -3.21 15.9 14.17 16.87 8.22 10,925,018 0.2% 747,654 685 17,820,000 257,855,400 249,480,000 5.39 16.75 47,864,645 31/12/2019 1.00 EGP 26/04/2018
100 Rowad Tourism (Al Rowad) EGP 10.730 -1.65 11.97 10.37 14.8 6.06 10,899,833 0.2% 965,032 815 17,311,800 185,755,614 173,118,000 3.77 16.91 13.98 49,268,848 31/12/2019 1.50 EGP 03/06/2020
101 United Housing & Development EGP 4.080 -1.69 4.36 3.96 4.4 1.98 10,519,838 0.2% 2,543,159 820 283,203,125 1,155,468,750 354,003,906 8.74 16.75 132,150,968 31/12/2019 0.06 EGP 28/06/2018
102 El Arabia Engineering Industries EGP 9.160 8.53 9.7 8.2 11.72 3.59 10,476,398 0.2% 1,156,899 689 16,658,600 152,592,776 62,469,750 24.12 10.34 6,326,858 31/12/2019 0.38 EGP 12/04/2018
103 Egyptian Real Estate Group EGP 6.970 0.87 7.76 6.68 19.46 1.44 9,891,739 0.2% 1,362,543 550 40,000,000 278,800,000 80,000,000 7.14 16.75 7.17 39,055,481 31/12/2019 0.50 EGP 20/07/2020

# Stock Name CR Close Price
% Chg.
Max Price
Min Price
Max in52Wks
Min in52Wks
EGP Value Traded
% of Total
Volume Traded (Shares)
# of Trades
No. Listed Shares
Market Capital in EGP
Paid Capital in EGP
Trailing P/E
SectorP/E
DY% EGP Net Profit Net Profit Date
Last Coupon Pay Date
104 Ismailia National Food Industries EGP 21.550 13.30 22 18.7 28.5 4.45 9,097,050 0.1% 446,674 755 11,500,000 247,825,000 57,500,000 12.07 -2,339,887 31/12/2019
105 Ceramic & Porcelain EGP 3.240 -1.22 3.49 3.15 3.49 1.36 8,890,683 0.1% 2,679,852 734 50,365,900 163,185,516 100,731,800 21.98 -59,701,487 30/06/2019 0.09 EGP 08/11/2017
106 National Real Estate Bank for Development EGP 11.970 -8.70 13.15 11.66 14.25 2.34 8,240,666 0.1% 659,574 536 5,203,440 62,285,177 52,034,400 21.17 -2,445,621 31/12/2019 2.90 EGP 14/07/2014
107 Sharkia National Food EGP 6.350 9.86 6.8 5.7 6.8 2.09 8,206,445 0.1% 1,288,573 812 16,392,712 104,093,721 81,963,560 12.07 -3,770,223 31/12/2019 0.10 EGP 27/04/2015
108 Lecico Egypt EGP 3.150 10.14 3.27 2.85 3.41 1.68 8,057,120 0.1% 2,605,185 654 80,000,000 252,000,000 400,000,000 21.98 -300,982,959 31/12/2019 0.25 EGP 30/04/2015
109Universal For Paper and Packaging Materials (Unipack
EGP 2.620 7.82 2.73 2.4 2.99 1.16 7,780,209 0.1% 2,986,503 884 77,000,000 201,740,000 77,000,000 7.95 13.74 9.77 25,374,415 31/12/2019 0.26 EGP 18/06/2020
110 Cairo Oils & Soap EGP 26.770 -0.41 28 26.45 28 6.64 7,696,859 0.1% 287,110 282 39,000,000 1,044,030,000 195,000,000 12.07 -49,905,835 31/12/2019 0.68 EGP 05/10/2005
111 Misr Cement (Qena) EGP 8.620 -2.82 9.05 8.5 9.42 3.61 7,147,159 0.1% 817,498 515 72,000,000 620,640,000 720,000,000 37.72 21.98 2.90 16,453,162 31/12/2019 0.25 EGP 21/05/2020
112 Abu Dhabi Islamic Bank- Egypt
EGP 11.980 -1.64 12.29 11.7 14.8 7.67 6,525,989 0.1% 540,550 320 200,000,000 2,396,000,000 2,000,000,000 1.95 3.38 1,228,239,000 31/12/2019 0.80 EGP 09/04/2002
113 Glaxo Smith Kline EGP 17.630 5.70 18.39 16.01 18.4 5.77 6,412,816 0.1% 368,554 381 83,514,200 1,472,355,346 835,142,000 10.32 17.45 142,635,872 31/12/2019 0.50 EGP 05/12/2019
114 Egyptian Gulf Bank USD 0.414 -0.48 0.43 0.41 0.61 0.381 6,255,552 0.1% 940,160 31 390,617,799 2,562,370,185 6,189,299,963 3.89 3.38 657,959,241 31/12/2019 0.04 USD 14/04/2014
115 Prime Holding EGP 0.784 -6.56 0.89 0.752 3.9 0.588 6,230,462 0.1% 7,583,663 520 350,000,000 274,400,000 350,000,000 9.07 -11,505,158 31/12/2019 0.30 EGP 17/04/2019
116 Egypt for Poultry EGP 2.620 13.91 2.65 2.13 2.45 0.89 6,070,468 0.1% 2,430,752 515 42,570,000 111,533,400 85,140,000 12.07 -490,815 31/12/2019 0.25 EGP 15/08/2004
117 Amer Group Holding EGP 0.653 -4.53 0.694 0.647 0.746 0.432 6,025,535 0.1% 8,998,645 452 1,003,099,822 655,024,184 1,003,099,822 11.61 16.75 56,401,564 31/12/2019 0.02 EGP 19/03/2018
118 Arabian Food Industries DOMTY
EGP 6.050 -6.78 6.69 6 9.25 4.7 5,932,800 0.1% 952,556 252 282,608,695 1,709,782,605 56,521,739 10.95 12.07 3.31 156,167,911 31/12/2019 0.20 EGP 14/05/2020
119 Mena Touristic & Real Estate Investment
EGP 7.300 -5.32 7.7 7.1 9.13 2.14 5,498,479 0.1% 747,947 311 75,000,000 547,500,000 150,000,000 147.38 16.75 3,714,862 31/12/2019 1.25 EGP 03/05/2007
120 Zahraa Maadi Investment & Development
EGP 5.360 0.56 5.67 5.22 12.13 4.04 5,472,617 0.1% 1,000,357 499 264,000,000 1,415,040,000 264,000,000 7.99 16.75 13.99 177,081,285 31/12/2019 0.75 EGP 02/06/2020
121 Egyptian Transport (EGYTRANS)
EGP 8.880 3.50 9.1 8.27 9.25 4.75 5,391,350 0.1% 608,166 348 31,212,500 277,167,000 156,062,500 8.70 8.81 11.26 31,871,196 31/12/2019 1.00 EGP 30/04/2020
122 Maridive & oil services USD 0.209 -0.95 0.216 0.196 0.344 0.133 5,279,579 0.1% 1,610,855 278 470,255,740 1,557,291,432 2,980,462,070 37.13 22.65 41,941,466 31/12/2019 0.06 USD 31/05/2011
123 Torah Cement EGP 7.210 -2.30 7.75 7.08 8.2 4.02 4,896,087 0.1% 654,499 373 71,524,200 515,689,482 357,621,000 21.98 -617,253,420 31/12/2019 0.50 EGP 23/04/2014
124 Alexandria Flour Mills EGP 10.010 -3.66 10.7 9.91 13.14 4.83 4,801,469 0.1% 468,009 467 32,891,778 329,246,698 164,458,890 12.38 12.07 3.00 26,589,193 30/06/2019 0.30 EGP 14/11/2019
125 El Obour Real Estate Investment
EGP 9.220 34.60 9.41 6.98 8.8 2.9 4,423,721 0.1% 521,172 329 5,876,169 54,178,278 29,380,845 26.89 16.75 3.25 2,015,165 31/12/2019 0.30 EGP 31/08/2020
126 El Nasr For Manufacturing Agricultural Crops
EGP 37.840 -8.99 43 36.11 44.52 11.92 4,172,725 0.1% 109,507 387 7,865,428 297,627,796 78,654,280 12.07 -8,559,511 31/03/2020
127
GMC GROUP FOR INDUSTRIAL COMMERCIAL & FINANCIAL INVESTMENTS
EGP 0.838 5.54 0.89 0.791 0.89 0.34 3,537,195 0.1% 4,213,254 398 41,616,333 34,874,487 83,232,666 10.09 -163,756 31/12/2019
128 Faisal Islamic Bank of Egypt- In EGP EGP 11.370 -0.61 11.54 11.21 15.5 9.4 3,467,818 0.1% 305,674 230 155,908,149 1,772,675,654 2,516,357,525 1.80 3.38 11.28 2,785,120,000 31/12/2019 1.28 EGP 16/04/2020
129 Arab Moltaka Investments Co EGP 15.910 -6.47 17 15.8 17.34 6.88 3,454,565 0.1% 213,434 222 30,000,000 477,300,000 300,000,000 7.95 9.07 12.57 60,051,955 31/12/2019 2.00 EGP 22/04/2020
130 Misr Hotels EGP 11.030 -7.39 12.37 10.5 63.5 6.6 3,432,953 0.1% 295,393 333 39,600,000 436,788,000 198,000,000 2.48 16.91 45.33 176,392,724 30/06/2019 5.00 EGP 27/10/2019
# Stock Name CR Close Price
% Chg.
Max Price
Min Price
Max in52Wks
Min in52Wks
EGP Value Traded
% of Total
Volume Traded (Shares)
# of Trades
No. Listed Shares
Market Capital in EGP
Paid Capital in EGP
Trailing P/E
SectorP/E
DY% EGP Net Profit Net Profit Date
Last Coupon Pay Date
131 The Arab Ceramic CO.- Ceramica Remas EGP 1.481 0.61 1.73 1.425 1.95 1 3,405,288 0.1% 2,206,213 394 179,687,500 266,117,188 179,687,500 14.28 21.98 18,637,372 31/12/2019 0.10 EGP 26/04/2018
132 Reacap Financial Investments EGP 4.500 11.39 4.8 4 4.93 3.6 3,185,896 0.0% 708,478 49 111,496,953 501,736,289 557,484,765 26.81 16.75 18,716,555 31/12/2019
133 National Drilling USD 4.760 -4.03 4.76 4.76 5.45 4.47 3,092,291 0.0% 41,000 1 5,000,000 377,108,620 126,759,200 22.65 -15,531,155 31/12/2019
134 Gharbia Islamic Housing Development EGP 8.510 16.42 8.81 7.4 8.78 3.1 2,894,715 0.0% 359,028 297 5,625,000 47,868,750 22,500,000 12.30 16.75 3,892,215 31/12/2019 0.20 EGP 13/06/2018
135 Obour Land For Food Industries EGP 5.990 -4.01 6.54 5.98 7 4.23 2,599,860 0.0% 424,671 112 400,000,000 2,396,000,000 400,000,000 8.11 12.07 8.35 295,289,641 31/12/2019 0.50 EGP 25/03/2020
136 Natural Gas & Mining Project (Egypt Gas) EGP 60.010 0.18 62 58 68 47.1 2,269,981 0.0% 37,664 165 24,000,000 1,440,240,000 240,000,000 8.73 8.73 5.00 164,957,628 31/12/2019 3.00 EGP 27/04/2020
137 Memphis Pharmaceuticals EGP 16.080 1.20 17.23 15.5 19.05 7.95 1,597,147 0.0% 96,769 191 5,625,000 90,450,000 56,250,000 17.45 -25,377,833 30/06/2019 0.25 EGP 07/11/2013
138 Misr Duty Free Shops EGP 7.100 -2.87 7.46 7 7.46 5.7 1,564,918 0.0% 217,096 205 93,750,000 665,625,000 93,750,000 6.11 10.09 108,906,060 30/06/2020 1.07 EGP 29/08/2019
139 General Silos & Storage EGP 47.820 7.05 49 40.52 48.85 25.32 1,549,393 0.0% 32,791 131 10,000,000 478,200,000 100,000,000 4.78 12.07 7.01 100,022,432 30/06/2019 3.35 EGP 25/12/2019
140 Delta Construction & Rebuilding EGP 7.030 15.25 7.31 6.04 7.39 3.19 1,382,574 0.0% 200,733 170 23,106,041 162,435,468 231,060,410 46.74 16.75 3,475,131 31/12/2019 9.71 EGP 15/04/1998
141El-Nile Co. For Pharmaceuticals And Chemical Industries
EGP 32.480 -1.64 33.49 31.01 38.91 16.01 1,228,498 0.0% 37,801 124 10,125,000 328,860,000 101,250,000 49.12 17.45 6,695,535 30/06/2019 1.02 EGP 29/10/2017
142 Egyptian Arabian (cmar) Securities Brokerage EAC
EGP 0.828 7.39 0.849 0.726 0.875 0.32 1,125,619 0.0% 1,399,168 126 68,750,000 56,925,000 55,000,000 10.00 9.07 9.66 5,693,260 31/12/2019 0.08 EGP 30/03/2020
143 Samad Misr -EGYFERT EGP 6.090 9.14 6.23 5.52 6.41 3 1,116,755 0.0% 187,416 202 9,600,000 58,464,000 48,000,000 10.71 -2,026,704 31/12/2019 0.20 EGP 26/04/2012
144 Al Baraka Bank Egypt EGP 10.660 5.23 10.8 10.2 13.5 8 1,104,272 0.0% 105,370 115 220,921,033 2,355,018,212 1,546,447,231 2.20 3.38 6.57 1,070,792,490 31/12/2019 0.70 EGP 27/04/2020
145 Arab Pharmaceuticals EGP 64.210 1.04 65 62.5 67 28 1,095,077 0.0% 17,188 46 6,000,000 385,260,000 60,000,000 4.15 17.45 92,799,793 30/06/2020 3.80 EGP 27/10/2019
146 El Ezz Porcelain (Gemma) EGP 16.430 -1.44 17.49 16.06 25.8 15 1,025,943 0.0% 60,206 86 51,045,467 838,677,023 255,227,335 15.98 21.98 1.37 52,470,967 31/12/2019 0.23 EGP 10/08/2020
147 Sinai Cement EGP 4.790 -4.20 5.26 4.52 8 3 961,882 0.0% 190,994 118 68,058,443 325,999,942 680,584,430 21.98 -446,125,604 31/12/2019 1.00 EGP 09/04/2015
148 Middle & West Delta Flour Mills
EGP 93.960 2.17 95.5 91 155 81.01 950,479 0.0% 10,164 45 7,500,000 704,700,000 75,000,000 3.90 12.07 180,727,000 30/06/2020 13.00 EGP 14/11/2019
149 Housing & Development Bank
EGP 40.020 0.38 42.79 39 48.01 28.21 924,991 0.0% 22,913 42 126,500,000 5,062,530,000 1,265,000,000 2.28 3.38 6.25 2,223,845,348 31/12/2019 2.50 EGP 15/04/2020
150 Faisal Islamic Bank of Egypt- In US Dollars
USD 1.029 0.68 1.03 1.016 1.186 0.901 869,612 0.0% 53,503 33 284,288,554 4,635,154,897 4,504,523,709 2.58 3.38 7.73 2,785,120,000 31/12/2019 0.08 USD 16/04/2020
151 National Bank Of Kuwait- Egypt- NBK
EGP 30.490 -0.20 30.49 29.01 44.24 29.01 858,613 0.0% 28,169 10 150,000,000 4,573,500,000 1,500,000,000 2.11 3.38 4.10 2,168,696,000 31/12/2019 1.25 EGP 08/04/2020
152 Naeem Holding USD 0.137 -1.44 0.14 0.132 0.223 0.125 854,731 0.0% 394,424 79 377,856,886 820,233,326 4,190,973,201 9.07 -97,285,262 31/12/2019 0.07 USD 28/04/2013
153 Suez Canal Bank S.A.E EGP 8.410 -7.68 8.85 8.26 9.21 4.18 804,726 0.0% 94,142 86 200,000,000 1,682,000,000 2,000,000,000 3.10 3.38 542,206,000 31/12/2019 1.00 EGP 23/04/2003
154 Marsa Marsa Alam For Tourism Development
EGP 0.749 2.32 0.797 0.731 0.839 0.375 770,136 0.0% 1,010,651 146 50,000,000 37,450,000 50,000,000 16.91 -1,915,261 31/12/2019
155 Nozha International Hospital EGP 38.000 -3.75 41 36.51 58.5 34.8 741,154 0.0% 19,309 26 14,062,500 534,375,000 84,375,000 8.83 17.45 1.58 60,504,135 31/12/2019 0.60 EGP 20/05/2020
156 Arab Aluminum EGP 15.940 -0.19 17.13 15.38 19.6 8.86 726,965 0.0% 44,032 90 5,652,040 90,093,518 28,260,200 11.93 10.71 6.27 7,554,411 31/12/2019 1.00 EGP 08/04/2020
157 Raya Holding For Financial Investments
EGP 6.710 10.00 6.9 6.11 6.79 3.61 629,663 0.0% 96,254 82 214,399,519 1,438,620,772 1,071,997,595 9.07 -85,103,067 31/12/2019 0.19 EGP 15/01/2020
158 Egyptian Satellites (NileSat) USD 4.310 2.62 4.55 4.2 5.8 3.53 560,572 0.0% 8,196 38 37,324,984 2,548,979,854 2,957,053,195 3.78 6.66 12.69 673,903,815 31/12/2019 0.55 USD 12/04/2020

# Stock Name CR Close Price
% Chg.
Max Price
Min Price
Max in52Wks
Min in52Wks
EGP Value Traded
% of Total
Volume Traded (Shares)
# of Trades
No. Listed Shares
Market Capital in EGP
Paid Capital in EGP
Trailing P/E
SectorP/E
DY% EGP Net Profit Net Profit Date
Last Coupon Pay Date
159 Egyptian Starch & Glucose EGP 7.890 -1.13 8.29 7.75 15.88 6.85 468,615 0.0% 58,084 41 50,077,580 395,112,106 415,643,914 12.07 -17,003,256 31/12/2019 0.82 EGP 17/03/2016
160 Saudi Egyptian Investment & Finance EGP 28.910 2.30 29.99 27.01 36.48 17.2 440,554 0.0% 15,660 75 2,500,000 72,275,000 6,700,000 3.11 9.07 7.78 23,268,029 31/12/2019 2.25 EGP 29/04/2020
161 Wadi Kom Ombo Land Reclamation EGP 14.260 -8.41 16 13.6 16 8 383,813 0.0% 25,079 64 5,600,000 79,856,000 28,000,000 2.72 21.17 29,339,274 30/06/2019 1.72 EGP 01/11/2006
162 Cairo Pharmaceuticals EGP 44.780 2.00 45.35 43.07 45.35 32 348,696 0.0% 7,827 31 11,947,500 535,009,050 119,475,000 4.90 17.45 109,140,458 30/06/2020 2.50 EGP 31/10/2019
163 Alexandria Pharmaceuticals EGP 140.520 -0.44 143.89 139.01 144 85 347,750 0.0% 2,460 34 5,000,000 702,600,000 50,000,000 4.13 17.45 170,046,947 30/06/2020 11.20 EGP 27/10/2019
164 North Cairo Mills EGP 14.130 0.64 14.74 13.9 17.43 10 345,641 0.0% 24,047 66 10,700,000 151,191,000 107,000,000 7.41 12.07 4.25 20,402,335 30/06/2019 0.60 EGP 20/11/2019
165 East Delta Flour Mills EGP 91.230 0.51 92.6 90.25 125.24 79.75 338,390 0.0% 3,708 29 6,000,000 547,380,000 60,000,000 2.95 12.07 15.35 185,628,000 30/06/2019 14.00 EGP 18/12/2019
166General Company For Land Reclamation,Development &Reconstru
EGP 13.240 8.08 14 12.5 14 7.2 326,641 0.0% 24,111 64 6,510,000 86,192,400 65,100,000 16.75 -29,514,985 30/06/2019 0.83 EGP 20/10/2005
167 El Ahram Co. For Printing And Packing
EGP 7.490 2.04 7.85 7.3 9.14 4.9 314,829 0.0% 41,986 40 8,320,000 62,316,800 41,600,000 29.26 13.74 2,129,410 31/12/2019 0.25 EGP 11/08/2016
168 Al Arafa For Investment And Consultancies
USD 0.100 -3.85 0.103 0.099 0.145 0.078 279,832 0.0% 175,074 24 469,589,137 744,059,292 1,488,118,583 3.09 4.33 240,926,632 31/01/2020 0.01 USD 04/02/2016
169 Middle Egypt Flour Mills EGP 28.650 1.06 29 28.35 38 20.05 246,357 0.0% 8,607 37 14,722,935 421,812,088 147,229,350 3.28 12.07 16.58 128,687,645 30/06/2019 4.75 EGP 28/11/2019
170 Osool ESB Securities Brokerage
EGP 0.588 -5.62 0.684 0.565 5.61 0.565 240,355 0.0% 394,236 59 400,000,000 235,200,000 40,000,000 212.39 9.07 1,107,378 31/12/2019 0.38 EGP 24/11/2010
171 Misr Beni Suef Cement EGP 13.490 3.37 13.6 13.01 19.7 8.71 230,946 0.0% 17,222 27 75,000,000 1,011,750,000 750,000,000 12.61 21.98 80,247,620 31/12/2019 2.50 EGP 25/09/2019
172Sabaa International Company for Pharmaceuticaland Chemical
EGP 4.910 -1.21 4.95 4.87 6.19 2.6 209,960 0.0% 42,821 26 38,500,000 189,035,000 77,000,000 22.01 17.45 8,589,882 31/12/2019
173 TransOceans Tours USD 0.040 -4.76 0.041 0.039 0.052 0.033 203,694 0.0% 318,614 29 100,000,000 63,379,600 158,449,000 12.19 16.91 5,201,008 31/12/2019 0.00 USD 14/10/2019
174 Sarwa Capital Holding EGP 3.850 -3.75 3.97 3.67 5.8 2.48 179,383 0.0% 47,356 21 1,196,974,000 4,608,349,900 191,515,840 11.34 9.07 2.60 406,513,085 31/12/2019 0.10 EGP 29/04/2020
175 South Cairo & Giza Mills & Bakeries EGP 13.530 0.37 13.76 13.45 16.96 12 171,502 0.0% 12,638 18 6,000,000 81,180,000 30,000,000 12.07 -45,614,000 30/06/2019 2.30 EGP 04/12/2018
176 Assiut Islamic Trading EGP 10.990 20.11 11.04 9.99 11.04 6.35 170,752 0.0% 16,187 14 6,684,653 73,464,336 66,846,530 10.17 16.91 4.55 7,222,274 31/12/2019 0.50 EGP 26/04/2020
177 Delta For Printing & Packaging EGP 15.000 6.53 15 14.04 15.88 7.6 156,920 0.0% 10,641 20 5,600,000 84,000,000 28,000,000 4.29 10.34 10.00 19,601,032 31/12/2019 1.50 EGP 08/04/2020
178 Kafr El Zayat Pesticides EGP 25.290 -0.08 25.6 24.66 29.75 17.1 119,170 0.0% 4,716 17 12,004,470 303,593,046 120,044,700 11.29 10.71 5.93 26,894,012 31/12/2019 1.50 EGP 30/04/2020
179Rubex International for Plastic and Acrylic Manufacturing
EGP 5.680 6.37 5.85 4.81 6.46 4.71 98,311 0.0% 17,602 22 20,000,000 113,600,000 100,000,000 17.01 21.98 6,677,875 31/12/2019 0.20 EGP 31/05/2012
180Modern Company for water proofing (Bitumode) EGP 3.500 0.00 3.5 3.45 3.9 1.29 97,500 0.0% 27,869 5 119,000,000 416,500,000 119,000,000 9.04 21.98 46,066,942 31/12/2019 0.39 EGP 17/10/2019
181El Arabia for Land Reclamation EGP 9.610 2.56 9.98 8.6 9.98 6.75 95,860 0.0% 10,225 22 5,200,000 49,972,000 26,000,000 79.60 21.17 627,809 30/06/2019 1.92 EGP 20/06/2010
182Modern Shorouk Printing & Packaging EGP 28.640 9.10 28.87 25.92 29.4 15.48 90,868 0.0% 3,173 21 13,101,000 375,212,640 131,010,000 9.08 10.34 6.98 41,335,458 31/12/2019 2.00 EGP 30/08/2020
183 Minapharm Pharmaceuticals EGP 77.150 2.87 81.8 76.89 93.44 64 76,909 0.0% 991 8 12,293,440 948,438,896 122,934,400 6.39 17.45 7.78 148,411,472 31/12/2019 6.00 EGP 29/06/2020
184Golden Textiles & Clothes Wool EGP 5.160 -1.71 5.76 5 5.85 4.55 74,131 0.0% 14,400 10 14,283,363 73,702,153 142,833,630 4.33 -10,700,097 31/12/2019 0.50 EGP 15/08/2018
185 Grand Investment Capital EGP 4.780 0.00 4.78 4.78 5.25 4 55,998 0.0% 11,715 3 7,800,000 37,284,000 39,000,000 9.07 -8,938,107 31/03/2020 0.20 Piaster 27/06/2010
186 Misr Oils & Soap EGP 15.380 9.86 15.4 14.46 18 13.1 55,257 0.0% 3,619 12 6,000,000 92,280,000 60,000,000 12.07 -15,594,168 30/06/2019 0.60 EGP 16/12/2012

# Stock Name CR Close Price
% Chg.
Max Price
Min Price
Max in52Wks
Min in52Wks
EGP Value Traded
% of Total
Volume Traded (Shares)
# of Trades
No. Listed Shares
Market Capital in EGP
Paid Capital in EGP
Trailing P/E
SectorP/E
DY% EGP Net Profit Net Profit Date
Last Coupon Pay Date
187 International Co For Investment & Development EGP 10.240 3.85 10.25 10 11.25 7.15 53,250 0.0% 5,225 3 9,000,000 92,160,000 45,000,000 35.43 16.75 2,601,042 31/12/2019 0.70 EGP 25/05/2008
188 Upper Egypt Flour Mills EGP 81.100 0.00 85 81.5 130 63.15 42,531 0.0% 519 9 7,000,000 567,700,000 70,000,000 3.26 12.07 13.56 174,128,709 30/06/2019 11.00 EGP 24/11/2019
189 Mohandes Insurance EGP 15.530 -2.69 16 14.37 17.77 7.48 36,329 0.0% 2,339 3 60,000,000 931,800,000 150,000,000 6.42 9.07 5.80 145,043,054 30/06/2019 0.90 EGP 18/12/2019
190 Alexandria New Medical Center EGP 31.370 0.00 31.35 29 34 18 34,724 0.0% 1,170 5 13,176,900 413,359,353 105,415,200 16.73 17.45 24,712,189 31/12/2019 0.40 EGP 31/07/2019
191 El Orouba Securities Brokerage EGP 0.501 0.00 0.551 0.494 0.614 0.451 26,727 0.0% 49,389 17 24,500,000 12,274,500 24,500,000 9.07 -844,051 31/12/2019 0.09 EGP 22/02/2010
192 National Housing for Professional Syndicates EGP 24.540 0.00 22.12 22.1 38.24 19.53 22,103 0.0% 1,000 3 16,000,000 392,640,000 160,000,000 486.41 16.75 807,219 31/12/2019 0.50 EGP 28/04/2011
193 El Kahera Housing EGP 11.460 0.00 10.82 10.46 13.53 9 22,033 0.0% 2,041 11 90,028,002 1,031,720,903 450,140,010 16.75 -20,789,921 31/12/2019 0.25 EGP 28/11/2013
194Alexandria National Company for Financial Investment
EGP 3.470 0.00 3.25 3.17 4.07 2.59 18,172 0.0% 5,610 7 5,225,000 18,130,750 26,125,000 9.07 -709,656 31/12/2019
195 Acrow Misr EGP 11.780 0.00 12.8 12.5 17.4 11.11 16,050 0.0% 1,260 4 55,054,690 648,544,248 550,546,900 3.76 21.17 172,697,256 31/12/2019 1.75 EGP 27/11/2019
196 Pyramisa Hotels EGP 20.000 0.00 19.32 19.3 25.72 16.74 3,129 0.0% 162 4 21,608,659 432,173,180 432,173,180 11.53 16.91 10.00 37,485,146 31/12/2019 2.00 EGP 11/06/2020
197 Cairo Educational Services EGP 9.800 0.00 9.09 9.09 11 8.19 1,818 0.0% 200 4 12,000,000 117,600,000 48,000,000 10.48 19.58 8.16 11,222,761 31/08/2019 0.80 EGP 31/12/2019
198 The Arab Dairy Products Co.Arab Dairy - Panda
EGP 5.100 0.00 4.6 4.6 6.99 3.9 1,403 0.0% 305 1 160,000,000 816,000,000 160,000,000 15.53 12.07 52,529,603 31/12/2019 0.50 EGP 29/04/2013
199 Sues Canal Company For Technology Settling
EGP 42.030 0.00 38 38 47 22.19 304 0.0% 8 1 90,900,000 3,820,527,000 909,000,000 8.02 19.58 5.95 476,618,000 31/08/2019 2.50 EGP 26/12/2019
Related Documents