~30% Smoking ~35% Unbalanced Diets Too Many Calories: Obesity Too Little Fiber & Micronutrients ~20% Chronic Infections Mostly in Poor Countries ~20% Hormones Breast, Endometrial, Etc. ~2% Occupation <1% Pollution Mostly Heavy Air Pollution The Causes of Cancer Total = 107% because of multiple causes

~30% Smoking ~35% Unbalanced Diets Too Many Calories: Obesity Too Little Fiber & Micronutrients ~20% Chronic Infections Mostly in Poor Countries ~20% Hormones.
Dec 19, 2015
Welcome message from author
This document is posted to help you gain knowledge. Please leave a comment to let me know what you think about it! Share it to your friends and learn new things together.
Transcript
~30% Smoking~35% Unbalanced Diets Too Many Calories: Obesity Too Little Fiber & Micronutrients~20% Chronic Infections Mostly in Poor Countries~20% Hormones Breast, Endometrial, Etc.~2% Occupation<1% Pollution Mostly Heavy Air Pollution
The Causes of Cancer
Total = 107% because of multiple causes

Epithelial
(Block, Patterson and Subar, Nutr. Canc., 18: 1-29, 1992)
Fruits and Vegetables Protect Against Cancer
Relative Risk (Median)Cancer Site
Fraction of Studies Showing a Protective Effect (p=0.05)
LungOral LarynxEsophagusStomachPancreasCervixBladderColorectalMiscellaneous
BreastOvary/EndometriumProstate
Hormone-Dependent
24/259/94/4
15/1617/199/117/83/5
20/356/8
2.22.02.32.02.52.82.02.11.9-
8/143/4
4/14
1.31.81.3
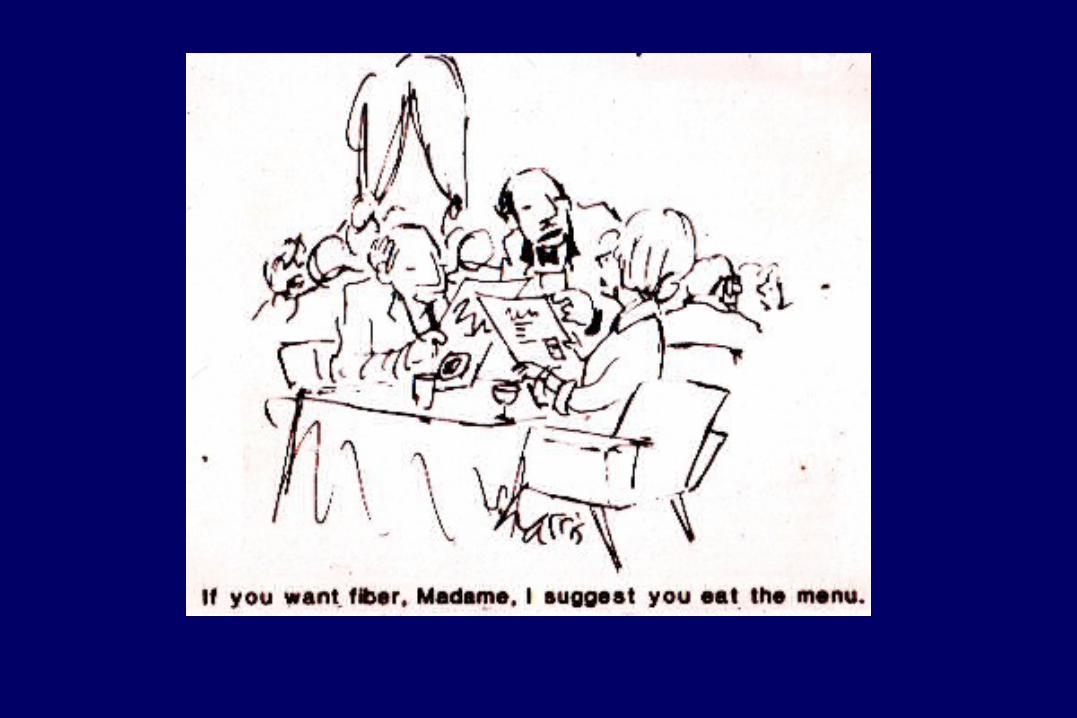

Energy Sources 1999-2000Energy Sources 1999-2000 Cumulative Cumulative
FoodFood Percentage Percentage
1. SOFT DRINKS 7.1
2. CAKE, PASTRIES, & DOUGHNUTS 10.6
3. HAMBURGERS & CHEESEBURGERS 13.8
4. PIZZA 16.8
5. POTATO CHIPS, CORN CHIPS, POPCORN 19.7
6. RICE 22.4
7. ROLLS, BUNS, MUFFINS, & BAGELS 25.0
8. CHEESE & CHEESE SPREAD 27.6
9. BEER 30.2
10. FRENCH FRIES, FRIED POTATOES 32.4
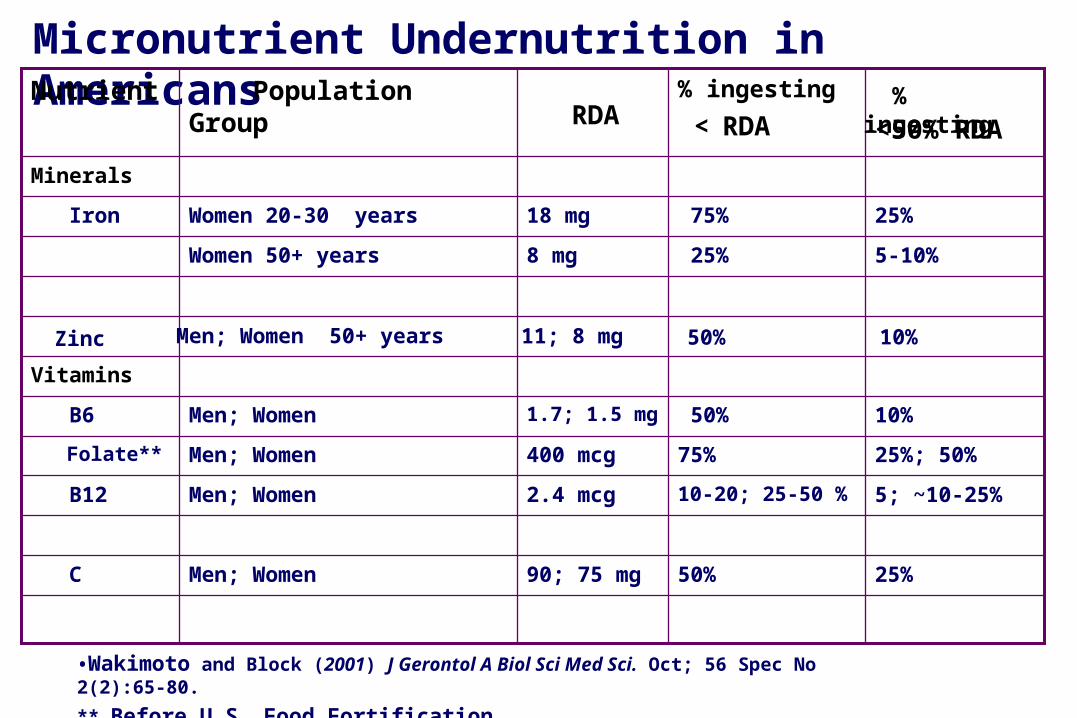
Micronutrient Undernutrition in Americans
25%50%90; 75 mgMen; Women C
5; ~10-25%10-20; 25-50 %2.4 mcgMen; Women B12
25%; 50%75%400 mcgMen; Women Folate**
10% 50%1.7; 1.5 mgMen; Women B6
Vitamins
5-10% 25%8 mgWomen 50+ years
25% 75%18 mgWomen 20-30 years Iron
Minerals
<50% RDA
% ingesting
< RDA Population GroupNutrient
•Wakimoto and Block (2001) J Gerontol A Biol Sci Med Sci. Oct; 56 Spec No 2(2):65-80.
** Before U.S. Food Fortification
RDA % ingesting
Zinc Men; Women 50+ years 11; 8 mg 50% 10%

dUMP dTMP
Methionine
SHMT
B6
Serine
MTHFR
Homocysteine
(polymorphism)
TS
MS
CH2=THF
B12CH3-THF

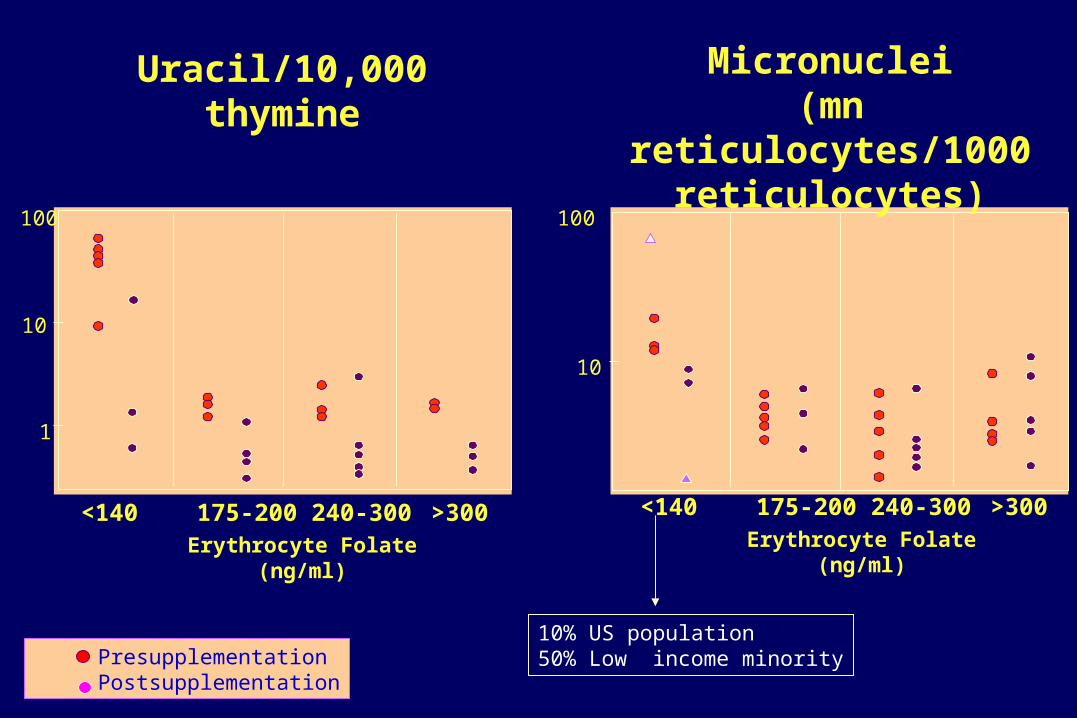
Micronuclei in: RNA positive reticulocytes RNA negative erythrocytes
Folic AcidFolinic Acid
TIME (DAYS)1 yearpreRx
Normalrange
Mic
ronu
clei
per
100
0 ce
lls
20
50 100 150 200 250 300 350
0
30
40
80
130
Presupplementation Postsupplementation
1
10
100
Uracil/10,000 thymine
10
100
Micronuclei(mn reticulocytes/1000
reticulocytes)
Erythrocyte Folate (ng/ml)
10% US population50% Low income minority
<140 175-200 240-300 >300
Erythrocyte Folate (ng/ml)
<140 175-200 240-300 >300

xx
PLASMA FOLATE (NG/ML)
MIN
PC
Es/
1000
PC
Es
60
50
40
30
20
10
00 5 10 15 20 25 30


0
0.5
1
1.5
2
2.5
3
3.5
0 2 4 6 8 10 12
Vitamin B-6 Intake
Human Lymphocyte DNA Strand Breaks (Comet Assay) vs. B-6 Intake
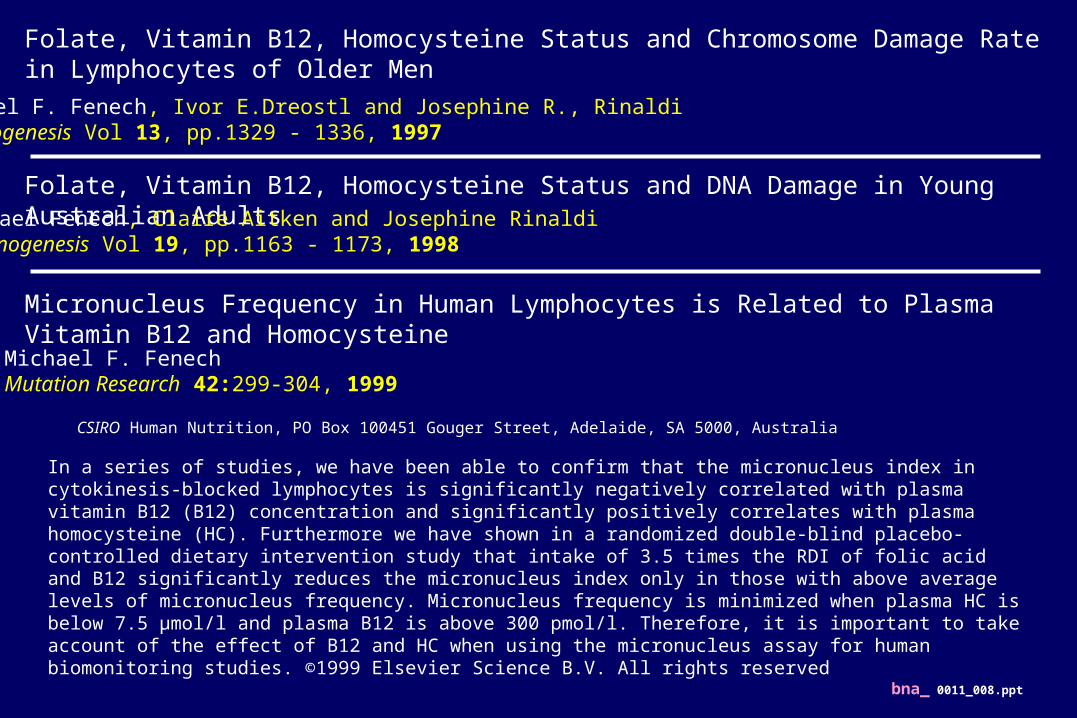
Folate, Vitamin B12, Homocysteine Status and Chromosome Damage Rate in Lymphocytes of Older Men
Michael F. Fenech, Ivor E.Dreostl and Josephine R., RinaldiCarcinogenesis Vol 13, pp.1329 - 1336, 1997
Folate, Vitamin B12, Homocysteine Status and DNA Damage in Young Australian AdultsMichael Fenech, Claire Aitken and Josephine RinaldiCarcinogenesis Vol 19, pp.1163 - 1173, 1998
Micronucleus Frequency in Human Lymphocytes is Related to Plasma Vitamin B12 and HomocysteineMichael F. FenechMutation Research 42:299-304, 1999
bna_ 0011_008.ppt
In a series of studies, we have been able to confirm that the micronucleus index in cytokinesis-blocked lymphocytes is significantly negatively correlated with plasma vitamin B12 (B12) concentration and significantly positively correlates with plasma homocysteine (HC). Furthermore we have shown in a randomized double-blind placebo-controlled dietary intervention study that intake of 3.5 times the RDI of folic acid and B12 significantly reduces the micronucleus index only in those with above average levels of micronucleus frequency. Micronucleus frequency is minimized when plasma HC is below 7.5 µmol/l and plasma B12 is above 300 pmol/l. Therefore, it is important to take account of the effect of B12 and HC when using the micronucleus assay for human biomonitoring studies. ©1999 Elsevier Science B.V. All rights reserved
CSIRO Human Nutrition, PO Box 100451 Gouger Street, Adelaide, SA 5000, Australia

Mean uracil content in sperm DNA from 23 men on diets low in fruits and
vegetables
14
12
10
8
6
4
2
0
DC uracil in DNA
Folate Deficiency Study epididymal Sperm Count
100
50
0
Epididymal Sperm

0.07
Seminal plasma folates vs. semen quality
Correlation coefficient (r); n=48
Total Sperm Count (105)Seminal Plasma Sperm Density (106/mL)
Non-methyl THF(methylene-THF, etc.)
5-Methyl THF
*p<0.05
* 0.31* 0.37
0.08
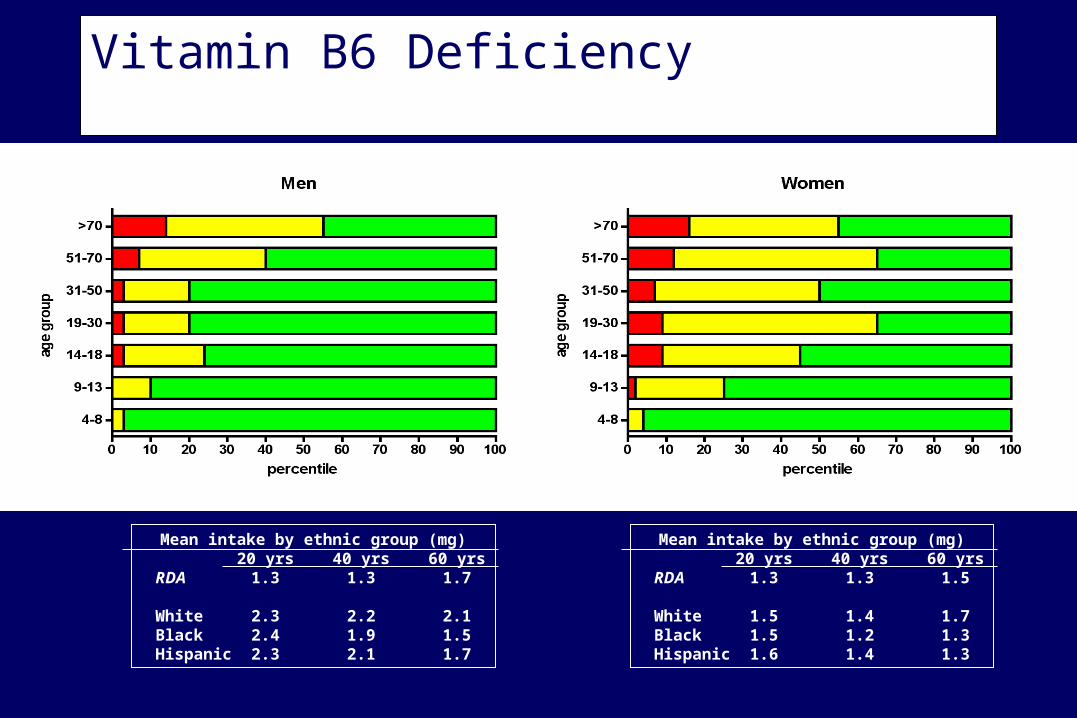
Vitamin B6 Deficiency
Mean intake by ethnic group (mg)20 yrs 40 yrs 60 yrs
RDA 1.3 1.3 1.7
White 2.3 2.2 2.1Black 2.4 1.9 1.5Hispanic 2.3 2.1 1.7
Mean intake by ethnic group (mg)20 yrs 40 yrs 60 yrs
RDA 1.3 1.3 1.5
White 1.5 1.4 1.7Black 1.5 1.2 1.3Hispanic 1.6 1.4 1.3
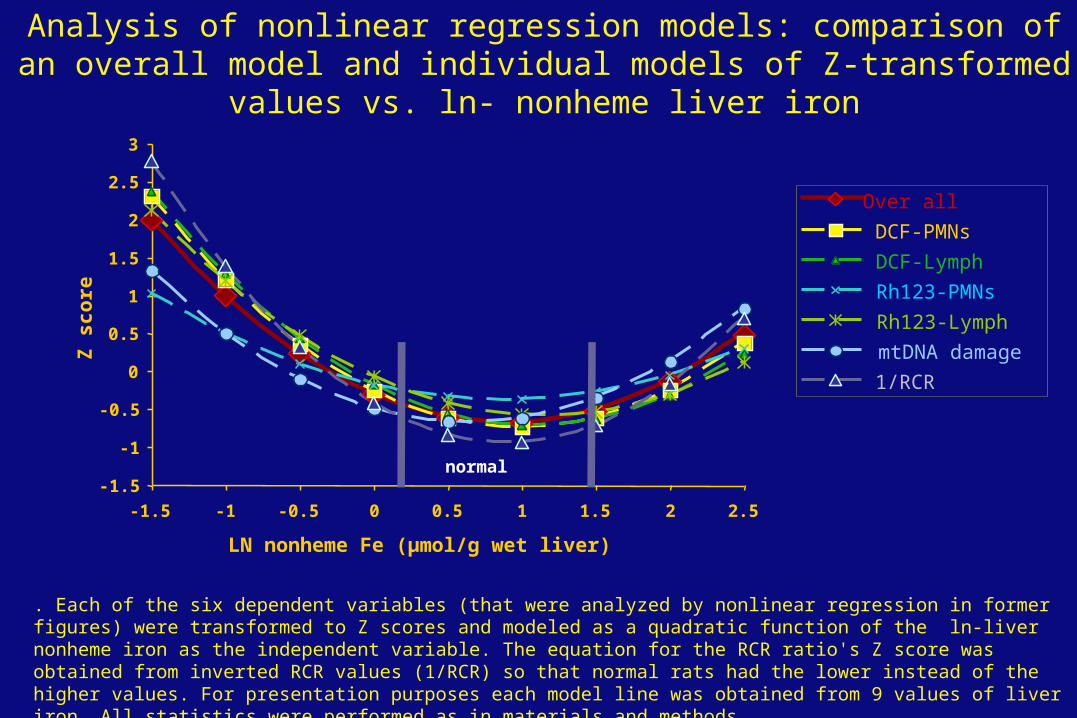
. Each of the six dependent variables (that were analyzed by nonlinear regression in former figures) were transformed to Z scores and modeled as a quadratic function of the ln-liver nonheme iron as the independent variable. The equation for the RCR ratio's Z score was obtained from inverted RCR values (1/RCR) so that normal rats had the lower instead of the higher values. For presentation purposes each model line was obtained from 9 values of liver iron. All statistics were performed as in materials and methods.
Analysis of nonlinear regression models: comparison of an overall model and individual models of Z-transformed values vs. ln- nonheme liver iron
Over all
DCF-PMNs
DCF-Lymph
Rh123-PMNs
Rh123-Lymph
mtDNA damage
1/RCR
-1.5
-1
-0.5
0
0.5
1
1.5
2
2.5
3
-1.5 -1 -0.5 0 0.5 1 1.5 2 2.5
LN nonheme Fe (µmol/g wet liver)
Z s
co
re
normal

Heme deficiency induces oxidative stress
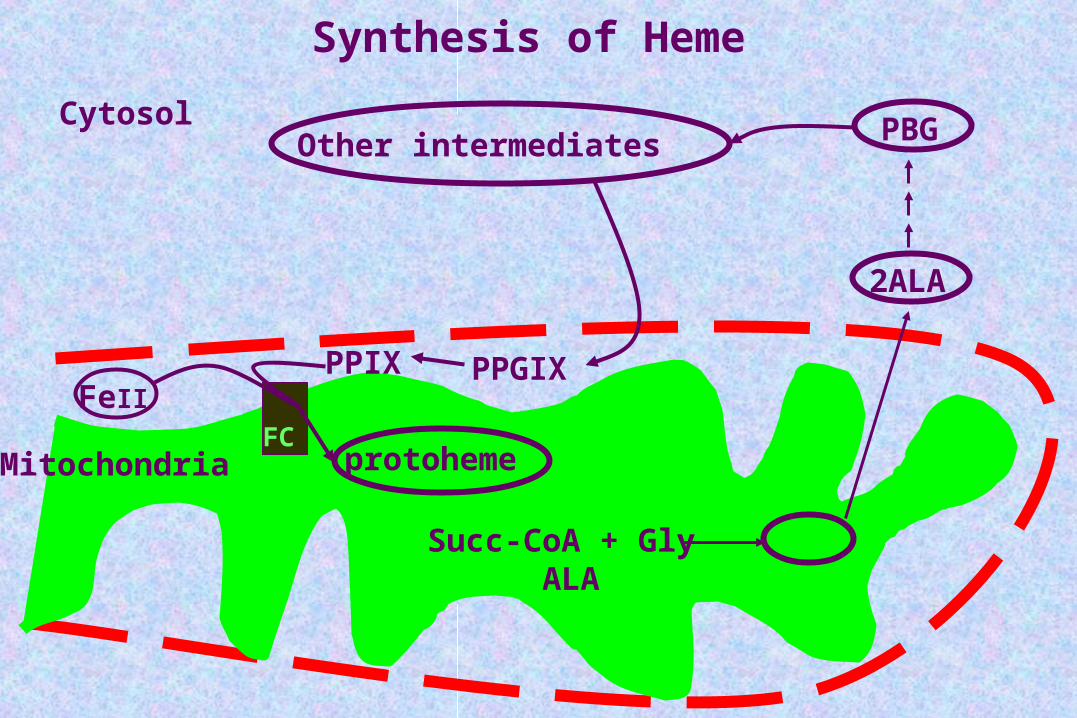
Succ-CoA + Gly ALA
2ALA
PBGOther intermediatesCytosol
PPIX PPGIX
protoheme
FeII
MitochondriaFC
Synthesis of Heme

9) Atamna et al (2001) JBC. 10) Atamna et al (2002) ABB. 11) Atamna et al (2002) PNAS.
Similarity Between the Consequences of Heme Deficiency and Normal Aging/neurodegeneration
Factor in Study Heme Deficiency Aging/Neurodegeneration
Complex IVIronOxidative StressAPP
NOSCell-cycle anddifferentiationMetabolismCalciumFerrochelataseHeme synthesis
Loss of complex IVAccumulationIncreasedDecreased andaggregate appearIncreasedDisabled differentiationor proliferationMitochondrial declineCorruptedIncreasedDecreased
Loss of complex IVAccumulationIncreaseddimmer or aggregate
IncreasedLoss of Axons; neuronal deathHypometabolismCorruptedIncreased in senescent cellsDecreased with age**
9
99
9,10
911
11
10
11
11
9*
*Not Determined in vivo. **Not determined in the aging brain
1994-96, 1998 CSFII Study, USDA


20
40
6080
100
120
140
Control ZnAD ZnDF
DC
F F
luo
resc
ence
In
ten
sity
(R
FU
)
Zinc Deficiency Induces IncreasedOxidative Stress in C6 Glioma Cells
*
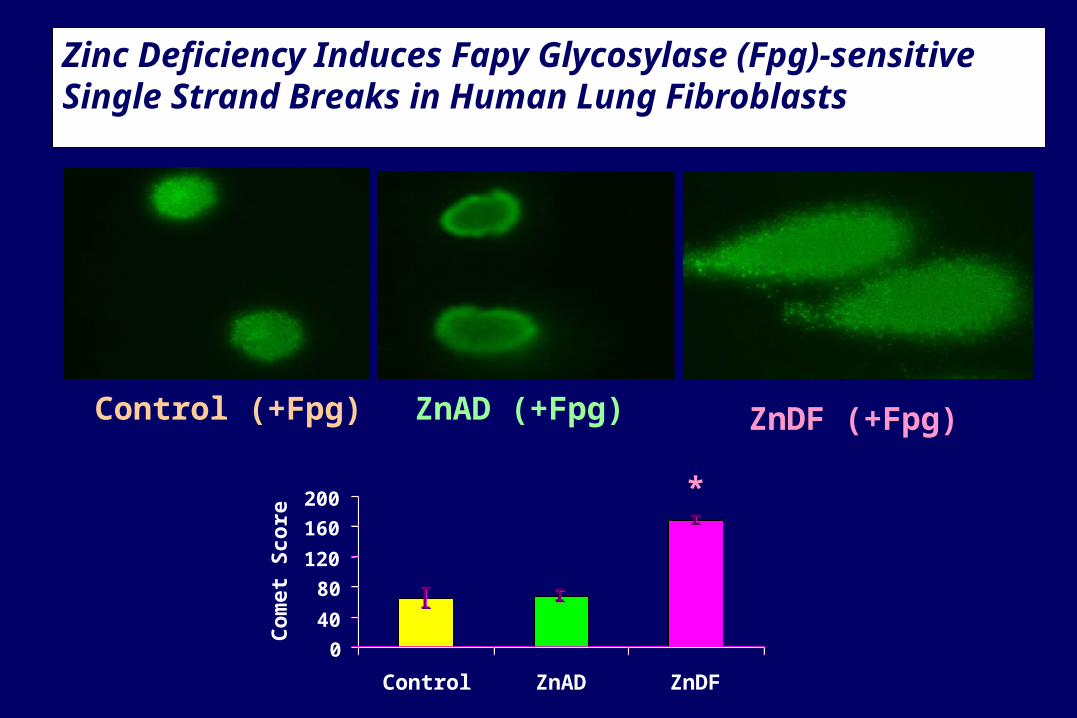
Zinc Deficiency Induces Fapy Glycosylase (Fpg)-sensitive Single Strand Breaks in Human Lung Fibroblasts
0
40
80
120
160
200
Control ZnAD ZnDF
Co
met
Sco
re
Control (+Fpg) ZnAD (+Fpg) ZnDF (+Fpg)
*

Zinc Deficiency
Mean intake by ethnic group (mg)20 yrs 40 yrs 60 yrs
RDA 11 11 11
White 15 14 13Black 16 13 10Hispanic 15 15 11
Mean intake by ethnic group (mg)20 yrs 40 yrs 60 yrs
RDA 8 8 8
White 9 10 10Black 10 8 8Hispanic 11 9 8


“The main distinguishing characteristicbetween man and the lower animals
is the desire to take pills”
Mark Twain

1994-96, 1998 CSFII Study, USDA
ACKNOWLEDGEMENTS Children’s Hospital Oakland Research Institute
University of California at Berkeley
Dr. Hani AtamnaDr. Ronit Erlitski, Dr. David KillileaMs. Susan Mashiyama, Dr. Lynn Wallock,Dr. Patrick Walter Dr. Arnold Huang, Dr. Mitch KnutsonDr. Chantal CourtemancheDr. Emily Ho, Prof.Fernando Viteri
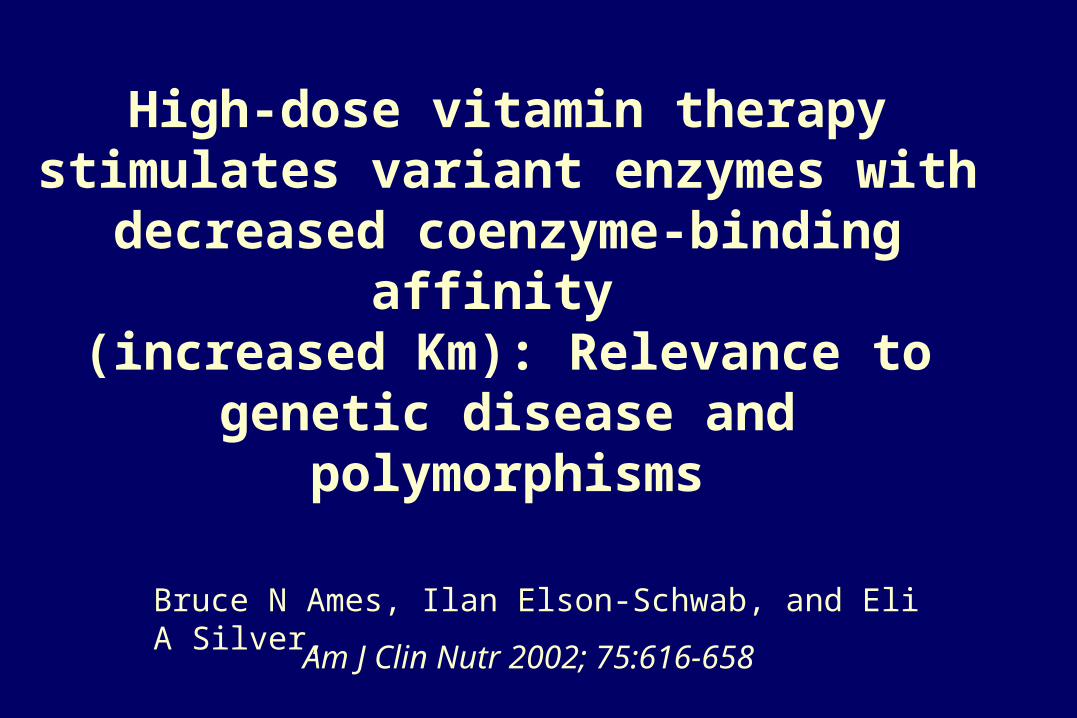
High-dose vitamin therapy stimulates variant enzymes with decreased
coenzyme-binding affinity (increased Km): Relevance to genetic
disease and polymorphisms
Am J Clin Nutr 2002; 75:616-658
Bruce N Ames, Ilan Elson-Schwab, and Eli A Silver,

Many genetic diseases in humans are ameliorated by the administration of high levels of vitamins. An appreciable percentage of mutations in a gene, perhaps a third, results in the corresponding enzyme having an increased Km (poorer binding affinity) for a coenzyme or substrate, resulting in a lower rate of reaction. Because the intracellular concentration of coenzyme can often be increased therapeutically, enzymatic activity can be restored at least partially, and the disease phenotype cured or ameliorated. We have documented about 50 human genetic diseases involving dysfunctional enzymes which can be remedied or ameliorated by high levels of the vitamin component of the coenzyme, and a number of other genetic diseases, including some due to polymorphisms, where this approach may be useful.
Summary of Work

Mitochondrial Ornithine Amino Transferase & Gyrate Atrophy of the Choroid and Retina• Defective OAT leads to
accumulation of ornithine and sight degradation.
• The Km of OAT for PLP (B6 cofactor) is increased (7 - 20x) in ~5% of patients.
• B6 therapy lowers ornithine levels.

Genetic disorders affect micronutrient sufficiency of the following vitamins and nutrients
11. Tetrahydrobiopterin12. S-Adenosyl Methionine13. Pantothenic Acid14. Lipoic Acid15. Carnitine16. Hormones17. Amino Acids18. Metals19. Maxi B Vitamins
1. Pyridoxine (Vitamin B6)2. Thiamine (Vitamin B1)3. Riboflavin (Vitamin B2)4. Niacin (Vitamin B3)5. Biotin (Vitamin B7)6. Cobalamin (Vitamin B12)7. Folic Acid8. Vitamin K9. Vitamin D10. Vitamin E

A number of polymorphisms affect coenzyme binding and may be remediable
by high-dose vitamins
• Methylenetetrahydrofolate Reductase C677T and FAD
• Glucose-6-Phosphate Dehydrogenase A44G and NADP
• NAD(P):Quinone Oxidoreductase 1 (DT-diaphorase) P187S and FAD
• Aldehyde Dehydrogenase E487K and NAD
• Short-Chain Acyl-CoA Dehydrogenase G209S and FAD


O2 O2-
e- e- e- e-
H2O2 •OH H2O
2

MitochondrialMatrix
Cellular Cytoplasm
Mitochondrial Outer MembraneMitochondrial Outer Membrane
Inner MembraneInner Membrane
IntermembraneSpace
VV
IIIIII
IIIIIIIVIV
CytCCytCCoQCoQ
HH++
PyruvateDehydrogenasecomplex
Citrate Synthase
-Ketoglutarate Dehydrogenase
Complex
Fumarate
L-Malate
Oxaloacetate
Acetyl-Co-A Citrate Isocitrate
-Ketoglutarate
Succinyl-Co-A
Succinate
FADFADH2
CITRICACID
CYCLE
H2OO2 ADP
ATP
ATP
NADH
NADH
NADH
NAD+
NADHNADH
HH++
HH++
HH++ HH++
HH++HH++HH++
HH++
HH++HH++
HH++ HH++HH++
HH++
HH++
HH++
HH++ HH++HH++
HH++
HH++
HH++
9
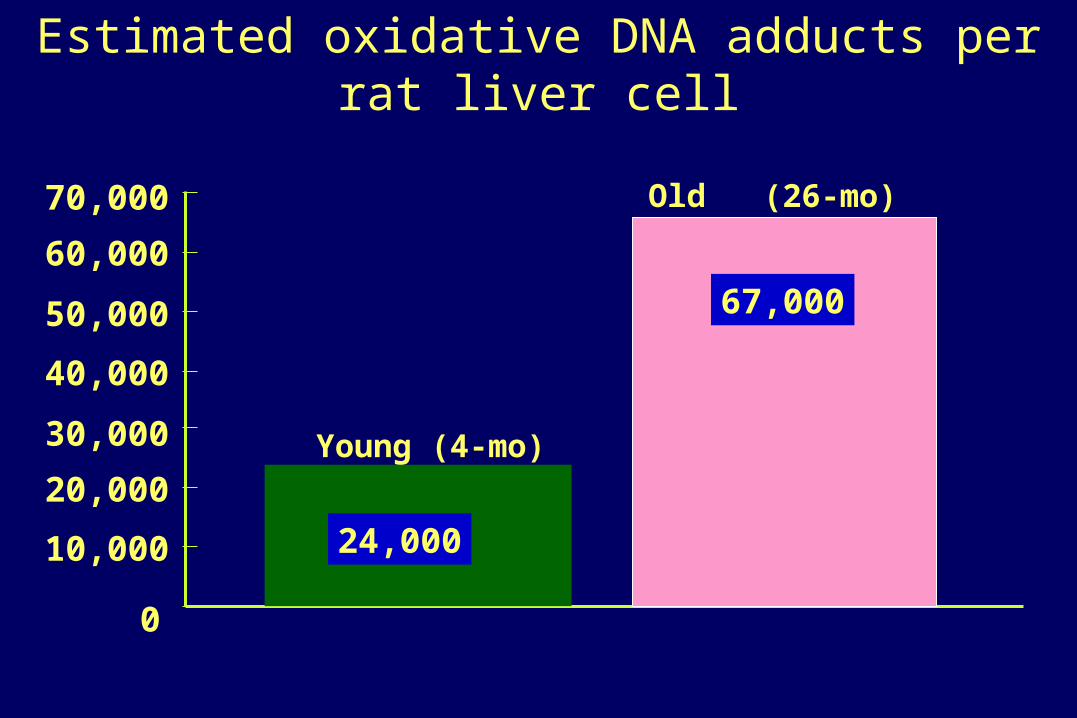
Estimated oxidative DNA adducts per rat liver cell
0
Old (26-mo)
Young (4-mo)
70,000
60,000
50,000
40,000
30,000
20,000
10,000 24,000
67,000
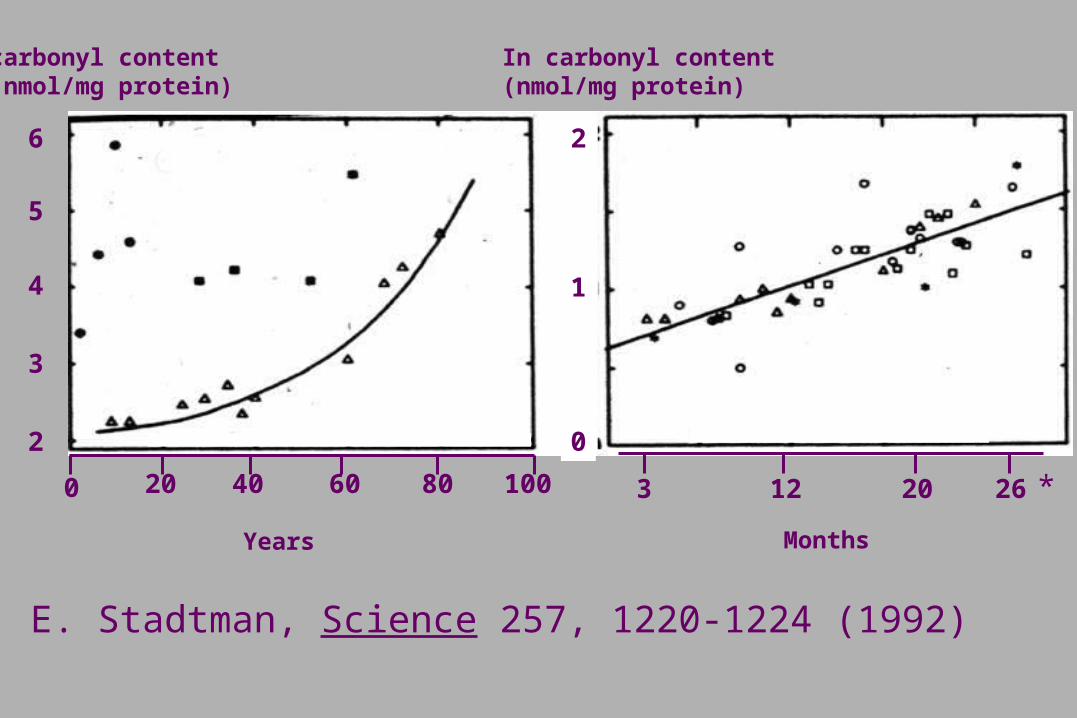
E. Stadtman, Science 257, 1220-1224 (1992)
carbonyl content(nmol/mg protein)
In carbonyl content(nmol/mg protein)
6
5
4
3
2
2
1
0
1000
Years
20 40 60 80
Months
3 12 20 26 *

Effect of ALCAR Supplementation on Cardiolipin Levels
Young
Ca
rdio
lipin
(µ
g p
er 1
0 c
ells
) 30
20
10
0
14
+ ALCAR
Old
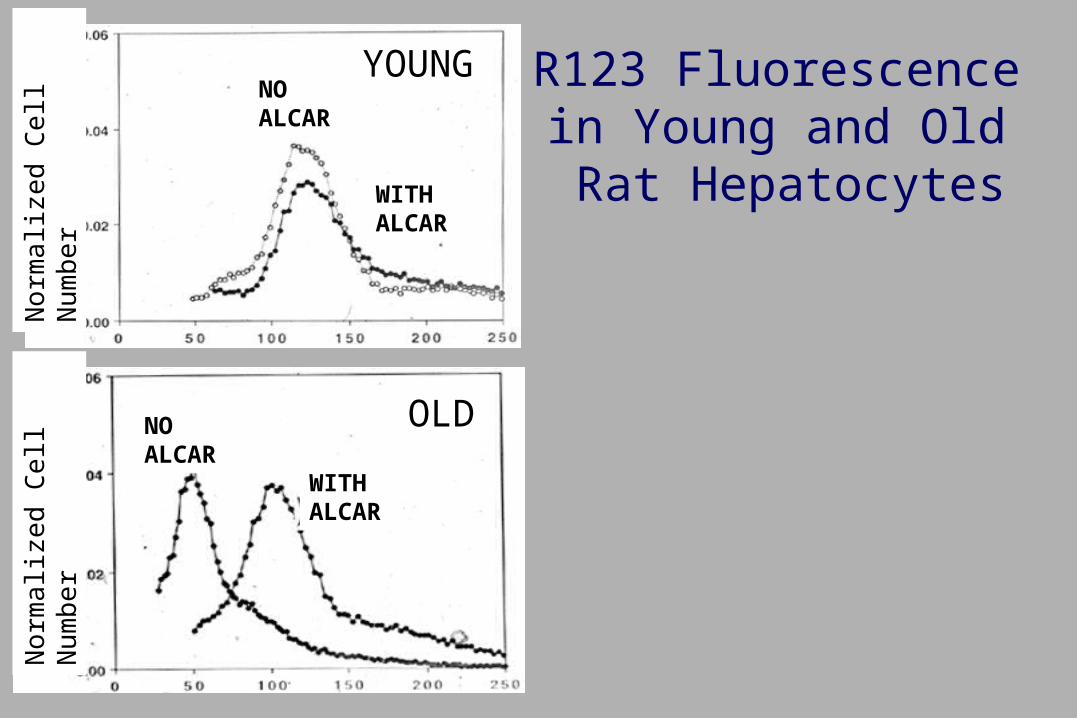
R123 Fluorescence in Young and Old Rat Hepatocytes
YOUNG
OLD
WITHALCAR
WITHALCAR
NOALCAR
NOALCAR
No
rma
lize
d C
ell
Nu
mb
er
No
rma
lize
d C
ell
Nu
mb
er

Lipoic Acid Lowers Mitochondrial Oxidants in Old RatsF
l. U
nit
s/O
2 C
on
sum
ed p
er M
inu
te
20
10
0Young Old
17
+ LA+ LA
**
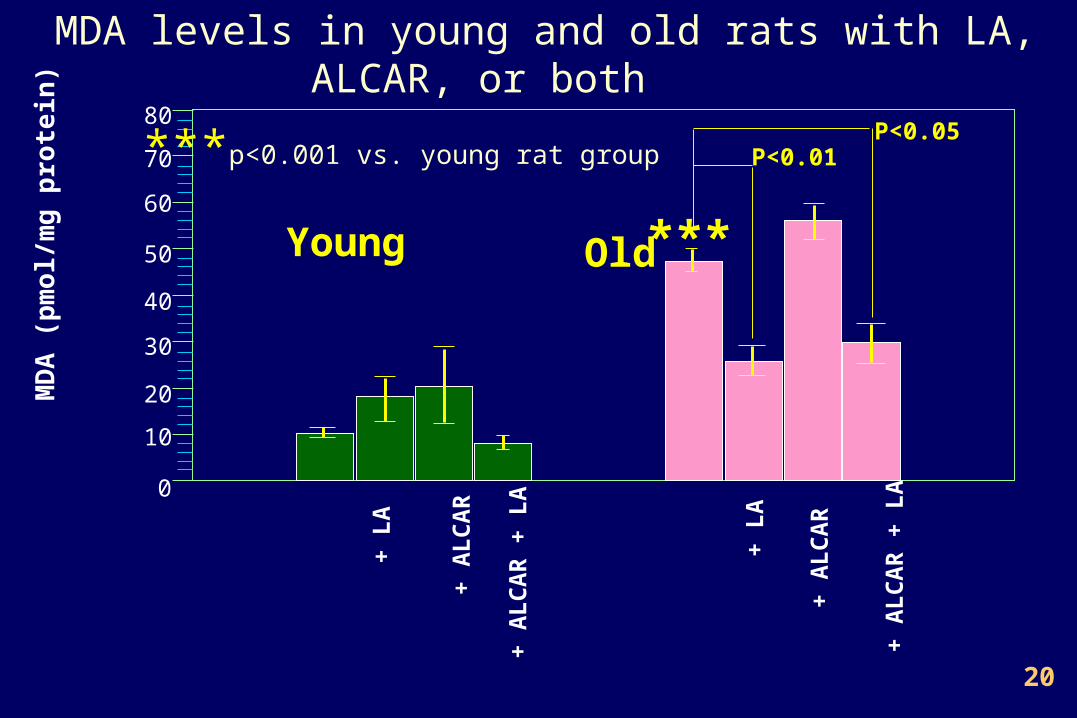
MDA levels in young and old rats with LA, ALCAR, or both
Young Old
MD
A (
pm
ol/m
g p
rote
in)
60
0
50
10
40
30
20
70
80
P<0.01P<0.05
***
+ L
A
+ A
LC
AR
+ A
LC
AR
+ L
A
+ L
A
+ A
LC
AR
+ A
LC
AR
+ L
A
20
***p<0.001 vs. young rat group

0
10
20
30
p<0.01
T c
ell
stim
ula
tio
n i
nd
ex
Young
Young Tre
ated
Old T
reat
edOld
Age-associated decrease in immune function and the effect of ALCAR (0.2%) + LA (0.1%) treatment for 2 months. Values are mean + SEM of 10-11 animals.
P<0.001

Ambulatory Activity before and After Supplementation with Lipoic Acid (LA) + Acetyl-L-Carnitine (ALCAR)
0
200
400
600
800
+ L
A +
AL
CA
R
OldYoung
+ L
A +
AL
CA
R
*
Dis
tan
ce
Tra
vel
ed
(c
m/h
ou
r/d
ay
)
*#
#
vs. young
vs. old
*
P<0.001
20
100
80
60
40
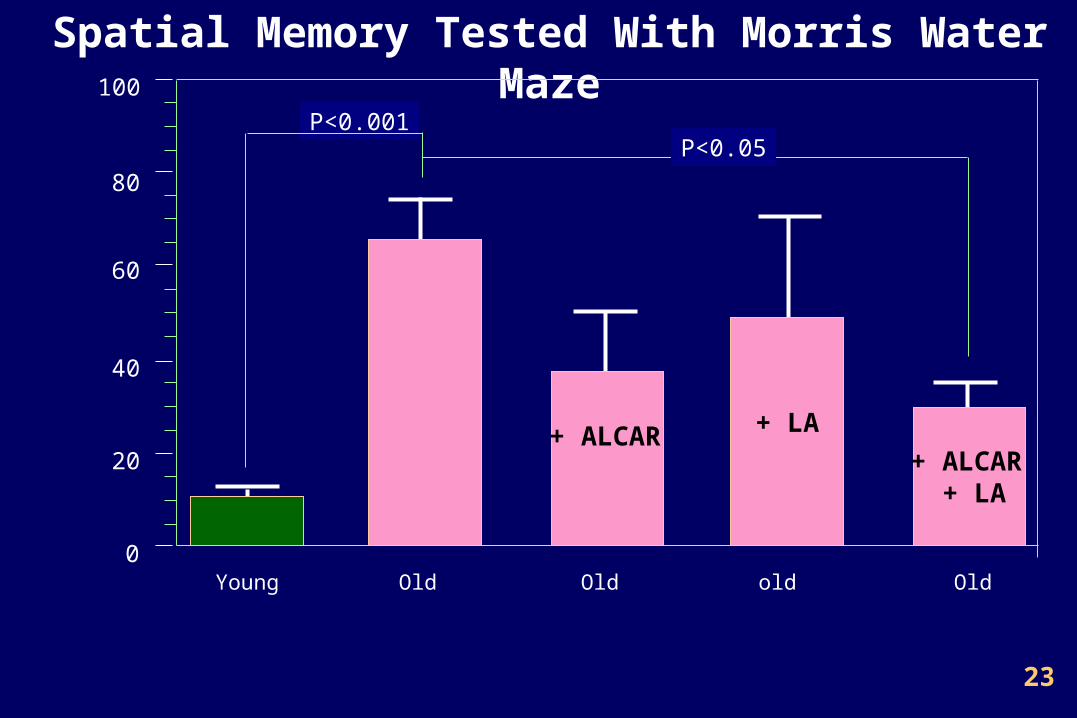
Spatial Memory Tested With Morris Water Maze
Young Old Old old Old 0
P<0.05
23
+ ALCAR + LA
+ ALCAR + LA

0.00
2.00
4.00
6
8
10
12
14
SOUND: Time to Signal
0 50 100 150 200
Young
Old
Old + ALCAROld + LA
Old + ALCAR + LA
0.00
2.00
4.00
6.00
8.00
10.00
12.00
LIGHT: Time to Signal
0 50 100 150 200
Peak procedure: for measuring temporal memory. Associated with striatum, cerebellum, & hippocampus
PEAK RATE: measures learning and motivation.
PEAK TIME: measures internal clock, food is rewarded only when animals push lever 40s after sound or light signal
25

Oxidative Damage to Nucleic Acid in Old Rats by mAb to oxo8G/oxo8dG: Immunohistochemical stain of neurons
26
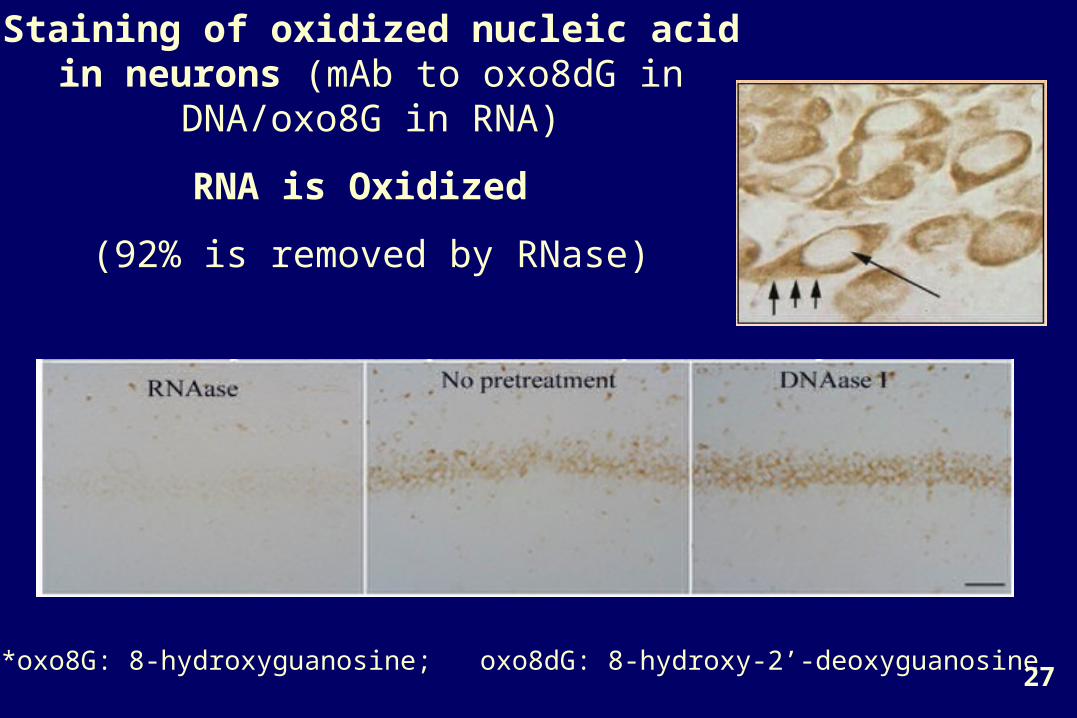
Staining of oxidized nucleic acid in neurons (mAb to oxo8dG in DNA/oxo8G in RNA)
RNA is Oxidized
(92% is removed by RNase)
*oxo8G: 8-hydroxyguanosine; oxo8dG: 8-hydroxy-2’-deoxyguanosine27
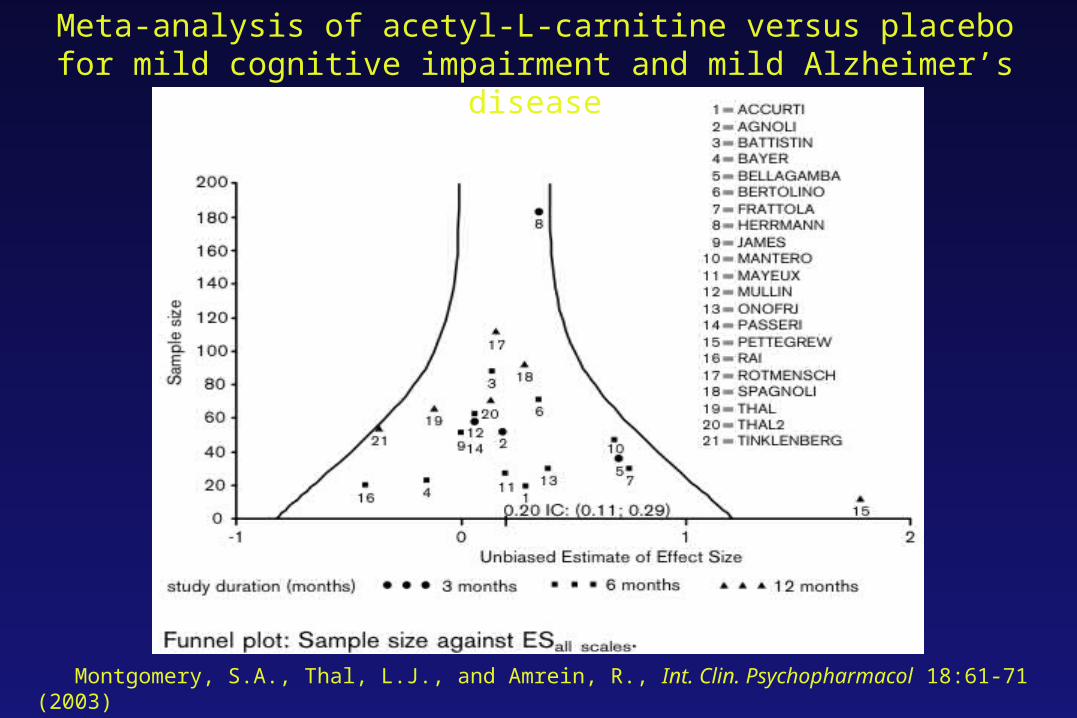
Meta-analysis of acetyl-L-carnitine versus placebo for mild cognitive impairment and mild Alzheimer’s disease
Montgomery, S.A., Thal, L.J., and Amrein, R., Int. Clin. Psychopharmacol 18:61-71 (2003)

* #
nm
ol/m
in/g
1200
800
400
0
#
M
150
100
50
0Km for ALCAR
Km for CoA
**
##
#**
403020100-10
5
10
0
5
10
0200150100500-50
1/[ALCAR, mM] 1/[CoA, mM]
Vmax
young old = vs. young
# = vs. old
1/v 1/v
*

B
CC
A
29

80
75
70
65
60
55
50
45
401900 1910 1920 1930 1940 1950 1960 1970 1980 1990
46.4
4950.1
53.654.5
56.3
5861.3 61.4
65.7 65.666.7
71.173.2
74.9
77.578.9
71.469.9
67.1
Life Expectancy of Men and Women at Birth
SOURCE: National Institute on Aging
ACKNOWLEDGEMENTSChildren’s Hospital Oakland Research Institute
University of California at BerkeleyUniversity of California at Irvine
Linus Pauling Institute, Oregon State University
Dr. Jiankang LiuDr. Tory HagenDr. Afshin GharibDr. David KillileaDr. Patrick WalterDr. Hani AtamnaDr. Emily Ho
Dr. Elizabeth HeadDr. Carl W. Cotman
35
Related Documents