FACTSHEET 30 June 2017

Welcome message from author
This document is posted to help you gain knowledge. Please leave a comment to let me know what you think about it! Share it to your friends and learn new things together.
Transcript

1
FACTSHEET30 June 2017

2
Index
Commentary - Equity Outlook 1
Commentary - Debt Outlook 4
IDFC Classic Equity Fund 5
IDFC Sterling Equity Fund 6
IDFC Premier Equity Fund 7
IDFC Focused Equity Fund 8
IDFC Equity Fund 9
IDFC Nifty Fund 10
IDFC Infrastructure Fund 11
IDFC Tax Advantage (ELSS) Fund 12
IDFC Arbitrage Fund 13
IDFC Arbitrage Plus Fund 14
IDFC Sensex Exchange Traded Fund 15
IDFC Nifty Exchange Traded Fund 15
IDFC Dynamic Equity Fund 16
IDFC Balanced Fund 17
IDFC Monthly Income Plan 18
IDFC Asset Allocation Fund of Funds 19
IDFC All Seasons Bond Fund 20
IDFC Cash Fund 21
IDFC Ultra Short Term Fund 22
IDFC Money Manager Fund – Treasury Plan 23
IDFC Money Manager Fund – Investment Plan 24
IDFC Banking & PSU Debt Fund 25
IDFC Super Saver Income Fund – Short Term 26
IDFC Corporate Bond Fund 27
IDFC Credit Opportunities Fund 28
IDFC Super Saver Income Fund – Medium Term 29
IDFC Super Saver Income Fund – Investment Plan 30
IDFC Dynamic Bond Fund 31
IDFC Government Securities Fund – Short Term Plan 32
IDFC Government Securities Fund – Provident Fund Plan 33
IDFC Government Securities Fund – Investment Plan 33
Performance Table 34
SIP Performance 37
Dividend History 39
Fund Manager Details 41
Investment Objective 41

1
WHAT WENT BY
At the half way mark of 2017, the NIFTY, NSE Mid Cap and NSE Small cap returns from the bottom of Aug-13 had climbed to 80%, 175% and 184% respectively for the three indices. The current bull market started when the taper tantrum was getting calmed by August-2013 – the “heroic” Dr Rajan took over as RBI Governor in September ‘13. Announcement of Mr Narendra Modi as the BJP’s Prime Ministerial candidate, brought hope of political stability and the first cracks in India’s FX nemesis – crude oil and gold were getting visible. The unexpected improvement in both these commodities and an unprecedented political victory for the BJP were the early drivers of the current uptrend.
To understand where we stand in the current bull market, we have compared it to the market movement from 2001-2007, which includes the great bull run of 2003-07. The 2001-2007 market movement could be divided into 2 phases:
Phase 1 – Market anticipation of an earnings recovery, returns from PE rerating: Markets bottomed in Sep-2001, after a sharp fall post 9/11. For the next 2 years, till December-03, markets rallied sharply in anticipation of an eco-nomic recovery. For the period Sep-01 to Dec-03, NIFTY, NSE Mid Cap and NSE Small Cap gave annualized returns of 38%, 66% and 77% respectively. But these returns were more in hope of an earnings recovery, as actual Sensex EPS grew -4% CAGR during the period. As in case of an economic recovery, market expected mid & small caps to post higher earnings growth and hence these stocks gave almost 2x returns as compared to large cap stocks.
Phase 2 – Earnings growth driving markets, returns driven by strong earnings growth: From Dec-03 onwards, markets first corrected over the next few months on account of earnings disappointment and 2004 general elec-tion outcome going against the consensus expectations. Markets recovered as earnings picked up from 2004 onwards. SENSEX earnings grew at a strong 23% CAGR over the 4-year period from 2003-2007. This earnings recovery boosted markets further resulting in a more broad based rally – NIFTY, NSE Mid Cap and NSE Small Cap annualized returns of 34%, 40% and 52% respectively. Return dispersion between large / mid and small caps nar-rowed as compared to the Phase 1, primarily driven by earnings growth across market segments.
EarningCAGR
ReturnCAGR
EarningCAGR
ReturnCAGR
EarningCAGR
ReturnCAGR
SENSEX Index -4% 38% 23% 37% 4% 16%NIFTY Index 38% 23% 34% 4% 17%NIFTYJR Index 66% 38% 8% 28%NSEMCAP Index 77% 40% 6% 30%NSESMCP Index 52% -1% 32%
BSE500 Index 57% 21% 38% 4% 21%
Sep'01 to Dec'03 Dec'03 to Dec'07 Dec'13 to Jun-17
Source: Bloomberg
In the current bull market, we seem to be similar to Phase 1 of the 2001-07 period: Coming back to the current rally, from the bottom of Aug-13 to Jun-17, earnings have only growth at an annualized rate of 4%. But NIFTY, NSE Midcap and NSE Smallcap indices have generated annualized returns of 17%, 30% and 32% respectively in antici-pation of an earnings recovery. As in the previous rally, mid & small cap indices have given almost 2x returns as compared to large caps.
The next leg of the rally has to be driven by strong earnings growth. We have seen a 5 year period of very low earn-ings growth. If we look at decadal earnings growth,
from 1993-2000, Sensex EPS grew at a CAGR of 18%;•
between 2000-2010, Sensex EPS grew at a CAGR of 15%•
between 2010-2017, SENSEX EPS has grown at a CAGR of only 7%•
In the long term, earnings growth should mirror nominal GDP growth and with nominal GDP growing double digits, earnings are expected to catch up. An EPS CAGR of 17% from 2017-2021 will push the decadal earnings growth to only 10%.
Commentary - Equity OutlookMr. Anoop Bhaskar Head - Equity

2
-
500
1,000
1,500
2,000
2,500
3,000 Sensex EPS
1990s:1993-2000EPS Growth Rate 18%
2000s:2000-2010EPS Growth Rate 15% 2010s:
2010-2017EPS Growth Rate 7%
EPS CAGR of 17% from 2017-2021 willonly push up 2010-2021 earningsGrowth to 10%
Source: Bloomberg, Internal Research
Initial green shoots of earnings recovery are visible in the last couple of quarters with BSE200 earnings growth of 16% in both Q3 and Q4 FY 17. This is the highest earnings growth posted since Sep-13. FY 17 earnings for the BSE200 Index grew 10% as compared to 5%, 8%, 6%, -3% in FY 13, FY 14, FY 15 and FY 16 respectively. The immedi-ate recovery will be led by cyclicals like corporate banks, commodities and oil & gas sectors. In the medium term, we expect discretionary sectors like Autos, Cement, and Building Materials etc., to post robust earnings growth.
Finally a word on GST, which has been implemented from 1st July 2017. This is expected to change the way busi-ness is done. Though, a near term disruption is expected as unorganized and small businesses grapple to come to terms with a more ‘organized’ way of doing business, GST is expected to be beneficial to the economy over the long term improving efficiency and tax compliance.
We expect the shift from ‘unorganized to organized’ to be more gradual as loop holes in the implementation get ironed out over time. We also expect unorganized businesses to adapt their business models or get organized in an effort to remain relevant.
Going forward, we expect companies with modern trade focus and higher proportion of direct distribution to benefit. As the implementation of GST becomes more robust, we expect the economy to become more and more organized with new regional players emerging to take on national leaders. The biggest beneficiary of GST will be Government finances – state as well as Centre, as tax collection should be boosted over the coming years. The multiple benefits of improved Government finances should salivate any long term equity investor!

3
Introducing the Returns vs Earnings Heat Map
QuarterlyReturns Jun-13 Sep-13 Dec-13 Mar-14 Jun-14 Sep-14 Dec-14 Mar-15 Jun-15 Sep-15 Dec-15 Mar-16 Jun-16 Sep-16 Dec-16 Mar-17 Jun-17
ReturnCAGR
SENSEX Index -7% 18% 6% 14% 5% 3% 2% -1% -6% 0% -3% 7% 3% -4% 11% 6% 16%NIFTY Index -9% 19% 6% 14% 5% 4% 3% -1% -5% 0% -3% 7% 4% -5% 12% 5% 17%NIFTYJR Index -11% 25% 4% 22% 3% 10% 4% 2% -1% 2% -6% 9% 12% -7% 17% 6% 28%NSEMCAP Index -11% 24% 7% 29% 3% 10% 3% 0% 0% 3% -5% 8% 12% -7% 20% 5% 30%NSESMCP Index -11% 31% 9% 46% -8% 7% 7% -5% -2% 8% -14% 19% 6% -6% 21% 6% 32%
BSE500 Index -9% 21% 6% 18% 4% 5% 3% -1% -4% 1% -4% 8% 6% -6% 14% 6% 21%
Yearly EarningsGrowth FY 13 FY 14 FY 15 FY 16 FY 17
EarningCAGR
SENSEX Index 2% 23% -11% 10% -3% 4%NIFTY Index 3% 17% -8% 5% 5% 4%NIFTYJR Index 10% 18% 11% -34% 51% 8%NSEMCAP Index 2% 10% 0% 7% 11% 6%NSESMCP Index -10% 53% -34% 4% 0% -1%BSE500 Index -1% 19% -10% -1% 14% 4%
Source: Bloomberg, Internal Research
Since the bottom of Aug-13, NIFTY, NIFTY JR, NSE Midcap and NSE Small Cap indices have given returns of 17%, 28%, 30% and 32% respectively. During the period FY 13 to FY 17, the earnings growth for these indices has been 4%, 8%, 6% and -1% respectively. Out of the 16 quarters in the above heat-map, small caps have given the highest returns in 8 quarters, mid-caps in 4 quarters and large caps in 4 quarters.In general, stocks across market capitalization levels have seen a PE rating with returns in excess of earnings growth. Mid-Cap indices have grown the most over the period with 8% earnings CAGR for NIFTYJR Index.Though small cap stocks have also given robust returns, but these returns haven’t been backed by earnings growth (-1% CAGR). As can be seen, there has been a strong rerating of these stocks in the last 1-2 years as these stocks consistently outperformed the broader indices. Given the strong rally in this segment, the earnings growth expectation that has been built up may be on the higher side.
Currency & Commodities Last Price % Change YTD % Change MTD
USD / INR 64.579 -4.93% 0.10%
Dollar Index 95.63 -6.44% -1.34%
Gold 1,241.55 7.75% -2.16%
Crude OIL
WTI (Nymex) 46.04 -14.30% -4.72%
Brent Crude 47.92 -15.66% -4.75%
India Macro Analysis Latest Equity Flows USD Mn
GDP 6.10 FII (USD mln)
IIP 3.10 YTD 8438.21
Inflation (WPI Monthly) 2.17 MTD 610
Inflation (CPI Monthly) 2.18 *DII (USD mln)
Commodity (CRB Index) 446.63 YTD 6,220
MTD 1,218
Data as on 29th June 2017
Equity Markets Index % Change YTD % Change MTD P/E
Nifty 9,520.90 16.31% -1.04% 18.52
Sensex 30,921.61 16.13% -0.72% 19.20
Dow Jones 21,349.63 8.03% 1.62% 17.64
Shanghai 3,192.43 2.86% 2.41% 14.10
Nikkei 20,033.43 4.81% 1.95% 17.33
Hang Sang 25,764.58 17.11% 0.41% 12.23
FTSE 7,312.72 2.38% -2.76% 15.11
MSCI E.M. (USD) 1,010.80 17.23% 0.54% 12.92
MSCI D.M.(USD) 1,916.43 9.43% 0.25% 17.18
MSCI India (INR) 1,119.85 13.90% -0.89% 18.27
Source: Bloomberg, SEBI

4
WHAT WENT BY
On the domestic front, India’s inflation continued to undershoot expectations, with CPI hitting a record low of 2.18% in May’17 compared to 2.99% in the previous month. The recent sharp decline in the inflation reading has been due to the significant fall in the prices of vegetables and pulses. WPI too declined to 2.18% compared to 3.88% in the previous month led by fall in food and fuel inflation.
The ten-year benchmark bond yield ended the month at 6.51%, 15bps lower than previous month owing to expectations of rate cut in the coming months. While in the June 7th policy meet, RBI maintained a neutral stance and kept the policy rates unchanged, the minutes of the monetary policy meeting released showed that one of the members advocated a 50bps rate cut. The remaining five members opted for a pause while awaiting few more prints of inflation.
Banking system’s liquidity during the month inched lower on the back of increased currency in circulation and outflows due to quarterly advance tax payment. The average liquidity surplus for the month of June’17 stood at INR 3,075bn compared to INR 3,403bn last month.
India’s Current Account Deficit (CAD) declined to USD 3.4Bn in Q4 FY’17 (0.6% of GDP) from USD 8Bn (1.4% of GDP) in the previous quarter. However, on YoY CAD was higher than previous year’s Q4FY16 reading of USD 0.3bn (0.1% of GDP) on account of higher trade deficit numbers. For the whole year, CAD stood at USD 15.2bn (0.7% of GDP) compared to USD 22.1bn in FY16 (1.1% of GDP). Supported by robust FPI inflows, Balance of Payment (BoP) surplus stood at USD 7.3bn in Q4FY17 significantly higher than a surplus of USD 3.3bn seen in Q4FY16.
On the global front, US once again raised its fed rate by 25bps, third time in six months and fourth so far since it began normalising the monetary policy from December ’15. It has also indicated at one more rate hike this year followed by three hikes next year. The hike in rate was in spite of concerns over inflation not meeting their target of 2%. The FOMC’s median projection for inflation forecast has been dropped to 1.6% in 2017, down from the 1.9% previously forecast. US economic growth forecasted is 2.2% in 2017, marginal increase from previous projection. The US Federal Reserve has also announced that it would begin the process of shrinking its balance sheet without indicating the start date, but this would be dependent on how the economy evolves.
GOING FORWARD
We have been running significant duration positions in spread assets including SDL, Uday and corporate bonds since February / March. They were available at stress valuations then and have performed well since. However, the trade also had limited period shelf life, given that supply on spread assets rises continually over the next few quarters. Indeed, the Q2 SDL calendar announced recently is more than 50% higher than actual issuances in Q1.
In preparation for this, we have been steadily reducing positions in duration (10 year and beyond) SDL, Uday, corporate bonds and switching the positions into government bonds. With this, our exposure in such duration spread assets in our bond and gilt funds is now very little and our preference for the time ahead is to run such duration positions now with government bonds. This will also make flexible duration management easier which may be helpful in the months ahead. However, we continue to like these spread bonds in the 5 – 6 year maturity and below; given the handsome carry that they provide even with respect to corresponding corporate bonds. Short term and medium term funds continue to look good given the attractive spread between overnight rate and front end bonds.
Commentary - Debt OutlookMr. Suyash Choudhary
Head - Fixed Income
5
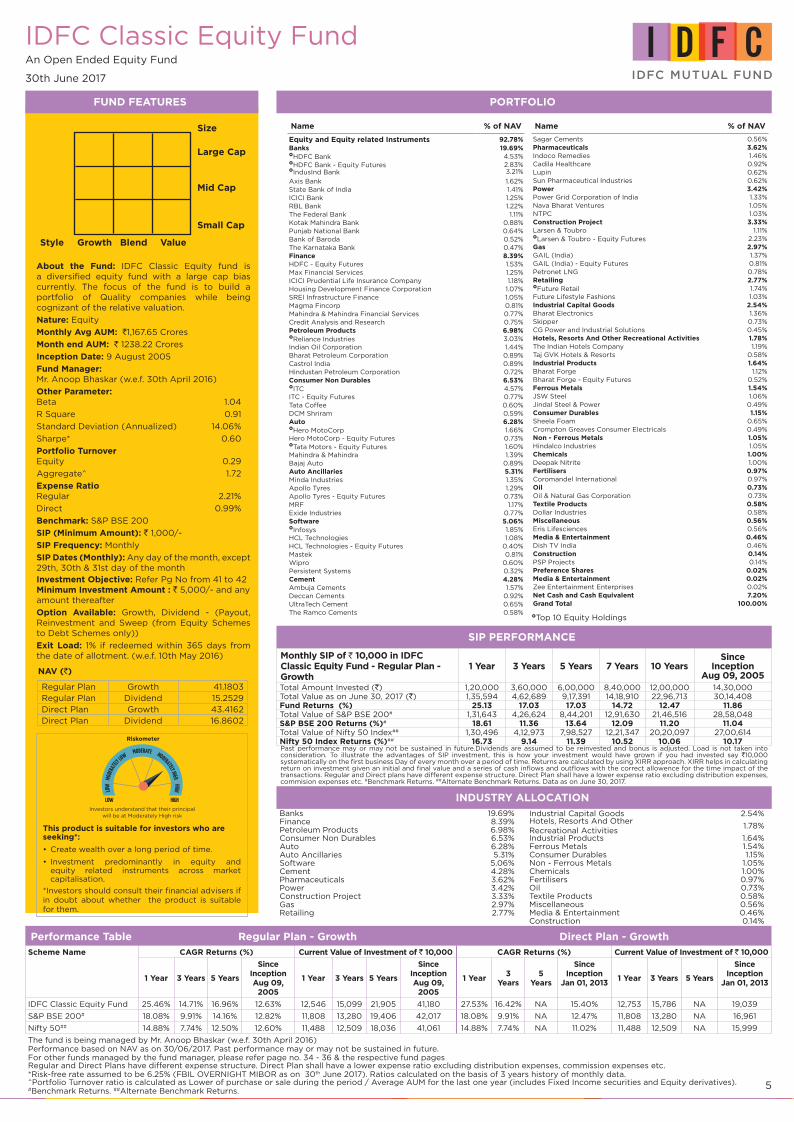
IDFC Classic Equity FundAn Open Ended Equity Fund
30th June 2017
FUND FEATURES
INDUSTRY ALLOCATION
Size
Large Cap
Mid Cap
Small Cap
Style Growth Blend Value
About the Fund: IDFC Classic Equity fund is a diversified equity fund with a large cap bias currently. The focus of the fund is to build a portfolio of Quality companies while being cognizant of the relative valuation.
Nature: Equity
Monthly Avg AUM: `1,167.65 Crores
Month end AUM: ` 1238.22 Crores
Inception Date: 9 August 2005
Fund Manager: Mr. Anoop Bhaskar (w.e.f. 30th April 2016)
Other Parameter: Beta 1.04
R Square 0.91
Standard Deviation (Annualized) 14.06%
Sharpe* 0.60
Portfolio Turnover Equity 0.29
Aggregate^ 1.72
Expense Ratio Regular 2.21%
Direct 0.99%
Benchmark: S&P BSE 200
SIP (Minimum Amount): ` 1,000/-
SIP Frequency: Monthly
SIP Dates (Monthly): Any day of the month, except 29th, 30th & 31st day of the monthInvestment Objective: Refer Pg No from 41 to 42 Minimum Investment Amount : ` 5,000/- and any amount thereafter
Option Available: Growth, Dividend - (Payout, Reinvestment and Sweep (from Equity Schemes to Debt Schemes only))
Exit Load: 1% if redeemed within 365 days from the date of allotment. (w.e.f. 10th May 2016)
Top 10 Equity Holdings
Banks 19.69%Finance 8.39%Petroleum Products 6.98%Consumer Non Durables 6.53%Auto 6.28%Auto Ancillaries 5.31%Software 5.06%Cement 4.28%Pharmaceuticals 3.62%Power 3.42%Construction Project 3.33%Gas 2.97%Retailing 2.77%
Performance Table Regular Plan - Growth Direct Plan - GrowthScheme Name CAGR Returns (%) Current Value of Investment of ` 10,000 CAGR Returns (%) Current Value of Investment of ` 10,000
1 Year 3 Years 5 Years
SinceInceptionAug 09,
2005
1 Year 3 Years 5 Years
SinceInceptionAug 09,
2005
1 Year3
Years5
Years
SinceInception
Jan 01, 20131 Year 3 Years 5 Years
SinceInception
Jan 01, 2013
IDFC Classic Equity Fund 25.46% 14.71% 16.96% 12.63% 12,546 15,099 21,905 41,180 27.53% 16.42% NA 15.40% 12,753 15,786 NA 19,039
S&P BSE 200# 18.08% 9.91% 14.16% 12.82% 11,808 13,280 19,406 42,017 18.08% 9.91% NA 12.47% 11,808 13,280 NA 16,961
Nifty 50## 14.88% 7.74% 12.50% 12.60% 11,488 12,509 18,036 41,061 14.88% 7.74% NA 11.02% 11,488 12,509 NA 15,999
The fund is being managed by Mr. Anoop Bhaskar (w.e.f. 30th April 2016)Performance based on NAV as on 30/06/2017. Past performance may or may not be sustained in future.For other funds managed by the fund manager, please refer page no. 34 - 36 & the respective fund pages Regular and Direct Plans have different expense structure. Direct Plan shall have a lower expense ratio excluding distribution expenses, commission expenses etc.*Risk-free rate assumed to be 6.25% (FBIL OVERNIGHT MIBOR as on 30th June 2017). Ratios calculated on the basis of 3 years history of monthly data. ^Portfolio Turnover ratio is calculated as Lower of purchase or sale during the period / Average AUM for the last one year (includes Fixed Income securities and Equity derivatives). #Benchmark Returns. ##Alternate Benchmark Returns.
SIP PERFORMANCE
Monthly SIP of ` 10,000 in IDFC Classic Equity Fund - Regular Plan - Growth
1 Year 3 Years 5 Years 7 Years 10 YearsSince
InceptionAug 09, 2005
Total Amount Invested (`) 1,20,000 3,60,000 6,00,000 8,40,000 12,00,000 14,30,000 Total Value as on June 30, 2017 (`) 1,35,594 4,62,689 9,17,391 14,18,910 22,96,713 30,14,408 Fund Returns (%) 25.13 17.03 17.03 14.72 12.47 11.86Total Value of S&P BSE 200# 1,31,643 4,26,624 8,44,201 12,91,630 21,46,516 28,58,048 S&P BSE 200 Returns (%)# 18.61 11.36 13.64 12.09 11.20 11.04Total Value of Nifty 50 Index## 1,30,496 4,12,973 7,98,527 12,21,347 20,20,097 27,00,614 Nifty 50 Index Returns (%)## 16.73 9.14 11.39 10.52 10.06 10.17Past performance may or may not be sustained in future.Dividends are assumed to be reinvested and bonus is adjusted. Load is not taken into consideration. To illustrate the advantages of SIP investment, this is how your investment would have grown if you had invested say `10,000 systematically on the first business Day of every month over a period of time. Returns are calculated by using XIRR approach. XIRR helps in calculating return on investment given an initial and final value and a series of cash inflows and outflows with the correct allowence for the time impact of the transactions. Regular and Direct plans have different expense structure. Direct Plan shall have a lower expense ratio excluding distribution expenses, commision expenses etc. #Benchmark Returns. ##Alternate Benchmark Returns. Data as on June 30, 2017.
Riskometer
Investors understand that their principal will be at Moderately High risk
This product is suitable for investors who are seeking*:
Create wealth over a long period of time.•
Investment predominantly in equity and •equity related instruments across market capitalisation.
*Investors should consult their financial advisers if in doubt about whether the product is suitable for them.
Industrial Capital Goods 2.54%Hotels, Resorts And Other Recreational Activities
1.78%
Industrial Products 1.64%Ferrous Metals 1.54%Consumer Durables 1.15%Non - Ferrous Metals 1.05%Chemicals 1.00%Fertilisers 0.97%Oil 0.73%Textile Products 0.58%Miscellaneous 0.56%Media & Entertainment 0.46%Construction 0.14%
NAV (`)
Regular Plan Growth 41.1803Regular Plan Dividend 15.2529Direct Plan Growth 43.4162Direct Plan Dividend 16.8602
PORTFOLIO
Name % of NAV
Equity and Equity related Instruments 92.78%Banks 19.69%HDFC Bank 4.53%HDFC Bank - Equity Futures 2.83%IndusInd Bank 3.21%
Axis Bank 1.62%State Bank of India 1.41%ICICI Bank 1.25%RBL Bank 1.22%The Federal Bank 1.11%Kotak Mahindra Bank 0.88%Punjab National Bank 0.64%Bank of Baroda 0.52%The Karnataka Bank 0.47%Finance 8.39%HDFC - Equity Futures 1.53%Max Financial Services 1.25%ICICI Prudential Life Insurance Company 1.18%Housing Development Finance Corporation 1.07%SREI Infrastructure Finance 1.05%Magma Fincorp 0.81%Mahindra & Mahindra Financial Services 0.77%Credit Analysis and Research 0.75%Petroleum Products 6.98%Reliance Industries 3.03%Indian Oil Corporation 1.44%Bharat Petroleum Corporation 0.89%Castrol India 0.89%Hindustan Petroleum Corporation 0.72%Consumer Non Durables 6.53%ITC 4.57%ITC - Equity Futures 0.77%Tata Coffee 0.60%DCM Shriram 0.59%Auto 6.28%Hero MotoCorp 1.66%Hero MotoCorp - Equity Futures 0.73%Tata Motors - Equity Futures 1.60%Mahindra & Mahindra 1.39%Bajaj Auto 0.89%Auto Ancillaries 5.31%Minda Industries 1.35%Apollo Tyres 1.29%Apollo Tyres - Equity Futures 0.73%MRF 1.17%Exide Industries 0.77%Software 5.06%Infosys 1.85%HCL Technologies 1.08%HCL Technologies - Equity Futures 0.40%Mastek 0.81%Wipro 0.60%Persistent Systems 0.32%Cement 4.28%Ambuja Cements 1.57%Deccan Cements 0.92%UltraTech Cement 0.65%The Ramco Cements 0.58%
Name % of NAV
Sagar Cements 0.56%Pharmaceuticals 3.62%Indoco Remedies 1.46%Cadila Healthcare 0.92%Lupin 0.62%Sun Pharmaceutical Industries 0.62%Power 3.42%Power Grid Corporation of India 1.33%Nava Bharat Ventures 1.05%NTPC 1.03%Construction Project 3.33%Larsen & Toubro 1.11%Larsen & Toubro - Equity Futures 2.23%Gas 2.97%GAIL (India) 1.37%GAIL (India) - Equity Futures 0.81%Petronet LNG 0.78%Retailing 2.77%Future Retail 1.74%Future Lifestyle Fashions 1.03%Industrial Capital Goods 2.54%Bharat Electronics 1.36%Skipper 0.73%CG Power and Industrial Solutions 0.45%Hotels, Resorts And Other Recreational Activities 1.78%The Indian Hotels Company 1.19%Taj GVK Hotels & Resorts 0.58%Industrial Products 1.64%Bharat Forge 1.12%Bharat Forge - Equity Futures 0.52%Ferrous Metals 1.54%JSW Steel 1.06%Jindal Steel & Power 0.49%Consumer Durables 1.15%Sheela Foam 0.65%Crompton Greaves Consumer Electricals 0.49%Non - Ferrous Metals 1.05%Hindalco Industries 1.05%Chemicals 1.00%Deepak Nitrite 1.00%Fertilisers 0.97%Coromandel International 0.97%Oil 0.73%Oil & Natural Gas Corporation 0.73%Textile Products 0.58%Dollar Industries 0.58%Miscellaneous 0.56%Eris Lifesciences 0.56%Media & Entertainment 0.46%Dish TV India 0.46%Construction 0.14%PSP Projects 0.14%Preference Shares 0.02%Media & Entertainment 0.02%Zee Entertainment Enterprises 0.02%Net Cash and Cash Equivalent 7.20%Grand Total 100.00%

6
IDFC Sterling Equity FundAn Open Ended Equity Fund
30th June 2017
FUND FEATURES
INDUSTRY ALLOCATION
Size
Large Cap
Mid Cap
Small Cap
Style Growth Blend Value
About the Fund: IDFC Sterling Equity Fund is a mid/small cap fund that focuses on active stock selection strategy.
Nature: Equity
Monthly Avg AUM: ` 1,458.44 Crores
Month end AUM: ` 1457.59 Crores
Inception Date: 7 March 2008
Fund Manager: Mr. Anoop Bhaskar (w.e.f. 30th April 2016) & Mr. Daylynn Pinto (w.e.f. 20th October 2016)
Other Parameter:
Beta 1.04
R Square 0.82
Standard Deviation (Annualized) 16.53%
Sharpe* 0.74
Portfolio Turnover
Equity 0.33 Aggregate^ 0.39
Expense Ratio
Regular 2.16%
Direct 1.37%
Benchmark: Nifty Free Float Midcap 100
SIP (Minimum Amount): ` 1,000/-
SIP Frequency: Monthly
SIP Dates (Monthly): Any day of the month, except 29th, 30th & 31st day of the monthInvestment Objective: Refer Pg No from 41 to 42
Minimum Investment Amount : ` 5,000/- and any amount thereafter
Option Available: Growth, Dividend (Payout, Reinvestment and Sweep (from Equity Schemes to Debt Schemes only))
Exit Load: 1.00% if redeemed on or before 365 days from the date of allotment. (w.e.f. 7th September, 2015)
Top 10 Equity Holdings
Banks 12.26%Auto Ancillaries 9.46%Retailing 9.30%Construction Project 8.96%Finance 7.43%Cement 6.78%Industrial Capital Goods 5.76%Media & Entertainment 3.81%Consumer Non Durables 3.53%Pharmaceuticals 3.46%Software 3.30%Consumer Durables 2.98%
Performance Table Regular Plan - Growth Direct Plan - GrowthScheme Name CAGR Returns (%) Current Value of Investment of ` 10,000 CAGR Returns (%) Current Value of Investment of ` 10,000
1 Year 3 Years 5 YearsSince
InceptionMar 07, 2008
1 Year 3 Years 5 YearsSince
InceptionMar 07, 2008
1 Year 3 Years 5 YearsSince
InceptionJan 01, 2013
1 Year 3 Years 5 YearsSince
InceptionJan 01, 2013
IDFC Sterling Equity Fund 33.95% 18.45% 21.00% 18.36% 13,395 16,628 25,968 48,131 35.19% 19.44% NA 20.14% 13,519 17,048 NA 22,819
Nifty Free Float Midcap 100#
28.32% 16.89% 19.23% 11.36% 12,832 15,977 24,116 27,271 28.32% 16.89% NA 17.45% 12,832 15,977 NA 20,610
Nifty 50## 14.88% 7.74% 12.50% 7.69% 11,488 12,509 18,036 19,953 14.88% 7.74% NA 11.02% 11,488 12,509 NA 15,999
The fund is being managed by Mr. Anoop Bhaskar (w.e.f. 30th April 2016) & Mr. Daylynn Pinto (w.e.f. 20th October 2016) Performance based on NAV as on 30/06/2017. Past performance may or may not be sustained in future.For other funds managed by the fund manager, please refer page no. 34 - 36 & the respective fund pages Regular and Direct Plans have different expense structure. Direct Plan shall have a lower expense ratio excluding distribution expenses, commission expenses etc.*Risk-free rate assumed to be 6.25% (FBIL OVERNIGHT MIBOR as on 30th June 2017). Ratios calculated on the basis of 3 years history of monthly data. ^Portfolio Turnover ratio is calculated as Lower of purchase or sale during the period / Average AUM for the last one year (includes Fixed Income securities and Equity derivatives). #Benchmark Returns. ##Alternate Benchmark Returns.
SIP PERFORMANCE
Monthly SIP of ` 10,000 in IDFC Sterling Equity Fund - Regular Plan - Growth
1 Year 3 Years 5 Years 7 YearsSince
InceptionMar 07, 2008
Total Amount Invested (`) 1,20,000 3,60,000 6,00,000 8,40,000 11,20,000
Total Value as on June 30, 2017 (`) 1,42,788 4,82,585 10,39,505 16,80,424 30,02,100
Fund Returns (%) 37.28 20.02 22.17 19.47 20.21
Total Value of Nifty Free Float Midcap 100# 1,34,812 4,72,197 10,19,960 15,66,050 25,04,689
Nifty Free Float Midcap 100 Returns (%)# 23.83 18.47 21.38 17.49 16.56
Total Value of Nifty 50 Index## 1,30,496 4,12,973 7,98,527 12,21,347 18,70,591
Nifty 50 Index Returns (%)## 16.73 9.14 11.39 10.52 10.65
Past performance may or may not be sustained in future.Dividends are assumed to be reinvested and bonus is adjusted. Load is not taken into consideration. To illustrate the advantages of SIP investment, this is how your investment would have grown if you had invested say `10,000 systematically on the first business Day of every month over a period of time. Returns are calculated by using XIRR approach. XIRR helps in calculating return on investment given an initial and final value and a series of cash inflows and outflows with the correct allowence for the time impact of the transactions. Regular and Direct plans have different expense structure. Direct Plan shall have a lower expense ratio excluding distribution expenses, commision expenses etc. #Benchmark Returns. ##Alternate Benchmark Returns. Data as on June 30, 2017.
Riskometer
Investors understand that their principal will be at Moderately High risk
This product is suitable for investors who are seeking*:
Create wealth over a long period of time.•
Investment predominantly in equity and equity •related instruments in the mid cap segment.
*Investors should consult their financial advisers if in doubt about whether the product is suitable for them.
Transportation 2.70%Industrial Products 2.49%Petroleum Products 2.38%Hotels, Resorts And Other Recreational Activities 2.27%
Textile Products 2.18%Power 1.93%Gas 1.90%Chemicals 1.72%Miscellaneous 0.98%Ferrous Metals 0.85%Fertilisers 0.79%Oil 0.31%
NAV (`)Regular Plan Growth 48.1309Regular Plan Dividend 20.0394Direct Plan Growth 49.9526Direct Plan Dividend 20.9259
PORTFOLIO
Name % of NAV
Equity and Equity related Instruments 97.53%Banks 12.26%IndusInd Bank 3.96%Union Bank of India 1.62%The Karnataka Bank 1.21%Bank of Baroda 1.08%The Federal Bank 1.00%Lakshmi Vilas Bank 0.92%Punjab National Bank 0.76%RBL Bank 0.11%RBL Bank - Equity Futures 1.60%Auto Ancillaries 9.46%Minda Industries 2.90%Igarashi Motors India 1.74%Exide Industries 1.74%WABCO India 1.06%Asahi India Glass 1.04%MRF 0.99%Retailing 9.30%Future Retail 5.96%V-Mart Retail 2.15%Aditya Birla Fashion and Retail 1.19%Construction Project 8.96%KEC International 3.18%Engineers India 2.21%Voltas 1.88%NCC 1.68%Finance 7.43%Bajaj Finance 3.53%Magma Fincorp 1.20%Max Financial Services 1.12%Equitas Holdings 0.93%Mahindra & Mahindra Financial Services 0.65%Cement 6.78%The Ramco Cements 4.72%JK Lakshmi Cement 1.50%Sagar Cements 0.56%Industrial Capital Goods 5.76%Lakshmi Machine Works 1.63%TD Power Systems 1.25%Skipper 1.12%CG Power and Industrial Solutions 0.96%Bharat Electronics 0.80%Media & Entertainment 3.81%PVR 1.45%Zee Entertainment Enterprises 1.25%Entertainment Network (India) 1.11%Consumer Non Durables 3.53%HBL Power Systems 1.68%
Name % of NAV
Procter & Gamble Hygiene and Health Care 1.38%Linc Pen & Plastics 0.48%Pharmaceuticals 3.46%Aurobindo Pharma 1.50%Hikal 1.26%Indoco Remedies 0.69%Software 3.30%Cyient 1.32%Persistent Systems 1.30%Tech Mahindra 0.68%Consumer Durables 2.98%Crompton Greaves Consumer Electricals 1.86%Greenply Industries 0.94%HPL Electric & Power 0.18%Transportation 2.70%VRL Logistics 2.70%Industrial Products 2.49%KEI Industries 1.59%Bharat Forge 0.90%Petroleum Products 2.38%Hindustan Petroleum Corporation 1.58%Castrol India 0.81%Hotels, Resorts And Other Recreational Activities 2.27%Wonderla Holidays 1.26%The Indian Hotels Company 1.01%Textile Products 2.18%K.P.R. Mill 1.35%Dollar Industries 0.83%Power 1.93%Nava Bharat Ventures 1.00%CESC 0.93%Gas 1.90%Petronet LNG 1.19%Gujarat Gas 0.71%Chemicals 1.72%Deepak Nitrite 1.38%Gujarat Alkalies and Chemicals 0.34%Miscellaneous 0.98%Dishman Carbogen Amcis 0.98%Ferrous Metals 0.85%Jindal Steel & Power 0.85%Fertilisers 0.79%Gujarat State Fertilizers & Chemicals 0.79%Oil 0.31%Oil India 0.31%Net Cash and Cash Equivalent 2.47%Grand Total 100.00%

7
IDFC Premier Equity FundAn Open Ended Equity Fund
30th June 2017
FUND FEATURES
INDUSTRY ALLOCATION
Size
Large Cap
Mid Cap
Small Cap
Style Growth Blend Value
About the Fund: IDFC Premier Equity Fund is a multi-cap Equity Fund. It is a fund that encourages systematic investing. The fund in the past has been opened for lump sum investments for a limited time periods.
Nature: Equity
Monthly Avg AUM: ` 5,948.87 Crores
Month end AUM: ` 5907.99 Crores
Inception Date: 28 September 2005
Fund Manager: Mr. Anoop Bhaskar (w.e.f. 30th April 2016)
Other Parameter:
Beta 0.93
R Square 0.77
Standard Deviation (Annualized) 14.04%
Sharpe* 0.67
Portfolio Turnover
Equity 0.22 Aggregate^ 0.28
Expense Ratio
Regular 2.00% Direct 1.32%
Benchmark: S&P BSE 500
SIP (Minimum Amount): ` 2,000/-
SIP Frequency: Monthly
SIP Dates (Monthly): Any day of the month, except 29th, 30th & 31st day of the month
Investment Objective: Refer Pg No from 41 to 42Minimum Investment Amount: ` 10,000/- and any amount thereafter (During the period when the fund is open for lump sum subscription)
Option Available: Growth, Dividend - (Payout, Reinvestment and Sweep (from Equity Schemes to Debt Schemes only))
Exit Load: 1.00% if redeemed before 365 days from the date of allotment. (w.e.f. 1st September, 2009)
Top 10 Equity Holdings
Finance 12.58%
Consumer Non Durables 10.33%
Transportation 8.22%
Industrial Products 7.41%
Banks 7.19%
Pharmaceuticals 5.33%
Auto 5.16%
Chemicals 4.07%
Construction Project 3.70%
Ferrous Metals 3.52%
Engineering Services 3.50%
Gas 3.20%
IT Consulting & Other Services 2.83%
Performance Table Regular Plan - Growth Direct Plan - GrowthScheme Name CAGR Returns (%) Current Value of Investment of ` 10,000 CAGR Returns (%) Current Value of Investment of ` 10,000
1 Year 3 Years 5 Years
SinceInception Sep 28, 2005
1 Year 3 Years 5 Years
SinceInceptionSep 28, 2005
1 Year 3 Years 5 Years
SinceInception
Jan 01, 20131 Year 3 Years 5 Years
SinceInception
Jan 01, 2013
IDFC Premier Equity Fund 16.57% 15.61% 21.08% 20.14% 11,657 15,460 26,051 86,549 17.48% 16.48% NA 19.29% 11,748 15,812 NA 22,097
S&P BSE 500# 19.48% 10.40% 14.53% 11.87% 11,948 13,459 19,721 37,394 19.48% 10.40% NA 12.86% 11,948 13,459 NA 17,225
Nifty 50## 14.88% 7.74% 12.50% 11.67% 11,488 12,509 18,036 36,646 14.88% 7.74% NA 11.02% 11,488 12,509 NA 15,999
The fund is being managed by Mr. Anoop Bhaskar (w.e.f. 30th April 2016)Performance based on NAV as on 30/06/2017. Past performance may or may not be sustained in future.For other funds managed by the fund manager, please refer page no. 34 - 36 & the respective fund pages Regular and Direct Plans have different expense structure. Direct Plan shall have a lower expense ratio excluding distribution expenses, commission expenses etc.*Risk-free rate assumed to be 6.25% (FBIL OVERNIGHT MIBOR as on 30th June 2017). Ratios calculated on the basis of 3 years history of monthly data. ^Portfolio Turnover ratio is calculated as Lower of purchase or sale during the period / Average AUM for the last one year (includes Fixed Income securities and Equity derivatives). #Benchmark Returns. ##Alternate Benchmark Returns.
SIP PERFORMANCE
Monthly SIP of ` 10,000 in IDFC Premier Equity Fund -Regular Plan - Growth
1 Year 3 Years 5 Years 7 Years 10 YearsSince
InceptionSep 28, 2005
Total Amount Invested (`) 1,20,000 3,60,000 6,00,000 8,40,000 12,00,000 14,20,000
Total Value as on June 30, 2017 (`) 1,32,702 4,37,262 9,75,026 16,18,205 32,48,807 49,14,609
Fund Returns (%) 20.34 13.07 19.53 18.41 18.93 19.53
Total Value of S&P BSE 500# 1,32,623 4,32,078 8,59,592 13,11,936 21,75,445 28,38,560
S&P BSE 500 Returns (%)# 20.21 12.24 14.37 12.52 11.45 11.13
Total Value of Nifty 50 Index## 1,30,496 4,12,973 7,98,527 12,21,347 20,20,097 26,56,426
Nifty 50 Index Returns (%)## 16.73 9.14 11.39 10.52 10.06 10.10Past performance may or may not be sustained in future.Dividends are assumed to be reinvested and bonus is adjusted. Load is not taken into consideration. To illustrate the advantages of SIP investment, this is how your investment would have grown if you had invested say `10,000 systematically on the first business Day of every month over a period of time. Returns are calculated by using XIRR approach. XIRR helps in calculating return on investment given an initial and final value and a series of cash inflows and outflows with the correct allowence for the time impact of the transactions. Regular and Direct plans have different expense structure. Direct Plan shall have a lower expense ratio excluding distribution expenses, commision expenses etc. #Benchmark Returns. ##Alternate Benchmark Returns. Data as on June 30, 2017.
Riskometer
Investors understand that their principal will be at Moderately High risk
This product is suitable for investors who are seeking*:
Create wealth over a long period of time.•
Investment predominantly in equity and •equity related instruments across market capitalisation.
*Investors should consult their financial advisers if in doubt about whether the product is suitable for them.
Textile Products 2.53%
Auto Ancillaries 2.35%
Commercial Services 2.35%
Cement 2.34%
Textiles - Cotton 2.02%
Industrial Capital Goods 2.01%
Media & Entertainment 1.71%
Construction 1.42%
Consumer Durables 1.42%
Petroleum Products 1.29%
Miscellaneous 0.84%
Retailing 0.22%
Hotels, Resorts And Other Recreational Activities
0.21%
NAV (`)
Regular Plan Growth 86.5485Regular Plan Dividend 34.0263Direct Plan Growth 89.3620Direct Plan Dividend 35.0293
PORTFOLIO
Name % of NAV
Equity and Equity related Instruments 97.74%Finance 12.58%JM Financial 3.45%ICICI Prudential Life Insurance Company 2.89%Multi Commodity Exchange of India 1.84%Max Financial Services 1.59%Bharat Financial Inclusion 1.46%Shriram City Union Finance 0.94%CRISIL 0.41%Consumer Non Durables 10.33%Asian Paints 2.98%Balrampur Chini Mills 2.38%Procter & Gamble Hygiene and Health Care 1.90%Britannia Industries 1.33%Mcleod Russel India 1.25%S H Kelkar and Company 0.49%Transportation 8.22%Container Corporation of India 3.27%Blue Dart Express 2.67%TCI Express 1.16%Transport Corporation of India 1.12%Industrial Products 7.41%Greaves Cotton 3.05%FAG Bearings India 2.84%Kirloskar Pneumatic Co. 0.77%Ingersoll Rand (India) 0.76%Banks 7.19%HDFC Bank 3.07%Kotak Mahindra Bank 2.26%City Union Bank 1.08%RBL Bank 0.77%Pharmaceuticals 5.33%Sun Pharmaceutical Industries 1.74%Natco Pharma 1.53%Suven Life Sciences 1.24%Aurobindo Pharma 0.83%Auto 5.16%Maruti Suzuki India 3.18%Ashok Leyland 1.98%Chemicals 4.07%Tata Chemicals 2.39%Pidilite Industries 1.04%Atul 0.64%Construction Project 3.70%Voltas 3.25%Power Mech Projects 0.45%Ferrous Metals 3.52%APL Apollo Tubes 3.52%
Name % of NAV
Engineering Services 3.50%VA Tech Wabag 3.50%Gas 3.20%Gujarat State Petronet 3.20%IT Consulting & Other Services 2.83%Cognizant Technology Solutions Corp - International Equities 2.83%
Textile Products 2.53%Page Industries 2.53%Auto Ancillaries 2.35%MRF 0.81%Minda Industries 0.79%Precision Camshafts 0.76%Commercial Services 2.35%3M India 2.35%Cement 2.34%Ambuja Cements 2.34%Textiles - Cotton 2.02%RSWM 1.08%Vardhman Textiles 0.94%Industrial Capital Goods 2.01%Bharat Electronics 0.91%Disa India 0.69%Kennametal India 0.41%Media & Entertainment 1.71%Entertainment Network (India) 1.16%Dish TV India 0.55%Construction 1.42%Poddar Housing and Development 0.78%ITD Cementation India 0.64%Consumer Durables 1.42%Bata India 1.42%Petroleum Products 1.29%Castrol India 1.29%Miscellaneous 0.84%Eris Lifesciences 0.84%Retailing 0.22%Future Retail 0.22%Hotels, Resorts And Other Recreational Activities 0.21%
EIH 0.21%Preference Shares 0.14%Media & Entertainment 0.14%Zee Entertainment Enterprises 0.14%Net Cash and Cash Equivalent 2.12%Grand Total 100.00%

8
IDFC Focused Equity Fund (The Fund was earlier known as IDFC Imperial Equity Fund)$$ An Open Ended Equity Fund 30th June 2017
FUND FEATURES
INDUSTRY ALLOCATION
Size
Large Cap
Mid Cap
Small Cap
Style Growth Blend Value
About the Fund: IDFC Focused Equity Fund is a concentrated portfolio of up to 30 stocks with the flexibility to invest across sectors and across market cap.
Nature: Equity
Monthly Avg AUM: ` 147.87 Crores
Month end AUM: ` 165.57 Crores
Inception Date: 16 March 2006
Fund Manager: Mr. Sumit Agrawal (w.e.f. 20th October 2016)
Other Parameter:
Beta 1.00
R Square 0.90
Standard Deviation (Annualized) 13.73%
Sharpe* 0.40
Portfolio Turnover
Equity 1.77 Aggregate^ 2.36
Expense Ratio
Regular 2.62%
Direct 1.69%
Benchmark: Nifty 50
SIP (Minimum Amount): ` 1,000/-
SIP Frequency: Monthly
SIP Dates (Monthly): Any day of the month, except 29th, 30th & 31st day of the monthInvestment Objective: Refer Pg No from 41 to 42
Minimum Investment Amount: ` 5,000/- and any amount thereafter
Option Available: Growth, Dividend - (Payout, Reinvestment and Sweep (from Equity Schemes to Debt Schemes only))
Exit Load: 1.00% if redeemed before 365 days from the date of allotment. (w.e.f. 1st September 2009)
Top 10 Equity Holdings
Banks 18.13%
Finance 17.12%
Miscellaneous 10.17%
Auto 8.56%
Industrial Capital Goods 5.09%
Software 4.97%
Consumer Durables 4.69%
Retailing 4.33%
Performance Table Regular Plan - Growth Direct Plan - GrowthScheme Name CAGR Returns (%) Current Value of Investment of ` 10,000 CAGR Returns (%) Current Value of Investment of ` 10,000
1 Year 3 Years 5 Years
SinceInception
Mar 16, 20061 Year 3 Years 5 Years
SinceInception
Mar 16, 2006
1 Year 3 Years 5 Years
SinceInception
Jan 01, 20131 Year 3 Years
5 Years
SinceInception
Jan 01, 2013
IDFC Focused Equity Fund 31.12% 11.76% 13.84% 11.50% 13,112 13,963 19,130 34,210 33.00% 13.33% NA 13.97% 13,300 14,560 NA 18,004
Nifty 50# 14.88% 7.74% 12.50% 10.05% 11,488 12,509 18,036 29,508 14.88% 7.74% NA 11.02% 11,488 12,509 NA 15,999
S&P BSE Sensex## 14.53% 6.75% 12.13% 9.69% 11,453 12,167 17,740 28,424 14.53% 6.75% NA 10.70% 11,453 12,167 NA 15,792
The fund is being managed by Mr. Sumit Agrawal (w.e.f. 20th October 2016)Performance based on NAV as on 30/06/2017. Past performance may or may not be sustained in future.For other funds managed by the fund manager, please refer page no. 34 - 36 & the respective fund pages Regular and Direct Plans have different expense structure. Direct Plan shall have a lower expense ratio excluding distribution expenses, commission expenses etc.*Risk-free rate assumed to be 6.25% (FBIL OVERNIGHT MIBOR as on 30th June 2017). Ratios calculated on the basis of 3 years history of monthly data. ^Portfolio Turnover ratio is calculated as Lower of purchase or sale during the period / Average AUM for the last one year (includes Fixed Income securities and Equity derivatives). #Benchmark Returns. ##Alternate Benchmark Returns.$$ The strategy of the Fund has been changed from large cap to focused fund
SIP PERFORMANCE
Monthly SIP of ` 10,000 in IDFC Focused Equity Fund - Regular Plan - Growth
1 Year 3 Years 5 Years 7 Years 10 YearsSince
InceptionMar 16, 2006
Total Amount Invested (`) 1,20,000 3,60,000 6,00,000 8,40,000 12,00,000 13,60,000
Total Value as on June 30, 2017 (`) 1,43,782 4,57,699 8,79,150 13,17,230 21,77,424 26,73,052
Fund Returns (%) 38.98 16.26 15.29 12.64 11.47 11.37
Total Value of Nifty 50 Index# 1,30,496 4,12,973 7,98,527 12,21,347 20,20,097 24,42,552
Nifty 50 Index Returns (%)# 16.73 9.14 11.39 10.52 10.06 9.89
Total Value of S&P BSE SENSEX## 1,30,881 4,08,394 7,84,765 11,97,833 19,75,338 23,76,860
S&P BSE SENSEX Returns (%)## 17.36 8.38 10.69 9.98 9.63 9.45
Past performance may or may not be sustained in future.Dividends are assumed to be reinvested and bonus is adjusted. Load is not taken into consideration. To illustrate the advantages of SIP investment, this is how your investment would have grown if you had invested say `10,000 systematically on the first business Day of every month over a period of time. Returns are calculated by using XIRR approach. XIRR helps in calculating return on investment given an initial and final value and a series of cash inflows and outflows with the correct allowence for the time impact of the transactions. Regular and Direct plans have different expense structure. Direct Plan shall have a lower expense ratio excluding distribution expenses, commision expenses etc. #Benchmark Returns. ##Alternate Benchmark Returns. Data as on June 30, 2017.
Riskometer
Investors understand that their principal will be at Moderately High risk
This product is suitable for investors who are seeking*:
To create wealth over a long period of time.•
Investment in a concentrated portfolio of equity •and equity related instruments of up to 30 companies.
*Investors should consult their financial advisers if in doubt about whether the product is suitable for them.
Gas 3.65%
Textile Products 3.54%
Construction 3.21%
Auto Ancillaries 2.86%
Cement 2.38%
Hotels, Resorts And Other Recreational Activities
2.26%
IT Consulting & Other Services 2.20%
NAV (`)
Regular Plan Growth 34.2099Regular Plan Dividend 13.9238Direct Plan Growth 35.9732Direct Plan Dividend 16.9024
PORTFOLIO
Name % of NAV
Equity and Equity related Instruments 93.18%
Banks 18.13%RBL Bank 4.29%
Kotak Mahindra Bank 3.93%
IndusInd Bank 3.57%
The South Indian Bank 3.35%
Lakshmi Vilas Bank 2.99%
Finance 17.12%PNB Housing Finance 4.24%SREI Infrastructure Finance 4.12%Bajaj Finance 3.98%
Rane Holdings 2.53%
AU Small Finance Bank 2.25%
Miscellaneous 10.17%Dishman Carbogen Amcis 4.29%
Central Depository Services (India) 2.48%
Eris Lifesciences 2.41%
Amulya Leasing And Finance 1.00%
Auto 8.56%Maruti Suzuki India 4.97%
Eicher Motors 3.59%
Industrial Capital Goods 5.09%Bharat Electronics 3.98%
Skipper 1.11%
Name % of NAV
Software 4.97%Infosys 4.97%
Consumer Durables 4.69%Titan Company 4.69%
Retailing 4.33%Avenue Supermarts 4.33%
Gas 3.65%
Petronet LNG 3.65%
Textile Products 3.54%
Dollar Industries 3.54%
Construction 3.21%
Kajaria Ceramics 3.21%
Auto Ancillaries 2.86%
Minda Industries 2.86%
Cement 2.38%
Sagar Cements 2.38%Hotels, Resorts And Other Recreational Activities 2.26%
The Indian Hotels Company 2.26%
IT Consulting & Other Services 2.20%Cognizant Technology Solutions Corp - International Equities 2.20%
Net Cash and Cash Equivalent 6.82%
Grand Total 100.00%

9
IDFC Equity Fund(The Fund has been repositioned with effect from April 18, 2017)$$ An Open Ended Equity Fund30th June 2017
FUND FEATURES
INDUSTRY ALLOCATION
Size
Large Cap
Mid Cap
Small Cap
Style Growth Blend Value
About the Fund: IDFC Equity Fund focuses on investing predominantly in Large Cap stocks.
Nature: Equity
Monthly Avg AUM: ` 266.04 Crores
Month end AUM: ` 266.02 Crores
Inception Date: 9 June 2006
Fund Manager: Mr. Sumit Agrawal & Mr. Arpit Kapoor (w.e.f. 1st March 2017)
Other Parameter:
Beta 0.97
R Square 0.96
Standard Deviation (Annualized) 12.79%
Sharpe* 0.20
Portfolio Turnover
Equity 0.79
Aggregate^ 0.90
Expense Ratio
Regular 2.54%
Direct 1.74%
Benchmark: S&P BSE 100 (w.e.f. April 18, 2017)
SIP (Minimum Amount): ` 1,000/-
SIP Frequency: Monthly
SIP Dates (Monthly): Any day of the month, except 29th, 30th & 31st day of the monthInvestment Objective: Refer Pg No from 41 to 42
Minimum Investment Amount : ` 5,000/- and any amount thereafter
Option Available: Growth, Dividend (Payout, Reinvestment and Sweep (from Equity Schemes to Debt Schemes only))
Exit Load: 1.00% if redeemed before 365 days from the date of allotment. (w.e.f. 1st September 2009)
Top 10 Equity Holdings
Banks 20.25%Finance 11.89%Consumer Non Durables 9.11%Auto 8.43%Software 7.39%Petroleum Products 5.89%Cement 4.68%Construction Project 4.31%Pharmaceuticals 3.87%Power 3.32%Consumer Durables 3.02%Retailing 2.57%
Performance Table Regular Plan - Growth Direct Plan - GrowthScheme Name CAGR Returns (%) Current Value of Investment of ` 10,000 CAGR Returns (%) Current Value of Investment of ` 10,000
1 Year 3 Years 5 Years
SinceInceptionJun 09, 2006
1 Year 3 Years 5 Years
SinceInceptionJun 09, 2006
1 Year 3 Years 5 Years
SinceInception
Jan 01, 2013
1 Year 3 Years 5 Years
SinceInception
Jan 01, 2013
IDFC Equity Fund 19.83% 8.82% 13.18% 9.94% 11,983 12,890 18,585 28,552 21.55% 10.37% NA 13.17% 12,155 13,448 NA 17,443
S&P BSE 100# 14.68% 7.68% 12.47% 11.44% 11,468 12,488 18,005 33,161 14.68% 7.68% NA 10.98% 11,468 12,488 NA 15,972
Nifty 50## 14.88% 7.74% 12.50% 11.46% 11,488 12,509 18,036 33,217 14.88% 7.74% NA 11.02% 11,488 12,509 NA 15,999
The fund is being managed by Mr. Sumit Agrawal & Mr. Arpit Kapoor (w.e.f. 1st March 2017). Performance based on NAV as on 30/06/2017. Past performance may or may not be sustained in future. For other funds managed by the fund manager, please refer page no. 34 - 36 & the respective fund pages Regular and Direct Plans have different expense structure. Direct Plan shall have a lower expense ratio excluding distribution expenses, commission expenses etc.*Risk-free rate assumed to be 6.25% (FBIL OVERNIGHT MIBOR as on 30th June 2017). Ratios calculated on the basis of 3 years history of monthly data. ^Portfolio Turnover ratio is calculated as Lower of purchase or sale during the period / Average AUM for the last one year (includes Fixed Income securities and Equity derivatives). #Benchmark Returns. ##Alternate Benchmark Returns. Current Index performance adjusted for the period from since inception to April 18, 2017 with the performance of Nifty 50 (Benchmark)$$For details please refer Notice (https://www.idfcmf.com/uploads/140320171238No-14-Change-in-Investmenty-Strategy-of-IDFC-Equity-Fund.pdf)
SIP PERFORMANCE
Monthly SIP of ` 10,000 in IDFC Equity Fund - Regular Plan - Growth
1 Year 3 Years 5 Years 7 Years 10 YearsSince
InceptionJun 09, 2006
Total Amount Invested (`) 1,20,000 3,60,000 6,00,000 8,40,000 12,00,000 13,30,000
Total Value as on June 30, 2017 (`) 1,34,142 4,27,020 8,22,537 12,65,384 20,97,774 24,32,934
Fund Returns (%) 22.72 11.43 12.59 11.51 10.77 10.44
Total Value of S&P BSE 100 Index# 1,31,078 4,19,496 8,17,995 12,50,833 20,69,303 24,17,294
S&P BSE 100 Index Returns (%)# 17.68 10.21 12.36 11.19 10.51 10.33
Total Value of Nifty 50## 1,30,496 4,12,973 7,98,527 12,21,347 20,19,185 23,59,214
Nifty 50 Returns (%)## 16.73 9.14 11.39 10.52 10.05 9.92
Past performance may or may not be sustained in future.Dividends are assumed to be reinvested and bonus is adjusted. Load is not taken into consideration. To illustrate the advantages of SIP investment, this is how your investment would have grown if you had invested say `10,000 systematically on the first business Day of every month over a period of time. Returns are calculated by using XIRR approach. XIRR helps in calculating return on investment given an initial and final value and a series of cash inflows and outflows with the correct allowence for the time impact of the transactions. Regular and Direct plans have different expense structure. Direct Plan shall have a lower expense ratio excluding distribution expenses, commision expenses etc. #Benchmark Returns. ##Alternate Benchmark Returns. Data as on June 30, 2017.
Riskometer
Investors understand that their principal will be at Moderately High risk
This product is suitable for investors who are seeking*:
To create wealth over a long period of time.•
Investment predominantly in equity and equity •related instruments in the large cap segment.
*Investors should consult their financial advisers if in doubt about whether the product is suitable for them.
Auto Ancillaries 2.19%Gas 1.91%Miscellaneous 1.76%Textile Products 1.42%Construction 1.36%Industrial Capital Goods 1.21%Ferrous Metals 1.11%Hotels, Resorts And Other Recreational Activities
1.02%
Transportation 0.93%Oil 0.62%
NAV (`)Regular Plan Growth 28.5516Regular Plan Dividend 14.2378Direct Plan Growth 30.0110Direct Plan Dividend 17.1496
PORTFOLIO
Name % of NAV
Equity and Equity related Instruments 98.25%Banks 20.25%HDFC Bank 7.08%ICICI Bank 4.14%Kotak Mahindra Bank 2.30%IndusInd Bank 2.11%RBL Bank 2.06%State Bank of India 1.44%Lakshmi Vilas Bank 1.11%Finance 11.89%Housing Development Finance Corporation 3.52%PNB Housing Finance 2.40%Bajaj Finance 2.06%ICICI Prudential Life Insurance Company 1.38%Magma Fincorp 1.37%GIC Housing Finance 1.15%Consumer Non Durables 9.11%ITC 4.87%Hindustan Unilever 1.95%Tata Coffee 0.99%Marico 0.76%Britannia Industries 0.55%Auto 8.43%Maruti Suzuki India 3.20%Mahindra & Mahindra 2.03%Hero MotoCorp 1.95%Eicher Motors 1.22%Tata Motors 0.03%Software 7.39%Infosys 4.15%NIIT Technologies 1.17%HCL Technologies 1.09%Tech Mahindra 0.98%Petroleum Products 5.89%Reliance Industries 3.32%Castrol India 0.97%Indian Oil Corporation 0.93%Bharat Petroleum Corporation 0.67%Cement 4.68%Ambuja Cements 1.30%UltraTech Cement 1.19%Shree Cements 1.15%Deccan Cements 1.05%
Name % of NAV
Construction Project 4.31%Larsen & Toubro 4.31%Pharmaceuticals 3.87%Aurobindo Pharma 1.29%Cadila Healthcare 1.15%Indoco Remedies 0.84%Alkem Laboratories 0.56%Sun Pharmaceutical Industries 0.04%Power 3.32%Power Grid Corporation of India 2.37%Nava Bharat Ventures 0.95%Consumer Durables 3.02%Titan Company 1.58%Mirza International 1.44%Retailing 2.57%Avenue Supermarts 2.57%Auto Ancillaries 2.19%Exide Industries 1.16%MRF 1.03%Gas 1.91%Petronet LNG 1.36%GAIL (India) 0.54%Miscellaneous 1.76%Central Depository Services (India) 1.76%Textile Products 1.42%Dollar Industries 1.42%Construction 1.36%PSP Projects 1.36%Industrial Capital Goods 1.21%Bharat Electronics 1.21%Ferrous Metals 1.11%Tata Steel 1.11%Hotels, Resorts And Other Recreational Activities 1.02%
Taj GVK Hotels & Resorts 1.02%Transportation 0.93%VRL Logistics 0.93%Oil 0.62%Oil & Natural Gas Corporation 0.62%Net Cash and Cash Equivalent 1.75%Grand Total 100.00%
Size
Large Cap
Mid Cap
Small Cap
Style Growth Blend Value

10
IDFC Nifty FundAn Open Ended Index Linked Equity Scheme
30th June 2017
FUND FEATURES
INDUSTRY ALLOCATION
About the Fund: IDFC Nifty Fund is an index fund which is managed passively by investing in proportion to the Nifty 50.Nature: EquityMonthly Avg AUM: ` 85.45 Crores Month end AUM: ` 85.45 Crores Inception Date: 30 April 2010Fund Manager: Mr. Arpit Kapoor & Mr. Sumit Agrawal (w.e.f. 1st March 2017) Other Parameter:Beta 1.00R Square 1.00 Standard Deviation (Annualized) 13.09%Sharpe* 0.18Portfolio TurnoverEquity 0.32Aggregate^ 0.52Tracking Error (Annualized) 0.64%Expense Ratio Regular 0.25%Direct 0.15%Benchmark: Nifty 50SIP (Minimum Amount): ` 100/- SIP Frequency: Monthly SIP Dates (Monthly): Any day of the month, except 29th, 30th & 31st day of the monthInvestment Objective: Refer Pg No from 41 to 42Minimum Investment Amount: ` 100/- and any amount thereafterOption Available: Growth, Dividend - (Payout, Reinvestment and Sweep (from Equity Schemes to Debt Schemes only))Exit Load: 1% if redeemed/switched out (to any non-equity scheme of IDFC Mutual Fund) within 7 days.
Top 10 Equity Holdings
Banks 26.41%Software 11.39%Consumer Non Durables 10.96%Auto 10.23%Petroleum Products 8.21%Finance 7.94%Pharmaceuticals 4.54%Construction Project 3.78%Power 2.73%Non - Ferrous Metals 2.02%
Performance Table Regular Plan - Growth Direct Plan - GrowthScheme Name CAGR Returns (%) Current Value of Investment of ` 10,000 CAGR Returns (%) Current Value of Investment of ` 10,000
1 Year 3 Years 5 YearsSince
InceptionApr 30, 2010
1 Year 3 Years 5 YearsSince
InceptionApr 30, 2010
1 Year 3 Years 5 YearsSince
InceptionJan 01, 2013
1 Year 3 Years 5 YearsSince
InceptionJan 01, 2013
IDFC Nifty Fund 15.47% 8.58% 13.33% 9.61% 11,547 12,803 18,706 19,310 15.59% 8.68% NA 11.96% 11,559 12,838 NA 16,618
Nifty 50# 14.88% 7.74% 12.50% 8.57% 11,488 12,509 18,036 18,039 14.88% 7.74% NA 11.02% 11,488 12,509 NA 15,999
S&P BSE Sensex## 14.53% 6.75% 12.13% 8.21% 11,453 12,167 17,740 17,610 14.53% 6.75% NA 10.70% 11,453 12,167 NA 15,792
The fund is being managed by Mr. Arpit Kapoor & Mr. Sumit Agrawal (w.e.f. 1st March 2017)Performance based on NAV as on 30/06/2017. Past performance may or may not be sustained in future.For other funds managed by the fund manager, please refer page no. 34 - 36 & the respective fund pages Regular and Direct Plans have different expense structure. Direct Plan shall have a lower expense ratio excluding distribution expenses, commission expenses etc.*Risk-free rate assumed to be 6.25% (FBIL OVERNIGHT MIBOR as on 30th June 2017). Ratios calculated on the basis of 3 years history of monthly data. ^Portfolio Turnover ratio is calculated as Lower of purchase or sale during the period / Average AUM for the last one year (includes Fixed Income securities and Equity derivatives). #Benchmark Returns. ##Alternate Benchmark Returns.
SIP PERFORMANCE
Monthly SIP of ` 10,000 in IDFC Nifty - Regular Plan - Growth
1 Year 3 Years 5 Years 7 YearsSince
InceptionApr 30, 2010
Total Amount Invested (`) 1,20,000 3,60,000 6,00,000 8,40,000 8,70,000
Total Value as on June 30, 2017 (`) 1,30,992 4,17,926 8,15,611 12,64,292 13,23,638
Fund Returns (%) 17.54 9.95 12.25 11.49 11.37
Total Value of Nifty 50 Index# 1,30,496 4,12,973 7,98,527 12,21,347 12,76,772
Nifty 50 Index Returns (%)# 16.73 9.14 11.39 10.52 10.40
Total Value of S&P BSE SENSEX## 1,30,881 4,08,394 7,84,765 11,97,833 12,51,888
S&P BSE SENSEX Returns (%)## 17.36 8.38 10.69 9.98 9.87
Past performance may or may not be sustained in future.Dividends are assumed to be reinvested and bonus is adjusted. Load is not taken into consideration. To illustrate the advantages of SIP investment, this is how your investment would have grown if you had invested say `10,000 systematically on the first business Day of every month over a period of time. Returns are calculated by using XIRR approach. XIRR helps in calculating return on investment given an initial and final value and a series of cash inflows and outflows with the correct allowence for the time impact of the transactions. Regular and Direct plans have different expense structure. Direct Plan shall have a lower expense ratio excluding distribution expenses, commision expenses etc. #Benchmark Returns. ##Alternate Benchmark Returns. Data as on June 30, 2017.
Riskometer
Investors understand that their principal will be at Moderately High risk
This product is suitable for investors who are seeking*:
Create wealth over a long period of time.•Replicate the Nifty 50 by investing in securities of •the Nifty 50 in the same proportion/weightage.
*Investors should consult their financial advisers if in doubt about whether the product is suitable for them.
Cement 1.98%Telecom - Services 1.37%Oil 1.21%Ferrous Metals 1.00%Minerals/Mining 0.87%Transportation 0.80%Media & Entertainment 0.73%Telecom - Equipment & Accessories 0.72%Gas 0.63%Auto Ancillaries 0.58%
NAV (`)
Regular Plan Growth 19.3104Regular Plan Dividend 19.4622Direct Plan Growth 19.3766Direct Plan Dividend 19.5418
PORTFOLIO
Name Rating % of NAV
Equity and Equity related Instruments 98.12%Banks 26.41%HDFC Bank 9.12%ICICI Bank 5.05%Kotak Mahindra Bank 3.17%State Bank of India 2.77%
Axis Bank 2.40%
IndusInd Bank 2.03%
Yes Bank 1.46%
Bank of Baroda 0.42%
Software 11.39%Infosys 5.10%Tata Consultancy Services 3.43%
HCL Technologies 1.32%
Wipro 0.89%
Tech Mahindra 0.65%
Consumer Non Durables 10.96%ITC 7.51%
Hindustan Unilever 2.10%
Asian Paints 1.36%
Auto 10.23%Maruti Suzuki India 2.61%
Tata Motors 2.58%
Mahindra & Mahindra 1.71%
Hero MotoCorp 1.31%
Bajaj Auto 1.03%
Eicher Motors 0.98%
Petroleum Products 8.21%Reliance Industries 6.24%
Indian Oil Corporation 1.07%
Bharat Petroleum Corporation 0.91%
Finance 7.94%HDFC 7.00%
Indiabulls Housing Finance 0.95%
Pharmaceuticals 4.54%Sun Pharmaceutical Industries 1.67%
Dr. Reddy's Laboratories 0.89%
Cipla 0.77%
Lupin 0.69%
Aurobindo Pharma 0.52%
Name Rating % of NAV
Construction Project 3.78%Larsen & Toubro 3.78%
Power 2.73%Power Grid Corporation of India 1.26%
NTPC 1.07%
Tata Power Company 0.40%
Non - Ferrous Metals 2.02%Vedanta 1.26%
Hindalco Industries 0.76%
Cement 1.98%UltraTech Cement 1.13%
Ambuja Cements 0.49%
ACC 0.36%
Telecom - Services 1.37%Bharti Airtel 1.37%
Oil 1.21%Oil & Natural Gas Corporation 1.21%
Ferrous Metals 1.00%Tata Steel 1.00%
Minerals/Mining 0.87%Coal India 0.87%
Transportation 0.80%Adani Ports and Special Economic Zone 0.80%
Media & Entertainment 0.73%Zee Entertainment Enterprises 0.73%
Telecom - Equipment & Accessories 0.72%Bharti Infratel 0.72%
Gas 0.63%GAIL (India) 0.63%
Auto Ancillaries 0.58%Bosch 0.58%
Corporate Bond 0.03%NTPC AAA 0.03%
Equity Futures 1.67%Index 1.67%Nifty Index 1.67%
Net Cash and Cash Equivalent 0.19%Grand Total 100.00%
Size
Large Cap
Mid Cap
Small Cap
Style Growth Blend Value

11
IDFC Infrastructure FundAn Open Ended Equity Scheme Fund
30th June 2017
FUND FEATURES
INDUSTRY ALLOCATION
About the Fund: A dedicated Infrastructure fund, that invests across the infrastructure value chain with exclusions like Banking, Autos, IT, Pharma and FMCG. It is a diversified portfolio of companies that are participating in and benefitting from the Indian Infrastructure and Infrastructure related activities.
Nature: Equity
Monthly Avg AUM: ` 277.05 Crores
Month end AUM: ` 296.98 Crores
Inception Date: 8 March 2011
Fund Manager: Mr. Rajendra Kumar Mishra (w.e.f. 27th June 2013)
Other Parameter:
Beta 0.75
R Square 0.68
Standard Deviation (Annualized) 16.55%
Sharpe* 0.55
Portfolio Turnover
Equity 0.43 Aggregate^ 0.43
Expense Ratio
Regular 2.54%
Direct 0.97%
Benchmark: Nifty Infrastructure
SIP (Minimum Amount): ` 1,000/-
SIP Frequency: Monthly
SIP Dates (Monthly): Any day of the month, except 29th, 30th & 31st day of the monthInvestment Objective: Refer Pg No from 41 to 42
Minimum Investment Amount: ` 5,000/- and any amount thereafter
Option Available: Growth, Dividend - (Payout, Reinvestment and Sweep (from Equity Schemes to Debt Schemes only))
Exit Load: 1.00% if redeemed before 365 days from the date of allotment.
Top 10 Equity Holdings
Construction 17.14%Power 11.43%Construction Project 11.37%Transportation 9.24%Industrial Capital Goods 6.41%Non - Ferrous Metals 5.91%Telecom - Services 5.64%Gas 5.05%
Performance Table Regular Plan - Growth Direct Plan - GrowthScheme Name CAGR Returns (%) Current Value of Investment of ` 10,000 CAGR Returns (%) Current Value of Investment of ` 10,000
1 Year3
Years5 Years
SinceInception
Mar 08, 20111 Year 3 Years 5 Years
SinceInception
Mar 08, 20111 Year 3 Years 5 Years
SinceInception
Jan 01, 20131 Year 3 Years 5 Years
SinceInception
Jan 01, 2013
IDFC Infrastructure Fund 44.01% 15.37% 13.26% 7.66% 14,401 15,360 18,649 15,938 46.11% 17.12% NA 15.26% 14,611 16,072 NA 18,938
Nifty Infrastructure# 12.50% -1.72% 5.78% 1.61% 11,250 9,492 13,251 11,063 12.50% -1.72% NA 4.60% 11,250 9,492 NA 12,240
Nifty 50## 14.88% 7.74% 12.50% 9.01% 11,488 12,509 18,036 17,246 14.88% 7.74% NA 11.02% 11,488 12,509 NA 15,999
The fund is being managed by Mr. Rajendra Kumar Mishra (w.e.f. 27th June 2013)Performance based on NAV as on 30/06/2017. Past performance may or may not be sustained in future.For other funds managed by the fund manager, please refer page no. 34 - 36 & the respective fund pages Regular and Direct Plans have different expense structure. Direct Plan shall have a lower expense ratio excluding distribution expenses, commission expenses etc.*Risk-free rate assumed to be 6.25% (FBIL OVERNIGHT MIBOR as on 30th June 2017). Ratios calculated on the basis of 3 years history of monthly data. ^Portfolio Turnover ratio is calculated as Lower of purchase or sale during the period / Average AUM for the last one year (includes Fixed Income securities and Equity derivatives). #Benchmark Returns. ##Alternate Benchmark Returns.
SIP PERFORMANCE
Monthly SIP of ` 10,000 in IDFC Infrastructure Fund - Regular Plan - Growth
1 Year 3 Years 5 YearsSince
InceptionMar 08, 2011
Total Amount Invested (`) 1,20,000 3,60,000 6,00,000 7,60,000
Total Value as on June 30, 2017 (`) 1,45,225 4,91,021 9,68,766 12,43,916
Fund Returns (%) 41.47 21.27 19.26 15.39
Total Values of Nifty Infrastructure# 1,30,179 3,88,823 7,08,586 9,02,142
Nifty Infrastructure Returns (%)# 16.21 5.08 6.60 5.35
Total Value of Nifty 50 Index## 1,30,496 4,12,973 7,98,527 10,88,223
Nifty 50 Index returns (%)## 16.73 9.14 11.39 11.20
Past performance may or may not be sustained in future.Dividends are assumed to be reinvested and bonus is adjusted. Load is not taken into consideration. To illustrate the advantages of SIP investment, this is how your investment would have grown if you had invested say `10,000 systematically on the first business Day of every month over a period of time. Returns are calculated by using XIRR approach. XIRR helps in calculating return on investment given an initial and final value and a series of cash inflows and outflows with the correct allowence for the time impact of the transactions. Regular and Direct plans have different expense structure. Direct Plan shall have a lower expense ratio excluding distribution expenses, commision expenses etc. #Benchmark Returns. ##Alternate Benchmark Returns. Data as on June 30, 2017.
Riskometer
Investors understand that their principal will be at High risk
This product is suitable for investors who are seeking*:
Create wealth over a long period of time.•Investment predominantly in equity and equity •related instruments of companies that are participating in and benefiting from growth in Indian infrastructure and infrastructural related activities.
*Investors should consult their financial advisers if in doubt about whether the product is suitable for them.
Miscellaneous 4.02%Ferrous Metals 3.28%Finance 2.71%Engineering Services 2.57%Cement 1.93%Petroleum Products 1.25%Hotels, Resorts And Other Recreational Activities
0.99%
Industrial Products 0.79%Consumer Durables 0.73%
NAV (`)
Regular Plan Growth 15.9375Regular Plan Dividend 15.9443Direct Plan Growth 16.8255Direct Plan Dividend 16.8145
Size
Large Cap
Mid Cap
Small Cap
Style Growth Blend Value
PORTFOLIO
Name % of NAV
Equity and Equity related Instruments 90.45%
Construction 17.14%Dilip Buildcon 3.72%NBCC (India) 3.43%J.Kumar Infraprojects 3.11%
Ahluwalia Contracts (India) 2.51%
PSP Projects 2.11%
PNC Infratech 1.69%
ITD Cementation India 0.59%
Power 11.43%
NTPC 2.54%
Power Grid Corporation of India 2.48%
Adani Transmission 2.46%
CESC 1.99%
PTC India 1.95%
Construction Project 11.37%Engineers India 3.83%Larsen & Toubro 3.47%
Techno Electric & Engineering Company 1.89%
Sadbhav Engineering 1.89%
Sadbhav Infrastructure Project 0.29%
Transportation 9.24%Adani Ports and Special Economic Zone 2.72%InterGlobe Aviation 2.59%
Gateway Distriparks 2.13%
Navkar Corporation 1.77%
Snowman Logistics 0.03%
Industrial Capital Goods 6.41%
BEML 1.70%
Bharat Electronics 1.55%
Praj Industries 1.35%
Bharat Heavy Electricals 1.18%
TD Power Systems 0.62%
Non - Ferrous Metals 5.91%Vedanta 5.20%
National Aluminium Company 0.71%
Name % of NAV
Telecom - Services 5.64%Bharti Airtel 4.09%
Idea Cellular 1.55%
Gas 5.05%
Gujarat State Petronet 2.08%
Indraprastha Gas 1.78%
Gujarat Gas 0.70%
GAIL (India) 0.49%
Miscellaneous 4.02%Tejas Networks 4.02%
Ferrous Metals 3.28%
Maharashtra Seamless 1.97%
Ratnamani Metals & Tubes 1.31%
Finance 2.71%
SREI Infrastructure Finance 1.66%
PTC India Financial Services 1.05%
Engineering Services 2.57%
VA Tech Wabag 2.57%
Cement 1.93%
UltraTech Cement 1.13%
Sagar Cements 0.44%
Deccan Cements 0.35%
Petroleum Products 1.25%
Reliance Industries 1.25%
Hotels, Resorts And Other Recreational Activities 0.99%
Taj GVK Hotels & Resorts 0.99%
Industrial Products 0.79%
Kirloskar Oil Engines 0.79%
Consumer Durables 0.73%
Blue Star 0.73%
Preference Shares 0.39%
Non - Ferrous Metals 0.39%
Vedanta 0.39%
Net Cash and Cash Equivalent 9.16%
Grand Total 100.00%

12
IDFC Tax Advantage (ELSS) FundAn Open Ended Equity Linked Saving Scheme with Lock in Period of 3 Years
30th June 2017
FUND FEATURES
INDUSTRY ALLOCATION
About the Fund: The Fund is an Equity Linked Savings Scheme (ELSS) that aims to generate long term capital growth from a diversified equity portfolio and enables investors to avail of a deduction from total income, as permitted under the Income Tax Act, 1961.
Nature: Equity
Monthly Avg AUM: ` 620.35 Crores
Month end AUM: ` 621.42 Crores
Inception Date: 26 December 2008
Fund Manager: Mr. Daylynn Pinto (w.e.f. 20th October 2016)
Other Parameter:
Beta 1.04 R Square 0.82 Standard Deviation (Annualized) 14.84% Sharpe* 0.73
Portfolio Turnover
Equity 0.61 Aggregate^ 0.61
Expense Ratio
Regular 2.40%
Direct 1.57%
Benchmark: S&P BSE 200
SIP (Minimum Amount): ` 500/-
SIP Frequency : Monthly
SIP Dates (Monthly): Any day of the month, except 29th, 30th & 31st day of the monthInvestment Objective: Refer Pg No from 41 to 42
Minimum Investment Amount: ` 500/- and in multiples of ` 500/- thereafter.
Option Available: Growth, Dividend (Payout, Reinvestment and Sweep (from Equity Schemes to Debt Schemes only))
Exit Load: Nil
Top 10 Equity Holdings
Banks 17.99%Consumer Non Durables 10.12%Auto Ancillaries 7.12%Finance 6.84%Software 6.27%Construction Project 5.81%Cement 5.06%Auto 4.71%Retailing 4.70%Petroleum Products 4.02%Miscellaneous 3.21%Gas 3.01%Media & Entertainment 2.27%
Performance Table Regular Plan - Growth Direct Plan - GrowthScheme Name CAGR Returns (%) Current Value of Investment of ` 10,000 CAGR Returns (%) Current Value of Investment of ` 10,000
1 Year 3 Years 5 Years
SinceInceptionDec 26, 2008
1 Year 3 Years 5 Years
SinceInceptionDec 26, 2008
1 Year 3 Years 5 Years
SinceInception
Jan 01, 2013
1 Year 3 Years 5 Years
SinceInception
Jan 01, 2013
IDFC Tax Advantage (ELSS) Fund
26.87% 17.14% 21.55% 20.73% 12,687 16,080 26,563 49,741 28.23% 18.63% NA 20.73% 12,823 16,704 NA 23,325
S&P BSE 200# 18.08% 9.91% 14.16% 16.68% 11,808 13,280 19,406 37,184 18.08% 9.91% NA 12.47% 11,808 13,280 NA 16,961
Nifty 50## 14.88% 7.74% 12.50% 15.18% 11,488 12,509 18,036 33,322 14.88% 7.74% NA 11.02% 11,488 12,509 NA 15,999
The fund is being managed by Mr. Daylynn Pinto (w.e.f. 20th October 2016), Performance based on NAV as on 30/06/2017, Past performancemay ormay not be sustained in future. Regular and Direct Plans have different expense structure. Direct Plan shall have a lower expense ratio excluding distribution expenses, commission expenses etc. For other funds managed by the fund manager, please refer page no. 34 - 36 & the respective fund pages. *Risk-free rate assumed to be 6.25% (FBIL OVERNIGHT MIBOR as on 30th June 2017). Ratios calculated on the basis of 3 years history of monthly data. ^Portfolio Turnover ratio is calculated as Lower of purchase or sale during the period / Average AUM for the last one year (includes Fixed Income securities and Equity derivatives). #Benchmark Returns. ##Alternate Benchmark Returns.
SIP PERFORMANCE
Monthly SIP of ` 10,000 in IDFC Tax Advantage (ELSS) Fund - Regular Plan - Growth
1 Year 3 Years 5 Years 7 YearsSince
InceptionDec 26, 2008
Total Amount Invested (`) 1,20,000 3,60,000 6,00,000 8,40,000 10,30,000
Total Value as on June 30, 2017 (`) 1,39,145 4,63,023 9,99,905 16,24,396 23,19,054
Fund Returns (%) 31.09 17.08 20.56 18.52 18.27
Total Value of S&P BSE 200# 1,31,643 4,26,624 8,44,201 12,91,630 17,74,370
S&P BSE 200 Returns (%)# 18.61 11.36 13.64 12.09 12.31
Total Value of NIFTY 50 Index## 1,30,496 4,12,973 7,98,527 12,21,347 16,67,142
NIFTY 50 Index Returns (%)## 16.73 9.14 11.39 10.52 10.92
Past performance may or may not be sustained in future.Dividends are assumed to be reinvested and bonus is adjusted. Load is not taken into consideration. To illustrate the advantages of SIP investment, this is how your investment would have grown if you had invested say `10,000 systematically on the first business Day of every month over a period of time. Returns are calculated by using XIRR approach. XIRR helps in calculating return on investment given an initial and final value and a series of cash inflows and outflows with the correct allowence for the time impact of the transactions. Regular and Direct plans have different expense structure. Direct Plan shall have a lower expense ratio excluding distribution expenses, commision expenses etc. #Benchmark Returns. ##Alternate Benchmark Returns. Data as on June 30, 2017.
Ferrous Metals 2.07%Construction 1.99%Chemicals 1.94%Industrial Products 1.93%Transportation 1.89%Consumer Durables 1.35%Non - Ferrous Metals 1.32%Power 1.13%Pharmaceuticals 1.10%Hotels, Resorts And Other Recreational Activities 0.95%
Fertilisers 0.74%
NAV (`)
Regular Plan Growth 49.7412Regular Plan Dividend 16.5225Direct Plan Growth 52.0412Direct Plan Dividend 19.8148
Size
Large Cap
Mid Cap
Small Cap
Style Growth Blend Value
Riskometer
Investors understand that their principal will be at Moderately High risk
This product is suitable for investors who are seeking*:
Create wealth over a long period of time.•
Investment predominantly in Equity and Equity •related securities.
*Investors should consult their financial advisers if in doubt about whether the product is suitable for them.
PORTFOLIO
Name % of NAV
Equity and Equity related Instruments 97.55%Banks 17.99%HDFC Bank 5.58%ICICI Bank 3.60%Axis Bank 2.33%Kotak Mahindra Bank 1.92%IndusInd Bank 1.90%RBL Bank 1.72%The Federal Bank 0.94%Consumer Non Durables 10.12%ITC 4.43%Procter & Gamble Hygiene and Health Care 1.94%Mcleod Russel India 1.26%Hindustan Unilever 1.04%HBL Power Systems 0.94%S H Kelkar and Company 0.51%Auto Ancillaries 7.12%Minda Industries 2.27%Apollo Tyres 1.36%Igarashi Motors India 1.27%Tube Investments of India 0.86%MRF 0.77%GNA Axles 0.33%WABCO India 0.27%Finance 6.84%Housing Development Finance Corporation 2.08%SREI Infrastructure Finance 1.40%ICICI Prudential Life Insurance Company 1.26%Magma Fincorp 1.10%Max Financial Services 1.02%Software 6.27%Infosys 2.86%HCL Technologies 1.37%Tech Mahindra 1.05%Mastek 1.00%Construction Project 5.81%KEC International 2.70%Voltas 1.69%Engineers India 1.42%Cement 5.06%The Ramco Cements 2.91%Ambuja Cements 1.39%Sagar Cements 0.77%Auto 4.71%Maruti Suzuki India 2.21%Tata Motors 1.64%Eicher Motors 0.87%Retailing 4.70%Future Retail 3.57%Future Lifestyle Fashions 1.13%
Name % of NAV
Petroleum Products 4.02%Indian Oil Corporation 1.86%Hindustan Petroleum Corporation 1.64%Bharat Petroleum Corporation 0.51%Miscellaneous 3.21%Dishman Carbogen Amcis 1.50%Eris Lifesciences 0.96%Amulya Leasing And Finance 0.76%Gas 3.01%GAIL (India) 2.04%Petronet LNG 0.97%Media & Entertainment 2.27%PVR 1.25%Zee Entertainment Enterprises 1.03%Ferrous Metals 2.07%Jindal Steel & Power 1.09%JSW Steel 0.98%Construction 1.99%PSP Projects 1.08%Asian Granito India 0.90%Chemicals 1.94%Deepak Nitrite 1.30%Atul 0.64%Industrial Products 1.93%KEI Industries 1.05%Bharat Forge 0.88%Transportation 1.89%VRL Logistics 1.89%Consumer Durables 1.35%Crompton Greaves Consumer Electricals 1.35%Non - Ferrous Metals 1.32%Hindalco Industries 1.32%Power 1.13%Nava Bharat Ventures 1.13%Pharmaceuticals 1.10%Aurobindo Pharma 1.10%Hotels, Resorts And Other Recreational Activities 0.95%
EIH 0.95%Fertilisers 0.74%Gujarat State Fertilizers & Chemicals 0.74%Preference Shares 0.25%Miscellaneous 0.22%3D PLM Software Solutions 0.22%Media & Entertainment 0.04%Zee Entertainment Enterprises 0.04%Net Cash and Cash Equivalent 2.19%Grand Total 100.00%

13
IDFC Arbitrage FundAn Open Ended Equity Fund
30th June 2017
FUND FEATURES
About the Fund: The fund invests in arbitrage opportunities in the cash and the derivative segments of the equity markets. It aims to capture the spread (Cost of Carry) between the cash and futures market by simultaneously executing buy (in the cash market) and sell (in the futures market) trades. The balance is invested in debt and money market instruments. The fund typically follows a strategy of taking market neutral (equally offsetting) positions in the equity market making it a low risk product irrespective of the movements in equity market.
Nature: Equity & Equity Derivatives
Monthly Avg AUM: ` 2,599.99 Crores
Month end AUM: ` 2231.71 Crores
Inception Date: 21 December 2006
Fund Manager: Equity Portion: Mr. Yogik Pitti (w.e.f. 27th June 2013), Mr. Arpit Kapoor (w.e.f. 1st March 2017) & Debt Portion: Mr. Harshal Joshi (w.e.f. 20th October 2016)
Other Parameter:
Beta 0.99 R Square 0.43 Standard Deviation (Annualized) 0.48% Sharpe* 1.17
Portfolio Turnover
Equity 3.47
Aggregate^ 14.97
Expense Ratio
Regular 0.97%
Direct 0.39%
Benchmark: Crisil Liquid Fund Index
SIP (Minimum Amount): ` 100/-
SIP Frequency: Monthly
SIP Dates (Monthly): Any day of the month, except 29th, 30th & 31st day of the month Investment Objective: Refer Pg No from 41 to 42
Minimum Investment Amount: ` 100/- and any amount thereafter
Option Available: Growth, Dividend - (Payout,Reinvestment and Sweep (from Equity Schemes to Debt Schemes only)) - Monthly & Annual
Exit Load: 0.25% if redeemed / switched-out within 1 month from the date of allotment (w.e.f 01st July 2016)
Performance Table Regular Plan - Growth Direct Plan - GrowthScheme Name CAGR Returns (%) Current Value of Investment of ` 10,000 CAGR Returns (%) Current Value of Investment of ` 10,000
1 Year 3 Years 5 YearsSince
InceptionDec 21, 2006
1 Year 3 Years 5 YearsSince
InceptionDec 21, 2006
1 Year 3 Years 5 YearsSince
InceptionJan 17, 2013
1 Year 3 Years 5 YearsSince
InceptionJan 17, 2013
IDFC Arbitrage Fund 6.14% 6.81% 7.66% 7.31% 10,614 12,188 14,469 21,017 6.71% 7.42% NA 8.13% 10,671 12,396 NA 14,164
CRISIL Liquid Fund Index# 6.86% 7.83% 8.25% 7.60% 10,686 12,541 14,872 21,633 6.86% 7.83% NA 8.29% 10,686 12,541 NA 14,258
Nifty 50## 14.88% 7.74% 12.50% 9.02% 11,488 12,509 18,036 24,836 14.88% 7.74% NA 10.77% 11,488 12,509 NA 15,765
The fund is being managed by Mr. Yogik Pitti (w.e.f. 27th June 2013), Mr. Arpit Kapoor (w.e.f. 1st March 2017) & Debt Portion: Mr. Harshal Joshi (w.e.f. 20th October 2016)Performance based on NAV as on 30/06/2017. Past performance may or may not be sustained in future.For other funds managed by the fund manager, please refer page no. 34 - 36 & the respective fund pages Regular and Direct Plans have different expense structure. Direct Plan shall have a lower expense ratio excluding distribution expenses, commission expenses etc.*Risk-free rate assumed to be 6.25% (FBIL OVERNIGHT MIBOR as on 30th June 2017). Ratios calculated on the basis of 3 years history of monthly data. ^Portfolio Turnover ratio is calculated as Lower of purchase or sale during the period / Average AUM for the last one year (includes Fixed Income securities and Equity derivatives). #Benchmark Returns. ##Alternate Benchmark Returns.
SIP PERFORMANCE
Monthly SIP of ` 10,000 in IDFC Arbitrage Fund - Regular Plan - Growth
1 Year 3 Years 5 Years 7 Years 10 YearsSince
InceptionDec 21, 2006
Total Amount Invested (`) 1,20,000 3,60,000 6,00,000 8,40,000 12,00,000 12,70,000
Total Value as on June 30, 2017 (`) 1,23,785 3,96,365 7,17,136 10,97,574 17,52,618 18,96,383
Fund Returns (%) 5.94 6.36 7.08 7.52 7.36 7.34
Total Value of Crisil Liquid Fund Index# 1,24,300 4,02,660 7,33,110 11,21,811 17,98,511 19,47,522
Crisil Liquid Fund Index Returns (%)# 6.76 7.42 7.96 8.14 7.85 7.82
Total Value of Nifty 50 Index## 1,30,496 4,12,973 7,98,527 12,21,347 20,20,097 21,87,982
Nifty 50 Index Returns (%)## 16.73 9.14 11.39 10.52 10.06 9.89Past performance may or may not be sustained in future.Dividends are assumed to be reinvested and bonus is adjusted. Load is not taken into consideration. To illustrate the advantages of SIP investment, this is how your investment would have grown if you had invested say `10,000 systematically on the first business Day of every month over a period of time. Returns are calculated by using XIRR approach. XIRR helps in calculating return on investment given an initial and final value and a series of cash inflows and outflows with the correct allowence for the time impact of the transactions. Regular and Direct plans have different expense structure. Direct Plan shall have a lower expense ratio excluding distribution expenses, commision expenses etc. #Benchmark Returns. ##Alternate Benchmark Returns. Data as on June 30, 2017.
INDUSTRY ALLOCATION
Finance 9.33%Consumer Non Durables 6.89%Banks 6.77%Ferrous Metals 6.58%Pharmaceuticals 6.43%Auto 5.65%Cement 5.19%Power 4.26%Software 2.97%Media & Entertainment 2.00%Petroleum Products 1.99%Auto Ancillaries 1.72%Oil 1.44%Pesticides 1.42%Construction 1.36%
Gas 1.33%Non - Ferrous Metals 1.21%Chemicals 0.91%Industrial Products 0.86%Healthcare Services 0.78%Construction Project 0.78%Industrial Capital Goods 0.65%Telecom - Services 0.55%Minerals/Mining 0.54%Consumer Durables 0.27%Trading 0.24%Textile Products 0.12%Telecom - Equipment & Accessories 0.11%Transportation 0.10%
NAV (`)
Regular Plan Growth 21.0169Regular Plan Monthly Dividend 12.6547Regular Plan Annual Dividend 10.5797Direct Plan Growth 21.5014Direct Plan Monthly Dividend 13.0184Direct Plan Annual Dividend 11.5808
Riskometer
Investors understand that their principal will be at Moderately Low risk
This product is suitable for investors who are seeking*:
To generate low volatility returns over short to •medium termInvestments predominantly in arbitrage opportunities •in the cash and derivative segments of the equity markets and the arbitrage opportunities available within the derivative segment and by investing the balance in debt and money market instruments.
*Investors should consult their financial advisers if in doubt about whether the product is suitable for them.
PORTFOLIO
Name Industries% of NAV
JSW Steel Ferrous Metals 3.94%ITC Consumer Non Durables 2.93%Yes Bank Banks 2.64%Sun Pharmaceutical Industries Pharmaceuticals 2.57%Infosys Software 2.45%Zee Entertainment Enterprises Media & Entertainment 1.92%CESC Power 1.85%Tata Global Beverages Consumer Non Durables 1.85%Reliance Capital Finance 1.82%Century Textiles & Industries Cement 1.82%Tata Motors Auto 1.78%The Federal Bank Banks 1.77%Indiabulls Housing Finance Finance 1.71%Tata Motors Auto 1.53%Dewan Housing Finance Corporation Finance 1.53%Reliance Infrastructure Power 1.53%United Spirits Consumer Non Durables 1.52%Tata Steel Ferrous Metals 1.51%State Bank of India Banks 1.47%UPL Pesticides 1.42%UltraTech Cement Cement 1.40%Oil & Natural Gas Corporation Oil 1.39%Max Financial Services Finance 1.22%Jindal Steel & Power Ferrous Metals 1.13%Exide Industries Auto Ancillaries 1.12%Mahindra & Mahindra Auto 1.08%Ambuja Cements Cement 1.05%Bajaj Finance Finance 0.98%Dr. Reddy's Laboratories Pharmaceuticals 0.88%Indraprastha Gas Gas 0.86%Maruti Suzuki India Auto 0.79%Fortis Healthcare Healthcare Services 0.78%LIC Housing Finance Finance 0.78%Reliance Industries Petroleum Products 0.75%Lupin Pharmaceuticals 0.71%Pidilite Industries Chemicals 0.71%Grasim Industries Cement 0.68%Divi's Laboratories Pharmaceuticals 0.68%Bharat Forge Industrial Products 0.62%Indiabulls Real Estate Construction 0.61%Reliance Power Power 0.59%Hindustan Zinc Non - Ferrous Metals 0.55%Bank of Baroda Banks 0.52%Indian Oil Corporation Petroleum Products 0.48%Glenmark Pharmaceuticals Pharmaceuticals 0.45%Tata Communications Telecom - Services 0.44%Hindalco Industries Non - Ferrous Metals 0.43%NMDC Minerals/Mining 0.43%Castrol India Petroleum Products 0.43%Asian Paints Consumer Non Durables 0.35%Apollo Tyres Auto Ancillaries 0.34%IRB Infrastructure Developers Construction 0.34%Hindustan Petroleum Corporation Petroleum Products 0.34%Granules India Pharmaceuticals 0.33%Aurobindo Pharma Pharmaceuticals 0.33%Housing Development and Infrastructure Construction 0.32%
Engineers India Construction Project 0.31%Bharat Financial Inclusion Finance 0.31%Muthoot Finance Finance 0.30%Bharat Electronics Industrial Capital Goods 0.29%GAIL (India) Gas 0.29%Voltas Construction Project 0.27%Motherson Sumi Systems Auto Ancillaries 0.26%Bharat Heavy Electricals Industrial Capital Goods 0.25%
Name Industries% of NAV
Shriram Transport Finance Company Finance 0.24%Tata Elxsi Software 0.24%Adani Enterprises Trading 0.24%Bajaj Auto Auto 0.23%Ashok Leyland Auto 0.23%Bata India Consumer Durables 0.21%Vedanta Non - Ferrous Metals 0.21%Tata Chemicals Chemicals 0.20%Britannia Industries Consumer Non Durables 0.18%Petronet LNG Gas 0.18%Power Grid Corporation of India Power 0.17%MindTree Software 0.15%The India Cements Cement 0.15%Rural Electrification Corporation Finance 0.15%Power Finance Corporation Finance 0.15%Wockhardt Pharmaceuticals 0.13%Cadila Healthcare Pharmaceuticals 0.12%Arvind Textile Products 0.12%Coal India Minerals/Mining 0.12%JSW Energy Power 0.11%Reliance Communications Telecom - Services 0.11%
Bharti Infratel Telecom - Equipment & Accessories 0.11%
GMR Infrastructure Construction Project 0.11%Jain Irrigation Systems Industrial Products 0.11%Sintex Industries Industrial Products 0.10%Syndicate Bank Banks 0.10%Adani Ports and Special Economic Zone Transportation 0.10%
ACC Cement 0.10%BEML Industrial Capital Goods 0.09%ICICI Bank Banks 0.09%Cipla Pharmaceuticals 0.09%DLF Construction 0.09%Strides Shasun Pharmaceuticals 0.09%Larsen & Toubro Construction Project 0.09%Sun TV Network Media & Entertainment 0.07%Andhra Bank Banks 0.07%Tech Mahindra Software 0.06%Titan Company Consumer Durables 0.06%Oracle Financial Services Software Software 0.06%IndusInd Bank Banks 0.05%Oil India Oil 0.05%Hindustan Unilever Consumer Non Durables 0.05%Axis Bank Banks 0.04%HDFC Finance 0.04%L&T Finance Holdings Finance 0.04%Biocon Pharmaceuticals 0.04%Mahindra & Mahindra Financial Services Finance 0.03%
Bajaj Finserv Finance 0.03%Cummins India Industrial Products 0.03%National Aluminium Company Non - Ferrous Metals 0.02%Siemens Industrial Capital Goods 0.02%Hero MotoCorp Auto 0.01%NTPC Power 0.01%KPIT Technologies Software 0.01%Kotak Mahindra Bank Banks 0.01%Dabur India Consumer Non Durables 0.01%Torrent Power Power 0.005%Total Hedged Equity 72.44%Margin Fixed Deposit 19.83%Corporate Bond 26.18%CBLO 4.97%Adjusted Net Current Asset -23.42%Grand Total 100.00%

14
IDFC Arbitrage Plus FundAn Open Ended Equity Fund
30th June 2017
FUND FEATURES
INDUSTRY ALLOCATION
About the Fund: The fund invests in arbitrage opportunities in the cash and the derivative segments of the equity markets. It aims to capture the spread between the cash and futures market by simultaneously executing buy (in the cash market) and sell (in the futures market) trades. The fund can also tactically participate in a mix of strategies like pair trades, corporate events like buybacks, etc, (restricted upto 5% of the portfolio). The balance is invested in actively managed debt and money market instruments.
Nature: Equity Derivatives
Monthly Avg AUM: ` 655.24 Crores
Month end AUM: ` 644.24 Crores
Inception Date: 9 June 2008
Fund Manager: Equity Portion: Mr. Yogik Pitti (w.e.f. 27th June 2013), Mr. Arpit Kapoor (w.e.f. 1st March 2017) & Debt Portion: Mr. Harshal Joshi (w.e.f. 20th October 2016)
Other Parameter:
Beta 1.47 R Square 0.22 Standard Deviation (Annualized) 0.99% Sharpe* 0.44
Portfolio Turnover
Equity 2.51 Aggregate^ 19.65
Expense Ratio
Regular 1.04%
Direct 0.38%
Benchmark: Crisil Liquid Fund Index
SIP (Minimum Amount): ` 1000/-
SIP Frequency: Monthly
SIP Dates (Monthly): Any day of the month, except 29th, 30th & 31st day of the monthInvestment Objective: Refer Pg No from 41 to 42
Minimum Investment Amount: ` 5,000/- and any amount thereafter
Option Available: Growth, Dividend - (Payout, Reinvestment and Sweep (from Equity Schemes to Debt Schemes only)) - Monthly & Annual
Exit Load: 0.25% if redeemed / switched-out within 1 (one) month from the date of allotment. (w.e.f. 12th August 2016)
Auto 10.74%Pharmaceuticals 10.44%Ferrous Metals 5.44%Petroleum Products 5.31%Finance 4.25%Healthcare Services 4.22%Cement 4.00%Industrial Capital Goods 3.38%Software 3.26%Banks 3.16%Consumer Non Durables 2.93%Construction 2.89%
Performance Table Regular Plan - Growth Direct Plan - GrowthScheme Name CAGR Returns (%) Current Value of Investment of ` 10,000 CAGR Returns (%) Current Value of Investment of ` 10,000
1 Year 3 Years 5 Years
SinceInceptionJun 09, 2008
1 Year 3 Years 5 Years
SinceInceptionJun 09, 2008
1 Year 3 Years 5 Years
SinceInception
Dec 31, 20131 Year 3 Years 5 Years
SinceInception
Dec 31, 2013
IDFC Arbitrage Plus Fund 6.44% 6.69% 7.43% 7.02% 10,644 12,145 14,312 18,502 7.25% 7.43% NA 7.63% 10,725 12,402 NA 12,932
CRISIL Liquid Fund Index# 6.86% 7.83% 8.25% 7.62% 10,686 12,541 14,872 19,458 6.86% 7.83% NA 8.08% 10,686 12,541 NA 13,124
Nifty 50## 14.88% 7.74% 12.50% 8.62% 11,488 12,509 18,036 21,153 14.88% 7.74% NA 12.51% 11,488 12,509 NA 15,103
The fund is being managed by Mr. Yogik Pitti (w.e.f. 27th June 2013), Mr. Arpit Kapoor (w.e.f. 1st March 2017) & Debt Portion: Mr. Harshal Joshi (w.e.f. 20th October 2016)Performance based on NAV as on 30/06/2017. Past performance may or may not be sustained in future.For other funds managed by the fund manager, please refer page no. 34 - 36 & the respective fund pages Regular and Direct Plans have different expense structure. Direct Plan shall have a lower expense ratio excluding distribution expenses, commission expenses etc.*Risk-free rate assumed to be 6.25% (FBIL OVERNIGHT MIBOR as on 30th June 2017). Ratios calculated on the basis of 3 years history of monthly data. ^Portfolio Turnover ratio is calculated as Lower of purchase or sale during the period / Average AUM for the last one year (includes Fixed Income securities and Equity derivatives). #Benchmark Returns. ##Alternate Benchmark Returns.
SIP PERFORMANCE
Monthly SIP of ` 10,000 in IDFC Arbitrage Plus Fund - Regular Plan - Growth
1 Year 3 Years 5 Years 7 Years 10 YearsSince
InceptionJun 09, 2008
Total Amount Invested (`) 1,20,000 3,60,000 6,00,000 8,40,000 NA 10,90,000
Total Value as on June 30, 2017 (`) 1,23,450 3,96,053 7,13,755 10,86,464 NA 15,19,672
Fund Returns (%) 5.41 6.31 6.89 7.24 NA 7.14
Total Value of Crisil Liquid Fund Index# 1,24,300 4,02,660 7,33,110 11,21,811 NA 15,76,569
Crisil Liquid Fund Index Returns (%)# 6.76 7.42 7.96 8.14 NA 7.92
Total Value of Nifty 50 Index## 1,30,496 4,12,973 7,98,527 12,21,347 NA 18,13,738
Nifty 50 Index Returns (%)## 16.73 9.14 11.39 10.52 NA 10.87
Past performance may or may not be sustained in future.Dividends are assumed to be reinvested and bonus is adjusted. Load is not taken into consideration. To illustrate the advantages of SIP investment, this is how your investment would have grown if you had invested say `10,000 systematically on the first business Day of every month over a period of time. Returns are calculated by using XIRR approach. XIRR helps in calculating return on investment given an initial and final value and a series of cash inflows and outflows with the correct allowence for the time impact of the transactions. Regular and Direct plans have different expense structure. Direct Plan shall have a lower expense ratio excluding distribution expenses, commision expenses etc. #Benchmark Returns. ##Alternate Benchmark Returns. Data as on June 30, 2017.
Power 2.58%Oil 0.99%Auto Ancillaries 0.91%Construction Project 0.81%Gas 0.72%Media & Entertainment 0.60%Textile Products 0.49%Non - Ferrous Metals 0.19%Chemicals 0.18%Minerals/Mining 0.06%Industrial Products 0.04%
NAV (`)
Regular Plan Growth 18.5020Regular Plan Monthly Dividend 12.0403Regular Plan Annual Dividend 10.7328Direct Plan Growth 18.9425Direct Plan Monthly Dividend 12.3286
Direct Plan Annual Dividend 11.0270
Riskometer
Investors understand that their principal will be at Moderate risk
This product is suitable for investors who are seeking*:
To generate low volatility returns over short to •medium term.Investments predominantly in arbitrage •opportunities in the cash and derivative segments of the equity markets and the arbitrage opportunities available within the derivative segment and by investing the balance in debt and money market instruments.
*Investors should consult their financial advisers if in doubt about whether the product is suitable for them.
PORTFOLIO
Name Industries% of NAV
Sun Pharmaceutical Industries Pharmaceuticals 5.76%
Tata Motors Auto 5.09%
Fortis Healthcare Healthcare Services 4.22%
Century Textiles & Industries Cement 3.47%
Bharat Electronics Industrial Capital Goods 3.25%
JSW Steel Ferrous Metals 2.90%
Indiabulls Housing Finance Finance 2.87%
Infosys Software 2.71%
Ashok Leyland Auto 2.39%
Lupin Pharmaceuticals 2.30%
Castrol India Petroleum Products 2.29%
Tata Motors Auto 2.27%
State Bank of India Banks 2.12%
Jindal Steel & Power Ferrous Metals 2.03%
Bharat Petroleum Corporation Petroleum Products 1.94%
Tata Global Beverages Consumer Non Durables 1.80%
Indiabulls Real Estate Construction 1.74%
Aurobindo Pharma Pharmaceuticals 1.44%
CESC Power 1.29%
IRB Infrastructure Developers Construction 1.15%
United Spirits Consumer Non Durables 1.10%
Reliance Power Power 1.09%
Mahindra & Mahindra Auto 0.99%
Oil & Natural Gas Corporation Oil 0.99%
Voltas Construction Project 0.81%
Bank of Baroda Banks 0.72%
Power Finance Corporation Finance 0.72%
Reliance Industries Petroleum Products 0.69%
Glenmark Pharmaceuticals Pharmaceuticals 0.63%
TV18 Broadcast Media & Entertainment 0.60%
Motherson Sumi Systems Auto Ancillaries 0.59%
MindTree Software 0.55%
UltraTech Cement Cement 0.53%
Name Industries% of NAV
Tata Steel Ferrous Metals 0.51%
SRF Textile Products 0.49%
GAIL (India) Gas 0.38%
Dewan Housing Finance Corporation Finance 0.37%
Indraprastha Gas Gas 0.33%
Hindustan Petroleum Corporation Petroleum Products 0.32%
Exide Industries Auto Ancillaries 0.31%
Syndicate Bank Banks 0.26%
Reliance Infrastructure Power 0.20%
Hindalco Industries Non - Ferrous Metals 0.19%
Divi's Laboratories Pharmaceuticals 0.18%
Tata Chemicals Chemicals 0.17%
Rural Electrification Corporation Finance 0.13%
Bharat Heavy Electricals Industrial Capital Goods 0.13%
Max Financial Services Finance 0.12%
Dr. Reddy's Laboratories Pharmaceuticals 0.11%
Indian Oil Corporation Petroleum Products 0.07%
NMDC Minerals/Mining 0.06%
The Federal Bank Banks 0.06%
Granules India Pharmaceuticals 0.04%
Mahindra & Mahindra Financial Services Finance 0.04%
Sintex Industries Industrial Products 0.04%
Asian Paints Consumer Non Durables 0.03%
Pidilite Industries Chemicals 0.01%
Kotak Mahindra Bank Banks 0.01%
Total Hedged Equity 67.57%
Margin Fixed Deposit 14.88%
Certificate of Deposit 2.99%
Corporate Bond 18.82%
CBLO 2.48%
Adjusted Net Current Asset -6.74%
Grand Total 100.00%

15
IDFC Sensex Exchange Trade FundAn Open Ended Exchange Trade Fund
30th June 2017
FUND FEATURES
FUND FEATURES
About the Fund: An open-ended Exchange Traded Fund that seeks to provide returns that, before expenses, closely correspond to the total return of the S&P BSE Sensex, subject to tracking errors.
About the Fund: An open-ended Exchange Traded Fund that seeks to provide returns that, before expenses, closely correspond to the total return of the Nifty 50, subject to tracking errors.
Monthly Avg AUM: ` 75 Lakhs | Month end AUM: ` 75 Lakhs | Inception Date: 07 October 2016 | Fund Manager: Mr. Yogik Pitti
Expense Ratio: 0.13% | Benchmark: S&P BSE Sensex | SIP (Minimum Amount): NA | SIP Frequency: NA | SIP Dates (Monthly): NA
Investment Objective: Refer Pg No from 41 to 42 | Minimum Investment Amount: Directly with Fund - Authorised Participants and Large Investors can directly purchase / redeem in blocks from the fund in “Creation unit size” on any business day. On the Exchange - The units of the Scheme can be purchased and sold in minimum lot of 1 unit and in
multiples thereof | Option Available: Presently the scheme does not offer any Plan/Options for Investment | Exit Load: Nil
NAV (`)
Regular Plan Growth 311.5832
Regular Plan Dividend N.A
Monthly Avg AUM: ` 4.01 Crores | Month end AUM: ` 4.72 Crores | Inception Date: 07 October 2016 | Fund Manager: Mr. Yogik Pitti
Expense Ratio: 0.15% | Benchmark: Nifty 50 | SIP (Minimum Amount): NA | SIP Frequency: NA | SIP Dates (Monthly): NA
Investment Objective: Refer Pg No from 41 to 42 | Minimum Investment Amount: Directly with Fund - Authorised Participants and Large Investors can directly purchase / redeem in blocks from the fund in “Creation unit size” on any business day. On the Exchange - The units of the Scheme can be purchased and sold in minimum lot of 1 unit and in
multiples thereof | Option Available: Presently the scheme does not offer any Plan/Options for Investment | Exit Load: Nil
NAV (`)
Regular Plan Growth 95.6583
Regular Plan Dividend N.A
Riskometer
Investors understand that their principal will be at Moderately High risk
This product is suitable for investors who are seeking*:
To create wealth over a long period of time.•
Investment in securities covered by S&P BSE •Sensex Index.
*Investors should consult their financial advisers if in doubt about whether the product is suitable for them.
Riskometer
Investors understand that their principal will be at Moderately High risk
This product is suitable for investors who are seeking*:
To create wealth over a long period of time.•
Investment in securities covered by • Nifty 50 Index.
*Investors should consult their financial advisers if in doubt about whether the product is suitable for them.
PORTFOLIO
PORTFOLIO
Name % of NAV
Equity and Equity related Instruments 98.57%Banks 27.07%HDFC Bank 11.25%ICICI Bank 6.26%Kotak Mahindra Bank 3.48%State Bank of India 3.18%Axis Bank 2.90%Consumer Non Durables 13.51%ITC 9.25%Hindustan Unilever 2.59%Asian Paints 1.66%Software 11.60%Infosys 6.27%Tata Consultancy Services 4.22%Wipro 1.10%Auto 11.38%Tata Motors 3.26%Maruti Suzuki India 3.17%Mahindra & Mahindra 2.10%Hero MotoCorp 1.58%Bajaj Auto 1.26%Finance 8.62%Housing Development Finance Corporation 8.62%Petroleum Products 7.69%Reliance Industries 7.69%Pharmaceuticals 4.88%Sun Pharmaceutical Industries 2.02%Dr. Reddy's Laboratories 1.07%Cipla 0.95%Lupin 0.85%Construction Project 4.54%Larsen & Toubro 4.54%
Name % of NAV
Power 2.87%Power Grid Corporation of India 1.55%NTPC 1.31%Telecom - Services 1.68%Bharti Airtel 1.68%Oil 1.43%Oil & Natural Gas Corporation 1.43%Ferrous Metals 1.22%Tata Steel 1.22%Transportation 1.08%Adani Ports and Special Economic Zone 1.08%Minerals/Mining 1.02%Coal India 1.02%Net Cash and Cash Equivalent 1.43%Grand Total 100.00%Top 10 Equity Holdings
Top 10 Equity Holdings
Banks 27.07%Consumer Non Durables 13.51%Software 11.60%Auto 11.38%Finance 8.62%Petroleum Products 7.69%Pharmaceuticals 4.88%Construction Project 4.54%Power 2.87%Telecom - Services 1.68%Oil 1.43%Ferrous Metals 1.22%Transportation 1.08%Minerals/Mining 1.02%
INDUSTRY ALLOCATION
Banks 26.60%Software 11.46%Consumer Non Durables 11.03%Auto 10.27%Petroleum Products 8.27%Finance 7.99%Pharmaceuticals 4.57%Construction Project 3.80%Power 2.75%Non - Ferrous Metals 2.03%Cement 1.98%Telecom - Services 1.37%Oil 1.22%Ferrous Metals 1.00%Minerals/Mining 0.87%Transportation 0.80%Media & Entertainment 0.74%Telecom - Equipment & Accessories 0.72%Gas 0.64%Auto Ancillaries 0.54%
INDUSTRY ALLOCATION
IDFC Nifty Exchange Trade FundAn Open Ended Exchange Trade Fund
31st May 2017
Name % of NAV
Equity and Equity related Instruments 98.68%Banks 26.60%HDFC Bank 9.19%ICICI Bank 5.10%Kotak Mahindra Bank 3.19%State Bank of India 2.79%Axis Bank 2.41%IndusInd Bank 2.04%Yes Bank 1.47%Bank of Baroda 0.42%Software 11.46%Infosys 5.13%Tata Consultancy Services 3.45%HCL Technologies 1.33%Wipro 0.90%Tech Mahindra 0.65%Consumer Non Durables 11.03%ITC 7.55%Hindustan Unilever 2.12%Asian Paints 1.36%Auto 10.27%Maruti Suzuki India 2.63%Tata Motors 2.59%Mahindra & Mahindra 1.72%Hero MotoCorp 1.31%Bajaj Auto 1.04%Eicher Motors 0.97%Petroleum Products 8.27%Reliance Industries 6.28%Indian Oil Corporation 1.08%Bharat Petroleum Corporation 0.91%Finance 7.99%Housing Development Finance Corporation 7.04%Indiabulls Housing Finance 0.95%Pharmaceuticals 4.57%Sun Pharmaceutical Industries 1.68%Dr. Reddy's Laboratories 0.89%Cipla 0.77%Lupin 0.69%Aurobindo Pharma 0.53%Construction Project 3.80%Larsen & Toubro 3.80%Power 2.75%Power Grid Corporation of India 1.27%NTPC 1.08%Tata Power Company 0.40%
Name % of NAV
Non - Ferrous Metals 2.03%Vedanta 1.27%Hindalco Industries 0.76%Cement 1.98%UltraTech Cement 1.13%Ambuja Cements 0.50%ACC 0.36%Telecom - Services 1.37%Bharti Airtel 1.37%Oil 1.22%Oil & Natural Gas Corporation 1.22%Ferrous Metals 1.00%Tata Steel 1.00%Minerals/Mining 0.87%Coal India 0.87%Transportation 0.80%Adani Ports and Special Economic Zone 0.80%Media & Entertainment 0.74%Zee Entertainment Enterprises 0.74%Telecom - Equipment & Accessories 0.72%Bharti Infratel 0.72%Gas 0.64%GAIL (India) 0.64%Auto Ancillaries 0.54%Bosch 0.54%Net Cash and Cash Equivalent 1.32%Grand Total 100.00%

16
IDFC Dynamic Equity Fund(The Fund has been repositioned with effect from June 19, 2017)$$ An Open Ended Equity Fund30th June 2017
FUND FEATURES PORTFOLIO
INDUSTRY ALLOCATION
About the Fund:‘Dynamically’ invests between Equity and •Debt An Equity fund that buys less when markets •are expensive and more when markets are expensive and more when markets are cheapBased on the model that tracks market •valuation
Nature: EquityMonthly Avg AUM: ` 296.40 Crores Month end AUM: ` 290.64 Crores Inception Date: 10 October 2014Fund Manager: Equity Portion: Mr. Arpit Kapoor & Mr. Sumit Agrawal (w.e.f. 01st March 2017), Debt Portion: Mr. Arvind Subramanian (w.e.f. 09th November 2015)Other Parameter: Standard Deviation (Annualized) 5.89%Portfolio TurnoverEquity 0.59Aggregate^ 4.47Expense Ratio Regular 2.46%Direct 1.40%Benchmark: CRISIL Balanced Fund – Aggressive Index (w.e.f. 19th June, 2017) SIP (Minimum Amount): ` 1,000/-SIP Frequency: Monthly SIP Dates (Monthly): Any day of the month, except 29th, 30th & 31st day of the monthInvestment Objective: Refer Pg No from 41 to 42Minimum Investment Amount : ` 5,000/- and any amount thereafterOption Available: Growth, Dividend (Payout, Reinvestment and Sweep (from Equity Schemes to Debt Schemes only))Exit Load: In respect of each purchase of Units:- For 10% of investment: Nil- For remaining investment: 1% if redeemed/ switched out within 1 year from the date of allotment (w.e.f. July 5, 2017)
Top 10 Equity Holdings
Name Rating % of NAV
Equity and Equity Related Instruments 66.77%Net Equity Exposure 52.37%Banks 15.96%State Bank of India 5.90%State Bank of India - Equity Futures -5.14%HDFC Bank 3.99%IndusInd Bank 1.75%Axis Bank 0.93%ICICI Bank 0.72%RBL Bank 0.63%The Federal Bank 0.63%Kotak Mahindra Bank 0.50%Punjab National Bank 0.37%Bank of Baroda 0.29%The Karnataka Bank 0.27%Finance 10.83%Indiabulls Housing Finance 5.54%Indiabulls Housing Finance - Equity Futures -5.56%Housing Development Finance Corporation 1.17%AU Small Finance Bank 1.07%Max Financial Services 0.70%ICICI Prudential Life Insurance Company 0.64%SREI Infrastructure Finance 0.59%Magma Fincorp 0.44%Mahindra & Mahindra Financial Services 0.43%Credit Analysis and Research 0.24%Auto 7.64%Tata Motors 2.57%Tata Motors - Equity Futures -2.58%Maruti Suzuki India 1.80%Hero MotoCorp 1.19%Mahindra & Mahindra 1.18%Eicher Motors 0.68%Bajaj Auto 0.23%Consumer Non Durables 5.12%ITC 3.00%Hindustan Unilever 1.45%Tata Coffee 0.34%DCM Shriram 0.33%Petroleum Products 3.65%Reliance Industries 1.71%Indian Oil Corporation 0.74%Bharat Petroleum Corporation 0.50%Hindustan Petroleum Corporation 0.41%Castrol India 0.29%Software 2.85%Infosys 1.04%HCL Technologies 0.83%Mastek 0.46%Wipro 0.34%Persistent Systems 0.18%Auto Ancillaries 2.65%Apollo Tyres 1.06%Minda Industries 0.71%MRF 0.45%Exide Industries 0.44%Cement 2.00%Ambuja Cements 0.90%UltraTech Cement 0.36%Deccan Cements 0.29%The Ramco Cements 0.26%
Banks 15.96%
Finance 10.83%
Auto 7.64%
Consumer Non Durables 5.12%
Petroleum Products 3.65%
Software 2.85%
Auto Ancillaries 2.65%
Cement 2.00%
Construction Project 1.88%
Pharmaceuticals 1.77%
Power 1.72%
Performance Table Regular Plan - Growth Direct Plan - GrowthScheme Name CAGR Returns (%) Current Value of Investment of ` 10,000 CAGR Returns (%) Current Value of Investment of ` 10,000
1 Year 3 Years 5 YearsSince
InceptionOct 10, 2014
1 Year 3 Years 5 YearsSince
InceptionOct 10, 2014
1 Year 3 Years 5 YearsSince
InceptionOct 10, 2014
1 Year 3 Years 5 YearsSince
InceptionOct 10, 2014
IDFC Dynamic Equity Fund 8.05% NA NA 6.11% 10,805 NA NA 11,751 9.10% NA NA 7.41% 10,910 NA NA 12,151
CRISIL Balanced Fund - Aggressive Index#
13.85% NA NA 8.80% 11,385 NA NA 12,581 13.85% NA NA 8.80% 11,385 NA NA 12,581
Nifty 50## 14.88% NA NA 7.29% 11,488 NA NA 12,113 14.88% NA NA 7.29% 11,488 NA NA 12,113
The fund is being managed by Mr. Arpit Kapoor & Mr. Sumit Agrawal (w.e.f. 1st March 2017) Debt Portion: Mr. Arvind Subramanian (w.e.f. 09th November 2015). Performance based on NAV as on 30/06/2017. Past performance may or may not be sustained in future.For other funds managed by the fund manager, please refer page no. 34 - 36 & the respective fund pages Regular and Direct Plans have different expense structure. Direct Plan shall have a lower expense ratio excluding distribution expenses, commission expenses etc. ^Portfolio Turnover ratio is calculated as Lower of purchase or sale during the period / Average AUMfor the last one year (includes Fixed Income securities and Equity derivatives). The portfolio shall be rebalanced on the first business day of every month.#Benchmark Returns. ##Alternate Benchmark Returns.$$ For details please refer Notice (https://www.idfcmf.com/uploads/160520171236May-16-2017-Change-in-investment-strategy-of-IDFC-Dynamic-Equity-Fund.pdf )
SIP PERFORMANCE
Monthly SIP of ` 10,000 in IDFC Dynamic Equity - Regular Plan - Growth
1 Year 3 Years 5 YearsSince
InceptionOct 10, 2014
Total Amount Invested (`) 1,20,000 NA NA 3,30,000 Total Value as on June 30, 2017 (`) 1,25,616 NA NA 3,59,265 Fund Returns (%) 8.85 NA NA 6.12Total Value of CRISIL Balanced Fund – Aggressive Index# 1,28,873 NA NA 3,78,415
CRISIL Balanced Fund – Aggressive Index Returns (%)# 14.09 NA NA 9.97
Total Value of Nifty 50## 1,30,496 NA NA 3,76,250 Nifty 50 Returns (%)## 16.73 NA NA 9.54
Past performance may or may not be sustained in future.Dividends are assumed to be reinvested and bonus is adjusted. Load is not taken into consideration. To illustrate the advantages of SIP investment, this is how your investment would have grown if you had invested say `10,000 systematically on the first business Day of every month over a period of time. Returns are calculated by using XIRR approach. XIRR helps in calculating return on investment given an initial and final value and a series of cash inflows and outflows with the correct allowence for the time impact of the transactions. Regular and Direct plans have different expense structure. Direct Plan shall have a lower expense ratio excluding distribution expenses, commision expenses etc. #Benchmark Returns. ##Alternate Benchmark Returns. Data as on June 30, 2017.
Riskometer
Investors understand that their principal will be at Moderately High risk
This product is suitable for investors who are seeking*:
Create wealth over a long period of time•
Dynamic allocation towards equity, derivatives, •debt and money market instruments
*Investors should consult their financial advisers if in doubt about whether the product is suitable for them.
Name Rating % of NAV
Sagar Cements 0.18%Construction Project 1.88%Larsen & Toubro 1.88%Pharmaceuticals 1.77%Cadila Healthcare 0.53%Aurobindo Pharma 0.36%Indoco Remedies 0.35%Sun Pharmaceutical Industries 0.35%Lupin 0.18%Power 1.72%Power Grid Corporation of India 0.69%Nava Bharat Ventures 0.59%NTPC 0.43%Gas 1.55%GAIL (India) 1.10%Petronet LNG 0.45%Retailing 1.44%Future Retail 0.98%Future Lifestyle Fashions 0.46%Oil 1.43%Oil & Natural Gas Corporation 1.43%Oil & Natural Gas Corporation - Equity Futures -1.02%
Industrial Capital Goods 1.30%Bharat Electronics 0.78%Skipper 0.32%CG Power and Industrial Solutions 0.19%Industrial Products 0.92%Bharat Forge 0.92%Ferrous Metals 0.88%JSW Steel 0.61%Jindal Steel & Power 0.27%Hotels, Resorts And Other Recreational Activities 0.76%
The Indian Hotels Company 0.60%Taj GVK Hotels & Resorts 0.16%Consumer Durables 0.65%Sheela Foam 0.37%Crompton Greaves Consumer Electricals 0.28%Fertilisers 0.55%Coromandel International 0.55%Non - Ferrous Metals 0.52%Hindalco Industries 0.52%Textile Products 0.33%Dollar Industries 0.33%Chemicals 0.28%Deepak Nitrite 0.28%Minerals/Mining 0.11%Coal India 0.11%Coal India - Equity Futures -0.11%State Government Bond 16.06%8.18% Haryana UDAY BOND - 2022 SOV 16.06%Commercial Paper 8.51%Bajaj Finance A1+ 8.51%Margin Fixed Deposit 3.44%IndusInd Bank 3.44%Corporate Bond 0.09%NTPC AAA 0.09%Net Cash and Cash Equivalent 5.12%
Grand Total 100.00%
Gas 1.55%
Retailing 1.44%
Oil 1.43%
Industrial Capital Goods 1.30%
Industrial Products 0.92%
Ferrous Metals 0.88%
Hotels, Resorts And Other Recreational Activities 0.76%
Consumer Durables 0.65%
Fertilisers 0.55%
Non - Ferrous Metals 0.52%
Textile Products 0.33%
Chemicals 0.28%
Minerals/Mining 0.11%
NAV (`)
Regular Plan Growth 11.7514Regular Plan Dividend 10.6510Direct Plan Growth 12.1506Direct Plan Dividend 11.0001
The industry allocation is provided at gross equity exposure

17
IDFC Balanced FundAn Open-ended Balanced Scheme
30th June 2017
FUND FEATURES
INDUSTRY ALLOCATION
About the Fund: IDFC Balanced Equity Fund provides a combination of equity (up to 60%), arbitrage (minimum 5%) and balance in debt so as to provide both stability of returns and potential of growth. Both equity and fixed income portions are actively managed.
Nature: Balanced
Monthly Avg AUM: ` 822.84 Crores
Month end AUM: ` 857.88 Crores
Inception Date: 30 December 2016
Fund Manager: Equity Portion: Mr. Anoop Bhaskar Debt Portion: Mr. Suyash Choudhary & Mr. Anurag Mittal
Other Parameter:
Modified Duration 5.45 years Average Maturity 7.89 years Yield to Maturity 7.40%
Expense Ratio
Regular 2.32%
Direct 0.57%
Benchmark: CRISIL Balanced Fund Aggressive Index
SIP (Minimum Amount): ` 1,000/-
SIP Frequency: Monthly
SIP Date (Monthly): Any day of the month, except 29th, 30th & 31st day of the month
Investment Objective: Refer Pg No from 41 to 42
Minimum Investment Amount: ` 5,000/- and any amount thereafter
Option Available: Growth & Dividend (Payout, Reinvestment & Sweep facility)
Exit Load: 10% of investment: Nil Remaining investment: 1% if redeemed/switched out within 1 year from the date of allotment
Banks 13.94%
Pharmaceuticals 6.77%
Petroleum Products 5.67%
Finance 5.08%
Auto 4.07%
Consumer Non Durables 3.73%
Cement 3.49%
Software 2.86%
Auto Ancillaries 2.24%
Power 1.92%
Hotels, Resorts And Other Recreational Activities 1.81%
Non - Ferrous Metals 1.80%
Industrial Capital Goods 1.80%
Construction Project 1.79%
Gas 1.34%
Consumer Durables 1.30%
Industrial Products 1.09%
Retailing 0.97%
Ferrous Metals 0.88%
Media & Entertainment 0.85%
Fertilisers 0.84%
Textile Products 0.62%
Chemicals 0.54%
Telecom - Equipment & Accessories 0.35%
Services 0.33%
Miscellaneous 0.31%
Oil 0.30%
Construction 0.15%
Minerals/Mining 0.11%
NAV (`)
Regular Plan Dividend 10.6236Regular Plan Growth 10.9798Direct Plan Growth 11.0790Direct Plan Dividend 10.7206
Riskometer
Investors understand that their principal will be at Moderately High risk
This product is suitable for investors who are seeking*:
Create wealth over a long period of time.•
Capital appreciation and current income by •investing in equity as well as fixed income securities.
*Investors should consult their financial advisers if in doubt about whether the product is suitable for them.
PORTFOLIO
**Basel III, Tier 1 Perpetual
Name Rating/Industry % of NAV
HDFC Bank Banks 2.95%
ITC Consumer Non Durables 2.21%
Reliance Industries Petroleum Products 2.09%
Hero MotoCorp Auto 1.87%
Axis Bank Banks 1.73%
IndusInd Bank Banks 1.34%
Larsen & Toubro Construction Project 1.31%
The Federal Bank Banks 1.29%
Indian Oil Corporation Petroleum Products 1.23%
HDFC Finance 1.21%
Grasim Industries Cement 1.15%
Apollo Tyres Auto Ancillaries 1.12%
Infosys Software 1.11%
Bharat Forge Industrial Products 1.09%
GAIL (India) Gas 1.06%
Top 15 Active Equity Holdings 22.76%
Other Active Equity Holdings 31.53%
Arbitrage Position 12.67%
7.61% GOI(MD 09/05/2030) SOV 7.40%
7.35% GOI (MD 22/06/2024) SOV 3.60%
7.16% GOI (MD 20/05/2023) SOV 3.56%
7.68% GOI (MD 15/12/2023) SOV 1.83%
8.20% GOI (MD 15/02/2022) SOV 1.23%
6.79% GOI (MD 26/12/2029) SOV 1.17%
7.88% GOI (MD 19/03/2030) SOV 0.62%
7.59% GOI(MD 11/01/2026) SOV 0.61%
Government Bond 20.02%
**ICICI Bank ICRA AA+ 1.78%
**IndusInd Bank CRISIL AA 1.78%
**Bank of Baroda CARE AA 1.77%
ICICI Bank ICRA AAA 1.74%
**Axis Bank CRISIL AA+ 1.17%
**State Bank of India CRISIL AA+ 0.59%
Corporate Bond 8.83%
8.21% Haryana UDAY BOND (MD 31/03/2022) SOV 0.21%
State Government Bond 0.21%
Margin FD 1.14%
Net Current Asset 2.85%
Grand Total 100.00%

18
IDFC Monthly Income PlanAn Open Ended Debt Fund
30th June 2017
FUND FEATURES
About the Fund: MIP is a hybrid fund which offers up to 25% participation in the equity markets with the balance invested in fixed income. The Equity portfolio of the fund is an actively managed all cap portfolio. The Fixed Income portfolio is also actively managed with a mix of debt and money market instruments.
Nature: Debt
Monthly Avg AUM: ` 251.78 Crores
Month end AUM: ` 249.81 Crores
Inception Date: 25 February 2010
Fund Manager: Equity Portion: Mr. Sumit Agrawal (w.e.f. 20th October 2016)
Debt Portion: Mr. Anurag Mittal (w.e.f. 09th November 2015)
Other Parameter:
Modified Duration 5.21 years Average Maturity 7.24 years Yield to Maturity* 7.39%
*Monthly income is not assured and is subject to availability of distributable surplus
Expense Ratio
Regular 2.30%
Direct 1.56%
Asset Quality
AAA Equivalent 86.31% AA 6.82% AA+ 6.87%
Benchmark: Crisil MIP Blended Index
SIP (Minimum Amount): ` 1,000/-
SIP Frequency: Monthly
SIP Dates (Monthly): Any day of the month, except 29th, 30th & 31st day of the monthInvestment Objective: Refer Pg No from 41 to 42
Minimum Investment Amount: ` 5,000/- and any amount thereafter
Option Available: Growth, Dividend - Quarterly, Regular
Exit Load: 1% if redeemed/switched out within 1 year (365 days) from the date of subscription
Performance Table Regular Plan - Growth Direct Plan - GrowthScheme Name CAGR Returns (%) Current Value of Investment of ` 10,000 CAGR Returns (%) Current Value of Investment of ` 10,000
1 Year 3 Years 5 YearsSince
InceptionFeb 25, 2010
1 Year 3 Years 5 YearsSince
InceptionFeb 25, 2010
1 Year 3 Years 5 YearsSince
InceptionJan 01, 2013
1 Year 3 Years 5 YearsSince
InceptionJan 01, 2013
IDFC Monthly Income Plan 12.10% 10.45% 11.25% 9.81% 11,210 13,479 17,050 19,890 13.06% 11.49% NA 11.05% 11,306 13,863 NA 16,020
CRISIL MIP Blended Index# 12.07% 10.56% 10.15% 8.97% 11,207 13,519 16,225 18,797 12.07% 10.56% NA 9.89% 11,207 13,519 NA 15,280
10 Year GOI## 11.69% 11.15% 8.46% 7.25% 11,169 13,736 15,017 16,725 11.69% 11.15% NA 8.20% 11,169 13,736 NA 14,251
The fund is being managed by Mr. Sumit Agrawal (w.e.f. 20th October 2016) & Mr. Anurag Mittal (w.e.f. 09th November 2015)Performance based on NAV as on 30/06/2017. Past performance may or may not be sustained in future.Regular and Direct Plans have different expense structure. Direct Plan shall have a lower expense ratio excluding distribution expenses, commission expenses etc.For other funds managed by the fund manager, please refer page no. 34 - 36 & the respective fund pages#Benchmark Returns. ##Alternate Benchmark Returns.
SIP PERFORMANCE
Monthly SIP of ` 10,000 in IDFC Monthly Income Plan - Regular Plan - Growth
1 Year 3 Years 5 Years 7 Years 10 YearsSince
InceptionFeb 25, 2010
Total Amount Invested (`) 1,20,000 3,60,000 6,00,000 8,40,000 NA 8,90,000
Total Value as on June 30, 2017 (`) 1,26,022 4,16,966 7,84,750 12,23,931 NA 13,21,942
Fund Returns (%) 9.50 9.80 10.69 10.58 NA 10.47
Total Value of Crisil MIP Blended Fund Index# 1,26,474 4,20,112 7,80,876 11,96,469 NA 12,89,122
Crisil MIP Blended Fund Index Returns (%)# 10.23 10.31 10.49 9.95 NA 9.81
Total Value of CRISIL 10 Year Gilt Index## 1,25,197 4,20,295 7,61,409 11,45,911 NA 12,29,191
CRISIL 10 Year Gilt Index Returns (%)## 8.19 10.34 9.48 8.73 NA 8.56
Past performance may or may not be sustained in future.Dividends are assumed to be reinvested and bonus is adjusted. Load is not taken into consideration. To illustrate the advantages of SIP investment, this is how your investment would have grown if you had invested say `10,000 systematically on the first business Day of every month over a period of time. Returns are calculated by using XIRR approach. XIRR helps in calculating return on investment given an initial and final value and a series of cash inflows and outflows with the correct allowence for the time impact of the transactions. Regular and Direct plans have different expense structure. Direct Plan shall have a lower expense ratio excluding distribution expenses, commision expenses etc. #Benchmark Returns. ##Alternate Benchmark Returns. Data as on June 30, 2017.
NAV (`)
Regular Plan - Dividend - 13.0865
Regular Plan - Growth - 19.8902
Regular Plan - Dividend Quarterly 13.2342
Direct Plan - Growth - 20.6841
Direct Plan - Dividend - 13.7730
Direct Plan - Dividend Quarterly 14.1214
Riskometer
Investors understand that their principal will be at Moderately High risk
This product is suitable for investors who are seeking*:
Capital appreciation and provide regular income •over a long period of time.Investment primarily in debt securities to •generate regular returns and investment of a portion of the Scheme’s assets in equity securities to generate long-term capital appreciation.
*Investors should consult their financial advisers if in doubt about whether the product is suitable for them.
PORTFOLIO
Name Rating % of NAV
Government Bond 46.30%
7.35% - 2024 G-Sec SOV 12.35%
7.72% - 2025 G-Sec SOV 8.41%
6.79% - 2029 G-Sec SOV 8.01%
7.16% - 2023 G-Sec SOV 6.12%
7.88% - 2030 G-Sec SOV 4.28%
7.61% - 2030 G-Sec SOV 4.23%
7.68% - 2023 G-Sec SOV 2.10%
6.35% - 2020 G-Sec SOV 0.80%
Corporate Bond 26.22%**ICICI Bank AA+ 4.07%**IndusInd Bank AA 4.07%**Bank of Baroda AA 4.06%
ICICI Bank AAA 3.99%**Axis Bank AA+ 2.80%
Blue Dart Express AA 2.75%
Small Industries Dev Bank of India AAA 1.63%
HDFC Bank AAA 1.47%
NHPC AAA 1.39%
Equity 23.78%
Banks 4.18%
HDFC Bank 1.32%
ICICI Bank 1.20%
Kotak Mahindra Bank 0.84%
State Bank of India 0.55%
Lakshmi Vilas Bank 0.27%
Pharmaceuticals 2.38%
Natco Pharma 0.96%
Alkem Laboratories 0.74%
Aurobindo Pharma 0.24%
Sun Pharmaceutical Industries 0.22%
Cadila Healthcare 0.21%
Auto 1.99%
Maruti Suzuki India 1.30%
Tata Motors 0.69%
Power 1.52%
Power Grid Corporation of India 1.14%
PTC India 0.39%
Consumer Non Durables 1.46%
DCM Shriram 0.59%
Mcleod Russel India 0.33%
Linc Pen & Plastics 0.27%
S H Kelkar and Company 0.26%
Petroleum Products 1.42%
Reliance Industries 0.99%
Name Rating % of NAV
Castrol India 0.42%
Software 1.34%
Infosys 0.52%
HCL Technologies 0.34%
NIIT Technologies 0.32%
Tech Mahindra 0.15%
Industrial Products 1.20%
FAG Bearings India 0.89%
Timken India 0.31%
Fertilisers 1.18%
Coromandel International 1.18%
Transportation 1.10%
VRL Logistics 0.58%
Blue Dart Express 0.53%
Finance 1.00%
JM Financial 0.71%
SREI Infrastructure Finance 0.30%
Oil 0.76%
Oil & Natural Gas Corporation 0.76%
Textiles - Cotton 0.64%
Vardhman Textiles 0.64%
Gas 0.64%
Gujarat State Petronet 0.64%
Textile Products 0.62%
SRF 0.62%
Miscellaneous 0.60%
Dishman Carbogen Amcis 0.60%
Construction Project 0.54%
Larsen & Toubro 0.54%
Construction 0.52%
Ahluwalia Contracts (India) 0.52%
Pesticides 0.44%
Monsanto India 0.44%
Non - Ferrous Metals 0.26%
National Aluminium Company 0.26%
Net Cash and Cash Equivalent 3.70%
Grand Total 100.00%**Basel III, Tier 1 Perpetual
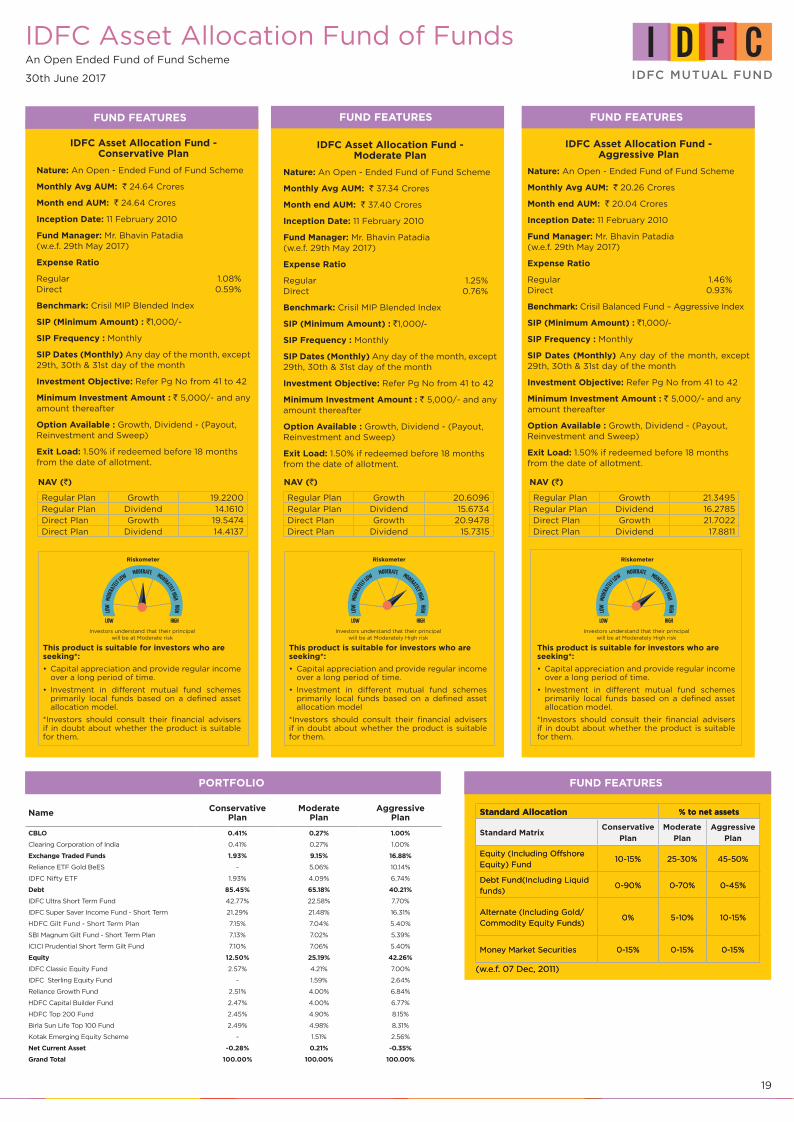
19
IDFC Asset Allocation Fund of FundsAn Open Ended Fund of Fund Scheme
30th June 2017
FUND FEATURES
NAV (`)
Regular Plan Growth 19.2200Regular Plan Dividend 14.1610Direct Plan Growth 19.5474Direct Plan Dividend 14.4137
IDFC Asset Allocation Fund - Conservative Plan
Nature: An Open - Ended Fund of Fund Scheme
Monthly Avg AUM: ` 24.64 Crores
Month end AUM: ` 24.64 Crores
Inception Date: 11 February 2010
Fund Manager: Mr. Bhavin Patadia (w.e.f. 29th May 2017)
Expense Ratio
Regular 1.08% Direct 0.59%
Benchmark: Crisil MIP Blended Index
SIP (Minimum Amount) : `1,000/-
SIP Frequency : Monthly
SIP Dates (Monthly) Any day of the month, except 29th, 30th & 31st day of the month
Investment Objective: Refer Pg No from 41 to 42
Minimum Investment Amount : ` 5,000/- and any amount thereafter
Option Available : Growth, Dividend - (Payout, Reinvestment and Sweep)
Exit Load: 1.50% if redeemed before 18 months from the date of allotment.
FUND FEATURES FUND FEATURES
IDFC Asset Allocation Fund - Moderate Plan
Nature: An Open - Ended Fund of Fund Scheme
Monthly Avg AUM: ` 37.34 Crores
Month end AUM: ` 37.40 Crores
Inception Date: 11 February 2010
Fund Manager: Mr. Bhavin Patadia (w.e.f. 29th May 2017)
Expense Ratio
Regular 1.25% Direct 0.76%
Benchmark: Crisil MIP Blended Index
SIP (Minimum Amount) : `1,000/-
SIP Frequency : Monthly
SIP Dates (Monthly) Any day of the month, except 29th, 30th & 31st day of the month
Investment Objective: Refer Pg No from 41 to 42
Minimum Investment Amount : ` 5,000/- and any amount thereafter
Option Available : Growth, Dividend - (Payout, Reinvestment and Sweep)
Exit Load: 1.50% if redeemed before 18 months from the date of allotment.
IDFC Asset Allocation Fund - Aggressive Plan
Nature: An Open - Ended Fund of Fund Scheme
Monthly Avg AUM: ` 20.26 Crores
Month end AUM: ` 20.04 Crores
Inception Date: 11 February 2010
Fund Manager: Mr. Bhavin Patadia (w.e.f. 29th May 2017)
Expense Ratio
Regular 1.46% Direct 0.93%
Benchmark: Crisil Balanced Fund – Aggressive Index
SIP (Minimum Amount) : `1,000/-
SIP Frequency : Monthly
SIP Dates (Monthly) Any day of the month, except 29th, 30th & 31st day of the month
Investment Objective: Refer Pg No from 41 to 42
Minimum Investment Amount : ` 5,000/- and any amount thereafter
Option Available : Growth, Dividend - (Payout, Reinvestment and Sweep)
Exit Load: 1.50% if redeemed before 18 months from the date of allotment.
NAV (`)
Regular Plan Growth 20.6096Regular Plan Dividend 15.6734Direct Plan Growth 20.9478Direct Plan Dividend 15.7315
NAV (`)
Regular Plan Growth 21.3495Regular Plan Dividend 16.2785Direct Plan Growth 21.7022Direct Plan Dividend 17.8811
Riskometer
Investors understand that their principal will be at Moderately High risk
This product is suitable for investors who are seeking*:
Capital appreciation and provide regular income •over a long period of time.
Investment in different mutual fund schemes •primarily local funds based on a defined asset allocation model.
*Investors should consult their financial advisers if in doubt about whether the product is suitable for them.
Riskometer
Investors understand that their principal will be at Moderate risk
This product is suitable for investors who are seeking*:
Capital appreciation and provide regular income •over a long period of time.
Investment in different mutual fund schemes •primarily local funds based on a defined asset allocation model.
*Investors should consult their financial advisers if in doubt about whether the product is suitable for them.
Riskometer
Investors understand that their principal will be at Moderately High risk
This product is suitable for investors who are seeking*:
Capital appreciation and provide regular income •over a long period of time.
Investment in different mutual fund schemes •primarily local funds based on a defined asset allocation model
*Investors should consult their financial advisers if in doubt about whether the product is suitable for them.
PORTFOLIO
Name ConservativePlan
ModeratePlan
AggressivePlan
CBLO 0.41% 0.27% 1.00%
Clearing Corporation of India 0.41% 0.27% 1.00%
Exchange Traded Funds 1.93% 9.15% 16.88%
Reliance ETF Gold BeES - 5.06% 10.14%
IDFC Nifty ETF 1.93% 4.09% 6.74%
Debt 85.45% 65.18% 40.21%
IDFC Ultra Short Term Fund 42.77% 22.58% 7.70%
IDFC Super Saver Income Fund - Short Term 21.29% 21.48% 16.31%
HDFC Gilt Fund - Short Term Plan 7.15% 7.04% 5.40%
SBI Magnum Gilt Fund - Short Term Plan 7.13% 7.02% 5.39%
ICICI Prudential Short Term Gilt Fund 7.10% 7.06% 5.40%
Equity 12.50% 25.19% 42.26%
IDFC Classic Equity Fund 2.57% 4.21% 7.00%
IDFC Sterling Equity Fund - 1.59% 2.64%
Reliance Growth Fund 2.51% 4.00% 6.84%
HDFC Capital Builder Fund 2.47% 4.00% 6.77%
HDFC Top 200 Fund 2.45% 4.90% 8.15%
Birla Sun Life Top 100 Fund 2.49% 4.98% 8.31%
Kotak Emerging Equity Scheme - 1.51% 2.56%
Net Current Asset -0.28% 0.21% -0.35%
Grand Total 100.00% 100.00% 100.00%
PORTFOLIO FUND FEATURES
Standard Allocation % to net assets
Standard MatrixConservative
Plan
Moderate
Plan
Aggressive
Plan
Equity (Including Offshore
Equity) Fund10-15% 25-30% 45-50%
Debt Fund(Including Liquid
funds)0-90% 0-70% 0-45%
Alternate (Including Gold/
Commodity Equity Funds)0% 5-10% 10-15%
Money Market Securities 0-15% 0-15% 0-15%
(w.e.f. 07 Dec, 2011)
FUND FEATURES
Standard Allocation % to net assets
Standard MatrixConservative
Plan
Moderate
Plan
Aggressive
Plan
Equity (Including Offshore
Equity) Fund10-15% 25-30% 45-50%
Debt Fund(Including Liquid
funds)0-90% 0-70% 0-45%
Alternate (Including Gold/
Commodity Equity Funds)0% 5-10% 10-15%
Money Market Securities 0-15% 0-15% 0-15%
(w.e.f. 07 Dec, 2011)

20
Performance Table
Scheme Name CAGR Returns (%) Current Value of Investment of ` 10,000
1 Year 3 Years 5 Years Since Inception 1 Year 3 Years 5 Years Since Inception
IDFC Asset Allocation Fund - CP - Regular Plan - Growth* 11.61% 10.16% 10.48% 9.25% 11,161 13,371 16,467 19,220
CRISIL MIP Blended Index# 12.07% 10.56% 10.15% 8.96% 11,207 13,519 16,225 18,852
CRISIL 10 Year Gilt Index## 11.69% 11.15% 8.46% 7.29% 11,169 13,736 15,017 16,817
IDFC Asset Allocation Fund - CP - Direct Plan - Growth$ 12.17% 10.72% NA 10.89% 11,217 13,578 NA 15,509
CRISIL MIP Blended Index# 12.07% 10.56% NA 10.21% 11,207 13,519 NA 15,111
CRISIL 10 Year Gilt Index## 11.69% 11.15% NA 8.19% 11,169 13,736 NA 13,970
*Since Inception Regular Plan - Growth Feb 11, 2010. $Since Inception Direct Plan - Growth Apr 02, 2013.
Performance Table
Scheme Name CAGR Returns (%) Current Value of Investment of ` 10,000
1 Year 3 Years 5 Years Since Inception 1 Year 3 Years 5 Years Since Inception
IDFC Asset Allocation Fund - MP - Regular Plan - Growth* 12.49% 10.72% 11.41% 10.29% 11,249 13,578 17,173 20,610
CRISIL MIP Blended Index# 12.07% 10.56% 10.15% 8.96% 11,207 13,519 16,225 18,852
CRISIL 10 Year Gilt Index## 11.69% 11.15% 8.46% 7.29% 11,169 13,736 15,017 16,817
IDFC Asset Allocation Fund - MP - Direct Plan - Growth$ 13.05% 11.28% NA 11.64% 11,305 13,785 NA 16,130
CRISIL MIP Blended Index# 12.07% 10.56% NA 10.09% 11,207 13,519 NA 15,178
CRISIL 10 Year Gilt Index## 11.69% 11.15% NA 7.92% 11,169 13,736 NA 13,923
*Since Inception Regular Plan - Growth Feb 11, 2010. $Since Inception Direct Plan - Growth Feb 26, 2013.
Performance Table
Scheme Name CAGR Returns (%) Current Value of Investment of ` 10,000
1 Year 3 Years 5 Years Since Inception 1 Year 3 Years 5 Years Since Inception
IDFC Asset Allocation Fund - AP - Regular Plan - Growth* 14.16% 11.07% 12.34% 10.81% 11,416 13,707 17,904 21,350
CRISIL Balanced Fund – Aggressive Index# 13.85% 9.08% 11.73% 9.59% 11,385 12,981 17,421 19,673
CRISIL 10 Year Gilt Index## 11.69% 11.15% 8.46% 7.29% 11,169 13,736 15,017 16,817
IDFC Asset Allocation Fund - AP - Direct Plan - Growth$ 14.77% 11.65% NA 11.58% 11,477 13,921 NA 16,363
CRISIL Balanced Fund – Aggressive Index# 13.85% 9.08% NA 10.75% 11,385 12,981 NA 15,829
CRISIL 10 Year Gilt Index## 11.69% 11.15% NA 8.20% 11,169 13,736 NA 14,251
The fund is being managed by Mr. Bhavin Patadia (w.e.f. 29th May 2017). Performance based on NAV as on 30/06/2017. Past performance may or may not be sustained in future.Regular and Direct Plans have different expense structure. Direct Plan shall have a lower expense ratio excluding distribution expenses, commission expenses etc.For other funds managed by the fund manager, please refer page no. 34 - 36 & the respective fund pages. #Benchmark Returns. ##Alternate Benchmark Returns.*Since Inception Regular Plan - Growth Feb 11, 2010. $Since Inception Direct Plan - Growth Jan 01, 2013.
IDFC Asset Allocation Fund of FundsAn Open Ended Fund of Fund Scheme
30th June 2017
IDFC All Season Bond FundAn Open Ended Fund of Fund Scheme
30th June 2017
FUND FEATURES
About the Fund: All Seasons Bond Fund is a Fund of Fund (FOF) structure which can invest in one or more funds within our basket of short term offerings currently. The portfolio gives the fund manager the flexibility to play between debt and money market, benefiting from the accrual available in its space and optimizing the portfolio yields.
Nature: Fund of Fund | Monthly Avg AUM: ` 166.92 Crores | Month end AUM: ` 174.04 Crores
Inception Date: 13 September 2004 | Fund Manager: Mr. Harshal Joshi (w.e.f 15th July 2016)
Other Parameter Asset Quality Expense Ratio
Standard Deviation (Annualized) 1.65% AAA Equivalent 96.85% Regular 0.70%
Modified Duration 2.13 Years AA+ 3.01% Direct 0.26%
Average Maturity 2.56 Years AA 0.13%
Yield to Maturity 7.24%
Benchmark: CRISIL Short Term Bond Fund Index (w.e.f. 30th November 2015) | SIP (Minimum Amount): ` 1,000/- | SIP Frequency: Monthly
SIP Dates (Monthly): Any day of the month, except 29th, 30th & 31st day of the month | Investment Objective: Refer Pg No from 41 to 42
Minimum Investment Amount: ` 5,000/- and any amount thereafter | Option Available: Growth, Dividend - Daily, Weekly, Fortnightly, Quarterly, Half Yearly, Annual & Periodic
Exit Load: 0.50% if redeemed or switched before 3 months (w.e.f. 09th October 2013)
NAV (`)
Plan Option Freq NAVRegular Plan Growth - 25.8722Regular Plan Dividend Quarterly 12.3377Regular Plan Dividend Half Yearly 11.8852Regular Plan Dividend Annual 11.6866Regular Plan Dividend Fortnightly 11.0202Regular Plan Dividend Daily NARegular Plan Dividend Weekly 10.9992Regular Plan Dividend Periodic 12.7922Direct Plan Growth - 26.3902Direct Plan Dividend Daily 11.0194Direct Plan Dividend Quarterly 12.4742Direct Plan Dividend Fortnightly 11.0208Direct Plan Dividend Periodic 12.8140
PORTFOLIO
Name % of NAV
Mutual Fund Units 99.99%
IDFC Super Saver Income Fund – Short Term 57.01%
IDFC Money Manager Fund - Investment Plan 42.98%
Net Cash and Cash Equivalent 0.01%
Grand Total 100.00%
Riskometer
Investors understand that their principal will be at Moderately Low Risk
This product is suitable for investors who are seeking*:
To generate short term optimal returns •with high liquidity.Investment predominantly in debt •oriented mutual fund schemes and money market instruments
*Investors should consult their financial advisers if in doubt about whether the product is suitable for them.
Performance TableScheme Name CAGR Returns (%) Current Value of Investment of ` 10,000
1 Year 3 Years 5 Years Since Inception 1 Year 3 Years 5 Years Since InceptionIDFC All Seasons Bond Fund - Regular Plan - Growth* 8.65% 8.81% 8.76% 7.71% 10,865 12,886 15,221 25,872CRISIL Short Term Bond Fund Index# 8.88% 9.12% 9.09% 7.62% 10,888 12,995 15,455 25,615CRISIL 1 Year T-Bill## 6.53% 7.57% 7.36% 6.08% 10,653 12,451 14,266 21,291IDFC All Seasons Bond Fund - Direct Plan - Growth$ 9.13% 9.29% NA 9.33% 10,913 13,057 NA 14,743CRISIL Short Term Bond Fund Index# 8.88% 9.12% NA 9.14% 10,888 12,995 NA 14,631CRISIL 1 Year T-Bill## 6.53% 7.57% NA 7.24% 10,653 12,451 NA 13,557
The fund is being managed by Mr. Harshal Joshi (w.e.f 15th July 2016). Performance based on NAV as on 30/06/2017. Past performance may or may not be sustained in future.Regular and Direct Plans have different expense structure. Direct Plan shall have a lower expense ratio excluding distribution expenses, commission expenses etc.For other funds managed by the fund manager, please refer page no. 34 - 36 & the respective fund pages. #Benchmark Returns. ##Alternate Benchmark Returns. *Since Inception Regular Plan - Growth Sep 13, 2004. $Since Inception Direct Plan - Growth Feb 22, 2013.

21
IDFC Cash FundAn Open Ended Liquid Fund
30th June 2017
FUND FEATURES PORTFOLIO
About the Fund: The Fund aims to invest in high quality debt and money market instruments with high liquidity and seeks to generate accrual income with low volatility.
Nature: Liquid Fund
Monthly Avg AUM: ` 10,123.56 Crores
Month end AUM: ` 9719.41 Crores
Inception Date: 2 July 2001
Fund Manager: Mr. Harshal Joshi (w.e.f. 15th September 2015) & Mr. Anurag Mittal (w.e.f. 09th November 2015)
Other Parameter:
Standard Deviation (Annualized) 0.15%
Modified Duration 48 Days
Average Maturity 48 Days
Yield to Maturity 6.45%
Asset Quality
AAA Equivalent 100.00%
Expense Ratio
Regular 0.23%
Direct 0.14%
Benchmark: CRISIL Liquid Fund Index
SIP (Minimum Amount): ` 100/-
SIP Frequency: Monthly
SIP Dates (Monthly): Any day of the month, except 29th, 30th & 31st day of the month
Investment Objective: Refer Pg No from 41 to 42
Minimum Investment Amount: ` 100/- and any amount thereafter
Option Available: Growth, Dividend - Daily, Weekly, Monthly & Periodic
Exit Load: Nil
NAV (`)
Plan Option Freq NAV
Regular Plan Growth - 2002.6112
Regular Plan Dividend Daily 1001.0846
Regular Plan Dividend Weekly 1002.3546
Regular Plan Dividend Periodic 1320.5943
Regular Plan Dividend Monthly 1000.5258
Direct Plan Growth - 2007.8861
Direct Plan Dividend Daily 1001.6663
Direct Plan Dividend Monthly 1007.2437
Direct Plan Dividend Weekly 1008.2497
Direct Plan Dividend Periodic 1240.9727
Name Rating % of NAV
Commercial Paper 70.64%
NABARD A1+ 9.70%
Indiabulls Housing Finance A1+ 6.13%
Reliance Jio Infocomm A1+ 5.36%
Aditya Birla Finance A1+ 5.12%
Reliance Industries A1+ 5.10%
Vedanta A1+ 4.08%
Tata Capital Housing Finance A1+ 3.83%
Cholamandalam Invt and Fin Co A1+ 3.07%
India Infoline Housing Finance A1+ 2.55%
Piramal Enterprises A1+ 2.54%
Chennai Petroleum Corporation A1+ 2.04%
Mahindra Vehicle Mfg A1+ 2.04%
Shriram City Union Finance A1+ 1.53%
Small Industries Dev Bank of India A1+ 1.53%
TGS Investment & Trade Pvt A1+ 1.53%
Godrej Properties A1+ 1.53%
GIC Housing Finance A1+ 1.52%
L&T Finance A1+ 1.28%
JM Financial Credit Solution A1+ 1.28%
Piramal Finance Private A1+ 1.27%
Tata Housing Development Co A1+ 1.02%
IIFL Wealth Finance A1+ 1.02%
Reliance Retail A1+ 1.02%
Performance TableScheme Name CAGR Returns (%) Current Value of Investment of ` 10,000
1 Year 3 Years 5 YearsSince
Inception1 Year 3 Years 5 Years
SinceInception
IDFC Cash Fund - Regular Plan - Growth*
6.83% 7.90% 8.41% 7.95% 10,683 12,566 14,979 20,026
Crisil Liquid Fund Index# 6.86% 7.83% 8.25% 7.62% 10,686 12,541 14,872 19,467
1 Year T-Bill## 6.53% 7.57% 7.36% 6.48% 10,653 12,451 14,266 17,678
IDFC Cash Fund - Direct Plan - Growth$
6.92% 7.98% NA 8.41% 10,692 12,592 NA 14,374
Crisil Liquid Fund Index# 6.86% 7.83% NA 8.29% 10,686 12,541 NA 14,306
1 Year T-Bill## 6.53% 7.57% NA 7.28% 10,653 12,451 NA 13,717
The fund is being managed by Mr. Harshal Joshi (w.e.f. 15th September 2015) & Mr. Anurag Mittal (w.e.f. 09th November 2015)Performance based on NAV as on 30/06/2017. Past performance may or may not be sustained in future.Regular and Direct Plans have different expense structure. Direct Plan shall have a lower expense ratio excluding distribution expenses, commission expenses etc.For other funds managed by the fund manager, please refer page no. 34 - 36 & the respective fund pages#Benchmark Returns. ##Alternate Benchmark Returns. *Since Inception Regular Plan - Growth Jun 04, 2008. $Since Inception Direct Plan - Growth Jan 01, 2013.
Riskometer
Investors understand that their principal will be at Low Risk
This product is suitable for investors who are seeking*:
To generate short term optimal returns with •high liquidity.Investments in high quality money market and •debt instruments
*Investors should consult their financial advisers if in doubt about whether the product is suitable for them.
Name Rating % of NAV
Afcons Infrastructure A1+ 0.87%
Aditya Birla Fashion and Retail A1+ 0.77%
Mahindra Rural Housing Finance A1+ 0.51%
Tube Investments of India A1+ 0.51%
Trapti Trading & Invest Pvt A1+ 0.51%
Kotak Mahindra Prime A1+ 0.51%
JM Financial Services A1+ 0.36%
HDFC A1+ 0.26%
ICICI Securities A1+ 0.25%
Treasury Bill 34.64%
77 Days CMB - 2017 SOV 18.12%
63 Days CMB - 2017 SOV 10.02%
80 Days CMB - 2017 SOV 6.45%
91 Days T-Bill - 2017 SOV 0.07%
Zero Coupon Bond 2.71%
Kotak Mahindra Prime AAA 1.69%
Kotak Mahindra Investments AAA 1.02%
Certificate of Deposit 1.42%
HDFC Bank A1+ 1.01%
Axis Bank A1+ 0.41%
Corporate Bond 0.05%
Power Finance Corporation AAA 0.05%
Net Cash and Cash Equivalent -9.47%
Grand Total 100.00%

22
IDFC Ultra Short Term FundAn Open Ended Income Fund
30th June 2017
FUND FEATURES PORTFOLIO
About the Fund: The Fund aims to invest in high quality debt and money market instruments and seeks to generate returns predominantly through accrual income.
Nature: Income Fund
Monthly Avg AUM: ` 6,095.02 Crores
Month end AUM: ` 5750.67 Crores
Inception Date: 17 January 2006
Fund Manager: Mr. Anurag Mittal (w.e.f. 09th November 2015)
Other Parameter:
Standard Deviation (Annualized) 0.76%
Modified Duration 340 Days
Average Maturity 388 Days
Yield to Maturity 7.00%
Asset Quality
AAA Equivalent 79.95%
AA+ 13.38%
AA 6.67%
Expense Ratio
Regular 0.37%
Direct 0.22%
Benchmark: CRISIL Liquid Fund Index
SIP (Minimum Amount): ` 100/-
SIP Frequency: Monthly
SIP Dates (Monthly): Any day of the month, except 29th, 30th & 31st day of the month
Investment Objective: Refer Pg No from 41 to 42
Minimum Investment Amount: ` 100/- and any amount thereafter
Option Available: Growth, Dividend - Daily, Weekly, Monthly, Quarterly & Periodic
Exit Load: Nil (Since 29th June 2012)
NAV (`)
Plan Option Freq NAV
Regular Plan Growth - 23.4516
Regular Plan Dividend Daily 10.0712
Regular Plan Dividend Periodic 12.6628
Regular Plan Dividend Weekly 10.1023
Regular Plan Dividend Monthly 10.1033
Regular Plan Dividend Quarterly 10.6232
Direct Plan Growth - 23.5863
Direct Plan Dividend Daily 10.1111
Direct Plan Dividend Periodic 12.6999
Direct Plan Dividend Weekly 10.0809
Direct Plan Dividend Monthly 10.1167
Direct Plan Dividend Quarterly 10.5380
Name Rating % of NAV
Corporate Bond 52.85%
HDFC AAA 6.73%
Rural Electrification Corporation AAA 4.65%
Power Finance Corporation AAA 4.21%
L&T Infrastructure Finance Co AA+ 3.95%
Cholamandalam Invt and Fin Co AA 3.60%
Tata Capital Financial Services AA+ 3.05%
Kotak Mahindra Prime AAA 2.88%
LIC Housing Finance AAA 2.71%
M&M Financial Services AAA 2.62%
NABARD AAA 2.11%
Small Industries Dev Bank of India AAA 2.03%
Gruh Finance AAA 1.92%
Tata Capital AA+ 1.75%
Shriram Transport Finance Company AA+ 1.75%
L&T Housing Finance AA+ 1.31%
JM Financial Products AA 1.30%
Tata Motors AA+ 1.12%
Tata Housing Development Co AA 1.05%
Kotak Mahindra Investments AAA 0.87%
Tata Motors AA 0.73%
Export Import Bank of India AAA 0.67%
Indiabulls Housing Finance AAA 0.61%
L&T Finance AA+ 0.44%
Bajaj Finance AAA 0.44%
Indian Railway Finance Corp AAA 0.35%
Commercial Paper 34.87%
Tata Power Company A1+ 6.86%
Hindustan Zinc A1+ 4.32%
Performance TableScheme Name CAGR Returns (%) Current Value of Investment of ` 10,000
1 Year 3 Years 5 YearsSince
Inception1 Year 3 Years 5 Years
SinceInception
IDFC Ultra Short Term Fund - Regular Plan - Growth*
8.24% 8.61% 8.98% 7.72% 10,824 12,813 15,377 23,452
Crisil Liquid Fund Index 6.86% 7.83% 8.25% 7.47% 10,686 12,541 14,872 22,824
1 Year T-Billl## 6.53% 7.57% 7.36% 6.27% 10,653 12,451 14,266 20,080
IDFC Ultra Short Term Fund - Direct Plan - Growth$
8.41% 8.77% NA 9.07% 10,841 12,871 NA 14,778
Crisil Liquid Fund Index Direct# 6.86% 7.83% NA 8.29% 10,686 12,541 NA 14,306
1 Year T-Bill## 6.53% 7.57% NA 7.28% 10,653 12,451 NA 13,717
The fund is being managed by Mr. Anurag Mittal (w.e.f. 09th November 2015)Performance based on NAV as on 30/06/2017. Past performance may or may not be sustained in future.Regular and Direct Plans have different expense structure. Direct Plan shall have a lower expense ratio excluding distribution expenses, commission expenses etc.For other funds managed by the fund manager, please refer page no. 34 - 36 & the respective fund pages#Benchmark Returns. ##Alternate Benchmark Returns. *Since Inception Regular Plan - Growth Jan 17, 2006. $Since Inception Direct Plan - Growth Jan 01, 2013.
Riskometer
Investors understand that their principal will be at Moderately Low Risk
This product is suitable for investors who are seeking*:
To generate short term stable returns with a low •risk strategy.Investments in good quality debt and money •market instruments such that the fund will offer a blend of liquidity with stability of returns.
*Investors should consult their financial advisers if in doubt about whether the product is suitable for them.
Name Rating % of NAV
Coromandel International A1+ 3.43%
Axis Finance A1+ 3.43%
Tata Housing Development Co A1+ 3.00%
Power Finance Corporation A1+ 2.55%
Godrej Industries A1+ 2.33%
NABARD A1+ 1.72%
Vedanta A1+ 1.72%
Ashok Leyland A1+ 1.72%
Godrej Consumer Products A1+ 1.30%
Reliance Jio Infocomm A1+ 0.86%
Trapti Trading & Invest Pvt A1+ 0.81%
TGS Investment & Trade Pvt A1+ 0.81%
State Government Bond 10.54%
8.39% Rajasthan UDAY BOND - 2018 SOV 5.90%
8.39% Rajasthan UDAY BOND- 2022 SOV 2.72%
8.21% Haryana UDAY BOND - 2022 SOV 0.90%
8.39% Rajasthan UDAY BOND - 2020 SOV 0.81%
7.67% Tamilnadu UDAY BOND - 2023 SOV 0.18%
8.24% Tamilnadu UDAY BOND - 2028 SOV 0.01%
8.04% Tamilnadu UDAY BOND - 2029 SOV 0.01%
8.21% Rajasthan UDAY BOND - 2020 SOV 0.01%
Treasury Bill 1.79%
91 Days T-Bill - 2017 SOV 1.79%
Zero Coupon Bond 0.39%
Kotak Mahindra Prime AAA 0.39%
Certificate of Deposit 0.02%
IndusInd Bank A1+ 0.02%
Net Cash and Cash Equivalent -0.45%
Grand Total 100.00%

23
IDFC Money Manager Fund – Treasury PlanAn Open Ended Income Fund
30th June 2017
FUND FEATURES PORTFOLIO
About the Fund: The Fund aims to invest only in short maturity, highly rated debt and money market instruments and seeks to generate returns predominantly through accrual income.
Nature: Debt
Monthly Avg AUM: ` 1,972.03 Crores
Month end AUM: ` 1862.17 Crores
Inception Date: 18 February 2003
Fund Manager: Mr. Anurag Mittal & Harshal Joshi (w.e.f. 15th May 2017)
Other Parameter:
Standard Deviation (Annualized) 0.85%
Modified Duration 403 Days
Average Maturity 473 Days
Yield to Maturity 7.08%
Asset Quality
AAA Equivalent 76.93% AA+ 15.47% AA 7.60%
Expense Ratio
Regular 1.07%
Direct 0.53%
Benchmark: CRISIL Liquid Fund Index (w.e.f 23rd July, 2015)
SIP (Minimum Amount): ` 100/-
SIP Frequency: Monthly
SIP Dates (Monthly): Any day of the month, except 29th, 30th & 31st day of the month
Investment Objective: Refer Pg No from 41 to 42
Minimum Investment Amount: ` 100/- and any amount thereafter
Option Available: Growth, Dividend - Daily, Weekly, Monthly & Periodic
Exit Load: Nil
NAV (`)
Plan Option Freq NAV
Regular Plan Growth - 25.9253
Regular Plan Dividend Monthly 10.2512
Regular Plan Dividend Daily 10.0994
Regular Plan Dividend Weekly 10.1273
Regular Plan Dividend Periodic 12.4582
Direct Plan Growth - 26.6535
Direct Plan Dividend Monthly 10.1872
Direct Plan Dividend Daily 10.0994
Direct Plan Dividend Weekly 10.1058
Direct Plan Dividend Periodic 12.4573
Name Rating % of NAV
Corporate Bond 46.65%
HDFC AAA 5.98%
LIC Housing Finance AAA 5.68%
Tata Motors AA+ 5.42%
JM Financial Products AA 5.39%
Kotak Mahindra Prime AAA 4.04%
Tata Capital Financial Services AA+ 4.03%
HDB Financial Services AAA 2.78%
L&T Finance AA+ 2.69%
Power Finance Corporation AAA 1.90%
Sundaram BNP Paribas Home Finance AA+ 1.89%
Tata Motors AA 1.40%
L&T Infrastructure Finance Co AA+ 1.36%
Export Import Bank of India AAA 1.35%
Power Grid Corporation of India AAA 0.83%
Tata Housing Development Co AA 0.81%
NABARD AAA 0.81%
NHPC AAA 0.27%
Tata Capital Housing Finance AA+ 0.04%
Performance TableScheme Name CAGR Returns (%) Current Value of Investment of ` 10,000
1 Year 3 Years 5 YearsSince
Inception1 Year 3 Years 5 Years
SinceInception
IDFC Money Manager Fund - Treasury Plan - Regular Plan - Growth*
7.41% 7.98% 8.17% 6.85% 10,741 12,593 14,815 25,925
Crisil Liquid Fund Index# 6.86% 7.83% 8.25% 6.84% 10,686 12,541 14,872 25,883
1 Year T-Bill## 6.53% 7.57% 7.36% 5.95% 10,653 12,451 14,266 22,935
IDFC Money Manager Fund - Treasury Plan - Direct Plan - Growth$
8.02% 8.62% NA 8.87% 10,802 12,820 NA 14,656
Crisil Liquid Fund Index# 6.86% 7.83% NA 8.29% 10,686 12,541 NA 14,306
1 Year T-Bill## 6.53% 7.57% NA 7.28% 10,653 12,451 NA 13,717
The fund is being managed by Mr. Anurag Mittal & Harshal Joshi (w.e.f. 15th May 2017) Performance based on NAV as on 30/06/2017. Past performance may or may not be sustained in future.Regular and Direct Plans have different expense structure. Direct Plan shall have a lower expense ratio excluding distribution expenses, commission expenses etc.For other funds managed by the fund manager, please refer page no. 34 - 36 & the respective fund pages#Benchmark Returns. ##Alternate Benchmark Returns.*Since Inception Regular Plan - Growth Feb 18, 2003. $Since Inception Direct Plan - Growth Jan 01, 2013.
Riskometer
Investors understand that their principal will be at Moderately Low Risk
This product is suitable for investors who are seeking*:
To generate short term stable returns with a low •risk strategy.Investments in good quality debt and money •market instruments such that the fund will offer a blend of liquidity with stability of returns
*Investors should consult their financial advisers if in doubt about whether the product is suitable for them.
Name Rating % of NAV
Commercial Paper 21.85%
CESC A1+ 5.33%
ICICI Securities A1+ 3.96%
Power Finance Corporation A1+ 3.89%
Shapoorji Pallonji and Company Private A1+ 3.38%
NABARD A1+ 2.66%
Tata Housing Development Co A1+ 1.33%
Afcons Infrastructure A1+ 1.30%
State Government Bond 16.54%
8.39% Rajasthan UDAY BOND - 2018 SOV 6.24%
8.39% Rajasthan UDAY BOND- 2022 SOV 2.80%
8.21% Haryana UDAY BOND - 2022 SOV 2.78%
8.60% Tamil Nadu SDL - 2023 SOV 1.99%
8.39% Rajasthan UDAY BOND - 2019 SOV 1.37%
7.38% Maharashtra Uday BOND - 2022 SOV 1.35%
Treasury Bill 5.33%
77 Days CMB - 2017 SOV 5.33%
Zero Coupon Bond 0.05%
Aditya Birla Finance AA+ 0.05%
Net Cash and Cash Equivalent 9.58%
Grand Total 100.00%
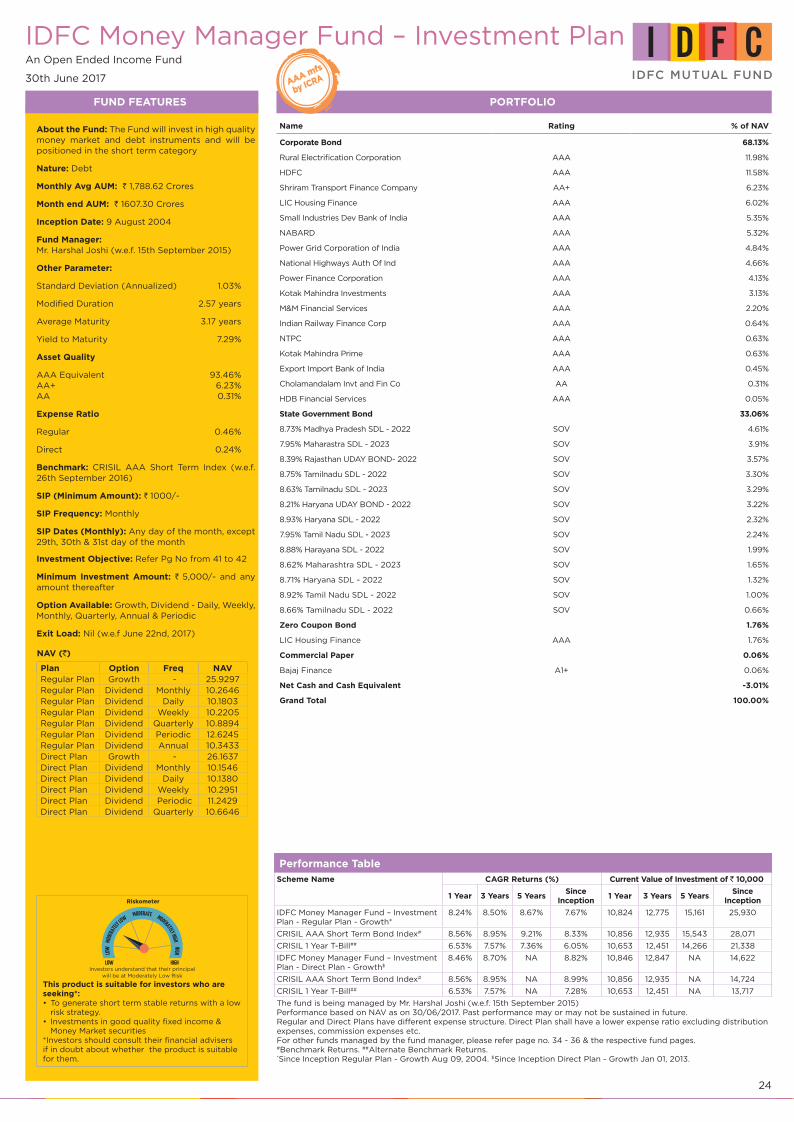
24
IDFC Money Manager Fund – Investment PlanAn Open Ended Income Fund
30th June 2017
FUND FEATURES PORTFOLIO
About the Fund: The Fund will invest in high quality money market and debt instruments and will be positioned in the short term category
Nature: Debt
Monthly Avg AUM: ` 1,788.62 Crores
Month end AUM: ` 1607.30 Crores
Inception Date: 9 August 2004
Fund Manager: Mr. Harshal Joshi (w.e.f. 15th September 2015)
Other Parameter:
Standard Deviation (Annualized) 1.03%
Modified Duration 2.57 years
Average Maturity 3.17 years
Yield to Maturity 7.29%
Asset Quality
AAA Equivalent 93.46% AA+ 6.23% AA 0.31%
Expense Ratio
Regular 0.46%
Direct 0.24%
Benchmark: CRISIL AAA Short Term Index (w.e.f. 26th September 2016)
SIP (Minimum Amount): ` 1000/-
SIP Frequency: Monthly
SIP Dates (Monthly): Any day of the month, except 29th, 30th & 31st day of the month
Investment Objective: Refer Pg No from 41 to 42
Minimum Investment Amount: ` 5,000/- and any amount thereafter
Option Available: Growth, Dividend - Daily, Weekly, Monthly, Quarterly, Annual & Periodic
Exit Load: Nil (w.e.f June 22nd, 2017)
NAV (`)
Plan Option Freq NAVRegular Plan Growth - 25.9297Regular Plan Dividend Monthly 10.2646Regular Plan Dividend Daily 10.1803Regular Plan Dividend Weekly 10.2205Regular Plan Dividend Quarterly 10.8894Regular Plan Dividend Periodic 12.6245Regular Plan Dividend Annual 10.3433Direct Plan Growth - 26.1637Direct Plan Dividend Monthly 10.1546Direct Plan Dividend Daily 10.1380Direct Plan Dividend Weekly 10.2951Direct Plan Dividend Periodic 11.2429Direct Plan Dividend Quarterly 10.6646
Name Rating % of NAV
Corporate Bond 68.13%
Rural Electrification Corporation AAA 11.98%
HDFC AAA 11.58%
Shriram Transport Finance Company AA+ 6.23%
LIC Housing Finance AAA 6.02%
Small Industries Dev Bank of India AAA 5.35%
NABARD AAA 5.32%
Power Grid Corporation of India AAA 4.84%
National Highways Auth Of Ind AAA 4.66%
Power Finance Corporation AAA 4.13%
Kotak Mahindra Investments AAA 3.13%
M&M Financial Services AAA 2.20%
Indian Railway Finance Corp AAA 0.64%
NTPC AAA 0.63%
Kotak Mahindra Prime AAA 0.63%
Export Import Bank of India AAA 0.45%
Cholamandalam Invt and Fin Co AA 0.31%
HDB Financial Services AAA 0.05%
State Government Bond 33.06%
8.73% Madhya Pradesh SDL - 2022 SOV 4.61%
7.95% Maharastra SDL - 2023 SOV 3.91%
8.39% Rajasthan UDAY BOND- 2022 SOV 3.57%
8.75% Tamilnadu SDL - 2022 SOV 3.30%
8.63% Tamilnadu SDL - 2023 SOV 3.29%
8.21% Haryana UDAY BOND - 2022 SOV 3.22%
8.93% Haryana SDL - 2022 SOV 2.32%
7.95% Tamil Nadu SDL - 2023 SOV 2.24%
8.88% Harayana SDL - 2022 SOV 1.99%
8.62% Maharashtra SDL - 2023 SOV 1.65%
8.71% Haryana SDL - 2022 SOV 1.32%
8.92% Tamil Nadu SDL - 2022 SOV 1.00%
8.66% Tamilnadu SDL - 2022 SOV 0.66%
Zero Coupon Bond 1.76%
LIC Housing Finance AAA 1.76%
Commercial Paper 0.06%
Bajaj Finance A1+ 0.06%
Net Cash and Cash Equivalent -3.01%
Grand Total 100.00%
Performance TableScheme Name CAGR Returns (%) Current Value of Investment of ` 10,000
1 Year 3 Years 5 YearsSince
Inception1 Year 3 Years 5 Years
SinceInception
IDFC Money Manager Fund – Investment Plan - Regular Plan - Growth*
8.24% 8.50% 8.67% 7.67% 10,824 12,775 15,161 25,930
CRISIL AAA Short Term Bond Index# 8.56% 8.95% 9.21% 8.33% 10,856 12,935 15,543 28,071
CRISIL 1 Year T-Bill## 6.53% 7.57% 7.36% 6.05% 10,653 12,451 14,266 21,338
IDFC Money Manager Fund – Investment Plan - Direct Plan - Growth$
8.46% 8.70% NA 8.82% 10,846 12,847 NA 14,622
CRISIL AAA Short Term Bond Index# 8.56% 8.95% NA 8.99% 10,856 12,935 NA 14,724
CRISIL 1 Year T-Bill## 6.53% 7.57% NA 7.28% 10,653 12,451 NA 13,717
The fund is being managed by Mr. Harshal Joshi (w.e.f. 15th September 2015)Performance based on NAV as on 30/06/2017. Past performance may or may not be sustained in future. Regular and Direct Plans have different expense structure. Direct Plan shall have a lower expense ratio excluding distribution expenses, commission expenses etc. For other funds managed by the fund manager, please refer page no. 34 - 36 & the respective fund pages. #Benchmark Returns. ##Alternate Benchmark Returns. *Since Inception Regular Plan - Growth Aug 09, 2004. $Since Inception Direct Plan - Growth Jan 01, 2013.
Riskometer
Investors understand that their principal will be at Moderately Low Risk
This product is suitable for investors who are seeking*:
To generate short term stable returns with a low •risk strategy.Investments in good quality fixed income & •Money Market securities
*Investors should consult their financial advisers if in doubt about whether the product is suitable for them.

25
IDFC Banking & PSU Debt Fund (The Fund (erstwhile IDFC Banking Debt Fund) has been repositioned with effect from June 12, 2017$$)An Open Ended Income Fund30th June 2017
FUND FEATURES PORTFOLIO
About the Fund: The Fund will predominantly invest in high quality money market and debt instruments of Banks, PSU and PFI.
Nature: Debt
Monthly Avg AUM: ` 834.66 Crores
Month end AUM: ` 696.19 Crores
Inception Date: 7 March 2013
Fund Manager: Mr. Anurag Mittal (w.e.f. 15th May 2017)
Other Parameter:
Standard Deviation (Annualized) 0.35%
Modified Duration 2.51 years
Average Maturity 3.13 years
Yield to Maturity 7.39%
Asset Quality
AAA Equivalent 81.19% AA+ 10.08% AA 8.73% Expense Ratio
Regular 0.41%
Direct 0.22%
Benchmark: Crisil Short Term Bond Fund Index (w.e.f. 12th June 2017)
SIP (Minimum Amount): ` 1000/-
SIP Frequency: Monthly
SIP Dates (Monthly): Any day of the month, except 29th, 30th & 31st day of the month
Investment Objective: Refer Pg No from 41 to 42
Minimum Investment Amount: ` 5,000/- and any amount thereafter
Option Available: Growth, Dividend - Daily, Fortnightly, Monthly (Reinvestment), Quarterly (Payout), Annual (Payout) & Periodic
Exit Load: Nil (w.e.f. June 12th 2017)
NAV (`)
Plan Option Freq NAVRegular Plan Growth - 14.1231Regular Plan Dividend - 10.2740Regular Plan Dividend Fortnightly 10.1846Regular Plan Dividend Daily 10.0953Regular Plan Dividend Monthly 10.1542Regular Plan Dividend Quarterly 10.5052Regular Plan Dividend Annual 10.2681Direct Plan Growth - 14.1904Direct Plan Dividend - 10.2798Direct Plan Dividend Fortnightly 10.0643Direct Plan Dividend Daily 10.0505Direct Plan Dividend Monthly 10.1039Direct Plan Dividend Quarterly 10.5764
Name Rating % of NAV
Corporate Bond 84.78%
Rural Electrification Corporation AAA 14.14%
Power Grid Corporation of India AAA 13.39%
Indian Railway Finance Corp AAA 11.58%
Power Finance Corporation AAA 9.52%
**Bank of Baroda AA 8.73%
**Axis Bank AA+ 7.89%
Indiabulls Housing Finance AAA 5.75%
Small Industries Dev Bank of India AAA 5.05%
NTPC AAA 3.64%
**HDFC Bank AA+ 2.19%
NHPC AAA 1.46%
National Highways Auth Of Ind AAA 1.44%
Government Bond 12.75%
7.59% - 2026 G-Sec SOV 5.26%
7.68% - 2023 G-Sec SOV 3.01%
8.15% - 2022 G-Sec SOV 2.28%
7.16% - 2023 G-Sec SOV 2.19%
Net Cash and Cash Equivalent 2.47%
Grand Total 100.00%
Performance TableScheme Name CAGR Returns (%) Current Value of Investment of ` 10,000
1 Year 3 Years 5 YearsSince
Inception1 Year 3 Years 5 Years
SinceInception
IDFC Banking & PSU Debt Fund - Regular Plan - Growth*
6.60% 7.94% NA 8.32% 10,660 12,580 NA 14,123
Crisil Short Term Bond Fund Index# 6.76% 7.80% NA 8.28% 10,676 12,530 NA 14,096
1 Year T-Bill## 6.53% 7.57% NA 7.24% 10,653 12,451 NA 13,523
IDFC Banking & PSU Debt Fund - Direct Plan - Growth$
6.71% 8.06% NA 8.44% 10,671 12,621 NA 14,190
Crisil Short Term Bond Fund Index# 6.86% 7.83% NA 8.30% 10,686 12,541 NA 14,108
1 Year T-Bill## 6.53% 7.57% NA 7.24% 10,653 12,451 NA 13,523
The fund is being managed by Mr. Anurag Mittal (w.e.f. 15th May 2017)Current Index performance adjusted for the period from since inception to June 12, 2017 with the performance of Crisil Short Term Bond Fund Index (Benchmark) & 1 Year T-Bill (Alternate Benchmark)Performance based on NAV as on 30/06/2017. Past performance may or may not be sustained in future.Regular and Direct Plans have different expense structure. Direct Plan shall have a lower expense ratio excluding distribution expenses, commission expenses etc.For other funds managed by the fund manager, please refer page no. 34 - 36 & the respective fund pages#Benchmark Returns. ##Alternate Benchmark Returns. Current Index performance adjusted for the period from since inception to June 12, 2017 with the performance of CRISIL Liquid Fund Index (Benchmark) *Since Inception Regular Plan - Growth Mar 07, 2013. $Since Inception Direct Plan - Growth Mar 07, 2013.$$ For details please refer Notice (https://www.idfcmf.com/uploads/090520171306No-18-Change-in-Scheme-features-of-IDFC-Banking-Debt-Fund.pdf)
Riskometer
Investors understand that their principal will be at Moderately Risk
This product is suitable for investors who are seeking*:
Income over short to medium term• A debt fund that invests predominantly in debt & •money market instruments issued by PSU, Banks & PFI
*Investors should consult their financial advisers if in doubt about whether the product is suitable for them.
**Basel III, Tier 1 Perpetual

26
IDFC Super Saver Income Fund – Short TermAn Open Ended Income Fund
30th June 2017
FUND FEATURES PORTFOLIO
About the Fund: A Short Term Income Fund, the portfolio is mostly a mix of short duration debt and money market instruments. The average portfolio maturity will not ordinarily exceed around 2 years.
Nature: Debt
Monthly Avg AUM: ` 5,518.41 Crores
Month end AUM: ` 5191.58 Crores
Inception Date: 14 December 2000
Fund Manager: Mr. Suyash Choudhary (Since 11th March 2011)
Other Parameter:
Standard Deviation (Annualized) 1.36%
Modified Duration 1.80 years
Average Maturity 2.11 years
Yield to Maturity 7.21%
Asset Quality
AAA Equivalent 99.41%
AA+ 0.59%
Expense Ratio
Regular 0.73%
Direct 0.25%
Benchmark: CRISIL AAA Short Term Index
(w.e.f. 26th September 2016)
SIP (Minimum Amount): ` 1000/-
SIP Frequency: Monthly
SIP Dates (Monthly): Any day of the month, except 29th, 30th & 31st day of the month
Investment Objective: Refer Pg No from 41 to 42
Minimum Investment Amount: ` 5,000/- and any amount thereafter
Option Available: Growth, Dividend - Fortnightly (Payout & Reinvestment), Monthly & Periodic
Exit Load: Nil (w.e.f. 23rd May 2016)
NAV (`)
Plan Option Freq NAV
Regular Plan Growth - 33.9654
Regular Plan Dividend Monthly 10.1613
Regular Plan Dividend Fortnightly 10.3260
Regular Plan Dividend Periodic 12.6023
Direct Plan Growth - 34.9741
Direct Plan Dividend Monthly 10.3669
Direct Plan Dividend Fortnightly 10.2517
Direct Plan Dividend Periodic 12.6267
Name Rating % of NAV
Corporate Bond 98.37%
Housing Development Finance Corporation AAA 13.35%
Power Finance Corporation AAA 11.60%
National Bank For Agriculture and Rural Development AAA 10.06%
Power Grid Corporation of India AAA 8.91%
LIC Housing Finance AAA 8.24%
Kotak Mahindra Prime AAA 7.75%
Bajaj Finance AAA 7.52%
Indian Railway Finance Corp AAA 5.34%
UltraTech Cement AAA 4.91%
Rural Electrification Corporation AAA 4.65%
National Highways Auth Of Ind AAA 4.63%
Small Industries Dev Bank of India AAA 3.92%
Reliance Jio Infocomm AAA 1.98%
HDB Financial Services AAA 1.54%
NLC India AAA 1.38%
NTPC AAA 0.98%
Export Import Bank of India AAA 0.98%
Mahindra & Mahindra Financial Services AA+ 0.59%
HDFC Bank AAA 0.03%
Net Cash and Cash Equivalent 1.63%
Grand Total 100.00%
Performance TableScheme Name CAGR Returns (%) Current Value of Investment of ` 10,000
1 Year 3 Years 5 YearsSince
Inception1 Year 3 Years 5 Years
SinceInception
IDFC Super Saver Income Fund – Short Term - Regular Plan - Growth*
8.03% 8.48% 8.61% 7.67% 10,803 12,769 15,121 33,965
CRISIL AAA Short Term Bond Index# 8.56% 8.95% 9.21% NA 10,856 12,935 15,543 NA
CRISIL 1 Year T-Bill## 6.53% 7.57% 7.36% 6.32% 10,653 12,451 14,266 27,566
IDFC Super Saver Income Fund – Short Term - Direct Plan - Growth$
8.62% 9.13% NA 9.17% 10,862 12,999 NA 14,838
CRISIL AAA Short Term Bond Index# 8.56% 8.95% NA 8.99% 10,856 12,935 NA 14,724
CRISIL 1 Year T-Bill## 6.53% 7.57% NA 7.28% 10,653 12,451 NA 13,717
The fund is being managed by Mr. Suyash Choudhary (Since 11th March 2011)Performance based on NAV as on 30/06/2017. Past performance may or may not be sustained in future.Regular and Direct Plans have different expense structure. Direct Plan shall have a lower expense ratio excluding distribution expenses, commission expenses etc.For other funds managed by the fund manager, please refer page no. 34 - 36 & the respective fund pages#Benchmark Returns. ##Alternate Benchmark Returns. *Since Inception Regular Plan - Growth Dec 14, 2000. $Since Inception Direct Plan - Growth Jan 01, 2013.
Riskometer
Investors understand that their principal will be at Moderately Low Risk
This product is suitable for investors who are seeking*:
To generate optimal returns over short to medium •term.Investments in good quality fixed income & •Money Market securities.
*Investors should consult their financial advisers if in doubt about whether the product is suitable for them.

27
IDFC Corporate Bond FundAn Open Ended Income Fund
30th June 2017
FUND FEATURES PORTFOLIO
About the Fund: The fund focuses on delivering returns through investment in the corporate bond segment. The fund will not have weighted average portfolio maturity of more than 5 years and shall not invest in G Secs.
Nature: Open Ended Income Fund
Monthly Avg AUM: ` 8,070.49 Crores
Month end AUM: ` 8209.97 Crores
Inception Date: 12 January 2016
Fund Manager: Mr. Anurag Mittal (w.e.f. 12th January 2016)
Other Parameter:
Standard Deviation (Annualized) 2.64%
Modified Duration 2.39 years
Average Maturity 2.84 years
Yield to Maturity 7.30%
Asset Quality
AAA Equivalent 100.00%
Expense Ratio
Regular 0.47%
Direct 0.22%
Benchmark: CRISIL Short Term Bond Fund Index
SIP (Minimum Amount): ` 1000/-
SIP Frequency: Monthly
SIP Dates (Monthly): Any day of the month, except 29th, 30th & 31st day of the month
Investment Objective: Refer Pg No from 41 to 42
Minimum Investment Amount: ` 5,000/- and any amount thereafter
Option Available: Dividend-Monthly, Quarterly, Half Yearly, Annual & Periodic
Exit Load: Nil
NAV (`)
Plan Option Freq NAVRegular Plan Growth - 11.3933Regular Plan Dividend - -Regular Plan Dividend Periodic 10.8899Regular Plan Dividend Monthly 10.5057Regular Plan Dividend Half
Yearly10.8287
Regular Plan Dividend Quarterly 10.4016Regular Plan Dividend Annual 10.2981Direct Plan Growth - 11.4490Direct Plan Dividend - -Direct Plan Dividend Periodic 10.8847Direct Plan Dividend Monthly 10.2406Direct Plan Dividend Quarterly 10.2450Direct Plan Dividend Annual 10.3028
Name Rating % of NAV
Corporate Bond 95.50%
Rural Electrification Corporation AAA 11.44%
Power Finance Corporation AAA 11.41%
LIC Housing Finance AAA 9.15%
Housing Development Finance Corporation AAA 7.58%
HDB Financial Services AAA 6.05%
Indian Railway Finance Corp AAA 5.57%
Power Grid Corporation of India AAA 5.32%
National Bank For Agriculture and Rural Development AAA 5.03%
Mahindra & Mahindra Financial Services AAA 4.87%
Bajaj Finance AAA 4.32%
Export Import Bank of India AAA 4.25%
Larsen & Toubro AAA 3.23%
Tata Sons AAA 2.76%
National Highways Auth Of Ind AAA 2.31%
UltraTech Cement AAA 2.27%
NTPC AAA 2.22%
Gruh Finance AAA 2.14%
Reliance Jio Infocomm AAA 1.25%
Mahindra Vehicle Mfg AAA 1.25%
NHPC AAA 1.02%
Reliance Industries AAA 0.89%
Small Industries Dev Bank of India AAA 0.88%
Axis Finance AAA 0.31%
Zero Coupon Bond 0.46%
Mahindra & Mahindra Financial Services AAA 0.39%
Kotak Mahindra Prime AAA 0.07%
Net Cash and Cash Equivalent 4.04%
Grand Total 100.00%
Performance TableScheme Name CAGR Returns (%) Current Value of Investment of ` 10,000
1 Year 3 Years 5 YearsSince
Inception1 Year 3 Years 5 Years
SinceInception
IDFC Corporate Bond Fund - Regular Plan - Growth*
9.54% NA NA 9.31% 10,954 NA NA 11,393
CRISIL Short Term Bond Fund Index# 8.88% NA NA 8.98% 10,888 NA NA 11,343
1 Year T-Bill## 6.53% NA NA 6.78% 10,653 NA NA 11,009
IDFC Corporate Bond Fund - Direct Plan - Growth$
9.91% NA NA 9.67% 10,991 NA NA 11,449
CRISIL Short Term Bond Fund Index# 8.88% NA NA 8.98% 10,888 NA NA 11,343
1 Year T-Bill## 6.53% NA NA 6.78% 10,653 NA NA 11,009
The fund is being managed by Mr. Anurag Mittal (w.e.f 12th January 2016)Performance based on NAV as on 30/06/2017. Past performance may or may not be sustained in future.Regular and Direct Plans have different expense structure. Direct Plan shall have a lower expense ratio excluding distribution expenses, commission expenses etc.For other funds managed by the fund manager, please refer page no. 34 - 36 & the respective fund pages#Benchmark Returns. ##Alternate Benchmark Returns. *Since Inception Regular Plan - Growth Jan 12, 2016. $Since Inception Direct Plan - Growth Jan 12, 2016.
Riskometer
Investors understand that theirprincipal will be at Moderate risk
This product is suitable for investors who are seeking*:
To generate long term optimal returns by active •management.Investment in corporate bonds & money market •instruments.
*Investors should consult their financial advisers if in doubt about whether the product is suitable for them.

28
IDFC Credit Opportunities FundAn Open Ended Debt Fund
30th June 2017
FUND FEATURES PORTFOLIO
About the Fund: IDFC Credit opportunities fund aims to provide an optimal risk-reward profile to investors by focusing on companies with well-run management and evolving business prospects or good businesses with improving financial profile.
Nature: Debt
Monthly Avg AUM: ` 585.17 Crores
Month end AUM: ` 633.54 Crores
Inception Date: 03 March 2017
Fund Manager: Mr. Arvind Subramanian (w.e.f. 03rd March 2017) and Khushboo Sharma (w.e.f. 15th May 2017)
Other Parameter:
Modified Duration 2.75 years
Average Maturity 3.44 years
Yield to Maturity 8.02%
Asset Quality
AAA Equivalent 27.27% AA 36.70% AA+ 26.93% AA- 9.10%
Expense Ratio
Regular 1.34%
Direct 0.30%
Benchmark: 80% CRISIL AA Medium Term Bond Index + 20% CRISIL AAA Short Term Bond Index
SIP (Minimum Amount): ` 1,000/-
SIP Frequency: Monthly
SIP Dates (Monthly): Any day of the month, except 29th, 30th & 31st day of the month
Investment Objective: Refer Pg No from 41 to 42
Minimum Investment Amount: ` 5,000/- and any amount thereafter
Option Available: Growth & Dividend (Payout, Reinvestment & Sweep facility)
Exit Load: 1% if redeemed/switched out within 365 days from the date of allotment
NAV (`)
Plan Option Freq NAV
Regular Plan Growth - 10.3082
Regular Plan Dividend Periodic 10.3082
Regular Plan Dividend Annual 10.3082
Regular Plan Dividend Half Yearly
10.3082
Regular Plan Dividend Quarterly 10.1081
Direct Plan Growth - 10.3397
Direct Plan Dividend Periodic 10.3398
Direct Plan Dividend Annual 10.3397
Direct Plan Dividend Half Yearly
10.3408
Direct Plan Dividend Quarterly 10.0996
Name Rating % of NAV
Corporate Bond 88.62%
Tata Housing Development Co AA 7.12%
Power Finance Corporation AAA 7.09%
**IndusInd Bank AA 5.62%
Indiabulls Housing Finance AAA 5.60%
Afcons Infrastructure AA 5.58%
JM Financial Products AA 5.54%
**Axis Bank AA+ 5.52%
Tata Power Company AA- 4.90%
Idea Cellular AA+ 4.69%
Hindalco Industries AA- 4.20%
Vodafone Mobile Services AA 4.01%
**HDFC Bank AA+ 4.01%
Tata Power Renewable Energy AA(SO) 3.96%
L&T Housing Finance AA+ 3.96%
**ICICI Bank AA+ 3.21%
Tata Motors AA+ 3.16%
Tata Steel AA 2.45%
Mahindra Rural Housing Finance AA+ 2.39%
Gruh Finance AAA 2.37%
Reliance Ports and Terminals AAA 1.63%
Reliance Jio Infocomm AAA 1.62%
State Government Bond 4.13%
8.39% Rajasthan UDAY BOND - 2023 SOV 4.13%
Zero Coupon Bond 2.42%
Aditya Birla Fashion and Retail AA 2.42%
Commercial Paper 1.53%
Shapoorji Pallonji and Company Private A1+ 1.53%
Net Cash and Cash Equivalent 3.29%
Grand Total 100.00%
**Basel III, Tier 1 Perpetual
Riskometer
Investors understand that their principal will be at Moderate risk
This product is suitable for investors who are seeking*:
To generate optimal returns over medium term.•To predominantly invest in a portfolio of •corporate debt securities across the credit spectrum.
*Investors should consult their financial advisers if in doubt about whether the product is suitable for them.

29
IDFC Super Saver Income Fund – Medium TermAn Open Ended Income Fund
30th June 2017
FUND FEATURES PORTFOLIO
About the Fund: The fund is positioned in the short term fund category and invests in a mix of debt and money market instruments. The overall average maturity of the fund will ordinarily not exceed around 4 years. MT is best suited for investors who want moderate participation. The around 4 year average maturity cap makes the fund well suited to offer lower volatility yet benefit from potential fall in interest rates.
Nature: Debt
Monthly Avg AUM: ` 4,331.64 Crores
Month end AUM: ` 4211.94 Crores
Inception Date: 8 July 2003
Fund Manager: Mr. Suyash Choudhary (w.e.f. 15th September 2015)
Other Parameter:
Standard Deviation (Annualized) 2.17%
Modified Duration 2.76 years
Average Maturity 3.46 years
Yield to Maturity 7.23%
Asset Quality
AAA Equivalent 100.00%
Expense Ratio
Regular 1.38%
Direct 0.74%
Benchmark: CRISIL Short Term Bond Fund Index
SIP (Minimum Amount): ` 1000/-
SIP Frequency: Monthly
SIP Dates (Monthly): Any day of the month, except 29th, 30th & 31st day of the month
Investment Objective: Refer Pg No from 41 to 42
Minimum Investment Amount: ` 5,000/- and any amount thereafter
Option Available: Growth, Dividend - Daily, Fortnightly (Payout & Reinvestment), Monthly, Bi - Monthly (once in two months), Quarterly & Periodic
Exit Load: 0.50% if redeemed/switched-out within 6 (six) months from the date of allotment (w.e.f. 11th May 2017)
NAV (`)
Plan Option Freq NAVRegular Plan Growth - 28.2386Regular Plan Dividend BiMonthly 11.6708Regular Plan Dividend Fortnightly 10.1541Regular Plan Dividend Monthly 10.1632Regular Plan Dividend Daily 10.2016Regular Plan Dividend Quarterly 10.7181Regular Plan Dividend Periodic 12.8948Direct Plan Growth - 29.1295Direct Plan Dividend BiMonthly 11.9419Direct Plan Dividend Fortnightly 10.1295Direct Plan Dividend Monthly 10.4254Direct Plan Dividend Quarterly 10.8274Direct Plan Dividend Daily 10.4168Direct Plan Dividend Periodic 12.9950
Name Rating % of NAV
Corporate Bond 52.05%
Housing Development Finance Corporation
AAA 13.06%
LIC Housing Finance AAA 9.85%
Power Finance Corporation AAA 9.33%
Kotak Mahindra Prime AAA 9.29%
Rural Electrification Corporation AAA 3.77%
Bajaj Finance AAA 2.22%
Power Grid Corporation of India AAA 2.21%
Export Import Bank of India AAA 0.80%
ICICI Bank AAA 0.60%
Indian Railway Finance Corp AAA 0.37%
HDFC Bank AAA 0.25%
National Bank For Agriculture and Rural Development
AAA 0.12%
National Highways Auth Of Ind AAA 0.12%
HDB Financial Services AAA 0.04%
Small Industries Dev Bank of India AAA 0.02%
State Government Bond 27.15%
8.39% Rajasthan UDAY BOND - 2019 SOV 5.83%
8.39% Rajasthan UDAY BOND - 2023 SOV 5.15%
7.38% Maharashtra Uday BOND - 2022 SOV 3.65%
8.21% Haryana UDAY BOND - 2023 SOV 3.08%
Performance TableScheme Name CAGR Returns (%) Current Value of Investment of ` 10,000
1 Year 3 Years 5 YearsSSince
Inception1 Year 3 Years 5 Years
SinceInception
IDFC Super Saver Income Fund - Medium Term Plan - Regular Plan - Growth*
9.27% 9.06% 8.60% 7.70% 10,927 12,976 15,111 28,239
CRISIL Short Term Bond Fund Index# 8.88% 9.12% 9.09% 7.29% 10,888 12,995 15,455 26,771
1 Year T-Bill## 6.53% 7.57% 7.36% 5.93% 10,653 12,451 14,266 22,400
IDFC Super Saver Income Fund - Medium Term Plan - Direct Plan - Growth$
9.97% 9.75% NA 9.13% 10,997 13,222 NA 14,809
CRISIL Short Term Bond Fund Index# 8.88% 9.12% NA 9.07% 10,888 12,995 NA 14,774
1 Year T-Bill## 6.53% 7.57% NA 7.28% 10,653 12,451 NA 13,717
The fund is being managed by Mr. Suyash Choudhary (w.e.f. 15th September 2015)Performance based on NAV as on 30/06/2017. Past performance may or may not be sustained in future.Regular and Direct Plans have different expense structure. Direct Plan shall have a lower expense ratio excluding distribution expenses, commission expenses etc.For other funds managed by the fund manager, please refer page no. 34 - 36 & the respective fund pages#Benchmark Returns. ##Alternate Benchmark Returns. *Since Inception Regular Plan - Growth Jul 08, 2003. $Since Inception Direct Plan - Growth Jan 01, 2013.
Name Rating % of NAV
7.63% Telangana UDAY BOND - 2023 SOV 1.63%
7.67% Tamilnadu UDAY BOND - 2023 SOV 1.55%
8.64% Uttar Pradesh UDAY BOND - 2023 SOV 1.26%
8.39% Rajasthan UDAY BOND - 2022 SOV 1.24%
7.76% Madhya Pradesh SDL - 2027 SOV 1.22%
8.44% Uttar Pradesh UDAY BOND - 2023 SOV 0.77%
8.25% Uttar Pradesh UDAY BOND - 2023 SOV 0.69%
7.71% Gujarath SDL - 2027 SOV 0.24%
7.77% Tamilnadu UDAY BOND - 2023 SOV 0.24%
7.75% Tamil Nadu UDAY BOND - 2023 SOV 0.24%
8.51% Uttar Pradesh UDAY BOND - 2023 SOV 0.23%
7.68% Madhya Pradesh UDAY BOND - 2023
SOV 0.13%
Government Bond 17.42%
8.20% - 2022 G-Sec SOV 9.05%
7.72% - 2025 G-Sec SOV 5.99%
8.15% - 2022 G-Sec SOV 2.39%
Certificate of Deposit 0.02%
Kotak Mahindra Bank A1+ 0.02%
Net Cash and Cash Equivalent 3.36%
Grand Total 100.00%
Riskometer
Investors understand that theirprincipal will be at Moderate risk
This product is suitable for investors who are seeking*:
To generate optimal returns over short to •medium term.Investments in high quality money market & •debt instruments including G-Sec securities.
*Investors should consult their financial advisers if in doubt about whether the product is suitable for them.

30
IDFC Super Saver Income Fund – Investment PlanAn Open Ended Income Fund
30th June 2017
FUND FEATURES PORTFOLIO
About the Fund: An actively managed bond fund which seeks to invest in highly rated money market and debt instruments (including government securities) and aims to generate stable long term returns through mix of accrual income and capital appreciation.
Nature: Debt
Monthly Avg AUM: ` 1,296.21 Crores
Month end AUM: ` 1295.85 Crores
Inception Date: 14 July 2000
Fund Manager: Mr. Suyash Choudhary (Since 15th October 2010)
Other Parameter:
Standard Deviation (Annualized) 6.06%
Modified Duration 6.59 years
Average Maturity 9.96 years
Yield to Maturity 7.27%
Asset Quality
AAA Equivalent 100.00%
Expense Ratio
Regular 1.66%
Direct 0.60%
Benchmark: CRISIL Composite Bond Fund Index
SIP (Minimum Amount): ` 1000/-
SIP Frequency: Monthly
SIP Dates (Monthly): Any day of the month, except 29th, 30th & 31st day of the month
Investment Objective: Refer Pg No from 41 to 42
Minimum Investment Amount: ` 5,000/- and any amount thereafter
Option Available: Growth, Dividend - Quarterly, Half Yearly, Annual & Periodic
Exit Load: If redeemed/switched out within 365 days from the date of allotment: For 10% of investment : Nil, For remaining investment : 1%
If redeemed/switched out after 365 days from the date of allotment: Nil
NAV (`)
Plan Option Freq NAVRegular Plan Dividend Quarterly 11.5105Regular Plan Growth - 41.3915Regular Plan Dividend Annual 11.4790Regular Plan Dividend Half
Yearly11.9143
Regular Plan Dividend Periodic 13.5915Direct Plan Growth - 42.9534Direct Plan Dividend Quarterly 11.9736Direct Plan Dividend Annual 15.7191Direct Plan Dividend Periodic 13.5934
Name Rating % of NAV
Government Bond 45.41%
7.61% - 2030 G-Sec SOV 25.47%
7.88% - 2030 G-Sec SOV 10.73%
7.59% - 2029 G-Sec SOV 5.81%
7.72% - 2025 G-Sec SOV 2.03%
8.32% - 2032 G-Sec SOV 1.37%
State Government Bond 37.87%
8.21% Haryana UDAY BOND - 2023 SOV 4.81%
7.59% Karnataka SDL - 2027 SOV 4.65%
8.39% Rajasthan UDAY BOND - 2023 SOV 3.72%
8.39% Rajasthan UDAY BOND- 2022 SOV 3.54%
8.21% Haryana UDAY BOND - 2022 SOV 3.20%
8.64% Uttar Pradesh UDAY BOND - 2023 SOV 2.70%
8.21% Rajasthan UDAY BOND - 2023 SOV 1.60%
8.25% Uttar Pradesh UDAY BOND - 2023 SOV 1.45%
7.76% Madhya Pradesh SDL - 2027 SOV 1.35%
8.44% Uttar Pradesh UDAY BOND - 2023 SOV 1.22%
7.71% Gujarath SDL - 2027 SOV 1.18%
7.63% Telangana UDAY BOND - 2023 SOV 1.16%
7.67% Tamilnadu UDAY BOND - 2023 SOV 1.01%
7.63% Gujarat SDL - 2027 SOV 0.94%
7.59% Haryana SDL - 2027 SOV 0.94%
Performance TableScheme Name CAGR Returns (%) Current Value of Investment of ` 10,000
1 Year 3 Years 5 YearsSince
Inception1 Year 3 Years 5 Years
SinceInception
IDFC Super Saver Income Fund - Investment Plan - Regular Plan - Growth*
13.13% 11.09% 9.77% 8.73% 11,313 13,712 15,948 41,392
CRISIL Composite Bond Fund Index# 11.47% 10.91% 9.58% NA 11,147 13,646 15,804 NA
10 Year GOI## 11.69% 11.15% 8.46% NA 11,169 13,736 15,017 NA
IDFC Super Saver Income Fund - Investment Plan - Direct Plan - Growth$
14.32% 12.04% NA 10.34% 11,432 14,068 NA 15,563
CRISIL Composite Bond Fund Index# 11.47% 10.91% NA 9.52% 11,147 13,646 NA 15,050
10 Year GOI## 11.69% 11.15% NA 8.20% 11,169 13,736 NA 14,251
The fund is being managed by Mr. Suyash Choudhary (Since 15th October 2010)Performance based on NAV as on 30/06/2017. Past performance may or may not be sustained in future.Regular and Direct Plans have different expense structure. Direct Plan shall have a lower expense ratio excluding distribution expenses, commission expenses etc.For other funds managed by the fund manager, please refer page no. 34 - 36 & the respective fund pages#Benchmark Returns. ##Alternate Benchmark Returns. *Since Inception Regular Plan - Growth Jul 14, 2000. $Since Inception Direct Plan - Growth Jan 01, 2013.
Name Rating % of NAV
7.51% Maharashtra SDL - 2027 SOV 0.94%
7.6% Madhya Pradesh SDL - 2027 SOV 0.71%
7.52% Gujarat SDL - 2027 SOV 0.55%
8.51% Uttar Pradesh UDAY BOND - 2023 SOV 0.49%
7.64% Haryana SDL - 2027 SOV 0.47%
7.68% Madhya Pradesh UDAY BOND - 2023
SOV 0.41%
8.47% Maharashtra SDL - 2026 SOV 0.26%
8.52% Uttar Pradesh UDAY BOND - 2022 SOV 0.24%
7.73% Rajasthan SDL - 2027 SOV 0.24%
8.36% Maharashtra SDL - 2026 SOV 0.12%
Corporate Bond 14.17%
Indian Railway Finance Corp AAA 7.31%
NTPC AAA 3.85%
Power Grid Corporation of India AAA 0.83%
Power Finance Corporation AAA 0.79%
Rural Electrification Corporation AAA 0.78%
National Bank For Agriculture and Rural Development
AAA 0.39%
Export Import Bank of India AAA 0.23%
Net Cash and Cash Equivalent 2.55%
Grand Total 100.00%
Riskometer
Investors understand that theirprincipal will be at Moderate risk
This product is suitable for investors who are seeking*:
To generate long term optimal returns by active •management. Investments in high quality money market & •debt instruments including G-Sec securities.
*Investors should consult their financial advisers if in doubt about whether the product is suitable for them.

31
IDFC Dynamic Bond FundAn Open Ended Income Fund
30th June 2017
FUND FEATURES PORTFOLIO
About the Fund: The fund is positioned in the income fund category to take exposure across the curve depending upon the fund manager’s underlying interest rate view where we employ the majority of the portfolio. It is a wide structure and conceptually can go anywhere on the curve. The fund plays the trade of the season which we think will sustain for a longer period of time.
Nature: Debt
Monthly Avg AUM: ` 4,294.33 Crores
Month end AUM: ` 4264.87 Crores
Inception Date: 25 June 2002
Fund Manager: Mr. Suyash Choudhary (Since 15th October 2010)
Other Parameter:
Standard Deviation (Annualized) 6.06%
Modified Duration 6.69 years
Average Maturity 10.17 years
Yield to Maturity 7.26%
Asset Quality
AAA Equivalent 100.00%
Expense Ratio
Regular 1.58%
Direct 0.78%
Benchmark: CRISIL Composite Bond Fund Index
SIP (Minimum Amount): ` 1000/-
SIP Frequency: Monthly
SIP Dates (Monthly): Any day of the month, except 29th, 30th & 31st day of the month
Investment Objective: Refer Pg No from 41 to 42
Minimum Investment Amount: ` 5,000/- and any amount thereafter
Option Available: Growth, Dividend - Quarterly (March, June, September & December), Half Yearly, Annual, Regular & Periodic
Exit Load: Nil (w.e.f. 17th October 2016)
NAV (`)
Plan Option Freq NAVRegular Plan Growth - 20.6353Regular Plan Dividend - 10.5846Regular Plan Dividend Quarterly 10.8328Regular Plan Dividend Annual 10.9492Regular Plan Dividend Half
Yearly10.7420
Regular Plan Dividend Periodic 13.4482Direct Plan Growth - 21.4852Direct Plan Dividend - 12.7533Direct Plan Dividend Quarterly 12.5736Direct Plan Dividend Annual 11.4174Direct Plan Dividend Half
Yearly10.8761
Direct Plan Dividend Periodic 13.8866
Name Rating % of NAV
Government Bond 48.35%
7.61% - 2030 G-Sec SOV 26.64%
7.88% - 2030 G-Sec SOV 11.89%
7.59% - 2029 G-Sec SOV 6.82%
7.72% - 2025 G-Sec SOV 1.97%
8.32% - 2032 G-Sec SOV 0.91%
8.12% - 2020 G-Sec SOV 0.07%
6.35% - 2020 G-Sec SOV 0.05%
State Government Bond 36.69%
8.21% Haryana UDAY BOND - 2023 SOV 5.24%
7.59% Karnataka SDL - 2027 SOV 4.68%
8.39% Rajasthan UDAY BOND - 2023 SOV 4.07%
8.21% Haryana UDAY BOND - 2022 SOV 3.27%
8.64% Uttar Pradesh UDAY BOND - 2023 SOV 2.90%
8.21% Rajasthan UDAY BOND - 2023 SOV 1.58%
8.25% Uttar Pradesh UDAY BOND - 2023 SOV 1.56%
7.71% Gujarath SDL - 2027 SOV 1.49%
8.44% Uttar Pradesh UDAY BOND - 2023 SOV 1.26%
8.39% Rajasthan UDAY BOND- 2022 SOV 1.25%
7.63% Telangana UDAY BOND - 2023 SOV 1.12%
7.63% Gujarat SDL - 2027 SOV 1.03%
7.67% Tamilnadu UDAY BOND - 2023 SOV 1.00%
7.59% Haryana SDL - 2027 SOV 0.90%
Performance TableScheme Name CAGR Returns (%) Current Value of Investment of ` 10,000
1 Year 3 Years 5 YearsSince
Inception1 Year 3 Years 5 Years
SinceInception
IDFC Dynamic Bond Fund - Regular Plan - Growth*
13.35% 11.32% 9.97% 8.81% 11,335 13,801 16,090 20,635
CRISIL Composite Bond Fund Index# 11.47% 10.91% 9.58% 8.51% 11,147 13,646 15,804 20,151
10 Year GOI## 11.69% 11.15% 8.46% 6.30% 11,169 13,736 15,017 16,893
IDFC Dynamic Bond Fund - Direct - Plan - Growth$
14.34% 12.33% NA 10.61% 11,434 14,178 NA 15,735
CRISIL Composite Bond Fund Index# 11.47% 10.91% NA 9.52% 11,147 13,646 NA 15,050
10 Year GOI## 11.69% 11.15% NA 8.20% 11,169 13,736 NA 14,251
The fund is being managed by Mr. Suyash Choudhary (Since 15th October 2010)Performance based on NAV as on 30/06/2017. Past performance may or may not be sustained in future.Regular and Direct Plans have different expense structure. Direct Plan shall have a lower expense ratio excluding distribution expenses, commission expenses etc.For other funds managed by the fund manager, please refer page no. 34 - 36 & the respective fund pages#Benchmark Returns. ##Alternate Benchmark Returns. *Since Inception Regular Plan - Growth Dec 03, 2008. $Since Inception Direct Plan - Growth Jan 01, 2013.
Name Rating % of NAV
7.51% Maharashtra SDL - 2027 SOV 0.90%
7.6% Madhya Pradesh SDL - 2027 SOV 0.74%
7.52% Gujarat SDL - 2027 SOV 0.66%
8.36% Maharashtra SDL - 2026 SOV 0.57%
8.51% Uttar Pradesh UDAY BOND - 2023 SOV 0.56%
7.64% Haryana SDL - 2027 SOV 0.45%
7.68% Madhya Pradesh UDAY BOND - 2023
SOV 0.42%
7.73% Rajasthan SDL - 2027 SOV 0.29%
8.52% Uttar Pradesh UDAY BOND - 2022 SOV 0.29%
8.47% Maharashtra SDL - 2026 SOV 0.26%
7.76% Madhya Pradesh SDL - 2027 SOV 0.08%
7.99% Uttar Pradesh SDL - 2026 SOV 0.06%
8.07% Rajasthan SDL - 2026 SOV 0.03%
7.98% Haryana SDL - 2026 SOV 0.02%
Corporate Bond 12.51%
Indian Railway Finance Corp AAA 4.78%
NTPC AAA 4.68%
National Bank For Agriculture and Rural Development
AAA 1.31%
Rural Electrification Corporation AAA 0.83%
Power Grid Corporation of India AAA 0.75%
Export Import Bank of India AAA 0.17%
Net Cash and Cash Equivalent 2.45%
Grand Total 100.00%
Riskometer
Investors understand that theirprincipal will be at Moderate risk
This product is suitable for investors who are seeking*:
To generate long term optimal returns by active •management.Investments in high quality money market & •debt instruments including G-Sec securities.
*Investors should consult their financial advisers if in doubt about whether the product is suitable for them.

32
PORTFOLIOName Rating % of NAV
Government Bond 73.68%
7.88% - 2030 G-Sec SOV 30.92%
7.61% - 2030 G-Sec SOV 21.24%
7.59% - 2029 G-Sec SOV 12.29%
7.50% - 2034 G-Sec SOV 5.23%
8.24% - 2033 G-Sec SOV 4.01%
State Government Bond 23.56%
7.71% Gujarath SDL - 2027 SOV 6.16%
7.84% Maharashtra SDL - 2026 SOV 4.96%
8.27% Tamilnadu SDL - 2026 SOV 4.24%
Name Rating % of NAV
7.59% Karnataka SDL - 2027 SOV 3.77%
7.63% Gujarat SDL - 2027 SOV 3.07%
8.21% Haryana UDAY BOND - 2022 SOV 0.42%
8.52% Uttar Pradesh UDAY BOND - 2022 SOV 0.32%
7.68% Madhya Pradesh UDAY BOND - 2023 SOV 0.31%
8.47% Maharashtra SDL - 2026 SOV 0.21%
8.36% Maharashtra SDL - 2026 SOV 0.11%
Net Cash and Cash Equivalent 2.76%
Grand Total 100.00%
FUND FEATURES
About the Fund: A dedicated gilt fund with an objective to generate optimal returns with high liquidity by investing in Government Securities.
Nature: Debt | Monthly Avg AUM: ` 99.30 Crores | Month end AUM: ` 99.62 Crores
Inception Date: 29 March 2004 | Fund Manager: Mr. Suyash Choudhary (Since 15th October 2010)
Other Parameter Asset Quality Expense Ratio
Standard Deviation (Annualized) 6.66% Sovereign 100.00% Regular 0.76%Modified Duration 7.61 years Direct 0.27%Average Maturity 12.05 yearsYield to Maturity 7.21%
Benchmark: I-Sec Composite Index | SIP (Minimum Amount): ` 100/- | SIP Frequency: Monthly | SIP Dates (Monthly): Any day of the month, except 29th, 30th & 31st day of the month | Investment Objective: Refer Pg No from 41 to 42 | Minimum Investment Amount: ` 100/- and any amount thereafter | Option Available: Growth, Dividend - Quarterly, Annual & Periodic | Exit Load: Nil (w.e.f. 11th December 2014). Yields for GSec/SDLs have been annualized wherever applicable.
NAV (`)
Plan Regular Plan Regular Plan Regular Plan Regular Plan Direct Plan Direct Plan Direct Plan Direct Plan
Option Growth Dividend Dividend Dividend Growth Dividend Dividend Dividend
Freq - Quarterly Annual Periodic - Quarterly Annual Periodic
NAV 30.1432 12.1514 11.5769 14.0846 30.8591 12.5300 12.8219 13.7455
Riskometer
Investors understand that theirprincipal will be at Moderate risk
This product is suitable for investors who are seeking*:
To generate optimal returns over •short to medium term.Investments in Government •Securities and Treasury Bills.
*Investors should consult their financial advisers if in doubt about whether the product is suitable for them.
Performance TableScheme Name CAGR Returns (%) Current Value of Investment of ` 10,000
1 Year 3 Years 5 Years Since Inception 1 Year 3 Years 5 Years Since InceptionIDFC Government Securities Fund – STP - Regular Plan - Growth*
9.48% 9.96% 10.27% 5.99% 10,948 13,299 16,312 24,397
I-Sec Si-BEX# 8.03% 8.76% 8.52% NA 10,803 12,869 15,056 NACRISIL 1 Year T-Bill## 6.53% 7.57% 7.36% 5.96% 10,653 12,451 14,266 24,292IDFC Government Securities Fund – STP - Direct Plan - Growth$ 9.65% 10.12% NA 10.39% 10,965 13,357 NA 15,593
I-Sec Si-BEX# 8.03% 8.76% NA 8.44% 10,803 12,869 NA 14,397CRISIL 1 Year T-Bill## 6.53% 7.57% NA 7.28% 10,653 12,451 NA 13,717The fund is being managed by Mr. Harshal Joshi (w.e.f. 15th May 2017). Performance based on NAV as on 30/06/2017. Past performance may or may not be sustained in future. Regular and Direct Plans have different expense structure. Direct Plan shall have a lower expense ratio excluding distribution expenses, commission expenses etc. For other funds managed by the fund manager, please refer page no. 34 - 36 & the respective fund pages. #Benchmark Returns. ##Alternate Benchmark Returns. *Since Inception Regular Plan - Growth Mar 09, 2002. $Since Inception Direct Plan - Growth Jan 01, 2013.
`
IDFC Government Securities Fund – Short Term PlanAn Open Ended Dedicated Gilt Fund
30th June 2017
FUND FEATURES
About the Fund: The fund is a mix of government bonds, state development loans (SDLs), treasury bills and/or cash management bills. The fund will predominantly invest at the shorter end of the sovereign yield curve.
Nature: Debt | Monthly Avg AUM: ` 85.35 Crores | Month end AUM: ` 85.24 CroresInception Date: 9 March 2002 | Fund Manager: Mr. Harshal Joshi (w.e.f. 15th May 2017)
Other Parameter Asset Quality Expense Ratio
Standard Deviation (Annualized) 2.08% Sovereign 100.00% Regular 0.40%
Modified Duration 2.33 years Direct 0.35%
Average Maturity 2.91 years
Yield to Maturity 6.93%
Benchmark: I - Sec Si Bex (w.e.f. 30th November 2015) | SIP (Minimum Amount): ` 1,000/- | SIP Frequency: Monthly | SIP Dates (Monthly): Any day of the month, except 29th, 30th & 31st day of the month | Investment Objective: Refer Pg No from 41 to 42 | Minimum Investment Amount: ` 5,000/- and any amount thereafter | Option Available: Growth, Dividend - Weekly, Monthly, Quarterly & Periodic | Exit Load: Nil. Yields for GSec/SDLs have been annualized wherever applicable.
NAV (`)
PlanRegular
Plan Regular
Plan Regular
Plan Regular
Plan Direct Plan
Direct Plan
Direct Plan
Direct Plan
Direct Plan
Option Growth Dividend Dividend Dividend Growth Dividend Dividend Dividend Dividend
Freq - Quarterly Annual Periodic - Quarterly Annual Periodic Weekly
NAV 24.3970 10.6770 - 13.0753 24.5210 10.9404 - 13.0868 15.3343
PORTFOLIO
Name Rating % of NAV
State Government Bond 57.63%
8.21% Haryana UDAY BOND - 2022 SOV 18.24%
7.67% Tamilnadu UDAY BOND - 2023 SOV 14.66%
8.74% Karnataka SDL - 2022 SOV 12.42%
8.92% Tamil Nadu SDL - 2022 SOV 6.26%
8.39% Rajasthan UDAY BOND - 2020 SOV 6.06%
Government Bond 3.63%
8.12% - 2020 G-Sec SOV 2.46%
6.35% - 2020 G-Sec SOV 1.17%
Net Cash and Cash Equivalent 38.74%
Grand Total 100.00%
Riskometer
Investors understand that theirprincipal will be at Moderate risk
This product is suitable for investors who are seeking*:
To generate short to medium term •optimal returns. Investments in Government •Securities and Treasury Bills.
*Investors should consult their financial advisers if in doubt about whether the product is suitable for them.
IDFC Government Securities Fund – Provident Fund PlanAn Open Ended Dedicated Gilt Fund
30th June 2017

33
IDFC Government Securities Fund – Investment PlanAn Open Ended Dedicated Gilt Fund
30th June 2017
FUND FEATURES PORTFOLIO
About the Fund: A dedicated gilt fund with an objective to generate optimal returns with high liquidity by investing in Government Securities.
Nature: Debt
Monthly Avg AUM: ` 589.03 Crores
Month end AUM: ` 597.10 Crores
Inception Date: 9 March 2002
Fund Manager: Mr. Suyash Choudhary (Since 15th October 2010)
Other Parameter:
Standard Deviation (Annualized) 6.57%
Modified Duration 7.65 years
Average Maturity 12.07 years
Yield to Maturity 7.21%
Asset Quality
Sovereign 100.00%
Expense Ratio
Regular 1.43%
Direct 0.83%
Benchmark: I-Sec Composite Index
SIP (Minimum Amount): ` 1,000/-
SIP Frequency: Monthly
SIP Dates (Monthly): Any day of the month, except 29th, 30th & 31st day of the month
Investment Objective: Refer Pg No from 41 to 42
Minimum Investment Amount: ` 5,000/- and any amount thereafter
Option Available: Growth, Dividend - Quarterly, Half Yearly, Annual, Regular & Periodic
Exit Load: Nil (w.e.f. 15th July 2011)
NAV (`)
Plan Option Freq NAVRegular Plan Dividend - 10.6837Regular Plan Growth - 20.4879Regular Plan Dividend Quarterly 11.0344Regular Plan Dividend Annual 10.8752Regular Plan Dividend Half
Yearly11.1646
Regular Plan Dividend Periodic 13.8238Direct Plan Growth - 21.0912Direct Plan Dividend - 11.5209Direct Plan Dividend Quarterly 10.6972Direct Plan Dividend Annual 11.9026Direct Plan Dividend Periodic NA
Name Rating % of NAV
Government Bond 76.73%
7.88% - 2030 G-Sec SOV 31.74%
7.61% - 2030 G-Sec SOV 20.20%
7.59% - 2029 G-Sec SOV 16.35%
8.24% - 2033 G-Sec SOV 4.90%
8.32% - 2032 G-Sec SOV 3.54%
State Government Bond 21.09%
7.71% Gujarath SDL - 2027 SOV 5.49%
7.84% Maharashtra SDL - 2026 SOV 4.35%
7.59% Karnataka SDL - 2027 SOV 3.79%
8.27% Tamilnadu SDL - 2026 SOV 3.71%
Name Rating % of NAV
7.63% Gujarat SDL - 2027 SOV 2.90%
8.52% Uttar Pradesh UDAY BOND - 2022 SOV 0.30%
8.47% Maharashtra SDL - 2026 SOV 0.23%
7.68% Madhya Pradesh UDAY BOND - 2023
SOV 0.20%
8.36% Maharashtra SDL - 2026 SOV 0.11%
8.21% Haryana UDAY BOND - 2022 SOV 0.02%
Net Cash and Cash Equivalent 2.18%
Grand Total 100.00%
Riskometer
Investors understand that theirprincipal will be at Moderate risk
This product is suitable for investors who are seeking*:
To generate long term optimal returns. •Investments in Government Securities and •Treasury Bills.
*Investors should consult their financial advisers if in doubt about whether the product is suitable for them.
Performance TableScheme Name CAGR Returns (%) Current Value of Investment of ` 10,000
1 Year 3 Years 5 YearsSince
Inception1 Year 3 Years 5 Years
SinceInception
IDFC Government Securities Fund – IP - Regular Plan - Growth*
14.46% 11.85% 10.72% 8.72% 11,446 13,997 16,647 20,488
I-Sec Composite Index# 11.04% 11.17% 9.88% 8.47% 11,104 13,745 16,025 20,081
CRISIL 10 Year GOI## 11.69% 11.15% 8.46% 6.30% 11,169 13,736 15,017 16,893
IDFC Government Securities Fund – IP - Direct Plan - Growth$
15.06% 12.63% NA 11.10% 11,506 14,294 NA 16,050
I-Sec Composite Index# 11.04% 11.17% NA 9.72% 11,104 13,745 NA 15,172
CRISIL 10 Year GOI## 11.69% 11.15% NA 8.20% 11,169 13,736 NA 14,251
The fund is being managed by Mr. Suyash Choudhary (Since 15th October 2010)Performance based on NAV as on 30/06/2017. Past performance may or may not be sustained in future.Regular and Direct Plans have different expense structure. Direct Plan shall have a lower expense ratio excluding distribution expenses, commission expenses etc.For other funds managed by the fund manager, please refer page no. 34 - 36 & the respective fund pages#Benchmark Returns. ##Alternate Benchmark Returns. *Since Inception Regular Plan - Growth Dec 03, 2008. $Since Inception Direct Plan - Growth Jan 01, 2013.
IDFC Government Securities Fund – Provident Fund PlanAn Open Ended Dedicated Gilt Fund
30th June 2017
Performance Table
Scheme Name CAGR Returns (%) Current Value of Investment of ` 10,000
1 Year 3 Years 5 Years Since Inception 1 Year 3 Years 5 Years Since Inception
IDFC Government Securities Fund - PF Plan - Regular Plan - Growth* 15.36% 12.69% 11.18% 8.68% 11,536 14,316 16,999 30,143
I-Sec Composite Index# 11.04% 11.17% 9.88% 7.67% 11,104 13,745 16,025 26,646
10 Year GOI## 11.69% 11.15% 8.46% 5.80% 11,169 13,736 15,017 21,126
IDFC Government Securities Fund - PF Plan - Direct Plan - Growth$ 15.76% 13.23% NA 11.54% 11,576 14,522 NA 16,338
I-Sec Composite Index# 11.04% 11.17% NA 9.72% 11,104 13,745 NA 15,172
10 Year GOI## 11.69% 11.15% NA 8.20% 11,169 13,736 NA 14,251
The fund is being managed by Mr. Suyash Choudhary (Since 15th October 2010). Performance based on NAV as on 30/06/2017. Past performance may or may not be sustained in future. Regular and Direct Plans have different expense structure. Direct Plan shall have a lower expense ratio excluding distribution expenses, commission expenses etc. For other funds managed by the fund manager, please refer page no. 34 - 36 & the respective fund pages. #Benchmark Returns. ##Alternate Benchmark Returns. *Since Inception Regular Plan - Growth Mar 29, 2004. $Since Inception Direct Plan - Growth Jan 01, 2013.

34
Period 1 Year 3 Years 5 Years
ManagingSince
BenchmarkIndex
SchemeReturn (%)
BenchmarkReturn (%)
SchemeReturn (%)
BenchmarkReturn (%)
SchemeReturn (%)
BenchmarkReturn (%)
Fund Manager Name: Mr. Anoop Bhaskar
IDFC Classic Equity Fund 30-04-2016 S&P BSE 200 25.46% 18.08% 14.71% 9.91% 16.96% 14.16%
IDFC Premier Equity Fund 30-04-2016 S&P BSE 500 16.57% 19.48% 15.61% 10.40% 21.08% 14.53%
IDFC Sterling Equity Fund 30-04-2016 Nifty Free Float Midcap 100 33.95% 28.32% 18.45% 16.89% 21.00% 19.23%
Mr. Anoop Bhaskar manages 4 schemes of IDFC Mutual Fund.
Fund Manager Name: Mr. Anurag Mittal
IDFC Monthly Income Plan 09-11-2015 CRISIL MIP Blended Index 12.10% 12.07% 10.45% 10.56% 11.25% 10.15%
IDFC Cash Fund 09-11-2015 CRISIL Liquid Fund Index 6.83% 6.86% 7.90% 7.83% 8.41% 8.25%
IDFC Ultra Short Term Fund 09-11-2015 CRISIL Liquid Fund Index 8.24% 6.86% 8.61% 7.83% 8.98% 8.25%
IDFC Money Manager Fund – Treasury Plan
09-11-2015 CRISIL Liquid Fund Index 7.41% 6.86% 7.98% 7.83% 8.17% 8.25%
IDFC Banking & PSU Debt Fund 01-08-2014 CRISIL Short Term Bond Fund Index
6.60% 6.76% 7.94% 7.80% NA NA
IDFC Corporate Bond Fund 12-01-2016 CRISIL Short Term Bond Fund Index
9.54% 8.88% NA NA NA NA
Mr. Anurag Mittal manages 6 schemes of IDFC Mutual Fund.
Fund Manager Name: Mr. Arpit Kapoor
IDFC Equity Fund 01-03-2017 S&P BSE 100 19.83% 14.68% 8.82% 7.68% 13.18% 12.47%
IDFC Dynamic Equity Fund 01-03-2017 CRISIL Balanced Fund – Aggressive Index
8.05% 13.85% NA NA NA NA
IDFC Nifty Fund 01-03-2017 Nifty 50 15.47% 14.88% 8.58% 7.74% 13.33% 12.50%
IDFC Arbitrage Fund 01-03-2017 CRISIL Liquid Fund Index 6.14% 6.86% 6.81% 7.83% 7.66% 8.25%
IDFC Arbitrage Plus Fund 01-03-2017 CRISIL Liquid Fund Index 6.44% 6.86% 6.69% 7.83% 7.43% 8.25%
Mr. Arpit Kapoor manages 5 schemes of IDFC Mutual Fund.
Fund Manager Name: Mr. Arvind Subramanian
IDFC Dynamic Equity Fund 09-11-2015 CRISIL Balanced Fund – Aggressive Index
8.05% 13.85% NA NA NA NA
Mr. Arvind Subramanian manages 2 schemes of IDFC Mutual Fund.
Fund Manager Name: Mr. Bhavin Patadia
IDFC Asset Allocation Fund of Fund - Aggressive Plan
01-03-2017 CRISIL Balanced Fund – Aggressive Index
14.16% 13.85% 11.07% 9.08% 12.34% 11.73%
IDFC Asset Allocation Fund of Fund - Conservative Plan
01-03-2017 CRISIL MIP Blended Index 11.61% 12.07% 10.16% 10.56% 10.48% 10.15%
IDFC Asset Allocation Fund of Fund - Moderate Plan
01-03-2017 CRISIL MIP Blended Index 12.49% 12.07% 10.72% 10.56% 11.41% 10.15%
Mr. Bhavin Patadia manages 3 schemes of IDFC Mutual Fund.
Fund Manager Name: Mr. Daylynn Pinto
IDFC Tax Advantage (ELSS) Fund
20-10-2016 S&P BSE 200 26.87% 18.08% 17.14% 9.91% 21.55% 14.16%
IDFC Sterling Equity Fund 20-10-2016 Nifty Free Float Midcap 100 33.95% 28.32% 18.45% 16.89% 21.00% 19.23%
Mr. Daylynn Pinto manages 2 schemes of IDFC Mutual Fund.
Fund Manager Name: Mr. Harshal Joshi
IDFC Arbitrage Fund 15-07-2016 CRISIL Liquid Fund Index 6.14% 6.86% 6.81% 7.83% 7.66% 8.25%
IDFC Arbitrage Plus Fund 15-07-2016 CRISIL Liquid Fund Index 6.44% 6.86% 6.69% 7.83% 7.43% 8.25%
IDFC All Seasons Bond Fund 15-07-2016 CRISIL Short-Term Bond Fund Index
8.65% 8.88% 8.81% 9.12% 8.76% 9.09%
IDFC Government Securities Fund – Short Term Plan
15-10-2010 I-Sec Si-BEX 9.48% 8.03% 9.96% 8.76% 10.27% 8.52%
IDFC Cash Fund 15-09-2015 CRISIL Liquid Fund Index 6.83% 6.86% 7.90% 7.83% 8.41% 8.25%
IDFC Money Manager Fund – Tresury Plan
09-11-2015 Crisil Liquid Fund Index 7.41% 6.86% 7.98% 7.83% 8.17% 8.25%
IDFC Money Manager Fund – Investment Plan
15-09-2015 CRISIL AAA Short Term Bond Index
8.24% 8.56% 8.50% 8.95% 8.67% 9.21%
Performance based on NAV as on 30/06/2017. Past Performance may or may not be sustained in futureRegular and Direct plans have different expense structure. Direct Plan shall have a lower expense ratio excluding distribution expenses, commission expenses, etc. The performance details provided herein are of regular plan.
Performance Table (Others Funds Managed by the Fund Managers)

35
Period 1 Year 3 Years 5 Years
ManagingSince
BenchmarkIndex
SchemeReturn (%)
BenchmarkReturn (%)
SchemeReturn (%)
BenchmarkReturn (%)
SchemeReturn (%)
BenchmarkReturn (%)
IDFC Yearly Series Interval Fund - Series II - Direct Plan - Growth
12-02-2013 CRISIL Short-Term Bond Fund Index
6.82% 8.88% 8.25% 9.12% NA NA
IDFC Fixed Term Plan - Series 27 - Growth
21-08-2013 CRISIL Short-Term Bond Fund Index
6.70% 8.88% 8.16% 9.12% NA NA
IDFC Fixed Term Plan - Series 27 - Direct Plan - Growth
21-08-2013 CRISIL Short-Term Bond Fund Index
6.80% 8.88% 8.27% 9.12% NA 9.09%
IDFC Fixed Term Plan - Series ^66 - Growth
23-01-2014 CRISIL Composite Bond Fund Index
7.53% 11.47% 8.03% 10.05% NA NA
IDFC Fixed Term Plan - Series ^66 - Direct Plan - Growth
23-01-2014 CRISIL Composite Bond Fund Index
7.89% 11.47% 8.44% 10.05% NA NA
^IDFC Fixed Term Plan - Series 70 - Growth
07-02-2014 CRISIL Composite Bond Fund Index
7.42% 11.47% 7.95% 10.05% NA NA
^IDFC Fixed Term Plan - Series 70 - Direct Plan - Growth
07-02-2014 CRISIL Composite Bond Fund Index
7.74% 11.47% 8.36% 10.05% NA NA
^IDFC Fixed Term Plan - Series 74 - Growth
21-02-2014 CRISIL Composite Bond Fund Index
7.59% 11.47% 8.11% 10.05% NA NA
^IDFC Fixed Term Plan - Series 74 - Direct Plan - Growth
21-02-2014 CRISIL Composite Bond Fund Index
7.93% 11.47% 8.51% 10.05% NA NA
^IDFC Fixed Term Plan - Series 75 - Growth
26-02-2014 CRISIL Composite Bond Fund Index
7.57% 11.47% 8.09% 10.05% NA NA
^IDFC Fixed Term Plan - Series 75 - Direct Plan - Growth
26-02-2014 CRISIL Composite Bond Fund Index
7.89% 11.47% 8.48% 10.05% NA NA
^IDFC Fixed Term Plan - Series 77 - Growth
05-03-2014 CRISIL Composite Bond Fund Index
7.60% 11.47% 8.20% 10.05% NA NA
^IDFC Fixed Term Plan - Series 77 - Direct Plan - Growth
05-03-2014 CRISIL Composite Bond Fund Index
7.91% 11.47% 8.49% 10.05% NA NA
IDFC Fixed Term Plan - Series 78 - Growth
11-03-2014 CRISIL Short-Term Bond Fund Index
7.56% 8.88% 8.28% 9.12% NA NA
IDFC Fixed Term Plan - Series 78 - Direct Plan - Growth
11-03-2014 CRISIL Short-Term Bond Fund Index
7.73% 8.88% 8.47% 9.12% NA NA
^IDFC Fixed Term Plan - Series 79 - Growth
14-03-2014 CRISIL Composite Bond Fund Index
7.59% 11.47% 8.12% 10.05% NA NA
^IDFC Fixed Term Plan - Series 79 - Direct Plan - Growth
14-03-2014 CRISIL Composite Bond Fund Index
7.90% 11.47% 8.51% 10.05% NA NA
^^IDFC Fixed Term Plan - Series 84 - Growth
12-03-2014 CRISIL Composite Bond Fund Index
7.55% 11.47% 8.11% 9.98% NA NA
^^IDFC Fixed Term Plan - Series 84 - Direct Plan - Growth
12-03-2014 CRISIL Composite Bond Fund Index
7.87% 11.47% 8.41% 9.98% NA NA
^^IDFC Fixed Term Plan - Series 86 - Growth
19-03-2014 CRISIL Composite Bond Fund Index
7.52% 11.47% 8.03% 9.98% NA NA
^^IDFC Fixed Term Plan - Series 86 - Direct Plan - Growth
19-03-2014 CRISIL Composite Bond Fund Index
7.84% 11.47% 8.38% 9.98% NA NA
^^IDFC Fixed Term Plan - Series 88 - Growth
26-03-2014 CRISIL Composite Bond Fund Index
7.64% 11.47% 8.22% 9.98% NA NA
^^IDFC Fixed Term Plan - Series 88 - Direct Plan - Growth
26-03-2014 CRISIL Composite Bond Fund Index
7.96% 11.47% 8.49% 9.98% NA NA
^^^IDFC Fixed Term Plan - Series 91 - Growth
16-04-2014 CRISIL Composite Bond Fund Index
7.84% 11.47% 8.35% 10.06% NA NA
^^^IDFC Fixed Term Plan - Series 91 - Direct Plan - Growth
16-04-2014 CRISIL Composite Bond Fund Index
7.94% 11.47% 8.48% 10.06% NA NA
IDFC Fixed Term Plan - Series 97 - Growth
03-06-2014 CRISIL Short-Term Bond Fund Index
6.56% 8.88% 7.92% 9.12% NA NA
IDFC Fixed Term Plan - Series 97 - Direct Plan - Growth
03-06-2014 CRISIL Short-Term Bond Fund Index
7.00% 8.88% 8.20% 9.12% NA NA
IDFC Fixed Term Plan - Series 99 - Growth
12-06-2014 CRISIL Short-Term Bond Fund Index
7.00% 8.88% 8.02% 9.12% NA NA
IDFC Fixed Term Plan - Series 99 - Direct Plan - Growth
12-06-2014 CRISIL Short-Term Bond Fund Index
7.10% 8.88% 8.16% 9.12% NA NA
Performance based on NAV as on 30/06/2017. Past Performance may or may not be sustained in futureRegular and Direct plans have different expense structure. Direct Plan shall have a lower expense ratio excluding distribution expenses, commission expenses, etc. The performance details provided herein are of regular plan. ^ Current Index performance adjusted for the period from since inception to April 8, 2015 with the performance of Crisil Short Term Bond fund index (Benchmark) & 1 year T Bill Index (Alternate Benchmark). ^^ Current Index performance adjusted for the period from since inception to April 6, 2015 with th e performance of Crisil Short Term Bond fund index (Benchmark) & 1 year T Bill Index (Alternate Benchmark) . ^^^Current Index performance adjusted for the period from since inception to April 20, 2015 with the performance of Crisil Short Term Bond fund index (Benchmark) & 1 year T Bill Index (Alternate Benchmark)
Performance Table (Others Funds Managed by the Fund Managers)

36
Period 1 Year 3 Years 5 Years
ManagingSince
BenchmarkIndex
SchemeReturn (%)
BenchmarkReturn (%)
SchemeReturn (%)
BenchmarkReturn (%)
SchemeReturn (%)
BenchmarkReturn (%)
IDFC Fixed Term Plan - Series 108 - Growth
08-05-2015 CRISIL Composite Bond Fund Index
6.89% 11.47% NA NA NA NA
IDFC Fixed Term Plan - Series 108 - Direct Plan - Growth
08-05-2015 CRISIL Composite Bond Fund Index
6.89% 11.47% NA NA NA NA
Mr. Harshal Joshi manages 43 schemes of IDFC Mutual Fund.
Fund Manager Name: Mr. Rajendra Kumar Mishra
IDFC Infrastructure Fund 27-06-2013 Nifty Infrastructure 44.01% 12.50% 15.37% -1.72% 13.26% 5.78%
Mr. Rajendra Kumar Mishra manages 1 scheme of IDFC Mutual Fund.
Fund Manager Name: Mr. Sumit Agrawal
IDFC Equity Fund 01-03-2017 S&P BSE 100 19.83% 14.68% 8.82% 7.68% 13.18% 12.47%
IDFC Dynamic Equity Fund 01-03-2017 CRISIL Balanced Fund – Aggressive Index
8.05% 13.85% NA NA NA NA
IDFC Nifty Fund 01-03-2017 Nifty 50 15.47% 14.88% 8.58% 7.74% 13.33% 12.50%
IDFC Focused Equity Fund 20-10-2016 Nifty 50 31.12% 14.88% 11.76% 7.74% 13.84% 12.50%
IDFC Monthly Income Plan 20-10-2016 CRISIL MIP Blended Index 12.10% 12.07% 10.45% 10.56% 11.25% 10.15%
Mr. Sumit Agrawal manages 5 schemes of IDFC Mutual Fund.
Fund Manager Name: Mr. Suyash Choudhary
IDFC Super Saver Income Fund – Short Term
11-03-2011 CRISIL AAA Short Term Bond Index
8.03% 8.56% 8.48% 8.95% 8.61% 9.21%
IDFC Super Saver Income Fund – Medium Term
15-09-2015 CRISIL Short-Term Bond Fund Index
9.27% 8.88% 9.06% 9.12% 8.60% 9.09%
IDFC Super Saver Income Fund – Investment Plan
15-10-2010 CRISIL Composite Bond Fund Index
13.13% 11.47% 11.09% 10.91% 9.77% 9.58%
IDFC Dynamic Bond Fund 15-10-2010 CRISIL Composite Bond Fund Index
13.35% 11.47% 11.32% 10.91% 9.97% 9.58%
IDFC Government Securities Fund – Investment Plan
15-10-2010 I-Sec Composite Index 14.46% 11.04% 11.85% 11.17% 10.72% 9.88%
IDFC Government Securities Fund – Provident Fund Plan
15-10-2010 I-Sec Composite Index 15.36% 11.04% 12.69% 11.17% 11.18% 9.88%
Mr. Suyash Choudhary manages 7 schemes of IDFC Mutual Fund.
Fund Manager Name: Mr. Yogik Pitti
IDFC Arbitrage Fund 27-06-2013 CRISIL Liquid Fund Index 6.14% 6.86% 6.81% 7.83% 7.66% 8.25%
IDFC Arbitrage Plus Fund 27-06-2013 CRISIL Liquid Fund Index 6.44% 6.86% 6.69% 7.83% 7.43% 8.25%
Mr. Yogik Pitti manages 4 schemes of IDFC Mutual Fund.Performance based on NAV as on 30/06/2017. Past Performance may or may not be sustained in futureRegular and Direct plans have different expense structure. Direct Plan shall have a lower expense ratio excluding distribution expenses, commission expenses, etc. The performance details provided herein are of regular plan.
Performance Table (Others Funds Managed by the Fund Managers)
ICRA Credit Risk Rating
IDFC MMF-TP, IDFC MMF-IP, IDFC SSIF-ST, SSIF-MT, IDFC CBF : “Credit Risk Rating AAAmfs” - The Fund carries the lowest credit risk, similar to that associated with long-term debt obligations rated in the highest credit- quality category.
IDFC CASH FUND, IDFC USTF: “Credit Risk Rating A1+mfs” - The highest-credit-quality short-term rating assigned by ICRA to debt funds. Debt funds rated in this category carry the lowest credit risk in the short term and are similar to that of fixed income obligations of highest credit- quality category with maturity of upto one year. This rating should however, not be construed as an indication of the performance of the Mutual Fund scheme or of volatility in its returns.
Source: ICRA Ltd.
CRISIL Credit Quality Rating
IDFC SSIF-IP, IDFC DBF: “CRISIL AAA mfs” - Schemes with this rating are considered to have the highest degree of safety regarding timely receipt of payments from the investments that they have made. The rating of CRISIL is not an opinion on the Asset Management Company’s willingness or ability to make timely payments to the investor. The rating is also not an opinion on the stability of the NAV of the Fund, which could vary with market developments.
CRISIL Credit Quality Rating Methodology
CRISIL’s credit quality ratings are based on the analysis of the credit risk of securities held by the fund. CRISIL has developed a Credit Quality Matrix to evaluate fund’s overall level of protection against losses associated with credit default. The matrix is a set of credit factors and credit scores derived scientifically from CRISIL’s rating default and transition rates. For details on closed ended funds, please refer the website www.idfcmf.com
FITCH Credit Quality Rating
IDFC Cash fund: “IND A1+ mfs” - Schemes with this rating are considered to have very strong degree of safety regarding timely receipt of payments from the investments that they have made.

37
IDFC All Seasons Bond Fund - Regular Plan - Growth 1 Year 3 Years 5 Years 7 Years 10 Years Since InceptionSep 13, 2004
Total Amount Invested (`) 1,20,000 3,60,000 6,00,000 8,40,000 12,00,000 15,40,000
Total Value as on June 30, 2017 (`) 1,24,816 4,08,762 7,47,300 11,43,510 18,38,766 26,63,246
Fund Returns (%) 7.62 8.46 8.74 8.68 8.28 8.15
Total Value of CRISIL Short Term Bond Fund Index# 1,24,990 4,10,907 7,53,250 11,56,193 18,67,841 26,86,814
CRISIL Short Term Bond Fund Index Returns (%)# 7.86 8.80 9.04 8.99 8.57 8.28
Total Value of CRISIL 1 Year T-Bill Index## 1,23,799 4,00,469 7,21,221 10,88,972 17,05,872 23,88,551
CRISIL 1 Year T-Bill Index Returns (%)## 5.96 7.06 7.30 7.31 6.84 6.58
SIP PerformanceMonthly SIP of `10,000
IDFC Cash Fund - Regular Plan - Growth 1 Year 3 Years 5 Years 7 Years 10 Years Since InceptionJun 04, 2008
Total Amount Invested (`) 1,20,000 3,60,000 6,00,000 8,40,000 NA 10,90,000
Total Value as on June 30, 2017 (`) 1,24,275 4,02,968 7,34,017 11,29,043 NA 15,96,058
Fund Returns (%) 6.71 7.47 8.00 8.32 NA 8.18
Total Value of Crisil Liquid Fund Index# 1,24,304 4,02,659 7,33,109 11,21,810 NA 15,76,581
Crisil Liquid Fund Index Returns (%)# 6.75 7.42 7.96 8.14 NA 7.92
Total Value of CRISIL 1 Year T-Bill Index## 1,23,825 4,00,525 7,21,280 10,89,085 NA 15,05,741
CRISIL 1 Year T-Bill Index Returns (%)## 5.99 7.06 7.31 7.31 NA 6.95
IDFC Ultra Short Term Fund - Regular Plan - Growth 1 Year 3 Years 5 Years 7 Years 10 Years Since InceptionJan 17, 2006
Total Amount Invested (`) 1,20,000 3,60,000 6,00,000 8,40,000 12,00,000 13,80,000
Total Value as on June 30, 2017 (`) 1,24,923 4,08,491 7,47,457 11,55,707 18,68,255 22,74,191
Fund Returns (%) 7.75 8.40 8.74 8.97 8.57 8.35
Total Value of Crisil Liquid Fund Index# 1,24,300 4,02,637 7,33,081 11,21,758 17,98,461 21,93,127
Crisil Liquid Fund Index Returns (%)# 6.76 7.42 7.96 8.14 7.85 7.76
Total Value of CRISIL 1 Year T-Bill Index## 1,23,799 4,00,469 7,21,221 10,88,974 17,05,972 20,56,097
CRISIL 1 Year T-Bill Index Returns (%)## 5.96 7.06 7.30 7.31 6.84 6.70
IDFC Money Manager Fund - Investment Plan - Regular Plan - Growth
1 Year 3 Years 5 Years 7 Years 10 Years Since InceptionAug 09, 2004
Total Amount Invested (`) 1,20,000 3,60,000 6,00,000 8,40,000 12,00,000 15,50,000
Total Value as on June 30, 2017 (`) 1,24,595 4,07,669 7,43,579 11,43,584 18,51,119 26,94,557
Fund Returns (%) 7.23 8.26 8.53 8.68 8.40 8.17
Total Value of CRISIL AAA Short Term Index# NA NA NA NA NA NA
CRISIL AAA Short Term Index Returns (%)# NA NA NA NA NA NA
Total Value of CRISIL 1 Year T-Bill Index## 1,23,799 4,00,469 7,21,221 10,88,972 17,05,872 24,09,947
CRISIL 1 Year T-Bill Index Returns (%)## 5.96 7.06 7.30 7.31 6.84 6.57
IDFC Money Manager Fund - Treasury Plan - Regular Plan - Growth
1 Year 3 Years 5 Years 7 Years 10 Years Since InceptionFeb 18, 2003
Total Amount Invested (`) 1,20,000 3,60,000 6,00,000 8,40,000 12,00,000 17,30,000
Total Value as on June 30, 2017 (`) 1,24,381 4,04,394 7,34,526 11,22,506 18,00,403 30,39,103
Fund Returns (%) 6.89 7.72 8.04 8.16 7.87 7.43
Total Value of Crisil Liquid Fund Index# 1,24,300 4,02,637 7,33,081 11,21,755 17,98,449 30,47,846
Crisil Liquid Fund Index Returns (%)# 6.76 7.42 7.96 8.14 7.85 7.46
Total Value of CRISIL 1 Year T-Bill Index## 1,23,799 4,00,469 7,21,221 10,88,972 17,05,928 28,07,767
CRISIL 1 Year T-Bill Index Returns (%)## 5.96 7.06 7.30 7.31 6.84 6.42
IDFC Banking & PSU Debt Fund - Regular Plan - Growth 1 Year 3 Years 5 Years 7 Years 10 Years Since InceptionMar 07, 2013
Total Amount Invested (`) 1,20,000 3,60,000 NA NA NA 5,20,000
Total Value as on June 30, 2017 (`) 1,23,922 4,02,740 NA NA NA 6,17,308
Fund Returns (%) 6.16 7.44 NA NA NA 7.88
Total Value of Crisil Short Term Bond Fund Index# 1,24,990 4,10,907 NA NA NA 6,32,906
Crisil Short Term Bond Fund Index Returns (%)# 7.86 8.80 NA NA NA 9.04
Total Value of CRISIL 1 Year T-Bill Index## 1,23,799 4,00,469 NA NA NA 6,09,725
CRISIL 1 Year T-Bill Index Returns (%)## 5.96 7.06 NA NA NA 7.30
IDFC Super Saver Income Fund - Short Term - Regular Plan - Growth
1 Year 3 Years 5 Years 7 Years 10 Years Since InceptionDec 14, 2000
Total Amount Invested (`) 1,20,000 3,60,000 6,00,000 8,40,000 12,00,000 19,90,000
Total Value as on June 30, 2017 (`) 1,24,555 4,06,668 7,41,778 11,37,965 18,44,549 40,08,368
Fund Returns (%) 7.16 8.10 8.43 8.54 8.33 7.91
Total Value of CRISIL AAA Short Term Index# NA NA NA NA NA NA
CRISIL AAA Short Term Index Returns (%)# NA NA NA NA NA NA
Total Value of CRISIL 1 Year T-Bill Index## 1,23,799 4,00,469 7,21,221 10,88,972 17,05,872 34,57,448
CRISIL 1 Year T-Bill Index Returns (%)## 5.96 7.06 7.30 7.31 6.84 6.31
Past performance may or may not be sustained in future.Dividends are assumed to be reinvested and bonus is adjusted. Load is not taken into consideration. To illustrate the advantages of SIP investment, this is how your investment would have grown if you had invested say `10,000 systematically on the first business Day of every month over a period of time. Returns are calculated by using XIRR approach. XIRR helps in calculating return on investment given an initial and final value and a series of cash inflows and outflows with the correct allowence for the time impact of the transactions. Regular and Direct plans have different expense structure. Direct Plan shall have a lower expense ratio excluding distribution expenses, commision expenses etc. #Benchmark Returns. ##Alternate Benchmark Returns. Data as on June 30, 2017.

38
IDFC Corporate Bond Fund - Regular Plan - Growth 1 Year 3 Years 5 Years 7 Years 10 Years Since InceptionJan 12, 2016
Total Amount Invested (`) 1,20,000 NA NA NA NA 1,80,000
Total Value as on June 30, 2017 (`) 1,24,887 NA NA NA NA 1,92,269
Fund Returns (%) 7.69 NA NA NA NA 8.68
Total Value of CRISIL Short Term Bond Fund Index# 1,24,990 NA NA NA NA 1,92,022
CRISIL Short Term Bond Fund Index Returns (%)# 7.86 NA NA NA NA 8.51
Total Value of CRISIL 1 Year T-Bill Index## 1,23,799 NA NA NA NA 1,88,989
CRISIL 1 Year T-Bill Index Returns (%)## 5.96 NA NA NA NA 6.36
IDFC Super Saver Income Fund - Medium Term Plan - Regular Plan - Growth
1 Year 3 Years 5 Years 7 Years 10 Years Since InceptionJuly 08, 2003
Total Amount Invested (`) 1,20,000 3,60,000 6,00,000 8,40,000 12,00,000 16,80,000
Total Value as on June 30, 2017 (`) 1,25,003 4,10,185 7,46,096 11,43,940 18,83,803 31,33,229
Fund Returns (%) 7.88 8.68 8.66 8.69 8.73 8.44
Total Value of CRISIL Short Term Bond Fund Index# 1,24,990 4,10,907 7,53,250 11,56,193 18,67,841 30,51,659
CRISIL Short Term Bond Fund Index Returns (%)# 7.86 8.80 9.04 8.99 8.57 8.09
Total Value of CRISIL 1 Year T-Bill Index## 1,23,799 4,00,469 7,21,221 10,88,972 17,05,872 26,94,089
CRISIL 1 Year T-Bill Index Returns (%)## 5.96 7.06 7.30 7.31 6.84 6.46
IDFC Super Saver Income Fund - Investment Plan - Regular Plan - Growth
1 Year 3 Years 5 Years 7 Years 10 Years Since InceptionJul 14, 2000
Total Amount Invested (`) 1,20,000 3,60,000 6,00,000 8,40,000 12,00,000 20,30,000
Total Value as on June 30, 2017 (`) 1,26,443 4,20,431 7,71,962 11,90,674 19,31,006 43,73,674
Fund Returns (%) 10.18 10.36 10.03 9.81 9.20 8.46
Total Value of CRISIL Composite Bond Fund Index# 1,25,737 4,20,729 7,75,183 11,85,550 18,99,038 NA
CRISIL Composite Bond Fund Index Returns (%)# 9.05 10.41 10.20 9.69 8.89 NA
Total Value of CRISIL 10 Year Gilt Index## 1,25,197 4,20,295 7,61,409 11,45,911 17,92,881 NA
CRISIL 10 Year Gilt Index Returns (%)## 8.19 10.34 9.48 8.73 7.79 NA
IDFC Dynamic Bond Fund - Regular Plan - Growth 1 Year 3 Years 5 Years 7 Years 10 Years Since InceptionDec 03, 2008
Total Amount Invested (`) 1,20,000 3,60,000 6,00,000 8,40,000 NA 10,30,000
Total Value as on June 30, 2017 (`) 1,26,577 4,21,817 7,75,947 12,06,856 NA 15,79,393
Fund Returns (%) 10.39 10.59 10.24 10.19 NA 9.71
Total Value of CRISIL Composite Bond Fund Index# 1,25,737 4,20,729 7,75,183 11,85,550 NA 15,42,299
CRISIL Composite Bond Fund Index Returns (%)# 9.05 10.41 10.20 9.69 NA 9.18
Total Value of CRISIL 10 Year Gilt Index## 1,25,197 4,20,295 7,61,409 11,45,911 NA 14,61,993
CRISIL 10 Year Gilt Index Returns (%)## 8.19 10.34 9.48 8.73 NA 7.97
IDFC G Sec Fund - Investment Plan - Regular Plan - Growth 1 Year 3 Years 5 Years 7 Years 10 Years Since InceptionDec 03, 2008
Total Amount Invested (`) 1,20,000 3,60,000 6,00,000 8,40,000 NA 10,30,000
Total Value as on June 30, 2017 (`) 1,27,236 4,25,786 7,88,740 12,37,029 NA 16,20,410
Fund Returns (%) 11.45 11.23 10.90 10.88 NA 10.28
Total Value of I-Sec Composite Index# 1,25,420 4,20,855 7,77,828 11,99,183 NA 15,63,122
I-Sec Composite Index Returns (%)# 8.54 10.43 10.34 10.01 NA 9.48
Total Value of CRISIL 10 Year Gilt Index## 1,25,197 4,20,295 7,61,409 11,45,911 NA 14,61,993
CRISIL 10 Year Gilt Index Returns (%)## 8.19 10.34 9.48 8.73 NA 7.97
SIP PerformanceMonthly SIP of `10,000
IDFC G Sec Fund - PF Plan - Regular Plan - Growth 1 Year 3 Years 5 Years 7 Years 10 Years Since InceptionMar 29, 2004
Total Amount Invested (`) 1,20,000 3,60,000 6,00,000 8,40,000 12,00,000 16,00,000
Total Value as on June 30, 2017 (`) 1,27,778 4,31,162 8,02,539 12,59,144 20,74,502 32,40,535
Fund Returns (%) 12.32 12.10 11.60 11.38 10.56 10.00
Total Value of I-SEC Composite Index# 1,25,420 4,20,855 7,77,828 11,99,183 19,47,466 29,84,742
I-SEC Composite Index Returns (%)# 8.54 10.43 10.34 10.01 9.36 8.88
Total Value of CRISIL 10 Year Gilt Index## 1,25,197 4,20,295 7,61,409 11,45,911 17,92,881 26,60,598
CRISIL 10 Year Gilt Index Returns (%)## 8.19 10.34 9.48 8.73 7.79 7.29
IDFC G Sec Fund - Short Term Plan - Regular Plan - Growth 1 Year 3 Years 5 Years 7 Years 10 Years Since InceptionMar 09, 2002
Total Amount Invested (`) 1,20,000 3,60,000 6,00,000 8,40,000 12,00,000 18,40,000
Total Value as on June 30, 2017 (`) 1,25,661 4,14,697 7,71,756 11,80,166 18,35,497 31,99,293
Fund Returns (%) 8.93 9.43 10.02 9.56 8.24 6.85
Total Value of I-SEC Si-Bex# 1,24,675 4,08,448 7,43,416 11,36,018 18,32,875 NA
I-SEC Si-Bex Returns (%)# 7.35 8.39 8.52 8.49 8.21 NA
Total Value of CRISIL 1 Year T-Bill Index## 1,23,799 4,00,469 7,21,221 10,88,972 17,05,872 30,68,405
CRISIL 1 Year T-Bill Index Returns (%)## 5.96 7.06 7.30 7.31 6.84 6.35
Past performance may or may not be sustained in future.Dividends are assumed to be reinvested and bonus is adjusted. Load is not taken into consideration. To illustrate the advantages of SIP investment, this is how your investment would have grown if you had invested say `10,000 systematically on the first business Day of every month over a period of time. Returns are calculated by using XIRR approach. XIRR helps in calculating return on investment given an initial and final value and a series of cash inflows and outflows with the correct allowence for the time impact of the transactions. Regular and Direct plans have different expense structure. Direct Plan shall have a lower expense ratio excluding distribution expenses, commision expenses etc. #Benchmark Returns. ##Alternate Benchmark Returns. Data as on June 30, 2017.

39
SIP PerformanceMonthly SIP of `10,000
IDFC Asset Allocation Fund of Fund - Conservative Plan Regular Plan - Growth
1 Year 3 Years 5 Years 7 Years 10 Years Since InceptionFeb 11, 2010
Total Amount Invested (`) 1,20,000 3,60,000 6,00,000 8,40,000 NA 8,90,000
Total Value as on June 30, 2017 (`) 1,26,482 4,15,646 7,77,394 12,03,626 NA 12,98,587
Fund Returns (%) 10.29 9.60 10.32 10.12 NA 10.01
Total Value of Crisil MIP Blended Fund Index# 1,26,474 4,20,112 7,80,876 11,96,469 NA 12,89,177
Crisil MIP Blended Fund Index Returns# 10.23 10.31 10.49 9.95 NA 9.81
Total Value of CRISIL 10 Year Gilt Index## 1,25,197 4,20,295 7,61,409 11,45,911 NA 12,29,283
CRISIL 10 Year Gilt Index Returns (%)## 8.19 10.34 9.48 8.73 NA 8.56
IDFC Asset Allocation Fund of Fund - Moderate Plan Regular Plan - Growth
1 Year 3 Years 5 Years 7 Years 10 Years Since InceptionFeb 11, 2010
Total Amount Invested (`) 1,20,000 3,60,000 6,00,000 8,40,000 NA 8,90,000
Total Value as on June 30, 2017 (`) 1,27,070 4,18,785 7,94,347 12,38,134 NA 13,39,045
Fund Returns 11.24 10.11 11.19 10.91 NA 10.82
Total Value of Crisil MIP Blended Fund Index# 1,26,474 4,20,112 7,80,876 11,96,469 NA 12,89,177
Crisil MIP Blended Fund Index Returns# 10.23 10.31 10.49 9.95 NA 9.81
Total Value of CRISIL 10 Year Gilt Index## 1,25,197 4,20,295 7,61,409 11,45,911 NA 12,29,283
CRISIL 10 Year Gilt Index Returns (%)## 8.19 10.34 9.48 8.73 NA 8.56
IDFC Asset Allocation Fund of Fund - Aggressive Plan Regular Plan - Growth
1 Year 3 Years 5 Years 7 Years 10 Years Since InceptionFeb 11, 2010
Total Amount Invested (`) 1,20,000 3,60,000 6,00,000 8,40,000 NA 8,90,000
Total Value as on June 30, 2017 (`) 1,28,510 4,22,332 8,14,125 12,67,010 NA 13,70,517
Fund Returns 13.58 10.69 12.19 11.56 NA 11.43
Total Value of CRISIL Balanced Fund –Aggressive Index# 1,28,873 4,16,509 7,94,227 12,18,598 NA 13,13,433
CRISIL Balanced Fund –Aggressive Index# 14.09 9.72 11.18 10.46 NA 10.30
Total Value of CRISIL 10 Year Gilt Index## 1,25,197 4,20,295 7,61,409 11,45,911 NA 12,29,283
CRISIL 10 Year Gilt Index Returns (%)## 8.19 10.34 9.48 8.73 NA 8.56
Past performance may or may not be sustained in future.Dividends are assumed to be reinvested and bonus is adjusted. Load is not taken into consideration. To illustrate the advantages of SIP investment, this is how your investment would have grown if you had invested say `10,000 systematically on the first business Day of every month over a period of time. Returns are calculated by using XIRR approach. XIRR helps in calculating return on investment given an initial and final value and a series of cash inflows and outflows with the correct allowence for the time impact of the transactions. Regular and Direct plans have different expense structure. Direct Plan shall have a lower expense ratio excluding distribution expenses, commision expenses etc. #Benchmark Returns. ##Alternate Benchmark Returns. Data as on June 30, 2017.
Date Plan Dividend NAVIDFC Classic Equity Fund27-Feb-17 Regular Plan 1.18 15.003629-Feb-16 Regular Plan 1.00 11.771925-Feb-15 Regular Plan 1.50 15.502927-Feb-17 Direct Plan 1.30 16.493329-Feb-16 Direct Plan 1.00 12.655325-Feb-15 Direct Plan 1.65 16.4674
IDFC Sterling Equity Fund10-Mar-17 Regular Plan 1.31 18.623521-Mar-16 Regular Plan 1.50 15.868516-Mar-15 Regular Plan 2.00 20.449510-Mar-17 Direct Plan 1.37 19.389421-Mar-16 Direct Plan 1.50 16.343316-Mar-15 Direct Plan 2.00 20.8582
IDFC Premier Equity Fund10-Mar-17 Regular Plan 2.32 33.034808-Mar-16 Regular Plan 3.50 31.487802-Mar-15 Regular Plan 4.50 39.395210-Mar-17 Direct Plan 2.38 33.923108-Mar-16 Direct Plan 3.50 32.024006-May-15 Direct Plan 4.35 38.4300
IDFC Focused Equity Fund24-Jan-17 Regular Plan 1.00 12.136828-Jan-16 Regular Plan 1.00 11.503623-Jan-15 Regular Plan 1.50 15.459414 May 08 Regular Plan 1.50 13.943124-Jan-17 Direct Plan 1.20 14.662528-Jan-16 Direct Plan 1.00 13.486923-Jan-15 Direct Plan 1.73 17.8403
IDFC Equity Fund10-Mar-17 Regular Plan 0.83 13.855114-Mar-16 Regular Plan 1.00 12.527109-Mar-15 Regular Plan 1.50 16.272210-Mar-17 Direct Plan 1.00 16.659514-Mar-16 Direct Plan 1.00 14.667509-Mar-15 Direct Plan 1.75 18.765923-Jan-15 Direct Plan 1.73 17.8403
IDFC Balanced Fund22-May-17 Reg Plan 0.35 10.8559
Last 3 Gross Dividends (`/unit) :
Dividend History
Date Plan Dividend NAV22-May-17 Dir Plan 0.35 10.9305
IDFC Arbitrage Fund22-Jun-17 Reg Plan Monthly 0.05 12.685130-May-17 Reg Plan Monthly 0.07 12.704427-Apr-17 Reg Plan Monthly 0.05 12.687729-Mar-17 Reg Plan Annually 1.05 11.4737
22-Jun-17 Dir Plan Monthly 0.05 13.0529
30-May-17 Dir Plan Monthly 0.08 13.074527-Apr-17 Dir Plan Monthly 0.06 13.056229-Mar-17 Dir Plan Annually 0.21 11.6070
IDFC Arbitrage Plus Fund22-Jun-17 Reg Plan Monthly 0.05 12.076130-May-17 Reg Plan Monthly 0.07 12.091227-Apr-17 Reg Plan Monthly 0.05 12.072229-Mar-17 Reg Plan Annually 0.15 10.724917-Mar-16 Reg Plan Annually 0.50 10.542422-Jun-17 Dir Plan Monthly 0.06 12.368330-May-17 Dir Plan Monthly 0.07 12.385827-Apr-17 Dir Plan Monthly 0.07 12.386629-Mar-17 Dir Plan Annually 0.29 11.138617-Mar-16 Dir Plan Annually 0.20 10.5645
Date Plan Freq Dividend NAVIDFC Tax Advantage Fund27-Feb-17 Reg Plan - 1.24 15.6964
29-Feb-16 Reg Plan - 1.40 13.0529
16-Feb-15 Reg Plan - 2.00 17.7419
27-Feb-17 Dir Plan - 1.48 18.7601
29-Feb-16 Dir Plan - 1.40 15.1914
16-Feb-15 Dir Plan - 2.25 20.3551
IDFC Monthly Income Plan29-Jun-17 Reg Plan Monthly 0.0900 13.1547
30-May-17 Reg Plan Monthly 0.0900 13.2148
27-Apr-17 Reg Plan Monthly 0.0900 13.2023
27-Jun-17 Reg Plan Quarterly 0.2700 13.4949
22-Mar-17 Reg Plan Quarterly 0.2600 13.3391
22-Dec-16 Reg Plan Quarterly 0.2700 13.1599
29-Jun-17 Dir Plan Monthly 0.0900 13.8397
30-May-17 Dir Plan Monthly 0.0900 13.8893
Date Plan Freq Dividend NAV27-Apr-17 Dir Plan Monthly 0.0900 13.8628
29-Mar-17 Dir Plan Monthly 0.0900 13.7523
27-Jun-17 Dir Plan Quarterly 0.2900 14.4005
22-Mar-17 Dir Plan Quarterly 0.2800 14.2137
22-Dec-16 Dir Plan Quarterly 0.2800 13.9870
IDFC Asset Allocation Fund of Fund - CP30-May-17 Reg Plan - 0.0700 14.1444
27-Apr-17 Reg Plan - 0.0900 14.1412
29-Mar-17 Reg Plan - 0.0900 14.0539
30-May-17 Dir Plan - 0.0700 14.3898
27-Apr-17 Dir Plan - 0.1000 14.3886
29-Mar-17 Dir Plan - 0.0900 14.2929
IDFC Asset Allocation Fund of Fund - MP30-May-17 Reg Plan Dividend 0.0500 15.653027-Apr-17 Reg Plan Dividend 0.1000 15.669629-Mar-17 Reg Plan Dividend 0.1000 15.4759
IDFC Asset Allocation Fund of Fund - AP30-May-17 Reg Plan Dividend 0.0400 16.289327-Apr-17 Reg Plan Dividend 0.1100 16.364129-Mar-17 Reg Plan Dividend 0.1100 15.941330-May-17 Dir Plan - 0.0400 17.881827-Apr-17 Dir Plan - 0.1200 17.955429-Mar-17 Dir Plan - 0.1200 17.4841
IDFC Dynamic Equity Fund28-Apr-17 Reg Plan - 0.21 10.668923-Jan-17 Reg Plan - 0.17 10.338027-Oct-16 Reg Plan - 0.18 10.673928-Apr-17 Dir Plan - 0.21 10.991723-Jan-17 Dir Plan - 0.18 10.63477-Oct-16 Dir Plan - 0.18 10.9554
IDFC Corporate Bond Fund29-Jun-17 Reg Plan Monthly 0.0964 10.602130-May-17 Reg Plan Monthly 0.0790 10.584727-Apr-17 Reg Plan Monthly 0.0488 10.554530-Aug-16 Reg Plan Dividend 0.4200 10.639317-Mar-16 Reg Plan Dividend 0.0497 10.101727-Jun-17 Reg Plan Quarterly 0.2300 10.634422-Mar-17 Reg Plan Quarterly 0.0700 10.4527

40
Dividend History
Date Plan Freq Dividend NAV22-Dec-16 Reg Plan Quarterly 0.2300 10.553522-Mar-17 Reg Plan Half Yearly 0.0800 10.655122-Sep-16 Reg Plan Half Yearly 0.2100 10.517729-Jun-17 Dir Plan Monthly 0.0961 10.336730-May-17 Dir Plan Monthly 0.0800 10.320627-Apr-17 Dir Plan Monthly 0.0520 10.292630-Aug-16 Dir Plan Dividend 0.4700 10.654617-Mar-16 Dir Plan Dividend 0.0544 10.107127-Jun-17 Dir Plan Quarterly 0.2400 10.487622-Mar-17 Dir Plan Quarterly 0.0700 10.299222-Dec-16 Dir Plan Quarterly 0.2300 10.392829-Mar-17 Dir Plan Annually 0.6000 10.6751
IDFC All Seasons Bond Fund22-Mar-17 Reg Plan Half Yearly 0.3600 11.993122-Sep-16 Reg Plan Half Yearly 0.5800 12.171722-Mar-16 Reg Plan Half Yearly 0.3935 11.958927-Jun-17 Reg Plan Quarterly 0.2500 12.590222-Mar-17 Reg Plan Quarterly 0.1700 12.490722-Dec-16 Reg Plan Quarterly 0.2000 12.471029-Mar-17 Reg Plan Annually 1.0300 12.492017-Mar-16 Reg Plan Annually 6.8962 18.309327-Jun-17 Dir Plan Quarterly 0.2600 12.736222-Mar-17 Dir Plan Quarterly 0.1900 12.639122-Dec-16 Dir Plan Quarterly 0.2200 12.6232
IDFC Cash Fund29-Jun-17 Reg Plan Monthly 5.2680 1005.598130-May-17 Reg Plan Monthly 5.7898 1006.119927-Apr-17 Reg Plan Monthly 5.1836 1005.513712-Sep-14 Reg Plan Periodic 208.4395 1277.506829-Dec-11 Reg Plan Periodic 17.6009 1003.360626-Sep-11 Reg Plan Periodic 0.0480 10.000029-Jun-17 Dir Plan Monthly 5.3698 1012.414230-May-17 Dir Plan Monthly 5.9020 1012.946427-Apr-17 Dir Plan Monthly 5.2836 1012.328012-Sep-14 Dir Plan Periodic 111.9648 1114.5856
IDFC Ultra Short Term Fund29-Jun-17 Reg Plan Monthly 0.0670 10.169330-May-17 Reg Plan Monthly 0.0658 10.168127-Apr-17 Reg Plan Monthly 0.0594 10.161712-Sep-14 Reg Plan Periodic 0.9994 11.048028-May-13 Reg Plan Periodic 0.6317 10.667630-Jan-12 Reg Plan Periodic 0.2375 10.028727-Jun-17 Reg Plan Quarterly 0.2000 10.820622-Mar-17 Reg Plan Quarterly 0.1500 10.748222-Dec-16 Reg Plan Quarterly 0.1900 10.750429-Jun-17 Dir Plan Monthly 0.0683 10.183930-May-17 Dir Plan Monthly 0.0672 10.182827-Apr-17 Dir Plan Monthly 0.0606 10.176227-Jun-17 Dir Plan Quarterly 0.2000 10.735322-Mar-17 Dir Plan Quarterly 0.1500 10.660422-Dec-16 Dir Plan Quarterly 0.1900 10.660312-Sep-14 Dir Plan Periodic 1.6479 11.6763
IDFC Money Manager Fund - Treasury Plan29-Jun-17 Reg Plan Monthly 0.0634 10.313730-May-17 Reg Plan Monthly 0.0610 10.311327-Apr-17 Reg Plan Monthly 0.0497 10.300029-Jun-17 Dir Plan Monthly 0.0675 10.253630-May-17 Dir Plan Monthly 0.0657 10.251827-Apr-17 Dir Plan Monthly 0.0540 10.2401
IDFC Banking & PSU Debt Fund29-Jun-17 Reg Plan Monthly 0.0469 10.200930-May-17 Reg Plan Monthly 0.0523 10.206327-Apr-17 Reg Plan Monthly 0.0502 10.204227-Jun-17 Reg Plan Quarterly 0.1500 10.657422-Mar-17 Reg Plan Quarterly 0.1300 10.617827-Jun-17 Reg Plan Quarterly 0.1500 10.657429-Mar-17 Reg Plan Annually 0.7600 10.878117-Mar-16 Reg Plan Annually 0.8038 10.906119-Mar-15 Reg Plan Annually 0.3851 10.450022-Mar-17 Reg Plan - 0.7400 10.852317-Mar-16 Reg Plan - 0.8028 10.892719-Mar-15 Reg Plan - 0.4276 10.480229-Jun-17 Dir Plan Monthly 0.0483 10.151930-May-17 Dir Plan Monthly 0.0530 10.156627-Apr-17 Dir Plan Monthly 0.0507 10.154327-Jun-17 Dir Plan Quarterly 0.1500 10.728422-Mar-17 Dir Plan Quarterly 0.1300 10.684122-Dec-16 Dir Plan Quarterly 0.1700 10.701722-Mar-17 Dir Plan - 0.7500 10.864517-Mar-16 Dir Plan - 0.8194 10.910519-Mar-15 Dir Plan - 0.4329 10.4862
IDFC Money Manager Fund - Investment Plan29-Jun-17 Reg Plan Monthly 0.0520 10.316030-May-17 Reg Plan Monthly 0.0634 10.327427-Apr-17 Reg Plan Monthly 0.0567 10.320727-Jun-17 Reg Plan Quarterly 0.1800 11.075322-Mar-17 Reg Plan Quarterly 0.1500 11.018422-Dec-16 Reg Plan Quarterly 0.2100 11.0518
Date Plan Freq Dividend NAV29-Mar-17 Reg Plan Annually 0.8000 10.970917-Mar-16 Reg Plan Annually 0.0166 10.053719-Mar-15 Reg Plan Annually 0.3937 10.443929-Jun-17 Dir Plan Monthly 0.0533 10.207230-May-17 Dir Plan Monthly 0.0646 10.218527-Apr-17 Dir Plan Monthly 0.0577 10.2116
27-Jun-17 Dir Plan Quarterly 0.1900 10.8601
22-Mar-17 Dir Plan Quarterly 0.1500 10.801322-Dec-16 Dir Plan Quarterly 0.2100 10.832922-Mar-16 Dir Plan Periodic 0.1309 10.251128-Dec-15 Dir Plan Periodic 1.1372 11.201912-Sep-14 Dir Plan Periodic 1.4277 11.4545
IDFC Super Saver Income Fund - Short Term Plan29-Jun-17 Reg Plan Monthly 0.0767 10.238030-May-17 Reg Plan Monthly 0.0682 10.229527-Apr-17 Reg Plan Monthly 0.0516 10.212929-Jun-17 Dir Plan Monthly 0.0825 10.449230-May-17 Dir Plan Monthly 0.0745 10.441227-Apr-17 Dir Plan Monthly 0.0572 10.4239
IDFC SSIF - Medium Term Plan29-Jun-17 Reg Plan Monthly 0.0842 10.247630-May-17 Reg Plan Monthly 0.0752 10.238627-Apr-17 Reg Plan Monthly 0.0411 10.204530-May-17 Reg Plan BiMonthly 0.0900 11.665129-Mar-17 Reg Plan BiMonthly 0.0100 11.542830-Jan-17 Reg Plan BiMonthly 0.0300 11.485227-Jun-17 Reg Plan Quarterly 0.2400 10.966322-Mar-17 Reg Plan Quarterly 0.0900 10.801022-Dec-16 Reg Plan Quarterly 0.2600 10.919129-Jun-17 Dir Plan Monthly 0.0920 10.517430-May-17 Dir Plan Monthly 0.0833 10.508727-Apr-17 Dir Plan Monthly 0.0476 10.473027-Jun-17 Dir Plan Quarterly 0.2600 11.095122-Mar-17 Dir Plan Quarterly 0.1000 10.918022-Dec-16 Dir Plan Quarterly 0.2800 11.037330-May-17 Dir Plan BiMonthly 0.1000 11.937629-Mar-17 Dir Plan BiMonthly 0.0300 11.819130-Jan-17 Dir Plan BiMonthly 0.0500 11.7673
IDFC Super Saver Income Fund - Investment Plan27-Jun-17 Reg Plan Quarterly 0.5300 12.079422-Dec-16 Reg Plan Quarterly 0.4800 12.017422-Sep-16 Reg Plan Quarterly 0.5101 12.123022-Mar-17 Reg Plan Half Yearly 0.4000 11.940122-Sep-16 Reg Plan Half Yearly 0.7699 12.183922-Mar-16 Reg Plan Half Yearly 0.2008 11.538329-Mar-17 Reg Plan Annually 1.3100 12.508417-Mar-16 Reg Plan Annually 7.5057 18.532130-Mar-09 Reg Plan Annually 0.9347 10.941327-Jun-17 Dir Plan Quarterly 0.4600 12.473222-Mar-17 Dir Plan Quarterly 0.0300 12.030022-Dec-16 Dir Plan Quarterly 0.5200 12.384229-Mar-17 Dir Plan Annually 1.9300 17.214217-Mar-16 Dir Plan Annually 0.6437 15.685919-Mar-15 Dir Plan Annually 1.6731 16.6326
IDFC GSF - Provident Fund Plan27-Jun-17 Reg Plan Quarterly 0.6900 12.892122-Dec-16 Reg Plan Quarterly 0.5500 12.734722-Sep-16 Reg Plan Quarterly 0.6300 12.909329-Mar-17 Reg Plan Annually 1.5100 12.720417-Mar-16 Reg Plan Annually 0.4930 11.510719-Mar-15 Reg Plan Annually 1.2994 12.248529-Mar-17 Dir Plan Annually 1.7300 14.131017-Mar-16 Dir Plan Annually 0.6007 12.791519-Mar-15 Dir Plan Annually 1.4679 13.580327-Jun-17 Dir Plan Quarterly 0.7400 13.321922-Dec-16 Dir Plan Quarterly 0.5800 13.148522-Sep-16 Dir Plan Quarterly 0.6700 13.339922-Mar-16 Dir Plan Periodic 0.4000 11.8919
IDFC Dynamic Bond Fund22-Mar-17 Reg Plan - 1.1800 11.428917-Mar-16 Reg Plan - 0.4301 10.554309-Mar-15 Reg Plan - 1.0833 11.158327-Jun-17 Reg Plan Quarterly 0.3800 11.250422-Mar-17 Reg Plan Quarterly 0.0100 10.868222-Dec-16 Reg Plan Quarterly 0.4500 11.192029-Mar-17 Reg Plan Annually 1.2800 11.963117-Mar-16 Reg Plan Annually 0.4466 10.964219-Mar-15 Reg Plan Annually 0.7439 11.210622-Mar-17 Reg Plan Half Yearly 0.3800 10.782122-Sep-16 Reg Plan Half Yearly 0.7000 10.991322-Mar-16 Reg Plan Half Yearly 0.1925 10.410722-Mar-17 Dir Plan - 1.5400 13.863017-Mar-16 Dir Plan - 0.6250 12.800119-Mar-15 Dir Plan - 0.5345 12.647527-Jun-17 Dir Plan Quarterly 0.4700 13.086522-Mar-17 Dir Plan Quarterly 0.0400 12.644722-Dec-16 Dir Plan Quarterly 0.5500 13.022729-Mar-17 Dir Plan Annually 1.4300 12.548517-Mar-16 Dir Plan Annually 1.8150 12.750729-Sep-14 Dir Plan Annually 0.5000 11.3737
Date Plan Freq Dividend NAV22-Mar-17 Dir Plan Half Yearly 0.4200 10.929922-Sep-16 Dir Plan Half Yearly 0.7500 11.139322-Mar-16 Dir Plan Half Yearly 0.2370 10.5476
IDFC GSF – Investment Plan27-Jun-17 Reg Plan Quarterly 0.5900 11.668422-Dec-16 Reg Plan Quarterly 0.4700 11.539622-Sep-16 Reg Plan Quarterly 0.5600 11.714829-Mar-17 Reg Plan Annually 1.3300 11.884417-Mar-16 Reg Plan Annually 0.3913 10.767919-Mar-15 Reg Plan Annually 0.9708 11.287522-Mar-17 Reg Plan - 1.2400 11.537517-Mar-16 Reg Plan - 0.3826 10.525719-Mar-15 Reg Plan - 0.7667 11.223422-Mar-17 Reg Plan Half Yearly 0.3600 11.121322-Sep-16 Reg Plan Half Yearly 0.8100 11.430322-Mar-16 Reg Plan Half Yearly 0.1758 10.718119-Sep-14 Dir Plan Half Yearly 0.5519 10.690407-Mar-14 Dir Plan Half Yearly 0.3463 10.405625-Sep-13 Dir Plan Half Yearly 0.0787 10.093527-Jun-17 Dir Plan Quarterly 0.6000 11.339422-Dec-16 Dir Plan Quarterly 0.4700 11.200522-Sep-16 Dir Plan Quarterly 0.5600 11.374922-Mar-17 Dir Plan - 1.4100 12.496817-Mar-16 Dir Plan - 0.4972 11.421919-Mar-15 Dir Plan - 1.3677 12.226929-Mar-17 Dir Plan Annually 1.5300 13.064117-Mar-16 Dir Plan Annually 0.2866 11.628207-Mar-14 Dir Plan Annually 0.1788 10.5354
IDFC GSF - Short Term Plan29-Jun-17 Reg Plan Monthly 0.1050 10.509330-May-17 Reg Plan Monthly 0.1225 10.526827-Apr-17 Reg Plan Monthly 0.0605 10.464827-Jun-17 Reg Plan Quarterly 0.3100 10.993922-Mar-17 Reg Plan Quarterly 0.0600 10.721622-Dec-16 Reg Plan Quarterly 0.2800 10.886130-Jan-17 Dir Plan Monthly 0.0687 10.555829-Nov-16 Dir Plan Monthly 0.1845 10.671627-Oct-16 Dir Plan Monthly 0.0749 10.562027-Jun-17 Dir Plan Quarterly 0.3200 11.267522-Mar-17 Dir Plan Quarterly 0.0600 10.980922-Dec-16 Dir Plan Quarterly 0.2900 11.1510
IDFC Credit Opportunities Fund27-Jun-17 Reg Plan Quarterly 0.2000 10.308827-Jun-17 Dir Plan Quarterly 0.2400 10.3394
Dividend is not guaranteed and past performance may or may not be sustained in future. Pursuant to payment of dividend, the NAV of the scheme would fall to the extent of payout and statutory levy (as applicable). Dividend received is subject to applicable dividend distribution tax. Face Value of all above schemes (excluding IDFC Cash Fund) is `10/- per unit. Face value of IDFC Cash Fund is `1000/- per unit. Past performance may or may not be sustained in future.

41
Total Experience of Fund Managers
Name Years Name Years
Mr. Anoop Bhaskar – Head Equity 23+ Mr. Harshal Joshi 9+
Mr. Anurag Mittal 10+ Ms. Khushboo Sharma 3+
Mr. Arpit Kapoor 12+ Mr. Rajendra Mishra 14+
Mr. Arvind Subramanian 7+ Mr. Sumit Agrawal 12+
Mr. Bhavin Patadia 8+ Mr. Suyash Choudhary - Head Fixed Income 16+
Mr. Daylynn Pinto 12+ Mr. Yogik Pitti 10+
How to read Factsheet
Fund ManagerAn employee of the asset management company such as a mutual fund or life insurer, who manages investments of the scheme. He is usually part of a larger team of fund managers and research analysts.
Application Amount for Fresh SubscriptionThis is the minimum investment amount for a new investor in a mutual fund scheme,
Minimum Additional AmountThis is the minimum investment amount for an existing investor in a mutual fund scheme.
Yield to MaturityThe Yield to Maturity or the YTM is the rate of return anticipated on a bond if held until maturity. YTM is expressed as an annual rate. The YTM factors in the bond’s current market price, par value, coupon interest rate and time to maturity.
SIPSIP or systematic investment plan works on the principle of making periodic investments of a fixed sum. It works similar to a recurring bank deposit. For instance, an investor may opt for an SIP that invests Rs 500 every 15th of the month in an equity fund for a period of three years.
NAVThe NAV or the net asset value is the total asset value per unit of the mutual fund after deducting all related and permissible expenses. The NAV is calculated at the end of every business day. It is the value at which the investor enters or exits the mutual fund.
BenchmarkA group of securities, usually a market index, whose performance is used as a standard or benchmark to measure investment performance of mutual funds, among other investments. Some typical benchmarks include the Nifty, Sensex, BSE200, BSE500, 10-Year Gsec.
Entry LoadA mutual fund may have a sales charge or load at the time of entry and/or exit to compensate the distributor/agent. Entry load is charged at the time an investor purchases the units of a mutual fund. The entry load is added to the prevailing NAV at the time of investment. For instance, if the NAV is `100 and the entry load is 1%, the investor will enter the fund at `101.
Note: SEBI, vide circular dated June 30, 2009 has abolished entry loan and mandated that the upfront commission to distributors will be paid by the investor directly to the distributor, based on his assessment of various factors including the services rendered by the distributor.
Exit LoadExit load is charged at the time an investor redeems the units of a mutual fund. The exit load is deducted from the prevailing NAV at the time of redemption. For instance, if the NAV is ` 100 and the exit load is 1%, the redemption price would be ` s99 per unit. Modified DurationModified duration is the price sensitivity and the percentage change in price for a unit change in yieldStandard DeviationStandard deviation is a statistical measure of the range of an investment’s performance. When a mutual fund has a high standard deviation, its means its range of performance is wide, implying greater volatility.Sharpe RatioThe Sharpe Ratio, named after its founder, the Nobel Laureate William Sharpe, is a measure of risk-adjusted returns. It is calculated using standard deviation and excess return to determine reward per unit of risk.BetaBeta is a measure of an investment’s volatility vis-a-vis the market. Beta of less than 1 means that the security will be less volatile than the market. A beta of greater than 1 implies that the security’s price will be more volatile than the market.AUMAUM or assets under management refers to the recent / updated cumulative market value of investments managed by a mutual fund or any investment firm.HoldingsThe holdings or the portfolio is a mutual fund’s latest or updated reported statement of investments/securities. These are usually displayed in terms of percentage to net assets or the rupee value or both. The objective is to give investors an idea of where their money is being invested by the fund manager.Nature of SchemeThe investment objective and underlying investments determine the nature of the mutual fund scheme. For instance, a mutual fund that aims at generating capital appreciation by investing in stock markets is an equity fund or growth fund. Likewise, a mutual fund that aims at capital preservation by investing in debt markets is a debt fund or income fund. Each of these categories may have sub-categories.Rating ProfileMutual funds invest in securities after evaluating their creditworthiness as disclosed by the ratings. A depiction of the mutual fund in various investments based on their ratings becomes the rating profile of the fund. Typically, this is a feature of debt funds.
Fund Manager Details
Investment Objective
IDFC Classic Equity Fund The investment objective of the Scheme is to seek to generate long term capital growth from a diversified portfolio of predominantly equity and equity related instruments. However, there is no assurance or guarantee that the objectives of the scheme will be realized.
IDFC Sterling Equity Fund The investment objective of the Scheme is to seek to generate capital appreciation from a diversified portfolio of equity and equity related instruments. The Scheme will predominantly invest in small and midcap equity and equity related instruments. Small and Midcap equity and equity related instruments will be the stocks included in the Nifty Free Float Midcap 100 or equity and equity related instruments of such companies which have a market capitalization lower than the highest components of Nifty Free Float Midcap 100. The Scheme may also invest in stocks other than mid cap stocks (i.e. in stocks, which have a market capitalisation of above the market capitalisation range of the defined small - midcap stocks) and derivatives. On defensive consideration, the Scheme may also invest in debt and money market instruments. In case of discontinuation / suspension of Nifty Free Float Midcap 100, the AMC reserves the right to modify the definition of Mid cap and Small cap companies. In case of such a modification, the interest of investors will be of paramount importance. There can be no assurance that the investment objective of the scheme will be realized.
IDFC Premier Equity Fund The Scheme shall seek to generate long-term capital growth from an actively managed portfolio of predominantly equity and equity related instruments. The Scheme portfolio would acquire, inter alia, small and medium size businesses with good long term potential, which are available at cheap valuations. Such securities would be identified through disciplined fundamental research keeping in view medium to long-term trends in the business environment. The Scheme shall endeavor to accumulate long-term investor wealth by opening subscriptions to units during periods when stocks are available at reasonable valuations. By doing so, the Fund managers would endeavor to prevent short-term money from flowing into the fund which can prove detrimental to the interests of long-term investors. As the scheme would be sold to investors with a long-term investment horizon, it is also expected that the portfolio would remain relatively more insulated to day to day redemption pressures. The fund will close subscription, once it has collected a predetermined “manageable” corpus (approximate amount), which will be decided by the fund manager of the scheme depending on the available investment opportunities in the stock market / if the fund manager is of the opinion that investment opportunities have diminished. Thus the fund manager will endeavour to ensure that there are sufficient assets available to meet the long-term objectives of the fund.
IDFC Focused Equity Fund The investment objective of the scheme is to seek to generate capital appreciation and/or provide income distribution from a portfolio of predominantly equity and equity related instruments. There is no assurance or guarantee that the objectives of the scheme will be realized.
IDFC Equity Fund The investment objective of the scheme is to seek to generate capital growth from a portfolio of predominantly equity and equity related instruments (including Equity Derivatives). The scheme may also invest in debt & money market instruments to generate reasonable income. However there is no assurance or guarantee that the objectives of the scheme will be realized.

42
Investment Objective
IDFC Nifty Fund The investment objective of the scheme is to replicate the Nifty 50 by investing in securities of the Nifty 50 in the same proportion / wightage. However, there is no assurance or guarantee that the objectives of the scheme will be realized and the scheme does not assure or guarantee any returns .
IDFC Infrastructure Fund The investment objective of the scheme is to seek to generate long-term capital growth through an active diversified portfolio of predominantly equity related instruments of companies that are participating in and benefiting from growth in Indian Infrastructure and infra structural related activities, However, there can be no assurance that the investment Objective of the scheme will be realized.
IDFC Tax Advantage (ELSS) Fund
The investment objective of the Scheme is to seek to generate long term capital growth from a diversified portfolio of predominantly equity and equity related securities. There can be no assurance that the investment objective of the scheme will be realised.
IDFC Arbitrage Fund The investment objective of the Scheme is to generate capital appreciation and income by predominantly investing in arbitrage opportunity in the cash and the derivative segments of the equity markets and the arbitrage opportunity available within the derivative segments and by investing the balance in debt and money market instruments. However there is no assurance that the investment objective of the scheme will be realized.
IDFC Arbitrage Plus Fund The investment objective of the Scheme is to generate income (absolute to low volatility returns) by taking advantage of opportunities in the cash and the derivative segments of the equity markets including the arbitrage opportunities available within the derivative segment, by using other derivative based strategies and by investing the balance in debtand money market instruments. However there is no assurance that the investment objective of the scheme will be realized.
IDFC Sensex Exchange Traded Fund
The fund seeks to provide returns that, before expenses, closely correspond to the total return of the underlying index, subject to tracking errors. There can be no assurance or guarantee that the investment objective of the Scheme would be achieved.
IDFC Nifty Exchange Traded Fund
The fund seeks to provide returns that, before expenses, closely correspond to the total return of the underlying index, subject to tracking errors. There can be no assurance or guarantee that the investment objective of the Scheme would be achieved.
IDFC Dynamic Equity Fund The primary objective of the scheme is to seek to generate long term capital appreciation with relatively lower volatility through systematic allocation of funds into equity and equity related instruments; and for defensive purposes in equity derivatives. The secondary objective of the scheme will be to generate in come and capital appreciation through investment in Debt & Money Market instruments. There is no assurance or guarantee that the objectives of the scheme will be realised.
IDFC Balanced Fund The Fund seeks to generate long term capital appreciation along with current income by investing in a mix of equity and equity related securities, debt securities and money market instruments. There is no assurance or guarantee that the objectives of the scheme will be realized.
IDFC Monthly Income Plan The primary objective of Scheme is to generate regular returns through investment primarily in debt securities. The secondary objective of the Scheme is to generate long-term capital appreciation by investing a portion of the Scheme’s assets in equity securities. Monthly Income is not assumed and the same is subject to availability of distributable surplus.
IDFC Asset Allocation Fund of Fund - Conservative Plan
The primary objective of Scheme is to generate capital appreciation through investment in different Mutual Funds schemes primarily local funds based on a defined asset allocation model. However, there can be no assurance that the investment objective of the scheme will be realized.
IDFC Asset Allocation Fund of Fund - Moderate Plan
The primary objective of Scheme is to generate capital appreciation through investment in different Mutual Funds schemes primarily local funds based on a defined asset allocation model. However, there can be no assurance that the investment objective of the scheme will be realized.
IDFC Asset Allocation Fund of Fund - Aggressive Plan
The primary objective of Scheme is to generate capital appreciation through investment in different Mutual Funds schemes primarily local funds based on a defined asset allocation model. However, there can be no assurance that the investment objective of the scheme will be realized.
IDFC All Seasons Bond Fund Seek to generate optimal returns with high liquidity by active management of the portfolio by investing predominantly in debt oriented mutual fund schemesand money market instruments. However, there can be no assurance that the investment objectives of the Scheme will be realized
IDFC Cash Fund IDFC - CF is an open-ended liquid fund with an objective to generate optimal returns with high liquidity by investing in high quality money market and debt instruments. However, there can be no assurance that the investment objectives of the scheme will be realized.
IDFC Ultra short Term Fund To offer an investment avenue for short term savings by looking to generate stable returns with a low risk strategy. The scheme will have a portfolio that is invested in good quality debt and money market instruments such that the fund will offer a blend of liquidity with stability of returns. There can be no assurance that the investment objective of the scheme will be realized.
IDFC Money Manager Fund - Treasury Plan
Seek to generate stable returns with a low risk strategy by creating a portfolio that is substantially invested in good quality floating rate debt or money market instruments, fixed rate debt or money market instruments swapped for floating returns and fixed rate debt and money market instruments. However, there can be no assurance that the investment objectives of the scheme will be realized.
IDFC Money Manager Fund - Investment Plan
Seek to generate stable returns with a low risk strategy by creating a portfolio that is substantially invested in good quality floating rate debt or money market instruments, fixed rate debt or money market instruments swapped for floating returns and fixed rate debt and money market instruments. However there is no assurance that the investment objective of the scheme will be realized.
IDFC Banking & PSU Debt Fund
The Scheme seeks to generate returns through investments in debt and money market instruments predominantly issued by entities such as Banks, Public Sector Undertakings (PSUs) and Public Financial Institutions(PFIs)
IDFC Super Saver Income Fund - Short Term Plan
The primary investment objective of the scheme is to seek to generate stable returns with a low-risk strategy by creating a portfolio that is invested in good quality fixed income & Money Market securities. However, there can be no assurance that the investment objectives of the scheme will be realized.
IDFC Corporate Bond Fund The Fund seeks to provide steady income and capital appreciation by investing primarily in corporate debt securities across maturities and ratings. However, there is no assurance or guarantee that the objectives of the scheme will be realised.
IDFC Credit Opportunities Fund
The Fund seeks to generate returns by predominantly investing in a portfolio of corporate debt securities across the credit spectrum within the investment grade. There is no assurance or guarantee that the objectives of the scheme will be realized.
IDFC Super Saver Income Fund - Medium Term Plan
The primary investment objective of the scheme is to seek to generate stable returns with a low-risk strategy by creating a portfolio that is invested in good quality fixed income & Money Market securities. However, there can be no assurance that the investment objectives of the scheme will be realized.
IDFC Super Saver Income Fund - Investment Plan
The primary investment objective of the scheme is to seek to generate stable returns with a low-risk strategy by creating a portfolio that is invested in good quality fixed income & Money Market securities. However, there can be no assurance that the investment objectives of the scheme will be realized.
IDFC Dynamic Bond Fund Seek to generate optimal returns with high liquidity by active management of the portfolio; by investing in high quality money market & debt instruments. However there can be no assurance that the investment objectives of the Scheme will be realized.
IDFC Government Securities Fund - Short Term Plan
IDFC – GSF -ST is an open ended dedicated gilt scheme with an objective to generate optimal returns with high liquidity by investing Government Securities. However there is no assurance that the investment objective of the scheme will be realized.
IDFC Government Securities Fund - Provident Fund Plan
Seek to generate optimal returns with high liquidity by investing in Government Securities. However there is no assurance that the investment objective of the scheme will be realized.
IDFC Government Securities Fund - Investment Plan
IDFC – GSF -IP is an open ended dedicated gilt scheme with an objective to generate optimal returns with high liquidity by investing Government Securities. However there is no assurance that the investment objective of the scheme will be realized.

IDFC DYNAMIC EQUITY FUND
A hassle free way to dynamically allocate between EQUITY & DEBT
ActiveManagement
DiversifiedPortfolio
TighterPE Bands
(6 bands instead of 5)
Simplified Model,using only PE
(no 200 DMA)
Mutual Fund Investments are subject to market risks, read all scheme related documents carefully.
IDFC Dynamic Equity FundThis product is suitable for investors who are seeking*: To create wealth over a long period of time. Dynamic allocation towards equity, derivatives, debt & money market instruments. *Investors should consult their financial advisors if in doubt about whether the product is suitable for them.
A model-based
approach
Dynamic allocation
between Equity & Debt
Active management of
Equity & Debt Portion
Equity Taxation
(under prevailing tax laws)
BENEFITS
FUND FEATURES
FUND STRATEGY*
Open ended equity scheme
NATURECrisil Balanced Fund-Aggressive index
BENCHMARK
Equity: Mr. Aprit Kapoor & Mr. Sumit Agrawal
Dept: Mr. Arvind Subramanian
FUNDMANAGERS
Minimum application amountis Rs. 5,000 any amount thereafter
MINIMUMAPPLICATIONAMOUNT
*Change in investment strategy for the scheme is effective from June 19, 2017
This fund is for investors who are looking to invest in a fund that dynamically allocates between asset classes depending on market conditions (PE value). To know more about it, please contact your Relationship Manager.

44
WESTAhmedabad B Wing, 3rd Floor, Chandan House Opp Gruh Finance, Mithakhali Six Roads, Law Garden, Tel.:079-26460923/925
Ahmedabad 380006.Bhopal Plot No. 49, First Floor, Above Tata Capital Limited, M P Nagar, Zone II, Bhopal [M.P.] - 462011.Bhilai 26, Commercial Complex, Nehru Nagar (East), Bhilai, Chhattisgarh, Pin - 490020. Mobile No. 8871144134.Goa F -27 & F -28, 1st Floor, Alfran Plaza, M.G Road, Opp. Don Bosco High School, Panjim - Goa. 403001, Tel.: +91-
0832-6631022.Indore 405, 4th Floor, 21/ 1, D. M. Tower, Race Course Road, Indore - 452 001. Tel.: +91-731-4206927/ 4208048. Fax:
+91-731-4206923.Mumbai ‘One IndiaBulls Centre’ 6th Floor, Jupiter Mills Compound, 841, Senapati Bapat Marg, Elphinstone (W) Mumbai
– 400013. Tel No. 6628 9999Mumbai (Churchgate)
2nd Floor,Ramon House , H.T Parekh Marg, 169,Backbay reclamation, Opp.Aakash wani, Churchgate 400020. Tel.:+912266289999.
Mumbai (Ghatkopar) Mumbai(Thane)
Office No. 308, Zest Business Spaces, M. G. Road, Ghatkopar (East), (Maharashtra) Mumbai- 400077.
Shop No. 1, Konark Towers, Ghantali Devi Road, Thane (West) 400602.
Nagpur Fortune Business Centre, First Floor, 6, VasantVihar, W. H. C. Rd., Shankar Nagar, Nagpur - 440 010. Tel.: +91-712-6451428/ 2525657.
Nasik Shop No - 6, Rajvee Enclave, New Pandit Colony, Off Sharanpur Road, Nasik - 422002. Tel.: 0253-2314611. Mobile: 9823456183.
Pune 1st Floor, Dr. Herekar Park Building, Next to Kamala Nehru Park, Off. Bhandarkar Road, Pune - 411 004. Tel.: +91-20-66020965/ 4.
Raipur T-19,III Floor, Raheja Tower, Near Hotel Celebration, Jail Road, Raipur (C G) - 492001. Tel: 0771-6900699.Rajkot “Star Plaza”, 2nd Floor, Office No. 201, Phulchab Chowk, Rajkot - 360 001. Tel.: +91-281-6626012.Surat U 15/16, Jolly Plaza, Athvagate, Surat - 395 001. Tel.: +91-261-2475060, 2475070.Vadodara 301, 2nd Floor, Earth Complex, Opposite Vaccine Ground, Above Indian Overseas Bank, Old Padra Road,
Vadodara - 380015. Tel No.: 0265 - 2339623/2339624/2339325.NORTHAgra Office No. 307A, 3rd Floor, Block #38/4A, Sumriddhi Business Suites, Sanjay Place, Agra - 282 002. Tel.:+91-
562-4064889Amritsar 6-FUF, 4th Floor Central Mall, Mall Road, Amritsar - 143001. Tel.:+911835030393.Chandigarh SCO 2475 - 76, 1st Floor, Sector 22, Chandigarh - 160 022. Tel.: +91 17 2507 1918 /5071919, Fax: +91-172-5071918.Dehradun G-12 B NCR Plaza, Ground Floor, 24 A, 112/28, Ravindranath Tagore Marg, New Cantt Road, Dehradun-248001.
Mobile: 9897934555, 8171872220Jaipur 301-A, 3rd Floor, Ambition Tower, Agersen Circle, Malan Ka Chaurah, Subash Marg, C-Scheme, Jaipur - 302 001.
Tel. No. : +91-0141- 2360945, 2360947, 2360948Jalandhar 1st floor, Satnam Complex, BMC Chowk, G.T.Road, Jalandhar-144001. Punjab-India. Tel.: 01815018264.Kanpur Office No. 214-215, IInd Floor, KAN Chambers, 14/113, Civil Lines, Kanpur - 208 001. Tel.: +91-512-2331071,
2331119.Lucknow 1st floor, Aryan Business Park, Exchange Cottage, 90.M.G. Marg, Park Road, Lucknow-226001, Mob: 9792999940,
Tel.: 0522-4928100 - 106, 0522-6888012Ludhiana SCO 122, 2nd Floor, Feroze Gandhi Market, Ludhiana - 140 001. Tel.: +911615022155.New Delhi 4th Floor, NarainManzil, 23, Barakhamba Road, New Delhi - 110 001. Tel.: +91-11-47311301/ 02/ 03/ 04/ 05.Varanasi IDFC Asset Management Co. Ltd. 3rd Floor, Premise No. D-64/127, CH, Arihant Complex, Sigra Varanasi - 221010
(U.P). Phone No. 05422226527Gurgaon 117, 1st Floor, Vipul Agora, M. G. Road, Gurgaon - 122 001. Ph: 011-47311336.SOUTHBangalore 6th Floor, East Wing, Raheja Towers, #26 & 27, M. G. Road, Bangalore - 560 001. Tel.: +91-80-43079000/ 01/
02/ 03, Fax - +91-80-43079009.Chennai KRM Tower, 8th floor, No. 1, Harrington Road, Chetpet, Chennai - 600 031. Tel.: +91-44-45644201/ 202.Cochin 39/3993 B2, Gr. Floor, Vantage Point, VRM Rd, Ravipuram, Cochin - 682 016. Tel: +91-484-3012639/ 4029291,
Fax: +91-484-2358639.Coimbatore A Complex , No. 49, Father Randy Street, Azad Road, R. S. Puram, Coimbatore - 641 002. Hyderabad 6-3-885/7/C/2/S2, 2nd Floor, Amit Plaza, Somajiguda, Hyderabad - 500 082. Tel. No. : +91-40-42014646/47
Fax: +91-40-40037521.Madurai No.278, 1st Floor, Nadar Lane, North Perumal Maistry Street, Madurai - 625 001. Tel.: 0452-6455530.Mangalore Shop No 4, Ground Floor, Raj Towers, Balmatta Road, Mangalore – 575001. Tel. : +91 9845287279.Mysore CH 26, Shop No 1, 2nd Floor, 7th Main, 5th Cross ( Veta Building ) Saraswathipuram, Mysore - 570009.Trivandrum T.C.2/3262(6), 1st Floor, RS Complex, Opposite LIC Building, Pattom P O, Trivandrum - 695 004.
Tel. : 9809053381.Trichy N Abdulla No. 28, First Cross Extension, Anna Nagar, Tennur, Trichy – 620 017EASTBhubaneswar Rajdhani House, 1st Floor, 77 Kharvel Nagar, Janpath, Bhubaneswar - 751001. Phone : 0674 6444252 / 0674
2531048 / 0674 2531148.Guwahati 4E, 4th Floor, Ganapati Enclave, G. S. Road, Ulubari, Opp. Bora Service Station, Guwahati - 781 007. Mobile:
9207410763, 9207410764, 9207410765, 9207410766.Jamshedpur IDFC Mutual Fund, Room No.111, 1st Floor, Yashkamal Complex, Main Road, Bistupur, Jamshedpur-831001, Ph No.
0657-2230112/111/222, Mobile No. : 9431102883.Kolkata Oswal Chambers, 1st Floor, 2 Church Lane, Kolkata - 700 001. Tel.: +91-33-40171000/ 1005.Patna 406, Ashiana Hariniwas, New Dakbanglow Road, Patna - 800 001. Tel.: +91-612-6510353. Ranchi : 306, Shrilok
Complex, 4 H B Road, Ranchi-834001 Phone : 0651-2212592/9931156362.Durgapur (West Bengal)
6/2A, Suhatta, 6th Floor, City Centre, Durgapur - 713216. Phone No.: +91 8537867746.
Related Documents