CRIUS ENERGY | ANALYST DAY | JANUARY 31, 2017 ANALYST DAY JANUARY 31, 2017

Welcome message from author
This document is posted to help you gain knowledge. Please leave a comment to let me know what you think about it! Share it to your friends and learn new things together.
Transcript

CRIUS ENERGY | ANALYST DAY | JANUARY 31, 2017
ANALYST DAYJANUARY 31, 2017

CRIUS ENERGY | ANALYST DAY | JANUARY 31, 2017 2
FORWARD-LOOKING STATEMENTS AND NON-IFRS MEASURESFORWARD-LOOKING STATEMENTSThis presentation contains forward-looking statements and forward-looking information (collectively, "forward-looking statements") that involve substantial known and unknown risks and uncertainties, most of which are beyond the control of Crius Energy Trust (the "Trust"), including, without limitation, statements pertaining to the objectives of the Trust (including to grow distributions to unitholders, increase valuation, grow customer base, increase customer lifetime value and reduce costs), the undervaluation/upside of the Trust, forecasted electricity demand, the value/growth proposition of deregulated energy, the future/success of solar energy, the value/growth proposition of solar energy, the impact of the restructuring transaction on the Trust, access to capital, scalable platform, diversified portfolio, customer churn, Xfinity relationship in 2017, customer revenues and margins, customer additions and renewals, customer consumption levels, distributable cash, revenue, payout ratio, cash availability, embedded margin, adjusted EBITDA, gross margin, selling expenses, general and administrative expenses, public float, current yield, annualized distribution, sufficiency of capital, stability of distributions, market penetration, cost-effective growth strategies, growth forecasts, risk management, accretiveness of acquisitions/transactions, treatment under governmental regulatory regimes and expected opening of energy markets. A statement may be considered a forward-looking statement when it uses what the Trust knows or expects today to make a statement about the future. Forward-looking statements may be identified by words such as anticipate, assume, believe, could, expect, goal, guidance, intend, may, objective, outlook, plan, seek, should, strive, target, will or other similar expressions. Statements that are not historical facts may be considered forward-looking statements and may involve estimates, assumptions and uncertainties, which could cause actual results or outcomes to differ materially from those expressed in such forward-looking statements. While these statements are based on current expectations, forward-looking statements inherently involve a number of risks and uncertainties which could cause actual results to differ from those anticipated. These risks include, but are not limited to, impact of weather, levels of customer natural gas and electricity consumption, rates of customer additions and renewals, fluctuations in natural gas and electricity prices, changes in regulatory regimes and decisions by regulatory authorities, competition, growth of the U.S. energy industry, dependence on certain suppliers, financial performance, and other business and economic conditions. Additional information on these factors and other factors that could affect the Trust's operations, financial results or distribution levels are described in (i) the annual information form of the Trust for the fiscal year ended December 31, 2015 (dated March 15, 2016), and (ii) the management's discussion and analysis of the Trust for the three and nine months ended September 30, 2016 (dated November 10, 2016), which can be accessed on SEDAR under the Trust's issuer profile at www.sedar.com.No assurance can be given that the expectations set forth in this presentation will ultimately prove to be accurate and, accordingly, such forward-looking statements should not be unduly relied upon. It is not possible for Management to predict new factors that may emerge from time to time, or to assess in advance the impact of each such factor on the Trust's business, or the extent to which any factor or combination of factors may cause actual results to differ materially from those contained in forward-looking statements. These forward-looking statements are given only as of the date of this presentation and the Trust does not assume any obligation to update or revise any forward-looking statement to reflect new events or circumstances, except as may be expressly required by applicable securities laws.This presentation is for informational purposes only and does not constitute an offer to sell or a solicitation of an offer to buy securities of the Trust, and is being provided to interested parties to assist them in their evaluation of the Trust.
NON-IFRS MEASURESStatements throughout this presentation may make reference to EBITDA, Adjusted EBITDA, Distributable Cash and payout ratio, which are non-IFRS financial measures commonly used by financial analysts in evaluating the financial performance of companies, including companies in the energy industry. Accordingly, Management believes EBITDA, Adjusted EBITDA, Distributable Cash and payout ratio may be useful metrics for evaluating the Trust's financial performance, as they are measures that Management uses internally to assess performance, in addition to IFRS measures. As there is no generally accepted method of calculating EBITDA, Adjusted EBITDA, Distributable Cash and payout ratio, these terms as used herein are not necessarily comparable to similarly titled measures of other companies. EBITDA, Adjusted EBITDA, Distributable Cash and payout ratio have limitations as analytical tools and should not be considered in isolation from, or as an alternative to, net (loss) income or other data prepared in accordance with IFRS. EBITDA is calculated as earnings before interest, taxes, depreciation and amortization. Adjusted EBITDA is calculated as EBITDA adjusted to exclude any change in the fair value of derivative instruments, change in fair value of non-controlling interest, change in fair value of warrant liability, unit-based compensation, goodwill impairment and distributions to non-controlling interest. The items excluded from EBITDA and Adjusted EBITDA are significant in assessing the Trust's operating results and liquidity. See the section entitled "Reconciliation of Net (Loss) Income and Total Comprehensive (Loss) Income to EBITDA and Adjusted EBITDA" in the management's discussion and analysis of the Trust to which such financial information relates for a reconciliation of EBITDA and Adjusted EBITDA to net loss and comprehensive loss as calculated under IFRS for the relevant periods, the most directly comparable measure in the Trust's consolidated financial statements. See the section entitled "Distributable Cash and Payout Ratio" in the management's discussion and analysis of the Trust to which such financial information relates for a reconciliation of Distributable Cash to cash flows provided by (used in) operating activities as calculated under IFRS, the most directly comparable measure in the Trust's consolidated financial statements. Other financial data has been prepared in accordance with IFRS.
All figures in this presentation are presented in U.S. Dollars and are reflective of information as at the end of the third quarter, September 30, 2016, unless otherwise noted.

CRIUS ENERGY | ANALYST DAY | JANUARY 31, 2017 3
SPEAKERS
• MICHAEL FALLQUIST, DIRECTOR & CHIEF EXECUTIVE OFFICER
• ROOP BHULLAR, CHIEF FINANCIAL OFFICER
• ROB CANTRELL, EXECUTIVE VICE PRESIDENT
• CHRISTIAN MCARTHUR, EXECUTIVE VICE PRESIDENT
• CHAITU PARIKH, CHIEF OPERATING OFFICER

CRIUS ENERGY | ANALYST DAY | JANUARY 31, 2017
MICHAEL FALLQUISTChief Executive Officer
4

CRIUS ENERGY | ANALYST DAY | JANUARY 31, 2017 5
CRIUS OBJECTIVES
REDUCE COSTS
GROW, DIVERSIFY AND DE-RISK CASH FLOWS
INCREASE CUSTOMER
LIFETIME VALUE
GROW CUSTOMER
BASE
GROWDISTRIBUTIONS TO
UNITHOLDERS
INCREASE VALUATION

CRIUS ENERGY | ANALYST DAY | JANUARY 31, 2017 6
2016: A BANNER YEAR FOR CRIUS ENERGY
2% Distribution Increase
Q1 2016
JANUARY
MARCH
Kona Customer Book Acquired~75,000 RCEs
DEMAND RESPONSE
Q4 2015 Results Adjusted EBITDA: $13.2 millionRCEs: 819,000
Q2 2016
FEBRUARY
APRIL
2% Distribution Increase
MAY
Q1 2016 Results Adjusted EBITDA: $14.4 millionRCEs: 916,000
Crius Goes 100% Public
2% Distribution Increase
JULY
SunEdison Direct Residential Solar Asset Purchase
Sale of Viridian Network Marketing Channel
JULY
Q4 2016
SEPTEMBER
OCTOBER
Verengo Residential Solar Installation Asset Purchase Announced
2% Distribution Increase
OCTOBER
Australia Customer Launch
Q2 2016 Results Adjusted EBITDA: $13.6 millionRCEs: 942,000
Q3 2016 Results Adjusted EBITDA: $20.6 millionRCEs: 962,000
AUGUST
AUGUST
Q3 2016
JUNE
NOVEMBER

CRIUS ENERGY | ANALYST DAY | JANUARY 31, 2017 7
INCREASING DISTRIBUTIONS; UNIT PRICE DECLINED YOY
MARKET CAP DOUBLED; 5X DISTRIBUTION INCREASES; COSTS DOWN AND RCEs UP
DISTRIBUTION PER UNIT KWH.UN
$0.175$0.179
$0.182$0.186
$0.190$0.193
$0.197$0.201
$0.205
$0.160
$0.165
$0.170
$0.175
$0.180
$0.185
$0.190
$0.195
$0.200
$0.205
$0.210
Q4 2015 Q1 2016 Q2 2016 Q3 2016 Q4 2016 Q1 2017 Q2 2017 Q3 2017 Q4 2017

CRIUS ENERGY | ANALYST DAY | JANUARY 31, 2017 8
PUBLIC MARKET VALUATION BENCHMARKSEV / 2017E EBITDA(1)
(1) Company filings, CapitalIQ and Bloomberg as at January 27, 2017. Crius 2017E EBITDA adjusted for estimated $10M (based on LTM) of financing costs not related to cash borrowings. (2)Select US Utilities and Select US IPP’s include companies with energy retail operations. Note: Energy Retailers comprised of Just Energy and Spark Energy; Canadian Home / Energy Services comprised of Enercare, Parkland, Superior Plus; Canadian Utilities comprised of AltaGas, Canadian Utilities, Emera, Enbridge, Fortis, Hydro One, TransCanada; US Utilities comprised of American Electric Power, CenterPoint Energy, Dominion Resources, Exelon, FirstEnergy, NextEra Energy, South Jersey, The Southern Company, WGL Holdings; Canadian Contracted IPP’s comprised of Algonquin, Boralex, Brookfield Renewable Partners, Innergex, Northland Power, TransAlta Renewables; US IPP’s comprised of Calpine, Dynegy, NRG Energy; Integrated Solar comprised of Canadian Solar, First Solar, SunPower Corporation.
CriusAverage
(2) (2)
DIVIDEND YIELD
CriusAverage
-
2.0%
4.0%
6.0%
8.0%
10.0%
Energy Retailers Canadian Home / EnergyServices
Canadian Utilities Canadian Contracted IPPs Select US Utilities Select US IPP's(2) (2)
2.0x
4.0x
6.0x
8.0x
10.0x
12.0x
14.0x
16.0x
Energy Retailers Canadian Home / EnergyServices
Canadian Utilities Canadian Contracted IPPs Select US Utilities Select US IPP's Integrated Solar

CRIUS ENERGY | ANALYST DAY | JANUARY 31, 2017 9
8.4%
6.5%
4.9%
2.7%2.0%
2.5%
4.5%
1.3%2.0%
3.3%
1.7% 1.5% 1.2%
5.8%
3.5%4.3%
-
2.0%
4.0%
6.0%
8.0%
10.0%C
rius
Just
Ene
rgy
Spa
rk E
nerg
y
S&
P T
SX
S&
P 5
00
TSX
Sm
all-
Cap
TSX
Div
iden
dA
risto
crat
s
Con
sum
er
Ene
rgy
Fina
ncia
ls
Hea
lth C
are
Indu
stria
l
Mat
eria
ls
RE
IT
Tele
com
Util
ities
Div
iden
d Yi
eld
(%)
CRIUS DIVIDEND YIELD
(1) Bloomberg as at January 27, 2017(2) TSX Dividend Aristocrats measures the performance of companies included in the S&P Canada BMI that have followed a policy of consistently increasing dividends every year for at least five years
CRIUS DIVIDEND YIELD VS. INDEXES(1)
S&P TSX Sub-Indexes

CRIUS ENERGY | ANALYST DAY | JANUARY 31, 2017 10
FUNDAMENTALLY STRONG CORE BUSINESS, PLUS UPSIDE
OUR CORE RETAIL ENERGY BUSINESS:
REVENUE: 3yr CAGR of 13%
EBITDA: 3yr CAGR of 25%
CUSTOMERS: 3yr CAGR of 17%
DIVERSIFIED CUSTOMER PORTFOLIO
MATERIAL Y-o-Y REDUCTION IN CHURN
SOLAR COMCAST M&A
CLEAR PATH TO CONTINUED GROWTH
OPTION VALUE:
BEST IN CLASS RISK MANAGEMENT

CRIUS ENERGY | ANALYST DAY | JANUARY 31, 2017
INDUSTRY OVERVIEWDeregulated Energy
11

CRIUS ENERGY | ANALYST DAY | JANUARY 31, 2017 12
DEREGULATED ENERGY: A GROWING MARKET
• Population 2.9 million; each new resident requires 20,000 KWh of electricity every year.
• Las Vegas alone reaches 6,000 – 8,000 megawatts of peak electric capacity on a summer day. Source: Forbes magazine
19.8 M (32%)
42.8 M (68%)
Third-Party With Utility
62.6 MILLION U.S. METERS CURRENTLY ELIGIBLE
NEBRASKA• Energy-intensive industrial sector puts Nebraska in the top 10
states in per capita energy consumption (primarily food processing and chemical manufacturing). Source: http://www.eia.gov/state
• Farm irrigation also is electricity-intensive and seasonal; further drives the average reported cost of electricity for Nebraska’s industrial sector.
PLUS, NEW MARKETS ARE EMBRACING ENERGY CHOICE
NEVADA
JAPAN• Market opened in April and roughly 820,000 households switched
immediately. Now up to over 2 million. Source: The Japan Times
Source: DNV GL. Retail Landscape, April 2016

CRIUS ENERGY | ANALYST DAY | JANUARY 31, 2017
13
DEREGULATED ENERGY: A STRONG VALUE PROPOSITION
$3 BILLION “…regions using a market approach to buy and trade electricity save about $3 billion a year because of the increased efficiencies and coordination the markets bring.”UNIVERSITY OF CHICAGO STUDY
https://epic.uchicago.edu/sites/default/files/UCH-ElectricityDistribute.Final_.pdfBased on simulated data pooled from daily electricity operating reports from nearly every electricity generating site in the country from 1999 to 2012
“Some policymakers are right now deciding whether their state should join a market system, while others are deciding whether they should return to the regulated approach. While these markets are certainly vulnerable to market power, this study shows that previously unmeasured cost reductions far outweigh those losses.”Steve Cicala, HARRIS SCHOOL OF PUBLIC POLICY
IN SAVINGS
“ “
13

CRIUS ENERGY | ANALYST DAY | JANUARY 31, 2017
14
DEREGULATED ENERGY: A STRONG VALUE PROPOSITION
https://epic.uchicago.edu/sites/default/files/UCH-ElectricityDistribute.Final_.pdfBased on simulated data pooled from daily electricity operating reports from nearly every electricity generating site in the country from 1999 to 2012
TDU SERVICE TERRITORY
LAST REGULATEDRATE (2001) cents/kWh
LAST REGULATEDRATE, Adjusted for
inflation
CURRENT LOWEST FIXED PRICE
PERCENTAGE CHANGE
AEP Central 9.6 13.1 5.6 -57.3%
AEP North 10.0 13.6 5.0 -63.2%
Center Point 10.4 14.1 5.4 -61.7%
ONCOR 9.7 13.2 4.5 -65.9%
TNMP 10.6 14.4 5.0 -65.3%
* PUCT Report, 2017 Scope of Competition in Electric Markets in Texas, page 4.
TEXAS INFLATION-ADJUSTED COMPARISON OF REGULATED AND COMPETITIVE RATES12 Month Fixed Price, 2017 Report*
14

CRIUS ENERGY | ANALYST DAY | JANUARY 31, 2017 15
DEREGULATED ENERGY: CONTINUED GROWTH
Source: DNV GL Retail Energy Outlook, H2 2016
224 27
0
299
294 39
8
404
405 47
4 545
575
597
605
612
611
618
628
641
649
658
22
28
34 35
86 88 92
114
136 15
5 183
187
182
184
184
186
189
189
192
0
100
200
300
400
500
600
700
800
900
2003 2004 2005 2006 2007 2008 2009 2010 2011 2012 2013 2014 2015 2016 2017 2018 2019 2020 2021
U.S. Competitive Retail Power Market Size (TWh), 2003-2021
Non-Residential Base Residential Base

CRIUS ENERGY | ANALYST DAY | JANUARY 31, 2017
INDUSTRY OVERVIEWSolar Energy
16

CRIUS ENERGY | ANALYST DAY | JANUARY 31, 2017 17
SOLAR ENERGY: A ROBUST PROJECTION
0
1,000
2,000
3,000
4,000
5,000
6,000
7,000
2014 2015E 2016E 2017E 2018E 2019E 2020E0
1,000
2,000
3,000
4,000
5,000
6,000
7,000
2014 2015E 2016E 2017E 2018E 2019E 2020E
(MW) U.S. Residential PV Installations (Pre-ITC Extension)
U.S. Residential PV Installations (Post-ITC Extension)
The Solar Investment Tax Credit (ITC) provides a 30% tax credit to solar system owners.
ITC extension in December 2015 saved over 200,000 U.S. jobs.
Bi-partisan issue: 84% of President Trump’s supporters are in favor of solar.**
(MW)
ITC EXTENSION WILL INCREASE SOLAR INSTALLATIONS 54% BY 2020*:
*Greentech Media, “Investment Tax Credit Extension Would Increase US Solar Installations 54% Through 2020.” https://www.greentechmedia.com/articles/read/investment-tax-credit-extension-will-increase-solar-installations-54-throug **Deutsche Bank.

CRIUS ENERGY | ANALYST DAY | JANUARY 31, 2017 18
SOLAR ENERGY: A STRONG VALUE PROPOSITION
c/kWh
2005
300
250
200
150
100
50
0
c/kWh
25
20
15
10
5
0
Solar U.S. Retail Electricity Solar U.S. Retail Electricity
2010 2015 2015 2020 2025 2030
350
Note: All data represents U.S. national averages.Source: U.S. Energy Information Administration for retail electricity cost forecast: Bloomberg New Energy Finance. GTM Research. U.S. Census Bureau data, and management expectations for solar cost forecast.
COST OF SOLAR & RETAIL ELECTRICITY (2005-2015)
EXPECTED COST OF SOLAR & RETAIL ELECTRICITY(2015-2030)
Present Day

CRIUS ENERGY | ANALYST DAY | JANUARY 31, 2017 19
SOLAR ENERGY: A GROWING MARKET
Source: GTM Research, US Census Bureau and management estimates. Includes US Only.
Cumulative residential
solar installs0.9 Million
Estimated households for which solar would be cheaper than retail
35 Million
Cumulative residential
solar installs4.3 Million
Estimated households for which solar would be cheaper than retail
88 Million
2015 2020E

CRIUS ENERGY | ANALYST DAY | JANUARY 31, 2017 20
MARKET# of
installed (MWs)
CURRENT SENTIMENT
YOY SENTIMENT RECENT DEVELOPMENTS
Massachusetts 1,199 POSITIVE POSITIVE Ranked #1 nationally with a new net metering bill in April 2016
New York 802 POSITIVE POSITIVE Governor’s energy vision should drive additional investment / interest in solar
New Jersey 1,839 POSITIVE POSITIVE $486 million was invested in solar installations in 2015
Maryland 508 POSITIVE POSITIVE 167 MW of solar electric capacity installed last year, growth of 109%
Connecticut 265 POSITIVE POSITIVE Installed capacity grew by 64% 2014 to 2015
Delaware 88 POSITIVE POSITIVE 137% growth 2014 to 2015
California 15,049 POSITIVE POSITIVE Existing solar property tax exclusion extended through January 1, 2025
D.C. 18 POSITIVE POSITIVE #31 nationally; 170% growth over last 3 years
New Mexico 406 POSITIVE POSITIVE In 2015, $86 million was invested in solar installations in New Mexico
Oregon 134 POSITIVE POSITIVE In 2016, a 157% increase over the previous year
Rhode Island 17 POSITIVE POSITIVE Feed in Tariff: pays solar panel owners a great deal more than retail rates for the electricity their system produces
Vermont 127 POSITIVE POSITIVERecent discussions regarding VT’s renewable energy goals, and a performance incentive program from the state’s largest utility are strong signs for the future
SOLAR ENERGY: A SUPPORTIVE ENVIRONMENT

CRIUS ENERGY | ANALYST DAY | JANUARY 31, 2017 21
SOLAR MARKET PERFORMANCE
Source: Guggenheim Solar ETF, formerly Claymore/MAC Global Solar Energy Index ETF, seeks investment results that correspond generally to the performance of an equity index called the MAC Global Solar Energy Index (the Index). The Index consists of approximately 25 stocks selected based on the relative importance of solar power within the Company's business model, as determined by MAC Indexing LLC (the Index Provider). The Index is designed to track companies within the business segments of the solar energy industry, which include companies that produce solar power equipment and products for end users, companies that produce fabrication products (such as the equipment used by solar cell and module producers to manufacture solar power equipment) or services (such as companies specializing in the solar cell manufacturing or the provision of consulting services to solar cell and module producers) for solar power equipment producers. The Fund’s investment advisor is Claymore Advisors, LLC.

CRIUS ENERGY | ANALYST DAY | JANUARY 31, 2017 22
SELECT SOLAR MARKET COMPARABLESREQUIRES ABUNDANT ACCESS TO LOW-COST CAPITAL

CRIUS ENERGY | ANALYST DAY | JANUARY 31, 2017 23
INDUSTRY DYNAMICS CREATE OPPORTUNITIES
TRADITIONAL UTILITIES:• Regulated product offerings, often dislocated from market
conditions
• Incentivized by infrastructure spending and grid reliability
• Increasing penetration of solar and energy efficiency products
• Increasing customer awareness and engagement
SOLAR PROVIDERS:• Uncertainty in highly levered, retained value
business model
• High cost-to-acquire customers
• High cancellation rates
CRIUS ENERGY:• Broad range of energy products offered (fixed, variable, green,
“bundled”, etc); flexible to change with market conditions
• Customer-centric business model
• Strategy to enhance customer lifetime value through solar and energy efficiency products
• High value, cash flow positive origination and installation management business model
• 20+ year customer relationship to monetize through balancing power, cross-selling, O&M fees and warranties
• Low cost lead generation via ~100,000 new energy customers added each quarter + 1-2 million current and former customers
• “Bundled” product reduces customer cancellation rates
CRIUS ENERGY:

CRIUS ENERGY | ANALYST DAY | JANUARY 31, 2017 24
THE CONVERGENCE OF RETAIL ENERGY AND SOLAR
ELECTRICITY & NATURAL GASIN DEREGULATED MARKETS
SERVING ~ 1 MILLION RCEs*
BEST IN CLASS RISK MANAGEMENT
SOLARIN STATES WITH FAVORABLE MARKET DYNAMICS
VERTICALLY INTEGRATED CAPABILITY
INSTALLED 20,000+ SOLAR SYSTEMS**
*A Residential Customer Equivalent or RCE is a unit of measure used by the energy industry to denote the typical annual commodity consumption by a single-family residential customer. A single RCE represents 100 MMBtu of natural gas or 10 MWh of electricity. **Pending close of Verengo acquisition.

CRIUS ENERGY | ANALYST DAY | JANUARY 31, 2017
ROOP BHULLAR Chief Financial Officer
25

CRIUS ENERGY | ANALYST DAY | JANUARY 31, 2017 26
GROSS MARGIN TRENDS
The defining trends impacting deregulated energy gross margins over the
last several years have been materially lower wholesale energy prices
and growth of the commercial customer portfolio
$-
$1.00
$2.00
$3.00
$4.00
$5.00
$6.00
$-
$20
$40
$60
$80
$100
$120
$140
2013 2014 2015 2016
Declining wholesale energy prices
PJM West Hub ($/MWh)
NYMEX Henry Hub ($/MMBTu)
3.5
7.5
1.2 1.6
-
1.0
2.0
3.0
4.0
5.0
6.0
7.0
8.0
9.0
Q1 Q2 Q3 Q4 Q1 Q2 Q3 Q4 Q1 Q2 Q3 Q4
2014 2015 2016
Increasing customer size(in RCEs)
Commercial Total
24%
37%
20%
25%
30%
35%
40%
45%
Q1 Q2 Q3 Q4 Q1 Q2 Q3 Q4 Q1 Q2 Q3 Q4
2014 2015 2016
Increasing proportion of commercial RCEs (%)

CRIUS ENERGY | ANALYST DAY | JANUARY 31, 2017 27
FY 2014 FY 2015 LTM 2016
GROSS MARGIN TRENDS (cont.)• Gross Margins flattened in 2016 reflecting margin
pressures offset by volumetric growth of the portfolio– Going forward, expect volumetric growth to offset lower
unit margins
• Historically achieved average annual Gross Margin per RCE within $175-$225 range
• Unit margins trending lower as a result of:– Skew to longer-term, lower margin, commercial
customers
– Margin pressure due to low wholesale price environment
• Growth in commercial customers expected to continue to drive annual gross margin per RCE towards $150 over next two years
• Positive trends in lower average attrition, lower costs to serve and lower costs to acquire provide an offsetting impact to lower gross margins per RCE
MARGIN PRESSURES OFFSET BY VOLUMETRIC GROWTH, HIGHER CLV, SCALE BENEFITS & LOWER COSTS
Gross Margin ($/RCE, per year)
Gross Margin ($M)
$119.1
$159.3 $155.2

CRIUS ENERGY | ANALYST DAY | JANUARY 31, 2017 28
LOWER COSTS• Achieved reduction in fixed costs of
$35/RCE from 2015. Driven by:– Operating leverage improved as fixed costs
are spread over an almost 40% larger customer base
– Restructuring of Viridian sales channel achieved ~$11M annual savings in fixed G&A
– Various workforce rationalizations focused on making operations more efficient
• Cost to acquire reduced by $7/RCE from 2015, reflecting channel mix for new sales
• Combined reduction of over $40/RCE from 2014 to 2016 and expect scale benefits to drive further reductions of ~$15 to $25/RCE over the next two years
COST TO SERVE(Fixed G&A per RCE, deregulated energy)
$56
$72
$85
$68
$50
$-
$10
$20
$30
$40
$50
$60
$70
$80
$90
COST TO ACQUIRE(Upfront selling expense per RCE, deregulated energy)
$37
$47
$34
$27
$0$5
$10$15$20$25$30$35$40$45$50
2013 2014 2015 LTM 20162013 2014 2015 LTM Q2
2016
Q3 2016
annual-ized
SCALE BENEFITS, FOCUS ON COST CONTROL AND CHANNEL MIX OFFSET MARGIN PRESSURE

CRIUS ENERGY | ANALYST DAY | JANUARY 31, 2017 29
CAPITAL EXPENDITURES
• 2016 capex of $11.7M included $4.9M related to the corporate office relocation. It should be noted that:
– Gross of $1.8M cash tenant incentive– Includes capital leases of $0.7M, which did not
represent a cash cost
• 2016 capex, after removing the impact of one-time corporate office relocation costs, was $6.8M, returning to more normalized levels following elevated spend related to strategic initiatives in 2015
• Forward expectation for capex within $4.0M to $6.0M range $0.0
$2.0
$4.0
$6.0
$8.0
$10.0
$12.0
$14.0
2013 2014 2015 LTM 2016
HISTORICAL CAPEX ($M)
Capex Office Capex

CRIUS ENERGY | ANALYST DAY | JANUARY 31, 2017 30
RESTRUCTURING TRANSACTION
• Completed successful transaction to take 100% of Crius public via C$72.5M equity offering and LLC units purchase and restructure
• Benefits include:– Increased market capitalization ~2x
– Improved trading liquidity ~2x *
– Reduced bid-ask spread >50%
– Simplified corporate structure and
financial statements
0.11
0.10
0.08 0.08
0.05
0.03
0.050.06
0.05 0.05
0.07
0.050.04
0.000
0.020
0.040
0.060
0.080
0.100
0.120
0
20,000
40,000
60,000
80,000
100,000
120,000
140,000
160,000
Average Daily Volume (# Units) Bid-Ask Spread
*Post-transaction announcement trading volumes normalized to remove the impact of 1.2 million units traded on May 18, 2016 following the announcement of the restructuring and 855,000 units traded on June 7, 2016 following the announcement of the completion of the restructuring, as these are not typical trading volumes.
Announcement of transaction

CRIUS ENERGY | ANALYST DAY | JANUARY 31, 2017 31
RESTRUCTURING TRANSACTION (cont.)
• Lock-up agreements in place with founding LLC holders to ensure orderly trading of units following restructuring transaction
• Initially, 14.8M units subject to lock-up in 4 tranches, which expire following 6, 12, 18 and 24 months from close of the restructuring transaction in June 2016
• In December 2016, 5.1M units (including the potentially ‘higher risk’ <1% holders) became freely tradable, with minimal activity and minimal impact to unit price
• Currently, 9.6M units held by founding LLC holders remain under lock-up:
– 4 groups of founding LLC holders hold such units (CEO, >10% “insider”, 2 non-insider holders)
– 7.0M units held by “insiders” (including CEO and >10% holder), leaving only 2.6M units held by non-insiders left under lock-up, representing only 6.5% of the total units outstanding
0
2
4
6
8
10
12
14
16
Jun 2016 Dec 2016 Jun 2017 Dec 2017 Jun 2018
"Insiders" Non-insiders
UNITS UNDER LOCK-UP
As at Jan 2017, only 6.5% units of outstanding units are held by
non-insiders in lock-up
# of
uni
ts (M
)
37%
24%
16%
8%

CRIUS ENERGY | ANALYST DAY | JANUARY 31, 2017 32
DISTRIBUTION & PAYOUT RATIO
ILLUSTRATIVE EXAMPLE:
Impact on payout ratio of current 8% annual distribution growth under Distributable Cash growth scenarios
• Maintain current 8% annual distribution increases
• Current foreign exchange forward rates
• Grown Distributable Cash by 3-year CAGR of 13% since 2013
• Focused on growth and sustainability of distribution
• 5 quarterly 2% increases in distribution rate per unit
• Current LTM payout ratio of ~60%
• Current distributions hedged out to 2018 with floor exchange rate of C$1.34 per US$1.00
DISTRIBUTION PER UNIT
C$0.175C$0.179
C$0.182C$0.186
C$0.190C$0.193
C$0.197C$0.201
C$0.205
$0.160
$0.165
$0.170
$0.175
$0.180
$0.185
$0.190
$0.195
$0.200
$0.205
$0.210
Q4 2015 Q1 2016 Q2 2016 Q3 2016 Q4 2016 Q1 2017 Q2 2017 Q3 2017 Q4 2017
FY 2017 FY2018 FY 20190.0% 63% 68% 73%2.5% 61% 65% 68%5.0% 60% 62% 63%
10.0% 57% 56% 55%15.0% 55% 51% 48%D
istri
buta
ble
Cas
h G
row
th R
ate
C$

CRIUS ENERGY | ANALYST DAY | JANUARY 31, 2017
ROB CANTRELLExecutive Vice President
33

CRIUS ENERGY | ANALYST DAY | JANUARY 31, 2017 34
2013 2014 2015 LTM 2016
A STRONG BUSINESS BY ANY MEASURE
615,000
569,000
819,000
962,000
2013 2014 2015 LTM
3 year CAGR of 15%CUSTOMERS*
(Deregulated Energy Only)ADJUSTED EBITDA
$31.8 M$35.0 M
$55.8 M
$62.0 M
2013 2014 2015 LTM 2016
(Deregulated Energy Only)ANNUAL ORGANIC CUSTOMER ADDS
363,000
266,000
377,000396,000
*A Residential Customer Equivalent or RCE is a unit of measure used by the energy industry to denote the typical annual commodity consumption by a single-family residential customer. A single RCE represents 100 MMBtu of natural gas or 10 MWh of electricity.

CRIUS ENERGY | ANALYST DAY | JANUARY 31, 2017 35
COMPETITIVE ADVANTAGE: CRIUS CORE CAPABILITIES
SALES &MARKETING
PRODUCT STRUCTURING
& RISK MANAGEMENT
SCALABLEPLATFORM
ACCESS TO CAPITAL

CRIUS ENERGY | ANALYST DAY | JANUARY 31, 2017 36
Active markets
Pending markets
CRIUS IS ACTIVE IN
21 MARKETS IN THE U.S. AND AUSTRALIA
COMPETITIVE ADVANTAGE: CRIUS FOOTPRINT

CRIUS ENERGY | ANALYST DAY | JANUARY 31, 2017 37
DIVERSIFIED SALES APPROACH
COMMERCIAL AGGREGATIONS RESIDENTIAL

CRIUS ENERGY | ANALYST DAY | JANUARY 31, 2017 38
CONTINUED GROWTH: YOY 18% growth 2015-2016, CAGR 23% 2013-2016
EXPERIENCED TEAM: Broker Desk team with over 50 years of combined broker management experience
PRICING THROUGHPUT: Proprietary pricing system active in all markets for electric and natural gas – pricing,
contracting, deal confirmation, commissions, enrollment
PAY CORRECTLY AND ON TIME: Commission system deployed for all markets and brands
SPREAD THE NET: 850+ brokers under contract, 500+ paid each month
EXTENDED REACH: Quality sales driven by a combination of internal sales team and external relationships
HIGHLY RESPECTED: Top 3 in ERCG Natural Gas survey, Top 10 in Electric (one of the largest jumps from 2015)
LARGE COMMERCIAL COMMERCIAL
Custom-priced commercial and industrial customers, typically over 50KW.

CRIUS ENERGY | ANALYST DAY | JANUARY 31, 2017 39
NEW BUSINESS SEGMENT: Grew from 0 in 2015 to over 10% of booked gross margin in 2016
PRICING THROUGHPUT: Enhanced broker portal allows deal submission and TPV automation
SENIOR LEADERSHIP: Decades of sales and indirect channel experience
MARGIN-DRIVER: Average gross margin of over $15/MWH – much higher than Large Commercial customers
EXTENDED REACH: Quality sales driven by a combination of internal sales team and external relationships
MASS MARKET COMMERCIAL COMMERCIAL
Matrix-priced small and medium commercial customers; sold through external brokers and internal sales groups.

CRIUS ENERGY | ANALYST DAY | JANUARY 31, 2017 40
CONTINUED GROWTH: 2016 largest year ever – 129% growth from 2015
IMPLEMENTATION EXPERIENCE: First aggregation won in 2013 – numerous new and renewals since
ADDITIONAL PARTNERS: Only one aggregator from 2013-2015 – 5 total in 2016
DIVERSE FOOTPRINT: Expansion to MA from NJ in 2016 – IL and others on roadmap
TOP BIDDER: 52% bid win percentage by opportunity, 45% by volumes
MUNICIPAL AGGREGATIONS AGGREGATIONS
Residential and small commercial customers acquired through formal bid and opt-out process; enabled through specific state programs.

CRIUS ENERGY | ANALYST DAY | JANUARY 31, 2017 41
CONTINUED GROWTH: YOY 15% growth 2015-2016
EXPANDING CHANNELS: Over 300 residential partners referring customers– most of the biggest online players
NEW ENERGY PRODUCTS: Bucket plans, community solar, tiered rates, demand response
EXPANDED WALLET: Thermostats, energy efficiency products, lighting, energy audits, rewards programs
COMING SOON: Filters and warranty programs
STANDARD OFFER PROGRAMS: Opportunistic participation in targeted markets
CONSTANT COMMUNICATION: Expanded digital and online activities
DIRECT MARKETING: Advertising and sponsorships shifting customer acquisition profile
MASS MARKETS RESIDENTIAL
Residential customers acquired through online partners and direct marketing channels.

CRIUS ENERGY | ANALYST DAY | JANUARY 31, 2017 42
CONTINUED GROWTH: YOY 222% RCE growth 2015-2016
INCREASED ENGAGEMENT: Call center promotions and trainings expanded Cincinnati Bell and FairPoint sales
NEW CUSTOMERS: Small commercial programs showing initial success
RE-ENGINEERING: Preparing Comcast for launch into new channel
EXPANDING FOOTPRINT: New platform partners onboarding Q1 2017
PRIVATE LABEL RESIDENTIAL
Residential and small commercial customers sold through white-label partnerships including Cincinnati Bell, FairPoint Communications and Comcast.

CRIUS ENERGY | ANALYST DAY | JANUARY 31, 2017 43
CHANNEL TRANSITION: Sale of network marketing channel to Viridian International Management (VIM)
PRICING STRATEGY: Eliminated guaranteed savings products and teaser rates in Q4 – optimal fixed & term-free
RE-FOCUS: Viridian to return to green and sustainability roots – avoid price discussion
PARTNER DIVERSIFICATION: VIM launched travel products – expands footprint and brings in new associates
LEVERAGE REACH: Dedicated commercial VIM team leading to early success for new and renewals
NETWORK MARKETING RESIDENTIAL
Residential and small commercial customers sold through the Viridian network of over 20,000 associates.

CRIUS ENERGY | ANALYST DAY | JANUARY 31, 2017 44
COMPETITIVE ADVANTAGE: DIVERSIFIED PORTFOLIO
CONTRACT TYPE
FixedVariable
IPO CURRENT
CUSTOMER SEGMENT
CommercialResidential
IPO CURRENT
89%
11%
20%
80%
22%
78%
38%
62%
COMMODITY / GEOGRAPHYIPO CURRENT
Mid-Atlantic – Electric
New England - Electric
Texas - Electric
New York - Electric
Midwest - Electric
Natural Gas
58%
36%
6%
7% 1%7%
14%
18%
53%
Mid-Atlantic (PJM) represents all or parts of DE, IL, IN, KY, MD, MI, NC, NJ, OH, PA, TN, VA, WV and DC. New York (NY-ISO) represents NY exclusively.New England (ISO-NE) represents all or parts of CT, MA, ME, NH, RI and VT. Midwest (MISO) represents all or parts of AK, IA, IL, IN, KY, LA, MI, MN, MO, MS, MT, ND, SD, WI, TX and Manitoba, Canada. Texas (ERCOT) represents TX exclusively.

CRIUS ENERGY | ANALYST DAY | JANUARY 31, 2017 45
MAKING CUSTOMERS “STICK”
CHURN FY 2016
3.4%
4.1%
3.4%
4.1%
5.6%
4.5%4.2%
5.0%4.8%
4.2%
3.2%3.1%
2.7%2.9%
2.5%
2.0%
2.5%
3.0%
3.5%
4.0%
4.5%
5.0%
5.5%
6.0%
Q1 2013 Q2 2013 Q3 2013 Q4 2013 Q1 2014 Q2 2014 Q3 2014 Q4 2014 Q1 2015 Q2 2015 Q3 2015 Q4 2015 Q1 2016 Q2 2016 Q3 2016
Monthly Customer Attrition

CRIUS ENERGY | ANALYST DAY | JANUARY 31, 2017 46
REDUCING CUSTOMER CHURN
PREVENTION REACTION RETENTION

CRIUS ENERGY | ANALYST DAY | JANUARY 31, 2017 47
NO SURPRISES: Most new customers choosing fixed products versus variable
NO GIMMICKS: Mass Market brands have avoided widespread teaser rates and complicated products
EXTENDED TERMS: Average customer term increasing with long-term incentives and better pricing
EARLY TERMINATION FEES: Most new products have maximum early termination fees allowed by law
SALES ALIGNMENT: True-ups, chargebacks, and residuals keep internal and external sales channels focused
on quality customers
AVOIDING ATTRITION IN ADVANCE PREVENTION

CRIUS ENERGY | ANALYST DAY | JANUARY 31, 2017 48
IDENTIFY PROBLEMS EARLY: Weekly feedback from compliance helps to isolate and identify issues negatively
impacting customers
DROP REPORTS: Sales teams receive weekly drop reports to help to run save/win-back activities
DROP THE HAMMER: Consistent and timely enforcement of early termination fees led to a $1 million improvement
CONSTANT COMMUNICATIONS: Owning any mistakes and keeping the customers in the loop
FIX ISSUES QUICKLY REACTION

CRIUS ENERGY | ANALYST DAY | JANUARY 31, 2017 49
COMMUNICATIONS: Increased renewal notices by mail and email – more than regulatory minimum
EASY PROCESS: 5 minute online renewal process or short call to customer service
INCENTIVES: Discounted thermostats and efficiency kits to targeted renewals, higher value for longer terms
MOST FAVORED: Renewing customers can choose any new customer rates (requires discipline)
SEGMENTS: Target high-value customers to improve dynamics of overall customer base
KEEP THE CUSTOMERS YOU WANT RETENTION

CRIUS ENERGY | ANALYST DAY | JANUARY 31, 2017
CHRISTIAN MCARTHURExecutive Vice President
50

CRIUS ENERGY | ANALYST DAY | JANUARY 31, 2017 51
STRENGTHENED RISK MANAGEMENT TEAM
• Tom McGinn, Vice President, Supply and Energy Procurement
– Joined Crius from Entrust Energy in Houston
– Worked as a Director of Wholesale Supply
– Spent six years at Just Energy
– Most recently as Director of Electricity Trading
– Holds a master’s degree in Finance from Tulane University
– Also, a bachelor's degree in Economics from the College of
William & Mary
PROVEN LEADERSHIP AND EXPERTISE ENABLES DUAL FOCUS ON RETAIL ENERGY AND SOLAR

CRIUS ENERGY | ANALYST DAY | JANUARY 31, 2017 52
OUR SOLAR HISTORY
• Partners with SolarCity -- the nation’s #1 solar provider -- to offer its residential solar energy products
2013-4• Launches co-branded
solar offering with Sungevity to improve value and enhance customer experience
• U.S. Investment Tax Credit (ITC) Extended
2015
• Acquires residential solar energy assets from SunEdison; establishes strategic partnerships with solar financiers
• Announces planned acquisition of solar energy installation capabilities from Verengo Solar
• Launches Crius Solar, our flagship solar energy brand
2016
50 MW+ SOLD
QUICKLY RAMPED TO TOP VOLUME PRODUCING SOLAR RESELLER; WORKED TO ENHANCE RETURNS ACROSS VALUE CHAIN

CRIUS ENERGY | ANALYST DAY | JANUARY 31, 2017 53
STRONG SOLAR ENERGY CUSTOMER VALUE PROPOSITION
• Immediate Savings– Particularly with $0 down options
• Long-Term Savings– 20-year hedge on electricity rates– 30+ year system life means “free” energy for a decade+
• Environmental Benefits– Contribute to carbon emissions reduction
• Tax Benefits– Federal ITC: 30% tax credit– State rebates and incentives
• Property Appreciation– Solar homes sell for $15,000 more*
SOLAR ENERGY DELIVERS:
*U.S. Department of Energy's Lawrence Berkeley National Laboratory Report

CRIUS ENERGY | ANALYST DAY | JANUARY 31, 2017 54
A RANGE OF BENEFITS: SOLAR FINANCING OPTIONS
PPA / LEASE SOLAR LOAN CASH PURCHASE
DOWN PAYMENT Options from as low as $0 down Requires little to no upfront payment 50% paid prior to install; 50% paid in full afterwards
INCENTIVES All incentives rolled into pricing Customer can use incentives to lower their loan payments Customer keeps incentives
WARRANTY 20-year system warranty 20-year system warranty 20-year system warranty
MONTHLY PAYMENTS
Fixed or variable monthly payments depending upon option chosen
Consistent monthly payment until balance is paid in full No monthly payments
THIRD-PARTY CUSTOMER-OWNED

CRIUS ENERGY | ANALYST DAY | JANUARY 31, 2017 55
A ROBUST AND GROWING SOLAR MARKET
Source: GTM Research U.S. Solar Market Insight, 2015 Year in Review (March 2016)
The cost to install solar in the U.S. has fallen over 60% in the last 10 years1
1%
(1) GTM Research “Solar Industry Data 2016”(2) GTM Research “How to Improve the Solar Customer Experience—
and Get More Referrals”
Underpenetrated, growing market2
The US added about 125 solar panels every minute in 2016, about double the pace in 2015.
Annual U.S. Residential Solar Installations (MW)
6,000
5,000
4,000
3,000
2,000
1,000
0
2000 2001 2002 2003 2004 2005 2006 2007 2008 2009 2010 2011 2012 2013 2014 2015 2016E 2017E 2019E 2020E2018E
$8.00
$7.00
$6.00
$5.00
$4.00
$3.00
$2.00
$1.00
$-2009 2010 2011 2012 2013 2014 2015 1H 2016
Solar PV Installations
Forecasted Solar PV Prices
14,000
12,000
10,000
8,000
6,000
4,000
2,000
0

CRIUS ENERGY | ANALYST DAY | JANUARY 31, 2017 56
-
1
2
3
4
5
6
Qtr1 Qtr2 Qtr3 Qtr4 Qtr1 Qtr2 Qtr3 Qtr4 Qtr1 Qtr2 Qtr3 Qtr4
2014 2015 2016
Crius Solar Sales Partner Breakage
SOLAR PROGRAM RECAP
• Crius able to deliver solar sales, despite
partner changes, inferior products– 5-20% close rate on leads
• Significant breakage post-Crius sale /
handoff to solar partner– 30% Installation rate (vs. 50% industry avg)
• Solar partner with insufficient funding capital
exacerbated pricing issues
Partner switchLost opportunity due to partner
GREATER CONTROL NEEDED TO UNLOCK FULL VALUE OF SALES CHANNELS AND CUSTOMER BASE
(MW)

CRIUS ENERGY | ANALYST DAY | JANUARY 31, 2017 57
SOLAR VALUE CHAIN
5% of leads
First-party leadsThird-party leads
50% to install
Brokering:Funder and
product selected
1-2 weeks0 20 years3-4 weeks
Underwriting:Customer and
funder approve deal
2 months
Crius is paid by funder
1 month
Asset transferred to funder
LEAD SALE APPROVAL INSTALL
Cross-sellingCrius is paid by customer
OPERATE SYSTEM
First-party installsThird-party installs
O&M:Monitoring and
maintenance of system
FUNDER

CRIUS ENERGY | ANALYST DAY | JANUARY 31, 2017 58
SOLAR SYSTEM ECONOMICS
AVG. SYSTEM PRICE:
$3.00 - $5.00 /watt
AVG. SYSTEM SIZE: 6.5kW
AVG. SYSTEM COST: $20,000 -$35,000
MARGIN PER SYSTEM: $2,000 -$6,500
INSTALLATION
MATERIALS
EXPECTED MARGIN• Overhead• Customer savings
• First-party install• Third-party install
• Market conditions and availability
• First-party leads• Third-party leads
$.25 - $1.00 /watt
$1.20 /watt
$1.25 /watt
ORIGINATION$.25 - $1.30 /watt
*Loan surcharges additional.

CRIUS ENERGY | ANALYST DAY | JANUARY 31, 2017 59
SOLAR CUSTOMER ECONOMICS: MASSACHUSETTS
PPA Loan Cash• 15.9 cents/kWh at 2.9% escalator • 4.99% APR, 20 year agreement
• 30% ITC pay down in first year• Up front buy out cost of $21K with
30% ITC
0
500
1000
1500
2000
2500
3000
3500
4000
0
500
1000
1500
2000
2500
3000
3500
4000
20 Year Savings of $6,544Avg. 1st Year Monthly Payment
of $136
-500
0
500
1000
1500
2000
2500
3000
3500
4000
-500
0
500
1000
1500
2000
2500
3000
3500
4000
20 Year Savings of $21,311Avg. 1st Year Monthly Payment
of $34
-20000
-15000
-10000
-5000
0
5000
10000
15000
20000
($20,000)
($15,000)
($10,000)
($5,000)
$0
$5,000
$10,000
$15,000
$20,000
20 Year Savings of $33,568
Note: Before Solar Cost and Savings based on utility rate of 18 cents/kWh. Margin earned is $5,000 in each scenario, regardless of system size.SREC value based on $200/MWh price for first 10 years of production. 1st Year Avg. Monthly Payment includes After Solar Utility Bill cost, Financing & any SREC contribution.

CRIUS ENERGY | ANALYST DAY | JANUARY 31, 2017 60
SOLAR CUSTOMER ECONOMICS: CALIFORNIA
• 12.9 cents/kWh at 2.9% escalator • 4.99% APR, 20 year agreement• 30% ITC pay down in first year
• Up front buy out cost of $20K with 30% ITC
Note: Before Solar Cost and Savings based on utility rate of 0.20 cents/kWh. 1st Year Avg. Monthly Payment includes After Solar Utility Bill cost, Financing & any SREC contribution. . Margin earned is $5,000 in each scenario, regardless of system size.
0
1000
2000
3000
4000
5000
6000
0
1000
2000
3000
4000
5000
6000
20 Year Savings of $25,073Avg. 1st Year Monthly Payment
of $146
0
1000
2000
3000
4000
5000
6000
0
1000
2000
3000
4000
5000
6000
20 Year Savings of $31,436Avg. 1st Year Monthly Payment
of $153
-20000
-15000
-10000
-5000
0
5000
10000
15000
20000
($20,000)
($15,000)
($10,000)
($5,000)
$0
$5,000
$10,000
$15,000
$20,000
20 Year Savings of $43,364
PPA Loan Cash

CRIUS ENERGY | ANALYST DAY | JANUARY 31, 2017 61
SOLAR CUSTOMER ECONOMICS: CONNECTICUT
• 16.9 cents/kWh at 2.9% escalator • 4.99% APR, 20 year agreement• 30% ITC pay down in first year
• Up front buy out cost of $21K with 30% ITC
Note: Before Solar Cost and Savings based on utility rate of 17 cents/kWh. 1st Year Avg. Monthly Payment includes After Solar Utility Bill cost, Financing & any SREC contribution. . Margin earned is $5,000 in each scenario, regardless of system size.
0
1000
2000
3000
4000
5000
6000
0
1000
2000
3000
4000
5000
6000
20 Year Savings of $2,352Avg. 1st Year Monthly Payment
of $141
-2000
-1000
0
1000
2000
3000
4000
5000
6000
-2000
-1000
0
1000
2000
3000
4000
5000
6000
20 Year Savings of $9,238Avg. 1st Year Monthly Payment
of $156
-20000
-15000
-10000
-5000
0
5000
10000
15000
20000
($20,000)
($15,000)
($10,000)
($5,000)
$0
$5,000
$10,000
$15,000
$20,000
1 3 5 7 9 11 13 15 17 19
20 Year Savings of $20,605
PPA Loan Cash
State incentives

CRIUS ENERGY | ANALYST DAY | JANUARY 31, 2017 62
SOLAR VALUE CHAIN
LEAD SALE APPROVAL INSTALL OPERATE SYSTEM
PARTNER TECHNOLOGY PLATFORM & FINANCING PRODUCTS
SUNEDISON-ACQUIRED CAPABILITY
VERENGO INSTALLATION CAPABILITY
CRIUS CAPABILITY
*Subject to Verengo acquisition closing.
PRIOR PARTNERSHIP MODEL
POST-ACQUISITIONS
CRIUS ENERGY | ANALYST DAY | JANUARY 31, 2017 63
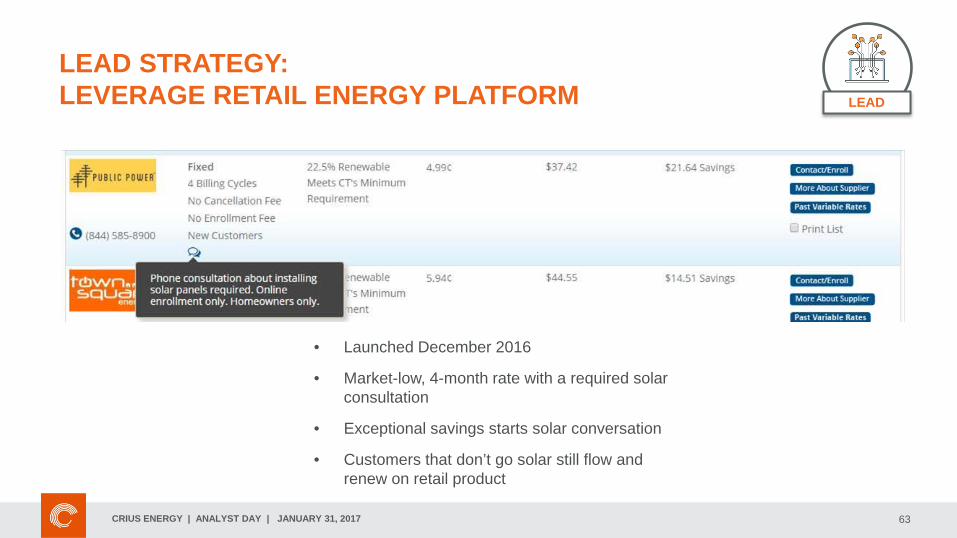
LEAD STRATEGY: LEVERAGE RETAIL ENERGY PLATFORM
• Launched December 2016
• Market-low, 4-month rate with a required solar consultation
• Exceptional savings starts solar conversation
• Customers that don’t go solar still flow and renew on retail product
LEAD

CRIUS ENERGY | ANALYST DAY | JANUARY 31, 2017 64
LEAD STRATEGY:DRIVING GREATER CLV IN THE RETAIL PORTFOLIO
• Crius Energy adds 100k energy
customers every quarter
• Crius Energy has thousands of
discussions every day with its existing
customers who have selected Crius to
drive energy innovation
• Crius Energy has rich energy data for
over 1M expired customers
Conservative Assumptions• Convert 5% of new retail customers in eligible markets to solar• Convert 1% of retail book to solar every year• Convert 0.1% of expired book to solar every year• Cross sell 4% of solar base every year
LEAD
Cross-Sell GM

CRIUS ENERGY | ANALYST DAY | JANUARY 31, 2017 65
SALES STRATEGY: OPTIMIZE FUNNEL, INCREASE VALUE
MAINTAIN INDUSTRY-LOW SELLING COSTS
RETAIL ENERGY DIRECT MARKETING PARTNERS
active & inactive
SALE
POTENTIAL SELLING PARTNERS

CRIUS ENERGY | ANALYST DAY | JANUARY 31, 2017 66
PRODUCT STRATEGY: REDUCING CUSTOMER CANCELLATION RATES
• Launched December 2016
• Day One solar rate
• Minimize breakage
SALE
DELIVERING SOLAR SAVINGS IMMEDIATELY THROUGH RETAIL ENERGY

CRIUS ENERGY | ANALYST DAY | JANUARY 31, 2017 67
PRODUCT STRATEGY: DIFFERENTIATION THROUGH INNOVATION
• Launched January 2017
• Whole home solution
• Drives greater savings for
customer
• Leverages energy expertise
• Demand Response-ready
SALE

CRIUS ENERGY | ANALYST DAY | JANUARY 31, 2017 68
• WIFI THERMOSTATS– Bundles and separate purchases– Enable efficiency and demand response– Create increased customer stickiness
• SMART METERS– Full Texas deployment– Access to granular customer usage data
• MONTHLY ENERGY SCORECARDS– Predictive analytics with detailed weather data
• DEMAND RESPONSE LEADER– 3+ Years Experience– 3,300 Active Smart Thermostats in Texas– 60,000 Voluntary Participants– Significant energy-saving tool
LEVERAGE EXISTING RESOURCES AND EXPERTISESALE

CRIUS ENERGY | ANALYST DAY | JANUARY 31, 2017 69
FINANCE STRATEGY: BETTER VALUE THROUGH BROKERING
MAINTAIN BEST CUSTOMER VALUE AT LOWEST ECONOMIC RISK TO CRIUS
APPROVAL

CRIUS ENERGY | ANALYST DAY | JANUARY 31, 2017 70
INSTALLATION STRATEGYDRIVE INDUSTRY-LEADING CUSTOMER EXPERIENCE AND POSITIVE CASH FLOW
FIRST PARTY INSTALLS: THIRD PARTY INSTALLS:
• Scale up and down quickly as needed• Design best customer experience• Service high-value customers
INSTALL
*Subject to Verengo acquisition closing.

CRIUS ENERGY | ANALYST DAY | JANUARY 31, 2017 71
VERENGO ACQUISITION
INSTALL
• Proven track record of 20,000+ residential installs• Based in Torrance, CA; strong brand presence in
Southern California*Subject to Verengo acquisition closing.

CRIUS ENERGY | ANALYST DAY | JANUARY 31, 2017 72
SUNEDISON ACQUISITION
DAVE SMITHVice President, Inside Sales
FRANK SMITHVice President, Field Operations
GREG HARRISSenior Vice President, Solar
Plus, experienced, sales-focused solar professionals in:
Toronto ~12 employees • Utah ~30 employees
• 15 years operations & project management
• 8 years with SunEdison
• Master’s from Florida Institute of Technology; 3 patents
• 8 years at Just Energy
• LightWing Co-Founder & COO
• Joint MBA from Northwestern and York University
• 12+ years leading telecenters to $1 million weekly sales
• B2B lead extraction and calling technology expert

CRIUS ENERGY | ANALYST DAY | JANUARY 31, 2017 73
SOLAR TECHNOLOGY DEMO
LEAD SALE APPROVAL INSTALL OPERATE SYSTEM
PARTNER TECHNOLOGY PLATFORM & FINANCING PRODUCTS
SUNEDISON-ACQUIRED CAPABILITY
VERENGO INSTALLATION CAPABILITY
CRIUS CAPABILITY
*Subject to Verengo acquisition closing.
PRIOR PARTNERSHIP MODEL
POST-ACQUISITIONS

CRIUS ENERGY | ANALYST DAY | JANUARY 31, 2017 74
Expected new markets
CRIUS SOLAR MARKETS
Active markets
FULL-SERVICE MARKETS REPRESENT 74% OF EXISTING RESIDENTIAL RETAIL ENERGY BASE
*Expected new markets active within one year.

CRIUS ENERGY | ANALYST DAY | JANUARY 31, 2017 75
2017 CRIUS SOLAR FORECAST
RAMP BACK UP TO HISTORIC SOLAR SALES LEVELS: REALISTIC WITH PLENTY OF UPSIDE
Partner switch
Lost opportunity due to partner
(MW)

CRIUS ENERGY | ANALYST DAY | JANUARY 31, 2017 76
WHY CRIUS SOLAR WILL SUCCEED
Leads & Sales Platform & Expertise Fulfillment Financing & Products Operations & Maintenance
With 100k net retail adds per quarter, Crius has a proven lead and sales engine
50MW of solar sales in less than 2 years demonstrates ability to convert leads, despite changing partners
Previously anchored to partner technology, Crius now has end-to-end sales and customer management capability
Team of top talent to drive customer journey from sales through installation (Sun Edison)
Hybrid install approach reflects mix of 1st party reliability (Verengo) and 3rd party speed to market
1st party installation capacity positions Crius to design best-in-class customer experience
Multiple install channels drives cost control and excellence
Brokering multiple financing partners delivers best pricing to customers at best return to Crius
Integrate retail, solar, and efficiency product offerings to drive new class of products reaching new segments of customers
Leverage Crius Energy’s existing back office to deliver best-in-class customer experience
Drive ongoing value from customer relationship through cross-sells into other verticals
*Subject to Verengo acquisition closing.

CRIUS ENERGY | ANALYST DAY | JANUARY 31, 2017
CHAITU PARIKHChief Operating Officer
77

CRIUS ENERGY | ANALYST DAY | JANUARY 31, 2017 78
Crius Energy has partnered with 3 leading service providers to sell electricity and gas to consumers in deregulated energy markets.
Leverage existing customer channel: Strong energy value proposition from a trusted brand
Premium customers: Unique channel to reach first time switchers and premium customers
Impactful revenue: One-time and residual revenue to partners
Opportunity: Approximately 18M warm customer contacts associated with existing service provider partners with low upfront customer acquisition costs
WHY A PRIVATE LABEL STRATEGY?
Energy Rewards™

CRIUS ENERGY | ANALYST DAY | JANUARY 31, 2017 79
CUSTOMER METRICS
Lower acquisition costs than average direct
marketing customers
↓ 30%Lower average customer attrition rate vs. our direct
marketing channels
↓ 20%Lower average
customer care costs due to fewer calls
↓ 25%
Plus, fewer average complaints from channel partner customers
CHANNEL PARTNER STRATEGY RESULTS IN HIGH QUALITY CUSTOMERS:

CRIUS ENERGY | ANALYST DAY | JANUARY 31, 2017
COMCAST• Provides regulated and unregulated
voice, data, and video services to residential, business, and wholesale customers in the U.S. (NASDAQ: CMCSA)
• Largest cable operator in the world $67.97 B in revenue
• 27.26 M customer relationships• Footprint across 14 deregulated states• Energy seen as pillar of potential growth
CURRENT PARTNERSHIP• 3 year exclusive partnership • Comcast Energy Rewards brand selling Electricity and
Natural Gas• Harness customer touchpoints, such as bill messaging,
email, digital/online, retail centers, etc.• Possible alignment with core XFINITY product offers
COMCAST PARTNERSHIP
Energy Rewards™
80

CRIUS ENERGY | ANALYST DAY | JANUARY 31, 2017
COMCAST PARTNERSHIP: DEVELOPMENTS & OUTLOOK
• Launched 7 markets (PA, IL, NJ, CA, & TX, MA, CT) servicing 30+ utilities (70% of addressable deregulated footprint)
• Average household energy usage trending above partnership targets
• Marketing tactics included; retail sales, email, digital online marketing, direct mail, selective outbound telemarketing and inbound lead-capture
• Strategic reposition closer to core business units and integrated product offerings (Home)
• Continue expansion into existing deregulated markets
• Optimize performance of existing sales channels
• Adding new partners onto the platform
RESULTS & OBSERVATIONS 2017-18 OUTLOOK
81

CRIUS ENERGY | ANALYST DAY | JANUARY 31, 2017 82
• Markets tend toward consolidation: Most mature markets (ex. United Kingdom, Canada, etc) are controlled by 3-6 players
• M&A activity continues in the U.S., although more and varied players (e.g. gentailers) have entered the market
– 41% of retailers indicate they plan on acquiring another Company within the next 12 months
– Currently 1,400 active supplier licenses
– Product diversification viewed as critical success indicator
Sourced DNV-GL, McKinsey analysis
(1)
9
(20)
8 5
(6) (3)
(12)
(40)
(30)
(6)
-60
-50
-40
-30
-20
-10
0
10
20
30
2006 2007 2008 2009 2010 2011 2012 2013 2014 2015 2016
Market Consolidation
New Retailers Retailer Exits M&A Deals Net Increase/Decrease
Data representative of retail M&A transactions only
MARKET CONSOLIDATION

CRIUS ENERGY | ANALYST DAY | JANUARY 31, 2017 83
• MORE THAN 325,000 customers added via six accretive acquisitions since IPO
– Focus on acquisitions that are accretive to our current market position
o Strengthen diversification and/or enable growth in customer segment, geography, channels or product
– Minimal additional operating cost resulting from scalability of platform
– Active pipeline of Merger & Acquisition opportunities expected to drive growth
STRATEGIC CONSIDERATIONS
February 2013~1,200
customers$75 / RCE
April 2014~40,000
customers$120 / RCE
June 2014~15,000
customers$87 / RCE
February 2015~200,000 customers$96 / RCE
June 2015~2,000
customers$100 / RCE
December 2015~75,000 customers
$97 / RCE
MERGER & ACQUISTIONS

CRIUS ENERGY | ANALYST DAY | JANUARY 31, 2017 84
Date Acquisition Acquirer Markets Accounts Transaction Price (in MM’s) Price/RCE
Nov-16 North American Power Calpine Corporation Multiple 250,000 N/A
Oct-16 Enertrade Electric LLS (Shyne Energy) Zen Home Services TX N/A N/A
Oct-16 Noble Americas Energy Solutions Calpine Corporation Multiple N/A 1,050 N/A
Sep-16 BluCo Energy, LLC Tarsier Energy Multiple N/A
Sep-16 Town Square Energy Genie Retail Energy, Inc. Multiple 47,000 11 234
Aug-16 Major Energy* Spark Energy, Inc. Multiple 215,000 81 375
Aug-16 Union Atlantic Electricity Corp CPG Power Holdings LLC ISO-NE 2,000 N/A
Aug-16 Provider Power* Spark Energy, Inc. ISO-NE 121,000 39 319Jul-16 Coned Solutions Constellation Multiple 1,410,000 200 142
Apr-16 Entrust Energy National Gas & Electric LLC Multiple 15,000 N/A
Apr-16 TruSmart Energy Verde Energy TX 10,000 N/A
Apr-16 Bargain Energy National Gas & Electric LLC PJM N/A N/A
Apr-16 Santa Buckley Energy, Inc. Sprague Resources LLC NE - Nat Gas N/A N/A
Jan-16 Gutman Energy GDF Suez Energy Resources Multiple N/A N/A
Jan-16 Continuum Energy Services LLC CenterPoint Energy Services
Mid West - Nat Gas N/A 77
*Transaction price includes base purchase price and 50% of potential earn-out value.
Retail Consolidation
Gentailer
Energy Efficiency
MERGER & ACQUISTIONS

CRIUS ENERGY | ANALYST DAY | JANUARY 31, 2017
MICHAEL FALLQUISTChief Executive Officer
85

CRIUS ENERGY | ANALYST DAY | JANUARY 31, 2017 86
RECAP — CRIUS OBJECTIVES
GROW CUSTOMER
BASE
INCREASE VALUATION
GROWDISTRIBUTIONS TO
UNITHOLDERS
GROW, DIVERSIFY AND DE-RISK CASH FLOWS
INCREASE CUSTOMER
LIFETIME VALUE
REDUCE COSTS

CRIUS ENERGY | ANALYST DAY | JANUARY 31, 2017 87
RECAP — VALUATION CONSIDERATIONS
OUR CORE RETAIL ENERGY BUSINESS:
REVENUE: 3yr CAGR of 13%
EBITDA: 3yr CAGR of 25%
CUSTOMERS: 3yr CAGR of 17%
DIVERSIFIED CUSTOMER PORTFOLIO
MATERIAL Y-o-Y REDUCTION IN CHURN
SOLAR COMCAST M&A
CLEAR PATH TO CONTINUED GROWTH
OPTION VALUE:
BEST IN CLASS RISK MANAGEMENT

CRIUS ENERGY | ANALYST DAY | JANUARY 31, 2017
ANALYST DAYJANUARY 31, 2017
88
Related Documents


