3-Year KTB Futures 3-Year KTB Futures Success Factors & Outlook Success Factors & Outlook 2003 Taipei Interest Rate Futures Conference November 20-21, 2003 Jungho Kang, Ph.D Korea Futures Excha nge

3-Year KTB Futures Success Factors & Outlook 2003 Taipei Interest Rate Futures Conference November 20-21, 2003 Jungho Kang, Ph.D Korea Futures Exchange.
Dec 29, 2015
Welcome message from author
This document is posted to help you gain knowledge. Please leave a comment to let me know what you think about it! Share it to your friends and learn new things together.
Transcript
3-Year KTB Futures3-Year KTB FuturesSuccess Factors & OutlookSuccess Factors & Outlook
2003 Taipei Interest Rate Futures Conference
November 20-21, 2003
Jungho Kang, Ph.D
Korea Futures Exchange
I. Market Overview
II. 3-Year KTB Futures Market
III. Underlying Market
IV. Key Features
V. Success Factors
VI. Outlook
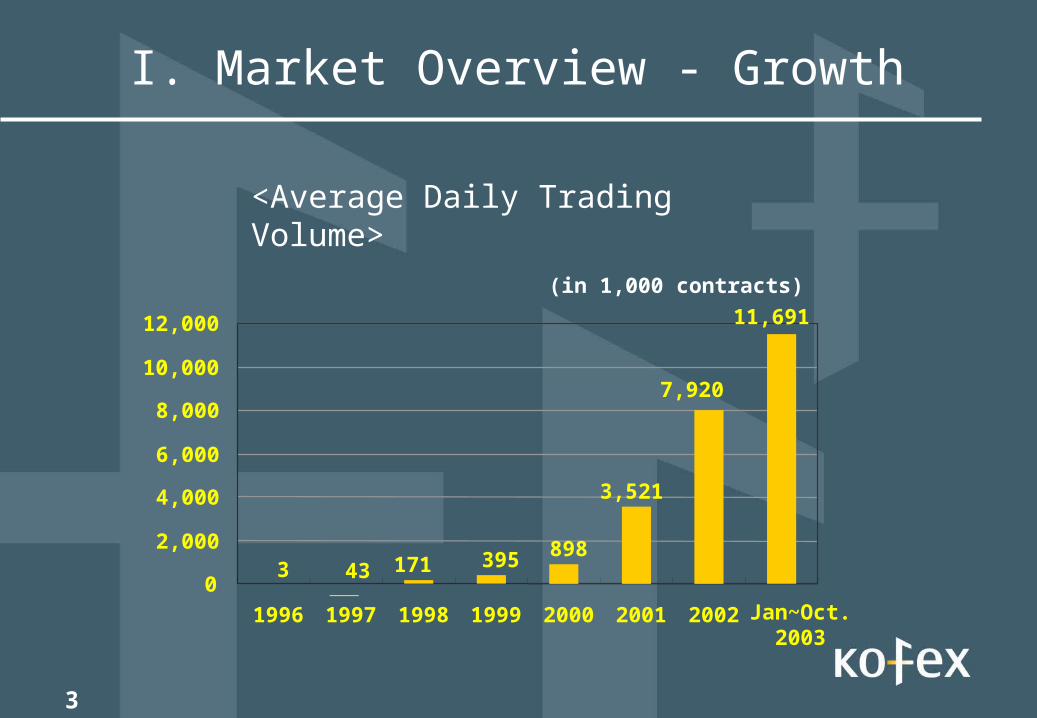
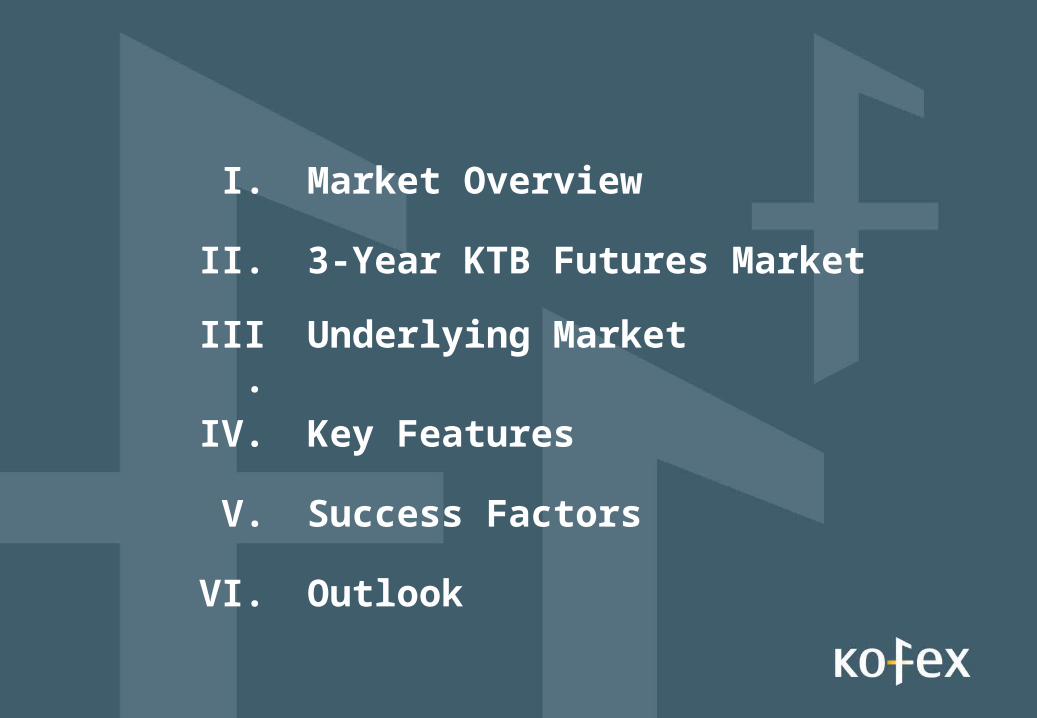
I. Market Overview - Growth
<Average Daily Trading Volume>
0
2,000
4,000
6,000
8,000
10,000
12,000
1996 1997 1998 1999 2000 2001 2002 Jan~Oct. 2003
3 43 171 395 898
3,521
7,920
11,691
(in 1,000 contracts)
3

I. Market Overview – Key Products
(Figures: Jan.~ Oct. 2003)
Contracts Total Trading Volume
Average Daily Trading Volume
KOSPI200 Options
2,344,349 11,380
KOSPI200 Futures
52,956 257
3-year KTB Futures
8,756 43
USD/KRW Futures 1,239 6
KOSDAQ50 Futures
642 3
(in 1,000 contracts)
4
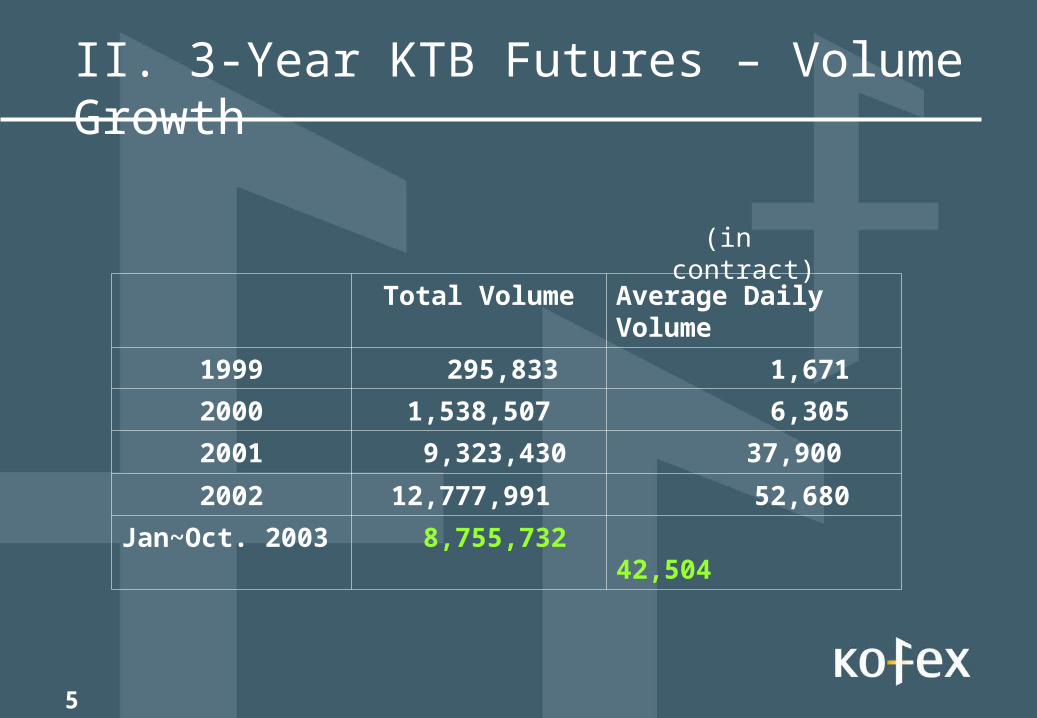
II. 3-Year KTB Futures – Volume Growth
Total Volume Average Daily Volume
1999 295,833 1,671 2000 1,538,507 6,305
2001 9,323,430 37,900
2002 12,777,991 52,680
Jan~Oct. 2003 8,755,732 42,504
(in contract)
5
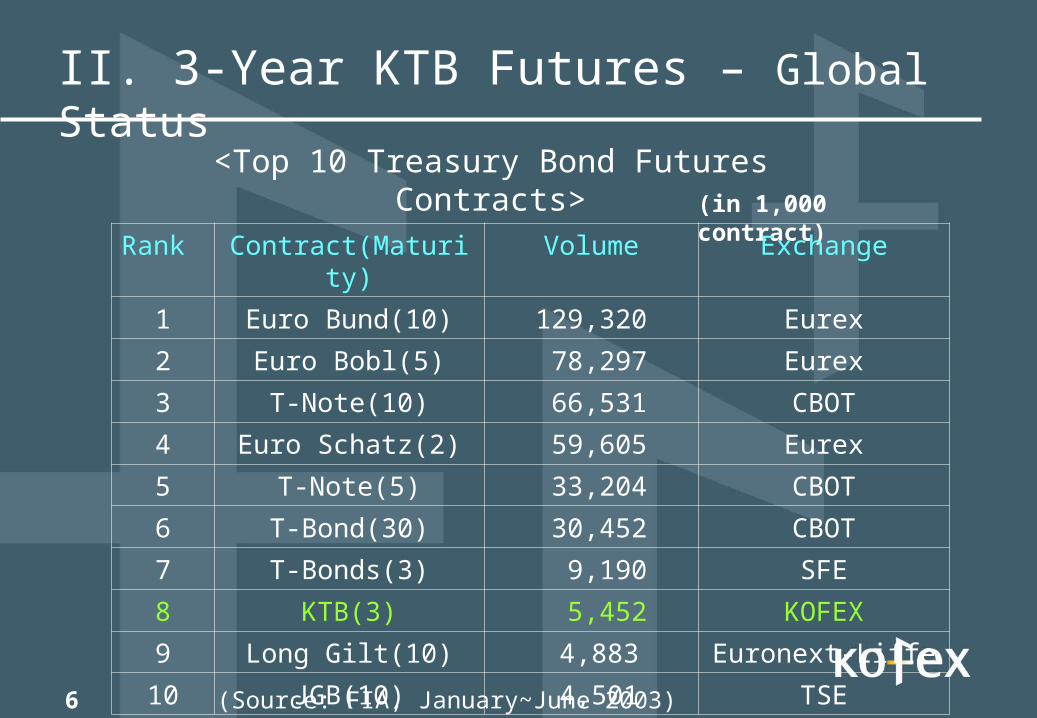
II. 3-Year KTB Futures – Global Status
(Source: FIA, January~June 2003)
<Top 10 Treasury Bond Futures Contracts> (in 1,000 contract)
Rank Contract(Maturity) Volume Exchange
1 Euro Bund(10) 129,320 Eurex2 Euro Bobl(5) 78,297 Eurex3 T-Note(10) 66,531 CBOT
4 Euro Schatz(2) 59,605 Eurex5 T-Note(5) 33,204 CBOT
6 T-Bond(30) 30,452 CBOT
7 T-Bonds(3) 9,190 SFE
8 KTB(3) 5,452 KOFEX
9 Long Gilt(10) 4,883 Euronext-Liffe10 JGB(10) 4,501 TSE
6
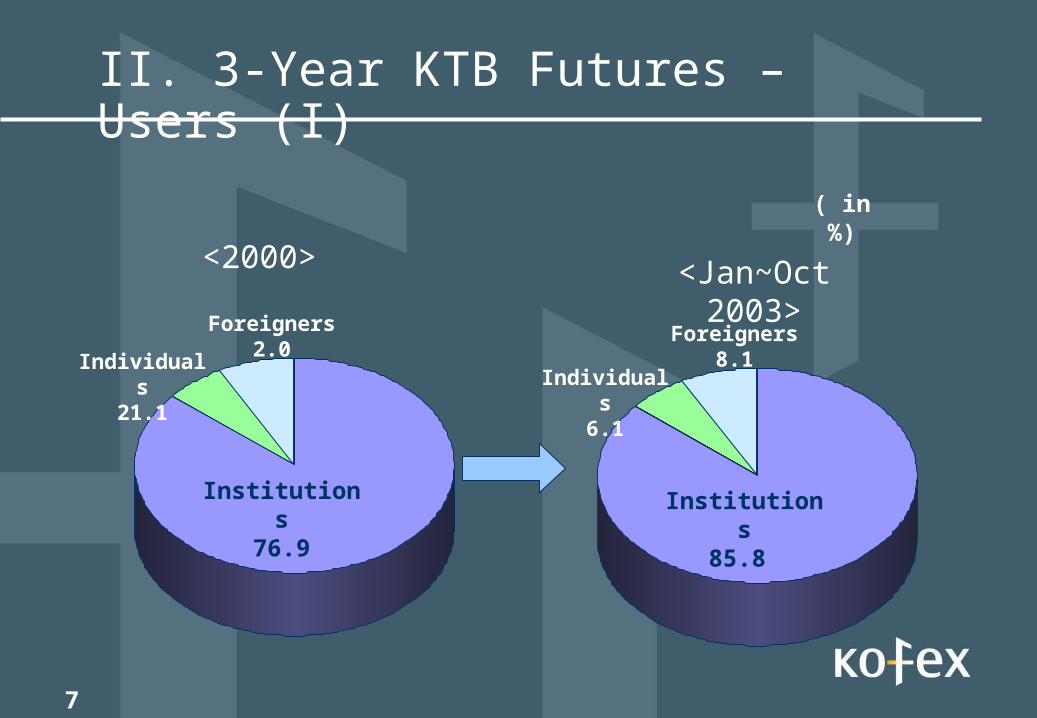
II. 3-Year KTB Futures – Users (I)
Institutions85.8
Individuals6.1
Foreigners8.1
Institutions76.9
Individuals21.1
Foreigners2.0
<Jan~Oct 2003>
<2000>
7
( in %)
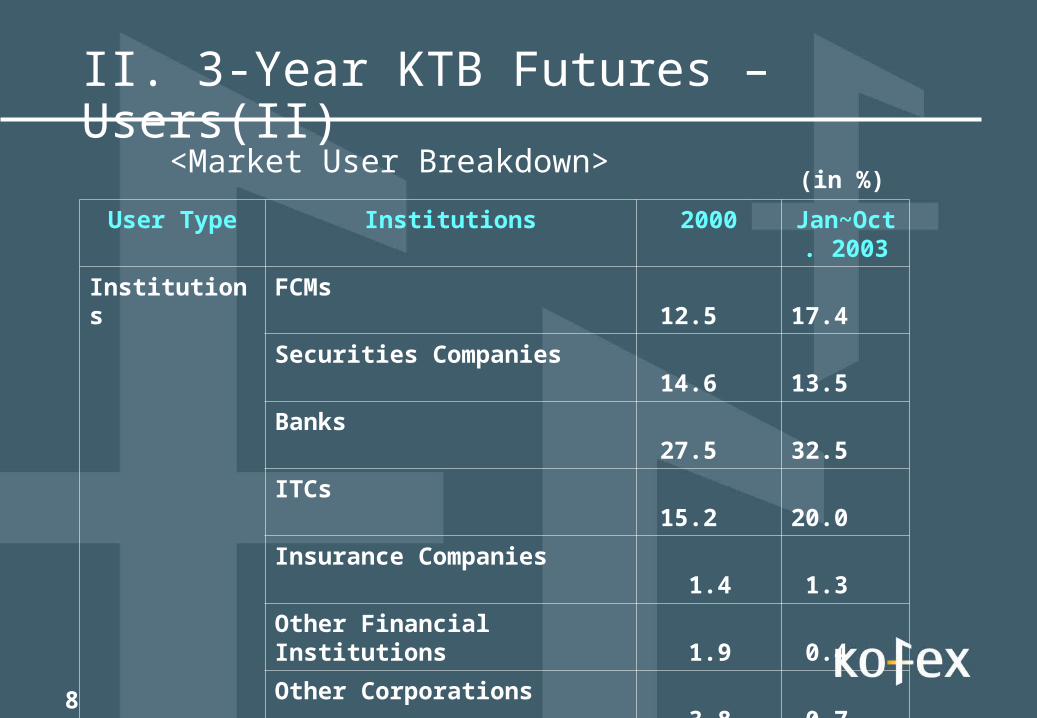
II. 3-Year KTB Futures – Users(II)
User Type Institutions 2000 Jan~Oct. 2003
Institutions FCMs 12.5
17.4
Securities Companies 14.6
13.5
Banks 27.5
32.5
ITCs 15.2
20.0
Insurance Companies 1.4
1.3
Other Financial Institutions
1.9
0.4
Other Corporations 3.8
0.7
Total 76.9
85.8
Foreigners 2.0
8.1
Individuals 21.1
6.1
Total 100.0
100.0
<Market User Breakdown>(in %)
8
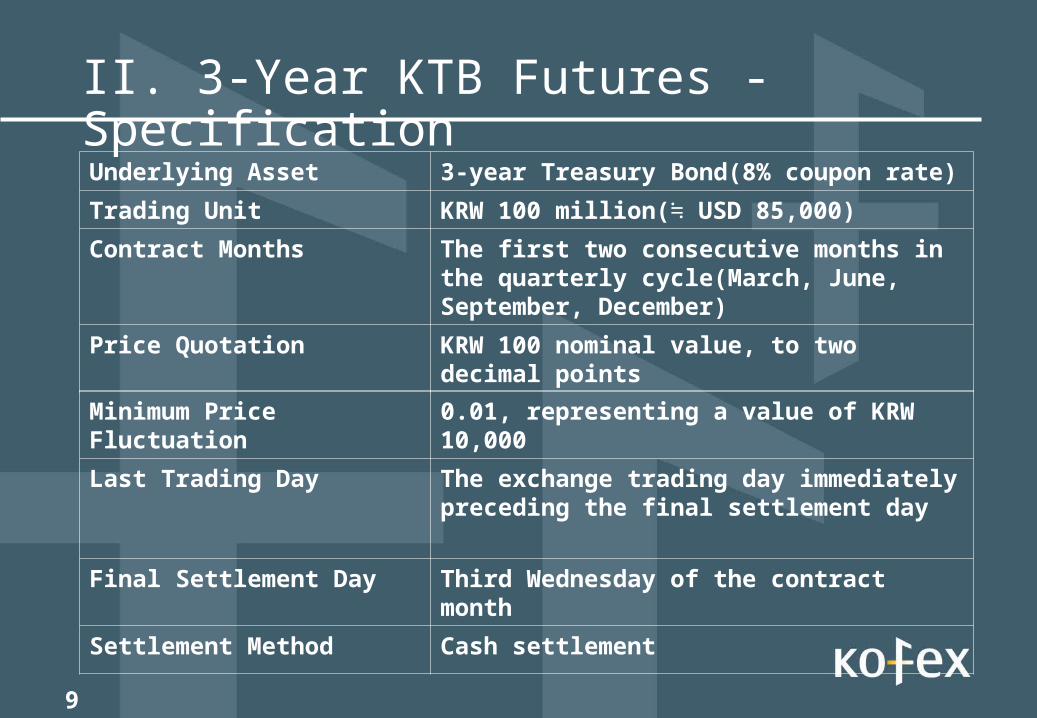
II. 3-Year KTB Futures - Specification
Underlying Asset 3-year Treasury Bond(8% coupon rate)
Trading Unit KRW 100 million(≒ USD 85,000)
Contract Months The first two consecutive months in the quarterly cycle(March, June, September, December)
Price Quotation KRW 100 nominal value, to two decimal pointsMinimum Price
Fluctuation0.01, representing a value of KRW 10,000
Last Trading Day The exchange trading day immediately preceding the final settlement day
Final Settlement Day Third Wednesday of the contract month
Settlement Method Cash settlement
9
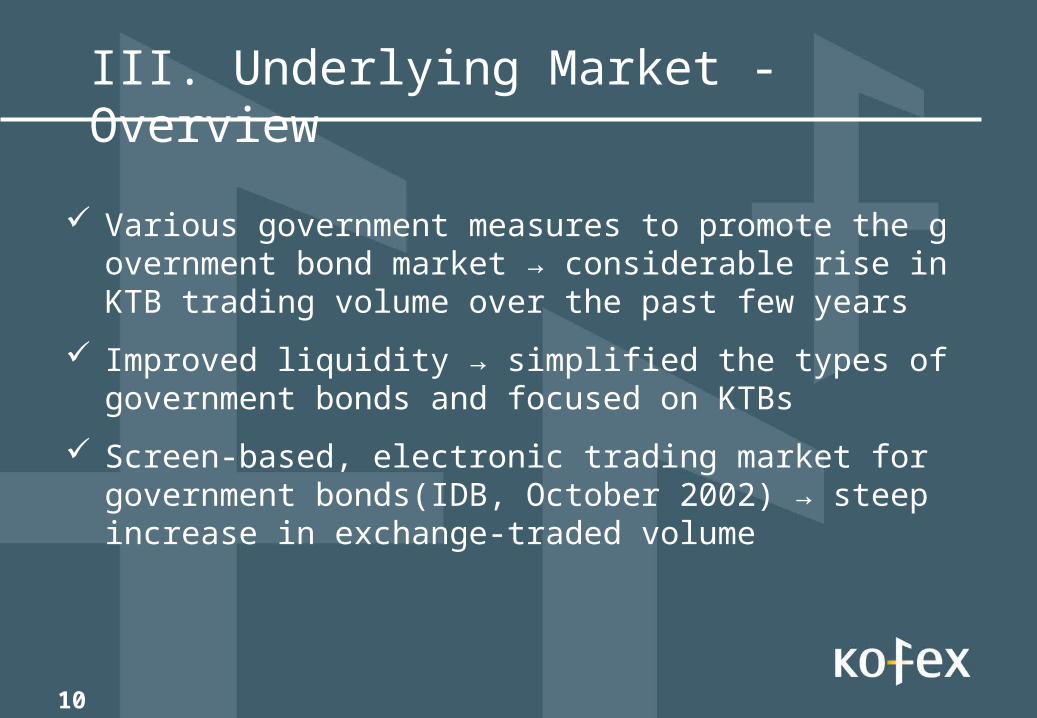
III. Underlying Market - Overview
Various government measures to promote the government bond market → considerable rise in KTB trading volume over the past few years
Improved liquidity → simplified the types of government bonds and focused on KTBs
Screen-based, electronic trading market for government bonds(IDB, October 2002) → steep increase in exchange-traded volume
10
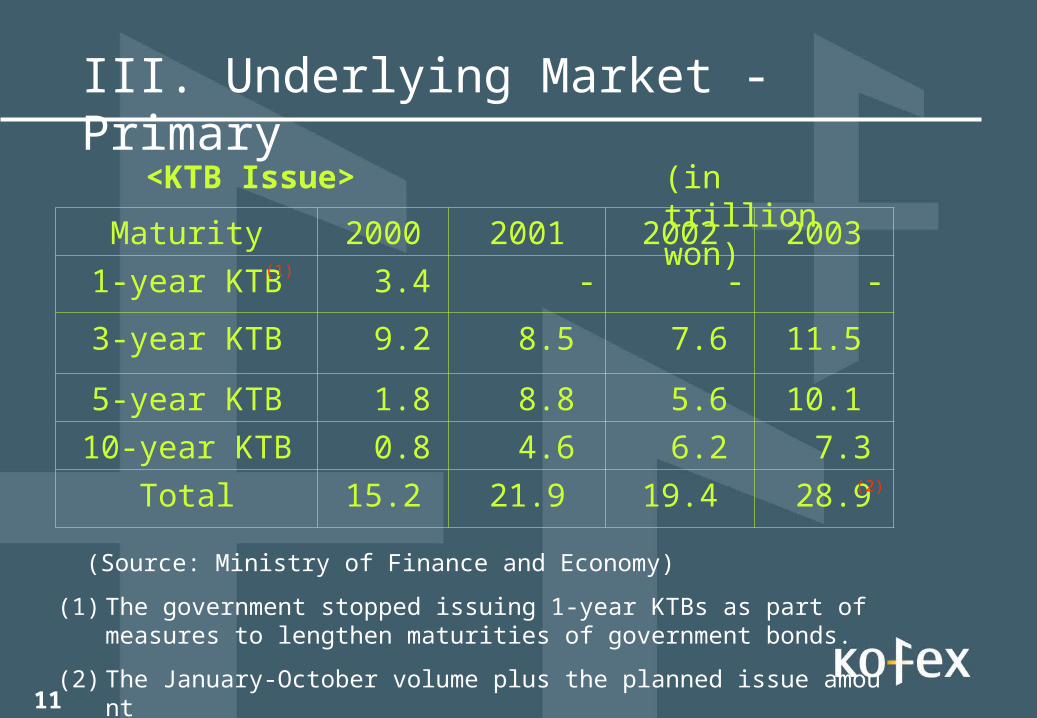
III. Underlying Market - Primary
Maturity 2000 2001 2002 2003
1-year KTB 3.4 - - -
3-year KTB 9.2 8.5 7.6 11.5
5-year KTB 1.8 8.8 5.6 10.1
10-year KTB 0.8 4.6 6.2 7.3Total 15.2 21.9 19.4 28.9
<KTB Issue> (in trillion won)
(Source: Ministry of Finance and Economy)
(1) The government stopped issuing 1-year KTBs as part of measures to lengthen maturities of government bonds.
(2) The January-October volume plus the planned issue amount11
(2)
(1)
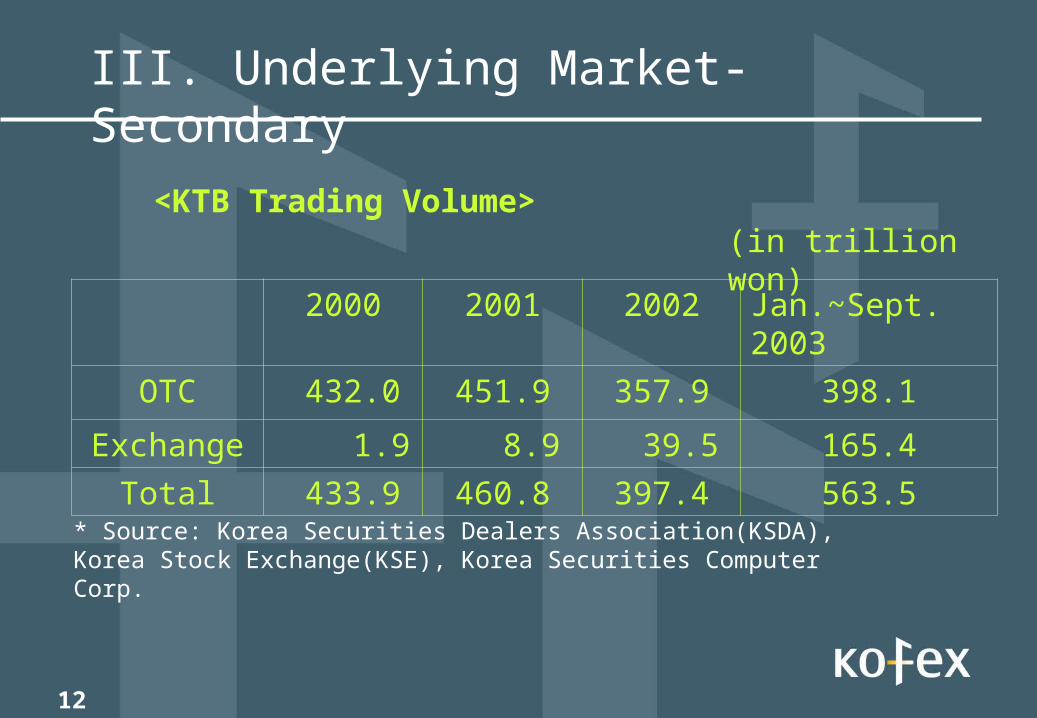
III. Underlying Market- Secondary
2000 2001 2002 Jan.~Sept.
2003
OTC 432.0 451.9 357.9 398.1
Exchange 1.9 8.9 39.5 165.4
Total 433.9 460.8 397.4 563.5
<KTB Trading Volume> (in trillion won)
* Source: Korea Securities Dealers Association(KSDA), Korea Stock Exchange(KSE), Korea Securities Computer Corp.
12
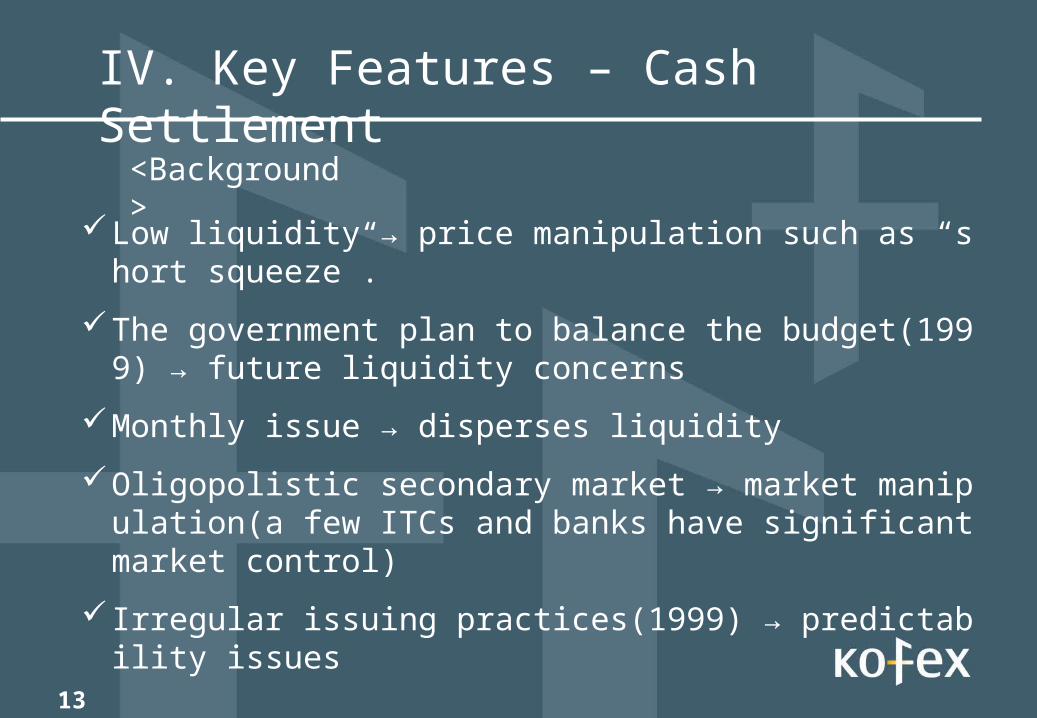
IV. Key Features – Cash Settlement
Low liquidity → price manipulation such as “short squeeze”.
The government plan to balance the budget(1999) → future liquidity concerns
Monthly issue → disperses liquidity
Oligopolistic secondary market → market manipulation(a few ITCs and banks have significant market control)
Irregular issuing practices(1999) → predictability issues
13
<Background>
IV. Key Features – Basket System
Basket system was adopted to come up with fair final settlement yield.
Final settlement price is determined, based on the average yield of a basket of selected treasury bonds.
KOFEX designates a basket comprising a single or multiple number of bonds prior to the listing of a new contract and the basket remains fixed until the expiry date of the contract.
14
<Background>
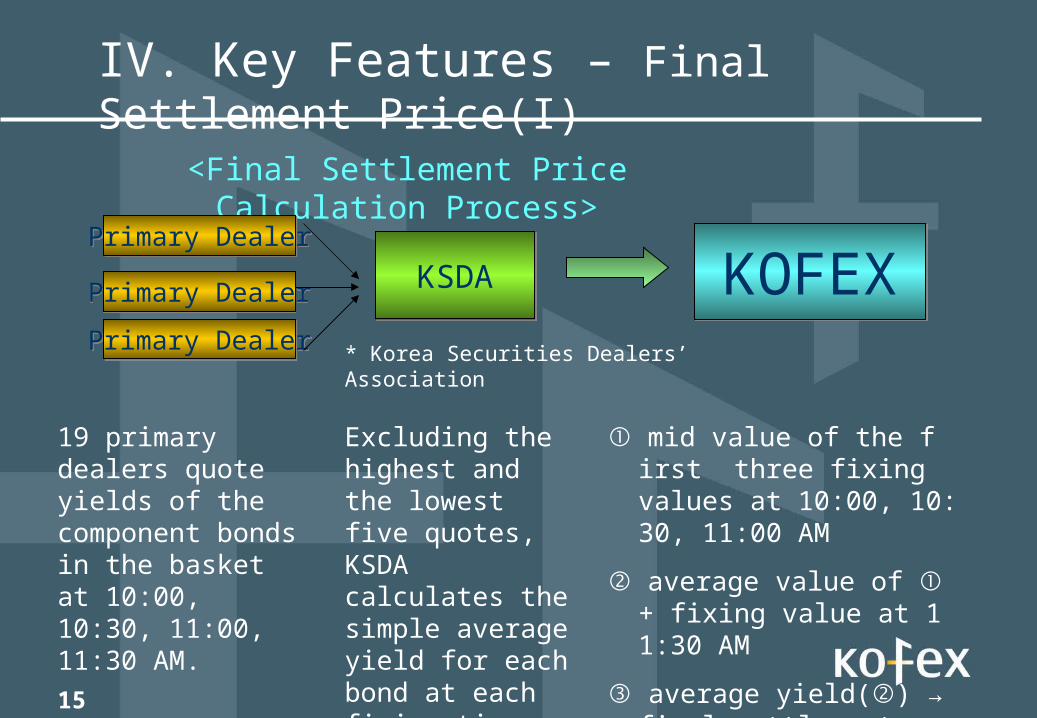
IV. Key Features – Final Settlement Price(I)
<Final Settlement Price Calculation Process>
Primary DealerPrimary Dealer
Primary DealerPrimary Dealer
KSDAKSDA
* Korea Securities Dealers’ Association
KOFEXKOFEX
19 primary dealers quote yields of the component bonds in the basket at 10:00, 10:30, 11:00, 11:30 AM.
Excluding the highest and the lowest five quotes, KSDA calculates the simple average yield for each bond at each fixing time.
① mid value of the first three fixing values at 10:00, 10:30, 11:00 AM
② average value of ① + fixing value at 11:30 AM
③ average yield(②) → final settlement price
Primary DealerPrimary Dealer
15
16
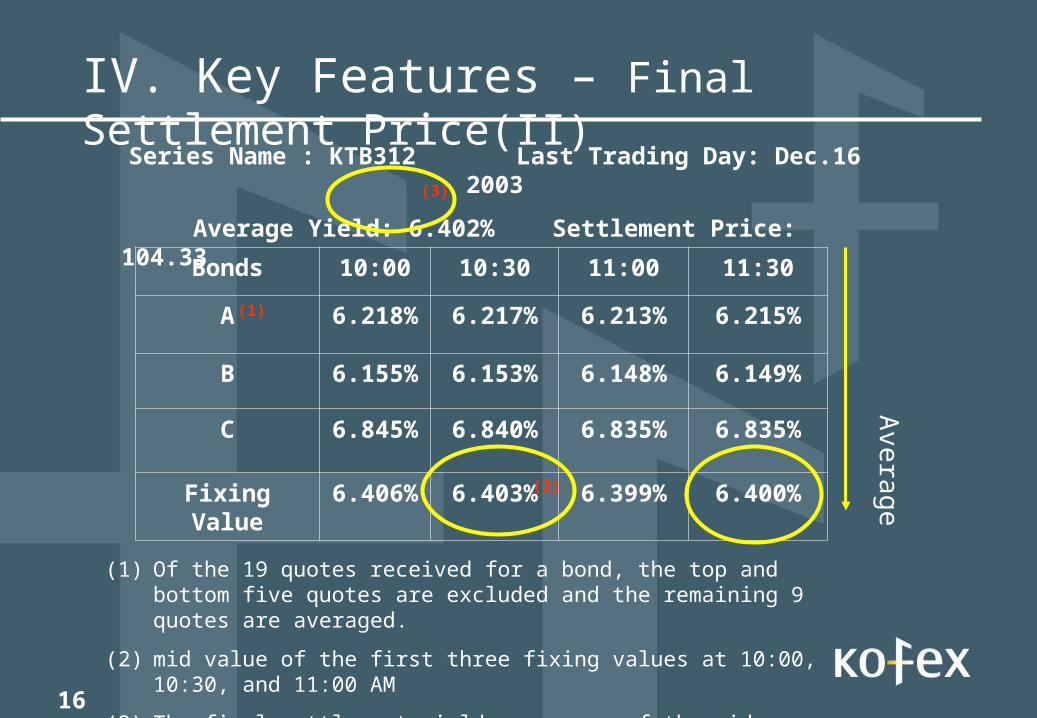
IV. Key Features – Final Settlement Price(II)
Bonds 10:00 10:30 11:00 11:30
A 6.218%
6.217% 6.213% 6.215%
B 6.155%
6.153% 6.148% 6.149%
C 6.845%
6.840% 6.835% 6.835%
Fixing Value
6.406%
6.403% 6.399% 6.400%
Series Name : KTB312 Last Trading Day: Dec.16 2003
Average Yield: 6.402% Settlement Price: 104.33
Avera
ge
(1) Of the 19 quotes received for a bond, the top and bottom five quotes are excluded and the remaining 9 quotes are averaged.
(2) mid value of the first three fixing values at 10:00, 10:30, and 11:00 AM
(3) The final settlement yield = average of the mid value(2) and the fixing value at 11:30 AM. Rounded up to three decimal points.
(2)
(3)
(1)
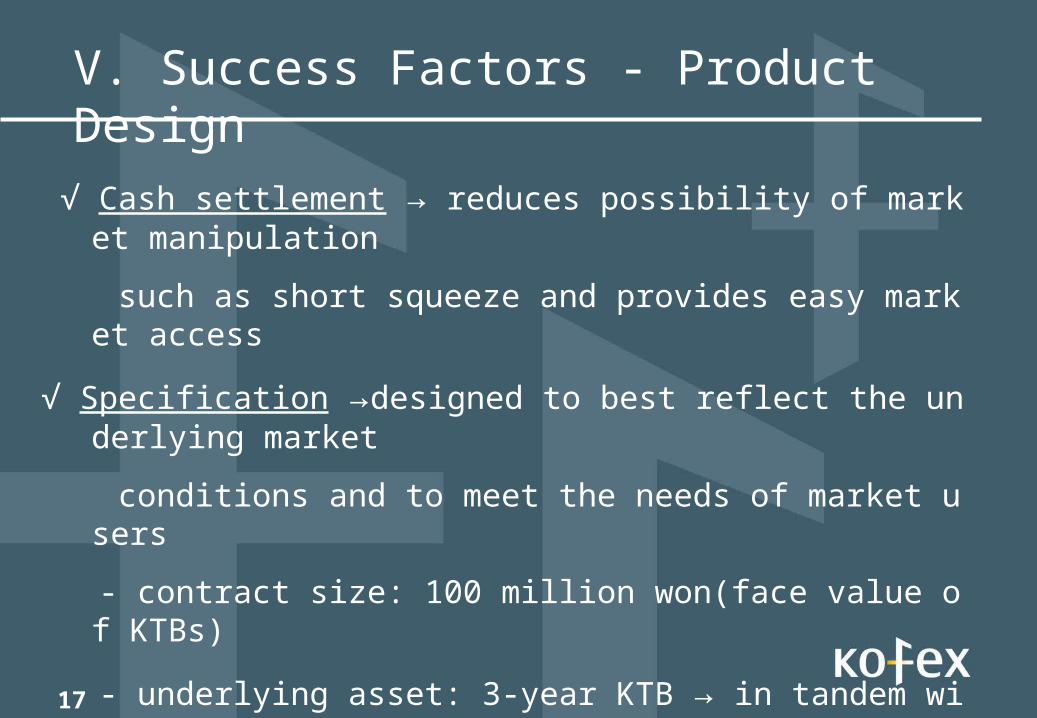
V. Success Factors - Product Design
√ Cash settlement → reduces possibility of market manipulation
such as short squeeze and provides easy market access
√ Specification →designed to best reflect the underlying market
conditions and to meet the needs of market users
- contract size: 100 million won(face value of KTBs)
- underlying asset: 3-year KTB → in tandem with the shift of the benchmark to 3-year KTBs from 3-year corporate bonds
17
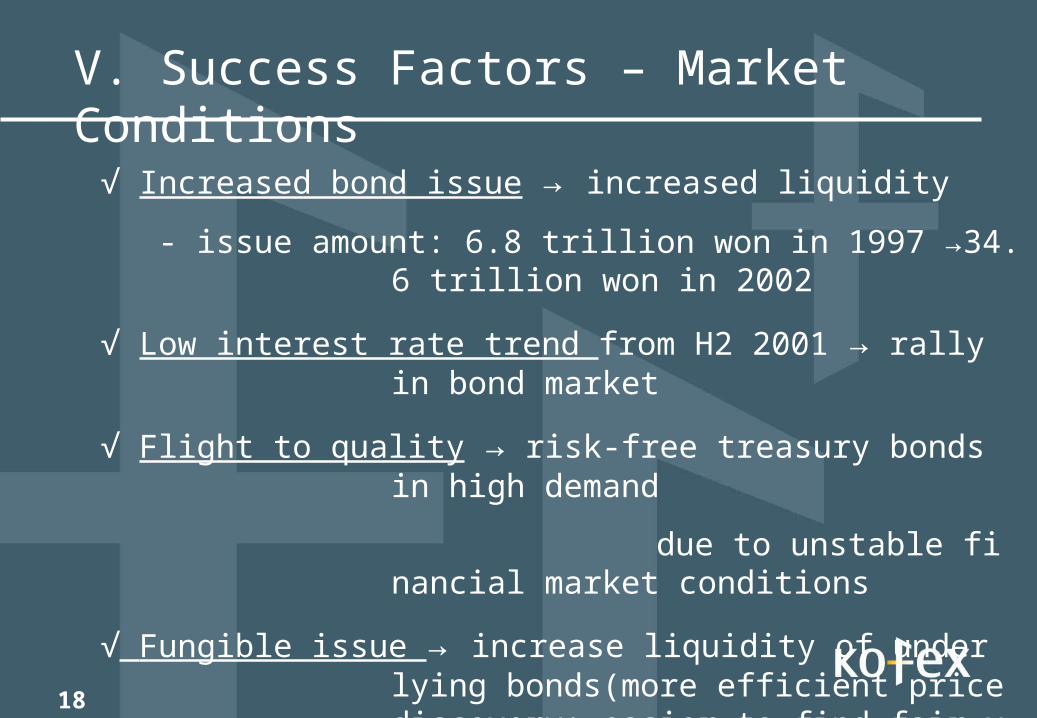
V. Success Factors – Market Conditions
√ Increased bond issue → increased liquidity
- issue amount: 6.8 trillion won in 1997 →34.6 trillion won in 2002
√ Low interest rate trend from H2 2001 → rally in bond market
√ Flight to quality → risk-free treasury bonds in high demand
due to unstable financial market conditions
√ Fungible issue → increase liquidity of underlying bonds(more efficient price discovery: easier to find fair value of underlying bonds)
18

V. Success Factors – Government Actions√ The government increased bond issue and began to
issue bonds regularly → enhanced market predictability
√ Primary Dealer System(July 1999)
√ Marking-to-Market System(July 2000) → increased hedging demand
√ Screen-based secondary bond market(IDB)(October 2002)
→ greatly increased exchange-traded volume & market
transparency
19
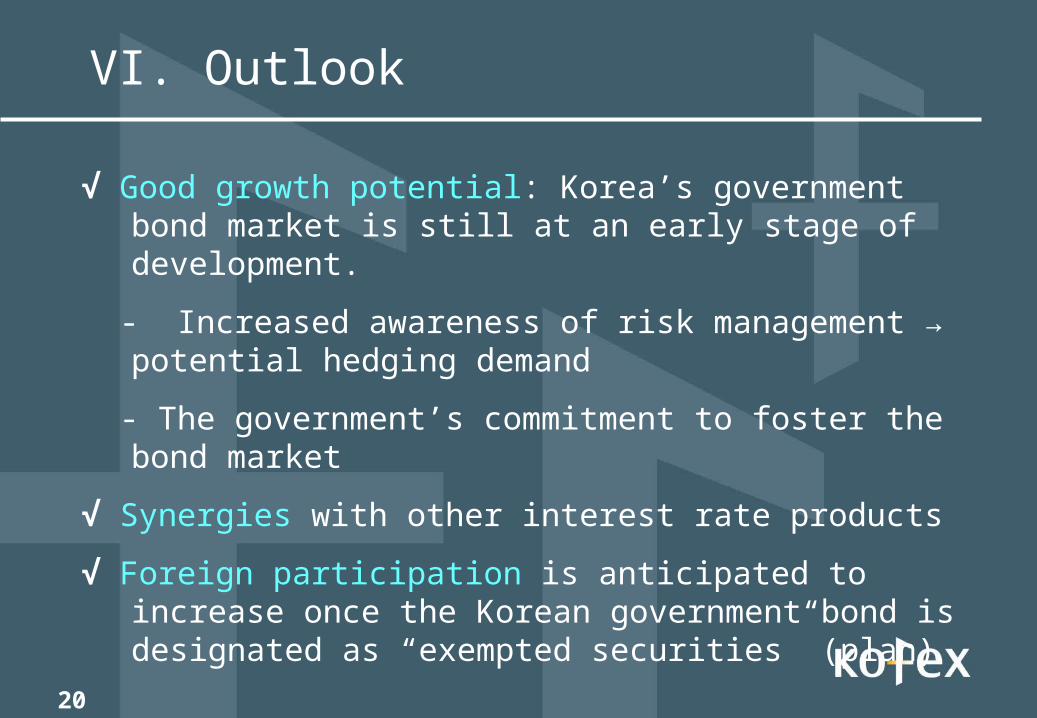
VI. Outlook
√ Good growth potential: Korea’s government bond market is still at an early stage of development.
- Increased awareness of risk management → potential hedging demand
- The government’s commitment to foster the bond market
√ Synergies with other interest rate products
√ Foreign participation is anticipated to increase once the Korean government bond is designated as “exempted securities” (plan)
20
21
Thank you
Related Documents