3-Year Budget Forecast FY 2016 – FY 2018 Commission on Government Forecasting and Accountability April 2015

Welcome message from author
This document is posted to help you gain knowledge. Please leave a comment to let me know what you think about it! Share it to your friends and learn new things together.
Transcript

3-Year Budget Forecast FY 2016 – FY 2018
Commission on Government Forecasting and Accountability
April 2015

Commission on Government Forecasting and Accountability
COMMISSION CO-CHAIRS
Senator Donne Trotter Representative Donald Moffitt
SENATE HOUSE
David Koehler Kelly Burke Matt Murphy Elaine Nekritz Chapin Rose Raymond Poe
Heather Steans Al Riley Dave Syverson Michael Unes
EXECUTIVE DIRECTOR Dan R. Long
DEPUTY DIRECTOR
Laurie Eby
REVENUE MANAGER Jim Muschinske
PENSION MANAGER Dan Hankiewicz
AUTHORS OF REPORT Benjamin L. Varner Lynnae Kapp Laurie Eby Dan Hankiewicz
OFFICE ASSISTANT
Briana Jackson

TABLE OF CONTENTS
3-Year Budget Forecast (FY 2016 – FY 2018)
April 2015
Section PAGE Introduction i I. Illinois Budget History 1 II. Threats and Opportunities 5 III. 3-Year Budget Forecasts 9 TABLES:
1 General Funds Revenue Growth Rates 2 2 General Funds Expenditures Growth Rates 4 3 CGFA FY 2016 General Funds Forecast 5 4 Illinois General Obligation Bond Ratings 8 5 CGFA Estimates FY 2015 - FY 2018 9 6 3-Year Budget Scenarios 12 CHARTS:
1 FY 2014 Base General Funds Revenues 1 2 FY 2014 Base General Funds Expenditures 3 3 Projected Total State Pension Cost for State Retirement Systems 7 4 General Funds End of Fiscal Year Fund Balance History 9 APPENDIX:
A Detailed General Funds Revenue History FY2005 – FY2014 13 B General Funds Expenditures History by Agency FY2005 – FY2014 14


INTRODUCTION
As part of Public Act 0958 of the 96th General Assembly, the Commission on Government Forecasting and Accountability has been directed to “…develop a 3-year budget forecast for the State, including opportunities and threats concerning anticipated revenues and expenditures, with an appropriate level of detail.” This report represents the Commission’s mandated 3-year budget forecast. It begins with an examination of the State of Illinois’ General Funds revenues and expenditures over the last 15 years; then considers threats and opportunities to Illinois’ budget; finally, it concludes with potential 3-year budget results based upon scenario analysis.
i


-1-
I. Illinois’ Budget History To begin analyzing Illinois’ budget, an assessment of historical General Fund revenues and expenditures was conducted. The examined data was from the Illinois State Comptroller’s annual report entitled “Traditional Budgetary Financial Report.” The composition of base revenues and expenditures were evaluated. In addition, growth rates for both revenues and expenditures were calculated over various time periods. These assessments were then used to assist in the Commission’s 3-year budget forecast. Revenues
Base General Funds revenue totaled $36.7 billion in FY 2014. This amount excludes short-term borrowing, transfers to the Budget Stabilization Fund, the Pension Contribution Fund, the FY13/14 Backlog Payment Fund, and other cash flow transfers. The largest component of base revenue came from the Personal Income Tax (Net) which equaled $16.6 billion after refunds. This amounted to 45% of total General Funds revenue. The next highest amount came from the Sales Tax which totaled $7.7 billion, or 21% of the total. Federal Sources and the Corporate Income Tax were the next biggest sources of revenue at $3.9 billion and $3.2 billion. Chart 1 illustrates the make-up of FY 2014 Base General Funds revenue. Appendix A shows historical totals for General Funds revenue from FY 2005 to FY 2014.
Personal Income Tax (Net)$16,642
45%
Sales Taxes$7,676
21%
Federal Sources$3,903
11%
Corporate Income Tax (Net)
$3,164 8%
Other State Taxes$2,208
6%
Transfers (includes Lottery and Gaming)
$2,112 6%
Public Utility Taxes$1,013
3%
Chart 1. FY 2014 BaseGeneral Funds Revenues
($ Million)*
Source: Illinois Comptroller*Excludes short-term borrowing, cash flow transfers and tranfers to the budget stabilization, the pension contribution funds, and the FY'13-14 Backlog Payment Fund
Total = $36,718

-2-
Three sources, Personal Income Tax, Sales Taxes, and Federal Sources, annually contributed approximately 65% to 75% of total revenue. The proportional make-up of General Funds revenue has been relatively steady over the last decade although Federal Sources, which is highly dependent on Medicaid and related reimbursement rates, varies from about 10% to 20% of base revenues depending upon the fiscal year. Federal Sources made up over 20% of base revenues in FY 2009 and FY 2010 but have been around 11% in the last three fiscal years. Over the last decade, base General Funds revenue grew at an average rate of 3.9% per year. Of the three biggest sources, Personal Income Tax (Net) averaged the highest growth rate at 9.6%. This growth was due to the increase in the income tax rate for tax year 2011 which led to increases of over 30% in both FY 2011 and FY 2012. Sales taxes grew by an average of 2.1% per year, while Federal Sources dropped approximately -1.4% per year though this source has shown a high level of volatility. Table 1 shows growth rates for each revenue source over different time periods.
1-Year 3-Year 5-Year 10-Year 15-YearRevenue Sources Growth Average Average Average Average
State Taxes Personal Income Tax (Net) 0.6% 15.1% 13.9% 9.6% 6.4% Sales Taxes 4.4% 4.0% 2.7% 2.1% 2.2% Other State Taxes 5.0% 5.8% 1.1% 0.1% 1.7% Transfers (includes Lottery and Gaming) 23.9% 0.2% 7.0% -0.2% 5.1% Corporate Income Tax (Net) -0.4% 20.5% 15.5% 14.5% 9.0% Public Utility Taxes -1.9% -3.8% -2.6% -0.5% 0.1%
Total State Sources 2.8% 9.6% 8.2% 5.3% 4.4%
Federal Sources -6.0% -8.3% -8.7% -1.4% 1.6%
Total, Base Revenues 1.8% 6.5% 5.0% 3.9% 3.7%
TABLE 1. GENERAL FUNDS REVENUE GROWTH RATES
($ million)*FY 1999 - FY 2014
*Excludes short-term borrowing, cash flow transfers, and tranfers to the budget stabilization and the pension contribution funds

-3-
Expenditures
Base General Funds expenditures amounted to $36.7 billion in FY 2014. Base expenditures exclude short-term borrowing, transfers to the budget stabilization fund, and cash flow transfers. This was an increase of 4.2%, or $1.5 billion, from FY 2013 when base expenditures were $35.2 billion. Approximately half of this increase can be accounted for by a $739 million increase in expenditures for the Teachers’ Retirement System (TRS) which grew from $2.8 billion in FY 2013 to $3.5 billion. The other major increase in expenditures was found in the $566 million increase in spending at the Department of Healthcare and Family Services (DHFS). For the ninth year in a row, DHFS had the highest level of expenditures at $7.3 billion or approximately 20% of total base expenditures. DHFS was followed by the State Board of Education at $6.7 billion. Net transfers out accounted for just under $5.5 billion in base expenditures. A break-down of base expenditures can be found in Chart 2 below. For a more detailed look at expenditures over the last decade, please see Appendix B in the back of this report.
Healthcare and Family Services$7,292
20%
State Board of Education$6,681
18%
Transfers Out , Net$5,497
15%
Teachers Retirement System$3,529
10%
Higher Education Agencies$3,303
9%
Human Services$3,217
9%
All Other Agencies$7,242
20%
Chart 2. FY 2014 Base General Funds Expenditures
($ Million)*
*Data does not show a -$60 million prior year adjustment and excludes short-term borrowing, cash flow transfers, repayment of interfund borrowing, and tranfers to the budget stabilization fundSource: Office of the Comptroller
Total = $36,701

-4-
Table 2 illustrates the growth of base general funds expenditures over the last 15 years. As shown in the table, total expenditures grew 4.2% in FY 2014 which was below the 10-year and 15-year averages of 4.4% and 5.5%. As mentioned previously, the largest numerical increase was seen in expenditures at TRS at $739 million. This equated to 26.5% growth. The growth rates for TRS are extremely high over the various time periods. The high rates of average growth are largely due to an 874% increase in expenditures in FY 2012. This large increase was due to the use of pension notes to fund a large portion of TRS spending in FY 2010 and FY 2011. In FY 2012, the State resumed funding TRS with money from the General Funds. Excluding FY 2012, the 10-year and 15-year averages would have been 1.7% and 4.2% even with the large increase in FY 2014. Looking at other areas within the budget, the highest growth rates have occurred in the transfers out category. Transfers out have averaged growth of almost 11% over the last 15 years. Similar to TRS, this high rate is somewhat misleading as this category has shown high levels of volatility. Actual expenditures on transfers out equaled $5.5 billion in FY 2014 which is similar to the $5.6 billion in FY 2005 as can be seen in Appendix B.
1-Year 3-Year 5-Year 10-Year 15-YearWARRANTS ISSUED Growth Growth Growth Growth GrowthBY AGENCY Healthcare and Family Services 8.4% 0.8% -4.2% 4.2% 4.7% State Board of Education 2.2% -1.1% -1.9% 2.1% 2.7% Human Services -6.7% -6.0% -4.8% -1.0% n/a Higher Education Agencies 2.1% 16.1% 7.5% 4.3% 3.1% Corrections 8.9% 2.0% -0.2% 1.0% 1.5% Children and Family Services -5.1% -6.6% -5.4% -1.3% -1.5% Aging -11.8% 15.5% 13.4% n/a n/a Teachers Retirement System 26.5% 304.2% * 160.1% * 89.0% * 62.2% * All Other Agencies 0.0% 29.2% 19.6% 7.3% 5.9%
Prior Year Adjustments 185.7% 136.5% 92.1% 20.6% 19.6%
Total Warrants Issued (14 months) 3.9% 7.5% 1.5% 3.6% 5.4%
Transfers Transfers Out 2.7% -6.4% 2.5% 13.3% 10.9%
Total, Base Expenditures 4.2% 6.4% 2.4% 4.4% 5.5%* Teacher Retirement System expenditure growth rates are extemely high due to FY 2012 growth of over 874%, excluding FY 2012, the 10-Year and 15-Year growth rates would have been 1.7% and 4.2%. This large increase was due to the return of using General Funds revenue to fund the Teacher Retirment System after mostly using pension notes in FY 2010 and FY 2011.
TABLE 2. GENERAL FUNDS EXPENDITURES GROWTH RATESFY 2000 - FY 2014
-5-
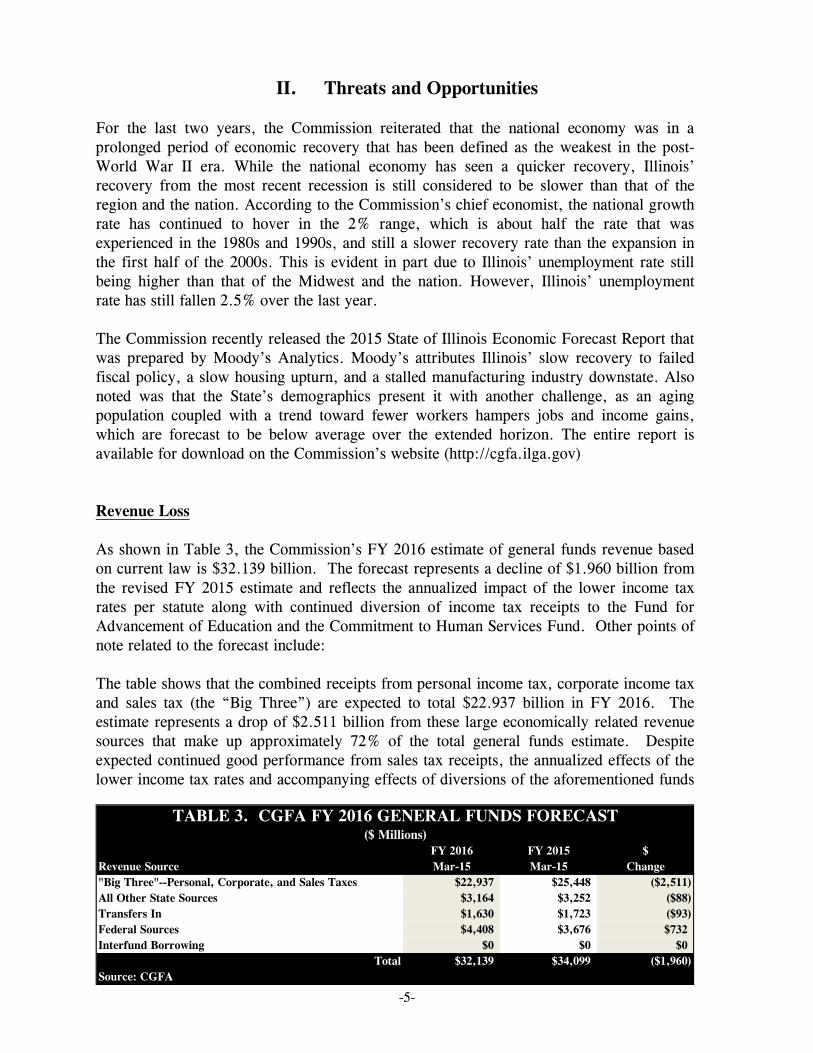
II. Threats and Opportunities
For the last two years, the Commission reiterated that the national economy was in a prolonged period of economic recovery that has been defined as the weakest in the post-World War II era. While the national economy has seen a quicker recovery, Illinois’ recovery from the most recent recession is still considered to be slower than that of the region and the nation. According to the Commission’s chief economist, the national growth rate has continued to hover in the 2% range, which is about half the rate that was experienced in the 1980s and 1990s, and still a slower recovery rate than the expansion in the first half of the 2000s. This is evident in part due to Illinois’ unemployment rate still being higher than that of the Midwest and the nation. However, Illinois’ unemployment rate has still fallen 2.5% over the last year. The Commission recently released the 2015 State of Illinois Economic Forecast Report that was prepared by Moody’s Analytics. Moody’s attributes Illinois’ slow recovery to failed fiscal policy, a slow housing upturn, and a stalled manufacturing industry downstate. Also noted was that the State’s demographics present it with another challenge, as an aging population coupled with a trend toward fewer workers hampers jobs and income gains, which are forecast to be below average over the extended horizon. The entire report is available for download on the Commission’s website (http://cgfa.ilga.gov) Revenue Loss As shown in Table 3, the Commission’s FY 2016 estimate of general funds revenue based on current law is $32.139 billion. The forecast represents a decline of $1.960 billion from the revised FY 2015 estimate and reflects the annualized impact of the lower income tax rates per statute along with continued diversion of income tax receipts to the Fund for Advancement of Education and the Commitment to Human Services Fund. Other points of note related to the forecast include: The table shows that the combined receipts from personal income tax, corporate income tax and sales tax (the “Big Three”) are expected to total $22.937 billion in FY 2016. The estimate represents a drop of $2.511 billion from these large economically related revenue sources that make up approximately 72% of the total general funds estimate. Despite expected continued good performance from sales tax receipts, the annualized effects of the lower income tax rates and accompanying effects of diversions of the aforementioned funds
FY 2016 FY 2015 $Revenue Source Mar-15 Mar-15 Change"Big Three"--Personal, Corporate, and Sales Taxes $22,937 $25,448 ($2,511)All Other State Sources $3,164 $3,252 ($88)Transfers In $1,630 $1,723 ($93)Federal Sources $4,408 $3,676 $732Interfund Borrowing $0 $0 $0
Total $32,139 $34,099 ($1,960)
TABLE 3. CGFA FY 2016 GENERAL FUNDS FORECAST
Source: CGFA
($ Millions)

-6-
will equate into a significant drop in revenues from these major revenue contributors. (A more detailed discussion can be found on the following page). A drop off of $88 million is anticipated from all other state source revenues. In large part the decline is due to the one-time nature of court settlement proceeds received in FY 2015 but not expected to repeat next year. For the most part, the smaller miscellaneous general revenue lines are relatively flat and offer little in the way of growth. Overall transfers are expected to decline $93 million. While lottery transfers should produce minor gains, riverboat gaming will continue to flag, and one time Refund Fund transfers will probably not recur, nor other miscellaneous transfers be able to generate any growth. Federal sources for FY 2016 are extremely difficult to predict, particularly given the Governor’s announced spending plan. For now, the Commission will display a figure of $4.408 billion for FY 2016 which is the same as that being carried by the GOMB under their “Maintenance/Autopilot” budget scenario. Federal sources are governed by appropriation levels, available cash for spending, and what bills are paid by the Comptroller. Add to those considerable variables the additional ambiguity created by the significant programmatic Medicaid changes called for by the Governor, and it brews up a near impossible task of forecasting federal sources. The magnitude of a revenue loss from the aforementioned sources, absent viable alternatives, will unarguably result in substantial budget cuts and direct financial and operational challenges for all state funded entities, vendors, and social service providers, amongst others. Backlog of Payables In addition to the drop off in revenue, another threat to the fiscal security of the State is the continued backlog of old bills. According to the Illinois Comptroller, at the end of FY 2014, the backlog of payables totaled $3.3 billion. This amount has grown to approximately $5.7 billion at the end of March 2015. This amount is expected to continue to grow through the remainder of the fiscal year. This $5.7 billion amount is based upon 119,044 outstanding bills with an average amount of just under $48,000.

-7-
State Pension Liability When the Commission submitted its three-year budget forecast last year, we noted that the major pension reform bill passed in 2013, P.A. 98-0599 (SB 1), was in legal limbo. In March of last year, the circuit court had not yet handed down a ruling on the constitutionality of SB 1, but in the time since the last report, the circuit court has ruled for the plaintiffs and found that the State does not possess “police powers” that would allow it to circumvent the contractual obligation to not impair or diminish pension benefits. The circuit court ruling was handed down on Nov. 21st, 2014. The matter was expedited to the Illinois Supreme Court, which heard oral arguments in the case on March 11th. A decision is expected sometime in late May of this year. Because the circuit court had issued an injunction against the enforcement of SB 1 on May 14th of last year, the State Retirement Systems prepared their June 30, 2014 actuarial valuations pursuant to the previous funding law, P.A. 88-593, commonly known as the “1995 funding law.” Under P.A. 88-593, the State is required to make contributions to the systems as a level percentage of payroll such that a 90% funding ratio is to be attained in FY 2045. The chart below reflects the actuarial forecast of projected State contributions to the five systems as prepared by each system’s actuary pursuant to P.A. 88-593. The chart is composed of three parts – the regular contributions pursuant to the 1995 law, plus the debt service components from the 2010-2011 bond/note issuances, and also the debt service associated with the 2003 Pension Obligation Bond issuance.
FY 2015 FY 2016 FY 2017 FY 2018 FY 2019 FY 2020
2010/11 Debt Service $1,219.3 $781.9 $1,052.2 $1,003.9 $952.9 $0.0
2003 POB Debt Service $578.6 $574.5 $595.2 $614.7 $633.2 $674.6
Regular Contribution $6,855.3 $7,537.3 $7,605.7 $7,779.9 $7,907.9 $8,065.2
$8,653.2 $8,893.7$9,253.1 $9,398.5 $9,494.0
$8,739.8
$0.0
$1,000.0
$2,000.0
$3,000.0
$4,000.0
$5,000.0
$6,000.0
$7,000.0
$8,000.0
$9,000.0
$10,000.0
CHART 3. PROJECTED TOTAL STATE PENSION COST FOR STATE RETIREMENET SYSTEMS
Based on Public Act 88-0593FY 2015 - FY 2020
($ in Millions)

-8-
General Obligation Bond Rating Since January 2013, Illinois has seen its General Obligation Bond ratings downgraded by all three rating agencies. In January 2013, Standard & Poor’s downgraded Illinois to a rating of A- with a “developing” outlook. This outlook was changed to negative in July 2014 due to the enacted FY 2015 budget that S&P believed was “not structurally aligned” and “will contribute to growing deficits and weakened liquidity”. This means they could raise or lower the rating during a two-year outlook period. In June 2013 Fitch downgraded Illinois to an A- rating and Moody’s to an A3 rating (the equivalent of an A-). Both Fitch and Moody’s have Illinois on a ‘Negative Watch’ for possible downgrading based on the ongoing budget and pension funding concerns. All three ratings agencies also pointed to the expiration of the State’s income tax increase as a problem affecting the State’s “structural budget balance”. Fitch, Moody’s and Standard & Poor’s all reaffirmed their current ratings for the State after an Illinois judge put the stay on the implementation of the State’s pension reforms in May 2014. Court challenges were expected and the ratings agencies are waiting on a decision from the Illinois Supreme Court and on the State’s passage of a Fiscal Year 2016 budget. Depending on the court’s decision regarding pension reform and its subsequent impact on the budget, Illinois could experience either upgrades or downgrades in the future.
Mar-Jul Dec Mar-Apr June Jan Aug Jan June2009 2009 2010 2010 2012 2012 2013 2013
A A A-/A+* A A A A A-AA- A+ A+ A+ A+ A A - A -A1 A2 A2/Aa3* A1 A2 A2 A2 A3
*Fitch and Moody's recalibrated their Municipal Bond ratings to be on a scale with their global ratings,
TABLE 4. ILLINOIS GENERAL OBLIGATION BOND RATINGS
-9-
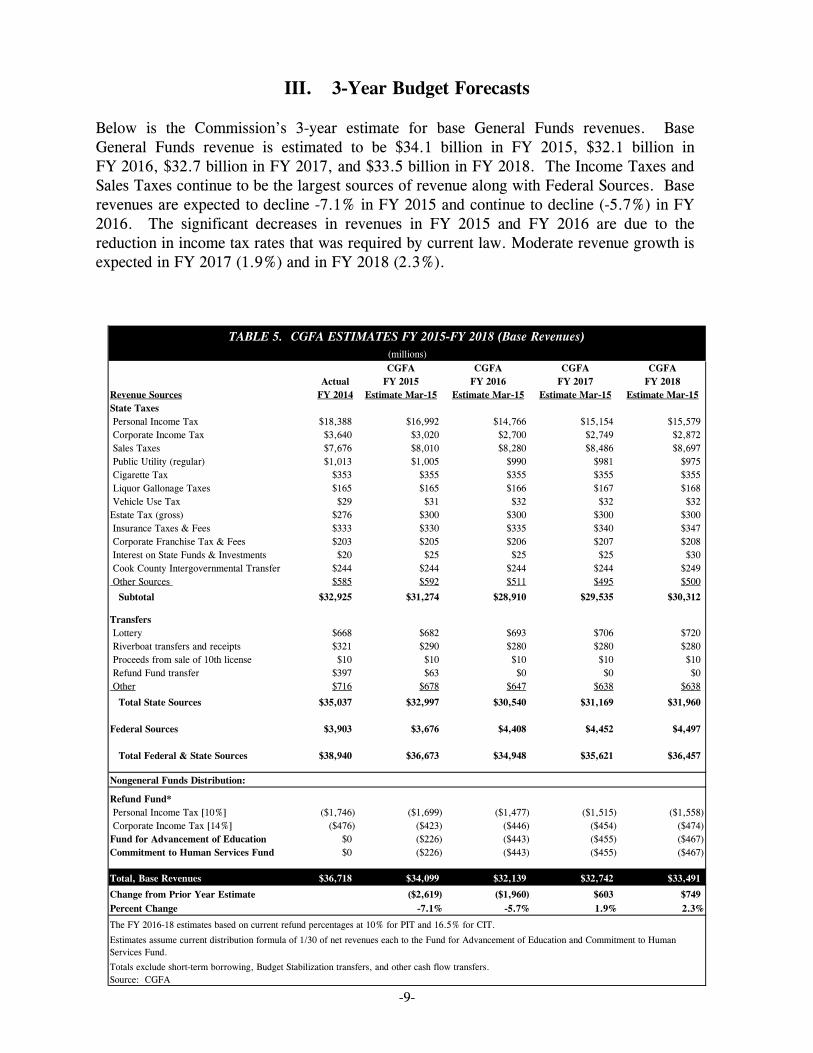
III. 3-Year Budget Forecasts Below is the Commission’s 3-year estimate for base General Funds revenues. Base General Funds revenue is estimated to be $34.1 billion in FY 2015, $32.1 billion in FY 2016, $32.7 billion in FY 2017, and $33.5 billion in FY 2018. The Income Taxes and Sales Taxes continue to be the largest sources of revenue along with Federal Sources. Base revenues are expected to decline -7.1% in FY 2015 and continue to decline (-5.7%) in FY 2016. The significant decreases in revenues in FY 2015 and FY 2016 are due to the reduction in income tax rates that was required by current law. Moderate revenue growth is expected in FY 2017 (1.9%) and in FY 2018 (2.3%).
CGFA CGFA CGFA CGFAActual FY 2015 FY 2016 FY 2017 FY 2018
Revenue Sources FY 2014 Estimate Mar-15 Estimate Mar-15 Estimate Mar-15 Estimate Mar-15State Taxes Personal Income Tax $18,388 $16,992 $14,766 $15,154 $15,579 Corporate Income Tax $3,640 $3,020 $2,700 $2,749 $2,872 Sales Taxes $7,676 $8,010 $8,280 $8,486 $8,697 Public Utility (regular) $1,013 $1,005 $990 $981 $975 Cigarette Tax $353 $355 $355 $355 $355 Liquor Gallonage Taxes $165 $165 $166 $167 $168 Vehicle Use Tax $29 $31 $32 $32 $32Estate Tax (gross) $276 $300 $300 $300 $300 Insurance Taxes & Fees $333 $330 $335 $340 $347 Corporate Franchise Tax & Fees $203 $205 $206 $207 $208 Interest on State Funds & Investments $20 $25 $25 $25 $30 Cook County Intergovernmental Transfer $244 $244 $244 $244 $249 Other Sources $585 $592 $511 $495 $500
Subtotal $32,925 $31,274 $28,910 $29,535 $30,312
Transfers Lottery $668 $682 $693 $706 $720 Riverboat transfers and receipts $321 $290 $280 $280 $280 Proceeds from sale of 10th license $10 $10 $10 $10 $10 Refund Fund transfer $397 $63 $0 $0 $0 Other $716 $678 $647 $638 $638
Total State Sources $35,037 $32,997 $30,540 $31,169 $31,960
Federal Sources $3,903 $3,676 $4,408 $4,452 $4,497
Total Federal & State Sources $38,940 $36,673 $34,948 $35,621 $36,457
Nongeneral Funds Distribution:
Refund Fund* Personal Income Tax [10%] ($1,746) ($1,699) ($1,477) ($1,515) ($1,558) Corporate Income Tax [14%] ($476) ($423) ($446) ($454) ($474)Fund for Advancement of Education $0 ($226) ($443) ($455) ($467)Commitment to Human Services Fund $0 ($226) ($443) ($455) ($467)
Total, Base Revenues $36,718 $34,099 $32,139 $32,742 $33,491
Change from Prior Year Estimate ($2,619) ($1,960) $603 $749Percent Change -7.1% -5.7% 1.9% 2.3%
Totals exclude short-term borrowing, Budget Stabilization transfers, and other cash flow transfers.Source: CGFA
TABLE 5. CGFA ESTIMATES FY 2015-FY 2018 (Base Revenues)(millions)
The FY 2016-18 estimates based on current refund percentages at 10% for PIT and 16.5% for CIT.
Estimates assume current distribution formula of 1/30 of net revenues each to the Fund for Advancement of Education and Commitment to Human Services Fund.

-10-
The Commission used these revenue estimates to present various budget scenarios using different spending levels as spending will change based upon priorities that will be determined during budget negotiations. Six budget scenarios were analyzed using different spending growth rates. These growth rates were applied to the FY 2015 spending base of $35.7 billion as indicated in the Governor’s “autopilot” budget projection released in February of 2015. No debt restructuring was assumed in any of these scenarios. The first growth rate scenario was annual declines in spending of -6.9% which is the rate at which the cumulative surplus/deficit would equal $0 at the end of the three years. The second rate was annual declines of -1%. The third scenario was 0.0% growth or flat spending. This was done to demonstrate what would happen if spending was held constant over the next three years. Scenario four through six use average growth rates in expenditures over various time periods. Scenario four uses the 5-year average (2.4%), scenario five uses the 10-year rate (4.4%), and the last scenario uses 5.5% annual growth which equals the 15-year average. Scenario Analysis Results Results of the various budget scenarios can be found in Table 6. Table 6 contains revenues, spending, operating surplus/deficit, and cumulative surplus/deficit information for each scenario. The cumulative surplus/deficit data assumes a cumulative deficit of -$3.9 billion at the end of FY 2014 which was taken from the FY 2015 budget book and a cumulative deficit of -$5.5 billion at the end of FY 2015. The -$3.9 billion cumulative deficit is different from what the Comptroller stated earlier in this report due to the budget book including bills still at the agency level. No scenario analyzed resulted in a cumulative surplus over the three years analyzed. In fact, only one scenario had years with surpluses and that scenario was specifically used to demonstrate what it would take to get the cumulative deficit to zero. These poor results are due to the scheduled lowering of the income tax rates which significantly lowered the expected amount of revenue in FY 2015 and FY 2016. To obtain yearly surpluses with the revenues assumed under current law would require significant decreases in expenditures.

-11-
Scenario 1. -6.9% Annual Decline in Spending The first scenario analyzed (annual declines of -6.9%) would get the Budget Basis Fund Balance (Deficit) at the end of the fiscal year to zero by the end of FY 2018. This column is described as cumulative surplus/deficit in Table 6. This scenario saw deficit spending in FY 2016 but surpluses in FY 2017 and FY 2018. Base expenditures would be reduced to only $28.8 billion in FY 2018 in this scenario. Scenario 2. -1% Annual Decline in Spending The second scenario (annual declines of -1% in spending) would have operating deficits in all three projected fiscal years. The deficit would be -$3.2 billion in FY 2016 and improve to -$1.1 billion in FY 2018. The cumulative deficit would worsen to -$12.0 billion. Scenario 3. Flat Spending Scenario 3 shows what would happen if expenditures were frozen at FY 2015 levels. This scenario once again predicts three years of deficits with FY 2015 having a deficit of over -$3.5 billion. The cumulative deficit rises to -$14.2 billion at the end of the three years. Scenario 4. 2.4% Annual Growth in Spending (5-Year Average Growth) Scenario 4 examines the results if spending were kept to 2.4% per year which is the 5-year average. This scenario leads to annual deficits of between $4 billion to $5 billion per year. The annual deficit would equal -$4.4 billion in FY 2016, grow to -$4.7 billion in FY 2017, and be -$4.8 billion in FY 2018. The cumulative deficit would grow to -$19.4 billion. Spending would grow to approximately $38.3 billion, while revenues would only be $33.5 billion. Scenario 5. 4.4% Annual Growth in Spending (10-Year Average Growth) Scenario 5 sees a deficit of -$5.1 billion in FY 2016, which grows by approximately a billion dollars per year. The deficit grows to -$6.2 billion in FY 2017 and to -$7.1 billion in FY 2018. The cumulative deficit would grow to -$23.9 billion. Spending would grow to $40.6 billion if this scenario were to be implemented. Scenario 6. 5.5% Annual Growth in Spending (15-Year Average Growth) Similar to scenarios 4 and 5, scenario 6 sees large deficits that grow quickly. Total spending almost reaches $42 billion using these assumed growth rates. A deficit of -$5.5 billion in FY 2016, would grow to -$7.0 billion in FY 2017, and to -$8.4 billion in FY 2018. The cumulative deficit would grow to -$26.4 billion.

-12-
Revenues SpendingOperating
Surplus/DeficitCumulative
Surplus/Deficit Revenues SpendingOperating
Surplus/DeficitCumulative
Surplus/DeficitFY 2015 $34,099 $35,687 ($1,588) ($5,465) FY 2015 $34,099 $35,687 ($1,588) ($5,465)FY 2016 $32,139 $33,216 ($1,077) ($6,542) FY 2016 $32,139 $36,543 ($4,404) ($9,869)FY 2017 $32,742 $30,916 $1,826 ($4,716) FY 2017 $32,742 $37,421 ($4,679) ($14,548)FY 2018 $33,491 $28,775 $4,716 $0 FY 2018 $33,491 $38,319 ($4,828) ($19,376)
Revenues SpendingOperating
Surplus/DeficitCumulative
Surplus/Deficit Revenues SpendingOperating
Surplus/DeficitCumulative
Surplus/DeficitFY 2015 $34,099 $35,687 ($1,588) ($5,465) FY 2015 $34,099 $35,687 ($1,588) ($5,465)FY 2016 $32,139 $35,330 ($3,191) ($8,656) FY 2016 $32,139 $37,257 ($5,118) ($10,583)FY 2017 $32,742 $34,977 ($2,235) ($10,891) FY 2017 $32,742 $38,897 ($6,155) ($16,738)FY 2018 $33,491 $34,627 ($1,136) ($12,027) FY 2018 $33,491 $40,608 ($7,117) ($23,855)
Revenues SpendingOperating
Surplus/DeficitCumulative
Surplus/Deficit Revenues SpendingOperating
Surplus/DeficitCumulative
Surplus/DeficitFY 2015 $34,099 $35,687 ($1,588) ($5,465) FY 2015 $34,099 $35,687 ($1,588) ($5,465)FY 2016 $32,139 $35,687 ($3,548) ($9,013) FY 2016 $32,139 $37,650 ($5,511) ($10,976)FY 2017 $32,742 $35,687 ($2,945) ($11,958) FY 2017 $32,742 $39,721 ($6,979) ($17,954)FY 2018 $33,491 $35,687 ($2,196) ($14,154) FY 2018 $33,491 $41,905 ($8,414) ($26,368)
All scenarios use GGFA revenue estimates, the Governor's proposed "autopilot" budget for the FY 2015 spending, and a cumulative deficit of ($3,877) at the end of FY 2014.
TABLE 6. 3-YEAR BUDGET SCENARIOS($ million)
Scenario 2: -1% Annual Decline in Spending Scenario 5: 10-Year Average Growth in Spending (4.4%)
Scenario 3: Flat Spending (0% growth) Scenario 6: 15-Year Average Growth in Spending (5.5%)
Scenario 1: -6.9% Annual Decline in Spending Scenario 4: 5-Year Average Growth in Spending (2.4%)
-13-
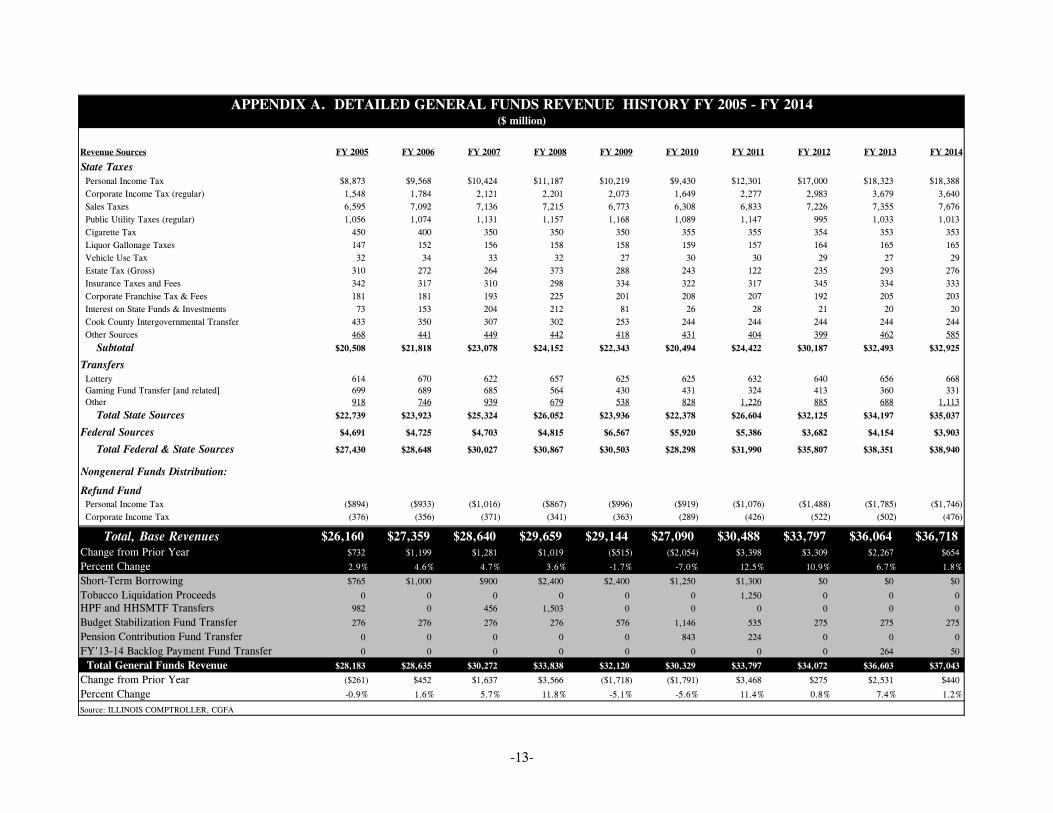
Revenue Sources FY 2005 FY 2006 FY 2007 FY 2008 FY 2009 FY 2010 FY 2011 FY 2012 FY 2013 FY 2014
State Taxes Personal Income Tax $8,873 $9,568 $10,424 $11,187 $10,219 $9,430 $12,301 $17,000 $18,323 $18,388 Corporate Income Tax (regular) 1,548 1,784 2,121 2,201 2,073 1,649 2,277 2,983 3,679 3,640 Sales Taxes 6,595 7,092 7,136 7,215 6,773 6,308 6,833 7,226 7,355 7,676 Public Utility Taxes (regular) 1,056 1,074 1,131 1,157 1,168 1,089 1,147 995 1,033 1,013 Cigarette Tax 450 400 350 350 350 355 355 354 353 353 Liquor Gallonage Taxes 147 152 156 158 158 159 157 164 165 165 Vehicle Use Tax 32 34 33 32 27 30 30 29 27 29 Estate Tax (Gross) 310 272 264 373 288 243 122 235 293 276 Insurance Taxes and Fees 342 317 310 298 334 322 317 345 334 333 Corporate Franchise Tax & Fees 181 181 193 225 201 208 207 192 205 203 Interest on State Funds & Investments 73 153 204 212 81 26 28 21 20 20 Cook County Intergovernmental Transfer 433 350 307 302 253 244 244 244 244 244 Other Sources 468 441 449 442 418 431 404 399 462 585
Subtotal $20,508 $21,818 $23,078 $24,152 $22,343 $20,494 $24,422 $30,187 $32,493 $32,925
Transfers Lottery 614 670 622 657 625 625 632 640 656 668 Gaming Fund Transfer [and related] 699 689 685 564 430 431 324 413 360 331 Other 918 746 939 679 538 828 1,226 885 688 1,113
Total State Sources $22,739 $23,923 $25,324 $26,052 $23,936 $22,378 $26,604 $32,125 $34,197 $35,037
Federal Sources $4,691 $4,725 $4,703 $4,815 $6,567 $5,920 $5,386 $3,682 $4,154 $3,903
Total Federal & State Sources $27,430 $28,648 $30,027 $30,867 $30,503 $28,298 $31,990 $35,807 $38,351 $38,940
Nongeneral Funds Distribution:
Refund Fund Personal Income Tax ($894) ($933) ($1,016) ($867) ($996) ($919) ($1,076) ($1,488) ($1,785) ($1,746) Corporate Income Tax (376) (356) (371) (341) (363) (289) (426) (522) (502) (476)
Total, Base Revenues $26,160 $27,359 $28,640 $29,659 $29,144 $27,090 $30,488 $33,797 $36,064 $36,718Change from Prior Year $732 $1,199 $1,281 $1,019 ($515) ($2,054) $3,398 $3,309 $2,267 $654
Percent Change 2.9% 4.6% 4.7% 3.6% -1.7% -7.0% 12.5% 10.9% 6.7% 1.8%
Short-Term Borrowing $765 $1,000 $900 $2,400 $2,400 $1,250 $1,300 $0 $0 $0
Tobacco Liquidation Proceeds 0 0 0 0 0 0 1,250 0 0 0HPF and HHSMTF Transfers 982 0 456 1,503 0 0 0 0 0 0
Budget Stabilization Fund Transfer 276 276 276 276 576 1,146 535 275 275 275
Pension Contribution Fund Transfer 0 0 0 0 0 843 224 0 0 0
FY'13-14 Backlog Payment Fund Transfer 0 0 0 0 0 0 0 0 264 50
Total General Funds Revenue $28,183 $28,635 $30,272 $33,838 $32,120 $30,329 $33,797 $34,072 $36,603 $37,043
Change from Prior Year ($261) $452 $1,637 $3,566 ($1,718) ($1,791) $3,468 $275 $2,531 $440
Percent Change -0.9% 1.6% 5.7% 11.8% -5.1% -5.6% 11.4% 0.8% 7.4% 1.2%
Source: ILLINOIS COMPTROLLER, CGFA
APPENDIX A. DETAILED GENERAL FUNDS REVENUE HISTORY FY 2005 - FY 2014($ million)

-14-
WARRANTS ISSUED FY 2005 FY 2006 FY 2007 FY 2008 FY 2009 FY 2010 FY 2011 FY 2012 FY 2013 FY 2014
BY AGENCY Healthcare and Family Services $4,990 $7,343 $7,725 $8,089 $9,556 $7,239 $7,309 $8,158 $6,726 $7,292 State Board of Education 5,751 6,045 6,472 6,995 7,357 7,273 6,912 6,739 6,539 6,681 Human Services 3,747 3,817 3,885 4,086 4,144 3,997 3,894 3,415 3,448 3,217 Higher Education Agencies 2,210 2,190 2,269 2,195 2,398 2,230 2,146 2,844 3,234 3,303 Corrections 1,198 1,170 1,119 1,208 1,308 1,156 1,205 1,210 1,172 1,276 Children and Family Services 754 803 771 887 906 847 840 806 721 684 Aging 331 352 421 458 537 653 646 731 1,060 935 Teachers Retirement System 942 610 814 1,110 1,527 914 256 2,494 2,790 3,529 All Other Agencies 2,619 1,783 2,035 2,143 2,055 2,009 2,261 2,900 4,624 4,622
Prior Year Adjustments 25 (10) (11) (14) (14) (17) (22) (88) (21) (60)
Total Warrants Issued (14 months) $22,567 $24,103 $25,500 $27,157 $29,774 $26,301 $25,447 $29,209 $30,293 $31,479
Transfers Transfers Out (14 months) 5,680 4,349 4,616 7,380 5,185 6,450 6,937 5,164 5,350 5,497
Total Expenditures $28,247 $28,452 $30,116 $34,537 $34,959 $32,751 $32,384 $34,373 $35,643 $36,976Change from Prior Year $2,882 $205 $1,664 $4,421 $422 ($2,208) ($367) $1,622 $3,259 $2,603
Percent Change 11.4% 0.7% 5.8% 14.7% 1.2% -6.3% -1.1% 5.0% 10.1% 7.6%
Repayment of Short-Term Borrowing 768 1,014 11 1,503 1,424 2,276 1,322 0 0 0Cash Flow Transfers 979 0 1,356 2,400 300 870 260 0 0 0Repayment of Interfund Borrowing 0 0 0 0 0 0 9 355 133 0
Budget Stabilization Fund Transfers 276 276 276 276 276 0 276 550 275 275
Total, Base Expenditures $26,224 $27,162 $28,473 $30,358 $32,959 $29,605 $30,517 $33,468 $35,235 $36,701Change from Prior Year $2,075 $938 $1,311 $1,885 $2,601 ($3,354) $912 $2,951 $1,767 $1,466
Percent Change 8.6% 3.6% 4.8% 6.6% 8.6% -10.2% 3.1% 9.7% 5.3% 4.2%Source: ILLINOIS COMPTROLLER, CGFA
($ million)APPENDIX B. GENERAL FUNDS EXPENDITURES HISTORY BY AGENCY FY 2005 - FY 2014

BACKGROUND
The Commission on Government Forecasting and Accountability (CGFA), a bipartisan, joint legislative commission, provides the General Assembly with information relevant to the Illinois economy, taxes and other sources of revenue and debt obligations of the State. The Commission's specific responsibilities include:
1) Preparation of annual revenue estimates with periodic updates;
2) Analysis of the fiscal impact of revenue bills;
3) Preparation of "State Debt Impact Notes" on legislation which would appropriate bond funds or increase bond authorization;
4) Periodic assessment of capital facility plans;
5) Annual estimates of public pension funding requirements and preparation of pension impact notes;
6) Annual estimates of the liabilities of the State's group health insurance program and approval of contract renewals promulgated by the Department of Central Management Services;
7) Administration of the State Facility Closure Act. The Commission also has a mandate to report to the General Assembly ". . . on economic trends in relation to long-range planning and budgeting; and to study and make such recommendations as it deems appropriate on local and regional economic and fiscal policies and on federal fiscal policy as it may affect Illinois. . . ." This results in several reports on various economic issues throughout the year. The Commission publishes several reports each year. In addition to a Monthly Briefing, the Commission publishes the "Revenue Estimate and Economic Outlook" which describes and projects economic conditions and their impact on State revenues. The “Bonded Indebtedness Report" examines the State's debt position as well as other issues directly related to conditions in the financial markets. The “Financial Conditions of the Illinois Public Retirement Systems” provides an overview of the funding condition of the State’s retirement systems. Also published are an Annual Fiscal Year Budget Summary; Report on the Liabilities of the State Employees’ Group Insurance Program; and Report of the Cost and Savings of the State Employees’ Early Retirement Incentive Program. The Commission also publishes each year special topic reports that have or could have an impact on the economic well-being of Illinois. All reports are available on the Commission’s website. These reports are available from:
Commission on Government Forecasting and Accountability 703 Stratton Office Building Springfield, Illinois 62706 (217) 782-5320 (217) 782-3513 (FAX)
http://www.ilga.gov/commission/cgfa2006/home.aspx
Related Documents