In This Chapter 3.1 The Rectangular Coordinate System 3.2 Circles and Graphs 3.3 Equations of Lines 3.4 Variation Chapter 3 Review Exercises A Bit of History Every student of mathematics pays the French mathematician René Descartes (1596–1650) hom- age whenever he or she sketches a graph. Descartes is consid- ered the inventor of analytic geometry, which is the melding of algebra and geometry—at the time thought to be completely unrelated fields of mathematics. In analytic geometry an equa- tion involving two variables could be interpreted as a graph in a two-dimensional coordinate system embedded in a plane. The rectangular or Cartesian coordinate system is named in his honor. The basic tenets of analytic geometry were set forth in La Géométrie, published in 1637. The invention of the Cartesian plane and rectangular coordinates contributed significantly to the subsequent development of calculus by its co-inventors Isaac Newton (1643–1727) and Gottfried Wilhelm Leibniz (1646–1716). René Descartes was also a scientist and wrote on optics, astronomy, and meteorology. But beyond his contributions to mathematics and science, Descartes is also remembered for his impact on philosophy. Indeed, he is often called the father of modern philosophy and his book Meditations on First Philosophy continues to be required reading to this day at some universities. His famous phrase cogito ergo sum (I think, there- fore I am) appears in his Discourse on the Method and Principles of Philosophy. Although he claimed to be a fervent Catholic, the Church was suspicious of Descartes’ philosophy and writings on the soul, and placed all his works on the Index of Prohibited Books in 1693. 3 Rectangular Coordinate System and Graphs 123 In Section 3.3 we will see that parallel lines have the same slope. 06022_CH03_123-154.QXP 10/29/10 10:56 AM Page 123

Welcome message from author
This document is posted to help you gain knowledge. Please leave a comment to let me know what you think about it! Share it to your friends and learn new things together.
Transcript
In This Chapter
3.1 The Rectangular CoordinateSystem
3.2 Circles and Graphs
3.3 Equations of Lines
3.4 Variation
Chapter 3 Review Exercises
A Bit of History Every student of mathematics pays
the French mathematician René Descartes (1596–1650) hom-
age whenever he or she sketches a graph. Descartes is consid-
ered the inventor of analytic geometry, which is the melding
of algebra and geometry—at the time thought to be completely
unrelated fields of mathematics. In analytic geometry an equa-
tion involving two variables could be interpreted as a graph in
a two-dimensional coordinate system embedded in a plane.
The rectangular or Cartesian coordinate system is named in
his honor. The basic tenets of analytic geometry were set forth
in La Géométrie, published in 1637. The invention of the
Cartesian plane and rectangular coordinates contributed
significantly to the subsequent development of calculus by its
co-inventors Isaac Newton (1643–1727) and Gottfried
Wilhelm Leibniz (1646–1716).
René Descartes was also a scientist and wrote on optics,
astronomy, and meteorology. But beyond his contributions to
mathematics and science, Descartes is also remembered for
his impact on philosophy. Indeed, he is often called the father
of modern philosophy and his book Meditations on First
Philosophy continues to be required reading to this day at some
universities. His famous phrase cogito ergo sum (I think, there-
fore I am) appears in his Discourse on the Method and
Principles of Philosophy. Although he claimed to be a fervent
Catholic, the Church was suspicious of Descartes’philosophy
and writings on the soul, and placed all his works on the Index
of Prohibited Books in 1693.
3 Rectangular Coordinate
System and Graphs
123
In Section 3.3 we will see that parallel lineshave the same slope.
06022_CH03_123-154.QXP 10/29/10 10:56 AM Page 123
124 CHAPTER 3 RECTANGULAR COORDINATE SYSTEM AND GRAPHS
3.1
Introduction In Section 1.2 we saw that each real number can be associated withexactly one point on the number, or coordinate, line. We now examine a correspondencebetween points in a plane and ordered pairs of real numbers.
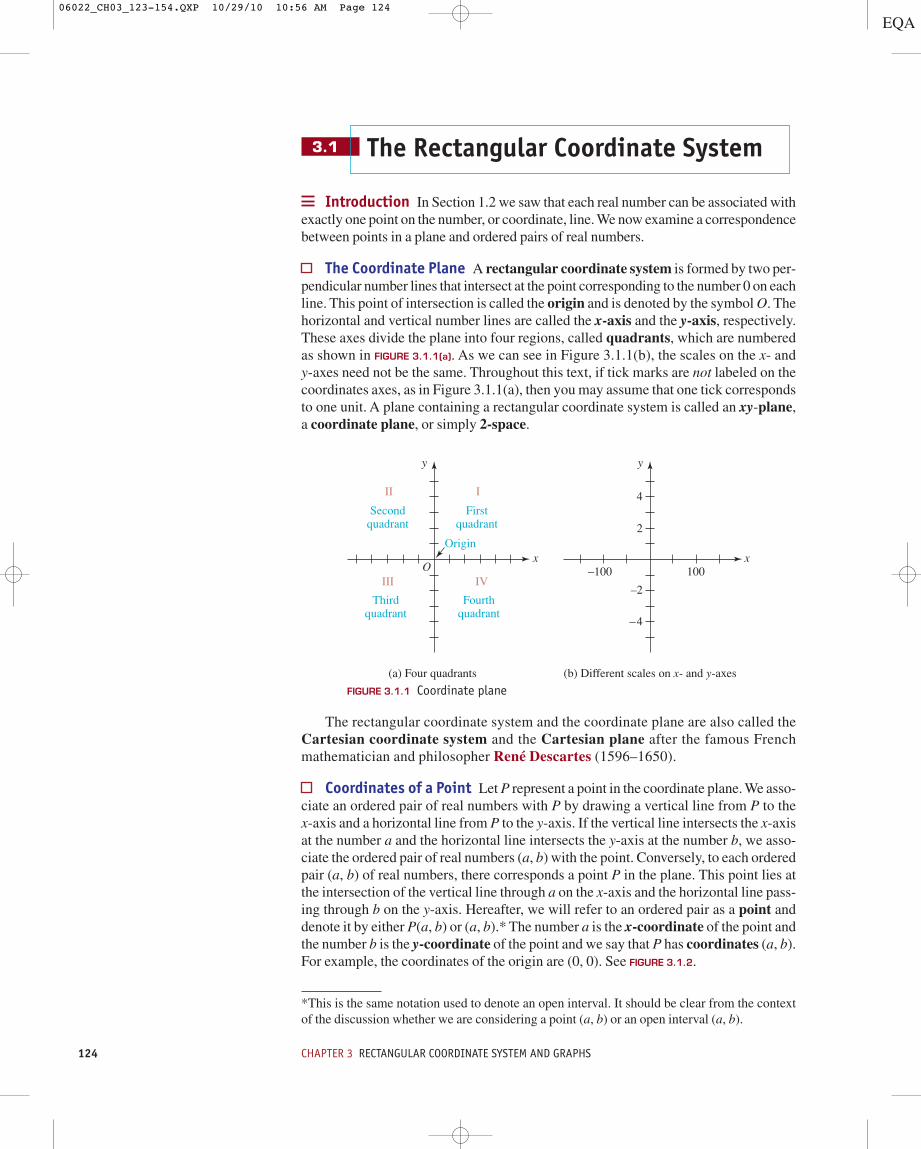
The Coordinate Plane A rectangular coordinate system is formed by two per-pendicular number lines that intersect at the point corresponding to the number 0 on eachline. This point of intersection is called the origin and is denoted by the symbol O. Thehorizontal and vertical number lines are called the x-axis and the y-axis, respectively.These axes divide the plane into four regions, called quadrants, which are numberedas shown in FIGURE 3.1.1(a). As we can see in Figure 3.1.1(b), the scales on the x- andy-axes need not be the same. Throughout this text, if tick marks are not labeled on thecoordinates axes, as in Figure 3.1.1(a), then you may assume that one tick correspondsto one unit. A plane containing a rectangular coordinate system is called an xy-plane,a coordinate plane, or simply 2-space.
The Rectangular Coordinate System
*This is the same notation used to denote an open interval. It should be clear from the contextof the discussion whether we are considering a point (a, b) or an open interval (a, b).
II
(a) Four quadrants (b) Different scales on x- and y-axes
I
–100 100III IV
Secondquadrant
Firstquadrant
Thirdquadrant
Fourthquadrant
Origin
y
xO
y
x
2
–2
–4
4
FIGURE 3.1.1 Coordinate plane
The rectangular coordinate system and the coordinate plane are also called theCartesian coordinate system and the Cartesian plane after the famous Frenchmathematician and philosopher René Descartes (1596–1650).
Coordinates of a Point Let P represent a point in the coordinate plane. We asso-ciate an ordered pair of real numbers with P by drawing a vertical line from P to thex-axis and a horizontal line from P to the y-axis. If the vertical line intersects the x-axisat the number a and the horizontal line intersects the y-axis at the number b, we asso-ciate the ordered pair of real numbers (a, b) with the point. Conversely, to each orderedpair (a, b) of real numbers, there corresponds a point P in the plane. This point lies atthe intersection of the vertical line through a on the x-axis and the horizontal line pass-ing through b on the y-axis. Hereafter, we will refer to an ordered pair as a point anddenote it by either P(a, b) or (a, b).* The number a is the x-coordinate of the point andthe number b is the y-coordinate of the point and we say that P has coordinates (a, b).For example, the coordinates of the origin are (0, 0). See FIGURE 3.1.2.
06022_CH03_123-154.QXP 10/29/10 10:56 AM Page 124
3.1 The Rectangular Coordinate System 125
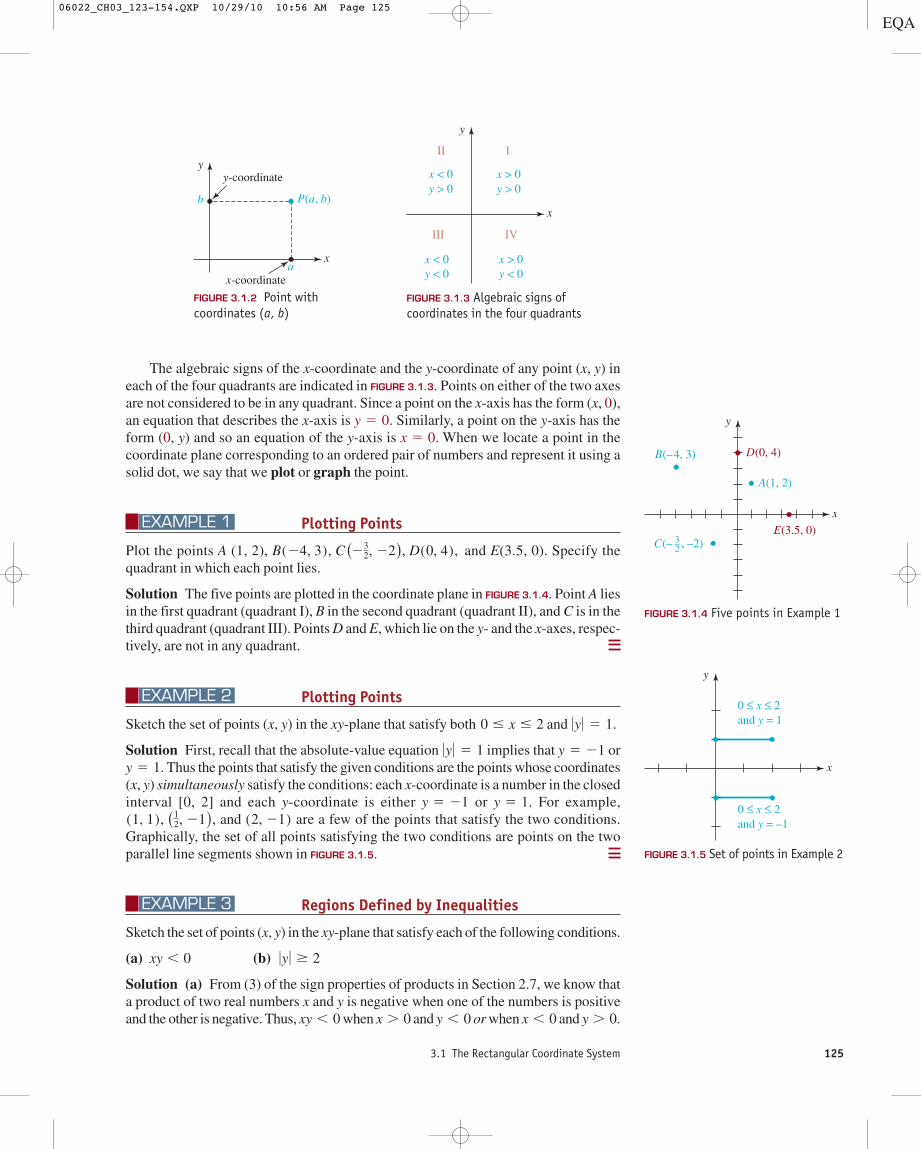
The algebraic signs of the x-coordinate and the y-coordinate of any point (x, y) ineach of the four quadrants are indicated in FIGURE 3.1.3. Points on either of the two axesare not considered to be in any quadrant. Since a point on the x-axis has the form (x, 0),an equation that describes the x-axis is Similarly, a point on the y-axis has theform (0, y) and so an equation of the y-axis is When we locate a point in thecoordinate plane corresponding to an ordered pair of numbers and represent it using asolid dot, we say that we plot or graph the point.
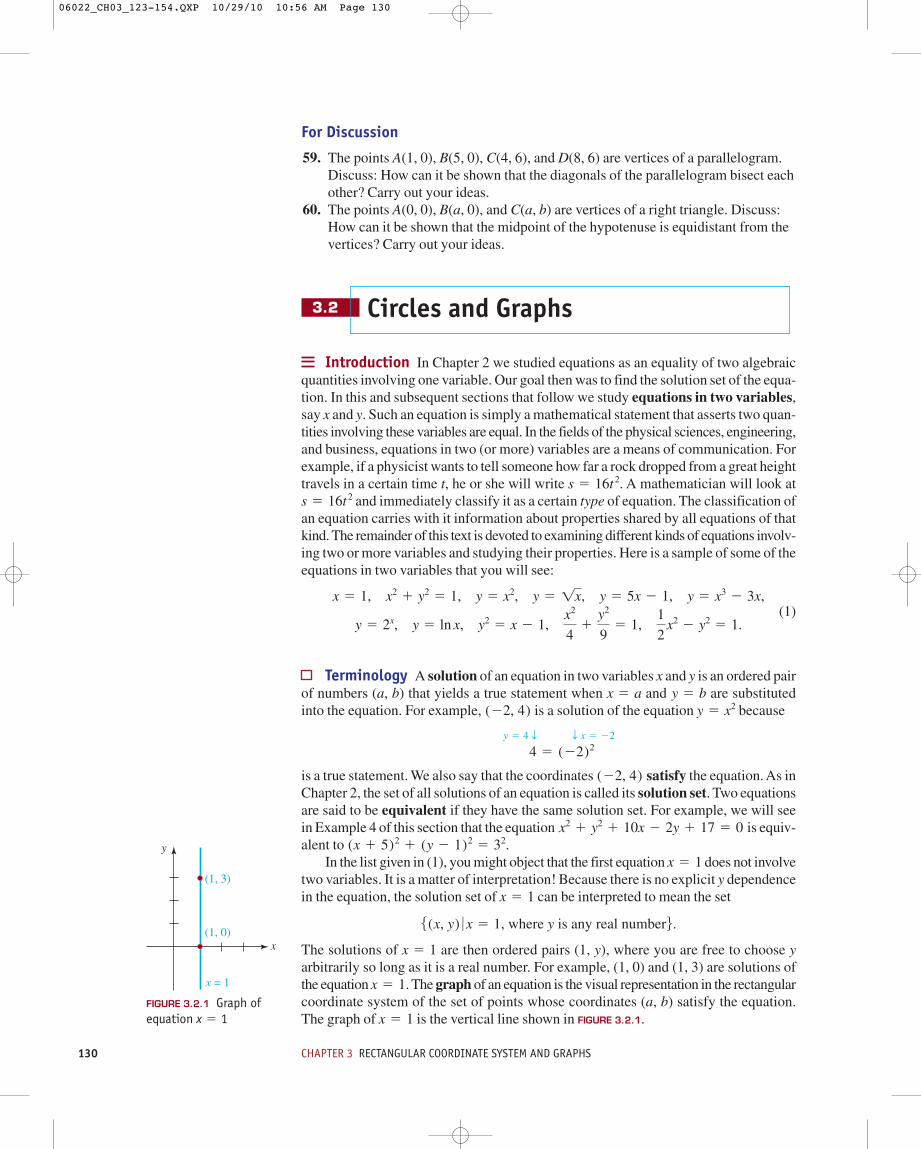
Plotting Points
Plot the points A (1, 2), and E(3.5, 0). Specify thequadrant in which each point lies.
Solution The five points are plotted in the coordinate plane in FIGURE 3.1.4. Point A liesin the first quadrant (quadrant I), B in the second quadrant (quadrant II), and C is in thethird quadrant (quadrant III). Points D and E, which lie on the y- and the x-axes, respec-tively, are not in any quadrant.
Plotting Points
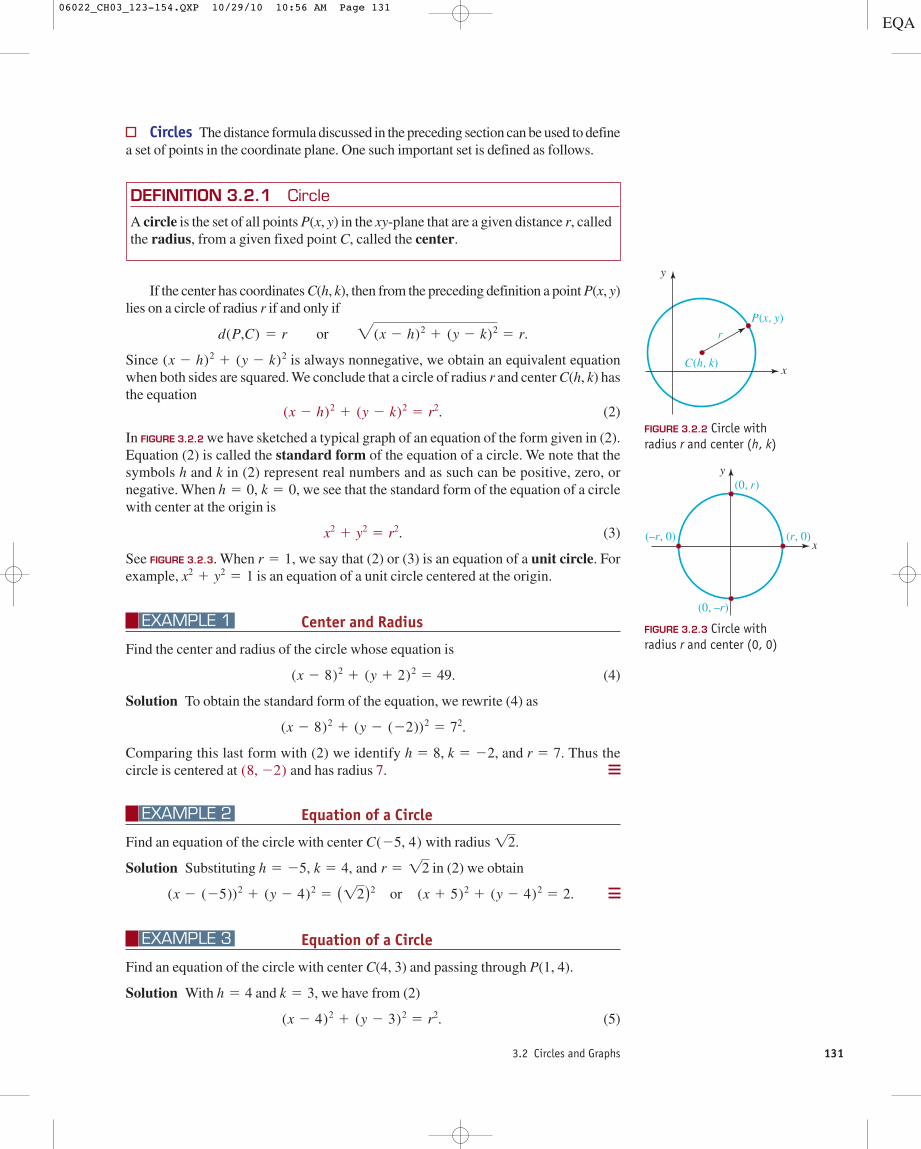
Sketch the set of points (x, y) in the xy-plane that satisfy both and
Solution First, recall that the absolute-value equation implies that orThus the points that satisfy the given conditions are the points whose coordinates
(x, y) simultaneously satisfy the conditions: each x-coordinate is a number in the closedinterval [0, 2] and each y-coordinate is either or For example,
are a few of the points that satisfy the two conditions.Graphically, the set of all points satisfying the two conditions are points on the twoparallel line segments shown in FIGURE 3.1.5.
Regions Defined by Inequalities
Sketch the set of points (x, y) in the xy-plane that satisfy each of the following conditions.
(a) (b)
Solution (a) From (3) of the sign properties of products in Section 2.7, we know thata product of two real numbers x and y is negative when one of the numbers is positiveand the other is negative. Thus, when and or when and y . 0.x , 0y , 0x . 0xy , 0
0y 0 $ 2xy , 0
EXAMPLE 3
(1, 1), (12, 21), and (2, 21)
y 5 1.y 5 21
y 5 1.y 5 210y 0 5 1
0y 0 5 1.0 # x # 2
EXAMPLE 2
B(24, 3), C (232, 22), D(0, 4),
EXAMPLE 1
x 5 0.y 5 0.
FIGURE 3.1.5 Set of points in Example 2
FIGURE 3.1.4 Five points in Example 1
FIGURE 3.1.3 Algebraic signs ofcoordinates in the four quadrants
y
x
II
III IV
I
x < 0y > 0
x < 0y < 0
x > 0y < 0
x > 0y > 0
y
x
B(–4, 3)
C(– , –2)
D(0, 4)
A(1, 2)
E(3.5, 0)32
y
x
0 ≤ x ≤ 2and y = 1
0 ≤ x ≤ 2and y = –1
FIGURE 3.1.2 Point withcoordinates (a, b)
y-coordinate
x-coordinate
y
x
b
a
P(a, b)
06022_CH03_123-154.QXP 10/29/10 10:56 AM Page 125

126 CHAPTER 3 RECTANGULAR COORDINATE SYSTEM AND GRAPHS
We see from Figure 3.1.3 that for all points (x, y) in the second and fourth quad-rants. Hence we can represent the set of points for which by the shaded regionsin FIGURE 3.1.6. The coordinate axes are shown as dashed lines to indicate that the pointson these axes are not included in the solution set.
(b) In Section 2.6 we saw that means that either Since xis not restricted in any way it can be any real number, and so the points (x, y) forwhich
can be represented by the two shaded regions in FIGURE 3.1.7. We use solid lines torepresent the boundaries and of the region to indicate that the points onthese boundaries are included in the solution set.
y 5 2y 5 22
y $ 2 and 2` , x , ` or y # 22 and 2` , x , `
y $ 2 or y # 22.0y 0 $ 2
xy , 0xy , 0
FIGURE 3.1.7 Region in the xy-planesatisfying condition in (b) of Example 3
x
y
y ≥ 2 and–∞ < x < ∞
y ≤ –2 and–∞ < x < ∞
FIGURE 3.1.8 Distance between pointsP1 and P2
P1(x1, y1)
P3(x1, y2)
|x2 – x1|
|y2 – y1|
P2(x2, y2)
d
x
y
THEOREM 3.1.1 Distance Formula
The distance between any two points P1 (x1, y1) and P2(x2, y2) in the xy-plane is given by
(2)d(P1, P2) 5 "(x2 2 x1)2 1 (y2 2 y1)2.
Distance Formula Suppose P1(x1, y1) and P2(x2, y2) are two distinct points in thexy-plane that are not on a vertical line or on a horizontal line. As a consequence, P1, P2,and P3 (x1, y2) are vertices of a right triangle as shown in FIGURE 3.1.8. The length ofthe side P3P2 is , and the length of the side P1P3 is If we denote thelength of P1P2 by d, then
(1)
by the Pythagorean theorem. Since the square of any real number is equal to the squareof its absolute values, we can replace the absolute-value signs in (1) with parentheses.The distance formula given next follows immediately from (1).
d2 5 0x2 2 x1 02 1 0 y2 2 y1 0
2
0y2 2 y1 0 .0 x2 2 x1 0
FIGURE 3.1.6 Region in the xy-planesatisfying condition in (a) ofExample 3
y
x
xy < 0
xy < 0
Although we derived this equation for two points not on a vertical or horizontalline, (2) holds in these cases as well. Also, because it makesno difference which point is used first in the distance formula, that is,d(P1, P2) 5 d(P2, P1).
(x2 2 x1)2 5 (x1 2 x2)2,
06022_CH03_123-154.QXP 10/29/10 10:56 AM Page 126

3.1 The Rectangular Coordinate System 127
Distance Between Two Points
Find the distance between the points and B(3, 7).
Solution From (2) with A and B playing the parts of P1 and P2:
The distance d is illustrated in FIGURE 3.1.9.
Three Points Form a Triangle
Determine whether the points and P3(4, 5) are the vertices of aright triangle.
Solution From plane geometry we know that a triangle is a right triangle if and only ifthe sum of the squares of the lengths of two of its sides is equal to the square of thelength of the remaining side. Now, from the distance formula (2), we have
Since
we conclude that P1, P2, and P3 are the vertices of a right triangle with the right angleat P3. See FIGURE 3.1.10.
Midpoint Formula In Section 1.2 we saw that the midpoint of a line segmentbetween two numbers a and b on the number line is the average, In the xy-plane, each coordinate of the midpoint M of a line segment joining two points P1(x1, y1)and P2(x2, y2), as shown in FIGURE 3.1.11, is the average of the corresponding coordinatesof the endpoints of the intervals [x1, x2] and [y1, y2].
To prove this, we note in Figure 3.1.11 that triangles P1CM and MDP2 are congru-ent since corresponding angles are equal and Hence,
or Solving the last equation for y gives
Similarly, so that and therefore
We summarize the result.x 5x1 1 x2
2.
x 2 x1 5 x2 2 xd(C, M) 5 d(D, P2)y 5y1 1 y2
2.
y 2 y1 5 y2 2 y.d(P1, C) 5 d(M, D)d(P1, M) 5 d(M, P2).
(a 1 b) /2.
[d(P3, P1)]2 1 [d(P2, P3)]2 5 25 1 100 5 125 5 [d(P1, P2)]2,
5 !9 1 16 5 !25 5 5. d(P3, P1) 5 "(7 2 4)2 1 (1 2 5)2
5 !64 1 36 5 !100 5 10, d(P2, P3) 5 "(4 2 (24))2 1 (5 2 (21))2
5 !121 1 4 5 !125, d(P1, P2) 5 "(24 2 7)2 1 (21 2 1)2
P1(7, 1), P2(24, 21),
EXAMPLE 5
5 "(25)2 1 (12)2 5 !169 5 13. d(A, B) 5 "(3 2 8)2 1 (7 2 (25))2
A(8, 25)
EXAMPLE 4
FIGURE 3.1.10 Triangle in Example 5
P3(4, 5)
P1(7, 1)
P2(–4, –1)
y
x
FIGURE 3.1.11 M is the midpoint ofthe line segment joining P1 and P2
y
C
x
P2(x2, y2)
P1(x1, y1)
M(x, y)
D
THEOREM 3.1.2 Midpoint Formula
The coordinates of the midpoint of the line segment joining the points P1(x1, y1) andP2(x2, y2) in the xy-plane are given by
(3)ax1 1 x2
2,
y1 1 y2
2b.
FIGURE 3.1.9 Distance betweentwo points in Example 4
d(A, B)
A(8, –5)
B(3, 7)
y
x
06022_CH03_123-154.QXP 10/29/10 10:56 AM Page 127

128 CHAPTER 3 RECTANGULAR COORDINATE SYSTEM AND GRAPHS
Midpoint of a Line Segment
Find the coordinates of the midpoint of the line segment joining and B(4, 1).
Solution From formula (3) the coordinates of the midpoint of the line segment joiningthe points A and B are given by
(1, 3).
This point is indicated in red in FIGURE 3.1.12.
3.1
In Problems 1–4, plot the given points.
1. (2, 3), (4, 5), (0, 2), 2.3. 4.
In Problems 5–16, determine the quadrant in which the given point lies if (a, b) is inquadrant I.
5. 6. 7.8. 9. 10.
11. 12. 13.14. 15. 16.
17. Plot the points given in Problems 5–16 if (a, b) is the point shown in FIGURE 3.1.13.18. Give the coordinates of the points shown in FIGURE 3.1.14.
(2b, b)(b, 2a)(2a, a)(2a, 2a)(b, 2b)(a, a)(2b, 2a)(2b, a)(b, a)(2a, 2b)(a, 2b)(2a, b)
(0, 0.8), (22, 0), (1.2, 21.2), (22, 2)(212, 22), (0, 0), (21, 43), (3, 3)
(1, 4), (23, 0), (24, 2), (21, 21)(21, 23)
Exercises Answers to selected odd-numbered problemsbegin on page ANS-5.
a22 1 4
2,
5 1 1
2b or
A(22, 5)
EXAMPLE 6
FIGURE 3.1.12 Midpoint ofline segment in Example 6
A(–2, 5)
B(4, 1)
(1, 3)
y
x
Midpoint
FIGURE 3.1.13 Point (a, b) inProblem 17
(a, b)
y
a
b
x
FIGURE 3.1.14 Points in Problem 18
A
D
BC
G
E
F
y
x1
1
19. The points , and (3, 0) are vertices of a rectangle. Find thefourth vertex.
20. Describe the set of all points (x, x) in the coordinate plane. The set of all points
In Problems 21–26, sketch the set of points in the xy-plane that satisfy the givenconditions.
21. 22.23. 24.25. 26.
In Problems 27–32, find the distance between the given points.
27. 28.29. 30.31. 32. A(25
3, 4), B(223, 21)A(23
2, 1), B(52, 22)
A(212, 23), B(25, 27)A(2, 4), B(24, 24)A(21, 3), B(5, 0)A(1, 2), B(23, 4)
0y 0 # 10x 0 . 4x # 2 and y $ 210x 0 # 1 and 0y 0 # 2xy . 0xy 5 0
(x, y)
(x, 2x).
(22, 0), (22, 6)
06022_CH03_123-154.QXP 10/29/10 10:56 AM Page 128

3.1 The Rectangular Coordinate System 129
In Problems 33–36, determine whether the points A, B, and C are vertices of a righttriangle.
33. 34.35. 36. A(4, 0), B(1, 1), C(2, 3)
37. Determine whether the points A(0, 0), B(3, 4), and C(7, 7) are vertices of anisosceles triangle.
38. Find all points on the y-axis that are 5 units from the point (4, 4).39. Consider the line segment joining and B(3, 4).
(a) Find an equation that expresses the fact that a point P(x, y) is equidistantfrom A and from B.
(b) Describe geometrically the set of points described by the equation in part (a).40. Use the distance formula to determine whether the points ,
and C(4, 10) lie on a straight line.41. Find all points with x-coordinate 6 such that the distance from each point to
is 42. Which point, or (0.25, 0.97), is closer to the origin?
In Problems 43–48, find the midpoint of the line segment joining the points A and B.
43. 44.45. 46.47. 48.
In Problems 49–52, find the point B if M is the midpoint of the line segment joining pointsA and B.
49. 50.51. 52.
53. Find the distance from the midpoint of the line segment joining and B(3, 5) to the midpoint of the line segment joining C(4, 6) and
.54. Find all points on the x-axis that are 3 units from the midpoint of the line
segment joining (5, 2) and 55. The x-axis is the perpendicular bisector of the line segment through A(2, 5)
and B(x, y). Find x and y.56. Consider the line segment joining the points A(0, 0) and B(6, 0). Find a point
C(x, y) in the first quadrant such that A, B, and C are vertices of an equilateraltriangle.
57. Find points P1(x1, y1), P2(x2, y2), and P3(x3, y3) on the line segment joining A(3, 6)and B(5, 8) that divide the line segment into four equal parts.
Miscellaneous Applications
58. Going to Chicago Kansas City and Chicago are not directly connected by aninterstate highway, but each city is connected to St. Louis and Des Moines. SeeFIGURE 3.1.15. Des Moines is approximately 40 mi east and 180 mi north ofKansas City, St. Louis is approximately 230 mi east and 40 mi south of KansasCity, and Chicago is approximately 360 mi east and 200 mi north of Kansas City.Assume that this part of the Midwest is a flat plane and that the connectinghighways are straight lines. Which route from Kansas City to Chicago, throughSt. Louis or through Des Moines, is shorter?
(25, 26).
D(22, 210)
A(21, 3)
A(210, 2), M(5, 1)A(5, 8), M(21, 21)A(4, 12 ), M(7, 25
2 )A(22, 1), M(32, 0)
A(x, x), B(2x, x 1 2)A(2a, 3b), B(4a, 26b)A(1
2, 232), B(25
2, 1)A(21, 0), B(28, 5)A(2
3, 1), B(73, 23)A(4, 1), B(22, 4)
(1/!2, 1/!2 )!85.(21, 2)
A(21, 25), B(2, 4)
A(21, 2)
A(2, 8), B(0, 23), C(6, 5)A(22, 21), B(8, 2), C(1, 211)A(8, 1), B(23, 21), C(10, 5)
y
x
St. LouisKansas
City
Des Moines Chicago
FIGURE 3.1.15 Map for Problem 58
06022_CH03_123-154.QXP 10/29/10 10:56 AM Page 129
130 CHAPTER 3 RECTANGULAR COORDINATE SYSTEM AND GRAPHS
For Discussion
59. The points A(1, 0), B(5, 0), C(4, 6), and D(8, 6) are vertices of a parallelogram.Discuss: How can it be shown that the diagonals of the parallelogram bisect eachother? Carry out your ideas.
60. The points A(0, 0), B(a, 0), and C(a, b) are vertices of a right triangle. Discuss:How can it be shown that the midpoint of the hypotenuse is equidistant from thevertices? Carry out your ideas.
3.2
Introduction In Chapter 2 we studied equations as an equality of two algebraicquantities involving one variable. Our goal then was to find the solution set of the equa-tion. In this and subsequent sections that follow we study equations in two variables,say x and y. Such an equation is simply a mathematical statement that asserts two quan-tities involving these variables are equal. In the fields of the physical sciences, engineering,and business, equations in two (or more) variables are a means of communication. Forexample, if a physicist wants to tell someone how far a rock dropped from a great heighttravels in a certain time t, he or she will write A mathematician will look at
and immediately classify it as a certain type of equation. The classification ofan equation carries with it information about properties shared by all equations of thatkind. The remainder of this text is devoted to examining different kinds of equations involv-ing two or more variables and studying their properties. Here is a sample of some of theequations in two variables that you will see:
(1)
Terminology A solution of an equation in two variables x and y is an ordered pairof numbers (a, b) that yields a true statement when and are substitutedinto the equation. For example, is a solution of the equation because
is a true statement. We also say that the coordinates satisfy the equation. As inChapter 2, the set of all solutions of an equation is called its solution set. Two equationsare said to be equivalent if they have the same solution set. For example, we will seein Example 4 of this section that the equation is equiv-alent to
In the list given in (1), you might object that the first equation does not involvetwo variables. It is a matter of interpretation! Because there is no explicit y dependencein the equation, the solution set of can be interpreted to mean the set
The solutions of are then ordered pairs (1, y), where you are free to choose yarbitrarily so long as it is a real number. For example, (1, 0) and (1, 3) are solutions ofthe equation The graph of an equation is the visual representation in the rectangularcoordinate system of the set of points whose coordinates (a, b) satisfy the equation.The graph of is the vertical line shown in FIGURE 3.2.1.x 5 1
x 5 1.
x 5 1
5 (x, y) 0 x 5 1, where y is any real number6.
x 5 1
x 5 1(x 1 5)2 1 (y 2 1)2 5 32.
x2 1 y2 1 10x 2 2y 1 17 5 0
(22, 4)
4 5 (22)2y 5 4 T T x 5 22
y 5 x2(22, 4)y 5 bx 5 a
y 5 2x, y 5 ln x, y2 5 x 2 1, x2
41
y2
95 1,
1
2 x2 2 y2 5 1.
x 5 1, x2 1 y2 5 1, y 5 x2, y 5 !x, y 5 5x 2 1, y 5 x3 2 3x,
s 5 16t2s 5 16t2.
Circles and Graphs
(1, 0)
x = 1
(1, 3)
y
x
FIGURE 3.2.1 Graph ofequation x 5 1
06022_CH03_123-154.QXP 10/29/10 10:56 AM Page 130
3.2 Circles and Graphs 131
Circles The distance formula discussed in the preceding section can be used to definea set of points in the coordinate plane. One such important set is defined as follows.
rP(x, y)
C(h, k)
y
x
FIGURE 3.2.2 Circle withradius r and center (h, k)
y
x
(0, r)
(0, –r)
(–r, 0) (r, 0)
FIGURE 3.2.3 Circle with radius r and center (0, 0)
DEFINITION 3.2.1 Circle
A circle is the set of all points P(x, y) in the xy-plane that are a given distance r, calledthe radius, from a given fixed point C, called the center.
If the center has coordinates C(h, k), then from the preceding definition a point P(x, y)lies on a circle of radius r if and only if
Since is always nonnegative, we obtain an equivalent equationwhen both sides are squared. We conclude that a circle of radius r and center C(h, k) hasthe equation
(2)
In FIGURE 3.2.2 we have sketched a typical graph of an equation of the form given in (2).Equation (2) is called the standard form of the equation of a circle. We note that thesymbols h and k in (2) represent real numbers and as such can be positive, zero, ornegative. When we see that the standard form of the equation of a circlewith center at the origin is
(3)
See FIGURE 3.2.3. When , we say that (2) or (3) is an equation of a unit circle. Forexample, is an equation of a unit circle centered at the origin.
Center and Radius
Find the center and radius of the circle whose equation is
(4)
Solution To obtain the standard form of the equation, we rewrite (4) as
Comparing this last form with (2) we identify Thus the circle is centered at and has radius 7.
Equation of a Circle
Find an equation of the circle with center with radius
Solution Substituting in (2) we obtain
Equation of a Circle
Find an equation of the circle with center C(4, 3) and passing through P(1, 4).
Solution With and we have from (2)
(5)(x 2 4)2 1 (y 2 3)2 5 r2.
k 5 3,h 5 4
EXAMPLE 3
(x 2 (25))2 1 (y 2 4)2 5 (!2)2 or (x 1 5)2 1 (y 2 4)2 5 2.
h 5 25, k 5 4, and r 5 !2
!2.C(25, 4)
EXAMPLE 2
(8, 22)h 5 8, k 5 22, and r 5 7.
(x 2 8)2 1 (y 2 (22))2 5 72.
(x 2 8)2 1 (y 1 2)2 5 49.
EXAMPLE 1
x2 1 y2 5 1r 5 1
x2 1 y2 5 r2.
h 5 0, k 5 0,
(x 2 h)2 1 (y 2 k)2 5 r2.
(x 2 h)2 1 (y 2 k)2
d(P,C) 5 r or "(x 2 h)2 1 (y 2 k)2 5 r.
06022_CH03_123-154.QXP 10/29/10 10:56 AM Page 131
132 CHAPTER 3 RECTANGULAR COORDINATE SYSTEM AND GRAPHS
Since the point P(1, 4) lies on the circle as shown in FIGURE 3.2.4, its coordinates mustsatisfy equation (5). That is,
Thus the required equation in standard form is
Completing the Square If the terms and are expanded and thelike terms grouped together, an equation of a circle in standard form can be written as
(6)
Of course in this last form the center and radius are not apparent. To reverse the process,in other words, to go from (6) to the standard form (2), we must complete the squarein both x and y. Recall from Section 2.3 that adding to a quadratic expression suchas yields which is the perfect square Byrearranging the terms in (6),
and then adding and to both sides of the last equation
we obtain the standard form of the equation of a circle:
You should not memorize the last equation; we strongly recommend that you workthrough the process of completing the square each time.
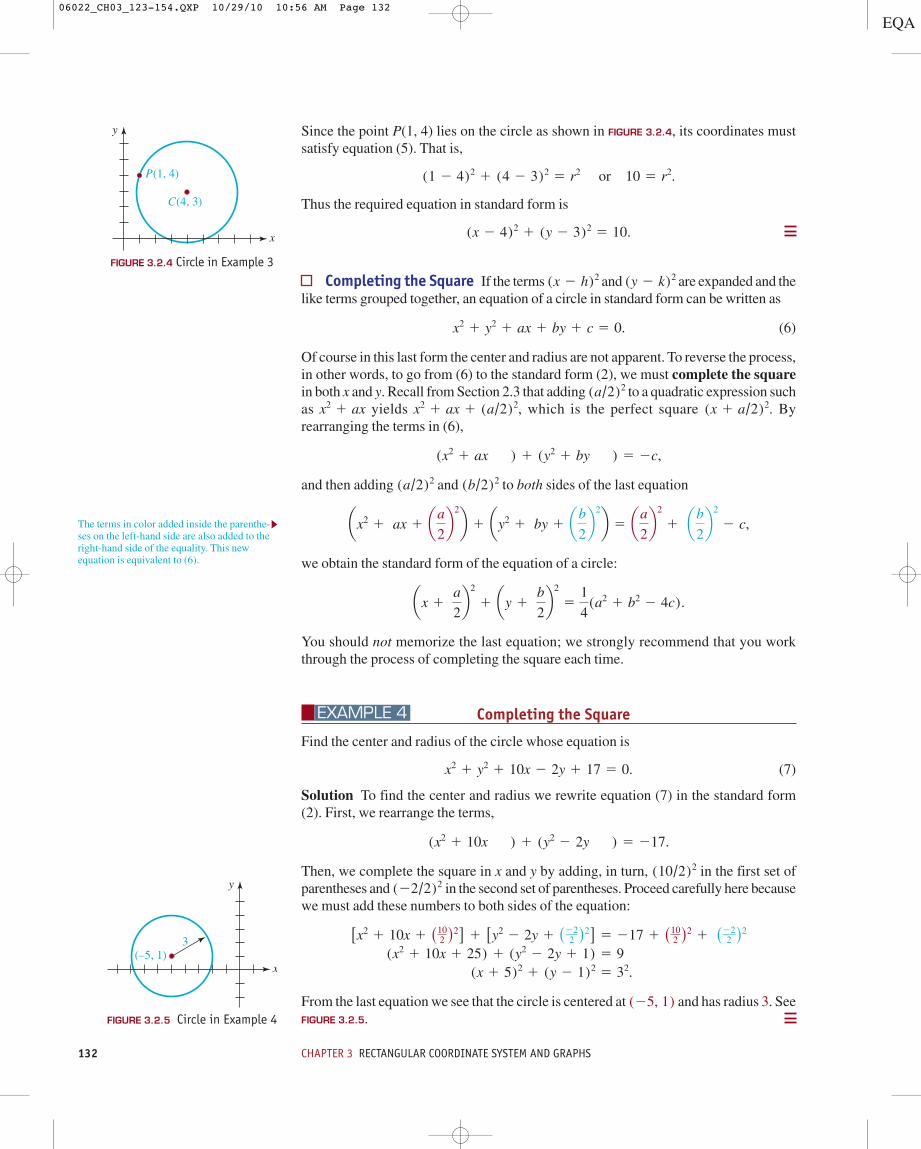
Completing the Square
Find the center and radius of the circle whose equation is
(7)
Solution To find the center and radius we rewrite equation (7) in the standard form(2). First, we rearrange the terms,
Then, we complete the square in x and y by adding, in turn, in the first set ofparentheses and in the second set of parentheses. Proceed carefully here becausewe must add these numbers to both sides of the equation:
From the last equation we see that the circle is centered at and has radius 3. SeeFIGURE 3.2.5.
(25, 1)
(x 1 5)2 1 (y 2 1)2 5 32. (x2 1 10x 1 25) 1 (y2 2 2y 1 1) 5 9
[x2 1 10x 1 (102 )2] 1 [y2 2 2y 1 (22
2 )2] 5 217 1 (102 )2 1 (22
2 )2
(22/2)2(10/2)2
(x2 1 10x ) 1 (y2 2 2y ) 5 217.
x2 1 y2 1 10x 2 2y 1 17 5 0.
EXAMPLE 4
ax 1 a
2b
2
1 ay 1 b
2b
2
51
4(a2 1 b2 2 4c).
ax2 1 ax 1 aa
2b
2
b 1 ay2 1 by 1 ab
2b
2
b 5 aa
2b
2
1 ab
2b
2
2 c,
(b/2)2(a/2)2
(x2 1 ax ) 1 (y2 1 by ) 5 2c,
(x 1 a/2)2.x2 1 ax 1 (a/2)2,x2 1 ax(a/2)2
x2 1 y2 1 ax 1 by 1 c 5 0.
(y 2 k)2(x 2 h)2
(x 2 4)2 1 (y 2 3)2 5 10.
(1 2 4)2 1 (4 2 3)2 5 r2 or 10 5 r2.
The terms in color added inside the parenthe-ses on the left-hand side are also added to theright-hand side of the equality. This newequation is equivalent to (6).
P(1, 4)
C(4, 3)
y
x
FIGURE 3.2.4 Circle in Example 3
(–5, 1)
y
x
3
FIGURE 3.2.5 Circle in Example 4
06022_CH03_123-154.QXP 10/29/10 10:56 AM Page 132
3.2 Circles and Graphs 133
It is possible that an expression for which we must complete the square has a lead-ing coefficient other than 1. For example,
Note
is an equation of a circle. As in Example 4 we start by rearranging the equation:
Now, however, we must do one extra step before attempting completion of the square;that is, we must divide both sides of the equation by 3 so that the coefficients of x2 andy2 are each 1:
.
At this point we can now add the appropriate numbers within each set of parenthesesand to the right-hand side of the equality. You should verify that the resulting standard form is
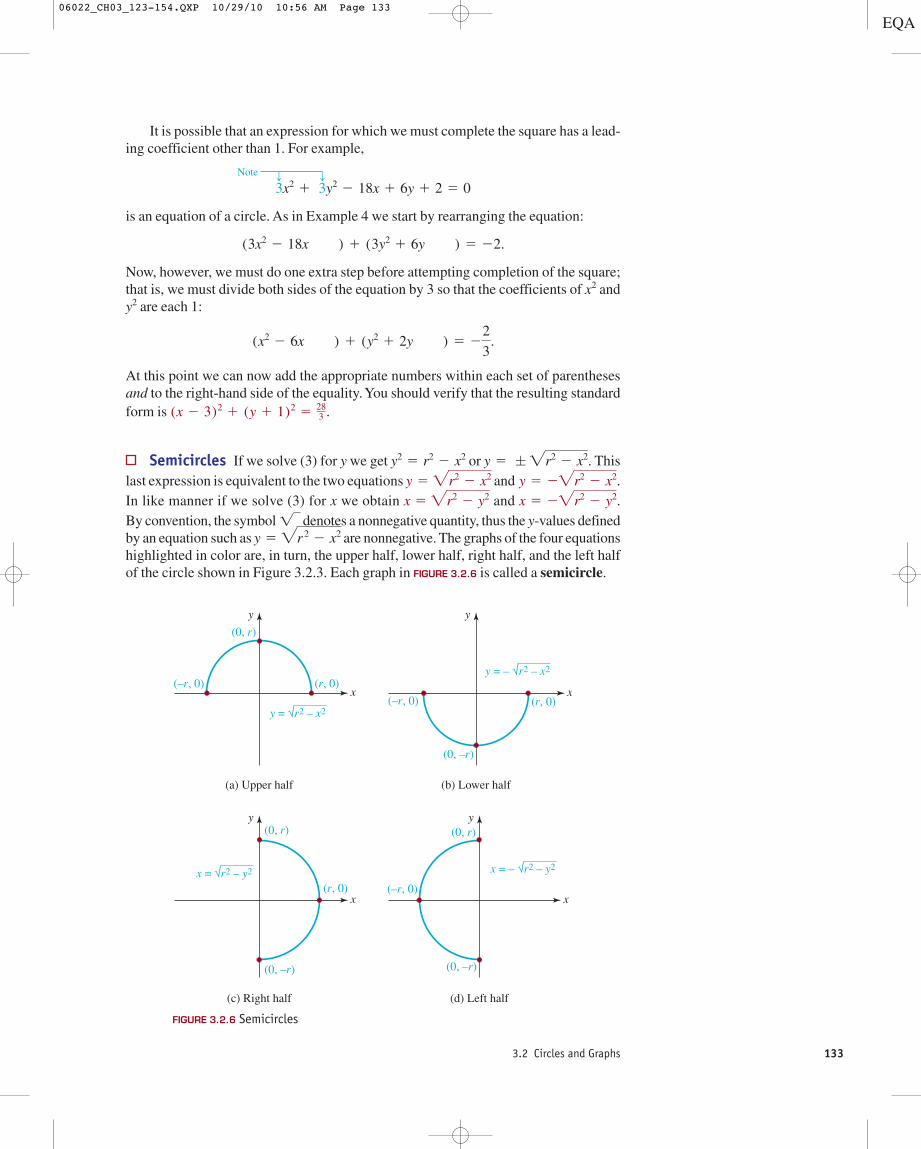
Semicircles If we solve (3) for y we get or . Thislast expression is equivalent to the two equations and In like manner if we solve (3) for x we obtain and By convention, the symbol denotes a nonnegative quantity, thus the y-values definedby an equation such as are nonnegative. The graphs of the four equationshighlighted in color are, in turn, the upper half, lower half, right half, and the left halfof the circle shown in Figure 3.2.3. Each graph in FIGURE 3.2.6 is called a semicircle.
y 5 "r 2 2 x2
! x 5 2"r2 2 y2.x 5 "r2 2 y2
y 5 2"r2 2 x2.y 5 "r2 2 x2
y 5 ; "r2 2 x2y2 5 r2 2 x2
(x 2 3)2 1 (y 1 1)2 5 283 .
(x2 2 6x ) 1 (y2 1 2y ) 5 22
3
(3x2 2 18x ) 1 (3y2 1 6y ) 5 22.
3x2 1 3y2 2 18x 1 6y 1 2 5 0
c c
y
x
(0, r)
(0, –r)
(–r, 0) (r, 0)
y = √r2 – x2
y
x(–r, 0) (r, 0)
y = – √r2 – x2
(a) Upper half (b) Lower half
y
x
(0, r)
(0, –r)
(r, 0)x = √r2 – y2
(c) Right half
y
x
(0, r)
(0, –r)
(–r, 0)
x = – √r2 – y2
(d) Left half
FIGURE 3.2.6 Semicircles
06022_CH03_123-154.QXP 10/29/10 10:56 AM Page 133
134 CHAPTER 3 RECTANGULAR COORDINATE SYSTEM AND GRAPHS
Inequalities One last point about circles. On occasion we encounter problemswhere we must sketch the set of points in the xy-plane whose coordinates satisfy inequal-ities such as The equation describes the setof points whose distance to the origin (0, 0) is exactly r. Therefore, the inequal-ity describes the set of points (x, y) whose distance to the origin is lessthan r. In other words, the points (x, y) whose coordinates satisfy the inequality
are in the interior of the circle. Similarly, the points (x, y) whose coordi-nates satisfy lie either on the circle or are exterior to it.
Graphs It is difficult to read a newspaper, read a science or business text, surf theInternet, or even watch the news on TV without seeing graphical representations of data.It may even be impossible to get past the first page in a mathematics text without seeing somekind of graph. So many diverse quantities are connected by means of equations and somany questions about the behavior of the quantities linked by the equation can be answeredby means of a graph, that the ability to graph equations quickly and accurately––like theability to do algebra quickly and accurately––is high on the list of skills essential to yoursuccess in a course in calculus. For the rest of this section we will talk about graphs in gen-eral, and more specifically, about two important aspects of graphs of equations.
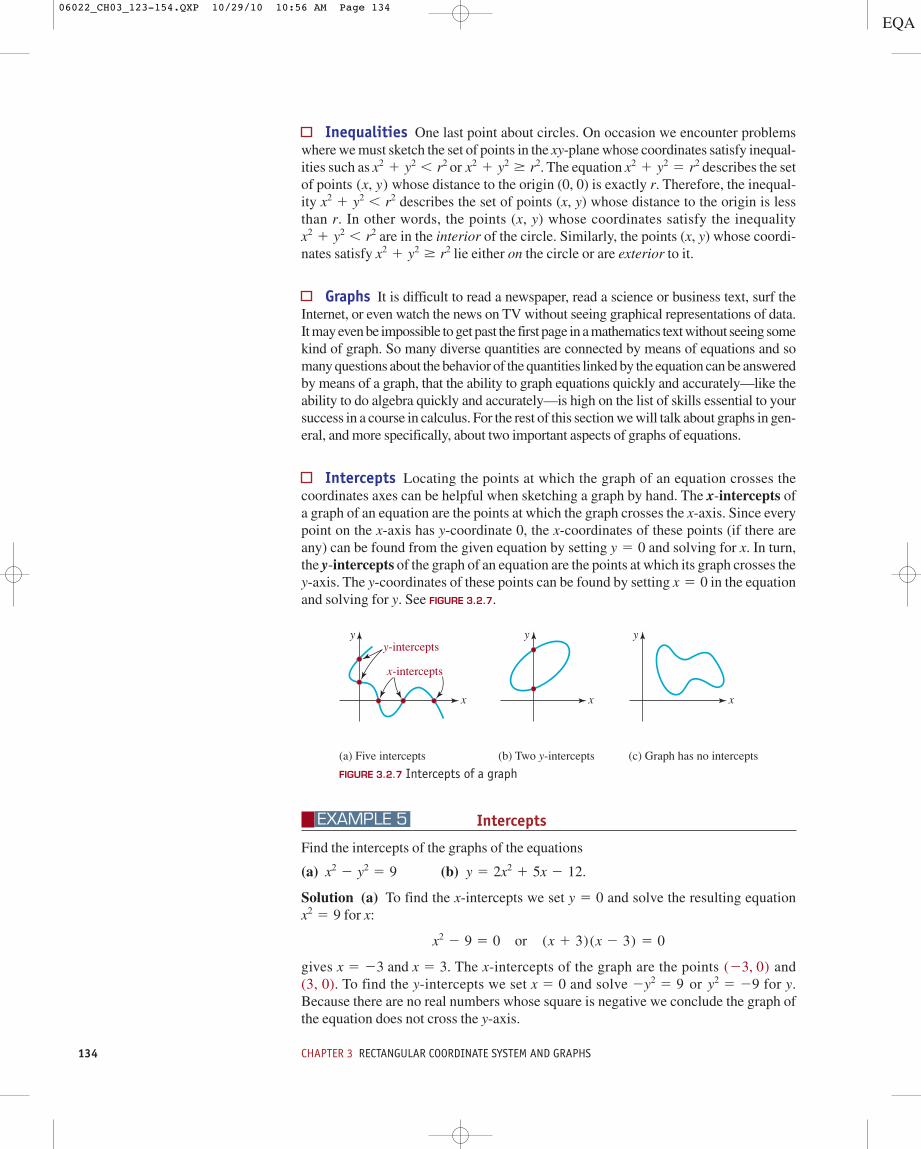
Intercepts Locating the points at which the graph of an equation crosses thecoordinates axes can be helpful when sketching a graph by hand. The x-intercepts ofa graph of an equation are the points at which the graph crosses the x-axis. Since everypoint on the x-axis has y-coordinate 0, the x-coordinates of these points (if there areany) can be found from the given equation by setting and solving for x. In turn,the y-intercepts of the graph of an equation are the points at which its graph crosses they-axis. The y-coordinates of these points can be found by setting in the equationand solving for y. See FIGURE 3.2.7.
x 5 0
y 5 0
x2 1 y2 $ r2x2 1 y2 , r2
x2 1 y2 , r2(x, y)
x2 1 y2 5 r2x2 1 y2 , r2 or x2 1 y2 $ r2.
FIGURE 3.2.7 Intercepts of a graph
Intercepts
Find the intercepts of the graphs of the equations
(a) (b) .
Solution (a) To find the x-intercepts we set and solve the resulting equationfor x:
gives The x-intercepts of the graph are the points and (3, 0). To find the y-intercepts we set and solve or for y.Because there are no real numbers whose square is negative we conclude the graph ofthe equation does not cross the y-axis.
y2 5 292y2 5 9x 5 0(23, 0)x 5 23 and x 5 3.
x2 2 9 5 0 or (x 1 3)(x 2 3) 5 0
x2 5 9y 5 0
y 5 2x2 1 5x 2 12x2 2 y2 5 9
EXAMPLE 5
x
y yy-intercepts
x-intercepts
x
y
x
(a) Five intercepts (b) Two y-intercepts (c) Graph has no intercepts
06022_CH03_123-154.QXP 10/29/10 10:56 AM Page 134
3.2 Circles and Graphs 135
(b) Setting yields This is a quadratic equation and can besolved either by factoring or by the quadratic formula. Factoring gives
and so and The x-intercepts of the graph are the points andNow, setting in the equation immediately gives
The y-intercept of the graph is the point
Example 4 Revisited
Let’s return to the circle in Example 4 and determine its intercepts from equation (7).Setting y � 0 in and using the quadratic formula tosolve shows the x-intercepts of this circle are and If we let , then the quadratic formula shows that the rootsof the equation are complex numbers. As seen in Figure 3.2.5, thecircle does not cross the y-axis.
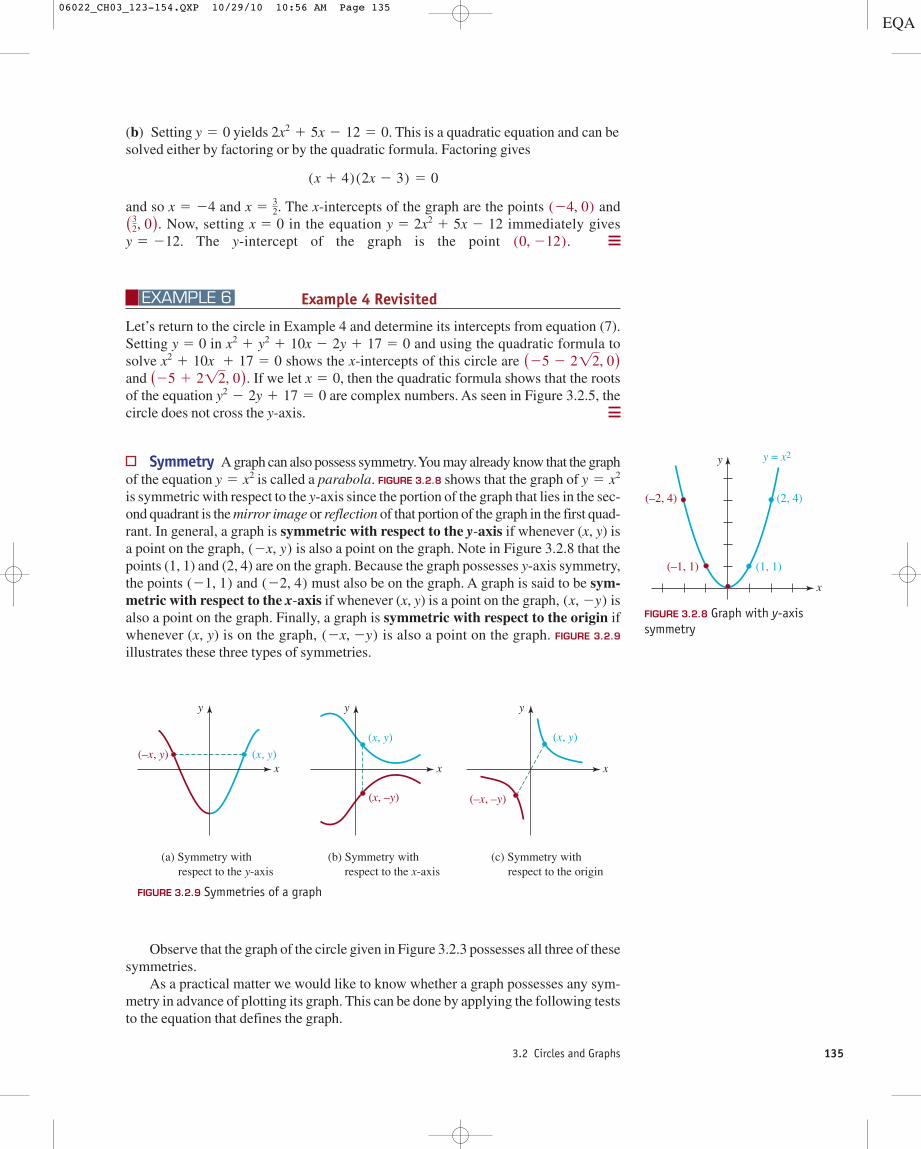
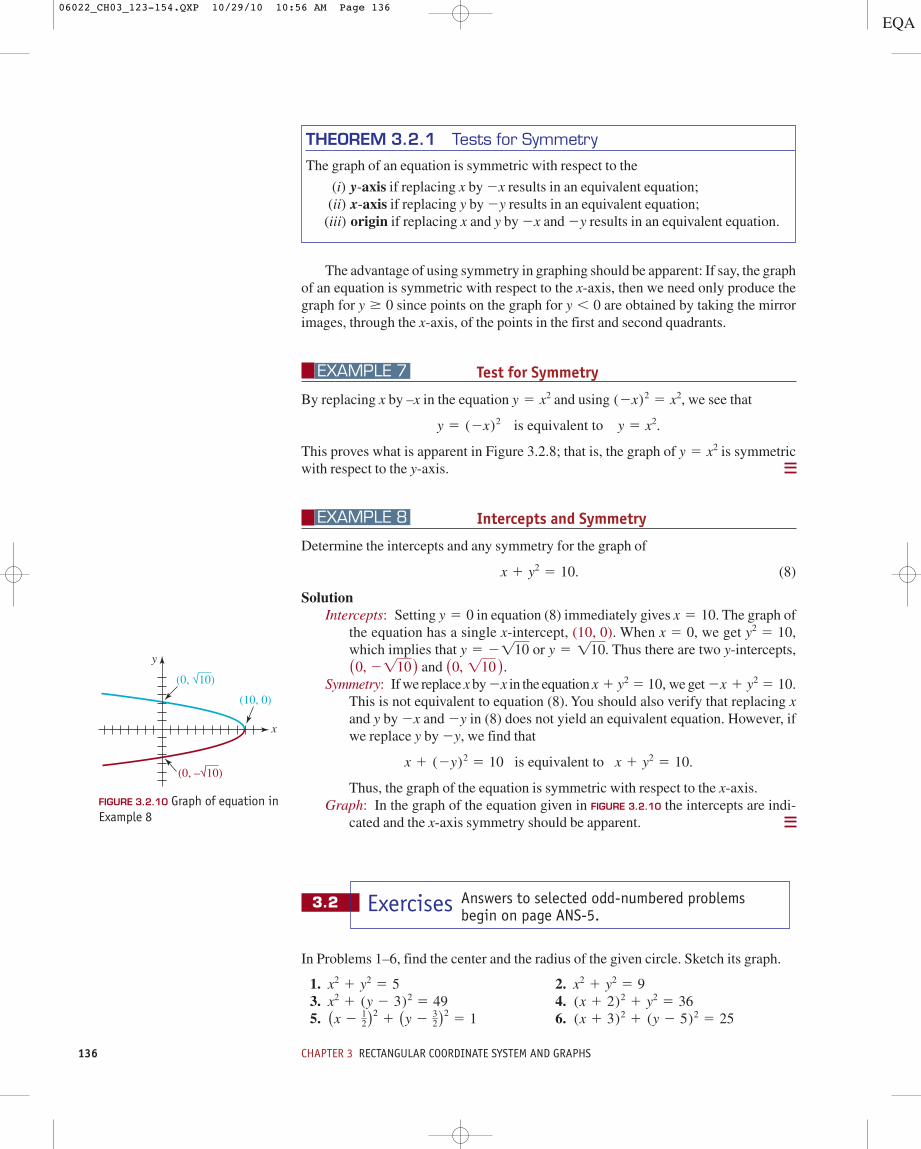
Symmetry A graph can also possess symmetry. You may already know that the graphof the equation is called a parabola. FIGURE 3.2.8 shows that the graph of is symmetric with respect to the y-axis since the portion of the graph that lies in the sec-ond quadrant is the mirror image or reflection of that portion of the graph in the first quad-rant. In general, a graph is symmetric with respect to the y-axis if whenever (x, y) isa point on the graph, is also a point on the graph. Note in Figure 3.2.8 that thepoints (1, 1) and (2, 4) are on the graph. Because the graph possesses y-axis symmetry,the points and must also be on the graph. A graph is said to be sym-metric with respect to the x-axis if whenever (x, y) is a point on the graph, isalso a point on the graph. Finally, a graph is symmetric with respect to the origin ifwhenever (x, y) is on the graph, is also a point on the graph. FIGURE 3.2.9
illustrates these three types of symmetries.(2x, 2y)
(x, 2y)(22, 4)(21, 1)
(2x, y)
y 5 x2y 5 x2
y2 2 2y 1 17 5 0x 5 0(25 1 2!2, 0).
(25 2 2!2, 0)x2 1 10x 1 17 5 0x2 1 y2 1 10x 2 2y 1 17 5 0
EXAMPLE 6
(0, 212).y 5 212.y 5 2x2 1 5x 2 12x 5 0(3
2, 0).(24, 0)x 5 3
2.x 5 24
(x 1 4)(2x 2 3) 5 0
2x2 1 5x 2 12 5 0.y 5 0
FIGURE 3.2.8 Graph with y-axissymmetry
FIGURE 3.2.9 Symmetries of a graph
Observe that the graph of the circle given in Figure 3.2.3 possesses all three of thesesymmetries.
As a practical matter we would like to know whether a graph possesses any sym-metry in advance of plotting its graph. This can be done by applying the following teststo the equation that defines the graph.
(–2, 4) (2, 4)
(–1, 1) (1, 1)
y y = x2
x
(–x, y) (x, y)
(x, y)
(x, –y)
(x, y)
(–x, –y)
(a) Symmetry with respect to the y-axis
(b) Symmetry with respect to the x-axis
(c) Symmetry with respect to the origin
y
x
y
x
y
x
06022_CH03_123-154.QXP 10/29/10 10:56 AM Page 135
136 CHAPTER 3 RECTANGULAR COORDINATE SYSTEM AND GRAPHS
The advantage of using symmetry in graphing should be apparent: If say, the graphof an equation is symmetric with respect to the x-axis, then we need only produce thegraph for since points on the graph for are obtained by taking the mirrorimages, through the x-axis, of the points in the first and second quadrants.
Test for Symmetry
By replacing x by –x in the equation and using we see that
This proves what is apparent in Figure 3.2.8; that is, the graph of is symmetricwith respect to the y-axis.
Intercepts and Symmetry
Determine the intercepts and any symmetry for the graph of
(8)
SolutionIntercepts: Setting in equation (8) immediately gives The graph of
the equation has a single x-intercept, (10, 0). When we get ,which implies that Thus there are two y-intercepts,
and Symmetry: If we replace x by in the equation we get
This is not equivalent to equation (8). You should also verify that replacing xand y by and in (8) does not yield an equivalent equation. However, ifwe replace y by , we find that
Thus, the graph of the equation is symmetric with respect to the x-axis.Graph: In the graph of the equation given in FIGURE 3.2.10 the intercepts are indi-
cated and the x-axis symmetry should be apparent.
3.2
In Problems 1–6, find the center and the radius of the given circle. Sketch its graph.
1. 2.3. 4.5. 6. (x 1 3)2 1 (y 2 5)2 5 25(x 2 1
2)21 (y 2 3
2)25 1
(x 1 2)2 1 y2 5 36x2 1 (y 2 3)2 5 49x2 1 y2 5 9x2 1 y2 5 5
Exercises Answers to selected odd-numbered problemsbegin on page ANS-5.
x 1 (2y)2 5 10 is equivalent to x 1 y2 5 10.
2y2y2x
2x 1 y2 5 10.x 1 y2 5 10,2x(0, !10 ).(0, 2!10)
y 5 2!10 or y 5 !10.y2 5 10x 5 0,
x 5 10.y 5 0
x 1 y2 5 10.
EXAMPLE 8
y 5 x2
y 5 (2x)2 is equivalent to y 5 x2.
(2x)2 5 x2,y 5 x2
EXAMPLE 7
y , 0y $ 0
THEOREM 3.2.1 Tests for Symmetry
The graph of an equation is symmetric with respect to the
(i) y-axis if replacing x by results in an equivalent equation;(ii) x-axis if replacing y by results in an equivalent equation;
(iii) origin if replacing x and y by and results in an equivalent equation.2y2x2y2x
FIGURE 3.2.10 Graph of equation inExample 8
(10, 0)
(0, √10)
(0, –√10)
y
x
06022_CH03_123-154.QXP 10/29/10 10:56 AM Page 136
3.2 Circles and Graphs 137
In Problems 7–14, complete the square in x and y to find the center and the radius of thegiven circle.
7. 8.9. 10.
11. 12.13. 14.
In Problems 15–24, find an equation of the circle that satisfies the given conditions.
15. center (0, 0), radius 1 16. center radius 517. center (0, 2), radius 18. center radius 19. endpoints of a diameter at 20. endpoints of a diameter at (4, 2) and 21. center (0, 0), graph passes through 22. center graph passes through 23. center (5, 6), graph tangent to the x-axis24. center graph tangent to the y-axis
In Problems 25–28, sketch the semicircle defined by the given equation.
25. 26.27. 28.
29. Find an equation for the upper half of the circle The righthalf of the circle.
30. Find an equation for the lower half of the circle Theleft half of the circle.
In Problems 31–34, sketch the set of points in the xy-plane whose coordinates satisfythe given inequality.
31. 32.33. 34.
In Problems 35 and 36, find the x- and y-intercepts of the given circle.
35. The circle with center and radius 736. The circle
In Problems 37–62, find any intercepts of the graph of the given equation. Determinewhether the graph of the equation possesses symmetry with respect to the x-axis, y-axis,or origin. Do not graph.
37. 38.39. 40.41. 42.43. 44.45. 46.47. 48.49. 50.
51. 52.
53. 54. y 5x2 2 10
x2 1 10y 5
x2 2 7
x3
x2
251
y2
95 14y2 2 x2 5 36
y3 2 4x2 1 8 5 0x 5 2"y2 2 16y 5 (x 2 2)2(x 1 2)2y 5 x(x2 2 3)y2 5 16(x 1 4)y 5 x2 2 2x 2 2x 5 2y2 2 4y 5 x2 2 4y 5 x3x 5 y22x 1 3y 5 62x 1 2y 5 1y 2 2x 5 0y 5 23x
x2 1 y2 1 5x 2 6y 5 0(3, 26)
x2 1 y2 . 2y1 # x2 1 y2 # 4(x 2 1)2 1 (y 1 5)2 # 25x2 1 y2 $ 9
(x 2 5)2 1 (y 2 1)2 5 9.
x2 1 (y 2 3)2 5 4.
y 5 2"9 2 (x 2 3)2x 5 "1 2 (y 2 1)2
x 5 1 2 "1 2 y2y 5 "4 2 x2
(24, 3),
(7, 23)(4, 25),(21, 22)
(23, 5)(21, 4) and (3, 8)
32(29, 24),!2
(1, 23),
12x
2 1 12y
2 1 52x 1 10y 1 5 5 02x2 1 2y2 1 4x 1 16y 1 1 5 0
x2 1 y2 1 3x 2 16y 1 63 5 0x2 1 y2 2 20x 1 16y 1 128 5 0x2 1 y2 2 18x 2 6y 2 10 5 0x2 1 y2 1 2x 2 4y 2 4 5 0x2 1 y2 2 6x 5 0x2 1 y2 1 8y 5 0
06022_CH03_123-154.QXP 10/29/10 10:57 AM Page 137
138 CHAPTER 3 RECTANGULAR COORDINATE SYSTEM AND GRAPHS
55. 56.
57. 58.59. 60.61. 62.
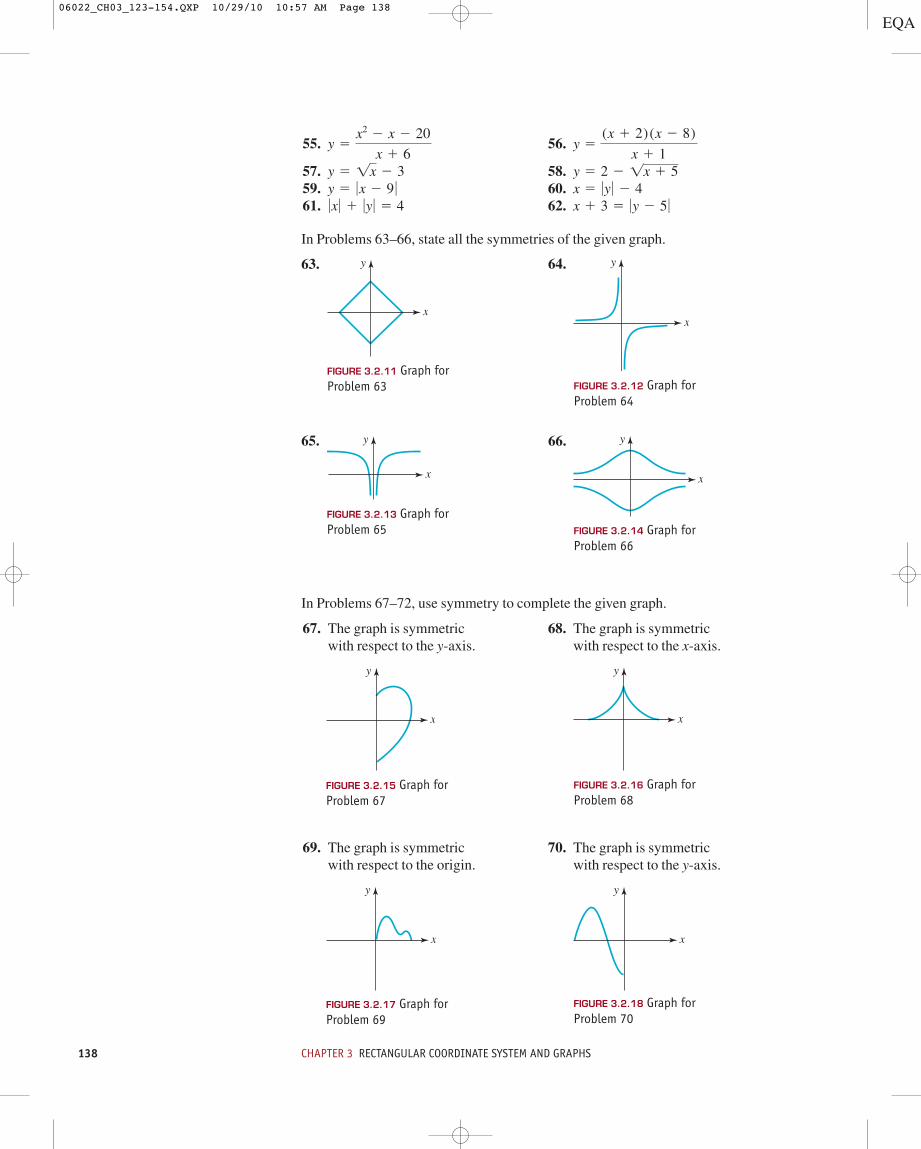
In Problems 63–66, state all the symmetries of the given graph.
x 1 3 5 0y 2 5 00x 0 1 0y 0 5 4x 5 0y 0 2 4y 5 0
x 2 9 0
y 5 2 2 !x 1 5y 5 !x 2 3
y 5(x 1 2)(x 2 8)
x 1 1y 5
x2 2 x 2 20
x 1 6
y
x
FIGURE 3.2.11 Graph forProblem 63
y
x
FIGURE 3.2.12 Graph forProblem 64
y
x
FIGURE 3.2.13 Graph forProblem 65
y
x
FIGURE 3.2.14 Graph forProblem 66
63. 64.
66.65.
In Problems 67–72, use symmetry to complete the given graph.
67. The graph is symmetric 68. The graph is symmetric with respect to the y-axis. with respect to the x-axis.
69. The graph is symmetric 70. The graph is symmetric with respect to the origin. with respect to the y-axis.
y
x
FIGURE 3.2.15 Graph forProblem 67
y
x
FIGURE 3.2.16 Graph forProblem 68
y
x
FIGURE 3.2.17 Graph forProblem 69
x
y
FIGURE 3.2.18 Graph forProblem 70
06022_CH03_123-154.QXP 10/29/10 10:57 AM Page 138
3.3 Equations of Lines 139
71. The graph is symmetric 72. The graph is symmetricwith respect to the x- and y-axes. with respect to the origin.
For Discussion
73. Determine whether the following statement is true or false. Defend your answer.
If a graph has two of the three symmetries defined on page 135, then the graphmust necessarily possess the third symmetry.
74. (a) The radius of the circle in FIGURE 3.2.21(a) is r. What is its equation in standardform?
(b) The center of the circle in Figure 3.2.21(b) is (h, k). What is its equation instandard form?
75. Discuss whether the following statement is true or false.
Every equation of the form is a circle.x2 1 y2 1 ax 1 by 1 c 5 0
y
x
FIGURE 3.2.19 Graph forProblem 71
y
x
FIGURE 3.2.20 Graph forProblem 72
y
(a) (b)
x
y
x
FIGURE 3.2.21 Circles in Problem 74
3.3
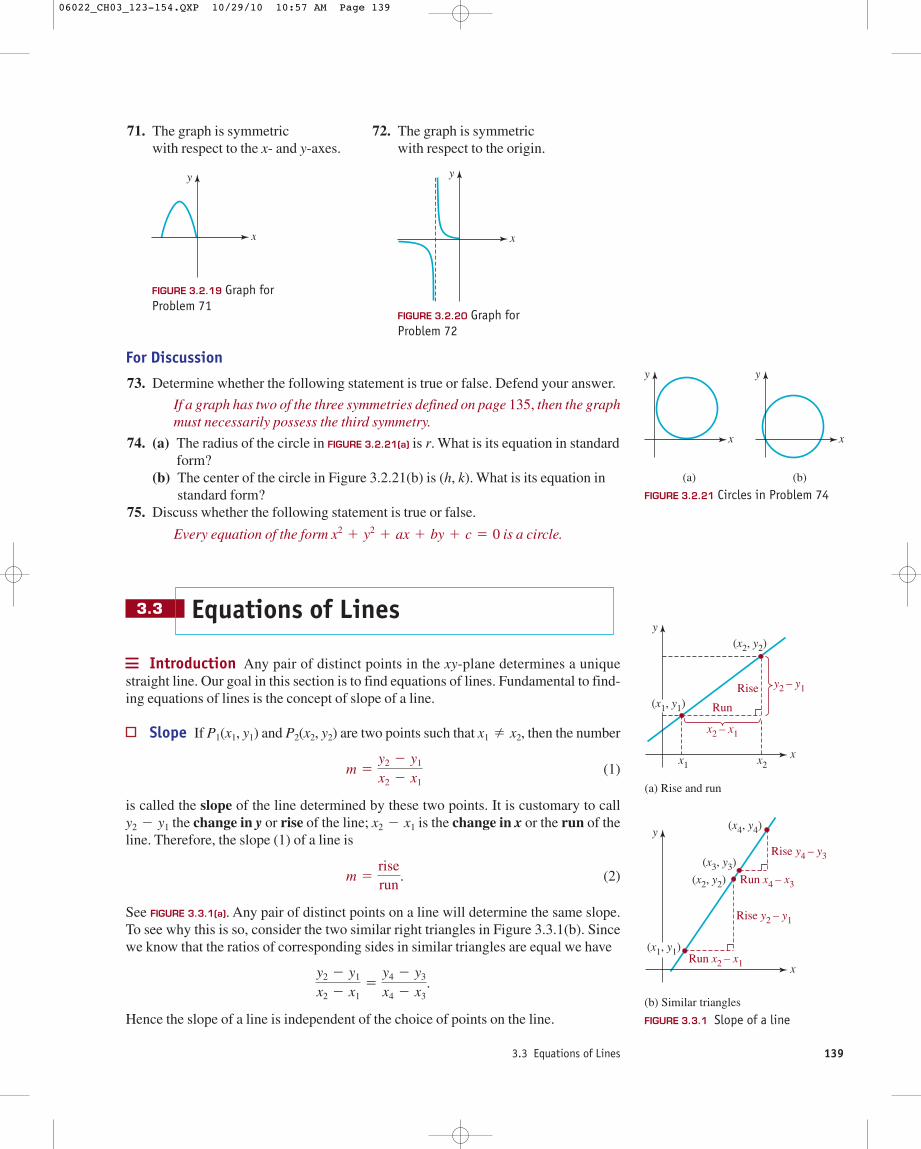
Introduction Any pair of distinct points in the xy-plane determines a uniquestraight line. Our goal in this section is to find equations of lines. Fundamental to find-ing equations of lines is the concept of slope of a line.
Slope If P1(x1, y1) and P2(x2, y2) are two points such that , then the number
(1)
is called the slope of the line determined by these two points. It is customary to callthe change in y or rise of the line; is the change in x or the run of the
line. Therefore, the slope (1) of a line is
(2)
See FIGURE 3.3.1(a). Any pair of distinct points on a line will determine the same slope.To see why this is so, consider the two similar right triangles in Figure 3.3.1(b). Sincewe know that the ratios of corresponding sides in similar triangles are equal we have
Hence the slope of a line is independent of the choice of points on the line.
y2 2 y1
x2 2 x15
y4 2 y3
x4 2 x3.
m 5riserun
.
x2 2 x1y2 2 y1
m 5y2 2 y1
x2 2 x1
x1 2 x2
Equations of Lines
FIGURE 3.3.1 Slope of a line
y
xx2
x2 – x1
y2 – y1
x1
(x2, y2)
(x1, y1) Run
Rise
y
xRun x2 – x1
Run x4 – x3
Rise y2 – y1
Rise y4 – y3
(x2, y2)
(x1, y1)
(x4, y4)
(x3, y3)
(a) Rise and run
(b) Similar triangles
06022_CH03_123-154.QXP 10/29/10 10:57 AM Page 139
140 CHAPTER 3 RECTANGULAR COORDINATE SYSTEM AND GRAPHS
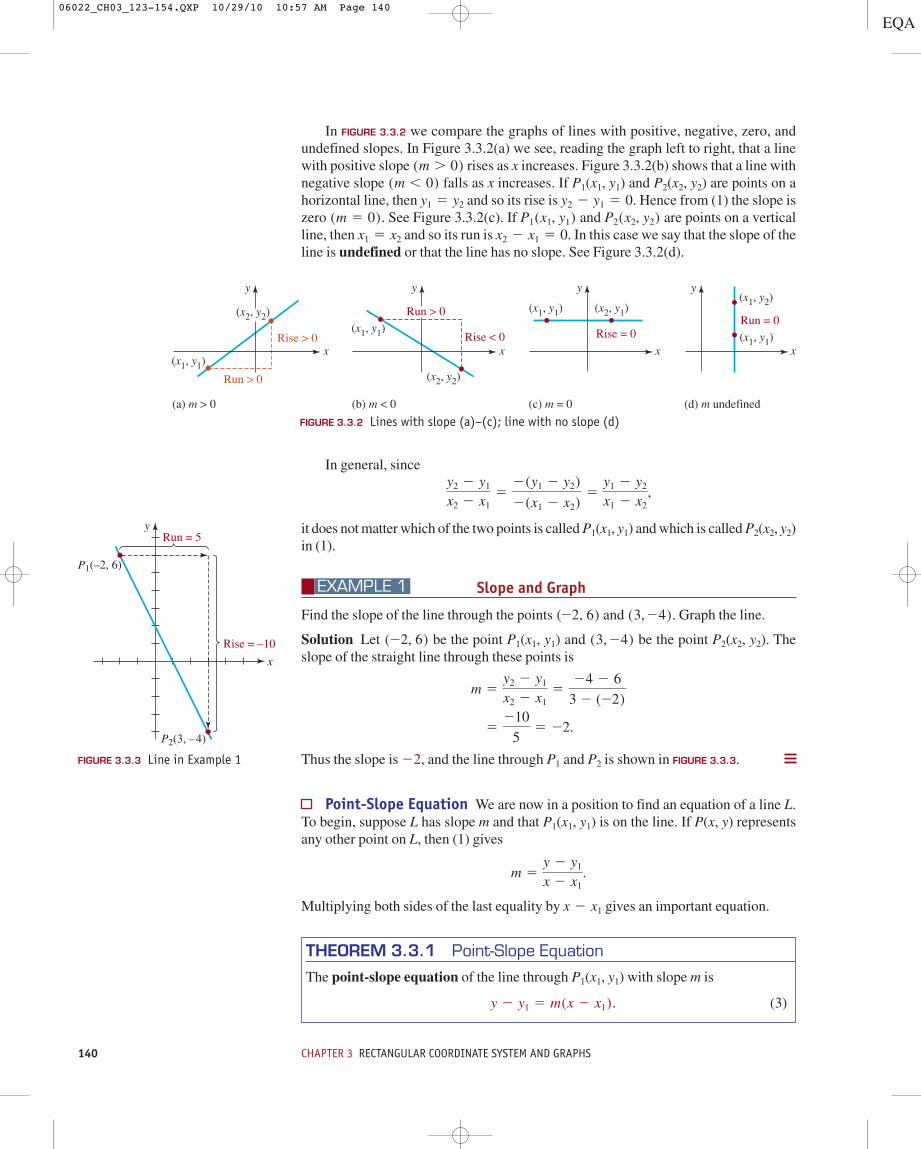
In FIGURE 3.3.2 we compare the graphs of lines with positive, negative, zero, andundefined slopes. In Figure 3.3.2(a) we see, reading the graph left to right, that a linewith positive slope rises as x increases. Figure 3.3.2(b) shows that a line withnegative slope falls as x increases. If P1(x1, y1) and P2(x2, y2) are points on ahorizontal line, then and so its rise is Hence from (1) the slope iszero See Figure 3.3.2(c). If and are points on a verticalline, then and so its run is In this case we say that the slope of theline is undefined or that the line has no slope. See Figure 3.3.2(d).
x2 2 x1 5 0.x1 5 x2
P2(x2, y2)P1(x1, y1)(m 5 0).y2 2 y1 5 0.y1 5 y2
(m , 0)(m . 0)
FIGURE 3.3.2 Lines with slope (a)–(c); line with no slope (d)
y
x
(x2, y2)
(x1, y1)
Run > 0
Rise > 0
y
x
(x1, y1)
(x1, y1)
(x1, y1)
(x2, y1)(x1, y2)
(x2, y2)
y
x
y
x
Run > 0
Rise < 0 Rise = 0Run = 0
(a) m > 0 (b) m < 0 (c) m = 0 (d) m undefined
In general, since
it does not matter which of the two points is called P1(x1, y1) and which is called P2(x2, y2)in (1).
Slope and Graph
Find the slope of the line through the points and Graph the line.
Solution Let be the point P1(x1, y1) and be the point P2(x2, y2). Theslope of the straight line through these points is
Thus the slope is �2, and the line through P1 and P2 is shown in FIGURE 3.3.3.
Point-Slope Equation We are now in a position to find an equation of a line L.To begin, suppose L has slope m and that P1(x1, y1) is on the line. If P(x, y) representsany other point on L, then (1) gives
Multiplying both sides of the last equality by gives an important equation.x 2 x1
m 5y 2 y1
x 2 x1.
5210
55 22.
m 5y2 2 y1
x2 2 x15
24 2 6
3 2 (22)
(3, 24)(22, 6)
(3, 24).(22, 6)
EXAMPLE 1
y2 2 y1
x2 2 x15
2(y1 2 y2)
2(x1 2 x2)5
y1 2 y2
x1 2 x2,
y
x
Rise = –10
Run = 5
P1(–2, 6)
P2(3, –4)
THEOREM 3.3.1 Point-Slope Equation
The point-slope equation of the line through P1(x1, y1) with slope m is
(3)y 2 y1 5 m(x 2 x1).
FIGURE 3.3.3 Line in Example 1
06022_CH03_123-154.QXP 10/29/10 10:57 AM Page 140
3.3 Equations of Lines 141
Point-Slope Equation
Find an equation of the line with slope 6 and passing through
Solution Letting , and we obtain from (3)
Simplifying gives
Point-Slope Equation
Find an equation of the line passing through the points (4, 3) and
Solution First we compute the slope of the line through the points. From (1),
The point-slope equation (3) then gives
the distributive lawT T
Slope-Intercept Equation Any line with slope (that is, any line that is not ver-tical) must cross the y-axis. If this y-intercept is (0, b), then with thepoint-slope form (3) gives The last equation simplifies to the nextresult.
y 2 b 5 m(x 2 0).y1 5 b,x1 5 0,
y 2 3 5 21
3(x 2 4) or y 5 2
1
3 x 1
13
3.
m 55 2 3
22 2 45
2
265 2
1
3.
(22, 5).
EXAMPLE 3
y 2 2 5 6(x 1 12) or y 5 6x 1 5.
y 2 2 5 6[x 2 (212) ].
y1 5 2x1 5 212m 5 6,
(212, 2).
EXAMPLE 2
THEOREM 3.3.2 Slope-Intercept Equation
The slope-intercept equation of the line with slope m and y-intercept (0, b) is
(4)y 5 mx 1 b.
FIGURE 3.3.4 Lines through the originare y 5 mx
y
x
y = –x y = x
y = x
y = 4xy = –4xy = –2x y = 2x
12y = – x1
2
The distributive law
is the source of many errors on students’ papers.A common error goes something like this:
The correct result is:
5 22x 1 3.5 (21)2x 2 (21)3
2(2x 2 3) 5 (21)(2x 2 3)
2(2x 2 3) 5 22x 2 3.
a(b 1 c) 5 ab 1 ac
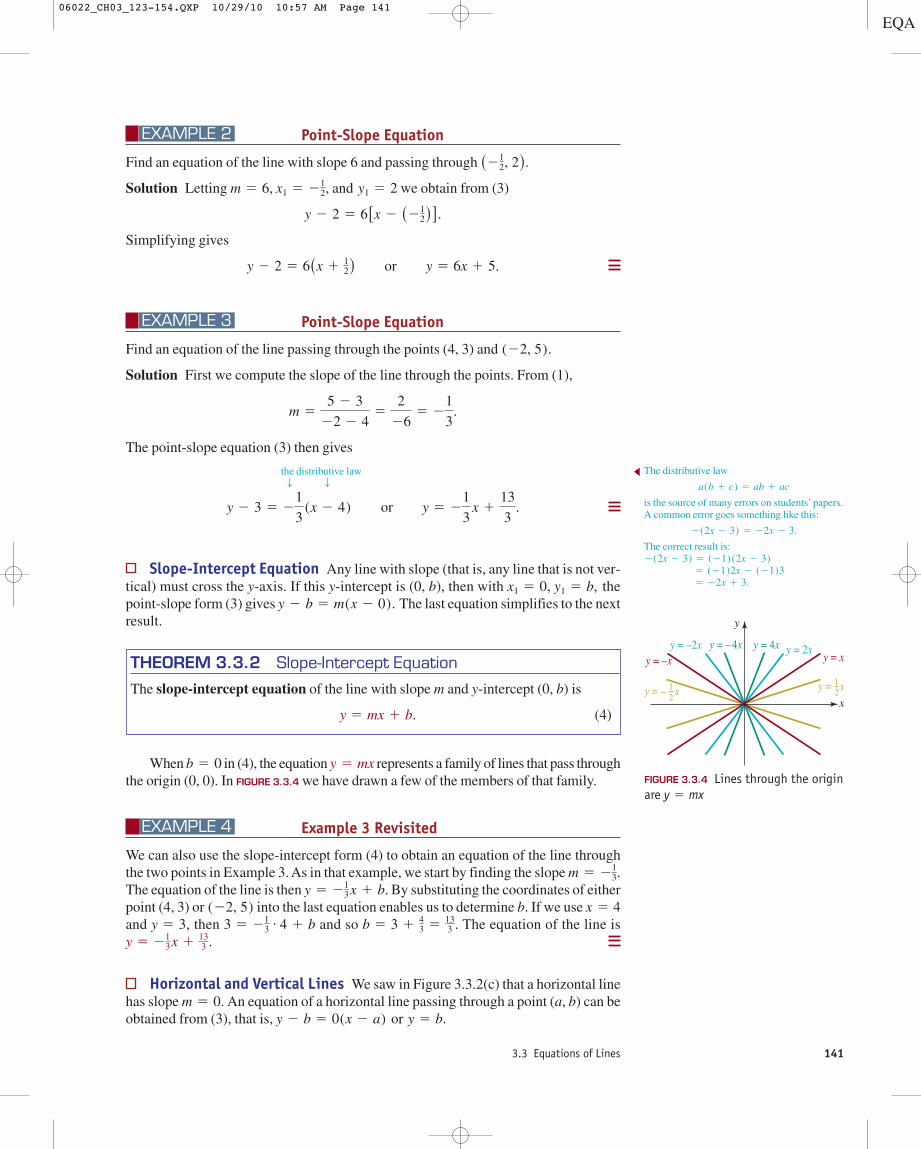
When in (4), the equation represents a family of lines that pass throughthe origin (0, 0). In FIGURE 3.3.4 we have drawn a few of the members of that family.
Example 3 Revisited
We can also use the slope-intercept form (4) to obtain an equation of the line throughthe two points in Example 3. As in that example, we start by finding the slope The equation of the line is then By substituting the coordinates of eitherpoint (4, 3) or into the last equation enables us to determine b. If we use and , then and so The equation of the line is
Horizontal and Vertical Lines We saw in Figure 3.3.2(c) that a horizontal linehas slope An equation of a horizontal line passing through a point (a, b) can beobtained from (3), that is, or y 5 b.y 2 b 5 0(x 2 a)
m 5 0.
y 5 213 x 1 13
3 .b 5 3 1 4
3 5 133 .3 5 21
3# 4 1 by 5 3
x 5 4(22, 5)y 5 21
3 x 1 b.
m 5 213.
EXAMPLE 4
y 5 mxb 5 0
06022_CH03_123-154.QXP 10/29/10 10:57 AM Page 141
142 CHAPTER 3 RECTANGULAR COORDINATE SYSTEM AND GRAPHS
THEOREM 3.3.3 Equation of Horizontal Line
The equation of a horizontal line with y-intercept (0, b) is
(5)y 5 b.
A vertical line through (a, b) has undefined slope and all points on the line have thesame x-coordinate. The equation of a vertical line is then
THEOREM 3.3.4 Equation of Vertical Line
The equation of a vertical line with x-intercept (a, 0) is
(6)x 5 a.
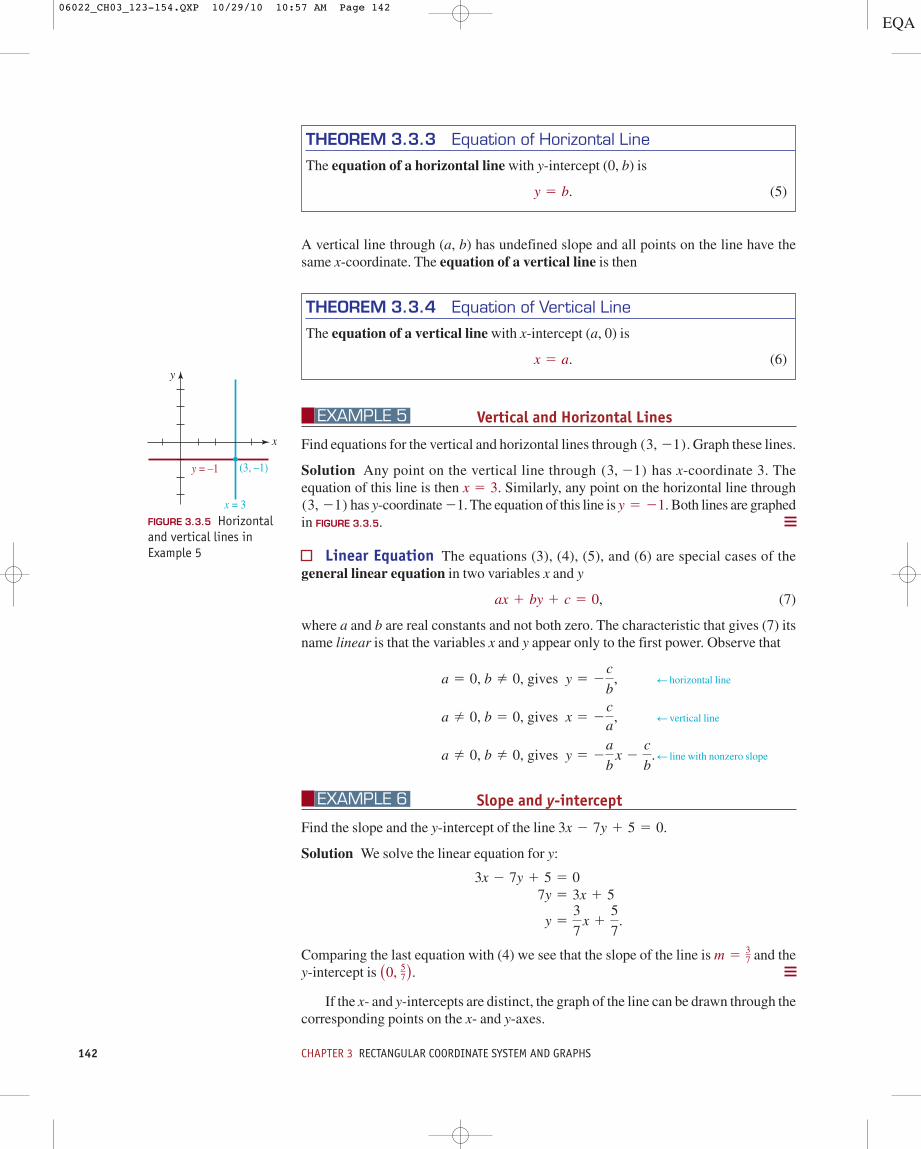
Vertical and Horizontal Lines
Find equations for the vertical and horizontal lines through Graph these lines.
Solution Any point on the vertical line through has x-coordinate 3. The equation of this line is then Similarly, any point on the horizontal line through
has y-coordinate �1. The equation of this line is Both lines are graphedin FIGURE 3.3.5.
Linear Equation The equations (3), (4), (5), and (6) are special cases of thegeneral linear equation in two variables x and y
(7)
where a and b are real constants and not both zero. The characteristic that gives (7) itsname linear is that the variables x and y appear only to the first power. Observe that
d horizontal line
d vertical line
. d line with nonzero slope
Slope and y-intercept
Find the slope and the y-intercept of the line
Solution We solve the linear equation for y:
Comparing the last equation with (4) we see that the slope of the line is and they-intercept is
If the x- and y-intercepts are distinct, the graph of the line can be drawn through thecorresponding points on the x- and y-axes.
(0, 57).m 5 3
7
y 53
7 x 1
5
7.
7y 5 3x 1 5 3x 2 7y 1 5 5 0
3x 2 7y 1 5 5 0.
EXAMPLE 6
a 2 0, b 2 0, gives y 5 2a
b x 2
c
b
a 2 0, b 5 0, gives x 5 2ca
,
a 5 0, b 2 0, gives y 5 2c
b,
ax 1 by 1 c 5 0,
y 5 21.(3, 21)x 5 3.
(3, 21)
(3, 21).
EXAMPLE 5
FIGURE 3.3.5 Horizontaland vertical lines inExample 5
y
x
y = –1
x = 3
(3, –1)
06022_CH03_123-154.QXP 10/29/10 10:57 AM Page 142
3.3 Equations of Lines 143
FIGURE 3.3.6 Line in Example 7
y
x83
3x – 2y + 8 = 0
(0, 4)
(– , 0)
THEOREM 3.3.5 Parallel and Perpendicular Lines
If L1 and L2 are lines with slopes m1 and m2, respectively, then
(i) L1 is parallel to L2 if and only if and(ii) is perpendicular to if and only if m1m2 5 21.L2L1
m1 5 m2,
FIGURE 3.3.7 Parallel lines
yL2
L1
x
Rise
RiseRun
Run
FIGURE 3.3.8 Parallel lines in Example 8
y
x
y = –3x + 2 y = –3x + 152
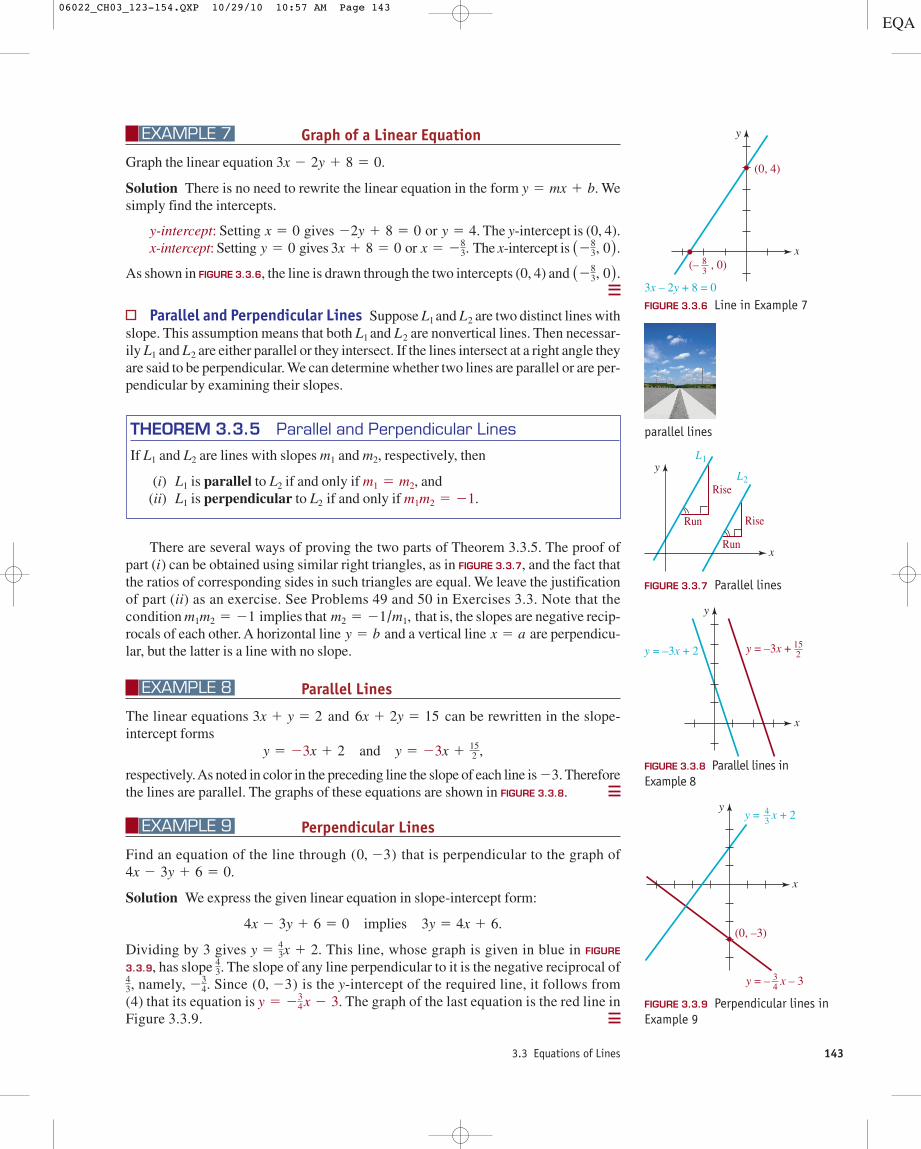
There are several ways of proving the two parts of Theorem 3.3.5. The proof ofpart (i) can be obtained using similar right triangles, as in FIGURE 3.3.7, and the fact thatthe ratios of corresponding sides in such triangles are equal. We leave the justificationof part (ii) as an exercise. See Problems 49 and 50 in Exercises 3.3. Note that thecondition implies that that is, the slopes are negative recip-rocals of each other. A horizontal line and a vertical line are perpendicu-lar, but the latter is a line with no slope.
Parallel Lines
The linear equations and can be rewritten in the slope-intercept forms
respectively. As noted in color in the preceding line the slope of each line is Thereforethe lines are parallel. The graphs of these equations are shown in FIGURE 3.3.8.
Perpendicular Lines
Find an equation of the line through that is perpendicular to the graph of
Solution We express the given linear equation in slope-intercept form:
Dividing by 3 gives This line, whose graph is given in blue in FIGURE
3.3.9, has slope The slope of any line perpendicular to it is the negative reciprocal ofnamely, Since is the y-intercept of the required line, it follows from
(4) that its equation is The graph of the last equation is the red line inFigure 3.3.9.
y 5 234 x 2 3.
(0, 23)234.
43,
43.
y 5 43x 1 2.
4x 2 3y 1 6 5 0 implies 3y 5 4x 1 6.
4x 2 3y 1 6 5 0.(0, 23)
EXAMPLE 9
23.
y 5 23x 1 2 and y 5 23x 1 152 ,
6x 1 2y 5 153x 1 y 5 2
EXAMPLE 8
x 5 ay 5 bm2 5 21/m1,m1m2 5 21
Graph of a Linear Equation
Graph the linear equation
Solution There is no need to rewrite the linear equation in the form Wesimply find the intercepts.
y-intercept: Setting gives or . The y-intercept is (0, 4).x-intercept: Setting gives or The x-intercept is
As shown in FIGURE 3.3.6, the line is drawn through the two intercepts (0, 4) and
Parallel and Perpendicular Lines Suppose L1 and L2 are two distinct lines withslope. This assumption means that both L1 and L2 are nonvertical lines. Then necessar-ily L1 and L2 are either parallel or they intersect. If the lines intersect at a right angle theyare said to be perpendicular. We can determine whether two lines are parallel or are per-pendicular by examining their slopes.
(283, 0).
(283, 0).x 5 28
3.3x 1 8 5 0y 5 0y 5 422y 1 8 5 0x 5 0
y 5 mx 1 b.
3x 2 2y 1 8 5 0.
EXAMPLE 7
FIGURE 3.3.9 Perpendicular lines inExample 9
43
x
y = x + 2
34y = – x – 3
(0, –3)
y
parallel lines
06022_CH03_123-154.QXP 10/29/10 10:57 AM Page 143
144 CHAPTER 3 RECTANGULAR COORDINATE SYSTEM AND GRAPHS
3.3
In Problems 1–6, find the slope of the line through the given points. Graph the linethrough the points.
1. 2. 3.4. 5. 6.
In Problems 7 and 8, use the graph of the given line to estimate its slope.
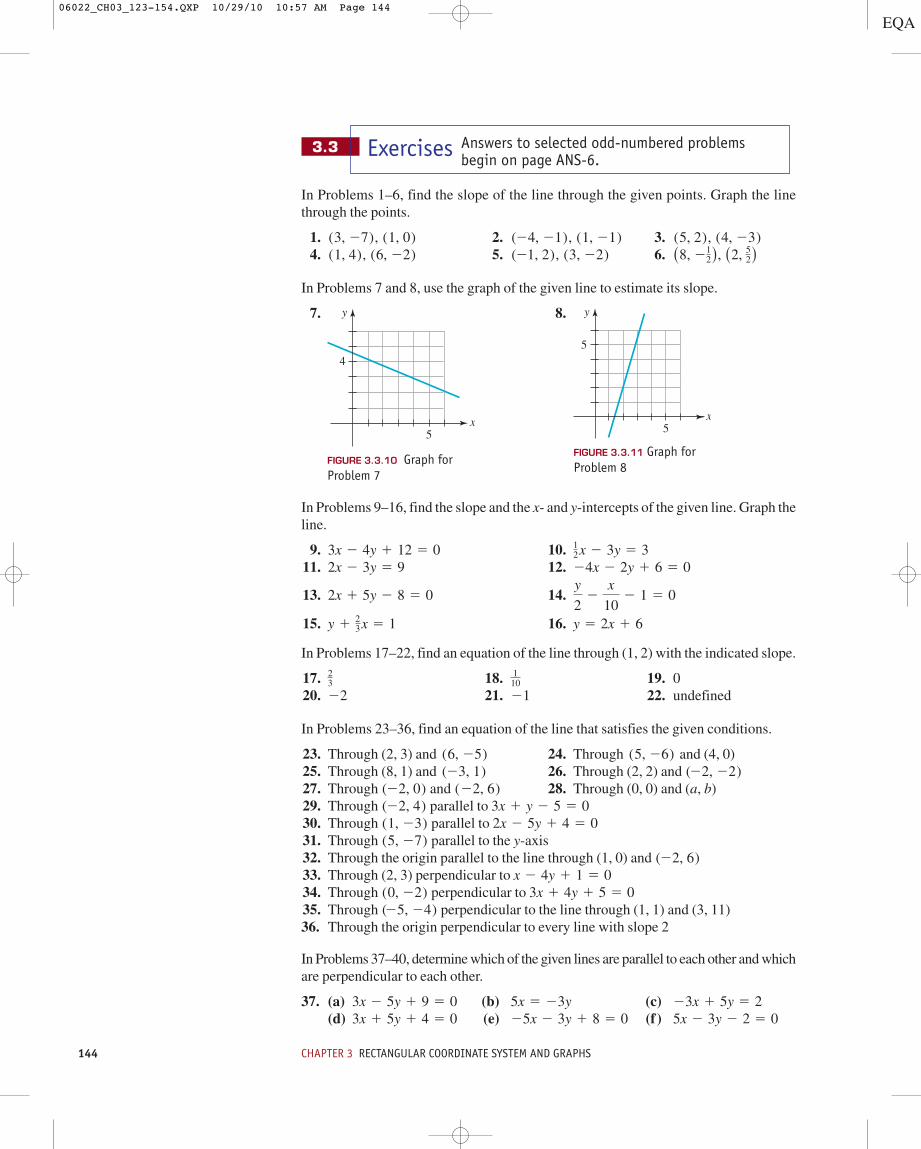
7. 8.
In Problems 9–16, find the slope and the x- and y-intercepts of the given line. Graph theline.
9. 10.11. 12.
13. 14.
15. 16.
In Problems 17–22, find an equation of the line through (1, 2) with the indicated slope.
17. 18. 19. 020. 21. 22. undefined
In Problems 23–36, find an equation of the line that satisfies the given conditions.
23. Through (2, 3) and 24. Through and (4, 0)25. Through (8, 1) and 26. Through (2, 2) and 27. Through and 28. Through (0, 0) and (a, b)29. Through parallel to 30. Through parallel to 31. Through parallel to the y-axis32. Through the origin parallel to the line through (1, 0) and 33. Through (2, 3) perpendicular to 34. Through perpendicular to 35. Through perpendicular to the line through (1, 1) and (3, 11)36. Through the origin perpendicular to every line with slope 2
In Problems 37–40, determine which of the given lines are parallel to each other and whichare perpendicular to each other.
37. (a) (b) (c)(d) (e) (f) 5x 2 3y 2 2 5 025x 2 3y 1 8 5 03x 1 5y 1 4 5 0
23x 1 5y 5 25x 5 23y3x 2 5y 1 9 5 0
(25, 24)3x 1 4y 1 5 5 0(0, 22)
x 2 4y 1 1 5 0(22, 6)
(5, 27)2x 2 5y 1 4 5 0(1, 23)3x 1 y 2 5 5 0(22, 4)
(22, 6)(22, 0)(22, 22)(23, 1)
(5, 26)(6, 25)
2122
110
23
y 5 2x 1 6y 1 23 x 5 1
y
22
x
102 1 5 02x 1 5y 2 8 5 0
24x 2 2y 1 6 5 02x 2 3y 5 9
12 x 2 3y 5 33x 2 4y 1 12 5 0
(8, 212), (2, 52)(21, 2), (3, 22)(1, 4), (6, 22)
(5, 2), (4, 23)(24, 21), (1, 21)(3, 27), (1, 0)
Exercises Answers to selected odd-numbered problemsbegin on page ANS-6.
FIGURE 3.3.11 Graph forProblem 8
y
x5
5
FIGURE 3.3.10 Graph forProblem 7
y
x
4
5
06022_CH03_123-154.QXP 10/29/10 10:57 AM Page 144
3.3 Equations of Lines 145
38. (a) (b) (c)(d) (e) (f)
39. (a) (b) (c)(d) (e) (f)
40. (a) (b) (c)(d) (e) (f)
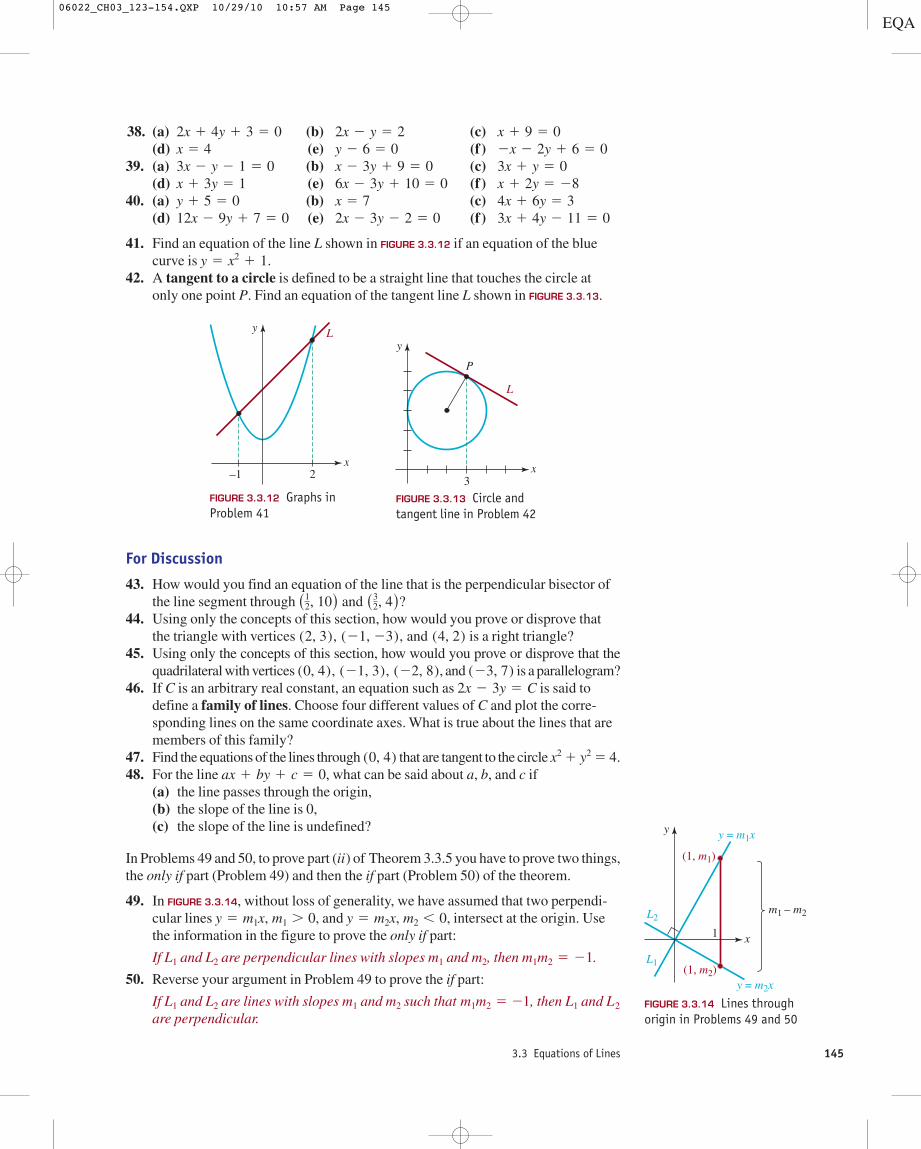
41. Find an equation of the line L shown in FIGURE 3.3.12 if an equation of the bluecurve is
42. A tangent to a circle is defined to be a straight line that touches the circle atonly one point P. Find an equation of the tangent line L shown in FIGURE 3.3.13.
For Discussion
43. How would you find an equation of the line that is the perpendicular bisector ofthe line segment through
44. Using only the concepts of this section, how would you prove or disprove thatthe triangle with vertices is a right triangle?
45. Using only the concepts of this section, how would you prove or disprove that thequadrilateral with vertices , and is a parallelogram?
46. If C is an arbitrary real constant, an equation such as is said todefine a family of lines. Choose four different values of C and plot the corre-sponding lines on the same coordinate axes. What is true about the lines that aremembers of this family?
47. Find the equations of the lines through that are tangent to the circle48. For the line what can be said about a, b, and c if
(a) the line passes through the origin,(b) the slope of the line is 0,(c) the slope of the line is undefined?
In Problems 49 and 50, to prove part (ii) of Theorem 3.3.5 you have to prove two things,the only if part (Problem 49) and then the if part (Problem 50) of the theorem.
49. In FIGURE 3.3.14, without loss of generality, we have assumed that two perpendi-cular lines , and , intersect at the origin. Usethe information in the figure to prove the only if part:
If L1 and L2 are perpendicular lines with slopes m1 and m2, then .
50. Reverse your argument in Problem 49 to prove the if part:
If L1 and L2 are lines with slopes m1 and m2 such that , then L1 and L2
are perpendicular.m1m2 5 21
m1m2 5 21
y 5 m2x, m2 , 0y 5 m1x, m1 . 0
ax 1 by 1 c 5 0,x2 1 y2 5 4.(0, 4)
2x 2 3y 5 C(23, 7)(0, 4), (21, 3), (22, 8)
(2, 3), (21, 23), and (4, 2)
(12, 10) and (3
2, 4)?
FIGURE 3.3.13 Circle andtangent line in Problem 42
x
y
L
P
3FIGURE 3.3.12 Graphs inProblem 41
x
y L
2–1
y 5 x2 1 1.
3x 1 4y 2 11 5 02x 2 3y 2 2 5 012x 2 9y 1 7 5 04x 1 6y 5 3x 5 7y 1 5 5 0x 1 2y 5 286x 2 3y 1 10 5 0x 1 3y 5 13x 1 y 5 0x 2 3y 1 9 5 03x 2 y 2 1 5 02x 2 2y 1 6 5 0y 2 6 5 0x 5 4x 1 9 5 02x 2 y 5 22x 1 4y 1 3 5 0
FIGURE 3.3.14 Lines throughorigin in Problems 49 and 50
x
L1
L2
y
1
y = m1x
y = m2x
m1 – m2
(1, m1)
(1, m2)
06022_CH03_123-154.QXP 10/29/10 10:57 AM Page 145

146 CHAPTER 3 RECTANGULAR COORDINATE SYSTEM AND GRAPHS
3.4
Introduction In many disciplines, a mathematical description by means of anequation, or mathematical model, of a real-life problem can be constructed using thenotion of proportionality. For example, in one model of a growing population (say, bac-teria) it is assumed that the rate of growth at time t is directly proportional to the popu-lation at that time. If we let R represent the rate of growth, P the population, then thepreceding sentence translates into
(1)
where the symbol is read “proportional to.” The mathematical statement in (1) is anexample of variation. In this section we examine four types of variation: direct, inverse,joint, and combined. Each of these types of variation produce an equation in two ormore variables.
Direct Variation We begin with the formal definition of direct variation.
~
R ~ P,
Variation
DEFINITION 3.4.1 Direct Variation
A quantity y varies directly, or is directly proportional to, a quantity x if there existsa nonzero number k such that
(2)y 5 kx.
In (2) we say that the number k is the constant of proportionality. Comparing (2)with Figure 3.3.4 we know that the graph of any equation of the form given in (2) is aline through the origin with slope k. FIGURE 3.4.1 illustrates the graph of (2) in the caseof when
Of course, symbols other than x and y are often used in (2). In the study ofsprings in physics, the force F required to keep a spring stretched x units beyond itsnatural, or unstretched, length is assumed to be directly proportional to the elongationx, that is,
(3)
See FIGURE 3.4.2. The result in (3) is called Hooke’s law after the irascible English physi-cist Robert Hooke (1635–1703).
F 5 kx.
k . 0 and x $ 0.
FIGURE 3.4.1 Graph ofx $ 0.y 5 kx, k . 0,
y
x
y = kx, k > 0
FIGURE 3.4.2 Stretched spring
xx0
Elongation
Force isF = kx
Naturallength
Stretchedspring
06022_CH03_123-154.QXP 10/29/10 10:57 AM Page 146

3.4 Variation 147
Hooke’s Law
A spring whose natural length is ft is stretched 1 in. by a force of 30 lb. How much forceis necessary to stretch the spring to a length of 1 ft?
Solution The elongation of 1 in. is equivalent to ft. Hence by (2) we have
Therefore, When the spring is stretched to a length of 1 ft, its elongation isThe force necessary to stretch the spring to a length of 1 ft is
A quantity can also be proportional to a power of another quantity. In general, wesay that y varies directly, as the nth power of x, or is directly proportional to xn, if thereexists a constant k such that
(4)
The power n in (4) need not be an integer.
Direct Variation
(a) The circumference C of a circle is directly proportional to its radius r. If k is theconstant of proportionality, then by (2) we can write
(b) The area A of a circle is directly proportional to the square of its radius r. If k isthe constant of proportionality, then by (4),
(c) The volume V of a sphere is directly proportional to the cube of its radius r. If k isthe constant of proportionality, then by (4),
From geometry we know in part (a) of Example 2 that in part (b), and in part (c),
Direct Variation
Suppose that y is directly proportional to . If when , what is the value ofy when
Solution From (3) we can write By substitution of and into thisequation, we obtain the constant of proportionality k, since implies that Thus, Finally, when we have
Inverse Variation We say that a quantity y varies inversely with x if it is pro-portional to the reciprocal of x. The formal definition of this concept follows next.
y 5 12
# 43, or y 5 32.x 5 4,y 5 12 x3.
k 5 12.4 5 k # 8
x 5 2y 5 4y 5 kx3.
x 5 4?x 5 2y 5 4x3
EXAMPLE 3
k 5 4p/3.k 5 p,k 5 2p,
V 5 kr3.
A 5 kr2.
C 5 kr.
EXAMPLE 2
y 5 kxn, n . 0.
F 5 360 # 34 5 270 lb.
1 2 14 5 3
4 ft.F 5 360x.
30 5 k( 112) or k 5 360 lb/ft.
112
14
EXAMPLE 1
DEFINITION 3.4.2 Inverse Variation
A quantity y varies inversely, or is inversely proportional to, a quantity x if there existsa nonzero number k such that
(4)y 5kx.
Note in (4) if we let one of the quantities, say x, increase in magnitude, then corre-spondingly the quantity y decreases in magnitude. Alternatively, if the value of x is
06022_CH03_123-154.QXP 10/29/10 10:57 AM Page 147
148 CHAPTER 3 RECTANGULAR COORDINATE SYSTEM AND GRAPHS
small in magnitude, then the value of y is large in magnitude. This can be seen clearlyin the graph given in FIGURE 3.4.3 for
An alternative form of (4) is In the study of gases, Boyle’s law stipulatesthat the product of an ideal gas’s pressure P and the volume V occupied by that gas sat-isfies In other words, P is inversely proportional to V. If the volume V of a con-tainer containing an ideal gas is decreased, necessarily the pressure exerted by the gason the interior walls of the container increases.
In general, we say that y varies inversely, or is inversely proportional to, the nthpower of x if there exists a constant k such that
Joint and Combined Variation A variable may be directly proportional to theproducts of powers of several variables. If the variable z is given by
(5)
we say that z varies jointly as the mth power of x and the nth power of y, or that z is jointlyproportional to and The concept of joint variation expressed in (5) can, of course,be extended to products of powers of more than two variables. Furthermore, a quantitymay be directly proportional to several variables and inversely proportional to othervariables. This type of variation is called combined variation.
Joint Variation
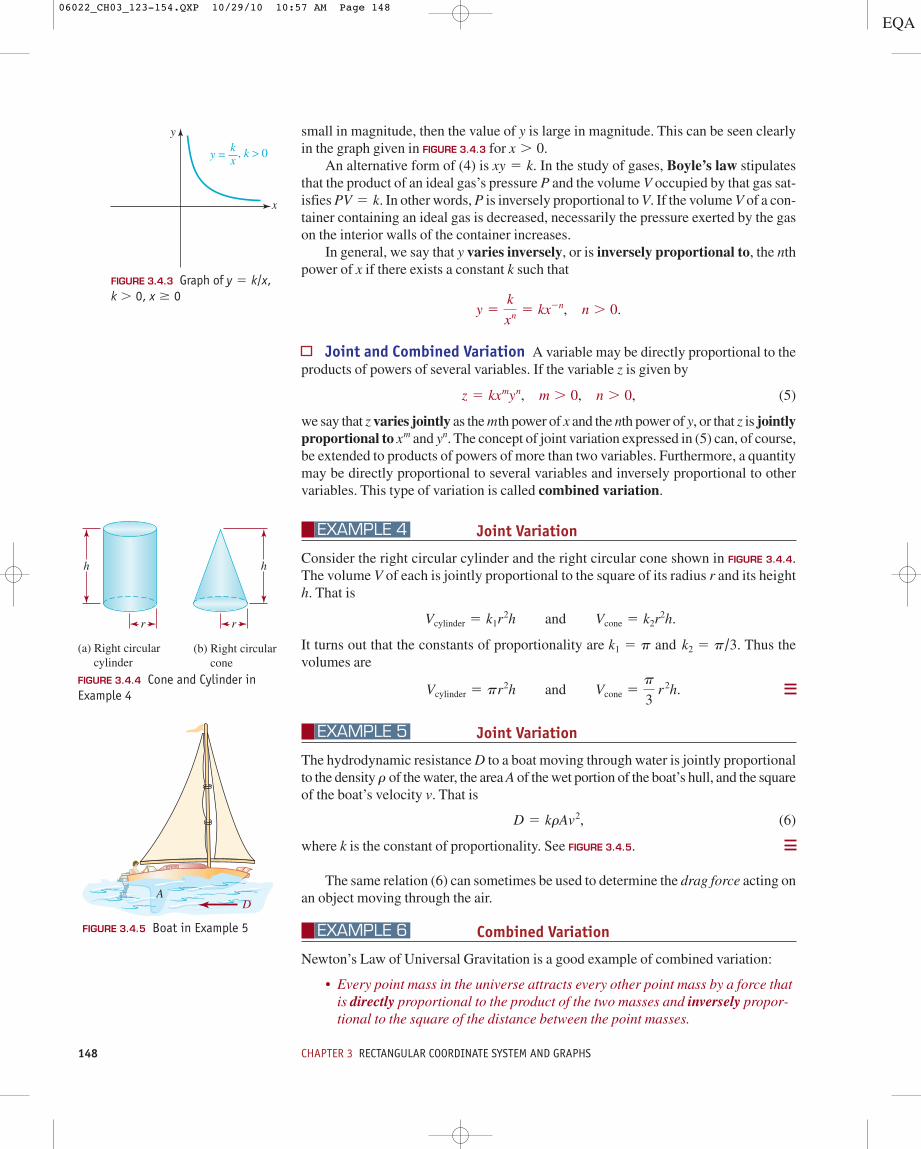
Consider the right circular cylinder and the right circular cone shown in FIGURE 3.4.4.The volume V of each is jointly proportional to the square of its radius r and its heighth. That is
It turns out that the constants of proportionality are and Thus thevolumes are
Joint Variation
The hydrodynamic resistance D to a boat moving through water is jointly proportionalto the density of the water, the area A of the wet portion of the boat’s hull, and the squareof the boat’s velocity v. That is
(6)
where k is the constant of proportionality. See FIGURE 3.4.5.
The same relation (6) can sometimes be used to determine the drag force acting onan object moving through the air.
Combined Variation
Newton’s Law of Universal Gravitation is a good example of combined variation:
• Every point mass in the universe attracts every other point mass by a force thatis directly proportional to the product of the two masses and inversely propor-tional to the square of the distance between the point masses.
EXAMPLE 6
D 5 krAv2,
r
EXAMPLE 5
Vcylinder 5 pr2h and Vcone 5p
3 r2h.
k2 5 p/3.k1 5 p
Vcylinder 5 k1r2h and Vcone 5 k2r
2h.
EXAMPLE 4
yn.xm
z 5 kxmyn, m . 0, n . 0,
y 5k
xn 5 kx2n, n . 0.
PV 5 k.
xy 5 k.x . 0.
FIGURE 3.4.3 Graph of x $ 0k . 0,
y 5 k/x,
y
x
y = kx
, k > 0
FIGURE 3.4.4 Cone and Cylinder inExample 4
h
r r
h
(a) Right circular cylinder
(b) Right circular cone
FIGURE 3.4.5 Boat in Example 5
AD
06022_CH03_123-154.QXP 10/29/10 10:57 AM Page 148
3.4 Variation 149
If, as shown in FIGURE 3.4.6, we denote the masses by and the distance betweenthe masses by r, the square of the distance by the common magnitude of the forcevectors F1 and F2 as F, and k the constant of proportionality, then the formulaic inter-pretation of the foregoing paragraph is
The constant of proportionality k in Example 6 is usually denoted by the symbol Gand is called the universal gravitational constant.
3.4
1. Suppose that y varies directly as the square of x. If when what isthe value of y when
2. Suppose that y is directly proportional to the square root of x. If whenwhat is the value of y when
3. Suppose that w is inversely proportional to the cube root of t. If whenwhat is the value of w when
4. Suppose that s varies inversely as the square of r. If a value of r is tripled, what isthe effect on s?
5. (a) Suppose a 10-lb force stretches a spring 3 in. beyond its natural length. Finda formula for the force F required to stretch the spring x ft beyond its naturallength.
(b) Determine the elongation of the spring produced by a 50-lb force.6. A spring whose natural length of 1 ft is stretched ft by a force of 100 lb. How
much force is necessary to stretch the spring to a length of ft?
Miscellaneous Applications
7. Falling Stone The distance s that a stone travels when dropped from a very tallbuilding is proportional to the square of the time t in flight. If the stone falls64 feet in 2 seconds, find a formula that relates s and t. How far does the stonefall in 5 s? How far does the stone fall between 2 s and 3 s?
8. Another Falling Stone The velocity v of a stone dropped from a very tall build-ing varies directly as the time t in flight. Find a formula relating v and t if thevelocity of the stone at the end of 1 second is 32 ft/s. If the stone is dropped fromthe top of a building that is 144 ft tall, what is its velocity when it hits theground? [Hint: Use Problem 7.]
9. Pendulum Motion The period T of a plane pendulum varies directly as thesquare root of its length L. How much should the length L be changed in order todouble the period of the pendulum?
10. Weight The weight w of a person varies directly as the cube of the person’slength l. At age 13 a person 60 in. tall weighs 120 lb. What is the person’s weightat age 16 when the person is 72 in. tall?
11. Animal Surface Area The surface area S (in square meters) of an animal isdirectly proportional to the two-thirds power of its weight w measured in kg. Forhumans the constant of proportionality is taken to be Find the surfacearea of a person whose weight is 81 kg.
k 5 0.11.
2.5
34
t 5 8?t 5 27,w 5 2
x 5 25?x 5 16,y 5 4
x 5 2?x 5 1,y 5 3
Exercises Answers to selected odd-numbered problemsbegin on page ANS-6.
F 5 k m1m2
r2 .
r2,m2,m1
FIGURE 3.4.6 Gravitationalforce in Example 6
F1
m1 m2F2
r
06022_CH03_123-154.QXP 10/29/10 10:57 AM Page 149
150 CHAPTER 3 RECTANGULAR COORDINATE SYSTEM AND GRAPHS
12. Kepler’s Third Law According to Kepler’s third law of planetary motion, thesquare of the period P of a planet (that is, the time it takes for a planet to revolvearound the Sun) is proportional to the cube of its mean distance s from the sun.The period of the Earth is 365 days and its mean distance from the Sun is92,900,000 mi. Determine the period of Mars given that its mean distance fromthe Sun is 142,000,000 mi.
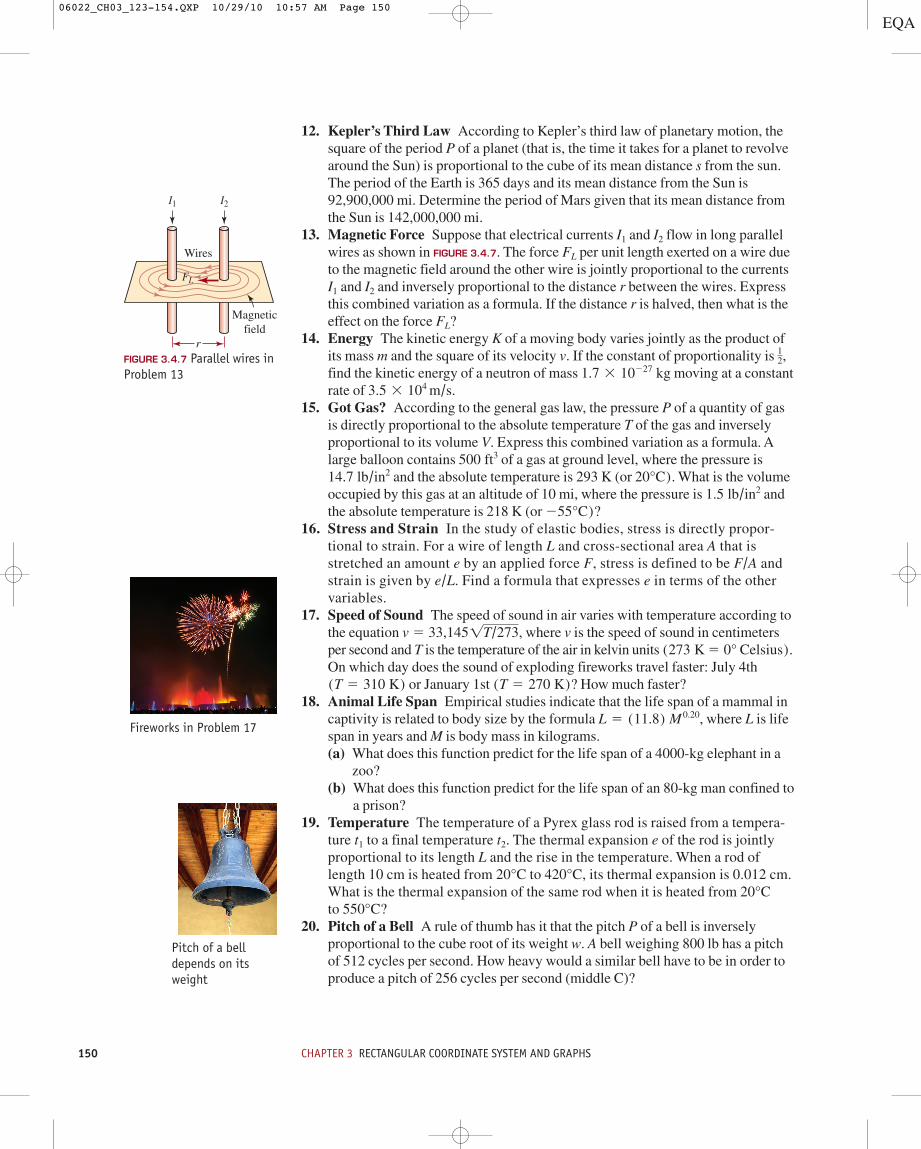
13. Magnetic Force Suppose that electrical currents I1 and I2 flow in long parallelwires as shown in FIGURE 3.4.7. The force FL per unit length exerted on a wire dueto the magnetic field around the other wire is jointly proportional to the currentsI1 and I2 and inversely proportional to the distance r between the wires. Expressthis combined variation as a formula. If the distance r is halved, then what is theeffect on the force FL?
14. Energy The kinetic energy K of a moving body varies jointly as the product ofits mass m and the square of its velocity v. If the constant of proportionality is ,find the kinetic energy of a neutron of mass moving at a constantrate of .
15. Got Gas? According to the general gas law, the pressure P of a quantity of gasis directly proportional to the absolute temperature T of the gas and inverselyproportional to its volume V. Express this combined variation as a formula. Alarge balloon contains of a gas at ground level, where the pressure is
and the absolute temperature is 293 K (or What is the volumeoccupied by this gas at an altitude of 10 mi, where the pressure is andthe absolute temperature is 218 K (or
16. Stress and Strain In the study of elastic bodies, stress is directly propor-tional to strain. For a wire of length L and cross-sectional area A that isstretched an amount e by an applied force F, stress is defined to be andstrain is given by Find a formula that expresses e in terms of the othervariables.
17. Speed of Sound The speed of sound in air varies with temperature according tothe equation where v is the speed of sound in centimetersper second and T is the temperature of the air in kelvin units On which day does the sound of exploding fireworks travel faster: July 4th
or January 1st How much faster?18. Animal Life Span Empirical studies indicate that the life span of a mammal in
captivity is related to body size by the formula where L is lifespan in years and M is body mass in kilograms.(a) What does this function predict for the life span of a 4000-kg elephant in a
zoo?(b) What does this function predict for the life span of an 80-kg man confined to
a prison?19. Temperature The temperature of a Pyrex glass rod is raised from a tempera-
ture t1 to a final temperature t2. The thermal expansion e of the rod is jointlyproportional to its length L and the rise in the temperature. When a rod oflength 10 cm is heated from to , its thermal expansion is 0.012 cm.What is the thermal expansion of the same rod when it is heated from to ?
20. Pitch of a Bell A rule of thumb has it that the pitch P of a bell is inverselyproportional to the cube root of its weight w. A bell weighing 800 lb has a pitchof 512 cycles per second. How heavy would a similar bell have to be in order toproduce a pitch of 256 cycles per second (middle C)?
550°C20°C
420°C20°C
L 5 (11.8) M0.20,
(T 5 270 K)?(T 5 310 K)
(273 K 5 0° Celsius).v 5 33,145!T/273,
e/L.F/A
255°C)?1.5 lb/in2
20°C).14.7 lb/in2500 ft3
3.5 3 104 m/s1.7 3 10227 kg
12FIGURE 3.4.7 Parallel wires in
Problem 13
Wires
FL
I1 I2
r
Magneticfield
Fireworks in Problem 17
Pitch of a belldepends on itsweight
06022_CH03_123-154.QXP 10/29/10 10:57 AM Page 150
CHAPTER 3 Review Exercises 151
A. True/False__________________________________________________
In Problems 1–22, answer true or false.
1. The point (5, 0) is in quadrant I. ___2. The point is in quadrant III. ___3. The points (0, 3), (2, 2), and (6, 0) are collinear. ___4. Two lines with positive slopes cannot be perpendicular. ___5. The equation of a vertical line through is ___6. If A, B, and C are points in the Cartesian plane, then it is always true that
___7. The lines and are perpendicular. ___8. The circle is tangent to both the x- and y-axes. ___9. The graph of the equation is symmetric with respect to the origin. ___
10. The center of the circle is ___11. The circle passes through the origin. ___12. If a line has undefined slope, then it must be vertical. ___13. The circle has no intercepts. ___14. If is on a line with slope 1, then is also on the line. ___15. The lines are parallel. ___16. If y is inversely proportional to x, then y decreases as x increases. ___17. The line through the points is horizontal. ___18. Graphs of lines of the form cannot contain a point with a negative
x-coordinate and a positive y-coordinate. ___19. If the graph of an equation contains the point (2, 3) and is symmetric with
respect to the x-axis, then the graph also contains the point ___20. The graph of the equation is symmetric with respect to the x-axis, the
y-axis, and the origin. ___0 x 0 5 0 y 0
(2, 23).
y 5 mx, m . 0,(21, 2) and (4, 2)
y 5 2x 2 5 and y 5 2x(1
2, 232)(21
2, 32)
(x 2 3)2 1 (y 1 5)2 5 2
x2 1 4x 1 y2 1 10y 5 0(22, 25).x2 1 4x 1 y2 1 10y 5 0
y 5 x 1 x3(x 1 1)2 1 (y 2 1)2 5 1
22x 1 3y 5 12x 1 3y 5 5d(A, B) 1 d(B, C) . d(A, C).
x 5 2.(2, 25)
(23, 7)
Review Exercises Answers to selected odd-numberedproblems begin on page ANS-6.
CHAPTER 3
Cartesian (rectangular) coordinatesystem
Coordinate axes:x-axisy-axis
Coordinates of a pointQuadrantsPoint:
coordinatesDistance formulaMidpoint formulaCircle:
standard formcompleting the square
Semicircle
Intercepts of a graph:x-intercepty-intercept
Symmetry of a graph:x-axisy-axisorigin
Slope of a line:positivenegativeundefined
Equations of lines:point-slope formslope-intercept form
Vertical line
Horizontal lineParallel linesPerpendicular linesVariation:
directinversejointcombinedconstant of proportionality
CONCEPTS REVIEW You should be able to give the meaning of each of the following concepts.
06022_CH03_123-154.QXP 10/29/10 10:57 AM Page 151
152 CHAPTER 3 RECTANGULAR COORDINATE SYSTEM AND GRAPHS
21. There is no point on the circle with x-coordinate 2. ___22. The radius r of the circle centered at the origin containing the point
is 5. ___
B. Fill in the Blanks_____________________________________________
In Problems 1–20, fill in the blanks.
1. The lines and are parallel if ___________.2. An equation of a line through that is perpendicular to
is ___________.3. The slope and the x- and y-intercepts of the line
are ___________.4. The distance between the points (5, 1) and is ___________.5. The slope of the line is ___________.6. The lines and are perpendicular if
___________.7. Two points on the circle with the same y-coordinate
are ___________.8. The graph of is a ___________.9. The center and the radius of the circle are ___________.
10. The point is on a graph. Give the coordinates of another point on the graphif the graph is(a) symmetric with respect to the x-axis. ___________(b) symmetric with respect to the y-axis. ___________(c) symmetric with respect to the origin. ___________
11. If is the midpoint of the line segment from to ,then ____________ and ____________.
12. The midpoint of the line segment from to is ___________.13. The quadrants of the xy-plane in which the quotient is negative are ___________.14. A line with x-intercept and y-intercept (0, 32) has slope ___________.15. An equation of a line perpendicular to and contains the point is
___________.16. If the point is on the graph of then ___________.
17. The graph of is a ___________.18. The equation ___________ is an example of a circle with center and both
x-intercepts on the negative x-axis.19. The distance from the midpoint of the line segment joining the points
and to the origin is ___________.20. If p varies inversely as the cube of q and when then
________ when
C. Review Exercises_____________________________________________
1. Determine whether the points A(1, 1), B(3, 3), and C(5, 1) are vertices of a righttriangle.
2. Find an equation of a circle with the points (3, 4) and (5, 6) as the endpoints of adiameter.
3. Find an equation of the line through the origin perpendicular to the line through(1, 1) and
4. Find an equation of the line through (2, 4) parallel to the line through and (4, 23).
(21, 21)(2, 22).
q 5 3.p 5
q 5 21,p 5 9(22, 0)
(4, 26)
y 5 2"100 2 x2
a 5y 5 2x,(a, a 1 !3 )
(22, 7)y 5 3(24, 0)
x/yP2(8, 29)P1(2, 25)
y2 5x1 5
P2(8, y2)P1(x1, 3)(22, 6)
(1, 5)(x 2 2)2 1 (y 1 7)2 5 8
y 5 26
23x2 1 y2 5 25k 5
kx 1 3y 1 3 5 02x 2 5y 5 1m 54y 5 6x 1 3
(21, 9)
24x 1 3y 2 48 5 0
y 5 3x 2 5(1, 2)k 5kx 1 3y 1 3 5 02x 2 5y 5 1
(1, 22)x2 1 y2 2 10x 1 22 5 0
06022_CH03_123-154.QXP 10/29/10 10:57 AM Page 152
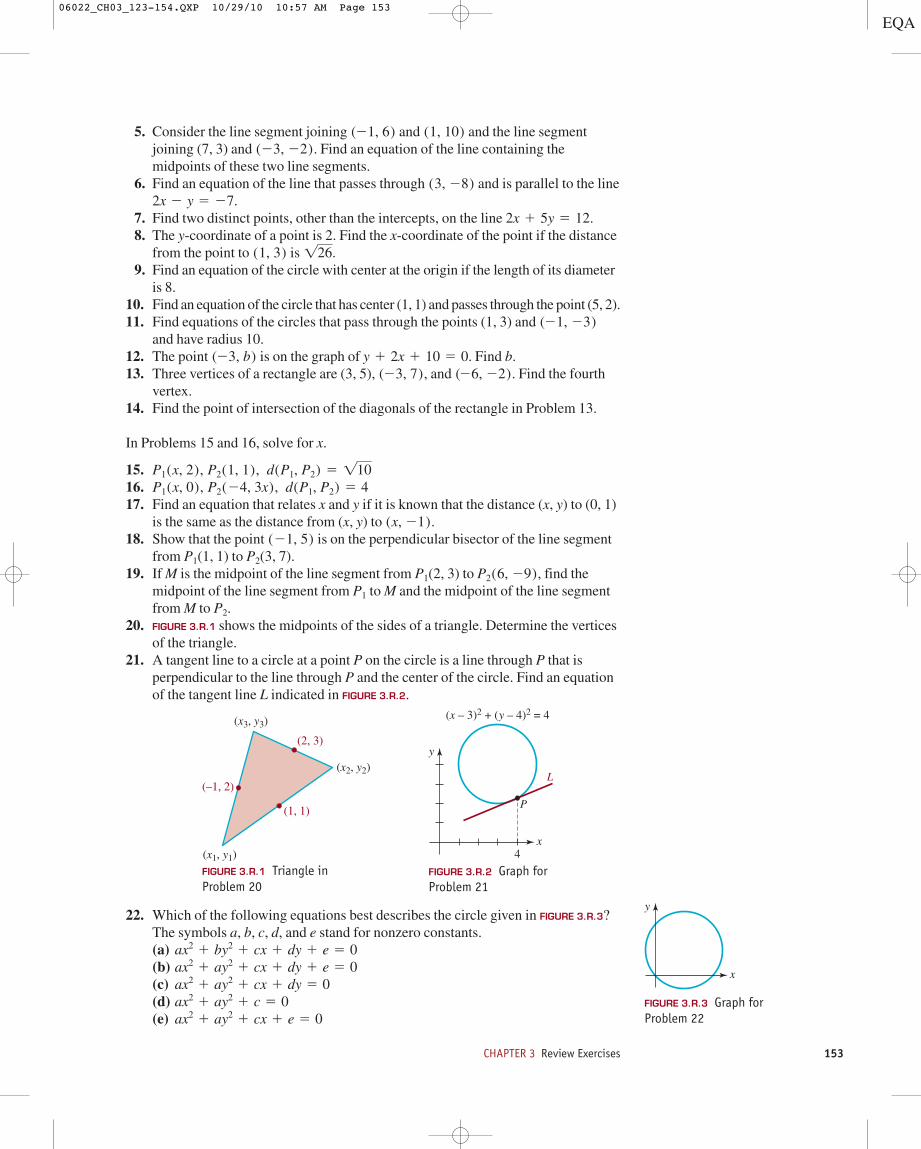
CHAPTER 3 Review Exercises 153
5. Consider the line segment joining and and the line segment joining (7, 3) and Find an equation of the line containing the midpoints of these two line segments.
6. Find an equation of the line that passes through and is parallel to the line
7. Find two distinct points, other than the intercepts, on the line 8. The y-coordinate of a point is 2. Find the x-coordinate of the point if the distance
from the point to is 9. Find an equation of the circle with center at the origin if the length of its diameter
is 8.10. Find an equation of the circle that has center (1, 1) and passes through the point (5, 2).11. Find equations of the circles that pass through the points (1, 3) and
and have radius 10.12. The point is on the graph of Find b.13. Three vertices of a rectangle are (3, 5), , and Find the fourth
vertex.14. Find the point of intersection of the diagonals of the rectangle in Problem 13.
In Problems 15 and 16, solve for x.
15.16.17. Find an equation that relates x and y if it is known that the distance (x, y) to (0, 1)
is the same as the distance from (x, y) to 18. Show that the point is on the perpendicular bisector of the line segment
from P1(1, 1) to P2(3, 7).19. If M is the midpoint of the line segment from P1(2, 3) to find the
midpoint of the line segment from P1 to M and the midpoint of the line segmentfrom M to P2.
20. FIGURE 3.R.1 shows the midpoints of the sides of a triangle. Determine the verticesof the triangle.
21. A tangent line to a circle at a point P on the circle is a line through P that isperpendicular to the line through P and the center of the circle. Find an equationof the tangent line L indicated in FIGURE 3.R.2.
P2(6, 29),
(21, 5)(x, 21).
P1(x, 0), P2(24, 3x), d(P1, P2) 5 4P1(x, 2), P2(1, 1), d(P1, P2) 5 !10
(26, 22).(23, 7)y 1 2x 1 10 5 0.(23, b)
(21, 23)
!26.(1, 3)
2x 1 5y 5 12.2x 2 y 5 27.
(3, 28)
(23, 22).(1, 10)(21, 6)
FIGURE 3.R.1 Triangle inProblem 20
(x2, y2)
(x1, y1)
(x3, y3)
(2, 3)
(1, 1)
(–1, 2)
FIGURE 3.R.2 Graph forProblem 21
y
x4
L
P
(x – 3)2 + (y – 4)2 = 4
22. Which of the following equations best describes the circle given in FIGURE 3.R.3?The symbols a, b, c, d, and e stand for nonzero constants.(a)(b)(c)(d)(e) ax2 1 ay2 1 cx 1 e 5 0
ax2 1 ay2 1 c 5 0ax2 1 ay2 1 cx 1 dy 5 0ax2 1 ay2 1 cx 1 dy 1 e 5 0ax2 1 by2 1 cx 1 dy 1 e 5 0
FIGURE 3.R.3 Graph forProblem 22
y
x
06022_CH03_123-154.QXP 10/29/10 10:57 AM Page 153
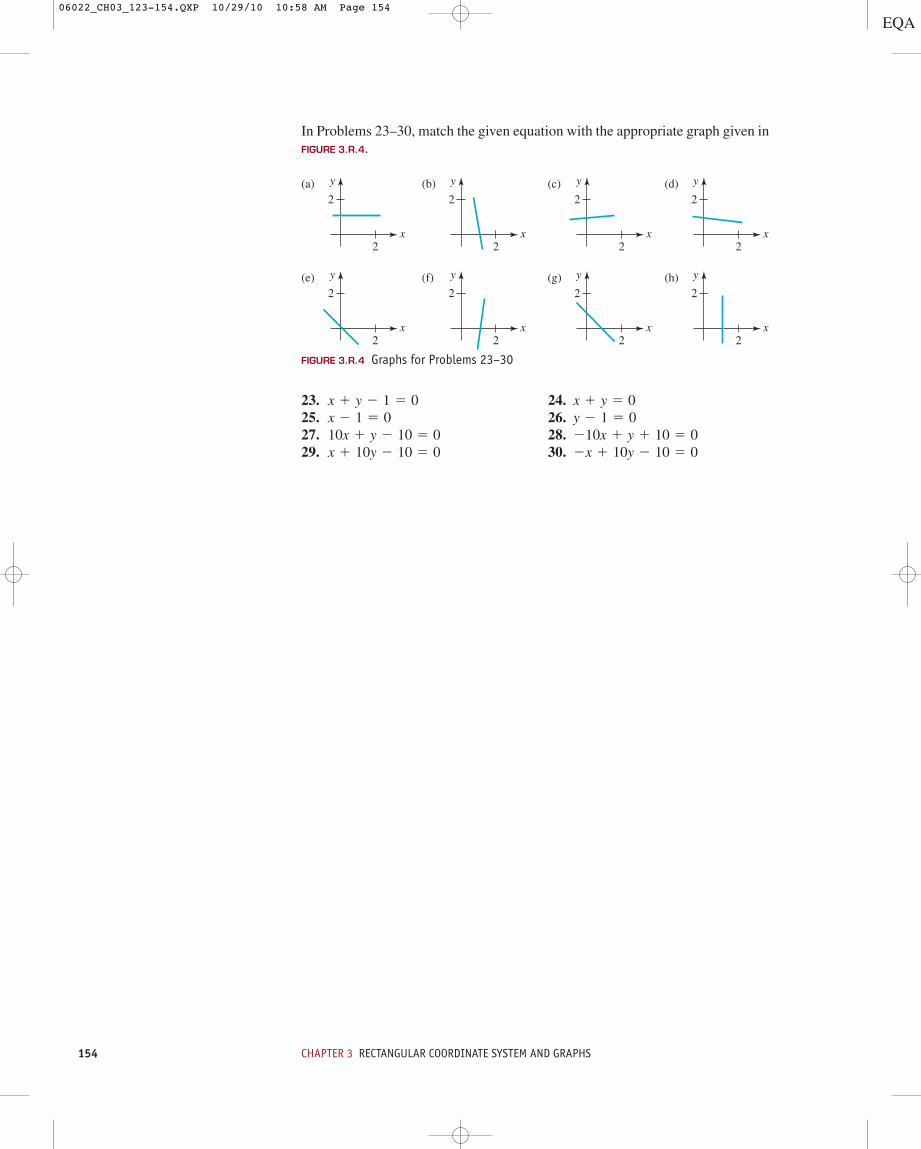
154 CHAPTER 3 RECTANGULAR COORDINATE SYSTEM AND GRAPHS
In Problems 23–30, match the given equation with the appropriate graph given inFIGURE 3.R.4.
FIGURE 3.R.4 Graphs for Problems 23–30
y
x2
2(a) y
x2
2(c) y
x2
2(d)y
x2
2(b)
y
x2
2(e) y
x2
2(g) y
x2
2(h)y
x2
2(f)
23. 24.25. 26.27. 28.29. 30. 2x 1 10y 2 10 5 0x 1 10y 2 10 5 0
210x 1 y 1 10 5 010x 1 y 2 10 5 0y 2 1 5 0x 2 1 5 0x 1 y 5 0x 1 y 2 1 5 0
06022_CH03_123-154.QXP 10/29/10 10:58 AM Page 154
Related Documents