45 3. Model, data and estimation methods 3.1 Introductory remarks The literature presented in the second chapter indicates that, although efforts have been made by some financial institutions to provide credit to women, the issue of differences in gender may still interfere with the supply of credit to borrowers by banks, as well as the extent to which borrowers use credit successfully. In this chapter, some terms used in the study are defined and some of the factors that may influence the creditworthiness of borrowers are discussed. Also, some institutional factors that may affect loan size and repayment behaviour are presented. The nature of the data set, the models for analysing the size of loan and repayment performance relationships, and the a priori expectations are presented. Finally, the analytical methods to be used in the study are outlined. 3.2 Definition of some terms In order to investigate the effect of gender and other factors on the size of loans given to borrowers and on their repayment performance, three effects have been considered, i.e., the 'direct gender effect', the 'gender interaction effect' and the 'socioeconomic effect' The 'direct gender effect' refers to the impact that is due purely to the gender of the borrower. Hilhorst and Oppenoorth (1992, p. 91) defined gender as 'learned culturally, determined (as opposed to biologically determined) differences in the behaviour patterns of women and men in relation to each other and to their social context'. The 'gender interaction effect' is a combination of two effects, namely gender and another socioeconomic variable such as land area, on either the size of loan allocated to, or the loan repayment performance of, the borrower. For example, in the case where gender interacts with land area, a financial institution may award larger loan increments to women than men borrowers for a marginal increase in land area, or a marginal increase in land area may result in a greater increase in loan repayment for women borrowers than men.

Welcome message from author
This document is posted to help you gain knowledge. Please leave a comment to let me know what you think about it! Share it to your friends and learn new things together.
Transcript

45
3. Model, data and estimation methods
3.1 Introductory remarks
The literature presented in the second chapter indicates that, although efforts have
been made by some financial institutions to provide credit to women, the issue of
differences in gender may still interfere with the supply of credit to borrowers by
banks, as well as the extent to which borrowers use credit successfully.
In this chapter, some terms used in the study are defined and some of the factors that
may influence the creditworthiness of borrowers are discussed. Also, some
institutional factors that may affect loan size and repayment behaviour are presented.
The nature of the data set, the models for analysing the size of loan and repayment
performance relationships, and the a priori expectations are presented. Finally, the
analytical methods to be used in the study are outlined.
3.2 Definition of some terms
In order to investigate the effect of gender and other factors on the size of loans given
to borrowers and on their repayment performance, three effects have been considered,
i.e., the 'direct gender effect', the 'gender interaction effect' and the 'socioeconomic
effect'
The 'direct gender effect' refers to the impact that is due purely to the gender of the
borrower. Hilhorst and Oppenoorth (1992, p. 91) defined gender as 'learned
culturally, determined (as opposed to biologically determined) differences in the
behaviour patterns of women and men in relation to each other and to their social
context'.
The 'gender interaction effect' is a combination of two effects, namely gender and
another socioeconomic variable such as land area, on either the size of loan allocated
to, or the loan repayment performance of, the borrower. For example, in the case
where gender interacts with land area, a financial institution may award larger loan
increments to women than men borrowers for a marginal increase in land area, or a
marginal increase in land area may result in a greater increase in loan repayment for
women borrowers than men.

46
The 'socioeconomic effect' refers to the factors other than gender that may influence
the size of loan that the borrower is given or the repayment performance of that
borrower.
3.3 Some factors affecting the creditworthiness of borrowers
Creditworthiness can be defined as the willingness and or the ability of a borrower to
repay promptly (Bourke and Shanmugam 1990). The factors that banks consider
when making the decision to lend are also used when deciding on loan size (B.
Shanmugam 1995, pers. comm.).
In assessing the creditworthiness of borrowers, banks are interested in minimising
credit risks so as to maintain their loan portfolio. According to Eisenreich (1990), the
risks comprise (i) cash insolvency, i.e., where cash inflows are not sufficient to meet
necessary cash outflows, leading to default, and (ii) cash inadequacy, i.e., where cash
inflows are not sufficient to meet necessary cash outflows on schedule, resulting in
slow repayment. Consequently, banks are interested in awarding loans to borrowers
who will be able to repay, and who have some form of security which can be seized in
the event of default.
White (1990) outlined the Cs of lending that a rational lender would use to determine
the creditworthiness of a borrower. Some of the Cs that are relevant to the study are
character, capacity, capital, conditions, customer relationships and collateral. Apart
from the use of the Cs to select borrowers, they are also employed as guidelines to
decide on the size of loan that borrowers should receive and their expected repayment
(B. Shanmugam 1995, pers. comm.). It is therefore assumed in this study, that the
factors that affect loan size are those that affect loan repayment. Although gender is
not stated explicitly as one of the factors determining bank lending, it is implicit in the
requirements of banks.
3.3.1 Character
Character refers to the willingness or commitment of the applicant to repay the loan
(White 1990). As Bourke and Shanmugam (1990) pointed out, it is possible for a
borrower of poor character to decline to repay despite having the money to repay, or to
use funds for purposes other than those for which the funds were granted. Therefore,
a bank is likely to refuse to lend to borrowers of poor character and to award smaller
loans to those for whom the character assessment is not positive. Also, the poorer a
borrower's character, the worse may be his or her repayment behaviour. Tilahun
47
(1994) found that unwillingness to repay was the major cause of poor loan repayment
amongst Ethiopian farmers.
There is evidence of some relationship between gender and the character of borrowers.
In the case of rural women, there has been an increasing realisation that, on the whole,
poor women are of good character in that they are willing to repay, and fear being in
debt. As mentioned in section 2.6.3, financial institutions such as the Grameen Bank
in Bangladesh report excellent repayments and recoveries from poor women
borrowers (Hilhorst and Oppenoorth 1992).
The age of a borrower may be related to loan size and to repayment behaviour.
Culturally, the status and image associated with older borrowers may be interpreted to
mean that they are more willing to repay.
Married people are considered to have many obligations, such as larger extended
families to support and more cultural obligations than single people. Thus, one may
say that married people are less likely to repay than those who are single.
Donald (1976) reported that borrowers with some political affiliation had high default
rates. Sengaati (1993) found that, for the case of Tanzania, borrowers with higher
social status and political connections had relatively poorer repayment rates than those
without such status or connections.
Culture may promote the unwillingness to repay. For instance, Ellis (1992) and
Tapsoba (1981) asserted that, in cultures where the concept of loan repayment is
unfamiliar, credit from the government may be mistaken for a gift, resulting in
unwillingness to repay. Fry (1988) reported that, in Brazil, subsidised interest rates
and expectations of government bail-outs provided a strong incentive for postponing
loan repayment. Also, where the legal systems are weak and the penalties due to
default are not harsh, repayment may be poor.
3.3.2 Capacity
Capacity pertains to the applicant's ability to repay, indicated usually by the expected
net cash flow of the borrower being greater than the repayment requirement (White
1990). To hedge against risk, a bank is likely to give smaller loans to borrowers
whose characteristics may impede their net cash flows.
Cash inflows are largely determined by the profitability of the income-generating
activity or activities the borrower is engaged in. Profits may go into investments on

48
farms, such as more cattle, not into cash flow. The degree to which the small business
operators and their workers have the relevant experience, literacy, numeracy, and
technical and business management skills is critical to the success of the business.
Marketing aspects, such as demand for the product, marketing infrastructures, location
of the enterprise and the price and quality of the product, all influence sales revenues
and hence the profitability of the enterprise. The availability of support services, such
as agricultural and veterinary extension, is important especially where modern
technologies are being used in the production process.
Borrowers may benefit from membership of farmers' organisations such as
agricultural societies (Oxfam 1990). For instance, members may gain access to
business information. Also, production costs per unit may be reduced through, for
example, bulk purchasing of inputs, joint renting of equipment, building of dips and
sharing transport for marketing produce ( Neck and Nelson 1987).
In the case of married borrowers, husbands and wives may both contribute to
household expenditures. The capacity to repay may therefore be higher for married
than for single borrowers. For the latter, especially if they have children, the capacity
to repay may be much lower, due to the burden of maintaining their households. In
the case of female-headed households, the burden may be greater due to the
combination of the gender roles and their limited access to resources, as mentioned in
section 2.4.6. However, there is evidence that single women may have a higher
capacity to repay than married women. In a study in Burkina Faso, single women
were found to be more economically active than married women, i.e., 60 per cent for
single women, 42 per cent for monogamously married women and 38 per cent to 50
per cent for polygamously married women (Dijkman and Dijk 1993). Also, single
women may have more decision-making power and control of their income and thus
have a higher capacity to repay than their married counterparts.
Vyarma (1993) found that women loan recipients in the Integrated Rural Development
Project in India failed to meet loan repayment due primarily to inadequate income and
high household expenditures.
A borrower who has another occupation, apart from that for which the loan was
granted, could have another source of cash inflow for repayment in case the enterprise
is not performing well. Also, although a borrower who has some other occupation is
likely to face greater time constraints (than one with no other occupation), the
increased cash flow may permit the borrower to hire labour or purchase labour-saving
devices. Consequently, the capacity of such a borrower to repay may be higher than
that of a borrower who has no other occupation.

49
The level of education may be taken as an indication of the literacy and numeracy
skills possessed by the borrower. According to Gittinger et al. (1990), 'education
appears to increase the ability and willingness to reallocate resources efficiently'.
Therefore the level of education may affect the performance of a business and thence
the capacity of the borrower to repay.
3.3.3 Capital
Bourke and Shanmugam (1990) refer to capital as the ability of the borrower to repay,
measured by the net worth of the business. Capital indicates the borrower's
accumulated wealth and past successes.
In most developing countries, many income-generating activities require some use of
land (UNICEF 1994). Land may be considered as a form of capital, or wealth, by the
bank. Consequently, it is likely that a bank will award larger loans to borrowers with
larger land areas.
The size of the herd could also indicate the financial worth of the applicant, i.e.,
capital. It may be viewed as a reflection of the borrower's past success in farming.
Also, culturally, the size of the herd represents status, wealth and prestige. Since the
larger the herd size, the more capital a borrower may have at stake if the business does
not succeed, the bank may consider borrowers with larger herd sizes to be relatively
more creditworthy than those with smaller sizes.
3.3.4 Collateral
Collateral reduces the risk to the lender in case of default. Collateral may be in the
form of either reputation or assets. The latter are preferred by most formal institutions
(Gittinger et al. 1990). The assets can be liquidated to cover the losses accruing from
default. In cases where guarantors are used as collateral, the guarantors can be
approached to repay the loans (Bourke and Shanmugam 1990).
3.3.5 Condition
Condition pertains to the economic, industry, business or other environment in which
the enterprise is to be operated, during the life of the loan, and how the conditions may
affect the capacity to repay. The economic environment refers to, for example,
inflation, taxation, and or regulation (Bourke and Shanmugam 1990). The sensitivity
of the cash flow to changes in the external environment may determine the ability of
50
the borrower to repay (White 1990). In agriculture, the inability of borrowers to repay
may be due to environmental conditions, such as crop failure, disease incidence or
other vagaries of weather (Tilahun 1994).
3.3.6 Customer relationships
Customer relationships refer to the amount of information and experience that the
lender has about borrowers. The information may assist the bank in making a clearer
assessment of the character of borrowers and their willingness to repay (White 1990).
Donald (1976) argued that maintaining customer relationships encourages borrowers
to feel that they are part of the bank, thereby motivating them to repay. According to
Chenery and Srinivasan (1988), asymmetric information about borrowers is one of the
major causes of poor repayment rates.
3.4 Some institutional factors that affect loan size and repaymentbehaviour
Tilahun (1994) reported that institutional and policy problems are major causes of non-
repayment. As mentioned in section 2.6.1, Fry (1988) claimed that many banks in
developing countries adopt inefficient lending criteria and monitoring procedures.
Also, some banks lack clear rules on delinquency and defaults. Many credit officers
lack expertise in loan appraisal and project evaluation techniques. According to
Morris (1985), in the case of formal financial institutions in India, poor repayments
were caused by, for example, defective loan policies such as delayed loan
disbursement, inappropriate loan sizes, unrealistic repayment schedules, ineffective
supervision and indifference of bank management with respect to recovering loans.
Such institutional factors may affect the allocation of funds and the capacity or
willingness of a borrower to repay.
3.5 The data set
The data used in this study were secondary data obtained from the Uganda
Commercial Bank Rural Farmers' Scheme (UCB RFS). These data comprised social
and economic information on men and women borrowers, as filled in on their loan
application forms. The names were not provided by the bank, to preserve the
confidentiality of the information. The background of the UCB RFS was discussed in
section 2.13.
51
All the borrowers were given loans for a three-year term to run dairy enterprises. The
data were obtained from the successful applications from two districts in the central
region of Uganda, namely Mpigi and Mukono. These districts were chosen because
they were the only districts where enough data on borrowers who operate dairy
enterprises could be obtained. Dairying was chosen amongst other enterprises
because the enterprise has a long repayment period (3 years), compared with other
enterprises, such as poultry, piggery and horticulture, which have shorter repayment
periods. Hence, a more appropriate number of observations could be obtained to
permit the study of the repayment behaviour of borrowers. The number of loans used
in the study was 105, 51 loans for men and 54 loans for women.
3.5.1 Composition of the raw data
The socioeconomic data on borrowers comprised:
• distance from the branch in kilometres;
• gender;
• marital status;
• household size;
• occupation;
• number of years of experience in farming;
• age;
• whether or not borrowers belonged to any society;
• ownership of land and buildings;
• types of tools and equipment owned;
• level of education;
• land area in hectares allocated to the dairy enterprise;
• numbers of indigenous and exotic stock owned;
• marketed surplus in terms of litres of milk;

52
• whether or not security was offered;
• nature of security;
• ownership of security;
• year of disbursement;
• amount disbursed of loan;
• interest rate;
• repayment in first, second and third years; and
• outstanding balance at the end of the third year.
3.5.2 The variables used in the study
Amongst the variables in the original data set obtained from the UCB RFS, only
gender, marital status, society membership, collateral, other occupation, age,
household size, experience, education, land area, herd-size, the percentage of exotic
cattle in total herd and distance from the branch were used in the analysis. Society
membership, marital status, ownership of collateral and other occupation were
incorporated as dummy variables. The data set is presented in Appendix 1.
The variable for ownership of land and buildings could be indicated by the variable
for ownership of collateral since all the security was in the form of land. Therefore
the variable for ownership of land was dropped. Since each of the borrowers had
some tools and equipment and no monetary value was attached to them, the variable
could not be used in the analysis. The variable for the number of indigenous cattle
was added to that for the number of exotic cattle to obtain the total herd size for each
borrower. Since the prime reason for maintaining large indigenous herd sizes is
prestige, i.e., to indicate wealth (UNICEF 1994), the latter could be better expressed
by the herd size as a whole. So the variable for number of indigenous cattle was
dropped. The bank reported the marketed surplus in terms of litres of milk as
`income'. However, since the variable did not reflect the disposable income from
which the borrower would have funds to repay the loan or to reinvest, the variable was
not considered to be useful for the analysis. The number of exotic cattle in a herd was
incorporated as a percentage of the total herd. The variable was incorporated to
capture the productivity of the herds since the exotic breeds yield more milk, on
average, than the indigenous ones. The percentage of exotic cattle in the herd

53
indicated the productivity of the herd, and so profitability per cow. Since a uniform
rate of interest was charged for all borrowers, the variable interest rate was dropped.
3.5.3 Descriptive characteristics of some of the data
Some descriptive statistics were computed to give a general overview of the data. In
this section, the arithmetic means and standard deviations, and the characteristics of
the basic and dummy variables based on the differences in gender are presented.
The arithmetic means and the standard deviations
The arithmetic means and the standard deviations were computed for distance from
the branch, age, household size, experience, education, herd size, land area, proportion
of exotic cattle, loan size and repayment rate, in order to show the central tendency
and the spread of the data around the means. The results are summarised in Table 3.1.
Table 3.1: Summary characteristics of the whole data set (n = 105)
Variable Abbreviation Mean Standard deviation
Distance from branch (km) KM 36.62 20.04
Age (y) AGE 41.23 11.28
Household size (no.) HSZ 9.56 5.79
Experience (y) EXP 7.64 9.62
Education (y) EDU 9.94 4.02
Herd size (no.) HER 8.48 14.49
Land area (ha) LAN 11.28 25.85
Exotic (%) PEXO 84.17 29.38
Loan size (U Shs '000) SIZE 527.27 486.86
Repayment rate (%) RATE 41.6 38.0

54
Characteristics of the basic variables based on differences in gender
The characteristics of the basic variables based on differences in gender were
computed, in support of the objective of the study which is to look at the differences
in the sizes of loans allocated to borrowers and the loan repayment rates of the latter
due to gender.
Table 3.2 gives the means and standard deviations (in columns 2 and 3) for different
variables for men and women borrowers. The values were used to construct a bar
chart, presented as Figure 3.1, to exhibit the differences between the genders. The
differences that were outstanding in the chart were that women stayed further away
from the branches, were less experienced in dairy farming, had smaller land areas and
herd sizes, kept a higher percentage of exotic breeds and repaid worse than the men
borrowers.
The differences between the means by gender were statistically tested using the t-test.
The formulae used are in Appendix 3. Table 3.2 presents the t-values (column 5) used
to test the hypothesis that there is no difference between the means of the variables for
men and women.
From Table 3.2 and at the 5% level of significance, it was concluded that, on average,
women lived further away from the branch; were less experienced in dairy farming
and had smaller herd sizes, than the men. However, differences between women and
men borrowers in terms of age, household sizes, education, land areas allocated to
dairy enterprises, proportion of exotic cattle in herds, sizes of loans and repayment
performance, were not significant at the 5% level.
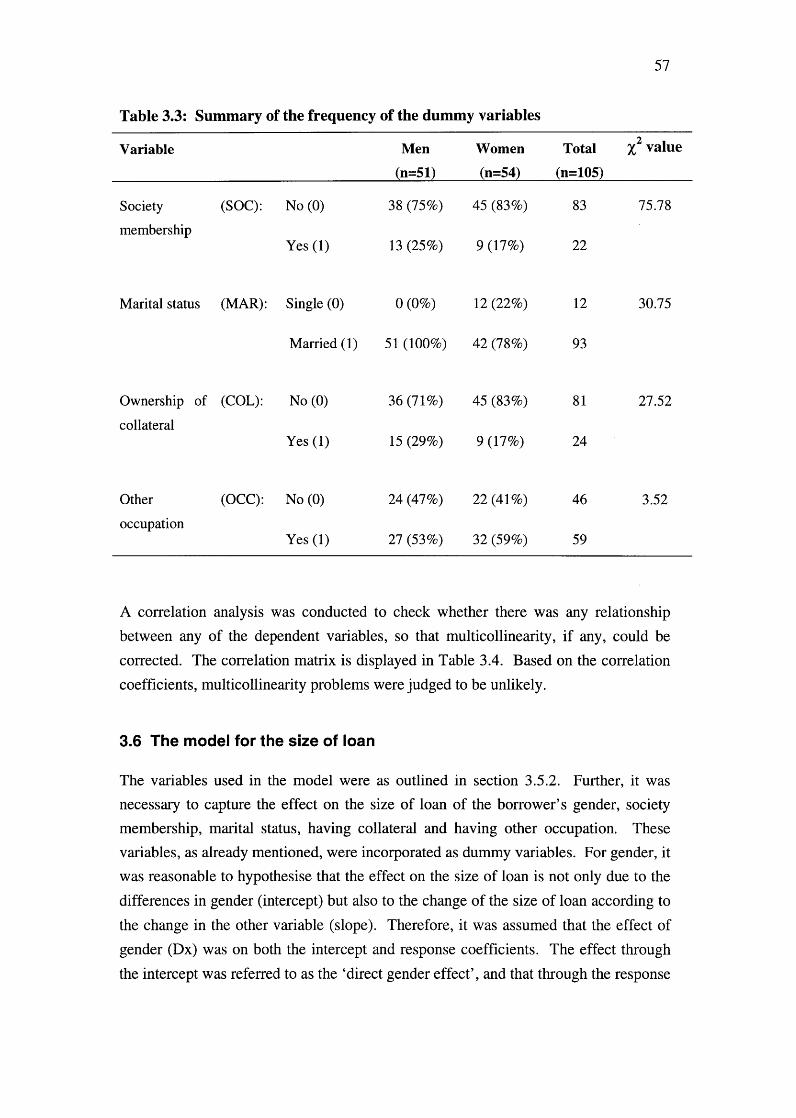
Frequency distribution of the dummy variables
The frequencies of the dummy variables, based on gender, are presented in Table 3.3.
A chi-square (x 2) test of independence was conducted to investigate whether there was
any independence between gender and each of the dummy variables. The method
used is presented in Appendix 4. The critical x2 value at one degree of freedom and
5% level of significance is 3.84. The results of the chi-square test indicated that, at
the 5% level of significance, women borrowers were less likely to be society
members, more likely to be single, less likely to own collateral, and less likely to have
some other occupation.

Table 3.2: Summary of characteristics of men and women borrowers
Variable Means Degrees offreedom
t-value Critical t-value(5%)
(5) (6)(1)Men(2)
Women(3) (4)
KM 30.43 42.47 101 -3.23 1.984
(17.19) (20.91)
AGE 42.84 39.06 102 1.64 1.983
(110.77) (11.64)
HSZ 9.65 9.48 80 0.14 1.990
(7.15) (4.20)
EXP 10.78 4.67 85 3.38 1.988
(10.93) (7.09)
EDU 10.26 9.65 102 0.77 1.983
(4.13) (3.93)
LAN 14.18 8.54 83 1.11 1.989
(31.08) (19.59)
HER 12.04 5.11 58 2.45 1.987
(19.46) (5.58)
PEXO 81.04 87.13 102 -1.06 1.984
(29.83) (28.90)
SIZE 513.13 540.62 100 -0.29 1.984
(519.15) (458.79)
RATE 47.43 36.00 99 1.55 1.984
(40.0) (35.00)
55

Figure 3.1: Differences in the arithmetic mean values of non-dummy variables for men and women borrowers
90
80
70
60
50Units
40
30
20
10
0KM
AGE
HSZ
EXP
EDU LAN
HER PEXO SIZE RATE
Variables
ID Men D Women
57
Table 3.3: Summary of the frequency of the dummy variables
Variable Men
(n=51)
Women
(n=54)
Total
(n=105)
x2 value
Society
membership
(SOC): No (0) 38 (75%) 45 (83%) 83 75.78
Yes (1) 13 (25%) 9 (17%) 22
Marital status (MAR): Single (0) 0 (0%) 12 (22%) 12 30.75
Married (1) 51 (100%) 42 (78%) 93
Ownership of (COL):
collateral
No (0) 36 (71%) 45 (83%) 81 27.52
Yes (1) 15 (29%) 9 (17%) 24
Other
occupation
(OCC): No (0) 24 (47%) 22 (41%) 46 3.52
Yes (1) 27 (53%) 32 (59%) 59
A correlation analysis was conducted to check whether there was any relationship
between any of the dependent variables, so that multicollinearity, if any, could be
corrected. The correlation matrix is displayed in Table 3.4. Based on the correlation
coefficients, multicollinearity problems were judged to be unlikely.
3.6 The model for the size of loan
The variables used in the model were as outlined in section 3.5.2. Further, it was
necessary to capture the effect on the size of loan of the borrower's gender, society
membership, marital status, having collateral and having other occupation. These
variables, as already mentioned, were incorporated as dummy variables. For gender, it
was reasonable to hypothesise that the effect on the size of loan is not only due to the
differences in gender (intercept) but also to the change of the size of loan according to
the change in the other variable (slope). Therefore, it was assumed that the effect of
gender (Dx) was on both the intercept and response coefficients. The effect through
the intercept was referred to as the 'direct gender effect', and that through the response
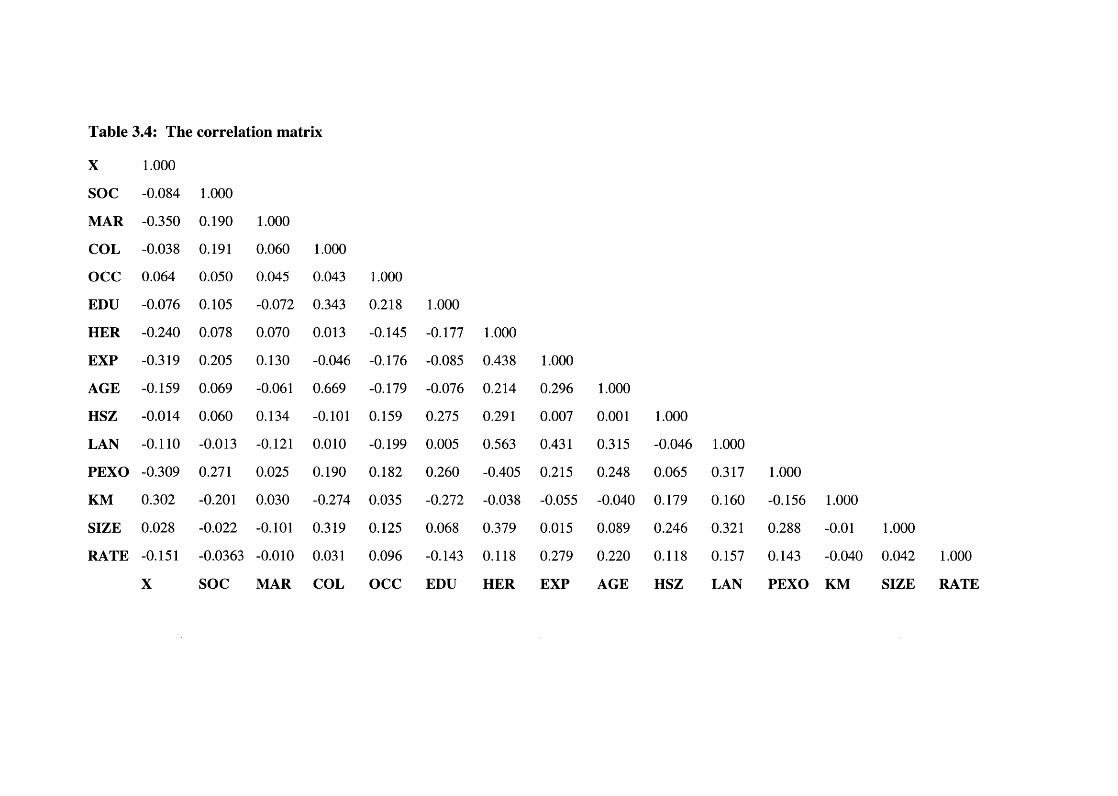
Table 3.4: The correlation matrix
X 1.000
SOC -0.084 1.000
MAR -0.350 0.190 1.000
COL -0.038 0.191 0.060 1.000
OCC 0.064 0.050 0.045 0.043 1.000
EDU -0.076 0.105 -0.072 0.343 0.218 1.000
HER -0.240 0.078 0.070 0.013 -0.145 -0.177 1.000
EXP -0.319 0.205 0.130 -0.046 -0.176 -0.085 0.438 1.000
AGE -0.159 0.069 -0.061 0.669 -0.179 -0.076 0.214 0.296 1.000
HSZ -0.014 0.060 0.134 -0.101 0.159 0.275 0.291 0.007 0.001 1.000
LAN -0.110 -0.013 -0.121 0.010 -0.199 0.005 0.563 0.431 0.315 -0.046 1.000
PEXO -0.309 0.271 0.025 0.190 0.182 0.260 -0.405 0.215 0.248 0.065 0.317 1.000
KM 0.302 -0.201 0.030 -0.274 0.035 -0.272 -0.038 -0.055 -0.040 0.179 0.160 -0.156 1.000
SIZE 0.028 -0.022 -0.101 0.319 0.125 0.068 0.379 0.015 0.089 0.246 0.321 0.288 -0.01 1.000
RATE -0.151 -0.0363 -0.010 0.031 0.096 -0.143 0.118 0.279 0.220 0.118 0.157 0.143 -0.040 0.042 1.000
X SOC MAR COL 0CC EDU HER EXP AGE HSZ LAN PEXO KM SIZE RATE

59
coefficient as 'the gender interaction effect'. These effects were defined in section
3.2. In the case of the other dummy variables, it was assumed that the effect on size
of loan was only through the intercept term.
The model for the loan allocation was specified as follows:
SIZE; = (asi + as2Dxi + ocs3DSOCi + as4DMARi + as5DCOLi + as6DOCCi) +
(Osi + (3s2Dxi) EDUi + Osi + lis2Dxj) HERi + (Os i + 0s2Dxj) EXPi +
(Es i + Es2Dxj) logAGEi + (Xs i + A.s2Dxj) HSZ + (11si + 11s2Dxi) LANi+
(Psi + Ps2Dxi) PEX0i+ ((ps i + (Ps2Dxi) KMi+ ei(3.1)
where
SIZE = the size of loan disbursed to borrowers reported in thousands of Uganda
shillings (1000 Uganda shillings a--1 US dollar).
asi = the constant intercept coefficient.
Dx = dummy variable for gender, with 0 = man and 1 = woman.
as2 = the intercept coefficient for gender. A positive sign was expected, since the
scheme claims to favour women (see section 2.13).
DSOC = whether or not the borrower is a member of a group, such as a farmers' union
or cooperative. It is a dummy variable where 0 = not a society member and 1 =
is a society member.
as3 = the intercept coefficient for society membership. A positive sign was expected
since society members may have a higher capacity to repay (see section 3.3.2).
DMAR = the dummy variable for the marital status of the borrower with 0 = single
and 1 = married. Since each borrower had at least one child (see data set in
Appendix 1), single borrowers were assumed to be heads of households.
as4 = the intercept coefficient for marital status. A negative sign was expected,
meaning that single people receive larger sizes of loans than married people
since the latter may have a lower capacity to repay (see section 3.3.2).
DCOL = the dummy variable for collateral, where 0 = has no collateral, that is she or
he used guarantors to secure the loan, and 1 = has collateral. Since there is the
option of using guarantors, having no collateral does not necessary mean that the

60
borrower owns no assets to present as collateral. The borrowers may choose to
use guarantors as a matter of preference.
as5 = the intercept coefficient for collateral. A positive sign was expected, implying
that the bank awards larger loans to borrowers with collateral since such loans
are seen as less risky than those where there is no collateral (see section 3.3.4).
DOCC = the dummy variable for other occupation, with 0 = borrower has no other
occupation and 1 = borrower has some other occupation. The latter could be in
the form of farm, non-farm and off-farm activities. Other farm activities could
include other livestock activities such as sheep or poultry farming, or cultivation
of cash and or food crops. Off-farm activities may entail retail trade, tailoring,
local brewing and honey collecting. Non-farm activities reported include
carpentry, engineering, manufacturing, crafts, voluntary work, accountancy,
transport, lawyer, civil servants, secretaries, teaching, nursing and brick making.
OCS6 = the intercept coefficient for other occupation. A positive sign was expected
since borrowers with other occupation are likely to have a higher capacity to
repay due to other sources of financial inflows apart from the dairy enterprise.
EDU = education in years. The education levels of the borrowers were initially
reported according to the highest grade they attended. In order to use this
variable in the analysis, the total number of years of education received by each
borrower were estimated, based on the Uganda education system, that is, 16
years for university level, 15 years for post advanced level, 13 years for
advanced level, 11 years for ordinary level, 8 years for junior secondary level
and 7 years for primary level.
1 s1 = the slope coefficient for education. A positive sign was expected since the level
of education was expected to enhance business performance (see section 3.3.2).
1352 = the coefficient for the interaction between gender and education. There was no
a priori expectation for this coefficient.
HER = herd size. Herd size comprised the total indigenous stock and the exotic
livestock owned.
is i = the coefficient for herd size. Borrowers with larger herds are likely to need more
money, and to be considered as more creditworthy than those with smaller herds
(see section 3.3.3). Thus a positive sign was expected, to indicate a positive
relationship between loan size and herd size.

61
7s2 = the coefficient for the interaction between gender and herd size. There was no a
priori expectation for this coefficient.
EXP = experience of the borrower in dairy farming, in years.
0S1 = the slope coefficient for experience. A positive sign was expected, to imply that
the more experienced a borrower is in a project, the more cash inflows and
therefore the more successful will the business be. One would expect an
experienced borrower to have a higher capacity to repay.
6S2 = the coefficient for the interaction between gender and experience. There was no
a priori expectation for this coefficient.
logAGE = the age of the borrower was expressed in years. The relationship between
age and size was not expected to be linear. The variable was expected to enter
non-linearly. However, a number of non-linear formulations were tried and the
log form was found to give best results. Therefore, the log form was retained.
Esi = the coefficient for the log of age. A positive sign was expected, to mean that the
size of loan increases with age but at a decreasing rate.
ES2 = the coefficient for the interaction between gender and log of age. There was no
a priori expectation for this coefficient.
HSZ = the total number of members in the household including the borrower.
XS1 = the slope coefficient for household size. A positive sign was expected. There
is evidence that farmers with larger household sizes may benefit from having
more family labour (Hilhorst and Oppenoorth 1992). Moreover, the larger the
household size, the more serious a borrower may be to succeed in an enterprise
and to repay.
Xs2 = the coefficient for the interaction between gender and household size. There was
no a priori expectation for this coefficient.
LAN = the area of the land in hectares that the borrower allocated to the dairy
enterprise.
= the slope coefficient for land area. Land may be considered as capital by the
bank (see section 3.3.3). Therefore, the size of loans may increase with
marginal increases in the land allocated to dairy enterprises by borrowers. A
positive sign was expected between land area and loan size.
62
T152 = the coefficient for the interaction between gender and land area. There was no a
priori expectation for this coefficient.
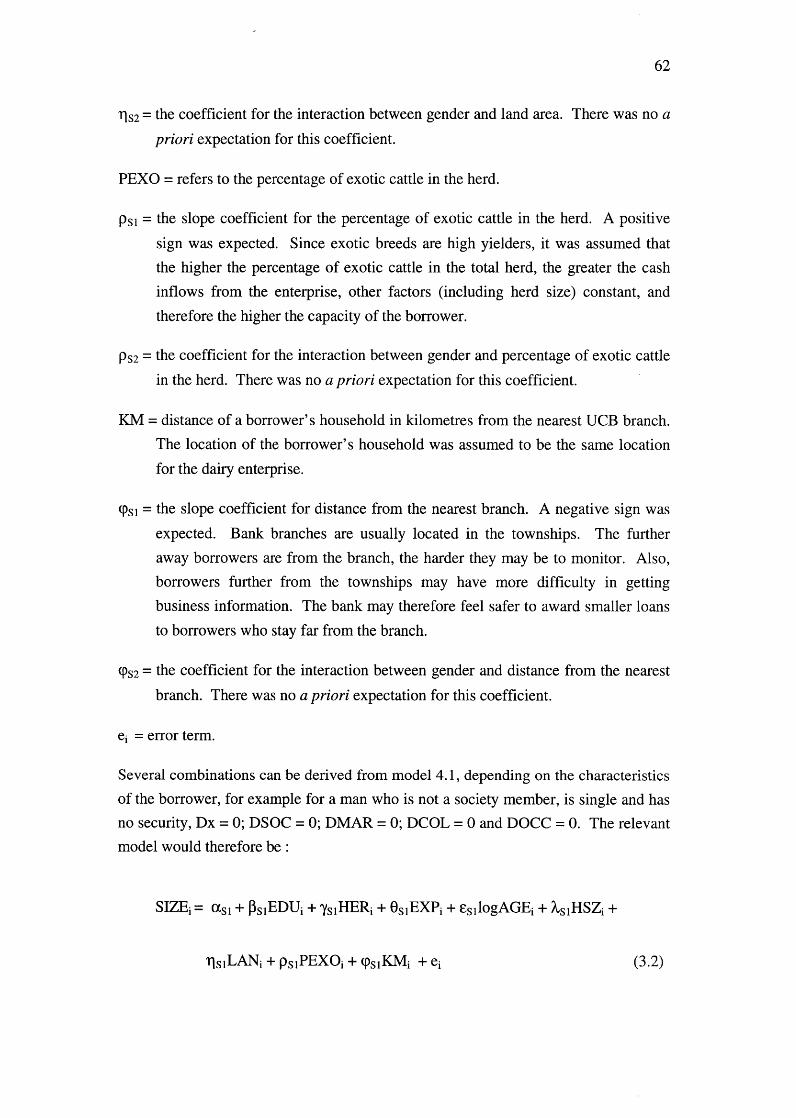
PEXO = refers to the percentage of exotic cattle in the herd.
Psi = the slope coefficient for the percentage of exotic cattle in the herd. A positive
sign was expected. Since exotic breeds are high yielders, it was assumed that
the higher the percentage of exotic cattle in the total herd, the greater the cash
inflows from the enterprise, other factors (including herd size) constant, and
therefore the higher the capacity of the borrower.
PS2 = the coefficient for the interaction between gender and percentage of exotic cattle
in the herd. There was no a priori expectation for this coefficient.
KM = distance of a borrower's household in kilometres from the nearest UCB branch.
The location of the borrower's household was assumed to be the same location
for the dairy enterprise.
(Psi = the slope coefficient for distance from the nearest branch. A negative sign was
expected. Bank branches are usually located in the townships. The further
away borrowers are from the branch, the harder they may be to monitor. Also,
borrowers further from the townships may have more difficulty in getting
business information. The bank may therefore feel safer to award smaller loans
to borrowers who stay far from the branch.
(Ps2 = the coefficient for the interaction between gender and distance from the nearest
branch. There was no a priori expectation for this coefficient.
ei = error term.
Several combinations can be derived from model 4.1, depending on the characteristics
of the borrower, for example for a man who is not a society member, is single and has
no security, Dx = 0; DSOC = 0; DMAR = 0; DCOL = 0 and DOCC = 0. The relevant
model would therefore be :
SIZE; = as i + Os iEDUi + 'ys i HERi + Os i EXPi + Es i logAGEi + Xs iHSZi +
isi l-Ai + ps i PEX0i + 9S1 1(Mi + ei(3.2)

63
For a woman who is a society member, married and has security,
Dx = 1; DSOC = 1; DMAR 1; DCOL = 1 and DOCC = 1. The relevant model
would then be:
= -S1 + -S2 S3 • as4+ ass aS6) (PS1 + Ps2) EDUi +SIZEi (ct + a + +
(7si + 7s2) HER; + (0s 1 + 0s2) EXPi + (esi + ES2) logAGEi +
(Xsi + 2 s2) HSZi + (Tisi + 11S2) LAN;
((Psi + (Ps2) KM; + ei (3.3)
3.7 The model for loan repayment
The model for the loan repayment rate was specified as follows:
RATE; . la + a Dx + ocR3DSOCi
.-R1 —R2- -i + aR4DMARi + ocR5DCOLi + ocR( DOCCi) +
(13R1 + 3R2 Dx;) EDUi + Ov. I R1 + 'YR2DXi) HER; + (ORI + OR2Dxj) EXPi +
(eRi + ER2Dxi) logAGE; + (XR1 + 42Dxi) HSZ; + (I1RI + 11R2DX1) LAN +
(PR1 + PR2Dxi) PEX0i + ((pm+ (PR2Dxi) KM; + ui (3.4)
where
RATE = the loan repayment rate of the borrower.
The loan repayment rate was calculated as follows:
Repayment received
Repayment rate = x 100Repayment expected
where the repayment received is the sum of the amount repaid in years 1, 2 and
3. The repayment expected is the sum of the repayment received and the
balance outstanding. The data set included the balance outstanding at the end of
the three-year term for each loan, as well as the amount repaid per year for each
of the three years.
a R1 = the constant intercept coefficient.
+ (Psi + Ps2) PEX0i +
(3.5)

64
Dx, DSOC, DMAR, DCOL, DOCC, EDU, HER, EXP, logAGE, HSZ, LAN, PEXO
and KM are as defined for model 3.1
aR2 = the intercept coefficient for gender. A positive sign was expected since
literature indicates that women are better repayers than men (Berger 1989,
Hilhorst and Oppenoorth 1992).
OGR3 = the intercept coefficient for society membership. A positive sign was expected
since society members may have a higher capacity to repay (see section 3.3.2).
aR4 = the intercept coefficient for marital status. A negative sign was expected,
meaning that single people may repay better than married people (see section
3.3.2).
aR5 = the intercept coefficient for collateral. A positive sign was expected implying
that borrowers who have staked collateral may repay better than those who have
not, to avoid losing assets in the event of default (see section 3.3.4).
OCR6 = the intercept coefficient for other occupation. A positive sign was expected
since borrowers with other occupation are likely to have more sources of cash
inflow, and therefore a higher capacity to repay, than those with no other
occupation.
(3R1 = the slope coefficient for education. A positive sign was expected, to indicate
that more educated borrowers may repay better than the less educated ones due
to the former having the required literacy and numeracy skills to operate a
business. Their comparatively higher cash inflows would enhance their capacity
to repay.
OR2 = the coefficient for the interaction between gender and education. There was no
a priori expectation for this coefficient.
YR 1 = the slope coefficient for herd size. A positive sign was expected indicating that
the larger the herd size, the greater would be the net worth of the enterprise, and
therefore the ability of the borrower to repay, other things being equal.
7R2 = the coefficient for the interaction between gender and herd size. A negative sign
was expected. The expansion in herd sizes would mean that the workload of the
women increased, since women would still have to fulfil their reproductive
roles. Therefore, the women may not be able to attend optimally to the
management demands of the expanding enterprise, unlike the men. One would

65
therefore expect that, for a marginal increase in herd size, women borrowers will
repay less than men borrowers, ceteris paribus
OR 1 = the slope coefficient for experience. A positive sign was expected since more
experience in dairying could transform into higher profitability of an enterprise
and therefore higher capacity to repay, other things being constant.
6R2 = the coefficient for the interaction between gender and experience. A positive
sign was expected, implying that for a marginal increase in experience, women
borrowers repay better than men borrowers, other things being constant. The
management of dairy cattle in a household is usually a woman's responsibility,
as is the processing of milk into ghee, cheese, and other dairy products.
Moreover, women do have hands-on experience in the management of such
enterprises since they can not usually afford to hire labour to tend the cattle,
unlike the men. Therefore, operations of an enterprise are likely to be enhanced
by the experience of women entrepreneurs.
ER1 = the slope coefficient for the log of age.
ER2 = the coefficient for the interaction between gender and log of age. A negative
sign was expected. The older a women gets, the more reproductive obligations
she may have to meet, for instance with an increasing number of children and
extended family, such as grandchildren. Also, older women may have more
community roles to fulfil, such as funerals, weddings, village meetings and other
requirements.
XR 1 = the slope coefficient for household size. There was no a priori expectation
about the sign of this coefficient. A positive sign would indicate that
households save on production costs due to family labour. A negative sign
would indicate that families incur high household expenditures due to larger
household sizes, therefore finding it hard to repay the loan.
42 = the coefficient for the interaction between gender and household size. A
positive sign was expected. According to Hilhorst and Oppenoorth (1992),
there is close complementarity in the labour of women and children, with
mothers sharing tasks with their older offspring. One would therefore expect
the marginal labour costs incurred by women borrowers to be lower than those
incurred by men, other things being constant.
11111 = the slope coefficient for land area. A positive sign was expected since
borrowers with larger land areas are expected to be more willing to repay, due to

66
status. Also, since they are usually wealthier, they are likely to have a higher
capacity to repay.
11 R2 = the coefficient for the interaction between gender and land area. A negative sign
was expected, meaning that for a marginal increase in land area, women
borrowers repay worse than men borrowers, ceteris paribus. Evidence indicates
that the women's land tends to be of poorer quality than that of men (Hilhorst
and Oppenoorth). Therefore, the pasture grown on this land may not be as good,
resulting in poor milk yields. Further, the larger the land area, the harder it may
be for the women to manage the resource, due to the demands of the
reproductive sphere.
PR1 = the slope coefficient for the percentage of exotic cattle in the herd. A positive
sign was expected, to indicate that, since exotic breeds are high yielders, the
higher the percentage of exotic cattle in the total herd, the greater the cash
inflows from the enterprise, other factors constant, and therefore the higher the
capacity of the borrower.
PR2 = the coefficient for the interaction between gender and proportion of exotic
cattle. A negative sign was expected, implying that for a marginal increase
(decrease) in the proportion of exotic cattle in a herd, women borrowers repay
worse (better) than men borrowers, other things being equal. Exotic cattle
demand special care, such as tick-control. Failure to perform these activities
would reduce the milk yield of these animals, leading to decreased profitability
of the enterprise. Women may find it hard to combine these activities with their
reproductive activities due to the higher burden associated with managing exotic
breeds.
(PRI = the slope coefficient for distance from the nearest branch. A negative sign was
expected, meaning that the further away the borrower is from the branch, the
poorer the market infrastructure, and therefore the less may be the sales.
Consequently, their cash inflows may be reduced and hence their capacity to
repay.
(PR2 = the coefficient for the interaction between gender and distance from the nearest
branch. A negative sign was expected, implying that for a marginal increase
(decrease) in the distance the enterprise is from the branch, women borrowers
will repay worse (better) than men borrowers, ceteris paribus. As already
mentioned, the remoteness of an enterprise may affect a woman's business more

67
than it does a man's due to the physical immobility that women encounter as a
result of their reproductive roles.
ui = error term.
As in the case of the model for the size of loan allocated, several combinations could
be derived from model 3.4, depending on the characteristics of the borrower. For
example, for a man who is not a society member, is single, has no security, and has no
other occupation, Dx = 0; DSOC = 0; DMAR = 0; DCOL = 0 and DOCC = 0. The
relevant model would be:
RATEi = ocRi + J3R1 EDUj + l'Ri fIERt + ORiEXPt + eRi logAGEi + XRMSZi
+ 110-AN, + pRiPEX0i + (pRi l(Mi + ui (3.6)
For a woman who is a society member, married and has security,
Dx = 1; DSOC = 1; DMAR = 1, DCOL = 1 and DOCC = 1. The relevant model
would then be:
RATEi = (nt + a + a + a + aR 5 + nt 1+ (R.-R1 - -R2 -R3 R4 R5 • --R6. - \rR1 ÷ ORD EDUi +
(yRi + PYR2) HERi + (Om+ 0R2) EXPi + (ERi + ER2) logAGEi +
(XR1 + XR2) HSZi + (11R1 + 11R2) LANi + (PR1 + PR2) PEX0i +
((Pm + (PR2) KM ., + ui (3.7)
3.8 The methods of analysis
The models 3.1 and 3.4 were both assumed to be linear in all parameters. If the errorterms in each of the models were well behaved, that is e t–N(0, (52), the use of ordinary
least squares for each model would have been possible and would have given the best
linear unbiased estimator.
For model 3.1, it seemed reasonable to assume that the error term was well-behaved
and that the method of ordinary least squares could be used to estimate it. For model
3.4, the range of the dependent variable of loan repayment rate was constrained to be
either positive or zero. The observations at zero corresponded to borrowers who do
not repay the loan. In cases where the dependent variable is constrained in some way,
the use of OLS gives biased estimators (Amemiya 1985, p. 367). A model where the

68
dependent variable is constrained or limited to some values is called a Tobit model. It
is sometimes known as a censored regression model.
Tobit model
Consider the linear regression model
yi = x11
(3 + e i ei – N(0, (72)
where
yi = the observed repayment rate when it is positive but unobserved when it is
negative. It can be viewed as reflecting the creditworthiness (willingness
and ability to repay of a borrower).
In practice, when y1 is unobserved, the value zero is assigned. Therefore, the value of
y is used instead, where
yi = yi if y 0
yi =0 <0
*The use of y1 instead of y implies that only observations for which e i is greater than
p) lead to an observed dependent variable. Therefore, the distribution of e i is a
truncated normal distribution and its mean is not zero. This destroys the required
assumption on e i for OLS to give a best linear unbiased estimator.
Among the methods suggested in the literature to estimate the Tobit model, maximum
likelihood estimation is the most widely used (Thomas 1993). The likelihood
function for the Tobit model is specified as:
L= 11(1/6) f yi -
no F ( x'.
where H, is the product over those i for which y > 0;
1-1 0 is the product over those i for which y = 0;
f(-) is the density function; and
F(•) is the distribution function.

69
The Shazam econometrics package was used for the estimation.
3.9 Concluding remarks
In this chapter, the factors that affect creditworthiness, the data set, the models used in
the analysis and the analytical method were outlined. The results of OLS and Tobit
estimation of the two models are presented in the following chapter.

70
4. Empirical results and discussion
4.1 Introduction
In this chapter, the empirical results from the analyses for the loan size and repayment
rate relationships are presented and discussed. Predictions of the loan sizes and
repayment rates of borrowers with average characteristics are also presented and
discussed. Finally, a comparison of the two relationships is provided.
4.2 Analysing the loan size relationship
In section 3.3, some of the variables likely to affect loan size were discussed. In this
section, the model for loan size was estimated using some of the variables
conceptualised as key determinants of the size of loans allocated to borrowers in
section 3.3. Model 3.1 (see section 3.6) was used in this analysis.
4.2.1 Results of estimating the model for loan size
Econometric regression, using ordinary least squares, was used to obtain the values of
the coefficients in the model for loan size. The results of estimating the model are
reported in Table 4.1.
The t-test (see appendix 5) was used to identify the significant coefficients.
According to the results displayed in Table 4.1, five coefficients were significant and
seventeen were not significant at the 5% level of significance, with 83 degrees of
freedom.
The significant coefficients were for society membership, collateral, herd size,
experience and the log of age. The coefficients for the constant, gender, marital
status, other occupation, education, household size, land area, percentage of exotic
cattle in the herd and the distance from the branch were not significant. Also, all the
coefficients for gender interactions were not significant.
The signs of the variables in accordance with the a priori expectations (mentioned in
section 3.6) were those for gender, marital status, collateral, other occupation,
education, herd size, log of age, household size, percentage exotic cattle in the total
herd and distance from the nearest branch.

71
Table 4.1: Coefficient estimate results of the model for loan size
Variable
ConstantGenderSociety membershipMarital status
CollateralOther occupationEducationGender and education
Herd sizeGender and herd sizeExperienceGender and experience
Log of ageGender and log of ageHousehold sizeGender and householdsize
Land areaGender and land area% exotic cattleGender and % exoticcattle
Distance from branchGender and distancefrom branch
Abrrev- Coeffi-iation dent
as 1X aS2S OC aS3MAR as4
COL aS5OCC aS6EDU 13s1DxEDU 13s2
HER 'Ys iDxHer 7S2EXP OS1DxEXP OS2
lAGE ES iDx1AGE ES2HSZ ?LSIDxHSZ XS2
LAN lls iDxLAN 1152PEXO PsiDxPEXO PS2
KM (PsiDxKM (PS2
EstimatedCoefficient
Standarderror
t-value
-2265.60 1258.00 -1.802715.10 1440.00 1.89-241.56* 118.80 -2.03-125.72 160.10 -0.79
277.68* 111.20 2.5061.57 92.53 0.6710.22 17.51 0.58
1.21 26.59 0.05
28.23* 8.57 3.30-20.50 18.45 -1.11-15.04* 7.25 -2.0720.47 12.66 1.62
676.53* 328.80 2.06-702.81 371.50 -1.89
15.15 10.79 1.4019.32 19.39 1.00
-5.50 4.13 -1.3310.41 6.12 1.703.21 2.51 1.28
-5.31 3.63 -1.46
-8.92 5.13 -1.745.84 5.73 1.02
*Significant t-value at 5% level.
Critical t-value = 1.99 at 83 degrees of freedom.-
R2 = 0.44 R2 =0.32
72
The variables whose signs were different from those stipulated in the a priori
expectations were those for society membership, experience and land area.
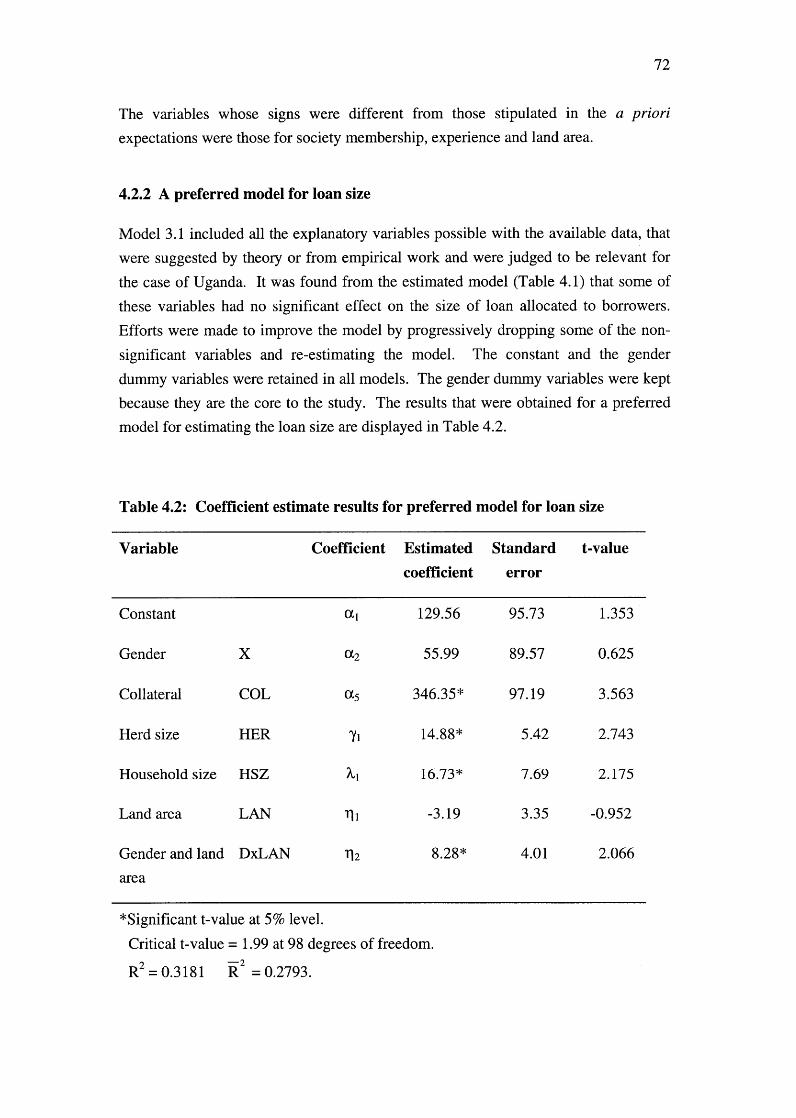
4.2.2 A preferred model for loan size
Model 3.1 included all the explanatory variables possible with the available data, that
were suggested by theory or from empirical work and were judged to be relevant for
the case of Uganda. It was found from the estimated model (Table 4.1) that some of
these variables had no significant effect on the size of loan allocated to borrowers.
Efforts were made to improve the model by progressively dropping some of the non-
significant variables and re-estimating the model. The constant and the gender
dummy variables were retained in all models. The gender dummy variables were kept
because they are the core to the study. The results that were obtained for a preferred
model for estimating the loan size are displayed in Table 4.2.
Table 4.2: Coefficient estimate results for preferred model for loan size
Variable Coefficient
Constant al
Gender X a2
Collateral COL a5
Herd size HER l'i
Household size HSZ Xi
Land area LAN
Gender and land DxLAN
area
Estimated
coefficient
Standard
error
t-value
129.56 95.73 1.353
55.99 89.57 0.625
346.35* 97.19 3.563
14.88* 5.42 2.743
16.73* 7.69 2.175
111 -3.19 3.35 -0.952
112 8.28* 4.01 2.066
*Significant t-value at 5% level.
Critical t-value = 1.99 at 98 degrees of freedom.
R2 = 0.3181 R2 = 0.2793.

73
The preferred model for loan size exhibited the existence of significant socioeconomic
effects of collateral, herd size and household size, and a gender interaction effect with
land area.
The coefficient of the intercept term (a 1 ) was found to have a positive sign and a
value of 129.56. This might be interpreted to mean that the size of loan allocated to
borrowers was U Shs 129 560 when all other coefficients were equal to zero.
However, Griffiths, Hill and Judge (1993, p. 187) cautioned that intercept estimates
should be interpreted with care. They recommended that, if the data set does not
include any observations in the region where the independent variable is zero, as in
this case, the estimated relationship may not be good approximation to reality in that
region. The intercept term was not significant at the 5% level of significance.
The coefficient for gender (a2) had a positive sign and a value of 55.99. This implies
that the size of loan allocated was U Shs 55 990 more when the borrowers were
women than men, when other factors were constant. This was consistent with the
argument that the scheme gave larger sizes of loans to women than to men, ceteris
paribus, since the scheme aimed to favour women. However, the coefficient was not
significant at the 5% level.
The coefficient for the dummy for collateral (a5) had a positive sign, with a value of
346.35. This implies that the change in the size of loan was U Shs 346 350 higher for
a borrower who had collateral than for one who had no collateral, when all other
factors were constant. The sign of this coefficient was consistent with the argument
that borrowers with collateral were considered to be less likely to default than those
without collateral and, therefore, would be awarded larger loans. The coefficient was
significant at the 5% level.
The coefficient for the variable herd size (71 ) had a positive sign and a value of 14.88.
This seemed to suggest that the size of loan allocated to the borrowers increased
(decreased) by U Shs 14 880 when the herd size of the borrower increased (decreased)
by one head of cattle, ceteris paribus. The sign of the coefficient was consistent with
the argument that borrowers who had larger herd sizes were considered to require
more money and to be more creditworthy than those with smaller herd sizes. The
coefficient was significant at the 5% level.
The coefficient for the variable for household size (X i ) had a positive sign and a value
of 16.73. This means that the size of loan allocated to the borrowers increased
(decreased) by U Shs 16 730 when the household size increased (decreased) by one
member, ceteris paribus. The sign of the coefficient was consistent with the argument

74
that borrowers who had larger household sizes were considered to be better risks than
those with smaller ones, due to free family labour. The coefficient was significant at
the 5% level.
The coefficient for the variable land area MO had a negative sign and a value of 3.19.
This suggests that the size of loan allocated to the borrowers decreased (increased) by
U Shs 3190 when the land area on which the borrower operates his or her enterprise
increased (decreased) by 1 ha. The sign of the coefficient was inconsistent with
argument that owners of larger land areas would require more money than those with
relatively smaller land areas. However, the coefficient was insignificant at the 5%
level.
The coefficient for the interaction between the land area and gender (1 2) had a
positive sign and a value of 8.28. This implies that the change in the size of loan
when the land area increased (decreased) by 1 ha was U Shs 8280 higher for women
than for men borrowers. The result indicates, therefore, that the size of loan was
reduced by U Shs 3190 for every extra 1 ha of land allocated to dairying by a man, but
was increased by U Shs 8280 — 3190 = 5090 for every extra 1 ha of land allocated to
dairying by women, ceteris paribus. The result suggests that, as the land area
allocated to dairy increased, the scheme favoured women while disfavouring men
borrowers. The results were consistent with one of the objectives of the bank i.e., to
supply credit to those women entrepreneurs who had the potential to expand their
enterprises. However, since the scheme claims to support small farmers as well (see
section 2.13), favouring women farmers with larger areas than those with small was
inconsistent with expectations. The coefficient was significant at the 5% level.
4.2.3 Testing the relevance of gender in the loan size model
The results for the preferred model show that the coefficient for gender was not
significant whilst that for the interaction between gender and land area was
significant. There was need to find out whether the coefficients could both be zero at
the same time. This would imply that gender did not affect the size of loans allocated
to the borrowers. The F-test was conducted to test the hypothesis H0: a- - S2 = 1152 = 0against H 1 : at least either as2 or 11s2 is not zero.
The calculated F-value was 3.133. At 2 and 98 degrees of freedom, and 5% level of
significance, the critical F-value is 3.07. Therefore, H 0 was rejected and H 1 accepted.
Consequently, it was concluded that there was no evidence to show that a2 = 11 2 = 0.

75
Gender was therefore important in determining the sizes of loans allocated to dairy
farmers of the UCB RFS.
4.2.4 Predicting the loan size for borrowers with average characteristics
The results described so far indicate that gender was an important determinant of loan
size. Other important factors were collateral, herd size, household size and land area.
However, gender entered the preferred model for loan size (Table 4.2) in a
complicated way, since the relationship between loan size and land area was positive
for women whilst being negative for men. Therefore, there was no way, from simply
looking at the coefficients, of knowing whether the impact of gender on loan size was
either positive of negative. Further, the estimated impact of gender would depend on
the levels of other socioeconomic variables. Therefore, in order to make some
inferences about the effect of gender on the loan size allocated to borrowers of
average characteristics, estimates of point predictions were computed for two
categories of borrowers, i.e., those with collateral and those with no collateral. The
average values of all the other variables in the data set (as displayed in Table 3.1 i.e.,
regardless of gender), were used, to enable the comparison between these categories
of borrowers. The point estimates were used because, although the estimation of
confidence intervals using OLS would have been easy, the estimation of confidence
intervals using Tobit analysis was beyond the scope of this study (B. Griffiths 1995,
pers. comm.). Consequently, the confidence intervals for both OLS and Tobit
estimates were not computed, for consistency. The results are shown in Table 4.3.
Table 4.3: Prediction estimates for loan size of borrowers of average
characteristics
Category Size of loan (U Shs)
WomenMen
With collateral 726.0
Without collateral 379.7
875.4
529.1
The results from Table 4.3 indicate that the UCB RFS allocated larger loans to women
than to men borrowers in either category. The results are consistent with those
displayed for the loan size variable in Table 3.2. In cases where both men and women

76
had collateral, women borrowers were favoured. The same was true in cases where
both genders had no collateral. Both women and men who had no collateral received
smaller loans, on average, than those with collateral.
4.3 Analysing the repayment rate relationship
As explained in section 3.3 and 3.5, the model for repayment rate was estimated using
the same independent variables as defined for the size of loan, on the assumption that
the same variables affect the repayment rate of borrowers. Consequently, the dummy
variables including gender, and the variables for gender interactions were also
incorporated in the model for the repayment rate. Model 3.4 (see section 3.7) was
used in this analysis.
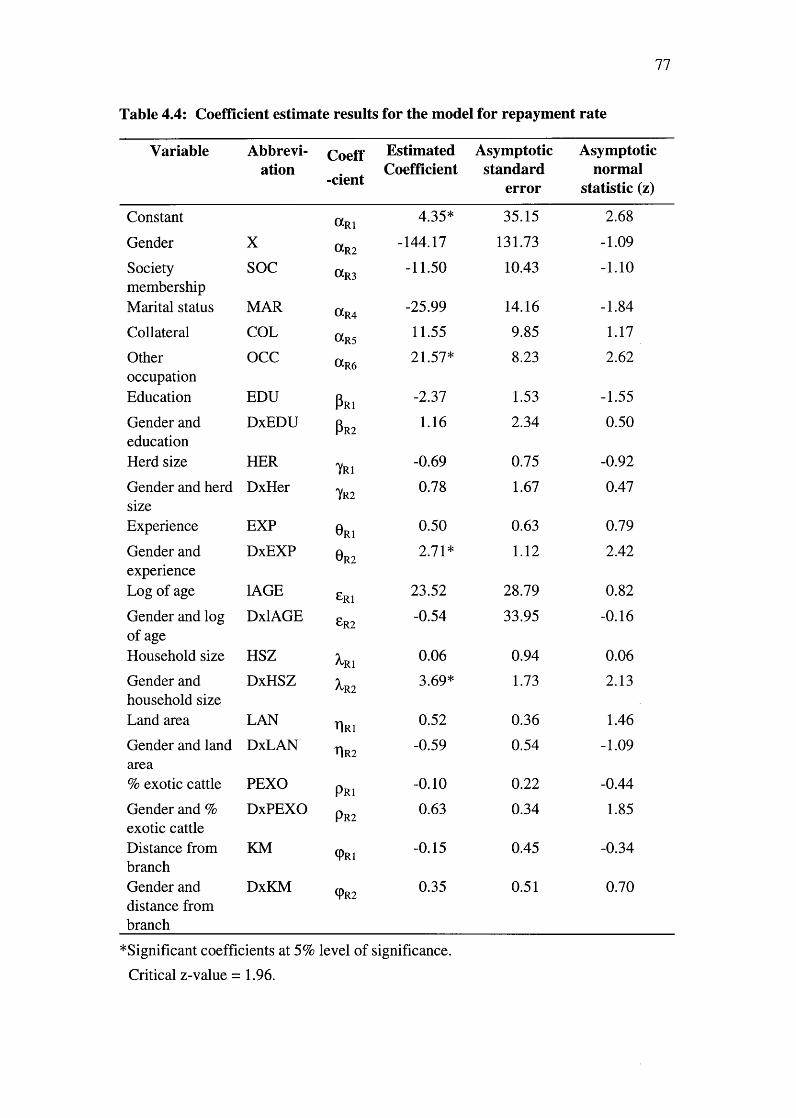
4.3.1 Results of estimating the model for repayment rate
The maximum likelihood estimation applied to the Tobit model, as described in
section 3.8, was used to obtain the values for the coefficients in the model for
repayment rate. The results of estimating the model are reported in Table 4.4.
From Table 4.4, four coefficients were found to be significant and eighteen not
significant, at the 5% level of significance. The significant coefficients were those for
the constant, other occupation, the interactions between gender and experience, and
gender and household size. The coefficients for gender, society membership, marital
status, collateral, education, herd size, experience, log of age, household size, land
area, percentage of exotic cattle in the total herd and distance from the branch were
not significant. Also, the interactions between gender and education, gender and herd
size, gender and log of age, gender and land area, gender and percentage of exotic
cattle in the total herd, and gender and distance from the branch were not significant at
the 5% level.
The signs of the variables in accordance with the a priori expectations (mentioned in
section 3.7) were those for marital status, collateral, other occupation, experience,
land area, distance from the branch and the interactions between gender and
experience, gender and log of age, gender and household size, and gender and land
area.
The variables whose signs were different from those stipulated in the a priori
expectations were gender, society membership, education, herd size, log of age,
77
Table 4.4: Coefficient estimate results for the model for repayment rate
Variable Abbrevi- Coeff Estimated Asymptotic Asymptotication
Coefficient standard normal-cient
error statistic (z)
Constant aRiGender X aR2Society SOC aR3membershipMarital status MAR aR4
Collateral COLaR5
Other OCC aR6occupationEducation EDU
13R1Gender and DxEDU
PR2
educationHerd size HER PYR 1
Gender and herd DxHer 7R2sizeExperience EXP OR1Gender and DxEXP
0122experienceLog of age lAGE ER1
Gender and log Dx1AGEER2
of ageHousehold size HSZ
41Gender and DxHSZ
42household sizeLand area LAN R 11Gender and land DxLAN 1R2area% exotic cattle PEXO PR 1
Gender and % DxPEXO P R2exotic cattleDistance from KM (PRIbranchGender and DxKM (PR2distance frombranch
4.35* 35.15 2.68
-144.17 131.73 -1.09
-11.50 10.43 -1.10
-25.99 14.16 -1.84
11.55 9.85 1.17
21.57* 8.23 2.62
-2.37 1.53 -1.55
1.16 2.34 0.50
-0.69 0.75 -0.92
0.78 1.67 0.47
0.50 0.63 0.79
2.71* 1.12 2.42
23.52 28.79 0.82
-0.54 33.95 -0.16
0.06 0.94 0.06
3.69* 1.73 2.13
0.52 0.36 1.46
-0.59 0.54 -1.09
-0.10 0.22 -0.44
0.63 0.34 1.85
-0.15 0.45 -0.34
0.35 0.51 0.70
*Significant coefficients at 5% level of significance.
Critical z-value = 1.96.

78
percentage of exotic cattle in the herd, and the interactions between gender and herd
size, gender and percentage of exotic cattle in the herd, and gender and the distance
from the branch.
4.3.2 A preferred model for repayment rate
As in the case for selecting a preferred model for loan size, a number of combinations
were tried while retaining the relevant gender variables, in an attempt to obtain a
preferred model for repayment performance. The model is displayed in Table 4.5.
Table 4.5: Coefficient estimate results for preferred model for repayment rate
Variable
Coeffi
- cient
Constant aR 1
Gender X aR2
Marital MAR aR4
status
Other OCC aR6
occupation
Experience EXP OR!
Household HSZ 41size
Gender and DxHSZ XR2
household
size
Estimated
Coefficient
Asymptotic
standard
error
Asymptotic
normal
statistic (z)
38.99 2.99 13.040
-47.90* 17.91 -2.674
-27.56* 13.51 -2.040
12.23 8.06 1.517
1.40* 0.44 3.196
-0.19 0.08 -0.243
3.73* 1.61 2.321
*Significant coefficients at 5% level of significance.
Critical z-value = 1.96.

79
The preferred model for repayment rate exhibited the existence of a direct gender
effect, socioeconomic effects of marital status, other occupation, experience and
household size, and a gender interaction effect with household size.
The coefficient of the intercept term (aRl ) had a positive sign and a value of 38.99.
Strictly speaking, this result would suggest that the repayment rate of borrowers is
38.99 per cent when all other coefficients are equal to zero. Again, the interpretation
of the intercept estimate was treated with caution, for the same reason as given in
section 4.2.2. The intercept term was insignificant at the 5% confidence level.
The coefficient for the dummy for gender (aR2) had a negative sign, with a value of
47.90. This appears to imply that the repayment rate of borrowers was 47.90 per cent
lower when the borrowers were women than men, ceteris paribus. The sign of this
coefficient was inconsistent with the claim that women were better in repayment than
the men. The coefficient was significant at the 5% level.
The coefficient for marital status (a R4) had a negative sign and a value of 27.56, which
implies that the repayment rate of the borrowers was lower by 27.56 per cent for
borrowers who were married, compared with those who were single, when all other
factors were constant. The sign of the coefficient was consistent with the argument
that married borrowers could repay worse than single ones due to the relatively higher
commitments of married people which could, in turn, impose constraints on the
smooth running of the business, for example, time constraint, funerals and other social
obligations. These commitments could also be associated with higher financial costs
and hence using the loan funds for consumption instead of repayment. The coefficient
was significant at the 5% level.
The coefficient for other occupation (aR6) had a positive sign and a value of 12.23.
This seemed to indicate that the repayment rate of the borrowers was higher by 12.23
per cent for borrowers who had some other occupation compared with those who were
only involved in dairy farming, ceteris paribus. The sign of the coefficient was
consistent with assertion that borrowers who had other occupations had other sources
of livelihood and therefore were less likely to divert loan funds into consumption.
Also, in case of poor performance of the dairy projects, income from these other
occupations could be used to repay the loan and or finance the dairy business. The
coefficient was insignificant at the 5% level.
The coefficient for experience (OR! ) had a positive sign and a value of 1.40. This
implies that the repayment rate of the borrowers increased (decreased) by 1.40 per
cent when the experience of the borrower increased (decreased) by one year, when

80
other factors were constant. The sign of the coefficient was consistent with the
argument that borrowers who had more experience in dairy farming would operate
their enterprises better than those with less experience, and hence would be likely to
repay better than those with relatively less experience. Experienced borrowers could
have more business information and contacts, for example with extension agents,
veterinary officers and opinion leaders, who would contribute to the profitability of
the business directly and or indirectly. The coefficient was significant at the 5% level.
The coefficient for household size (4 1 ) had a negative sign and a value of 0.19. This
appeared to imply that the repayment rate of the borrowers decreased (increased) by
0.19 per cent when the household size increased (decreased) by one person, ceteris
paribus. The sign of the coefficient was consistent with the claim that borrowers with
larger household sizes had more commitments and were likely to use the credit for
purposes other than that for which the credit had been allocated, such as consumption
and fees, and so, would have no money for repaying the loan. However, the
coefficient was insignificant at the 5% level.
The coefficient for the interaction between household size and gender (X had a_R2,1
positive sign and a value of 3.73. This seemed to suggest that the change in
repayment rate when household size increased by one person was 3.73 per cent higher
for women borrowers than for men borrowers, when other factors were constant. The
results could be explained by findings from literature (Nalwanga-Sebina and
Natukunda 1988). As discussed in section 2.10.2, it is the duty of the women to
mobilise household labour. Therefore, their enterprises are likely to benefit more
from household labour than those of male borrowers. Also, since dairying is a
woman's responsibility, women have hands-on experience in dairy activities. The
coefficient was significant at the 5% level. The results therefore indicate that the
repayment rate was reduced by 0.19 per cent for every extra increase in household size
by one individual for men borrowers whereas the rate increased by 3.73 - 0.19 = 3.54
per cent for every extra increase in household size by one individual for women
borrowers, ceteris paribus.
4.3.3 Testing the importance of gender in the repayment rate model
Given the results of the preferred model for the rate relationship displayed in Table
4.5, the coefficients for gender and the interaction between gender and household size
were both significant. However, since one of the objective of our study was to
investigate the effects of gender on repayment rate, it was necessary to find out
whether the coefficients for gender could both be zero at the same time. Therefore,
81
the Wald test was conducted to test the hypothesis Ho: aRl R1 = XR2 = 0 against H1: at
least either aRl or XR2 is not zero.
The calculated Wald statistic value was 7.022. At 2 degrees of freedom and 5% level
of significance, the x2 value is 5.99. Therefore Ho was rejected and it was concluded
that gender had an effect on the repayment rate of borrowers.
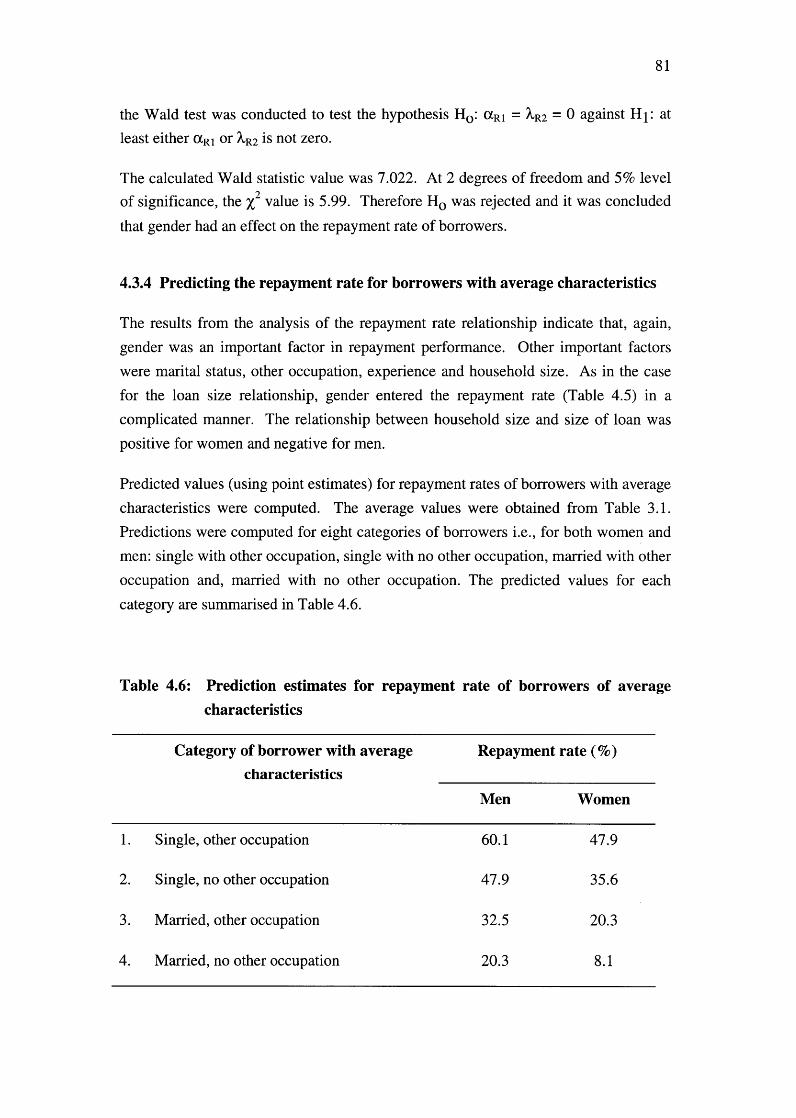
4.3.4 Predicting the repayment rate for borrowers with average characteristics
The results from the analysis of the repayment rate relationship indicate that, again,
gender was an important factor in repayment performance. Other important factors
were marital status, other occupation, experience and household size. As in the case
for the loan size relationship, gender entered the repayment rate (Table 4.5) in a
complicated manner. The relationship between household size and size of loan was
positive for women and negative for men.
Predicted values (using point estimates) for repayment rates of borrowers with average
characteristics were computed. The average values were obtained from Table 3.1.
Predictions were computed for eight categories of borrowers i.e., for both women and
men: single with other occupation, single with no other occupation, married with other
occupation and, married with no other occupation. The predicted values for each
category are summarised in Table 4.6.
Table 4.6: Prediction estimates for repayment rate of borrowers of average
characteristics
Category of borrower with average
characteristicsRepayment rate (%)
Men Women
1. Single, other occupation 60.1 47.9
2. Single, no other occupation 47.9 35.6
3. Married, other occupation 32.5 20.3
4. Married, no other occupation 20.3 8.1

82
The results from Table 4.6 indicate that in all categories, women repaid worse than
men borrowers. Generally, the poor performance of women was consistent with the
general view that Ugandan rural women encounter constraints that may impede the
performance of their income-generating activities. Such constraints may include, for
example, strenuous reproductive responsibilities, inadequate business managerial
skills, poor marketing infrastructure and lack of business information and support
(discussed in section 2.10.2).
The results further indicate that borrowers with some other occupation (apart from
dairy enterprise) repaid better than those with no other occupation. However, women
borrowers who had some other occupation repaid worse than men in the same
category. The findings were consistent with the evidence that, although both men and
women may have some other occupation, the cash inflows of women may be less than
those of men due to the low profitability of the women's occupations (see section
2.10.2).
The results suggest that, single borrowers repaid better than married borrowers.
Implications of this result have already been discussed in section 4.3.2. However,
single women borrowers (female heads of households [see section 3.6]) repaid worse
than single men borrowers (male heads of households). This result was consistent
with the evidence that single men had helpers, such as relatives and or hired servants
to conduct the reproductive activities (UNICEF 1994). Consequently, compared with
their women counterparts, single men borrowers could have a less onerous
reproductive burden than women and therefore more time to commit to dairying. As
discussed in section 2.10.6, female heads of households face comparatively heavier
reproductive burdens.
From the results, it was found that, on average, married women repaid worse than
married men. This finding was consistent with the literature that husbands may
contribute less to household expenditures when wives start income-generating
activities (UNICEF 1994). Such women may divert funds into consumption, thereby
reducing the capacity to repay. Also, there is evidence that women may not control
their income (see 2.10.1 and 2.10.2).
The results also indicate that single women borrowers repaid better than married ones.
Evidence indicates that female heads of households are poorer than marrieds (see
2.10.6). That the former are better repayers than the latter is consistent with the
findings that poorer women are better repayers than those who are not as poor (Berger
1989). Another argument could be that married women have greater social-cultural
obligations, since they, on average, may have larger extended families, than single

83
women. The obligations could reduce the time the women devote to their enterprises
(see section 2.10.2). Also, the poorer performance may be due to the increased
financial obligations that married women encounter, in cases where husbands stop
contributing to household expenses (see section 2.10.3).
4.4 The comparison of the two preferred models
In comparing the preferred model for size of loan allocated to borrowers (Table 4.2)
with that for the repayment rate (Table 4.5), it is clear that, apart from household size,
the factors that the bank focused on when allocating the sizes of loans were different
from those that determined repayment rate amongst borrowers. While the bank
focused on collateral, herd size, household size and land area in determining the size
of loan to allocate to borrowers, the repayment rate was determined by the gender of
the borrower, marital status, other occupation, experience and household size.
4.5 Concluding remarks
The results of the study showed that, for the case of the UCB RFS, gender was
significant in the performance of the scheme. Marital status, other occupation,
experience and household size were also important in repayment performance, while
collateral, herd size, household size, land area and gender were important in
determining the size of loan given to borrowers. On the whole, the scheme favoured
women by giving them larger loans, especially as they allotted more land area to dairy
enterprise. However, women were not repaying as well as men borrowers. Further,
the bank's loan size policy was not conducive to loan repayment performance, since it
did not focus on the factors that were important for loan repayment. The results were
used to suggest some policies, outlined in the next chapter.

84
5. Summary, policy implications andconclusions
5.1 Introduction
This chapter begins with an overview of the results of the study, outlined in the last
chapter. The findings are summarised, the results of testing the hypotheses are
reported and possible explanations of the results are discussed. Policies are
recommended for improving loan repayment performance of women borrowers and
the sustainability of lending of the UCB RFS. The need to incorporate gender issues
in policy formulation, in general, is also highlighted. The limitations of the study and
areas for further research are also presented. Finally, the conclusions from the study
are outlined.
5.2 Overview of the results
5.2.1 Summary of the findings
In this study, two estimation procedures were employed to test the hypotheses stated
in section 1.5. The OLS technique was used to estimate the relationship between
various factors, including gender, and the size of loans allocated to dairy farmers of
the UCB RFS. The maximum likelihood method of estimation was applied to the
Tobit analysis to estimate the relationship between various factors, including gender,
and the loan repayment performance of those farmers. In both estimation procedures,
gender and gender interaction variables were included.
Results from the size of loan model indicated that more money is lent to borrowers
who are women, have collateral and have larger-sized households. The effect of
gender was not significant. The relationship between land area and the size of loan
was found to be negative for men farmers and positive for the women farmers.
Results from the loan repayment model indicated that women repaid less well than
men. Single borrowers, those with other occupation(s) and those with more
experience were found to repay better. The relationship between repayment rate and
household size was negative for men borrowers and positive for women borrowers.

85
The relevance of gender in both models was also assessed, using joint tests (Wald test
and F test). It was found that gender is important in determining both the size of loan
allocated to dairy farmers of the UCB RFS, and their repayment performance.
Results of the predictions of the size of loans allocated to borrowers of average
characteristics indicated that borrowers who are women, or with collateral receive
larger loans than those who are men, or who lack collateral. Results of the predictions
for loan repayment rate indicated that borrowers who are women, married or with no
other occupation repay worse than those who are men, single, or with other
occupation(s).
5.2.2 Testing the hypotheses
In this study, two hypotheses were stated, as outlined in section 1.5. The first
hypothesis was: for dairy farmers receiving loans from the UCB RFS, there is no
effect of gender on the amounts allocated to borrowers when other factors are taken
into account. This hypothesis was rejected because, as explained in section 4.2, the
results from the study indicated that, at the 5% level of significance, there was
evidence to show that for dairy farmers from the UCB RFS, gender, through
interacting with household size, had an effect on the amounts of loans allocated to
borrowers when other factors are constant.
The second hypothesis was: for dairy farmers receiving loans from the UCB RFS,
there is no effect of gender on the loan repayment performance of borrowers when
other factors are taken into account. The hypothesis was rejected since, as outlined in
section 4.3, the results from the study indicated that, at the 5% level of significance,
gender and the interaction between gender and land area, had an effect on the loan
repayment performance of borrowers when other factors are constant.
5.2.3 Comments and possible explanations for the results
Size of loan relationship
The results of this study indicated a positive relationship between size of loan and both
herd size and land area allocated to dairying by women borrowers. As mentioned in
section 3.3.3, herd size and land area can signify the accumulated wealth of the
borrower. It seems rational, therefore, for the bank to allocate larger sizes of loans to
wealthier borrowers, other factors being constant. Since the herd size and land area for

86
women appear not to affect loan repayment, it seems that the UCB RFS is tailoring
loans well to the scale of operation of the borrowers.
The results of the study indicated a positive relationship between household size and
size of loan (and repayment rate). The UCB RFS apparently does well to give larger
loans to borrowers with larger households, since household size enhances repayment,
especially amongst women borrowers.
As outlined above, the results of the study indicated that the UCB RFS awards larger
loans to borrowers with collateral than to those with no collateral. Also, larger loans
are given to borrowers with relatively larger herds and land areas allotted to dairy
farming. However, the emphasis that the UCB RFS puts on collateral, herd size and
land area may indirectly bias the loan size policy against women. This is because, in
this study, a larger proportion of women than men borrowers had collateral (see Table
3.3), and, on average women had smaller herds and land areas than men (see Table
3.2).
Repayment relationship
Results from this study indicated that women repay significantly worse than men, and
that single borrowers repay better than married. The data set used for this study had
no single men, meaning that all single borrowers were women. As explained in
section 3.6, since each borrower had at least one child, all the single women in the
data set were assumed to be female heads of households. The results therefore
indicate that, among the women, those who are female heads of households repay
better than married women. As discussed in section 4.3, the poor repayment
evidenced amongst women in general, and married women in particular, may be due
to the reproductive roles that women face and the consequent time constraints. Also
important may be women's lack of technical and business skills, their inadequate cash
flow management and the types of enterprise in which they are engaged. There may
also be a problem of men taking the women's income.
Evidence indicates that poverty is a high-ranking problem amongst Ugandan rural
women (see section 2.10.6). Therefore, due to poverty, the income generated from the
dairy farming may not be sufficient to meet the needs of the women and their
households. Further, the dairy enterprises may not be profitable. In such cases,
providing credit funds for unviable enterprises would exacerbate the repayment
problems faced by the women, leaving them worse off.

87
Household size especially for women, has a positive relationship with repayment rate.
The relationship may be due to the free labour that the family members may contribute
to the enterprise. The result could mean that the management of dairy enterprise is
very labour intensive and likely to be demanding on the women's time, given the
multiple roles that women face. Therefore, women who have relatively smaller
household sizes may not have enough family labour to operate the dairy enterprises.
As already explained in section 2.10.3, rural women in Uganda often spend a bigger
proportion of their income on consumption than rural men. For such women, the
domestic and non-domestic (income-earning) spheres tend to be inseparable (Heyzer
1993). Income may therefore be used for obligations that are considered of a higher
priority than repayment, such as medical expenses, food and other welfare
expenditures, resulting in poor repayment performance.
5.3 Policy implications
Recommendations for improving the repayment performance of women borrowers
and the sustainability of bank lending are suggested in this section, based on the
results and possible explanations outlined above. To effect the improvements
suggested below, the UCB RFS, other financial institutions, the Government of
Uganda (GOU), the donors and the women borrowers may all have roles to play.
5.3.1 The general need for gender policies
As already mentioned, the results indicated that gender is important in the size of
loans allocated to borrowers and in loan repayment performance. Therefore, since
gender is important, there may be a general need for incorporating gender issues into
the policy formulation procedures of the UCB RFS, in particular, and other
organisations that assist women in general. The incorporation of gender issues in
formulating policies to assist women is well supported in modern literature (Evers
1993; Mayoux 1993b). For instance, Radcliffe (1993) contended that gender issues
are crucial to development policies for peasant economies. According to Elson
(1993), if government policy does not take gender-relations into account, it is much
harder for financial institutions and NGOs offering assistance to women to intervene
in the making of economic policy. Elson further argued that gender issues make a
difference to many policy recommendations and decisions. According to Moser
(1989), since women play different roles and therefore have different needs from men,
gender planning should be incorporated into policy formulation.

88
5.3.2 Implications for repayment performance
As outlined above, the results of this study indicate that, for sample loans of UCB
RFS, women repaid worse than men borrowers. The results of the study are contrary
to other evidence that women repay better than men (Kuiper 1989) or that gender is
insignificant in loan repayment (Sengati 1993). As noted in section 1.5, since gender
is significant and women are poorer repayers than men, the results from this study
manifest a problem for a policy aimed at increasing the access of women to credit.
However, since the need for credit by women is well documented (see section 2.5),
the bank's policy of supporting women should not be discarded based on the findings
here. Rather, gender-specific policies may be required for financial institutions,
donors and the GOU to improve the repayment of women borrowers to at least bring
their performance up to par with that of men. Further, more attention may need to be
given to which women get loans, and the riskiness of their projects.
Time constraints
In cases where time constraints hamper the repayment performance of the borrowers,
(such as explained in section 5.2.3), the bank may need to take the reproductive burden
of women borrowers into account, before credit for operating dairy enterprises is
granted. Due to the female gender roles, income-generating activities may over-
burden women, thereby undermining their reproductive roles and so reducing their
overall productive capacity (and hence their capacity to repay). It may therefore be
better if credit were to be provided in a package more closely tailored to the needs of
women borrowers. Thus, in addition to lending to expand dairy production, the bank
may also need to lend for domestic or on-farm labour saving devices. The devices
would alleviate women's workloads. Consequently, the women would be able to
participate more in the income-generating activities. The bank may need to confirm
that women borrowers have easy access to communal child-care facilities, water
sources and firewood or energy saving fuel, before granting loans. Such a
confirmation may be necessary since lack of the mentioned facilities may exacerbate
the reproductive burden that women face, contributing to poor repayment.
Given the possible time constraints that women have and the high and regular labour
demand of dairy farming, enterprises that are less demanding in terms of time and
labour may be more suited to the women's conditions, such as poultry, goat-keeping
and some forms of horticulture.
The government may need to support the establishment of facilities that reduce
workloads for women. Projects that reduce women's reproductive burdens, such as

89
through provision of child-care facilities, accessible water, rural electrification and
simple technological improvement in the processing and preparation of food in the
house may improve the capacity of women to use and repay credit. The availability of
fuel-wood may be improved by maintaining existing fuel-wood resources and
adopting appropriate agricultural and agro-forestry strategies as integral parts of rural
development programs and projects.
Women borrowers may need to make joint efforts to ease their time constraints.
Reproductive burdens, such as child-care, may be reduced through self-help
community efforts. Also, women borrowers could improve their skills through
participating in women's groups.
Lack of technical and business management skills
If the lack of technical and business management skills are part of the causes of poor
repayment by women, the UCB RFS may need to adopt an integrated approach of
credit delivery (see section 2.7) so as to enhance the women's skills in these areas.
One way would be to provide training in dairy husbandry to women borrowers. The
training methods used would need to be practical, participatory and appropriate to the
trainees' local situations. The bank would need to consider the women's time and
mobility constraints when scheduling such programs. As already explained, the
various roles that women play may deter them from participating in the training
activities. On-farm training and training during off-peak seasons are possible options.
Training for women borrowers in areas that would improve the productivity and
performance of their income-generating activities may be useful. Training in
entreprenuership development, time management and marketing may be beneficial to
the borrowers.
There is evidence that the government extension services are inefficient (Nalwanga-
Sebina and Natukunda 1988). Further, according to Nalwanga-Sebina and
Natukunda, rural women in Uganda lack access to such facilities, which constrains the
productivity of their enterprises (see section 2.10.2). Therefore, the UCB RFS may
need to establish facilities that provide agricultural extension services, business
advisory services and information, to supplement those provided by the GOU.
Technical, small business management and dairy production units may have to be
formed within the UCB RFS, since the development of an effective extension service
by GOU may not occur in the short term (UNICEF 1994).

90
Also, the women could participate in groups that market products of members, and or
share production costs.
If the lack of technical and business management skills results in poor repayment by
men borrowers as well, training to improve such skills and provision of adequate
business advice could improve their repayment performance.
Lack of cash management skills
Evidence indicates that, traditionally in Uganda, cash management is the men's
responsibility (see section 2.12.1). Consequently, many women may be incompetent
in managing finances. If further investigation shows that cash management problems
are a cause of poor repayment amongst women borrowers, the UCB RFS may need to
provide training for women, in cash management. In cases where husbands either
decline from contributing to household expenses or confiscate their wives' incomes,
cooperation from husbands may need to be solicited by the credit officers before loans
are granted.
Poverty
If poverty is a cause of poor repayment for borrowers in general and women in
particular, then finding a solution is very difficult and provision of credit may not be
the best and certainly the only way of overcoming the problem. Probably, equity and
property rights may need to be tackled and programs to meet basic needs may need to
be put in place.
5.3.3 Implications for sustainability of bank lending
Financial institutions, such as the UCB RFS, that support development activities for
women, need to maintain their sustainability in order to be able to assist the women
(and men) successfully (Tilahun 1994). Since the UCB RFS is realising poor
repayment rates (an average of 36 per cent for women and 47 per cent for men [Table
3.2]), the sustainability of the scheme may well be threatened. Given that one of the
objective of the UCB RFS is to provide priority support to women, the UCB RFS
would need to consider ways of minimising risks of lending, especially to the women.
Since the UCB RFS is interested, not only in enhancing the repayment performance of
borrowers, but also in getting its money back in the event of default, the bank may
consider some factors that do not necessarily enhance repayment but safeguard the
bank's portfolio against default. The results indicate that the bank focuses on
91
collateral, herd size, land area for women and household size in determining the size
of loan. As explained in section 3.3, factors such as collateral, herd size and land area
for women constitute hedges against risk. According to the results of this study,
gender, marital status, other occupation, experience and household size are important
in loan repayment. When determining the size of loans to give to borrowers, the bank
could therefore improve its loan size policy by focusing on factors that enhance loan
repayment rate, in addition to those which hedge against risk. Based on the results,
the loan size policy should be revised to include gender (thereby addressing the
possible gender-related problems mentioned in section 5.2.3), marital status, other
occupation and experience in addition to the factors already considered by the bank.
The results also reveal that, although experience is important in repayment
performance, the bank does not appear to consider experience as important when
deciding on the loan size for borrowers. It is therefore recommended that the bank
gives more attention to experience in deciding which borrower gets what size of loan.
Also, it may be useful for the UCB RFS to focus on building the borrowers'
experience in managing dairy enterprises, for example by phasing loans more
carefully as borrowers build up their farms.
The results from this study indicate that collateral is considered as a major factor in
determining the loan size for borrowers. However, the factor does not seem to
enhance repayment. It therefore seems inappropriate to give high priority to collateral
when it has no impact on repayment rate. The bank could focus less on collateral in its
loan allocation procedures.
The evidence from this study suggests that the bank may need to adopt policies to
improve the screening processes for the character of borrowers, that is, their
willingness to repay. Although borrowers may fail to repay for genuine reasons, some
could be defaulting wilfully. Therefore, more effective and efficient loan appraisal
and screening procedures could be adopted by credit officers, to improve their ability
to detect strategic defaulters. Failure prediction models, credit scoring and
computerised expert systems may be used (Altman 1984). Also, closer supervision of
borrowers may be required, so that, in the event of default, credit officers can isolate
genuine cases from wilful defaults. Flexible repayment schedules, more credit for
working capital to borrowers with genuine repayment difficulties and instalment
lending could be considered. However, strict enforcement of sanctions may be
necessary in cases of wilful defaults.
Experience with some other developing countries has shown that group lending
enhances loan repayment (Hossain 1990; Hilhorst and Oppennoorth 1992). Thus, the

92
UCB RFS could explore the possibility of improving the repayment performance
through group lending, especially to women. The groups could be involved in pre-
screening applicants, monitoring projects and effecting recoveries through peer
pressure. Care would need to be taken to ensure that the groups are self-selected, since
heterogeneity within groups, for example with respect to age, education, status,
motivation, may be a problem (Hyma and Nyamwange 1993).
Ideally, any financial institution should reduce its transaction costs so as to promote
self-sufficiency and sustainability. However, given the need to improve the
performance of women borrowers of the UCB RFS, the cutting down of transaction
costs by the bank may not be possible in the short term. Measures such as supervision
and training are likely to be costly, yet necessary, if the UCB RFS is to continue to
assist poor women. Nevertheless, some strategies to reduce transaction costs may still
be employed. For example, more efficient administrative procedures, low-cost
innovative experiments, such as mobile credit officers, one-person branches, opening
branches on a part-time basis, or agents to work for the bank on commission, may be
useful.
Some financial institutions that award credit to women in Uganda have realised good
repayment performance (Musoke and Amajo 1989). The UCB RFS could promote
networking or coordination with various rural financial agencies endeavouring to help
women borrowers, such as CERUDET, the UWFCT and the Cooperative Bank (see
section 2.12.2) so that the UCB RFS may learn from those institutions that are doing
better. For example, workshops on gender and rural credit may be held to share
experiences.
A good knowledge of cultural aspects of the intra-household gender-relations of
beneficiaries may be essential in awarding credit. Evidence shows that women may
not have any control of their income (see section 2.10). It may therefore be a problem,
for instance, to give larger loans to women who allocate more land to dairying (as
indicated by this study), without being certain whether the women actually control the
proceeds from the enterprises.
Since the poor repayment performance by women may discourage lending, the
financial institutions that are committed to the development of women may need
government support to sustain their operations. Consequently, the government may
need to create an environment where lending to the rural women is financially
attractive to financial agencies, so that the banks can provide credit willingly. To that
effect, wholesale remission of debt, insistence on very low interest rates and policy
statements discouraging farmers from repaying loans may need to be avoided.

93
Further, the government could provide financial institutions with access to low-cost
funds.
Donors may wish to support activities that improve bank sustainability. For instance,
funds for training programs and seminars for credit officers, research on rural financial
markets, testing of financial innovations, installation of computerised management
information systems and development of appropriate screening and credit scoring
procedures, may be useful. Donors may also provide technical assistance in
appraising, monitoring and evaluating rural credit projects.
5.4 Limitations of the study
The selection of the study sample and the information available could inevitably not
be controlled in the research program since the bank had to be relied upon.
Consequently, the sample could have been biased in some way. Further, data on
variables other than those recorded on the loan application forms and provided by the
bank could not be obtained. In particular, information on unsuccessful loan
applications was not available. It would have been desirable to have data on the
characteristics of unsuccessful applicants. Also, no data could be obtained on the
reasons for slow repayment and default. Such information would have been valuable
in interpreting the regression results.
The sample size was small. Results might have been better if the sample size had
been larger. However, data were provided on all dairy loans in both the districts of
study, for the period 1988 to 1991. To increase the sample size, it would have been
necessary to collect data from more districts or for more years, which would probably
have increased the variability of the sample. Finally, the study was undertaken under
conditions of resource and time constraints. More adequate resources and longer time
would have permitted a more thorough investigation.
5.5 Areas for further research
There is need to investigate the reasons for poor repayment by the borrowers,
especially the women. It would be important to repeat the study for other rural credit
schemes and other enterprises to assess whether the relatively poorer repayment
performance of women than men is a wide-scale problem in Uganda. Also, it would
be useful to extend the study of the size of loan to include those who got no loans, in
the sample.
94
5.6 Conclusion
The main theme of the study was gender issues and the important role that credit
might play in improving the status and lives of rural women in Uganda. It is
concerning to find out that women (dairy farmers) in the UCB RFS have a poorer
repayment record and that which is inferior to men, contrary to some other findings.
Evidently, there is a problem and the sustainability of the UCB RFS is obviously
under threat. Therefore, some changes have to be made. Unfortunately, it was not
possible to identify the reasons for the poor repayment performance of borrowers,
especially women, in this study. More investigation of this question is a first priority.
Until such evidence has been collected, firm prescriptions for change can not be
offered. However, it does seem likely that changes in a number of areas relating to
gender that go beyond the scope of the UCB RFS will be necessary, if the goal of
raising women and their households is to be attained.
Related Documents