3 - 1 3 Managing Projects PowerPoint presentation to accompany Heizer, Render, and Al-Zu’bi Operations Management, Arab World Edition Original PowerPoint slides by Jeff Heyl Adapted by Zu’bi Al-Zu’bi

Welcome message from author
This document is posted to help you gain knowledge. Please leave a comment to let me know what you think about it! Share it to your friends and learn new things together.
Transcript
3 - 1
3 Managing Projects
PowerPoint presentation to accompany
Heizer, Render, and Al-Zu’bi
Operations Management, Arab World Edition
Original PowerPoint slides by Jeff Heyl
Adapted by Zu’bi Al-Zu’bi
3 - 2
Learning Objectives
1. Define steps involved in project planning
2. Use a Gantt chart for scheduling
3. Draw AOA and AON networks
4. Complete forward and backward passes for
a project
5. Determine a critical path
5. Calculate the variance of activity times
6. Crash a project
When you complete this chapter you should be able to:
3 - 3
Importance of Project Management
Project Management Plays an increasing important role as projects size gets bigger and bigger
Examples of big projects:
Arabtec’s Burj Khalifa Project: The tallest building in the world, with 160 floors, located in the heart of Dubai’s downtown area, which aims to be the world’s most prestigious square kilometer. ($1.5 billion)
Bectel’s Princess Nora Bint Abdulrahman University Project: In this Saudi Arabian educational project, Arabtec will construct the married junior staff housing, composed of 46 buildings with a total area of 240,000 square meters. ($350 million)
3 - 4
Implication of large projects
When Arabtec Construction LLC won the contract for Burj Khalifa, it quickly had to:
mobilize an international force of manual workers, construction professionals, cooks, and even medical personnel.
Its project management team had to access millions of tons of supplies and equipment to complete the project.
3 - 5
Each new Project is seen as a unique event
Many related activities
Difficult planning and resources (inventory) control
High labor skills
Typical Project Characteristics
3 - 6
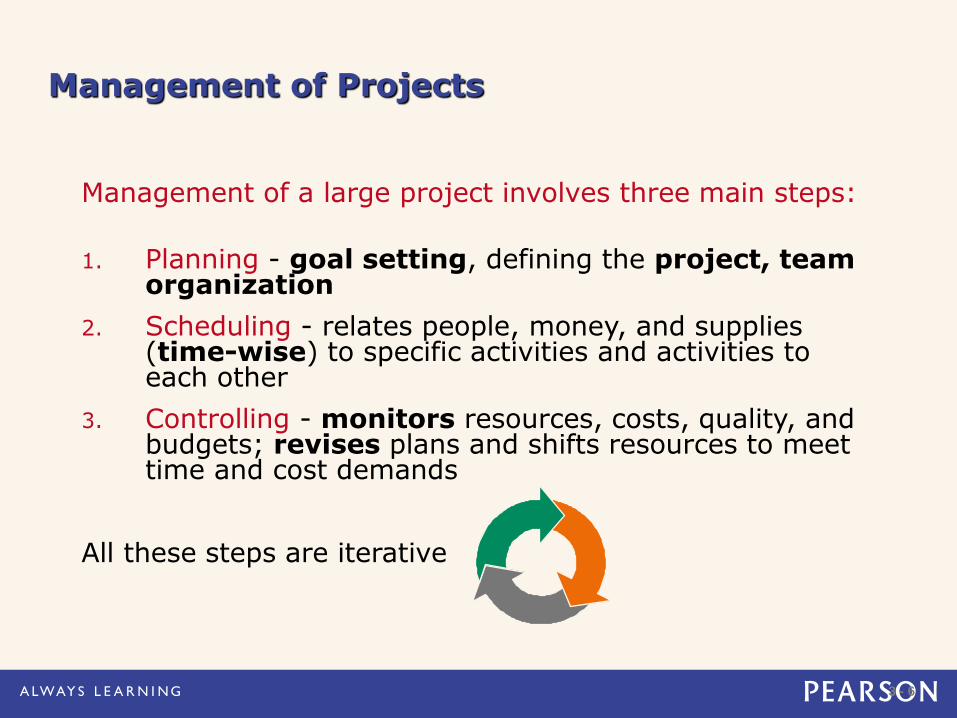
Management of Projects
Management of a large project involves three main steps:
1. Planning - goal setting, defining the project, team organization
2. Scheduling - relates people, money, and supplies (time-wise) to specific activities and activities to each other
3. Controlling - monitors resources, costs, quality, and budgets; revises plans and shifts resources to meet time and cost demands
All these steps are iterative
3 - 7
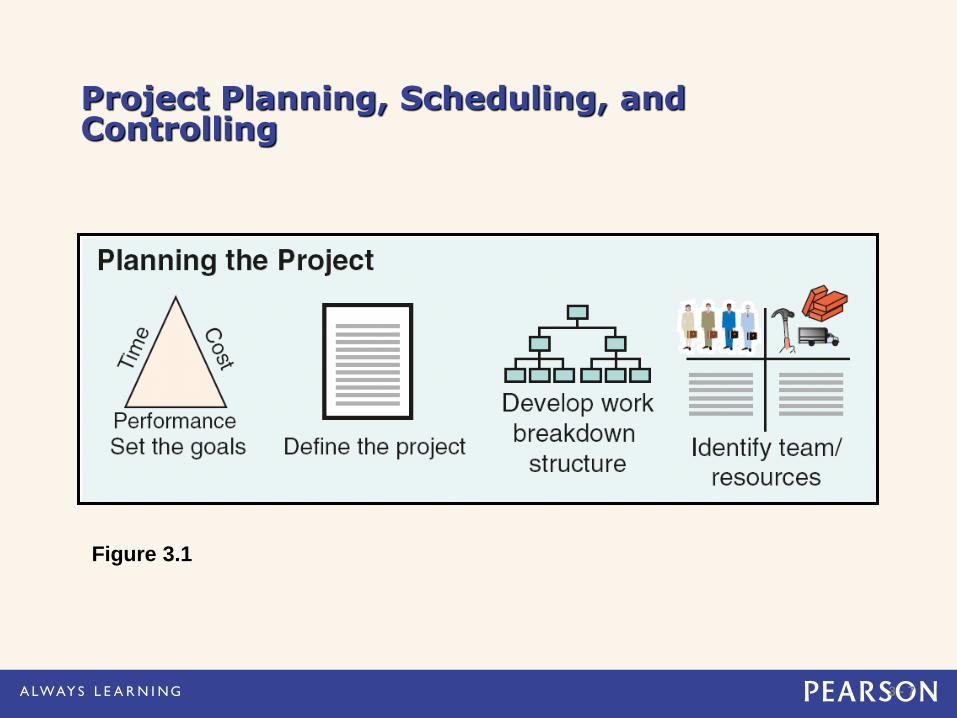
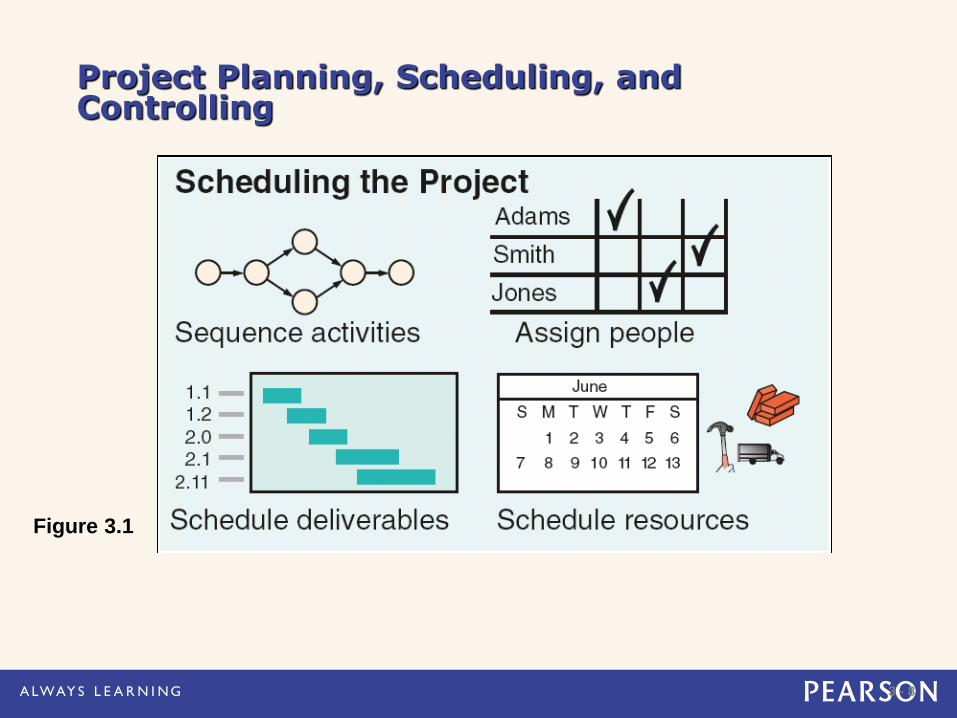
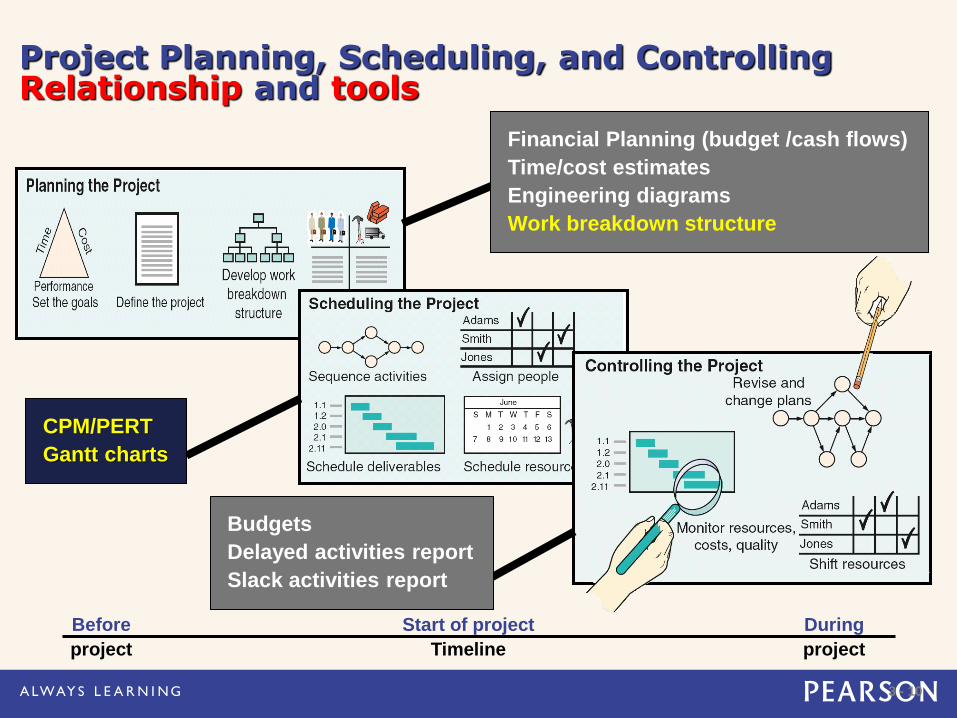
Project Planning, Scheduling, and Controlling
Figure 3.1
3 - 8
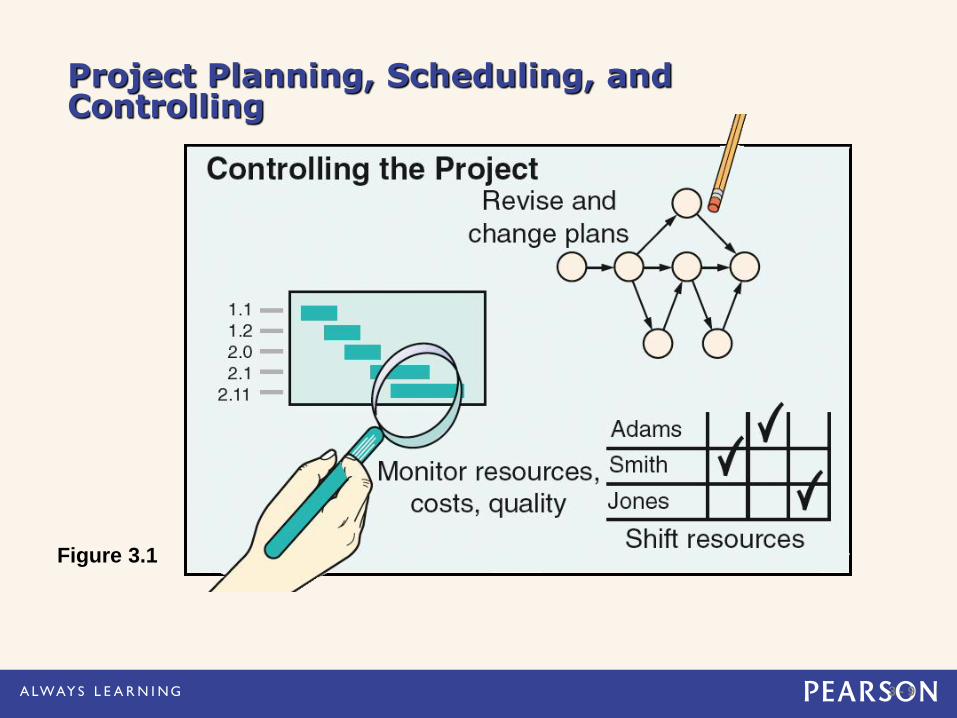
Project Planning, Scheduling, and Controlling
Figure 3.1
3 - 9
Project Planning, Scheduling, and Controlling
Figure 3.1
3 - 10
Project Planning, Scheduling, and Controlling Relationship and tools
Before Start of project During
project Timeline project
Financial Planning (budget /cash flows)
Time/cost estimates
Engineering diagrams
Work breakdown structure
CPM/PERT
Gantt charts
Budgets
Delayed activities report
Slack activities report
3 - 11
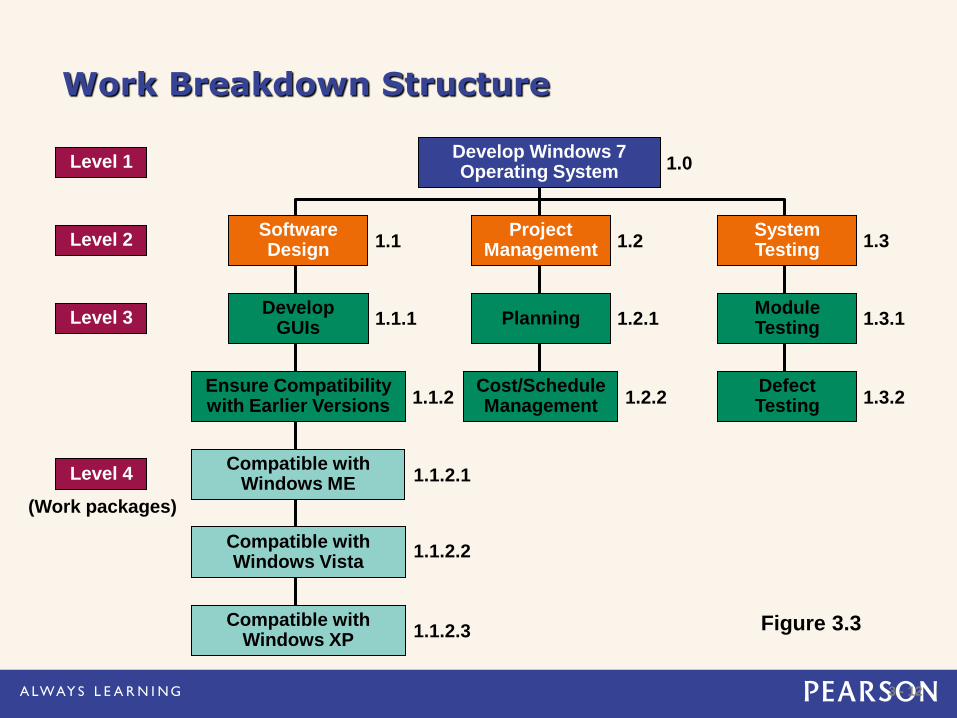
Work Breakdown Structure
Level
1. Project
2. Major tasks in the project
3. Subtasks in the major tasks
4. Activities (or work packages) to be completed
3 - 12
Level 4 Compatible with
Windows ME
Compatible with Windows Vista
Compatible with Windows XP 1.1.2.3
1.1.2.2
1.1.2.1
(Work packages)
Level 3 Develop
GUIs Planning
Module Testing
Ensure Compatibility with Earlier Versions
Cost/Schedule Management
Defect Testing
1.1.1
1.2.2 1.3.2
1.3.1 1.2.1
1.1.2
Work Breakdown Structure
Figure 3.3
Level 2 Software Design
Project Management
System Testing 1.1 1.2 1.3
Level 1 Develop Windows 7 Operating System 1.0
3 - 13
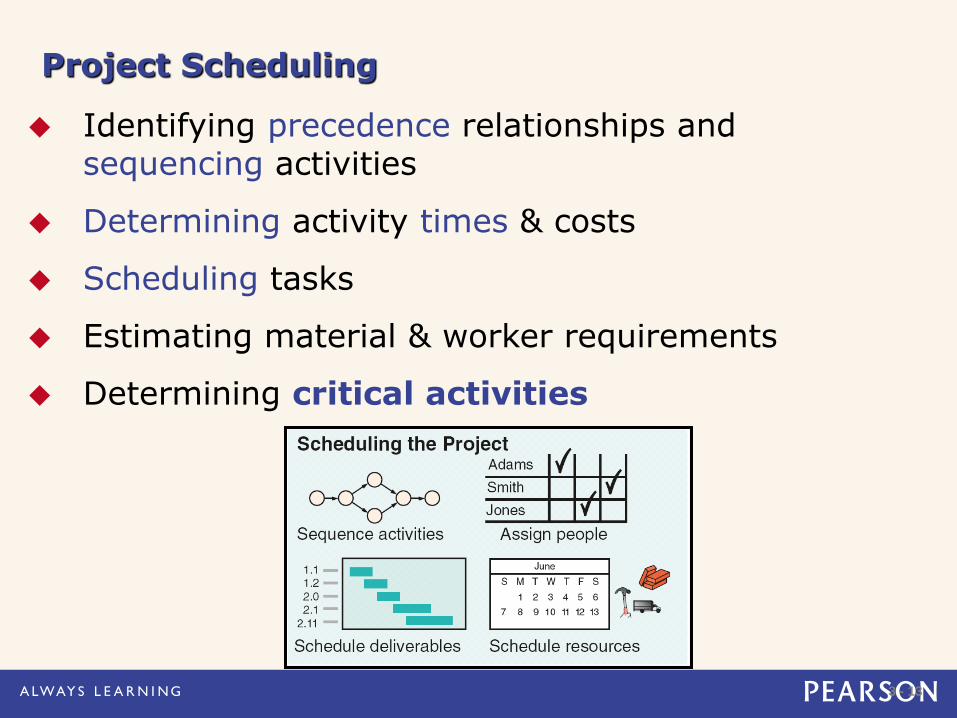
Project Scheduling
Identifying precedence relationships and sequencing activities
Determining activity times & costs
Scheduling tasks
Estimating material & worker requirements
Determining critical activities
3 - 14
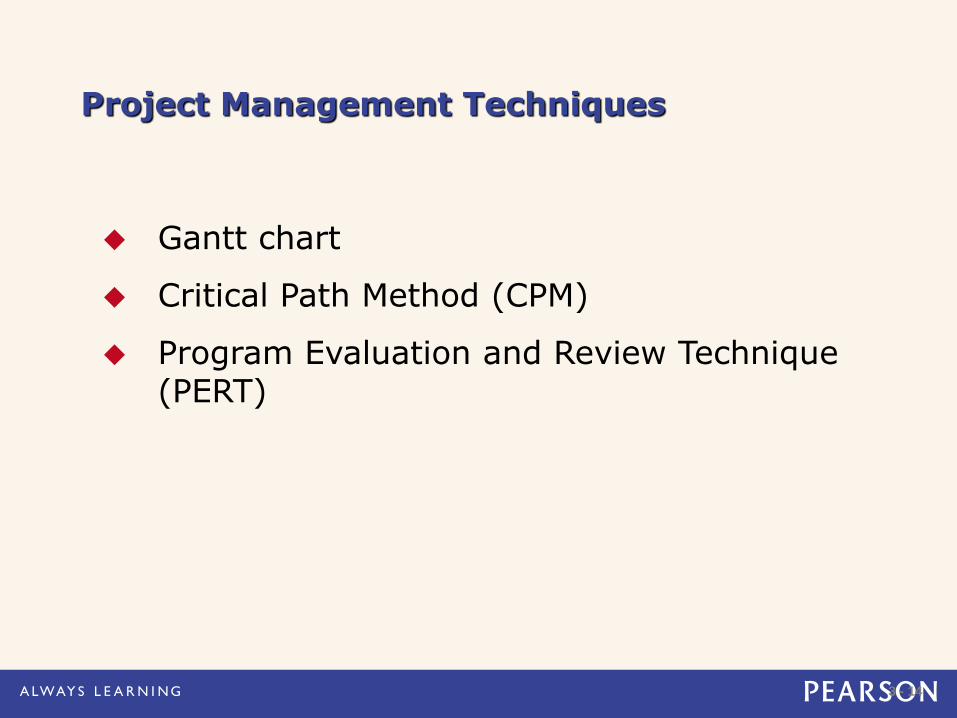
Gantt chart
Critical Path Method (CPM)
Program Evaluation and Review Technique (PERT)
Project Management Techniques
3 - 15
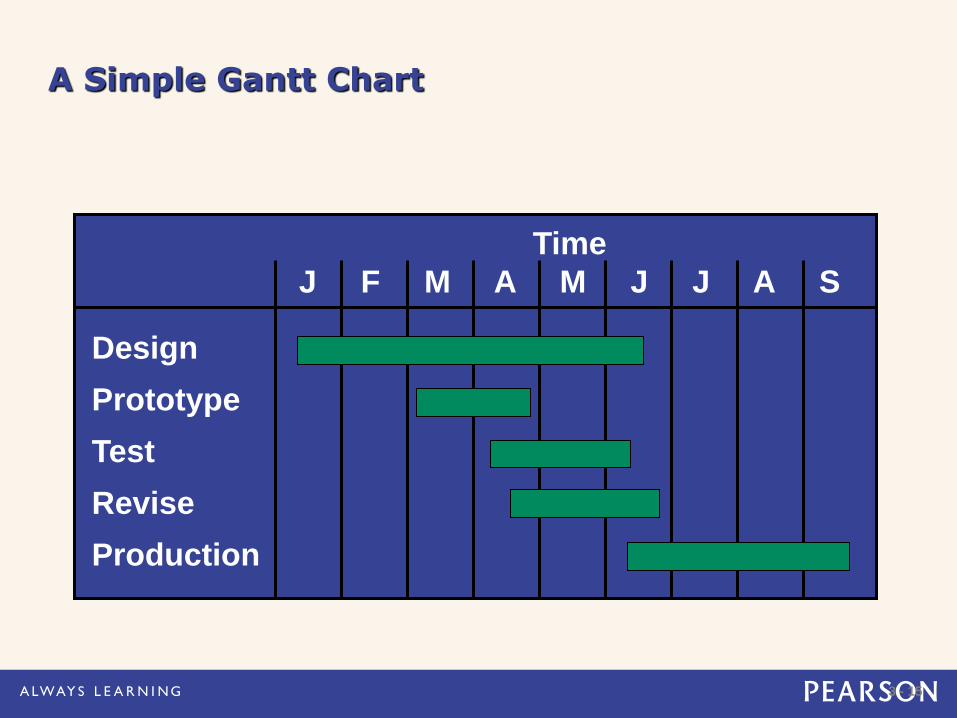
A Simple Gantt Chart
Time
J F M A M J J A S
Design
Prototype
Test
Revise
Production
3 - 16
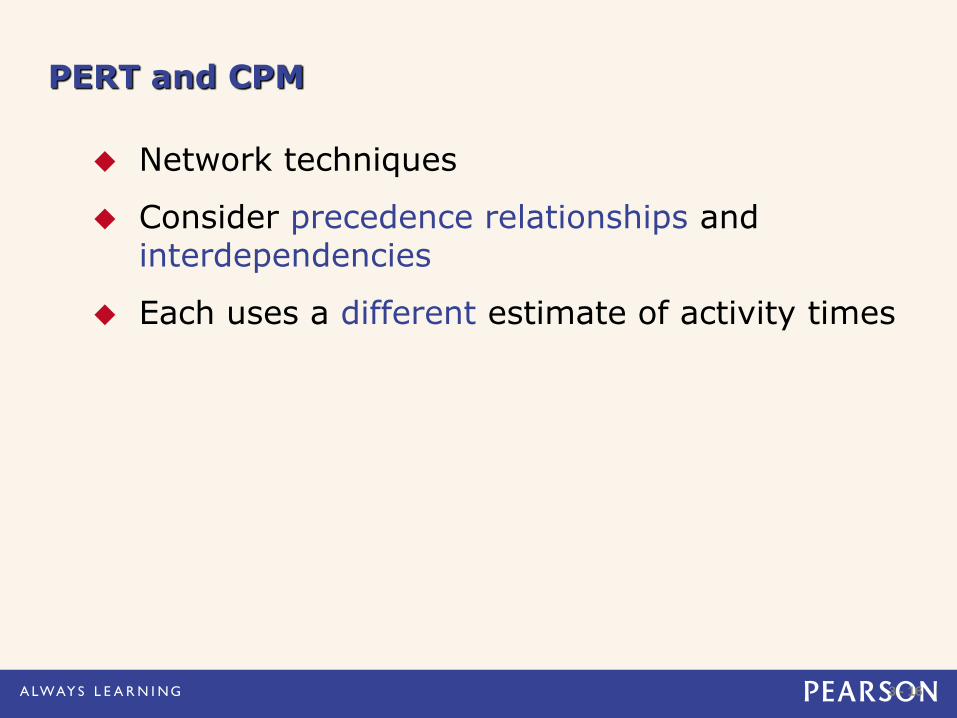
Network techniques
Consider precedence relationships and interdependencies
Each uses a different estimate of activity times
PERT and CPM

3 - 17
Six Steps of PERT & CPM
1. Define the project and prepare the work breakdown structure
2. Develop relationships among the activities - decide which activities must precede and which must follow others
3. Draw the network connecting all of the activities
4. Assign time and/or cost estimates to each activity
5. Compute the longest time path through the network – this is called the critical path
6. Use the network to help plan, schedule, monitor, and control the project
3 - 18
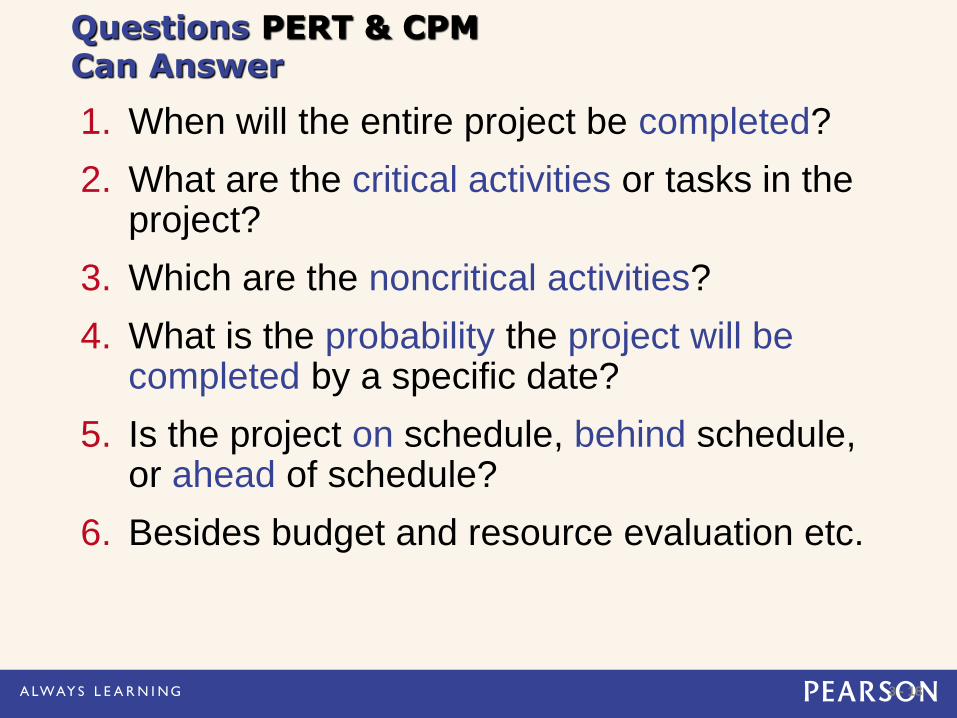
1. When will the entire project be completed?
2. What are the critical activities or tasks in the project?
3. Which are the noncritical activities?
4. What is the probability the project will be completed by a specific date?
5. Is the project on schedule, behind schedule, or ahead of schedule?
6. Besides budget and resource evaluation etc.
Questions PERT & CPM Can Answer
3 - 19
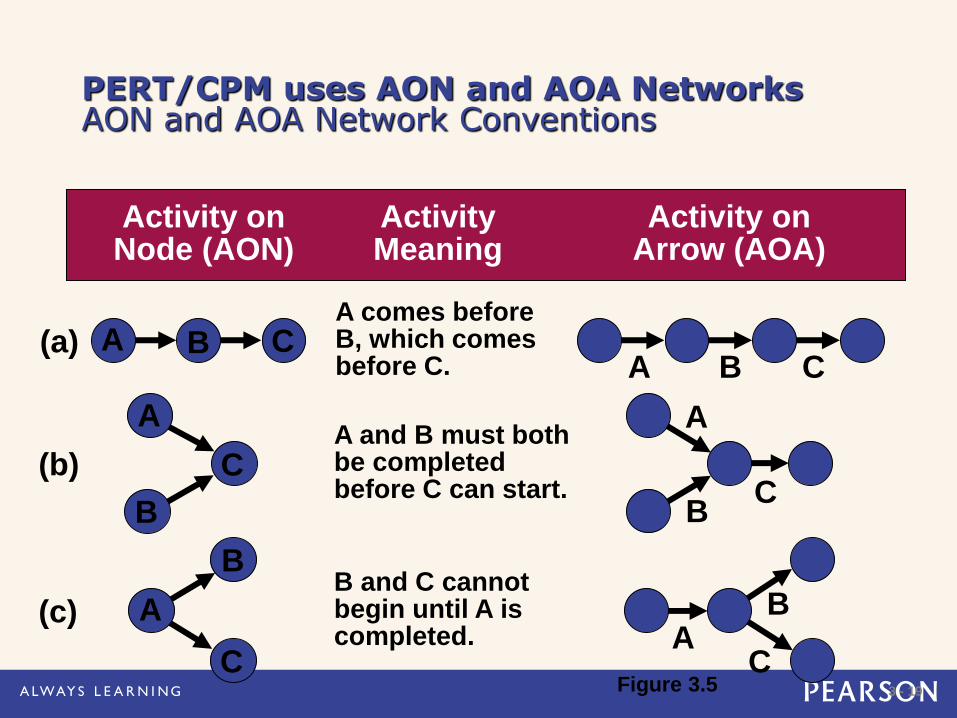
PERT/CPM uses AON and AOA Networks AON and AOA Network Conventions
Activity on Activity Activity on Node (AON) Meaning Arrow (AOA)
A comes before B, which comes before C.
(a) A B C B A C
A and B must both be completed before C can start.
(b)
A
C C
B
A
B
B and C cannot begin until A is completed.
(c)
B
A
C A
B
C Figure 3.5
3 - 20
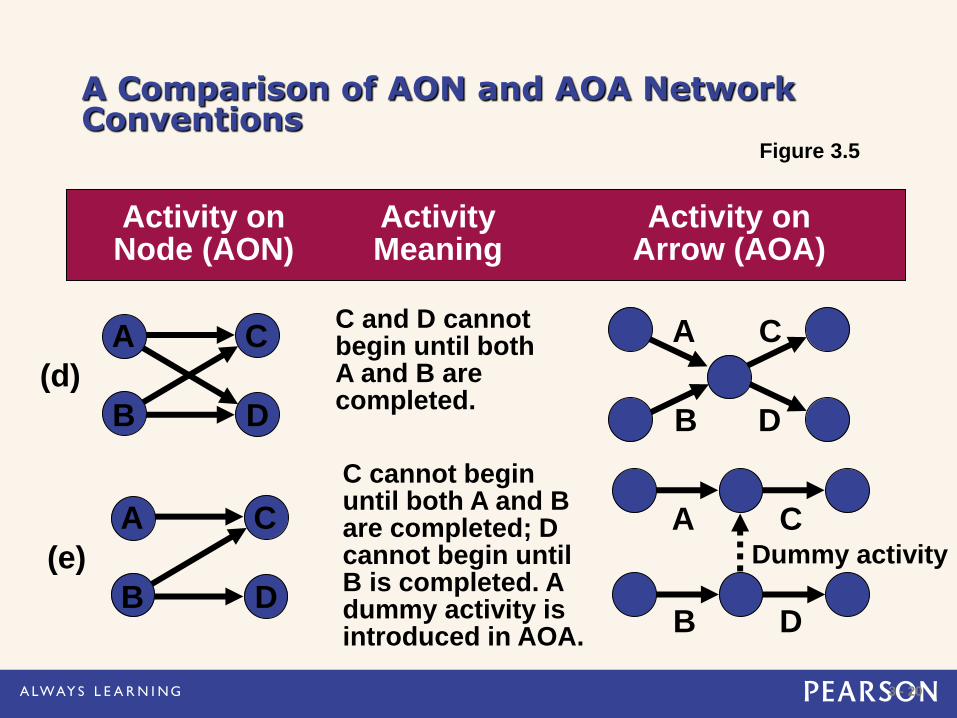
A Comparison of AON and AOA Network Conventions
Activity on Activity Activity on Node (AON) Meaning Arrow (AOA)
C and D cannot begin until both A and B are completed.
(d)
A
B
C
D B
A C
D
C cannot begin until both A and B are completed; D cannot begin until B is completed. A dummy activity is introduced in AOA.
(e)
C A
B D
Dummy activity
A
B
C
D
Figure 3.5
3 - 21
A Comparison of AON and AOA Network Conventions
Activity on Activity Activity on Node (AON) Meaning Arrow (AOA)
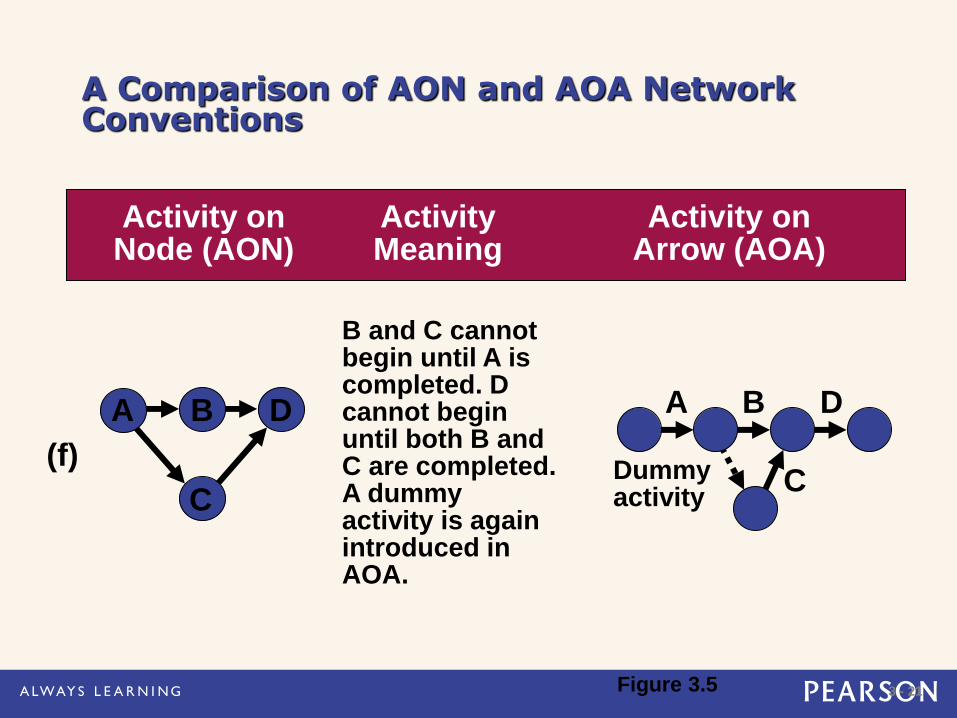
B and C cannot begin until A is completed. D cannot begin until both B and C are completed. A dummy activity is again introduced in AOA.
(f)
A
C
D B A B
C
D
Dummy activity
Figure 3.5
3 - 22
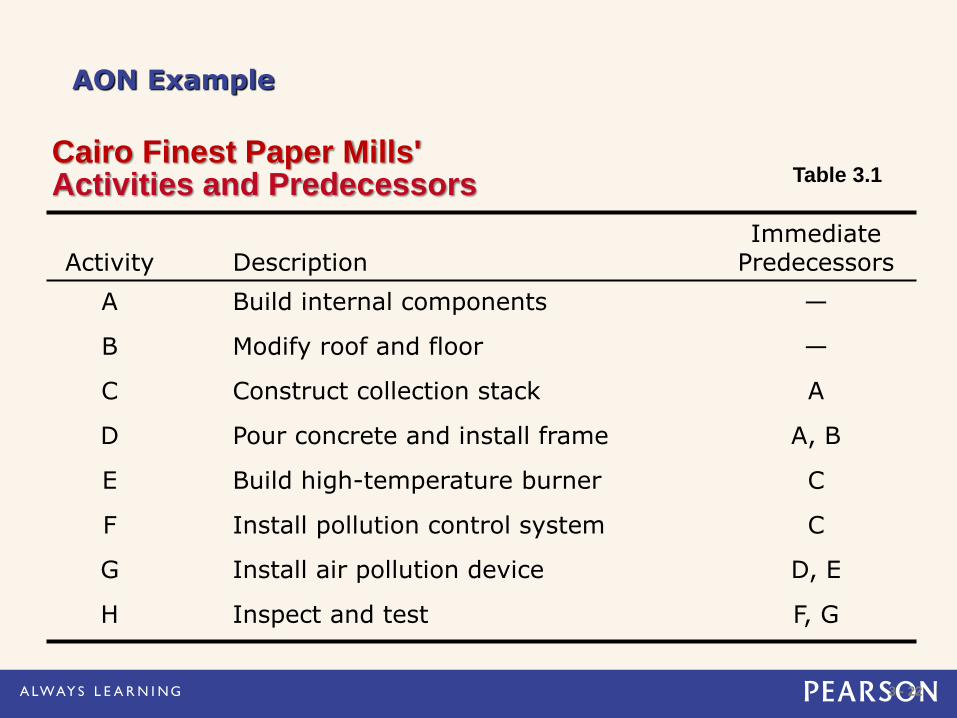
AON Example
Activity Description Immediate
Predecessors
A Build internal components —
B Modify roof and floor —
C Construct collection stack A
D Pour concrete and install frame A, B
E Build high-temperature burner C
F Install pollution control system C
G Install air pollution device D, E
H Inspect and test F, G
Cairo Finest Paper Mills' Activities and Predecessors Table 3.1
3 - 23
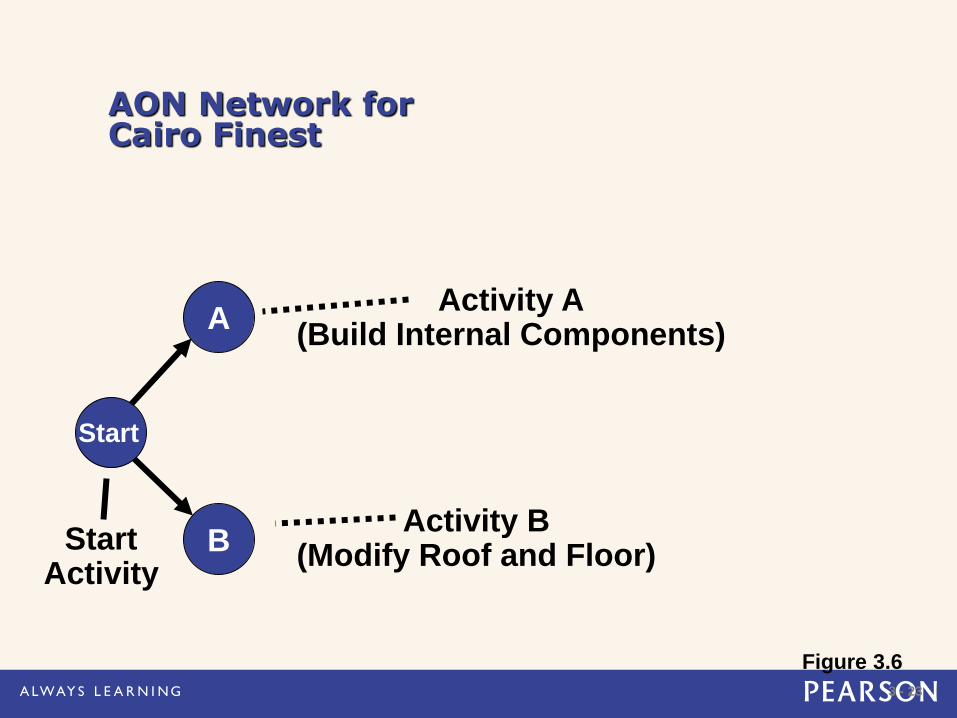
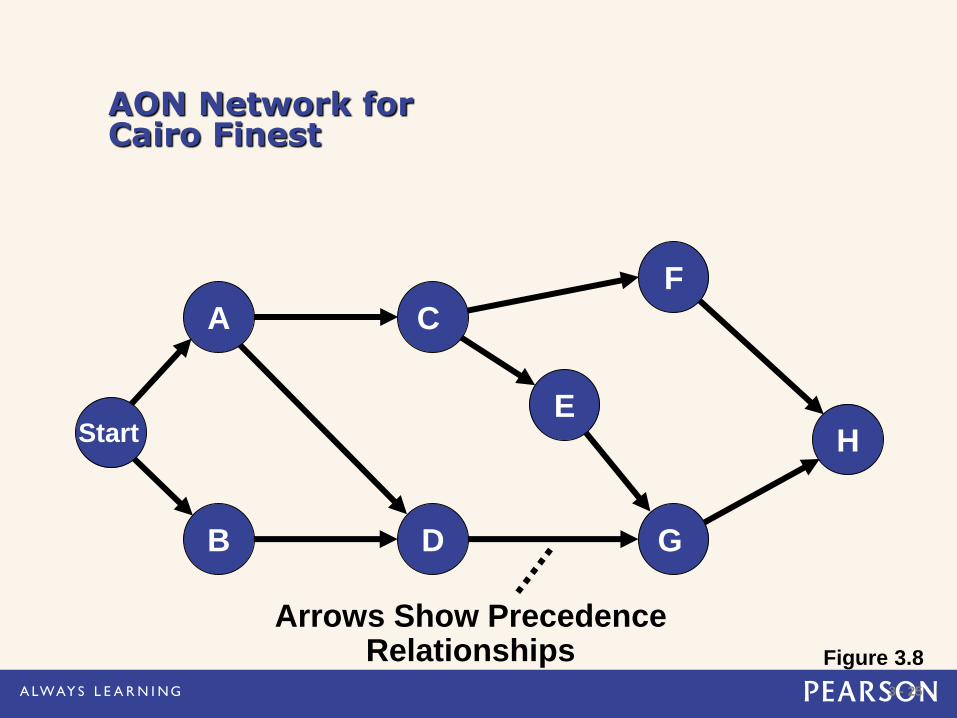
AON Network for Cairo Finest
A
Start
B Start Activity
Activity A (Build Internal Components)
Activity B (Modify Roof and Floor)
Figure 3.6
3 - 24
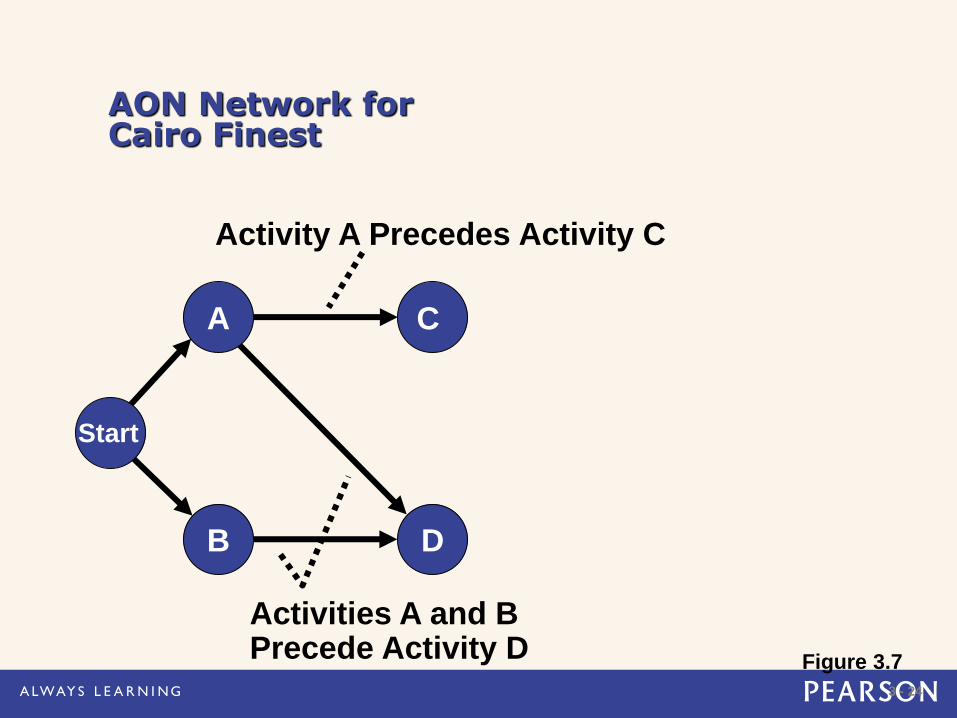
AON Network for Cairo Finest
Figure 3.7
C
D
A
Start
B
Activity A Precedes Activity C
Activities A and B Precede Activity D
3 - 25
AON Network for Cairo Finest
G
E
F
H
C A
Start
D B
Arrows Show Precedence Relationships Figure 3.8
3 - 26
H
(Inspect/ Test)
7 Dummy Activity
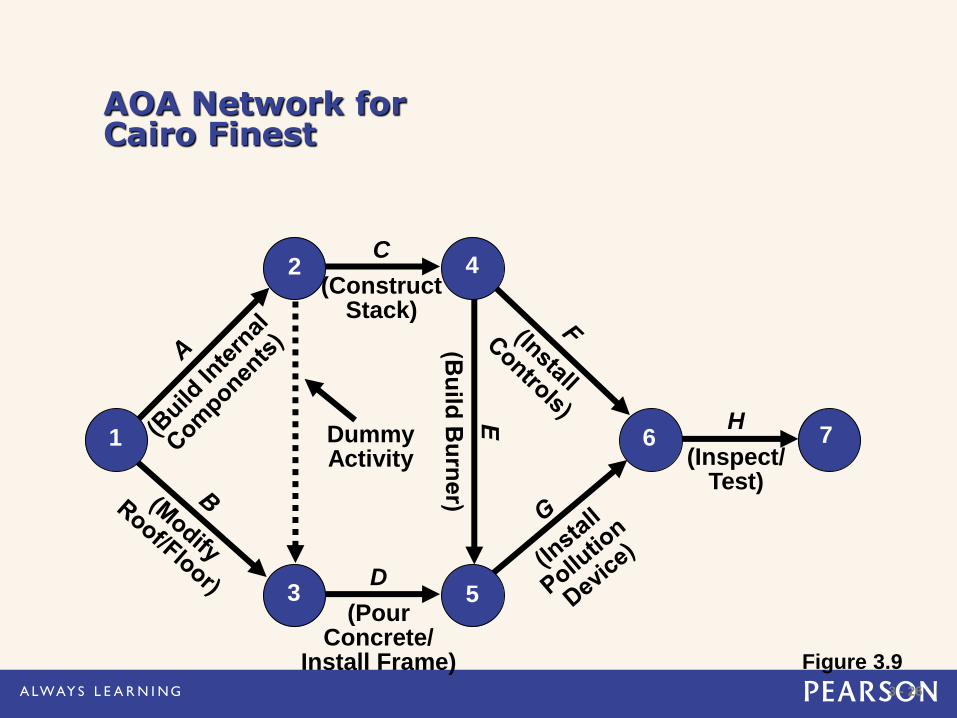
AOA Network for Cairo Finest
6
5 D
(Pour Concrete/
Install Frame)
4 C
(Construct Stack)
1
3
2
Figure 3.9
3 - 27
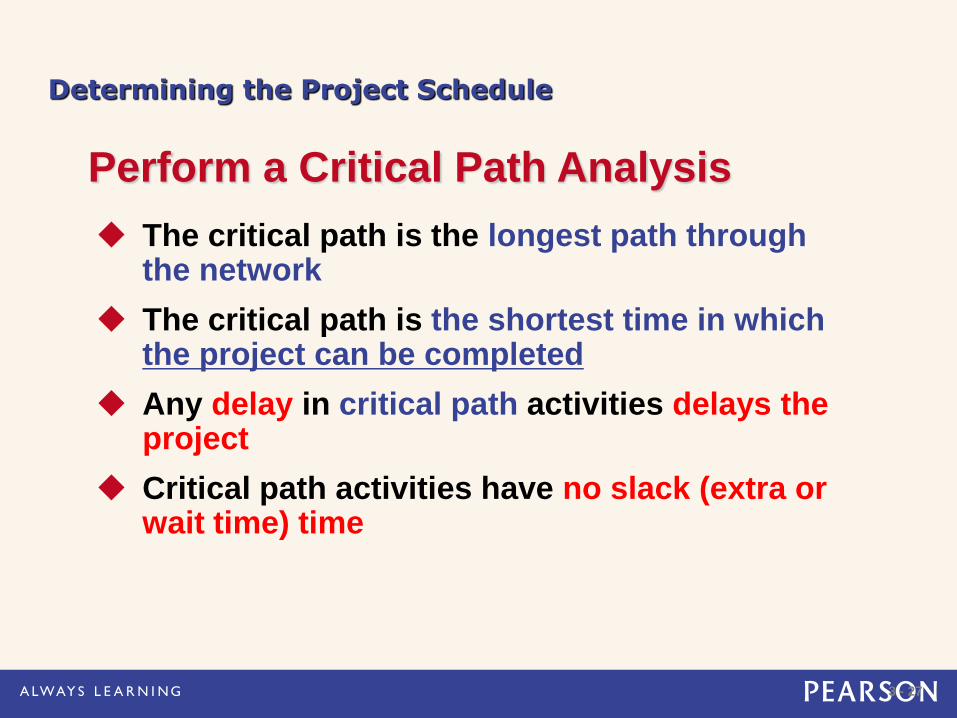
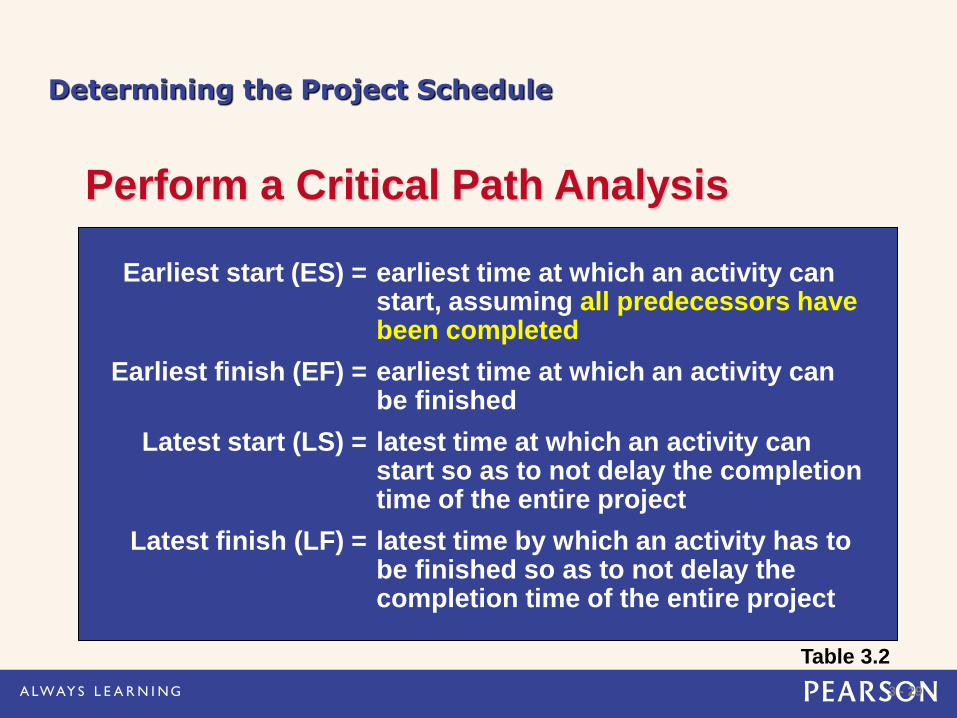
Determining the Project Schedule
Perform a Critical Path Analysis
The critical path is the longest path through the network
The critical path is the shortest time in which the project can be completed
Any delay in critical path activities delays the project
Critical path activities have no slack (extra or wait time) time
3 - 28
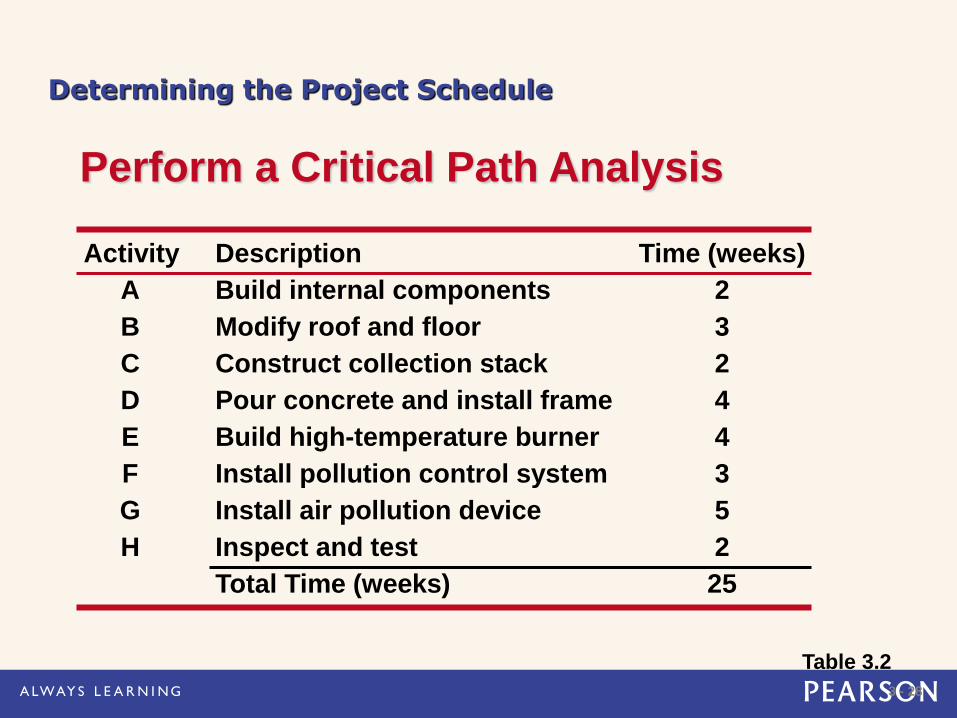
Determining the Project Schedule
Perform a Critical Path Analysis
Table 3.2
Activity Description Time (weeks)
A Build internal components 2
B Modify roof and floor 3
C Construct collection stack 2
D Pour concrete and install frame 4
E Build high-temperature burner 4
F Install pollution control system 3
G Install air pollution device 5
H Inspect and test 2
Total Time (weeks) 25
3 - 29
Determining the Project Schedule
Perform a Critical Path Analysis
Table 3.2
Activity Description Time (weeks)
A Build internal components 2
B Modify roof and floor 3
C Construct collection stack 2
D Pour concrete and install frame 4
E Build high-temperature burner 4
F Install pollution control system 3
G Install air pollution device 5
H Inspect and test 2
Total Time (weeks) 25
Earliest start (ES) = earliest time at which an activity can start, assuming all predecessors have been completed
Earliest finish (EF) = earliest time at which an activity can be finished
Latest start (LS) = latest time at which an activity can start so as to not delay the completion time of the entire project
Latest finish (LF) = latest time by which an activity has to be finished so as to not delay the completion time of the entire project
3 - 30
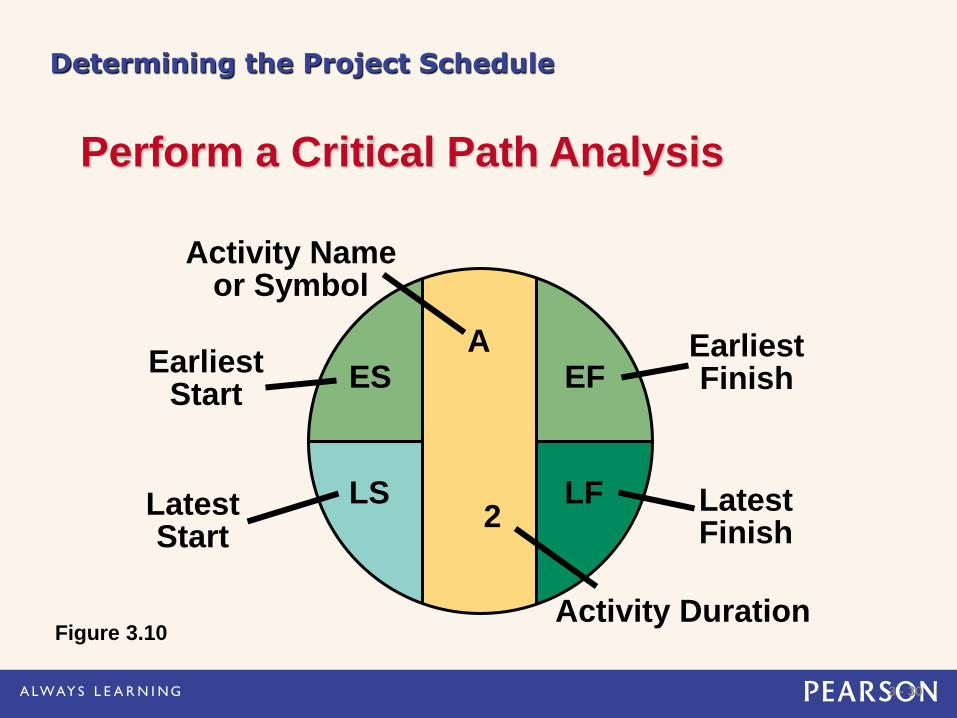
Determining the Project Schedule
Perform a Critical Path Analysis
Figure 3.10
A
Activity Name or Symbol
Earliest Start
ES Earliest Finish EF
Latest Start
LS Latest Finish
LF
Activity Duration
2
3 - 31
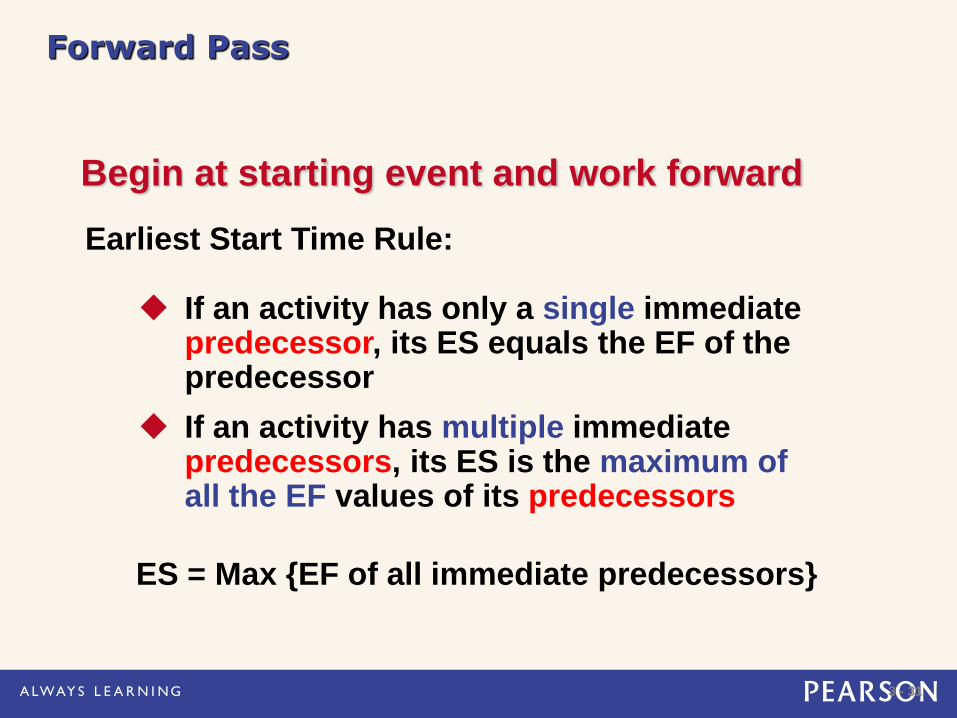
Forward Pass
Begin at starting event and work forward
Earliest Start Time Rule:
If an activity has only a single immediate predecessor, its ES equals the EF of the predecessor
If an activity has multiple immediate predecessors, its ES is the maximum of all the EF values of its predecessors
ES = Max {EF of all immediate predecessors}
3 - 32
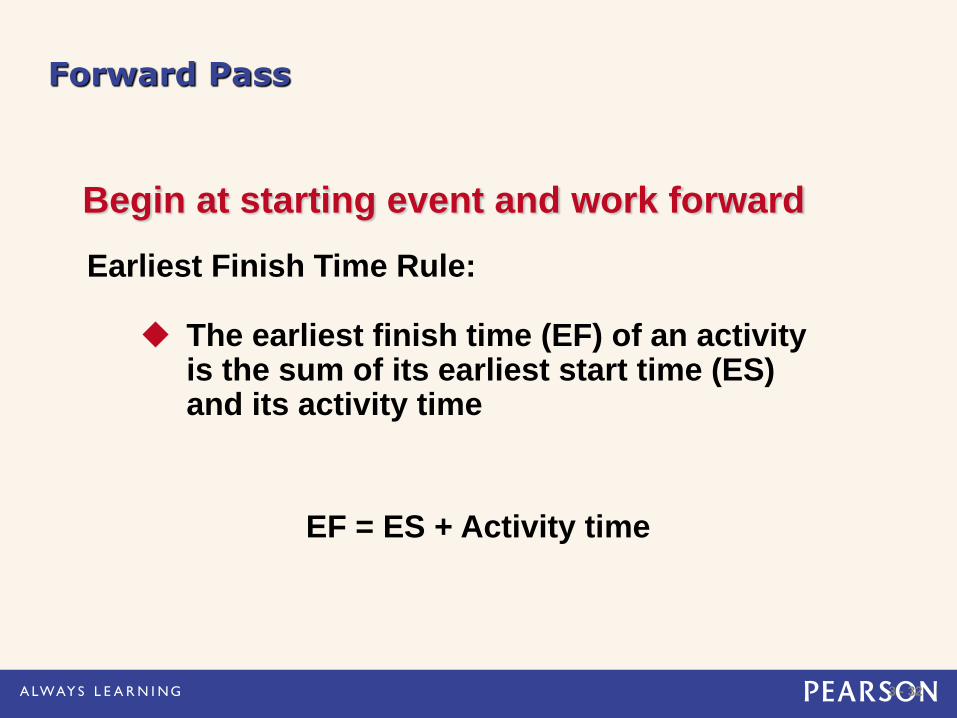
Forward Pass
Begin at starting event and work forward
Earliest Finish Time Rule:
The earliest finish time (EF) of an activity is the sum of its earliest start time (ES) and its activity time
EF = ES + Activity time
3 - 33
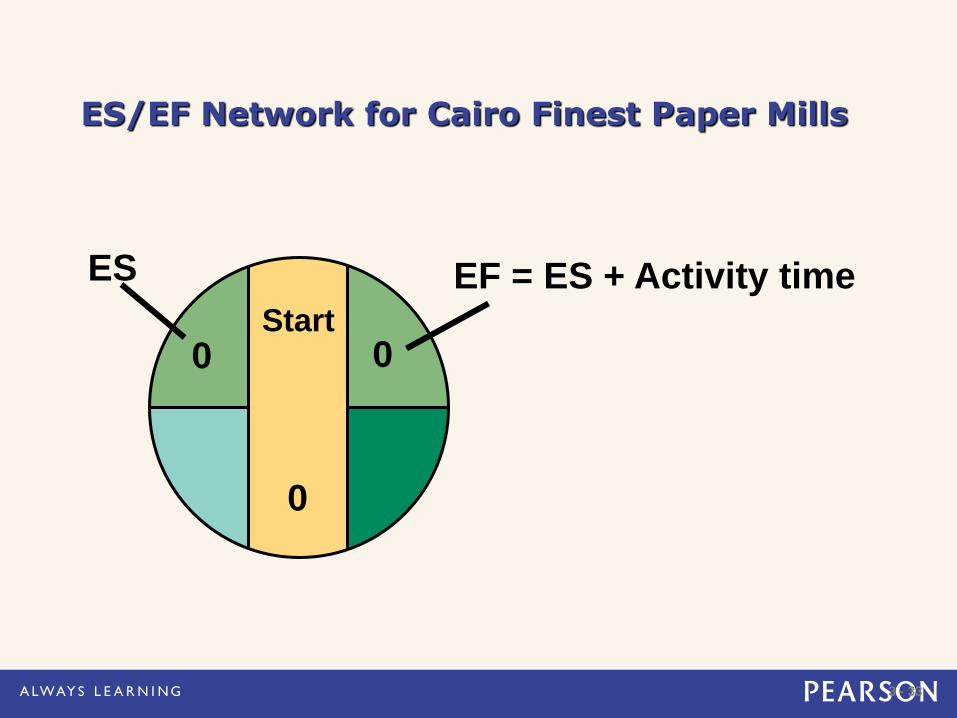
ES/EF Network for Cairo Finest Paper Mills
Start
0
0
ES
0
EF = ES + Activity time
3 - 34
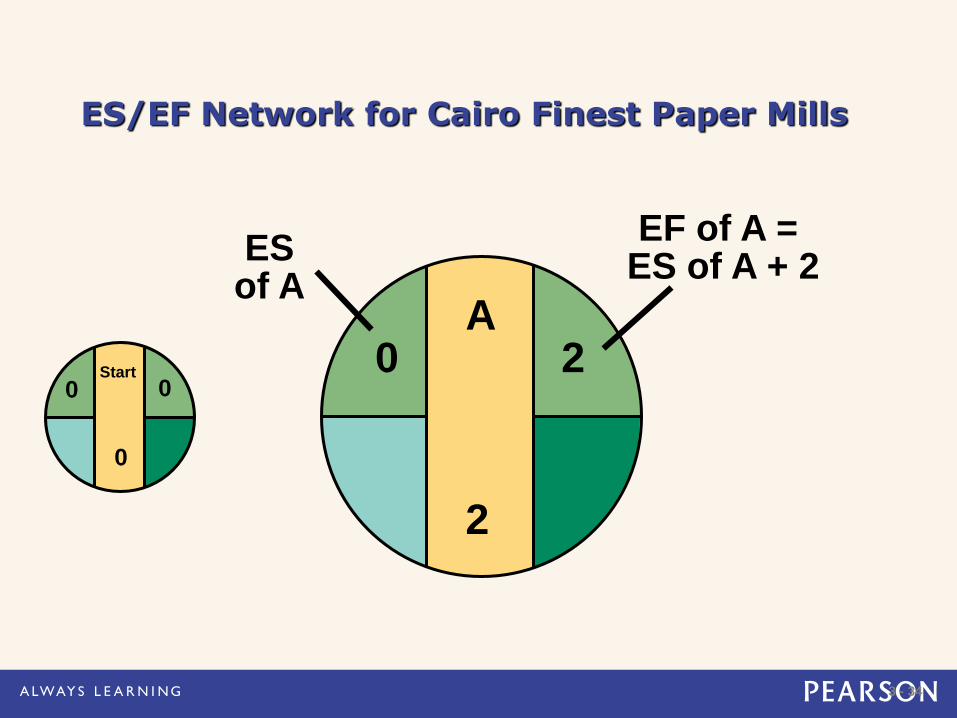
ES/EF Network for Cairo Finest Paper Mills
Start
0
0
0
A
2
2
EF of A = ES of A + 2
0
ES of A
3 - 35
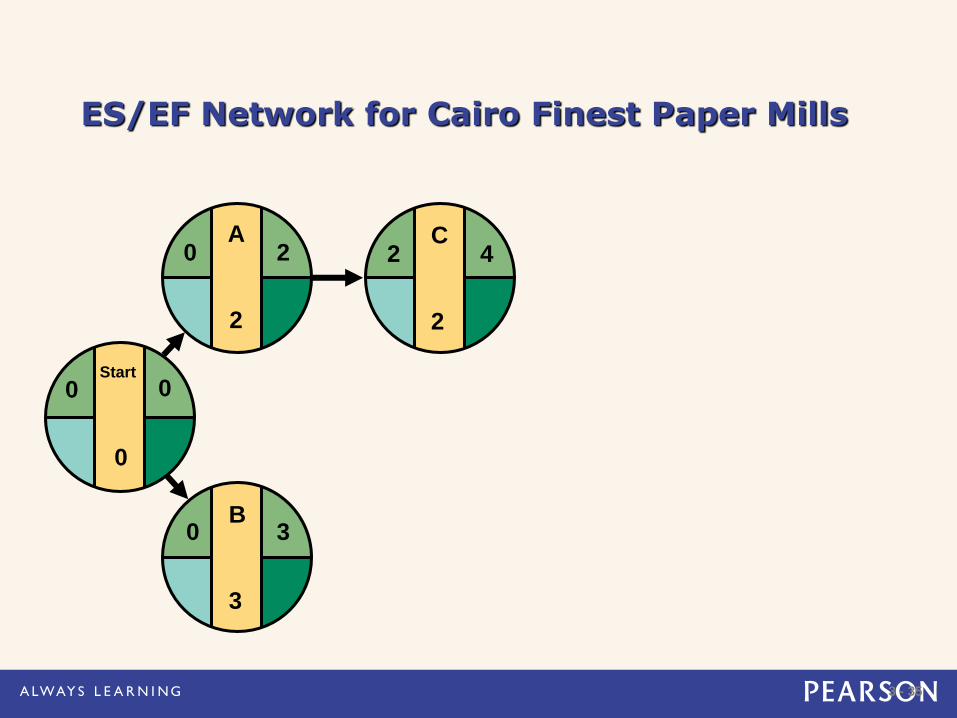
C
2
2 4
ES/EF Network for Cairo Finest Paper Mills
B
3
0 3
Start
0
0
0
A
2
2 0
3 - 36
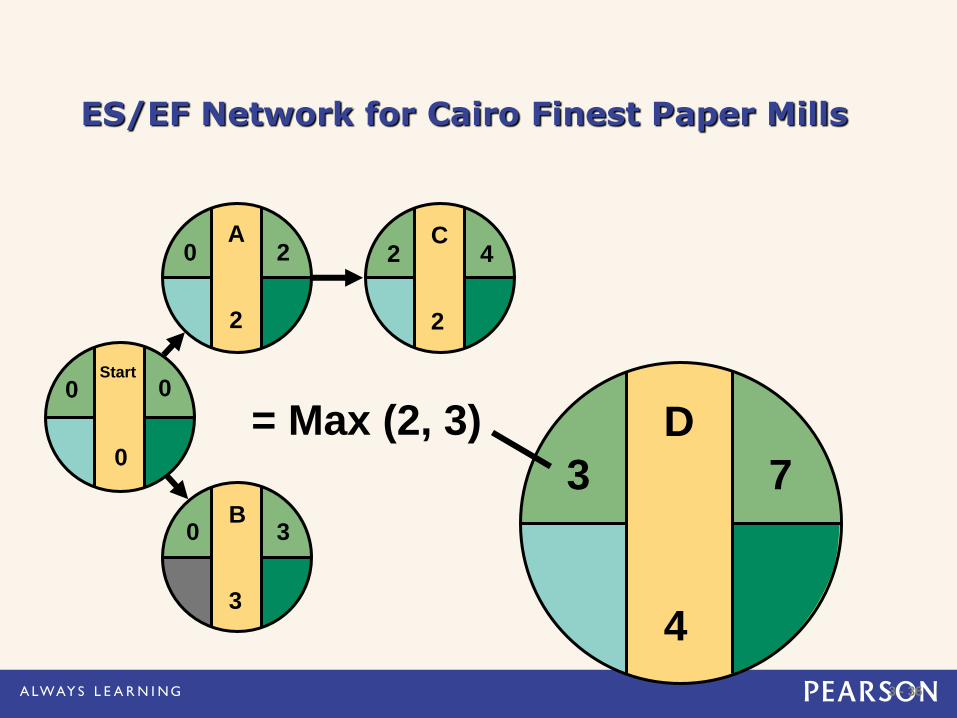
C
2
2 4
ES/EF Network for Cairo Finest Paper Mills
B
3
0 3
Start
0
0
0
A
2
2 0
D
4
7 3
= Max (2, 3)
3 - 37
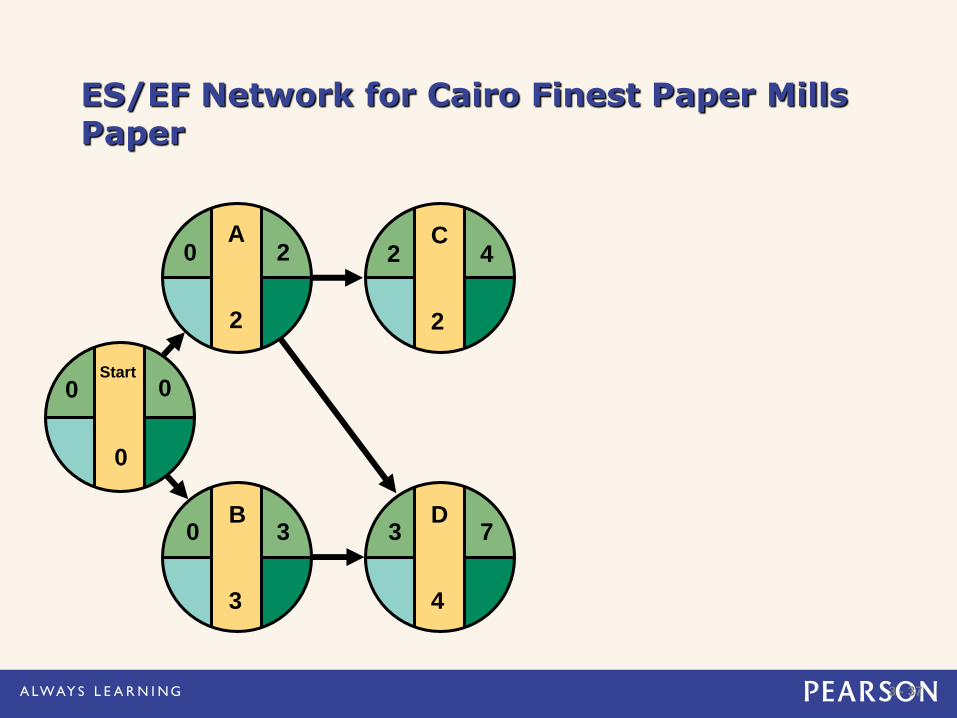
D
4
3 7
C
2
2 4
ES/EF Network for Cairo Finest Paper Mills Paper
B
3
0 3
Start
0
0
0
A
2
2 0
3 - 38
E
4
F
3
G
5
H
2
4 8 13 15
4
8 13
7
D
4
3 7
C
2
2 4
ES/EF Network for Cairo Finest Paper Mills
B
3
0 3
Start
0
0
0
A
2
2 0
Figure 3.11
3 - 39
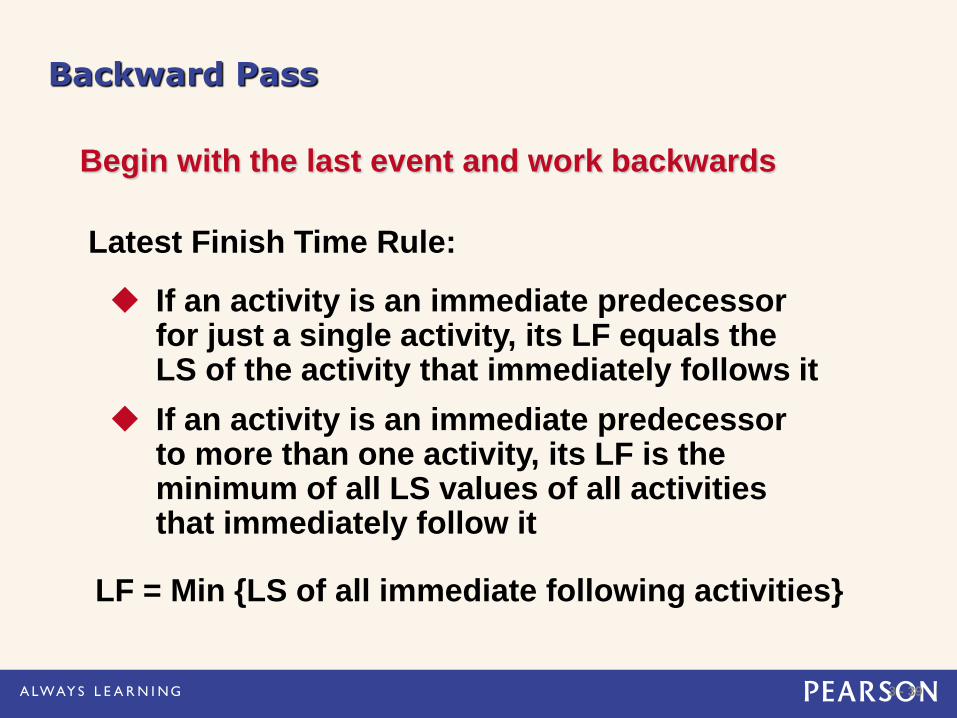
Backward Pass
Begin with the last event and work backwards
Latest Finish Time Rule:
If an activity is an immediate predecessor for just a single activity, its LF equals the LS of the activity that immediately follows it
If an activity is an immediate predecessor to more than one activity, its LF is the minimum of all LS values of all activities that immediately follow it
LF = Min {LS of all immediate following activities}
3 - 40
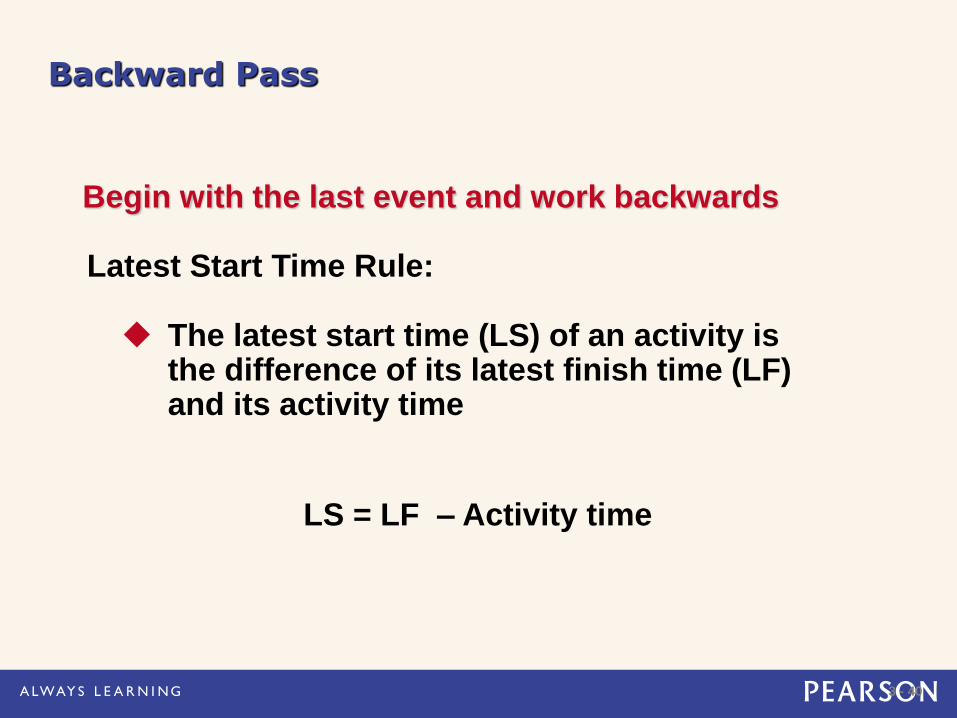
Backward Pass
Begin with the last event and work backwards
Latest Start Time Rule:
The latest start time (LS) of an activity is the difference of its latest finish time (LF) and its activity time
LS = LF – Activity time
3 - 41
LS/LF Times for Cairo Finest Paper Mills
E
4
F
3
G
5
H
2
4 8 13 15
4
8 13
7
D
4
3 7
C
2
2 4
B
3
0 3
Start
0
0
0
A
2
2 0
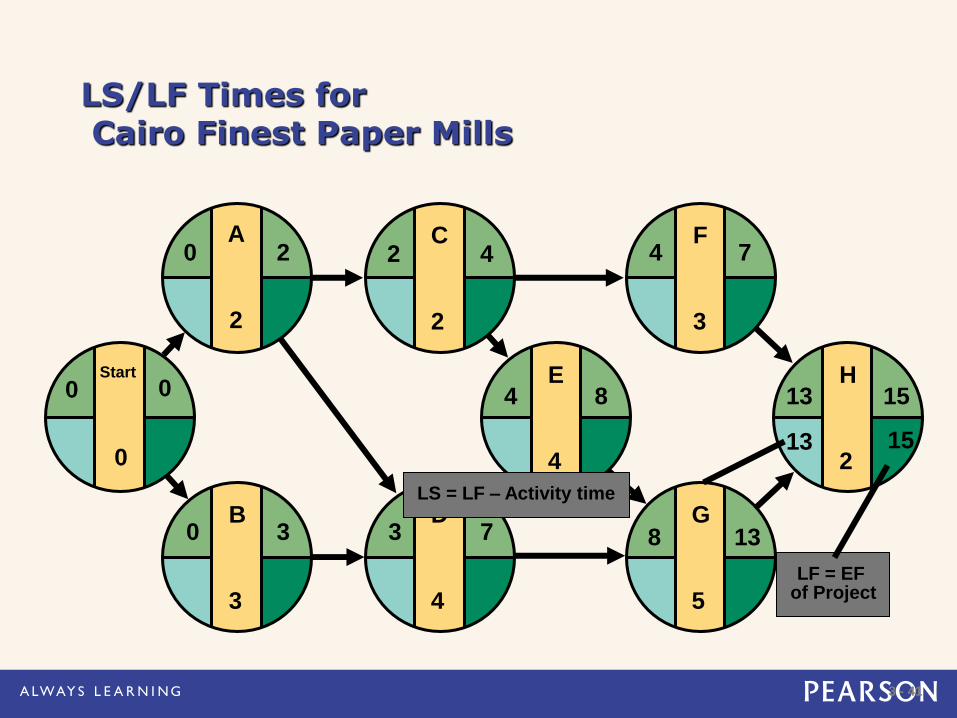
LF = EF of Project
15 13
LS = LF – Activity time
3 - 42
LS/LF Times for Cairo Finest Paper Mills
E
4
F
3
G
5
H
2
4 8 13 15
4
8 13
7
13 15
D
4
3 7
C
2
2 4
B
3
0 3
Start
0
0
0
A
2
2 0
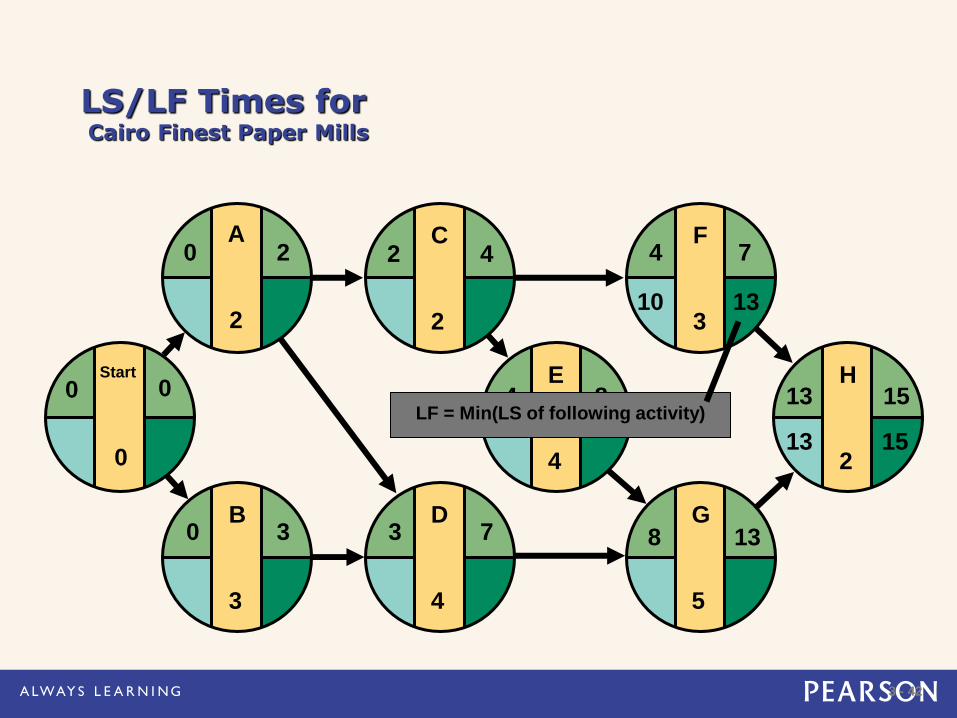
LF = Min(LS of following activity)
10 13
3 - 43
LS/LF Times for Milwaukee Paper
E
4
F
3
G
5
H
2
4 8 13 15
4
8 13
7
13 15
10 13
8 13
4 8
D
4
3 7
C
2
2 4
B
3
0 3
Start
0
0
0
A
2
2 0
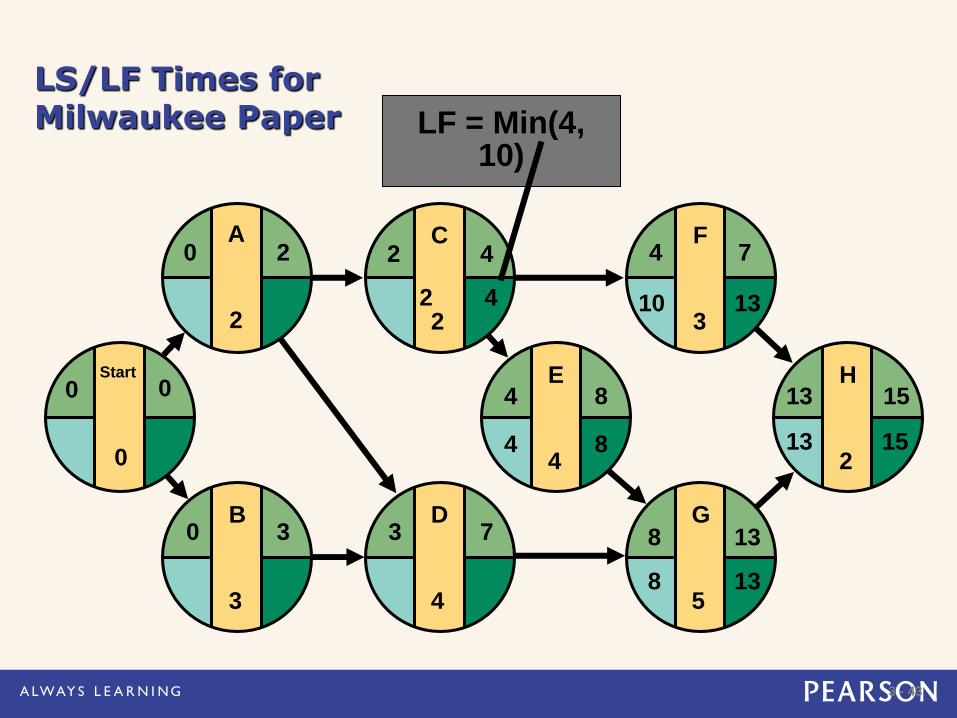
LF = Min(4, 10)
4 2
3 - 44
LS/LF Times for Cairo Finest
E
4
F
3
G
5
H
2
4 8 13 15
4
8 13
7
13 15
10 13
8 13
4 8
D
4
3 7
C
2
2 4
B
3
0 3
Start
0
0
0
A
2
2 0
4 2
8 4
2 0
4 1
0 0
3 - 45
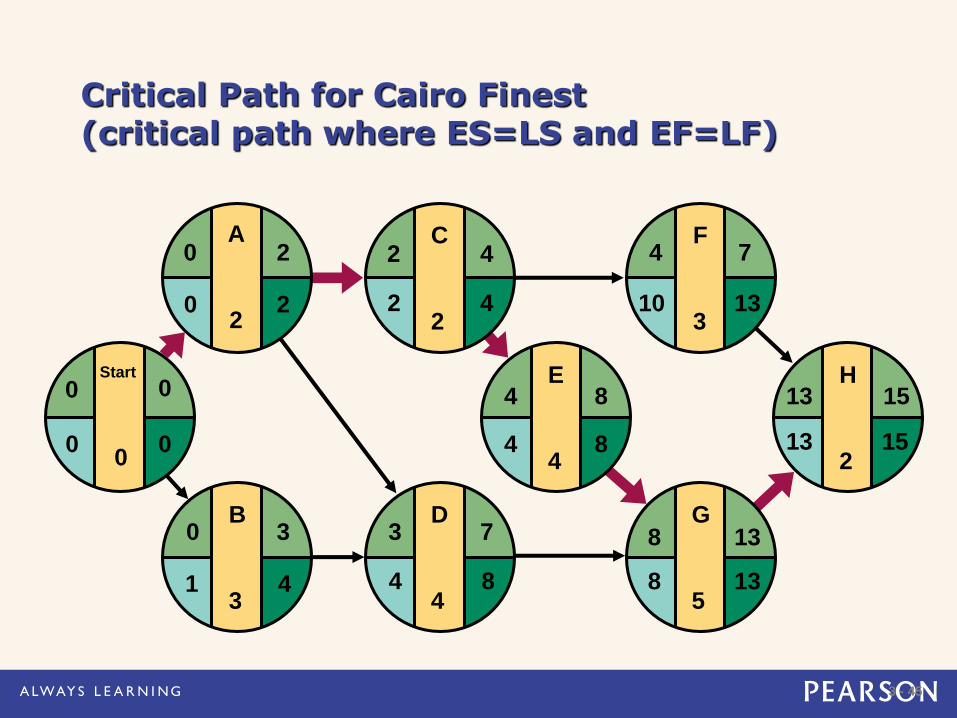
Critical Path for Cairo Finest (critical path where ES=LS and EF=LF)
E
4
F
3
G
5
H
2
4 8 13 15
4
8 13
7
13 15
10 13
8 13
4 8
D
4
3 7
C
2
2 4
B
3
0 3
Start
0
0
0
A
2
2 0
4 2
8 4
2 0
4 1
0 0
3 - 46
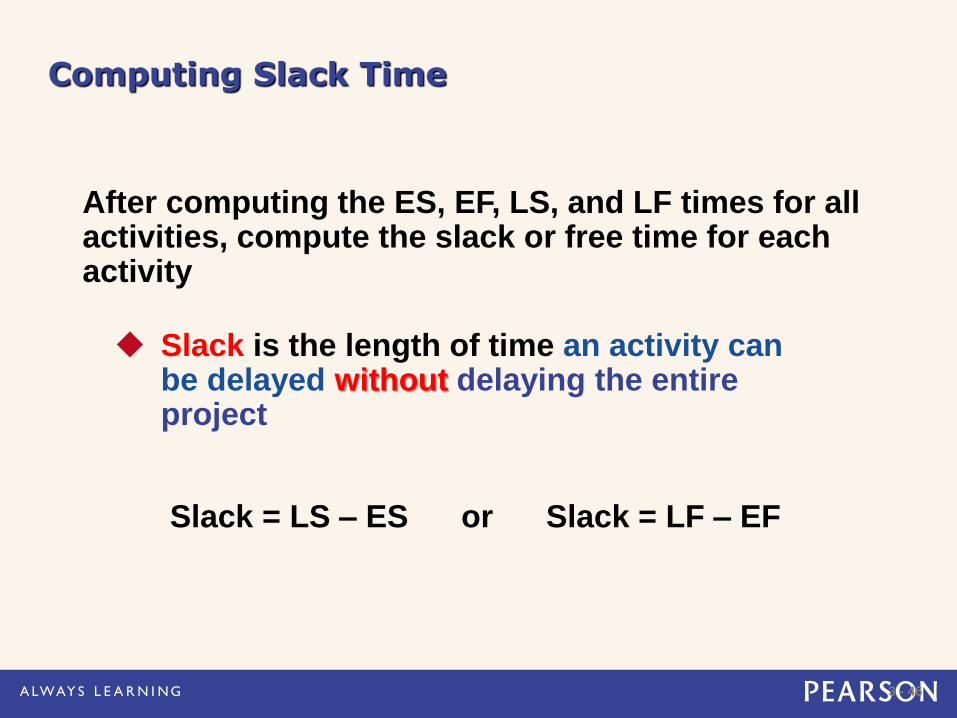
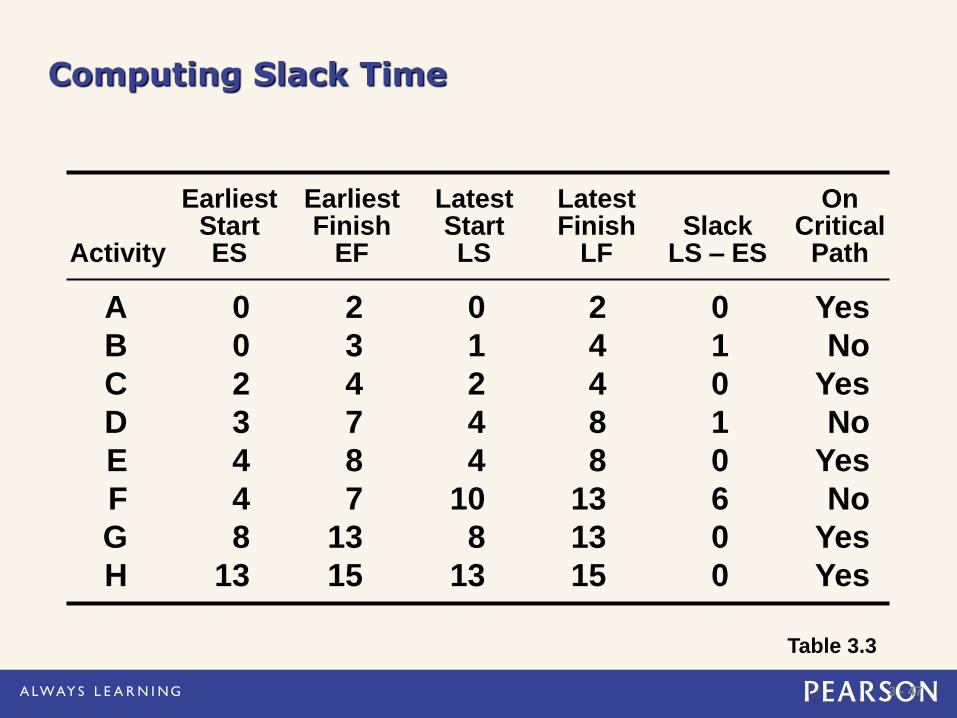
Computing Slack Time
After computing the ES, EF, LS, and LF times for all activities, compute the slack or free time for each activity
Slack is the length of time an activity can be delayed without delaying the entire project
Slack = LS – ES or Slack = LF – EF
3 - 47
Computing Slack Time
Table 3.3
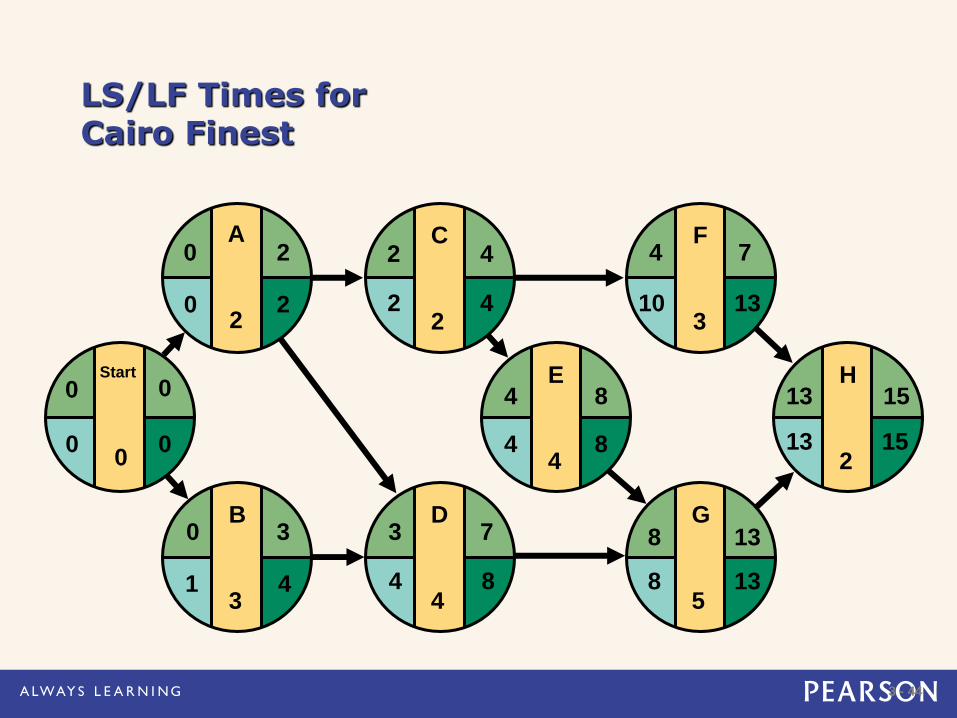
Earliest Earliest Latest Latest On Start Finish Start Finish Slack Critical Activity ES EF LS LF LS – ES Path
A 0 2 0 2 0 Yes
B 0 3 1 4 1 No
C 2 4 2 4 0 Yes
D 3 7 4 8 1 No
E 4 8 4 8 0 Yes
F 4 7 10 13 6 No
G 8 13 8 13 0 Yes
H 13 15 13 15 0 Yes
3 - 48
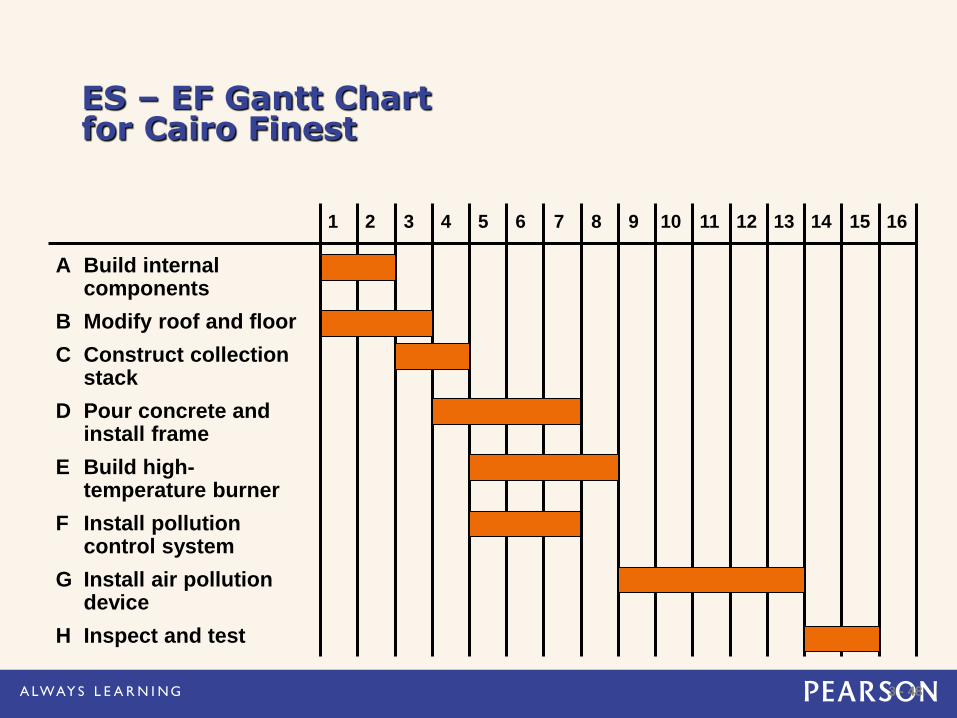
ES – EF Gantt Chart for Cairo Finest
A Build internal components
B Modify roof and floor
C Construct collection stack
D Pour concrete and install frame
E Build high-temperature burner
F Install pollution control system
G Install air pollution device
H Inspect and test
1 2 3 4 5 6 7 8 9 10 11 12 13 14 15 16
3 - 49
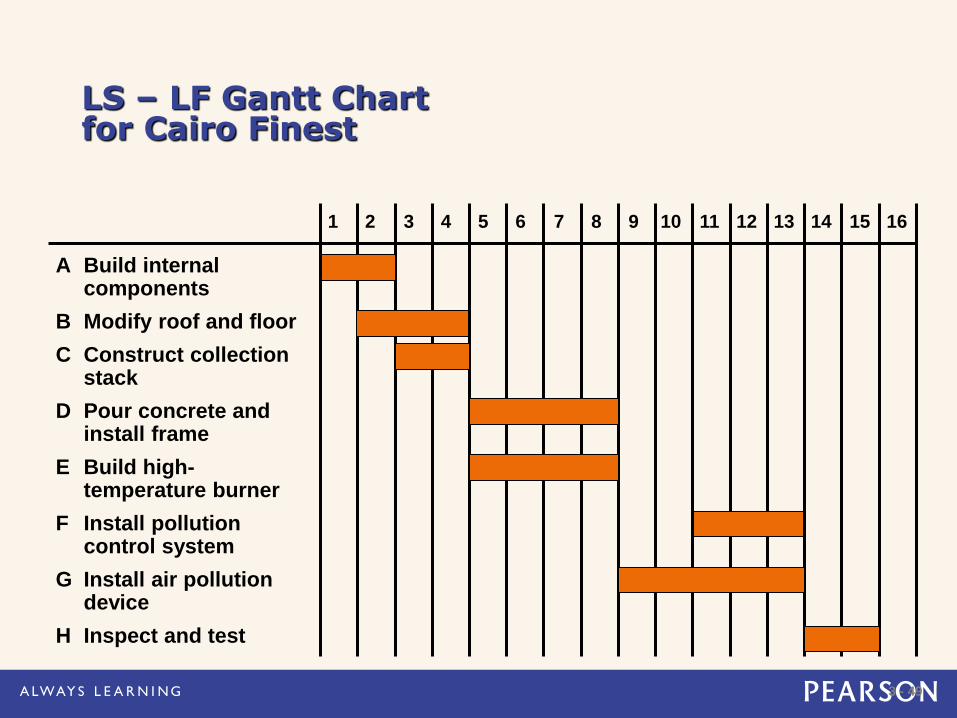
LS – LF Gantt Chart for Cairo Finest
A Build internal components
B Modify roof and floor
C Construct collection stack
D Pour concrete and install frame
E Build high-temperature burner
F Install pollution control system
G Install air pollution device
H Inspect and test
1 2 3 4 5 6 7 8 9 10 11 12 13 14 15 16
3 - 50
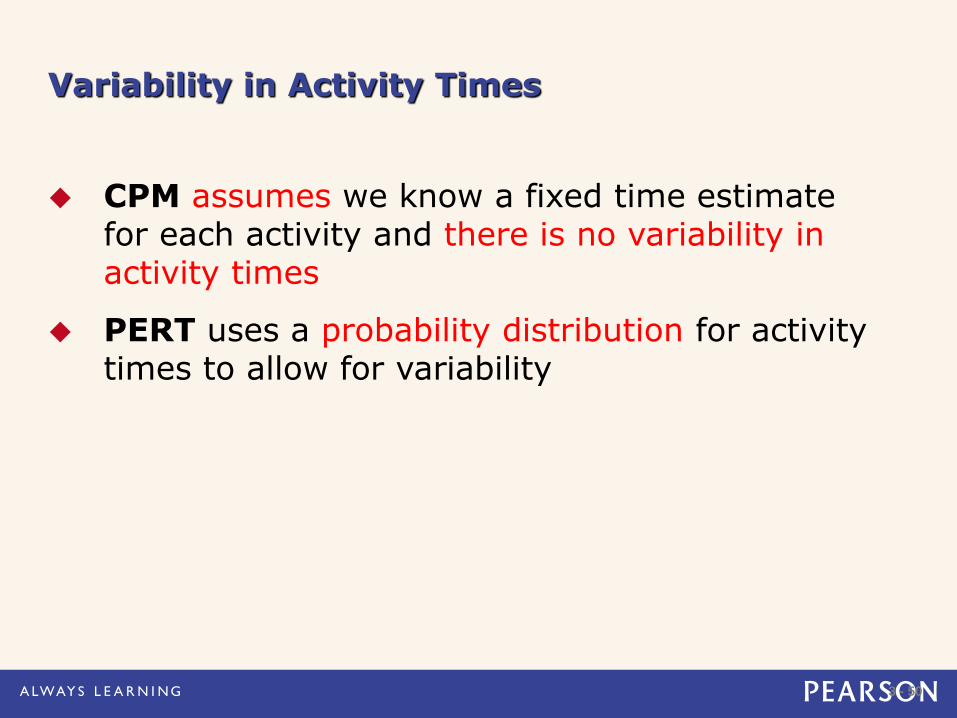
CPM assumes we know a fixed time estimate for each activity and there is no variability in activity times
PERT uses a probability distribution for activity times to allow for variability
Variability in Activity Times
3 - 51
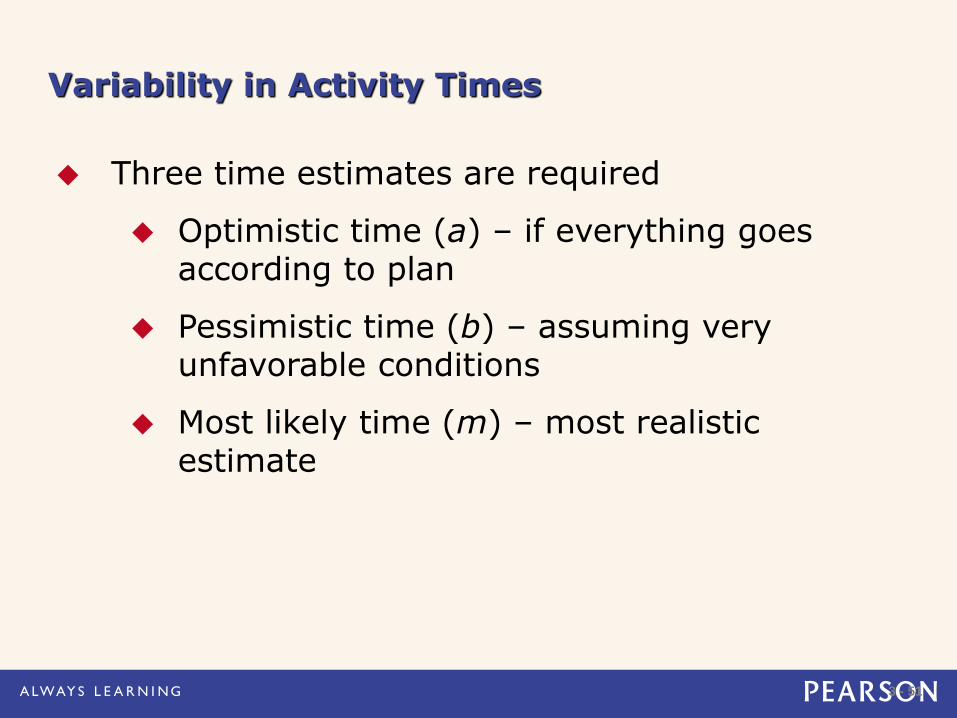
Three time estimates are required
Optimistic time (a) – if everything goes according to plan
Pessimistic time (b) – assuming very unfavorable conditions
Most likely time (m) – most realistic estimate
Variability in Activity Times
3 - 52
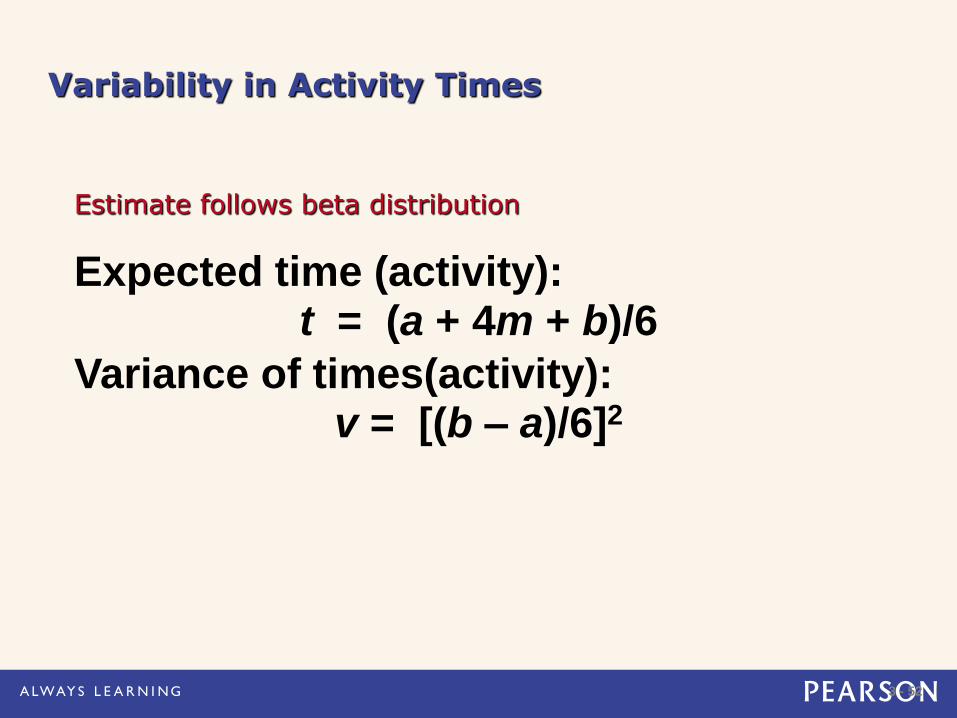
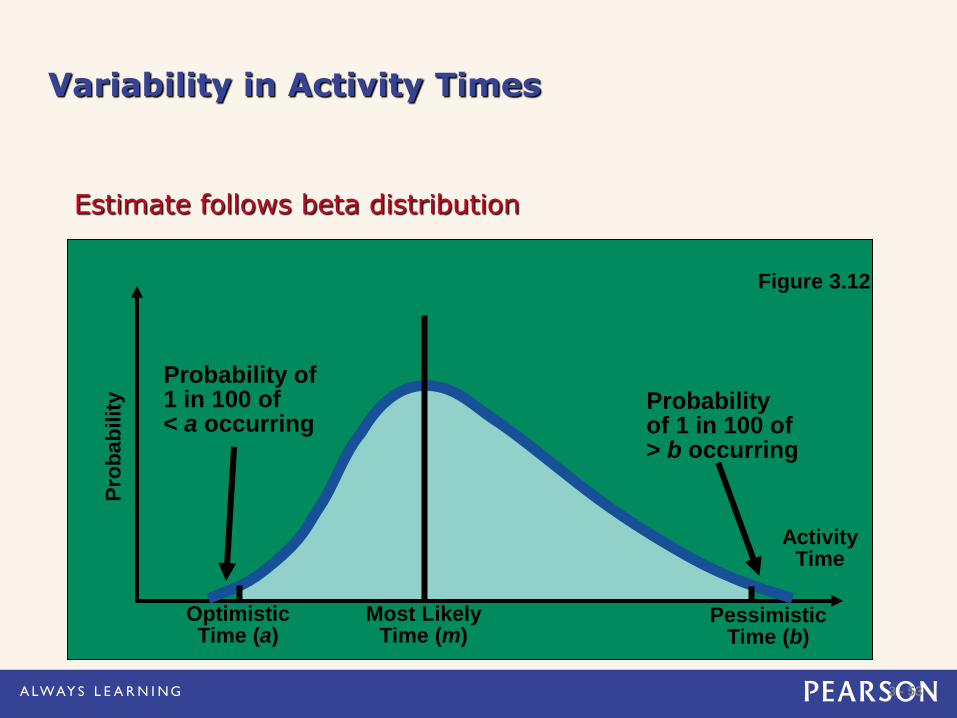
Estimate follows beta distribution
Variability in Activity Times
Expected time (activity):
Variance of times(activity):
t = (a + 4m + b)/6
v = [(b – a)/6]2
3 - 53
Estimate follows beta distribution
Variability in Activity Times
Expected time:
Variance of times:
t = (a + 4m + b)/6
v = [(b − a)/6]2 Probability of 1 in 100 of > b occurring
Probability of 1 in 100 of < a occurring
Pro
bab
ilit
y
Optimistic Time (a)
Most Likely Time (m)
Pessimistic Time (b)
Activity Time
Figure 3.12
3 - 54
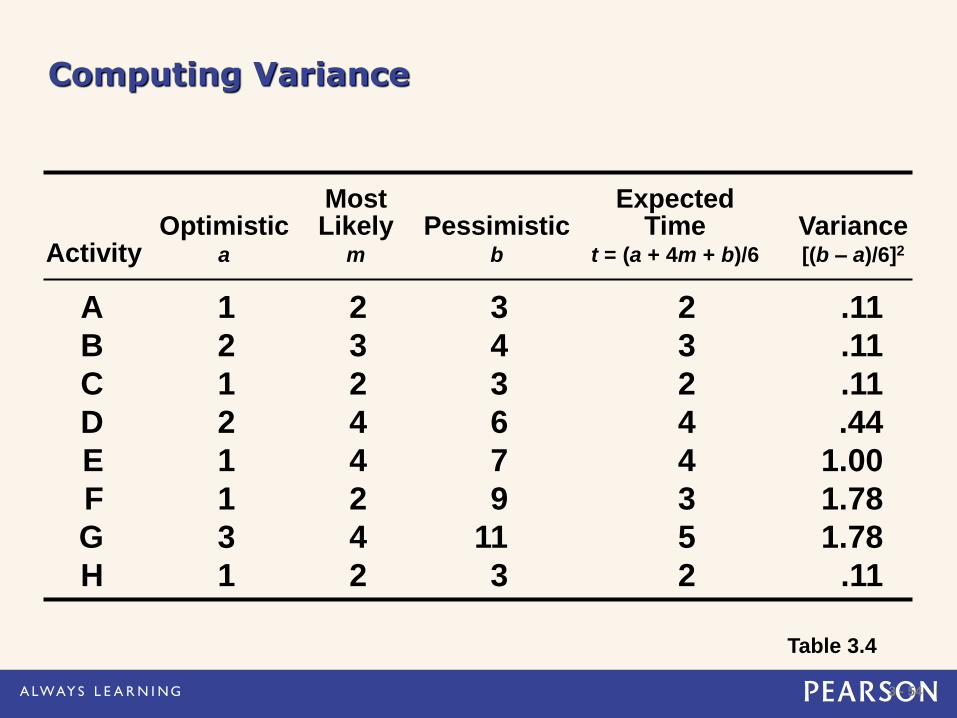
Computing Variance
Table 3.4
Most Expected Optimistic Likely Pessimistic Time Variance Activity a m b t = (a + 4m + b)/6 [(b – a)/6]2
A 1 2 3 2 .11
B 2 3 4 3 .11
C 1 2 3 2 .11
D 2 4 6 4 .44
E 1 4 7 4 1.00
F 1 2 9 3 1.78
G 3 4 11 5 1.78
H 1 2 3 2 .11
3 - 55
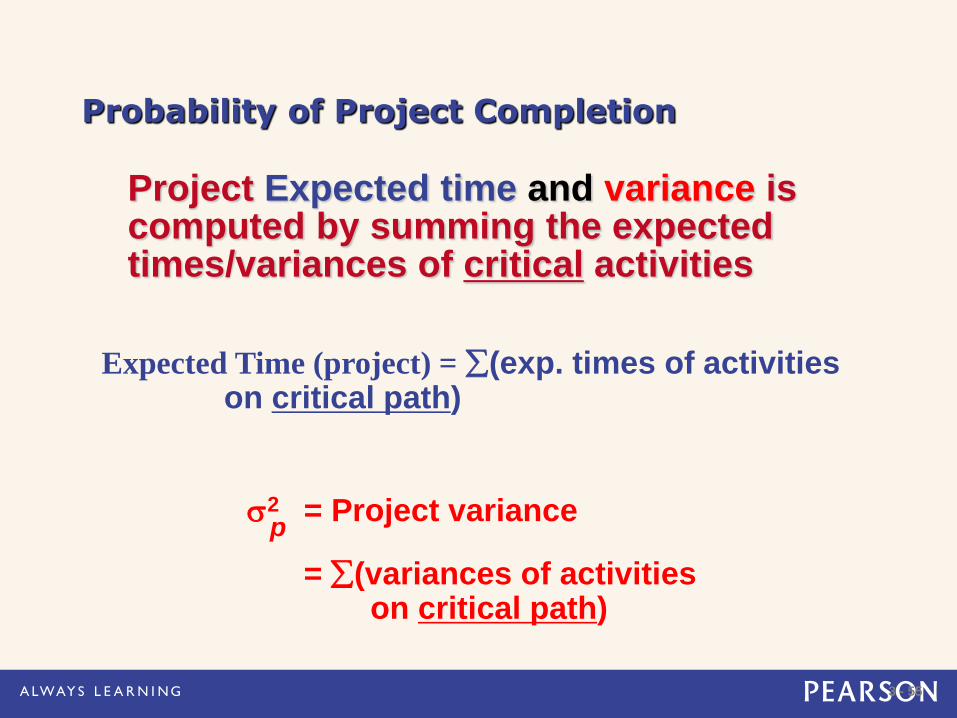
Probability of Project Completion
Project Expected time and variance is computed by summing the expected times/variances of critical activities
s2 = Project variance
= (variances of activities on critical path)
p
Expected Time (project) = (exp. times of activities on critical path)
3 - 56
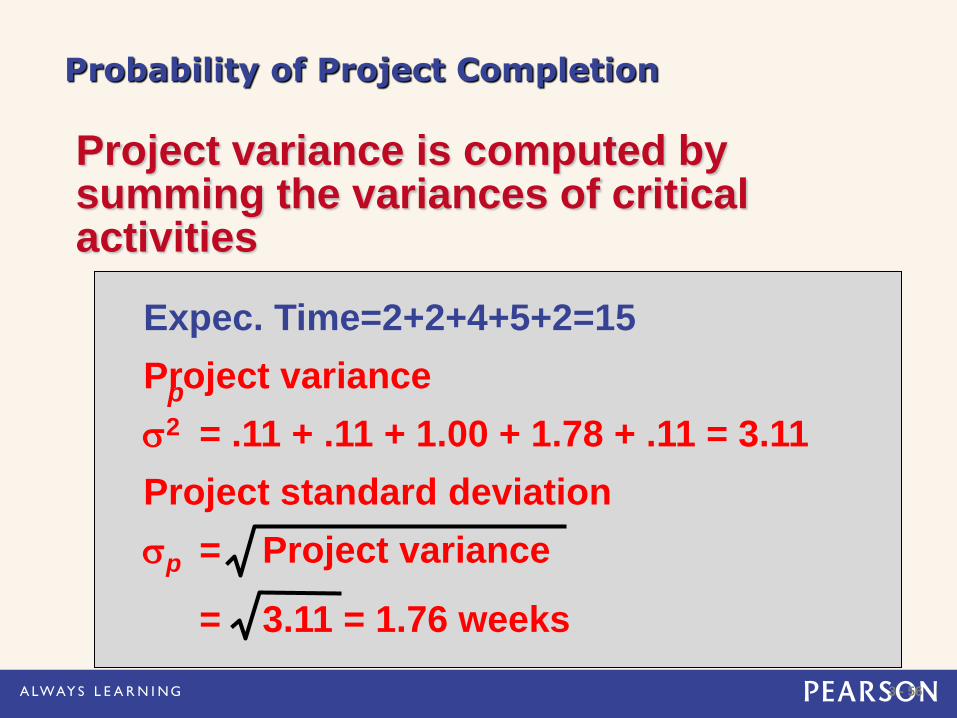
Probability of Project Completion
Project variance is computed by summing the variances of critical activities
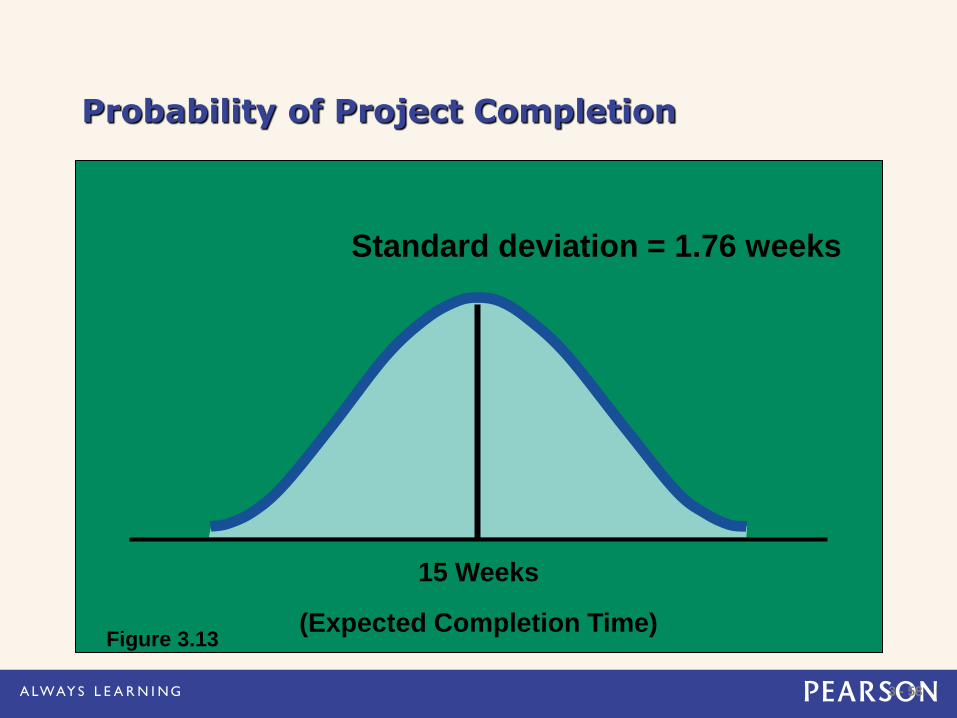
Expec. Time=2+2+4+5+2=15
Project variance
s2 = .11 + .11 + 1.00 + 1.78 + .11 = 3.11
Project standard deviation
sp = Project variance
= 3.11 = 1.76 weeks
p
3 - 57
Probability of Project Completion
PERT makes two more assumptions:
Total project completion times follow a normal probability distribution
Activity times are statistically independent
3 - 58
Probability of Project Completion
Standard deviation = 1.76 weeks
15 Weeks
(Expected Completion Time) Figure 3.13
3 - 59
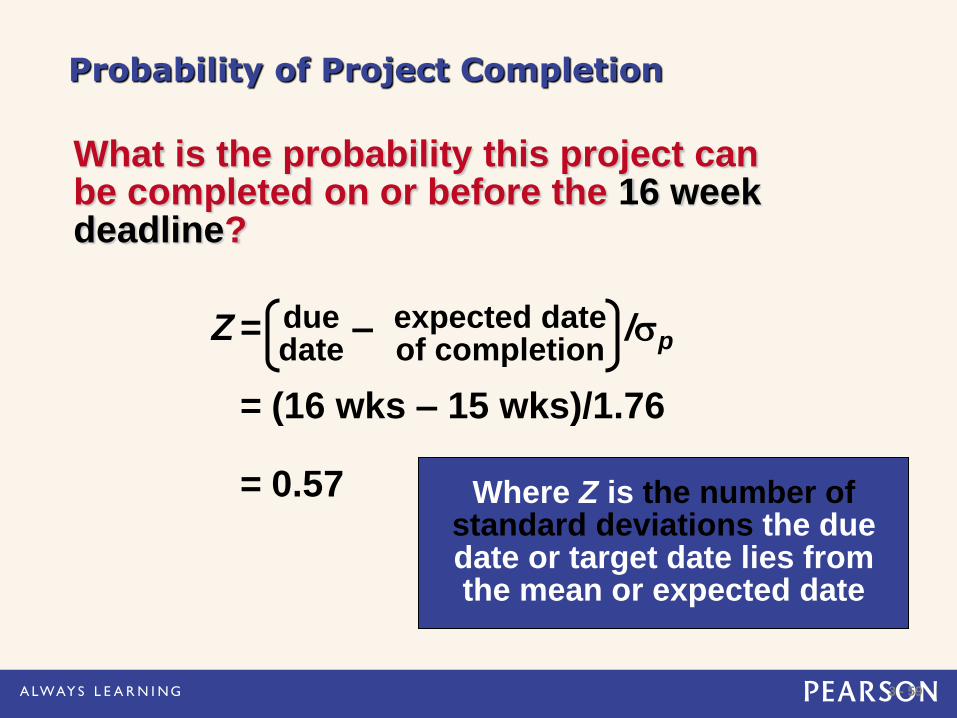
Probability of Project Completion
What is the probability this project can be completed on or before the 16 week deadline?
Z = – /sp
= (16 wks – 15 wks)/1.76
= 0.57
due expected date date of completion
Where Z is the number of standard deviations the due date or target date lies from the mean or expected date
3 - 60 © 2013 Pearson Education
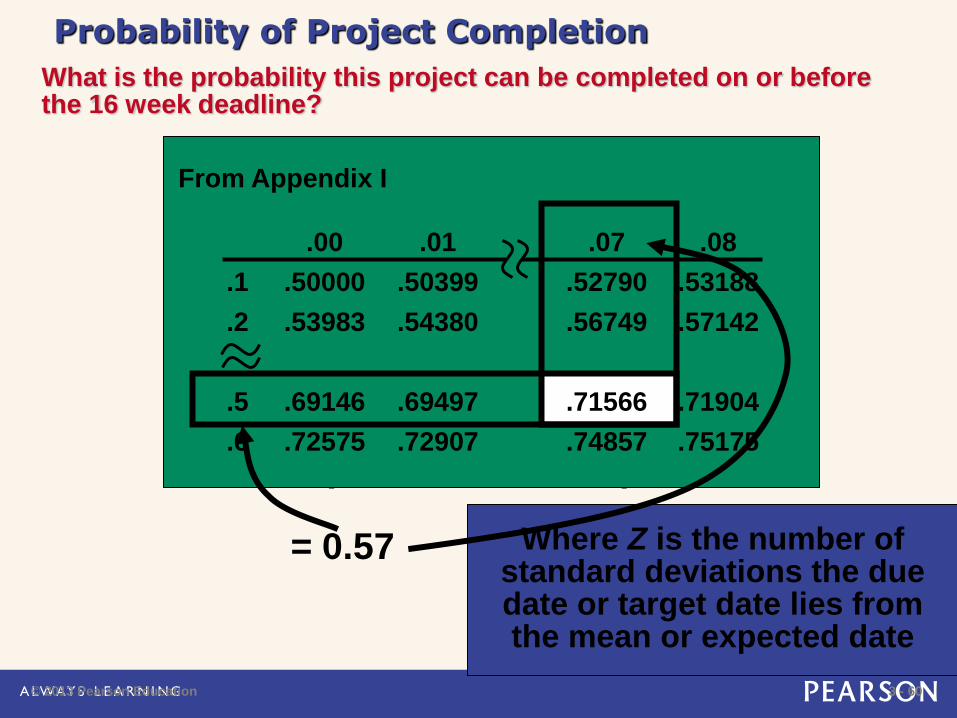
Probability of Project Completion
What is the probability this project can be completed on or before the 16 week deadline?
Z = − /sp
= (16 wks − 15 wks)/1.76
= 0.57
due expected date date of completion
Where Z is the number of standard deviations the due date or target date lies from the mean or expected date
.00 .01 .07 .08
.1 .50000 .50399 .52790 .53188
.2 .53983 .54380 .56749 .57142
.5 .69146 .69497 .71566 .71904
.6 .72575 .72907 .74857 .75175
From Appendix I
3 - 61
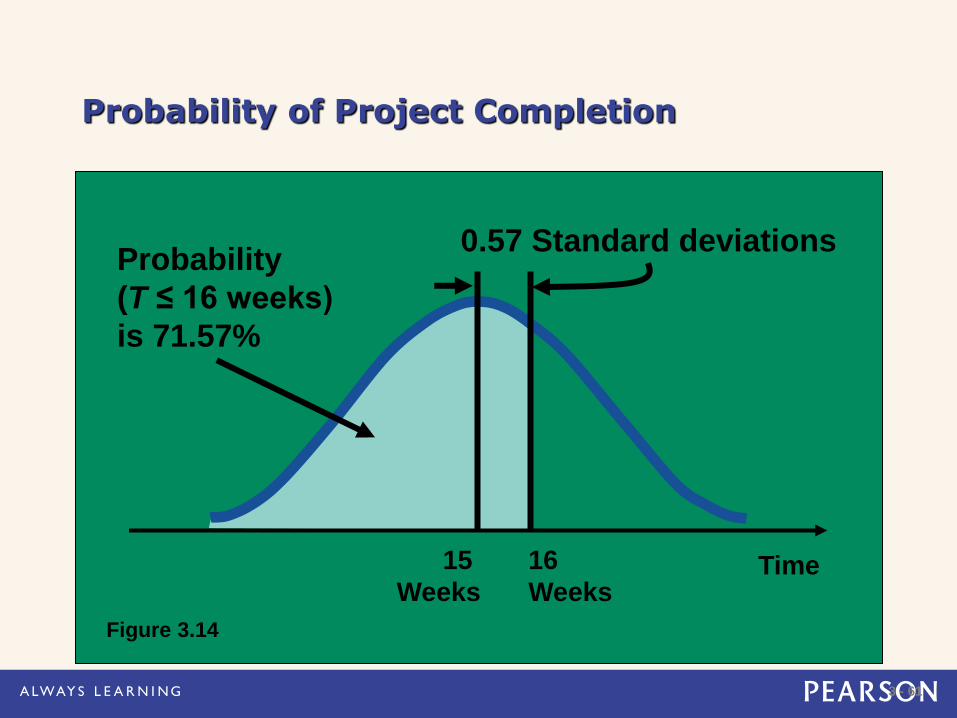
Probability of Project Completion
Time
Probability
(T ≤ 16 weeks)
is 71.57%
Figure 3.14
0.57 Standard deviations
15 16
Weeks Weeks
3 - 62
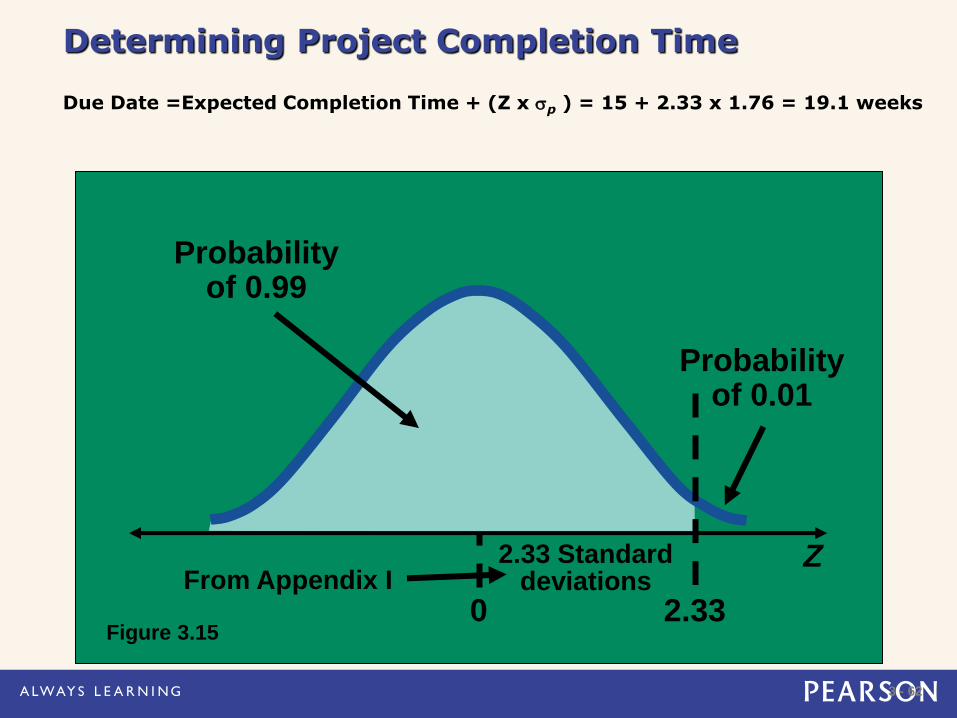
Determining Project Completion Time Due Date =Expected Completion Time + (Z x sp ) = 15 + 2.33 x 1.76 = 19.1 weeks
Probability of 0.01
Z
Figure 3.15
From Appendix I
Probability of 0.99
2.33 Standard deviations
0 2.33
3 - 63
Variability of Completion Time for Noncritical Paths
Variability of times for activities on noncritical paths must be considered when finding the probability of finishing in a specified time
Variation in noncritical activity may cause change in critical path
3 - 64
What Project Management Has Provided So Far
1. The project’s expected completion time is 15 weeks
2. There is a 71.57% chance the equipment will be in place by the 16 week deadline
3. Five activities (A, C, E, G, and H) are on the critical path
4. Three activities (B, D, F) are not on the critical path and have slack time
5. A detailed schedule is available
3 - 65
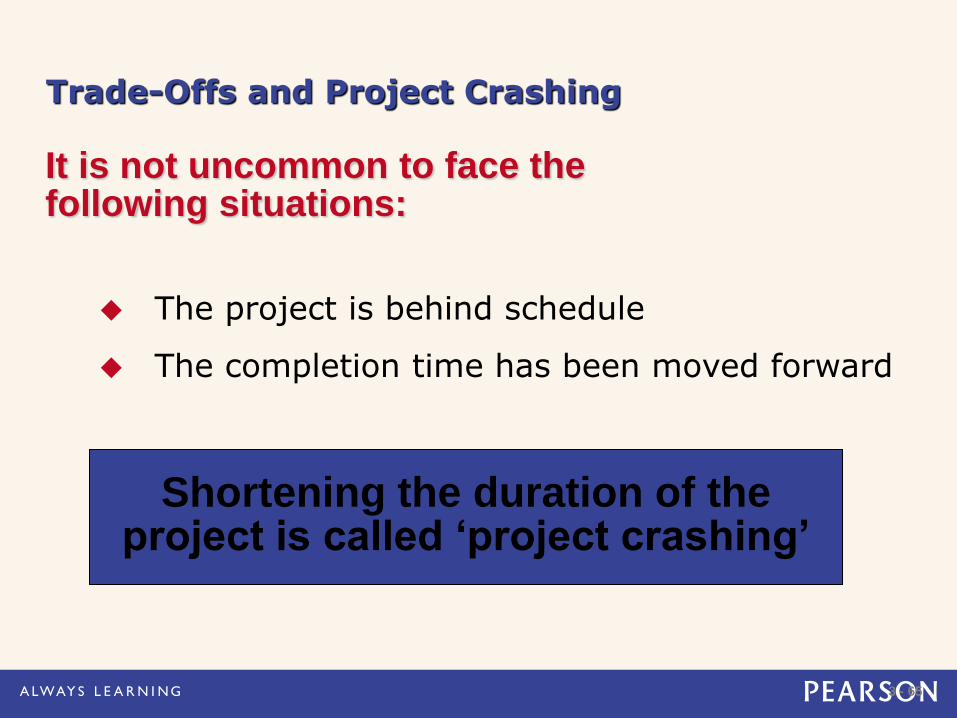
Trade-Offs and Project Crashing
The project is behind schedule
The completion time has been moved forward
It is not uncommon to face the following situations:
Shortening the duration of the project is called ‘project crashing’
3 - 66
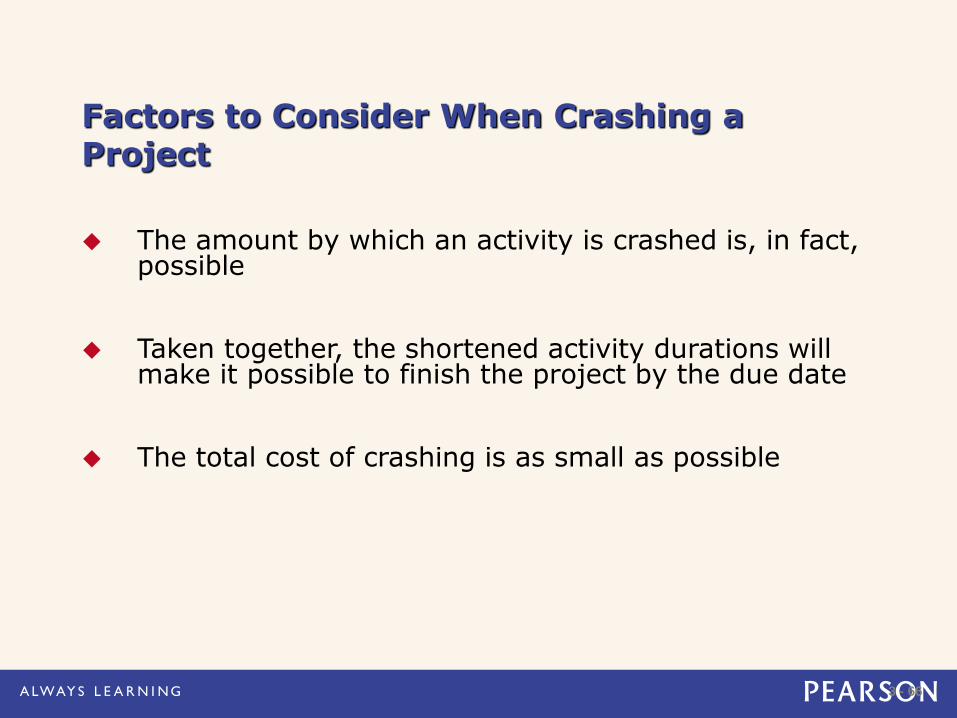
Factors to Consider When Crashing a Project
The amount by which an activity is crashed is, in fact, possible
Taken together, the shortened activity durations will make it possible to finish the project by the due date
The total cost of crashing is as small as possible
3 - 67
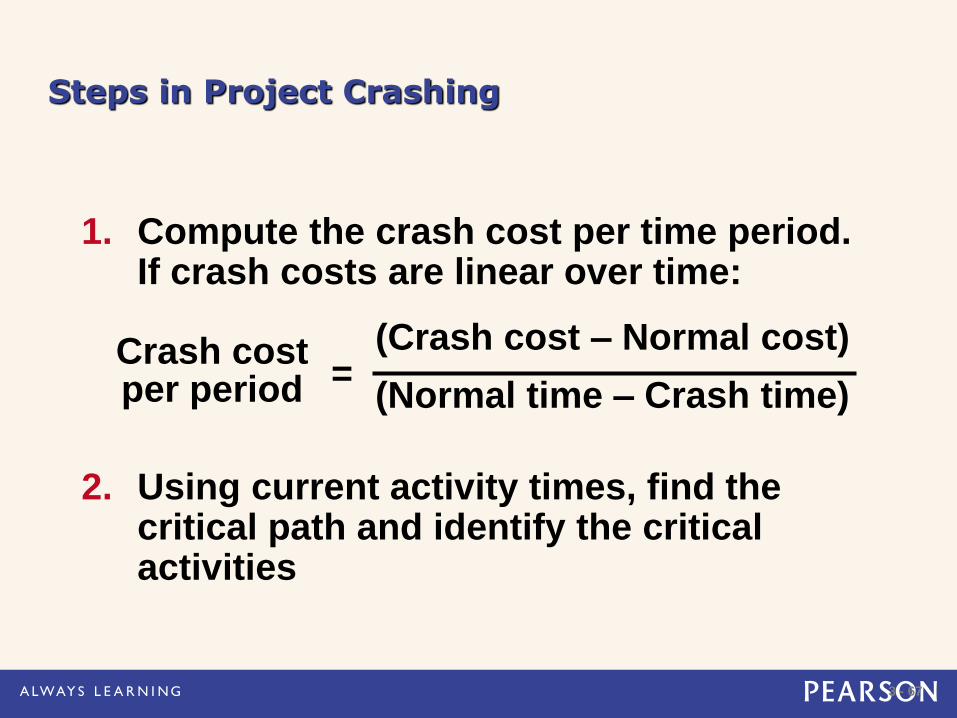
Steps in Project Crashing
1. Compute the crash cost per time period. If crash costs are linear over time:
Crash cost per period =
(Crash cost – Normal cost)
(Normal time – Crash time)
2. Using current activity times, find the critical path and identify the critical activities
3 - 68
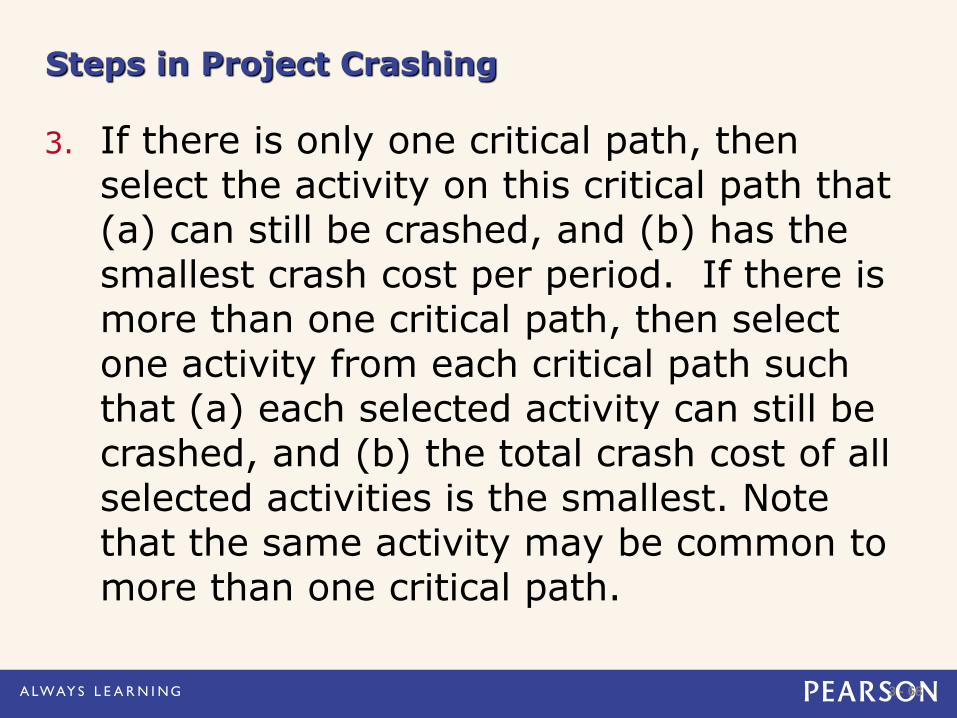
Steps in Project Crashing
3. If there is only one critical path, then select the activity on this critical path that (a) can still be crashed, and (b) has the smallest crash cost per period. If there is more than one critical path, then select one activity from each critical path such that (a) each selected activity can still be crashed, and (b) the total crash cost of all selected activities is the smallest. Note that the same activity may be common to more than one critical path.
3 - 69
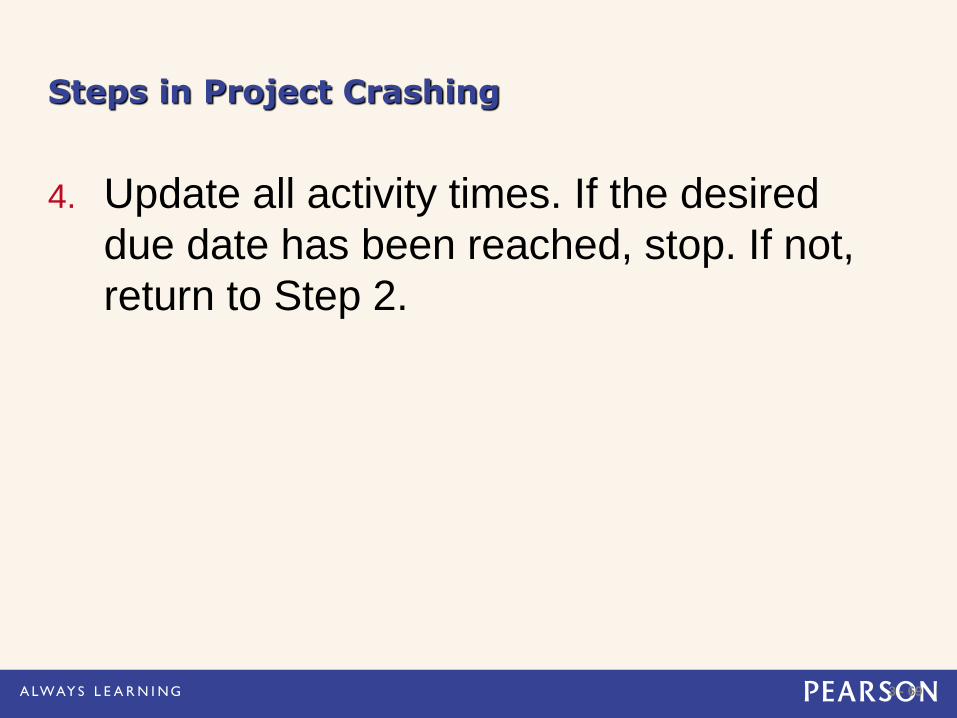
Steps in Project Crashing
4. Update all activity times. If the desired
due date has been reached, stop. If not,
return to Step 2.
3 - 70
Crashing The Project
Table 3.5
Time (Wks) Cost ($)
Crash Cost Critical Activity Normal Crash Normal Crash Per Wk ($) Path?
A 2 1 22,000 22,750 750 Yes
B 3 1 30,000 34,000 2,000 No
C 2 1 26,000 27,000 1,000 Yes
D 4 2 48,000 49,000 1,000 No
E 4 2 56,000 58,000 1,000 Yes
F 3 2 30,000 30,500 500 No
G 5 2 80,000 84,500 1,500 Yes
H 2 1 16,000 19,000 3,000 Yes
3 - 71 © 2013 Pearson Education
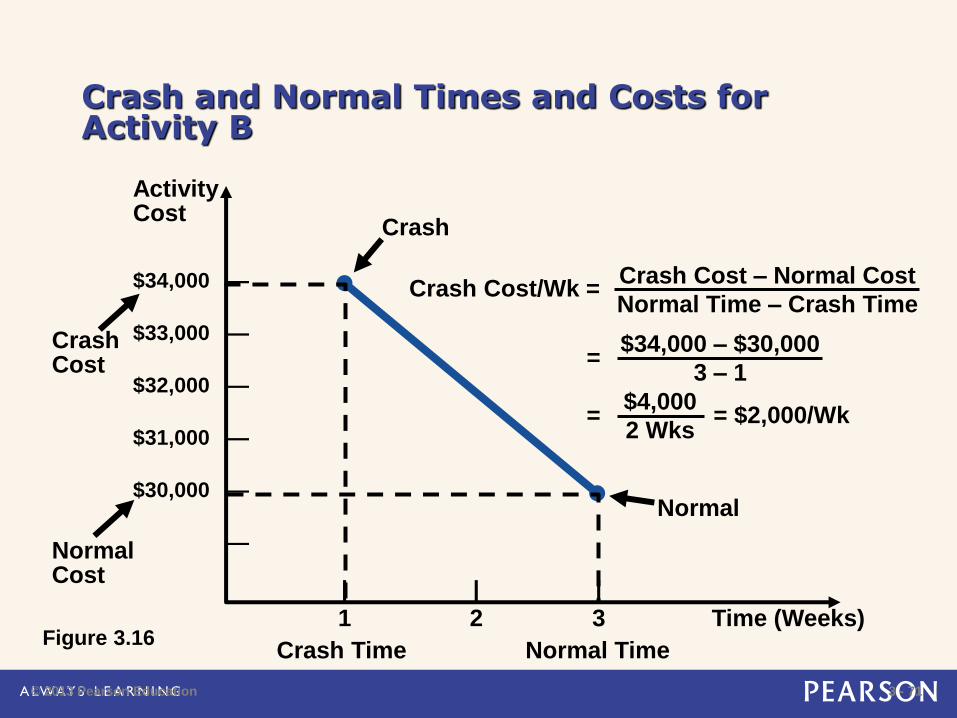
Crash and Normal Times and Costs for Activity B
| | |
1 2 3 Time (Weeks)
$34,000 —
$33,000 —
$32,000 —
$31,000 —
$30,000 —
—
Activity Cost
Crash
Normal
Crash Time Normal Time
Crash Cost
Normal Cost
Crash Cost/Wk = Crash Cost – Normal Cost
Normal Time – Crash Time
= $34,000 – $30,000
3 – 1
= = $2,000/Wk $4,000
2 Wks
Figure 3.16
3 - 72
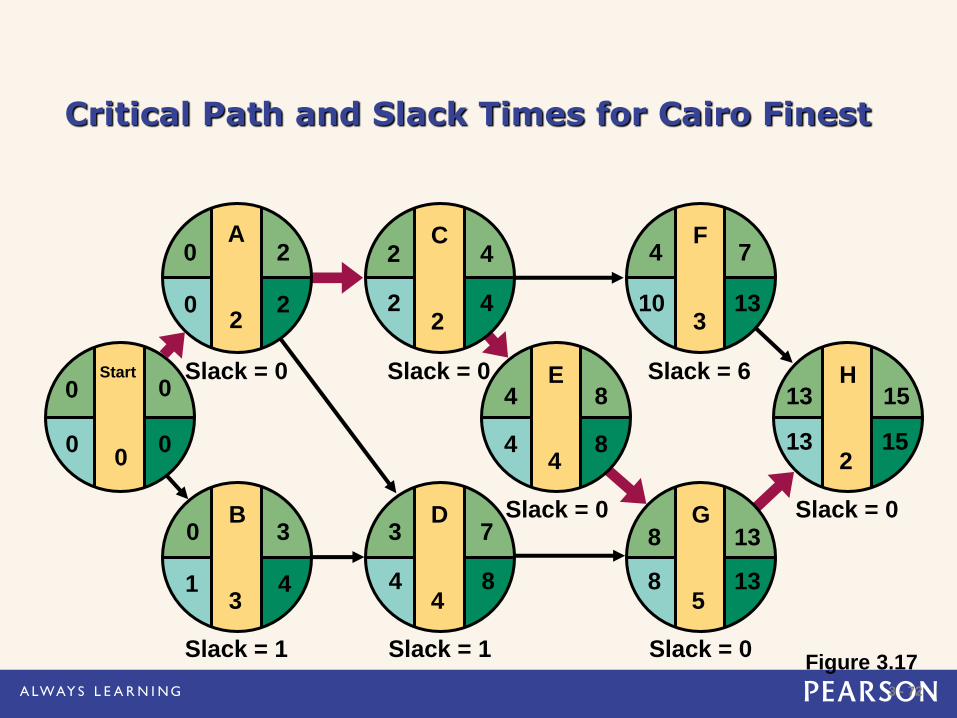
Critical Path and Slack Times for Cairo Finest
Figure 3.17
E
4
F
3
G
5
H
2
4 8 13 15
4
8 13
7
13 15
10 13
8 13
4 8
D
4
3 7
C
2
2 4
B
3
0 3
Start
0
0
0
A
2
2 0
4 2
8 4
2 0
4 1
0 0
Slack = 1 Slack = 1
Slack = 0 Slack = 6
Slack = 0
Slack = 0
Slack = 0
Slack = 0
3 - 73
Advantages of PERT/CPM
1. Especially useful when scheduling and controlling large projects
2. Straightforward concept and not mathematically complex
3. Graphical networks help highlight relationships among project activities
4. Critical path and slack time analyses help pinpoint activities that need to be closely watched
3 - 74
Advantages of PERT/CPM
5. Project documentation and graphics point out who is responsible for various activities
6. Applicable to a wide variety of projects
7. Useful in monitoring not only schedules but costs as well
3 - 75
1. Project activities have to be clearly defined, independent,
and stable in their relationships
2. Precedence relationships must be specified and
networked together
3. Time estimates tend to be subjective and are subject to
fudging by managers
4. There is an inherent danger of too much emphasis being
placed on the longest, or critical, path
Limitations of PERT/CPM
3 - 76
Project Management Software
There are several popular packages for managing projects
Primavera
MacProject
Pertmaster
VisiSchedule
Time Line
Microsoft Project
3 - 77
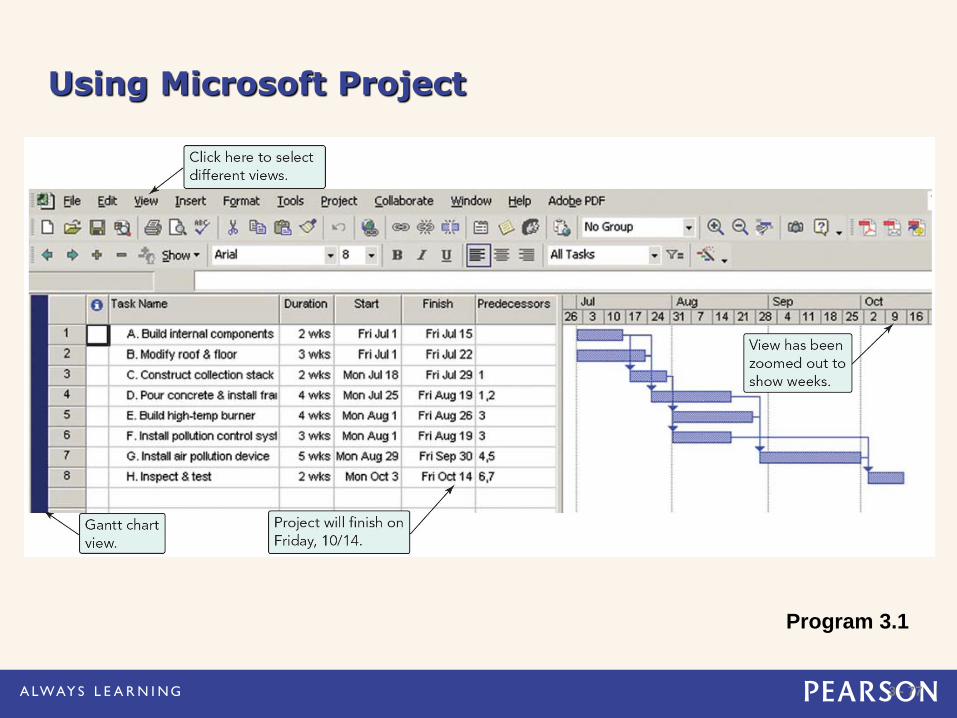
Using Microsoft Project
Program 3.1
3 - 78
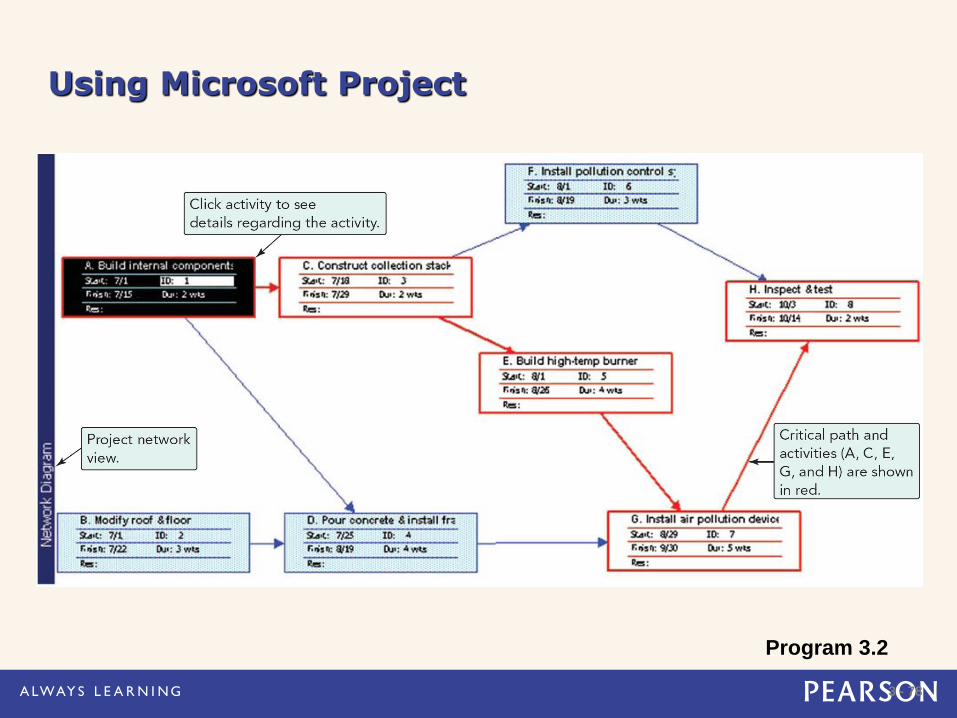
Using Microsoft Project
Program 3.2
3 - 79
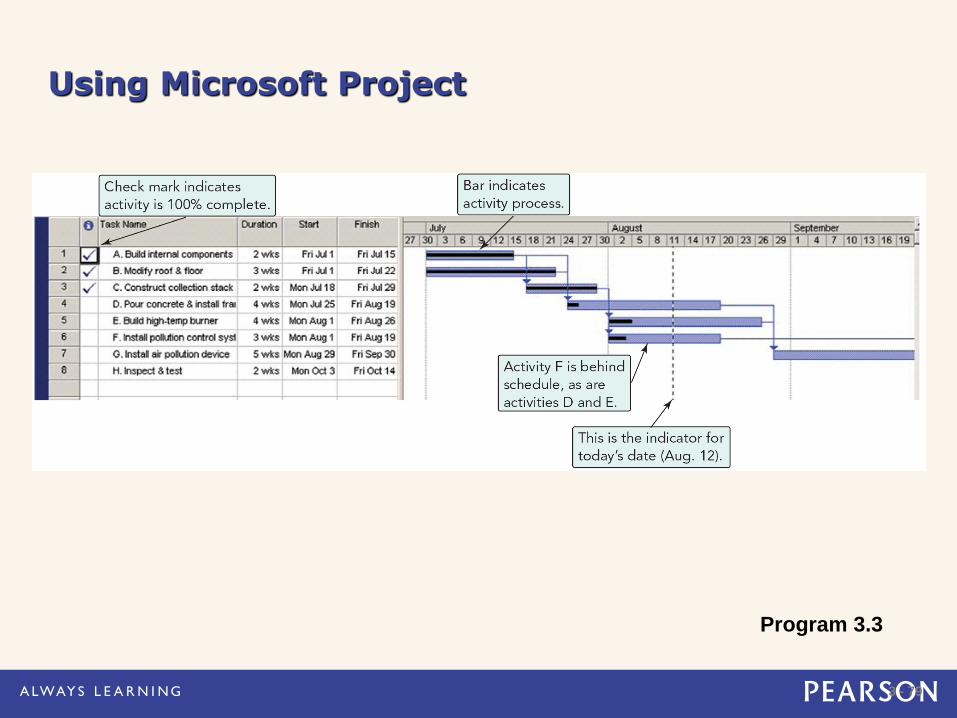
Using Microsoft Project
Program 3.3
Related Documents