Hae-Jin Choi School of Mechanical Engineering, Chung-Ang University 3. Factorial Experiments (Ch.5. Factorial Experiments) 1 DOE and Optimization

Welcome message from author
This document is posted to help you gain knowledge. Please leave a comment to let me know what you think about it! Share it to your friends and learn new things together.
Transcript
Hae-Jin ChoiSchool of Mechanical Engineering,
Chung-Ang University
3. Factorial Experiments
(Ch.5. Factorial Experiments)
1DOE and Optimization
2
Introduction to Factorials
Most experiments for process and quality improvement involve several variables. Factorial experimental designs are used in such situations. Specially, by a factorial experiment we mean that in each complete trial or replicate of the experiment all possible combinations of the levels of the factors are investigated. Thus, if there are two factors A and B with a levels of factor A and blevels of factor B, then each replicate contains all abpossible combinations.
Some Basic Definitions
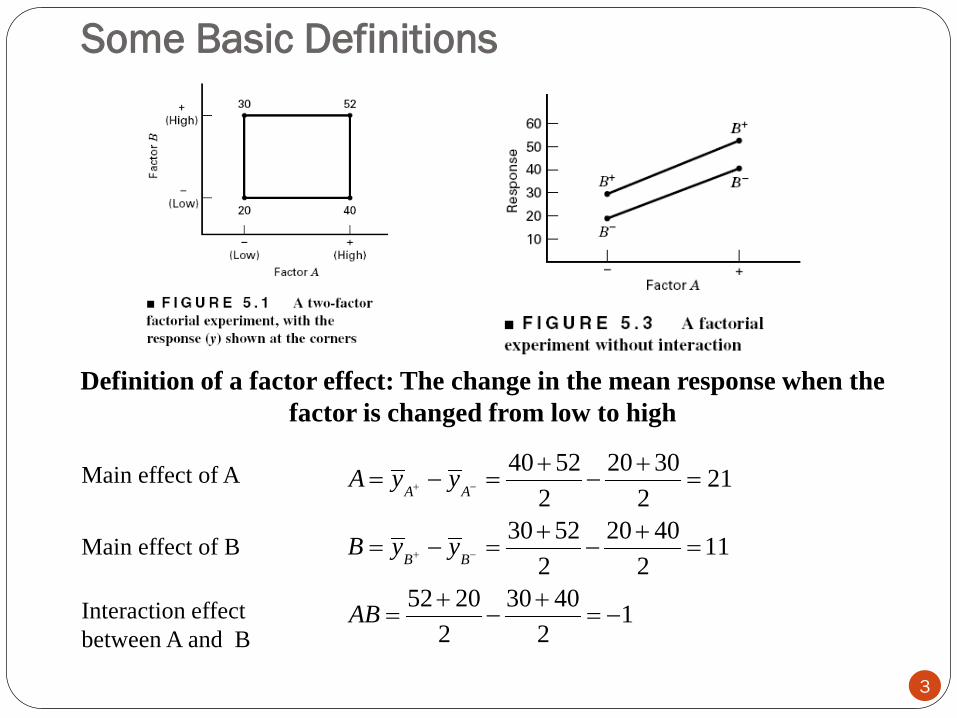
Definition of a factor effect: The change in the mean response when the
factor is changed from low to high
40 52 20 3021
2 2
30 52 20 4011
2 2
52 20 30 401
2 2
A A
B B
A y y
B y y
AB
Main effect of A
Main effect of B
Interaction effect
between A and B
3
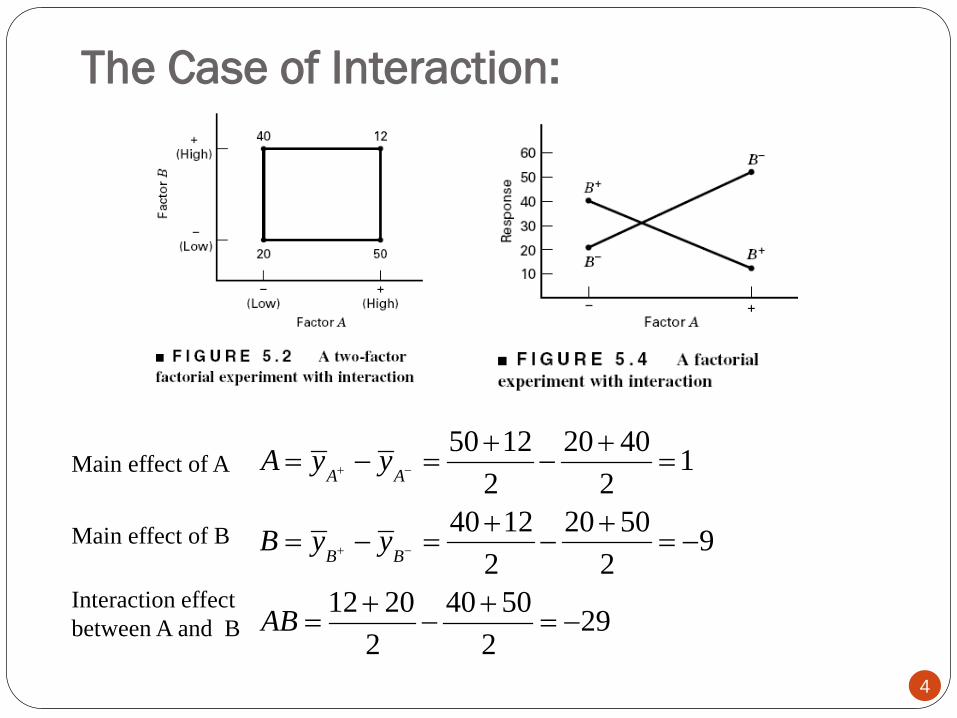
The Case of Interaction:
50 12 20 401
2 2
40 12 20 509
2 2
12 20 40 5029
2 2
A A
B B
A y y
B y y
AB
Main effect of A
Main effect of B
Interaction effect
between A and B
4
The Battery Life Experiment
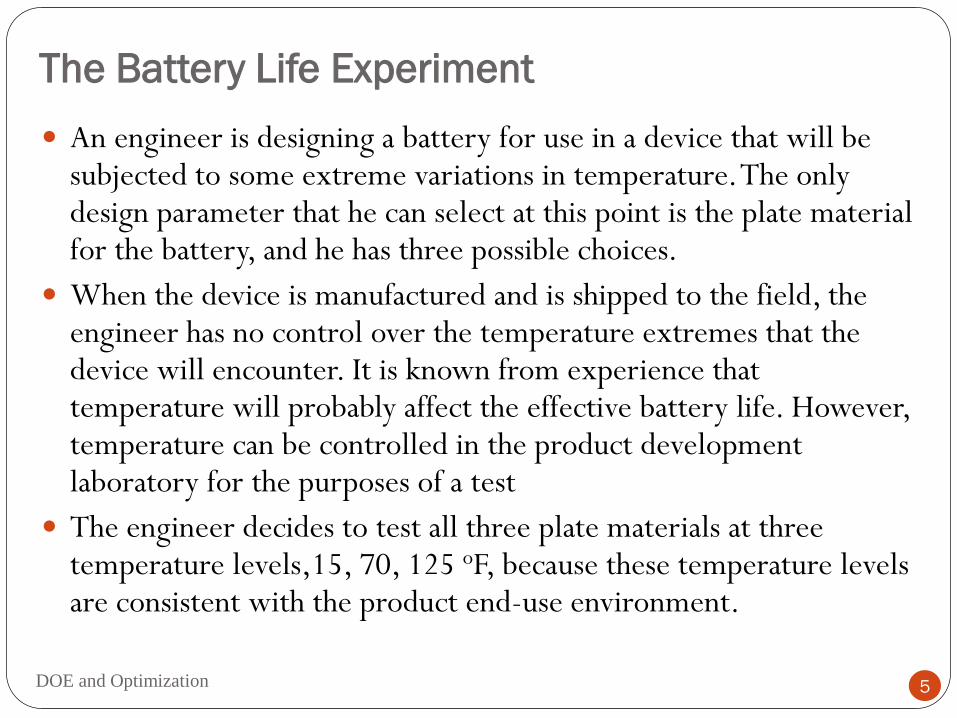
An engineer is designing a battery for use in a device that will be subjected to some extreme variations in temperature. The only design parameter that he can select at this point is the plate material for the battery, and he has three possible choices.
When the device is manufactured and is shipped to the field, the engineer has no control over the temperature extremes that the device will encounter. It is known from experience that temperature will probably affect the effective battery life. However, temperature can be controlled in the product development laboratory for the purposes of a test
The engineer decides to test all three plate materials at three temperature levels,15, 70, 125 oF, because these temperature levels are consistent with the product end-use environment.
DOE and Optimization 5
The Battery Life Experiment
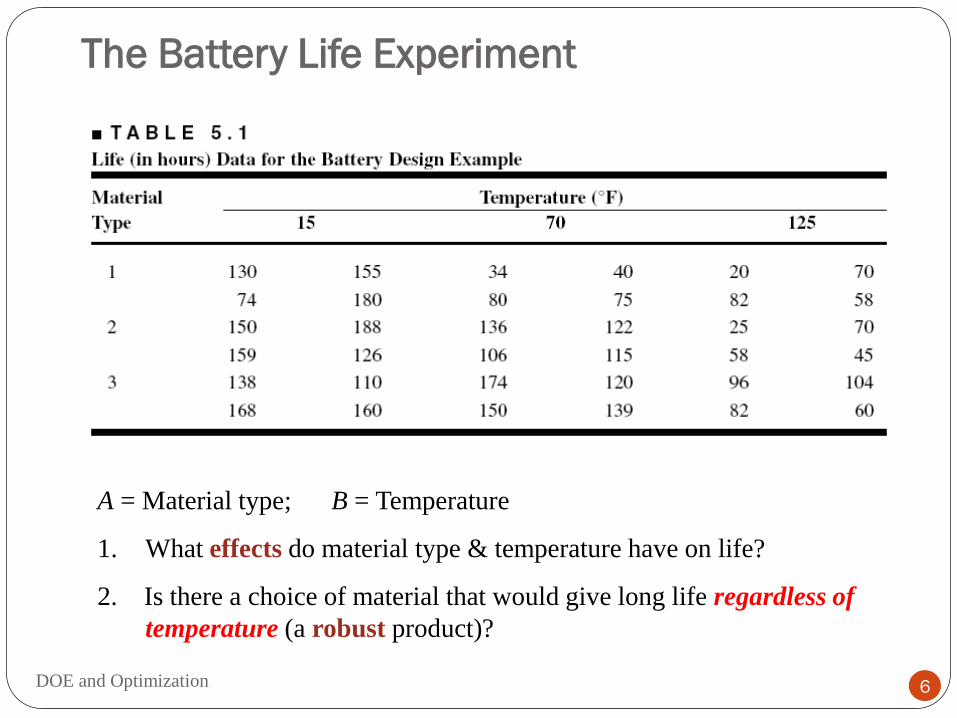
A = Material type; B = Temperature
1. What effects do material type & temperature have on life?
2. Is there a choice of material that would give long life regardless of
temperature (a robust product)?
DOE and Optimization 6
General Two-Factor Factorial Experiment
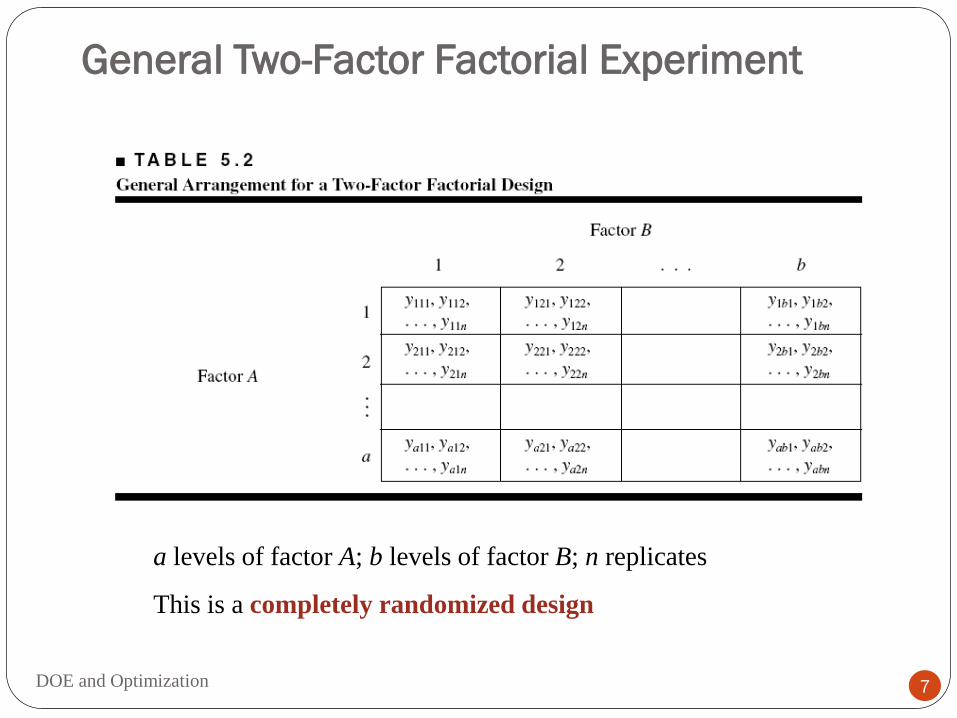
a levels of factor A; b levels of factor B; n replicates
This is a completely randomized design
DOE and Optimization 7
1,2,...,
( ) 1,2,...,
1,2,...,
ijk i j ij ijk
i a
y j b
k n
Statistical Model of Two-factor Factorial Design
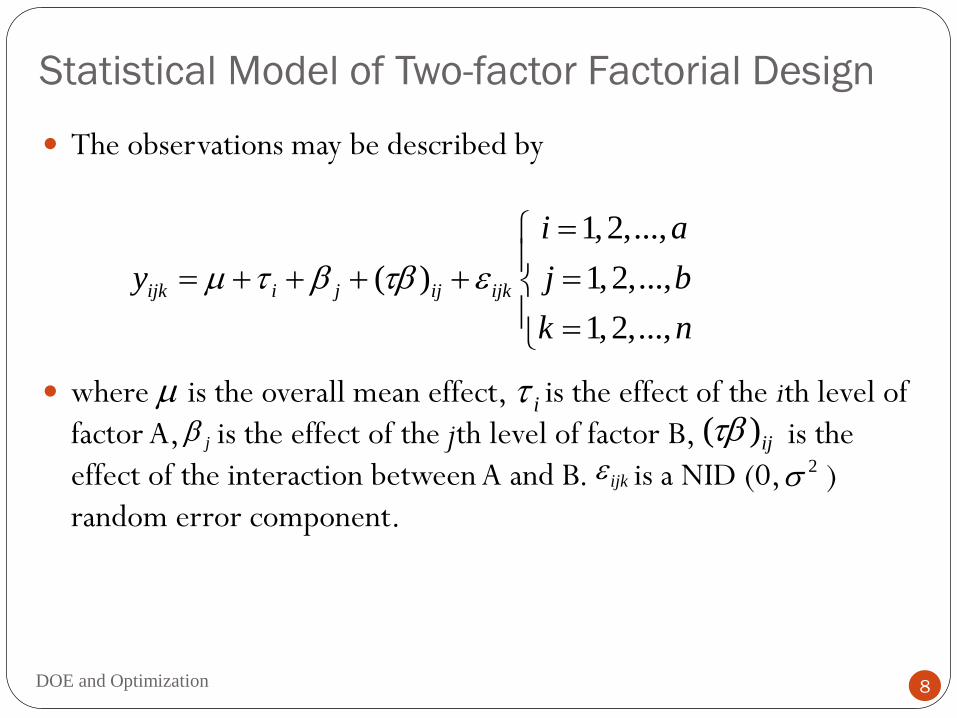
The observations may be described by
where is the overall mean effect, is the effect of the ith level of
factor A, is the effect of the jth level of factor B, is the
effect of the interaction between A and B. is a NID (0, )
random error component.
i
j ( )ij
ijk 2
DOE and Optimization 8
Hypotheses for Two-factor Analysis
DOE and Optimization 9
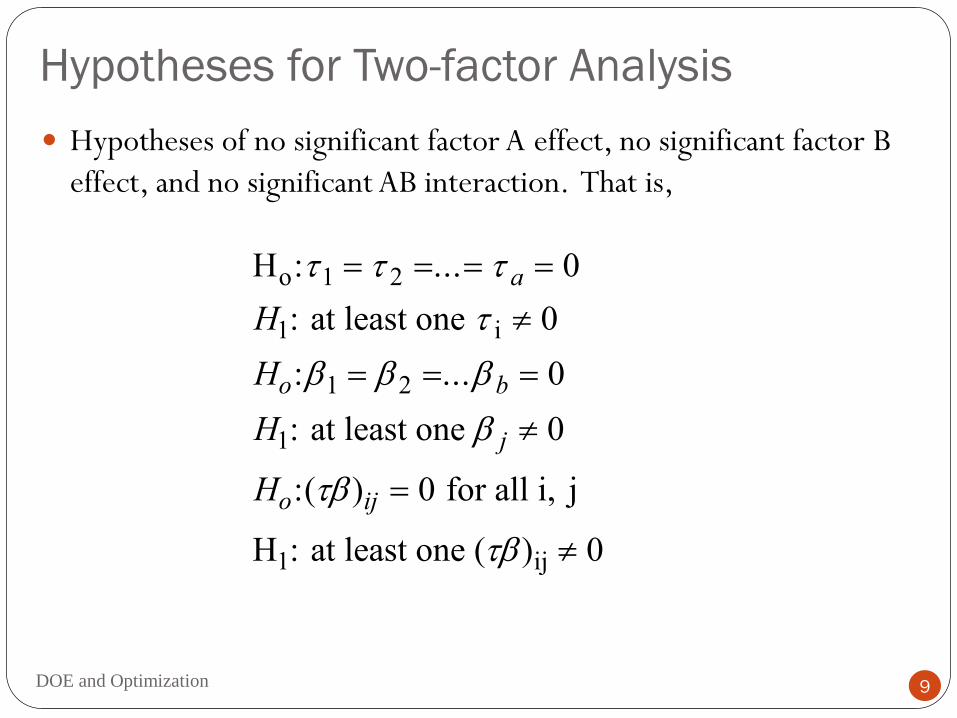
Hypotheses of no significant factor A effect, no significant factor B
effect, and no significant AB interaction. That is,
H
at least one
at least one
for all i, j
H at least one ( )
o
i
1 ij
: ...
:
: ...
:
:( )
:
1 2
1
1 2
1
0
0
0
0
0
0
a
o b
j
o ij
H
H
H
H
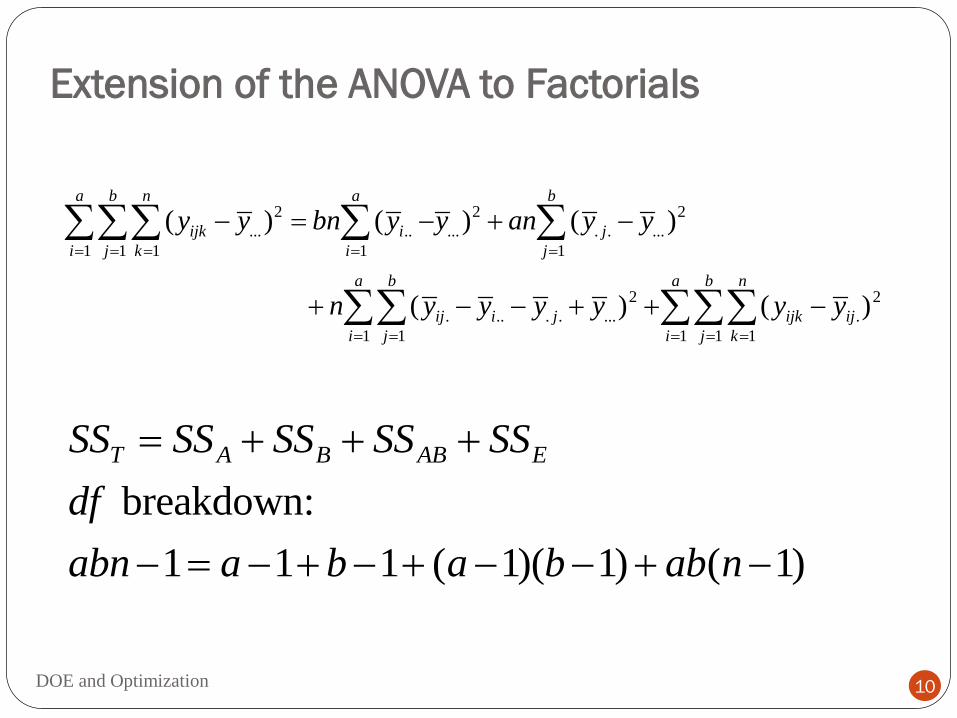
Extension of the ANOVA to Factorials
2 2 2
... .. ... . . ...
1 1 1 1 1
2 2
. .. . . ... .
1 1 1 1 1
( ) ( ) ( )
( ) ( )
a b n a b
ijk i j
i j k i j
a b a b n
ij i j ijk ij
i j i j k
y y bn y y an y y
n y y y y y y
breakdown:
1 1 1 ( 1)( 1) ( 1)
T A B AB ESS SS SS SS SS
df
abn a b a b ab n
DOE and Optimization 10
DOE and Optimization 11
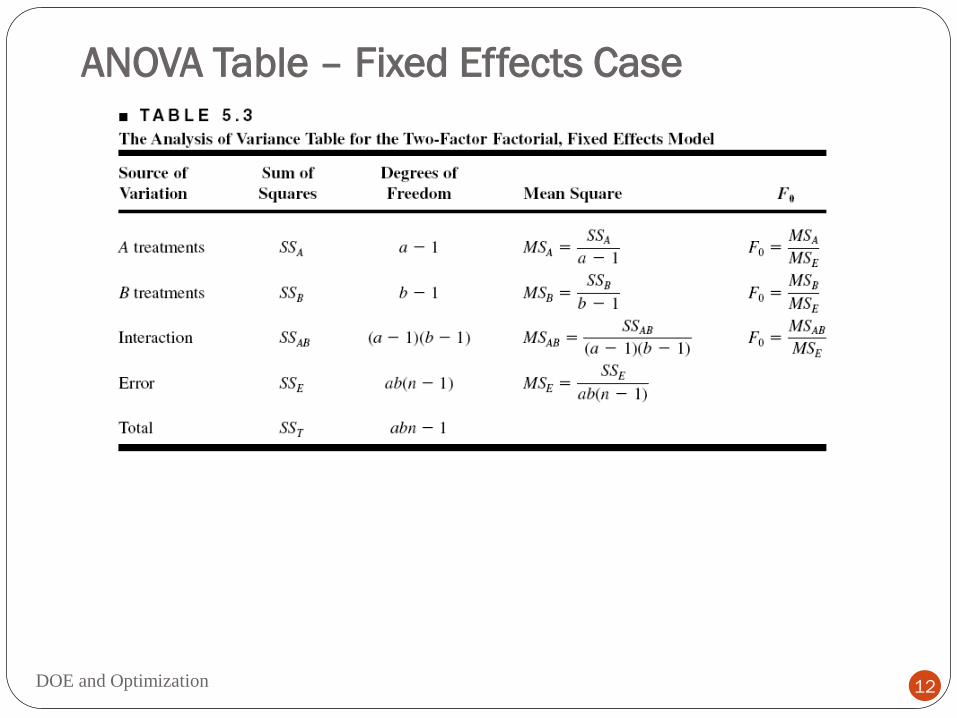
ANOVA Table – Fixed Effects Case
DOE and Optimization 12
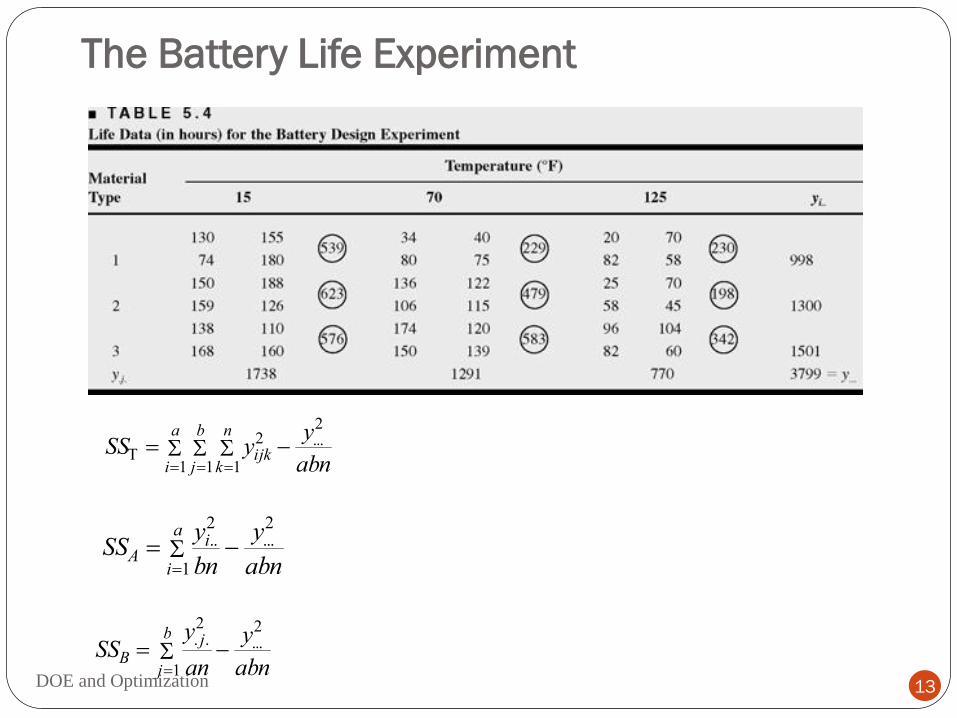
The Battery Life Experiment
SS yy
abni
a
j
b
k
n
ijk 1 1 1
22...
SSy
bn
y
abnA
i
ai
1
2 2
.. ...
SSy
an
y
abnB
j
b j
1
2 2
. . ...
DOE and Optimization 13
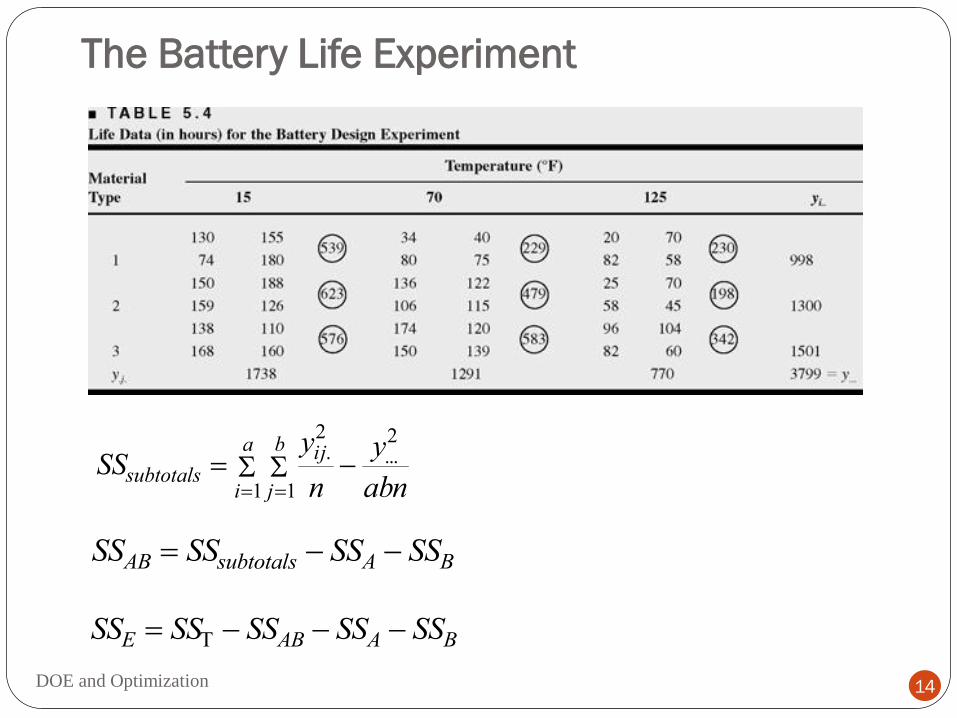
The Battery Life Experiment
SSy
n
y
abnsubtotals
i
a
j
b ij
1 1
2 2
. ...
SS SS SS SSAB subtotals A B
SS SS SS SS SSE AB A B
DOE and Optimization 14
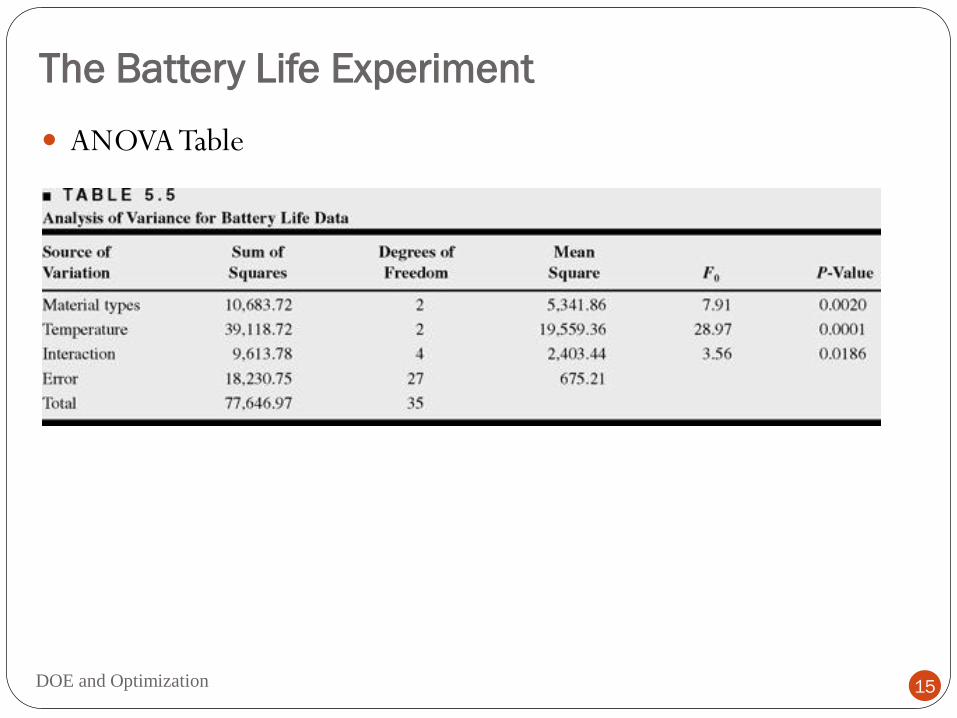
The Battery Life Experiment
DOE and Optimization 15
ANOVA Table
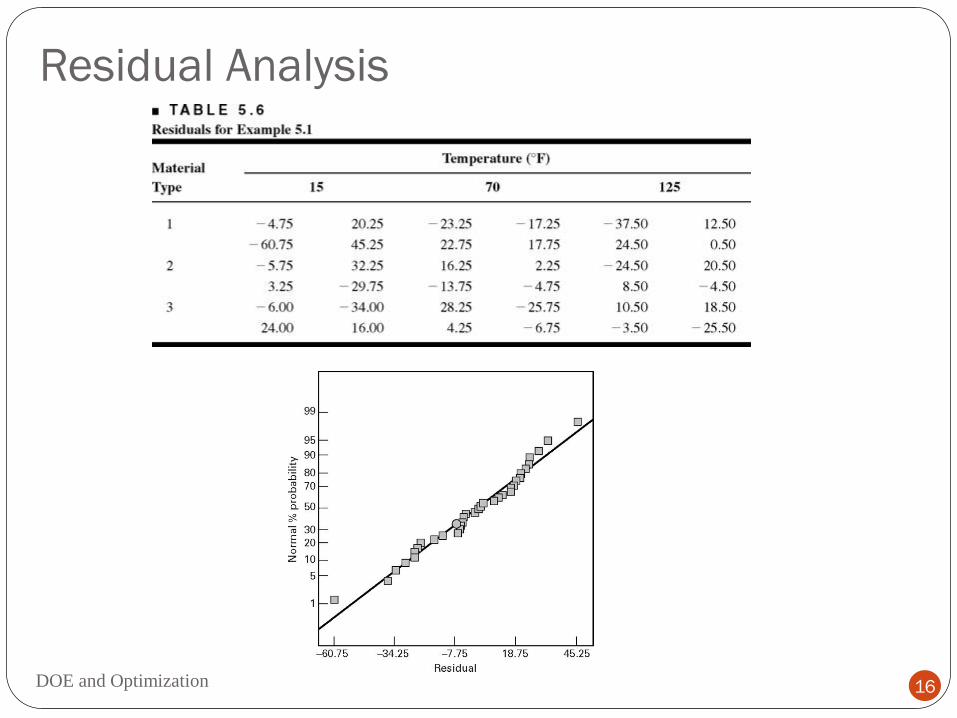
Residual Analysis
DOE and Optimization 16
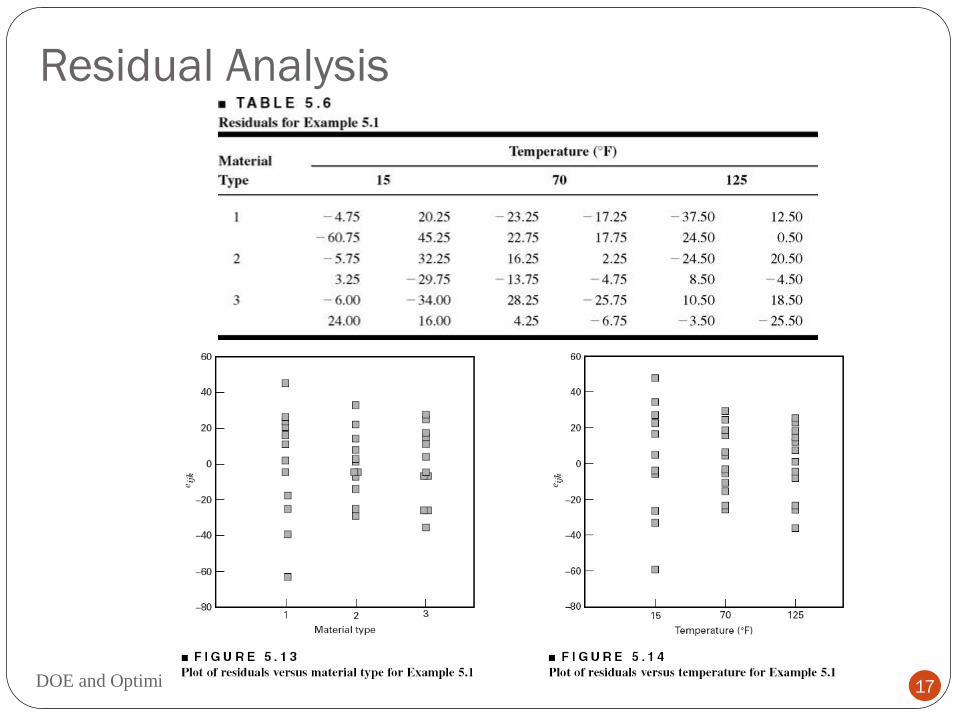
Residual Analysis
DOE and Optimization 17
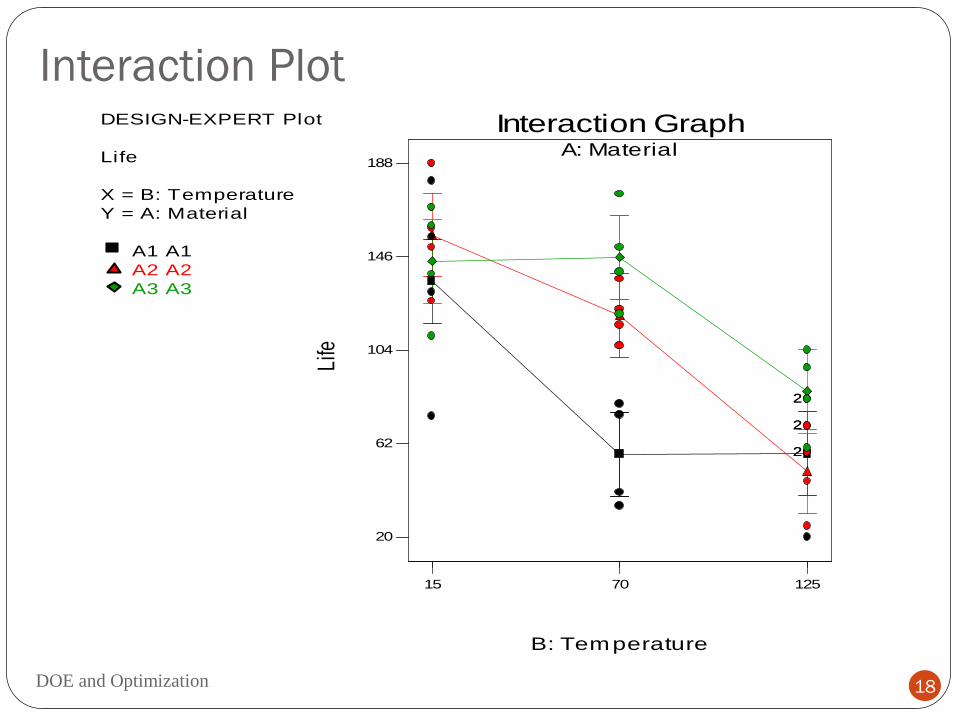
Interaction Plot
DOE and Optimization 18
DESIGN-EXPERT Plot
Life
X = B: Temperature
Y = A: Material
A1 A1
A2 A2
A3 A3
A: Material
Interaction Graph
Life
B: Temperature
15 70 125
20
62
104
146
188
2
2
22
2
2
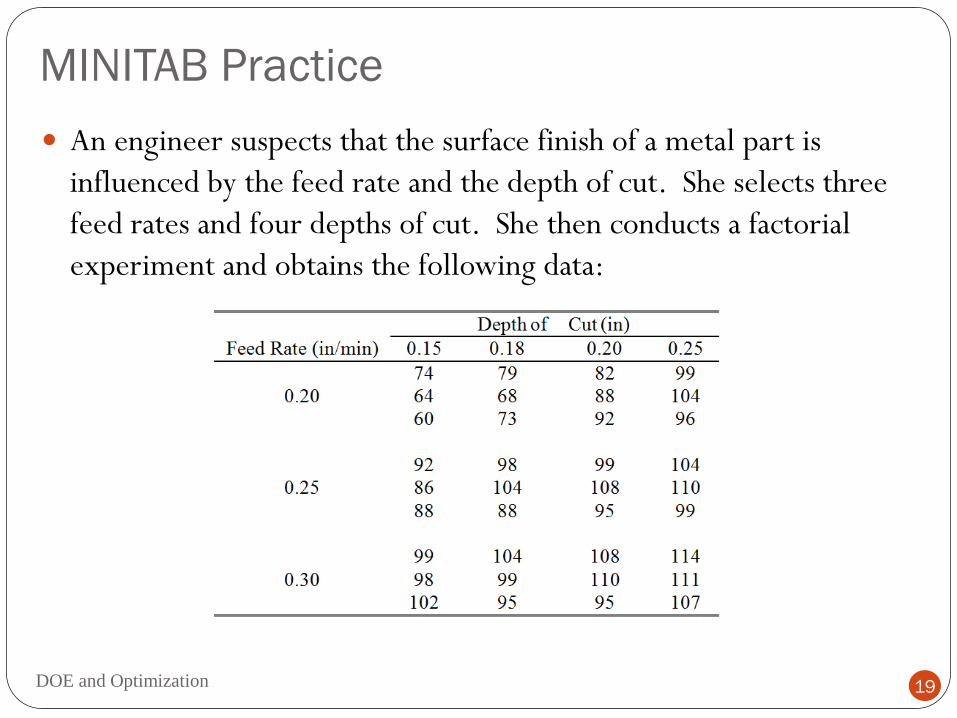
MINITAB Practice
DOE and Optimization 19
An engineer suspects that the surface finish of a metal part is
influenced by the feed rate and the depth of cut. She selects three
feed rates and four depths of cut. She then conducts a factorial
experiment and obtains the following data:
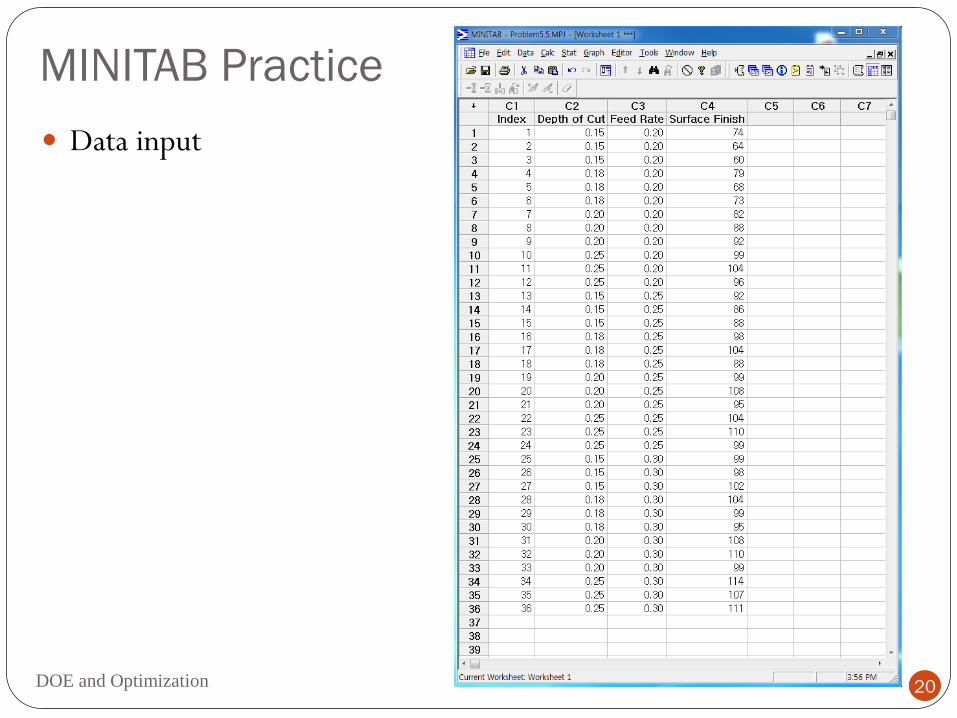
MINITAB Practice
DOE and Optimization 20
Data input
MINITAB Practice
DOE and Optimization 21
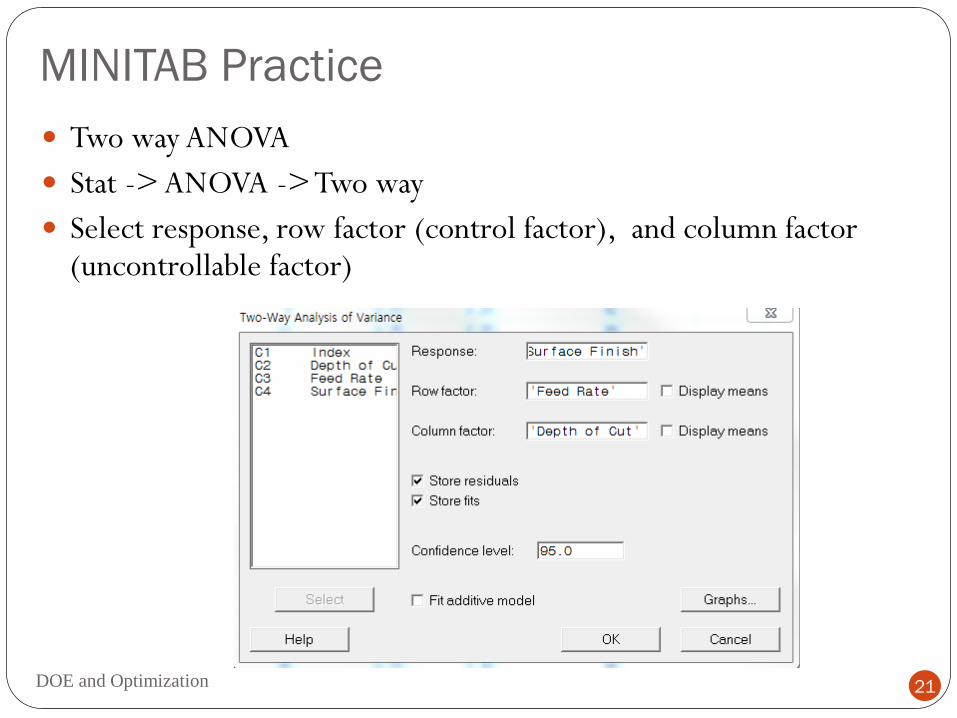
Two way ANOVA
Stat -> ANOVA -> Two way
Select response, row factor (control factor), and column factor (uncontrollable factor)
MINITAB Practice
DOE and Optimization 22
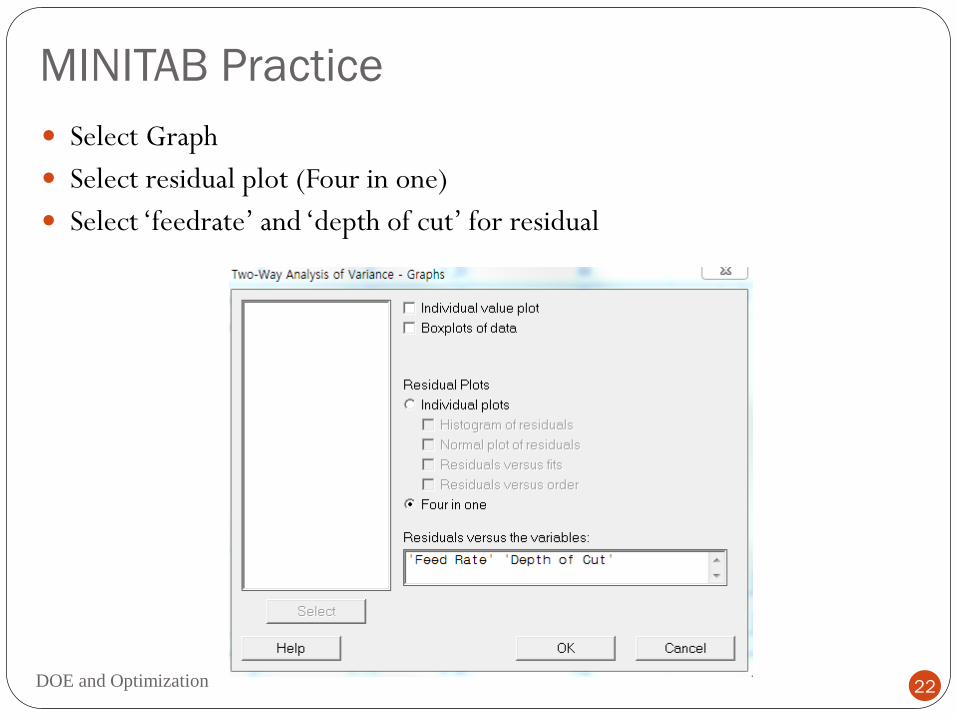
Select Graph
Select residual plot (Four in one)
Select ‘feedrate’ and ‘depth of cut’ for residual
MINITAB Practice
DOE and Optimization 23
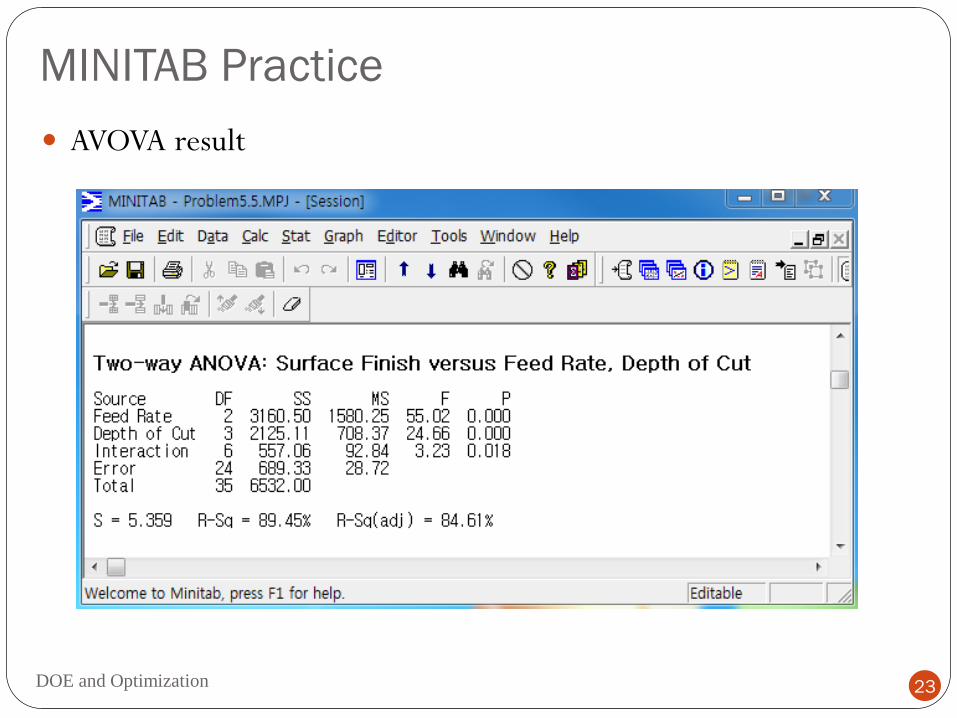
AVOVA result
MINITAB Practice
DOE and Optimization 24
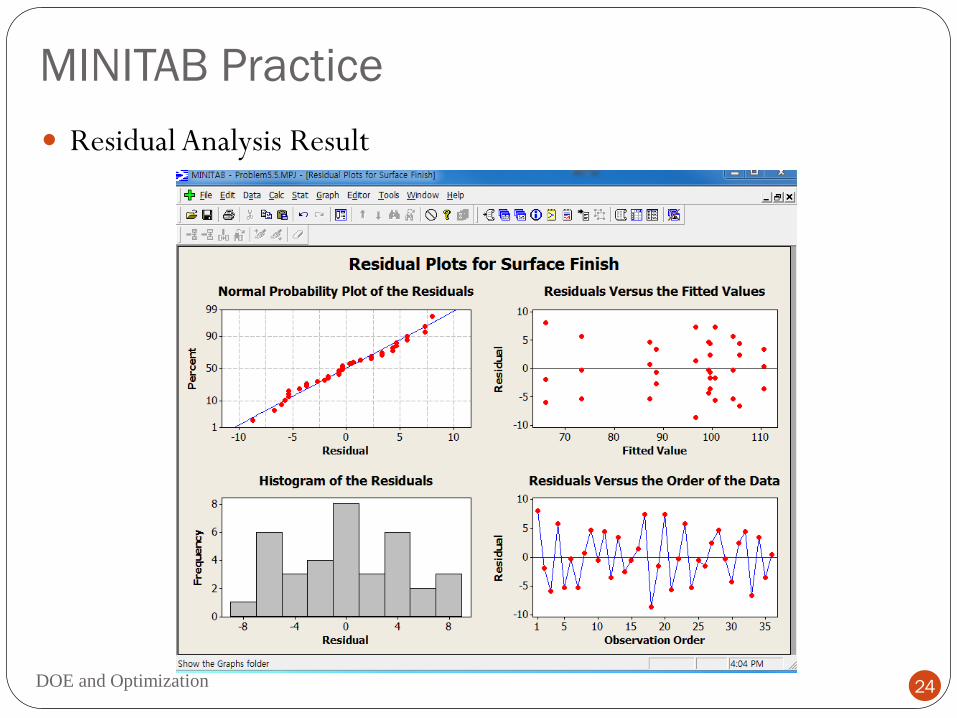
Residual Analysis Result
MINITAB Practice
DOE and Optimization 25
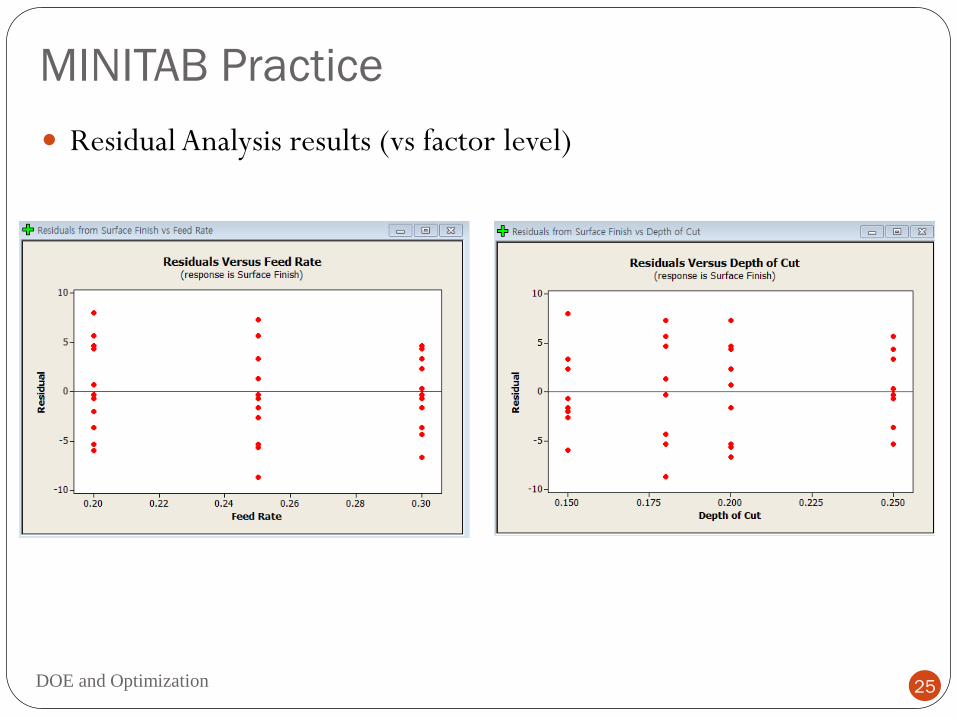
Residual Analysis results (vs factor level)
MINITAB Practice
DOE and Optimization 26
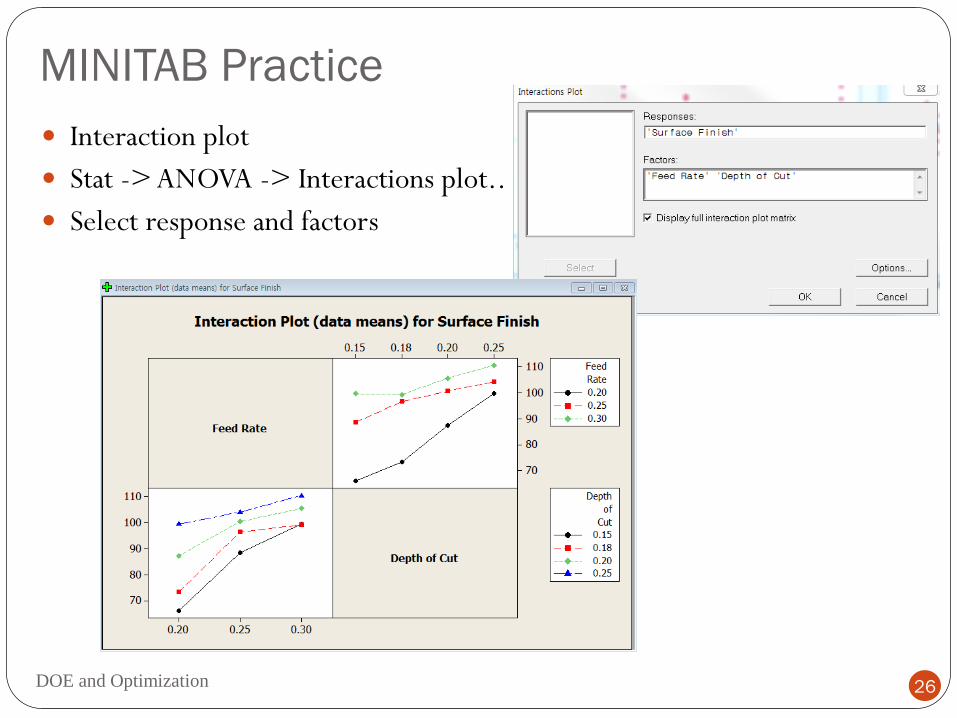
Interaction plot
Stat -> ANOVA -> Interactions plot..
Select response and factors
Related Documents