1 23/08/2012 1 3-D Simulation of tunnel structures under Blast loading 2 3 M. Buonsanti 4 Assistant Professor 5 Department of Mechanics and Materials 6 Mediterranea University of Reggio Calabria, Italy 7 Via Graziella, Feo di Vito, 89100, Reggio Calabria, Italy, 8 e-mail:[email protected] 9 10 11 G. Leonardi PhD (corresponding author) 12 Associate Professor 13 Department of Information, Electronics and Transport Engineering, 14 Mediterranea University of Reggio Calabria, Italy, 15 Via Graziella, Feo di Vito, 89100, Reggio Calabria, Italy, 16 Tel. +39 0965 875237, e-mail: [email protected] 17 18 Number of figures: 8 19 Number of tables: 5 20 21 Cover Letter

Welcome message from author
This document is posted to help you gain knowledge. Please leave a comment to let me know what you think about it! Share it to your friends and learn new things together.
Transcript

1
23/08/2012 1
3-D Simulation of tunnel structures under Blast loading 2
3
M. Buonsanti 4
Assistant Professor 5
Department of Mechanics and Materials 6
Mediterranea University of Reggio Calabria, Italy 7
Via Graziella, Feo di Vito, 89100, Reggio Calabria, Italy, 8
e-mail:[email protected] 9
10
11
G. Leonardi PhD (corresponding author) 12
Associate Professor 13
Department of Information, Electronics and Transport Engineering, 14
Mediterranea University of Reggio Calabria, Italy, 15
Via Graziella, Feo di Vito, 89100, Reggio Calabria, Italy, 16
Tel. +39 0965 875237, e-mail: [email protected] 17
18
Number of figures: 8 19
Number of tables: 5 20
21
Cover Letter

1 2 3 4 5 6 7 8 9 10 11 12 13 14 15 16 17 18 19 20 21 22 23 24 25 26 27 28 29 30 31 32 33 34 35 36 37 38 39 40 41 42 43 44 45 46 47 48 49 50 51 52 53 54 55 56 57 58 59 60 61 62 63 64 65
3-D Simulation of tunnel structures under Blast loading
Michele Buonsanti
Assistant Professor
Department of Mechanics and Materials
Mediterranea University of Reggio Calabria, Italy
Via Graziella, Feo di Vito, 89100, Reggio Calabria, Italy,
e-mail:[email protected]
Giovanni Leonardi PhD (corresponding author)
Associate Professor
Department of Information, Electronics and Transport Engineering,
Mediterranea University of Reggio Calabria, Italy,
Via Graziella, Feo di Vito, 89100, Reggio Calabria, Italy,
Tel. +39 0965 875237, e-mail: [email protected]
Number of figures: 8
Number of tables: 5
*Manuscript

1 2 3 4 5 6 7 8 9 10 11 12 13 14 15 16 17 18 19 20 21 22 23 24 25 26 27 28 29 30 31 32 33 34 35 36 37 38 39 40 41 42 43 44 45 46 47 48 49 50 51 52 53 54 55 56 57 58 59 60 61 62 63 64 65
2
Abstract
In this paper we want to study the behaviour of an underground structure subject to blast action. Other
than the normal operating loads we considered the actions generated by a thermal gradient simulating the
action of a fire load and by a pressure wave simulating an explosion.
Initially the theoretical aspects of the problem were exanimated, and then a model was developed in
numerical form and implemented through a Finite Element Analysis. This modelling allows the simula-
tion of a real scenario, e.g. railway tunnels with reinforced concrete structure that is subject to a fire gen-
eration and a subsequent explosion. The simulation involved aspects of thermal analysis, and therefore
the structural problem was tackled analysing the tensions in the structure generated by the effect of tem-
perature-pressure generated by the fire and by the overpressure generated by the blast. Only following
this approach the most important factors influencing the dynamic response and damage of structure can
be identified and the appropriate preventive measures can be designated.
Keywords: tunnel, fire, explosion, blast, shock wave, Finite Element Analysis
Introduction
The tunnel and underground structures are widely used in civil engineering; thus, the possibility of explo-
sions in tunnel caused by fire accidents or terrorist attack is also increasing with the development of sub-
way and underground structures. Consequently, the analysis of blast wave propagation inside tunnels has
great significance.
The major risks are associated with the transportation of hazardous materials like LPG. LPG is a major
hazardous material transported in bulk by road and railway. Because LPG is a liquefied gas, that is a su-
perheated liquid, it is stored and transported under pressure, the vapour pressure at the prevailing liquid
temperature. In the proposed safety study, the consequences of a train accident with the rupture of a 50m3

1 2 3 4 5 6 7 8 9 10 11 12 13 14 15 16 17 18 19 20 21 22 23 24 25 26 27 28 29 30 31 32 33 34 35 36 37 38 39 40 41 42 43 44 45 46 47 48 49 50 51 52 53 54 55 56 57 58 59 60 61 62 63 64 65
3
LPG transport vessel were analysed. Vessel rupture may occur directly by some heavy mechanical impact
[1, 2] or indirectly as a consequence of a fire.
A fire further pressurises the vessel by increasing the LPG’s vapour pressure and at the same time af-
fects the vessel’s structural strength.
The consequence of a catastrophic rupture of a pressure vessel of LPG is a boiling liquid expanding
vapour explosion (BLEVE), which may produce a substantial blast effect. The blast wave reflects repeat-
edly because of the limit of tunnel wall when there is an explosion in a tunnel, its close-in effect makes
the overpressure of tunnel blast wave increase and continuance time of the blast wave longer [3].
In the past decades, a lot of experiments and simulations were conducted to study the consequences of
explosive charges detonation in underground ammunition storage chambers and access tunnels [4, 5].
Nevertheless, propagation and decaying of nonreactive blast-waves in simple geometry structures, such as
tunnels, tubes or plates assemblies, is still object of investigation. Only limited related studies can be
found in literature. Chill et al. [6] investigated the dynamic response of underground electric plant subject
to internal explosive loading using three-dimensional numerical method. Coupled fluid-solid interaction
was considered in their study; however, the nonlinearity and failure of rock and concrete as well as the
interaction between different solid media were not simulated. For traffic tunnels, Choi et al. [7] used the
three-dimensional Finite Element method to study the blast pressure and resulted deformation in concrete
lining. Lu et al [8] and Gui and Chien [9], using FE method, looked into the blast-resistance of tunnels in
soft soil subject to external explosive loadings. Van den Berg and Weerheijm [10] investigated to what
extent an open space may effective mitigating blast effects from explosion in an urban tunnel system.
There exist very few numerical studies investigating the dynamic and nonlinear response of under-
ground structures subject to the simultaneous actions of fire and blast loading. To this end the dynamic
response and damage of a railway tunnel structure under fire and explosion load is the subject of this pa-
per.

1 2 3 4 5 6 7 8 9 10 11 12 13 14 15 16 17 18 19 20 21 22 23 24 25 26 27 28 29 30 31 32 33 34 35 36 37 38 39 40 41 42 43 44 45 46 47 48 49 50 51 52 53 54 55 56 57 58 59 60 61 62 63 64 65
4
Theoretical background
The blast action can be decomposed in two components, thermal and shock wave’s loads. In this para-
graph theoretical assumptions are developed in both cases, and furthermore some structural considera-
tions on the thick shell behaviour are given in premises. From a structural point of view the tunnel can be
considered as a half thickness-walled cylinder subject to internal and external pressures. Assuming the z-
axis as the revolution axis, the deformation becomes symmetrical in respect to the z-axis. Consequently
it’s convenient to use cylindrical coordinates r, , z.
[Figure 1 near here]
So we can consider a half cylinder of inner radius a and outer radius b (Fig. 1) and subject to an inter-
nal pressure pa and an external pressure pb, other than the radial temperature field T(r). Due to the axial
symmetry of the problem, we assume that the displacement field is radial only, namely ur = u(r), u = 0,
and assuming the plane strain, we have uz = 0.
According to [11-13] the stresses satisfy the equilibrium conditions; without body forces, the expres-
sion becomes:
0rr
r r
(1)
while the components of the deformation field assume the form:
1 1 1; ;
2
r r rr r
u u uu u u
r r r r r r
(2)
where the function u(r,) represents the displacement field over the shell. Introducing the Lame’s consti-
tutive equations (with and E, respectively, Poisson’s and Young’s modulus) after some simple calcula-
tions we get the basic equations governing the thick-walled half-cylinder.

1 2 3 4 5 6 7 8 9 10 11 12 13 14 15 16 17 18 19 20 21 22 23 24 25 26 27 28 29 30 31 32 33 34 35 36 37 38 39 40 41 42 43 44 45 46 47 48 49 50 51 52 53 54 55 56 57 58 59 60 61 62 63 64 65
5
2 2 2 2
2 2 2 2
2 2 2 2
2 2 2 2 2
2 2 2 2
2 2 2 2 2
1 1a b a br
a b a br
a b a b
p a p b p pa bu r
E b a E r b a
p a p b p pb a
b a r b a
p a p b p pb a
b a r b a
(3)
Under these conditions, we recall the specific conditions of the internal and of the external pressure
loads. In the first case (internal pressure) the above equations become:
2 2
2 2 2
2 2
2 2 2
1
1
ar
a
p a b
b a r
p a b
b a r
(4)
From the equations above, a consideration can be drawn about the circumferential stress ( tensile
stress), which is at its greatest on the inner surface and is always greater than pa.
In the second case (external pressure) the general equations (3) assume the form.
2
2 2 2
2 2
2 2 2
1
1
br
b
p a
b a r
p b a
b a r
(5)
The stress paths, when no inner holes were present, are uniformly distributed in the cylinder. From
now we will be able to describe the coupling actions over the thick-walled half-cylinder shell, and there-
fore we recall some basic thermo-elasticity assumption. There is a significant presence in literature over
the question, but we prefer to refer to [13-15].
We focus the consistence of thermal stresses induced in thick-walled half-cylinder when the tempera-
ture field is symmetrical to the z-axis. In this case we suppose the temperature T as radius function only
and independent from z then z = 0.
With analogous considerations to those above, the basic equations, for the coupled problem, can be
written as in equations (6) where the term represents the thermal expansion coefficient.

1 2 3 4 5 6 7 8 9 10 11 12 13 14 15 16 17 18 19 20 21 22 23 24 25 26 27 28 29 30 31 32 33 34 35 36 37 38 39 40 41 42 43 44 45 46 47 48 49 50 51 52 53 54 55 56 57 58 59 60 61 62 63 64 65
6
2 2
2 2
2 2
2 2 2
2 22
2 2 2
2 2
1 1 2
1
1
1
1
1
2
1
r b
r
a a
b r
r
a a
b r
a a
b
z
a
r au Trdr Trdr
r b a
E r aTrdr Trdr
r b a
E r aTrdr Trdr Tr
r b a
ETrdr Tr
b a
(6)
If the temperature T is positive and if the external temperature is equal to zero, then the radial stress is
always compressive, like the other stresses in the inner surface, while the latter are tensile in external
surface.
After numerous disasters in the building and structures, the fire-structure question was developed by
many researchers, which have reproduced a significant and numerous amount of literature [16-19]. Now
we analyse the structural effects after the burst. According to Meyers [20] the interaction between a deto-
nating explosive and the material in contact, or in close proximity, is extremely complex, since it evolves
detonation waves, shock waves, expanding gases, and their interrelationships.
The topic was developed principally for military use, developing the computational apparatus, for in-
stance the Gurney equation [21].
So, we assume the following basic hypothesis. 1) A shock is a discontinuous surface and has no ap-
parent thickness. 2) The shear modulus is assumed to be zero and so it responds to the wave as a fluid,
and the theory can be restricted to higher pressures. 3) Body forces and heat conduction at the shock front
are negligible. 4) There is no elastic-plastic behaviour. 5) Material does not undergo phase transforma-
tions.
Now, to our aim we will consider the dynamic behaviour of thick-wall cylindrical shell under internal
pressure produced by shock wave.
Let pc be the collapse pressure, then the shell is subject to a symmetrical internal pressure pulse, in the
interval time 0 t , while p = 0 when t . Again we assume rigid perfectly plastic material behaviour.
Supposing the pressure load symmetric, then the yielding is controlled by force in the shell middle
plane. So, let N be the generalized membrane forces, at the yielding point we have N = Nc (with Nc the

1 2 3 4 5 6 7 8 9 10 11 12 13 14 15 16 17 18 19 20 21 22 23 24 25 26 27 28 29 30 31 32 33 34 35 36 37 38 39 40 41 42 43 44 45 46 47 48 49 50 51 52 53 54 55 56 57 58 59 60 61 62 63 64 65
7
fully plastic membrane forces). Neglecting the elastic effects, the dynamics response consist of two
phases motion with N =Nc. For major clarify we consider, as the second phase, the time as t t*
where t* is the response duration time. Let be the transverse displacement of the shell middle plane and
let v° be the spherically symmetric outwards impulsive velocity, we then find the radial displacement:
2
c r tN t v (7)
After some calculations we have the associated permanent radial displacement field over the shell.
4 cf r v N (8)
About the next numerical implementation we will be able to represent the preliminary considerations on
the problem, in particular regarding the complex nature of the physics problem. In other words here we
have a coupled problem, or better, a coupled-field analysis that is one that takes into account the interac-
tion (coupling) between two or more fields of engineering [22, 23].
There are certain pros and cons with coupled-field formulations: one the one hand they allow to find solu-
tions to problems which otherwise would not be found by finite elements, on the other there is an increase
in wave-front with an insufficient matrix reformulation.
The procedure for a coupled-filed analysis varies depending on which fields are being coupled, but two
distinct methods can be identified: the indirect method and the direct method. Here we select the first one
which involves two sequential analyses, each belonging to a different field. The two field are coupled by
applying results from the first analysis as load for the second analysis. For example in this thermal-stress
analysis the nodal temperature from the thermal analysis are applied as body force loads in the subsequent
stress analysis.
Finite Element Model
The Finite Element model was based on a single track railway tunnel system consisting of concrete tunnel
tube with the section dimensions reported in the Fig. 2.
[Figure 2 near here]

1 2 3 4 5 6 7 8 9 10 11 12 13 14 15 16 17 18 19 20 21 22 23 24 25 26 27 28 29 30 31 32 33 34 35 36 37 38 39 40 41 42 43 44 45 46 47 48 49 50 51 52 53 54 55 56 57 58 59 60 61 62 63 64 65
8
The tunnel was about 10 m below the ground surface. The model extended 150 m in the longitudinal
direction of the tunnel, while the length and height of the model were of 26.8 m. The finite Element
model was fixed at the base and roller boundaries were imposed to the four side.
Structural model
Solid elements have been used in the finite element model. According to Schrefler et al. [19] they are
more accurate in coupled thermal and mechanical analysis. In particular the ten-node tetrahedral elements
[24, 25] have been implemented by ANSYS Code [26]. This is a higher order of the three-dimensional
linear tetrahedral element (Fig. 3). When compared to the four-node, the ten-node is fits better for a more
accurate modelling problem with curved boundary.
[Figure 3 near here]
For solid problems the displacement field is represented by the indicial form:
, 1 1 , 2 2 , 3 3 , 4 4
, 1 2 , 2 3 , 1 3 , 1 4 , 2 4 , 3 4
2 1 2 1 2 1 1
4 )
2
(
i i I i J i K i L
i M i N i O i P i Q i R
u u S S u S S u S S u S S
u S S u S S u S S u S S u S S u S S
(9)
Where the i-index is variable as (i = x, y, z) representing the components of the displacement field.
Likewise the spatial distribution of temperature over an element is given by:
1 1 2 2 3 3 4 4
1 2 2 3 1 3 , 1 4 2 4 3 4
2 1 2 1 2 1 2 1
4( )
I J K L
M N O P Q R
T T S S T S S T S S T S S
T S S T S S T S S T S S T S S T S S
(10)
Particularly, the shape functions having the form:
1
6
iS a b X c Y d ZV
(11)
In the last equation V represents the volume tetrahedral element, while the i-index vary from 1 to 4,
and -index is varying as I, J, K, L-node. The coefficients a , b , c , d can be deducted by the determi-
nant of the matrix form, rotating through the I, J, K, and L subscripts using the right-hand rule.

1 2 3 4 5 6 7 8 9 10 11 12 13 14 15 16 17 18 19 20 21 22 23 24 25 26 27 28 29 30 31 32 33 34 35 36 37 38 39 40 41 42 43 44 45 46 47 48 49 50 51 52 53 54 55 56 57 58 59 60 61 62 63 64 65
9
Modelling materials
The modelled tunnel structure is surrounded by soil, the unit weight of which was 18.9 kN/m3, and this
load represents the starting state of stress. Drucker-Prager elasto-plastic model was used to model the soil
(Table 1).
[Table 1 near here]
For the characterization of the reinforced concrete of the tunnel structure it was considered a C50/60
class concrete. The mechanical characteristics of the reinforced concrete (at a temperature of 20°C) are
reported in Table 2.
[Table 2 near here]
The effects of high temperature on the mechanical and physical characteristics of reinforced concrete
have been considered in the model according with the indications of the Eurocode 2 [27], in particular,
the values of the elasticity modulus in function of temperature are reported in Table 3.
[Table 3 near here]
Modelling of loads
A fundamental aspect in the study of fire resistance in underground structures is the definition beforehand
of the fire scenario taken in the analysis, therefore choosing the best fit standard curve. A standard curve
used when testing the temperature exposure is the cellulose curve defined in several standards, e.g. ISO
834 [28]:
g = 0 + 345·log10(8t + 1) (12)
where: t is time (min); g is the temperature (°C) at time t; 0 is the initial temperature (°C). This curve
applies to materials found in typical buildings. This has been used for many years, also for tunnels, but it

1 2 3 4 5 6 7 8 9 10 11 12 13 14 15 16 17 18 19 20 21 22 23 24 25 26 27 28 29 30 31 32 33 34 35 36 37 38 39 40 41 42 43 44 45 46 47 48 49 50 51 52 53 54 55 56 57 58 59 60 61 62 63 64 65
10
is clear that this curve does not represent all materials, e.g. petrol, chemicals, etc., and therefore a special
curve, the hydrocarbon curve (the HC curve) [29], which was developed in the 1970s for use in the petro-
chemical and off-shore industries, has been applied to tunnels:
g = 0 + 1080·(1 – 0,325·e-0,167·t
– 0,675·e-2,5·t
) (13)
The main difference between these two curves is that the HC curve exhibits a much faster fire devel-
opment and consequently is associated with a faster temperature increase than the standard ISO 834 fire
curve and has traditionally been seen to be more relevant for a petroleum fire. Specific temperature curves
have been developed in some countries to simulate hydrocarbon fires in tunnels. Examples of such curves
are the RABT/ZTV Tunnel Curve in Germany [30] and the Rijkswaterstaat Tunnel Curve (RWS curve) in
The Netherlands (based on laboratory scale tunnel tests performed by TNO in 1979 [31]). Fig. 4 displays
the above mentioned temperature-time curves.
[Figure 4 near here]
[Table 4 near here]
In the considered model the HC curve was used to simulate the fire action, the numerical-time tem-
perature values of the first two hours are reported in Table 4.
At this fire scenario load we have to add the tensional stress caused by the vertical load of 10 meters of
above-ground soil and the explosion over-pressure.
The blast overpressure was generated from an instantaneous release of 50 m3 LPG rail tanker at 326K.
The pressure-time curve was assumed to be of triangular shape, the duration of which was obtained from
CONWEB reflected pressure diagram [32].
To calculate the decay of blast overpressure during the longitudinal direction of the tunnel the Energy
Concentration Factor (ECF) method was used [33].
The Energy Concentration Factor (ECF) is the ratio between volume of the hemisphere with radius r0
and volume of the confined region included in the distance r0 from the epicentre of blast.

1 2 3 4 5 6 7 8 9 10 11 12 13 14 15 16 17 18 19 20 21 22 23 24 25 26 27 28 29 30 31 32 33 34 35 36 37 38 39 40 41 42 43 44 45 46 47 48 49 50 51 52 53 54 55 56 57 58 59 60 61 62 63 64 65
11
With reference to a tunnel in which the charge is placed at the middle of a tunnel:
3
02
0
0
2
13
2 3
H Sph
Tun
rVECF r
V Ar A
(14)
where A is the tunnel cross section area.
In this perspective the Energy Concentration Factor (ECF) is a purely geometrical factor that takes
into account the increase in spatial density of energy caused by the reduction of the volume available for
gas expansion.
When a BLEVE occurs in open environment, the peak side-on overpressure of the blast wave is nor-
mally evaluated by means of scaled overpressure curves [34, 35] that provide the scaled overpressure,
PS/P0, as function of the Sachs scaled distance.
The Sachs scaled distance is then given by the following expression:
1/3
00
2
PR r
W
(15)
where r0 (m) is the distance from the blast source, W (J) is the expansion work devoted to blast-wave gen-
eration and P0 (Pa) is the atmospheric pressure.
In case of a BLEVE event in a tunnel the ECF method allows to predict the blast-wave overpressure at
different locations from the blast source.
The use of the Energy Concentration Factor leads to a modified expression of the Sachs scaled dis-
tance on the form:
1/3
00'
2
PR r
ECF W
(16)
In the considered case of railway tunnel, the numerical values of the overpressure at the different dis-
tances are reported in Table 5:
[Table 5 near here]

1 2 3 4 5 6 7 8 9 10 11 12 13 14 15 16 17 18 19 20 21 22 23 24 25 26 27 28 29 30 31 32 33 34 35 36 37 38 39 40 41 42 43 44 45 46 47 48 49 50 51 52 53 54 55 56 57 58 59 60 61 62 63 64 65
12
During the propagation of the blast wave over the first 75 m from the BLAVE to the tunnel opening,
the blast overpressure falls from 1700 kPa (vapour pressure at 326K) down to approximately 86 kPa.
This decay is solely through the intense energy dissipation in the strong leading shock of the blast
wave.
Numerical simulation and analysis
The 3-Dimensional model is representative of a tunnel section 150 meters long, while the length and
height of the model are 25 m. This model was implemented by quadratic tetrahedral type elements with
the ANSYS FEM package [36], obtaining 95,003 elements and 147,528 nodes as shown in Figure 5. The
mesh on the 3-D computational domain was constructed after deciding for a greater refinement (0.3 m) of
the tunnel walls elements as illustrated in the same Fig. 5. The Finite Element model was fixed at the base
and elastic supports were imposed to the other sides to simulate the soil reaction.
[Figure 5 near here]
The analysis was carried out in two steps. The first step obtained the initial stress state caused by soil
load and fire and the second step analysed the dynamic response under blast loading.
Consequently the following load conditions were considered in the FE analysis:
1) from time t = 0 to time t = 120 min the tunnel was subjected to the surrounding soil load and to the
fire thermal stress;
2) at the instant t = 2 sec the structure was subjected to the blast over pressure.
Results of numerical simulation and discussion
Firstly, a thermal analysis was carried out to investigate the effects of the fire on the structure. Therefore,
on the base of this analysis, the distribution of the temperature inside of the structure is known. In Fig. 6
the temperature distribution and the thermal strain after 1800 sec are showed.

1 2 3 4 5 6 7 8 9 10 11 12 13 14 15 16 17 18 19 20 21 22 23 24 25 26 27 28 29 30 31 32 33 34 35 36 37 38 39 40 41 42 43 44 45 46 47 48 49 50 51 52 53 54 55 56 57 58 59 60 61 62 63 64 65
13
[Figure 6 near here]
The thermal analysis shows a distribution of temperatures which have a linear variation in time and as-
sumes uniform values along the gallery and reaches the maximum value after 30 minutes (Figure 6). Sub-
sequently, the mechanical behaviour of the models was analysed introducing also to thermal stress, the
explosion load (Fig. 7 and Fig. 8).
[Figure 7 near here]
[Figure 8 near here]
Analyzing the deformed model (Fig. 7), it can be seen that the gallery shows an increase of concavity
in the middle of gallery, where the instantaneous explosive impact can be considered main source of the
deformations.
Fig. 8 shows the Mises stress of tunnel section, from meddle, where explosion is localized, to the tunnel
opening.
Conclusions
The proposed study was motivated by the fact that explosion in an underground structure may not only
cause direct life loss, but also damage the structure and lead to further loss of lives and properties.
Preventive measures should therefore be undertaken to protect existing subway and tunnel structures,
at least the most important or most vulnerable sections, from collapse under internal blast loading; such
internal blast loading should also be properly taken into consideration in the design of new structures. The
importance of this issue was pointed out in numerous documents and reports [6, 7].

1 2 3 4 5 6 7 8 9 10 11 12 13 14 15 16 17 18 19 20 21 22 23 24 25 26 27 28 29 30 31 32 33 34 35 36 37 38 39 40 41 42 43 44 45 46 47 48 49 50 51 52 53 54 55 56 57 58 59 60 61 62 63 64 65
14
The proposed methodology can be used to evaluate the structure integrity of existing subways and
tunnels and to design new underground structures taking into account the internal blast loading still need
to be developed.
References
[1] D. Manca, S. Brambilla, Complexity and Uncertainty in the Assessment of the Viareggio LPG Railway
Accident, Journal of Loss Prevention in the Process Industries, 2 (5) (2010) 668–679.
[2] S. Brambilla, D. Manca, The Viareggio LPG railway accident: event reconstruction and modeling, Journal of
Hazardous Materials, 182 (1-3) (2010) 346-357.
[3] J. Liu, Q. Yan, J. Wu, Analysis of blast wave propagation inside tunnel, Transactions of Tianjin University, 14
(5) (2008) 358-362.
[4] A. Skjeltorp, One-Dimensional Blast Wave Propagation, Norwegian Defence Construction Service Oslo, Oslo,
Norway, 1968.
[5] A. Skjeltorp, T. Hegdahl, A. Jenssen, Underground Ammunition Storage. Report I. Test Programme,
Instrumentation, and Data Reduction, Defense Technical Information Center, Oslo, Norway, 1975.
[6] F. Chill , A. Sala, F. Casadei, Containment of blast phenomena in underground electrical power plants, Advances
in Engineering Software, 29 (1) (1998) 7-12.
[7] S. Choi, J. Wang, G. Munfakh, E. Dwyre, 3D Nonlinear blast model analysis for underground structures, in:
Proc. GeoCongress 2006: Geotechnical Engineering in the Information Technology Age, ASCE, Atlanta, Georgia,
United States, 2006.
[8] H. Liu, Dynamic Analysis of Subway Structures Under Blast Loading, Geotechnical and Geological
Engineering, 27 (6) (2009) 699-711.
[9] M. Gui, M. Chien, Blast-resistant analysis for a tunnel passing beneath Taipei Shongsan airport–a parametric
study, Geotechnical and Geological Engineering, 24 (2) (2006) 227-248.
[10] A. Van den Berg, J. Weerheijm, Blast phenomena in urban tunnel systems, Journal of Loss Prevention in the
Process Industries, 19 (6) (2006) 598-603.
[11] S. Timoshenko, S. Woinowsky-Krieger, S. Woinowsky, Theory of plates and shells, McGraw-Hill New York,
1959.
[12] M.H. Sadd, Elasticity, Elsevier, 2004.
[13] L.S. Srinath, Advanced mechanics of solids, Tata McGraw-Hill, 2003.
[14] C. Truesdell, Mechanics of solids, Springer Verlag, 1973.
[15] I. Doghri, Mechanics of deformable solids, Springer, 2000.
[16] D.A. Crozier, J.G. Sanjayan, Tests of load-bearing slender reinforced concrete walls in fire, ACI Structural
Journal, 97 (2) (2000).
[17] A. O'Meagher, I. Bennetts, Modelling of concrete walls in fire, Fire safety journal, 17 (4) (1991) 315-335.
[18] F. Pesavento, D. Gawin, C.E. Majorana, A. Witek, B. Schrefler, Modelling of thermal damaging of concrete
structures during fire, in: Proc. VII Int. Conf. Computational Plasticity, CIMNE, 2003.
[19] B. Schrefler, P. Brunello, D. Gawin, C. Majorana, F. Pesavento, Concrete at high temperature with application
to tunnel fire, Computational mechanics, 29 (1) (2002) 43-51.
[20] M.A. Meyers, Dynamic behavior of materials, Wiley-Interscience, 1994.
[21] R.W. Gurney, The Initial Velocities of Fragments from Bombs, Shell and Grenades, U. S. Army, Aberdeen
Proving Ground, Maryland, 1943.
[22] S. Moaveni, Finite Element Analysis: Theory and Applications with ANSYS, 2003.
[23] M. Buonsanti, G. Leonardi, F. Scoppelliti, F. Cirianni, Dynamic Behavior of Granular Mixture Solids, Key
Engineering Materials, 488 (2012) 541-544.
[24] K.J. Bathe, Finite element procedures, Prentice hall Englewood Cliffs, NJ, 1996.
[25] M. Buonsanti, G. Leonardi, F. Scopelliti, 3-D Simulation of shock waves generated by dense explosive in shell
structures, Procedia Engineering, 10 (2011) 1554-1559.
[26] ANSYS Inc., Modeling and Meshing Guide, 2009.
[27] E. Committee, Eurocode2: Design of concrete structures-Part 1-2: General rules-Structural fire design, ENV
1992-1-2, 1995.

1 2 3 4 5 6 7 8 9 10 11 12 13 14 15 16 17 18 19 20 21 22 23 24 25 26 27 28 29 30 31 32 33 34 35 36 37 38 39 40 41 42 43 44 45 46 47 48 49 50 51 52 53 54 55 56 57 58 59 60 61 62 63 64 65
15
[28] International Organization for Standardization, ISO 834 Fire-resistance tests - Elements of building
construction - Part 1: General requirements, 1999.
[29] European Committee for Standardization, EN 1363-2: Fire resistance test. Part 2: Alternative and additional
procedures, 2000.
[30] Forschungsgesellschaft für Straßen - und Verkehrswesen, Richtlinien für Ausstattung und Betrieb von Tunneln
(RABT), Ausgabe, 1985.
[31] Instituut TNO voor Bouwmaterialen en Bouwconstructies, Rapport betreffende de beproeving van het gedrag
van twee isolatiematerialenter bescherming van tunnels tegen brand, Delft, The Netherlands, 1980.
[32] D. Hyde, CONWEP, Conventional Weapons Effects Program, US Army Engineer Waterways Experiment
Station, Vicksburg, USA, 1992.
[33] M. Silvestrini, B. Genova, F. Leon Trujillo, Energy concentration factor. A simple concept for the prediction of
blast propagation in partially confined geometries, Journal of Loss Prevention in the Process Industries, 22 (4)
(2009) 449-454.
[34] Center for chemical process safety, Guidelines for Evaluating the Characteristics of Vapor Cloud Explosions,
Flash Fires and BLEVEs, American institute of chemical engineers, 1994.
[35] C. Van Den Bosh, R. Weterings, Methods for the calculation of physical effects (Yellow Book), The Hague
(NL): Committee for the Prevention of Disasters, (1997).
[36] G.J. DeSalvo, J.A. Swanson, ANSYS User's Manual, Swanson Analysis Systems, Inc, (1979).
[37] UNI - Ente Nazionale Italiano di Unificazione, UNI 9502:2001 - Analytical fire resistance assessment of
reinforced concrete and prestressed concrete structural elements, UNI, Milano, Italy, 2001.

1 2 3 4 5 6 7 8 9 10 11 12 13 14 15 16 17 18 19 20 21 22 23 24 25 26 27 28 29 30 31 32 33 34 35 36 37 38 39 40 41 42 43 44 45 46 47 48 49 50 51 52 53 54 55 56 57 58 59 60 61 62 63 64 65
16
Fig. 1. Tunnel theoretical model (a); tunnel-section with load conditions (b)
Fig. 2. Rail tunnel section
Fig. 3. 3-D 10-node Tetrahedral Structural Solid Element
Fig. 4. Tunnel curves according to fire course models for tunnels
Fig. 5. Meshed model
Fig. 6. Temperature distribution (°C) and thermal strain (m) at t = 1800 sec.
Fig. 7. Deformation (m) of the tunnel at the explosion instant.
Fig. 8. Mises stress (Pa) of the tunnel at the explosion instant.

1 2 3 4 5 6 7 8 9 10 11 12 13 14 15 16 17 18 19 20 21 22 23 24 25 26 27 28 29 30 31 32 33 34 35 36 37 38 39 40 41 42 43 44 45 46 47 48 49 50 51 52 53 54 55 56 57 58 59 60 61 62 63 64 65
17
Table 1. Drucker-Prager model parameters for soil
Young’s
modulus E
(MPa)
Density
(kg/m3)
Poisson’s
Ratio
Yield stress
(MPa)
Friction
angle
(°)
Specific
Heat
(J/kg°K)
Thermal
conductivity
(W/m°C)
146.72 1890 0.3 0.056 43 1840 2.00

1 2 3 4 5 6 7 8 9 10 11 12 13 14 15 16 17 18 19 20 21 22 23 24 25 26 27 28 29 30 31 32 33 34 35 36 37 38 39 40 41 42 43 44 45 46 47 48 49 50 51 52 53 54 55 56 57 58 59 60 61 62 63 64 65
18
Table 2. Mechanical characteristics of concrete
Young’s modulus E
(MPa)
Density
(kg/m3)
Poisson’s
Ratio
30000 2300 0.18

1 2 3 4 5 6 7 8 9 10 11 12 13 14 15 16 17 18 19 20 21 22 23 24 25 26 27 28 29 30 31 32 33 34 35 36 37 38 39 40 41 42 43 44 45 46 47 48 49 50 51 52 53 54 55 56 57 58 59 60 61 62 63 64 65
19
Table 3. Temperature dependence of concrete modulus of elasticity [37]
Temperature
(°C) 20 50 200 400 600
Young’s modulus E
(MPa) 3000 3000 1500 450 150

1 2 3 4 5 6 7 8 9 10 11 12 13 14 15 16 17 18 19 20 21 22 23 24 25 26 27 28 29 30 31 32 33 34 35 36 37 38 39 40 41 42 43 44 45 46 47 48 49 50 51 52 53 54 55 56 57 58 59 60 61 62 63 64 65
20
Table 4. HC curve values
Time
(min) 0 1 5 10 20 30
Temperature
(°C) 0 741 928 1014 1068 1078

1 2 3 4 5 6 7 8 9 10 11 12 13 14 15 16 17 18 19 20 21 22 23 24 25 26 27 28 29 30 31 32 33 34 35 36 37 38 39 40 41 42 43 44 45 46 47 48 49 50 51 52 53 54 55 56 57 58 59 60 61 62 63 64 65
21
Table 5. Calculation of the overpressure in a tunnel of 28 m2 section area for the
BLAVE of a 50 m3 LPG rail tanker
Distance (m) 50 100 150
ECF 87 349 785
R’ 0.52 0.66 0.76
P0/Ps 1.1 0.8 0.65
Ps (Pa) 111457 81060 65861

internal pressure
pb
paa
b
q
b)
sqq
qr
q
srq
x
y
a)
Figure 1

5.00
Figure 2

Y
Z
X
23
4
PR
Q
K
N
J
MI
O
Figure 3

0 3 5 10 20 30 40 50 60 70 80 90 100 110 120 130
200
400
600
800
1000
1200
14002
3
4
12
3
1
4
RABT/ZTV Tunnel Curve
Rijkswaterstaat Tunnel Curve
Hydrocarbon Curve
Standard Temperature Curve (STC)
Time [min]
Te
mp
era
ture
ϑ −
ϑ0 [K]
cooling phase
1260 13001350
1300
1200
1014
1068 1078 10801080
566
658
761
822
925986 1029
cooling phase
Figure 4

Figure 5Click here to download high resolution image

Figure 6Click here to download high resolution image
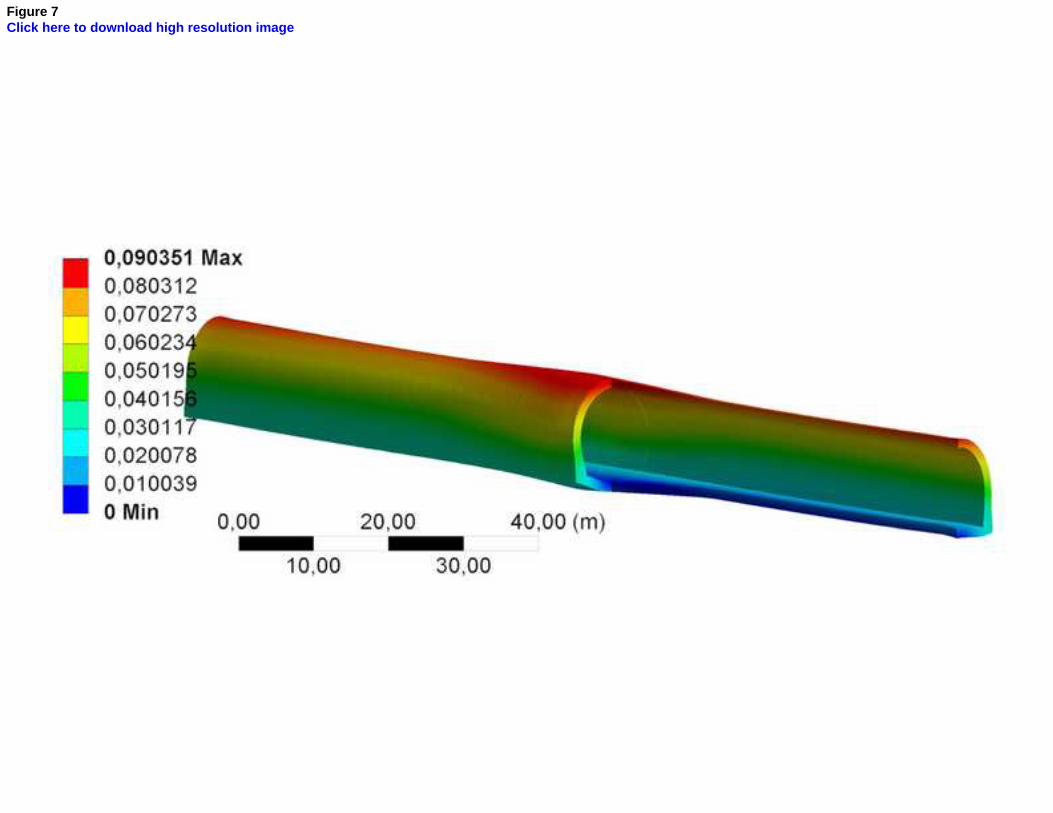
Figure 7Click here to download high resolution image

Figure 8Click here to download high resolution image
Related Documents