1 3. Chapter 3: JOINT PERFORMANCE TEST SETUPS AND EVALUATION PROCEDURES 3.1 Introduction A joint performance component has not yet been incorporated in any of the currently available whitetopping design procedures. Probably, the complexity involved in its characterization is the reason for being neglected. Most of the research studies ( Colley & Humphrey, 1967; Nowlen, 1968; Bruinsma, et al., 1995 Raja & Snyder, 1995 and Jensen & Hansen, 2001 and Brink, et al., 2004) that characterized the joint performance in conventional concrete pavements were carried out by casting large size slabs. Joint performance characterization with large size slabs is expensive and generally cost-prohibitive, when evaluating the joint performance with respect to a large number of variables. Therefore, development of a simple, economic and accurate joint performance test procedure is a dire necessity. The present study developed a small-scale joint performance test. As mentioned in Chapter 1, this procedure is referred as the ‘beam accelerated load testing’ (B ALT ) procedure. The procedures for estimating the joint performance characterizing parameters such as LTE and DER are also established in this study. The results obtained from the B ALT procedure is then compared and correlated with the results from a large-scale joint performance test. The large- scale procedure is referred as to the ‘slab accelerated load testing’ (S ALT ). Although the joint performance testing with a large size slab is not new, the setup used to conduct the tests in the present study was fabricated under the scope of the present project. This chapter includes a detailed description on the design and fabrication aspects associated with both the B ALT and S ALT procedures. 3.2 Beam Accelerated Load Testing, B ALT The B ALT procedure has been developed with a vision to make the joint performance evaluation task very simple and economical so that the test can be conducted using readily available laboratory resources or with a marginal investment. In the B ALT procedure, joint performance can be characterized by (i) using the conventional 24- x 6- x 6-in beam specimens that are

Welcome message from author
This document is posted to help you gain knowledge. Please leave a comment to let me know what you think about it! Share it to your friends and learn new things together.
Transcript
1
3. Chapter 3: JOINT PERFORMANCE TEST SETUPS AND EVALUATION
PROCEDURES
3.1 Introduction
A joint performance component has not yet been incorporated in any of the currently available
whitetopping design procedures. Probably, the complexity involved in its characterization is the
reason for being neglected. Most of the research studies ( Colley & Humphrey, 1967; Nowlen,
1968; Bruinsma, et al., 1995 Raja & Snyder, 1995 and Jensen & Hansen, 2001 and Brink, et al.,
2004) that characterized the joint performance in conventional concrete pavements were carried
out by casting large size slabs. Joint performance characterization with large size slabs is
expensive and generally cost-prohibitive, when evaluating the joint performance with respect to
a large number of variables. Therefore, development of a simple, economic and accurate joint
performance test procedure is a dire necessity. The present study developed a small-scale joint
performance test. As mentioned in Chapter 1, this procedure is referred as the ‘beam accelerated
load testing’ (BALT) procedure.
The procedures for estimating the joint performance characterizing parameters such as LTE and
DER are also established in this study. The results obtained from the BALT procedure is then
compared and correlated with the results from a large-scale joint performance test. The large-
scale procedure is referred as to the ‘slab accelerated load testing’ (SALT). Although the joint
performance testing with a large size slab is not new, the setup used to conduct the tests in the
present study was fabricated under the scope of the present project. This chapter includes a
detailed description on the design and fabrication aspects associated with both the BALT and SALT
procedures.
3.2 Beam Accelerated Load Testing, BALT
The BALT procedure has been developed with a vision to make the joint performance evaluation
task very simple and economical so that the test can be conducted using readily available
laboratory resources or with a marginal investment. In the BALT procedure, joint performance
can be characterized by (i) using the conventional 24- x 6- x 6-in beam specimens that are
2
actually cast for modulus of rupture testing, (ii) performing the test on a scaled down facility and
(iii) using only one single low capacity (max. capacity ~2000 lbs) actuator. These objectives
were achieved by (i) designing and fabricating the BALT in such a way that the mechanical action
induced on the joints of an in-service concrete pavement can be replicated in the BALT procedure,
(ii) determining magnitude of the scaled down load corresponding to an equivalent standard axle
load (ESAL), (9000 lb), (iii) determining the location for the application of the scaled down load
and (iv) establishing the specimen preparation, testing and data collection procedures.
3.2.1 Setup design principle
The test setup was design to replicate the abrasive action that occurs on the joints of an in-service
concrete pavement. Both the conditions (i) when the wheel is on the approach (case I) and (ii)
when the wheel is on the leave slab (case II) were considered. In the BALT procedure, unlike the
in-service pavements, load is applied only on one side of the joint. In the in-service condition,
when the load is applied on the approach slab, the approach slab directly deflects down, and the
leave slab is indirectly pulled down by the approach slab because of the load transfer
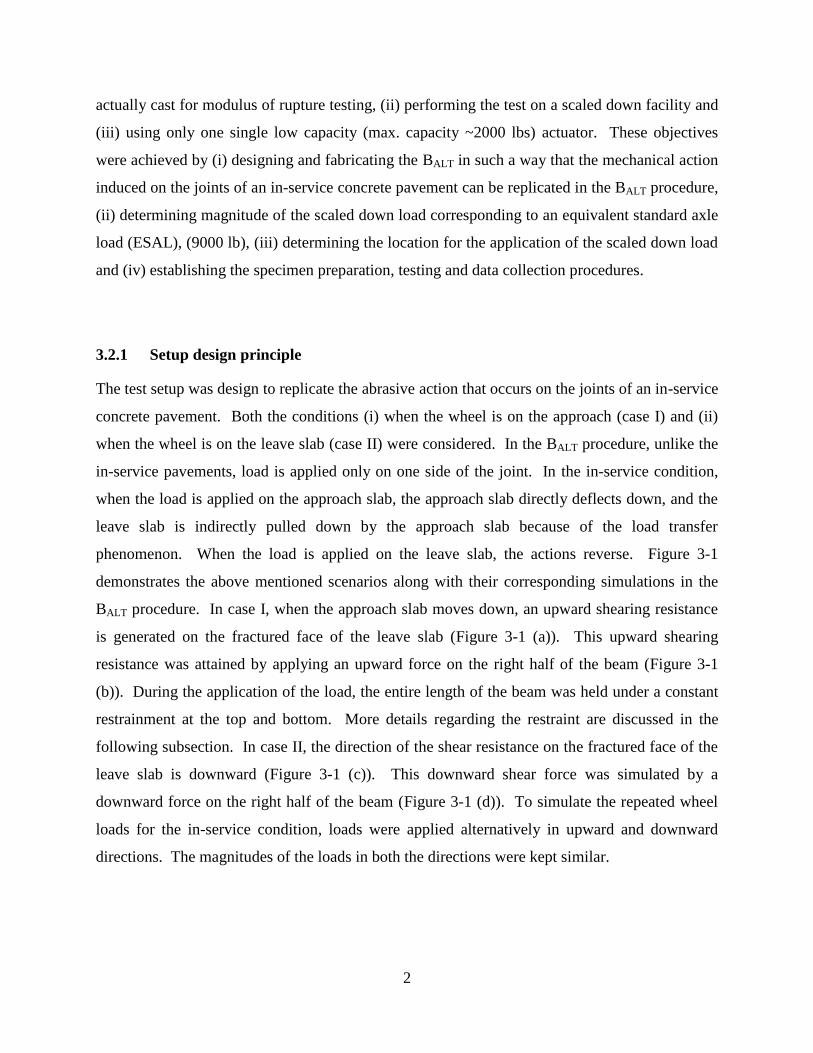
phenomenon. When the load is applied on the leave slab, the actions reverse. Figure 3-1
demonstrates the above mentioned scenarios along with their corresponding simulations in the
BALT procedure. In case I, when the approach slab moves down, an upward shearing resistance
is generated on the fractured face of the leave slab (Figure 3-1 (a)). This upward shearing
resistance was attained by applying an upward force on the right half of the beam (Figure 3-1
(b)). During the application of the load, the entire length of the beam was held under a constant
restrainment at the top and bottom. More details regarding the restraint are discussed in the
following subsection. In case II, the direction of the shear resistance on the fractured face of the
leave slab is downward (Figure 3-1 (c)). This downward shear force was simulated by a
downward force on the right half of the beam (Figure 3-1 (d)). To simulate the repeated wheel
loads for the in-service condition, loads were applied alternatively in upward and downward
directions. The magnitudes of the loads in both the directions were kept similar.
3
Figure 3-1: Loading scenarios in the in-service pavement and their simulation in the BALT procedure.
3.2.2 Components
Foundation and restraint: The foundation support provided by the lower layers under the
concrete slab in an in-service pavement was replicated by an artificial foundation. Since, the
load was applied in both upward and downward direction, an artificial foundation was provided
at both the top and bottom of the specimen. Two layers of neoprene pads, known as Fabcel 25
(http://www.fabreeka.com/Products &productId=24), were used as the foundation. Figure 3-2
shows the picture of a Fabcel 25 waffle shaped neoprene pads.
The stiffness of the two combined Fabcel layers was determined by conducting plate load testing
according to ASTM-D1195/D1195M, 2009), and was found as 200 psi/in. The specimen and
Fabcel layers were vertically restrained so that the deflection under the load is only due to the
compression of the Fabcel layers. Figure 3-3 shows a picture of the BALT setup. Figure 3-4
shows the cross section of the test setup. Different components can be seen in these two figures.
Case I: Load at approach side Case II: Load at leave side
Slab Slab
Beam Beam
Fabcel
Fabcel

4
Figure 3-2: Picture of a waffle shape neoprene pad, Fabcel 25.
Figure 3-3: Photo of the BALT test setup.
(a) Flange of base I-beam
(b) Fabcel
(c) Top I-beam
(d) Restraining rod
(e) Brace plate
(f) Horizontal load plates
(g) Vertical load plates
(h) Calibrated spring
(1) LVDT and its holder
(c)
(b)
(b)
(a)
(d)
(e) (f)
(f)
(g)
(h)
(d) (d)
(e) (e)
(l)
(1)
Unloaded side Loaded side

5
Figure 3-4: Schematic of the cross section of BALT setup.
A 17-inch wide I-beam, to be referred as the base I-beam in this study, was used as the platform
for the BALT setup. This base I-beam was situated on the concrete floor of the lab. The Fabcel
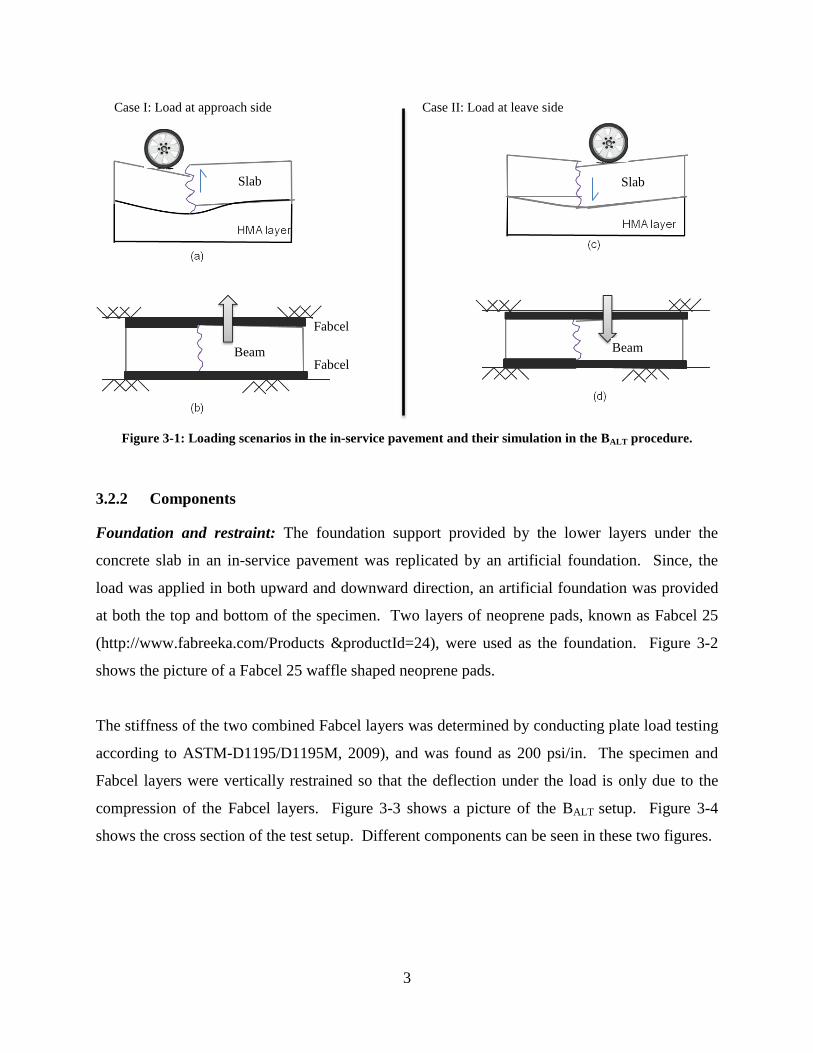
layers were directly laid on the top flange of this base I-beam. At the top of the specimen, a built
up I-beam with a 6-in wide bottom flange (equal to the width of the beam specimen), was placed
on the Fabcel layer. This I-beam is referred as the top I-beam in this study, and is shown in
Figure 3-5.
To secure the top I-beam with the base I-beam, six 1-in diameter threaded rods (referred to as
restraining rods), three brace plates and twenty four hexagonal nuts were used in the assembly.
The test specimen, covered with two layers of Fabcel at top and bottom, rests in between top I-
beam and base I-beam. The brace plates, which run across the top flange of the top I-beam, were
strategically placed, one at the mid-span (on top of the joint) and the other two near the edges.
These brace plates were secured with the top flange of the base I-beam by a pair of restraining
rods. Hexagonal nuts were used to tight the assembly. A torque of 40 in-lb was applied to all
the nuts located at the top of the brace plates that keep a uniform restraint along and across the
specimen. It was observed that with a 40-in-lb torque, the reproducibility of the results
(deflections and LTE) was better. The assembly was strong and sturdy with no or negligible
movement of the top I-beam when the dynamic load was applied. A torque below 40 in-lb on
the nuts provides higher deflection under tension loading, and a higher torque produces lower
(f) Horizontal load plates
(g) Vertical load plates
(h) Calibrated spring (i) Bearing with collar
(j) Loading rod
(k) Beam specimen
(l) Actuator
(d)
(a)
(b)
Load from actuator (l)
(f)
(h)
(g) (g)
n
2 2
(k)
(i)
(c)
(d)
(e)
(j)
6
deflection in both the tension and compression loads. However, the torque on the nuts creates a
pre-compression in the Fabcel layers. The deflections measured, with the help of linear variable
differential transformer (LVDT), before and after the application of the torque, showed that the
Fabcel layers compress by 25 mils under this level of applied torque.
Figure 3-5: The top I-beam in BALT setup.
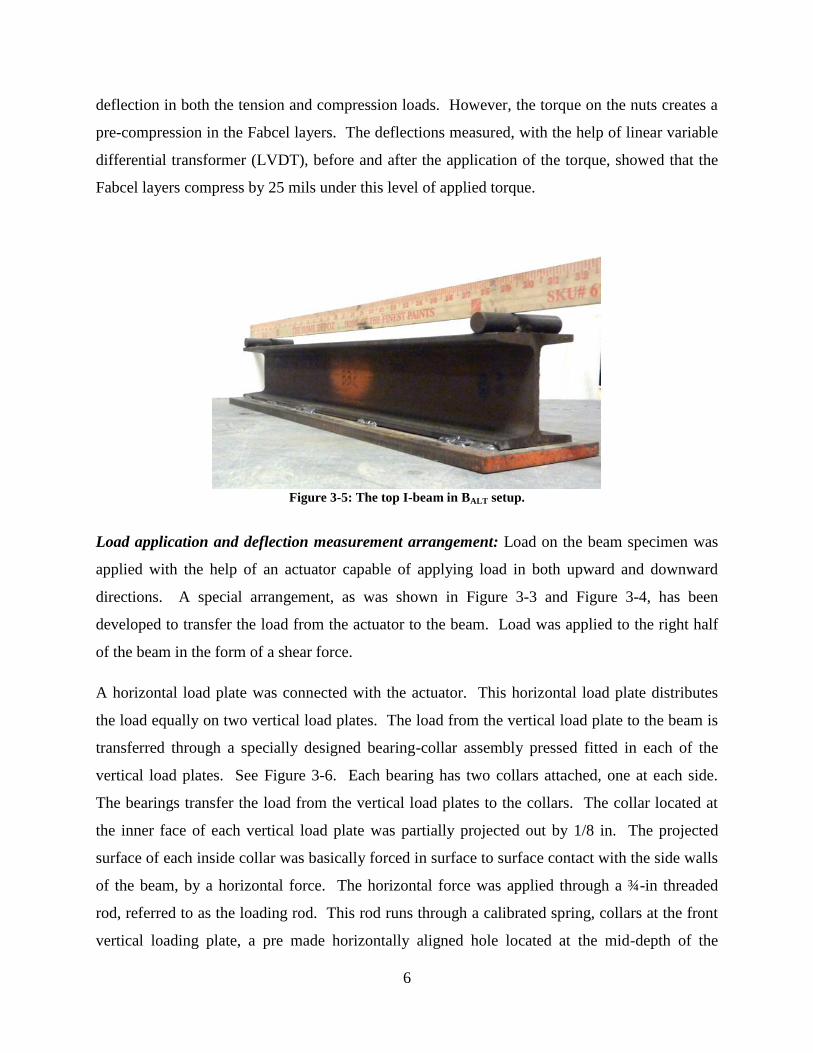
Load application and deflection measurement arrangement: Load on the beam specimen was
applied with the help of an actuator capable of applying load in both upward and downward
directions. A special arrangement, as was shown in Figure 3-3 and Figure 3-4, has been
developed to transfer the load from the actuator to the beam. Load was applied to the right half
of the beam in the form of a shear force.
A horizontal load plate was connected with the actuator. This horizontal load plate distributes
the load equally on two vertical load plates. The load from the vertical load plate to the beam is
transferred through a specially designed bearing-collar assembly pressed fitted in each of the
vertical load plates. See Figure 3-6. Each bearing has two collars attached, one at each side.
The bearings transfer the load from the vertical load plates to the collars. The collar located at
the inner face of each vertical load plate was partially projected out by 1/8 in. The projected
surface of each inside collar was basically forced in surface to surface contact with the side walls
of the beam, by a horizontal force. The horizontal force was applied through a ¾-in threaded
rod, referred to as the loading rod. This rod runs through a calibrated spring, collars at the front
vertical loading plate, a pre made horizontally aligned hole located at the mid-depth of the

7
specimen and collars at the rear vertical loading plate. Nuts on this loading rod on each side of
the beam are tightened to apply the horizontal force. The pictures of the calibrated spring,
loading rod, nut, bearing and collar assembly are shown in Figure 3-6.
The load is quantified by the calibrated spring, which has a spring constant equal to 3000 lb/ in.
The magnitude of the required horizontal tensile force at the loading rod or the compression at
the collar-beam interface is a function of the load magnitude on each vertical load plate and
coefficient of friction between the steel and concrete surfaces. Sufficient horizontal force was
applied to generate the required frictional resistance at the collar-beam interface so that the total
vertical load from the actuator was transferred to the beam, without any sliding. The magnitude
and location of the load used is discussed in Section 3.2.3. The purpose of the bearings in the
loading assembly was to create a hinge along the axis of the loading rod so that no moment is
transferred to the beam either from the load or from the restrainment. The load induced
deflection profile is therefore purely a function of the applied load magnitude, analogous to the
in-service condition.
The deflections at both sides of the joint were measured by two LVDTs. One aluminum LVDT
holder was glued on each side of the joint on the front side of the beam.
Crack width control arrangement: The crack width control assembly in the BALT setup can be
seen in Figure 3-7 and Figure 3-8. Crack width was controlled by regulating a horizontal force
along the length of the specimen. While casting the specimen, a ¾-in threaded rod is embedded
in each end of the beam along the longitudinal axis. This rod is referred to as a tension rod. The
embedded length of the tension rod was 4.5 in, while the exposed length was around 1.5 to 2 in.
On the left hand side of the beam, the exposed end of the tension rod is connected to a
horizontally aligned steel angle running across the width of the beam. Two more parallel ¾-in
threaded rods (referred to as crack width (cw) control rods) coming out from this steel angle
were connected to a vertical column through one more steel angel and a bracket, as shown in
Figure 3-7.

8
(c)
Inner collar
Loading rod
Calibrated spring
Outer collar
(a)
Outer collar
fixed in place Outer face of the
vertical load plate
Bearing Collar at the outer face
Placement of outer
collar
(b)
Inner face of the
vertical load plate
Inner collar
fixed in place
Collar at the inner face
Bearing
Placement of
inner collar
Figure 3-6: Loading and deflection measuring assembly (a) bearing and collar at the outer face of the vertical
load plate (b) bearing and collar at the inner face of the vertical load plate (c) calibrated spring, loading rod
and the concrete face where the inner collar remains in contact.
9
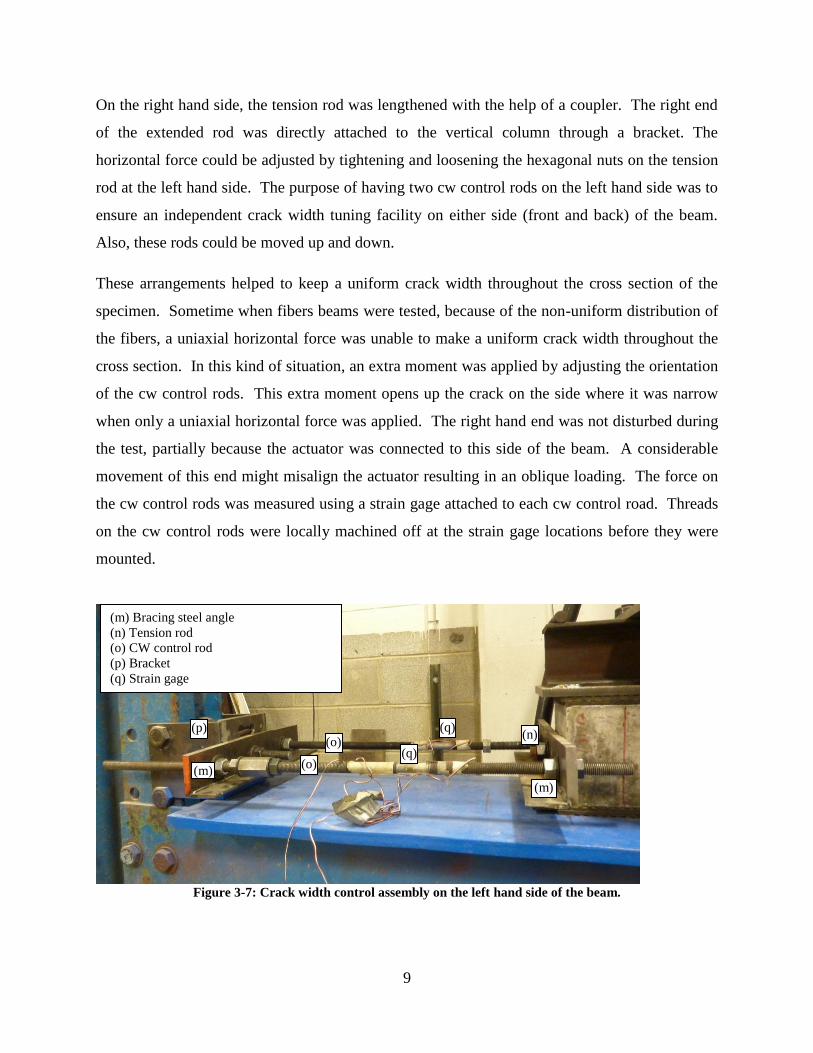
On the right hand side, the tension rod was lengthened with the help of a coupler. The right end
of the extended rod was directly attached to the vertical column through a bracket. The
horizontal force could be adjusted by tightening and loosening the hexagonal nuts on the tension
rod at the left hand side. The purpose of having two cw control rods on the left hand side was to
ensure an independent crack width tuning facility on either side (front and back) of the beam.
Also, these rods could be moved up and down.
These arrangements helped to keep a uniform crack width throughout the cross section of the
specimen. Sometime when fibers beams were tested, because of the non-uniform distribution of
the fibers, a uniaxial horizontal force was unable to make a uniform crack width throughout the
cross section. In this kind of situation, an extra moment was applied by adjusting the orientation
of the cw control rods. This extra moment opens up the crack on the side where it was narrow
when only a uniaxial horizontal force was applied. The right hand end was not disturbed during
the test, partially because the actuator was connected to this side of the beam. A considerable
movement of this end might misalign the actuator resulting in an oblique loading. The force on
the cw control rods was measured using a strain gage attached to each cw control road. Threads
on the cw control rods were locally machined off at the strain gage locations before they were
mounted.
Figure 3-7: Crack width control assembly on the left hand side of the beam.
(m)
(n)
(m)
(m) Bracing steel angle
(n) Tension rod
(o) CW control rod
(p) Bracket
(q) Strain gage
(o)
(o) (p) (q)
(q)

10
Figure 3-8: Crack width control assembly on the right hand side of the beam.
3.2.3 Load magnitude and location
The magnitude and location of the load in the BALT procedure were determined through an
analysis using the finite element method (FEM). The finite element analysis software, ABAQUS
FEA (http://www.3ds.com/products/simulia/portfolio/abaqus/overview/) was utilized. The BALT
procedure was modeled in such a manner to capture the equivalent joint performance between
the two adjacent 4-in thick, 5-ft x 6-ft whitetopping slabs. First a FEM model for the above
mentioned slab was developed. Then, using similar material properties, a model for the beam
specimen was developed. Deflection profiles for the 12- in x 6-in x 6-in beam specimen (half of
a 24-in long beam) in the BALT procedure were matched with the deflection profiles for the 4-in
slab in the SALT procedure. A detail of the modeling features for both the procedures is described
below.
Table 1 presents the general features for the slab model. Figure 3-9 shows a screenshot of the
slab model in ABAQUS. A load of 9000 lbs was applied on a space 10- x 10-in square area on
the right hand side of the slab. The center of the loading area is 18 in away from the left hand
side longitudinal edge and 6 in away from the transverse joint, analogous to the Raja & Snyder,
1995 study. Both the adjacent slabs are rested on an elastic foundation with a stiffness
equivalent to 200 psi/inch modulus of subgrade reaction. Two layers of Fabcel-25 pads provide
(r) Coupler
(s) Extension of tension rod
(n) (r) (s)
(p)

11
such foundation stiffness. The load transfer between the adjacent slabs was modeled using
translational springs in the Z- direction. Each pair of nodes on the adjacent slab across the
transverse and longitudinal joints was connected by one single spring.
Table 1: Input and FEM modeling features for the concrete slab model.
Slab size 60 x 72 x 4 inch
Modulus of elasticity of concrete 4,000,000 psi
Poisson’s ratio of concrete 0.15
Density of concrete 0.0026 slugs/inch3
Modulus of subgrade reaction 200 psi/in
Element type 27 noded brick
Element size 1 x 1 x 1 inch
Figure 3-9: Screenshot of the slab model.
The joint stiffness (AGG) is a spring constant that relates to the non-dimensional joint stiffness
(AGG*= AGG/kl). Using the Ioannides & Korovesis, 1990 relationship for the LTE vs AGG*,
AGG* for a given LTE can be determined. The stiffness assigned to each node, K, is based on
the area contributing to the stiffness of that node. The ratio of the areas covered by the corner,
edge and intermediate nodes is 1:2:4, therefore, for equally spaced nodes the spring constants can
also be assigned in that ratio. The following equations (3-1), (3-2) and (3-3) ( Feng & Ming,
2009) are used to determine the respective spring constants assuming uniformly spaced nodes.
( )( ) (3-1)
12
(3-2)
(3-3)
where , and are the spring constants (lb/in) at the corner, edge and
intermediate nodes on the joint faces, respectively; k is the modulus of subgrade reaction
(psi/inch); L is the width of the slab (inch), 72 inch in the present case; l is the radius of relative
stiffness (inch); AGG* is the non-dimensional joint stiffness; and and are the numbers of
rows and columns of nodes on the joint face, which depend on the element size, type and area of
the cross section of the slab.
Using the slab model, deflection profiles were generated for two different cases, one with an 85
percent LTE and the other with a 90 percent LTE. Relatively higher LTEs were chosen so that
the influence of the joint performance is dominant in the generated deflection profiles, but not
the foundation. The deflection profiles for the two cases are shown in Figure 3-10 and Figure
3-11. The maximum deflections obtained for the two cases are quite similar, 0.034 and 0.033
inches for 85 and 90 percent LTEs, respectively. The slope of the generated deflection profiles,
calculated for a12-in length starting from the transverse joint, were -1/1350 and -1/1430 at 85
and 90 percent LTEs, respectively. The slopes on the loaded side of the slab were considered.
The reason for determining the slope only up to a 12- in length is because the length of loaded
side of specimen in the BALT procedure is also 12 in.

13
Figure 3-10: Deflection profile of slab at 85% LTE.
Figure 3-11: Deflection profile of slab at 90% LTE.
Next, the beam model was developed. The input related to foundation, materials and modeling
features were kept similar to that of the slab model, as was given in Table 1. The load in the
-0.010
0.000
0.010
0.020
0.030
0.040
0.050
0 20 40 60 80 100 120
Def
lect
ion (
inch
)
Distance from the transverse joint (inch)
Max. defl. = 0.034 inch;
slope = -1/1350
-0.010
0.000
0.010
0.020
0.030
0.040
0.050
0 20 40 60 80 100 120
Def
lect
ion (
inch
)
Distance from the transverse joint (inch)
Max. defl. = 0.033
inch; slope = -1/1430
Loaded side Unloaded side
Unloaded side Loaded side

14
beam model was applied in the form of surface traction on a 6 in2
rectangular area, on both the
front and back side walls. This loading scenario was chosen to simulate the applied force in the
BALT. Figure 3-12 presents a screenshot of the beam model with the loading area shown at the
front side of the beam. The ratio of the joint spring constants ( , and )
was 1:2:4. Figure 3-13 shows the transverse joint springs in the beam model and the modeled
elastic foundation.
Figure 3-12: Beam model with the loading area depicted.
Figure 3-13: Side view of the beam model showing joint springs and foundations.
It was desired that the deflection and rotation of the beam simulated that of the slab. The load
magnitude and location were selected to achieve these goals. Both the slab from the SALT and
beam from the BALT were analyzed using the FEM so the deflection and rotation could be
characterized for a range of load magnitudes and load locations. The analysis was performed for
LTE of 85 and 90 percent. The generated deflection profiles for the beam were compared with
deflection profiles for the slab (Figure 3-10 and Figure 3-11). An initial scanning of the beam
deflections revealed that the magnitude of the load in the beam could be within the range of 1000
to 1100 lbs and the location between 4 to 5 in. Table 2 presents the values of maximum
deflections and the slope of deflection profiles for a few of the runs which were found to be
closer to the slab deflection profiles at 85 and 90 percent LTEs. Figure 3-14 and Figure 3-15
Loading area
Unloaded side Loaded side
Joint spring
Elastic foundation

15
provide the graphical comparison of the deflection profiles. It can be seen that in both cases (85
and 90 percent LTE) the maximum deflection and slope for the beam closely matches with the
slab when the load magnitude and location are 1050 lbs and 4.5 in, respectively. Hence, the
magnitude and location of the load in the beam test was selected as 1050 lbs and 4.5 in.
Table 2: Maximum deflection and the deflection profile slope for different load magnitude and
locations.
Target
LTE (%)
Load (lb) Dist.
from the trans.
joint (in)
Maximum
deflection (in)
Slope
85 1000 4.0 0.038 -1/543
85 1000 4.5 0.033 -1/1124
85 1000 5.0 0.028 1/155584
85 1050 4.5 0.035 -1/1070
85 1100 4.0 0.042 -1/495
85 1100 4.5 0.036 -1/1026
85 1100 5.0 0.031 1/14286
90 1000 4.0 0.036 -1/604
90 1000 4.5 0.032 -1/1379
90 1000 5.0 0.027 1/4881
90 1050 4.5 0.033 -1/1313
90 1100 4.0 0.040 -1/550
90 1100 4.5 0.035 -1/1253

16
Figure 3-14: Comparison of the deflection profiles for the beam and slab at 85 percent LTE.
Figure 3-15: Comparison of the deflection profiles for the beam and slab at 90 percent LTE.
-0.01
0
0.01
0.02
0.03
0.04
0.05
0 10 20 30 40 50 60
Def
lect
ion
(in
ch)
Distance from the transverse joint (in)
Slab Beam: 4 in, 1000 lb Beam: 4 in, 1100 lb
Beam: 4.5 in, 1000 lb Beam: 4.5 in, 1050 lb Beam: 4.5 in, 1100 lb
Beam: 5 in, 1000 lb Beam: 5 in, 1100 lb
-0.01
0.00
0.01
0.02
0.03
0.04
0.05
0 10 20 30 40 50 60
Def
lect
ion (
inch
)
Distance from the transverse joint (inch)
Slab Beam: 4 in, 1000 lb Beam: 4 in, 1100 lb
Beam: 4.5 in, 1000 lb Beam: 4.5 in, 1050 lb Beam: 4.5 in, 1100 lb
Beam: 5 in, 1000 lb

17
3.2.4 Specimen preparation
One of the advantages of the BALT procedure is the utilization of the readily available 24- x 6- x
6-in steel beam molds for specimen preparation. These molds are generally utilized to make
beams for modulus of rupture testing of concrete ( ASTM-C78/C78M, 2010). Test specimens
were prepared in a manner such that the specimen has one tension rod at each end along the
longitudinal axis, and has a notched crack at the bottom at mid-span controlling the location of
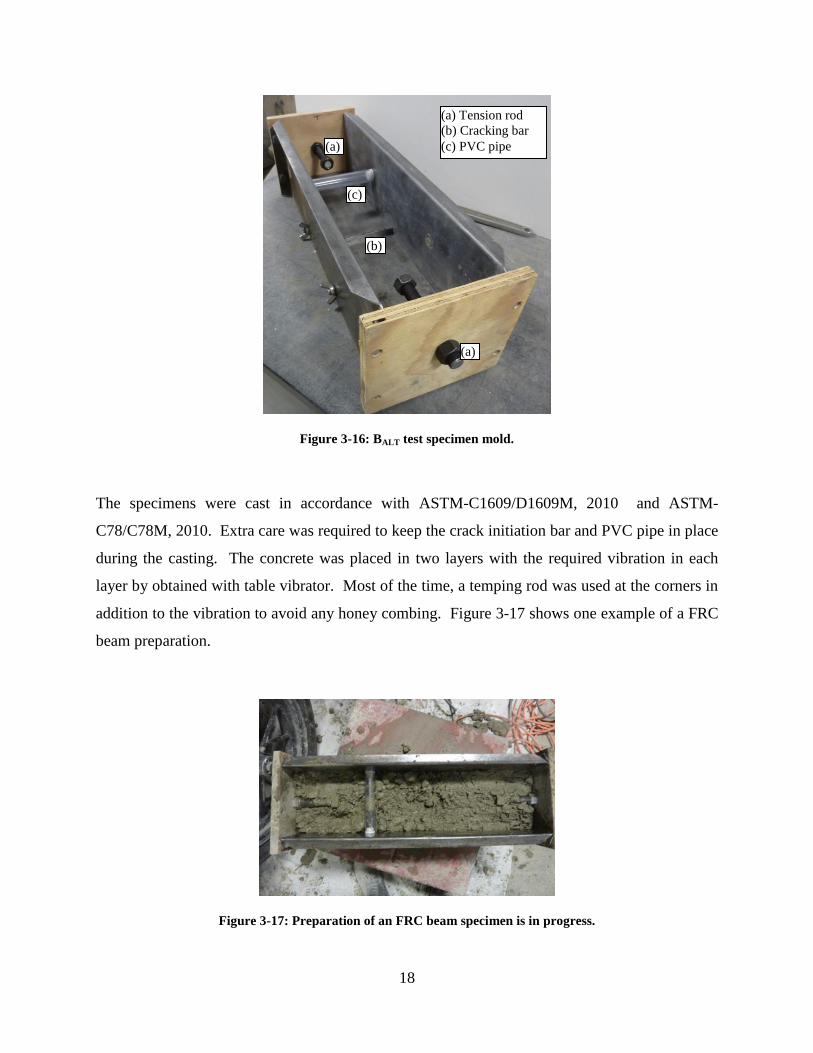
the fracture plane. In the present study, 24- x 6- x 6-in steel mold was used with some
modification. To accommodate the tension rod at both the ends, the steel end caps were replaced
with wooden planks, as shown in Figure 3-16. The wooden planks were pressed fitted at the end
of the longitudinal sides using the bolts available at the end of each longitudinal side. Holes
were drilled through the center to accommodate the tension rods. A steel wire was looped
around the all four sides to provide an extra rigidity so that the end caps were held securely in
place. Nuts were firmly tightened on both sides of the plank to secure the tension rods firmly in
place. A ½- x ¼- x 6- in metal bar was glued at the center of the bottom plate to create a notch
for crack initiation. A horizontally aligned hollow PVC pipe was attached in the mold to keep
the space for the loading rod. Two plastic end caps were glued to the surface of the longitudinal
walls of the mold to hold the pipe horizontal. The inside diameter of the pipe was ¾ in. The
pipe was placed in a location such that the longitudinal axis of the pipe was 4.5 in away from the
mid-span of the beam and 3 in above the bottom plate.
18
Figure 3-16: BALT test specimen mold.
The specimens were cast in accordance with ASTM-C1609/D1609M, 2010 and ASTM-
C78/C78M, 2010. Extra care was required to keep the crack initiation bar and PVC pipe in place
during the casting. The concrete was placed in two layers with the required vibration in each
layer by obtained with table vibrator. Most of the time, a temping rod was used at the corners in
addition to the vibration to avoid any honey combing. Figure 3-17 shows one example of a FRC
beam preparation.
Figure 3-17: Preparation of an FRC beam specimen is in progress.
(a) Tension rod
(b) Cracking bar
(c) PVC pipe (a)
(a)
(b)
(c)

19
Specimens were demolded at 14 to 15 hours after casting. The crack initiation bar and the plastic
end caps attached to the PVC pipe, were removed. A gentle tapping with a screw driver on one
end of the crack initiation bar slides it out easily, as shown in Figure 3-18. The next task was to
adhere three pairs of aluminum gage studs on each side of the specimen, as shown in Figure
3-19. These studs had a conical shaped slot on them. The distance between the slots in each pair
of studs was measured in triplicate when recording the initial gage distance. The purpose of the
gage studs was to monitor the crack width.
Figure 3-18: Removal of cracking bar from the concrete.
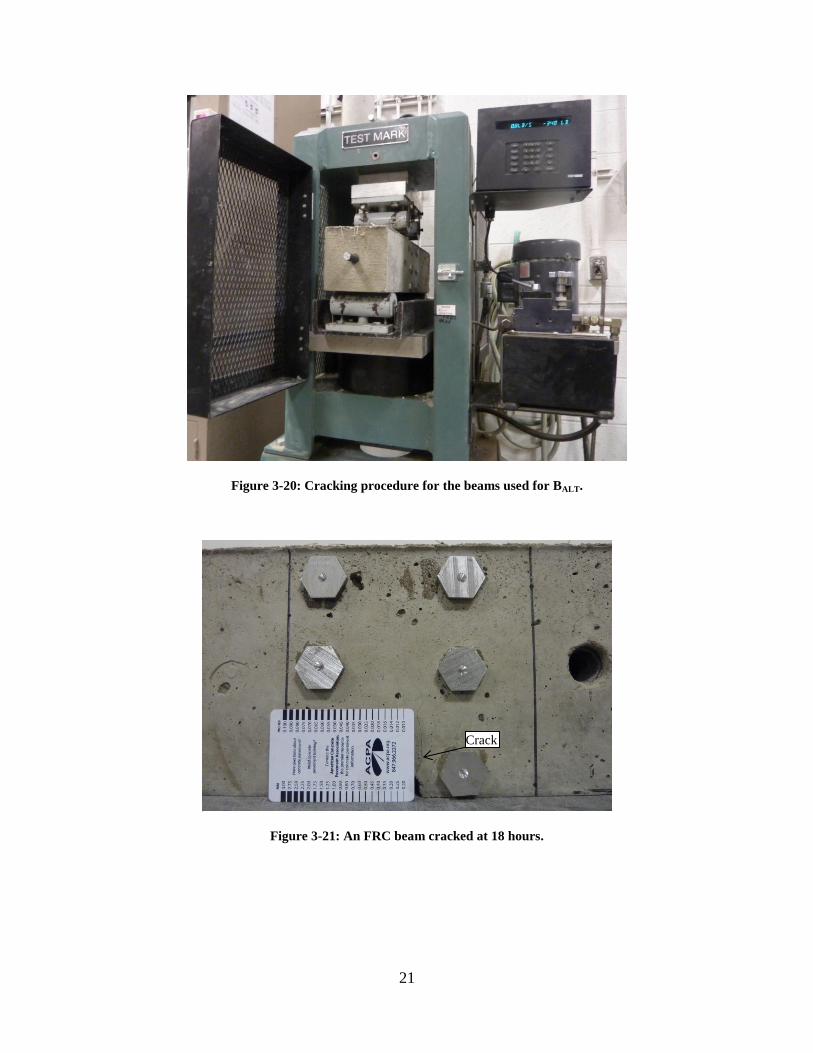
At 18 hours, the specimen was cracked at mid-span by applying a flexural load in the same
manner used for a MOR test. Figure 3-20 shows cracking of an FRC beam. The loading rate, 15
to 45 lb/sec, was kept constant during the cracking process in accordance with ASTM-
C78/C78M, 2010. During the cracking procedure, extra attention is required to ensure the beam
is unloaded immediately after crack development. Initiation of the crack or just development of
a very tight crack should be considered sufficient. Therefore, loading was stopped just after the
appearance of a crack on the concrete surface. This is difficult to achieve for beams without
fibers. Putting the two separated halves of the beam back exactly in the same position, matching
the crack surface textures, is really a challenging task. In the FRC beams, fibers bridge the

20
crack, so the beam halves do not generally fall apart. See in Figure 3-21. One notable point in
this procedure of cracking is that the crack width at the bottom becomes wider than the top. This
also simulates the non-uniform crack width pattern of an in-service pavement condition. In the
present work, the cracked beams were transferred on a wooden plank right after the cracking
procedure. Further handling of specimens were performed on the plank so that the crack faces
remain undisturbed until they were placed in the test setup. The cracked beams were cured for
28 days in a moist curing room at a relative humidity greater than 100 percent.
Figure 3-19: Aluminum gage studs for measuring crack width.
Aluminum gage studs
21
Figure 3-20: Cracking procedure for the beams used for BALT.
Figure 3-21: An FRC beam cracked at 18 hours.
Crack

22
3.2.5 Test Procedure
Now that a description of how the BALT specimen is prepared has been provided, a description of
the BALT test will be provided. Before testing begins, the top surface of it must be inspected to
verify the surface is smooth. If considerable undulation or irregularity is present on the beam
surface, the surface is ground to obtain a smoother level surface. After the surface is checked,
the beam is carefully placed on the lower layer of Fabcel. The top Fabcel layers and the top I-
beam are then placed on top of the beam. Care must be taken when handling the beam so the
crack width is maintained. The restraining rods, bracing plates and the crack width control
assembly are then set in place. The beam on the frame was positioned with care so that that the
axis of the vertically aligned actuator is directly above the loading location. Then, the loading
components such as loading rod, vertical load plates assembled with bearing and collars, and the
calibrated spring are put in their respective place, as discussed in the Subsection 3.2.2. After
that, the nuts on the restraint rods are tightened. The nuts on the bracing plates are tightened
with a 40- in-lb torque. Then, while holding the vertical load plates aligned, the actuator in
which the horizontal load plate is already attached is brought down in contact with the vertical
load plates. A very minimal load, such as 5 to 10 lbs, is applied during this process so that the
vertical plates come in contact with the horizontal load plate attached to the actuator. The
horizontal force is then applied. The magnitude of the horizontal force is estimated based on the
load on each vertical load plate, area of the surface of each inner collar that remains in contact
with the concrete and coefficient of friction between the concrete and steel surfaces. The
estimated horizontal force, which was 1500 lbs, was ensured by attaining a half in reduction in
the length of the calibrated spring. The spring constant of the calibrated spring was 3000 lbs/ in.
The vertical load plates were tightly fastened with the horizontal load plate by bolts.
Once the beam was successfully placed in the loading assembly, two LVDT holders were glued
with epoxy to the vertical walls of the beam at front side. These holders were placed such that
the deflections could be measured 1 in distance from crack on both sides of the crack. LVDTs
were then mounted in the holders. Next, depending on the existing crack condition, the desired
initial crack width was obtained using the cw control assembly. In the case of the plain concrete
beams, obtaining the desired uniform initial crack width on all four sides of the beam was
relatively easy as compared to FRC beams. Force and moment were applied through the tension

23
rods to stabilize a uniform crack width, as previously discussed in Subsection 3.2.2. Also, a low
magnitude, dynamic, vertical load (300 to 500 lb) with a low frequency (2 to 4 Hz) was
sometimes applied in addition to the horizontal force through the tension rod, especially in the
case of FRC beams. An average of the crack widths measured at the 3 locations (top, middle and
bottom) on each side of the beam was used to establish considered as the crack width of the joint.
Finally, when the setup was completely ready, a sinusoidal load cycle was applied through the
actuator to obtain the load and deflection profiles. The magnitude of the peak load was 1050 lbs
in both upward and downward directions. The loading frequency was 10 Hz. The typical load
and deflection profiles are discussed in Section 3.4.1. The joint performance in the present study
was evaluated at different crack widths and at different load cycles. The joint performance
estimation procedures will be discussed in Section 3.4.
3.3 Slab Accelerated Load Testing, SALT
The large-scale test setup was developed to perform the joint performance test on real size slabs.
The developed setup simulates the impact of a passing wheel on the transverse joints between
two adjacent slabs. This setup is capable of testing slabs with millions of load cycles in a
relatively short period of time. The main purpose of the SALT was to investigate the validity of
the joint performance results obtain with the BALT procedure. The following subsections briefly
describe the details of the SALT setup.
3.3.1 Setup design principle
The SALT setup in the present study was developed in a similar manner to the setup developed in
Raja & Snyder, 1995 study. The vehicle load was simulated using two actuators. These
actuators provide sinusoidal loads on both sides of the joint. The peak loads on the approach and
leave slabs were applied with a phase difference. The phase angle is established based on the
desired vehicle speed.

24
3.3.2 Components
Foundation: A concrete foundation, 12-ft long, 6-ft width and 2.75-ft deep, was used as the test
platform. This was cast on a concrete reaction floor. Figure 3-22 shows a picture of the form
work built to cast the foundation. Concrete was poured in three separate and equal layers. To
strengthen the foundation at the mid-span, where the actuators would apply load during the joint
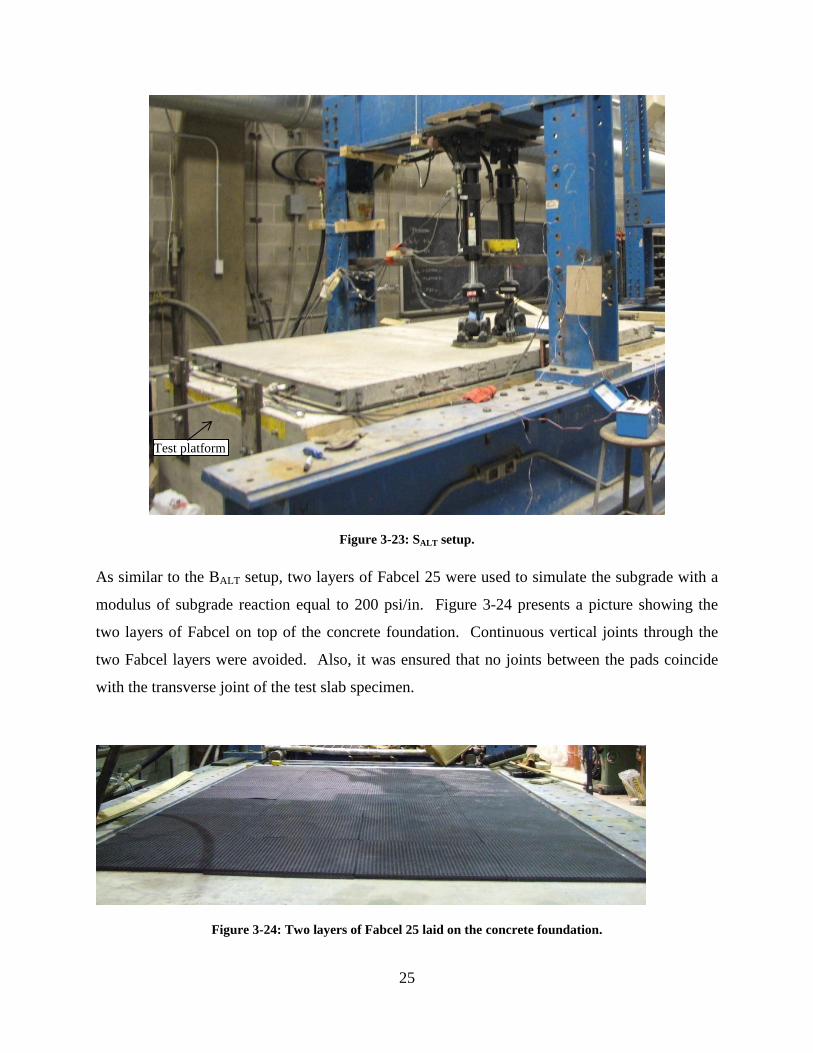
performance test, a steel I-beam was embedded, as shown in Figure 3-22. Figure 3-23 presents a
picture of the test setup showing platform for the SALT.
Figure 3-22: The form work used to cast the foundation.
Form work
I-beam
25
Figure 3-23: SALT setup.
As similar to the BALT setup, two layers of Fabcel 25 were used to simulate the subgrade with a
modulus of subgrade reaction equal to 200 psi/in. Figure 3-24 presents a picture showing the
two layers of Fabcel on top of the concrete foundation. Continuous vertical joints through the
two Fabcel layers were avoided. Also, it was ensured that no joints between the pads coincide
with the transverse joint of the test slab specimen.
Figure 3-24: Two layers of Fabcel 25 laid on the concrete foundation.
Test platform

26
Test specimen
Different slabs sizes can be accommodated with this loading frame. In this study, 10-ft x 6-ft
slabs, 4-in thick, were cast with a transverse crack initiated at the mid span (5-ft)
Casting frame
An example of the frames used to cast the slab is shown in Figure 3-25. Four inch deep steel
channel sections were utilized for building the casting frame. The transverse sides were made
with a single channel section whereas, the longitudinal sides are comprised of two separate
channel sections, held together by a splice. See Figure 3-26. The longitudinal sides were tied by
four equally spaced pencil rods which helped to attain a good rigidity in the transverse direction.
Four I-bolts are placed on the two longitudinal sides of the frame so the crane can be used for
lifting the specimen. See Figure 3-26. The other important components of the frame are the 26
shear keys. These are 2-in long steel rods welded on the inner side of the frame at an
approximately equal spacing. These shear keys hold the slab from dropping out when it is lifted.
Figure 3-25: Test specimen frames for SALT.
Pencil rod Shear key
Cracking bar
Tension rod
27
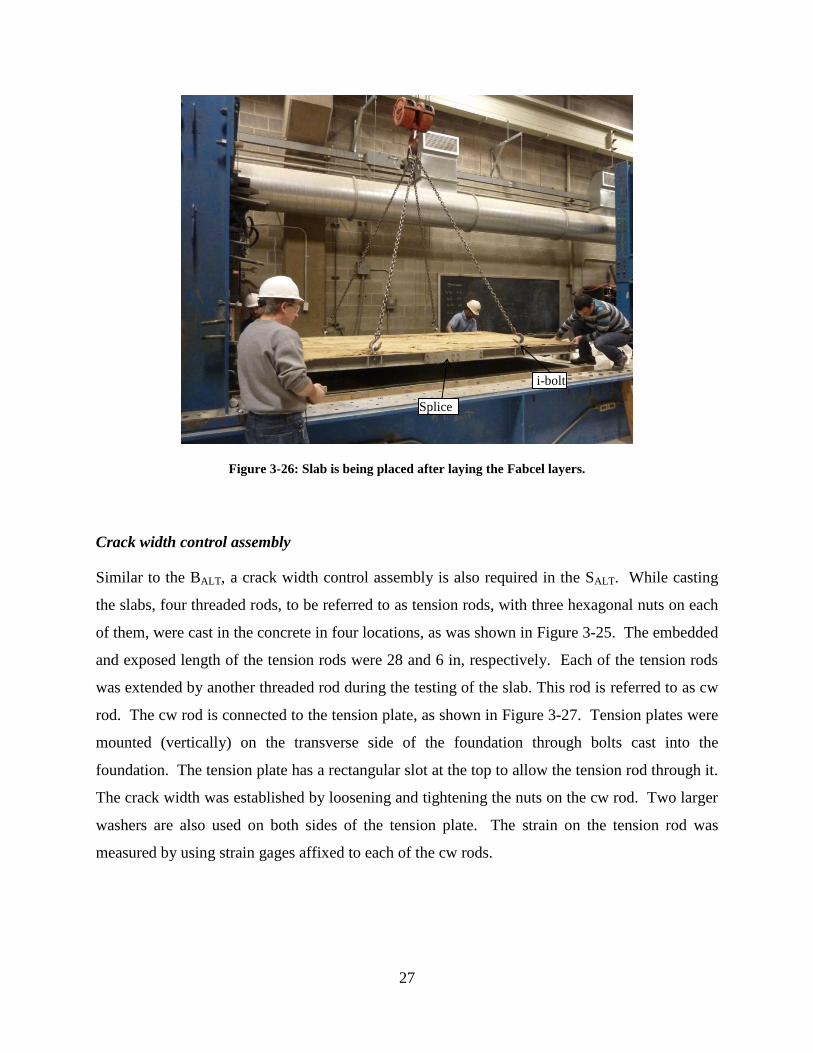
Figure 3-26: Slab is being placed after laying the Fabcel layers.
Crack width control assembly
Similar to the BALT, a crack width control assembly is also required in the SALT. While casting
the slabs, four threaded rods, to be referred to as tension rods, with three hexagonal nuts on each
of them, were cast in the concrete in four locations, as was shown in Figure 3-25. The embedded
and exposed length of the tension rods were 28 and 6 in, respectively. Each of the tension rods
was extended by another threaded rod during the testing of the slab. This rod is referred to as cw
rod. The cw rod is connected to the tension plate, as shown in Figure 3-27. Tension plates were
mounted (vertically) on the transverse side of the foundation through bolts cast into the
foundation. The tension plate has a rectangular slot at the top to allow the tension rod through it.
The crack width was established by loosening and tightening the nuts on the cw rod. Two larger
washers are also used on both sides of the tension plate. The strain on the tension rod was
measured by using strain gages affixed to each of the cw rods.
Splice
i-bolt

28
Figure 3-27: Crack width control assembly.
3.3.3 Specimen preparation
The slabs were cast on the foundation itself so that the bottom surface of the test specimen
mimics the shape of the top surface of the foundation. This proved to be immensely helpful to
avoid any gaps between the artificial foundation and test slab. It may be mentioned here that a
couple of shakedown slabs were initially cast on the laboratory floor but when they were
transferred to the foundation for testing, gaps were noticed in many locations. Therefore, all test
slabs were cast on a plastic sheet on the foundation. A properly oiled ½- in x ¼-in x 6- ft steel
bar, known as crack initiation bar was cast into the slab at mid span (Figure 3-25). This crack
initiation bar created a weak zone, which helped in initiating the crack at the desired location at
the bottom mid-span.
Casting of the slab generally started at mid-span (Figure 3-28). Shaft vibrators were used to
consolidate the concrete. Figure 3-29 shows a photograph taken right after finishing the surface.
Gage studs for crack width measurement were inserted into the concrete right after finishing the
surface. A pair of gage studes are installed 3 in off the longitudinal edge on each side of the slab.
The gage studs consisted of small bolts with a conical slot drilled into the head, as shown in
Figure 3-30.
Tension plate
Washers
Tension rod cw rod

29
Figure 3-28: Casting of the slab.
Figure 3-29: Example of a finished slab.

30
Figure 3-30: Photograph of a pair gage studs inserted into the concrete.
The mid-slab transverse crack was initiated 18 hours after casting. A flexural load was applied
to initiate the crack at the bottom of the slab and mid-span. One end of the 10-ft x 6-ft slab was
jacked upward while restraining any upward movement on the other half of the slab. Figure 3-31
shows the slab cracking procedure. It can be seen that a 4-in x 4-in yellow steel angle was place
at the middle of the slab. The angle was placed such that it rests on the restrained half of the 10-
ft long slab, while the upward force was applied at the corners at the other end. The upward
force was applied by using a pair of 10-ton hydraulic jacks through the two steel plates
connected to the frame at the corners along the end. The slab was cured with plastic covered wet
burlap for at least 28 days before testing.

31
Figure 3-31: Slab cracking procedure.
3.3.4 Test Procedure
Before loading of the slab can begin, the slab must be lifted off the foundation so that the Fabcel
layers can be placed. The slab is then placed on top of the two layers of Fabcel. Proper
referencing work was performed before moving the slab so that it could be replaced back in
exactly on the same location from where it was lifted. After laying the Fabcel layers and setting
the slab in place, the crack width control assembly was installed along with the deflection
measuring assembly. The deflection measuring assembly consists of a 6-in wide steel plate
attached to the concrete foundation, an arm connected to the steel plate, two aluminum LVDTs
holder and two LVDTs. Figure 3-32 shows the two LVDTs mounted in the LVDT holders.
Both of the LVDTs are placed 1in from the crack, one on the approach slab and the other one on
the leave slab. Both are approximately 12 in from the longitudinal edge. The load was applied
by two actuators through two 12-in diameter and 1-in thick circular load plates. A circular
rubber pad was attached to each load plate to avoid any localized stress concentration on the

32
slab. The location of the load plates and the LVDTs can be seen in the schematic presented in
Figure 3-33.
Figure 3-32: LVDTs and the LVDT holder for the SALT.
Figure 3-33: Location of load plates and LVDTs in SALT procedure.
10 ft
6 ft
18 inch 12 inch
2 inch
Load plates
Approach side
Leave side
LVDT holder
Not to scale
Leave slab Approach slab
LVDTs
LVDTs
33
The joint performance test was conducted by applying a composite sinusoidal load profile
through each actuator. The load profile was designed in such a way that each slab was loaded
for a period of 0.035 seconds with a 0.165 seconds rest period providing a time of 0.20 seconds
to complete each cycle. Thus, the overall load cycle frequency is 5 Hz. During the actual
loading period, the load rises from 500 to 9000 lbs in each actuator. In the rest period, a 500-lb
load was maintained so that the actuator and slab remain in contact. The two actuators were
operated with a 90-degree phase difference. The time difference between the two peaks was
0.032 seconds, which was equivalent to a vehicle speed 30 to 35 mph. It was also ensured that
when one actuator reaches its peak load, the other is applying the minimum 500-lb load. It may
be noted that the magnitudes of the loading periods, rest periods, peak loads, loads at rest period
and the phase difference between the peak loads of the two actuators may slightly vary with the
joint condition. Similar to the BALT, the joint performance was evaluated at different crack
widths and load applications. The joint performance evaluation concept followed in the SALT
procedure is discussed in the next section.
3.4 Joint Performance Evaluation Procedure
The joint performance can be characterized in many ways, such as in terms of load transfer
efficiency (LTE), differential deflection (DD), differential deflection ratio (DDR), differential
energy dissipation (DED) and dissipated energy ratio (DER). In the present study, both the BALT
and SALT procedures are able to produce any of the above mentioned joint performance
characterization parameters. These parameters are derived either from the load and/or deflection
profiles.
The following subsections describe the concepts of evaluating the joint performance through
LTE and DER in both the BALT and SALT procedures.
34
3.4.1 Joint performance through LTE
BALT
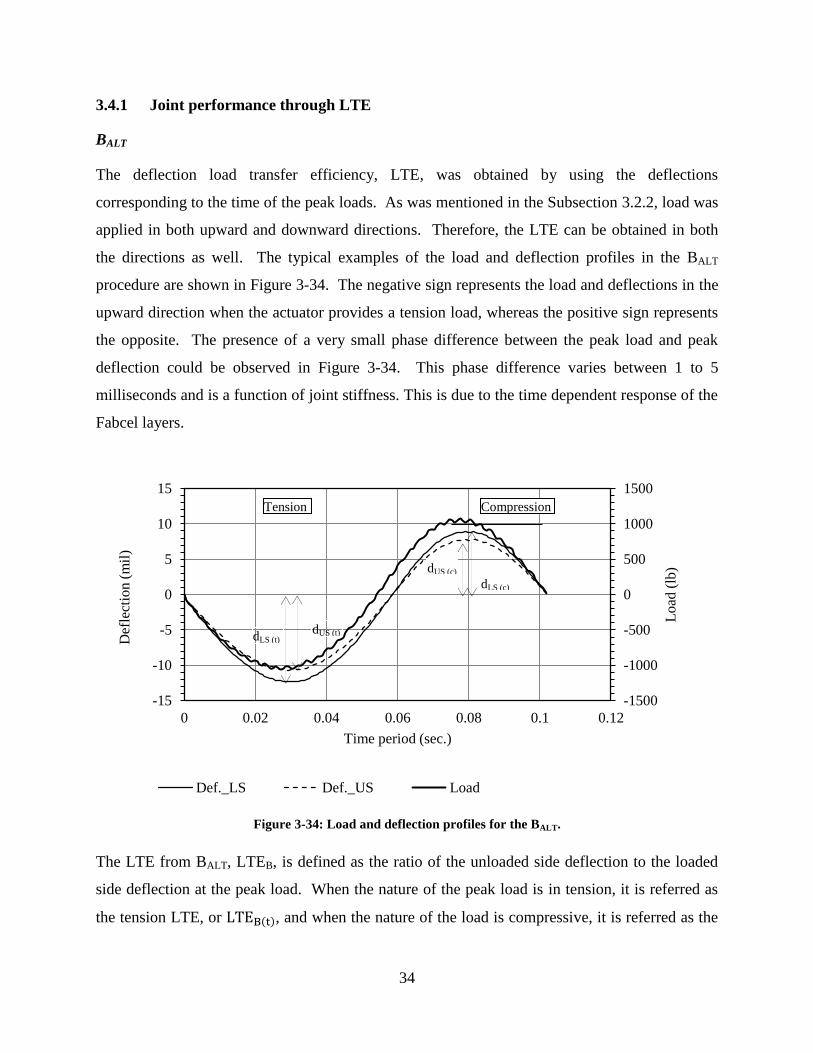
The deflection load transfer efficiency, LTE, was obtained by using the deflections
corresponding to the time of the peak loads. As was mentioned in the Subsection 3.2.2, load was
applied in both upward and downward directions. Therefore, the LTE can be obtained in both
the directions as well. The typical examples of the load and deflection profiles in the BALT
procedure are shown in Figure 3-34. The negative sign represents the load and deflections in the
upward direction when the actuator provides a tension load, whereas the positive sign represents
the opposite. The presence of a very small phase difference between the peak load and peak
deflection could be observed in Figure 3-34. This phase difference varies between 1 to 5
milliseconds and is a function of joint stiffness. This is due to the time dependent response of the
Fabcel layers.
Figure 3-34: Load and deflection profiles for the BALT.
The LTE from BALT, LTEB, is defined as the ratio of the unloaded side deflection to the loaded
side deflection at the peak load. When the nature of the peak load is in tension, it is referred as
the tension LTE, or ( ), and when the nature of the load is compressive, it is referred as the
-1500
-1000
-500
0
500
1000
1500
-15
-10
-5
0
5
10
15
0 0.02 0.04 0.06 0.08 0.1 0.12
Lo
ad (
lb)
Def
lect
ion (
mil
)
Time period (sec.)
Def._LS Def._US Load
Tension Compression
dLS (t) dUS (t)
dUS (c)
dLS (c)

35
compression LTE, or ( ). The LTE under both the tension and compression loads can be
estimated by using the following equations.
( ) ( )
( )
(3-4)
( ) ( )
( )
(3-5)
where ( ) and ( ) are the unloaded side deflections under the tension and compression
load, respectively; ( ) and ( ) are the loaded side deflections under the tension and
compression load, respectively.
Ideally, the difference between ( ) and ( ) shall be zero when the surface areas of the
aggregates engaged in load transfer in both the directions are equal. But in reality, the developed
crack is not perfectly vertical, which results in a different quantity of aggregate engagement in
one direction than the other. Since the area of the crack face in a beam specimen is far lower
than that of a slab specimen, a small difference in the area of the aggregate engaged in load
transfer significantly influences the magnitude of the load transfer. Therefore, the average of
( ) and ( ) provides a more meaningful characterization. This average neutralizes the
effect of macro texture to a certain extent.
SALT
The typical load and deflection profiles obtained in the SALT procedure are shown in Figure 3-35.
It can be seen that when the approach slab load reaches the peak load, the leave slab load goes
down to the minimum, and vice versa. It can be assumed that at the time when the load on a
particular slab reaches the peak, the deflections on both the approach and leave slabs are due
only to the load applied on that slab. It can be seen in Figure 3-35, that the time when the peak
load is applied to the approach slab, peak deflection also occurs at about the same time the load
peak is observed. The same occurs for the leave slab. In this procedure, a phase difference
between the peak load and peak deflection can be observed, as was seen in the BALT due to the
time-dependent response of the Fabcel.

36
Figure 3-35: Typical load and deflection profiles for SALT.
In this case, LTE can be separately calculated for the approach and leave sides. These are
calculated using the following equations.
( ) ( )
( )
(3-6)
( ) ( )
( )
(3-7)
where ( ) and ( ) are the approach and leave side LTEs; ( ) and ( ) are the
deflections at the leave and approach sides, respectively, with the peak load on the approach
slab; ( ) and ( ) are the deflections at the approach and leave sides, respectively, with the
peak load on the leave slab.
0
2000
4000
6000
8000
10000
0
10
20
30
40
50
60
70
194.56 194.61 194.66 194.71 194.76
Lo
ad (
lb)
Def
lect
ion
(m
il)
Time (secs.)
Def._approach side Def._leave side
Load_approach side Load_leave side
dAS (AS)
Load on leave
slab
Load on approach
slab
dLS (AS)
dLS (LS)
dAS (LS)

37
3.4.2 Joint performance through DER
The concrete pavement system dissipates energy when it deflects under the wheel load. The
magnitude of the dissipated energy (DE) is proportional to the magnitude of the pavement
deflection. Conceptually, the DE is the area under the load vs deflection curve. The difference
in magnitude of the DEs between the approach and leave sides is known as differential energy
dissipation (DED), and the ratio between the leave side DE to the approach side DE is known as
dissipated energy ratio (DER). For good joint performance, the magnitude of the DE on both
sides is low with lower values of DDE and DER.
BALT
In the BALT, as was shown in Figure 3-34, the total load cycle comprises of four individual
loading segments, in order, (i) 0 to -1050 lbs, (ii) -1050 to 0 lb, (iii) 0 to +1050 lbs and (iv)
+1050 to 0 lb. In that figure, it is seen that at the time when the load drops from -1050 to 0 lb (at
the end of the second segment), the Fabcel layers still exhibit some amount of deflection. This
results in a hysteresis in the load vs deflection curve. This means the areas of the load vs
deflection curves for the 0 to maximum and maximum to 0 loads are not similar; the later one
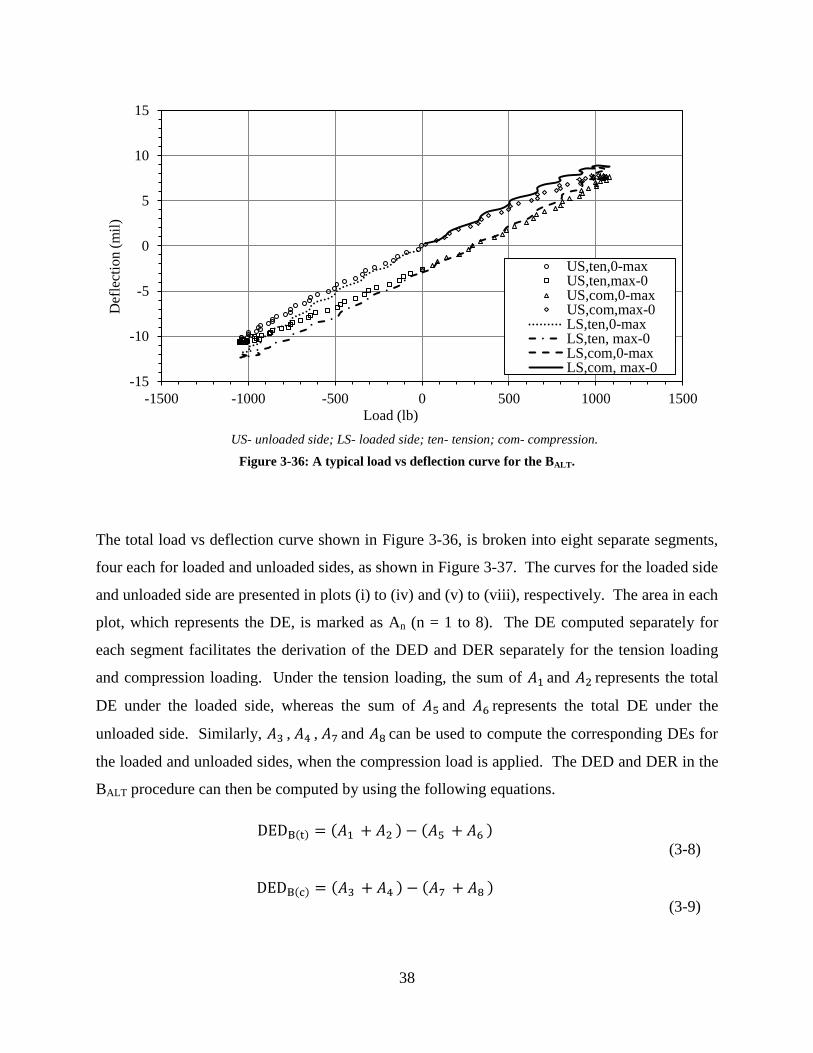
has higher value. This can be seen in Figure 3-36. This figure includes load vs deflection
profiles for all four segments, for deflections on both the loaded and unloaded sides. Because of
the presence of the hysteresis, the areas under the load vs deflection curve for each segment are
different and therefore computed separately.
38
Figure 3-36: A typical load vs deflection curve for the BALT.
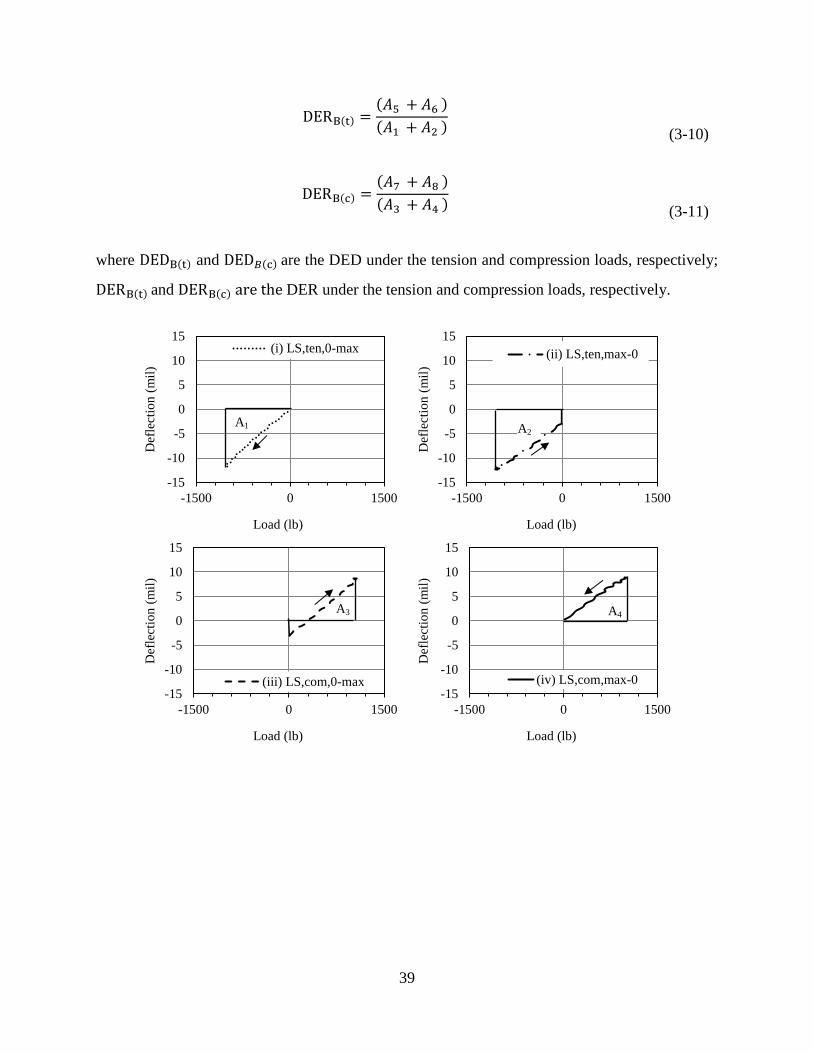
The total load vs deflection curve shown in Figure 3-36, is broken into eight separate segments,
four each for loaded and unloaded sides, as shown in Figure 3-37. The curves for the loaded side
and unloaded side are presented in plots (i) to (iv) and (v) to (viii), respectively. The area in each
plot, which represents the DE, is marked as An (n = 1 to 8). The DE computed separately for
each segment facilitates the derivation of the DED and DER separately for the tension loading
and compression loading. Under the tension loading, the sum of and represents the total
DE under the loaded side, whereas the sum of and represents the total DE under the
unloaded side. Similarly, , , and can be used to compute the corresponding DEs for
the loaded and unloaded sides, when the compression load is applied. The DED and DER in the
BALT procedure can then be computed by using the following equations.
( ) ( ) ( )
(3-8)
( ) ( ) ( )
(3-9)
-15
-10
-5
0
5
10
15
-1500 -1000 -500 0 500 1000 1500
Def
lect
ion
(m
il)
Load (lb)
US,ten,0-maxUS,ten,max-0US,com,0-maxUS,com,max-0LS,ten,0-maxLS,ten, max-0LS,com,0-maxLS,com, max-0
US- unloaded side; LS- loaded side; ten- tension; com- compression.
39
( ) ( )
( )
(3-10)
( ) ( )
( )
(3-11)
where ( ) and ( ) are the DED under the tension and compression loads, respectively;
( ) and ( ) DER under the tension and compression loads, respectively.
-15
-10
-5
0
5
10
15
-1500 0 1500
Def
lect
ion (
mil
)
Load (lb)
(i) LS,ten,0-max
-15
-10
-5
0
5
10
15
-1500 0 1500
Def
lect
ion (
mil
)
Load (lb)
(ii) LS,ten,max-0
-15
-10
-5
0
5
10
15
-1500 0 1500
Def
lect
ion (
mil
)
Load (lb)
(iii) LS,com,0-max-15
-10
-5
0
5
10
15
-1500 0 1500
Def
lect
ion (
mil
)
Load (lb)
(iv) LS,com,max-0
A1 A2
A3 A4

40
Figure 3-37: Individual segments in the load vs deflection curve: (i) to (iv) - loaded side and
(v) to (viii) -unloaded side.
SALT
The load in the SALT is applied using two actuators so the derivation of DED and DER is
different. In the load and deflection profiles shown in Figure 3-35, it can be seen that there is an
overlap of approach and leave side loads. This occurs in the middle of the loading cycle when
the load applied on the approach slab is transferred to the leave slab. In this particular case
(Figure 3-35), the load on both of the actuators remains below 2000 lbs in the overlapping zone.
To avoid this overlapping, deflection due to any load below 2000 lbs for either of the actuators is
discarded from the analysis.
Figure 3-38 shows a deflection trace for the approach side. The deflections generated by the
loads below 2000 lbs are discarded. The solid line in the graph represents the deflection when
the load is applied to the approach slab, whereas the dash line shows the deflection when load is
applied on the leave slab. In this graph, the deflection increases from 27 to 57 mils when the
-15
-10
-5
0
5
10
15
-1500 0 1500
Def
lect
ion (
mil
)
Load (lb)
(v) US,ten.,0-max.
-15
-10
-5
0
5
10
15
-1500 0 1500
Def
lect
ion (
mil
)
Load (lb)
(vi) US,ten,max-0
-15
-10
-5
0
5
10
15
-1500 0 1500
Def
lect
ion (
mil
)
Load (lb)
(vii) US,com,0-max
-15
-10
-5
0
5
10
15
-1500 0 1500
Def
lect
ion (
mil
)
Load (lb)
(viii) US,com,max-0
A7
A6
A8
A5

41
load on the approach side increases from 2000 to 9000 lbs and then drops to 44 mils when the
load drops back to 2000 lbs. The difference between the deflections, at the 2000-lbs load is 17
mils. This hysteresis is due to the delay response of the Fabcel. Immediately following the
deflection increases again to 54 mils as a result of the load increase on the leave slab. Figure
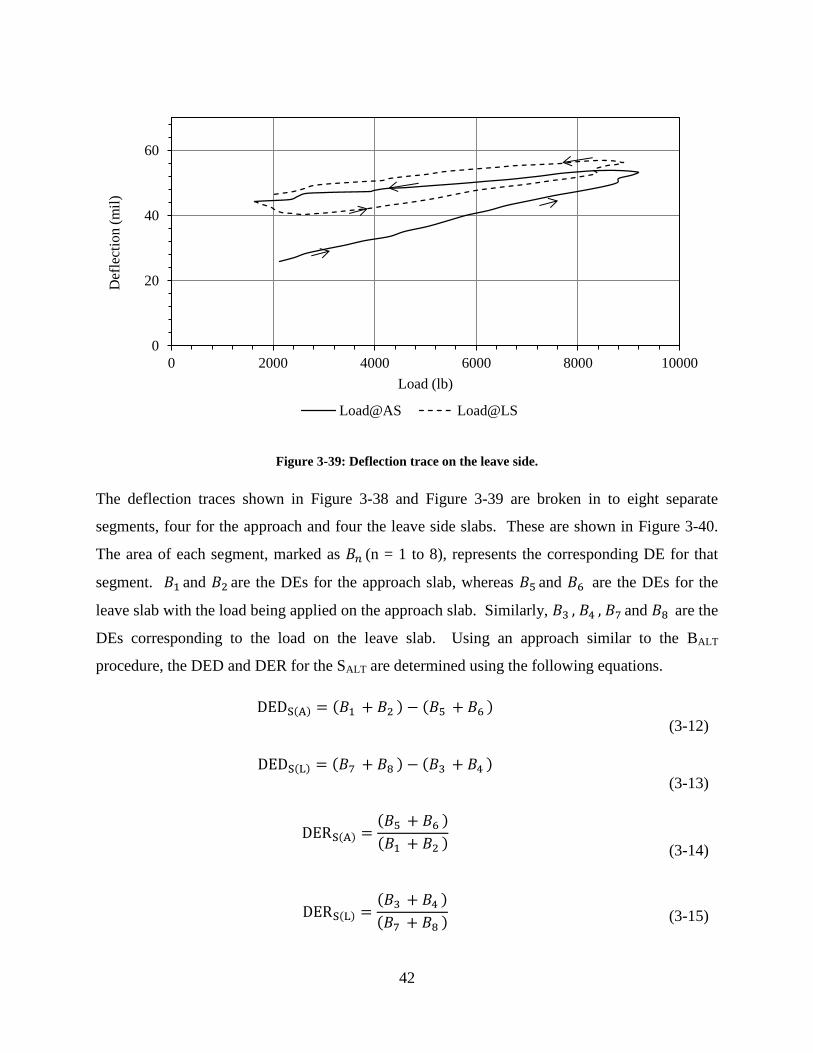
3-39 shows the deflection trace measured for the leave slab. Similar to the earlier graph, the
solid and dash lines represent the deflection generated by the loads applied on the approach and
leave slabs, respectively. As expected, the deflection on the leave side also exhibited a
hysteresis. Therefore, in the SALT, DEs are also calculated separately for each different segment
in the total loading cycle.
Figure 3-38: Deflection measured on the approach side.
0
10
20
30
40
50
60
70
80
0 2000 4000 6000 8000 10000
Def
lect
ion (
mil
)
Load (lb)
Load@AS Load@LS
42
Figure 3-39: Deflection trace on the leave side.
The deflection traces shown in Figure 3-38 and Figure 3-39 are broken in to eight separate
segments, four for the approach and four the leave side slabs. These are shown in Figure 3-40.
The area of each segment, marked as (n = 1 to 8), represents the corresponding DE for that
segment. and are the DEs for the approach slab, whereas and are the DEs for the
leave slab with the load being applied on the approach slab. Similarly, and are the
DEs corresponding to the load on the leave slab. Using an approach similar to the BALT
procedure, the DED and DER for the SALT are determined using the following equations.
( ) ( ) ( )
(3-12)
( ) ( ) ( )
(3-13)
( ) ( )
( )
(3-14)
( ) ( )
( ) (3-15)
0
20
40
60
0 2000 4000 6000 8000 10000
Def
lect
ion (
mil
)
Load (lb)
Load@AS Load@LS

43
where ( ) and ( ) are the DED for the approach and leave slabs, respectively; ( )
and ( ) DER for the approach and leave slabs, respectively.
0
20
40
60
80
0 5000 10000
Def
lect
ion (
mil
)
Load (lb)
(i) A, min to max
0
20
40
60
80
0500010000
Def
lect
ion (
mil
)
Load (lb)
(ii) A, max to min
0
20
40
60
80
0 5000 10000
Def
lect
ion (
mil
)
Load (lb)
(iii) L, min to max
0
20
40
60
80
0500010000
Def
lect
ion (
mil
)
Load (lb)
(iv) L, max to min
B1 B2
B3 B4

44
Figure 3-40: Individual segments in the SALT load vs deflection curve: (i) to (iv) - load on the approach side
and (v) to (viii) - load on the leave side.
3.5 Conclusions
This chapter presented a comprehensive detail of the two joint performance test setups built
under the scope of the present study. Although both the methods were developed to evaluate the
joint performance for a whitetopping overlay, the joint performance for any concrete pavement is
also possible using either method. Evaluation of the joint performance with the BALT procedure
is very economic and faster. This setup can be very helpful to characterize joint performance
when a large numbers of variables are to be considered. The SALT is more expensive but
simulates the pavement joint condition in a more realistic manner.
0
20
40
60
80
0 5000 10000
Def
lect
ion (
mil
)
Load (lb)
(v) A, min to max
0
20
40
60
80
0500010000
Def
lect
ion (
mil
)
Load (lb)
(vi) A, max to min
0
20
40
60
80
0 5000 10000
Def
lect
ion (
mil
)
Load (lb)
(vii) L, min to max
0
20
40
60
80
0500010000
Def
lect
ion (
mil
)
Load (lb)
(viii) L, max to min
B6
B7 B8
B5
A- Approach side; L- Leave side
Related Documents


