3 Chapte r Financial Information and Analysis Slides Developed by: Terry Fegarty Seneca College

3 3 Chapter Financial Information and Analysis Slides Developed by: Terry Fegarty Seneca College.
Dec 26, 2015
Welcome message from author
This document is posted to help you gain knowledge. Please leave a comment to let me know what you think about it! Share it to your friends and learn new things together.
Transcript

33Chapt
er
Chapt
er
Financial Information and Analysis
Financial Information and Analysis
Slides Developed by:
Terry FegartySeneca College

© 2006 by Nelson, a division of Thomson Canada Limited 2
Chapter 3 – Outline (1)
• Financial Information Users of Financial Information Sources of Financial Information The Annual Report
• Ratio Analysis Comparisons Common Size Statements Categories of Ratios Liquidity Ratios Asset Management Ratios

© 2006 by Nelson, a division of Thomson Canada Limited 3
Chapter 3 – Outline (2)
Debt Management Ratios Profitability Ratios Market Value Ratios Dupont Equations Sources of Comparative Information Limitations and Weaknesses of Ratio Analysis Words of Caution

© 2006 by Nelson, a division of Thomson Canada Limited 4
Financial Information
• Financial information—results of business operations in monetary terms Responsibility of management Created by company’s accountants Creates a potential conflict of interest
• Management wants to portray firm in positive light
Published to a variety of audiences

© 2006 by Nelson, a division of Thomson Canada Limited 5
Users of Financial Information
• Investors and Financial Analysts Financial analysts interpret information about
companies and make recommendations to investors Major part of analyst’s job is to study recent financial
statements
• Vendors/Creditors Use financial info to determine if firm is expected to
make good on loans
• Management Use financial info to pinpoint strengths and
weaknesses in operations
© 2006 by Nelson, a division of Thomson Canada Limited 6
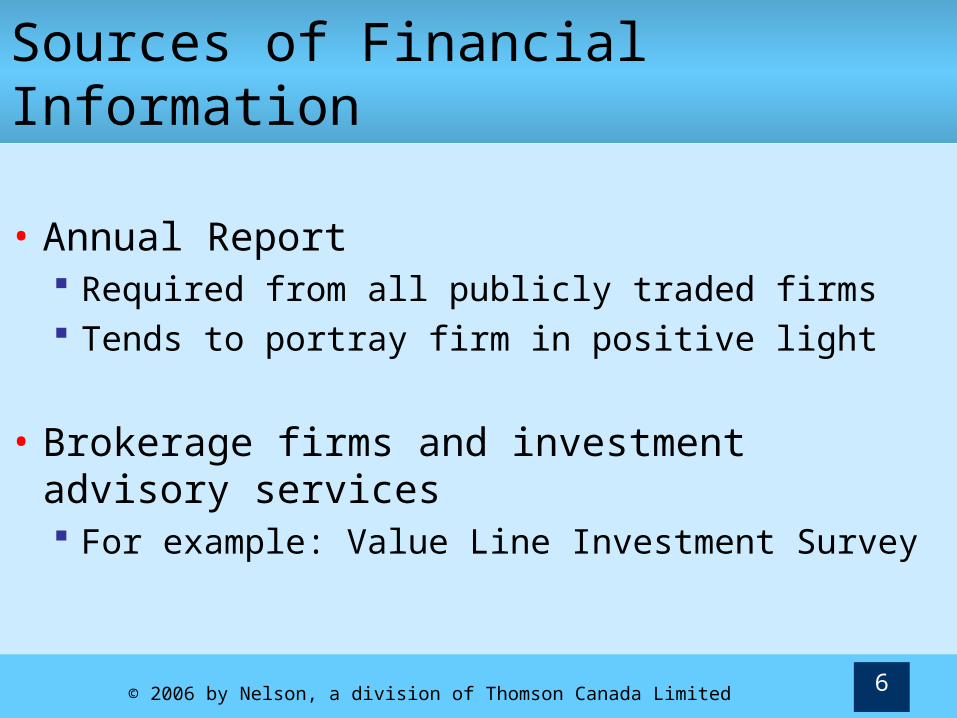
Sources of Financial Information
• Annual Report Required from all publicly traded firms Tends to portray firm in positive light
• Brokerage firms and investment advisory services For example: Value Line Investment Survey

© 2006 by Nelson, a division of Thomson Canada Limited 7
The Annual Report
• Typically includes: Letter to shareholders, reviewing the results and
events of past year, and management’s strategies and plans for future
Management discussion and analysis, analyzing and explaining financial results for the year
Audited financial statements for past year and previous year, including income statement, balance sheet, statement of retained earnings, and statement of cash flows
Notes to the financial statements (audited) Other recent and historic financial information.
© 2006 by Nelson, a division of Thomson Canada Limited 8
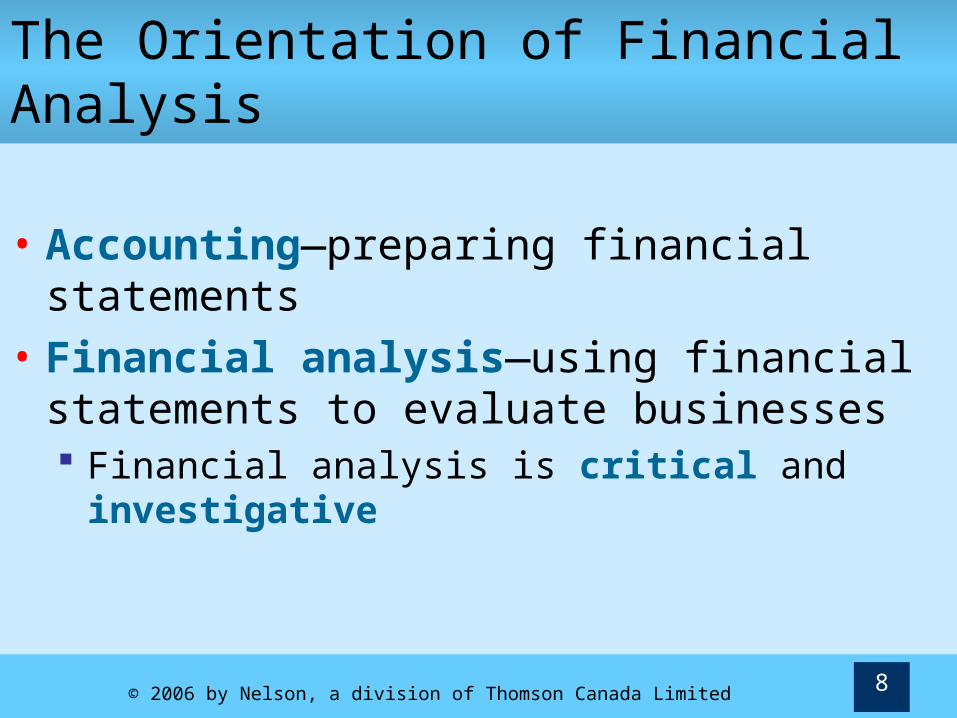
The Orientation of Financial Analysis
• Accounting—preparing financial statements
• Financial analysis—using financial statements to evaluate businesses Financial analysis is critical and
investigative
© 2006 by Nelson, a division of Thomson Canada Limited 9
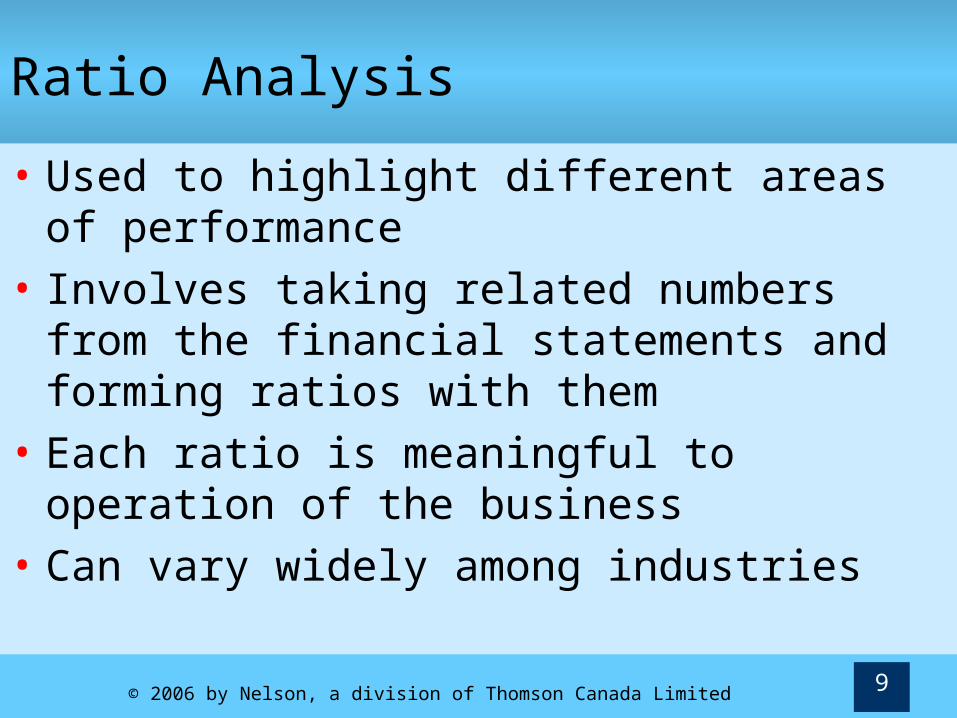
Ratio Analysis
• Used to highlight different areas of performance
• Involves taking related numbers from the financial statements and forming ratios with them
• Each ratio is meaningful to operation of the business
• Can vary widely among industries

© 2006 by Nelson, a division of Thomson Canada Limited 10
Comparisons
• When examined separately, ratios don’t convey much information. Ratios are compared with: History—examine trends (how ratio has changed
over time)
Competition—compare with other firms in same industry
Budget—compare actual ratios with expected or desired ratios
© 2006 by Nelson, a division of Thomson Canada Limited 11
Common Size Statements
• First step in financial analysis is usually common size statement
Common size income statement• Presents each line as percent of revenue
Common size balance sheet• Presents each line as percent of total assets
© 2006 by Nelson, a division of Thomson Canada Limited 12
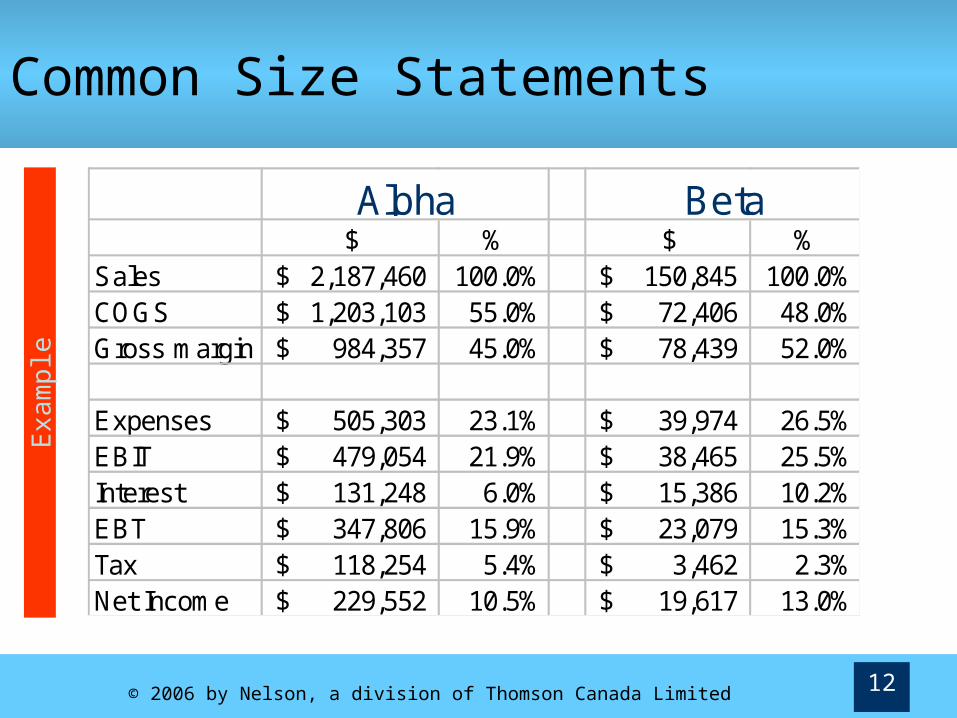
Common Size Statements
$ % $ %Sales 2,187,460$ 100.0% 150,845$ 100.0%COGS 1,203,103$ 55.0% 72,406$ 48.0%Gross margin 984,357$ 45.0% 78,439$ 52.0%
Expenses 505,303$ 23.1% 39,974$ 26.5%EBIT 479,054$ 21.9% 38,465$ 25.5%Interest 131,248$ 6.0% 15,386$ 10.2%EBT 347,806$ 15.9% 23,079$ 15.3%Tax 118,254$ 5.4% 3,462$ 2.3%Net Income 229,552$ 10.5% 19,617$ 13.0%
Alpha Beta
Exa
mpl
e
© 2006 by Nelson, a division of Thomson Canada Limited 13
Categories of Ratios
Liquidity—indicate firm’s ability to pay its bills in short run
Asset Management—show firm’s ability to generate revenue using minimum amount of assets
Debt Management—determine if the firm is using so much debt that it is assuming excessive financial risk
Profitability—allow assessment of the firm’s ability to make money
Market Value—give an indication of how investors feel about firm’s financial future

© 2006 by Nelson, a division of Thomson Canada Limited 14
Liquidity Ratios
• Current Ratio
Current Assets
Current Ratio Current Liabilities
To ensure solvency, current ratio is expected to exceed 1.0
Average is 1.3 for industrial corporations
May be too high if too much money is tied up in receivables and inventory
© 2006 by Nelson, a division of Thomson Canada Limited 15
Liquidity Ratios
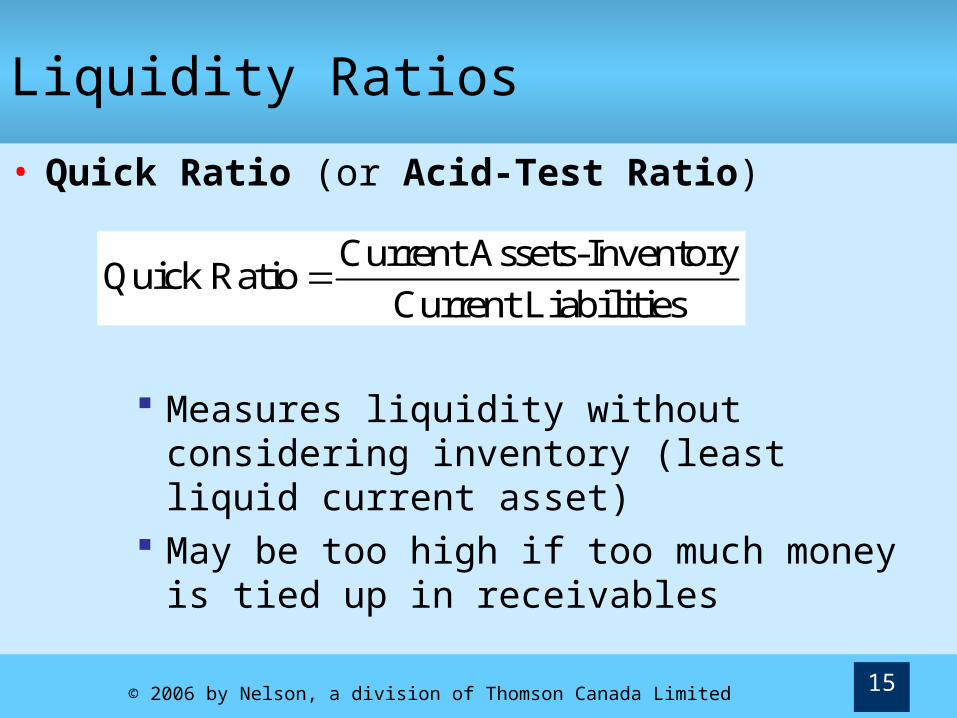
• Quick Ratio (or Acid-Test Ratio)
Measures liquidity without considering inventory (least liquid current asset)
May be too high if too much money is tied up in receivables
Current Assets-InventoryQuick Ratio
Current Liabilities

© 2006 by Nelson, a division of Thomson Canada Limited 16
Asset Management Ratios
• Average Collection Period (ACP)
Accounts ReceivableACP =
Average Daily (Credit) Sales
AKA: days sales outstanding (DSO) Measures time to collect on credit sales.
Compare to business credit terms (ex: 30 days)
Accounts Receivable × 365ACP =
Annual (Credit) Sales
or
© 2006 by Nelson, a division of Thomson Canada Limited 17
Asset Management Ratios
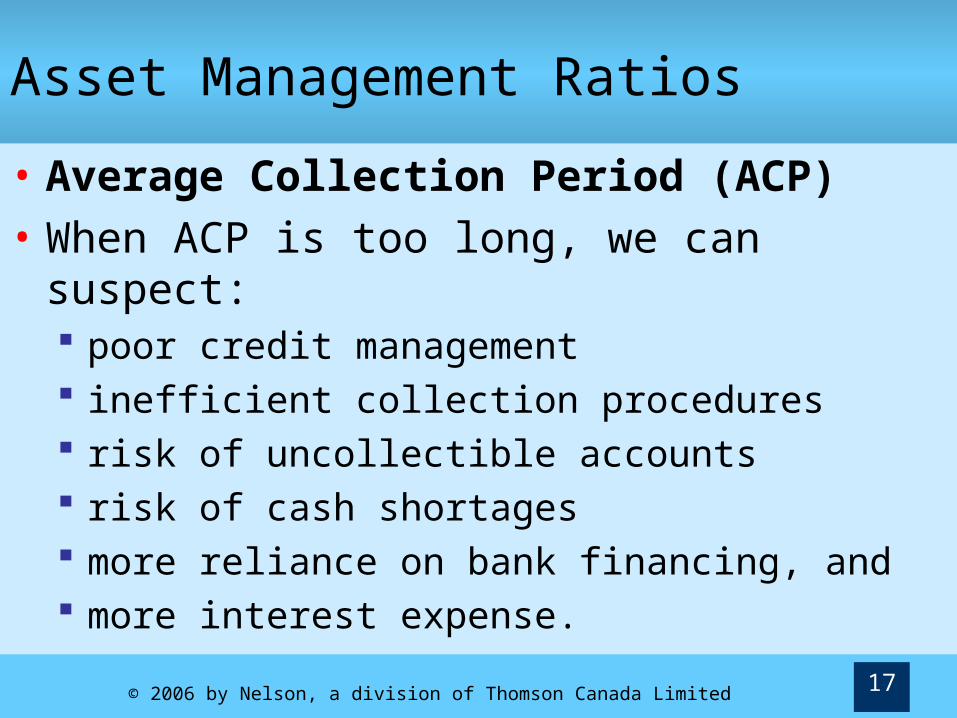
• Average Collection Period (ACP)• When ACP is too long, we can suspect:
poor credit management inefficient collection procedures risk of uncollectible accounts risk of cash shortages more reliance on bank financing, and more interest expense.

© 2006 by Nelson, a division of Thomson Canada Limited 18
Asset Management Ratios
• Inventory Turnover
Measures how many times a year firm uses up an average stock of goods
Higher turnover implies doing business with less tied up in inventory
Indicates quality of inventory as well as how it is managed
Cost of Goods SoldInventory Turnover =
Inventory
© 2006 by Nelson, a division of Thomson Canada Limited 19
Asset Management Ratios
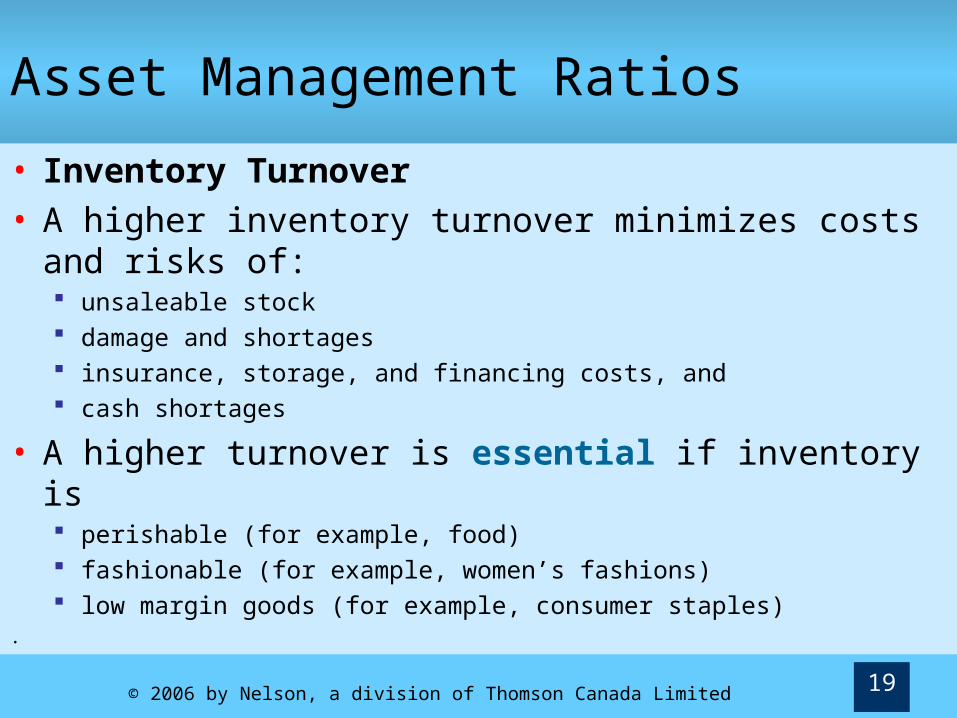
• Inventory Turnover• A higher inventory turnover minimizes costs
and risks of: unsaleable stock damage and shortages insurance, storage, and financing costs, and cash shortages
• A higher turnover is essential if inventory is perishable (for example, food) fashionable (for example, women’s fashions) low margin goods (for example, consumer staples)
.
© 2006 by Nelson, a division of Thomson Canada Limited 20
Asset Management Ratios
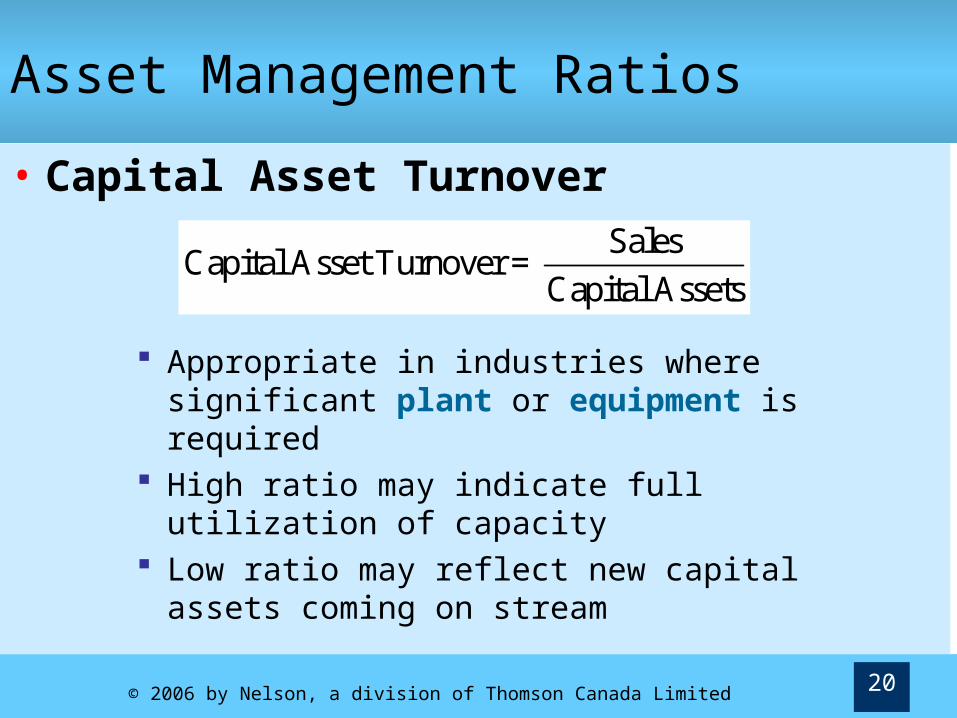
• Capital Asset Turnover
Appropriate in industries where significant plant or equipment is required
High ratio may indicate full utilization of capacity
Low ratio may reflect new capital assets coming on stream
SalesCapital Asset Turnover =
Capital Assets
© 2006 by Nelson, a division of Thomson Canada Limited 21
Asset Management Ratios
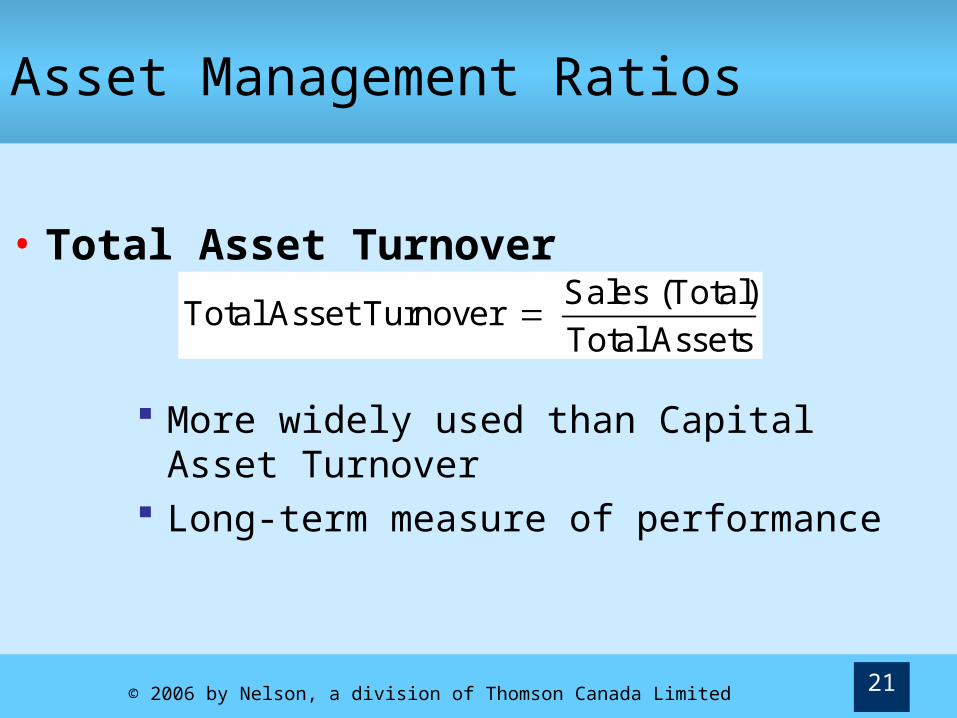
• Total Asset TurnoverSales (Total)
Total Asset Turnover Total Assets
More widely used than Capital Asset Turnover
Long-term measure of performance
© 2006 by Nelson, a division of Thomson Canada Limited 22
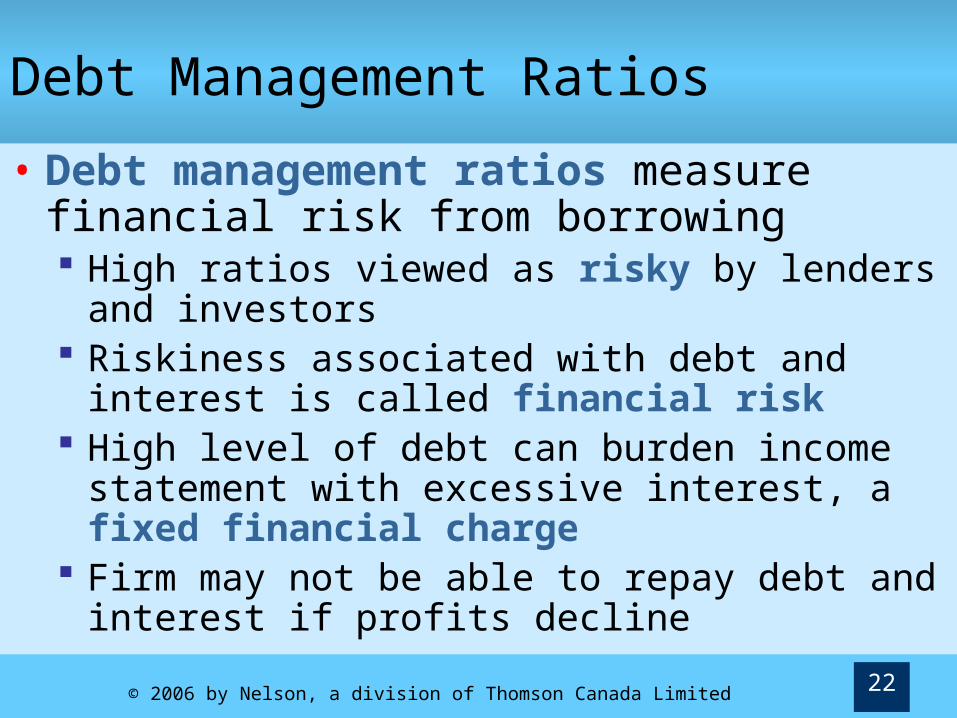
Debt Management Ratios
• Debt management ratios measure financial risk from borrowing High ratios viewed as risky by lenders and
investors Riskiness associated with debt and interest is
called financial risk High level of debt can burden income
statement with excessive interest, a fixed financial charge
Firm may not be able to repay debt and interest if profits decline
© 2006 by Nelson, a division of Thomson Canada Limited 23
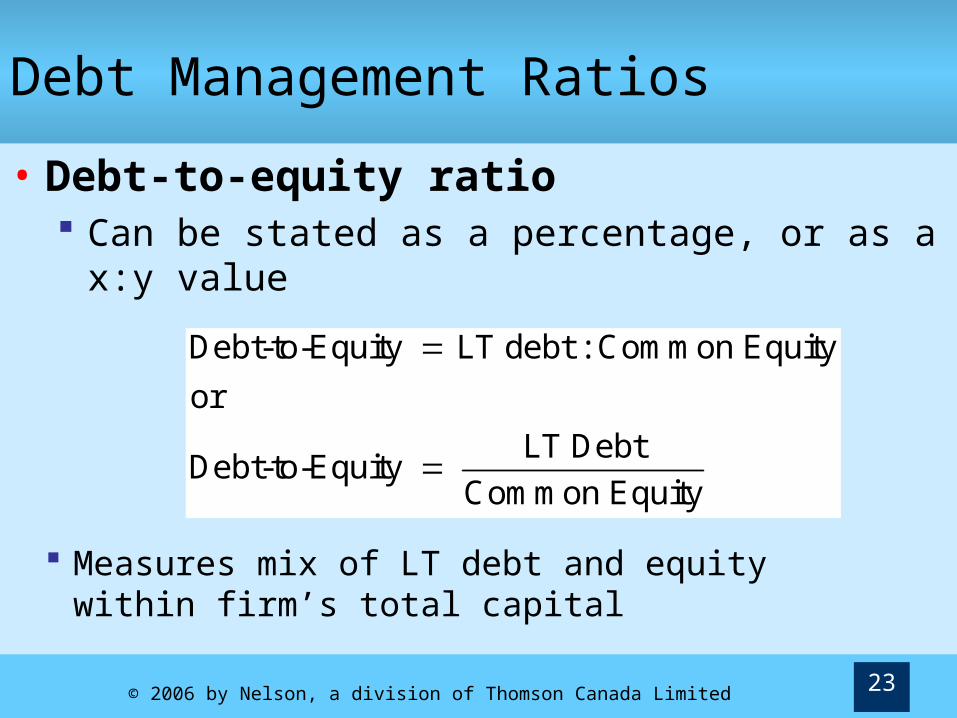
Debt Management Ratios
• Debt-to-equity ratio Can be stated as a percentage, or as a x:y
value
Debt-to-Equity LT debt : Common Equity
or
LT DebtDebt-to-Equity
Common Equity
Measures mix of LT debt and equity within firm’s total capital

© 2006 by Nelson, a division of Thomson Canada Limited 24
Debt Management Ratios
• Debt Ratio
Long-term debt Current LiabilitiesDebt Ratio
Total Assets
Need to determine if company is using so much debt that it is assuming excessive financial risk
High debt ratio is viewed as risky by investors

© 2006 by Nelson, a division of Thomson Canada Limited 25
Debt Management Ratios
• Times Interest Earned
EBITTIE
Interest Expense
TIE is a coverage ratio• Reflects how much EBIT covers interest
expense• High level of interest coverage implies
safety for lenders
High TIE ratio often means a low debt/equity ratio
© 2006 by Nelson, a division of Thomson Canada Limited 26
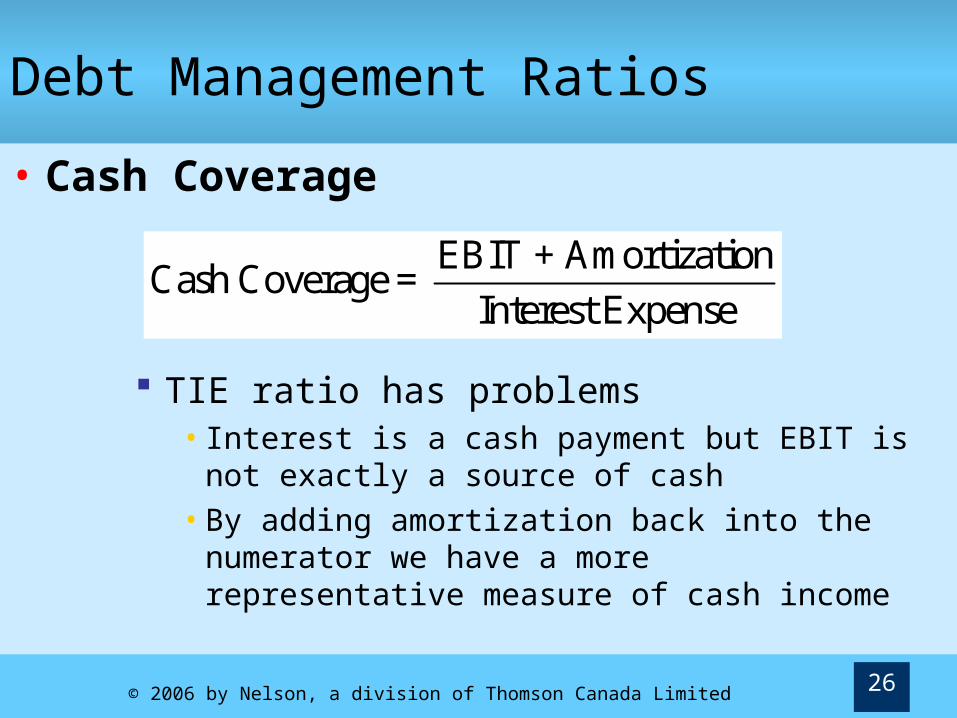
Debt Management Ratios
• Cash Coverage
TIE ratio has problems• Interest is a cash payment but EBIT is not
exactly a source of cash• By adding amortization back into the
numerator we have a more representative measure of cash income
EBIT + AmortizationCash Coverage =
Interest Expense

© 2006 by Nelson, a division of Thomson Canada Limited 27
Debt Management Ratios
• Fixed Charge Coverage
EBIT Lease PaymentsFixed Charge Coverage
Interest Expense Lease Payments
Interest payments are not the only fixed charges
Lease payments are fixed financial charges similar to interest• Must be paid regardless of business
conditions

© 2006 by Nelson, a division of Thomson Canada Limited 28
Profitability Ratios
• Return on Sales (or: Profit Margin, Net Profit Margin)
Net IncomeROS
Sales
Measures control of income statement: revenue, cost and expense
Indicates overall profitability of the business Low ROS may be OK for large firm Small firm needs higher ROS

© 2006 by Nelson, a division of Thomson Canada Limited 29
Profitability Ratios
• Gross Profit Margin
Indicates how efficiently firm buys or manufactures its products, and how well it marks up and maintains selling prices
Will vary, depending on industry and product lines involved. • For instance, margin on jewellery typically is much
higher than that on most food products
Gross ProfitGross Profit Margin=
Sales

© 2006 by Nelson, a division of Thomson Canada Limited 30
Profitability Ratios
• Return on Assets
Net IncomeROA
Total Assets
Adds effectiveness of asset management to Return on Sales
Measures ability of firm to utilize assets to earn profit
Often compared to firm’s cost of financing (after tax)

© 2006 by Nelson, a division of Thomson Canada Limited 31
Profitability Ratios
• Return on Equity
Adds effect of borrowing to Return on Assets Measures ability to earn a return on owners’
investment If firm has substantial debt, ROE tends to be higher
than ROA in good times and lower in bad times Compared to returns available from alternate
investments
Net IncomeR eturn on Equity =
Shareholders' Equity

© 2006 by Nelson, a division of Thomson Canada Limited 32
Earnings and Book Value per Share
• Earnings per Share
Indicates how much income was earned for each common share outstanding
Net IncomeEarnings per Share=
Number of Common Shares
© 2006 by Nelson, a division of Thomson Canada Limited 33
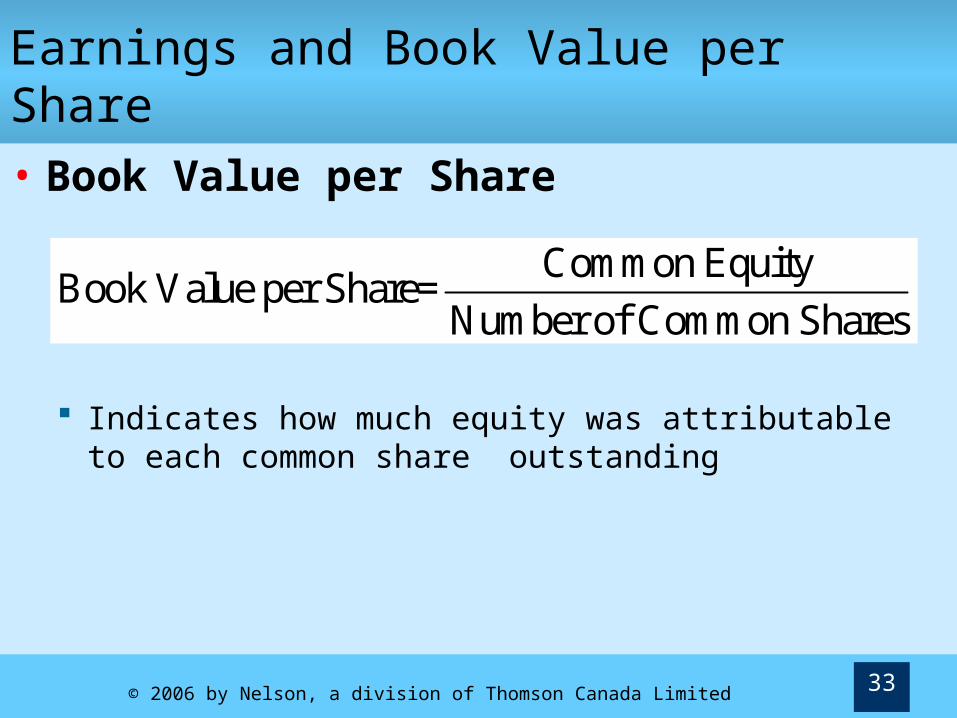
Earnings and Book Value per Share
• Book Value per Share
Indicates how much equity was attributable to each common share outstanding
Common EquityBook Value per Share=
Number of Common Shares
© 2006 by Nelson, a division of Thomson Canada Limited 34
Market Value Ratios
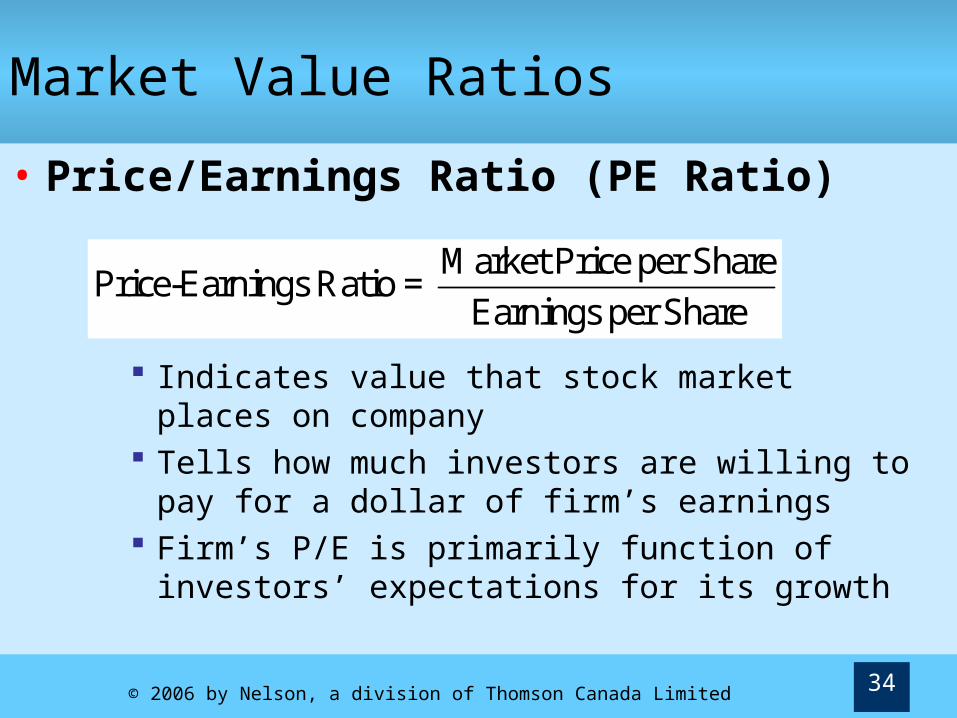
• Price/Earnings Ratio (PE Ratio)
Indicates value that stock market places on company
Tells how much investors are willing to pay for a dollar of firm’s earnings
Firm’s P/E is primarily function of investors’ expectations for its growth
Market Price per SharePrice-Earnings Ratio =
Earnings per Share
© 2006 by Nelson, a division of Thomson Canada Limited 35
Market Value Ratios
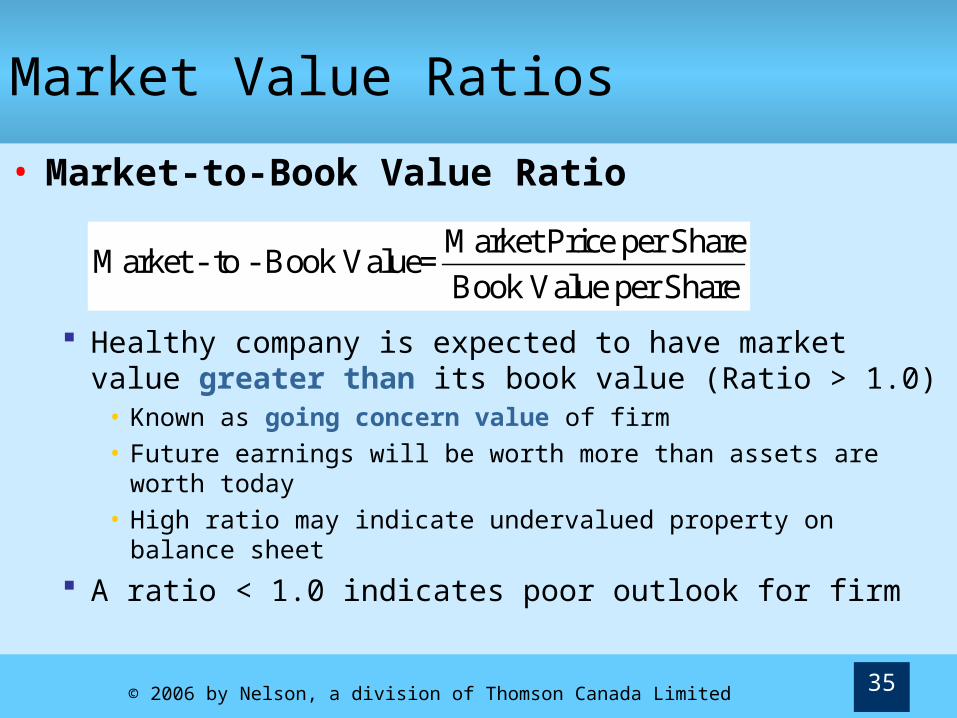
• Market-to-Book Value Ratio
Healthy company is expected to have market value greater than its book value (Ratio > 1.0)
• Known as going concern value of firm• Future earnings will be worth more than assets are worth
today• High ratio may indicate undervalued property on balance
sheet
A ratio < 1.0 indicates poor outlook for firm
Market Price per ShareMarket - to - Book Value=
Book Value per Share
© 2006 by Nelson, a division of Thomson Canada Limited 36
Du Pont Equations
• Ratio measures are not entirely independent
• Performance on one is sometimes tied to performance on others
• Du Pont equations express relationships between ratios that give insights into successful operation
© 2006 by Nelson, a division of Thomson Canada Limited 37
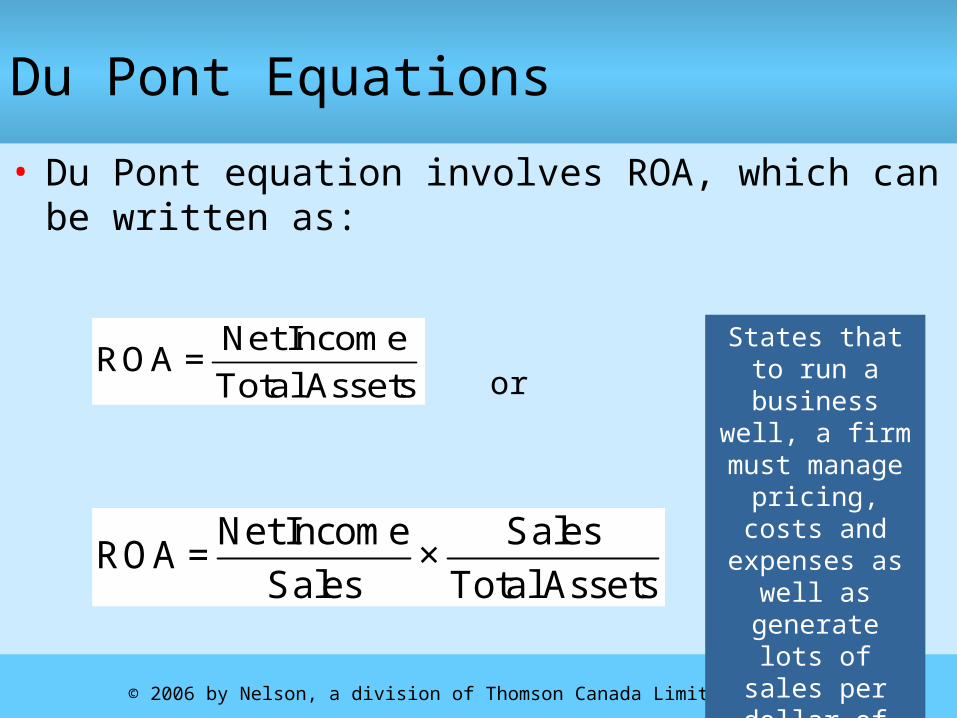
Du Pont Equations
• Du Pont equation involves ROA, which can be written as:
Net IncomeROA =
Total Assets
States that to run a business
well, a firm must manage pricing,
costs and expenses as
well as generate lots of sales per dollar of assets.
Net Income SalesROA = ×
Sales Total Assets
or
© 2006 by Nelson, a division of Thomson Canada Limited 38
Du Pont Equations
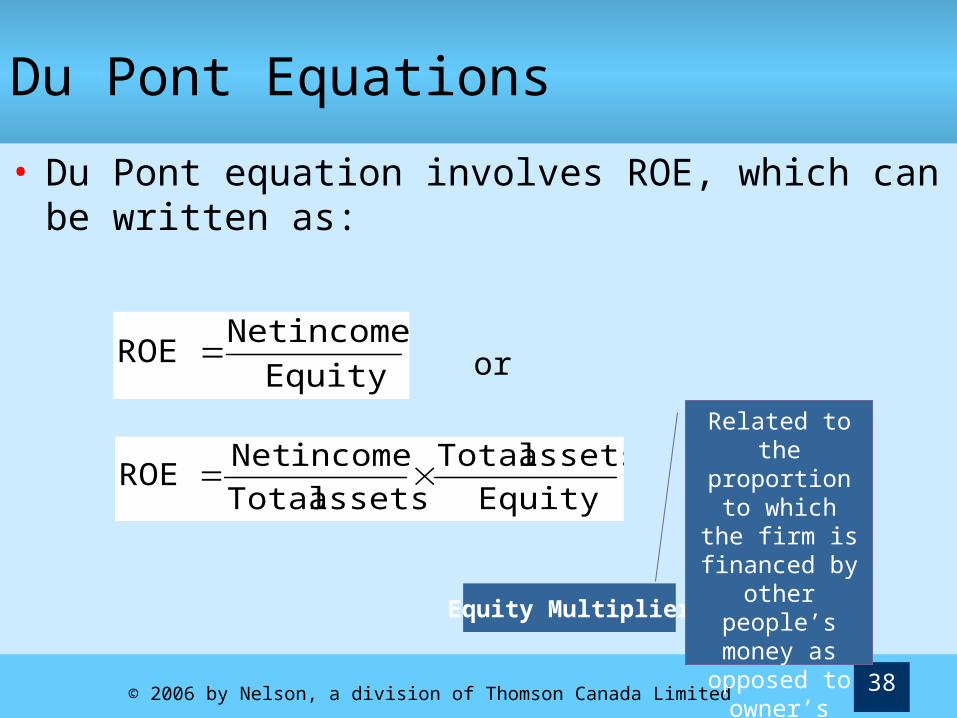
• Du Pont equation involves ROE, which can be written as:
Equity
income NetROE
Equity
assets Total
assets Total
income NetROE
Equity Multiplier
Related to the proportion to
which the firm is financed by other people’s
money as opposed to
owner’s money.
or
© 2006 by Nelson, a division of Thomson Canada Limited 39
Du Pont Equations
• Extended Du Pont equation states that operation of a business is reflected in its ROA However, this result—good or bad—can be
multiplied by borrowing, resulting in ROE The way you finance a business can
exaggerate the results from operations
• Du Pont equations can be used to isolate problems

© 2006 by Nelson, a division of Thomson Canada Limited 40
Table 3.2: Sources of Comparative Information
© 2006 by Nelson, a division of Thomson Canada Limited 41
Limitations and Weaknesses of Ratio Analysis• Ratio analysis requires judgment and
experience Examples of significant problems
• Diversified companies—comparing companies operating in several industries can be a problem
• Window dressing—companies make balance sheet items look better through temporary improvements
• Different accounting principles—similar companies may report same thing differently
• Inflation may distort numbers• Illegal and/or misleading accounting practices may
overstate assets, understate debt, or hide losses
© 2006 by Nelson, a division of Thomson Canada Limited 42
Words of Caution
• Ratios are only as good as information on which they are based
• Ratios become most valuable when: Compared to past, competition, or budget
• When comparing ratios among different firms, ensure the ratios calculated using same method
• Ratios should cause one to ask questions; rarely do they provide answers themselves
Related Documents