3-1 Copyright © 2010 Pearson Education, Inc. Chapter Three Research Design

3-1 Copyright © 2010 Pearson Education, Inc. Chapter Three Research Design.
Dec 22, 2015
Welcome message from author
This document is posted to help you gain knowledge. Please leave a comment to let me know what you think about it! Share it to your friends and learn new things together.
Transcript
3-1Copyright © 2010 Pearson Education, Inc.
Chapter Three
Research Design

3-2Copyright © 2010 Pearson Education, Inc.
Chapter Outline
1) Research Design Classification
2) Exploratory Research
3) Descriptive Research
4) Causal Research
5) Potential Sources of Error
6) Marketing Research Proposal
3-3Copyright © 2010 Pearson Education, Inc.
1) Research Design: Definition
• A research design is a framework or
blueprint for conducting the marketing
research project. It details the procedures
necessary for obtaining the information
needed to structure or solve marketing
research problems.

3-4Copyright © 2010 Pearson Education, Inc.
The Problem Definition Process (again)
Fig. 2.1Discussionwith
Decision Maker(s)
Interviewswith Experts
SecondaryData Analysis
QualitativeResearch
Management Decision Problem
Marketing Research Problem
Tasks Involved
Environmental Context of the Problem
Step I: Problem Definition
Step II: Approach to the Problem
Objective/ TheoreticalFoundations
ResearchQuestions Hypotheses
Step III: Research Design
Analytical Model: Verbal, Graphical, Mathematical
SpecificationofInformationNeeded

3-5Copyright © 2010 Pearson Education, Inc.
1) Components of a Research Design
1. Define the information needed (Chapter 2)2. Design the exploratory, descriptive, and/or
causal phases of the research (Chapters 3 - 7)3. Specify the measurement and scaling
procedures (Chapters 8 and 9) 4. Construct and pretest a questionnaire
(interviewing form) or an appropriate form for data collection (Chapter 10)
5. Specify the sampling process and sample size (Chapters 11 and 12)
6. Develop a plan of data analysis (Chapter 14)
3-6Copyright © 2010 Pearson Education, Inc.
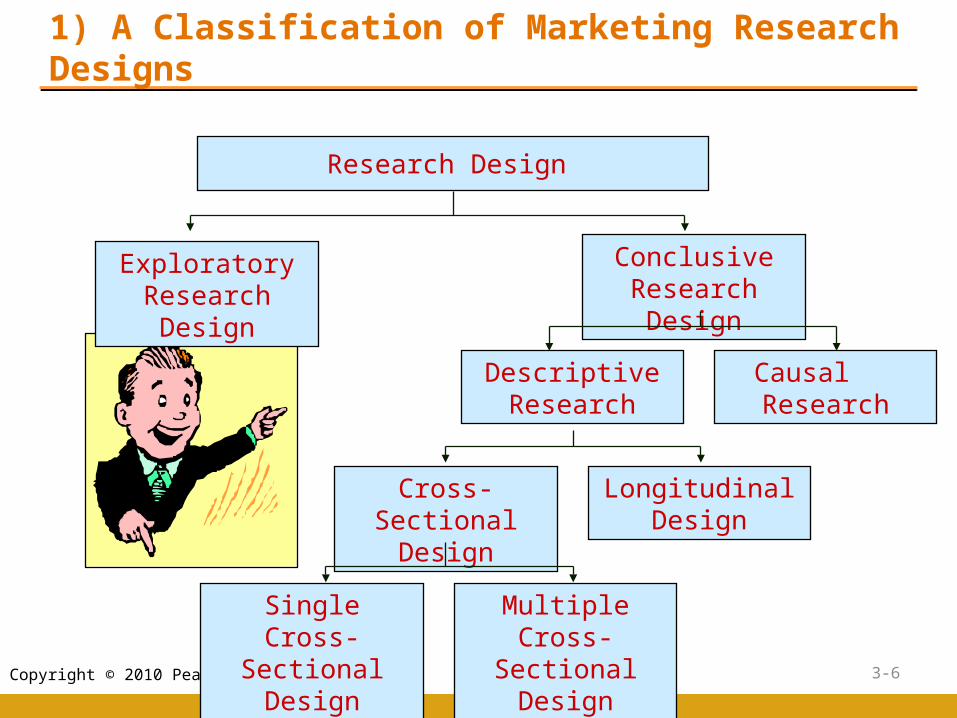
1) A Classification of Marketing Research Designs
Single Cross-Sectional Design
Multiple Cross-Sectional Design
Research Design
Conclusive Research Design
Exploratory Research Design
Descriptive Research
Causal Research
Cross-Sectional Design
Longitudinal Design
3-7Copyright © 2010 Pearson Education, Inc.
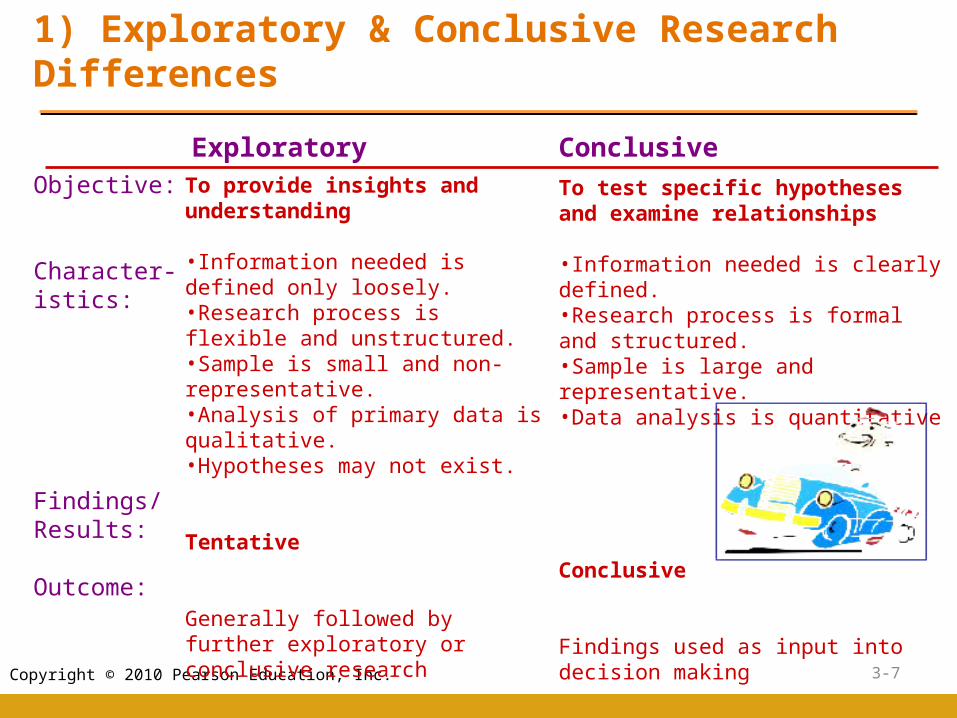
1) Exploratory & Conclusive Research Differences
Objective:
Character-istics:
Findings/ Results:
Outcome:
To provide insights and understanding
•Information needed is defined only loosely. •Research process is flexible and unstructured. •Sample is small and non-representative. •Analysis of primary data is qualitative. •Hypotheses may not exist.
Tentative
Generally followed by further exploratory or conclusive research
To test specific hypotheses and examine relationships
•Information needed is clearly defined. •Research process is formal and structured. •Sample is large and representative. •Data analysis is quantitative
Conclusive
Findings used as input into decision making
Exploratory Conclusive
3-8Copyright © 2010 Pearson Education, Inc.
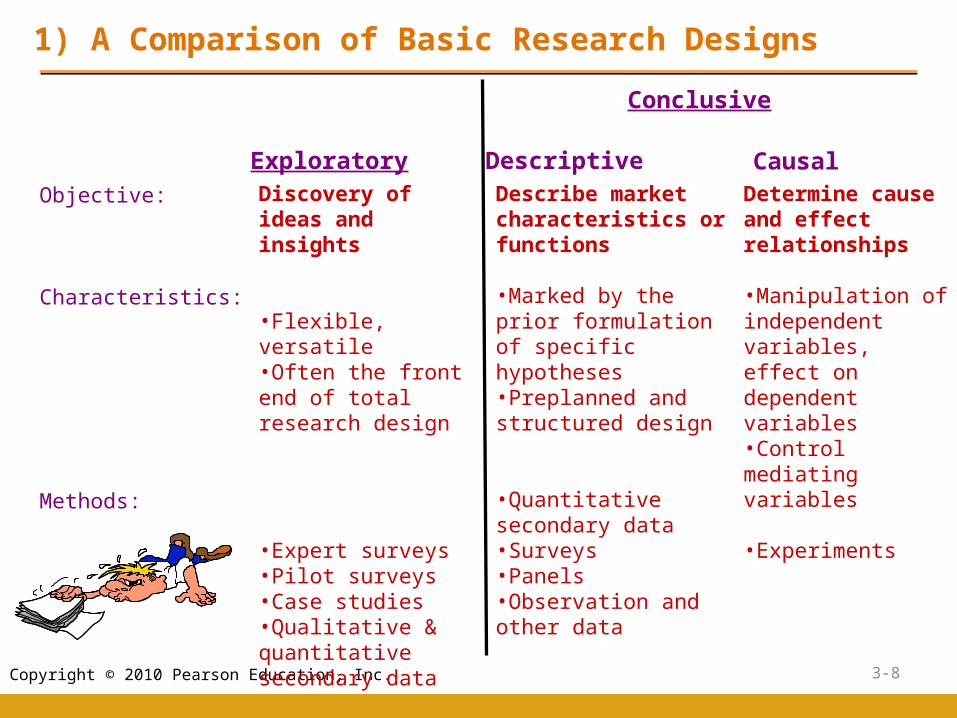
1) A Comparison of Basic Research Designs
Objective:
Characteristics:
Methods:
Discovery of ideas and insights
•Flexible, versatile•Often the front end of total research design
•Expert surveys•Pilot surveys•Case studies•Qualitative & quantitative secondary data
Describe market characteristics or functions
•Marked by the prior formulation of specific hypotheses•Preplanned and structured design
•Quantitative secondary data•Surveys•Panels•Observation and other data
Determine cause and effect relationships
•Manipulation of independent variables, effect on dependent variables•Control mediating variables
•Experiments
Exploratory Descriptive Causal
Conclusive

3-9Copyright © 2010 Pearson Education, Inc.
2) Uses of Exploratory Research
Exploratory research can be used to:
•Formulate a problem or define a problem more precisely
•Develop hypotheses
•Establish approach and priorities for further research
Exploratory methods discussed in chapters 2-5.

3-10Copyright © 2010 Pearson Education, Inc.
3) Use of Descriptive Research
Descriptive research can be used to:•describe the characteristics of relevant consumers•determine the perceptions of product characteristics•make specific predictions
Descriptive research can be further classified into cross-sectional and longitudinal research…
3-11Copyright © 2010 Pearson Education, Inc.
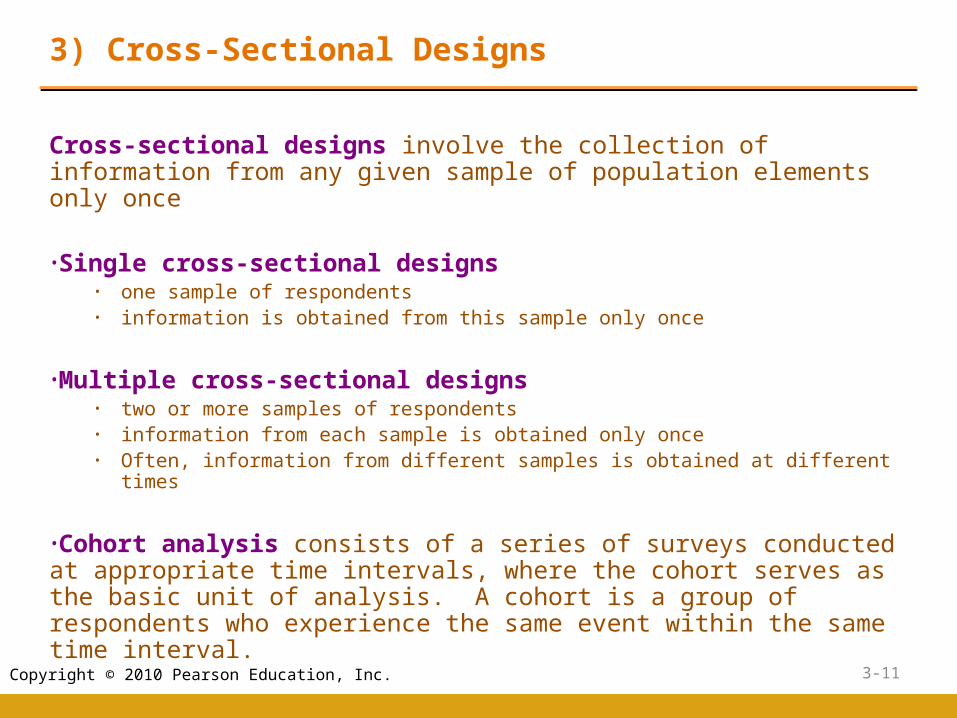
3) Cross-Sectional Designs
Cross-sectional designs involve the collection of information from any given sample of population elements only once
•Single cross-sectional designs• one sample of respondents • information is obtained from this sample only once
•Multiple cross-sectional designs• two or more samples of respondents• information from each sample is obtained only once• Often, information from different samples is obtained at different times
•Cohort analysis consists of a series of surveys conducted at appropriate time intervals, where the cohort serves as the basic unit of analysis. A cohort is a group of respondents who experience the same event within the same time interval.

3-12Copyright © 2010 Pearson Education, Inc.
3) Example of Cohort Analysis
Cohorts (in this example) = income level groups

3-13Copyright © 2010 Pearson Education, Inc.
3) Longitudinal Designs
A longitudinal design involves a fixed sample (or samples) of population elements that is measured repeatedly on the same variables.
•A longitudinal design differs from a multiple cross-sectional design in that the sample(s) remain the same over time.
•A panel is a sample of respondents who have agreed to provide information at specified intervals over an extended period.

3-14Copyright © 2010 Pearson Education, Inc.
3) Cross-Sectional vs. Longitudinal
Sample(s)
Surveyed at T1
Sample Surveyed
at T1
Same Sample
also Surveyed
at T2
Time1 Time2
Cross- Sectional Design
Longitudinal Design
Time
3-15Copyright © 2010 Pearson Education, Inc.
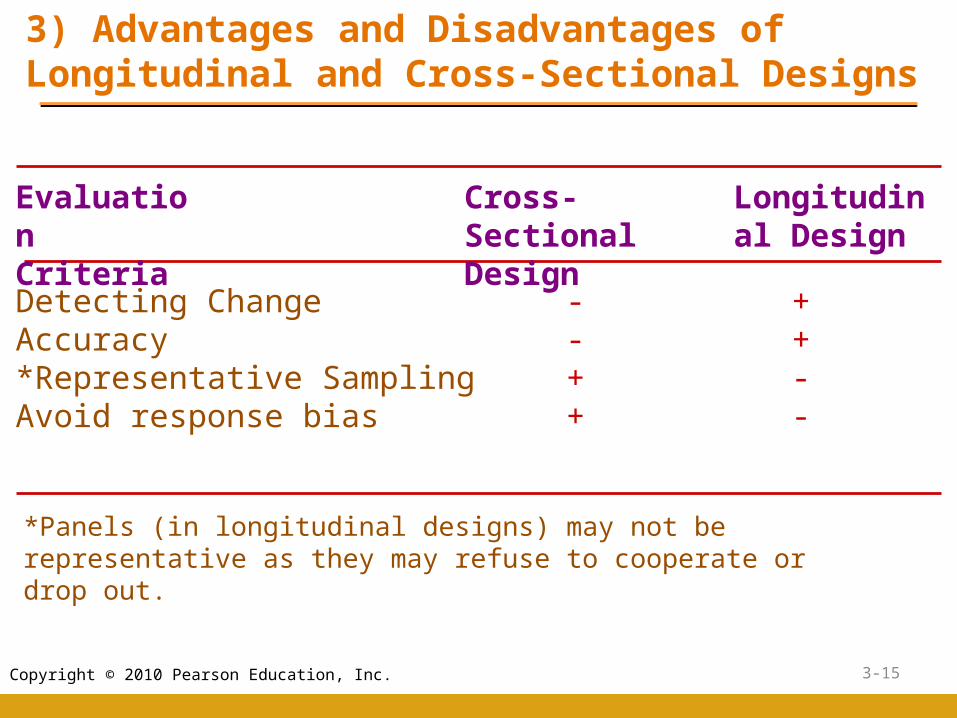
3) Advantages and Disadvantages of Longitudinal and Cross-Sectional Designs
Evaluation Criteria
Cross-Sectional Design
Longitudinal Design
Detecting ChangeAccuracy*Representative SamplingAvoid response bias
--++
++--
*Panels (in longitudinal designs) may not be representative as they may refuse to cooperate or drop out.

3-16Copyright © 2010 Pearson Education, Inc.
4) Causal Research
• Causal research: a type of conclusive research where the major objective is to obtain evidence regarding cause-and-effect (causal) relationships.
• Cause = independent variable(s)
• Effect = dependent variable(s)
• METHOD: Experiments

3-17Copyright © 2010 Pearson Education, Inc.
5) Potential Sources of Error in Research Designs
Surrogate Information Error
Measurement Error
Population Definition Error
Sampling Frame Error
Data Analysis Error
Respondent Selection Error
Questioning Error
Recording Error
Cheating Error
Inability Error
Unwillingness Error
Total Error
Non-sampling Error
Random Sampling Error
Non-response Error
Response Error
Interviewer Error
Respondent Error
Researcher Error

3-18Copyright © 2010 Pearson Education, Inc.
Errors in Marketing Research
• The total error includes:• Random sampling error is the difference between
the true mean value for the population and the true mean value for the original sample.
• Non-sampling errors can be attributed to sources other than sampling, and they may be random or nonrandom:
• Non-response/response error,• Poor problem definition, • Wrong research approach, • Unbalanced scales, and so on…

3-19Copyright © 2010 Pearson Education, Inc.
Errors in Marketing Research
• Non-response error arises when some of the respondents included in the sample do not respond.
• Response error arises when respondents give inaccurate answers or their answers are misrecorded or misanalyzed.

3-20Copyright © 2010 Pearson Education, Inc.
Thank you!
Questions??
Related Documents