• - A STUDY ON TI N015E AND IijTtHFERtNC~ IN TtLECOMMU~ICATION . 'STEM ~ITH SPECIAL REfERENCE TO BANGLADESH (,,2r;;.8035L\'32- \98'0 MDE. BY ! MD.. £~IDADUR HAHMAN KHAN, B. Sc. ENGG. ( ELECT.) .i ~ .,' -.~ 1- , DEPATM.ENT Of ELECTRICAL ENGINEERING BINGLADESH UNI ERSIlY OF ENGIN£ERI~G AND TECHNOLOGY, DACCA. , JULY, 1.960 .1 I I I'

Welcome message from author
This document is posted to help you gain knowledge. Please leave a comment to let me know what you think about it! Share it to your friends and learn new things together.
Transcript
•-
A STUDY
ON TI N015E AND IijTtHFERtNC~ IN TtLECOMMU~ICATION.
'STEM ~ITH SPECIAL REfERENCE TO BANGLADESH
(,,2r;;.8035L\'32-\98'0MDE.
BY
!MD.. £~IDADUR HAHMAN KHAN, B. Sc. ENGG. ( ELECT.)
.i~.,'
-.~
1-,
DEPATM.ENT Of ELECTRICAL ENGINEERING
BINGLADESH UNI ERSIlY OF ENGIN£ERI~G AND TECHNOLOGY, DACCA.,
JULY, 1.960
.1I
I
I'
A STUDY
ON THE NOISE AND INTERfERENCE IN TELECOMMUNICATION
SYSTEM WITH SPECIAL REfERENCE TO BANGLADESH
BYMD. i::MDADUR RAHMAN KHAN; B.5c.ENGG.(ELEC-T.)
~'--~-'".- "," :.'~;~')"[''1:,,,-_,'" ..-:;'i.\.;...." .. _. _i'~~" ,"
f,( ,jy~~.~'.1~41g?7,~./;~~.",','~r I _
\" ~ '. .. 2-",?-:.?--:~O~..;.' ~
~. ;Tri; ~,><I"....._.. '< 104't I V
. ~';"._.-A THESIS, .•..... """"
SUBMITTED TO THE DEPARTMENT OF ELECTRICAL ENGINEE~ING.BANGLADESH UNIVERSITY Of ENGINEERING AND TECHNOLOGY; DACCA
IN PARTIAL fULfiLMENT Of THE REQUIREMENTS fOR THE DEGREE
OFMASTER Of SCIENCE IN ENGINEERING (ELECTRIC AL)
DEPARTMENT OF ELECTRI CAL EN GI NEERING
BANGLADESH UNI VER51TY Of ENGIN EERI NG AND TECHNOLOGY. DACCA.
JUL Y. 1')50
'.
,
THIS IS TO CERTIFY THAT THIS WORK WAS DONE BY ME ANDIT HAS NOT BEEN SUBMITTED ELSEWHERE FOR TBE AWARD OF ANYDEGREE OR DIPLOMA.
~.<"'~SIGNATURE OF THE SUPERVISOR
NJ. Ey\,,A,,JM!7 RalM.£,oa Ldg'1SIGNATURE OF THE CANDIDATE
A STUDYON THE NOISE AND INTERfERENCE IN TELECOMMUNICATION
. ,SYSTEM WITH SPECIAL REfERENCE TO BANGLADESH.
ACCEPTED AS SATISfACTORY fOR PARTIAL fULfILMENT Of THE REQUIRE-MENTS fOR THE DEGREE Of MAST&R Of SCIENCE IN ENGINEERING(ELECT.).. ---
. ,
EXAMINERS
\
~,'6,r-~DR. A.M. PATWARI . (ih-l'<>O,PROfESSOR,DEPARTMENT Of ELECT. ENGG.,BUET, DACCA.
?&Y \.~JJ,9f!J<a;l,.-I',llr"1'-• KAZI ABDUR ROUf .
MAN~'Nfr-DIRECTOR;TELEPHONE SHILPA SAN.G&'f.I+A-.
~ ~;''h' ',' .~\""'no QI.(... ~ i'1'?o-DR-:=;. M. ZAHOO-RlH:-HlY. 18 ~ .
PROfESSOR AND HEAD;DEPARTMENT Of €I:ECT. ENGG.;BU ET; DACCA.
, ..~
CHAIRMAN
EXTERNALMEMBER
MEMBER- \ .
, . <
~~ ~\r~"ilDR.I'--SHAMS1WD..I.N,'AHMEilPROfESSOR; DE~~ OfELECT. ENGG.;B,JT;DACCA.
,
DR. M HfUZUR RAHMAN KHAN 1(1-(1'0As,spJ;ATE PROfESSOR,DEPT. Of ELECT. ENGG.;BUET,DACCA .•
, • i.
I.. 'MEMBER
MEMBER .. ~
,'. I
ABSTRACT
For efficisntand reliable operation of any communication
'system. the noise sources involved need a careful 61ndthrough study.
In this thesis an attempt has been made to evaluate theperforlllsnce
of the Telecommunication system in Bangladesh; by msking 13 careful
and thorough study of the noise sources involved.
A mathematical analysis of noise in various stages in tele-
communication system is givsn in brief. Measurements for noise
end signal are made at various stages' in our telecommunication
system. Cslculations of the overall signal to noi~e ratio Of the
syst.em have been made. Efforts have been. made to identi fy the
ceuses of noise snd interference in the various stsges of the
different types of telecommunication system of Bangladesh and to
find out the means to improve signal to noise ratio.
A brief discussion ebout fui:ure telecommunication systems
in Bengladesh is also given elong with necessary comments.
(vi)
CONTENTSPage
Acknowledgement
AbstractList of figures
List of TablesList of Symbols
vvixUX:vx'Vi
1
1
2
34
4
445555
6
a -9
,...,....
'....
.,..'..
•••.,.
Tel&communicati-o-n-- Systems
Their characteristics
PreliminariesT-elecommunicstion
1NTRODUCTION
Signal and Noise in
Trensmission Media.and Degradetions
1.3.1 Copper conductors\,' ,~l, 3. 2 Co-axi. a1 cable~l
'\ .' '0" 1.3.3 High frequency ( h-f) System\,' 1.3,4 Very high Frequency (v-h-f) system
1.3,5 Ultra High Frequency (.u-h-f) System
1.3.6 Microwave System (MW) •••
1.3.1 Other 'Media •••1.3.•a Other Degradations •••
1.4 Brief Literature Review1.5 -Objective of the Thesis1.6 Contents of the Thesis
Chapter 1'1 0,, 1,1
'.1.2
1.3
ChaptYNOISE. INTERFERENCE ANDDISTORTION INTELECOMMUNICATIONSYSTEMS
2,0 Preliminaries ,.. 102,1 Noiss. Interference and Distortion 10
2.1.1 Distortion .., 102.1.2 Interference '... 112.1.3 Noise .'.-. 12
2.2 Effect of Noise on Signal ••• 122.3 Common Types of noise ..'.. 14
2.3.1 Thermal Noise .,. 142.3,2 Shot Noise .,. 142.3.3 Low Frequency Noise ••• 15
2.3.4 Impulse Noise .04
2.3.5 Quantization Noise •••
2.3.6 Other Noiees ,•••2.4 Mathematical Description of Noise
2.4.1 Stetistics of Noise Wave Form
2.4. 2 Frequency Analysis 0 fNoise Waveform
2.4.3 Mathemetics for Shot Noise •••2.4.4 Thermal Noise •••2.4,.:i Noise Temper,ature •••2.4.6 low frequency Noi,ss •••
2.4.7 Impulse Noise •••2.4.8 Quentization Noise •••
2.4.9 Band Limited Noise •••
Page
151616171721232627282930
31
3.2.2 Noise in Active Devices •••Available Power and Noise TemperatureEffect of Moduletion on Noise •• ,.Noise and Amplitude MOdulation •••
3.5.1 Single Sideband (SSB) Moduleted Wave3.5.2 Double Sideband Suppressed
Carri er (DSBSC) Modu,lated Wave
3.5.3 Bouble Sideband Transmitted Carrier(8SHfC) Modulated Wave •••
3.5.4 Syncronou$ Detector •••
3.5.5 Envelope Detactor '"Compari son of Linear MOdulation Syilteme
NOISE IN NETWORKSANDDEVICES
3535
353638
3'40414346474950
525253
54
51
Network
•••
•••
••••••
Preliminaries '•••Noise in Networks •••
3.1.1 Description of Noisy two Part
3.1.2 Effective Noise Temperature3.1.3 Noise figura
3.1.4 Cascaded NetworkNoise in Devices
3.2.1 Noise in Passive Devices
3.2
Chapter 3
3.03.1
'411 ••
'....
•••
.....58
59
59
Page
56.3.7 Noi se end Angle MociJla1:ion
3.7.1 Effect of Pre-emphasisandPCl~emphasison Noise in FM System
3.7.2 FM Threshold Effect3~6 Comparison of Exponential and Linear
Modulation System
, 4.3 Transmission Level Point (OTLP.dBr.dBmo etc)
4.4 Measurement of Effective Input NoiseTemperature and Noise Figure •••4.4.1 Calibrated NDise So.urce •••
4.4~2 Calibrated Signal Source •••4.5 Noise Loading Method •••
4.6 Out of Band Noise Measurement ••.•
TECHNIQUESAND METHODSFOR MEASURINGNOISE
6869707174
6161616566666667
••••••
•••
•. .'.•....
•••
4.2.1 Signal4.2.2 Noise
4
4~C Preliminaries4.1 Noise and Signal Measurement
4l~ 4.1.1 Noise
4.1.2 Signal4.2 Units for Measuring Noise and Signal
Chapter
NOISE IN CABLES AND SWITCHING NETWORKS
7575767676778283858890
•••
•••
•••
•••
..•,.
..' ..
.,....Telephone Cable
Noise and Interference in Telephone ExchangeRole of Grounding in Reducing Interference
Measurements and Results
PreliminariesNoise in Cables
Th srmal Noi se
l/f Noise
Croes-talk
5.4.1 Crosstalk in multipsired
Conducted InterferenceRadiated Interference5,.6
5.75.85.9
5.5
5
5.05.15.25.3
Chepter
,
/
.'..
5.10
5.11
Message Channel Objectives •••5.10.1 Message Circuit Noise Objective5.10.2 Impulse Noise Objective •••5.10.3 Crosstelk objective •••Discussion
Page
9191929293
NOISE IN CARRIERANDR-f" SYSTEM
6.5;-0Interrnodulation rJoise Due to Echoes6.6~se Due to Radio Interference •••
6.6.1 In-channel Interference •••6.6.2 Image Chsnnel Interference •••6.6.3 Adjacent Channel Interference6.6.4 Single frequency InterferEJlce
6.1 Effact of Absorption •••6.8 Noise in Satellite System •••
6.8.1S01ar Noisa •••
6.B.2 Cosmic Noise ••.•
9898989899
100102102
104
106
110111
11111311511111811B118119119120
120
•••
'...
•••
Shot Noise
6.1.2 Crosstalk ' ••6.1.3 Intermodulation ' ••Measurement of Noise in Multiplexing andDBrnu1tip1exing Equipment •••Nonlinearities end Intermodulation6.3".1 Amplitude Nonlinaarity •••
6.3.2 Effect.of Ampliiude Nonlinearity onAngle Modul ated Waves •••
6.3.3 Intermodu1ation Noise due toTransmission Deviations •••
Noise in r-f iystem •••I ntermodul etion Noi SB in r-f system6.5.1 Intermodu1ation Noise Due to
Nonlineari ties
Preliminaries
Noise in Carrier System6.1.1 Thermal Noise and
Chapter
6.11 Discussion
6.9.1 Measurement by Noisa Loading Method6.9.2 Measurements for Fading •••
6.9.3 Noise Measurement in MUX/DEMU.Xendr-f Combined •••
6.9.4 Noise /4eesurement in Sate11ite System6.10 Noise Objective for Multip1exed Transmission
System •••
6.9 Measurements and Resu1ts ...-.
•••
Page
120121123
123124
125
126
Chapter 7
7.1
Appendices
Appendi x-A
CONCLUSIONSANDRECOMMENDATIONSConclusion end Recommendations
The NPR Versus Loading Curve
•••
•••
130
133
Appendi.x-B
Appendix-C
Different Weighting Curves fOr Noise
CCITT end CCIR Recommendations forMUX-DEMUXand r-f System Noise •••
136
137
I
Figure No.
2.12.22.32.4
2.5
2.62.7
I
3.9
LIST Of FIGUR£S
TiUe
Typical neise waveform.
The Gaussian probability distribution.
Summation of two noise signals.
Circuit designed to measure the autocorrelationfunction of a noise signal.
Equivalent circui t to represent thermal noise in aresistor.
PCMamplitude levels and quantization errcJr.
Represent.ation of bend limited noise
{al I n terms of in-phase and quadrature components.{blIn terms of magnitude and phase.
The Reyl sigh probebili ty di stribution .•
A noisy two port network.
A noisy two port with matched source and load.
Cascaded network and noise.
Noise equivalent bandwidth. BN• of a bandpass filter.
An Rt circuit with resistance noise(e) Circuit diagram.
(bl Noise equival.ent circuit.
Simple equivalent circuit for e noisy transistor.
Simple triode ampli fier(9) Circuit diagram.(b) Noise equivalent circuit.
(e) Phasor diagram for carrier plus sinusoidalinterference.
(bl Line spectrum for the interfering sinusoid.Product demoduletion of r-f noise(a) r-f noise spectrum (b) Baseband noise spectrum.
figure No. Title
3.~O Phasor diagram for a modulated cerrier and IIIband limited noise.
3.12
3.13
5.2
5.35.4
5.56.1
6.2
6.3
-Detected interference amplitude as e function offi for an interfering wave at l'c + fi•
Detected interference amplitude for fM wi thde-emphasis fil taring.
Instantenaa.s frequency deviation versus time fortvo sinu soi de.
POst detection signal to noise ratio. es a functionof' z.for different types of modulation.
Set-up for the measurement 0 l' noi se figure.
Noise meeeurement by using noise loading method
(a) no bend stop fil tar between noise generatorand system.
(b) ~ band stop filter bstween noise generator andsystem,.
(a) Crosstalk by inductive and capecitive couplingbetween two circuits.
(b) Verious capacitances between conductors oftwo circui ts.
four conductors in a quad of a multipaired cable.
A simple network for arc suppression.
Set up for the measurement 0 f noi se in cabl e andswi tching system.
Noise judgement curves.
(a) Crosstalk due to improper filtering.
(b) A base band frequency allocation for 960 channels.
Typical set up for the measurement of noise in thelllUltiplexing end demultiplexing equip.ment.
Thermal, crosstalk and intermodulation noise in echannel.
Nonlinear voltage tranafer characteristic of 8two port.
figure No. Title
6.5 Low-order transmiss.ion gain and phase shapes.
6.6 System analog for second order modulation.
6.7 Echo in a transmitter antenna system.
6.8 Radio frequency interference.
6.9 Adjacent channel interference.
6.10 Spectral intensity for iigniJs-A.
6.11 set up for measurement of r-f system noisl' in theDacca-CTGMWlink by using noise loading method.
6.12 set up for measurement of r-fsystem noise in theDacca-Hsjiganj MWlink us.ingnoi se loading method.
'a) Variation of received signal level measuredat Hajiganj MWrepeater station from12-3-80 to 18-3-80.
(b) Typical AGeealibration curve.
Interruption period due to fading for three months(Dac-eTGMWlink).
Interruption due to fading for elifferent years •
. set up for measurement of MUX-DEMUX end r-fsystem combined noise in some channels inDaeea-CTGSiD circuit.
Typical NPRversus noise loading curve.
NPRversus noise loading curve for different orderof distor.Uon.
Table No.
5.2
5.3
•
LIST {If TABLES
Title
Comparison of different types of linear modulationsystems.
Relation between di fferent uni ts 1'01' noi sa power.
Noise values fur various interconnections between!SGlllle(a) Some subscribers of central exchange
(28 and 25 only).
(b) Some subscribers of central exchange and somesub scribers of Sher-e-Banglanagar exchenge.
(c) Some subscribers of Gulshen exchange.
(a) Resistance between conductors in two cables atold Dacca area.
(b) Resistance between conductor in two cablesetMiqlur area.
Different judgement qualities and correspondingnoise levels.
Phese modulation caused by small. low ordertransmission deviatio.ns and AM/PMconversion.
Results for 1'-1' system noise measurement inDacca-CTG MWlink.
Received signal levels at different timss atHajiganj MWrt!peeter stat;lon (from 12-3-80 to18-3-80). for simplicity. Datas are omitted butcorresponding g.raphs are shown in fig. 6.13( a).
(xv)
Interruption periods due to fading for three months(In Dac-CTGMWlink).
in the STD circuit
1980.1980.and eCI R
6.5 Interruptions in hours dus(In DAC-CTGMWline).
SNR for di fferent channel sbetween Dacca and eTG.(a) In the month of feb.(b) In the month of May.
Comparison between CC1TTreference circuit.
to fading for three yeers
hypothetical
I1:2 Noise objectives for MUX-DEMUXand 1'-1' system
according to eC!TTand eClR. !
•wf
Gew)
k
TBWH( f)
1.
m
dBmOJ:i
dBrnco
dBmdBrn
LI ST (IF SYMBOLS
Standard deviation
Charge of an electronAngular frequencyFrequency
Frequency spectrum of a power signel-23 0Bolt~an~constBnt = l.37xlO Joules/ k
Tamperature in oK
Bendwidth
Message channel bandwidthTransfer function
White noise power densityGain of a tlolOport
Effective input noise temperature oftwo-port networkNoise figure
Noise equivalent bandwidth
Reverse saturation current
Transmitted power
Transmitted power. PT; divided by total white noisein eudio bandwidth till).
Moduletion index
Power of a point in dBmreferred to zero level pointwith psophometric weighting
Noise power of e point in dBrnreferred to zero levelpoint with C-message weighting
POwer relative to one miliwatt (expressed in dB)
POwer relative to one picowatt (expressed in dB)

CHAPTER-lINTRODUCTION
1
1.0 Preliminaries
Tile ability to communicate. that is to share information,
is one of the char;3cteri stics of human race which has played a
major part in its development. New techniques are beiag. evolv,ing
every day to further enhance the communication. But in transmi-
tting and receiving of information. there is alweys some unwanted
signal which is called noise. This limits the .capacity of informs-
tion trensmission. and so it is en.important factor in designing
and evaluating performance of any telecommunication system. In.
this chapter an introduction is given about signal and noise in
telecommunication systems. A brief literature review. objective
end contents of this thesis are also given in this chapter.
1.1. Telecommunication
Today; telecommunication systems are found wherever infor-
mation is to be conveyed from one point to another - from manto
man or machine to machine. Now-a-days; telephone;" picture~phone.
radio and talevision have become intagral parts .of everyday life.
long distance circuits span the globe, carrying text; voic" and
images. Radar and telemetry systema play vital rales in navigation;v
defent and sci,entific research. Computer talk to computers via
tran~continental data links. Thus; there are myriad types of
communication~ An important one, among these; is the communication
between people by telephones.
2
-vi.2 Sign.l Ad Nelse An T,lecollllllunlcationSyat!t!li
The objective of • cOlllllluni,caUon syst_ie to carry in tor-
.Iltion from one point called &Duree to anothl!!t' point celled
destination. Inforntation is tranemitted end received as electrical
elgnala 1n teleea_unic.tion lI)lst.1II8. But information ,produced
by e source. in ,general,!. notelaetricel. So • tr.nsducer i.s
required. Transducer convert, the lnfO%1ltetion or 1Il6ssage to a
aigne1t • titus varying electrical qusntity such as voltage or
curr.nt, whlch is better lilUited for fu:rther proc •• d.ng by the
8Y.'.III. Si'.il.u:1Yt another transducer at the destination converts
the output signal to the appropriate massage foX'lll.
But in eou:r:se0 f ,electric.l Bignel tr.n •••:!. .aion, c1lrta1n
unw.tled and undeeirabJ.e .f1'.8Ct$ take place. One i. attenuat.ion
IIIhichr'llduces the eignal strength; llIO:t'f:I serious. however, are
di .torUo"" interference end 1\01_ which ch.nge tohe signal shape.
In • bJ:O.dsenae, .n~ un••anted .19"a1 perturbation lII.y b. C188ai-
tied '.8 noiae.
N01e. oc:eurs in te1ecolllmunicat.ion ayet.elIIs in ",arious way••
It may occu:r by net.workeend devices used in the collllllUnication
systeM itself, by extran&ou6electroaegnetic waves produced byother colllfoluniclSt1on eystelllS,t by atmospheric electrici.ty, by solar
,rad$..ation, by man-mad" source and by lIleny other ways. The tot.l
noiss that reaches " list'aner' '8 e.rs affects the degree of annoy••
ance and the 1ntelligibility of received speech. SiJdlarly, •••• in
th.• ca•• of television. the ultilllete .ff'.ect produced by noi.e is
against the eya and te1ns tluch as snowor ghos1:edescribe this
3
effect subj ectively. Howmuch deterioration 0 f the signal will
be caused by noise depends on signllland noise strengths. If
signal power is appreciably higher than noi se power, then effect
of noise will not be perceptible. Thus the criterion of performance
of I!Isystl!lm is taken as the ratio of signal power to noise power
or signsl to noise ratio (S.N.R). There is a lower limit of SNR
for intelligibility of a signsl. for example. in case of Tv.
transmission systems. SNRmuat be higher than 50 DBand for .audio
systems SNRshould be higher than 30 DB.Thus for better perfor-
mance. transmission systems must have good SNR.
It is clear that noise phenomen~in tranamission systems is
an i~portant and basic factor. for reasonable SNR.,the syst~m
must have speci fied no~se aa by using amplification SNRcannot
be increased. rather it is dllGreaaed as amplifiers add extra
noise. Thus noiae objectives lire given in any system design.
System performance detariorates when noise values exceed given
objectives. Of course. cases are there for whiGh SNRmey be kapt
within reasonable value ellen if noise increases ina parti,cular
section of the transmission system. This may bedoneby i,nael!Jsing
the signal level preceding the noisy section. But this may ,not
be preGticabla as the existing circuit may not carry, the increased
signal ,level. Thus study of noise phenomena is important in
telecommunication systems.
1.3 Transmission Media. Their Characteristics and Degradations
The main transmission media ev.ilable for telecommunications- -
are (1) copper conductors (2) co-axial cables, (3) h-f radio
4
(4) v-h-f, radio (5) u,.h•..f radio. (6) microwave (n other medill.
1.3.1 Copper Conductors
Copper conductors are used in telegraph poles or in twisted
pair cable. Recently, aluminiulll wires are also used in twisted
pair cable. Besides copper conductors. iron conductors are also
used in telegraph lines. These can be used upto several kilo Hert.
if edequate amplification and balancing are provided.
1.3.2 Co-axial Cable
Co-axial cable is usable from about 50 KHZto hundrads of
megaHertz and is used fOr transmission of baseband signals.
1.3.3 High Frequency (h-f) System
This .syetem( h-f) is uaed. for poin'!; to .point communiCation
around the world. The frequency range ia (3-30) mHz. Ey using
independent sideband modulation (ISS) four channels can be used•..t
by one cerrier. Eesidfis. un~di,rectionAcommunicatiol1_.ifl a.l,so. malilil
by h-f system. fOr example, short wave radio stations in the world.
Since these waves are reflected by ionospheres, fading is high
using these frequences.
1.3.4 Very High frequency 1v-h-fl SYstem
v-h-f radio operates in the range 150 to 180 MHz. It operates
mostly on the line 0 f sight principle. Maximum72 audio channels
5
can be used. It is also used for small scale point to point
communication and also in mobile radio operation.
1.3.5 Ultra High frequency (uih,,,) System
u-h-f system has increasing demand fOr mobile operation.
It is elsa used for transmission ,of baseband signal. fraquency
range is from 400 mHz to one gegaHertz.
1.1.6 Mic,50wave System (MW)
Microwave system is uaed in terrestrialcommunicetion as
well as in th a satelli te communication., frequency ranges fbr
telecommunicetions by microwave are 2;4.6,,7 and 11 GHz (GegaHertz).
till now,maximum 2700 audiochannels canbe u1;ledby a,UWllull: single
carrier, Antenna system gain can be made very high and noi se in
this system is also lower, for these reasons microweve systems
are used widely,
1,3.7 Other Media
Othar media like fibre optics and laserbeem are now being
uBed.,Th~se have much higher capacity. for example, more,than
230.; 000 telephone channels can be U sed by using fibre optics.
Of course these are new techniques and so have not yet been used
widely,
l,3.B Other Degradati.ons
In addition to the bandwidth limitations there are many other
channel degradations which are given below:
(a) attenuation
(b) frequ ency di eto rtion i. e change 0 f gain .r att enuation
with frequency
(c) amplitude distortion: change of attenuation or gain
with the emplitude of the signal
(d) phase or delay distortion: change of propagation delay
with frequency
(el change of phase with amplitude i.e AM/PMconversion
(f) noise: power, bt ••••• x.itbr bandwidth end statistie. of
circuit noiee end in the casaaf speech the background
room noi se.
(g) croBstalk from other channels
(h) side tones end echoes
(i) delay or propaglltion time •
.Jl.4 Brief Literature Review
Transmission of 1!Isignzl1 as well as the rate st which it
may be transmitted is characterized greatly by the noise present
in the system. The rate of transmission of intelligence (signal)
is elsa characterized by the time required. fo:l;' energy. change in
the systsm. But these facts werl!l not very clear till 1948 when
Claude Sh.nnon(l) gave a mathl!lml!ltical reletionship between system
capacity, signal strength and noise strength. System capacity
means the maximumamount of information that may be transmitted
in one second.
--' -
7
. Dut for quite e ~o.ng time the concept of information theory
was rather nebulous. Th. first ettempt to measure the amount of
information was lIIadeby H.~teley{ 2) in a paper celled "Tran_ission
of inform.tion". The work 0 f Hartley was greatly influenced by
Myquist-Kup1muller law d1scovered in 1924. The.law states -that
for transmitting telegraph signals .t a given rate a de'finit •
. frequency bllTldwidthis requized. The modern info mation theory
callie, in fect. dUe to the contribution by N_Wiener(3) and C.
Shannon. The communication theory owes 8 greet debt to professor
M. Wiener (a mathematician) fo~ lIlLlchof its basic philosophy and
mathematical formulation. The statistical approach to thecolll1llu-
nication theory is based on hi. contribution. The foundation of
the .mo,derninf01:lllation theorywBiI laid by Shannon's first paper •
•The lIIoth_sticel theory 0f comlllunication".
f'ollow1ng Wiener's end Shannon's worke considerable research
work have been done tj.l1 today. blportanceof t.he -study of noise
and int.erf,erence in telecomlllunicati.on systema was felt essential
efter Shannon's fO:l:lllulafor syst!!Jlll°capacity wa. derivet!,.An unueu-
ally large number of scientifi~ papers in this field appeared
ctvring the past. three decades. Thie undoubtedly indicates th.
great interest end enthusiasm of scientist and engineere in this'
fiel.d. Somecontributors from Bell-telephone laboretories are
S.O. Rice(4). D. Hufflnsn(51.B• KOlllil1an16)T_K. S8n(1). D.C_Hogg{B).
A. f'einste~ 9). J.A. Wozencraft( 10) snd D. Slepien (11). Someother
fallliliar names in the list of scientists end metht!lllsticians with
B
contribution in the field 0 f communication are Abranson( 12) •
GoldmanClJ). Schmitt(l4). Kapp(15). Juhani Alme(16). !?;';c~;eh(17).I-\"",-",,'k US) \-("''''' (19) (20) (21)N;i;c:tlwEl . • Hel. lIlIPSlln j Glave ; Gordon and many others.
were
In Bangladesh; previous studies in the(22) (23)made by Rouf and Das. Rouf made
field communication
a shti6ti~alstudy
of the telephone traffic ~nd.thecontit'ibutic:m._()f.Das""as.in the
study of information content of Bengali language and he also made
a study of the noiS8 inmicrowsve communication system. These
works were carried out in the Department 0 f Electrical Engineering.
Bangladesh Uni versi tYD f Engineering and Te.chnology (For .M.$c. Engg.
thesis).
1.5 .Objective of the Thesis
for effic:Len!o. and!,-"eliel:ll~oPe!'-"C11;ionof any .::l~mmunic:i31;ion
system; the noise sources involved need a careful end thorough
study. The main obj.ective of this thesis is to make e study.em
noise and interfe!,-"snc::e,in. tt?1,scC1mmu,:,;cliltion.sY$t~ll)with sPl!Ici!)l
reference to the telecommunication system in Bangladesh and to
find out any .possible means to .improve the Signal to noi se ratio
( SNR). Measurements for noi.ss l!!nd.interferen~f3 wil1b.e. mlilde~rl
the telecommunication system in Bangladesh and the results will
be compared with those given by ccnsultativecommittee for inter~
naticnal Telephone and Telegraph ~CCITT) lind consultative committee~-=---for international radiocommunication (CCIR).
Conclusion will be made on the basis of the results. Efforts
will be made to find out soms601utions to the problems that might
9
1.6 Contents of the Thnis
A~ introduc1:ion to the top:1cof the thes:1swith • ~ '-t-~c.-y,""...,...,\- ~-L-C.y,..t>-l~ "l-<'>Vi>I'>, ct •. "hl'"'''' "'1\(0< ' .)0.<.-
1~ezwtur8 review ha. been given in CbaRt.r-l.~.scription of\ .~~ -"N"";::JQ!;;:~~ 'f ~ '1- 'V '- ~V.<N L.- J4 \{-, •.••..
vtu:ious types of noises Imd-thetl' AI!l1;~~a~'t-i.on'S _\") f-e,<'\- y..••~<, ~ f-w'~ "'" a.4.~h~-; u-
given in :::00p1:er-2. A discussion about noiae in network. lilnd. ~
~ ••• is lIIadein Chapter-3. Chepter-4 giveal!l brief deecr1pUonS IV P•.B ,~~ 4-.J. 'Y.J'->":' !- •.•..•••~
abaut d1fferent lllethoele of Illea.uringnoi ••'. It discus.io" .bou.t dwk<-(,.:v~dn;" ...,
nq,i.a in cab! a.and awitching netwo-dc--i. lIled-e-i.il-t;;.tH'~S. ::;J ,o j ;? ,,'" flv ("-5 (': ~ .'5-y~,<~:'JSOllie llIeasurements far noi ae 1n cables and SW.1tching networks.n •... f,....p ~_" ~ ~ /')61-,</:.l)anghcli.t'l '-r~llllinienieA-Syet'JlII ~ff•••de~~ Jr;6;;s'f;n~' .1",,",<' •
,.." "'-baasd on the liIeaWrelllents are .1eo given in Chapter-S.ft b~ef
theorBtical dl!l&CriPtio/s"weil a. IllSalSUretltentafor car~r end
r-f system noise Il~iven in Chapter-6 .where e diSCl,l~On ha•
• leo been added.
Conclusions and recommendations of the whole work are given
in the
future
r;hepter- J along with necessary coll/llsnta.
BIBLIOGRAPHY
,1. Shflnnan. C.f end W. Wesver
2. Hartley. R.U.L.
3. WIener. N.
4. Rice. S.O.
6. McMillan, B
7. Sen. 1.K.
8. HOW9, D.C.
9. Feinstein, A
10. Wozencrett. J.A.
11. Slepien. I).
12. Abraneon, No~en
"The Mathematical Theory ofCommunication", University ofIllinois Press. Urbana. 111.1949.
"Transml seion af In fa_a tion. "Bell S,ystelll tech. 39urn.1. 1101.7.1928 •.
"Cybernetice". techno~ogy Press.M.I.T. Cambridge. Maa.; .John Wileyand 50ns. Inc •• NawYoX'1<. 1948.
"Communication in the Presllnce ofNoise. ProbebiU.ty of £rro1" fortwo Encoding Schemes", Bell SystemTech • ..I•• Vol. 29, 1950."The Synthesie of Linear SequllntialCoding Networke", Prot. Symposiuman Information Theory, London, 1955."The Besic Theorems 131' InformationTheory". Ann. Math. Statistics.Vol. 24. 1952.
""aaking of Croa_talk by Speechand Nois.", Bell Syst8l1l Tech• .I.,Vol. 49. April. 1970 ••• Statistics on Attenuation ofMicrowaves by Intense Rain".Bell SYBtlllll r echo ,..I•• Vol. 48.Nov_ber. 1969.
"Foundations 0 f Intormetion Theory".McGrew Hill Book Company. Inc.,N_ YoX'1<. 1958.
"Sequential Decoding for ReliableCommunication" IRE Conv. Record.Vol. 5. March, 1957.
"A Clase of Binllry SignallingAlphabet.". Bell Sy.tam Tech•• J••Vol. 35. 1956.
8Info~etion Theory end Coding",McGraw Hill Book Company. Inc.,N.Y. 1963,
13. lioldllsn
14. Shillitt, Neil l'lllrtin
15. KepI'. Jack
16. Helme, SlIPPO .Juhani
J.7. Rhee. Joong lieun
.- , ...-(,, i
"-18. Huang, John Chen-Yuen\
!.-.. _. ,
19. Han. Young Yearl.
20. Glsve, fredci.ck :Ernest
21. Gordon. John Petersen
22. Rlbf. Kazi Abdur
"Information Theo1'Y", Prentiee liell.Inc. N.Y, 1954.
itA itudyof Bauble Sided Inter-8y~bo1 Interference in DigitalDe~a Communication", Doc~orelDieaartation, Southern "ethodistUniversity. 1969-70."Performance of Suboptimum Detectorsand Signal Selection in liausian andhllpulaive Noies". Doctorsl Disser-tation, 1969-10, N.Y Universl~y."Communication in a Tu1'bulentI'tlllOspherre". Doctoral Dlasertat1on.1969-70. M.l. T.
"'TheNoise p1'OJH.rties of Thielefilm. Resistor •••• Doctoral Dieser-tetion, 1979. University of South.,florida;-l~i- . .
"On Band Width £'fficient Spectral.Shaping.Methode and Digital Modu-"I'etion Tet:hniquas in linear andNonlinear Channel ••••DoctoralDiesertation. 1979. ConclJdli.21University. (C~NADA)."Ad.ptive Multile\1el IntegrationReceivers ~or Impulsive Inter~erenca ••Doctorsl Dissertation. 1919.University o~ Mi,slllouri.
"Co.munication Over fading DispersiveChannels with feedback". DoctoralDissertation. 1969-70, URi", ersi ty0' California. Berkeley.
"Random Input Signal Analysis ofNonlinearSystl3lll8 .with TransportDeley". Doctoral Dissertation.1969-711. University of Ulinois.t Urbana Campaign."Statlisticsl study 0 f Telecommuni-cation Traf~ic in Pakistanu• M.Sc.Engg.(El set.) Thesia, DUET.Decca, 1967 •
.",01'1 lnfo:r:metion Content of' Bengalilanguage lind Noi a8 in MWC_ll'Iunicetionin Bangladesh", M.Sc.fngg.(Elec~.)Theels. Merch .1976j BUET;Dacca.
CHAPTER-2NOISE. INTERfERENCE AND DISTORTIONIN TELECOMMUNICATION SYSTEMS
3.0
2.0 Preliminaries
In this chapter discussion will be made abou~ what are meant
by naise. interference anddi~tortion.their types. ma~hemati~~l.
description and how they affect intelligence in telecommunication
systems.
2.1 Noise. Interference and Distortion
In cou rse of Electr~cG\l .signal.transmisElion,. certain unwanted
and undesirable effects. take place e.g distortion, noise and
interference which alter the signal shape. So. at the receiver
end the signal is received as contaminated signel. These undesired
signal partlilrbation may be classified as noise. HDw~ver. there are
goad reasons and adequate basis for seperating the three effects
as follows:
2.1.1 .Distortion
It is the alteration of thflsignal due to imperfect :i:esponse
of the system to the desired signal itself. Distortion dissappears
when signal is turned off. for eXl!Imple,the gain of an .amplifier
may change with frequency or input signal level causing so called
frequency distortion or amplitude distort;on. Similarly, the phase
of output signal may change with frequency causing phase distortion.
These will be discussed in the subsequent chapters.
Improved system design or compensating networks can reduce
distortion. Theoretically perfect compensation is p_sible but
11
practically. some distortion Illust be accepted, though the amount
can be held within tolerable limits in all but extreme cases,
2.1.2 Interference
Interference is the cantamination of the desiredsignalby
extraneous signals, usually man made, of a form similer to ,the
desired signal, It may be a deterministic signal or~ random
sign.al.,.O' for ex~ple.multiplexing in telecommunication' systems
may be considered. In this case mapychannels are multiplexed by
using different frequency carriers (frequency division multiplexing)
for transmission over a commonlink, But due to incomplete filtering,
information from one channel may,enter. il] another channelc:au sing
interference which is called crosstalk in this case, Information
theory says that e known signal carr~no info~ation and SO it is
meaninglesS to transmit. Hence ell meaningful communication signals'1'lo'Yt
must be of~deterministic nature. that means, information carrying
signals must be ran(;\om, Here tha type ,of ~nter1'erenceci,ted ,is
elso rendom. Of course. it may alsO be deterministic e,g. in
telecommunication system, an in~erferingsine_~avemaY be generated
from an external uncontrolled source (say a power line) which is
deterministic in nature. However. actu<;lllY,E!peaking. th1;l.amplitude,
frequency or phase of the said sine wave are subjected to unpre-
dictable changes. So this may also be considered as random type
of interference,
Unlike distortion; interference remlilins if_ the, desirsc1
signal is turned off. Tha cure for interference is obvious i.e.
12
the elimination a f the interfering signal or its 6Ource. Again
a perfect 6Olution is possible, though not always practicable.
Noise means the random and unpredictable electricCllsignl,'lls
which cOlliefrom natural causes, both internal and,external,to,the
system. Obviously these are unwi3n:t,ed,6ignals.~lh,at makes, noi,se
unique is that it can never be completely eliminated, even in.
theory. It will be shol,," that non-eliminable noise pOses s'lte. of
the basic problems of electrical communication/The case of thermal
noise may be cited. Such t:'oise is due to the continual motion of
the electrons in thermal equilibrium with the molecules, in,6
conductor. This type of noise causes a random voltage to develop
across a resistor., Another example of noise is shot noise which
arises due to the discrete nature of electron flow and is found
in most activedevi~es. Unlike distortion. noise remains even if
signal is turned off.
from the foregoing discussions, it is clear that noise,
interference and distortions are undesirable signals. ,li:ach ofwa •..-
them intefer~~the desired signal. for easier analysis, all of them
may be termed as noise. That means, any undesired signal is termed
ss noisa.
2.2 Effect a l' Noise on Signal
It is clear fromthe previous discussion thatnoise,srif!les
in telecommunicati'on'systems in various ways. It may be due 1fo
13
nonlinearity of an amplifier; due to incomplete filtering; inherent
thermal and shot noise etc. It may elso be we to th'e coupling
between conductors in a cable; coupling by the commonpower sou,rce
and commongrounding./External int~rfere"-ce may ,a~socau~e ~oiee.,
Actually> noise may occur in various ways. These noises or,unwanted.--sign~ls finally add with the desired signal at the
a result. the receiver output will be a mixture, of
receiver. AsI '
the two signal,s.
So. if the ,received signall;lsrel!ludio, !i1ignals; then the ears will
receive both the wanted signal and noise. The effect of noise may
be like a hiss; click. crash. pitch; loudness. etc. It may elsQ,
be an intelligible signal; Just annoyance, will. be felt byrer;eiving,
lll.lchunwanted signals i.' e noise; for person to person communication.
the annoyance will be more if the noise is intelligible. Also,the
intelligibility of the ,signal will be deteriorated due to the
presence of noise. Similarly,' if theraceived signal ,is ,a video
signal; then picture intelligence, will be deteriorated in addition
to the annoyance felt by the eyes. "In case of telegraph system
and data transmission, noise isa threat to the accuracy of the
received information.
Now, how much deterioration o'f the signal will be caused
by noi se depends on signal and noi sa strengths'. If signel power
is appreciably higher than noi se power;, then effect of noi sa will. '
not be perceptible. Thus the criterion of performanC,e ofa eY,stem
ie determined by the ratio of signal power to noise power. This
ratio is called the signal to noise ratio, (SNR). The h;!.gher .the.
SNR; the better is the performance of a system. There is a lower
I
14
limit of SNRbelow which effect of noise is dominant. for example
incase of audio system SNRshould be higher than 30 DB and in
case of video system. SNRshould be higher' than 50 DB~)
2.3 CommonTyees of Noise
following ere the commontypes of noise in telecommunication
systems:
2.3.1 Thermal Noise
This noise is due to the random motion of electrons (or other
charge carriers) in a conductor. According to the kinetic theory
of heat. the elec'trons in a conductor are in continual random
motion in thermal equilibrium with the moleculea. The mean square
velocity of the electrons is proportional to the absolute tempe-
rature. Since. each electron carries,. ,unit. negative charge. ,each
flight of en electron between collisions with molecules constitutes
• short pulse of current. Because of the such randomly moving
electrons and the frequency of col.lisions. a voltage is developed
across the terminals of the conductor. The average value of,th,
voltage is zero (otherwise. chargas would pile up at one end of
the conductor and stay there) but it has got an effective value.
This voltage is called the thermal noise voltage •. Mathematical
description of this voltage will be given in the following ssction.
2. J.•2 Shot Noi se
It is due to the discrete nature of
(OY 0 I~ ,J",,,-~c....l\"-'4el ectronl\ flow andi s
found in most active devices. This type of noise involves random
15
fluctuations about an average particle flow. for example: electrons
flowing between cathode and anode in III vacuum tube. electron and
holes flowing in a semiconductor. photoelectrons emitted in photo
diode etc. Although averaging over many particles. the flow is
found constant •. therewi.ll be fluctuations about this average.
This fluctuation causes a noise voltage to develop. The mechanism
of fluctuations depends on the particular process. In the following
section it will be shown that mean squared fluctuatiQ"-.sbout the
average value .is proportional to the average value itself.
2.3.3 LaW freouency Noise (l/f noise)
This noise in associated with contect and surface irregula-
rities in cathodes end semiconductors. It appeers to be caused.
by fluctuations in tha conductivity of the medium. This noise i!3
elso called cantactnoi sa. flickernoisa or l/f noise becaus13 of
its particular increase towards very low frequencies. This noise
also occurs in the irregular contacts that may be presenti!,! cable
joint or any other joint. for a good device. such noise is negle-
gible over 1 kHz although the corner frequency can be a faw decades
higher .in frequency for high frequency low noise transistors.
2.3.4 Impulse No.iee
Impulse noise consists of short spikeliof lilnergy.hevil'lg.sn
approximetely flat "frequency spectrum over the frequency range
of interest. ,Such noise arises from switching transit!lnt13. incen~J:l!l.
offices and dialling from subscribers end. Humanbeing appears to be
16
reaS)nebly tolerant of elicks and popjils i.e impulses below levels
which might ceu se hearing damage. However,. PCMand diltl;l receivers
ere relatively intolerant of these impulses aince they cannot
di.stinguish between impulse noise and pulse to be detected. Thus
study of this noisa is very J.mportant for digital transmission.
2.3.5 Quantization Noise
This noise arises due to the roundoff' errors in converting.
analog signals to digital form in PCMsystems. The coded ..represen-
tation of' the sample ~mplitudes can be exactly right only whe~
the sampled value corresponds exactly with one of th.s discrete
coclewords. But exact correspondence 0 f sampled. velueswith code.
values is a rare possible case end so sampled yalues are required
to be quantized by assuming nearest coded or quantized level
giving rise to quantization noise.
2.3.6 Other Noises
Since in a broad sense. noise includes interference end
dlisto rtion effects. other type 0 f noise (due to interference
and distortion) may be cited here. For example. in.8 telephone
ex-change 'there are interferences due to arcing 0 f relays, coupling
by power source. battery internal resistance and groundresil[ltance.
faulty flourescent lamp etc. Interferences are also present in
cables due to coupling between di fferent conductors.
In the multiple~ng and demultiplexing equipments thare ara
also noises like intermodulation noise. (due to nonlinearitiesl
17
crosstalk (due to imperfect filtering), Noise is .1$0 present in
r-f 1:ransmission system due to nonlinearities; fading and absorp-
tion, Solar radiation end cosmic radiation appear as noise at
MWfrequencies, Atmospheric naise also hampers communication in
h-f bend, These will be discussed in the subsequent chapters,
2.4 Mathematical Description of NOise(l).{J);l5)
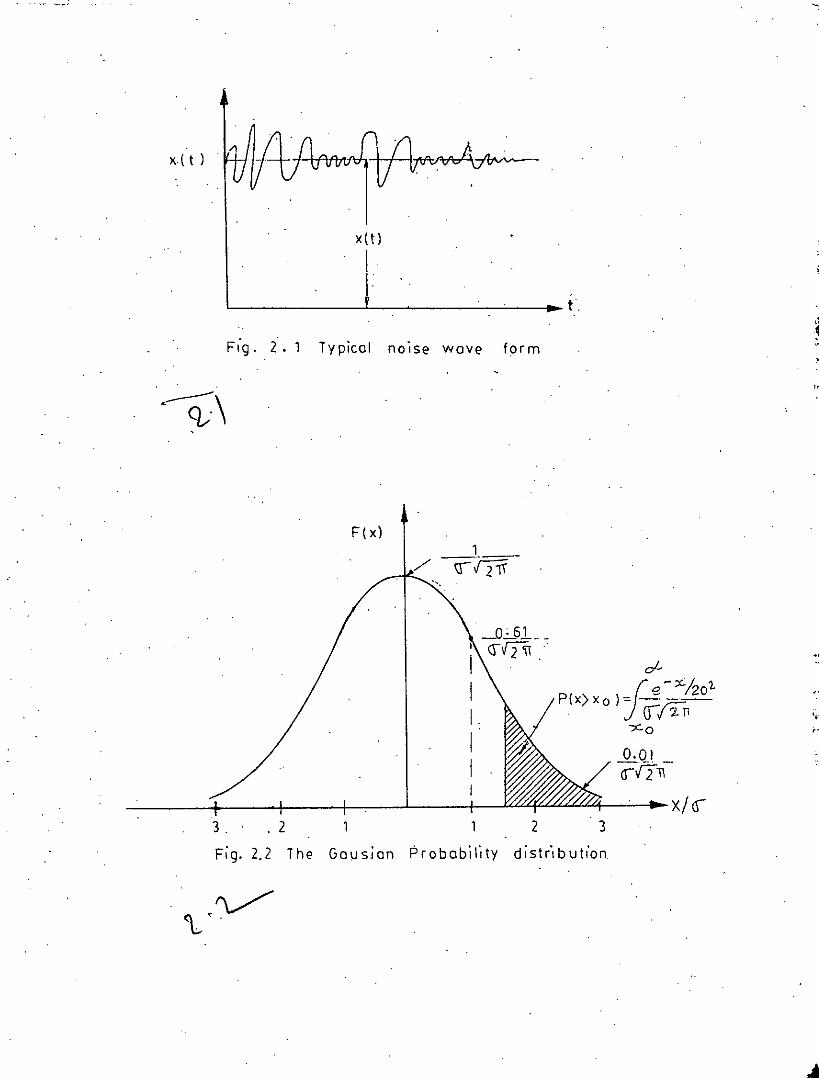
2.4.1 Statistics of Noise Wave form
Superposition of large no, of events occuring in a random
!Ranner causes a noi se wave form, for example; th ermill noi Sl!!, stated
earlier. arises from the random motion of electrons in €l conductor.
Since the nature is random, it is not possible to give any precise
statement regarding the effect at any particular instant but sinCe
the number of events concerned is. very large, the average behaviour
is well de:fined and the sati sfl!lctory description 0 l' noi se waveform
can be made in statistical terms, A typical noise waveform ie shown
in fig. 2.1.
In the fig. 2~~ fluctuation of the noise voltage about
the mesn value xrtT is shown. An obvious measure of the magnitude
of tha noise is the r,m,s, value of the waveform, In practice it
is simple to work with the Illean squara value which is given by
x2(t) _ It ,.. .,.It is also required to know the. probability of occurenee of a
x. ( t )
~(t)
I
Fig. 2.1 Typical nOise wave form
3. , 2
Fig. 2.2 The
F (x)
Gaws.ian
2 3Probabil'lty distr',butlon
0.01IJV211-
x/If'
','
IS
!
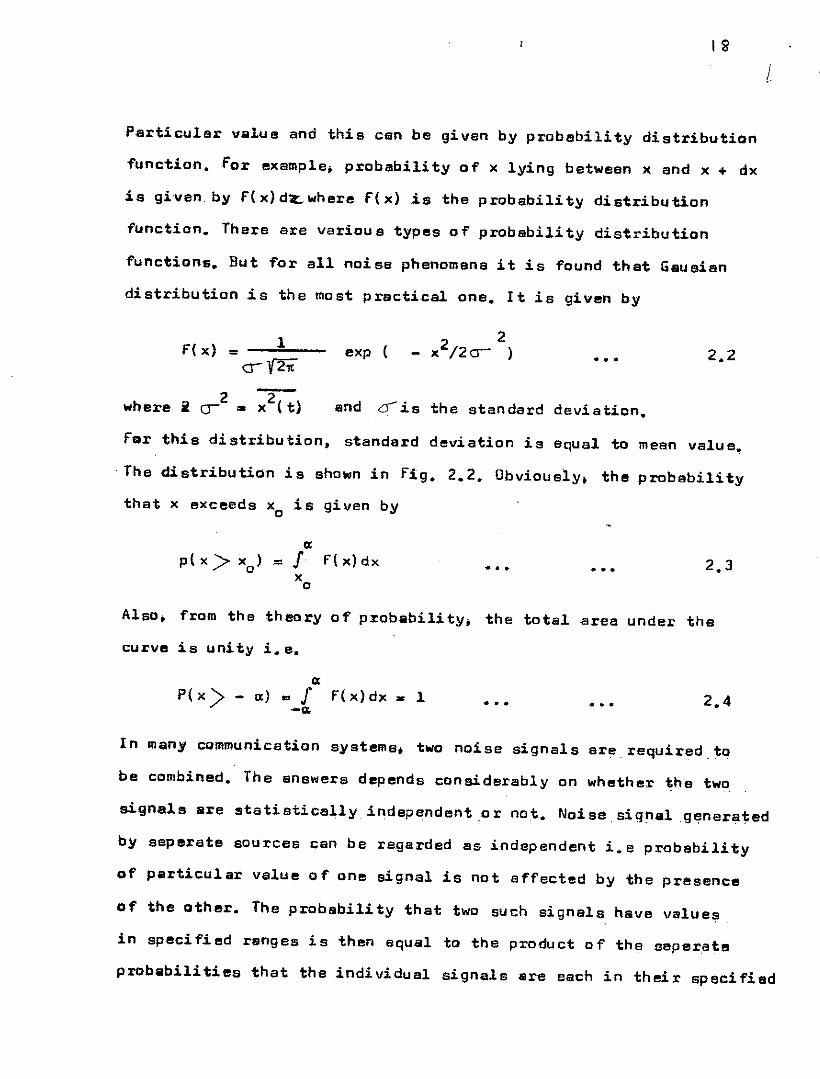
P.articular I1lalue and this can be given by probability distribution
function. ,for example; probability of x lying between x and x + dx
is given by f(x)di[.where fIx) is the probability distribution
function. There are various types of probability distribution
functions. But for all noise phenomsna it is found that Gausian
distribution is the most practical one. It is given by
1f( x) =cr "'{2it
exp ( •••
2 -r-where i CJ •• x (t) IIInd 6""is the standard deviation.
fQ.r this distribution, standard deviation is equal to mean value •
. The distribution is shown in fig. 2.2. Obviously; the probability
that x exceeds Xo is given by
ctpIx> xo) = r f(x)dx
Xo... ...
Also; from the theory of problability. the total area under the
curve is unity i. e.
ctP( x > - 0;) "' f f( x) dx • 1
-ct ... ...In lIIeny communication systems, two noise signals are. required. to
be combined. The answers depends considerably on whether the two
signals are statistically independent .01' not. Noise. signlalgenera1;ed
by seperate sources can be regarded as independent i.e probability
of particular value of one signal is not effected by the presence
of the other. The probsbility that two such signals have values
in specified ranges is then equal to the product of the seperate
probabilities that the individual signals lare each in their specified
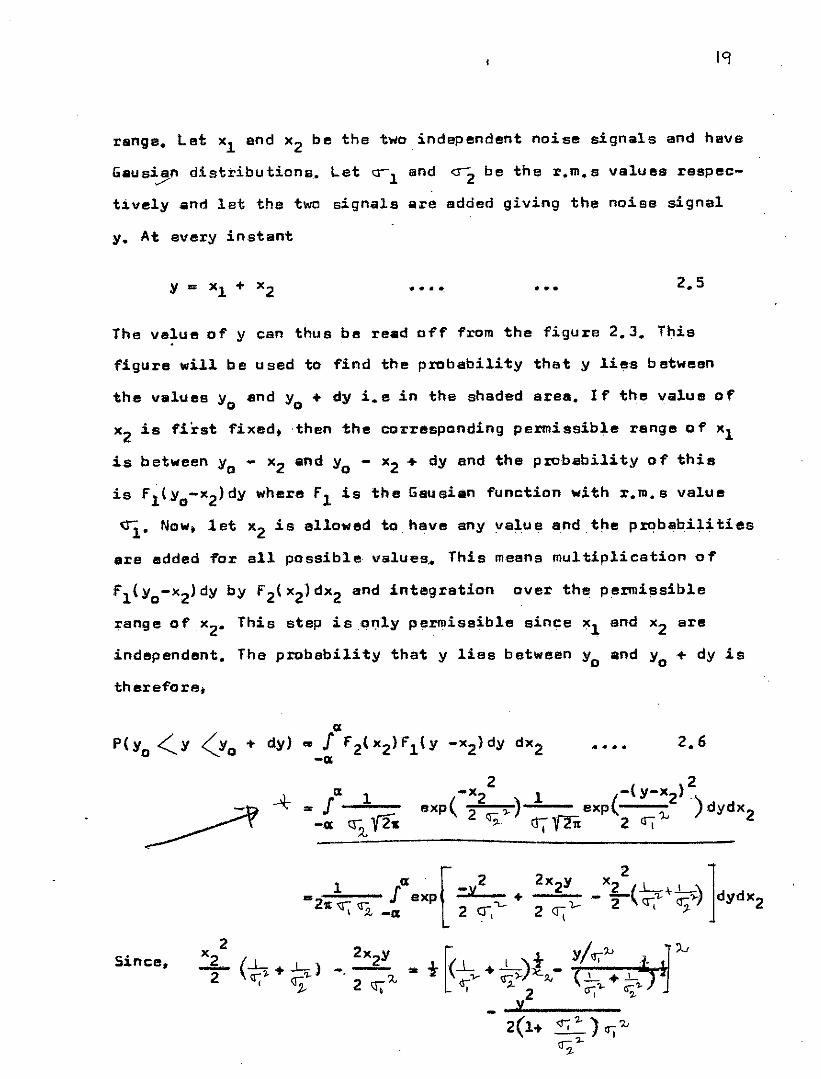
19
range. Lat x1 and x2 be the two1ndependent noise signals and have
Gausi~ distributions. let 0-1 and <12 be the r.m.s values respec-
tively and let the two signals are added giving the noise 8ign81
y. At every instant
..'. 2.5
The value of y can thus be read off from the figure 2.3. This
figure will be used to find the probability that y 1ies betwesn
the values Yo snd Yo + dy i.e in the shaded area. If the value of
x2 is first fixed. then the corresponding permissible range 0 f xl
is between Yo - x2 and Yo - x2 + dy and the probilbility of this
is f1(Yo-x2)dy where fl is the Gausi.n function with r.m.s value
Ui. Now, let x2 is allowed to heve any value and the probabilities
are added for all possible values,. This mesns multiplication of
fl(yo-X2)dy by f2(x2)dx2 and integration over the permissible
range of x2• This step iS0':11y permissible aince xl and x2 are
independent. The probability that y lies between Yo and Yo + dy is
therefore.
g:~ J f2(xZ}rl{y -xZ)dy dX2-Q;
•• <II • •
"" JI:1._.=l __
-Q; tr";z, '/'2-
Since,
3
Xl = yo - x2Xl=Yo-x2+dy
Xl
~.)Fig. 2,,.3/ Summation of two nOise s"gnals y :::,Xl +X2"/.
Il')tegrator w',lhtime constant 1.Noise
LPFr-y..--~
f (t)Multiplier
xf(t)f(t"t'l
!
designe ds"lgn al
Delay'(
to measure the
f (t'f )
autocorrelation function of a
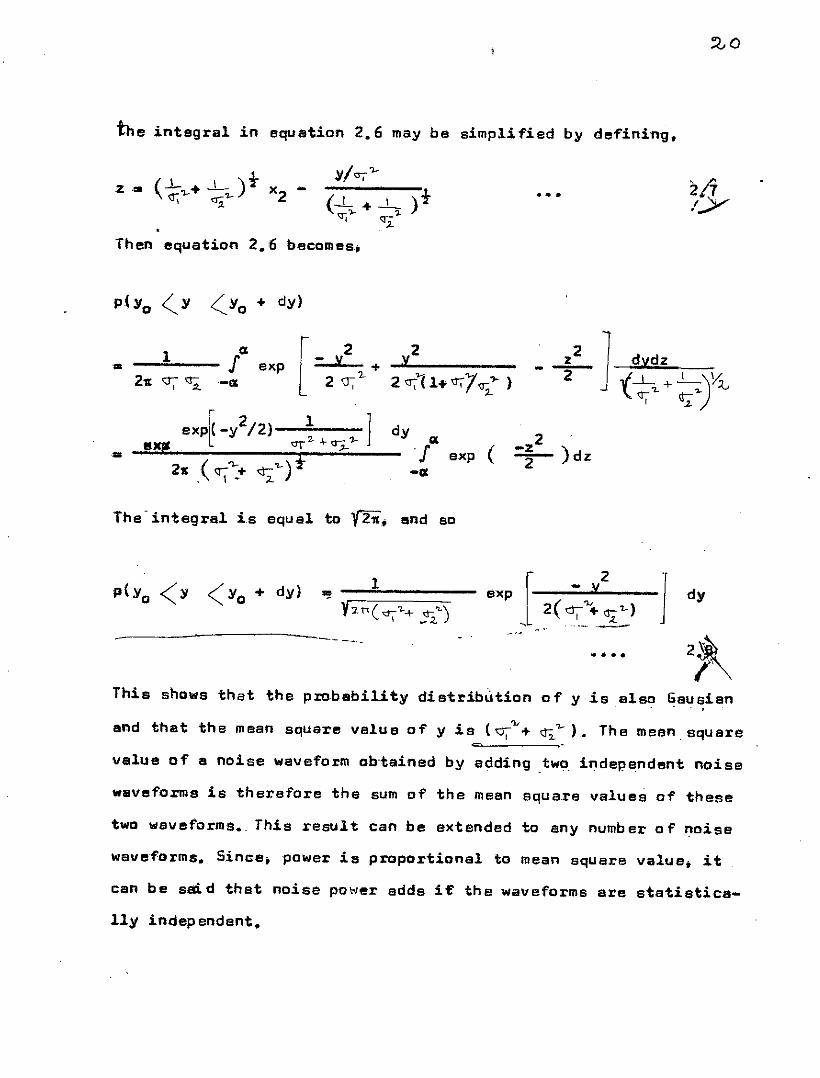
the integral in equation 2.6 may be simpIi fied by defining.
z .• .'. . 24.--l.."r
Then equation 2.6 becomes.;
p'(Yo (Y (Yo + dy)
exp~-i12} 1 J2. + 0-S!!, . t:lT ~
2lt (<r 'l-+ <:t":""l-)t. \. ;L
dydz,f-L + _I )Y:(.,\. q-:--"L Q":"'2.-
[ 2.
-+]2 .
-z )-z dzexp (lit
Jdy
y22 <r,'1l+ u-;7,,; )exp
aJ1•
The'integral is equal to V211..end so
p(y o <YO+dy)1
hn(".-"'+ <:t:"l-)[ _z----
••••
] dy
2)'~l\
This shows that the pmbsbility distribution of y is also Gausisn. .
and that the mean square value of y ie (",'" + <:Ii'-). The mesn square
value of s noise waveform ob.tained by addin9 two. independent noise
wllveforme is therefore the sum of the mean squa.re values of these
two waveforms •. Thisresul t can be extended to any number 0 f noise
waveforms. Since; power is proportional to mean square value. it
eEl" be said that noise power adds it' the waveforms are statisti.ca-
lly independent.
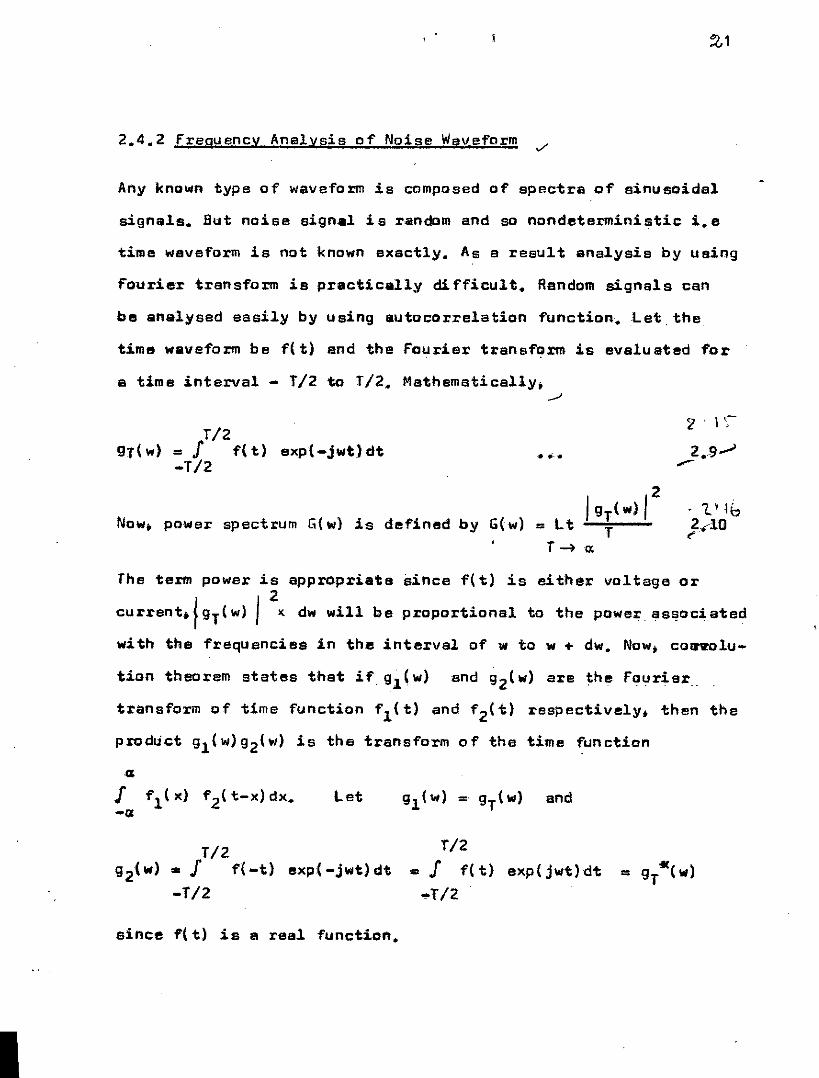
2.4.2 Fregu ency Analysis 0 f Noise Waveform
Any known type of waveform is composed of spectra of sinusoidal
signals. But noise signal is random and so nondeterministic i.e
time waveform ie not known exactly. As a result analysis by uein9
FotJri.er transform is p.ractically difficult. Random signals can
be analysed easily by USin9 autocorrelation function. Let . the
time waveform be f( t) and the fourier transform is evaluated for
e time interval - T/2 to T/2. Mathematically;./
T/29r(w) •• f fIt) expt-jwt)dt
-T/2.• fi..•
2I9r( loll ITNow. power spectrum G(loll is defined by G(w) = Lt
T ~a;
. 1.' 1{,2 10•....-
The term power is appropriate since 1'(t) is either voltage or
current.,t9r(w) 12l{ dw ",ill be proportional to the power aSf!oc:i,ated
with the frequencies in the interval of w to w + dw. Now; co~olu-
ticn theorem states that if gl(w) and 92(w) are the fourier.
transform of time function flIt) end f2(t) respectively. then the
product 91(w)92(w) is the transform of the time function
Let and
I
r/292( w) ••• f f( -t) exp( -jwt) dt
-T/2
since 1'(t) is a real functil:!ft.
T/2.. f f(tl exp(jwt)dt
-T/2
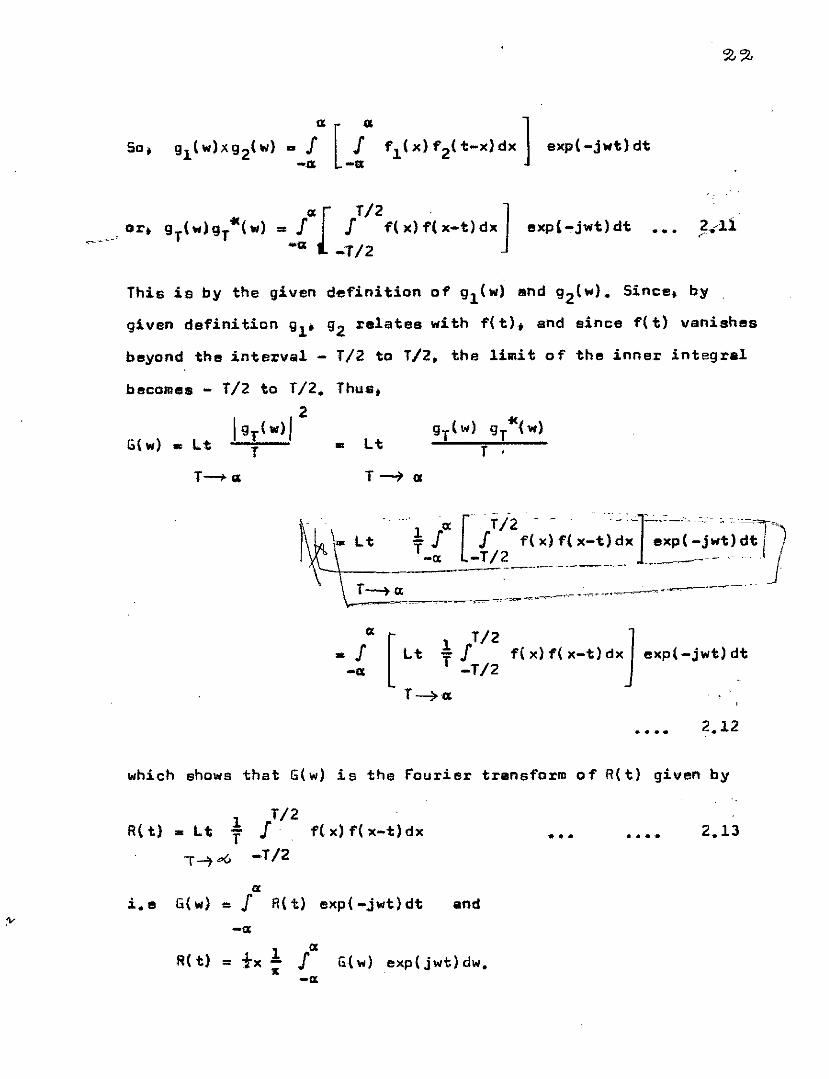
« IXI T/2 . J~ ' or. 9T("') 9T (",) •• f f. f( x) f( x-t) dx exp{-jwt) dt-0: ";T/2
•••
This is by the given definition of 91("') end 92{w). Since. by
9iven definition gl. g2 relates with f( t) .• and since f( t) vanishes
beyond the interval - T/2 to T/2, the limit of the inns.r integral
become. -
G(",) •• It
T/2 to T/2.2I9f( loll) I
T
Thus;
•• It
T-+ IX
'"It ~l ["/i2 f('X; f(X-t)~x-']- ~:;;-jw~)~~~11~')-IX -T12_ ... ._~__ ,_.. ..~~'- .' ... J---- .
~,.-~~~~~-..- ...,..,~~..--"~ ...,..,---_.-.
0: [ 1 fT/2•.f Lt--IX T -T/2
T ---;>u
f(X)f(X-t)dxj exp(-jwt)~t
,
•••• 2.12
which shows that G(w) is the Fourier transform of R(t) given by
R( t)1 T/2
•• It f f f(x)f(x-t)dx
"T~ "" -T12••• ..... 2.13
0:i.e G(loll) •• J R(t) exp( -jwt) dt lind
-0:
R(t) = fx:- fO: G(w)exp{jwt) dw.-IX
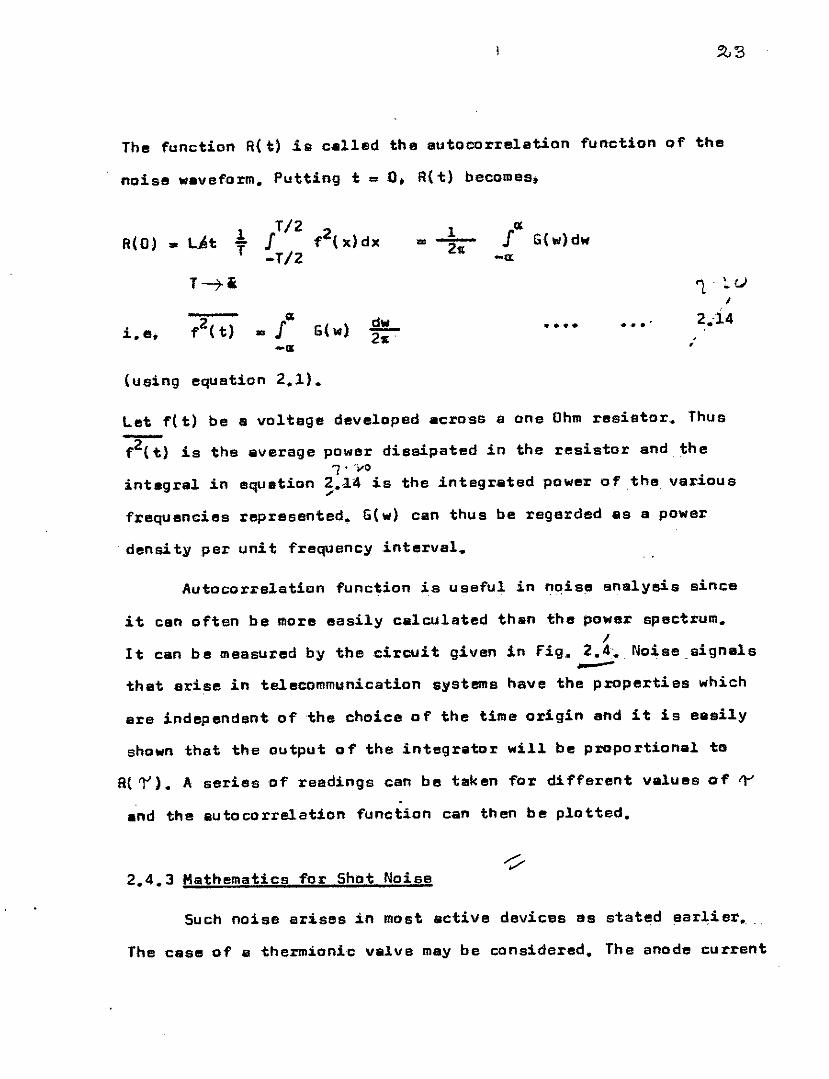
The function R{t) is called the autocorrelation function of the
noise waveform. Putting t = o. R{t) becomes.
R(O) • Lst
'l'1.UI
2.-14"
• ••••••
-u1
=2'U1 T/2T ~T/2
T-7i
i. a.
(u,sing equation 2.1).
integral in equation
be a voltage developed across a one Ohmresiator. Thuslet f( t)
f2( t) is the average power dissipated in the resistor and the1. ">'I)2.J.4 is the integrated power of the various, , ,
frequencies represented. G(w) can thus be regarded as a power
, density per unit frequency interval.
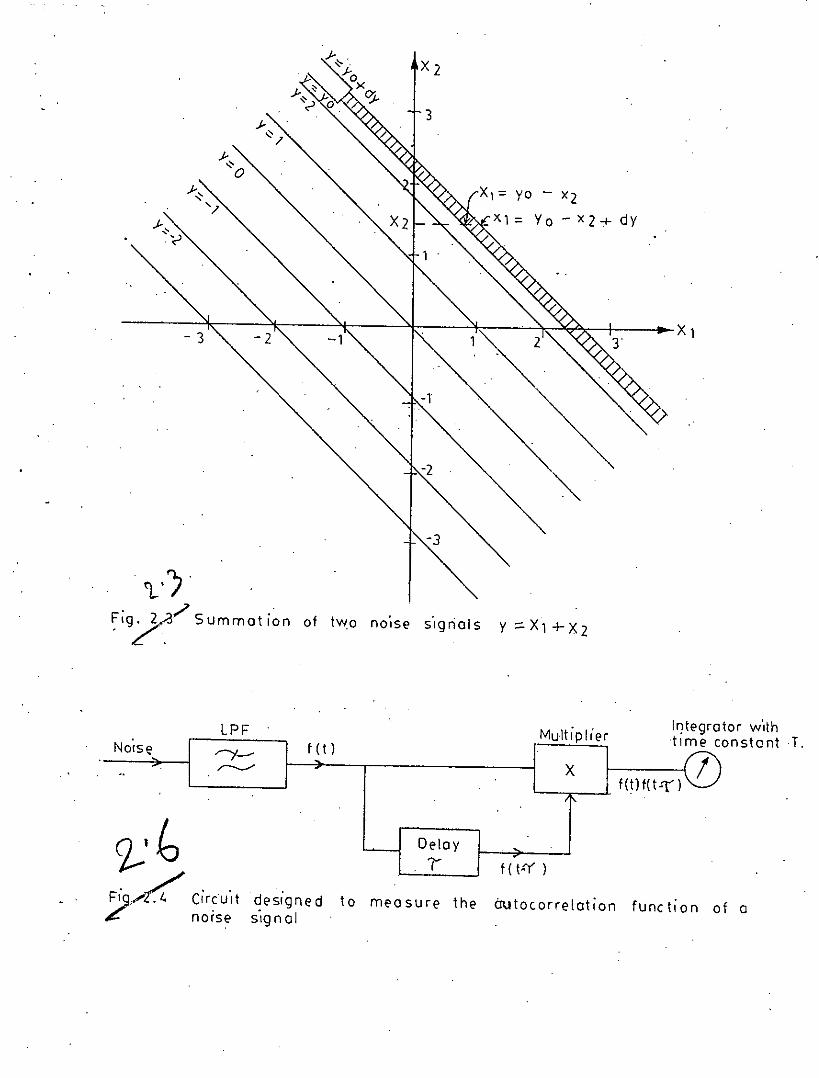
Autocorrelation function is useful in noise analysis since
it clln often be more easily calculated than the power spectrum.I
It can be measured by the circuit given in fig. 2.4'. Noiseelgnlllls-that arise in telecommunication systems have the properties which
are independent of the choice of the time origin and it is easily
shown that the output of the integrator will be proportional to
R('t'). A series of readings can be tak en for different valu es of It'
and the autocorrelation function can then be plotted.
2.4.3 Mathematics for Shot Noise
Such noise ar:isas in most active devices as stated earlier.,
The case of a thermionic villve may be considered. The anode current
cen be regarded as the sum of II succession of current pulses,
each pulse being caused by the transit of one electron from the
cathode to the anode. let anode potential is sufficiently lerge
to attract all the electrons to the anode. let an electron leaves
the cathode at time 't'. The current pulse can be written as i( t}.
This function i{ t} is zero if t .( 0 end i (t) also zero when.f t'
exceeds ~ , the time taken by the electron to txavel from the
cathode to the anode. The charge transferred by each electron is
the electronic charge fe' and so,
't"J i( t)dt =B
a••• • •• 2.15
11' the number of electrons emitted per second is N, the total
charge transferred per second is Ne and so the dTc anode current
is given by
••• ••• 2.16
The electrons are emitted at random instants and so statistical
results may be used. Thus mean square values can.ba added. This
is permissible since any individual electron is not effected by
the others, sa the individual current pulses are independent in
the statistical sense, A simplification is mede by assuming that
transit time 1" is negligibly short. This means i(t) can be
represented by en impulse function of strength given by •et• So.
itt) •• e~(t) ..-.The frequency spectrum of the single pulse i(t-tn} which occurs
at time tn is given by.•
2.19
2.18
..'.
••••• •
NTG(w) = It
T~II
/2= e2
The magnitude Ign""') I is independe~t of the time at which the
pulse occurs. The value of /gn(W) I for NT pulses ;hich occur
in 1!I period T is given by adding the values Ign(w)/ for the
individual pulses and the power spectrum G{w) is therefore,2
This po.•er spectrum iethe value of the mean square current
associated with a bandwidth of 1Hz. centered on the angular fre-
quency w. Tha spectrum is defined f~r both positive and negative
frequencies and there ere equal contributions fmm the bands.
centered en +w end - w. These two centributions are usually added
together and the result is expressed in the form
"2i ,,",2eI dfD .... I. _.. 2.20
which is equivelent to saying that the mean squere current in
the frequency f' and f' + df is 2eI df. This farmula is often knownoas shottky formula. from above equation, it is clear that mean
.squarecurrent is independent of frequency. Such noisl! isca.1.1ed
white noise. This independence of frequency only holds strictly
when transit tim,e is assumed negligibly short. In practice, above
relation is valid for frequencies appreciably less than the
reciprocal of the transit time.the relation derived depends an the
assumption that individual pulses are statisticelly independent.
This is justified for temperature limited region. But most valltes
.operl!lte under space charge limited region. Here current by one
electron is not statistically independent on other electron and
analysis is to be modified. It cen be shown that (detailed analysis
is given in the references) the space charge produces a smoothing
effect on tha random fluctuations and so the rms shot noise current
is smaller. This is accounted for by using a factor k where
with
i 2. 2ek2iodf .... • ••
Shot noise also arises in semiconductor devices due to the
rsndom fluctuations '0 f electrons and holes flow. However, their
exact nature snd evaluation is more complicated and still not clearly
understood. Still. some .expression for shot noi se
will be given in Chapter-3. The basic equation i2
in semiconductors
=0 2eI df will"0
be used as it will also be <appliceble for the case of semiconductor.
2.4.4 Thermal Noise
The random motion of each electron correspo'nds .to a .cu~ren'\;..
""ithin the resistor and summation 0 'f the effects 0 f 1311 the electrons.
making allowance for the statisticel distribution of the .velocities.
gives the followin9 expression for the mean aquare currant:
-i 2 •• 4kTGdf .-.. '... 2.22
wherek is the Bolt' zmen constsnt •• 1.37xlO-23 .Joules/Ok.
T •• absolute temperature (ok)
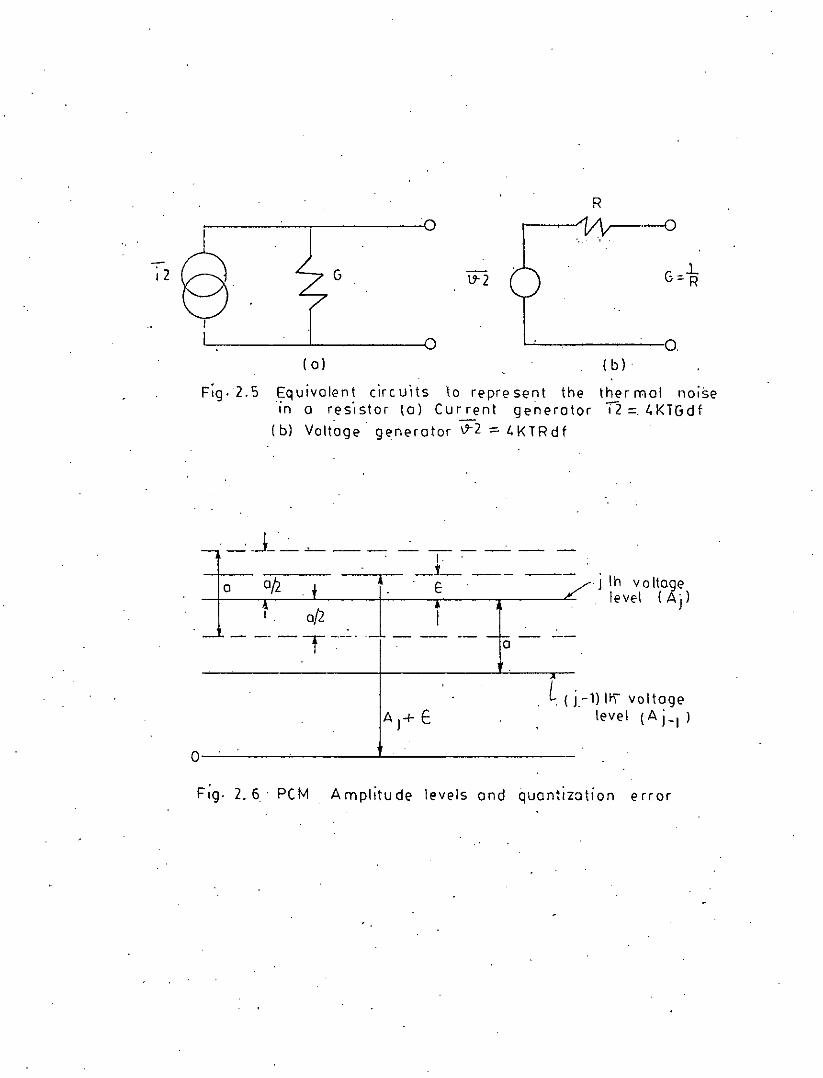
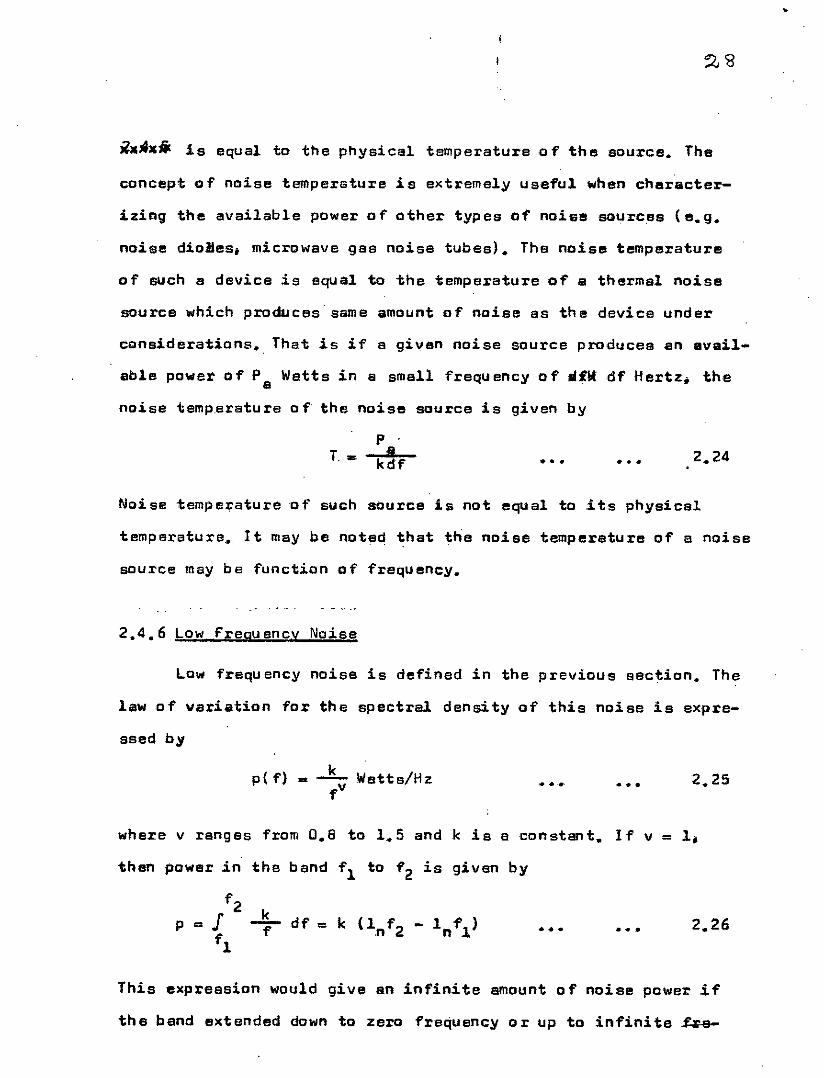
G is the conductance of the resistor, By using Thevenin's theorem.
equivalent circuit for the thermal noise becomes ae shown in
fig, 2,5. The instanteneous voltage across the resistor is
v •• Ri, if 'i' is the instanteneous current delivered by the
current generator, Squarring ~nd everaging gives
..• '. •••
fJ:om the equation of ~ and i 2 • it is seen that thermal noise i-:lwhits that is independent of frequency, It is strictly true only
for frequencies. at which quantum effects can be neglected, Quan-
tum effedts can in generel be neglected!n the frequency range
conElidered in communication stu dies, thel'lnly signi fi csnt exception
being the use of mt!aser amplifiers. The above thermal noise expre-
ssion applies to any kind of resistor. including radiation resis-
tance 0 f an aerial. In the cese 0 f an aerial. the temperature is
that of the body at which the eeri.lis pointing i. e the body on
which radiation from the aerial would fall. For many communication
iz aerilills; most of the radiation from the aerial is ultimately
indicent on the earth-' s surface and so th.e temperature of the
earth's surface (3000k) ia used.
2.4.5 Noise Temperature
Since the available noiss power of a thermal noise source
is directly proportional to the absolute temperature "of the source.
it is said that the noise source has !II noise temperature indegre~s
Kelvin. In the case of a thermal noise source, the noise temperature
R
i 2
( a)
G
o
\7-2
( b)o
Equivalent eire uits to repre sent the ther mal noisein a res',stor{a) Cur.-':..ent generator T2 =. I,KTGdf
(b) Voltage generator 17-2 ::0 I, KTRd f
---------I-j- --- ---
€
a
j Ih voltagelevel (A')
L (j-1) n..- voltagelevel (A j-I )
o
Fig. 2.6' PCM Amplitude levels and quantization error
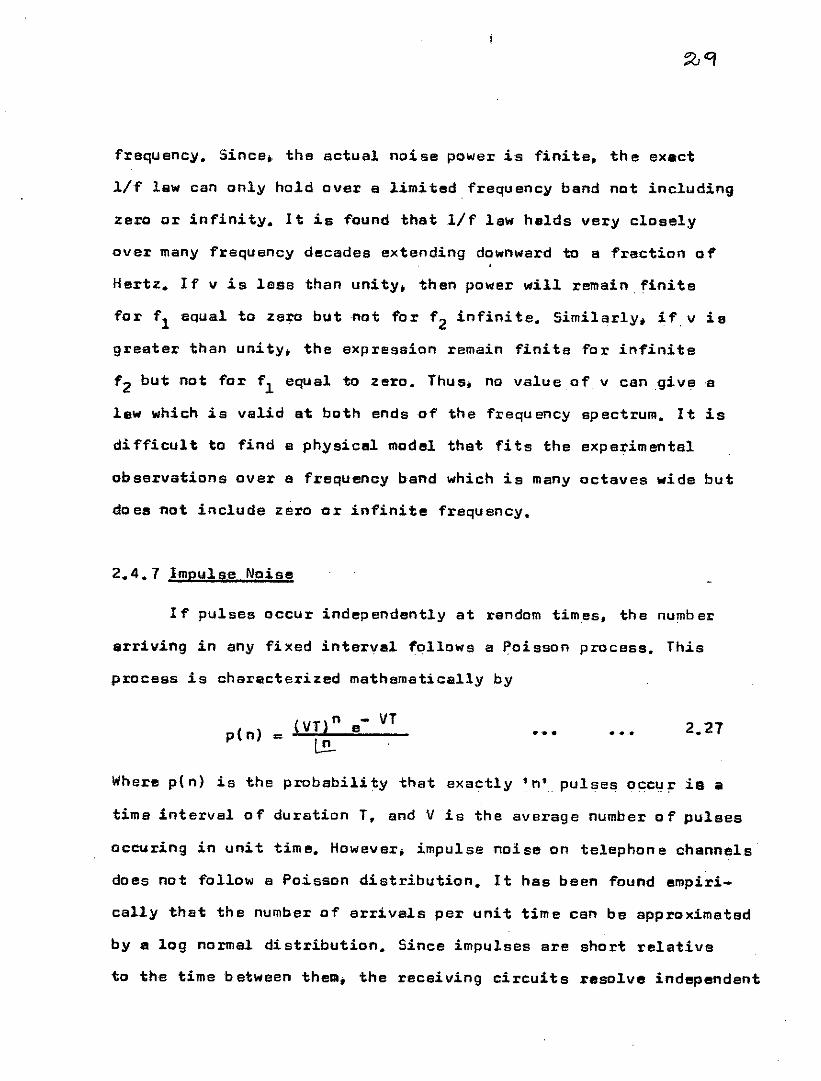
illC:4lC/ir. is equal to the physical temperature of the source. The
concept of noise temperature is extremely useful when character-
izing the available power of other types of noisa sQurc.es (B. g.
noise dioBes; microwave gas noise tubes). The noise temperature
of such a device is equal to 1:he temperature of a thermal noise
source which produces. same amount of noise as the device under
considerations. That is if s given noise sourc.e produces en 8vail.
eble power of Pe Watts in a small frequency of .flit df Hertz. the
noise temperature of the noise source is given by
•
T. '"
p.a
kdf • • • •••
Noise temperature of such source is not equal to its physical
temperature. It may be noted that the noiee temperature of a noise
source may be function of frequency.
2.4.6 Low frequency Noise
Low frequency noise is defined in the previous section. The
law of variation for the spectral density of this noise is expre-
ssed by
p (f) •• Watts/Hz ..-. ...where v ranges from 0.6 to 1.5 and k is a constant. If v •• I,
then power in the band fl to f2 is given by
f2P •• J ~ df •• k (l,nf2 - 1nf1)
f1••• • ••
This expreasion would give an infinite amount of noise power if
the band extended down to zero frequency or up to infinite ~
frequency. Since. the ectual noise power is finite, the exact
Ilf law can only hold over a limited. frequency band not including
zero or infinity. It is found that Ilf law helds very closely
over many f.requency decades extending downward to a fraction of
Hertz. If v is less than unity. then power will remain. finite
for 1'1 equa.l to zero but not for 1'2 infinite. Similarly. if v is
greater than unity. the expression remain finite for infinite
1'2 but not for fl equal to zero. Thus. no value of v can give a
lllw which is valid at both ends of the frequ ency apectrum. I t is
difficult to find e physical model that fits the exparimental
observations over a frequency band which is many octaves wide but
do ea not include zero or infinite frequency.
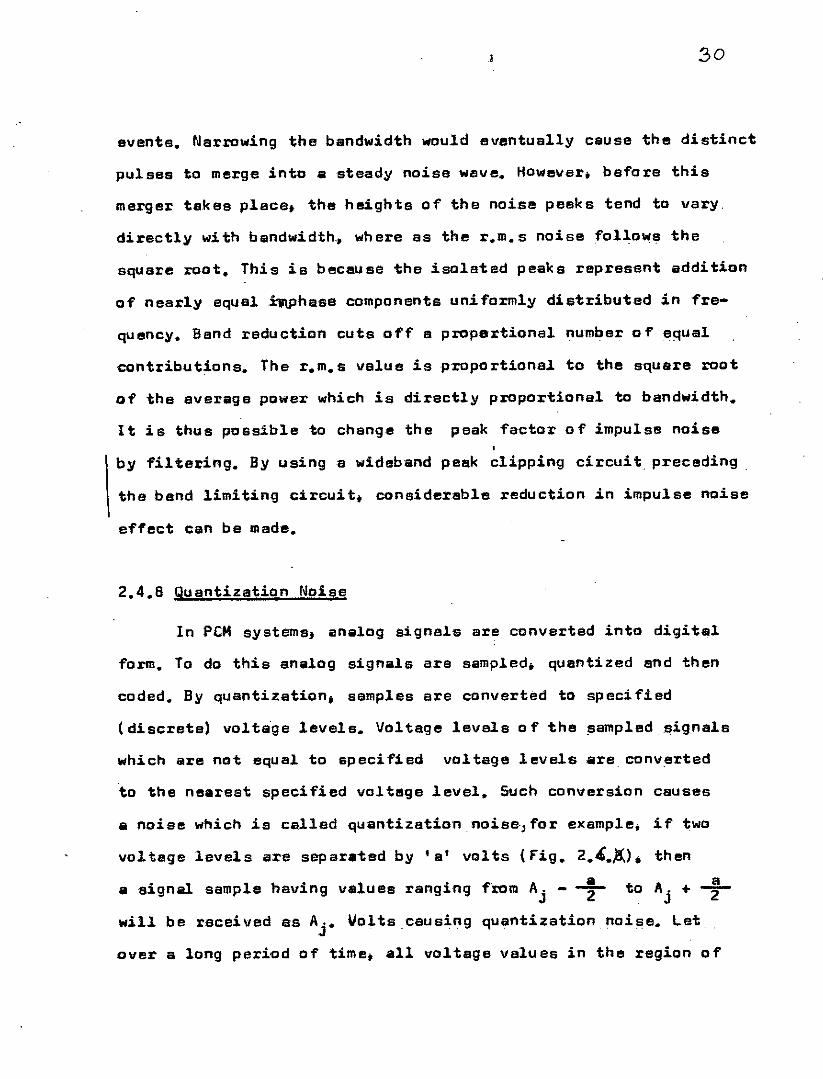
2.4.7 Impulse Noise
If pulses occur independently at random times, the number
arriving in any fixed interval follows a Poisson process. This
procass is characterized mathematically by
p( n) = (VT) n e
t!!.-VT .'.. .'. ,. 2.27
Where p( 0) is the probabili ty that exactly •n' pulses occu l' is 1iI
time interval of duration T, and V is the average number of pulses
occu.ring in unit tim e. However; impulse noi se on telephone channel.s
does not follow a Poisson distribution. It has been found empiri-
cally that the number of arrivals per unit time can be approximeted
by e log normal distribution. Since impulses ere ahort relative
to the time between them, the receiving circuits resolve independent
30
events. Narrowing the bandwidth would eventually cause the distinct
pulses to merge into a steady noise weve. However. bsfore this
merger takes pIece. the heJ.ghta of the noise peaks tend to vary.
directly with bandwidth. where as the r.m.s noise follows the
square root. This is because the isolated peaks represent addition
of nearly equal .i1\phase components uni formly distributed in fre-
quency. Band reduction cuts off a proportional number of equal
contributions. The r.m.s value is proportional to the a'quare root
of the average power which is directly proportional to bandwidth.
It is thus poasible to change the peak factor of impulse noise
\
by filtering. By using a wideband peak clipping circuit preceding
the band limiting circuit. conaiderable reduction .in impulse noise
effect can be made.
2.4.6 Quantization Noise
In PC" systems; analog signals are converted into digital
form. To do this analog signals are sampled. quantized and then
coded. By quantization; samples are converted to specified
(discrete) voltage levels. Voltage levels 0 l' the sampledsignals
which are not equal to specified voltage levels are converted
to the nearest specified voltage level. Such conversion causes
a noise which is called quantization. noise, for example. if two
ato "j + -r
voltage levels are separated by 'a' volts (Fig. 2.4.)().
a signal sample having values ranging from Aj - ~
then
will be received as Aj• Volts causing quantization.noise. Let
over a long period of time. all 1101tage values in the region of
31
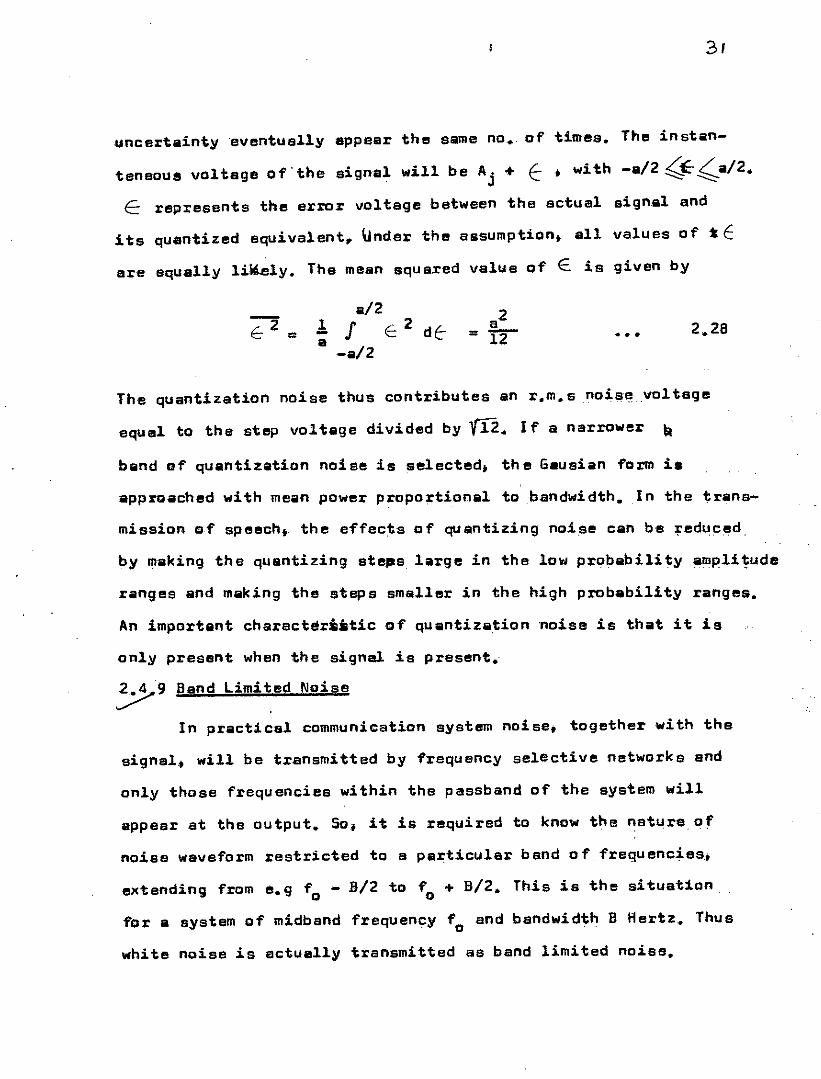
uncertainty 'eventually appear the same no. of times. The instan-
teneous voltage of'the sign81 will be Aj -+ E:-. with -a/2 ~£~a/2.
E represents the error voltage between the actual signal and
its quantized equivalent, \..Inder the assumption. all values 0 f t Eare equally lii'.ely, The mean squared velue of E is given by
a/2.! J E: 2 dE-e-a/2
,,,
The quantization noise thus contributes an r.m. s noisEl.vol tage
aque! to the step voltage divided by '{12. If a narrower "
bend of quentization noise is selected. the G.usian form i.
approached with mean power proportional to bandwidth. In the trens-
mission o.f speech. the effects of quantizing noise can be reduced
by making the quantizing steps large in the low probability ampli~ude
ranges and making the steps smaller in the high probability ranges,
An important charecter':iltic of quantizlition noise is that it is
only present when the signal is present.
~9 Band Limited Noise
In practical communication system noise, together with the
eignal, will be transmitted by frequency selective networks and
only those frequencies within the passband of the system will
lippearat the output. So, it is required to know the nature of
noise waveform restricted to a particular band of freguencies~
extending from e.9 f - 11/2 to f + B/2. This is the situationa 0
for e system of midband frequency fa and bandwidth B Hertz, Thus
white noise is actually transmitted as band limited noise.
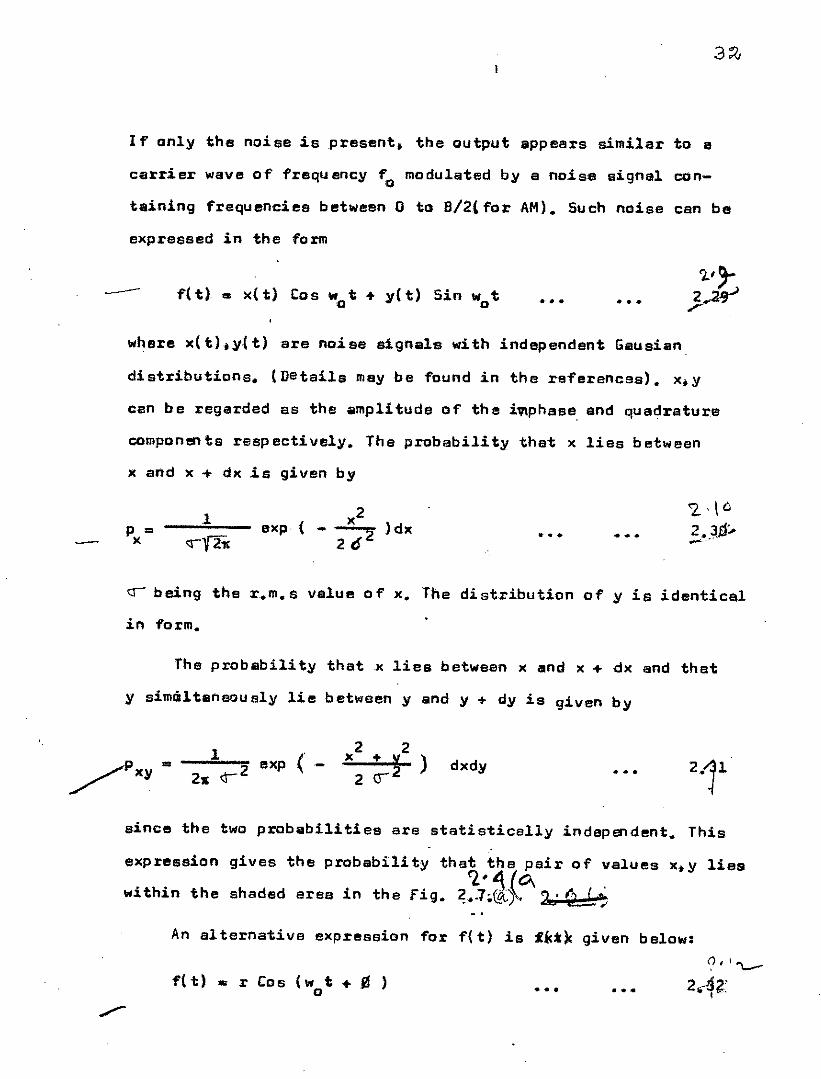
If only the noise is present. the output appears similar to 8
carrier wave of' frequency fa modulated by a noise signal con-
taining frequeneies between 0 to B/2( for AM)• Such noise can be
expressed in the form
- .•. .•. •••
where x(t) .•y{t) are noise signals with independent Gausian
distributions. (Details may be found in the references). x.y
can be regarded as the amplitude of the i~phese. and quadrature
components respectively. The probability that x lies between
x and x .•. dx is given by
p =, x exp ( - )dx .'... '.... '2...\02. 3..ti~~_.-
cr being the r.m. s value of x. The distribution of y is identical
in form.
The probability that x lies between x and x + dx and thet
y simmltaneously lie between y and y + dy is given by
1 2 exp (-2,& <r2x ) dxdy • • •
since the two probabilities are statistically independent. This
expression gives the probability that the pair of values x.y lies
within the shaded erea in the fig. ~:;;,~~o..5L' Q.16
An alternativa expression for f(t) is fkt~given below:
f( t) •• r Cos (w t + .f1 )o ••• • ••
/ y
y
x xx
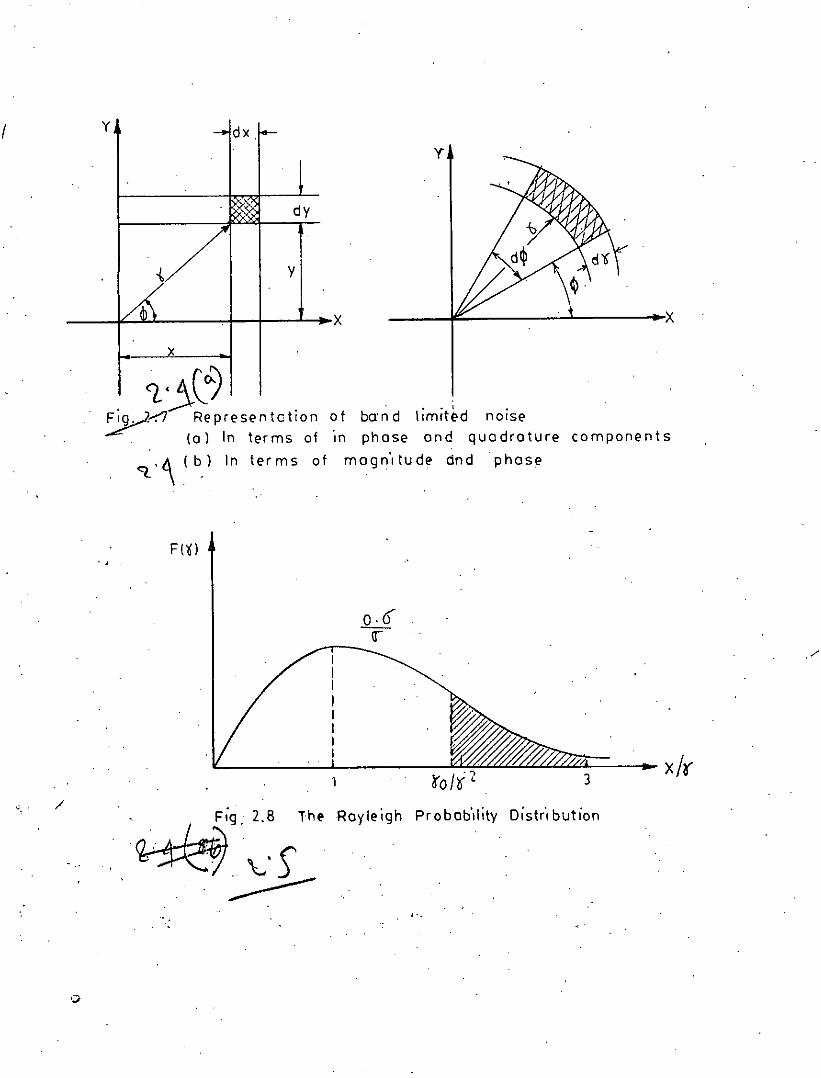
,~~rj. ..'~/,'l Representation of bo'n d limIted nOise
, (0) In terms of 'In phose and quadrature components
"t'~ (b) In terms of mogn'ltude and phose
F(~), ,
3 x/ro ' /
,;}
Royle igh Probob'Jlity Oistr'l bution
",
33
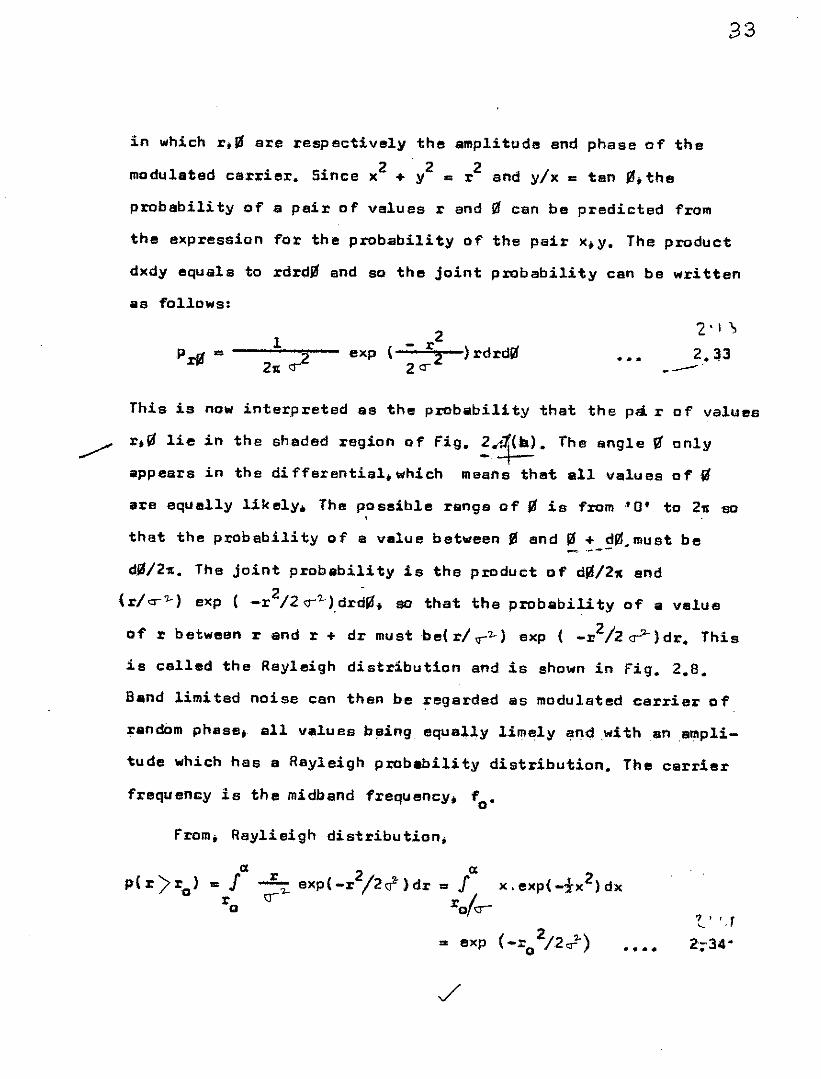
in which r.16 are respectively the amplitude and phase of the
modulated carrier. Since x2 + y2 = r2 and y/x = tan ~.the
probabili ty of a peir 0 f values rand fIIcan be predicted from
the expression for the probability of the pair x.y. The product
dxdy equals to rdrdlif and so the joint probability can be written
as follows:
prli!' =1
21t cr2 exp ( ) rdrdJ6 •••
This is now interpreted ss the probability that the pa. r of values
~ r.1it lie in the shaded region of fig. :1(11). The angle fIIonly
appears in the differential. which meana that all values of' .f1
are equlllly likely. The possible ranga of 16 is from '0' to 21t so
that the probability of a value between J6 end 16+ dl1J.must be-- ...--
of r between rand r + dr must
the product 0 f dlif/21tand
that tha probability of a value
bet 1'/ ,,2..) exp ( _112/2 cr7-) dr. This
joint probability is2 -
( -r /2 cr'l- )drdiiJ. so
dS/21t. The
(r/ cr'l-) exp
is celled the Rayleigh distribution and is shown in fig. 2.8.
Band limited noise can then be regarded as modulated carrier of
random phese •. all values baing equally limely and .withan empli-
tude which has a Rayleigh p:robability distribution. The carrier
frequency is the midband frequency. 1'0'
From. Raylieigh distribution,
..,..
0: 2= J x,exp(-tx )dxrofer
>2 exp (-ro2/2,J-) 2;34'
The amplitude must be positive and so it ieaxpectisd that
p (r> 0) is to be equal to unity. This is confirmed by the'Ll ttl
equation for p(r /" ro). (-1..<-. ~.:t,. 3"1).
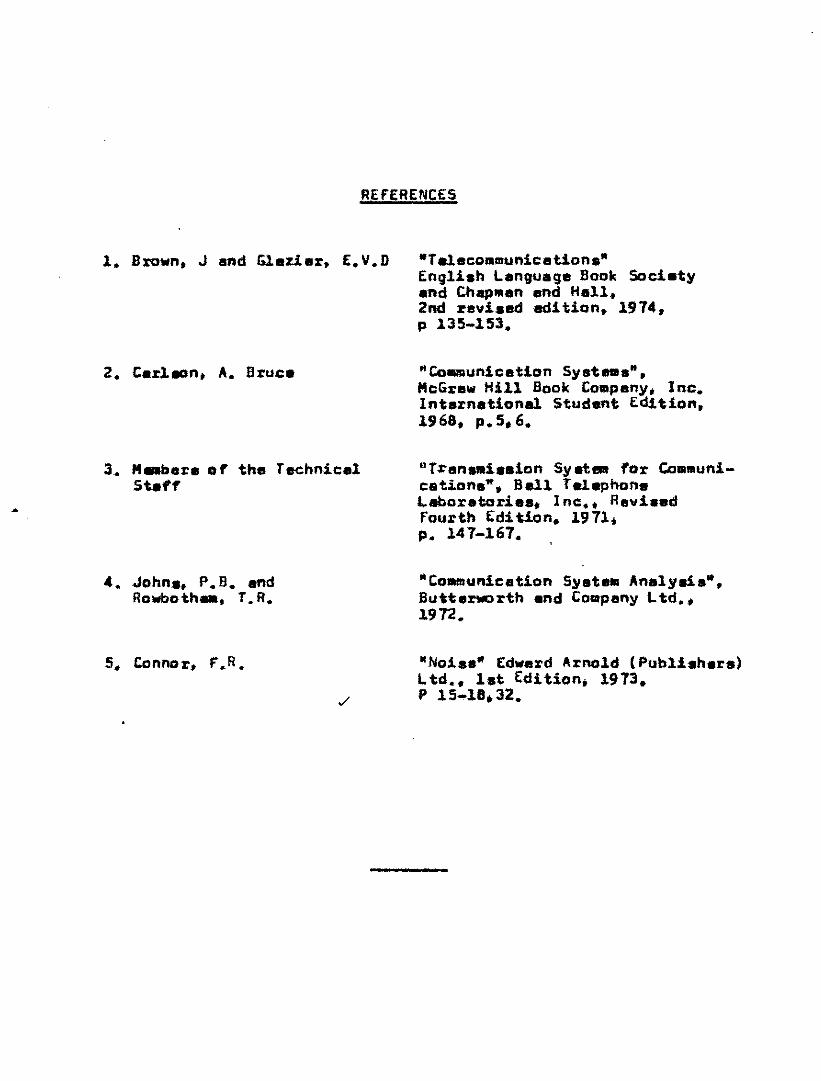
REF"£RENCES
1. Brown. J and GlazLer. E.V.D
3. HMcbere of the TechniealStaff
4. 40hns. P.B. endRowboth_. T.R.
-Taleco.munication••Engli.h Language Book Societyend Cheplllan end Hall.2nd revised edition •. 1974,p 135-153.
"Co~unlcatiDn Systems".McGrew Hill Book Compeny. Inc.Intarnational Student Edition.1968. p.5.6.
"rren_i •• ion Syatt!lllfor Co•••unl-cat.i.on•••• Bell TelsphoneL~oratorie •• Inc•• Revi.edfourth Edition. 1971.p. 147-167.
"COlMlunicetion Syets. Anelyais•••Butterworth end Company Ltd ••1972.
"Noiss. Edward Arnold (Publishers)Ltd•• l.t Edition. 1973.p 15-18.32.

:; ..,.
CHAf'TER-3. - - .
..
. ... ,..
.. ,,/ .~ -~' .
35
,In this chapts%:discus.ion will be Illade about noie. in
Yl 0 ~ t:"-_?~"'''C-L<''-<'netwo.rks and devices. ooiss figure and it ••Pe••"rreAt. A discu-
"ion .bout nolse in AM.PMand fM .ystem. will .lso be preaented.
In the previous chapter, it", •• shown th.t differant types
of noi••• are present in .11 sort. ,of devicas (.cUv.or pa•• ive).
e. g. in an ltctive device like transistor theJ11!lare ttl erMal noi liB.
short noise and pertitiannoisfl. A resistor has tihermal ooie8.
Since, networks are compo.ad of' active lind pesl!liva devices, it is
claar th.t they .1so produce various types .of noises. Obviously,
the total noi •• produced by • network will be different for differentnetwork•• Hem::,. the topic is lengtht. So, only II typical two port
network w111be dealt hera. Analysis for particular 'type of ne'tworka
will be found in ref'erences.
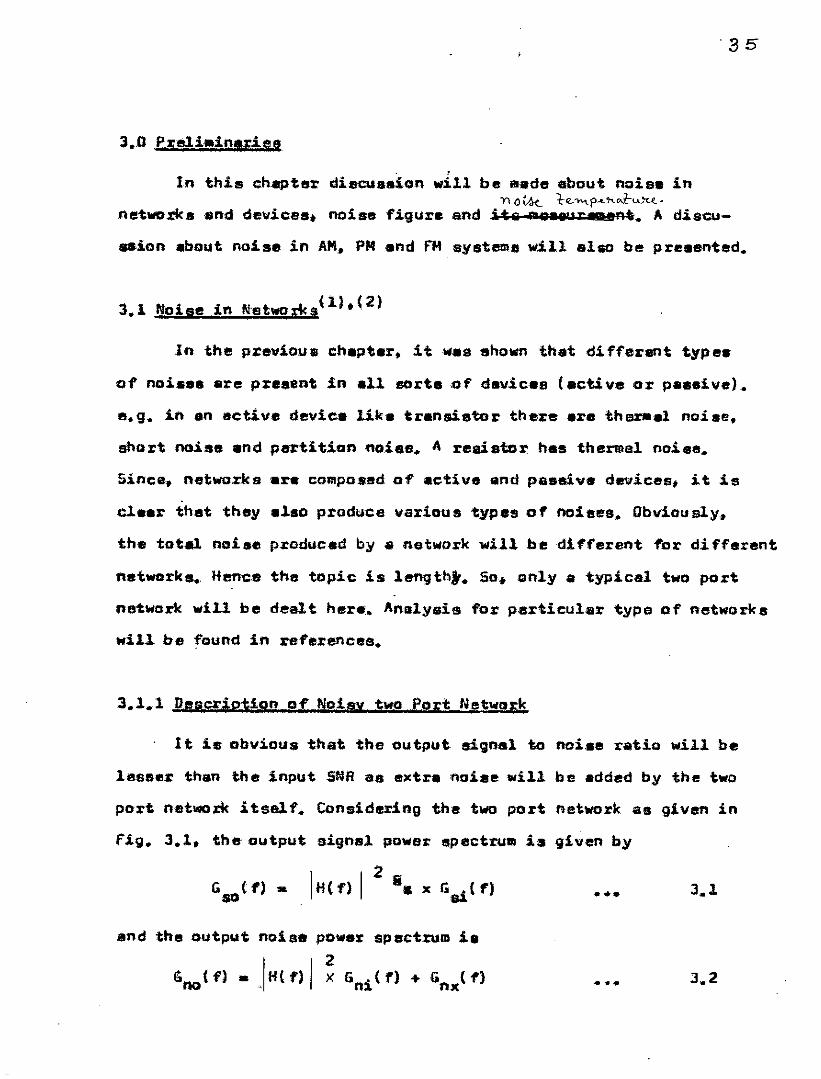
3.1.1 Descriptipn of Noisy two Port t~etw!!&k
It ls obvious that the output signal toooi •• ratio wi1.1be
lesesr than the input SNRaa extra noise ",ill be added by 'the two
port netwoxk itself. Considering the two port network .us given in
fig. 3.1. the output signal power epectrum i. given by
11i( f) I 2Ii.G$D( f) • xusi(fl ••• 3.1
and the outplolt noiae power spectrum i.
Gna(f) • JH(fl/ ~ Gni(r) + unx(f} •••
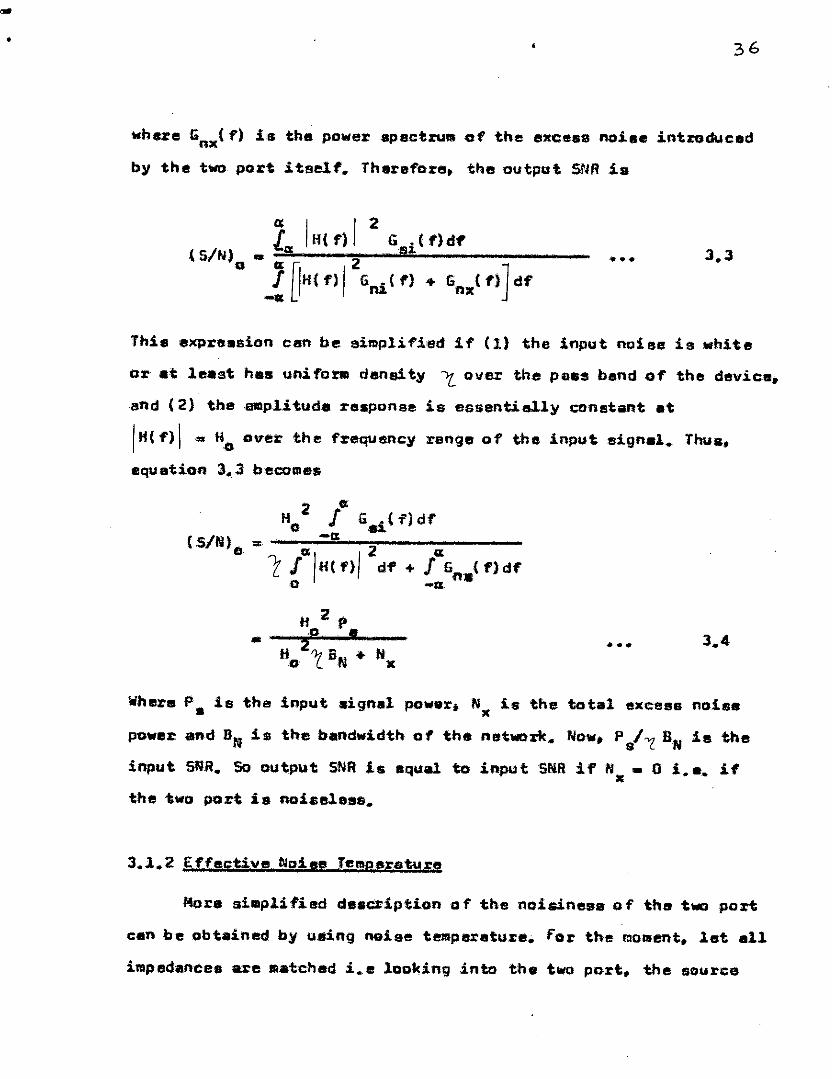
• • 36
whue 'nx( f) i,5 the power apect:rulll .of ~he excess noi.e intzoduced
by the tllm port itself. Therefore. the output SNRi.
••• .3.3
Thi. expression een be simplified if (1) the input nolee ie white
er at least ha. unifoJ:lll density 'L over the peas bend .of the device.
and (2) the aIllp.lituderesponse is essentially constant at
IH('F)I •• He curer the frequency range of the input signal. ThUll.
equation 3.3 becomes
. "02/« Gst(f)df(SiN) = -.-- ..--•..••"--...-------
o 1/'/H(f)/2df + lbn.(f)df',0 -tJ,
•H 2 P,p- - •
H 2", B.N + Ito L 11:
• •• 3.4
Wherep. 1s the input signal power. Nx is the total exeess noiea
power and DNis the b.ndwidtb of the net_:rk .• Now. Ps/oz Bft ie the
inpu.t SNR. So output StiR is equal to inputSNR if Pix _ 0 i.a. if'
the two port i. noiseless.
3.1.2 (f'festive Noi,! Telllpereture
More sillplitied de8cd.ptionof the noisin!!l!I. of thll t_ port
can be obtained by 1I.8ing noise t!!lllpereture. for the moment. let all
impedanees are lllatehed i.e looking into tha two pori:. tile source
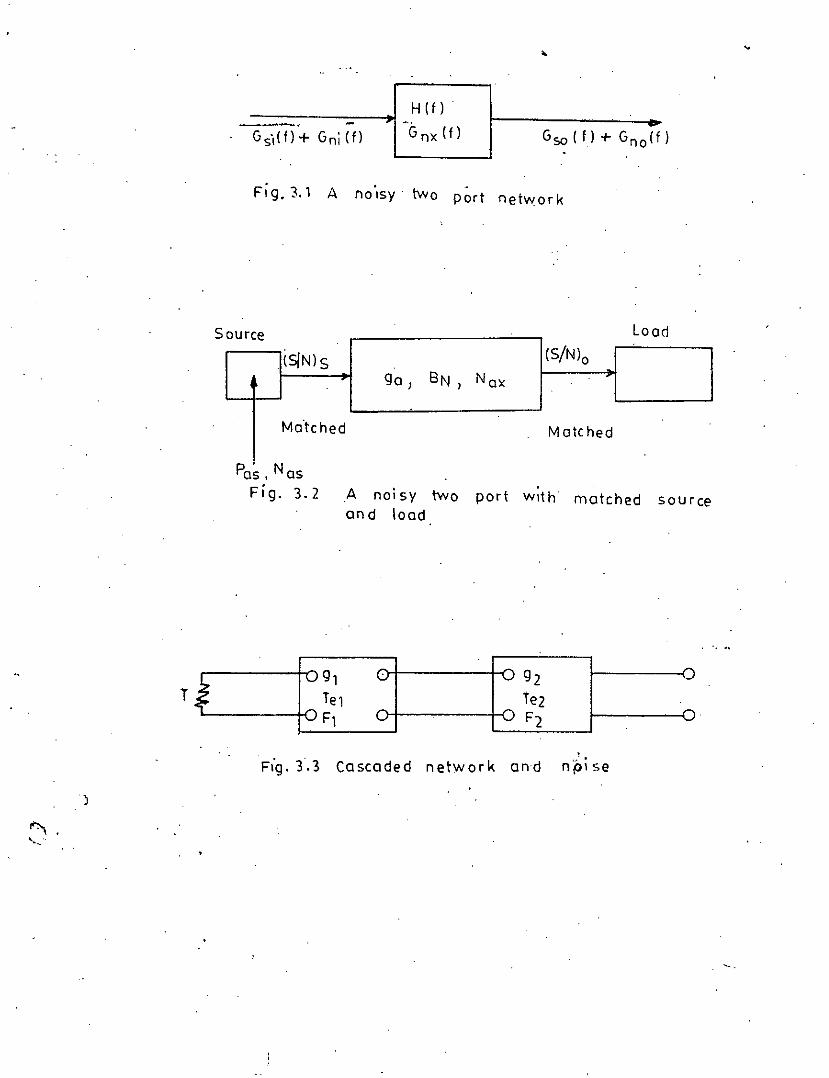
••
H (f 1 ."(j nx (f)
Fig,3.1 A no ISY . two -port network
Loadource
tS/NlS (SjNlo
Iga) 8N) Nax
Matched Matched
5
Pas, NasFig. 3.2 A noisy two port With matched source
and load
T~ ~:i' d bt~ :...- .
FIg, 3,3 Cascaded network and np,se
)
.••••• >
/
sees a mlltchedimpedancaand the output of the two port ,sass.. (fig43.~).
metched loadJ The source then delivers its llVeilable slgnel power
p .s:~ ilftd the output ,eignel poweris
P=gPao .& II. '•.• 4-
where 9. is the power gainot the port. SiD1ilarly~ the output
noi.88 power ,is
N •• 9 N +Neo 'a as ex .'.. 3.6
tIlax being available 'excess noise power at the output. If. the input
noise is white and represented by a noise tSlIIperature Te'. then .•
Nas" kTs~N is the equivalent ,source noiee in the equivalent band-
lIiidth U'4. rhen~
(!i/~)op_ . eoNao
praking. (S/N)s" SNR at ,input •• f4l!S _
.a. teqn. 3.7 becomes
..s: ( S/tJ)" e •••
It waa noted before
noiseless; but tramthat (S/N)o'.- (SIN) . onlyllolhen two-port i.
• •the equation 3.8 it is seenthet the output
!iNR Ciln be nseJ'ly equal 'to the input SI"lA. despite e)(cass noise~
pmvided that Nax 0ekTsTlN. i.e the value of the excess noise is
not the lIlain factor. rather it8valucsrelative to source noise is
.lroportent. Now. the
of the two-port and
te3:11N . /{I kilN dllpenda' only on the parameteJ'S1Ix".has the dimension of temperature., This quantity
32
is ealled effective :input temperature (also _lled amplifier
ttllllper.eture) end is denoted by Te. Thus;
" ..Hence. ra :is th e lIleasure of noi..en •• s of. the netwluk referred to
the input. 1f the device is noiseless; then Te •• O. Using Te
equ.etian 3.8 becOllleS
( SiN) s1+ T"lT II
••9 Pa as
9 kIT +T lBN• so•• 3.10
Thus, under ,matched condition. the output noise power is given by
and OUtput noise telltpsrature is
•••
....,.
.'.'.
•••
What will be the case if the 1mpedance. 81'e not ••etehed '1
In th.t case all powers will be less than available powers, beingreduced by a fIIi_eteh factor. Still. the above equations ax:e valid
as miemitch fector cancels out since powsr ratios ereconeidered.
3.1.3 Not.ss figUre
The .ffective input noise teMperature io Illost useful in
describi.nglow noise 8lllpli tiers, devices withT e <t:T8" But when
excess noise is large, noiee figure f proves more convenient.
Noip figure ie defined •• the actual output noi.8 power di'vided
b)' the output noi.s. POW8Z if the t.wo-port wllre noi •• less. lh.
source being at roolll tlllllperature To' Thus.
••• 3.13
PUtting the value of' T. f becomes ••
•••
•••
EvidenU)'. f'). 1; r ••1 when two-port is noiseles8 ,and r >.1when two-port has sa=e nols8. Now. T•• {f-l)To (tzom eqn. 3.14).
So.(SiN) •o •••
••• 3.17
Before the advent 0 f lown01 se device. most source telllper.l!ltures
were essl!lllt1ell)' rosnd 80 equation 3.11 could be used. But for
low noiae receive.", eQn. 3.16 .hould be used.
3.1.4 C.a-eaded Network
Let two networKS be connected in tandem 8a shown in fig.3.3.Let the effective input noise temperatures for network A end n beTal end T&2 respectively. Let the noise ecurce has noise temp. T.
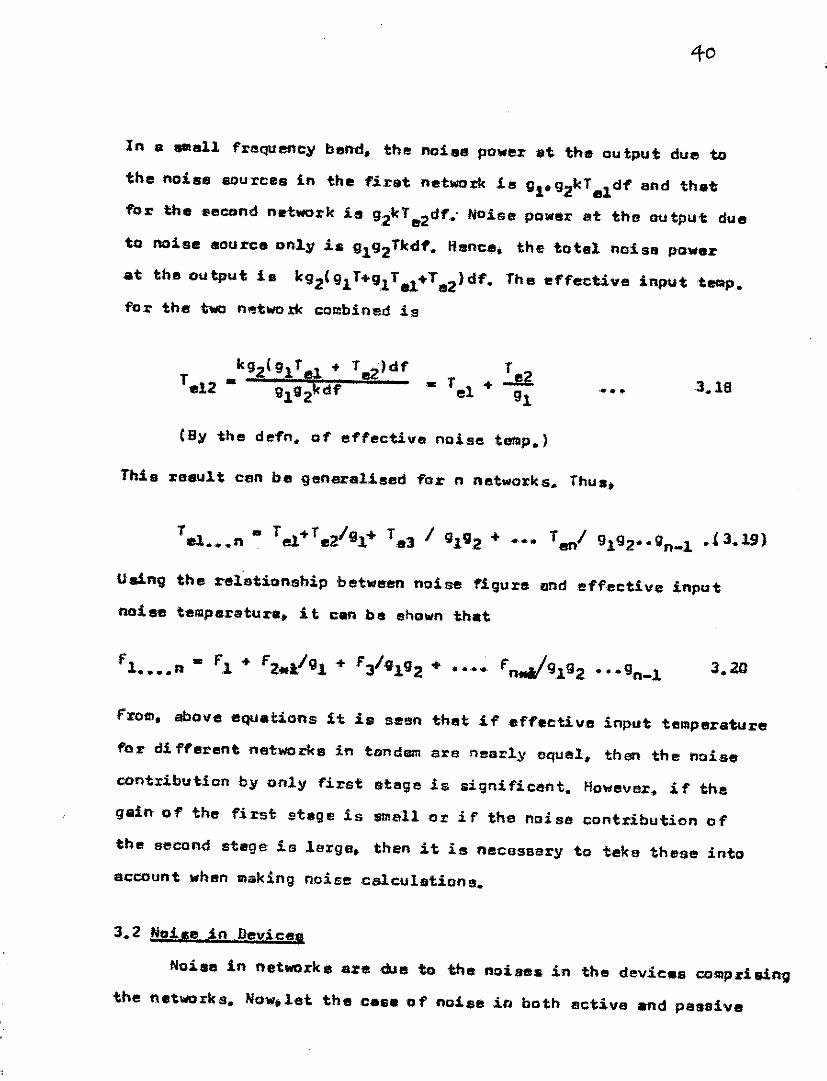
In a •• all fraqtl.,neyband. the neiee power at the output due to
th., noise 80urces in the first networkie 111-92kTe1df and th.t
for thellecond network is 92kTe2df.' Hoise power at the output due
to noise source only is 9192Tkdf. flence, the totel noisa power
at the output is k92(gl T+9lTel+Te2)df'. The effective input 'temp.
for the two n'!ltwo rk cOlllbined is
••••
(By the defn. of effective noise telllp.l
Thi. result cen be generalised for n networks. Thus.
Using the tefationship between noise figura I!Indeffective input
noise temperature. it can be shown that
from. above equations it is seen that if.ff'ective input temperature
for d1 fferent ne'tworka in tondam are nearly equel. then the noise
contribution by only first stage is sign1ficent. However, if the
gain of the first stege is SIIlell or if the noise contribution of
the 51!!cond stege ia larga. then it is necessary to teke these in'to
account when lIl111kingnoisec5lculations.
3.2 Neile in Devicelil
Noise in netwoxk. are due to the noises in the devices CtlllIpri sing
the networks. Now.let the casaof noiee in both l!Ictive and passive
devices bet: taken. Baeicnoie.a inactive devie •• are '''.tic thern:al.
short and parti ticn noiae. Beaie noiae is pl!liIsive network is
tbeJ:'lllsl noise.
3.2.1 Uoise .in Pelsiye Device,
It can be easily shown that passive reactive e18lllants do
not generate any noise. But in s resistor. tlle%'1lls1 noise i. alway.
present. fhi. noise eao be taken illS ",hita noise over .11 1'.requen-
eiell of' intereat used in cOlDlIlunicat1onaystem. The meat'! square
. voltage across the terl1linels of the resistor is If1'Oll\ eqn.2.23}-v2
•• 4kTBfi in a bendwidth B. Also, it lIIay be noted thilt noi ••
voltages do not; add, only noise power adds. The resistance noiae
can be taken as white noise over all freqlleneies of intereet in
comlllunieation networks. So, if total noiS8 power 01' a resistor
i. coneidsred. then 1'1;,becomes infinity. But,. in practiclIl any two-
port device or measuring instrUMent h••• noise equival.ent band-
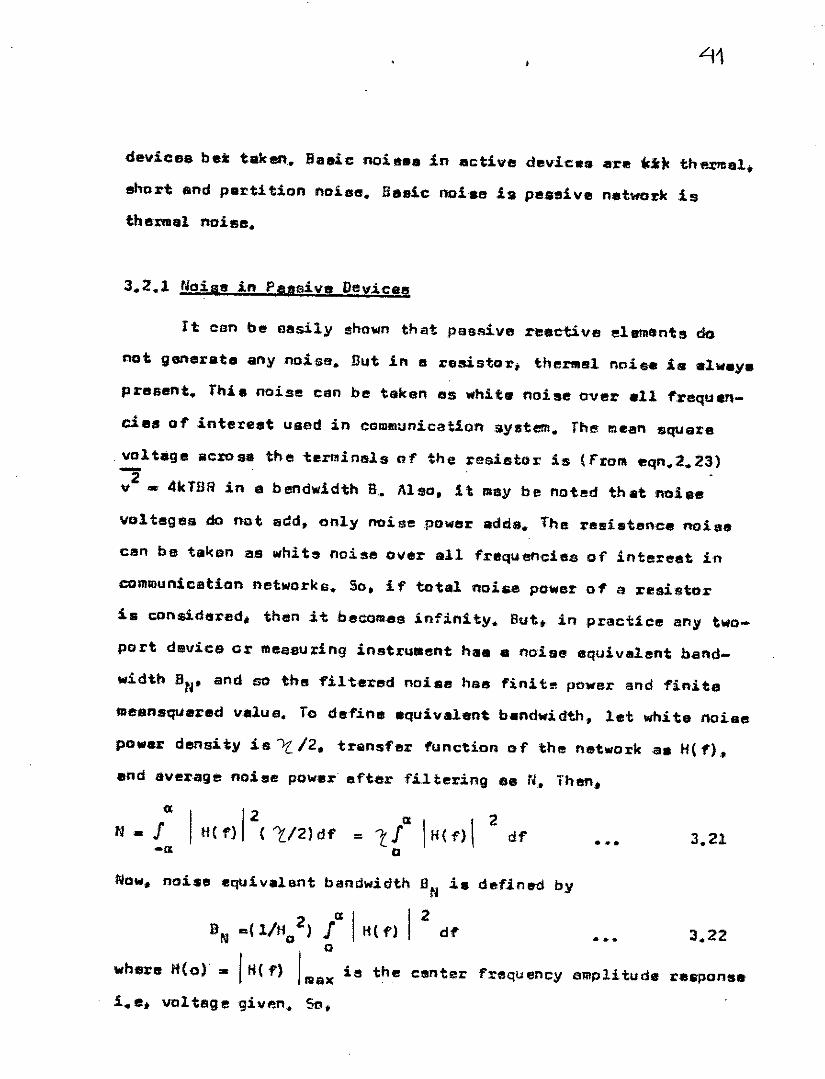
width BN, and 50 the filtered noise has finite power and finitellItlensquered velue. To define equivalent bandwidth, let whits /'IOis8
powar density is't12. trilnsfer function of the network a. HIf)"
lind aver.age noiae power after f.il. ter.ing GIS rJ. Then.
N •• /' I He f} 12, 1/2) df
,-ll •••
Now. noise equivalent bandwidth fiN .i.BN ••'1/H0
2) (' I HCf) 12
df
where It(0) •• IHI f) LUll( is til e center
1.e. voltl!lge given. So.
defined by
•••
frequency amplitude response
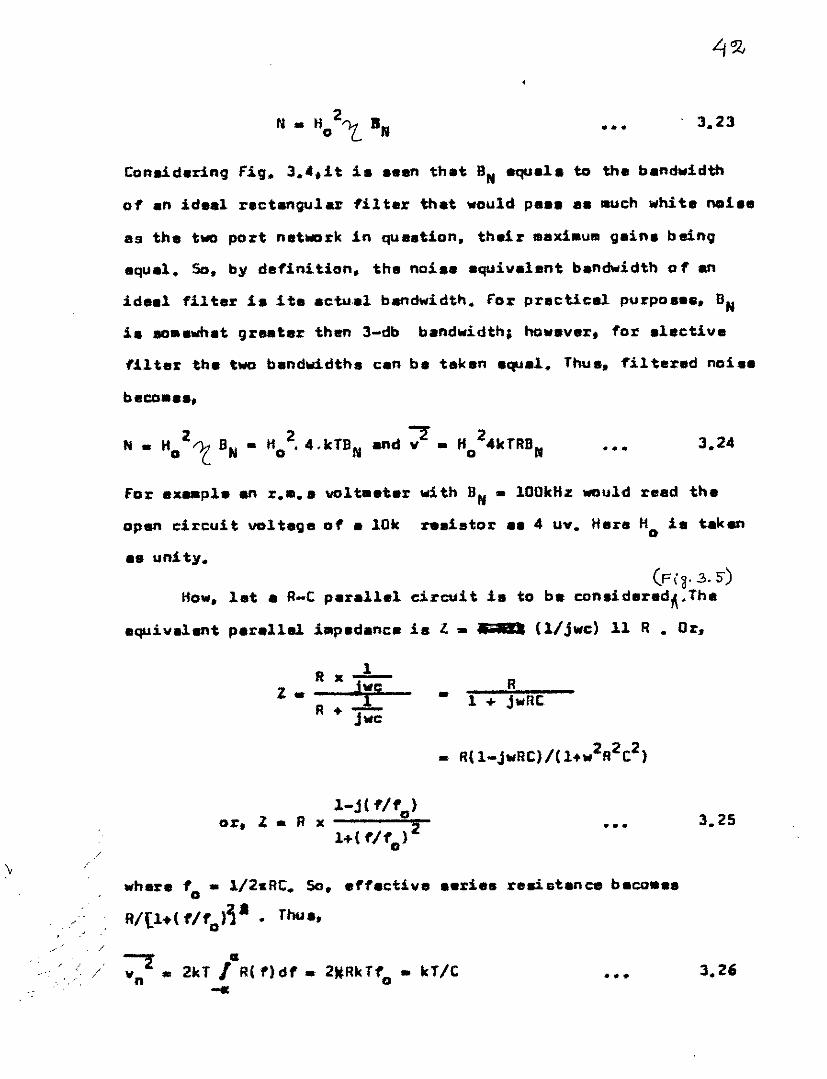
••• . 3.23
Conaid.ring Fig. 3.'.it i ••• an that BNaquala to the bandwidth
01 an id •• l r.ctangular 1ilt.r that wouldpa•••• lauchwhita noi••
es the two port n.twork in que.tion. their lDaXiIDUIDgain. being
.qual. So. by definition. the noi.e .quivalant bandwidthof an
ideal filter i. ita acw,al bandwidth. For prectical purpo•••• UN
i. so•• ""'at gr•• ter then 3-db bandwidth; how.ver. for .lective
flltex tha two bend-.ddths c.n ba taken aqual., Thus. filtered noi••
•••
for ex•• pl.an r •••• volt.etar with BN• 100kHz would reed theopen circuit voltege of a 10k
a. unity.
reei.tor a. 4 uy. Here H i. takeno
(F (~.3. 5)How.let a R-Cparall.l circuit i. to b. CDnaiderad~.Th.
aquivalent paullal i.p.dance i. l. _.' • (l/jwc) 11 R • Or,
z.1Rx-jwc;
R + ...LJwc• R
1 + jwnC
/
or. Z. R xI-j( fIfo)
1+( f/fo)2 ••• 3.25
wh.r. 10• 1/2.RC. So. eff.ctive .erie. reaiat.nce beco•••
R/(l1>( fI1o)~I • Thu ••
/Z IIIvn • 2kT'£ R( f) el1 • 2lfRkTfo • kT IC •••
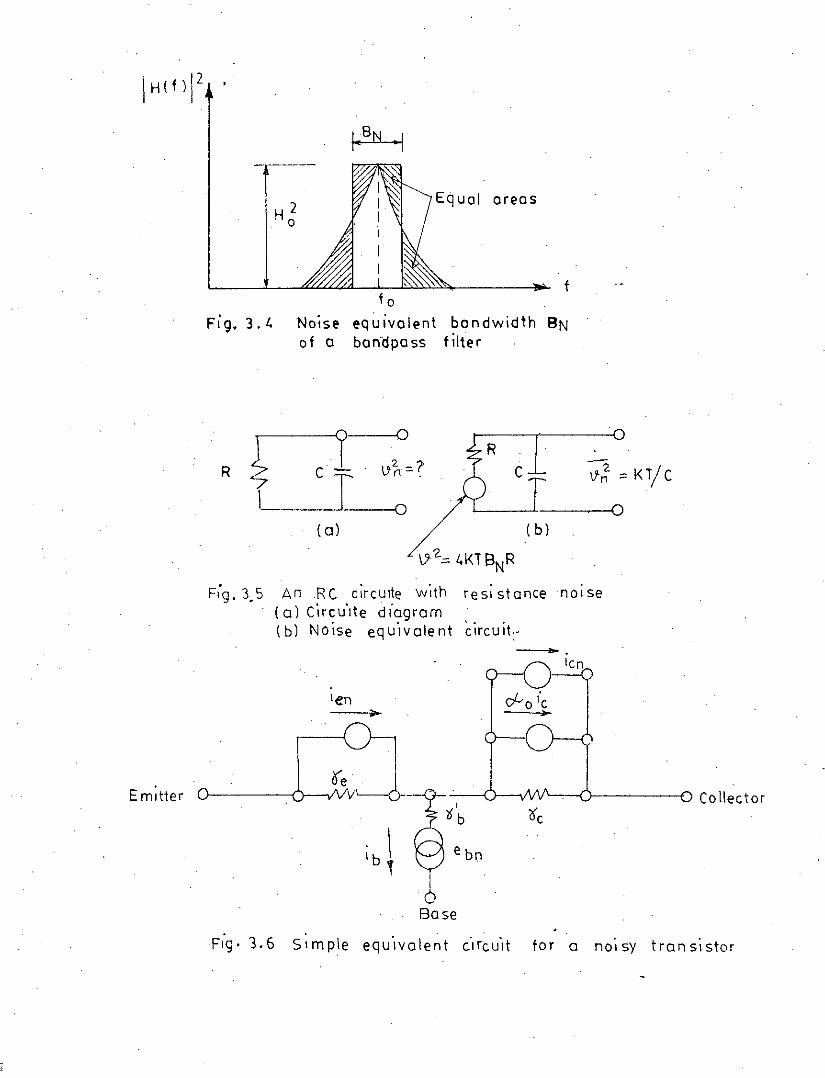
Fig. :L~
H 2o
Noiseof 0
/
Equal areas
ffo
equivalent bandwidth BNban.dpass filter
* I0
R'2. - 7'
~ =oKTjCR C T \JrY - .
1 0 0( 0) (b)
AnRC circulte with resistance nOise(0) Cireu'lte diagramlb) Noise equ"lvolent circuit,.--~Olen
0'--0 Ieb
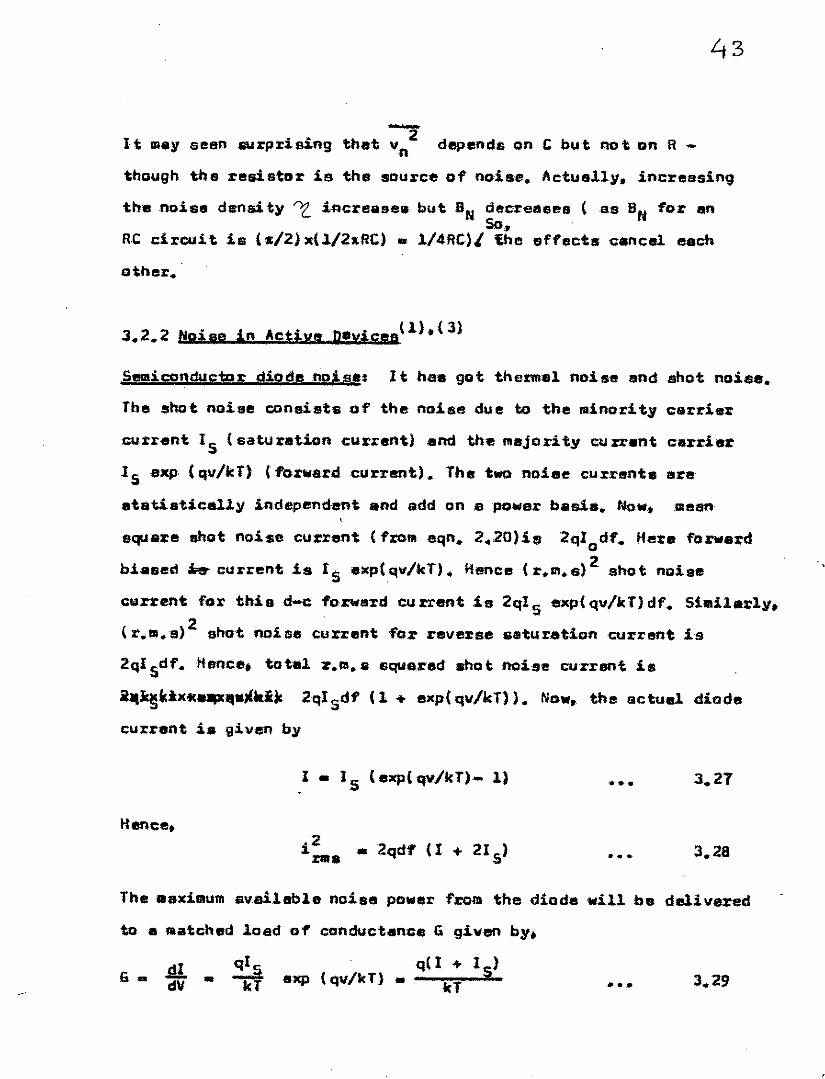
43
2'It lIlayseen surprising that vn dependson C but not Dn R -
though the resistDr is the sOurce of noise. Actually, increesing
the noise density "2. increase. but UNdecreases ( as BN for an50. .
RoCcircuit is (./2)x{.l/2IlRC)• 1/4RC)' the effects cancel _ch
other.
S!!!liconductor diodenolslIs It haa 90t thermal noise and shot noise.
Tbe shot noiee consisteof the noise due to the minority carder
.cl.I:trent Is (satu rat1oncurrent) and the "'ajori ty Cl.In.nt carrier
IS exp (qv/kT) (fOrward current). Tb. two noiee currsnts ere
ataUs'tical1y independent and add on apowar basis. Uow.IIlSl!l11
squsre shot noise current (froM eqn. 2.20)i$ 2qlodf .• !fere forward
biased _ current is 15 exp(qv/kT). Hence (1'.111. fiI) 2 shot noise
current for thio d-e forward eurrent:i.s 2qIs exp(qv/lo:T)df. 511l1i1.l:ly.
(1'.a.&)2 Bho~ noiGe current for reverse ssturationcurrent is2qI Sdf. lisnee. tatalr.lII. s squered .hot noise current ie
jh,1c~lcix«,,".,£.i~ 2qIsdf (1 + exp(qv/kT». Now, the actual diode
curren't i. given by
.1 • IS (sxp( qv/kT)- 1) .-..
••• 3.28
The maximumfivsillJble noise power from the diode will bu delivered
to • matched loed of conductance Ii given by.
Ii •• l!J. ~dV - kT
q(I + IS)sxp (qv/SeT) - kT •••
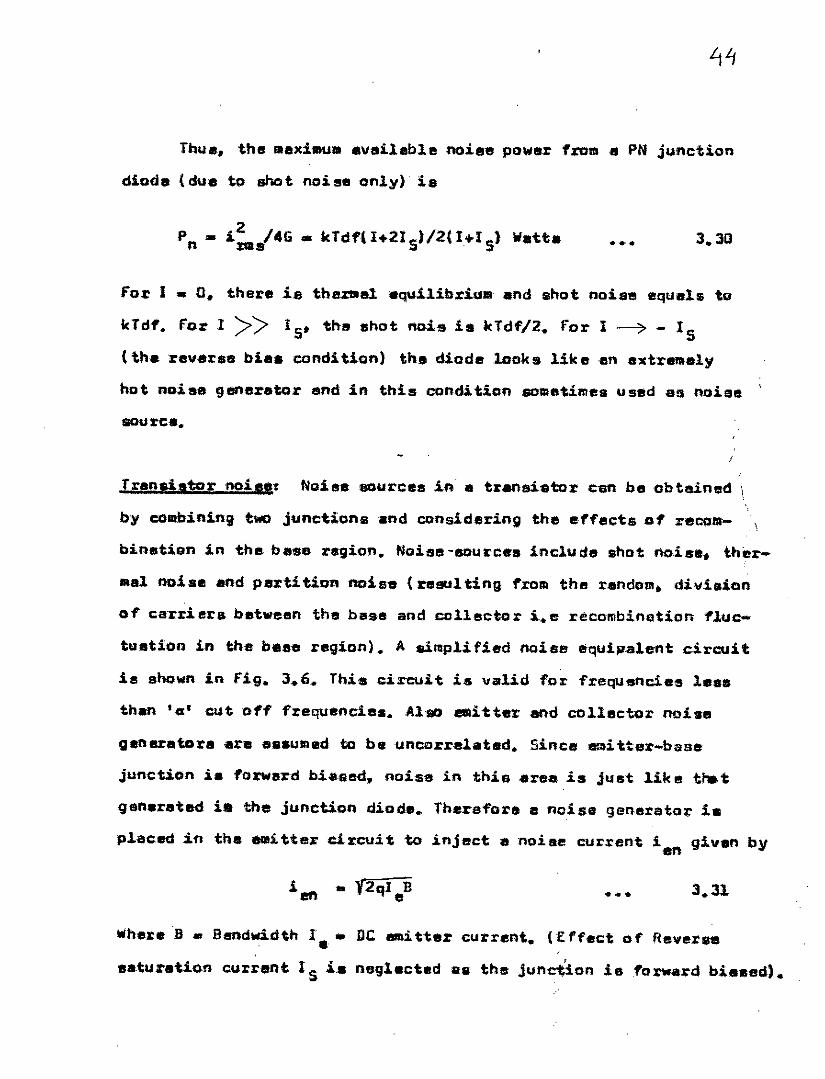
Thull. the mexiaumavaileble noiee power from • PHjunction
diode (due to shot noise only) ia
P - 12.. /4G. kTdf{I+21S)/2(1+1Sl VaU.n J:tII!! . •••
for I • O. there ie therlllel equilibrium and shot noiSlIlequals to
IcTdf. for I >> IS' ths shot nole is kTdf/2. for I -----7- IS
(th. reverse bias c:ondition) the diedelooks 11k elln extre.ely
hot noise generator and in this condition sollletimeaused all noiae
I
Tean!i.tor noi.,~ Noie, sources in a transistor can b. obtained \
by COllbininlJtwo ju~iona end considering the effect. of reCCIll- .\
bin.tilln in 1:hllbase region. Noise-aaurc•• inclu de .hot noiae. iher-
lIal noise and partition noislI (resulting f'rolllthe rendom. dilliaion
of carriere between the base and collector i.e recombination fluc-
tuation in the beB1l region). A simplified noise equi~alent circuit
ie shownin Fig. 3.6. Thi. circuit 1s valid for f'requfSf1cies 1•••
than 'a:' cut; off frequencie •• AllllO.i1:t8r .and coll"ctor nol."
generatore are a.sullIed to beuncorrelated. Sine" lllllIitter-bas"
junction i. forward biased, noi$e in this arelS is just like tn.t
gen.rated ia the junction diode. Therefore. noise generato:t' i.
plaCed in the 8IIIlitter circuit to inject a noise current; ien giv.n by
•••Y2qI Be ••••
wher.B •••B"ndtddth I •• DC lIIIlit'ter current. (:Effect of Rellern
saturation current Is i. nogleeted 8S the junction ieforward bi •• ed).
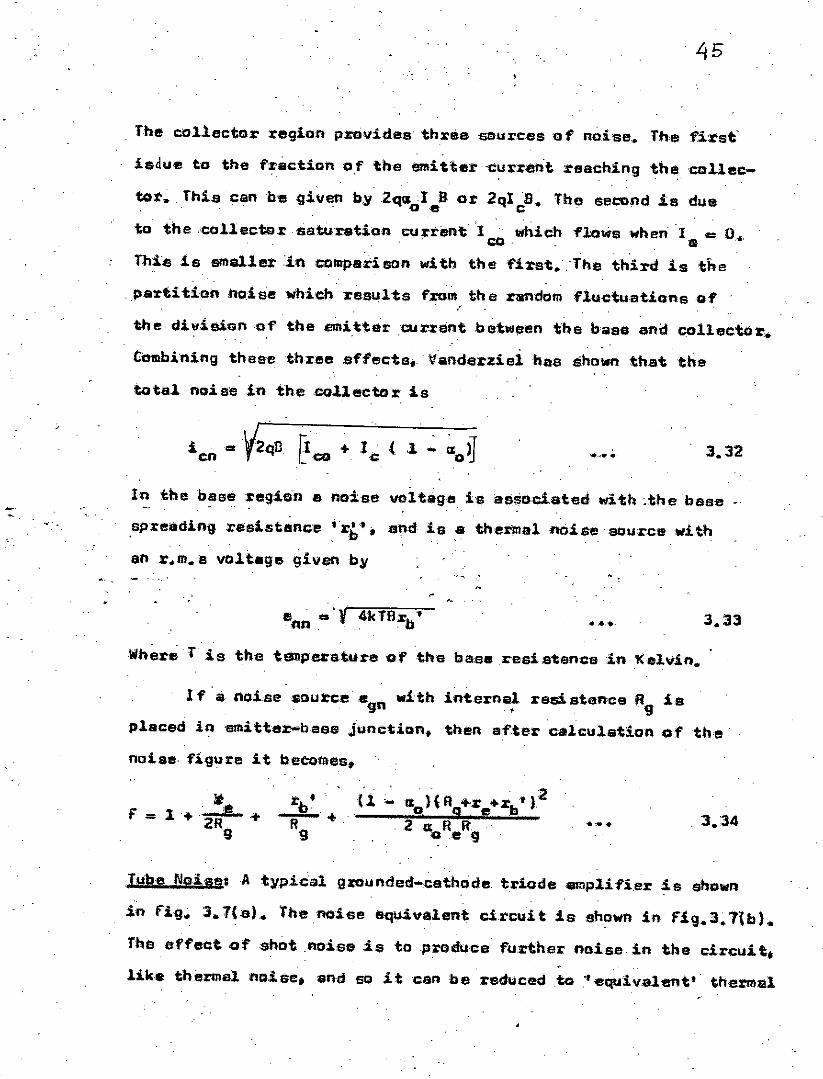
The collector region pxovides three sources 'Of Rai'ss. Tbe first'
ladue ta the fractian a,f ~he emitter-eurren't reaching the ,cal1ec-
tor •. This can b'e givefl by '2qg;I B 'Or 2qIB..fhe see'CIndis due.ae c .
to the .,colleetorsa~ration current '1 ' ~ich 1'.1ows whenI •• 0.•' . , .' co,, GThis 1ssm8l1er'in comp.riso'n with thefirs1:.,'Ttul third is the
. perU tiDn ,noise which '1'&su1ts fromth e rsndom fluctuations of'
thediv,iei,on'af' the emitter current betwsen the base and col1ectcU::,.
COmbining these three .effects •. Vanderziei ties shown that the
total noise in the .collector is
'.-,.. . 3.32
,. ,
In the base :regiflinello1se \/Dltage is l!tlj~ocl.ated with cthebase
spreading resl15tance 'r;" ,enaia a themal.nt'Jisesource with
an r.m.s voltage given by
e_n a'V 4kTBr ~", '" .b
Where r is the td'llp:er8.ture of the bae.reel stance in'Kalvin.
3.33
If ••noi:se sou~ce egJ'l ••ith
placed in 'BllIitter-beae Junction,
noiae, figure it becomes,
internel reo stan'ee It :i.e• 9then af'.ter calculation of the .
itF = 1+ ._' .••!!!- +
ZRg
'. . 2(1- rl )(R +r +~')o 9 eb
2 'U R R "o.e 93.34
Tube N2il1le,A typical gzounded-cathode triode emplifie:r is show",
in fi9~ J.7(a} .• Thenoiseequivelent circuit is showninf'ig .•3~7th) .•
The effect. .ofshotnoiseil;ltopraduce further noise in the cireui t.
lika thermill noiae'j end eo it can be l'educedto"equivalentt thermal
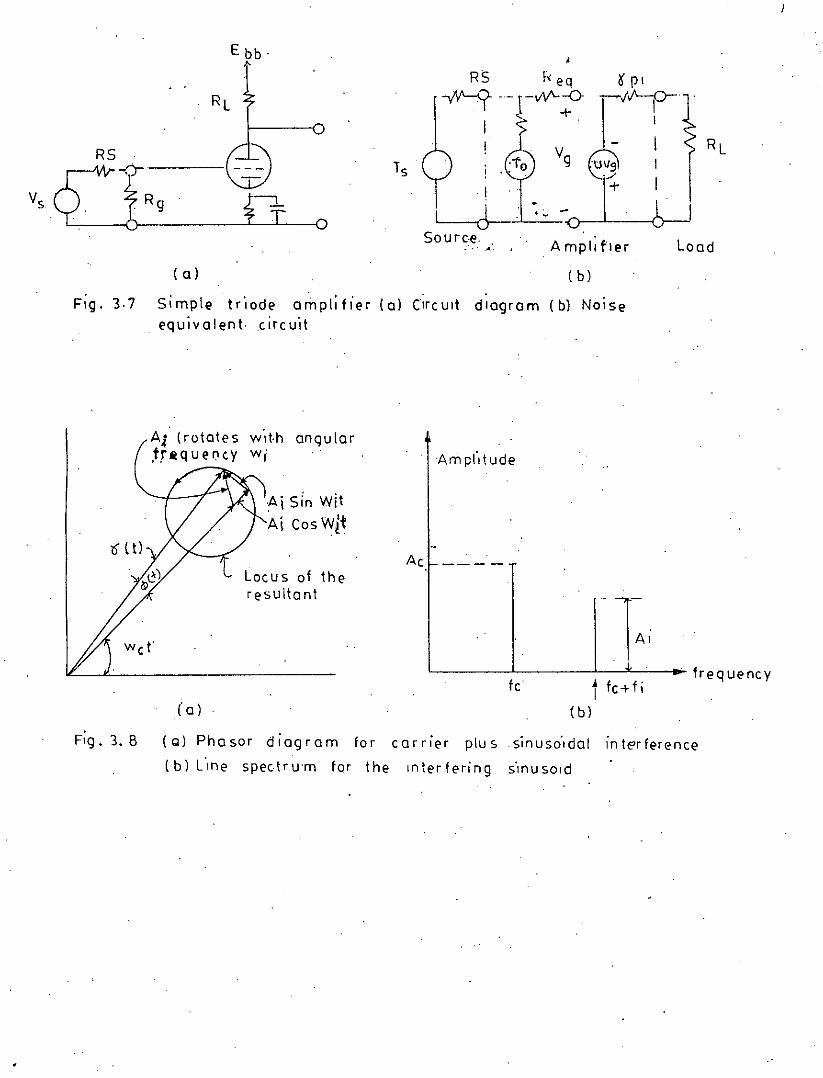
RS k eq-yY'-y- - - T -v\!"-.-o
~ +I!
oA mpll fler Load
( 0) ( b)
Flg.3.7 Simple tr'lode amplifier (0) Circuit dIagram (b) Noiseequ iva lent.c irc U'lt
At (rotate s w',t.h anqu lortr.i que 11C Y WI'
Ai Sin wjtAi Cos wIt
Locus of theresultant
(0)
Ac. _
L.. -'- ~____'''_'_ __ fr eque nc yfc t fc-tfi
(bl
F;g.3.8 (0) Phasor diagram for carrier piussinuso',dal interference
(bl L'me spectrum for the Interfering s'lI1usold
naiae by •• l!lOc1ating 1t witb an equivalent resistance R .• Req eq
.pp.eaJ:s et the input of the circuit erid J:p(plate reais1:ance)
appear's as noiseless. The source noiae 1s represented by Ita at
temperature T•• The loiidnoise from Re is treated as external
to the 1!I11lp.1i f1e1'. Loak1ng back 'from th e g1'id te.PIlinal s. th rae
nl)isy resistors are aeen viz. R • R. R • Tile latter two eres ge.q .
,at roOI1l teillperew ril and taking Til... To :0 roOIll tlrlllPeratu 1'8 (to
facilitate calculation). the lIIeanaqueregr1d voltl!lge bacalllel!l
;'2 ..4R'kT B9 0 ••• 3.35
where R••••Req + RgR.!(Rg+Rs). Since the plate circuit adds noother -noise, the available noiee power is
.-
9- Pi_IF _"lR Ir )a '-..8e upz) ....
3.38
But Rg» fie foJ:'most triode amplifiers. So.
f~J.+RIR'qs •••
3.3 Avai~ab18 Po",er pnd Noise TempKsture
The noise power ofa r~stor Ii is 4kTBN•• ndllleensquare
47
noi •• loIol1:a\la1a 4kTBNIi1.oMaxillluIIIpower output will taka plece
when load impedance i •.colllplex conjugat.of internal illlpedance.
Hence. for lIIaxillulll powex- ou'tput. h.lf of the l1oltag&1.e.
V4kTRBN12will appeer at the load. Hence. noise power dalJ.vared
to load isi4kTRBH/411). kfBWWhich depends only .on the ' •• perature
and bandwidth. Cll!arly. t_perllture i. the fund_ental pareaeter
of therlllal noi.8. But 1:here ere other white noiea lIOurces which
are nontne:n.el in the sanli. that the noille pnwer is unrelated
to a phY8ical. telllperature. Nonetheless. the noiae 1:eJllper.tur.'e
r of any white noise aourCB. thermal or non themel llley be• •
considered by defi'ning
T. N IkB ••• a •• • ••
thsrlIIel 8Qurcaa. T i. e phyeical tentper_•sources it is a IlfillSSUreof' the availabletux. and for nantherlllsl
WhereN is the maximulll no1.&.pover the aource can deliveS's in•bandwidth aN. Thus, fOl:
noise power...;
3.4 ,ffed .g.fMpduhpon an Noi,,(1) ••(2)
It i.evident th8t tr.naml1:t.d power i. tWff'iciently higher
'then noise power at the tran •• ittl!lr point end $0 effect of noi ••
i.negligible at this point. But the signal delivered tattle
dwmodulator i.9 alweys accompanied by appreciable noise inc1.uding.
that gen"rated in the preceding stages of the receiver itself.
At this point noiae i. comparable with the eignel a. signel strength18 lower. rurth er, there may be interfering signals in the deeired
band tn.tare not rejected by the r-f or 1-1 ••pl!'!er. Both nai ••
and interference give rise ta undesired CQ1IIlpont!'nts at the detector
output. first. the effect a' 8.0 interfering signal lIIaybe eonlddered ••
Let the interference has IIlllplitude "'( an d frequency fc .•. f ••• ,:I.
D1'farent types of modulation will 9ivI!l di fferent 1!lff'ect.
now. tatal signal entering the demodulator is
.....where A,j;Cos wet is an um.oduleted carrier. No", y( t) can be
written as
y(i:) - r( tl Coa (.ct+IRt) ) ••• 3.42
__;where r(t} .. viA +Ai COS""'i tl 2 - 2S' 2\JIit 3.43••• Ai 1n .,. .•. c
Ai Sin Witand f&( t) •• arc tan"- AiCo. "'i, t '... 3.44-••c
The phssor dil.lgr_ is shawn in fig. 3.8. for .'rbitraX'y values of
At: and Ai' these expression cannot be further ~llIpli'ied. However.
if th. i.ftterference i. sm.ll colllp$red to the e:a1'rier. the reaul tant
envelope elln be apPnlXilllBted as th e SUIII0 f the inphaae l;:(llltponents.
while the quadrature co.pem.nt determinea the phase .,gle. So. if
Ai -«:Ac' then r(t}~!le + Ai Co. Wit liIndlt't)~(AiIAc} Sin w.it .•
And tID.
At the extreme csse. if Ai ~ Ac' the analysis will be
reversed i •• carrier wl11 IIlOdulate the interf'ersnee.. Thus. the
int.rf.d.ng ai9n.l both _plitude and frequency IIlOdulates the
u~dul.t.d carri" with. llIoduJ..Ung tone of' '1' So. to the
d.odul.tor. the input .ignal will b. like a AMand fMIIIOdul.t.d
W.".4 AMa.odul.tor 1llill ignora phlleevari.tion, fH - d.-oduletor
will 19nore aplitude vari.tion.
• (1) (2) (5)3.5 "01" end Ampl1tud. Modul.tip" • •
At the output of the 11Mdl!llllodulator the d.tected .lgnal
will b. (for the .aid 1npu1;y(t». KutAc + "i eoa Wit). ",hara kD
i •• constant. Upon fi.l.tering end r •• oval 0 l' DC c:oIISponent. the
output ugnal i.
for
11'1.1 ZUI'il> B
•••
Vher. B is the band-width.
for colllp.1'1&on.if the carrier i. int.nU.nelly IIlOdul.t.d at the
t1' •••• 11ot.r. then
x (t) • A [1+1'1)( t) ] eo. w tc: c _ ~ c:
.wndthe d.adulated output i.
••••
••••
for ton. IIlOdulaUon. And where A i. the carrier _Dlltude ••• surfldC .Id'ulIxAxxi:a at the detector output. Thu. for intentionel lIIOdul.-
&tion. output at the d\!tector 1. proportional to carrier •• plitude
end •• plitude of thelllcclulating signal. But for unin~ention.l
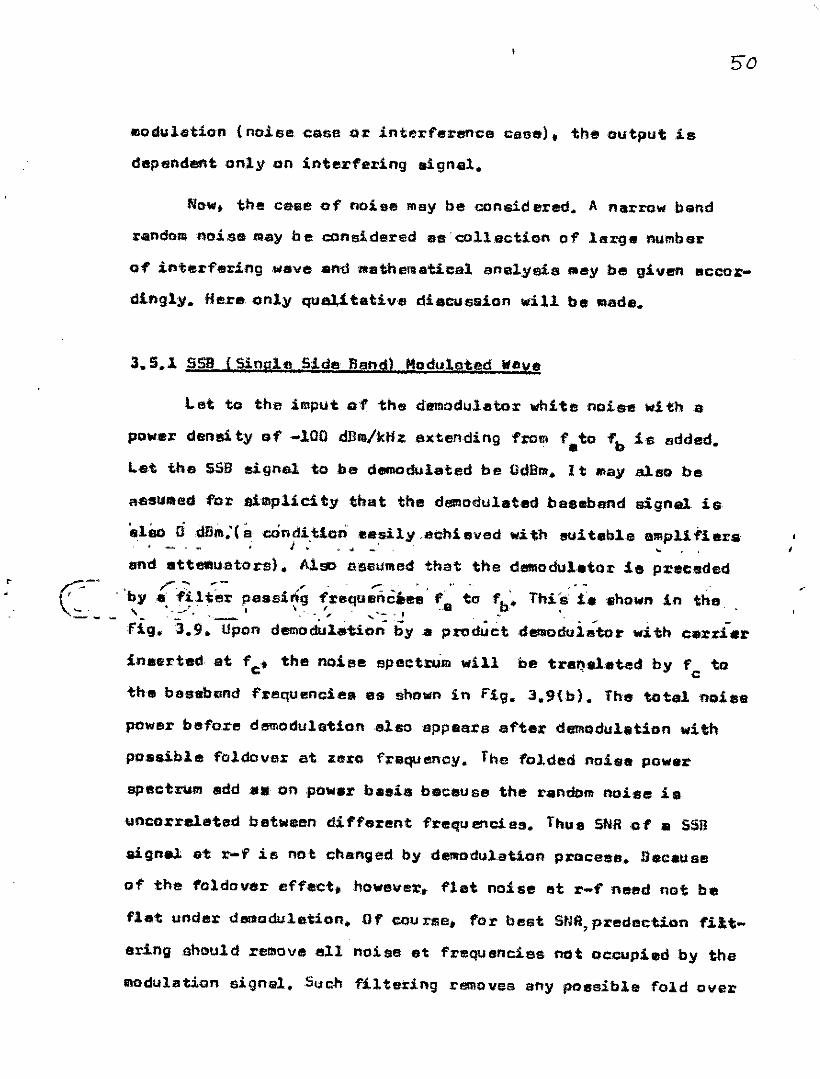
50
lIlodulat1on (noise ,case Q~ interf',lllrence casal. the output is
dependent only ,on inter'fering signal.
Net"'. the cese of noiee may be consid ared. A narrow blind
randol'll noi,sefllay be considered illS'coll.ection of lllrganumber
of interfering ,weve and mathematical analysis mey be given 8CCOI:-
dingly. He.r. only que1,1tative di.eussion will be made.
3.5.1 sse (Single Side Band) Modulated wave
1.at to the impute' the demodulateX' whit e noi5111 wi th a
pow.llr dens1ty sf -100 dDllI/ld:lz.extending from f IIto 1'b is. !ldded.
Let the ssa sign'l1 to be demodulated be OdBm.It Jnaya1sCl be
assullIed for ailllp.licity that the demodulated besebend signet. is
.180 ri .dBliI:C Ii eOndi.t1o'\ usily ,achieved w.ith auit.ble IIlmplltier.a........-~ . I. ~..I_'. ....,
end attlllllUators). Also assullled that the dellloclul,.tor ie preceded~-"'< .' r.~ "':'- ~,.. " "'"':.-""_" .,"'- \' _\:::- __' ~y •..~.11;~~assi~g .~~"qu~~~" '11 to tb" This hllhown inth.
fig. 3.9. Upon demock.la.tion- by • product demodulator with card.ar
inserted at fc" the noiee apect:a.im will be tr.~s1.ted by fc ta
thlll bestlbllnd fraquencies es shown in tig.J.9(b). The totalnoisfI
power before demodulation ,el8O appears after demodulation with
po.sible foldover at z.ero frequency. Tn.s folded noise power
,spectrulll add •• on power b •• is bal:euse the random noise ie
'uncorreleted between different frequencies. Thu. SNR,of" SSB
&ignN et r-f ilS notchlilnged by de1llOdulation proc:ess,. Secause
of the 1'01do"ereffect. howe\fer,~ flet noise et 1'-1' need not be
flat under demQduletion• .or ,cou rse. for best StUI,predection filt-
ed.ng .shl3uld reDlCive ell noise et frequencies not Q(:cupied by the
modulation signel. Sl:lcn filtering removes any poesiblefold over
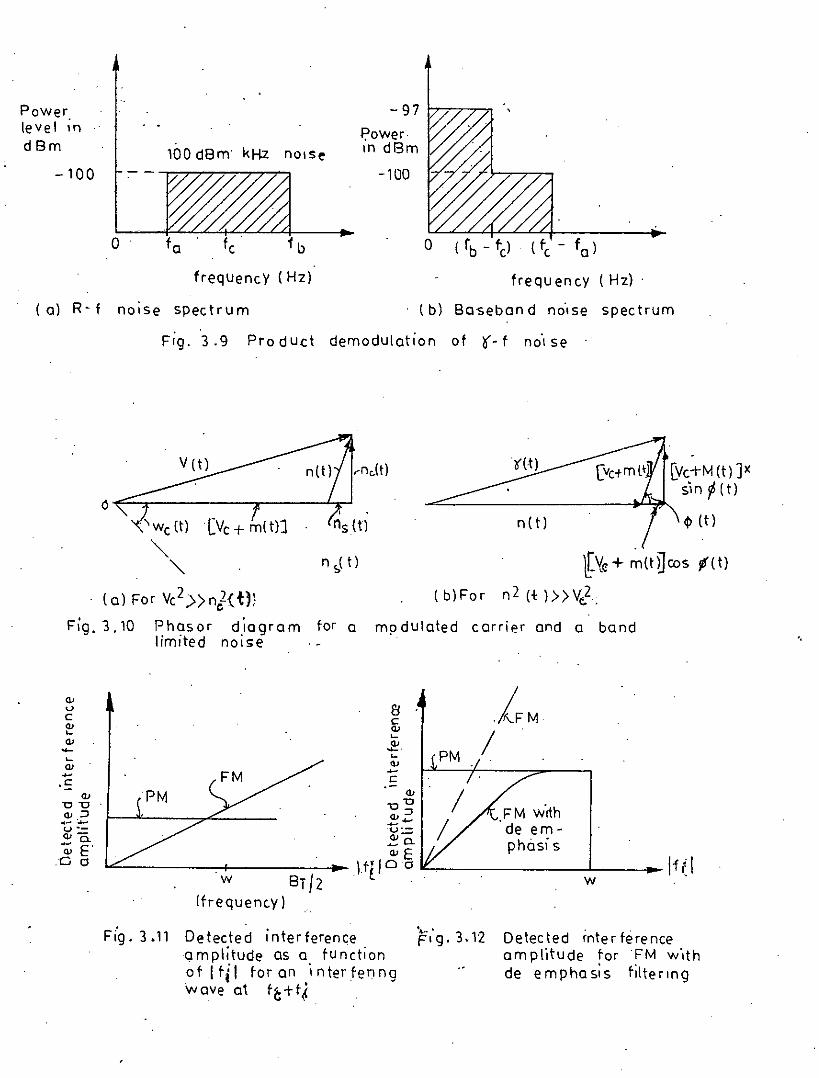
Powerlevel ;ndBm
-100100d8m' kHz nOISe
- 97
,?owerIn dBm
-100
0 fa fc 1b a ( fb - tc) (tc - fa)
frequencY (Hz) frequency ( Hz) .
( a) R- f nOise spectrum ( b) Baseban d nOise spec trum
Fig. 3.9 Pro duct demodulation of (-f noise
"
[Vc-t-M (t)]xsin ~ (tl
~ (t)n (t 1
~~e+~(tilcos f{t)
(b) For n2 (~l»vl.mpdulated carrier and a band
,ndt)
n s( t)
.[Vc+ m( tlJ
(a) For V(2»n2(t))
Fig.3.10 Phasor diagram for alimited noise
'f1'g.3.12 Detected interferenceamplitude forFM w'lthde emphas;s filtering
'"uC
'"~'"-~'"
w 8T /2[frequency)
F{g. 3.11 Detected interferenceamplitude as a functionotltil toran interfenngwave at f~+fJ
FM w'rthde em-phasi s
wIf(1
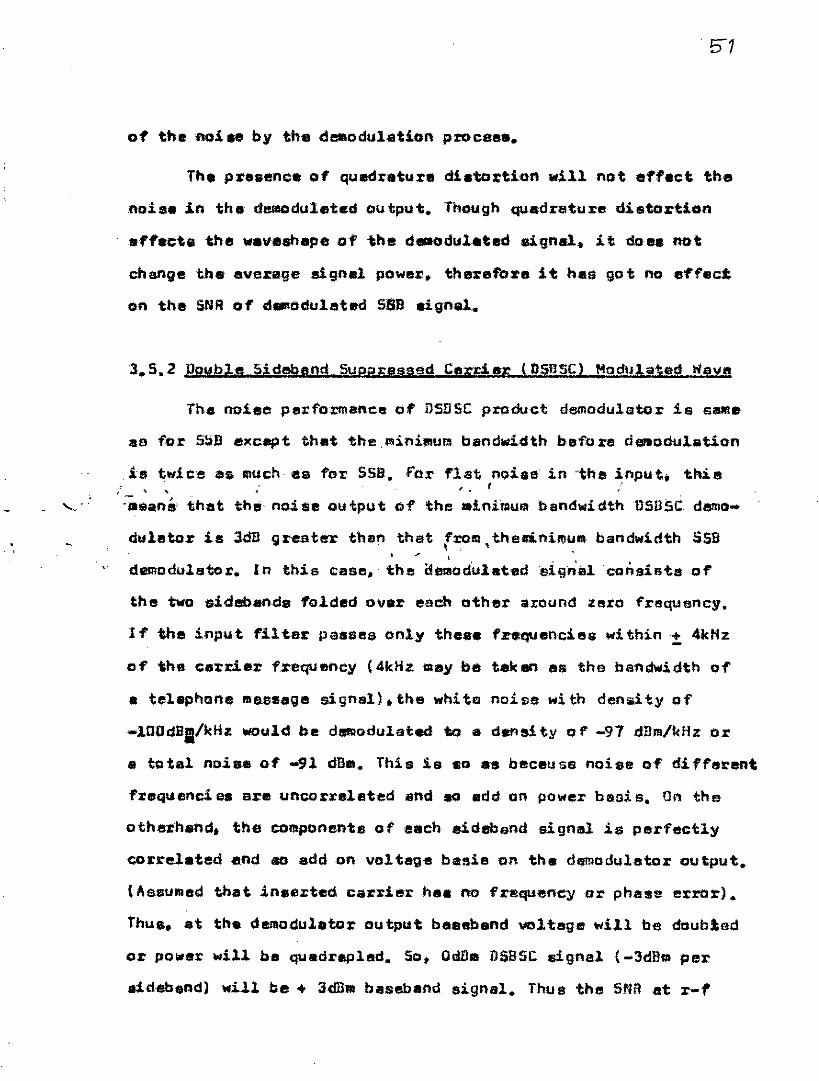
of the noi ae by the dellloduletion prol:sas.
Th. pra.senc.ot quedrature cU.• taction will not eff.ct the
noise in the delllOdul.ted output. Thoughquadrature distortion
1IIff.eta the w.v.shape of the d_odul.ted eignal. it don not
change 101'1.average sign.l powar. thlil'refore it has got no effeci:
on the SNRof d.u)t!ulated SSD ~9nlil1..
3.5.2 .Double Sidebsnd.Superassed Cerrial:' (DSllSq Modu!pted Wave
Th. noiee performance of nSDSC produ,ct demodulator is SlIlII.
liS for SSD except that the ,lllinilllu~ bandwidth before demodulation
is twice SS Illuch as for SSB•. ror flat nQiae in "the input .• thie".. '. f .'
,-,.. :means' that th. noise output of the .iniilluill bandwidthUSUSC dem!)•••
dull!ltor is JdB greater then that frolll thellinill)ulII bandwidth liSB,.. '~ ••• L •
demDdulato~. In this case. the ~emodul.ted ei9hsl consisteofthe twosidebande folded ovar each ather around zl!Iro frequency.
If the input filter passes only theae frequencies within!. 4kHz
of the carrier f,requency (4kHz IlUljf be t.ken as the bandwidth of
• tel.phone lllaesage Bignell,the ••hite noisa ••ith density of
"'lOOdBIl/kHzwould be dllllllodulated to II dena! ty 0 f -97 dDm/kHz or
• total noi.e of -91 dBIl. This is aD as beceuss noiae of diffel'ent
fxequ.enc:i ell ere uncorreleted ilnd so edd an power bllai s. On the
otherhand, the colllponente of elllch eideband signlll1 is perfectly
correlated and ao add on voltage basis on tha d~oduletar output.(Assumed that !naerted carrier hili. no frequency or phase error).
Tnu•• at tne demodulator au tput: baseband voltage will be doublod
or power will b. quadreplad. So, Odam DSBSC eignal (-3dBm peraLdeb.ndl will be + JdlJlIl baseband si.gnal. Thus the 5NRat r-f
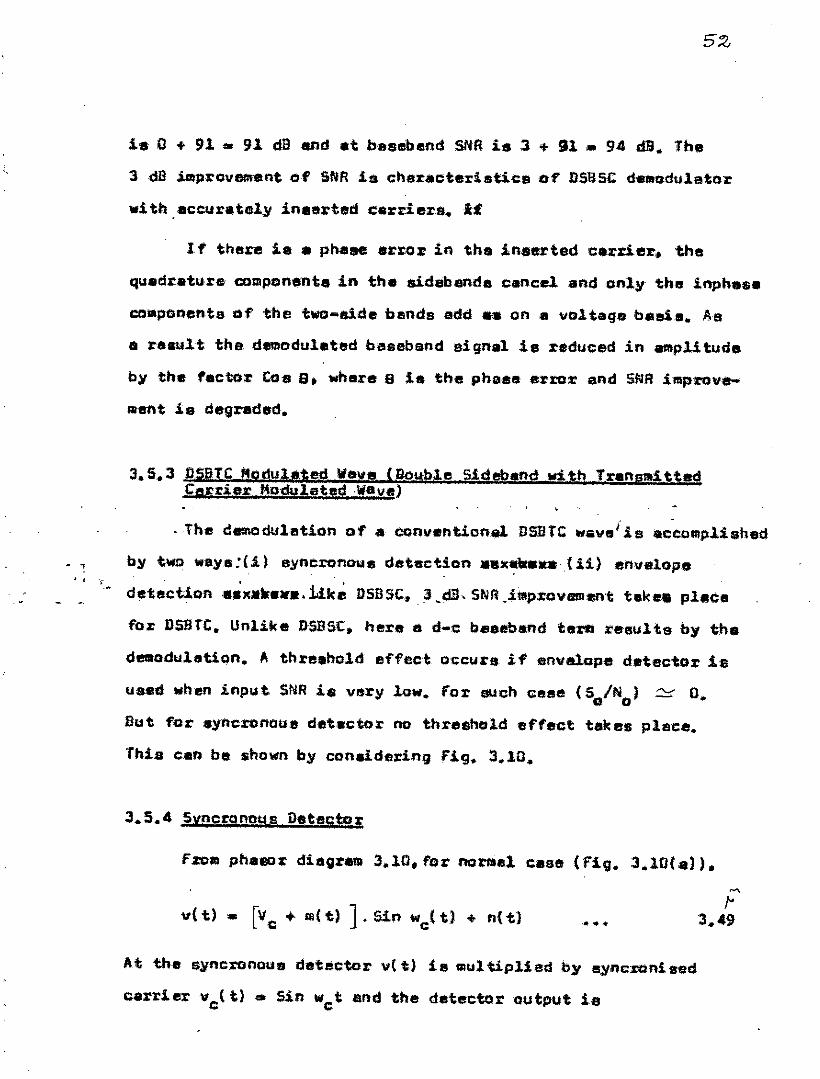
- ,
52
~. 0 + 91 • 91 dB end .t ,basebend SUR ~a 3 + 91 • 94 dB. The3 dB .iIIlprov.ent 0.' SNR14 characteristics of DS!lSCd_odulator
with eccurate1yinearted earriers. it
If there 1e • phe" error in the inserted carner,. the
q",.draturecolllponent.a in tha aidebende cance1andonly the inphelil.
coaponen.te of the two•••aide bends add •• on a voltage basis. A8
IIIreINlt the demodulated baseband signal ie reduced in _plitude
by the factor Cos a. where 9 1. the phlll.stlrrer and SNR improve-
lIlent is degraded.
3.5.3 DSBTC!10dU&!ted lien Ukl!ilble Sideband todt~ ,rranslllittedCarrier Moeule$!dWave)
. The dtllllOduletion of a eonvention(il1. DSIlTC wlille/is .c-eoIllPlisbed
by two waya:(i) 8yncronoue det1Sction •• x••••• (U.) envelope
detection •• x.k •• e. id.k~ DSBSC.:3 _d.ll- SIIIA.iillj)J:QvlIIlIent take. pleell
fOl; USSfC. Unlike DSBst. here a d-e beeebsnd h1:«l results by the
dl!!lllodulati~n.II threahold effect oce:curs if envelope detector 18
uaecl when input SNRi$ very 10w. for such ceae (So/Nol :::=:: O.
But for .yncronaue dtlt.ct~r no threshold effect tllk ell piece.
Thia e.o be shown by considering Fig. 3.10.
3.5.4 SynergnotlsDetectcr
fJ:'Olllphal101' diagr.llI 3.10. for oorllllll case (fig. 3.10Ce».
'..•../It the sync:ronou!I deteetor v( t) ie Illul tiplied by l5yneroni tied
carrier vet t) •• Sin wet And the deteet:or output i8
53
( ) ]2 .+ ns t . ,S1.n wet
••
.Iit'•• 3.50
where III(tl i. the lllodul1ltt1ng signals. Tbe eignal eftsr fi1 tllr!"g
by e lew paSfl filter 'wi til d-e bloel<1ng i.
" ."--' '.o.../ ~, 'J It (t) :II laC~)/2 +" n (t)/Z
'0 _.... ~ __ ' 1!
,••••
" -,\
3.51.I
-, "f:vi"dOl'ltly, the result :is independent (')f tbe' input' SURBihee it' ".f '4 -l'~ I" .,.""" .1 t;.~ 0. I~_
does oat enter into the anelJfeie. The output SNR1. given by•
.• .. ,,.
Th\nl. the result 101111be hold for Ilny input SNR.
3. 5.6 Envelope De1:tetor
'\Ie t) ~ [\Ie + Ill! t) •••
Thu.s the dllllllOduleted output will be proportional to
1Il( tl + n (tl. Thus StiR is $l!llftl!l as for "yncl'OOOUS detector in thisscees.
r( t) ~ DC t) + [Ve + 1lI( t) 1. Cos It{ t) ••• 3.54
(neglecting the quadretuncolllponllnt wlli.en i.. varll SlIall ••
Sj,/fli Is very 8lIlall).
Hence, ou tpu t ",i~1 bat
••• 3.•55
cannot
process\
!i_onal
Here, the desired signal i8 dependent on .• rsndolll, ,Coli ~(t) and.1>O info~lltion is last. Sc.lllOdul.ting. '.recovered. Thi.l!l is celled threshold effect.
!
3.6 COlllperison 9f' Uo"r Modubtion systt'lll!( 2)
For colllparif:lOll of variou$ type .of linear !Ilodu1etion the
following points al'e to be not.d.
(1) tren~1esion bandwidth. BT(Ii) poat detctlon SNR,(S/N)o(iii) D-C or low frequency algne! tran8lllissions
(iv) instrumentation (lOlIlpll1xi.ty
(v) tranemitted po••r
Tn.e. an cOlllpared in the feb1. 3.1.
Suppreaaedcerrier moduletion 1e superior to convsntiontd
AMon severel count. viz. better SNR•. ,no threshold effoct. When
bandwidth conservation i. illportant. SSBand vsn (vestigial
eidebend) are per'tieularly attractive.
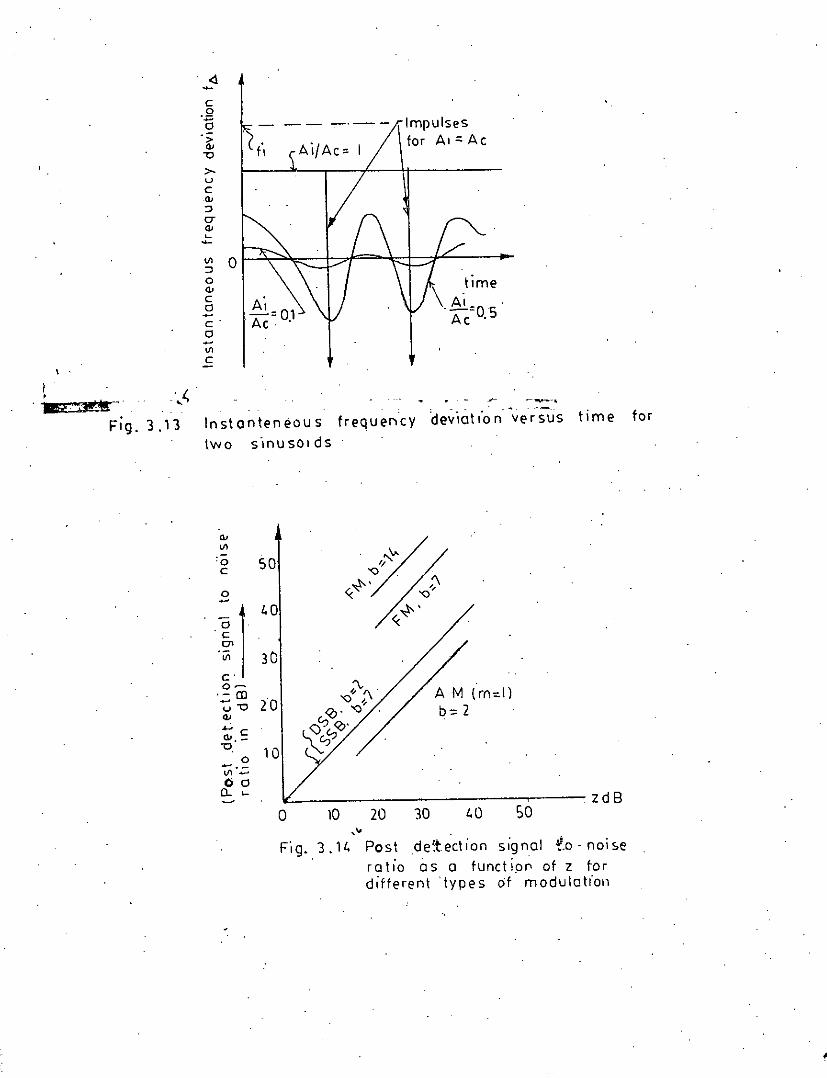
<l-c0
'';:;0.-
(tl>'""0>-uc'"::>CT
'"~-II> 0::>0
'"C0C'0II>C
-- _.--Ai/Ac= I
Impulsesfor A,"Ac
\.time
AI .'-=05Ac .
---.Fig,3,1'3 Instanteneous frequency 'dev',atl'on-versus time for
two s',nuso' ds
'"II>'0 50C
0- /'0l1 3DC'0-
'':: OJ 20u'O'".••• C
"'.-'0 100-,-II>-000- ~
0 10 20 '30 so zd B
Fig.3,l1. Post detection signal i.o - noiseratio as a function of z fordifferent 'types or' modulatl'ol1
•
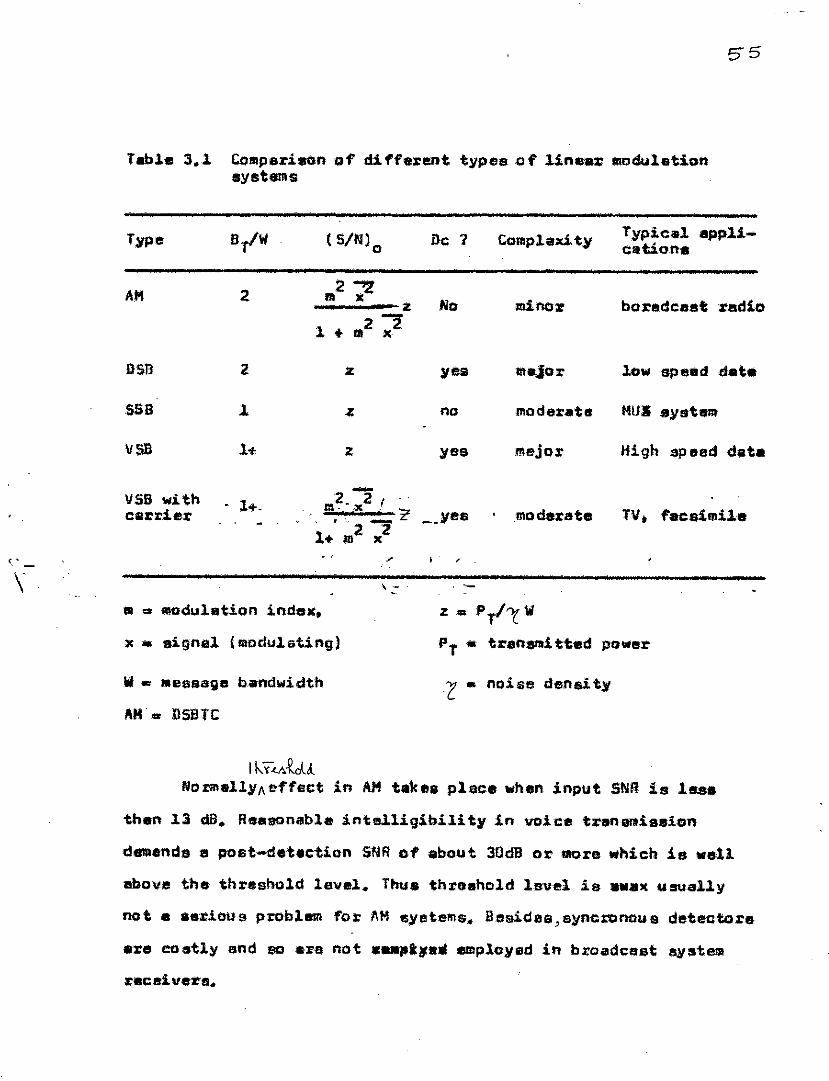
55
Tabl. 3.1 Colllperison of eli.fferent types of linear lIoc:l111etionsystems
2 - -z
1 + 1',2 x2
llc ?
No
C-omplexi ty
minor
Typical appli-cation.
bor.dcast radio
\
0513
SSB
V$B
VSB withcarrier
z
1
1+-
z
z
, .
no
yes
,
major
moderate
mejor
moderate
MUI system
III ~ modulation ind •• ,x • signel (modulating)
III •• MeSS81jle bandwidth
~M •• DSBTC
Pt. tranatll1 tt.d power
z. noise density
Il-.:~.<A~LJ,Normall,vAsffect in A.l1 t.kea place when input SNRis 1__
then 13 dB. Reasonableintelligibility in vo1c1I trtlflQllliesion
d8lllenda a post-det.c::tion SNRot about 30clBor IltOrs which is well
Gave the threshold 1,sv.1. Thus thxtlahold level is •• al< usually
not • aeriou9 problem for I\M !SyetelllS. BSliIide6,syncnmoU8 deteQtorl!l
are co.t1y and so are not ."l'il1tlll IlIIlplcYtld in broadca ••t ayl!ltE!lll
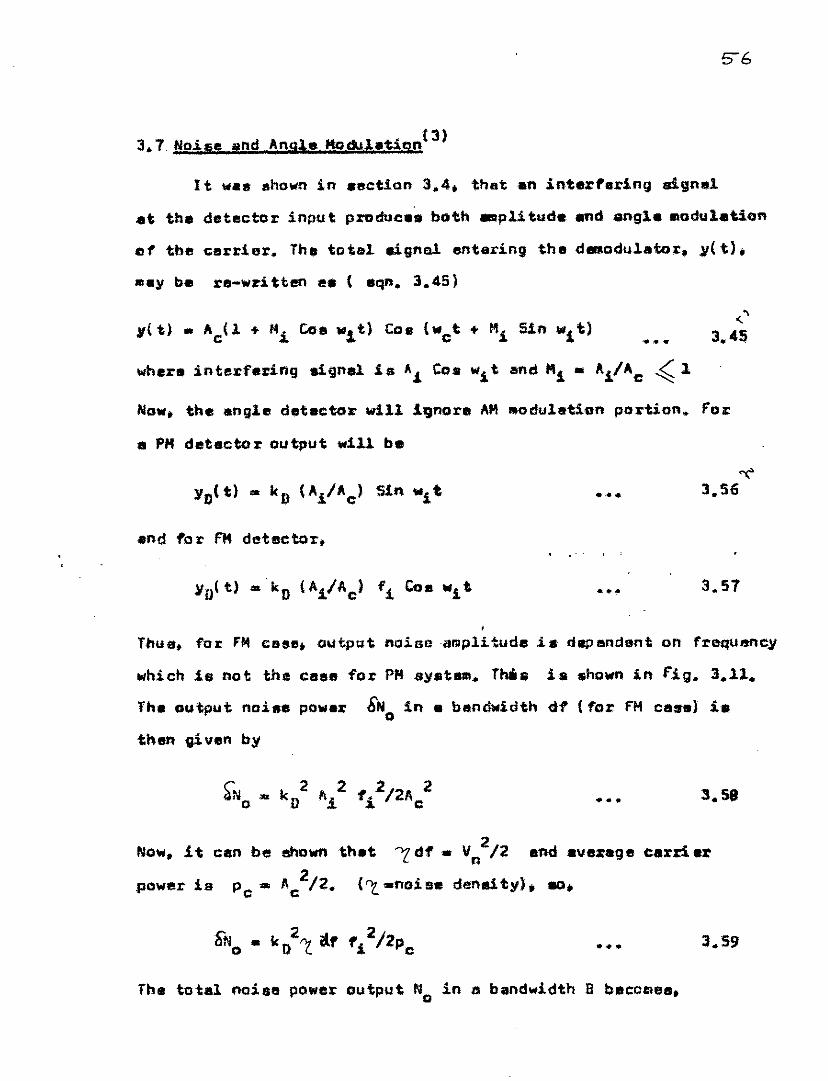
56
3.THain and An91eMocluleUont 3)
I t ",all shownin ."etian 3.4. that an interfering signal
.t the detector input produce. both .plitud. and angle lIlodul.tion
at the carrier. Th. ttltal GUnal entaring the dlllllodulator. y( t).
~.Y b. re-written e. ( eqn. 3.45)
.. ,..
Now. the angle detector will Ignore AM••odulation portion. fOit
• PH detector Qutput will b.
. ..
.,..
••• 3.51
Tnua. for FMcase; output noisoalllplitude i. dependant on frequency
which is not the CIII!II.I for PHay.tu" Thia i •• hownin fig. 3.11.
Th. output noi.e power ENo in e bandwidth df (foz: fH case) i.
then gi vlln by
~N •••k 2 fI 2 f.2/2", 2a D.i,l. c: •••
N4w, it cen be
.pcwer is p •••e
t!lhDwn th.t 1'dt. Vn2/2 end average earn.:I.'
Ac2/2• ("L _noi se denai ty); tIO •
•••
Th. total noise power output No in 3 bandwidth B beccClee.
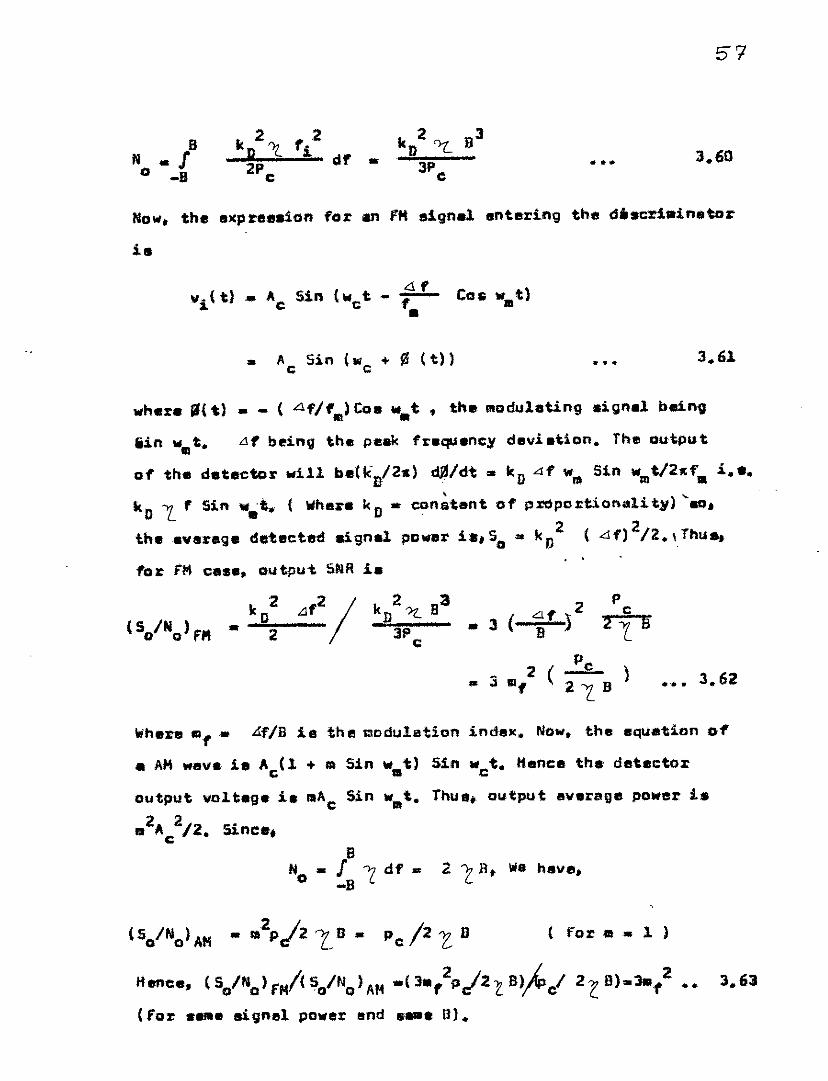
BN • /o -8
,2i of • • ••
57
Now. the lI>cpreeaion for." (/II sign.l lIntaring the discr1.inetor
1.
• ••
where lIt t) • - ( L!.fl f.) Co. ".t t the lIlodulating .igl'ld being
iin "'lilt. tlf being the peak frequency devi.tion. Thill output
of the d.t.etor ",UI betk••/2s) ~/dt •• leD L1f '" 5in w tlZ"f i.e.1>. III III III,kO 1- ' Sin w.;t. ( Where kD • constant of proportionality) ~"ttlt •• vlIrag. detected eigne! power i.,So •• k£l2 (df)2/2.,Thu-...fOll: (/II e•••• output S~R i.
•.•• 3.62
loihere III,. ,df/B ie the I:loduletion indllJ<. Now. the equ.tion of
• AM ",eva i8 Actl + III Sin w.t) Sin "'ct, Kence the detectoroutput vo1.t8ge i. mAc Sin w.t, ThUll, output average power i •
• 2,,(;2/2, Since,B
/ "2 df ••-B
(So/No) AM • 1121'/2'IB.. Pc /2 t B ( for III- 1 )
Hence.(So/No)fI/(So/NO)AH .(J./j)!2~B)~cl 2(8).311/ •• 3.63
(fGra •• e eignel power lind ._. a),
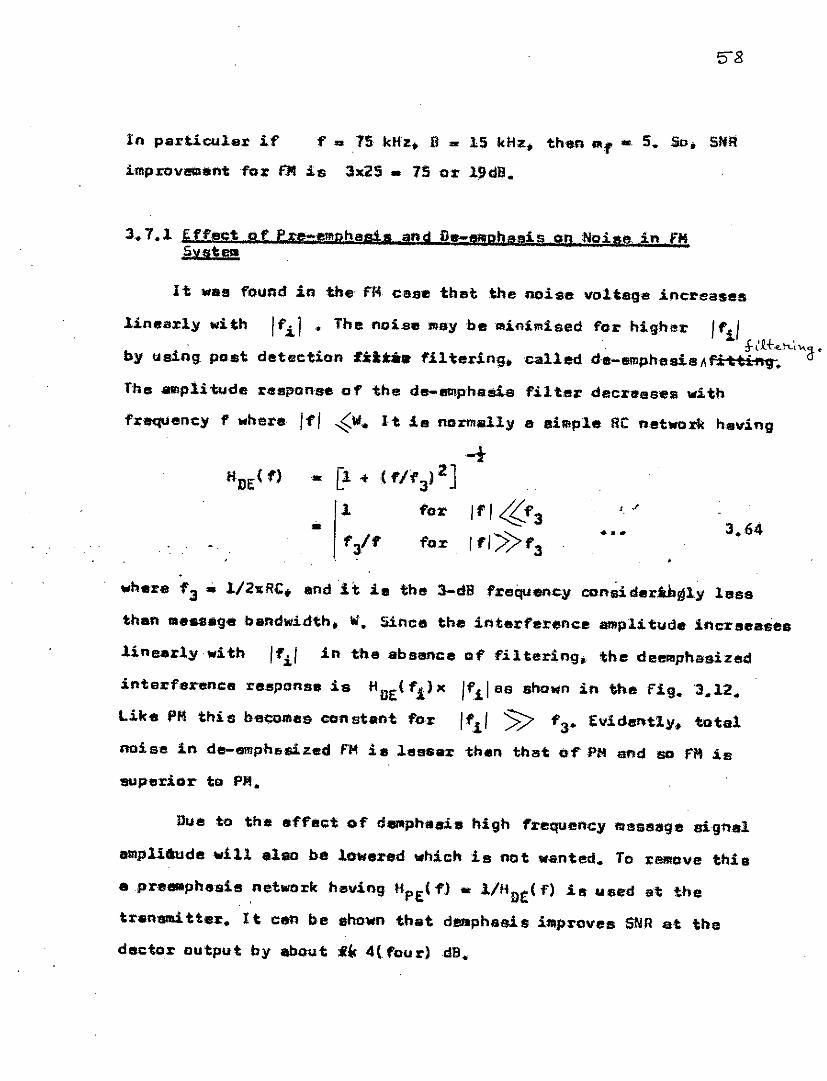
Inparticu~8r if
imp J:O vsan1:fo r FM ;i.s 3x25 • 75 or ~1IdB.
3.7.~ HIed of Pre-emphasisgOd D_ftpbaeiscn Noise in fHSyqb.
It was found in the f"I~ca81l tbBt tbe noise voltegeinereases
linearly ",ithby using po.st
1f'.11 • The noiae may be ainimlsed
detection f:il:na f'ilterin9.cal~ed
The amplitude response .of the de-lIllIphasS.s filter decreas.elil with
frequency f ••bere /t/ ~w•. It.i. narmll11y a simple at network heving
-tflDE( f) • [1 .•. ( f/f3}2]
1 for 1'/<Sf3 J, "
.- "1»'3 ••• 3.64- 'if for
.",hue "3 • 1/2",R~. and 1t ill tbe 3-dB frequencycon8iderih~ly las8
than lIe••• g8 bandwidth. W. Since the inter'erence8lllplitude inerseasea
linearly ••ith I'il in the absenceof filtering •. the deelilpbasized
intsrferenClI response is HUE( 'i) l!(
Like PMthi s beC:Oll'les constant 'nr
/'il as shown in the fig. 'J.12.
1'1/ » 13• Evidently. total
noise in de-empht>flized FMi. ~eS8ltr "than that of PM and so fM is
'superioT 109p~.
Due to the affect of dentphilsi. high 'requ.encYlllBss1lIge signal
ampli4ude will .• ism be lowered "hich Isnat want1!d. To remove thIs
• .pre8llphash netl«lrk hevlng "1'£(1) •• 1/"D£( f) is used .t the
transmitter. It een be shown that d.Mphasis illlproves SNRat the
dector output by ebout :itt 4( four) dB.
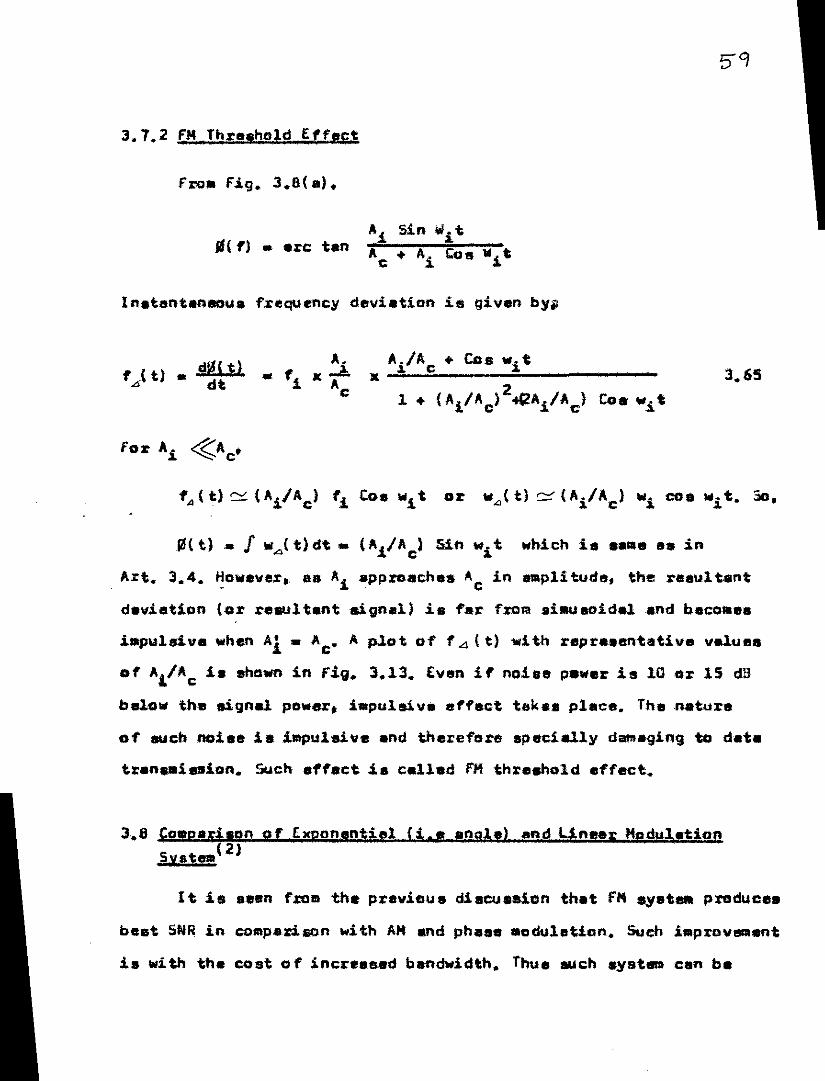
3,7,2 fM Th~e.hold Effest
JlII f) •• " tanAi Sin WitAc + Ai Cos 1111 t
In.tanteneou, frequency devi.tion is given bYi
, J t) • d!6l tl~ dt .,iCo. "it
(illt).! "'..,(t)eft - IAi/Ae' Sin "'it which ia •••• as in
Art, 3,4, ~o",eve;1". aa Ai approaches Ae in 8IIlplituefa. the r.ault,nt
deviation (or result.nt signal) i. f';1" fromai.ullOid.l .nd baeo.e.
i.pulsiv. ",henAi - "c. ApJ.ot of f.4 (t) with repre .•entative value.
of A"/Ac i. shown in fig. 3,13. Evan if noise p.wer is 10 0;1" 15 dB
below the signal power. blpuls1v. effact tak•• plac., Ttlenature
of such noi.e ia ia'pulsive .nd the:r:efcrespeeielly dD.ging to d.t.
tren •• i.lon. Such .1'1'act i. celled I"H threshold effect.
3.8 "'!lpari.pn of Exponential U.e.ngle) and Un!!; "edglll1:ionSvst8lll(2)
I t is 8.en fJ:OIIthe previou 8 discussion th.t f/4 .y.t•• produce.
be.t SNRin CQllIpadllOn with AMand ph.e •• oduleUon, Sueh i.provl!IIlIent
i. with the cost 0 f incre.sed b.ndwidth. ThUlllILIchsyst_ elln be
60
applied for :cases where hsridwidth.croqui3:emen~ is GecGndary faetc:lr
SOQclean ,slgruila a%'edes1red. Besides pow.srrlllquirement is lesser
for fM cass.
11'eomparieongraphissnown in Fig. 3.14 •. 1t Should tie. noted
that FMforsOIlIlII instances is inferior toPCM system •
. .! ,.... "'.'
.-." ",
.RltfERENCES
1. Membersof the TechnicalSteff
2. Carlson. A. Bruce
3. Connor, F.R.
4., Panter, Philip F.
5, Johns. P,B. andRowbotham, T,R
"Transmission System for Communi-cations". Bell T.e1ephoneLaboratories. Inc •• Revisedfourth Edition. 1971.p 180-194.206-211.
"Communication Systems",McGrawHi1.1 Book Company. Inc ••International Student Edition,1968. p 200-212. 439-442.
"Noise" Edward Arnold (Publishers)ltd,. 1st Edition, 1973.p 46-56,
"Modulation. Noise and SpectrslAnalysis". McGrawHill Book CompanyInc,. 1965 p, 172-178 .• 429-430.
"Communication System Analysis".Butterworth. and Companyltd, .•1972. p. 69-71.
CHAPTER-4
TECHNI QUES AND METHODS FOR MEASURING Nor Sf
£1
Prelimin!!ri es
In this chapter methods for measuring
an lal oj e.oo;.telllperet"J"iI will be discussed briefly. Also a discuesian
will be made about measuring units of noise and signal.
J 4.1 Noise and Signel Measurement( 1)
4.1.1 Noise
It is difficult to measure the limplitude of noise due to the
non-deterministic nature of noise waveforms and amplitude dependence
on bandwidth. I f an a-c voltmeter is connected to II noise source.
then since noise is random; meter reading will be fluctuated randomly
end it is so meaningless to measure noise i1'Lthis way. Thus. it
is usually necessary to average the noise amplitude over some interval
so that a moX'eor less constant mete.r reading i~ obtained. A meteX'
~hat integrates the reading over a time period which is long compared
to the reciprocal of the bandwidth removes most of the fluctuations.
So rillS noise voltage can be measured by en
over finite time interval end dividing the
a-c volt.eter by averaging2rms noise voltage by
resistor. noise power can be determined. Measurement of absolute
magnitude of noise power is not important. Rather it is important
to measure how much it annoys. telephone use ••. Thus measurement
of subjective effects of noiseie important. So; the mlier is designed
to measure the following effectss
(1) the readings should take into considerations the fact
that the interfering effect 0 f n!!lise will be a function of frequency
spectrum as well aeof magnitude.
(2) When different noises ars present simultaneously, the. . ..
meter should combine them to properly measure the overall inter-
fering effect .•
(3) When different types.o f noise. cause eqysl interference
as determined in subjective tests. the meter should give equal
reading.s.
Besides, the transient response of the meter should be
eimilar to that of the human ear.
Interference is made up of two components viz (i) annoyance
and (ii) the effect of noise an intelligibility. Both are function
of frequency. Hence proper frequency weighting is required in the
meter which is stated by. point '1' .bove: For. example, a 200 Hz
tone of given power is .25 dllJ.lees disturbing then a 1000 Hz tone
of same power. Hence, the weighting network incorporated in the
noisemeter will heve 25 dB more loss at 200 Hz than at 1000 Hz.
It is assumed (by several tests) that the effect of noise power . ~-- '/maximumat 1000 Hz. This frequency is used as the reference frequency
in Bell syetl!ml. But CCITTand CCIR(l) recommended reference frequency-is 600 cps. To determine weigh~ng at di fferent frequencies (1. e
frequency weighting curve) annoyance is measured in the absence
of speech by adjusting the level of a given tone until it is as
annoying as a re~erence 1000 Hz tone. This is done for many tones and
fo r many :i:IIlJUI.x.lltix1Iu:observers and the resul1:s are avereged and
plotted. A similar experiment is done in the presence of speeqh at
the average receivetl volume to determine the effect of noiae an
63
.rticulation. The results of the two experiments are combined
and smoothed resulting in the C-message weighting curve. Similar
experiments give other types of weighting curve. For paophometeric
weighting (CCIR and CCITT recommended) ths reference frequency
ie taken iiS aoo Hz. These are shown in the Appendix-B. Weighting.-like 144. flA etc. are not used ~(3).
Another important factor is that 5X~".~.,li' 3 l.j
noise add on power besis. Thus meter must also read in this way.
The last important factor is the transient responsaof the
humsn ear. I t has been found that. fo r sounds shorter than 200 lbec.
the humsn ear does not fully appreciste the true power in the.
Bound. For thi s reason the noi se lReasuring meter is designed to
give 8 full indication on bursts of noise longer than 200 mssc.
For shorter bursts, the meter indication decreases.
Thus. frequency weighting. power addition and transient
response of e noise measuring meter describe the way in which a
message circuit noise is to be measured. Besides. II noise referelnc:e
and scale of measurement must also be provided. The chosen reference
is 10-12' watts or -90 dBm. The scale marking is in llI.sill •• decibel
and measurements are expressed in dB above reference noise (dBrn).
For peophometric reading, this reference is et aoo Hz and for
Bell system it is 1000 Hz(l).
In particular. let w(f) represent the weighting of the noise
shaping network in dB relstive to 1kHz reference frequency. Thus,...w( f) /10
= 10 •••
64
Where H("') is the transfer function of the weighting network.
The total weighted noise power for noise density of Pi (f) watts/Hz
is given by
PT • f« iH(f)/2 Pi(f)df wettso • • •
The effect of weighting over the frequency range 1'1 to 1'2 is given
by 1'2f p~(f)df'l' ,.A .. 10 10 g .....,,..1••••. _
1'2 [ 2f H(f)! p.(f)dfl' .1-1
dB ...•.
Thus. weighting network attanuates the noise power by ).., dB. for
fl~ O. 1'2=3 kHzj (telephone chennel) }- .•• 2dIl for flat Pier)
and C-message weighting. for psophometric weighting end flat Pie f).
" becomee 2.5 dB.~
Till now. measurement of noise is considered,f!Jrt.,lephone.
chennel with analog signal. for analog TV signal. separate type of
weighting is required .according to the effect of noise to eye.
Digital signals such as Data and PCMere not affected by no~se in
the same way as analog voice signale. for example. the annoying
hiss due to thermal noise has no effect on digit~ sign81s unless
its Ilmplitude approaches the amplitude of the signals. On the other
hand. illlpulseswhich cause tolerable clicks or pops on voice circuit
result in almost certain errors becaJlli5S1:of their high amplitude.
Thus separate type of noise measuring techniqu! is used for digital.
signal. Details can be found from reference. (6)
&5
Signa.ls
Message or speech signal is alsononperiodic (otherwise no
information) and so difficult to messure. the nature of speech.or
pJ:ogram signal is such that the average. r.m.s. and peek values a
are irregular functions of time SlJ that one lIumber cannot specify
any of them. But regardless of the difficulty 0 f the problem •. the
magnitude of the telephone signal must be measured .and ,characterized
in &Omefashion so that proper design of transmission media can be
made. Signlll magnitudes must be sdjusted to. avoid overload end
distlJrtion and gain and loss must be measured. for this purpose
a characterized unit called volume uni t( vulis used. It is an-..---- _..... .-~------ ----emperical kind of measurement evolved to meet prect.tcal need. and is
not deT'inable by preci se mathematical formul,a. The vu. meter used
for this purpose gives the reading in vu. The pri.ncipal functions
of the vu meter are
(l) Measuring si.gnal amplitude in a manner which 'will enable
the user, to avoid overload and distortion.
(2) Checking transmission gain and loss' for the complex signal.
(3) Indicating the relative loudness with which the signal
will be heard when conve~ed to sound.
for convenience. the meter scale is made logarithmic but
unit is vu not dB. It can be related with dB by ths following
relation;
Average power. vu - 1.4 dBm ••• '...Such relation hold fora continuous t~el'l. E=:I: ," I i filii , en
66
! aU wr. for no,nco,ntinuous talker the relation is
Average power'"' vu - 1.4 + log log"""- L dBm ... 4.5
~.
Where '"Y L is the load activity factor. It should be noted that vu
meter has a flat frequency response over the audible range and is
not frequency weighted in any fashio,n.
/4.2 Uniots for Measuring Noise and Signal
4.2.1 Signd
Since telephone cirCuits operate with signal powers which
rarely are as large .liS 0.1 watt. and which may be lower than 1 pW
(pica weott). the use of watt as a unit
A convenient unit is the milliwatt i.e
of meas.rement is awkward.-310 watt. Many operations
can further be simplified by expressing power in relative dB.
Normally power is compared with one milliwatt and then. expressed
in dB. This is called dBm. Thus a power of i mil is odSm and a
power of 1 pWis 10 ~og(10-12/10-3) dam or - 90 dBm.
Noise
It was shown in the previous section that for both psophometric
and C-message measurement reference power of 1 pili is takan. Reference
frequency for weighting is BOOcps for psophometric weighting end
1000 cps for C-message weighting. Psophometric noise power is the
average noise power delivered to 600 Ohm resistance and expressed
liS picowatt psophometric (pWp). Thus
pWp •• I h t. mVl.2..psop ome rJ.C _600 x 106 picowatts •••
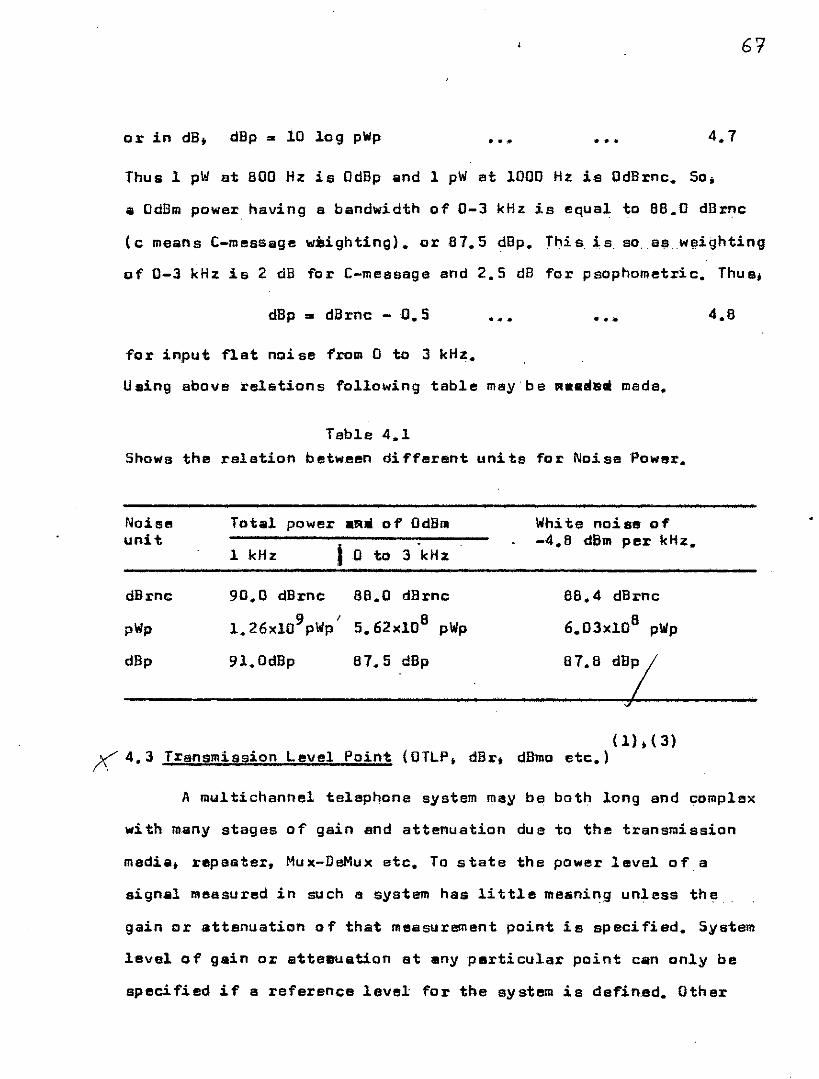
orin dB. dBp '" 10 log pWp .. ,. • • •
6'1
Thus 1 pW 51; 800 Hz is OdBp _IOd1 pW at 1000 Hz is OdBrnc. So_
a OdBmpower having a bandwidth of 0-3 kHz is equal to 88.0 dBrnc
(c mSliIns C-message waighting). or 87.5 d8p. Thi s is. so. esw!lighting
of 0-3 kHz is 2 dB for C-message snd 2.5 dB for psophometric. Thus.
dBp •• dBrnc -0.5
for input flst noise from 0 to 3 kHz.
••• •••
UlIing above relation s following table may. be " •• Iblll mads.
Table 4.1Shows the reletion between di fferent un! ts fo l' Noi sePower.
Noise Total power .111. 0 f 0dBllIunit
I1 kHz o to 3 kHz
dBrnc 90.0 dBrnc 88.0 dBrnc
pWp 9 . I 5.62xlO8 pWp1.26xlO pWp
dBp 91.0dBp 67.5 dBp
White noiae of-4.6 dBm per kHz.
88.4 dBrnc
6.03xlOB pWp
67. B
(lh{3)K 4.3 Transmission Level Point (OTLP_ dBr. dBmo etc.)
A multichannel telephona system may ba both long and complex
wi th m.sny stages 0 f gain and attenuation dua to the transmi ssion
media, repeater, Mux-DeMux etc. To state the power level of a
signal measured in such a system has little meaning unless the ..
gain or attenuation of that measurement point ie specified. System
level of gain or atteDuation at any particular point can only be
specified if a reference level for the system is defined. Other
68
points in the system may then be expressed in terms of dB of
gain or attenuation relative to this reference level. In telephone
system; this reference level is called zero level point or zero
TLP. It is the point at which standard test tone has an absolute
power of ImW or OdEm. This point is often situated in the trunk
exchange (toll office) at the transmit end of long haul system.
The level of any point in the system expressed in decibeJ.s
relative to the zero TLP is referred to as the relative transmiss-
ion level 0 f th ilt point. It is designated by dEr 81though TLP is
some times used. Thus a - 33 dBr (or - J3 TLP) point in a system
will be 3J dB below the zero «TLP point. It should be noted that
dEr is. not a meaaure of power. I f signal power is measured at any
point in the system in absolute terms (e.g dEm), it may be related
to nominal loading levels by expressing it relative tothe trans-
mission level at that same point. Power levels specified in this
'way are given the suffix O. Thus dBmo is used to indicate the
signal magnitude in dBmreferred to OTLP. Then dEm and dEmo is
related by
dBmo= dBm_ dBr ••• • ••
Similarly,; dBmopmeans power of the point referred to zero TLP
with psophometric weighting.
y 4.4 Measurement of Effective Input Noise Tempera1:ure andNoise figure
The above two parameters of a networl< can be measured normally
by two ways viz. (1) calibrated noi se source and (ii) calibrated'-
• 6'1
signal source. Tha first is more convenient to use as it does not
involve bandwidth of the noise of the system which is gnerally
difficult is know accurately. This can be shown by the following
description.
/' 4.4.1 &t.i.a Cslibrated Noise Source
fig. 4.1 shows 1;he circuit for measuring noise figure and
noise tempara1;ure. Let T1be the noise temperature of the source
due to its internal terminating resistance when the generator in
the noise source is turned off. Noise temperature of the source
becomes T2. when the generator is on. Now. the noise power measured
ilt the output of the two port network under test under the generator
off lind on conditionll are resp,ectively
and
••• ..'....
4.10
where 9t •• gain of 1;he netwo rk
BW = noise bandwidth of the network and power meter combi,ned.
noiseTs •• effective input/temperature of the network
Now; let~ '" P2/Pl' then r is given by.
or,
•••
•••
Thus. the value of T can be determined by using the above relation.e
70
Now; the noise figure; f. of the two port network is
given by.
F = 1 + T ITe 0
Tc-i-o•• y - 1 .... 4.13
If the source impedance ie at standard temperature; (i.e T1 •• To)
then.
F •• ••• 4.14
Thus f can also be determined.
Sources of white noise that can be used for such measuremente
are the temperature-limited noise diode Ii. e shot noisel, the
gas tube n£lise generator. and resistors at di fferent. temperatures.
The temperature limited noise diode represents a variable'noise
source Useful at frequencies lsss than lGHz. The noise output may
be changed by simply varying the anode current of' the diode. The
gaa tube noise generator may be used for MWfrequency regions.
I f resistors ara used for the purpose of noi se gener.atlion; then
eccurate temperature may be obtained by immersing resistors in
icebath. liquid nitrogen baths etc.
>( 4.4.2 Calibratad 5ignal Source
This method is similar to the above method except that in
place of noise generator iii signal source is used. When the generatar
is on, the available signal power is Pc' It is assumed that the
generiltor source impedance is at standard temperature TD
• Powers
71
measured at the output of the network with the generator off and
.n are respectively,
•••
and•••
gtkBw (Te .• 101 .• gtPcgt + kBW ( Te .• To )
••• 4.17 •
and F •• 1y-l lC •••
v-V5 Noise Loading Method
~ In the laboratory and field testing of multichannel message
system. noise loading test method is mostly used. In this system
multichannel messege signal is simulated by proper whit. noise
level. I t is found that when several subscribers IIre*akic"I}(lCi:kllJl
talking, then the resultant signal at the bSlilband i8 like a white
noise. Thus a white noise can simulate the signal of multichannel
message. It is found that the average loed of a multichannel(3)
system is
p = - 15 .• 10 log Nav ...
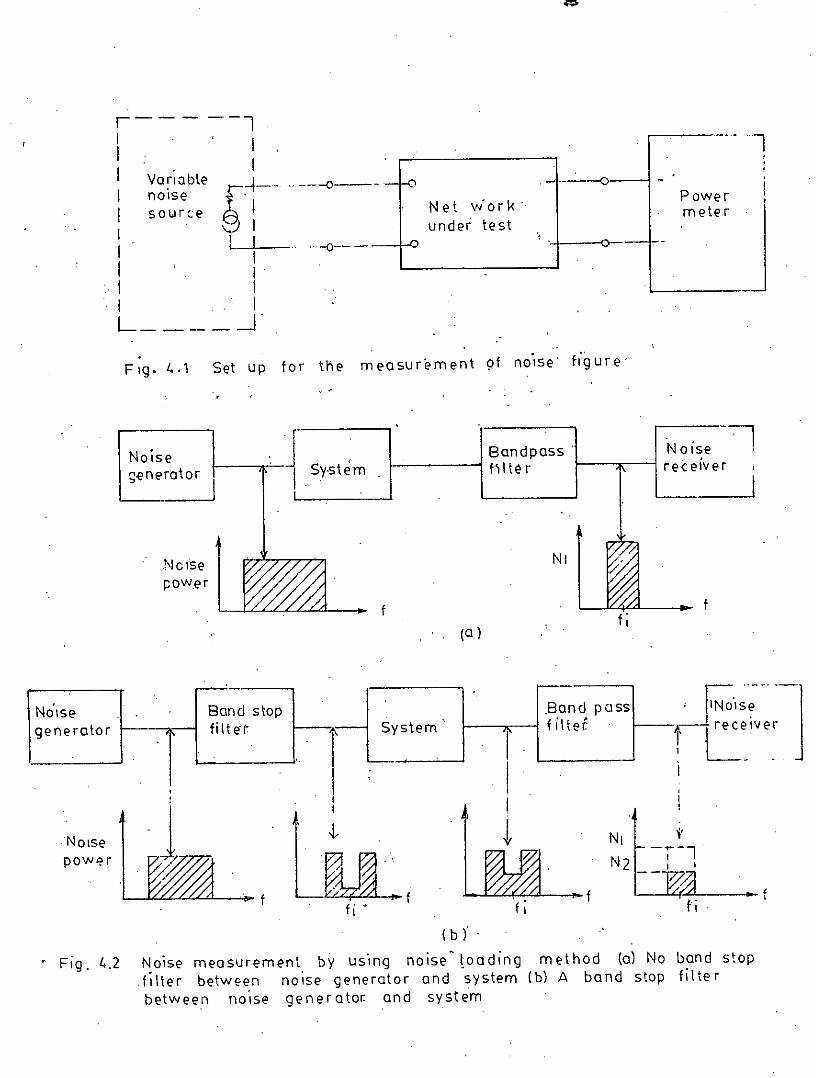
..---0---
r--- --lI II II Varloble I
II noise r'~I--sourte @>
: L_~I__II I
I iI IL ...J
..-0'--
Net ",jork-under test
l
Powermete r
Fig. 1,.1 Set up for the measur~ment 9f no'1se figure.. -
Noise-;:enerator
-'~'Bandpass'fl Ite r
Noise -~receiver
Nelsepower
f(0)
Nt
f
NI V
N2---;--l
I I
~f l
IiI
,It
f
.Band pass , 1
System f il tet I
I t•. 1
f
,NOisepow,?r
NOise Bond stopgenerator fi It er
'.
,
( b) .
• Fig. 1,,2 Noise measurement by us',ng noise' (oading method (0) No bond stopfilter between noise generator and system (b) A bond stop filterbetween noise generator and system
which is elCceededonly one percent of the time at the busy hour.
Hers, N is thschannel capacity of the system and Pavis the
value at zero TLP. Thus the simulated white noise must heve a
level of - 15 + 10 log N dEmo. This relation holds for N> 240.
The derivation 0 f th e above relation may be found in the references! 1)
rig. 4.2 shows the measuring technique of noise power ratio
(or SNR) using white noise method.
,Procedure
The noise generator g~nerates the simulated signal. It is
then impressed at the system input. At the system output a band
pass filter is connected. The bendpass filter has abendwidth of, ,
one message channel. Normally, arrangements. for three center
frequencies_ are there at the band pass filter. One frequency is
used for measuring lower chllnnel noise, o.ne is for.middle channel
and the third one is for higher channel noise me.sarement. Thu!!,
noise receiver, whichie cannected at the output £If the bend pass
filter, (4kHz sbout fil lIeasures noiss in the channel at center
frequency fi• Let the reading is NldB.
Now. a filter .is introduced between system input end noiee
generetor. This filter eliminates the noise in the message channel
at fi• If the system is noiseless, then the measured output by
noise receiver will be zero. But actually; there are inherent
noises in the system and the receiver will read some value at the
slot channel fi• Let the reading is N2 (in dB). Thus; noise power.
ratio (NPR) i B gi ven by, - N2 + N1 '" NPR. Now, SNfl (signal !G noise
ratio) is defined at OTLPpoint. Since, at zero TLP point a load of
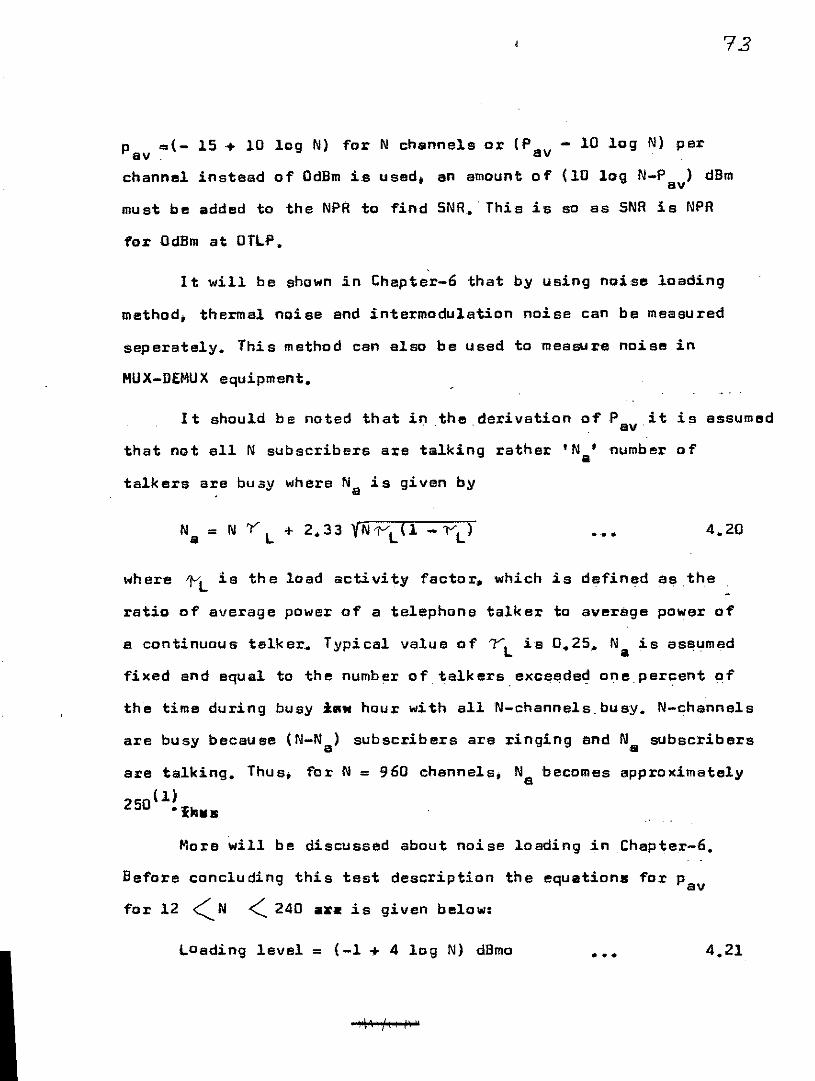
72
must be added to the NPR to find SNR•. This is
15 + 10 log N) for N channelsor(P av - 10 log N) perp =(-av .channel instead of OdBmis used, an amount of (10 log N-P ) dBm
av
so as SNR is NPR
forOdBm at OTlP.
It will be shown in Chapter-6 that by using noise loading
mathod, thermal noiee snd intermodulation noise can be measured
seperately. This method can also be used to measure noiSl!! in
MUX-D£MUXequipment.
I t should be noted that in .the derivation of Pav it is assumed
that not all N subscribers are talking rather 'Na' number of
talkers are buay where Na is given by
••• 4.20
where t-t is the load activity factor. which is defined ae .the
ratio of average power of a telephone talker to aVl!!rage power of
a continuous talker~ Typical value of 'YL is 0.25. N. is assumad
fixed and equal to the number of talkers exceeded one. percent of
the time during busy illll hour with all N-channels.busy. N-channels
are busy becau sa (N-Na) subscrib ers are ringing and Na subscribers
are talking. Thus; for N = 960 channels; Na becomes approximately(1)
250 • fill II III
More will be discussed about noise loading in Chapter-6.
Before concluding this test description the equations for Pav
for 12 <N < 240 a:u is given below:
lOading level = (-1 + 4 log N) dBmo
,t Ii / I P I,
•••
4.6 Out of BAnd ~toi'l1 Me@surelllent
International. recomlllendation exists for G noise IISlt.U ring
techni.qult known 88 out .of band testing which can be carried out
dudng the trenllllllin10nof actual tra1'fic. The principle 18 ai_iIar
to floiee loading method. Here a Iluaasu ring channel is located
approximately l.O~outsids the baseband and a bend stop filter at
this frequency i e inSErted peX'llianently at the aystSlll input to
ainimise nois9 due to lnco.ing circuits. A whits noise receivertunad to this channel cantinuouely !DonitOr the dietortionnoiseoccuring due to the tX'eft'ic lasding in the base bend. The IIltraeurinq
channel msy be above the baseband in which cese it will be more
sensitive to changes in the~al and intermodulation noise in the~-f and i-f seetions 0 f radio 9;)'9t __ • l.ocating the channel below
bS5eband will generally give leltels more sensitive toehangl!lS in
multiJillaxJ!ing/de-mul tiplexing equipme!lts. OBN(when used for
eatalli.te eystem)frequency i. different for different g:mund s1:e-
tiona.
Since lIleasurement .i 9 lIad. during Ilctuel traffic 1:rlllnsllli.aion
ita accuracy is li1llitad due to variable natun 0" the traffic loading
11!l\lel.end the fect that e1'faet. within the basebend can only b.
predi.ctad rather then measured directly. for these reason8 •• ffOlrt
ia presentl.v being expanded in U.S.A and elsewhare .i.;ntc 'the probl_
af monitoring S)'81:eID psrfo:tlllsnce eu1;o1lle1:1c81ly1'or eigne of' ayetlllll
degradaUon during actusl traffic ;condition.
'.
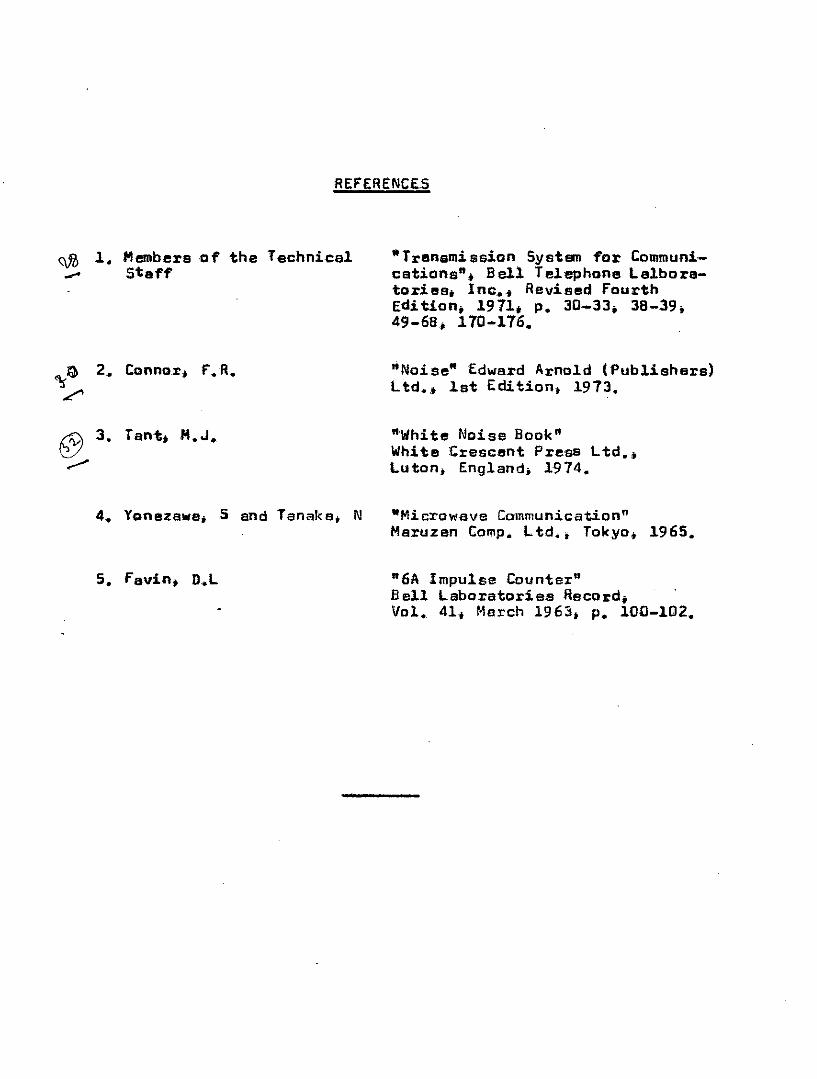
REFERENCES
1. Membereof the TechnicalSteff
4. Yonezaw8; 5 and Tanaka; N
5. favin. D.l
"Trensmission SystElll for Communi-cations". Bell Telephone lelbore-tories. Inc •• Revised fourthEdition; 1971. p. 30-33; 38-39.49-68; 170-176.
"Noise" Edward Arnold (Publishers)Ltd •.• 1st Edition. 1973.
".White Noise Book"White Crescent Press Ltd ••Luton, England. 1974.
"Microwave Communication"Maruzen Camp. ltd., Tokyo. 1965.
"6A Impulse Counter"Bell Laboratories Record.Vol. 41. March 1963, P. 100-102.
CHAPTER-SNOISE IN CABLES AND SWITCHING NETWORKS
!
7'5
5.0 Preliminariee
In this chapter discussion will be made sbout noises and
interferences in cabl.essnd switching networks. Important sourcee (If
~.ise in cablee are crostal.k. thermal. noise. l/f noiee (or contact
noise). conducted or radiated interference. The main sources 0 f
noiae in switching networks are relay arcing, coupl.ing by battery
internal resistance. coupling by ground contact resistance. and
other interfering sources (e.g feul.ty flourescent lamp. generator,
motor etc.). Results bassd on the measurements taken in the swit-
ching system and cable network in Dacca city will also be given.
finally, discussion will be made based upon the results.
5.1 Noise in Cables
It is ,clear that the term' cable' includes (i) multip aired
teleph.ne cable (primary, secondary and junction)' and (ii) co-axial
cable used for carrying base band signal in longk •• i1 haul trans-\
mission. for long haul transmission, co-axial cabl.e is not used
in B.angladesh at present though such iii system is planned for
communication between Dacca and Chittagong. Normally r-f system
is used to transmit baseband signal in our country. Of course.
there are somBoverhead physical lines to carry baseband signals
at some areas. Considerations will be made here only for multipairad
telephone- cable which is extensively used as primary, secondary
and junction cable elsewhere.
I mportant sources of no1 se in cablas ara (i) crosstalk
(ii) thermal noise (iii) l./f noise. Besides. interferences may be
j
76
preaen1: in two ways (i)conouction and (ii) radiation. These
will be discussed in the following sections.
5.2 Thermal Noise
SdYV\.€-Each pair of telephone cable has elillH'Saresistance. So.
thermal noise is present in each pair which is dependant on the
ambient temperature. The meximumthermal noise power 1:hat can
be delivereo to the load is KTB(B • bandwidth) which takes place
when source impedence is complex conjugate of loed impedance.
5.3 lIf Noise
Such noiae arises due to the loose contact. Mathematical
expression is given in Chapter-2. Loose contact ari ses sp ecially
in PE(polythenej( insulated) cables where normally jointing is
made by t\~isting the conductors without using soldering. Besides
in lead cable Ilf noise may arise due to dry soldiaring in joints.
5.4 Cross-talk
Croes-talk is defined 8S the disturbance created in one
communication circuit_by the signals in other communication
circuits. So it is a sub-division of the general subject of
interference. It is the disturbance created by another circuit
due to circuit nonlinearities; transmittiance and electromagnetic
coupling. The disturbance created by another circuit due ~
electromagnetic radiation is not considered as cross-talk, it is
rather considered as interference. Cross-talk ",as originally
77
used to indicate the presence in a telephone receiver of unwanted
speech sounds from enother telephone conversation. But i twas
found that the methods for computing such craBs-talk quantitatively
••ere applicable for nontelephone circuits also. So; the ttal:l1l crOS8-
talk ultimately broadened to apply to interference between eny
kinds 0 f communication circuits. J
Cross-talk may be intelligible or unintelligible e.g. croes.
talk between unlike channele (in a 'carrier system) is usually
unintelligible because of frequency inversion. frequency displace-
ment or digital encoding. On the other hand ere ss-talk in multi-
paired telephone cable illl intelligible as there is no question
of frequency inversion or displacement. Undesired intermodulation
products in a fDMsystem are usually un-intelligible crose-talk.
Intelligible cross-telk is more annoying than unintelligibl.e
one and also objectionsble because of loss of privacy.
In case of nonvoice circuits;intelligible crosstalk means
unwanted signal 0 f the same type las the desired signal. Nti;rmally.
unintelligible cross-talks both in voice and nonvoice circuit
are treated as noise(2).
In this chapter; crosstalk in multipared cable will be
considered. Cross-talk in fDMsystem will be di scu ssed in
Chapter-6.
5.4.1 Crosstalk in Multip~ed Telephone Cable(2}.{1)
In multipaired telephone cable croastalk arises due to the
different types of coupling between conductors. Coupling mey be
78
by induct,ance. capacitance til' by resistence. The coupling
phenQmenon may be illustrated by using the figs. 5.1. It is
assullled that transmission paths are short in terms ,of wave
length (at f = 3kHz. A = 1000 kH; «luI telephonecab&e length
is much below than this value of f.- ). Thus inductances and
capacitances cen be considered as lumped element parameters.
The two capacitors shown as cu/2; characterize the unbelanca
capecitence; c; between the circuits. components of c includesu u
all the direct capacitances shown in fig. 5'.1{b)(2). Capacitances
to ground are neglected. Thus;
••• 5.1
ascIJ and c24 produces, disturbance in the same direction and
C32 and c14 also produces disturbance in the same direction
which is opposite to that of c13 and c24• The two circuits are
assumed to be connscted for maximumpower transfer II i. e &0 = ~.NO~J.current io in the disturbilOg circuit causes a voltage;
va '" ioZo; to appear across tiffs circuit. In the disturbed
circuit. this voltage causes a current;
Normally;
'lZ.i=ci .4a 04/jwc + Z /2
u "
••• 5.2
%.1 •• jwi Z c /4C 0011 ••• 5.3
A current of ielffl = jwioZoCu/8 appears at each end of the dis-
turbed circuit BS shown in the fig. S.l{ a).
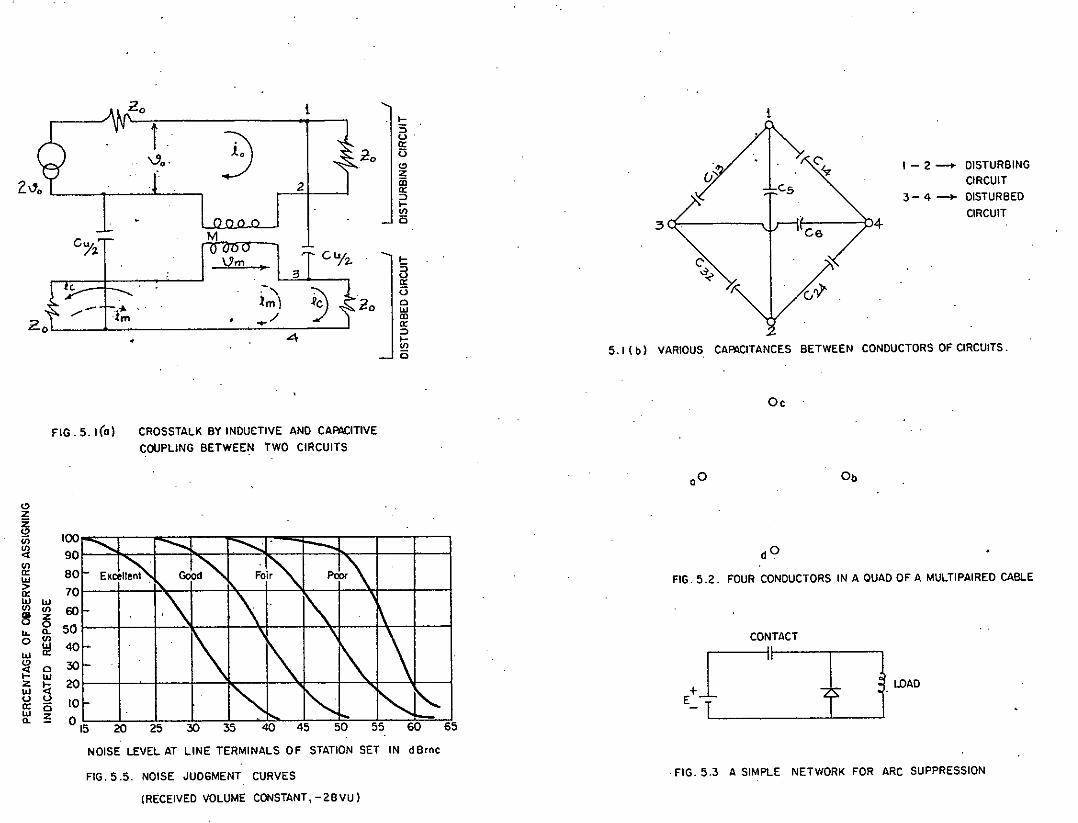
5.1 (b) VARIOUS CAPACITANCES BETWEEN CONDUCTORS OF CIRCUITS.
I - 2 _ DISTURBING
CIRCUIT
3 - 4 -+ DISTURBED
CIRCUIT'4
1
:3
i"' ..
20
•
..•..fm,.-
t
C~2.
2.0
Oe
FIG.5.1(0) CROSSTALK BY INDUCTIVE AND CAPACITIVE
COUPLING BETWEEN TWO CIRCUITS
0° Ob
C>Z
~<Il~<Ila:UJ>a:UJ UJ<Il <Il~ ~••• Q.o <Il
UJUJ a:~ 0I- UJ
Z ~UJ UU _a: 0UJ ZQ. -
100
90BO70605040302010
o 15 65
dO
FIG. 5.2. FOUR CONDUCTORS IN A QUAD OF A MULTI PAIRED CABLE
CONTACT
"til I~-NOISE LEVEL AT LINE TERMINALS OF STATION SET IN dBrne
FIG. 5.5. NOISE JUDGMENT CURVES
(RECEIVED VOLUME CONSTANT, - 2B VU)
. FIG. 5.3 A SIMPLE NETWORK FOR ARC SUPPRESSION
79
Now. the effect of mutual inductance'Mtmay be cDnsidered.
currentio in the disturbing circuit produces a voltage vm••iojwM
in the disturbad cirt:uit. This voltage causee a current.
••• 5.4
The shielding effect of intervening conductors or shields may
reduce the unball!lnce capacitance Cu and the mutual inductance
M. and thus reduce theeurrent coupled into the disturbed circuit.
Equations 5.3 and 5.4 are the coupling crosstalk cur~entl> due
'to tha capacitive and indu c'ti ve coupling respectively. Thase
may be classified into 'two groups: (i) Near end cross'talk (1i)
far end crosstalk. Near end cTosetalk (NEXT)is cr~sstalk whose
energy 'travels ,in the opposite dir'ection to that of the signal
in the disturbing circuit. It occurs,at near end. Thus, from
Fig. 5.l(a). N£XTcurrent ie given by in = i - i and thec mNEXTratio is
inti = jwc Z /a + jwM/2Zo u 0 0 ••• 5.5
Similarly, far end crosstalk (fEXT) i,s crosstalk whose energy
travels in the same direction as the signal in the disturbing
circuit. Thus rEXT current is if" ic + im and rEXT ratio is,
if/i •• jwc z /ao uo • • •
From equations 5.5 and 5.6 it is clear that capacitive crosstalk
and inductiva crosstalk oppose each other for fEXT,and add for
NEXT.Thus NEXTis mo,rs serioue problem., The degree of cancella-
tion in the far end depends upon the magnitude of unbalance
go
capaci tance. indu ctance and Zoo from eqn. 5.6. it is seen that
for high impedance circuit (high lol. capacitive coupling is
the most significant moda of croastalk interference. On the
other hand for low impedance circuit inductive coupling is
more significant.
The two types of crosstalk discussed above are direct
in nature as they arise due to the direct coupling between
disturbing circuit end disturbed circuit. Crosstslk may ba
arised also by indirect coupling. In such case., the crcsstaJ,k
is callad indirect crosstalk. Coupling between the disturbing
line and disturbed line by way of a tertiary circuit, is called
indirect coupling. I ndi rect cro sstalk can be subdi vided into
two groups:(i) transveree indirect (ii) interaction indirect.
In casa of trensverseindirect crosstalk. ,crosstalk currant,
occurs via the tertiary path but it does not flo>'J through the
tertiary path. Such crosstalk occurs when tertiary circuit
(s. g ground return circuit) changes capacitance unbaJ.ance between
two circuits. In balanced system any unbalance to tertiary. . . - . .'.
rel!lults in transverse indirect cro sstalk. e. g resistan ce unbalance
caused by unequal wire diametars or poor joints and inductance,
unbalance caused by one conductor being unsymmetrically wrapped
eround its mate.
In case of interaction indirect crosstalk. tertiary circuit
elsa carry crosstalk lI:iclrll:QIi::t current. Such crosstalk occurs
specially in repeateredsystem. Coupling takes place at the
repeater aections. These are four types viz. Near-end near-end.
81
far-end far-end; far-end Near-snd and Near-end fer-end. Besides;
additional crosstalk occurs in any cable when mismatch exists
in the cable. Hismatch in disturbing circuit causes some energy
to be reflected which by coupling appears at the disturbed circuit.
Mismatch may occur at cab1.e joint; repeaters etc.,
I t should be noted that to reduce crosstalk in multipaired
cabla (where capacitence is very high as the conductors are
closedly spaced and which is the main ceuse of .erosstalk) the
conductors are .grouped in four to form. a quad as shown in
fig. 5.2. Conductors lllilm e and b form one .PElir and conductors
c and d form another jiair. In this arrangement both wires .of
transmission line a-h ars equidistant from c and d condoctors
of other line. This causes to neutralise tha induced effect
(both inductive and capacit:i.ve) on line c-d by conductors' a'
of line a-b; by induced effect on line c-d by conductor b of
line a-b, In other words; the two transmission pair in a quad
are balanced and so no crosstalk occur. A multiconductor cable
contains many pairs of conductors arranged in quad form. Trans-
positions are provided to reduce crosstalk between neighbouring
quads by continuously rolling together the four wires of each
quad throughout the entire length of the cable.
But in practice capacitance and inductance unbalance
takes place between the pairs in a quad and pairs between quads
due to the follo~Jing reasons:
(1) The dismeter of the copper conductor mayvary slightly,
(2) Thickness of the insu1.tating material may vary .•
(3) Some conductors may be longer than others due to
twisting of quad conductors and layers.
(4) The formation of the quad may not be regular throughout
the lengthDf the ceble. ,
The capacity unbalance, the main cause of crosstalk, may
be compensated by adding capacitances between conductors at the
joints. Before doing so, all quads in each length of a cable
in a route are tested for capacity unbelance. Quads in each of
the cable lengths are then chosen and jointed together so that
capacity unbalances of quads in one length of cable .are compen-
sated by that in another length of the cable. The remaining
unbalances, if any, may be compensated by using extra capacitances.
5.5 Conducted Interference j
The previous di scu ssion co vers noi ses that are generated
within the cable itself. But outside interfelrences may alSD
present within the cable. Such interference may enter into the
cable in two ways viz. (i) by conduction (ii) by radiation.
Interference by conduction i.e conducted interference will be
discussed in this section. Ths following sectian will cover
radiated interference.
Equipment must be connected to other equipment, equipment
must be connected to commonpower system, and equipments -also ..
must be connected to commongrounds. Signal from one equipment,
thus, can enter into the another equipment by such connection.
83
This i. called conducted interference. Thus conducted interference
is that interference which enter into a circuit by conduction, Ceble
pairs of a mu1tipaired cable are connected to various equipments
in the exchange. Unwanted signals from these-equipments can enter,
directly into the cable by conduction resulting conducted interf'er-
ence. These unwanted signals must be removed as much ae possible
by proper filtering. Also. the conducting medium mey be made in
such II wey that it does not pick up unwanted energy. Of course, if
the interfering signal falls in the voice band; then some times it
bec.mee very difficult to eliminete it end ultimately it eppears
at the receiver as interference.
5.6 Radiated Interference
The interference that enters in the cable (or equipment) by
radiation is called radiated interference. The magnitude of inter-
ference that appeers in the circuit depend on the following _factors:
(1) Physical length of the exposed conducting medium
(2) The intensity of unwanted signala or fields to which the
conducting medium ie exposed.
(3) Particular types of interfering fields involved.
(4) Ths impedance of the termination to which the perticular
conducting medium connects.
Shielding is the only practical method 0 l' suppressing inter-.
~erence which is radiated directly from a source. A perfect shield
will not allow the passage 0 fai ther electrostatic or electromagnetic
energy. Shielding partially reflects the interfering signal, and
absorb the rest. The absorbed portion is attenuated as it passes
through the metal shield~ A good shield to contsin the interference
should setisfy the following requirements:
(1) It must be able to confine undesired signals that are
generated within the case (e. g. signals in the conductors of elle
cable are interference for another nearest cable) or reduce them
to such an extent that they do not cause malfunctioning of another
cable (equipment) .•
(2) It must be able to prevent inside cable (equipment) from
.eceiving undesired signals that exist in the erea •. The interfering
signels may be from adjacent power lines; open wireptelephone
line. telegraph line. any nearest electrical arcing etc.
The efficiency of shielding is measured by the term 'shielding
effectiveness'. It is defined by
'...where 5 is the shielding effectiveness and R is the reflection
loss in dB and A is the absorption lass in dB. for ref~ection loss
in metallic shields. R is given by( 1) •
R "" 20 10910 ••• 5.8
where
Z isw
Z is the intrinsic impedance of the metal barrier and8
the intrinsic impedance of the reflected electromsgnetic weve.
••• 5.9
where f •• frequency; G = relative conductivity of metal referred
to copper. u = relative permeability of metal referred to free
space, and t •• thickness of the shielding meterial in mils.
Another term known as "shield factor" is also used which,
is defined by the ratio 0 l' the resultant voltage in the interfered
with circuit, after the shielding is used, to the nonshielded int •• -
fered - with voltage.
It is found that e metallic shield that is ungrounded will
reduce at least one half of the interference. where.Bs+ a met~llic
shield with a good ground, ",ill reduce about three quarters of the
interference(l). Thus it is practical to ground cable .!Shiel-ds.
This also assures that potential differences will beminimmzed in
shields and so little current flow will occur in shields •./"
.Interference in Tele hone Exchan e
Various types of machineries and equipments ere used in the
exchanges. These are the sources of interference e.g. d-c rotating
machineries like electric motor, generator, drill etc. generates.'
interference due to arcing produced in the process of commuti3tion.
Similar type 0 f interferences occur in motors containing alip. rings.
Oxidation is another perennial sourcs Q f intier.ference in rotating.
lIIechineries. Oxidation film is generally formed irregularly causing
variations in the sliding control resistance which in tern causes,
the d-c current to vary. resulting in r-f interference. The oxidation
film also sets up a rectifier condition which makes transients
possible since the resistance vary non-linearly; depending on whether
86
the brush is positive or negative.
In machines where rotor and stator are not electrically
connected. interference develops because of the discharges of the
electrostatic energy which builts upon the seperate moving parts.
This becomes important specially at high speeds. where. for example;
the greaee or lubricant between the inner and outer 'cases of a
ball bearing acts as a dielectric. Energy buields up Qn,both siElae
end eventually discharge takes place across the dielecttic. Of
course a conductive lubricant would eliminate this problem. however.
this technique is not yet used commercially. "nottler successf'ul
technique is to ground the rotating shaf't by use of slip ring. In
case of'commutetor machines, capacito,rs are connected. to reduce,
interf'erenc,e. across bruah holder and machine f'rama. It is obvioua
that machines containing no com"".utation or slipringproduc;es, Ileg:l.i~
gible interf'erence. Thus induction motors are best for this purpp~
Interf'erence due to arcing also generates at switches, relays.
flourescent lamps etc. Speciel networks can be designed for arc
suppression. These networks eliminates. as much as possible., any
transient that may occur during a switching operation. A typic~l
circuit ia shown in Fig. 5.3. When contact is made. the instantaneous
current is low as the diode is r,eversed biased and current through
the inductance changes slowly. Whencontact breake, .a negative<==> . -------- - -surge voltage appears across the .1oad and so current. flo,",s , through,
the diode. At this point. the instantaneous voltage across, 1;~con1;act--,~- - . r ~ -
is the supply voltage plu s the small voltage drop aeross the diode •.~ . . ~ --------
Other types of suppression networks, ar~sg~ed.__ - _. __ -_" ~ __ ~ __ ~ d~
'87
An important source of crosstalk interference ie the battery
internal resistance. Since a battery supplies power to different
ci rcui ta, coupling tak es place by its internal resistance. The
lower the internal resistance, the lower will be the crosstalk
interference. The value of internal resistance becomes fixed during
th edesign of the battery. But thi s resistance increases if the.
battery is not maintained pxoperly. Besidas; if power drawn from
tha battery is small er; then current from the battery will be
stnsller and so voltage drop across the internal resistance will
be lower causing lower crosstalk. Obviously; if different batteries
are used for different circuits then no crosstalk will arrise. But
it is not pOl!lsible due to economic reasons. Of course ,di fferent
batteries must be used at least for networks drawing apprecieble
and changeable powar. e. g. relay arcui t current changes randomly
with the change in traffic demand. This will causa an intarference
if commonbattery is used for relay circuits and signal circuits.
Besides, although arc supression reduces interference, .a certein
mmount cannot be eliminated completely and this residue is conduc-
ted or radiated awey. for these reasons. indep endent power supply
for relay circuits are used •...-. ,
Another i~portant crosstalk interference producing parameter
is ground contact resistance. I f grounding ie net proper,greund
contact resistance, lik e bettery internal resistance causes coupling
of various signals. Hence attantion must be given for proper groun-
ding. The cause of grounding is discussed in the next sllction.
5.8 Role of Grounding in R!!lducing Interference
The most general and the most important reason for grounding
of Bny equipment. building, structures etc. is to make sure that
no dangerous voltages are present on a=essible psrts of equipment.
building etc. that will endenger the safatyof persons who come
in contact with it. Under this general raason. thare are other
reasons for grounding. one of the most important is the reducti.on
of interference. Another is for the safety of the equipment. Power
system is similarly grounded mainly for (1) protection of equipment
(2) easy fault location and (3) safety to persons.
But in telecommunication system. in addition to the safety
of equipment and person grounding helps in two ways:
(i) redu ces i nt erference
(ii)seva a conductor,
Interference reCuction by grounding of equipment body and chasis
is obvious. If bodies of theequipments are I!It same potential and
grounded. then all unwanted signals will go, to ground. Saving of
a conductor by grounding can be shown by assuming that l!l subscriber
of an exchange l!I A wants to make a connection tO,one.of the subs-
criber at another exchange B. Obviously 1st group selector will
be provided by exchange A and other group selectort'! will ba
provided by xlll exchsnge B. Now to control the selectors in exchsnge B
by the subscriber 0 f exchange A. the battery, terminals 0 f exchange A
must be extended to exchange B. for this purposa one terminal of
the ~X~~R.battery is groundad and the ground acts as one of tha
conductors to extended the battery to the other exchange.
8'1
Thus g~unding can save a conductor. Of course. ground contact
resistancs; Rg. must be very small. Otherwise switches will not
function p~perly and coupling by fig will also ba appreciable.
for p:r:oper grounding various factors a,re i:1Sl be considered.
Important fsctors are (1) ground rod. (2) depth. and (3) treatment
of the soil. ,JGround rods: Ground xods are used for the purpo se of grounding
which are driven into the soil. These may be pipes or rods. A
few long rods are usually more satisfactory thsn many short rods
since volume of soil effected increases directly wi1;h the .length
of the electrode below the surfsce. Soil resistivity generally
decreases with depth due to increased moisture contant. Driv!3n
ground rods are by far the 1Il0st generally used type of ground
electrodes. This is a result of the comparative eese of il'l3ta:1.1ation
and penetretion through relatively great depths .•Buried plates may
al so be used. NOrmally plates are used only in locali ti es where
cond~tions make it impractical to install driven. rods. Parallel
ground rods reduces fig. Ground rods sho~~d protect corrosion to
themselves. Size of the ground rod is not much important as. e.g •.
it is found that a single ground rod of diameter 2a does. not gi~e
as Iowa ground resistance that obtained by paralleling two rods
each of diameter 'a'.
Depth: Soil resistivity decreases with depth. This is mainly due
to the increased amount of moisture in soil with depth. I\t a depth"
of 20" or above the resistance (Rg) la.lIlIKlliSli becomes less than 20 Ohm
(for untreated soil). With further increase of depth the resistance
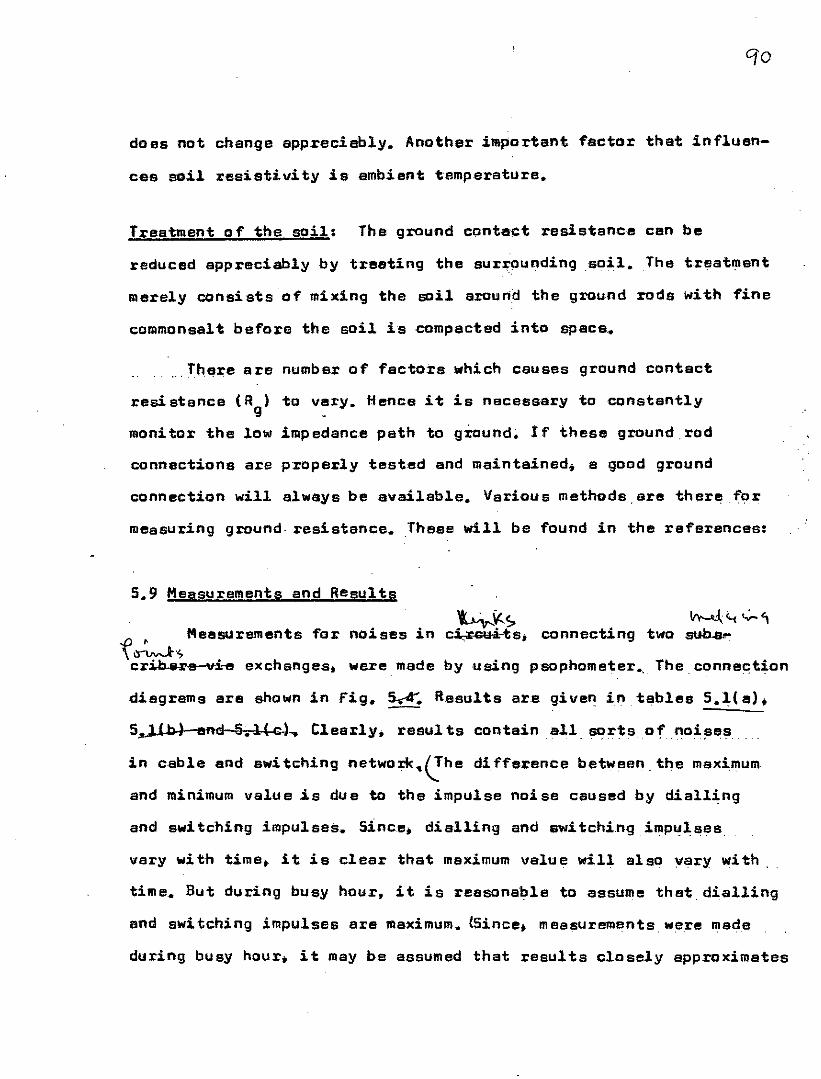
does not change appreciebly. Another illlportant l'actor that in1'luen-
ces soil resistivity is ambient temperature.
Treatment 01' the soilJ The ground conta~t resietance can be
reduced appreciably by treating the sur~undingsoil. The treatment
merely consists of mixing the soil around the ground rods with l'ine
commonsalt bel'ore the soil is compacted into space.
There a re number 0 f l'actorswhich causes ground contact
resistance (Rgl to very. Hencs it is necessary to constantly
monitor the low impedance path to ground. J: f these ground. rod
connections are properly tested and m.aintained.j. a good ground
connection will always be available. Various methods. are there for
measuring ground. resistance. These will be found in the references:
5.9 Measurements and Results
~~> ~~~~..p' Measurements for noises in cj,;r~Sj connecting tWQsub~ ••,~.~cr;i,.b.a,r-&-V3.-i!!exchange.s; were made by using psophometer., The .connac:tion
diagrams are shown in fig. 5..4". Results are given in tables 5.1(a).
5..JJ.b.)-end !i.l(c.) ..• Clesrly. results contain all aortsol' noi!3es
in cable and switchingnetwo:rk~Che difference between. the maximum
and minimum value is due to the impulse noise caused by dialling
and switching impulses. Since. dialling and switching impulses
vary with time;. it is clear that maximumvalu e ""ill a1so vary with .
time. But during busy hour, it is reasonable to assume that dialling
and switching impulses ara maximum.~ince. measuremantswere made
during busy hour. it may be assumed that results closely epproximates
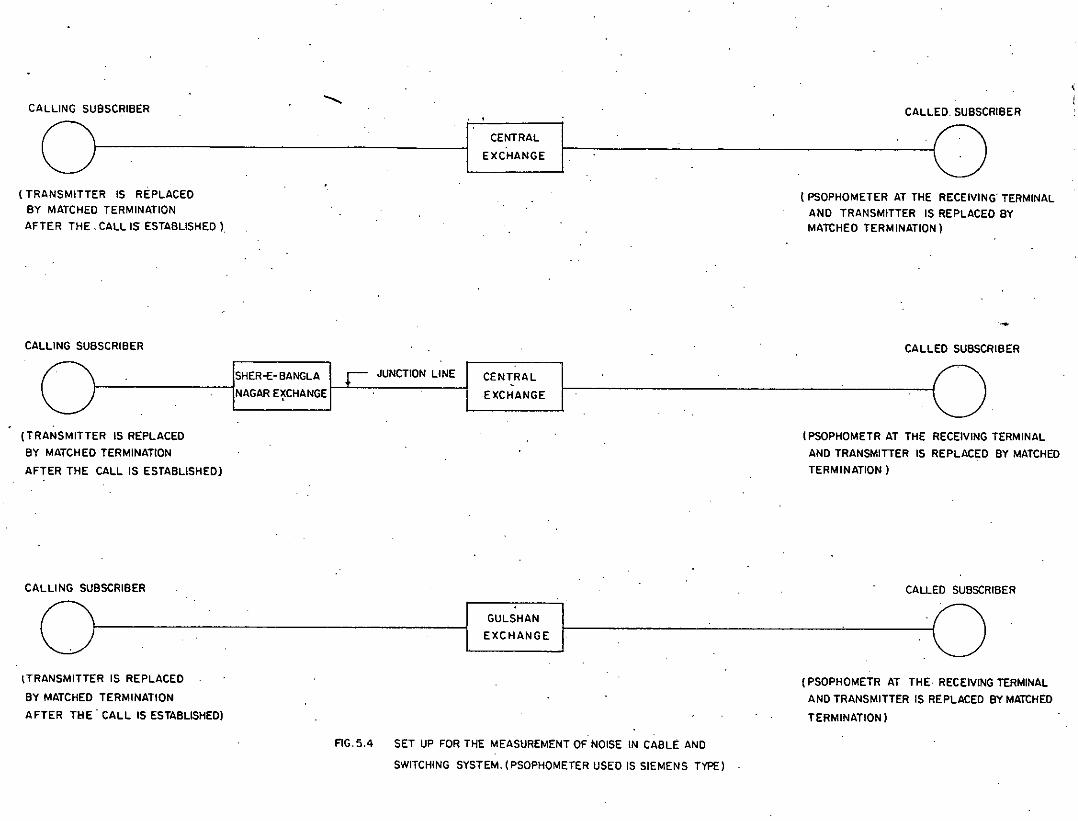
-CALLING SUBSCRIBER CALLED, SUBSCRIBER
O~---I E~~~:NA~E I, '0(TRANSMITTER IS REPLACED
BY MATCHED TERMINATIONAFTER THE, CALL IS ESTABLISHED l,
CALLING SUBSCRIBER
(TRANSMITTER IS REPLACEDBY MATCHED TERMINATION
AFTER THE CALL IS ESTABLISHED)
SHER-E-BANGLA
NAGARE~CHANGE
JUNCTIONLINE CENTRAL
EXCHANGE
t PSOPHOMETER AT THE RECEIVING' TERMINALAND TRANSMITTER IS REPLACED BYMATCHED TERMINATION)
CALLED SUBSCRIBER
(PSOPHOMETR AT THE RECEIVINGTERMINALAND TRANSMITTER IS REPLACED BY MATCHEDTERMINATION)
CALLING SUBSCRIBER CALLED SUBSCRIBER
O I GULSHAN I '0' ----------------------- EXCHANGE,
ITRANSMITTER IS REPLACED
BY MATCHED TERMINATION
AFTER THE' CALL IS ESTABLISHED)
AG.5.4 SET UP FOR HiE MEASUREMENTOF NOISE IN CABLE AND
SWITCHINGSYSTEM. (PSOPHOMETER USED IS SIEMENS TYPE)
(PSOPHOMETR AT THE, RECEIVINGTERMINALAND TRANSMITTER IS REPLACED BY MATCHED
TERMINATION l
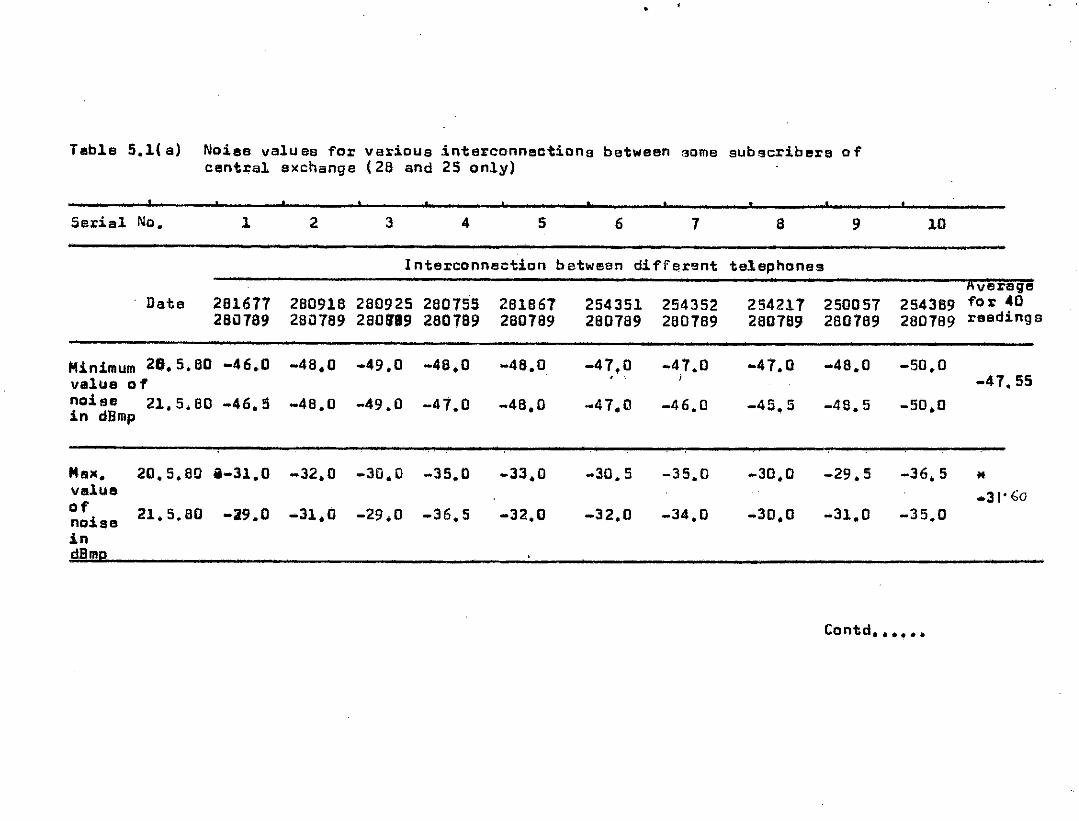
•
Table 5.l( a) Noiee valu ee for various interconnectiona between aome sub !3cribers 0 fcentral exchange (28 and 25 only)
, , , , , , , , , , ,Serial No, 1 2 3 4 5 6 1 a 9 10
InteX'conneetion between diffar9nt telephonesAverage
Date 281617 280918 280925 260155 261661 254351 254352 254217 250057 254389 fo r 40280789 280789 2801119 260789 280789 280189 280789 260789 260769 280789 reading s
Minimum 20.5,80 -46.0 -48,0 -49.0 -48.0 -48.0 -47.0 -47.0 -47.0 -48.0 -50.0value of
, I -47.55noise 21,5.80 -46.5 -48.0 -49.0 -47.0 -46,0 -47,0 -46.0 -45.5 -46,5 -50.0in dBmp
- - - ----
Mslt. 20.5.80 i-3l.0 -32.0 -30.0 -35,0 -33.0 -30.5 -35.0 -30.0 -29.5 -36,S *value -31' 60of 21,5,80 -39.0 -31.0 -29.0 -36.5 -32,0 -32.0 -34.0 -30.0 -31.0 -35.0noiseindBmD
Contd ••••••
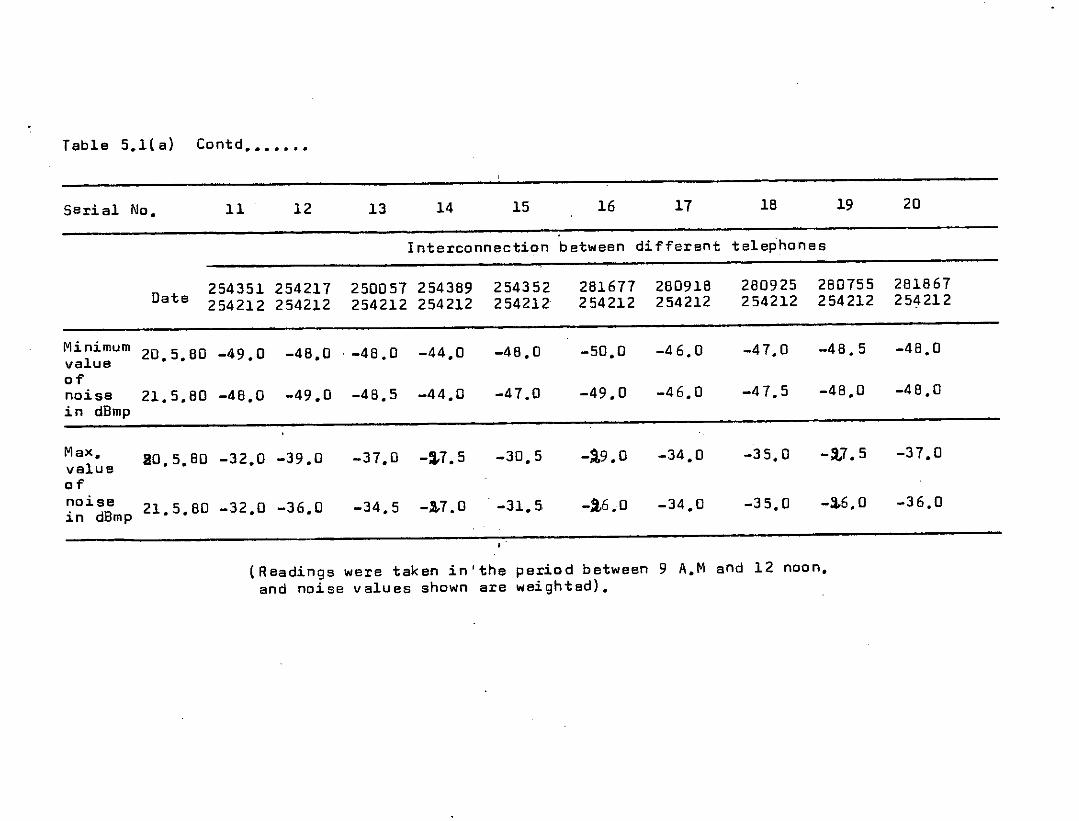
Table 5.1(a) Contd •••••••
Serial No. 11 12 13 14 15 16 17 16 19 20
Interconnection between different telephones
Date 254351 254217 250057 254369 254352 261677 260916 280925 260755 281867254212 254212 254212 254212 254212 254212 254212 254212 254212 254212
Minimum 20 5 80 -49 0 -48.0 . -46.0 -44.0 -46.0 -50.0 -46.0 -47.0 -48.5 -46.0value •• •ofnoise 21.5.80 -46.0 -49.0 -46.5 -44.0 -47.0 -49.0 -46.0 -47.5 -46.0 -46.0in dBmp
Max. 80.5.80 -32.0 -39.0 -37.0 -:'i-7.5 -30.5 -~9.0 -34.0 -35,0 -~7. 5 -37.0valueofnoise -34.5 -1-7.0 -31.5 -2,6.0 -34.0 -35.0 -:1,6.0 -36.0in dBmp 21.5.60 -32.0 -36.0
•(Readings were taken in' the period between 9 A.M and 12 noon.and noise values shown are weighted).
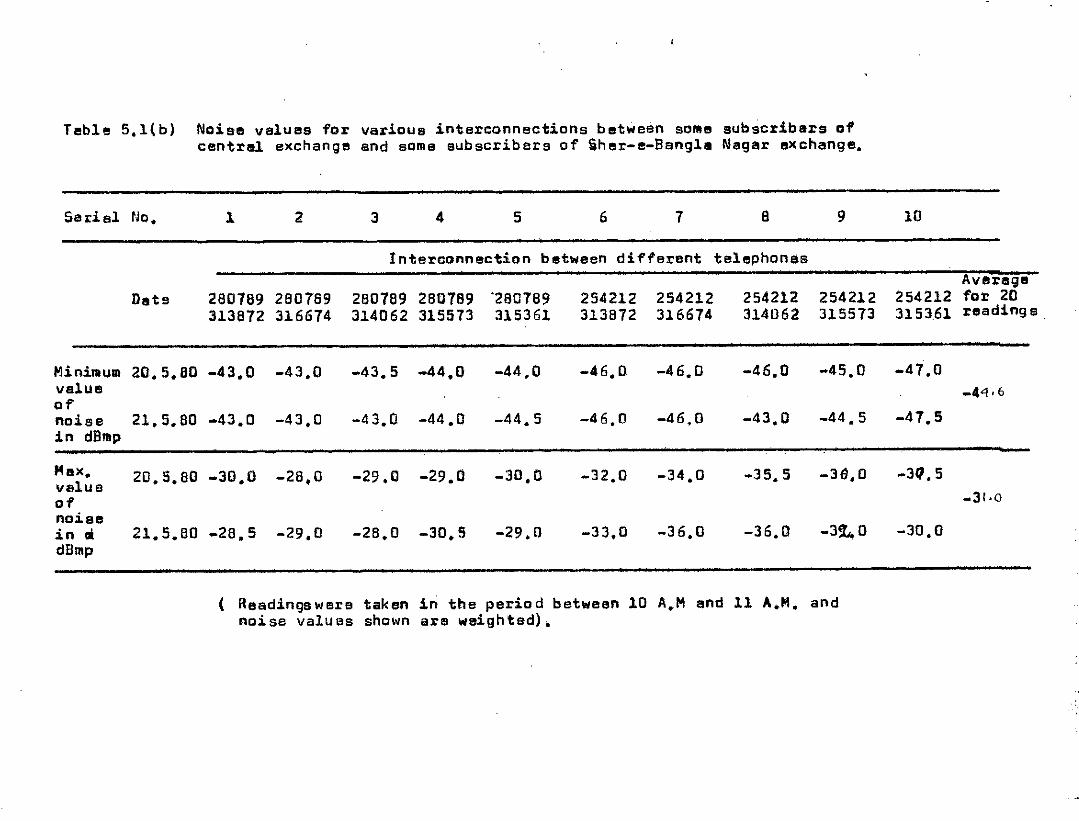
Teb1" S,l(b) Noise values for various interconnections between sOlliesubscribars of'central exchange and some subscribers of iher-e-Bangll1 Nagar exchange.
Serial No. 1 2 3 4 5 6 7 a 9 10
Interconnection between different telephones. -- -~---~._._._- ----
AveregeDate 280789 280789 280789 280789 '280769 254212 254212 254212 254212 254212 for 20
313872 3H674 314062 315573 315361 313872 316674 314062 315573 315361 readings
Minimum20.5,60 -43.0 -43,0 -43.5 -44.0 -44.0 -46,0 -46.0 -46.0 -45.0 -47,0value _44.6ofnoise 21,5.BO -43,0 -43,0 -43.0 -44.0 -44.5 -46.0 -46.0 -43.0 -44.5 -47.5in dBmp
Hax. 20.5.80 -30,0 -28,0 -29,0 -29.0 -30,0 -32.0 -34.0 -35.5 -36,0 -311,5valUeof _31.0noisein III 21.5.80 -28.5 -29,0 -28,0 -30,5 -29.0 -33.0 -36.0 -36.0 -3jL.0 -30,0dBmp
( Readingswere taken in the period between 10 A.Mand 11 A,M. andnoise values shown are weighted),
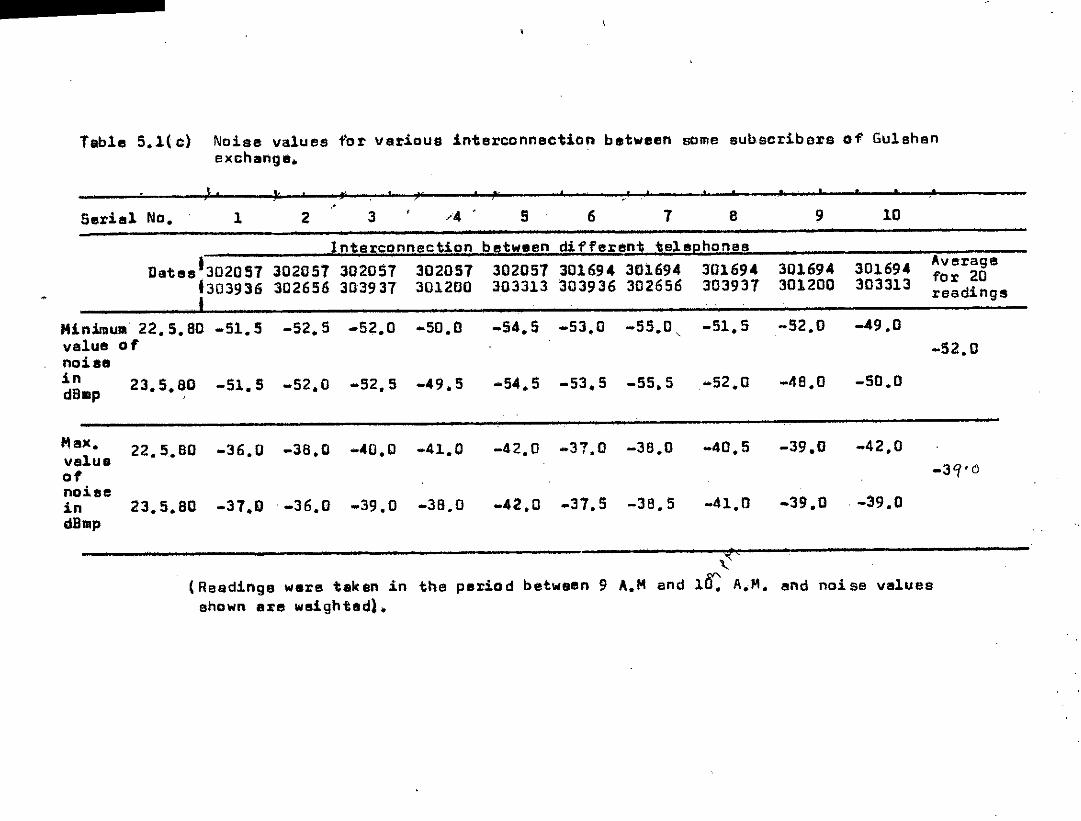
Table S,l( c) Noise values for various interconnection between some subscribers of Gulehanexchange,
J t ,e' Jf 1 J I ! . ..." t' .' • • • !,Seriel No, 1 2 3 /4 - 5 6 7 a 9 10
-52,0-50,0-48.0-52.0-55.5-53.5-54,5-49,S-52.5-52,0-51.523,5.80
Intex:connection between different telephones ._Date8'302057 302057 302057 302057 302057 301694 301694 301694 301694 301694 ~ver~6e
______________1303936 302656 303937 301200 303313 303936 302656 303931 301200 303313 r~:dings
Min;imwa22,5,80 -51,5 -52,5 -52,0 -50,0 -54,S -53,0 -55,0 -51,S -52,0 -49.0,value ofnois.indB.p
Max. 22.5.BO -36.0 -38.0 -40.0 -41.0 -42,0 -37.0 -38.0 -40.5 -39.0 -42,0ve!luBof -3'f'clnoisein 23.5,80 -37,D . -36,0 -39.0 -3B.O -42.0 -37,5 -38.5 -41.0 -39.0 . -39.0dBmp
'O{-'\..
(Readings ware t.k en in the peria d between 9 A.Mand 10: A,M, end noi se veluesshown ere weighted),
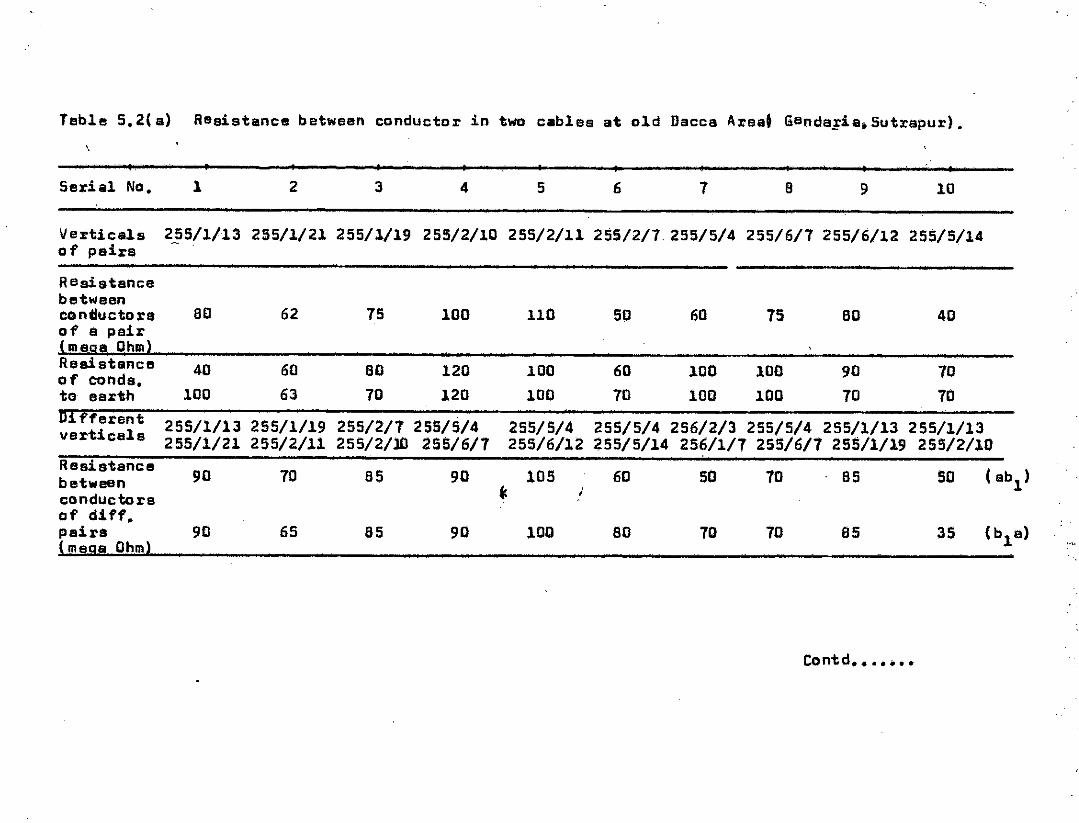
Table 5.2(a) Resistance between conductor in two cables at old Dacca Areal GandaF!siSutrapur).
L , , , , . I , , I , ,Serial No. 1 2 3 4 5 6 7 B 9 10
VeJ:ticals 2~5/1/13 255/1/21255/1/19 255/2/10 255/2/11255/2/7,255/5/4 255/6/1255/6/12 255/5/14of pairs-Resistancebetweeneon~uctors aD 62 75 100 110 50 60 75 ao 40of a pair(mega Chill)Resistance 40 60 aD 120 100 60 100 100 90 70of conds.to earth 100 63 10 120 100 70 100 100 70 70tilfferent 255/1/13 255/1/19 255/2/1 255/5/4 255/5/4 255/5/4 256/2/3 255/5/4 255/1/13 255/1/13verticals 255/1/21 255/2/11 255/2/30 256/6/1 255/6/12 255/5/14 256/1/7 255/6/1 255/1/19 255/2/10Resistance 90 70 85 90 lOS 60 50 70 85 SO (ab1)betweanconductors t: I
of diff.pairs 90 65 85 90 100 80 10 70 as 35 (b1a)(maca Ohm)
Contd •.••.•.•.••
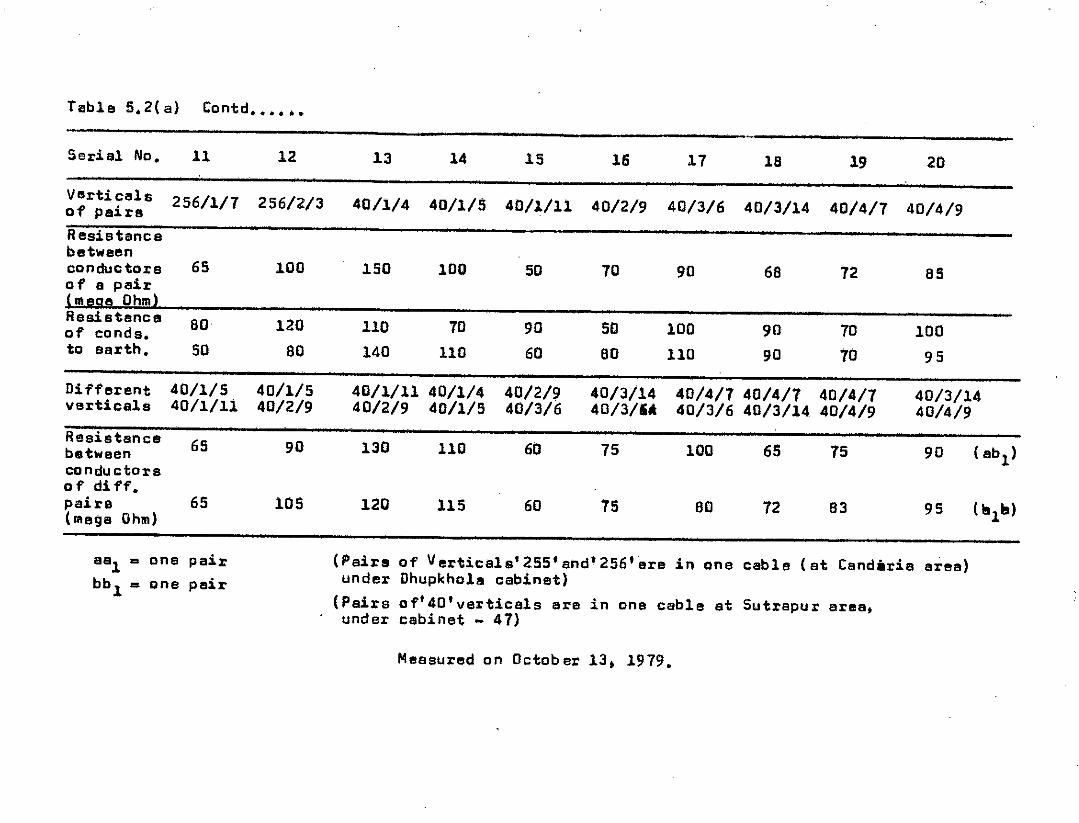
hble S.2( a} Contd ••••••
Serial No. 11 12 13 14 15 16 17 18 19 20
Vert! cels 256/1/7 256/2/3 40/1/4 40/1/5 40/1/11 40/2/9 40/3/6 40/3/14 40/4/7 40/4/9of pairsResistancebetweenconductors 65 100 150 100 50 70 90 68 72 85of a pair(mege Ohm)Resistanca BO 120 110 70 90 50 100 90 70 100of conde.to earth. 50 80 140 110 60 BO 110 90 10 95
Different 40/1/5 40/1/5 40/1/11 40/1/4 40/2/9 40/3/14 40/4/7 40/4/7 40/4/7 40/3/14verticale 40/1/11 40/2/9 40/2/9 40/1/5 40/3/6 40/3/" 40/3/6 40/3/14 40/4/9 40/4/9Resistance 65 90 130 110 60 75 100 65 75 90 ( ab1)betweenconductOrsof diff.pairs 65 105 HQ 115 60 15 80 72 83 95 (81h)(maga Ohm)
aal •• ona pair (Pairs of Verticals'255'and'256'are in one cable (at Candilrie aree)bb1 •• one peir under Dhupkhols cabinet)
(Peirs of'40'vertice1s are in one cable et Sutrapur area,under cabinet - 47)
Meesured on October 13, 1979.
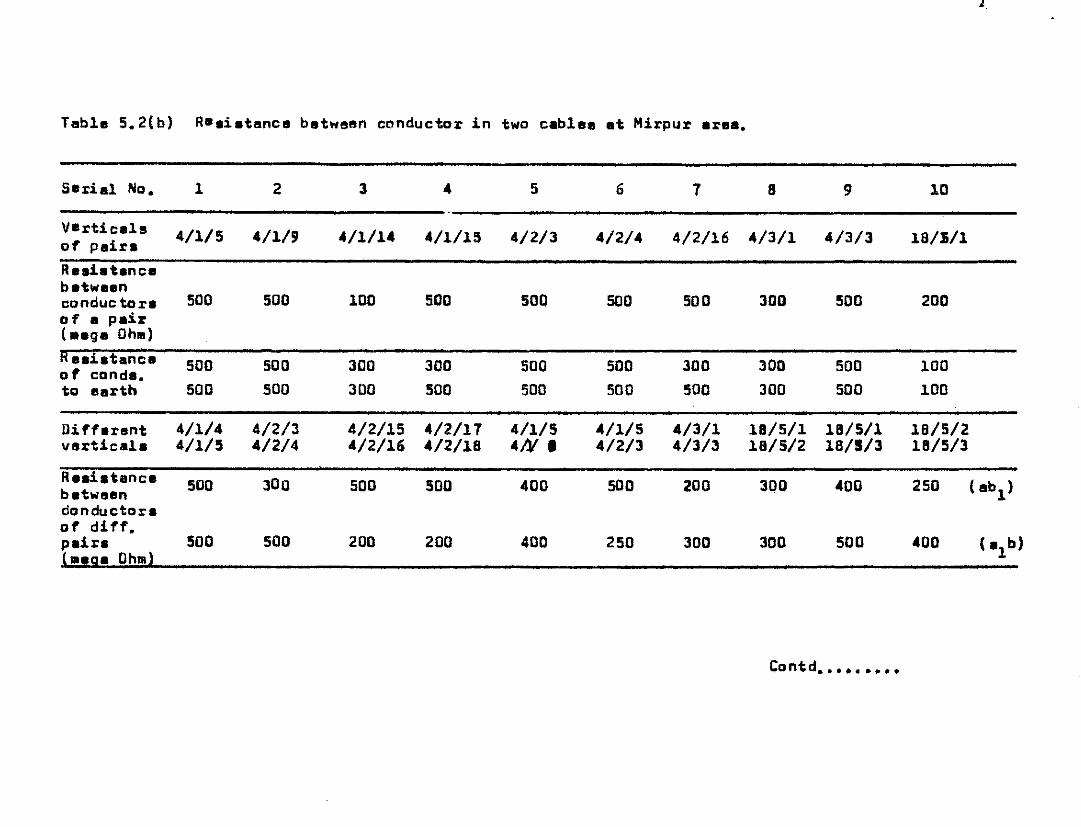
Tabl. 5. 2(b) Raaiatanca batween conductor in two cabl •• at Mirpur ar.a.
l.
Sarial No. 1 2 3 " 5 6 7 II 9 10
V.rtic.ls 4/1/5 "/1/9 "/l/l" "/1/13 4/2/3 4/2/" 4/2/16 "/3/1 4/3/3 IB/li/lof pairaRaaiat.nc.batwa.nconductora 500 500 100 500 500 500 500 300 500 200of a pair(.ag. Ohll)
R•• iatenc. 500 500 300 300 500 500 300 300 500 100of conda.to earth 500 500 300 500 500 500 500 300 500 100
Diffarllnt 4/1/4 4/2/3 4/2/15 4/2/17 4/1/5 "/1/5 4/3/1 18/5/1 18/5/1 IB/5/2vartica1a 4/1/5 4/2/4 4/2/16 "/2/18 4N' 4/2/3 4/3/3 18/5/2 18/1/3 IB/5/3
R.aiatenc. 500 300 500 500 400 500 200 300 "00 250 (ab1 )b.twllendonductoraof ditf.paira 500 500 200 200 400 250 300 300 500 400 ( a1b)(".aa Ohlll)
Cont d•••••••••
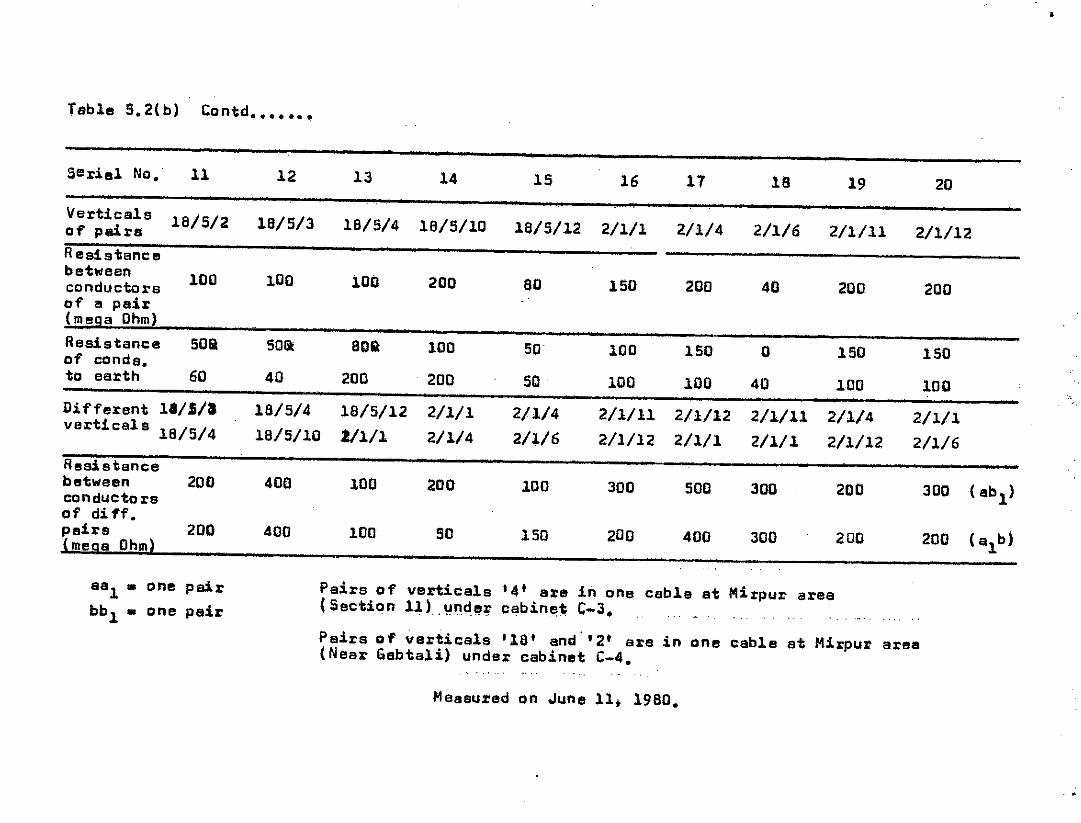
Table 5.2(b) Contd•••••••
sedel No. 11 12 13 14 15 16 17 1B 19 20Verticals IB/5/2 IB/5/3 1B/5/4 IB/5/10 IB/5/12 2/1/1 2/1/4 2/1/6 2/1/11 2/1/12of pairsResistancebetween 100 100 100 200 60 150 200 40 200 200conductorsof a pair(mega Ohm)Resistance 50Q 50& 80Q 100 50 100 150 a 150 150of conde.to earth 60 40 200 200 50 100 100 40 100 100Different 1'/5/' 16/5/4 18/5/12 2/1/1 2/1/4 2/1/11 2/1/12 2/1/11 2/1/4 2/1/1verticals IB/5/4 IB/5/10 211/1 2/1/4 2/1/6 2/1/12 2/1/1 2/1/1 2/1/12 2/1/6Resistancebetween 200 400 100 200 100 300 500 300 200 300 (ab1)conductorsof diff.pairs 200 400 100 SO 150 200 400 300 200 200 (alb)(mega Ohm)
aal • one pair Pairs of verticals '4' ere in one cebls at Mirpur areabbl. one pair (Section 11) ,lHld!!rcabinfj1:C-3.
Pairs of verticals '18' and '2' ara in one cable at Mirpur aree(Near Gabtal!) under cabinet C-4.
Measured on June 11. 19BO.
•
qt
to the true value. Of course this again vary with days. weeks;
months. and years. However. the variations are normally very small.)
Measurements were slso made in till cable$" (one at Dhupkhola
cabinet. Gandaria) and (other at Sutrapur c inet; C•.47) and also
in other {""o cables at Mirpur area. Resi different
conductors in the cebles are givsn in Tab e 5.2(a) and 5.2(b).
5.10 Message Channel Objectives
The telephone speech .signal is usually delivered to the. sM--''''
telephone ca.d!P"~ in the form of audible sounds impinging on the
telephone tranl!llllit ter. It is th e t elephon Bcampany' s rellponsibili ty
to deliver a replica of this sound to the ear .of the clllied subs-
criber. To perform this in a batterwey certain objectives are
necessery. A concept known as grade ofeervice is commonlyused
to determine acc~table message channel. objectives .•.It. combines
the distribution of customer opinion with the distribution of. ' ,- . - - - . ,- .
plent performance to obtain the e~cted per.centsge of cuatomsr. .
opinio~ in a given categor)':-V~ objectives for message channelr-
are given belowl
5.10.1I4e8s6ge Circuit Noise Objective
Message circuit noise is defined as the short term average
noise level as measured with a psophometer or meter using C-message
weighting. The relationship between the meter reading and customer
opinion of the illlpairmentwas determined by subjective tests. The
quality of ths circuit with noise was judged es excellent. good.
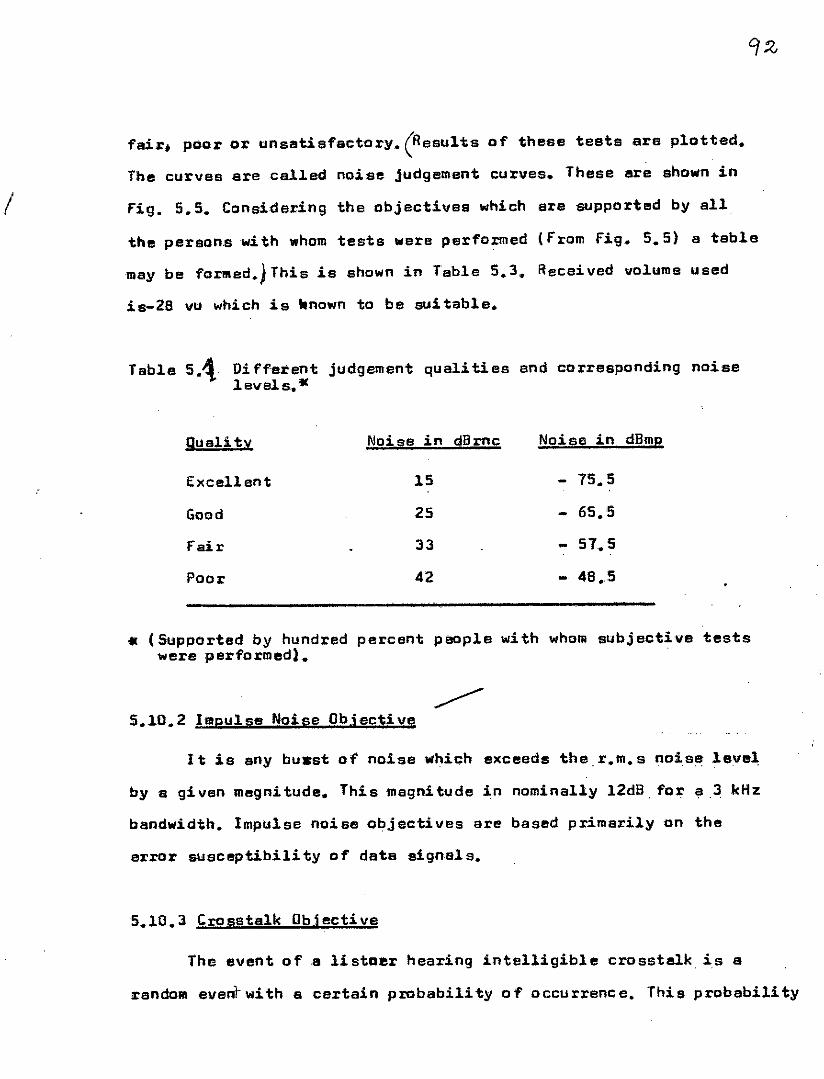
I
fair. poor or unsatisfacttlry. (Ilesults of these tests are plotted.
The curves are called noise judgement curves. These are shown in
fig. 5.5. Considering the objectives which are supported by all
the person.swith ",homtests were performed (from fig. 5.5) a table
may be fOrJlled.)This is shown in Table 5.3. Racei ved volume used
is-28 vu which is "nown to be suitable.
Table 5.'\ Different judgement qualities and corresponding noise1evels.«
Quality Noise in dBmc Noise in dBmp
Excellent 15 - 75.5
Good 25 65.5
fair JJ - 57.5
Ptlor 42 - 48.5
.• (Supported by hundred percent people with whomsubj ective testswere performed) ..•
5.10.2 Impulse Noise Obiective
It is any buast of noise which exceeds the.r.m.s noi.se level
by a given megnitude. This magnitude in nominally 12d8. for a.3 kHz
bandwidth. Impulse noiee objectives are based primarily on the
error susceptibility of data signals.
5.10.3 Crosstalk Objective
The event a fa li stDllr hearing intelligibl e crosstalk is a
random evenT-with a certain probability of occurrence. This probability
is called crosstalk index. The objective is a crosstalk index of one
(l)percent .(cauu): for inter tall trunks and an index of 0.5 fO.r all
other trunk s. ero ss-telk received by a subscriber depend~ on (i).f:~
the volullleo f the disturbing tllkes (ii) the loss to the point of
crosstalk CUi) coupling loss between two circuits and (iv) the
loss from the point of crosstalk to the listner. Also. the ability
of a customer to hear a given magnitude of crosstalk will depend
upon his listening acuity in the presence 0 fnoise. Only. one 0 f .
these factors is uniquely allsociated with crosstalk. end iscontroll-
able by the designer. This factor is the coupling 10l!ls. Thus.
crosstalk objectives ere designed to restrict the coupling lossas
in i!I system to an amount that would limitthereeeived.crosstalk
to a tolerably low amount. These are generalised crosstalk index(1)
cherts which provide a graphical ml!lthod fo r determining. the
crosstalk index from .the eouplingloss. for example. it.may.be
calculated from generalised. crolls-talk index charts. that for index
of 1 for lOti disturbers. noise at listener's telephone set is
20 dBrnc or -70 dBmp. Mean coupling loss for this case in 72 dB•.
5.1Z Diacussion
Maximuman. minimum noise values (in cQble an. switching
networks) for different type of interconnections are shown in
r.bles 5.1(11), 5.l{b); S.l{e}. Corresponding Glverage values lire ..
also ahown in these tsbles. It is seen that average of the minimum
noise is lowest for Gulshan exchange (Table S.l{c) which is
-52 .Bmp. Corresponllling fiqure for interconnection of twClsubscri-
bers in cen10rill exchange is -47.55 dBmpand for two subscribers
-(one of Shllr-e-Bangla Nagar exchange ana ene of central exchan!e)
is - "14. b.l2"P:his noise inclul1es therlllal noise, swi tching otfice
noise. lIewer hum. crosstalk. l/f noise i. e alllDossible noises
in cable snlli switchin!, networks •. Since. occurrence at crosstalk
is stati stical anll eo may be lower or higher. the resul t founl~
may varY. This result may be cOllllsrell with the given noise objec~
tives in section 5.10. for the time being. let the resul t corres-
pond for maximumcrosstalk case (actually very feeble crosstalk
was hearll during measurement). Taking crosstalk neise objective
as -10 IIBmpanll lIIessage circuit noise objective as ~B.5 .BIIIII
(Poor easel from section 5.10, the total noise objective becomes
-46.8 dBmp. (aQeing as power basis). 517 measured value.( taking
the lowest case) ,i s 5.2 dB lower than the message. channel obj ective
for poor case. Taking' Fair' cllse. the total objective is -51.26
dBmp. for this case the result is about 5.25 dB higher than the
given objective. Thus. OUr telephone system falls at best under
the category a f' fair' • for two subscribers at different exchanges
or two subscribers under central exchange, the category will beand
between 'feir'/'poor' .• The above cB~egcry is supported by 100 percent
observers (fig. 5.5L But the category fo r same resul tis 'goo.',accoreing to about 70 18 ercentob servers. 0 f course taking the case
of central exchange, the category) according to 75>J' people is' fair'.
The objective for im,lulse noise is 12dB. But results show
that minimum shift from the average minimum noise value i813.0 dB
(for Gulshan exchange) and maximumshift is 16 dB (for two subscribers
at central exchange).
So. this is elso higher. Of course better inference could be
drawn if measurements were made for more times and also for more
conneetions.
Though during measur~ents crosst.lk was not heard appreci-
ably. but some times objectionable crosstalk occurs. for such case.
our telephone system may fall below "poor' category. It was shown
that crosstalk occur,s due to inductive and 'capacitive coupling
between conductors .in • cable. But it may also happen clue to the
c1irsct resistive connection between two pairs. This hsppen. When
insulation resistance between. conductors becomes lower. Thespeci-
fication for insulation resistance in, primary Ct!lble is 5000 'lIega Ohm.
Butllleasurements show that the insulation rasistlllOce i,nexisting
prilllsry cable is maximum500 mega Ohm.snd.minimum,30 lIleghaOhlll
(Tabls 5.2at and 5.2b). Besides. insulation resistance for
secondary cable is much lower (specielly in the old Decca Bree).
Even insulation resistance for SOlliepeirs is below 10 mega Ohm.
This is an important cause for crosstalk. Besides. crosstalk may
also happen in ewitc:h room equiplllents. This msy beby battery
internal resistance enlll commaground contact resistance. Whic:h
on. contributes what cannot be told as no messurement for bettery
internal resistancesnd grouncl contact rssistance were possible.
Sometime. faulty switch also contribute some crosstalk.
Mainly two types of ceblea IIrs useel in our country for
telephone service viz. (1) lead sheath cable anll (11) PE(p~astic
insulated) cable. In PE cable aluminiam foil just under the,
plastic cover acta as shield. I n lead' sheath cable. lead cover
"16
itself acts asshi&1 •• Shiel" must be grounded toraduce inter-
ference as discussed in section 5.6. So. after making a joint
in .PE cable, aluminium foil from. both side must be connected
together so that ground extends to the other end of the cable.
But aluminium foils are rarely connected in joints. (specially
in secondary cablesJ.. As a result interference noisa increases.
In lead sheath cable. lead sleeve is used for jointing purpose.
Lead sleeve is a cylindrical hollow lead pipe which is used to
cover the joint. Here. automatically lead sheaths at both ends
of the joint are cOnnected by the lead sleeve and so ground
extends to other enclof the cable.
Another important factor which increase noise level in
cablee. is the moisture. Different agencies (Ti tae. WASil.WAPDA.
Municipality) dig road at different times end cause damage toenters
T and T cable. Water/into the cable and causes rust to daposit.
in the joint in PE cable. It also reduces insulation rellistance
at joints. Thus. crosstalkjandljf noise. result. In case of
lead cable where water enters insulation breakdown takes. place
(as paper insulation ie used) and communication is stopped.
Another reason for increase in noise level is the over use
of switches. for example. capacity of 25 exchangeis.lO.OOO linaof
end there should be an allo~ancejl5~ i.e total connection should
nat exceed 8.500. But totel connection is now more than 9•.500.
Similarly. the 10,.000 line cBpacity Sher-e-Bangla Nagar exchange
has more than 9.950 connections. Henctl a subscriber is to dial
IDlSnytimes to get a number (increasing switching noi se) and in
this way switches Bre to hunt many times. This shortens the life
period of switches and increases switching contact resistance
which adda noi sel
Besides; some exchanges are very old. for example the 24'
exchange in Dacca was installed in 1954., As this exchanges ,has
already passed the designed "eriod of useful life which is about
12 to 15 years; obviously its performance is degraded which may
add extra noise.
Another important thing that may be noted is the average
holding time. for western countries. sxchanges ere normally
designad for an average holding time of three minutes. B:I:I:tExchsn-
ges in Bangladesh were imported from western countries ana, so are
designed for 3-minute average holding ti,me. But. it seems that•
ou1'JIIpeople in average talk for more thill'll.three minutes • .of
course, it is just from experience. No measurements in this regard
were possible es there is no facility for such measurament., So
arrangements should be made to measure average, holding ,'time,
traffic offered; traffic carried atc. so ~hat p~per planning
may be made. Increase in average, holdi,ng time end ,?!fer~ traffic
cause repeated dialling to establieh a call and thils increases
switchilignoise~
y
1. Ficchi; Rocco. F.
REFERENCES
"Electrical Interference";London Iliffe Books Ltd.1st Edi tion; 1964;P. 29_37;46_47;81_91;99_101,105-115; 132-139; 188-191.
2. Members of the TechnicalStaff
3, Hobbs, Marvin
4, Fink, G. Donald andBeaty Wayne H,
"Transmission System for Communi-cations", Bell Telephone Labora-tories, Inc.; Revised FourthEdition, 1971; p 279-lJIh-286,
"Modern Communications SwitchingSystems"; Tab Books Ltd,;1st Edition, 1974~
"Standard Handbook forElectrical Engineers",
. ,.• I ~'" ••• ' '"'
CHAPTER-6
NOISE IN CARRIER AND R-r SYSTEM
J/ 6,0 Prelilftin@ries
"
.'.-. ,. .....•"" ........• -..&
,~
In this chapter discussion will be made about n(Jise in
carrisr systent (multiplexing and demultiptexing equipment) end
noise in radiofrequency (r-f) system, Noises in r-f system are
meinly inherent thermal noise, intermoduletion noise due to various
types 0 f nonlineari ties end ellchoes in r-f equipments and noise
dua to fading, It also include sky noise that appears at the
.ntanns and any other r-f interference. Carrier system noises era
mainly inherent thermal nDise._c~osetalk due to improper filtering•..~..------and interlllodulation noise. Results of SOlliemeesurements taken in
the Dacca-Chittegong MWsystem will be given, Finally e discussion
will be made basad on thetle reBul t6,
6.1 Noise in Carrier System
Carrier system noises are basically (i) inherent thermalIk.~.l::H'~' ~
noistl end shott noi,se (ii) crosstalk due to improper f.''''ng eand
(iii) intermodulation noise due to nonlinearities.
6.1.1 Thermal noise end Shot•• i •• Noise
Thermal noi se is the inherent noi 511 present in all resistors
end conductors used in the circuitry. Besides. shot noise is present
in the active devices like trensistors. diodes etc. used in the
multiplering and demultiple~ing equipment.
6,1.2 Crosstalk
Crosstalk in multiplexing and demultiplexing ¥~a~s~x8Ek~••
process arises due to the improper filtering. This is shown in
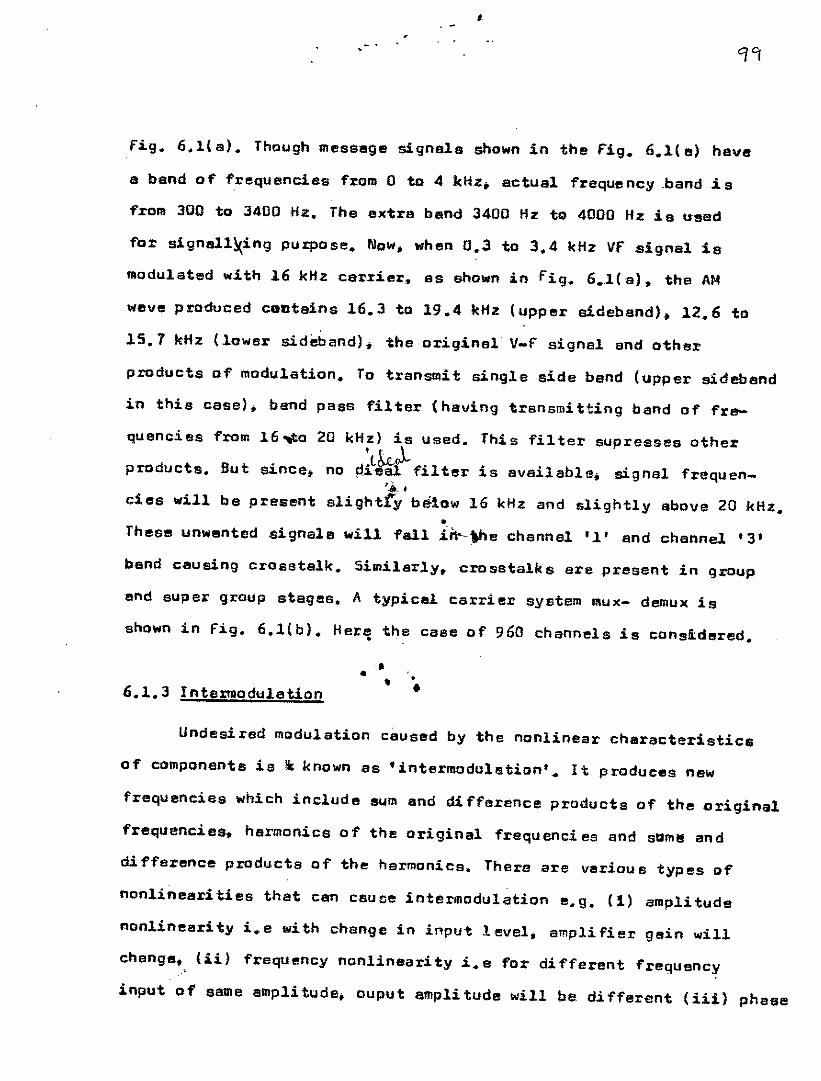
•
fj,g. 6.l( a). Though messege signals shown in the fig. 6.l( 5) have
iii bsnd of frequencies from 0 to4 kHz. actual frequency.band j,s
'from 300 to 3400 Hz. The extra band 3400 Hz to 4000 Hz is used
for signl!lll~ing purpose. Now. when 0.3 to 3.4 kHz Vf .signal is
mOdulated ••ith 16kHz carrier. as ahown in fig. 5.l( al. the AM
weve produced cODtains 16.3 to 19.4 kHz (upper sidebandl~ 12.6 to
15.7 kHz (lower sidebandl. the origi.nsl V-I' signal and other
pzoducts of modulation. To transmit single side band (upper sideband
in this easel. band pass filter (having transmitting band of fre-
quencies from 16~0
products. But since.
eiee will be present
20 kHz) is used. This filter supressea other
no #~t~ filter is available. signal frequen-tl.. f
slightf'y be'iow 16 kHz and t;lightly sbove 20kHz.•
These unwanted signale will fall .1n---\hechannel '1' and cihannel •3'
band causing crosstalk. Similarly, crosstalks ere present in group
and super group stages. A typical. carrier system mux- demux is
shown in Fig. 6.l(b). Here the case of 960 channels is considered ••
6.1.3 Intermodulation
,• • ••
Undesired modulation caused by the nonlinear characteristics
of components is ~ known as 'intermodu18tion'~ It produces new
frequencies ""hich include sum and di fference products of the original
frequencies, harmonics 0 f the original frequ enci es and stlm!! and
difference products of the harmonics. Thera are various types of
nonlinearities that can caUDe intermoduletion e.9. (ll amplitude
nonlinearity i.e with change in input level. amplifier gain will
change, iii) frequency nonlinearity i.e for different frequency•input of sallie ampli tude. Duput ampli tude will be. di fferjOlnt (iii) phase
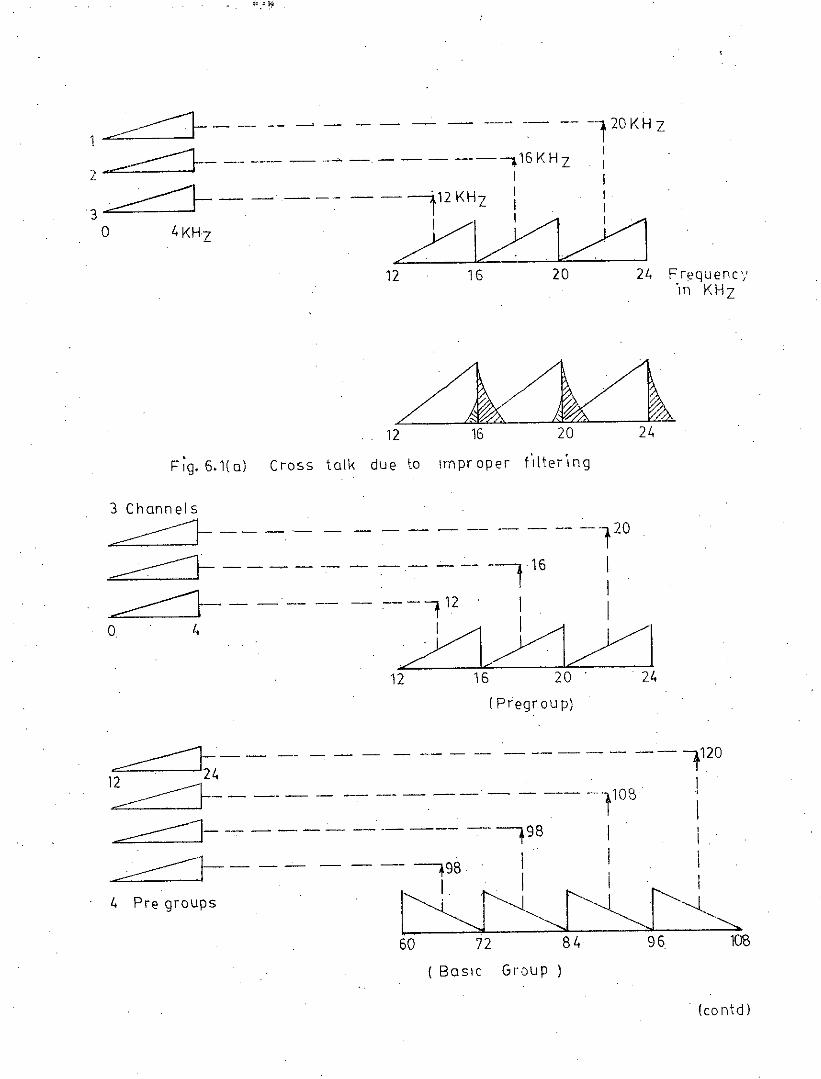
21, Fr"quenC)''in KHz
201612
- --' --, - --POKH Z
~ "_' -,-------,16KHZ :I II II II I
~--- -- ~---
2
3 c-=::=:===:J- - -' ,- - - - - -; 12KHZ
o 4 KHZ I
12 16 20
Fig,6.1(a) Cross talk due to Improper t'Jiter'lng
3 Channels~---,,-' -'-------------120
-=-:::::1- - - - - -- - -, ,- - -- ---, 16 I
~~_ -----------'112' I I
o 4 ,DcY1/112 16 20 24
(Pregr ou p)
~'--- ---- - - ----- --'------- --'1120
12 24 '------:-:::=:}- - -- - - .- --- -,--' -, - -- -t108 I-=::::::1- -- - -- - - - -- --~ -, t98 I i~]-- --' -- ---~98' I ! I--- I "I I, I
4 Pre groups "tsJ::"~t~'>,,60 72 84 96 100
(BasIC Gr,)up)
(contd)
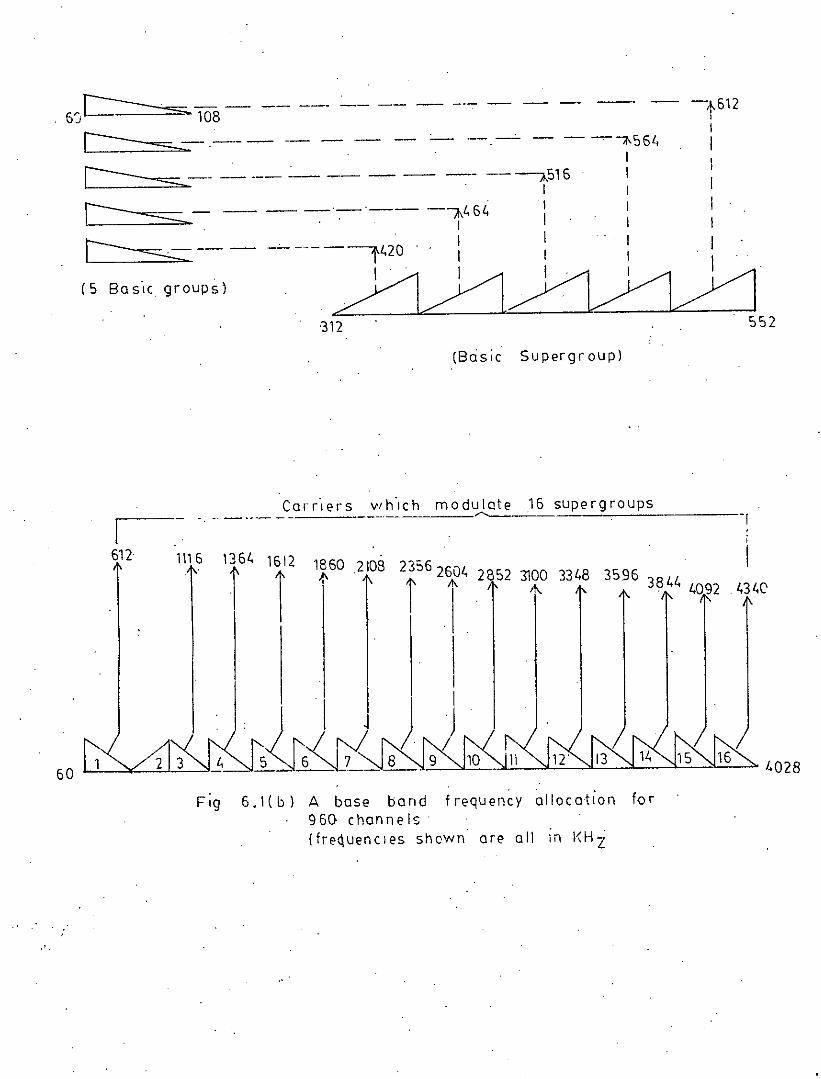
(5 Ba s-Ie groups l
r----...- . . - --6'jl--------:::=. 108
~-.--- -- - - - _.- --.-. - --. "S6l,. I
~-- -----_.---------.---tS16 :
~-. -- -- --..-._._- -1~64 : :~ ---- _. _.---f~20 .. : : : . I .-
...B~/:1/1J=j312 . 552
(Basic Supergroup)
Carr-Iers wh-Ich modulate .16 supergroups_. - --- -------- --_ ... -----"'---------------,
I612 1116 136~
t1
1612
i18602108).\ 2356 260~T ~ 2 52 3100 33~8 3596 38 ~~
- ~092 ~3~C
60FIg 6.I(b) A base band frequency allocation for
960 channe Is.{frequencIes shown are all in I<HZ
/"028
100
nonlinearity, i.e output phase will change accerding to ,the input
aIIlplitudeand (iv) phase and group del-ay. i.e eutput phase will
vary fa r di fferent frequency input. A mathematical description
will be given fer all above cases in the subsequent sections .• In
multiplexing and demultiplexing equipmant the main causes of
intermodulatiens are:
(1) iOl::o,rrect operllting peint: This causes amplituda
nonlinearity and se intermedulatien products.
(2) overloading' iince linear range is limited. eve.rleading
drives the component in nenlinear range i.e amplitude
nenlinearity eccure fer overload conditien.
(3) frequency distortien: This means variation of gain with
f,requency. The eutput waveferm becomes distorted giving
a nai see This ef'fect can be minimised by using equalisers.
Besides. intermadulatien distortien occurs in audio pregramme
transmissien. An audie pregramme signal is a complex wave cansisting
of many component frequencies. Normally its bandwidth ie equal to
3 times the voice frequency bandwidth. I f these frequencies are
transmitted via equipment that produces intermodulation, new
frequencies are prOduced. Some of these new frequencies will fall
within the bandwidth of the transmitted audio programme, producing
distortion which lowers the quality ef the received programme.
6.2 Measuremant of Noise in Multiplexing end DemultiplexingEquipment
Neise in multiplexing and demultiplexing equipment may be
measured by naise loading method. Discussion WBS made about noise
...:
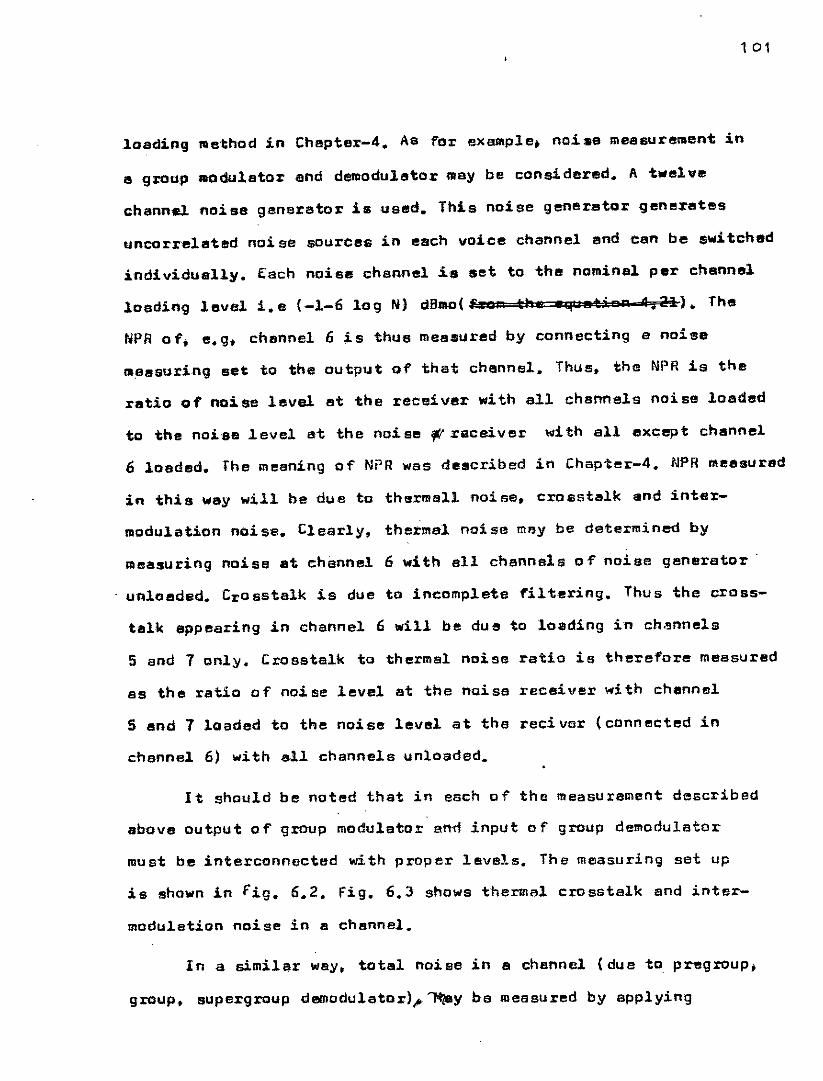
101
.1080in9 llIethoo in Chepter-4. As for exalllple. noi.e measurement in
e group .aduletor and demodulator may be considered. A twelve
channel noise generator is used. This noise generetor generates
uncorrelated noise sources in each voice channel and can be switehed
individually. Each noise channel is set to the nominel per chsnnel
loading lavel i.e (-1-6 log N) dBllIO(hn the e"4 !!Ition 4.23:1. The
NPRof; e.g. chennel 6 is thus messured by connecting e noi15s
measuring eet to the output of that channel. Thus. the NPRis the
ratio of na.ise level st the receiver with all channels noise loadllld
to thlll noiss .level at the noise r;; receiver with all except chennel
6 loaded. The meaning of NPRwas described in Chapter-4. NPRmeasured
in this way will be due to thermall noise. crosstalk alnd inter-
modulation noise. Clearly, thermal noise may be determined by
l1leasuring noise at channel 6 with all channels of noise generator.
unloaded. Crosstalk is due to incomplete l'iltering. Thus the cross-
talk appearing in channel 6 will be due to loading in channels
5 and 7 only. Crosstalk to thermal noise ratio is therefore measured
as the ratio of noise level at the noise receiver with chennel
Sand 7 loaded to the noise level at the reci var (connected in
channel 6) with all channels unloaded.
It should be noted that in each of the measurement described
above output of group modulator and input of group demodulator
must be interconnected with proper levels. The measuring set up
is shown in fig. 6.2. Fig. 6.3 shows thermal crosstalk and inter-
modulation noise in e chennal.
In a similar way. total noise in a channel (due to pregroup;
group. supergroup demodulator)~ '"H/8y be measured by applying
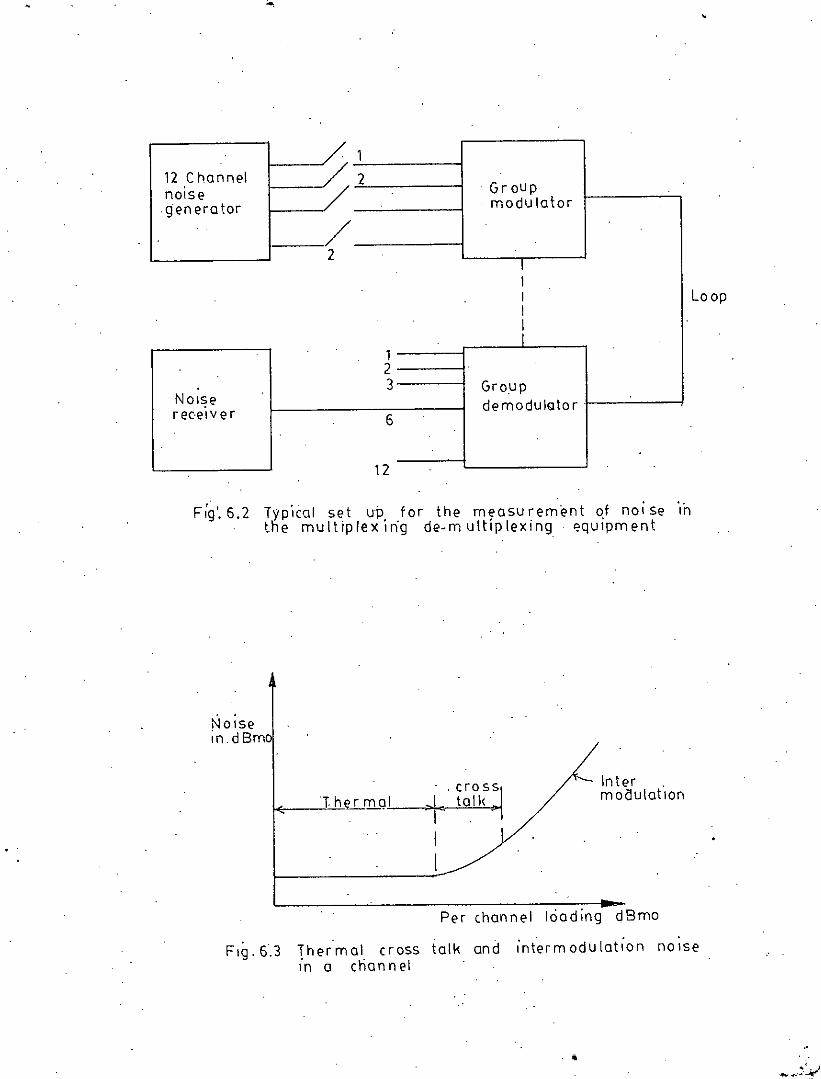
12 ChannelnOiseg'enera tor
NOI~er ec-el v e r
/2
12
123
6
12
, G r Ou pmodulator
Groupdemodulator'
Loop
F:g'.6.2 Typical set up for the measu rement of nOI Se 'Inthe multip!ex irig de-m ultiplexing "quipment
NOisein d Bmo
1.h li..m q,~1_-;.;'- Inter ,
moaulatlon
Per channel loading dBmo
Thermal crosS talk and int'ermodulation noiseIn a channel
. I'
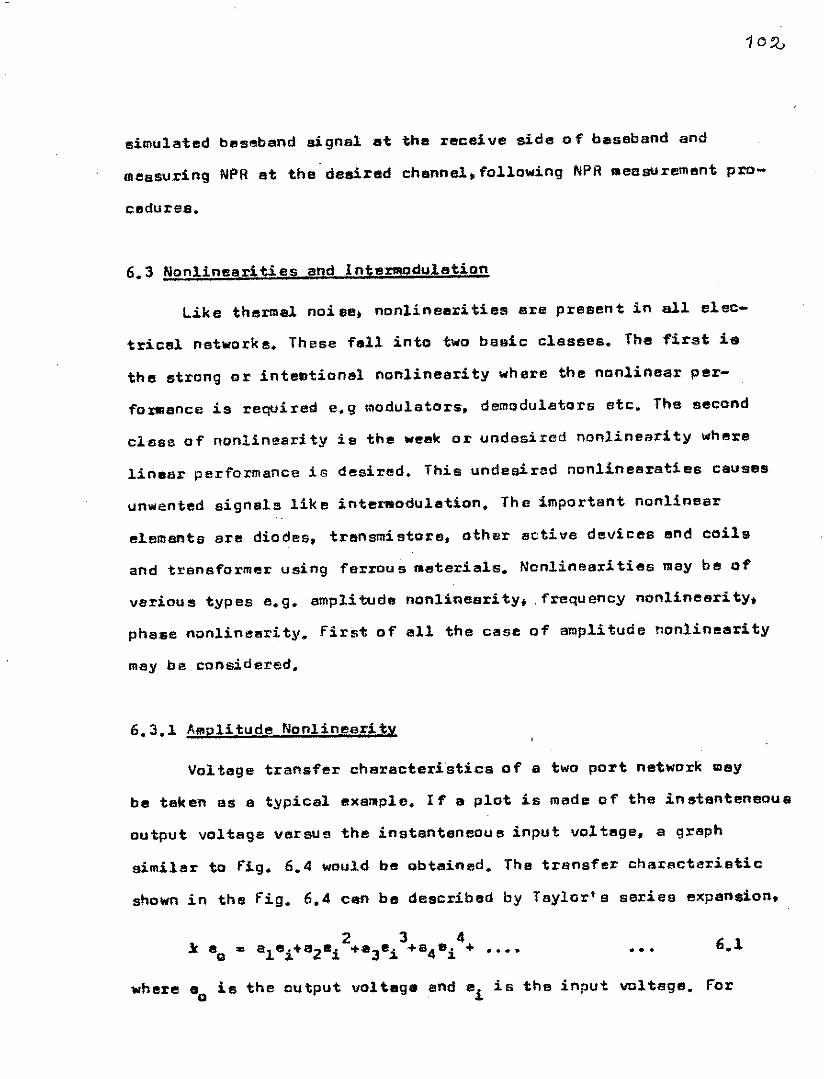
simulated baseband signal at the receive side 0 f baseband and
measuring NPR at the desired channel. following NPR measurement pro-
clldures.
6.3 Nonlinearities and Intermoduletion
L,ike thermal noi ee. nonlinellri ties are present in all elec-
tricel network I!. These fall into two basic classes. The first is
the strong or inteDtionel nonlinearity where the nonlinear per-
fOXIRsnceis required e. 9 modulators, demodulators etc. The second
class of nonlinearity is the week or undesired nonlinearity where
linear performance is desired. This undesired nonlinearaties causes
unwanted signals like internodulation. The important nonlinear
elements are diodes, transmistore. other active devices end coils
and transformer using ferrous lllflter.1als. Ncnlinearities may be of
various types e.g. amplituda nonlinearity. ,frequency nonlineerity.
phase nonlinearity. firs'!: of all the case of amplitude nonlinearity
may be considered.
6.3.1 Amplitude Nonlinearity
Voltege transfer cheracteristics of a two port network may
ba taken as a typical exalllple. I fa plot is mede of the instanteneous
outp'ut vol i:sg8 versu s the instani:eneou e input vol tage, a graph
similar to f.1g. 6.4 would be obtained. Tha transfer characterietic
shown in the fig. 6,4 can be described by Taylor's series expansion,
•••
where So is the autput voltage and ei is the input voltage. For
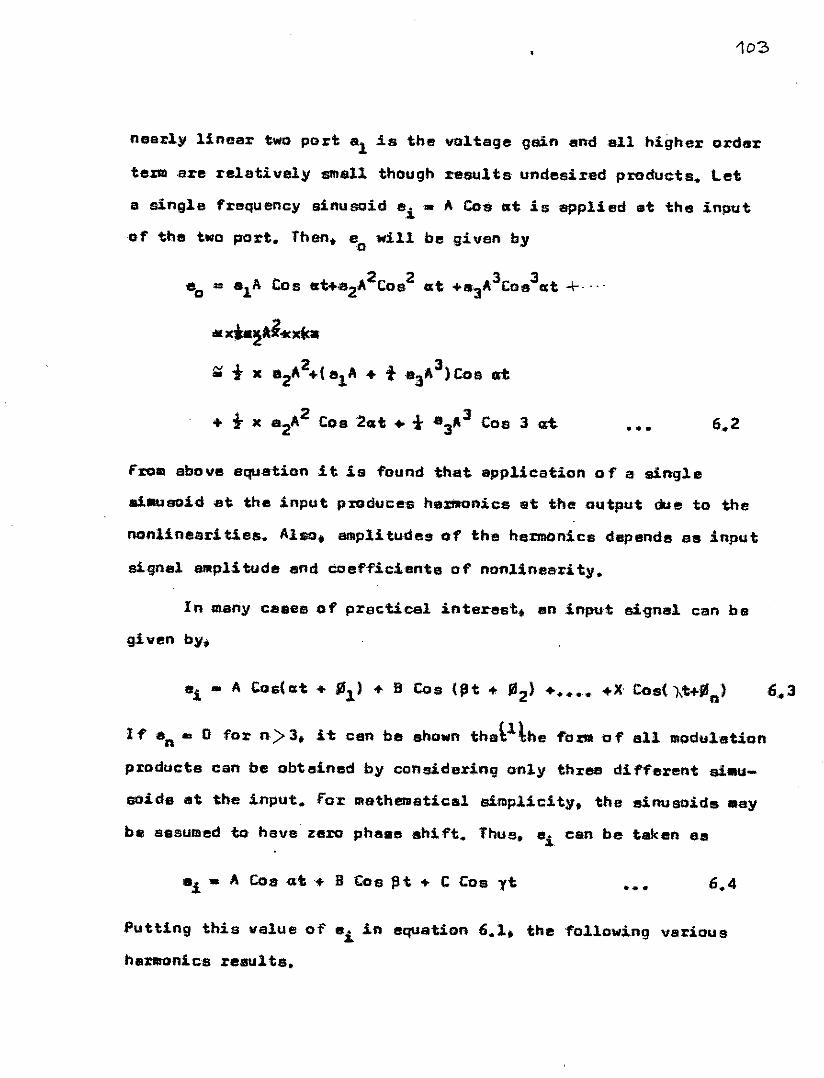
103
nearly linear two port al is the voltage gcn endsll higher ordsr
teD! .are relatively small though results undesired products. Let
a single frequency sinusoid e. - A Cos elt is I!lPplied at tha input.:1.of the two port. Then. 8
0will be given by
•••• ~Ai1C.~t x 82,,2+(811.+ tsaA3)Cos .t
•••
froll above aquation it1& tound that application of a single
s1llUsoidat the input pmouce's haZillonicsat the output due to the
nonlinearit.ies. Also. 8lIlplitudes of the harmonics depande as input
signel 8lItplitude end coefficients of nonlinearity.
In manycases of prscti.cel interest. en .input signal can be
I f an •• D for n> 3. it can ba shownthatl the fa l'III 0 f all modulation
producta can be obtained by considering only three different siau-
soid6 at the input. for IIlsthematical simplicity. the sinusoids .ay
be assumed to have zero phs8eshift. Thus. ei can be taken as
8i • It. Cos «t+ B COa 'I!t + C Cos y1: •••
.Putting this value of 81 in equation 6.1. the following various
hllrllonies results.
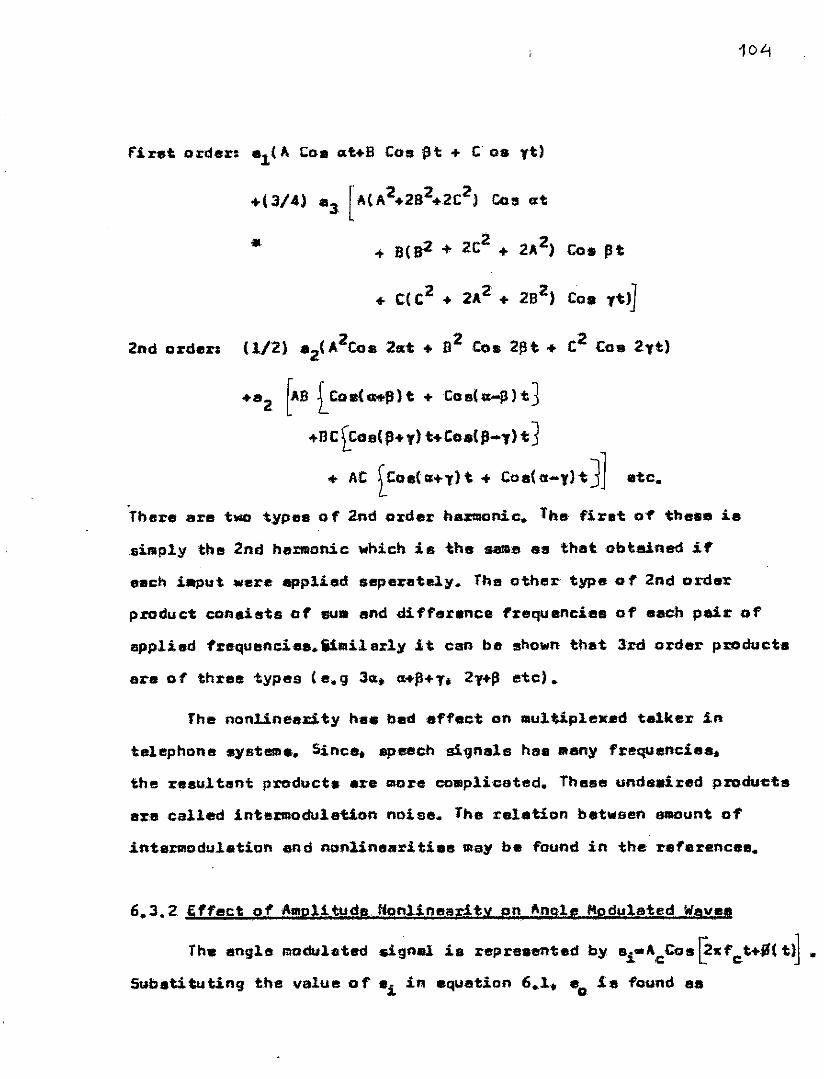
10tj
1ir&t order: al{A Cae «t+8 Cos tlt + C oa ytl
+(3/4) a3 [AtA2+2B2+2C2) Cos «t
.,..Bla2 .••2,2 + 2,,2) Cos pt
+ C( (2 + 2,,2 + 2B2) Cos 11;)]
2nd order: (Ul) 82(A2Co. 21d: + 82 Cos 21'1t+ ,2 Cae 2yt)
+82 ~B LCoat_IUt + (;0$(00;-l»t3
+BCLCoB(~+T)t+CO.(P-1)t]
+ At £COe("+l)1; + l:oa(o:-,)tJ] etc •.There are t~ tYPetl 0 f 2nd order hazmllnic. The firet 0" these ie
sillply thl!l 2nd hft%lllonic which is the Sde as that obtained if
e81::'hi.aput .ere epplied sepe:tetlllly. The other type 0 f 2nd order
product conuets of flU. and differ.nce frequ.nei.s of each pair of
applied frequent:i._. &111111 ad)' it can be shown that 3rd order products
ere 0f three types 'tl. 9 311t' C1+fl+T. 21+13e1:c).
The nonllJlearity h•• bed .ffact on lIIul.tiplexed talker in
telephone S)'81:__ • Since. IIppc:h signel8 he. lIleny frequenc1ellt
the :teeul tent product. are lIIOrecolllplicated. These undeulired product.
e~e called Intermoduletion noIse. The relation between _ount of
interlllodu~etion end nonlintuu:itiee lIlBYbe found in the referencee.
6.3.2 £f1'ect of AlIlplituda tIonllne19rit)/ on ""91" Mpdulated Wove,
Th. engle lllodulated signal Is reprea1!lnted by 1!I,i-A.eCos[21Cfet+j{( t)] •Slilbstituting the value of 81 in equation 6.1•• 0 1. found .,
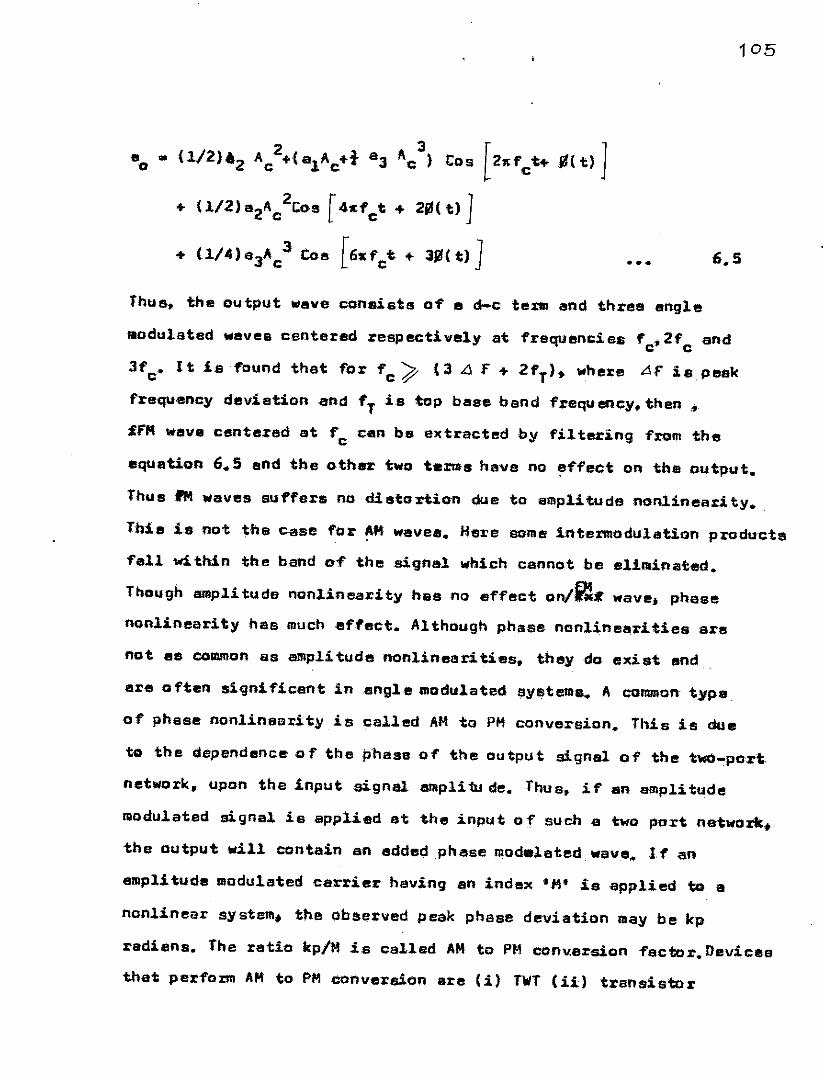
eo •• (1/2)62 Ac2+(a1Ac+t 8a Ac3) Cos [2ltf'ct+ ~(t) ]
+ U/2)a2Ac 2eos [ 4lt1ct + 2lH t) ]
+ (1/4)s3Ac3 Cos [6&fc't + 3~l(t)] •••
105
6.5
Thus. the output weve consists of e d-c term end three engle
Modulated ",eves centered respectively at frequencies fc,2fcand
3fc• It la10und that for fc >(3 Ll f + 2fT). where Llf is peak
frequency deviation and 1T is top base band frequency. then .•
IfM wava centered at fc cen be extracted by filtuing from the
aquation 6.5 and the other two teJ:'lJtshave no effect on the output.
Thus 1M waves suffers no distortion due to amplitude nonlinearity •.
Thle i8 not the Cese for AM waves. Here sDme intermoliulation products
fall within the band of' the .signal which cannot be elilllinated.
Though amplitude nonlinearity haa no effect onl~. wave. phase
nonlinearity has mu;cneffect. Although phase nonlinearities are
not 1!Il!I co1llRlonas ampl! tude nonlinear! ties, they do exist end ,
are often significent in engle lIIodulated l;lyetema. A commontype
,of phase nonlinearity is called AM to PM conversion. This is due
to the dependence of the phase of the output signal of the twa-port,
network. upon the input signal 8QlplillJ de. Thue, if an amplitude
11l0dulated algnal is applied at the input 0 f such a two port natwork.
the output will contain an eddedphese modelated wave. If an
amplitude modulated carrier heving an index .~. is applied to a
nonli,near sy.stem. the observed peak phase deviation may be kp
radians. The retia kp/M ia called AM to PM conversion facter. Devices
that perform AM to PM conversion are (i) T"T (1i) transistor
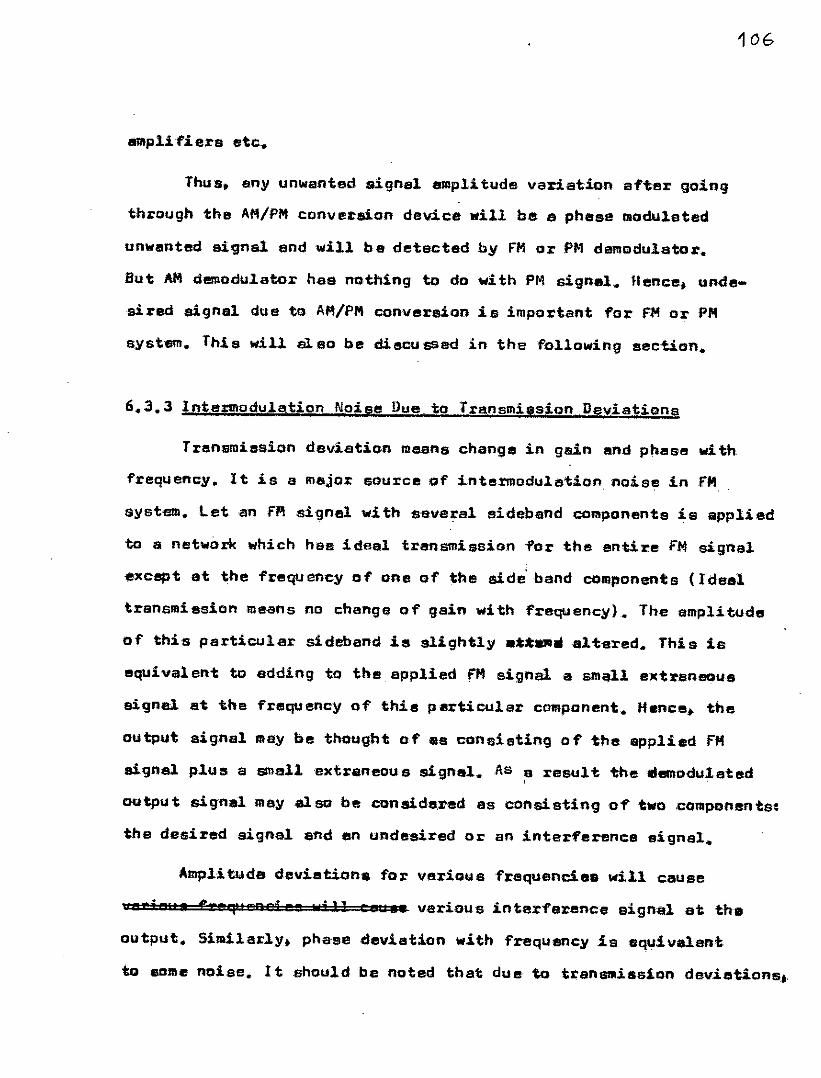
106
amplifiers etc.
Thus. any unwanted signal amplitude variation after going
through the AM/PM conversion device will be 8 phase modulated
unwented signal and will be detacted by F'Mor PM demodulator.
But AMdemodulator has nothing to do with PM signel .• Hence. unde-
sired signal due to AM/PM conversion is important for fHor PM
system. This will also be discussed in the following section.
6.3.3 lnts%ll'lodulationNoise Due to Transmission Deviations
Transmission deviation means change in gun end phase with
frequency. It is a major source of inte:rmoduletion noise in fll
system. Let an fA signal withsevsral sideband components is applied
to a network which hae ideal trensmissionfor the entire FM signal
i!lxceptat the frequency cOfonlllof thesi.de; band componenta ( Ideal
transmission me~nsno change 0 f gain",i th frequency). The ampli.tude
of this particular sideband is slightly _**P.sltered. This is
equivalent to adding to the applied fM signal a sm~l extraneous
signal at 'the frequency of this pllrticular component. Hence. the
output signal llIaybe thought of lIIS consisting of 'the applied fM
signal plus a smallextraneou s signal • .Asa result the.emodulated•
output signal may also be CQneids.1'edas consisting of two ,colllj)Onents~
the desired signal and en unde$ired or an interference signal.
Amplituda deviation. for veriousfrequenc:.ieB will cause
7 ??, fro1" nc; or 'd 'J] c e u61 various inter1'erenc:-e signal at th.
output. Similarly. phase devietion with frequency is equivalant
toeallle noiss. Itahould be noted that due to tranSlllission deviations,.
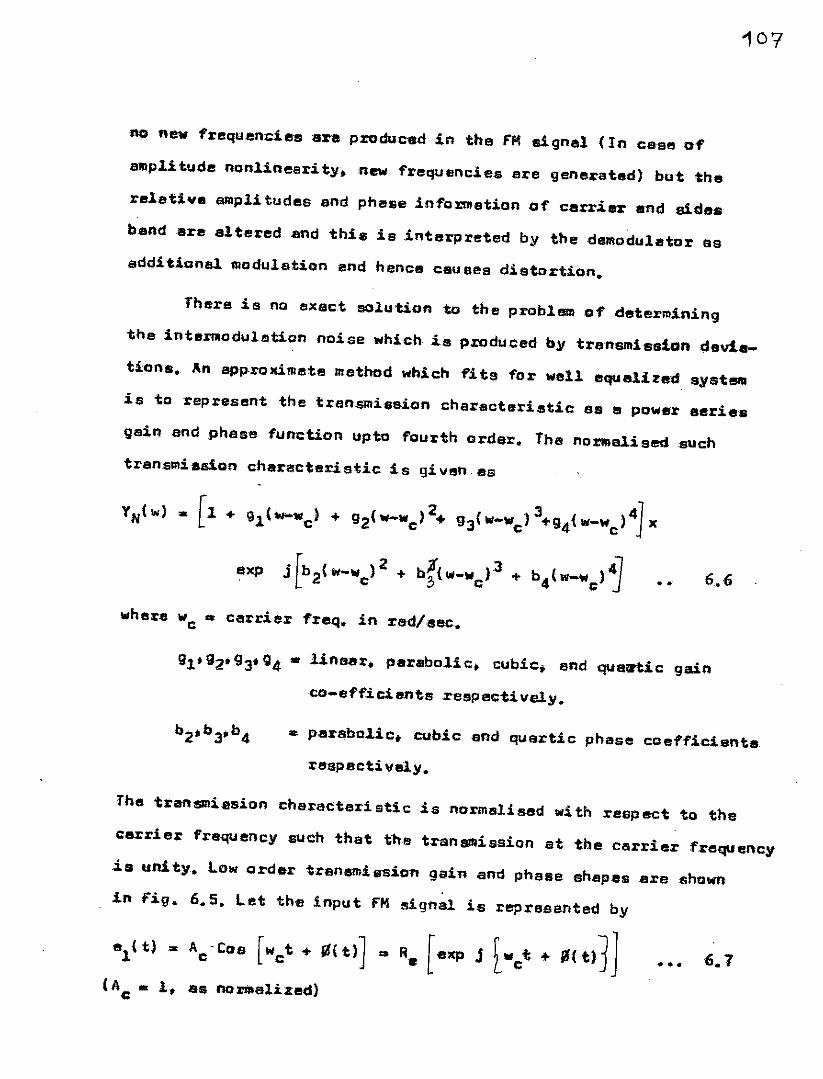
••
•••
107
no new frequem::iel5lare produced in the FMsignal (In catle of
amplitude nonlinearity. new frequencies are gene~ated) but the
relative amplitudes and pheBeinfo:z:DIatianof carrier and sides
bend ere altered 1.mdthis is ,interpretet! by the dl!llloduletoras
additienalmadulation end henceceu Bes distortion.
There is no eXact solutiDn to the p:cobllllllaf determining
the intertllodulation naise which ie produced by trs'nsmissian dev1_
tiens. Anapp,roxi,mlltemethodwhich fite for wall aquali:l:ed system
is to represent the transmission characteristic as a power eeries
gain and phase function upto fourth order. The nortIIslised such
tranSllliea10ncharacteristic is gi van,as
TN(w) ,. [1 + 91(-.c) + 92(_wc)2. g3(W-wclJ+94(W-Wc,4] lit
exp j[b2(W-Wc)2 + b~(w-wc)3+ b4(-Wc)~
where we~ carrier fraq.in red/sec.
91,92093,94 • lineer. parabolic. cubic, and qus~c gain
co-efficiente respectively.
e parabolic, cubic end quartic phase coefficient.
re:specti vely.
The tran!lllliesion characteri sUe is normalised with resp act ta the
carrier frequency such that t'h" tranlllllission at the carrier frequency
is unity. Laworder transmission gain and phase shapes are shown
.in Fig. 6.5. 1.at the input flo! signal is represented by
al( tJ", Ac -Cos [Wet + rI( t)] .• R. [exp j ~"'et + lI(t)]]
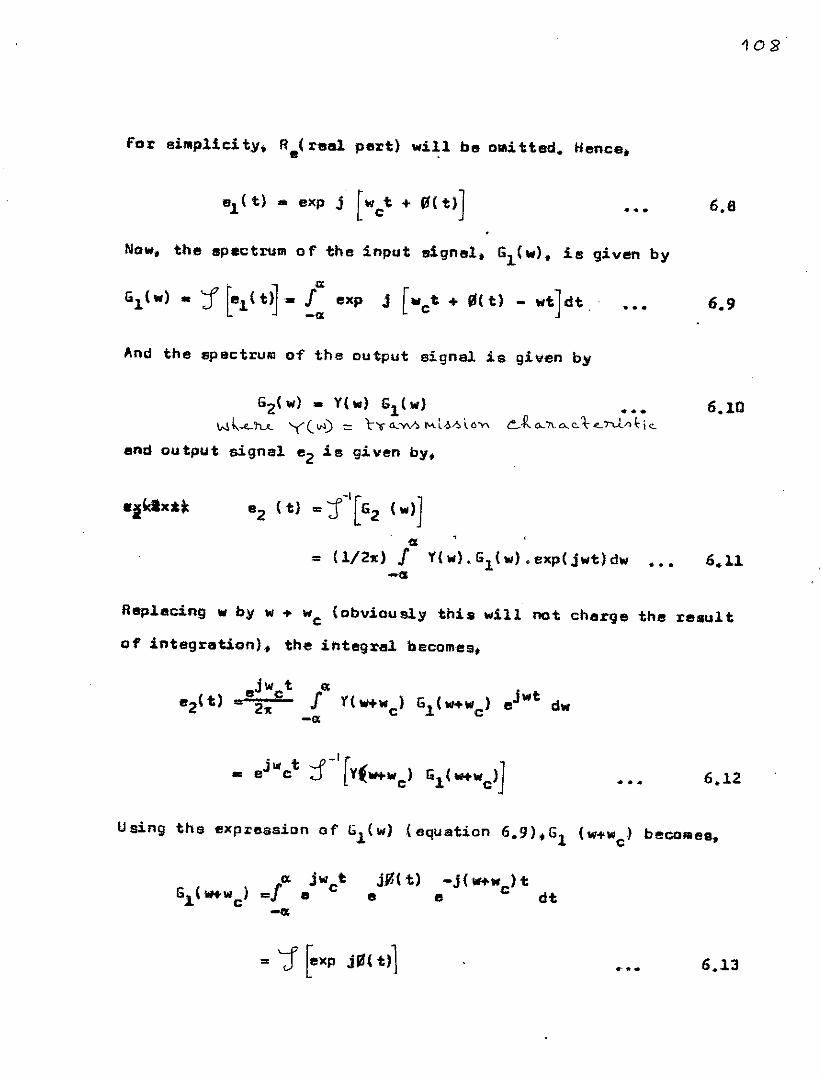
102
for einlplicity. Re( real pert) w111 be DllI1tted. Hence.
••• 6,8
Now. the spectrum of the input signsl. Gl(w). 18 given by
••• 6.9
And the spectrum of the output signal is given by
S2(W) - Y(.) G1(w) ••• 6.10IN ~..•...1"u- Y (. "') -= t-~<I..:vv'> l'I.l~ r..\ ""Y\ ~ -R.0-"" 0- e-1c~n1A i: k
and output signal eZ is g1ven by.
c= (1/2~)! Y(w),61(w).exp(jwt)dw-I'JI
•••
Replacing w by w + Wc (ObV10usly this will not charge the resultof integration). the integral becomes.
• ••
= J ~xp j5!( t)l .... 6.13
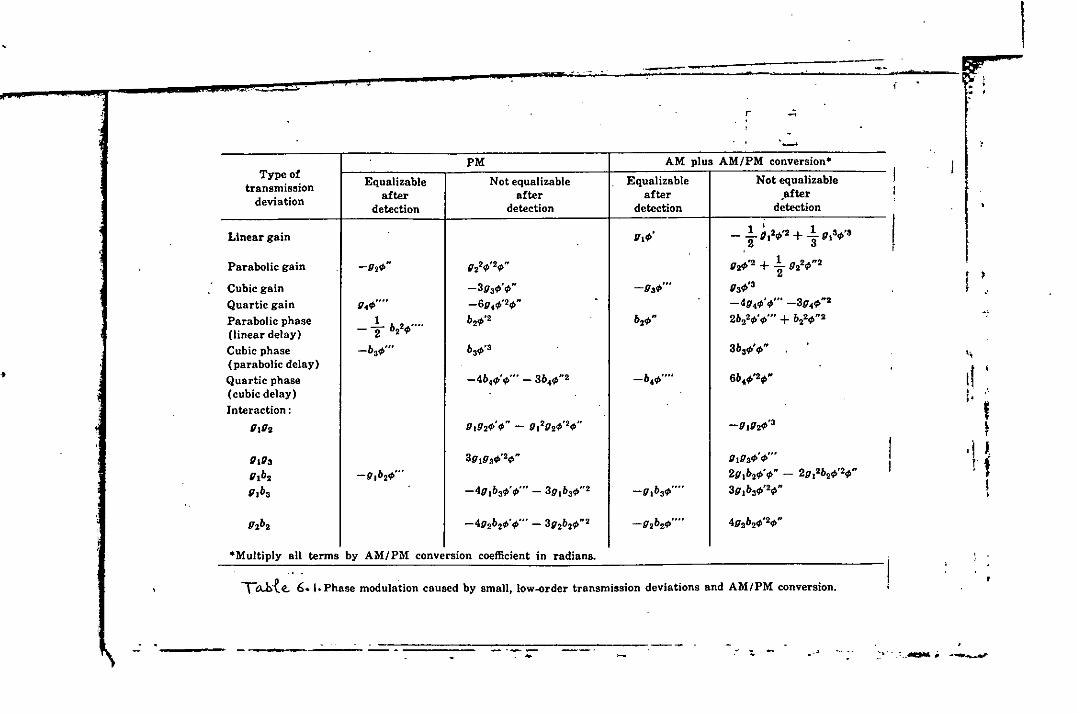
•
._-r -:;
.~PM AM plus AM/PM conversion-
Type.fEqualizable Not equalizable Equalizable Not equalizable
transmissiondeviation after after after .after
detection detection detection detection
Linear gain 11ltfJ' _ .!..9.211"2 + 1.O13f/":t2 3
Parabolic gain -g'l~" (/224"2(/>" (/2"''2 + ~ 02'lrp"22
Cubic gain -3g3~'~" -g3~'" fl34t's
Quartic gain 1J•."' •••• -6g.~"~" - -4g.~'~'" -3g.~"'
Parabolic phase .!.b' .... b2IP'2 624''' 2b2'lt/J'f/'''' + b2'ltf>"2(linear delay) - 2 ,~
Cubic phase -b3~'" b3CP's 3634"4'''(parabolic delay)Quartic phase -4b.~'~•••- 3b.~"' -b.~"" 6b,,95''24'''(cubic delay)Interaction:
IlI/J2 01024" cp" - U.2O'lt/J'2cp" -U.024"3
(/1(/S 3UtD3tP'2t/>" IhUati" 4''''
(J162 -g,b,~'" 2g1b,~'~"- 2gl'b,~"~"
l1.b3 -401b34"</'''' - 301639""2 -0Ib3<1' •••• 301b3t/1''lt/>''
g,b, -4g,b,~'~.••- 3g,b,~"' -02b24' •••• 402b2</)'24'''
.Multiply all terms by AM/PM conversion coefficient in radians.
TaJ::.{e. 6. I. Phase modulation caused by small, low-order transmission deviations and AM/PM conversion.
~,II :;. ,I
'If!,
\
----~ ~ -':~'~.~._-=tMi ~_--,"
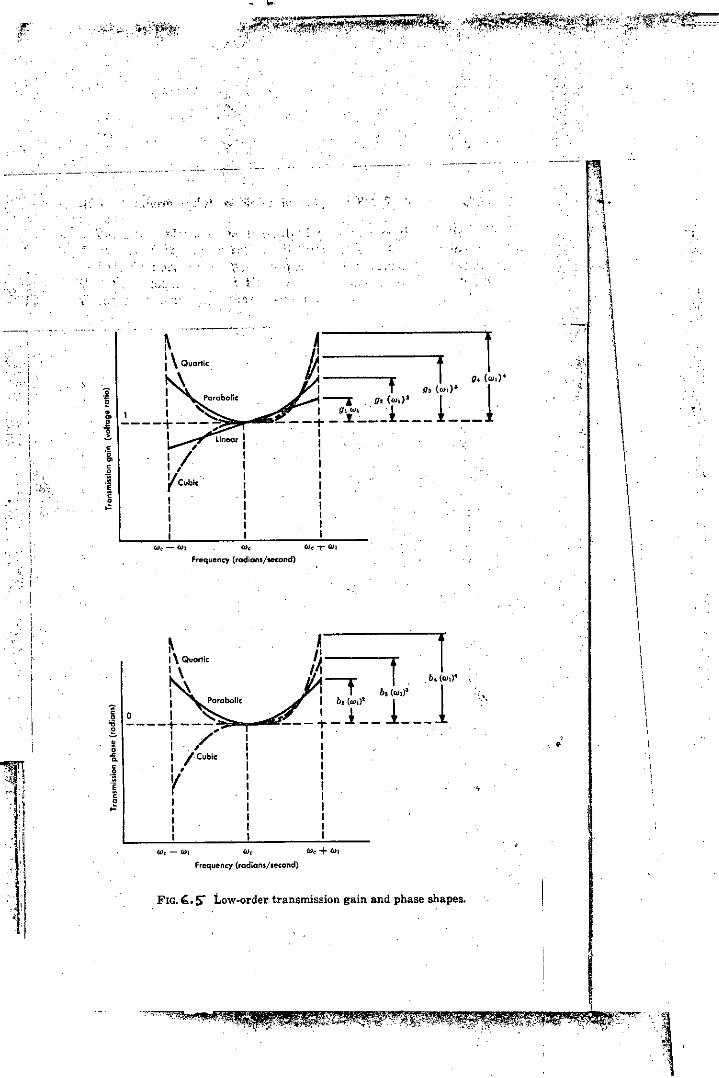
•.'
: "'.,
.. ,:~.
~..
,, ,
~-t.
,'"
'. "
<"'.
~~ \ Quartic.
\
,,/VCublc"
I,II
W. - lUI
.',",;':: ,,"
" ' ,~' , f~ f f g. (w.)'
I g, (w.)' 1----r gl (WI)! 1I glWl' '1 '. .
---+-~'--_!._-- ---I,II,III,II
W~+ClII
,!
'1"f,' , •, ",!
\1
\\
\\
.'
Nequency (radians/second)
"•
",
~I\ Quartic
'\~
w,Frequency (radians/second)
FIG. ,. S' Low-order transmission gain and phase shapes.
II Parabolic
10 I '=:'6 -----t----g I /'• I,-i I I,Cubic
.~ V~ r
.g III,I
i,Ii
IIIi
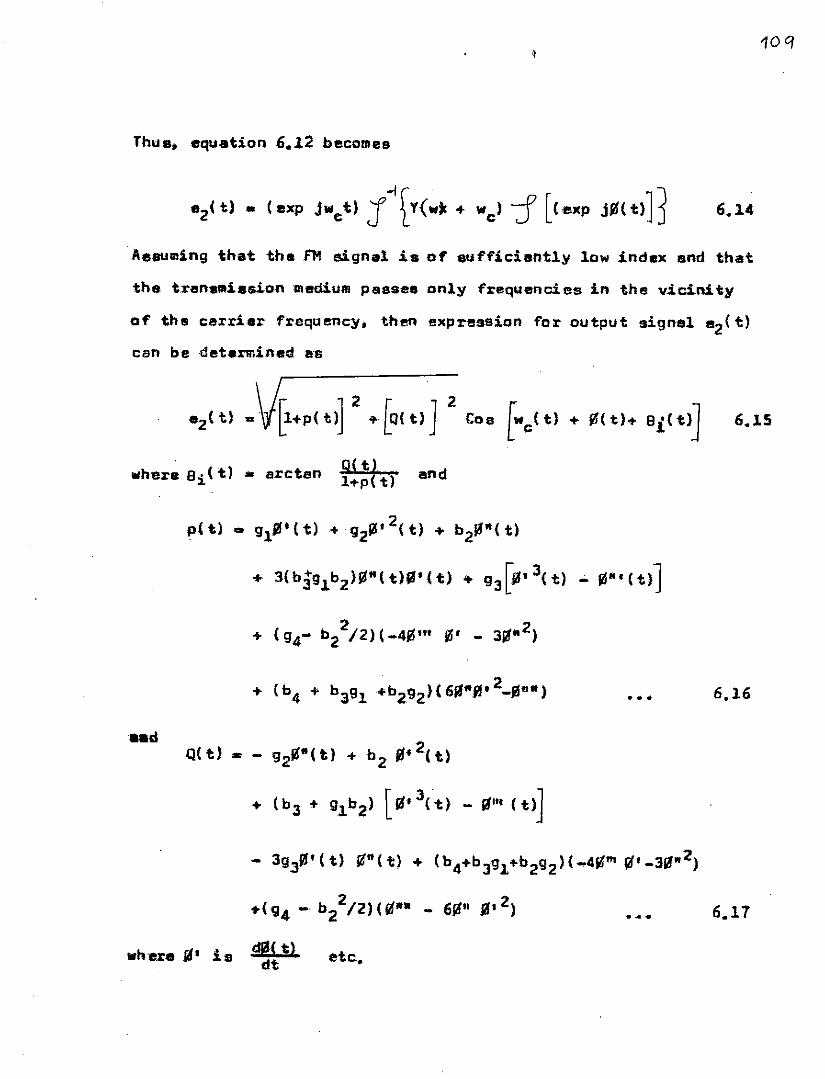
Thull; equ.•tion 6.12 becomes
Assumingthat the FMaignal is ofeufficiantly low index Bnd that
the tren1lllli.sion mediumpasses only frequencies in the vicinity
of the carrier frequency> then expression for .output signal 82(t)can be determined as
",here 8i (t) • arctan ~l:lt}endp( t) • '''1111 {t} .•.92~12( t) .•.b2J6"(tl
.•. 3{bjglbZ)J/"(tHI'(t) .•. 93Lj,l.3{t) •• J/'''(tlj
6.15
Q(t} • - 92J/"{tl .•.b2 ~.2{tl
.•. (b3'" 91b2) [li!f3{-tl - it'" (t)]
••• 6.16
•••
393J/'(tl ~"(t).•.(b4+b3g1.•.b2g2){_4~m ~'_3".•2)+(94 - b22/2)(J/". - 611" JI.2) 6.17
where II' is !iii t).dt etc.
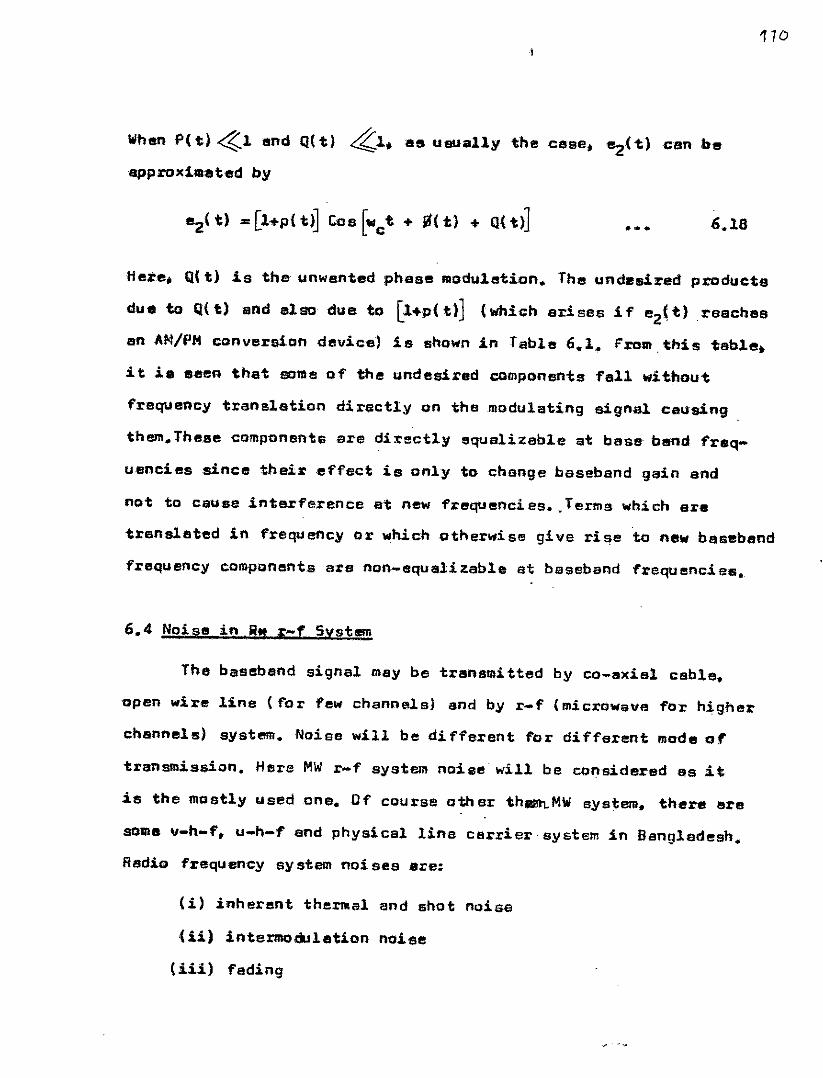
110
WhenP(t) <t1end CI( t) <Z.1. as u.sually the case. 82(t)csn be
approxi1ll8ted by
•••• 6.18
Here. Q( t} is the unwanted :phase Illoduletion. The undesired products
due to CI( t) and also due to [l+p( t)] (which srises if e2(t)reacha9
an AM/PH(;onversion device) is shownin Table 6.1. From this table.
it i. Sllen that earnecf the undesired components fall without
frequency translation directly on the modulating signal causing
them.The.se components are directly aqualizable at base band freq-
uenciessince their effect is only to change baseband gain and
not to cause interference at new f'requenci es•. Terma ""hicn are
translsted in frequency or which otherwise give ri",e to ,newbaseband
frequency components ars non-equalizebla at baseband frequencies.
6.4 Noise in Rtt r-f Syshm
The baseband signal maybe transmi tted by co-axial cable.
'open wire line {for fewchannelsl and by r-f (micrOwave far higher
channels) system. Noise will be different for different modeof
transmisaion. Here MWr-f system noiee will be considered as it
is the mostly used ana. Of course othsr th$].MWsystem. there l!lrl!l
somev-h-f. u-h-f and physical line carrier system in Bangladesh.
Radio fr.equeney sy stem noi ses ere:
(i) inherent the~al and shot noise
(ii) intermo.wlation noise
(iii) fading
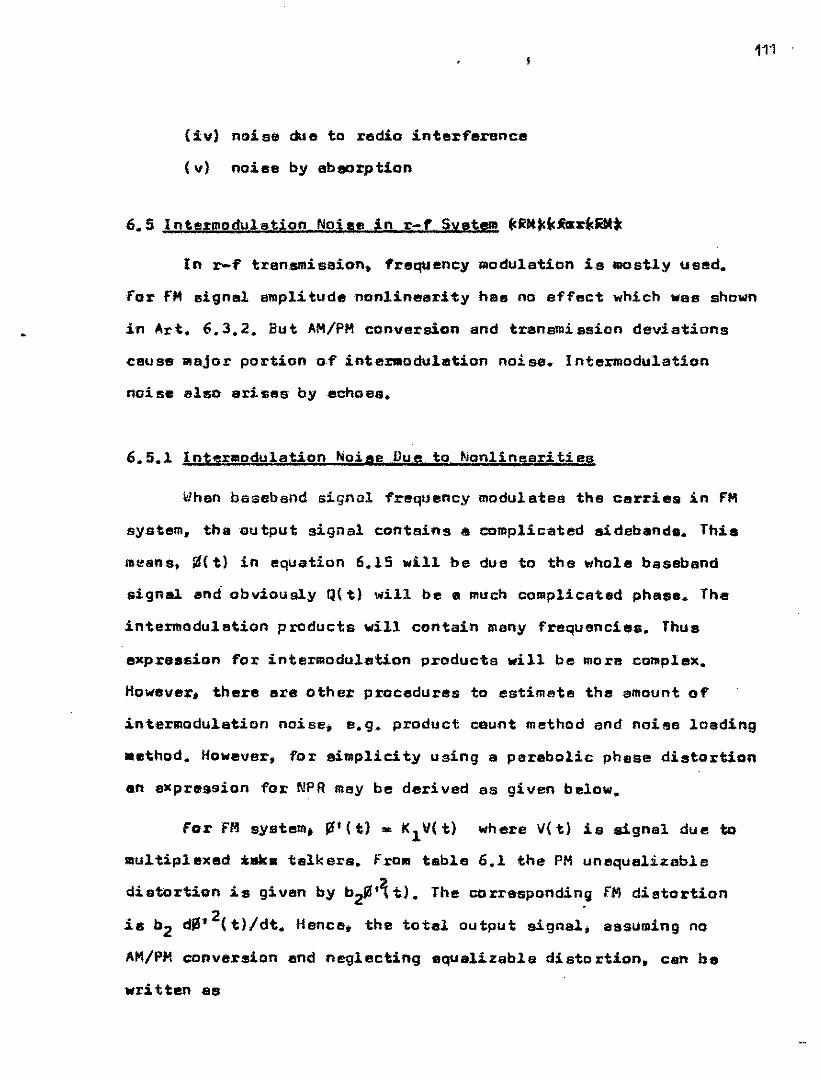
111
(iv) noise due to redio interference
(v) noiee by abaorption
6.5 Intermodulation Nohe 1n r-f Svst!!l!!l(dIM""~~"iIO
In r-f trensmission. frequency 1lI0dulation .is IIIOstlyused.
for fM signal amplitude nonlinearity has no effect which was shewn
in Art. 6.3.2. But AM/PMconversion and trenamiasion deviations
cause lIlajor portion of inte:aaoduletion noise. Inte1'lllodulation
noise also enslls by echoes.
6.5.1 Inter.pdulation Noise Due to Nonlinearities
when baseband signal frequency moduletes the carries in FM
system, the output signal contains a complicated sidabands. This
means, lil"(t) in equation 6.15 will be due to the whole baseband
signal end"obvlou sly Q( tl wl11 be a much coll1plicatedphase. The
lntermoduletion products will contain meny frequencies. Thus
expra.ssion for intermodulation products will be more cOlllplex.
However. ethere are other procedures to estimate the amount of'
.interlllodulation noise. e. q. product count method and noise loading
.ethod. However. for simplicity using a parabolic phase dietortlon
an expression for NPRmay be derived as given below.
for fM system. !il' (t) "" K11I( t) where V{t) is signal due to
multiplexed *ak. telkers. from table 6.1 the PMunequalizable
distortion ie given by b2lilf~ t). The correspondin.9 fM distortion
115 b2 dlip2(t)/dt. Hence, the totel output signal., assuming no
AM/PMconversion end neglecting equalizabla distortion. can be
written as
> c
.' f •••.
' .. ,. ,
"," ."
, ,0 utj:{Vf 'voltage, eo
,."'."
. "
••c
. "'\'-
cc'
,-0 .F;g. 5.~ Nonlinear volta'ge transfer' 'chiJ.racteri stic of 'two - port
-~ <. --- ~ ..,C ',' •. '.
c'c
0>
Squa reI' y '" d Multip'lier 7X"c
0.. , , yl t ) dt b2, k 1 2 (I)" x (t) - .,
.
Fig.5.5 System o'nalog for second order modulation
"
,"', Primary path
.ech.o path .~'.
,
, ante rtn a
)
Signal amplitudes
FIg. 5.7' o' Echo 'n a. transm',tter an tenna system
.. .'.Th. distort1on term (2nd term~ in eqn. 6.19) may be represented
by the Fig. 6.6. Heretlt(t) •• Vin{t) is assumed to be Gaussian
process with zero mean. Autocorrelation function 0 l' x( t) i$
fix{ 1-") •• Lt (1/211' )
T~a
TJ x( t) x( t + 1-') dt-1
m E [xl t) x( t +'l")J
(E means expectation).
...
Sinca autocorrelation functionlllnd power density spectrum
form fourier transformpa r. Rx('Y) ean be writt!!n as
and
(I
Rx{Y 1 •• (1/2,,) J Sx(w) {exp jw'1"')dw1l'f
(I
;)x(w) c':f[RXI-Y)J - J Rxl1-') (exp -jw'l""')d7'-'-(I
•••
•••
Now,mean of the squared vllIlue of the input signal i8
••• 6.23
This Illesns .AxlOI is equllll to the average power of the signal x(t)
since ~ Sx(.) is the input power density in watts per K!!rtz
assuming a one Ohmload imped!mee for convenience. Now, !!utocorre-
1aUan function of th esquare of x( t) is
22Rx 1'1) .... 6.24
Th.e teX'lllflx2( 0) is the square of the average power 0 f the signal
and aa a con.tent contributa. no di.tortion apactru.. Thu.. the
di.tol:tion apwc1:ruaat Y i. given by
ex5y(w} .2/ Rx2('Y) (pp - jW1'"')d'Y
.(1/.) [Sx(w) « 5x(w)J •••
",h.r. 's' ••ans convoluUon. finally, ainca taking tba d.riv.Uve
of V(t) i. equivalent to aul1:.iplying S(w) by ",2. the power sp.ctral
5z(w) •k 2 b 21 2
Ie",2
[SX(w) • SlC( w} ] • ••
Thus. SHRor MPRat ••.•y b•• eband fr.quency in en FM8y.t •• with
par.bolic phe•• oc lin •• r del.y .lope will b.
f · Svin(w)NPR(w) • 10 log 2,. 2 2
b2'-k1. w (Svin« Svin)] ...
The ••••• u:•• ent .ethad for VPIl Ie given in Chapter •• Of courae
.in that ••• eureaent interaodu1ation noi.e due to eehoe. is aleo
included.
6.5.2 IntaraodglaY.on Noi•• Dueto Echoe.
Echo••• a significant .ouree of int.Z'IllOdul.tion noise 1n f"M
.y.t_, aay b. genarated in nUJaber of ",ay. e.g. ;lapedance ai.eten.
or product fr.quenci •• end othel:' related effect ••• y caus•• cho•••
11~
The conditiona for the generation 0f an echae are • desired p:d.lllery
transmission path and en un~anted aBconderypeth over which 15
frection .af the original Jlignal arrives at the receiver. di$Placed
in tilDe from the prima.rysignal. fig. ,6.7 illustrates. sit-.tion
cOllllllonlyoc:curedin waveguide runs. Here an echo of llfBplitude
retia •y. relative to the desired sign81. in displaced by an
absolute tille delay. T; to reach the antenna. Thus. if en angle
aodulated signal 9l(t) •• "c Sin [Wet l' f5(t)] is transmitted over
the ey.tl!lllS in fig •. 6.7,. the resultant transmitted wavewill be
•••
Now. using. X« wet + ~(t) and y.-we' + ~(t--T) - ~(t) eqn.6.28becomes,
152(111)•• Ac Re [••@exp jx)- JTexp J(x+y)J
•• Ac R. [ •• jexp jJ( .(1 + Texp Jy)]
Now;for $ y ~1. sqn. 6.29 maybe written as
ez( t) ..,"c Re[ .••(j exp jx) axp( ysJY)]
•• Ac R. L(sXP yEosy)( •••j}exp j(x+TSiny)]
fhi. expression 1lI1!1)' further ba spprox.i.mated••
• eo.
••• 6.30
e2i t.}••Ac( 1+TtoflY) Sine x+TSiny) ••• 6.31
115
Now, putting values ofll: and y. eqn. 6.3m becomes
6.32
Aftsr limi ting" the phase modulation will be ~(t) + 16n( t),
where lifn(t) is unwanted signal effect in phase. I t is 1!IJ:_ given .&y-
fzom Eqn. 6.32 as•
Evidently, "n( t) produces intermodulation noise. Intermodulation
frequencies forlifp( t) ~ay be found in references.
Basically echoes may be devided into two l;:1allsesviz •. Ul
echoes due to mismatches in ilmpedance such as at tha ends 0 f
waveguide connection,s to the antenna, and in sOllieCases echoes
by reflection from buildings in proximity to the transmission
path. These are normally weak echoes, (ii) Strong echoes which
approach the magnitude of tha lIlain signal having very short time
delays caused by atmospheric,lIIul.~ipath tJ;'all~ission or by ground
reflections. This type 0 f echoe .cause fading.
Noise Due to Radio
:;: f the undesired
interference
interference signal is added to the desired
fM signel, the spectral b_ts of both signal.s fall into every
message channel. and is cal.led interference noise.
Let the desired fM signal be Ac Sin [Wet + aA(tl] and the
undesired fM signal be Be Sin [wdt + Ba( t)]. Combining both signals,
the output fram the frequency discriminator ie given by. if
B <ft.
116
=(1/2.) Z(-Bc/Ac)nCOIll
'" ~(
The first terlll in eqn. the signal and the 2nd term ax.h.
is the interference. Three important factors in the interference
noise are:
(1) Carrier frequency difference between the desired and
undasiJ:.d signal ("'c- "'d)'
(2) Th. desired to undesired sign.l r.Uo.
(31 The sidebend spectrum of the desired and undllsired
eignal (the terlll SA - Ba).
Now. tha power spectrum of the desiX'ed signel is given by
....whera Of. - affective frsquency deviation of the desired dgnal.
ftnd for undesired signal;
•
B 2c
2 V2i era2 2j.B -( f'-f -f' ) /2ceo------e
2 '{2x cJB
a:2B
cr:2B•••
•,where; fd - fc •• 1'0 and era'" .ffectiva frequ ency deviation 0 f
the undllsired signal. Now. power spectrum a f the reBultant noise
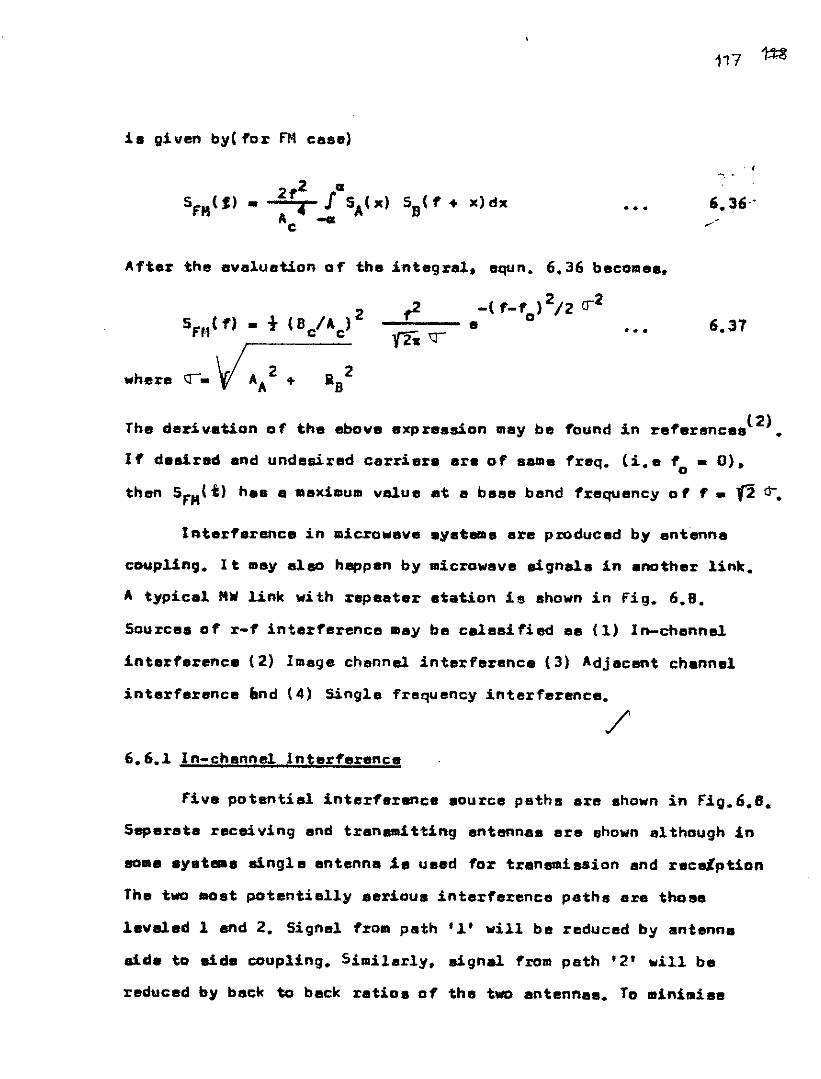
117
i. given byefor FMcase). ,
••• 6.36"
After the evaluetion of the integral. equn. 6.36 becomea,
••• 6.37
The derivation of the ebove expression maybe found in refersnces(2).
I f desired and undesired carrier. ere of sallle freq. (i.e f _ 0),othen SFM't) hes a lIexilllumvalue at a beae band frequency 0 f , • 12 0-.
In.terference in microlllave.yeto•••• are produc.d by antenna
cO\Jpling. I t !Deyalso happen by microwav. aignala in .nother link.
A typical MWlink with repeater .tation is ehownin Fig. 6.8.
Sources of r-f interf.rence maybe caleBi fied as (1) In-channal
interference (2) Image chennel interference (3) Adjacent chennel
interference ~nd (4) Single frequency interference.
/6.6.1 In-channel Intarference
Five potential interference source paths are .hown in Fig.6.8.
Seperata receiving and tranemitting antenna. are ehownalthough in
solie .yst_e singl e entenne .1e ueed for tran8lllission and recetption
The two most potentielly serious interference paths are tho ••
l.valed 1 and 2. Sign.l from path '1' will b. reduced by antenna
sid. to side coupling. Similerly, signal from path '2' lIIi11ba
reduced by beck to back ratios of ths two antennas. To .inilllis.
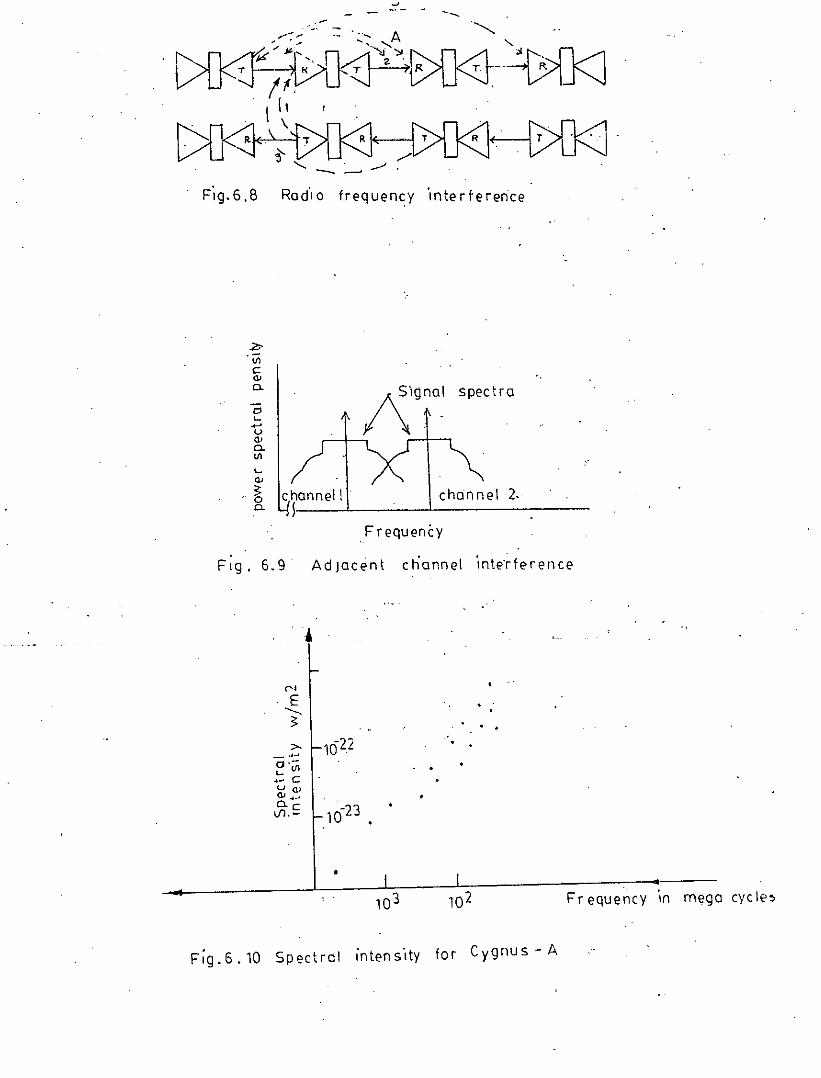
.-
Fig.G.a Radio frequency 'Interference
pVlC
'"0- 1\19nolspectra
cJL---Ua>0-.Vl
L-
a>
~ 2.0-
Frequency
Fig. 6.9 Adjacent ctiannel,Inte-rference
. .
•Frequency In mega cycle~
F;g.6.10 Spectral intens'lty for Cygnus-A
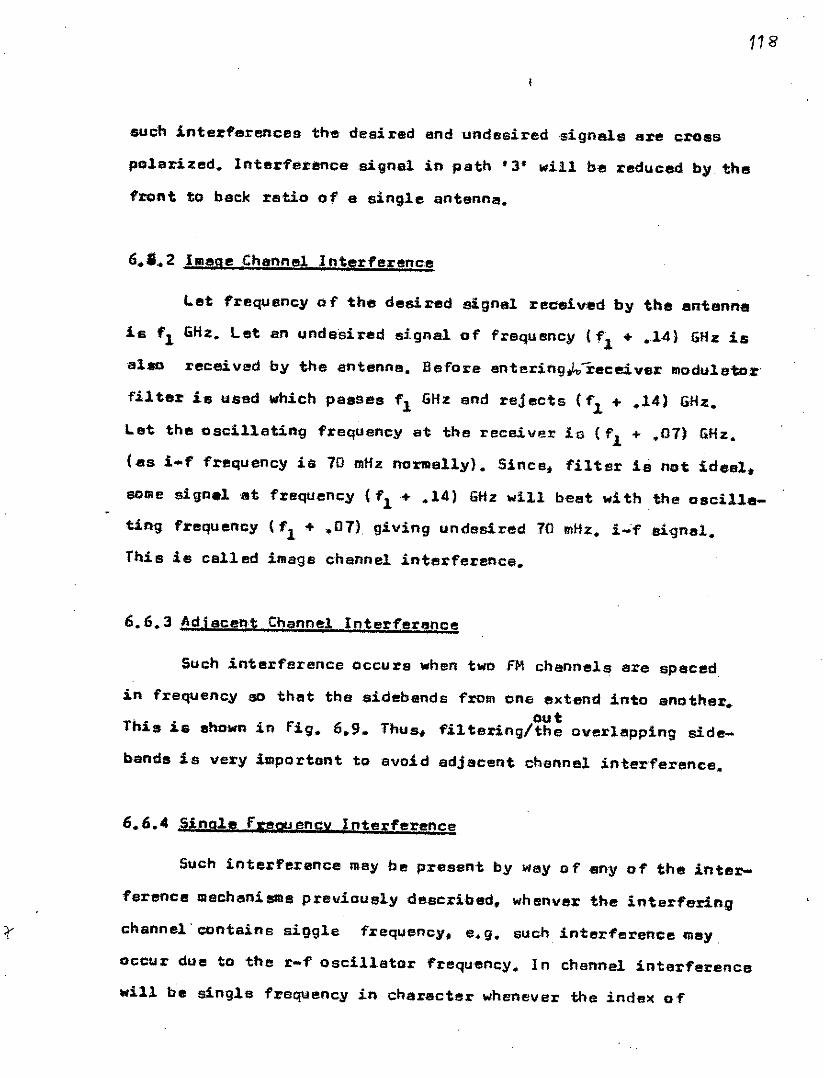
118
such interferenc.es the desired and undesired ,signals are cross
polarized. Interference signal in path '3' will be reduced by the
front to back rstio of e single antenne.
6.'.2hu'gt! Channel I nterferenc1!l
let frequency of the desired aigna1 received by the antenna
is '1 GHz. let an undesired signal of frequency (fl+ .14) GHzis
a1f1O received by the antenne. Before enteringhreceiverllloduletor.
filter is used which passes '16Hz and rejects (f1 + .14) 6Hz.
1.et the oscillating frequency at the receiver in ('1 + .07) 6Hz.
(as i ••' frequency is 70 mHznOrllla11y). Since. fi1 tar Is not idee1~
SOllie 5i913.1 at frequency (fl+ .14) 6Hz will best with the oscilla-
ting frequency ('1 + ,.01) giving undesired 10 mHz. i-fBignal.
This Is called image channel interference.
6.6.3 Adj acent Chennel Interference
Such interference occurs when two fM channels are spaced
in frequencyBO that thasidebands from one extend into another.out
This is shown in fig. 6.9. Thus, filtering/the over1epping side-
bands is very important to avoid adjacent channel interference.
6.6.4 Sing~e frequency Interference
Such interference may be present by way of any of the .inter-
tsrence mecheniSllla previously described. whenvet: the interfering
channel. contains si9gle frequency. e.g. such interference mey
occur due to the r-f oscillator frequ1!lncy. In channel interference
will be single frequency in character whenever the index of
11"/
moduletion in the disturbing signal is low oJ:'~when~in the
8)(1;r,... the carrier is unllloduleted.
6.7 (ffect of Abaerption
Re1t\fell and wateJ:'vllpour produce pronoun.ced att8nu.tion
by .bsgrption .t higher microwave frequencies. for heavy rain.
this loe. ie about 0.5 dB/kMfor frequency around 6 GHz. Though
it is not actually a noise. but since signal strength decrsesea.
ultimata sffect eppsers es noiS8. Besides at about 606Hz oxygen
ebeorption tak liS place.
6_.1Noise .in Satellite 5ys-te
Noise in satellite transmission system meybe divided into
two broed groups.{i) noise in 8ete111te itself (ii) sky noise.
The former consists of thermal noiss. shot noise. intermodulation
noise etc. Sky noise maybeclaeslfied i-nto three groups, (1) th.
solar noille (ii) cople noise and (iii) atmospheric static.
Atmosphe.ric static that is mo.stly generated by local and tropical
thunder-storms p1:imarily causes harmful interference ta h-f and
lawer frequencies. Dn the contrary solar radiatian covers the
whole frequency 8pectrum from h-f ta the frequencies hi-gher than
10 GHz. COlllllicnaiee may al. so be considered to cover a broad
frequency band even if such a deacrete frequency spectral J.1n.
88 1420 mHzis well known. but has not been fully investigated
to th., broad extent .Df frequency.
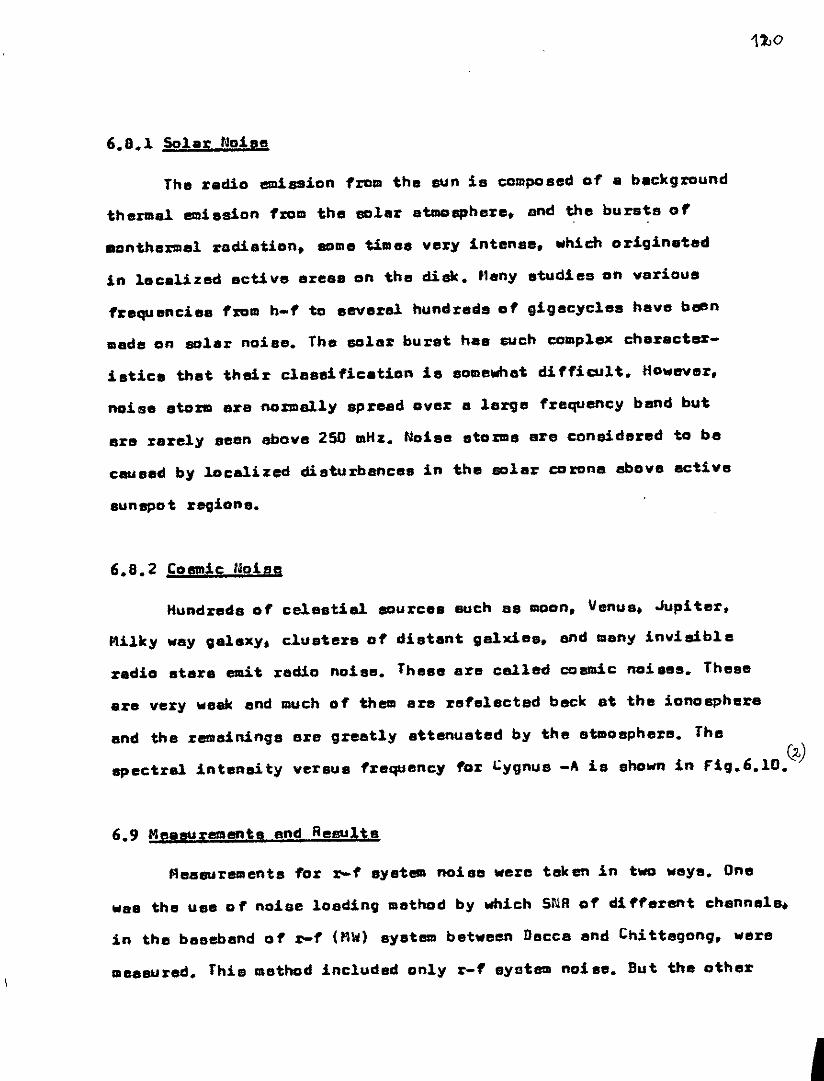
11JO
6.8.1 Solar Noise
The radio emission fram the sun is composedof a backgraund
thermaJ. l!Illission fzom the solar atmosphere. one!the bursts of
aanthermel radiation. some times very intense. which originated
in lecalized acti ve ereas on the disk •• 1any etudies on various
frequencies fzom h-f to seYsral hundrsds of gigscycles heve been
medeon solar noise. The ISOlerburst has such complex chsrBcter-
istics thet thsir clessification is somewhetdifficult. HOlllever,
noise etorm ere normaJ.ly spread over a lerge frequency bend but
Bre rerely seen above 250 mHz.Noiee stoms Bre considered to be
caused by locdized dieturbances in the soler corone abovs ective
sunspot regions.
6.8.2 COsmic NoisD
Hundreds of celestid sources such as moon. Venus. jupiter,
Milky lIIaygal.~y. clusters of distant gal~es, and manyinvisible
radio stars emit rediD noise. These are celled coBlllicrtQises. These
ars very lIIeakend muchof thl!lllSrB rsfslected beck et the ionosphere
end the remeinings
spectral intensity
Bre greetly attenuated by the etmosphere. The. C&)
versus frequency for l,;ygnus-A is shownin Fig.G.1D.
6.9 Measurements BndResults
Meesurements for r-f system noi se were tsk en in tllllOIIIsys. Ons
wes the use 0 f noise loading method by which SNRof' di fferent channels.
in the beeebend of r-f (MW)system between Decce end Chittagong, 1118re
measured. This lIlethodincluded only r-f SYlltBlllnoi se. But the o'ther
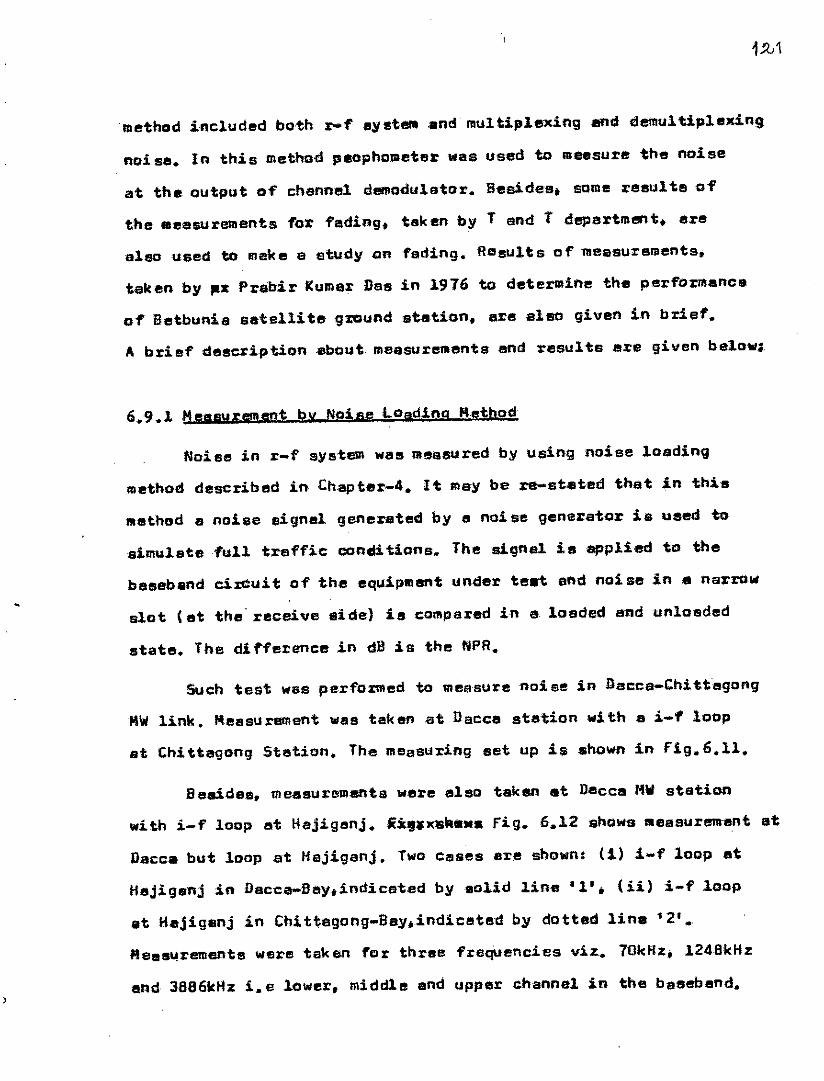
method included both r-f B1stetlland multi,,~exing IIf1ddelllultiplelci.ng
noiee. In this method paophollleteJ:was used to meesure the noise
at the output ofchennel demodulatctr. Besides. some r8sul t8 of'
the messurements for feding. taken by T and r department. erealso used to make a study on fading. Results of 1lleasurements.
taken by ,._ Prabir lCumerDas in 1976 to deterllline the parfornlance
of Betbunia satellite g1:Clund station. aresleo given in brief.
A brief descriptioneboutmeesurelllents end results e.rs given be~ctw;
6.9.1 Meowrement by Noioe LOadingMethgd
Noise in r-f sj/steJl\was mellleuredby using noise loading
method described in thapter-4. It may be re-steted that in this
method e noise eignel geRl!lrstedby a nolse generator is used to
81mu18te1ul1 traffic conditions. The signel is applied to the
bsseband cixCuit of the equipmsnt under telrt ('lAd noise in ,IInarrow
slot (at the' receive side) is compared in e loaded and unlosded
state. The di fference in dB is the NPR.
Such test was perfo%llledto measure noiee in Daccs-Chittagong
Mill Ii-nk. Meesurementwas tel<en at Dacca station ••ith a i-1 loop
at Chittsgong Stetion. Thl!lmeasuTing eet up is shownin fig.6.1l.
Besides, measuremanta were aleo t8ken .t DeccaMWstation
with i-f loop et Hejigenj. fiX'I'QR ••• fig. 6.12 showsftIl1ll1surnentat
Dacc. but loop .at Hajiganj. Twocl!Ises ere showm( 1) i-f loop at
Hejigenj in Dacc.a-Bey.indiceted by.olid linit '1'. (ii) i-f loop
at H-ejigllnj in Chittegong-Bay.indiceted by dottsd line 12'.
Mees\.!rem.entsWtlre taken f'or three frequencies viz:.. 70kHz. 1248kHz
end 3886kHzt .•e lower, middle and upper channel in the basebend.
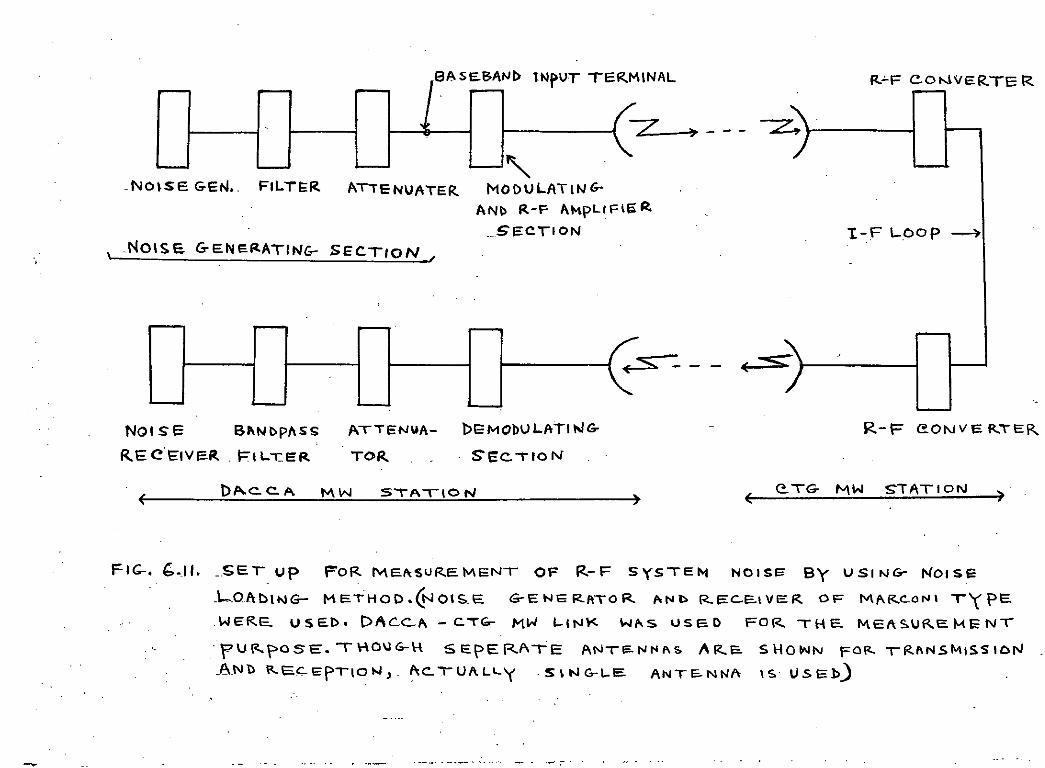
.BASE-BANI> INpUT TERMINAL R.-'-FCONVER.TS R
"-.NO~SE GEN•. FILT~R ATiENUATER MODULATING-ANI> R-F AMpLrFi~R...Se:CT"ION
\ .Nolse. &ENe.~ATING-- Sec.TION./'I-F LOOp ~
Not s E: Bf\Nl>pIlSS
R.EC.EWI:R . FILTE~
ATTENUA- I>EMObI)LAtnlG-
TOR. SEC.TION
R-F e.ONVE RoTE\<"
( e.TG MW STATION),( DA.Co Co A M. W STATIO N )
FIG... b-I/ •.. SET up FoR MEAsuREMENT OF R-F SySTEM NOISS" BY USING- NOise
.1-..OftDING- M ST HO \).001 S E G-ENE RI\TO R AN t> R. EC-E\ VE R. 0 F M./'IR.C-ON I T'( pE.
WER.E.. USE\). t:>1\C.CA - C'TG- MW LIN~ W/'<s use.D FOR. THE. MEf\SoUR.e.kENT
.F'UR.POSE. ,\-\O\lG-\-\ 5EpER-PlTE ANT\S.N"'/'I~ J\R.e. SHOWN FoF- TR./'IN.5l'v1ISSIOI'i
.&Nl:l REc:..EpTIOt-l, A<:"'T"Uf\LLY .SIt-lG-LE. ANTENNA IS USEb)
.~ -.--;-
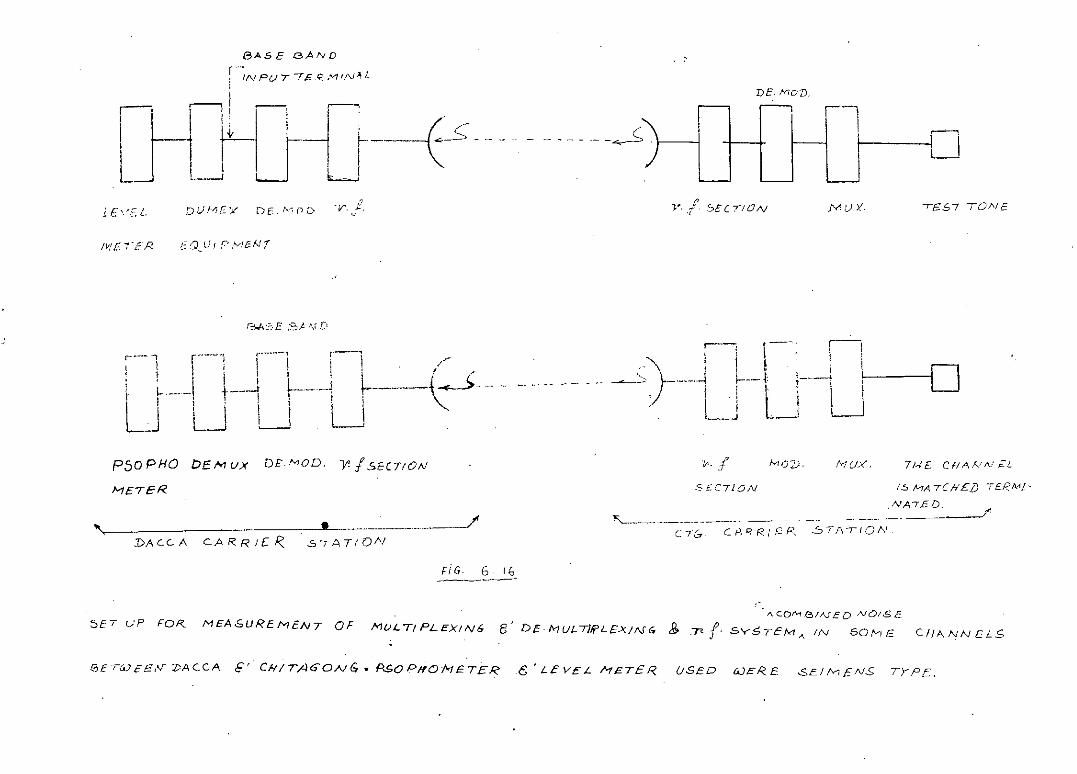
BASE eANDr--i INPUT 7£ ,t;: ,v11,1\.i~L
n.1,---,,---: .OiJ-UiJ~~--{~- - -. -- -...-S
DE. MoD,
r--l,
-11
L£'.'.~L DU;'.r,[y DE,,'-",n,:> -v. i, oV'.. { SEC 7/0N /Y U 'x. '657 TONE.
Iv/E i-l:'R. EQ.. U I (" //J&f.!1
r:."",,~:?~E :,7.;,l N [)
)
,----, r-'-~-\ l."-~--" r-.-l1 I I i I \ : 1 /~, 1 ! j ! I I ' . / ..
t. l- __ -I t-_.J L----1 ~--{--- ...>.-
I' I I I: "LJLJULJ -
,--, 1--' '---1" Iii' i i
. \ ! '. I' D~ ,., , !~_ L ------1 ,...--l ,-,-I ,r . I . ! I
'j I I L'. \ LJL__. .J -
PSG PHO DEM ux DE'."'OD. "!5ECTION
METER
S'TATION
"'----_. _ ..._--_. __ ._-_. _.C7G. CA'<RlER,
IS MA TCflED 7£RML~
,NA7£D.----- _._------------./'"
57ATION.
71--1E. CI-/ANt\/ £L;\-: U.:< ,MOL).V)_ f.,.S£C710N
_.__"_"_JJl.DALLA C.ARRIER.."
FiG. 6 1(,----_._-1'\ COI\1/2,/N ED NO;$ E
SET ,,)P FOR.. MEASUREMeNT OF MULTIPLEXIAl6 E)' DE-MULTJIfLEJ<JNG £. .7' {- SYSTEM~ IN SOME CI-IANNELS
GET0E£,v'VACCA Ii' CH/T,4GONG. P..sOPnOM£TER6' LEVEL METER. USED 6.JER.E 5EItv1£N.5 TYPE,
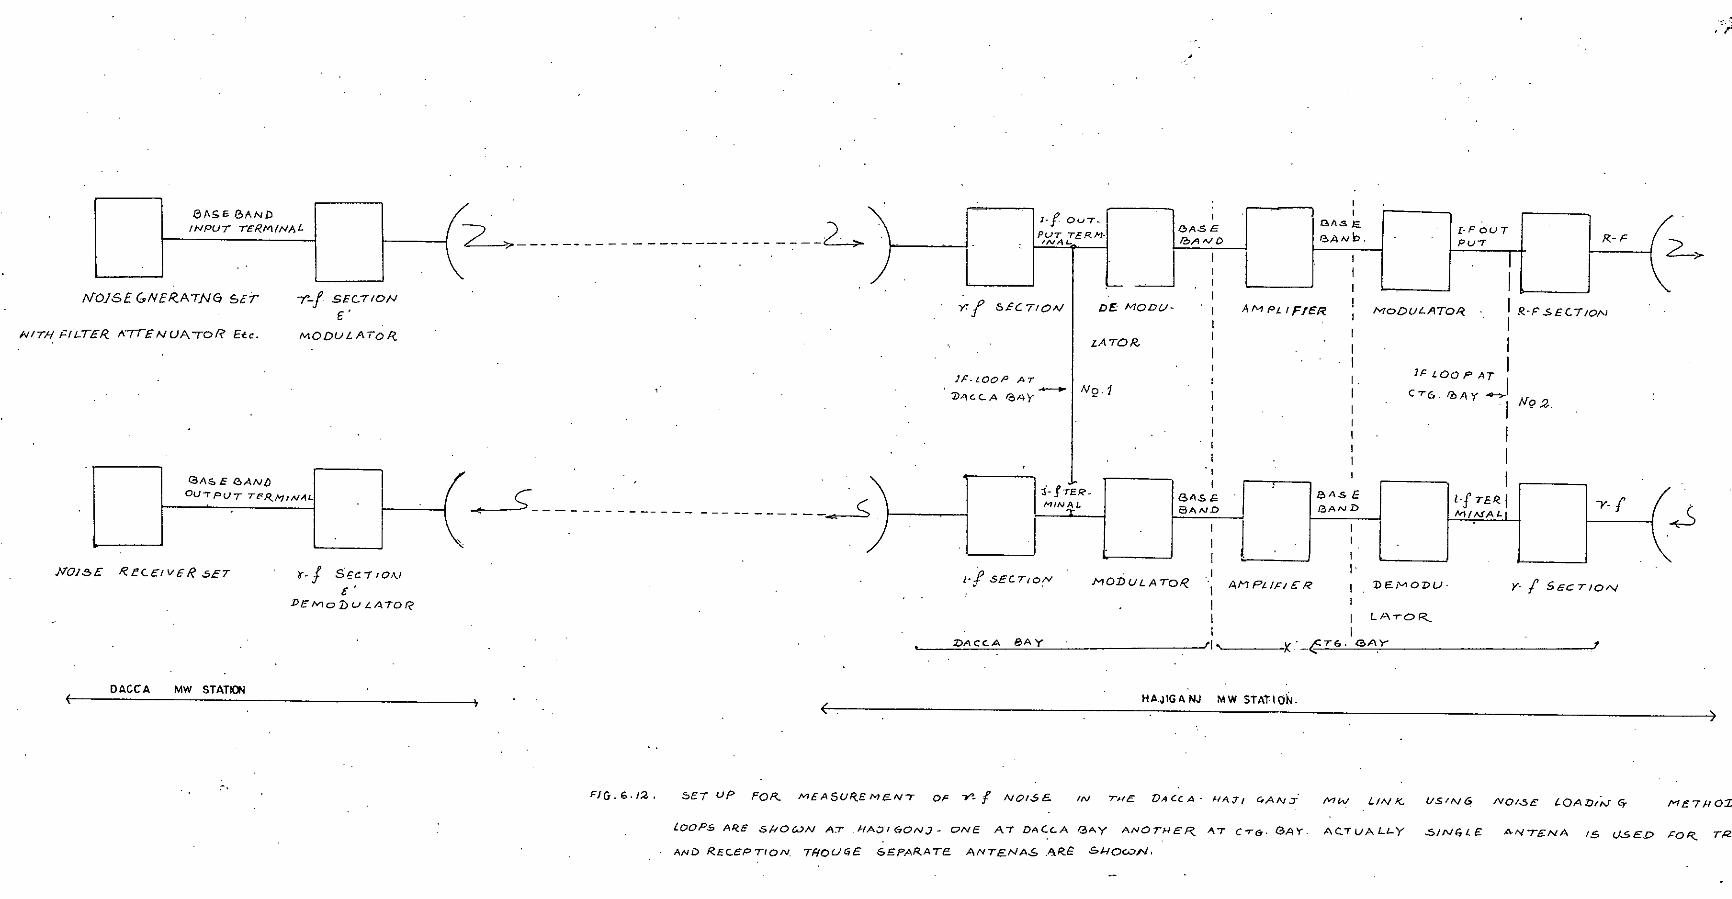
.'..~,'r
c'
eASE 'bANDINPUT r£RMIHAL
GAS E l!>ANbOUiPU-r TER....MtN.4L;
~
2->-R.F
1
-y.f
N92,
.~'F S£CTION
y.f SGCTION
[-FOUTpu-r
III
I'f TE.R. jklIMA/...
IIIII
lPLOOPAT IC'6.0Ay......,..
I
MoDULATOR.
1>EI'V\ODU.
L 1-\ -rO R..
II
IIII
II
.Q.A.s E.I?>AN b.
IIIII
IIIt.It
IIIII
BAS EBAND
A /Vi PL I FfER
1
8AS Ii'SAND
I
0AS E/?;)/t 1\1 D
PEe NlODV.
I
I[
c IMODULATOR, 1 AMPLII'IE:R
I1I I____ '1' )('_<2T". GAY
LATD/<-
-i.fTE!?MINAL
1.f OuT~
PUT TERM.INJ'\L..
,./ SECT{o('"
Yo f 6ECTION
.DACC.A 8AY
JF-lOOP AT .•.....•.I No. 1~AGCA ~AY -
~----------- ------- ------:---G
. C;..• - - - - - - - - -- - - -
7'-/ SECTION6'
MODLiLAToR.
;r~J $£c..-rJOAJE'
DeMoDuLATOR
NOj5£ (,NER.ATNG SET
./VOJ-5£ R.ec.ElvER SET
NITH FILTER. A"TT£NUATOf? Etc.
fDACCA MW STATiO'I ------------4', HA.JIGANJ MW STATION.
( )
c.PIG.G.I:<-, SET up FOR. /VIEASUR.£Me.N7 OF 'Y' f NOIS£. IN THe DA C::c A - f-/A71 C,ANJ: MW LfNI<.. US IN 6 NOloSE LOA llliV' G- METNO:L
lOOPS AR.E SHOWN AT .J.IA;)'/(70N.)- ONE A7 DAC~A GAY ANOTI--/ER.. AT eTC;- GAY. Ac..TUALl-Y :SINGLE.
AND R.£cep7,oN. TRoU~£ SEPARATE. ANTENA,J; ,"'R.B. 61-10=;-1,
A.NT£NA IS USED J:OR.. TR
..•
These frequencies ere recommendedby CCIR. Results are .hown in
Table 6.2.
I tehould be: noted that noise in one link (Dac-Ctg.) is,,
half .of that in two links (Dac-Ctg.-Dec) i.e in dBnoise in one
link will be JdB ,lower than in two link s or II loop. Henee actuel
SNRor N?Rwill be 3dBhigher then that indiceted »•.• ~I:e by the
.utter. This is elsa given in Table 6.2. SNRis calculated from
NPRby using eqn. 6.36. which is given below:
SNR.., NPR + 10 log N - 14.8 + 2.5 dB •••
Here. 2,5 ensee due to weighting end 14.8 arises a. it is
the -"aulatedsignel power.• (The deyivation i. given in Chaptar-4).
The instrument used W88 the Merconi noise generator/receiver
set which gave direct NPRreading. It should be noted that by
noiae loading method ther~al end inte~dulation noia. mey be
measured seperetely, Thie is deecribed below:
Let; the following readings. are taken withti) noi.e load
in the system with e elot raJscUon filter between the l!lOurceand
input; (i.e noise appearing in e quiet slot)'ii) with noiee eource
turned off. The first reading gives thermal end intermodulation
noise and the 2nd readinggivee only thermal noi89. So. the
difference of the reading (i) and (Ul gives inteZ'Modulation nolee.
Besides. using this llIethodthe NPRversus Loading curve 1Il8yal~
be plotted trom the shape of which the order of predominant distor-
tion maybe determined. A.ath~atical analysis in thie regard ie
qiven in Appendix-A. Howeverit was not possible to deterMine the
NPRvrs. loading curve due to reaaone ~xp18ined in the discussion.
6.9.2 Measurements for Fading
Effect of fading received at Hajiganj ~'Wrepeater station
(a repeater station in the Dacca-Ctg. MWlink) is shown in Fig.6.13la).
The curve is plotted for 7 days starting from 12th March to 18th
March of 1980. The ordinate shows the AGCmeter reading for diffe-
rent times. AGCmeter is the meter which measures the input r-f
level received by the receiver. The AGCmeter is marked by numbers
lik e 1,2,3 etc. To find the corresponding input signal level in13(b).
dBm, a graph is also shown in Fig./The datas were obtained from the
T and T Department. The threshold level is about -70 dBm and nominal
received level is -35 dBm. Datas corresponding to Fig. 1i.13( a)
are shown in Table 6.3(a) and 6.3(b).
Besides the daily variation, a graph showing monthly interr-
uption due to fading (.for the months of lh: Nov•• Dec. of 1979 and
Jan., 1980) is also given in fig.6.14. Datas are given in
Table 6.4. A plot showing yearly variation of fading is also given
in Fig. 6.15. Normally, fading occurs in the period betl1een Bctober
and March. Hence, Fig. 6.15 shows fading only in these months.
Corresponding datas are also obtained from T and T Department and
are given in Table 6.5.
6.9.3 Noise Measurement in MUX/DEMUXand r-f Combined
Some measurements for noise and 5J1JR were taken at channel
stage at Dacca carrier station e.g. particular channel I x' between
Dacca and Ctg. May be considered. Transside 0 f Chittagong end was
matched terminated
Clearly, since all
and noi se at receiv:eug side at Dacca was measured.-~ ~
other ch¥el s were working, the noi se measured
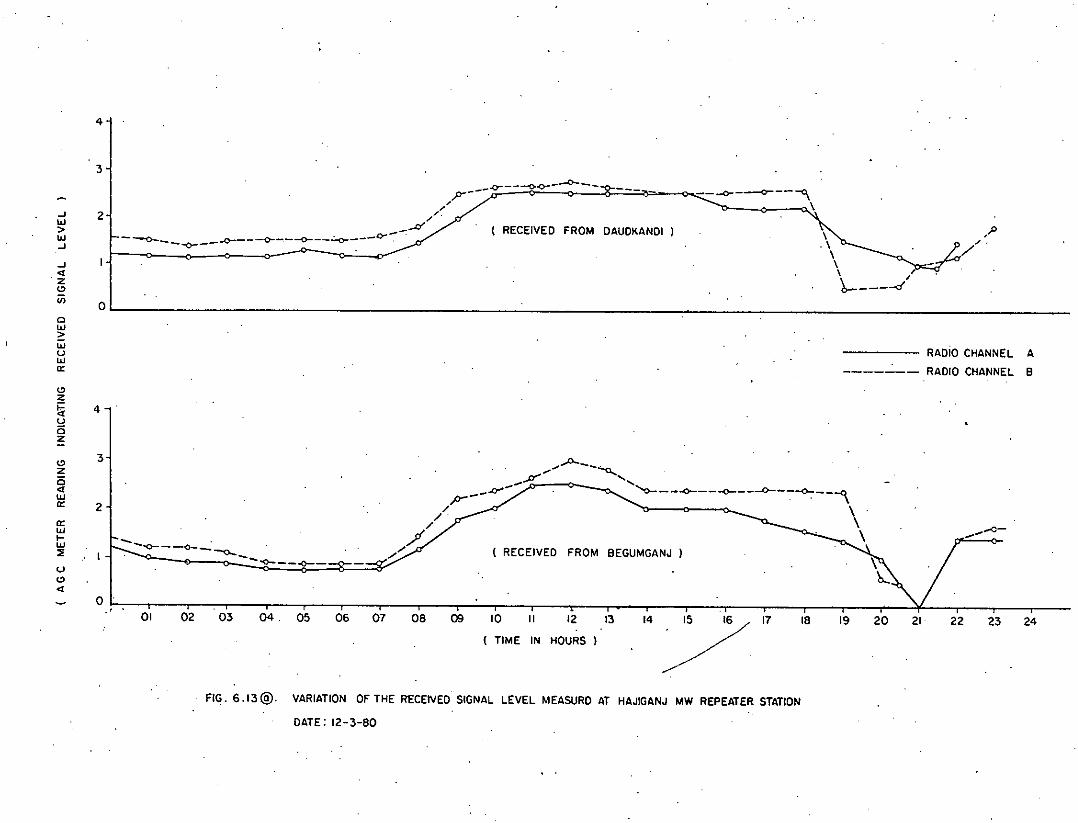
4
3
-'w>w-'-'".z<:>'"
2
o
-o- __ -<>~--o---7---//.
__A /' ( RECEIVED FROM DAUDKANDI )----0- ~-._~ __..:..o- cr ..----0----...---
-- -0- -----<r - -""'\\
\. \
\\\
'b-----/
J'// .
cw2:wuwa:
RADio CHANNEL A
RADIO CHANNEL 8
<:>z~ 4!,!cz
---0- - -<0----0-:--.;. - - "0- __ ..()-_
2423
....0---
222120191814/171312II10
( TIME IN HOURS
0908
.....,0-. __ ..J.Y"" -0.....•....- '-.,y- "0- - --<)-- --<)-- ---<>-- --<)..__ -Qp--- .. \
/ \/ \
//;p/ (RECEIVED FROM 8EGUMGANJ ) \ ~
~
070604. 05030201
3
2
o
. I
<:>z~wa:
a:wI-W~UC>
"
FIG.6.13@. VARIATION OF THE RECEIVEDSIGNAL LEVEL MEASURD AT HAJIGANJ MW REPEATER STATION
DATE; 12-3-80
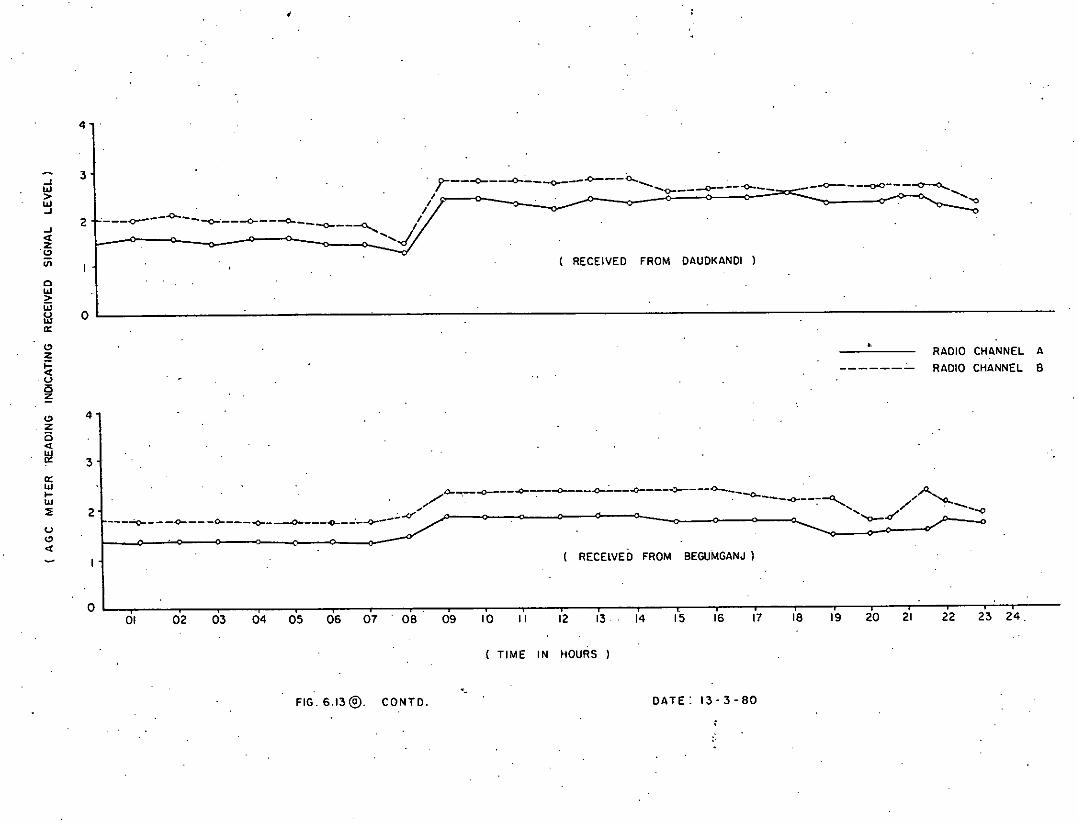
,
4
...•w>w........••
.~en
3
2
. ..0---0.../--~---o----o--- _0- __ --0-----0--_/ CJ c
ff___ -0----<>-- - -<>-'---<)-- --0..---<>-'----0..... ' .....J;
( RECEIVED FROM DAUDKAND' )
_..-0--- - _~o()- - --o-~.•.•..•.•.'0
c~iiild 00:
C>Z
~.t)
~
.,RAD'O CHANNEL ARADIO CHANNEL B
C>Zo••lli0:W>-w::Et)
C>••
4
3 .e-_~__~__~_~_~ ~ <l--._ ""-,/ .. .--0- -<>- -<> /
2.J .,/ ..•••••••. /. --I .4' C' ........'---0---~-- _ _o_--_o_ _>-___o_---.o_--.-_o_--- / 0 C\ -< 0 C CI............- 'o--.d
~
RECEIVED FROM BEGUMGANJ)
o .I - ~- --~--_-~--~----~--~----~--
0, 0'2 03 04 05 06 ch 08 09 ,'0 ,', ,'2 ,'3 ,'4 '5 t'6 t'7 t'B ,'9 20 2', 22 2'3 2'4.
( T'ME 'N HOURS)
F'G.6.13@. CONTD.'.
DATE: 13-3-BO
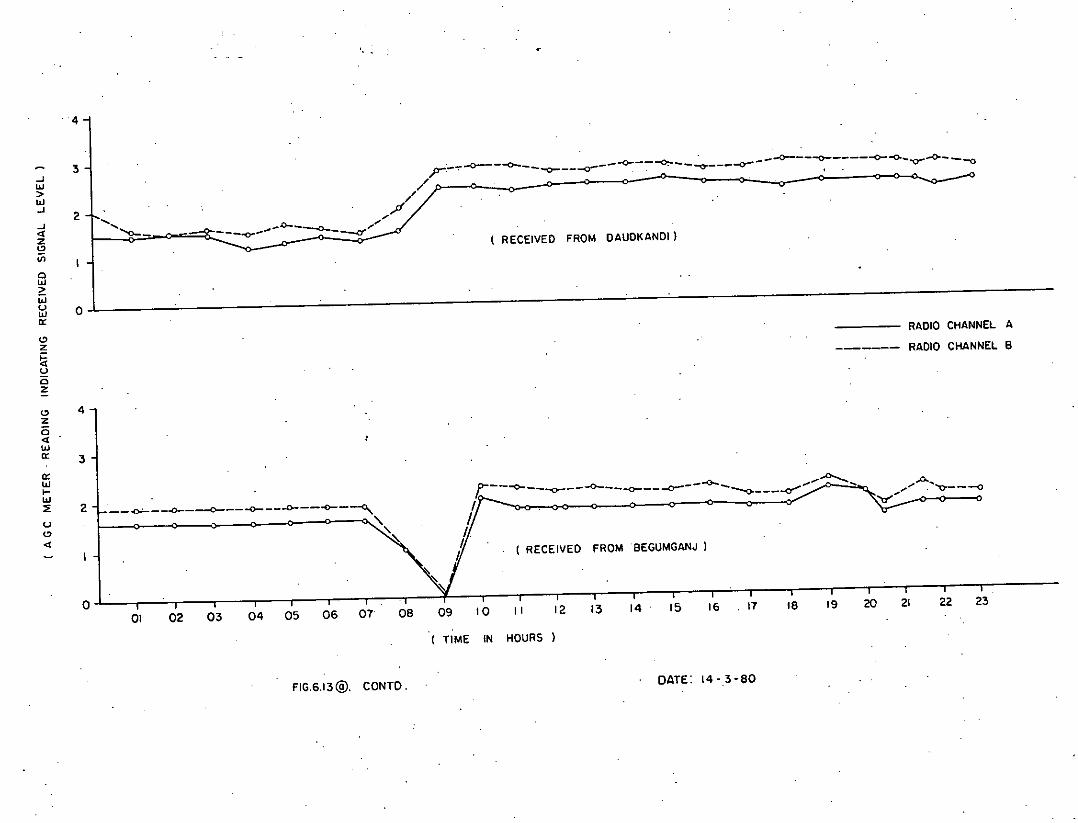
4
3
( RECEIVED FROM DAUDKANDI)
RADIO CHANNEL A
_____ RADIO CIiANNEL B
p-:_~-0-- -~---o----o----0---:--0=-- _ ~ -<r" - _-0-----0------0- -0....-0--<>---0, .",/_-0-__ /,,"
----0--'''' ~---.d.•..''0-_
2
ClZ
~u15z
...JUJ>UJ...J
...J<tzCl
iiioUJ>wt;l 0a:
Clz15<tUJa:
4
3
2322212019IB171615141312
(RECEIVED FROMBEGUMGANJ)
II1009OB07060504030201
__ ~ __-o-_~ __ -o- __..o---oo()--~
":'-.~2
o
a:UJ...UJ:EuCl
'"
(TIME IN HOURS
FIG.6.13@. CONTO.DATE: 14 -.3-BO
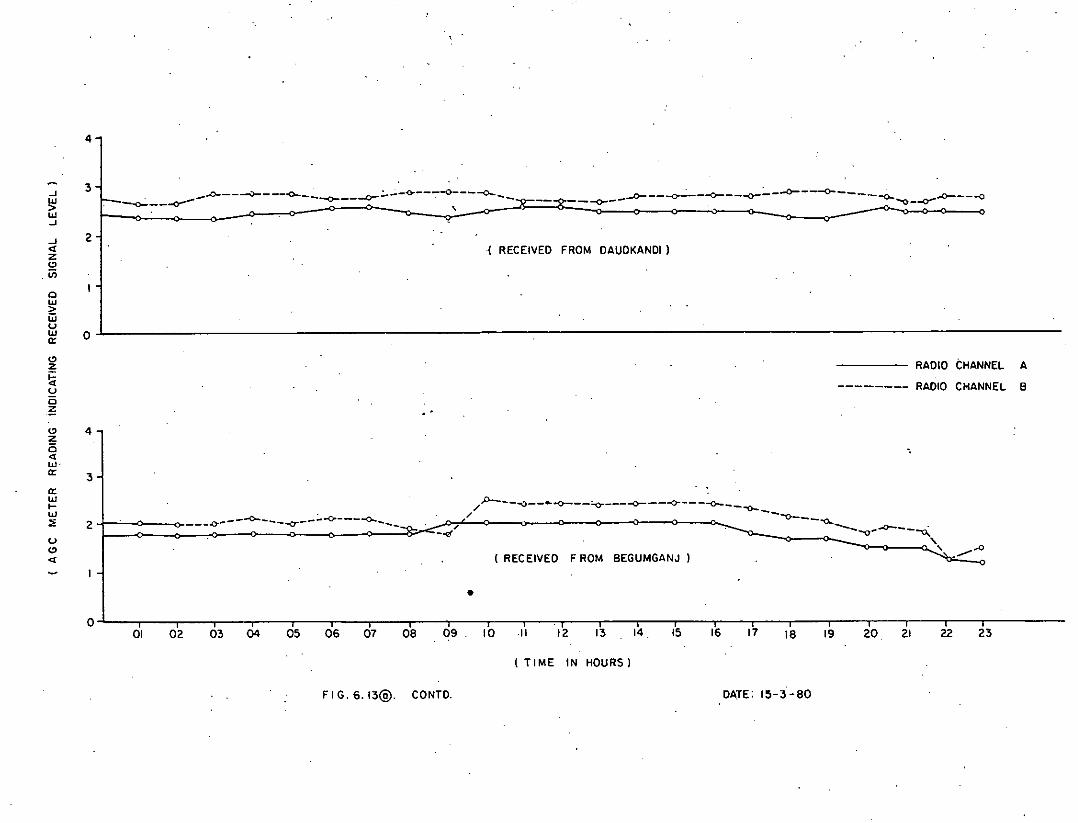
..J
~'"..J
4
3--0- _-<r'"- _..0----:>- - -<>-----O----L;)--;.. _-<r---~---0- __
~ , ~--~-~--~~-~-~----~~--~-0--- '""'0--0--0 :: 0 :l Jo-- ~: cr
2..J«z!2
.(/)
o~Wu~ 0
"'zfiucz
( RECEIVEO FROM OAUOKANOI)
RAOIO CHANNEL A
-------- RAOIO CHANNEL 8
"'zC«"'.a:a:'"•...'":;;u
"'«
4
3
2 ---~---~---'T--~~---0-.. _/
-.;f
P----~-_..__o__--:..o_----o-----o- - - --<>-- --0-__/ -o-- __ ~
I' ""'Q"'~_
----~I RECEIVEO FROM 8EGUMGANJ )
•
-.
-"'," ~.<J~
o I Iii iii , iii iii iii I i I I Iii01 02 03 04 05 06 07 08 09 10 .11 12 13 14. 15 16 17 18 19 20. 21 22 23
FIG. 6. 13@. CONTO.
(TIME IN HOURS)
OATE: 15-3 -80
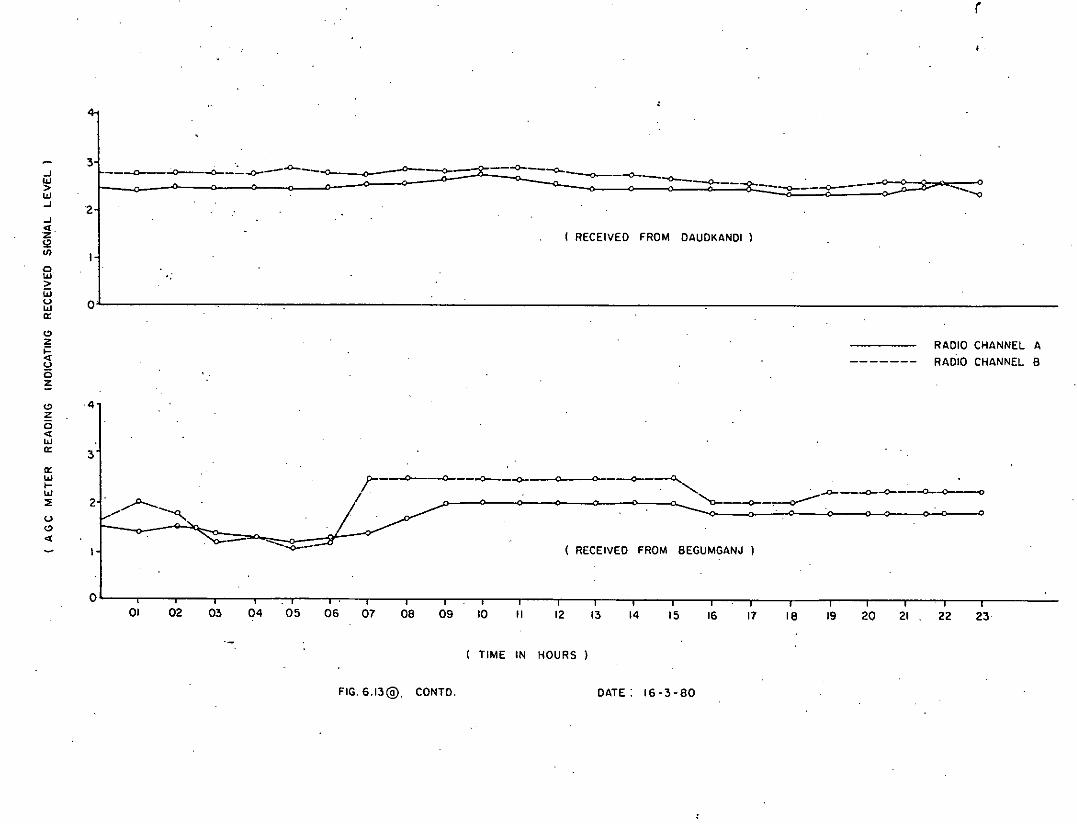
..J
':!iUJ..J
..J.~
!2onoUJ>G:iuUJa:
2
o
~ ~-6-_::"'.....o---.o-_~._~-<>-- ---0----0---0----0----0----0- __
I RECEIVED FROM DAUDKANDI)
---0-----0-----
(
--....,
'"z~uisz
'"zis~UJa:
a:UJ•...UJ~u
'"~
-4
3
2
o
.....-"'--~- ~-
~-~-~--~-~I .
RADIO CHANNEL A------- RADIO CHANNEL 8
-"'-----~--o-----a..... ..•...••.. . ....o- __ ~~ __ ~4) 0
~--<>--~ .
( RECEIVED FROM 8EGUMGANJ I
01 02 03 04 05 06 07 08 09 10 II 12 13 14 15 16 17 18 19 20 21 22 23
FIG.6.13@. CONTD.
( TIME IN HOURS)
DATE: 16-3-80
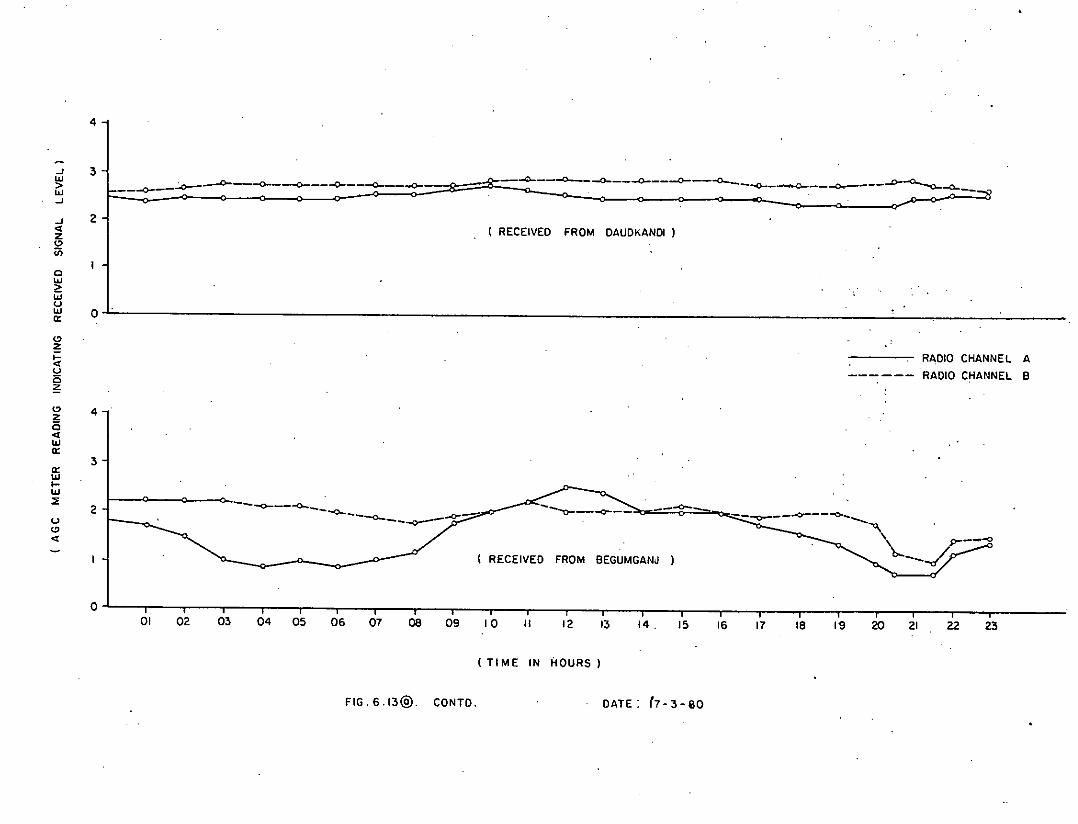
4
...J
~W...J
3 -o-_~--o----o-----o---~--~-o- ~--~-~--~--~~ : :: 0--
-o----o-_-...o- __~---..D-~_o.._...J
"zc>U\
2(RECEIVED FROM OAUDKANDI
RADIO CHANNEL ARADIO CHANNEL B
o~~ 0 _Il. ~-'------_:_~------a:
c>z~uo;;c>;; 4o
"wa:
( RECEIVED FROM BEGUMGANJ )
a:UIl-UI::;uc>
"
3
2 --~--~-- ---<?-~ ...o---~__ -0--...,...-- ..•..\b-._~--
o01 02 03 04 05 06 07 DB 09 10 II 12 13 14. 15 16 17 18 19 20 21 22 23
( TI ME IN HOURS)
FIG. 6.13@. CONTD. DATE: (7 - 3 - 80
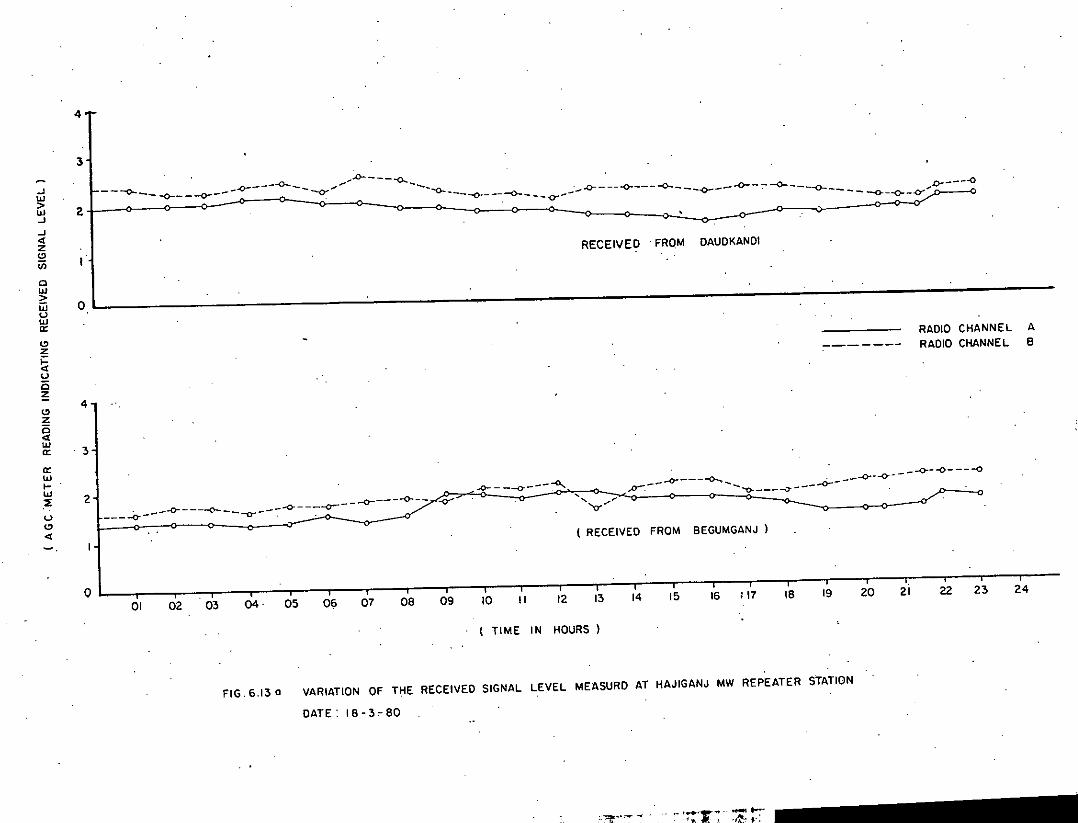
4
3
..JW>W..J..J<[ZClU;
2
I
__-0.._ .•....0-----0...__ ___..0---0- __ -<r-- --o----~~ - -0-.... ...--0- -...0-_---0- 0-----.0-- ---o----~- ___o_---O----0---_-0- __ - - -o---o--<y"'~
,
RECEIVEO . FROM DAUDKANDI
c~iii 0ull!Clz\;iuoz
RADIO CHANNEL A_______ RADIO CHANNEL B
ClZ
~wa:
a:w...w.::1:uCl<[-.
4
3
2 -0- _-_...0- - ---0- __ --0--_---0- - ----<J-*- - -0--- --0--
--<> 0 ~o 0-
<0--..0--_----0-_---0..... ..o-.---O----~---0.-, ;
'",;
(RECEIVED FROM BEGUMGANJ)
-;;, -0-- _--<>----0'"- - - -0--"'- ---0
-0-...........,
o01 02 03 04. 05 09 07 OB 09 10 II 12 13 14 15 16 ; 17 IB 19 20 21 22 23 24
FIG. 6.130
( TIME IN HOURS
VARIATION OF THE RECEIVED SIGNAL LEVEL MEASURD AT HAJIGANJ MW REPEATER STATION
DATE: IB-3"80
''''I!'''~- . .-'::'r~-~~
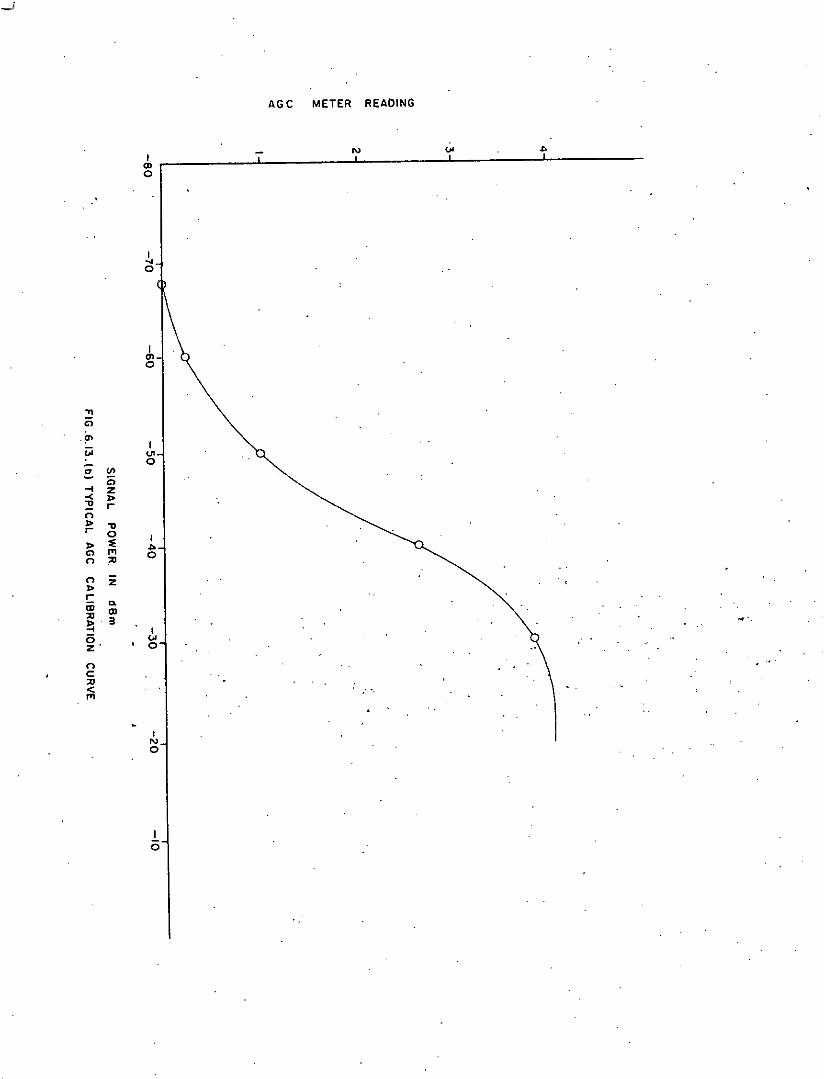
AG C METER READING
IQlo
N
.!,o
I
'"0
~'"!" I(;; '"0~ U>c;..• z-< l>." ,..nl> .",..0:e I
l> •••'" '" 0n ::u
n Zl>C c.Ql Ql::u~ 3 ~.
I6 '"z. 0
nc::u< ..'"
IN0
Io
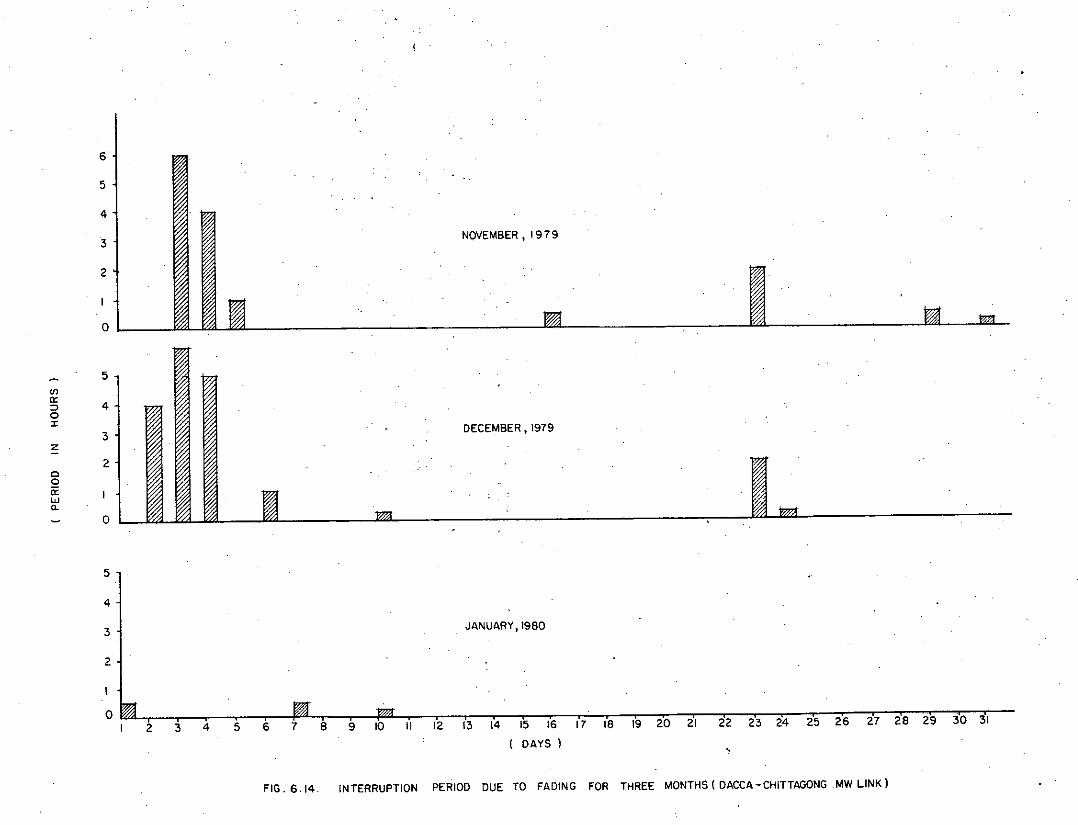
6
5
4
3
2
5
4
NOVEMBER. 1979
3
2
o2 3 4 5 6 7
JANUARY. 19BO
B 9 10 II (2 (3 14 15 (6 (7 1'8 19 20 21
DAYS l
22 2'3 24 25 26 27 2'8 29 30 31
"
FIG.6.14, INTERRUPTION PERIOD OUE TO FADING FOR THREE MONTHS(DACCA-CHITTAGDNGMW LINK l
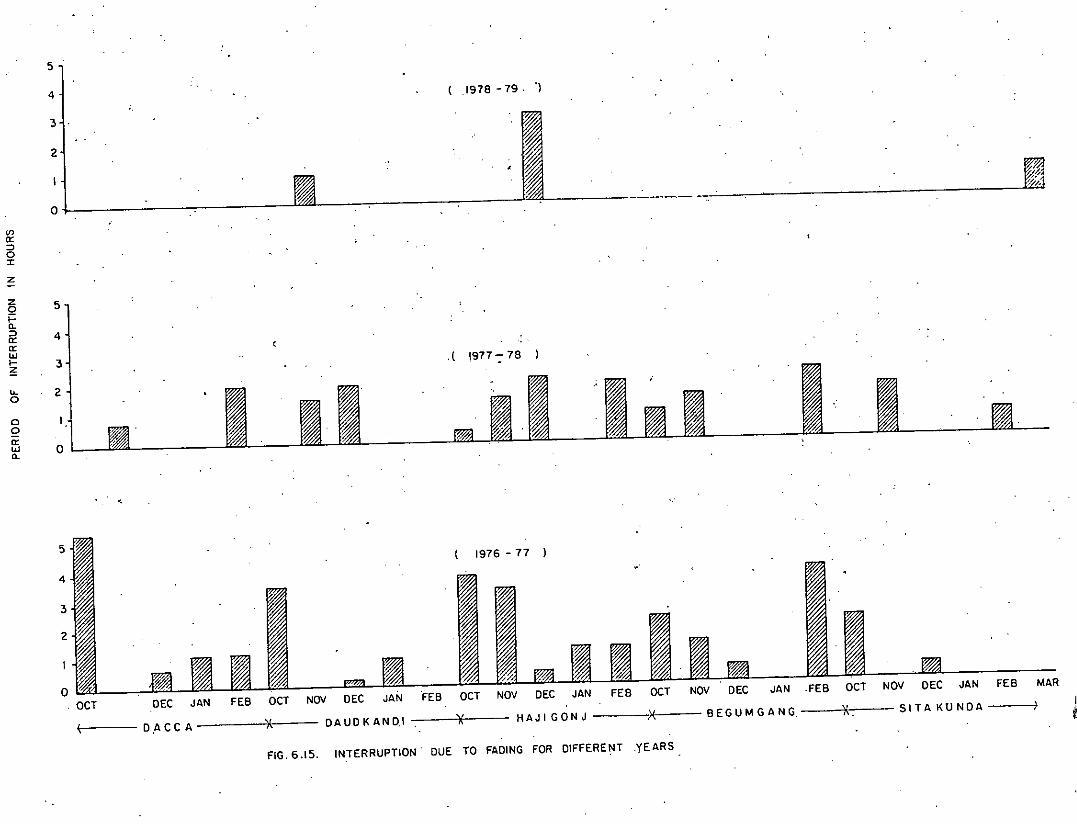
5
4
3
2
o
.1978 -79. ')
~___ J2J
Vl0::::Jo:I:
z
~ 2oQ15 0a.
.( 1977-783
4
55t~0::UJI-~
'.
IfHAJIGONJ )( BEGUMGANG. )( SITAKUNDA
1976 - 77 )
*JAN FE8 OCT NOV DEC JAN 'FE8 OCT NOV DEC JAN FEB OCT NOV DEC JAN .FEB OCT NOV DEC JAN FEB MAR
, D.ACC A )\ DAUDKAND.I
o. OCT
2
4
3
5
FIG.6.15. INTERRUPTION' DUE TO FADING FOR DIFFERENT .YEARS
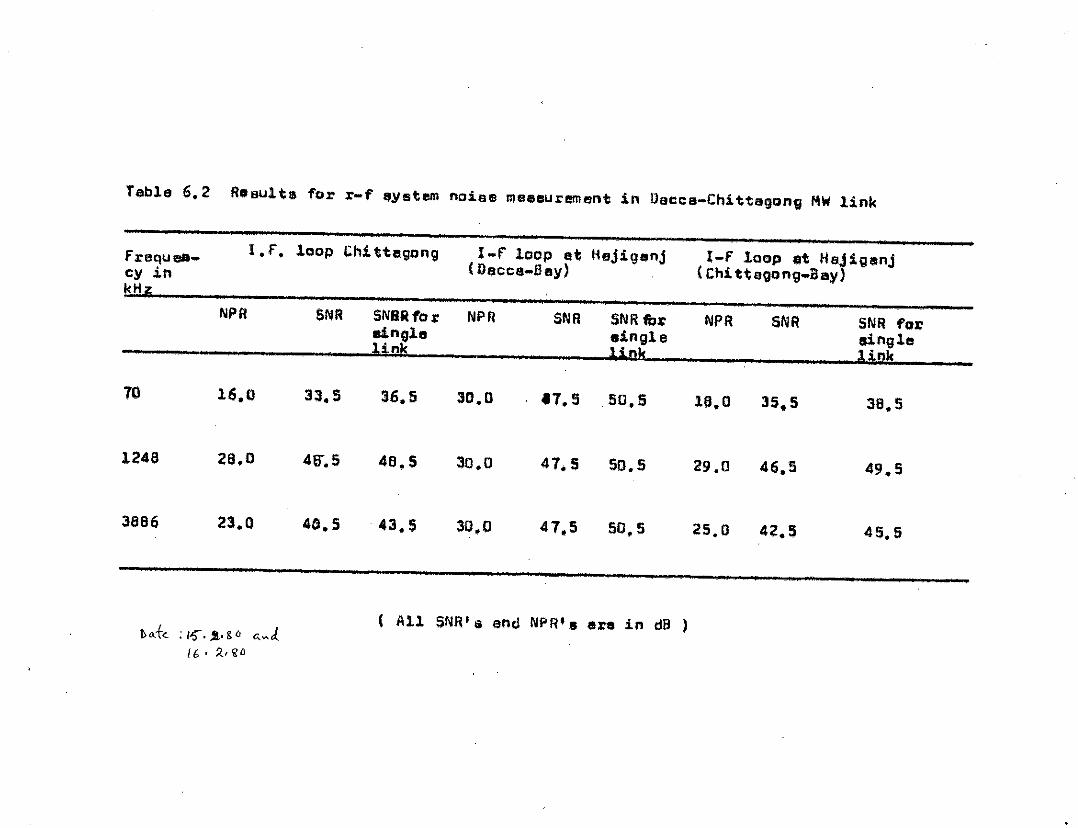
Table 6.2 ROil!<lltlll for r-f $ystem noise 1llllllllllUrl!lllent in Uacca-Chittagong Mit link
frequea-cy inkHi:
I.f. loop Chittegong I -F loop at Hejiganj(D$cce-Bay)
I-I' loop .t HeJiglllnj(Chli.ttagong_Bay)
NPR 5NR SN8R 10 r NPR SNA SNR fbx- NPR !INA SNR fore1ngle oingle oinglelink ~ink link
70
1248
3886
16.0
28.0
23.0
33.5
4Er,5
40.5
36.5
48,S
.43.5
30.0
30.0
30.0
t7,S 50.5
47.5 50.5
47,5 50.5
16.0
29,0
25.0
35.5
46.5
42.5
38.5
49,5
45.5
1),,'+<- ; I~. J.. g" ,,~J/6.:/ .• ,,0
( All SNIPIi and NPR'. ere 1n dB )
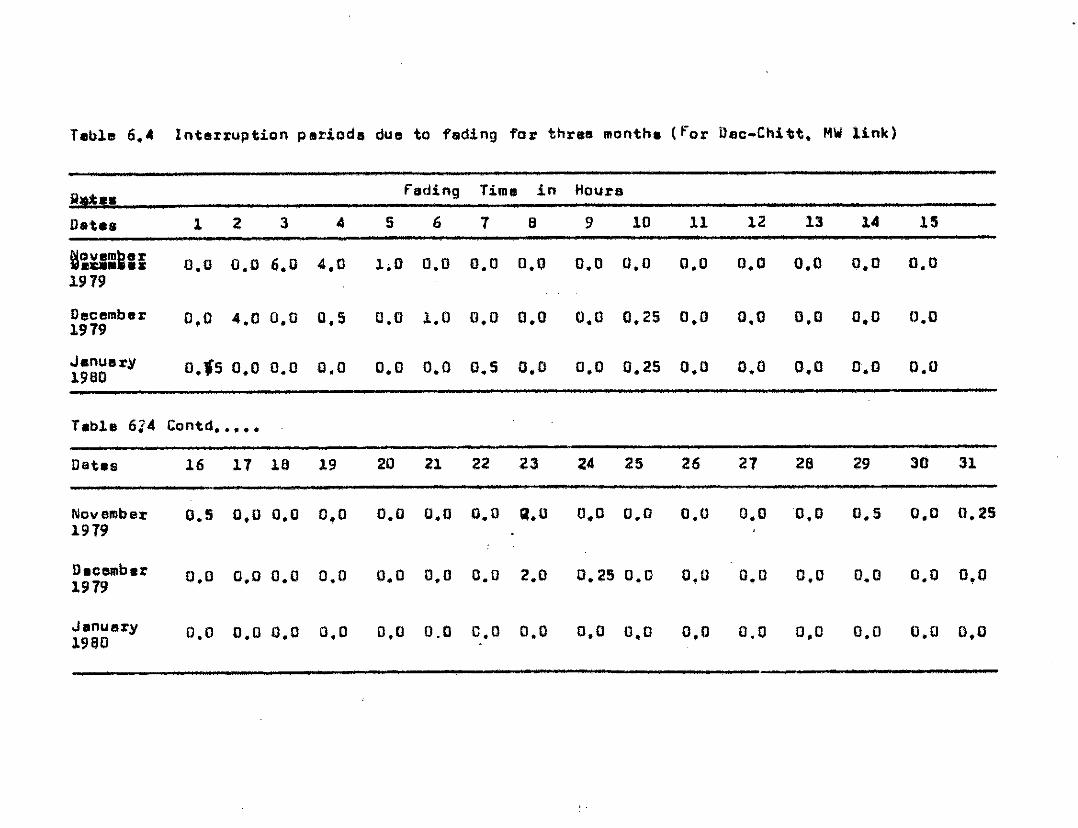
Tebllll 6." Inter~uption periods due to fading for three month. (for Dec-Chitt. MW link)
R,b. fading Time in HouraData. 1 2 3 4 5 6 7 8 9 10 11 12 13 14 1S~ovem~er 0.0 0.0 6.0 4.0 1,0 0.0 0.0 0.0 0.0 0.0 0.0 0.0 0.0 0.0 0.0__ ax1979D.,cembe~ 0.0 4.0 0.0 0.5 0,0 1,0 0.0 0.0 0.0 0.25 0.0 0,0 0,0 0.0 0.01979January 0."5 0.0 0.0 0,0 0.0 0.0 D,S 0.0 0.0 0.25 0.0 0.0 0.0 0.0 0.01960
Table 614 Conto •••••
Datas 16 17 18 19 20 21 22 23 24 25 26 27 26 29 30 31
November 0.5 0,0 0,0 0,0 0.0 0,0 0.0 CI.O 0,0 0.0 0.0 0.0 0.0 0.5 0.0 0.251979
D.ctllllb.r 0.0 0.0 0.0 0.0 0.0 0.0 0.0 2.0 0.25 0.0 0.0 G.O O.C 0.0 0.0 0.01979
January 0.0 0.0 0.0 0.0 0.0 0.0 0.0 0.0 0.0 0.0 0,0 0.0 0.0 0,0 0.0 0.019aO .
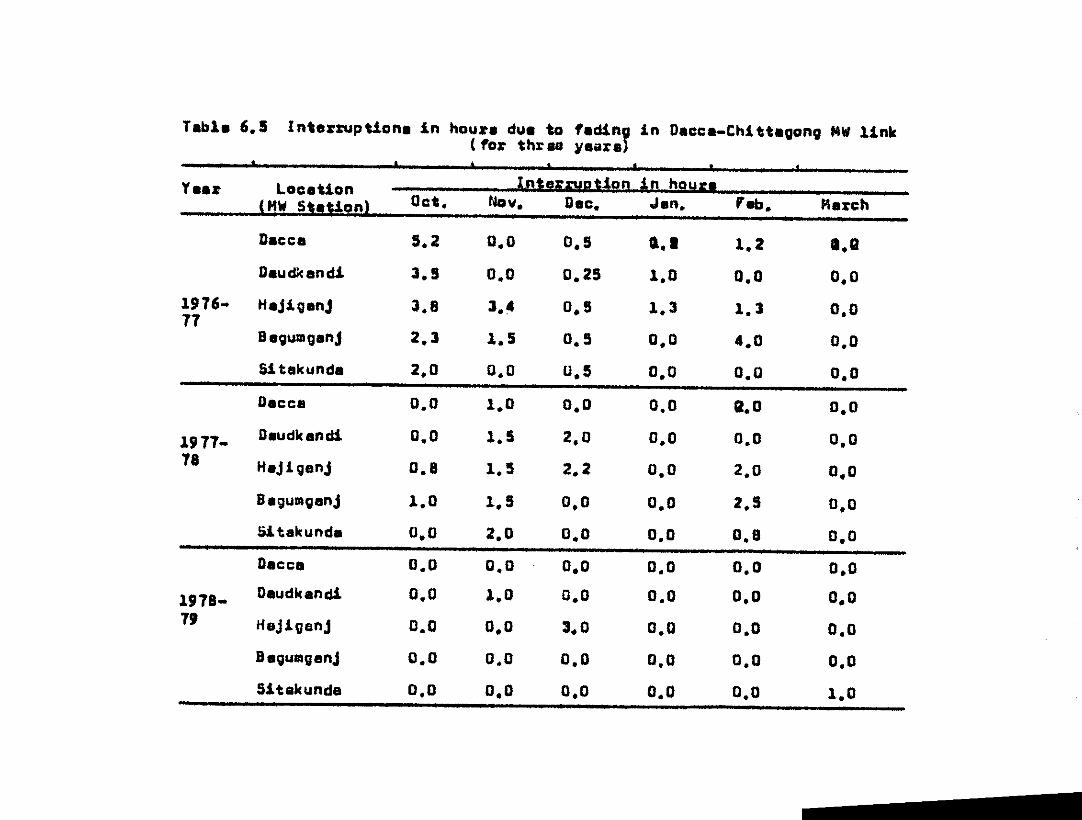
Table 6.5 Int.~~ption. in hour. due to faalnr in Dacca-Chitt.gong MWlink(for thi •• ¥.ara
, , • , , , ,
Y ••• Location Interruption in hQU~'(HW5"tion) Oct, Nov. D.c. J.n, 'ab. K.rch
Dacca 5.2 0,0 0.5 1l.1 1.2 1.8Daudleand! 3,5 0,0 0.25 1.0 0.0 0.0
In6. HaJig.nJ 3,8 3,. 0.5 1,3 1,3 0.071B.gUlllg.nJ 2.3 1.5 0,5 0,0 4,0 0.0Sitllkunda 2,0 0,0 U.5 0.0 0.0 0.0Dacc. 0,0 1,0 0.0 0,0 111.0 0.0
11171. DllUdkanal 0,0 1,5 2.0 0.0 0,0 0,0TI H.JigenJ 0,1 1,5 2,2 0.0 2,0 0.0
B.gulllganJ 1,0 1,5 0.0 0,0 2,5 0.0Sitakund. 0.0 2.0 0,0 0.0 0.8 0,0Dacca 0.0 0.0 0.0 0,0 0,0 0.0
InS- O.udkandi 0.0 1.0 0.0 0.0 0.0 0.0T9 HeJigenJ 0.0 0.0 3.0 0.0 0.0 0.0
B.gulllllenJ 0.0 0,0 0.0 0.0 0.0 0.05itakunde 0,0 0.0 0,0 0.0 0,0 1.0
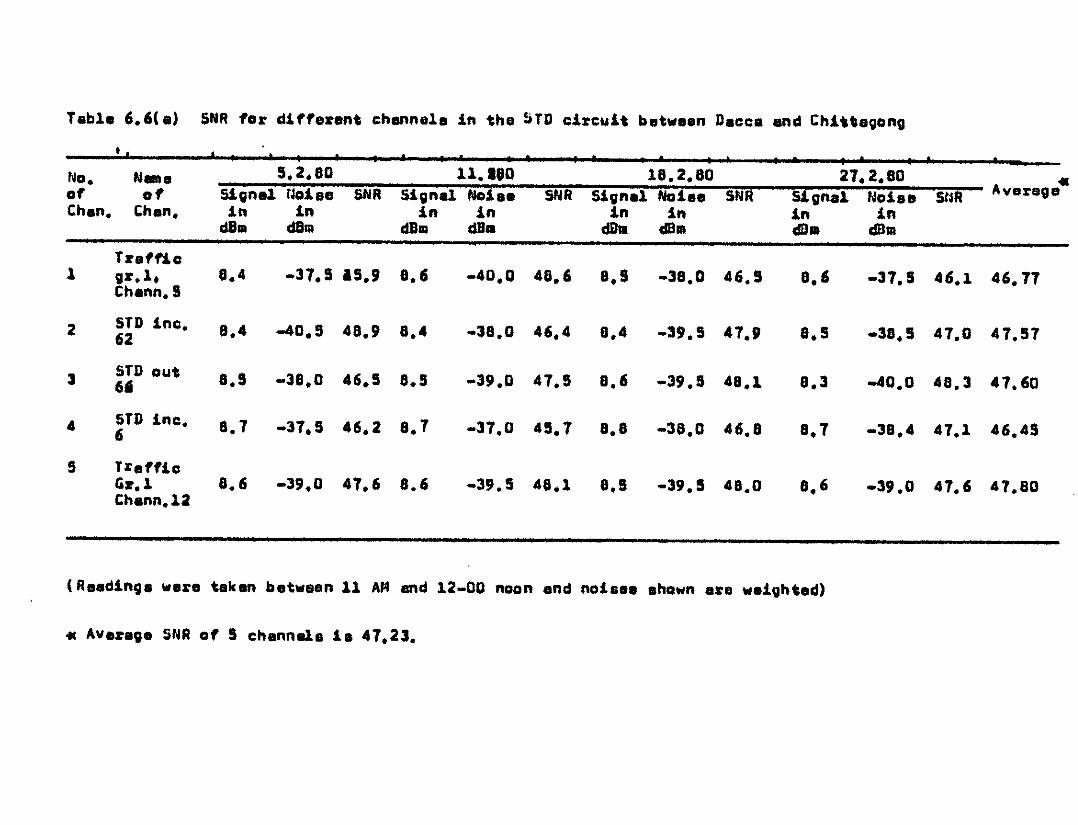
Table 6.6(a) 5NR for different chenne1. in the ~TD circuit between Dacca end Chi_'.Qong., , , ,I
,I I , I I • , ,
I • , , , I , , I I I -r~o. MDe 5.2.80 11.180 18.2.80 21.2.80 «of of 51gn.l 1:O.1n SNR 5ign.l Noi •• SNR 51gne1 Nohe SUR Signal Noi.e StJR AveregeChen. Chan. in in .1n in in in in in
dB•• dBlll dB•• dB•• dihI dill! em •• em ••Treffic
1 glr.1. 8.4 w37.S IS.' 8.6 w40.0 48.6 8.S w38.0 46.5 8.6 -37.5 46.1 46.77Chenn.1
2 STU inc. 8.4 -40. !J 48.' 8.4 -38.0 46.4 8.4 w39.S 41.9 8.5 -38.5 47.0 41.5162
3 STD out 8.5 -38.0 46.5 8.5 -39.0 41.5 8.6 -39.5 48.1 8.3 -40.0 48.3 47.606j
4 STD inc. 8.7 -37.5 46.2 8.1 -31.0 45.1 8.8 -38.0 46.8 8.1 -38.4 41.1 46.4565 Traffic
Gr.1 8.6 -39.0 41.6 8.6 ••39.5 48.1 8.S -39.5 48.0 8.' -39.0 41.6 41.80Chann.12
(Reedinge were t.ken between 11 AM end 12-00 noon and noi.ee .hown are weighted)
« Avalrege SNR of 5 channels 1. 47.23.
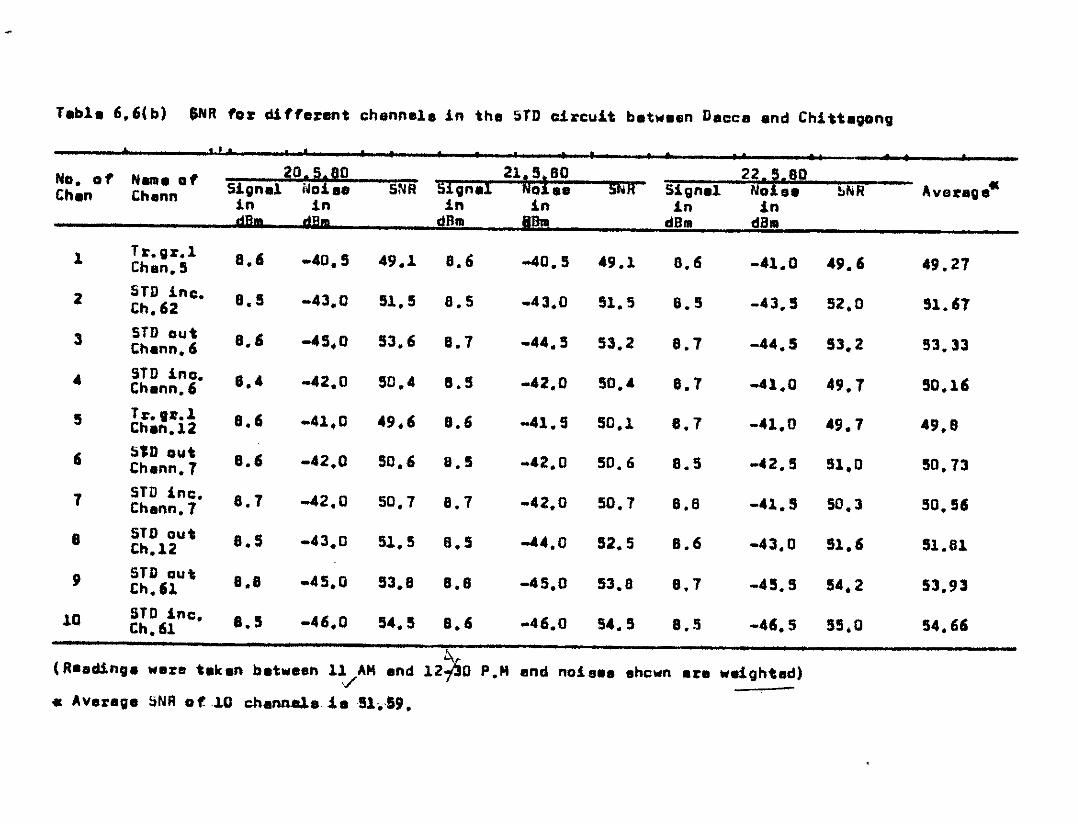
Tabh 6.6(b) JNR 'D~dif'e~ent chenne1e in the 5TD ci~cult betwe.n Decca and Chittagong• , ! • . , , • • • • • I , 0 p : • I • • I
20.5 go 21 5 80 22.5.g0No. 0' Name 0' • SIgna! ~Qt.e sNR Averags«Ch.n Chan" Sign.l i~Dtse SNR Silln.1 Noi •• ~NRin in in in In indBm dBm dBm Ib dB•• dB.
1 Tr.g~.l 8.6 ••40.5 49.1 8.6 -40.5 49.1 8.6 -41.0 49.6 49.27Chen.52 STD inc. 8.5 -43.0 51.5 8.5 ••43.0 51.5 8.5 -43.5 52.0 51.67Ch.62:I STD aut 8.6 -45.0 53.6 8.7 -44.5 53.2 8.7 -44.5 53.2 53.33Chann.'4 STU ina. 8.4 -42.0 50.4 8.5 -42.0 50.4 8.7 -41.0 49.7 50.16Chenn.'5 Tr.gl:.1 8.6 -41.0 49.6 8.6 -41.5 50.1 8.7 -n.D 49.7 49.8Chan.126 sn out 8.6 -42.0 50.' B.5 -42.0 50.6 8.5 -42.5 51.0 50.13Chenn.77 STn inc. 8.7 -42.0 50.1 8.1 -42.0 50.7 8.8 -41.5 50.3 50.56Chenn.18 STD out 8.5 -43.0 51.5 8.5 -44.0 52.5 B.6 -43.0 51.6 51.61Ch.129 STD aut 8.8 ••45.0 53.B 8.8 -45.0 53.8 B.7 -45.5 54,2 53.93Ch.U
10 STD Inc. 8.5 -46.0 54.5 8.6 ••46.0 54.5 8.5 -46.5 55.0 54.66Ch.61
(R••ding. were t.ken batween 11 AM end 12~0 P.H end noi.ee ehewn ere weighted)-/
« Average SNR of 10 channel.J.e51.-59.
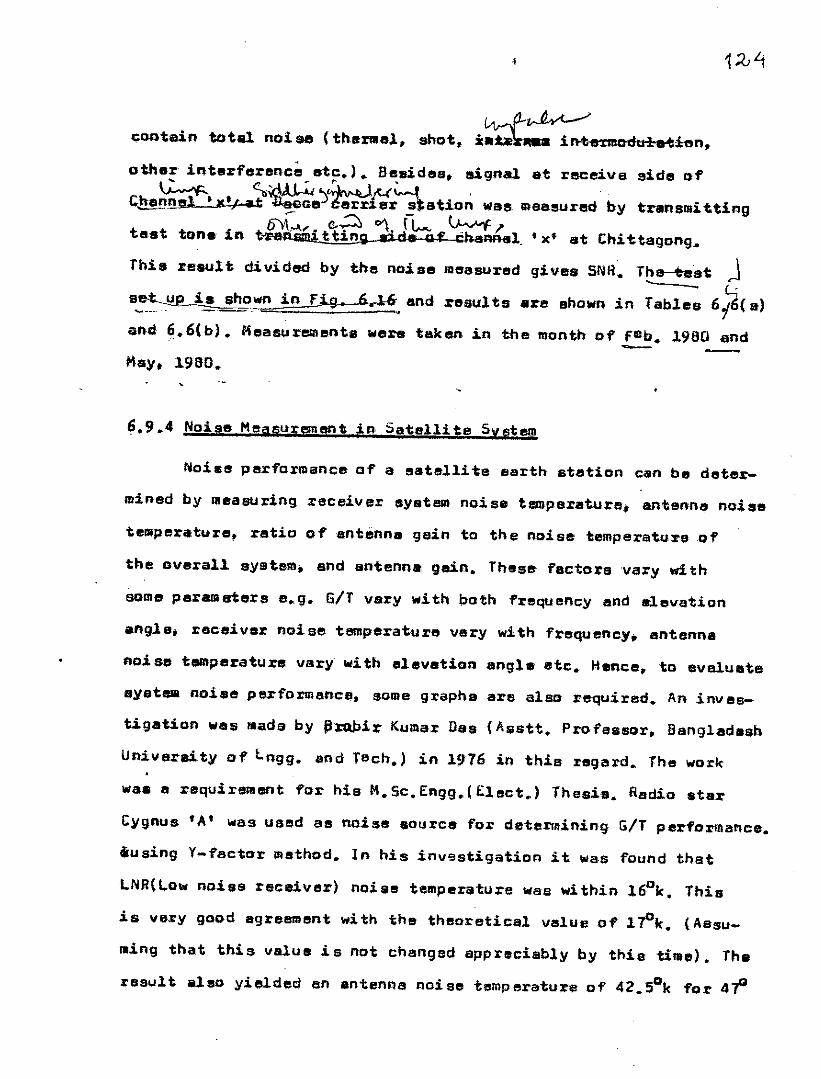
1;(,4
~OAtain total noise (tn.ltrllu'l. shot, i~~ermadl:l~.ilien,
other interference etc.) ••Bea.ides; signal at receive aide of~. ~GJ' , .
C.hannd '"t" iJi:-':u.aeG.')'t:;#t:r~ation wae maeeu:r8dby transl8itting~ ~ - ~
test tone in ~<¥iitCfin'il ~Jhf cb~l .• xt at Chittagong.
This result divid8d by the noise measured gives SNR~Th~8t J----- L;
s~~p i. Elbownin Fig, ~rl-6.and resul t8 lllJ~eshownin Tables 6,,6( a)
l1lnd6.6(b). Meal5u:rl!llllentewers taken in the month of feb. 1980 end<. - --
Kay, 1980.
6.9.4 Noise MejJSurementin Satellite System
Nai.e performance of a satellite earth station can be deter-
mined by QlltallUring receiver aystlllll noi se temperature; antenna noise
telllperature, ratio ofentenn. gain to the noise temperature of
the overall system, and sntenna gain. These factors vary with
someperamst.ers e.g. G/T vary with both frequency and .levation
angle; receiver noise temperature very with frequency, antenna
noiset temperature vary with elevation angle etc. Hence, to evaluate
syst8111noise performance, SOlliegraphs are also re~ui:red. An inves-
tigeti.on we. llIadeby ~J:Q.birKumarDss (Alilstt. Professor, Beng.ladesh
Univeraity of t.ngg. lind Tech.) in 1976 in this rsgard. The work
was a requiremant for his M.Sc.Engg.(£lsct.) Thesis. Radio stal:
Cygnus 'A' was used es noise lIourca for determining G/T performance.
iusing V-factor 1II11tho.d.In his invsstigation it was found that
lNR(Lownois9 receiver) noise temperature was within 16°k, This
is V8l:Ygood agrel!llllentwith the theoretical valUe of 1 rOk. (Assu-
••ing that this value is not changed sppreciably by thietinte). Ths
result also yielded an sntenna noise temperature of 4Z.Sok for 41"
1:.05"
elevation which is wel~ below the designed noiss temperst.ure
budget of 530k. Investigstion 151$0showedtnat there is 1.~S dB
margin in GIT and ~ dB margin in gain G.
Since, an investigation is alread~ made. no further measu-
rements were taken at aatel~ite ground station (Betbunia, Chittegong).
6.1e N01S0 Qbjectiy' for ~lul,tiple,xed ~rSnBmission Sy9tem
Kypothetical reference circuit (tlRC) t This is e cOlllplets
telephone circuit (between audio frequency tSrillina1s at each and)
established over a hypothetical internaticnal carrier system of
definite ~ength. It I;:omrises definite number cf modulators,
delllodulatorih groups, sup,",g.roups etc. Various lIRe have been,defined for different system •• Noise perfo.1'manceobjectives •.1'15
defined for each HRC. TheslII ere listed in Appendix-g.
From the table of tlRC (for CCITTand CCIR), the recommended
nois.at zero level point may be cited as followsl
(1) Total noi Be power of 25,000 kM length HRCis 10,OOOpW
(psophometric) •
(2) Out of 10,00013'1, 2500pW is for frequency division
lIlultiplex terminal equipllIent.
(3) In r-f (MW)system 7, SOOpli' psopnometrically weighted
mean value in any hour'.
(4) 100,.00013111 (unweighted, with a integrating time of 5 ms)
for more than D.IIllS of month when fading is severe.
(5) 7, SOOpiNpsophometrically weighted one minute maan p0lo/er
for IIIOre than 20" 0 f III month when fading is severe.
,,
126
6.11 D.i,scu,sionlength
D.i,stribution af 1,500 pWfar 25,.000 kM/( ':ram Art. 6.10}
inue.tes a 3 pW/k'" r-f noise. Now.nacc_Chittagong Klit distance
1a about 240 kM. So r-f noise should not exceed 3x240 '"' 120'11.•
Allldingtha carriar noise Dbjectivs. the totel noise becomes
(2500 + 120) '"' 3.220pll/op(actually thisanould be lower than the
valUe given. as 2500 "Ill f.d.1II noise is fG31those numberof modol_
tara and duodulatorll lld1ich are used for 25000kMlength Kill systeJlll).
But 1:e8ults show thet the lIlin.imulIIaverage noise pewer refe1:red to
<taro level JIIoin1:(chann.elnumber 5 in bbl. 6. 6(a» i. -47.8 dBA!
or .pproximately 16.596 pWopin the month of Feb. 1960. Thi. con-
siats of f.d.1Il and r-f systelll noise. This value i. 16.596/3220 i. e
5.15 timea or 7.J.dB .higher then the objective. The lIIax.i,lIIulllI!IVera98
noise power in the aPe lllonth (ehannelnumbeJ:.4 in table 6.6(.» is
-46.45 dB1D01tor approximately 22,646 ',WoP. This v.lua is 22.646/3220
i.e 1 tilles or 8.4 dB higher th.n the objective •. The average noise
power of 5 channele (Tabla 6.6(.» in the sama ~onth (feb. 1980)
i& -41.23 dBllIIJpor 16.923 ,Wopwhich is 5.61 times or 7.69 dB higher
th.n the objective. The corresponding figures in the lIIonthof
MaYi19BO(fro~ table 6.6(b» are (i)minimumaverage noise power of
-54.66 dBmopor 3419.6 pWopwhich is 1.06 times or 0.26 dB hig.her
than the obj ective (U.) maximulllaverage naiel!l pOWl!l1:of -49.21 dBlllop
or 11.830 pWopwhich ie 3.61 times Or 5.65 dB higher than the
objective and (iii) average noise (fo3110 channels) power Gf
-51.59 dBmopor 6.934 pWopwhich is 2.15 times or 3.33 dB hi9h.1:
than the objective.
1:0'1
Thus i1: is seen that there is in average (7 •.69-3.33). 4.36 dB
improveaen1:in the month of Mey. 1960 in COlllluu:iaonwith feb. 1980.
So far it is known•• speeiel maintenance work we. psrforJlled in
the MWsystem in the 1st weekof Hay 1980. which probably is the
!aain reason for 4.36 dB improvelllent. But ati11 tb. noise (the cese
.f May. 1980) ie .pproxi ••etely double the objective. Of course
this conclusion would be llIOrsjuatifisd if meellUrSHtIltswere taken
in laore channels and also 1"orlIIore ti188with setiofying condition
•3' in Art;. 6.10. However. it !Daybe stated that each ralliding.
was talcen for five lllinutes and there iIIasno chenge in tha reading
within this tillls interviil. So. it is reasonable to assu.e that the
readings closely .pproximatas.to ona--hourmean noi.e power.
Be.ides to mee,t the CCHI snd CCITTobjectives" other condi-
tions in Art. 6.10 Illust also b. satisfied. aut meaSUrlllllBJ:ltsin
thess regards 'wers not pO$sible.
Now.noise power objectivs (for poor case) in audio frsq-
uency circuit (from Art. 5.11) i. 1875 pWpand 1'e$llt8 shows th~
the existing audio circuit noisa power is 6309.57 pWp(or_ 52dBmp).
Thus total existing noiae (audio frequency circuit plus lIlulti-
p1sxing and r-~ noise) becomea (6309.57 + 6934) ••.13.243.57 pW
and total objsctive is (1875 + 3220) = 5095 pW.Hence total
existing no!se is 2.6 timea or 4.14 dB higher than the objective.
Thus two subscribe~ one at Chittagong and another at Dacca will
hava 4.14 dBmore noiea than the objective when they are talking.
Thiti will be higher for IS subs~iber at Bangladesh and another
subscriber at U.S.A. But sn important thing is that cOlllmunicstion
will be possible if SURis more than 30 dB. However,comlllunication
'1;{,S
will he better. the highe.r the SNR.Obviously. SNRfor two sub_
cribers seperated by longest distance is IllOrethan 30 dB for the
existing system in OUrcountry except for some time when fading
is severe.
Now. r-f noise DUty blnlleasured aspera'tely by using noise
lo.dug method. This measursmant was taken and the :results flI:re
given in Table 6.2. But thelle results are not fully correct dua
te the following :reasons:
There s:re two radio channels between Dacca and Chittegong
(Ch8nnal~Aand Channel_B). But for two radio channels thare ere
only one baseband 'equipment for telaphone signals and one baseband
equipment for lv (television) signel. So llIea$lrSlllentsin the
t.elephone llystl;llllcould' be dDnlfonly after interrupting the 8111rvice
which WlilS not possibl e. Butlllessur_ents were talcen in the B-
channel wi'th Tv. base band equipllant end test signal level used
waa that 1'0:1." telepho,na case Ia. tbis was only available). Th~ t~sign.l levels for two channels including baseband equiplIIants ara
diffe:cent. Sa the :l."8sultobtained is not accurate. r est signal
level for Tv. bass band input is highsr which wss not availabla
and so NPR versus loading curve was not possible' to be plotted.
But one inference may be drawn from the result whicb tells thatbetter
middle channels in the baseband have/lPlIK SNRthan end channels.
Actually SNRfor all channels should be equal. Thus, frequency
response of 'the system is not according to the standard. Also.
anothar infe:cence frolll the result of noiae loading test that may
be drawn is that there ill some~fault at Hajigenj.
r29
The two radio channels used in Dacca-Chittagong MWeireui.t
haB only f~equency diversity and it was found that during severe
fading tim.e both channlll s go out 1;1 f order simultaneously. This
is sean in Tables 6.3(a) and 6.3(bl and in fig. 6.13{al, 6.13(b).
f:ven fadin", occurs simultaneOUB~inboth hops (i.e Hajiganj-
Deuukandi end Hajiganj_Begumganj). This is alfIQ seen frolll Fig. 6. 13(al
and 6.13( bl. Fading may i11sohappen simulteneousl.y in 1lI0rethan
1:"0 hops. Duration of fading is different for different llIonthe.
Such. veri.ticn is shown in Fig. 6.14. Also a yaarly variation
is shownin jalc Fig. 6.15. Nozmsl1y, there' ie no fading in the period
between Merch and September. So these months are not shownin the
figura.
Normally, it is expected that durio.g fading at least one
channel should work. But nowboth of the channels tChannel A and
Channel B} go out of order during f'ading. This may heppen in two
waya tal fra:lneJ. zone touches earth due to ~he variation oftkt
factor (bl due to air duct. These may be ovarcomed by using space
diversity antennas having greeter height than the existing antenna
height.
'$
REfERENCES
1. Members of' the TechnicalStaff
2. Yonezawa, 5 and Tanaka. N
3. Tent. M.J.
4.
5. Panter~ Philip F.
6. Hogg, D. C.
7. GrQss. T. G.
B. Hills, M.T andEvans. B. G.
9. Lankurt Electric
"Transmission System for Communi-cations". Bell Telephone Labora-tories, Inc., Revieed fourthEdation. 1971, p. 237-245,492-512.517-519. 536-540.-
"Microwave Communication" MaruzenCompo Ltd., Tokyo. 1965._P. 357-360.
UWhite Noise Book". White CrescentP:ress Ltd •• Luton, England, 1974.p. 50-60.
"Malayasians TelecommunicationsI nstru c-tions" •
"Modulation, Noise and Spect:ralAnalysis". McGraw Hill Book- CompanyInc., 1965 P.
"Statistics on Attenuation of'Microwaves by I ntense Rain",Bell System Tech •• J., Vol. 46,Novsmber •. 1969,
"pows:r Density Spectrum of theSun of Two Correlated Intermodula-tion Noiee Cont:ributors inFMSyetems"'. Bell System Tech. J,Vol. XLVI. December, 1967.
"T:rensmi ssion Systems", &-~'\*,- t\ll-<.'I1.",-",A u,< IN' '" L-ht, Lo"AoVl, 1"1:U
"Video, Voice and Data Manual"Fa-rill. 75 A2-M56-1, IssueSeptembe:r 5. 1972. P. 4 of 4.

\\\
." -
.' -~.,;. '.
,,"-
, I-1J31d1fH:J
.- ,
. "
130
7.1 Conclusions and Recommendations~
It is found that noise is increased in our telecommunication
system causing a lower SNR. It is increased in cables and switch-,j
ing system and also in f.d.m and r-f system. The amount of
increase is stated in the discussions. (Chapter-5 and Chapter-6).
Noise level is increased in cable and switching system
(as discussed in Chapter-5) mainly due to poor maintenance.
Similarly; increased noise level in r-f and multiplexing/demulti-
plexing system (as obtained in Chapter-6) is primarily due to the
poor maintenance. Thus, to increase SNR maintenance must be done
in better way. Maintenance require regular testing e.g. if two
base band equipmen~are arranged for ,telephone channel and two
for Tv channel in Dacca-Chittagong MW link; then performa~ceof
the link can be tested by using noise loading method and
so prop~r, tre.tm~nt can be made~based upon the test results. Such
arrangement should be made for each microwave link. Similarly,
for better maintenance; faciliti es must be made for regular
measurement and testing in cable and switching networks. Only
making arrangements for measurements and tests are not sufficient.
Proper execution of regular tests and measurements, evaluation
of the results; decision on the basis of evaluation and implemen-
tation of the decision must be made to accomplish the whole main-
tenance work.
Only using frequency diversity antenna, effect of fading
cannot be avoided as found in Dacca-Chittagong MW link. Some space
131
diver.sity antenna is in existance i.n north Bengal MWsystem.
Such spece diversity antenna;it used in Dacca-Chittagong MW
system in addition to the frequency diversity; will probeb~y
make it possible to avoid .the effect of severe fading. Since"
Dacca-Chittegong MWlink is used also for intsrnational i"'~II.;d:.1
IUI**a".l telecommunication. it will be better to establi sh another
MWlink in this route to give further flexibility to the service.
A,nother factor is the necessity of increasing exchange
line capacity due to the higher dellland.• This must be done with
proper planning which requires the measurement of offered, carried
and overflow traffic. Now; only measurement facility for.carried
traffic is in existence at .Moghbazar axchange. for the. saiel
purpose such arrangement in addition to the measuremant facilit;
for .ffered traffic should be made for other exchanges.
J It is heard that electronic exchange is going to be intro-
duced in our country. This will reduce switching system nois,:.
Besides if;in addition; digital technique is used, then effect
of noise will further be reduced .as, in th;;s ,system, regenera,ti(),:,
of the signal ispossibl.e .at determined points in the transmission
path and the regeneration pulses carry no information about noise
or distortion in the preceding link.
Oldage of some cables; exchanges and MWsystems is probably~~ - - ..- --- -
the another cause for increased noise level.. for example; exchange
'2'" was installed in 195•• and exchange '2B' was installed,in_].96~.
But life period of an exange is normally 12-15 YI!H!I~e.So. these
13:0
exchanges have elready passed their designed period of li fe and
so their performance is obviously degraded. Similarly; the
Dacca-Chittagong Microwave system has already passed the designed
life period as it was installed in 1970; the designed life period
of which is 10 years. 50; for better performance and better
sNR; old~ squipments should be replaced.

.. ,
APPENDICES
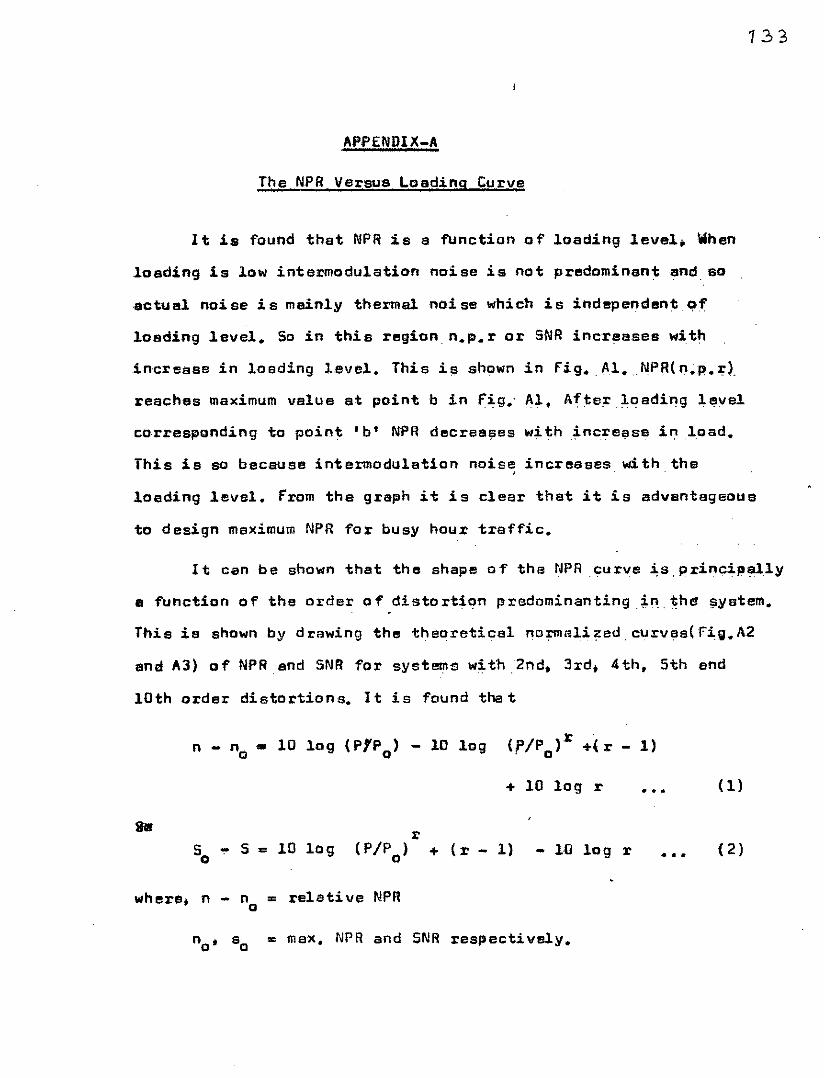
133
APPENDIX-A
The NflRVersus Loading Curve
I t is found that NPRis a function 0 f loading level. When
loading is low intermodulation noise is not predominant and so
actual noi se is mainly thermal noi se which is independent <;If
loading level. So in this region n.p.r or SNRincreases with
increase in loading J.evel. This i!;l shown in fig.Al.NPR(n.p.;-).
reaches maximum valUe at point b in fig, Al, After loading level
corresponding to point I b' NPRdecreases wi th increase in load,
This is SO becausa intermodulation noise increases with the,
loading level. from the graph it is clear that it is advantageous
to design maximum NflR for busy hour traffic,
It can be shown that the shape of the NPR curve is,principlill1y
II function of the order of distortion predominantingin. ther system,
This is shown by drawing the theoretical normalizedcurvas(Fig.A2
and 1.3) of NPR end SNAfor systl!!ll1s wit'h2nd. 3rd; 4th, 5th and
10th order distortion s, It is found the t
n - "0. 10 log (PfPo) - 10 log
+ 10 log r
r50 ~ 5 = 10 log (1"/1"0) + (r - 1) - 10 log r
where; n - n •• relative NPRo
"0; So •• msx. NPR and 5NR respectively.
,..
.,,
( 1)
(2 )
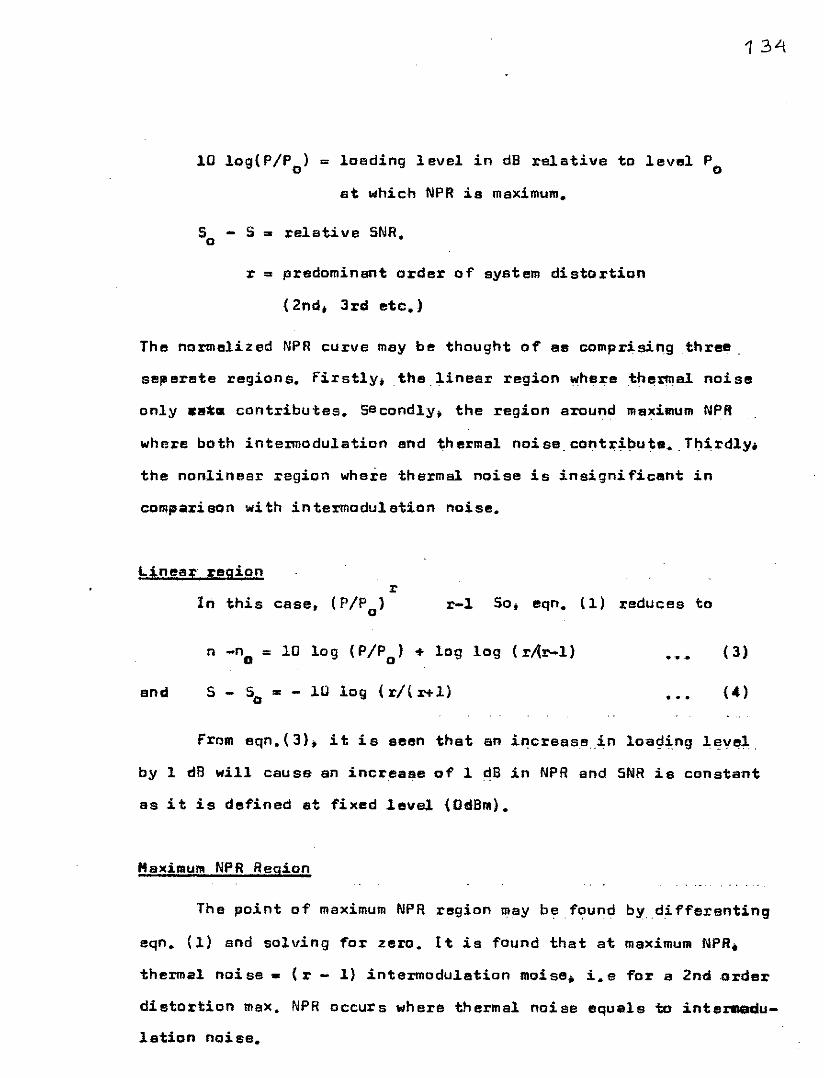
134
10 10g{P/P ) = loading level in dB relative to level Po 0
at which NPRis maximum.
So 5 .os relative 5NR.
r os predominant order of system distortion
(2nd; 3rd etc.)
The normelized NPRcurve may be thought of as comprising .three.
sell'erete regions. firstly; the. linear region where thermal noi se
only •• ~. contributes. secondly; the region around meximumNPR
where both intermodulation and th ermal noi se. contribute •. Thirdly.;
the nonlinear region where thermal noise is insignificant in
compa:t'ison with intermodulation noise.
Linear regionr
In this case, (P/Po> r-l So; eqn. (1) reduces to
and
n -no = 10 log (P/Po) + log log (rAr-l)
5 - So '" - 10 log (r/( r+l)
...-.
..'.( 3)
(4)
from eqn. (3); it is seen that an i,..crease in loading level,.
by 1 dB will cause an increase of 1 dB in NPRand SNRis constant
as it is defined at fixed level (OdBm).
MaximumNPRRegion
The point of maximumNPR region may be found by di fferenting
eqn. (1) and solving for zero. It is found that at maximumNPR.
thermal noise - (r - 1) intermodu1ation moise. i.e for a 2nd order
distortion max. NPRoccur s where th ermal noi se equlills to interllGdu-
18tion noi se.
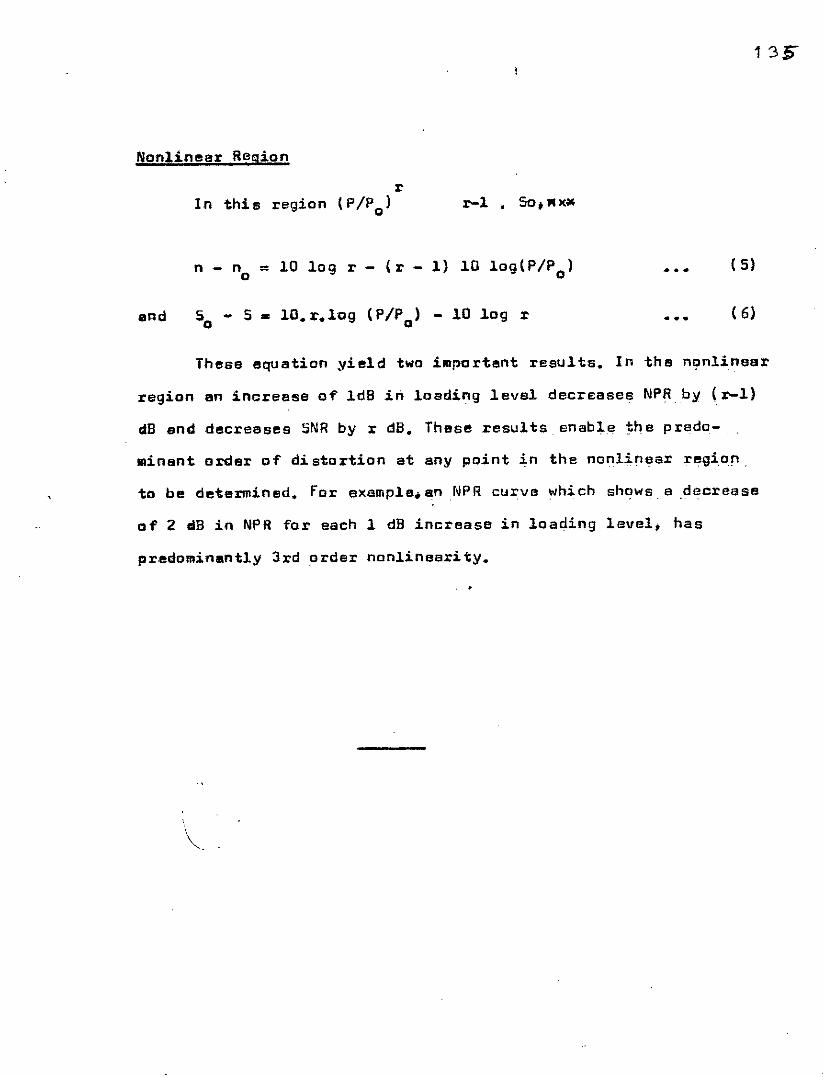
135"
Nonlinear Region
rIn -this region (1"/1"0)
end
n - no = 10 log r - (r - 1) 10 109(1"/1"0) ..'.•••
( 5)
( 6)
These equa-tion yield two illlportant results. In the ngnlinear
region an increese of IdB in losding level decreases NPRby (r-1)
dB and decreases 5NRby r dB. These results enable the predo-
minant order of distor-tion at any point in the nonlinear region.
to be determined. for examp1a.anNPR curve which shows e .decrease
of 2 clB in NPR for each 1 dB increase in loading level; has
predominantly 3rd order nonlinearity.
"\
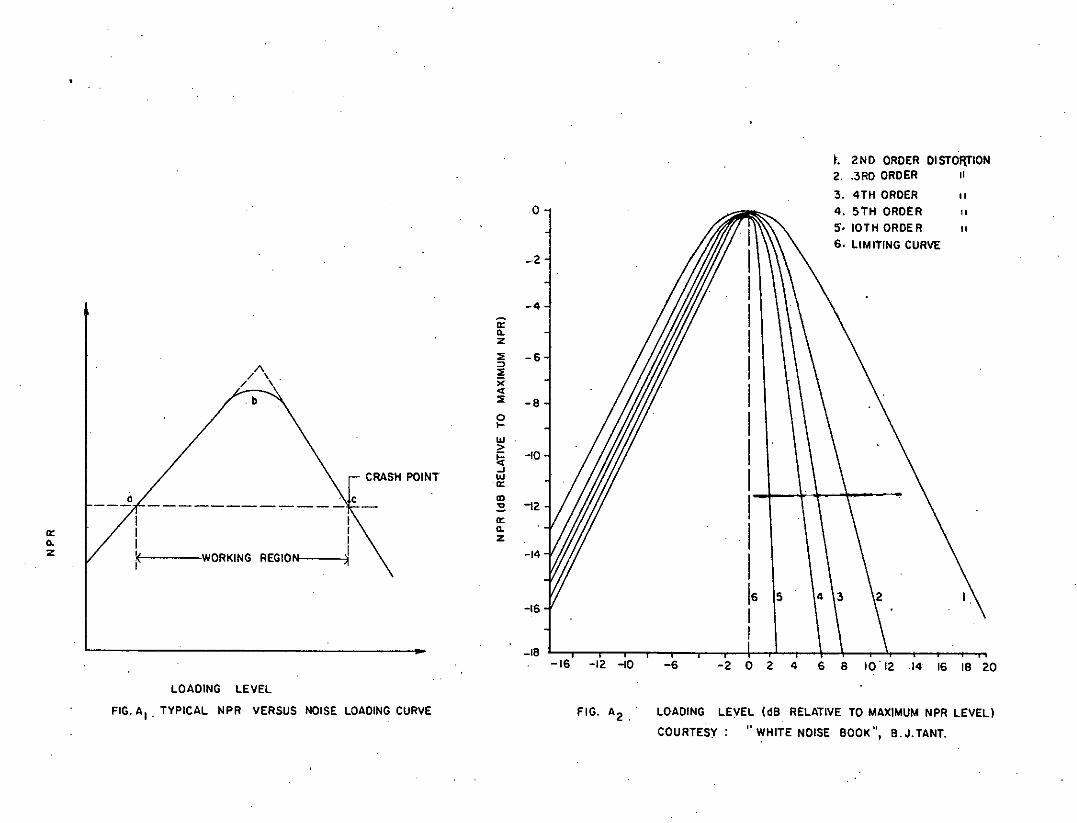
-8
-6
t. 2ND ORDER DISTOf{TION2.. 3RO ORDER "
3. 4TH ORDER II
4. 5TH ORDER II
5', 10TH ORDE R II
6. LIMITING CURVE
5 \4 \3
-2 0 2 4 6 8 10' 12 14 16 18 20-6-16 -12 -10
-4
III~ 42a:Q.2
-18
_2
-16
o
-14
a:Q.2
:;
~X••:;g'">ti -10..J
'"a:CRASH POINT
1\/ \
/ \'
,III
I( WORKING REGION 1a:Q.2
LOADING LEVEL
FIG. AI . TYPICAL NPR VERSUS NOISE LOADING CURVE FIG. A2.' LOADING LEVEL (d8 RELATIVE TO MAXIMUM NPR LEVEL)
COURTESY: "WHITE NOISE 800K", 8.J.TANT.
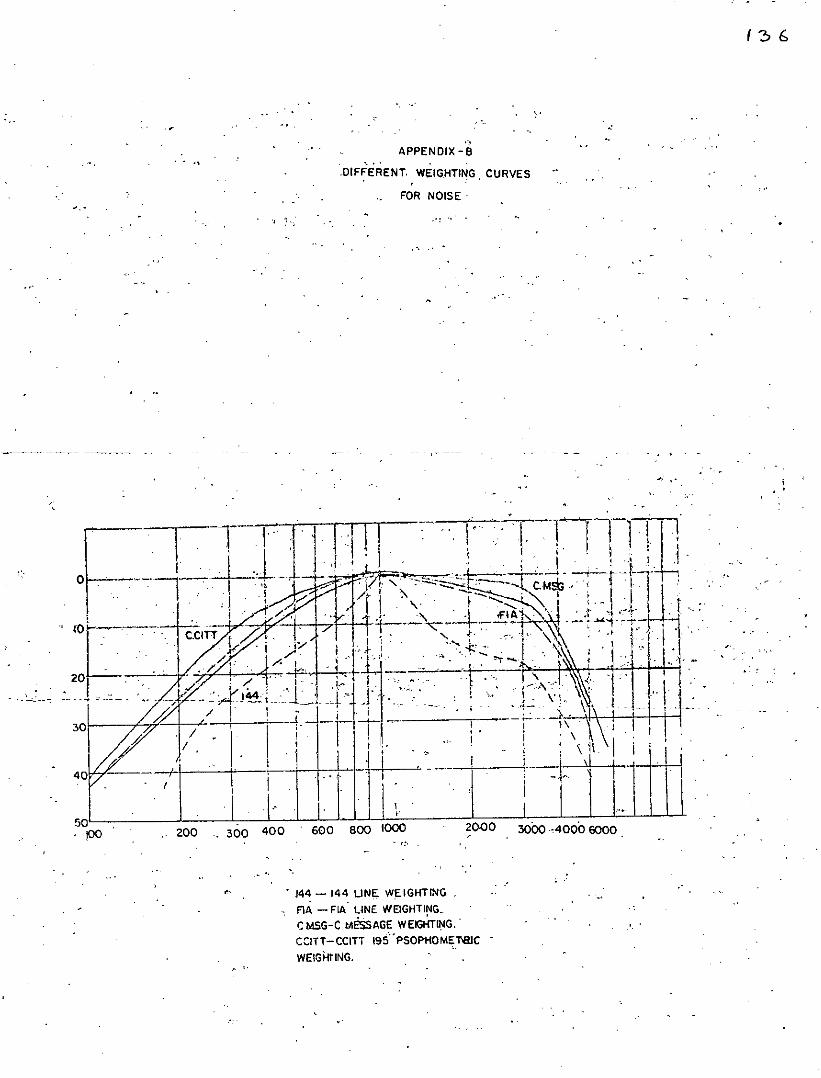
-..
o
30
50100 200
. "
" 300 400
- ..
,".,
",APPENDIX -B..... .
.DIFFERENT. WEIG.HTlNG CURVES
FOR NOISE'
.": .,
"
• 144 - 144 UNE WE'IGHTING .flA - FIA LINE WEIGHTING,CMSG-C MessAGE WEIGHrING..CCITT-CCITT 19S"PSOPHOMENlICWEIGHtiNG.
...
; ."
. .'
"',- ,". .
..
. :-
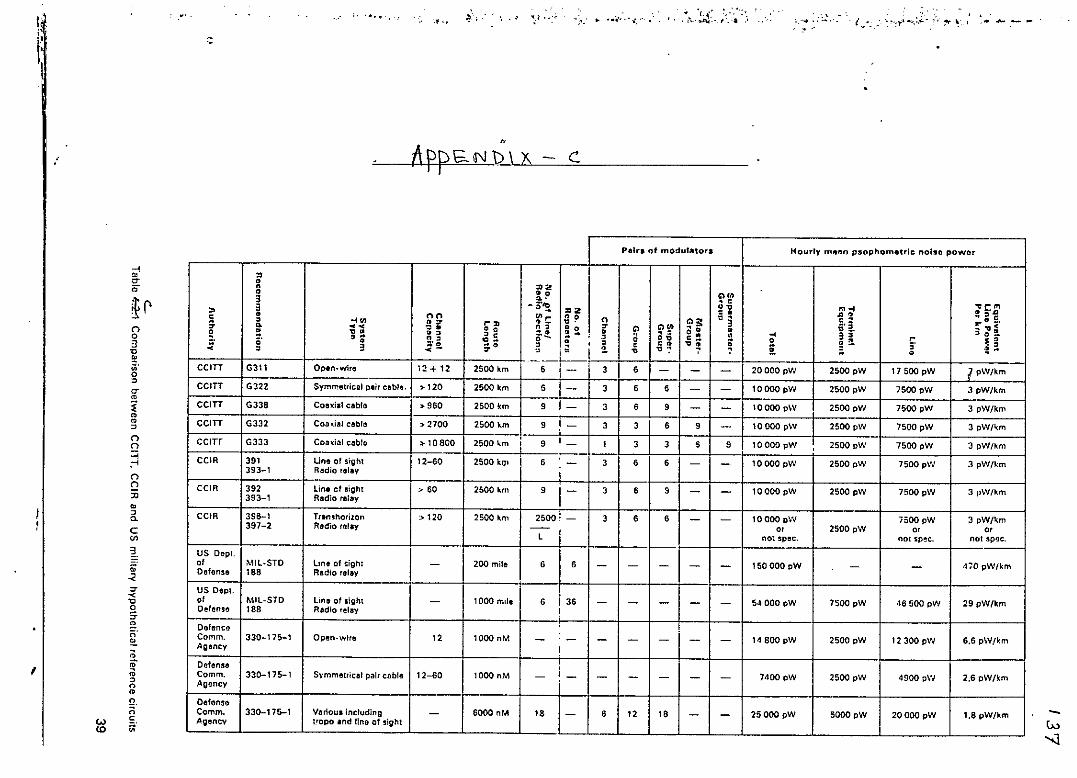
1~.I:I
~
-/ ........-.'t'O ~\ . , ~) .,,~, .•.. ••• ".t•• "-:, ~ .\,_~~~~f. ~ -:.
..~~."-10 •• - •••• , I 0
:,.~ •••.)-~ ;', ~ ll.- ," oIW __
-<•""~r(')03"•:.00~"~~mm~(')(')
::;:-<(')
Q:xl•~a.C
'"~~.
-<".~"05'~;;.':.~;;, I ~~"m!l.n
W ~.'" 0
"_0 _~p S.N b \ )\ - L
Pairs of modulators Hourly malin p:!liophomlltric noisD powor
"• "20• 00 ,,,.3 •.. • c3 -5'~ "2 o~ m •• -:c.:~ = • ~o • , cc 0 nn "'~ 00 n "l': = 3 c ,
lI:"'~<- , ..'" 0" ~" o. ~." "'"
..," .. ~~ ~. • = o , 00 " c; ~ 0 ~•. 3o!.0 ~ 0' , c go.!. ~.•. ; 0 a l;a ~ .. 3'o' o- n, "- 0 s c _0 o!!. ~ , 0~. 0 ;00 -. , , = co ~.0 ~
;. 0', 3 <- " " LI !!. ~ "0 -: 7 7 ;; • ~.celn G311 Open-wire 12 + 12 2500 km -.1- 3 6 - - - 20000 pW 2500 pW 17500 pW 1 pW/km
CtlIT G322 Symmetrical p.•l, cllble. ~120 2500 km 6 1- 3 6 6 - - 10000 pW 2500 pW 7500 pW 3 pW/km
CCITT G338 COISl(i.1 cable ).960 2500 \(m 9 1- 3 6 9 - - 10000 pW 2500 pW 7500 pW 3 pWjkm
CtlIT G332 COJ)-.;ialcllble >2700 2500 km 9 i_ 3 3 6 9 - 10000 pW 2500 pW 7500 pW 3 pW/l(m
CelTT G333 Coaxial cltb!& ). 10800 2500 J.:m : 9 ,- I 3 3 S 9 10000pW 2500 pW 7500 pW 3 pW/km,tCIA 391 Un'! of sight 12-60 2500 klJl 6
, - 3 6 6 - - 10000 pW 2500 pW 7500 pW 3 pW/km393-1 Rlldio !!tlav i
CCIR 392 Lin. ef !light > 60 2500 110m 9 - 3 6 9 - - 10000pW 2500 pW 7500 pW 3llW/llm393-1 Radio relllV
CCIR 396-1 Tt.n~horll.on ;)0 120 2500 11m 2500; - I 3 6 6 - - 10000 pW 7500 pW 3 pW/!<m397-2 Radio rlllav -- ., 2500 pW o. 0'l
,no: spec. nOI spec. nOlllp'JC.
US Deptof MIL.STD line of sigh: - 200 mile 6 S - - - - - 150000 pW - - 470 pW/kmDofense 188 Radio relay
US Depl.i 36of Mll-STD Lin" of sight - 1000 mil. 6 - - - - - 54 000 pW 7500 pW 46500 pW 29 pW/kmDaflln~tl 168 Rltdlo relay I
Defence, !
Comm. 330-175-1 Open.wit. 12 1000 nM - - - - - - - 14 BOOpW 2500 pW 12300 pW 6.6 pW/kmAgency I
Defense ,Comm. 330-175-1 Svmmelflcel palt Cllble 12-60 1000 nM - '- - - - - - 7400 pW 2500 pW 4900 pW 2.6 pW/kmAgency
Defensc6000 oM IComm. 33O-17~1 VtHioua Including - 18 - 8 '2 18 - - 25000 pW 5000 pW 20000 pW 1.8 pW/km
Agencv t.opo iIInd IIOBof sight -Cu"1
Related Documents