2ooZo(,,"15ol 5 73c o zctF To appear in The Astrophysical Journal, Dec. 20, 2001 r---q c'q _) < ¢¢5 c'q ;> t"- ('¢3 OO O O I © 5¢3 ;> ,r--t X The Ionization and Metallicity of the Intervening O vI Absorber at z = 0.1212 in the Spectrum of H1821+6431 Todd M. Tripp, 2 Mark L. Giroux, 3'4 John T. Stocke, 3 Jason Tumlinson, 3 and William R. Oegerle 5'6 ABSTRACT We use high-resolution UV spectra of the radio-quiet QSO H1821+643 (zero = 0.297), obtained with the Space Telescope Imaging Spectrograph (STIS) and the Far Ultraviolet Spectroscopic Explorer (FUSE), to study the ionization and metallicity of an intervening 0 VI absorption line system at Zabs ---- 0.1212. This absorber has the following notable properties: (1) Several galaxies are close to the sight line at the absorber redshift, including an actively star-forming galaxy at a projected distance of 144 hg_ kpc. (2) There is a complex cluster of H I Lycr absorption lines near the O VI redshift, including at least five components spread over a velocity range of--_700 km s -1. (3) The strongest Lya line in the cluster appears to be composed of a mildly saturated component with a typical b-value blended with a remarkably broad component with b _ 85 km s -I. (4) The 0 VI absorption is not aligned with the strongest (saturated) H 1 absorption, but instead is well-aligned with the very broad component. (5) The only detected species (at the 4_r level) are 0 VI and H I despite coverage of strong transitions of abundant elements (e.g., C II, C III, and C IV). Based on these constraints, we find that the absorption line properties can be produced in collisionally ionized gas with 105a _< T _< 10 _6 K and -1.8 _< [O/HI _< "0.6. However, we find that photoionization is also viable if the pathlength 1 through the absorbing gas is long enough; simple photoionization models require 85 < l < 1900 kpc and -1.1 _< [O/HI _< -0.3. We briefly discuss how observations of X-ray absorption lines due to O VII and O VIII could be used, in principle, to break the ionization mechanism degeneracy, and we conclude with some comments regarding the nature of O VI absorbers. Subject headings: (H1821+643) intergalactic medium -- quasars: absorption lines -- quasars: individual 1 Based on observations with the NASA/ESA Hubble Space Telescope, obtained at the Space Telescope Science Institute, which is operated by the Association of Universities for Research in Astronomy, Inc., under NASA contract NAS 5-26555. 2Princeton University Observatory, Peyton Hall, Princeton, NJ 08544, Electronic mail: tripp_astro.princeton.edu 3Center for Astrophysics and Space Astronomy and Department of Astrophysical and Planetary Sciences, University of Colorado, Boulder, CO 80309. 4 Current address: Department of Physics and Astronomy, East Tennessee State University, Johnson City, TN 37614 5Department of Physics and Astronomy, Johns Hopkins University, Baltimore, MD 21218 eNASA Goddard Space Flight Center, Greenbelt, MD 20771

Welcome message from author
This document is posted to help you gain knowledge. Please leave a comment to let me know what you think about it! Share it to your friends and learn new things together.
Transcript

2ooZo(,,"15ol5 73c o
zctF
To appear in The Astrophysical Journal, Dec. 20, 2001
r---q
c'q
_)
<¢¢5c'q
;>
t"-('¢3OOO
O
I
©
5¢3
;>,r--t
X
The Ionization and Metallicity of the Intervening O vI Absorber at z = 0.1212
in the Spectrum of H1821+6431
Todd M. Tripp, 2 Mark L. Giroux, 3'4 John T. Stocke, 3 Jason Tumlinson, 3 and William R. Oegerle 5'6
ABSTRACT
We use high-resolution UV spectra of the radio-quiet QSO H1821+643 (zero = 0.297),
obtained with the Space Telescope Imaging Spectrograph (STIS) and the Far Ultraviolet
Spectroscopic Explorer (FUSE), to study the ionization and metallicity of an intervening 0 VI
absorption line system at Zabs ---- 0.1212. This absorber has the following notable properties:
(1) Several galaxies are close to the sight line at the absorber redshift, including an actively
star-forming galaxy at a projected distance of 144 hg_ kpc. (2) There is a complex cluster
of H I Lycr absorption lines near the O VI redshift, including at least five components spread
over a velocity range of--_700 km s -1. (3) The strongest Lya line in the cluster appears to be
composed of a mildly saturated component with a typical b-value blended with a remarkably
broad component with b _ 85 km s-I. (4) The 0 VI absorption is not aligned with the strongest
(saturated) H 1 absorption, but instead is well-aligned with the very broad component. (5) The
only detected species (at the 4_r level) are 0 VI and H I despite coverage of strong transitions
of abundant elements (e.g., C II, C III, and C IV). Based on these constraints, we find that the
absorption line properties can be produced in collisionally ionized gas with 105a _< T _< 10 _6 K
and -1.8 _< [O/HI _< "0.6. However, we find that photoionization is also viable if the pathlength
1 through the absorbing gas is long enough; simple photoionization models require 85 < l <
1900 kpc and -1.1 _< [O/HI _< -0.3. We briefly discuss how observations of X-ray absorption
lines due to O VII and O VIII could be used, in principle, to break the ionization mechanism
degeneracy, and we conclude with some comments regarding the nature of O VI absorbers.
Subject headings:
(H1821+643)
intergalactic medium -- quasars: absorption lines -- quasars: individual
1 Based on observations with the NASA/ESA Hubble Space Telescope, obtained at the Space Telescope Science Institute,
which is operated by the Association of Universities for Research in Astronomy, Inc., under NASA contract NAS 5-26555.
2Princeton University Observatory, Peyton Hall, Princeton, NJ 08544, Electronic mail: tripp_astro.princeton.edu
3Center for Astrophysics and Space Astronomy and Department of Astrophysical and Planetary Sciences, University of
Colorado, Boulder, CO 80309.
4 Current address: Department of Physics and Astronomy, East Tennessee State University, Johnson City, TN 37614
5Department of Physics and Astronomy, Johns Hopkins University, Baltimore, MD 21218
eNASA Goddard Space Flight Center, Greenbelt, MD 20771

1. Introduction
Any successful cosmological model must account for the quantity, distribution, and physical state of
the baryons in the Universe. While this is likely a more tractable challenge than understanding the more
exotic non-baryonic dark matter and dark energy (i.e., the cosmolo_cal constant), there is a "missing
baryon problem" which has been known for some time. In brief, inventories of the well-observed baryons
in the nearby Universe (including stars, cool neutral gas, and X-ray emitting galaxy cluster gas) find
total baryon densities, in units of the closure density, of f_b = P/P¢ _ 0.006 (assuming H0 = 75h75 km
s -1 Mpc -1, see, e.g., Persic & Salucci 1992; Fukugita et al. 1998). This is far less than the expected
value based on Big Bang nucleosynthesis and deuterium measurements (Burles & Tytler 1998): _bh_o o =
0.019+0.001 ( = 0.034+0.002 for hi00 = 0.75). Ironically, the baryons have been more readily accounted
for in the distant Universe than in the low-z Universe: at high redshifts, the "Lya forest" - photoionized,
diffuse intergalactic gas at T --_ 104 K - appears to contain the vast majority of the baryons predicted by
the deuterium observations (Rauch et al. 1997; Weinberg et al. 1997). At low redshifts, the cool Lya
forest is less dominant but still makes a substantial contribution to the baryon inventory. However, even
including recent estimates of the baryonic content of the low-z Lya forest (Shull, Stocke, & Penton 1996;
Penton, Shull,& Stocke 2000), the census of baryons at the present epoch falls well short of the expected
ftb. Consequently, cosmologists are confronted with an important question: where are the missing baryons
at the present epoch?
A promising possible answer to this question has been provided by cosmological simulations of the
growth of large scale structure. According to hydrodynamic simulations of structure formation, at the
present epoch 30-50% of the baryons (by mass) are located in low-density, intergalactic gas which has been
shock-heated to 10 s - 107 K (Cen _ Ostriker 1999a; Day@ et al. 1999, 2001). Following Cen & Ostriker,
we refer to this 10 s - 107 K gas as the warm/hot intergalactic medium to distinguish it from the hotter
gas observed in rich galaxy clusters. Such gas is challenging to observe. Its X-ray emission is extremely
difficult to detect, especially at lower energies where confusion due to foreground emission and absorption is
substantial. Current X-ray observations do not exclude this hot IGM baryon reservoir (Kuntz, Snowden, &
Mushotzky 2001; Phillips, Ostriker, & Cen 2001), and there are some indications of large-scale filaments of
diffuse gas delineated by X-ray emission (e.g., Scharf et al. 2000; Rines et al. 2001). However, Volt, Evrard,
&: Bryan (2001) and Croft et aI. (2001) have demonstrated that it is difficult to distinguish between X-ray
emission from diffuse intergalactic gas outside of virialized structures (as predicted by the cosmological
simulations) and X-ray emission from virialized groups and clusters. The gas may be a significant baryon
repository in either case, but the distinction has important physical implications, e.g., regarding the relative
importance of gravitational vs. nongravitational heating processes.
QSO absorption lines provide an alternative means to test the prediction that a significant quantity
of baryons are in the warm/hot IGM. Absorption lines such as the O VI AA1031.9,1037.6 and Ne VIII AA
770.4,780.3 doublets provide sensitive probes of 105 - 106 K gas in collisional ionization equilibrium (Verner,
Tytler, _: Barthel 1994). Searches for the O VI absorption lines at z_b_£ 0.3 with the Space Telescope
Imaging Spectrograph (STIS) on board the Hubble Space Telescope (HST) have revealed that the number
of intervening O VI absorbers per unit redshift (dN/dz) is remarkably high (Tripp, Savage, & Jenkins 2000;
Tripp _: Savage 2000). Furthermore, with reasonable assumptions about the metallicity and ionization of
the gas, these studies have shown that O VI absorption systems are probably an important baryon reservoir.
Since the O VI ion fraction peaks at T --, 3 × 10_ K in collisional ionization equilibrium, these O VI
absorption studies provide tantalizing evidence that the warm/hot IGM is an important baryon repository

#
r -.
at z --_ 0. However, there are several issues which must be addressed in order to build a compelling case.
First, the number of O VI systems (and sight lines) in the published STIS observations is rather small,
and consequently quantities such as dN/dz and the cosmological mass density have large uncertainties.
More observations are needed, and new programs to build the sample are underway. Second, the O VI
lines could arise in gas which is not collisionally ionized, but rather is photoionized by the bA r background
from QSOs and active galaxies. Or, the gas could be collisionally ionized but out of equilibrium, e.g.,
because it is able to cool more rapidly than it can recombine. Photo- or non-equilibrium ionization is
favored in some of the O VI systems because they have narrow associated H I lines (e.g., Tripp _ Savage
2000; Savage et al. 2001) which would not arise in equilibrium collisional ionization. Alternatively, these
could be multiphase absorbers. Of course, in some cases photoionization and collisional ionization could
be comparably important. If the gas is photoionized, then there are concerns about double-counting in
the baryon inventory (see below). Third, the metallicity of the absorbers is poorly constrained. If these
O VI systems originate in pockets of high metallicity gas, then there is less hydrogen associated with the
absorbers and their baryonic content is lower [flb(O VI) c¢ (O/H)-1]. Finally, the environment in which
these absorbers are located must be scrutinized. Are these absorbers found in unvirialized galaxy filaments
or even galaxy voids, or do they arise in virialized structures? Are these systems due to gas which is
gravitationally shock-heated when gas accretes onto lar_g_e-scale structures, or could they be heated by
nongravitational processes such as supernova-driven winds?
In this paper we are primarily interested in the ionization and metallicity of the gas. Specifically, we
use high-resolution UV spectra obtained with STIS and the Far Ultraviolet Spectroscopic Explorer (FUSE)
to study the ionization and nature of a particular absorption system at Zabs = 0.1212 in the spectrum of
the radio-quiet QSO H1821+643 (Z_m = 0.297). While some O VI absorbers are apparently "intrinsic" (i.e.,
close to the QSO itself, see Hamann & Ferland 1999), the H1821+643 absorber at z_bs = 0.1212 is certainly
an intervening system: it is highly displaced from the QSO redshift (Av ,_ 43,400 km s-1) and is located
at a redshift where there are several galaxies close to the line of sight, including a luminous galaxy at a
projected distance of 144 hT_ kpc which shows [O II], [O lII], and Hfl emission lines indicative of active
star formation (Tripp, Lu, & Savage 1998; Bowen, Pettini, _ Boyle 1998). The ionization mechanism is a
crucial issue because if the O Vl absorbers are photoionized and cool rather than collisionally ionized and
hot, then they still represent a substantial baryon reservoir (see Tripp & Savage 2000), but in this case they
may reveal the same baryons counted in Lya studies such as Penton et al. (2000) [note that all intervening
O VI systems that we have detected so far are also detected in the H I Lya transition]. Apart from the
baryon census, the metallicity and physical conditions of the gas are interesting in their own right.
The paper is organized as follows. The STIS and FUSE observations and data reduction are described
in §2. Section 3 summarizes the absorption line measurement techniques. Constraints are placed on the
physical conditions and metallicity of the gas in §4 including a comparison of the absorber properties
required in collisi0nally ionized and photoionized scenarios and some comments on X-ray absorption lines
of O VII and O VIII. We discuss the results and summarize our conclusions in §5. Throughout this paper
we assume H0 = 75 km s-1 Mpc -1 and q0 = 0.0 unless otherwise indicated. We also report heliocentric
wavelengths and redshifts; in this direction, VLSR = Vhelio + 16 km s-t assuming the standard definition of
the local standard of rest (Kerr & Lynden-Bell 1986).

-4-
2. Observationsand Data Reduction
ThispapermakesuseofobservationsofH1821+643takenwithSTISinboththeechelleandfirst-ordergratingmodes,aswellasshorter-wavelengthobservationsmadewith theFUSE satellite. In this section we
briefly describe the observations and data reduction; see Woodgate et al. (1998) and Kimble et al. (1998)
for information on the design and performance of STIS, and Moos et al. (2000) and Sahnow et a]. (2000)
regarding the .FUSE design and performance.
2.1. STIS Spectroscopy
H1821+643 was observed with the medium resolution FUV echelle mode (E140M) of STIS on 1999
June 25 and 2000 March 3I for a total integration time of 50.93 ksec. This STIS mode uses the FUV
MAMA detector, which generally has very low dark background counts. While this detector also has an
amoebic region that shows elevated dark Counts when the detector temperature increases (see Figure 1
in Brown et al. 2000), the dark count rate was small compared to the source count rate for all of the
observations employed here. The observations made use of the 0'.'2 x 0'.'06 slit resulting in a line spread
function with minimal wings (see Figure 13.87 in the STIS Instrument Handbook, v4.1). This STIS eehelle
mode/slit combination provides a resolution of R = A/A)` _ 46,000 (FW%IM _ 7 km s-1, see Kimble et
al. 1998) and wavelength coverage from _1150 to 1710/_ with four small gaps between orders at )` > 1630
_. Several STIS first-order grating observations of H1821+643 were also obtained on 1999 June 24. Most
relevant to this paper is the STIS G230M observation extending from 1724 to 1814 A, which covers the
C IV doublet at Z_bs = 0.1212. This first-order grating spectrum has a resolution of _30 km s -1 (FWHM).
The data were reduced with the STIS Team version of CALSTIS at the Goddard Space Flight Center.
The individual echelle spectra were flatfielded, extracted, and wavelength and flux calibrated with the
standard techniques. Then a correction for scattered light r was applied using the method developed by
Bowers et al. (2001), and the individual spectra were combined weighted by their inverse variances averaged
over a large, high S/N region. Finally, overlapping regions of adjacent orders were also coadded weighted
inversely by their variances, s The first and last ten pixels in each order were not coadded to avoid spurious
pixel values often seen near order edges.
The STIS G230M first-order grating observation covering the C IV )`M548.2,1550.8 doublet at Zabs
= 0.1212 was flatfielded and wavelength calibrated in the normal way, but the spectrum was extracted
with the optimal method of Robertson (1986). Two 50-pixel wide regions centered 52 pixels away from
the spectrum (one on each side) were used to determine the background. The two G230M spectra were
also combined with weighting based on signal- to-noise. To ensure that the wavelength scale of the G230M
spectrum is aligned with that of the E140M echelle spectrum, the Milky Way Ni II )`1741.5 and ),1751.9
lines covered in the G230M spectrum were compared to the Milky Way Ni II M317.2 and )`1370.1 lines
7Inspection of the cores of strongly saturated lines indicates that while the scattered light correction is usually quite effective,
occasionally errors in the flux zero point at the level of a few percent of the contlnuum are evident. Consequently, we have
included a term due to the flux zero point uncertainty in the overall uncertainties in the STIS measurements (see §3), and we
have allowed the profile-fitting code to adjust the zero point by a few percent (for the STIS data only) as a free parameter.
8For the overlapping regions of adjacent orders, the weighting was determined on a pixel-by-pixel basis. However, a five-
pixel boxcar smoothing was applied to the error vectors for the determination of the weights so that plxels with larger noise
fluctuations are not inappropriately over- or under-weighted.

F
J
recorded in the E140M spectrum.
2.2. FUSE Spectroscopy
H1821+643 was initially observed with FUSE on 1999 October 10 and 13; the total integration time
was 48.8 ksec. Results from this observation have been presented by Oegerle et al. (2000). Subsequently,
the QSO was re-observed with FUSE on 2000 July 24 with a total integration time of 62.7 ksec. Both
observations used the large (30" × 30 _) LWRS aperture. FUSE has four co-aligned telescopes and Rowland
spectrographs which record spectra on two microchannel plate detectors. Two of the optical channels have
LiF coatings to cover the 1000-1187 _ range, and the other two channels have SiC coatings to cover
905-1105/_. During the 1999 October observation, only the two LiF channels were successfully aligned,
but high-quality spectra were obtained with all four channels in 2000 July. By design, most wavelengths in
the FUSE bandpass are recorded by at least two channels (see Figure 3 in Sahnow et al. 2000).
The initial (1999) observations were reduced as described in Oegerle et al. (2000). The laterobservations were reduced in a similar fashion with CALFUSE version 1.7.6. The data were recorded in
time-tag mode and were processed to correct for Doppler shifts due to orbital motion, subtract backgrounds,
and wavelength and flux calibrate the spectra. Flatfield and astigmatism corrections were not sufficiently
tested at the time of processing and were not applied. CALFUSE assumes that the background is uniform
across a given detector, which is an adequate approximation for an object as bright as H1821+643. Oegerle
et al. (2000) report that the resolution of the 1999 October spectrum is 20-25 km s -1. The resolution of
later observations are somewhat better; the FUSE PI Team finds that the current resolution ranges from
_17 to 25 km s-1 (e.g., Savage et al. 2001). In both cases the resolution depends on the wavelength and
channel used to record the data. Because of the varying resolution of data from different channels and
observation dates, there are differing views on how to best make use of multiple detections of a particular
line. We discuss our strategy regarding this issue in §3.
While the wavelength scale of the 1999 October data can show large errors (10-30 km s -1) over small
intervals, this problem was subsequently corrected and is not evident in the 2000 July data. The relative
dispersion solution of the 2000 July data is accurate to _6 km s-1. However, there can still be an error in
the zero point of.the wavelength scale, e. g., due to imperfect centering of the target in the aperture. To set
the zero point of the FUSE data, the multicomponent Milky Way Fe II Al144.9 line was compared to the
Galactic Fe II 1608.5 line recorded in the STIS E140M spectrum. Similarly, Lyman series lines in the FUSE
spectrum at Z_bs ----0.225, which show distinctive component structure, were compared to the Ly7 line at
this redshift in the STIS spectrum. As in Oegerle et al. (2000), the wavelength scale of the 1999 October
data was corrected on a line-by-line basis by comparison to appropriate analogous lines in the STIS E140M
observation.
3. Absorption Line Measurements
The absorption profiles of detected lines at Z_bs = 0.1212 as well as regions of undetected species of
interest are shown in Figure 1. Standard processing of FUSE data provides highly oversampled spectra,
so we have rebinned the FUSE data to _ 7 km s -1 pixels. The STIS data are optimally sampled, so
no rebinning has been applied. Remarkably, despite the close proximity of several galaxies (see §1) and
a relatively strong Lya line, only Lye, Lyfl, and the O VI _1032 transitions are clearly detected at the
-6-
I
1
I
1
i
1 ! H
I--. , ...... _t,[L. _ _
H1821+643 I ./'
z=0.1212 , _ ,0-1 _ r t t r t I i i i"f_t i i I i j i ! i -
-600 -400 -200 0 200 400
Rest-frame Velocity (km/s)
x
b_,--4
0Z 1
C II ;_ 1334
(STIS E14OM)
C III ;_977
(rUSE)
C IV X1548
(STIS G230M)
N V k1239
(STIS EI40M)
0 VI XI032
(FUSE)
H I Lya(ST]S EI40M)
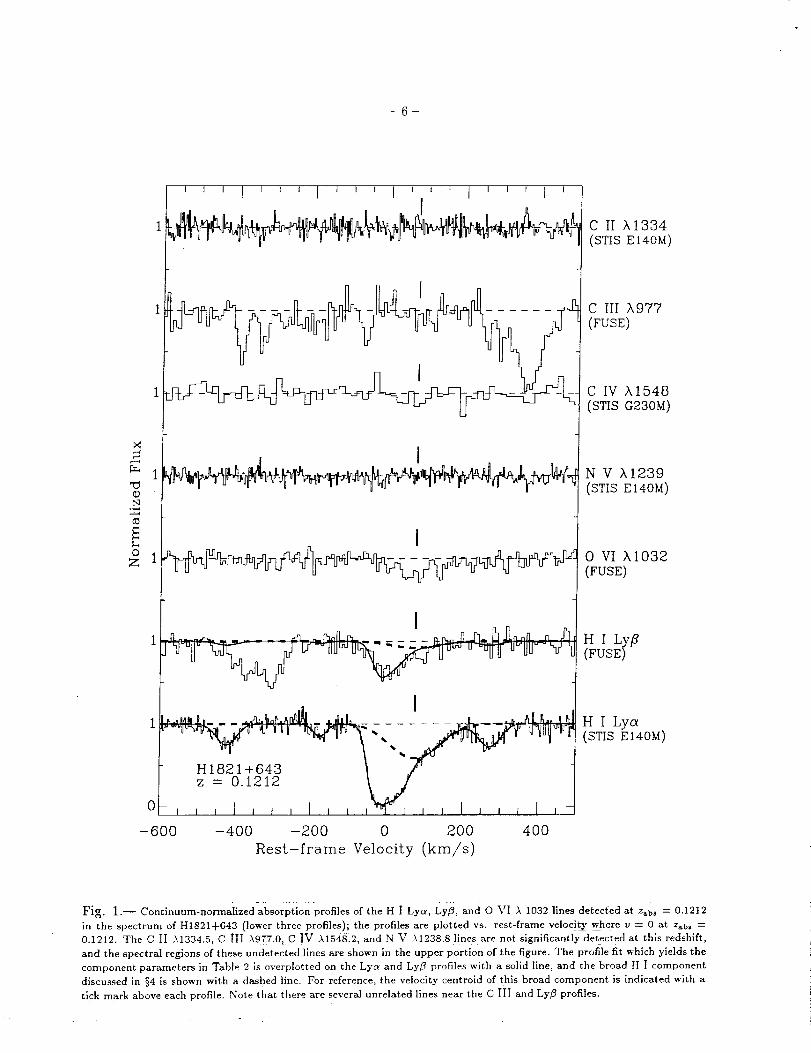
Fig. 1._ Continuum-normalized absorption profiles of the H I Lya, Ly/3, and O VIA 1032 lines detected at Z_bs = 0.1212
in the spectrum of H1821+643 (lower three profiles); the profiles are plotted vs. rest-frame velocity where v = 0 at Z,b 8 =
0.1212. The C II A1334.5, C ilI _977.0, C IV A154K2, and N V ),1238.8 lines are not significantly detected at this redshift,
and the spectral regions of these undetected lines are shown in the upper portion of the figure. The profile fit which yields the
component parameters in Table 2 is overplotted on the Lye* and Lyfl profiles with a solid llne, and the broad H | component
discussed in §4 is shown with a dashed line. For reference, the velocity centroid of this broad component is indicated with a
tick mark above each profile. Note that there are several unrelated lines near the C III and Lyfl profiles.
40- level or better at this redshift (we argue below that there is evidence of O VI A1038 absorption as
well, although the transition is blended with an unrelated line). Table 1 lists rest-frame equivalent widths
(Wr) of the detected absorption lines at Z_bs = 0.1212, measured using the methods of Sembach _z Savage
(]992), as well as 40" upper limits on undetected lines. Note that contributions due to the uncertainty in
the curvature and height of the continuum as well as a 2% uncertainty in the flux zero point are included
with the statistical uncertainties in the overall errors in Table 1. Integrated apparent column densities
(Savage & Sembach 1991), which similarly include continuum placement and zero point uncertainties, are
also provided in Table 1.
The quantities in Table 1 are integrated over the full velocity range of the mMn Lya feature but do
not include the three high-velocity weak Lye lines evident in Figure 1 at v -----425,-179, and +270 km
s-1. However, it is obvious from Figure 1 that even the main Ly_ feature is composed of at least two
substantially blended components. To deblend these components and measure line widths, we have used the
Voigt profile-fitting software of Fitzpatrick &: Spitzer (1997) to simultaneously fit the Lye and Ly/_ profiles.
For the STIS echelle data (Lye), we have accounted for instrumental broadening using the line spread
functions from the STIS handbook; for FUSE data (Ly/3), we have assumed that the LSF is adequately
described by a Gaussian with FWHM _ 20 km s-1. The profile-fitting results are summarized in Table 2.
The final model profile is overplotted on the Lya and LyE profiles in Figure 1 with a solid line.
Two comments on the profile-fitting results are in order. First, the Lyfl profile shows excess absorption
compared to the model profile over several pixels at v _ 90 km s-1. This is due to noise. Since the Lyc_
f-value is a factor of 5 greater than the LyE f-value, and since the equivalent width goes as f)_2, this
"component" would be very prominent in the Lya profile if it were real. We have attempted to find a set
of components which produce this extra LyE absorption without violating the constraints set by the Lyo_
profile, and we have been unsuccessful. Since FUSE is known to have complex and substantial fixed-pattern
noise (Sahnow et al. 2000), it is not too surprising to occasionally encounter a noise feature of this sort.
Second, the model profile fitted to the H I lines is not unique. The smoothness of the Lye profile at
100 _ v _ 200 km s-1 provides some support for fitting this wing with a single broad component, but a
comparably good fit can be obtMned with several narrower components spread over this velocity range.
In the case of the FUSE data, we are primarily interested in total equivalent widths and column
densities integrated across the full velocity range of the main absorption feature (i.e., -110 < v <: +210 km
s-I in Figure 1). Given the breadth of the absorption features of interest and the moderate differences in
resolution of the various data, it is reasonable to coadd the various spectra to increase the S/N. Nevertheless,
to be conservative we have measured integrated equivalent widths and apparent column densities from
the individual spectra separately, then we have determined the mean of the individual measurements,
each weighted inversely by its variance. These weighted means are the final integrated quantities reported
in Table 1. For profile fitting, on the other hand, we fitted the STIS Lya and FUSE LyE profiles
simultaneously. Consequently, to make full use of the FUSE observations, we first coadded LyE profiles
with the usual weighting based on the inverse variances of the individual spectra. We similarly coadded the
FUSE 0 VI data for the purposes of the next paragraph. Note that Figure 1 shows these coadded Ly/3 and
O VI profiles. Since the LyE lines are detected at high significance in the individual spectra, we elected
to coadd only the Lyfl profiles from the two LiF channels obtained in 2000 July and thereby preserve the
resolution as much as possible. However, the O VI lines are detected at lower significance in the individual
channels, and one of the LiF channels from 2000 July is not useful in the O VI region due to the vertical
stray light stripe caused by scattered terrestrial Lya emission during spacecraft orbital daytime (see §2.3
in Sahnow et al. 2000). Consequently, for the O VI lines we have coadded both of the LiF channels from

-8
Table1. EquivalentWidthsandIntegratedColumnDensitiesoftheOVIAbsorberat z = 0.1212
Species A0a fa PVrb log Na ¢ Spectrograph
(A) (mI)
H I ....... 1215.67 0.416 595-t-12 >14.38 d STIS E140M
H I....... 1025.72 0.0791 1584-14 14.43+0.04 FUSE e
O vI ...... 1031.93 0.133 90-1-17 14.02+0.07 FUSE r
N V ....... 1238.82 0.156 <56 g <13.42g STIS E140M
C IV ...... 1548.20 0.19i <144g <13.55 g STIS G230M
C III ...... 977.02 0.759 <104 g <13.21 g FUSE h
C II ....... 1334.53 0.127 <62g <13.49 g STIS E140M
Si IV ...... 1393.76 0.514 <55 g <12.79 g STIS E140M
Si III ...... 1206.50 1.669 <70 g <12.51g STIS E140M
_Rest frame vacuum wavelength and oscillator strength from Morton
(2001) or Morton (1991).
bRest frame equivalent width integrated from -110 to 210 km s -1
where v = 0 km s -1 at Z_bs = 0.12!2.
eApparent column density integrated from -110 to 210 km s-1. For
undetected lines, 4_r upper limits are derived from the upper limits on
Wr using the linear portion of the curve of growth.
dSaturated absorption line.
eWeighted mean of individual measurements from the observations
with the LiFlb and LiF2a detectors on 1999 October 17 and 2000 July
24.
f Weighted mean of individual measurements from the observations
with the LiFlb and LiF2a detectors on 1999 October 17 and the LiF2a
detector on 2000 July 24. The LiFlb spectrum from 2000 July 24 was
adversely affected by the vertical stray light "stripe" (Sahnow et al.
2000) and is too noisy to provide a useful measurement.
g4_r upper limit.
abased on the LiF2a spectrum from 2000 July 24 only.

Table2. ComponentParametersOftheLya andLyfl AbsorptionLinesat z = 0.1212 a
Redshift b v ¢ b (kin s -1) log N
0.11961 -425 35±9 13.14+0.04
0.12053 -179 23+_ 5 12.71±0.08
0.12112 -21 26 +13 13.93±0.37--9
0.12125 13 40+_ 14.04+0.360.12147 72 _K+37 13.78±0.17
vv_26
0.12221 270 38+9 13.22±0.04
aBased on simultaneous profile fitting of "
the Lya and Ly/3 lines with the software of
Fitzpatrick & Spitzer (1997) and the STIS
E140M line spread functions from the STIS
Instrument Handbook. The FUSE LSF was
taken to be a Gauss±an with FWHM _ 20 km
S -1 "
bHeliocentric redshift; the conversion from
a heliocentric velocity scale to the Local
Standard of Rest velocity scale is given by
VLSR : _3helio -_- 16 km s-] assuming the Sun
is moving in the direction 1 = 56 °, b = 23 ° at
19.5 km s -1 (Kerr & Lynden-Bel] 1986).
¢Component velocity centroid in the rest
frame of the absorption system where v = 0
km s-1 at Zabs = 0.1212.

-10-
the1999observationswith theoneusefulLiFchannel(LiF2)fromthe2000observations.Wenotehat themeasurementsfromtheindividualchannelsareConsistentwithintheir 1oruncertainties.
SinceOVI hasaresonance-linedoublet,its absorptionlinescanusuallybeunambiguouslyidentified.Unfortunately,theweaker1038tt lineof theOVI doubletat Zab s = 0.1212 in the spectrum of H1821+643
is strongly blended with the Ly0_ line from the absorption system at Zab s _--- 0.225, which may lead some
readers to question the reliability of the identification of the stronger O VI M032 line shown in Figure i.
However, since the Ly5 line is not strongly saturated, we should be able to demonstrate that the 1038 ,_
line is present if the S/N is sufficient, and indeed we do find evidence of the 1038/_ line at the expected
wavelength and strength. Figure 2 shows this evidence. This figure shows the continuum-normalized,
coadded O VI profiles. A single-component fit to the O VI ,k1032 line only is shown with a dashed line
overplotted on the 1032 A profile (upper histogram). The velocity, column density, and Doppler parameter
from this fit predict a 1038 _ absorption line shown with a dashed line shown overplotted on the lower
histogram in Figure 2. Absorption is clearly present in the lower profile at the expected velocity with the
expected strength. This gives us confidence that the O VI identification is correct.
4. Physical Conditions and Metallicity
In this section we explore the implications of the absorption-line measurements regarding the ionization
and metallicity of the gas. We first consider colIisional ionization, and then we examine photoionization.
Before assessing the ionization mechanism, we comment on several interesting features of this absorber:
1. The O VI absorption occurs at a redshift where there is a cluster of Lya absorption lines; at least five
Lya lines are present within a velocity interval of _700 km s-1 (see Figures 1 and 3).
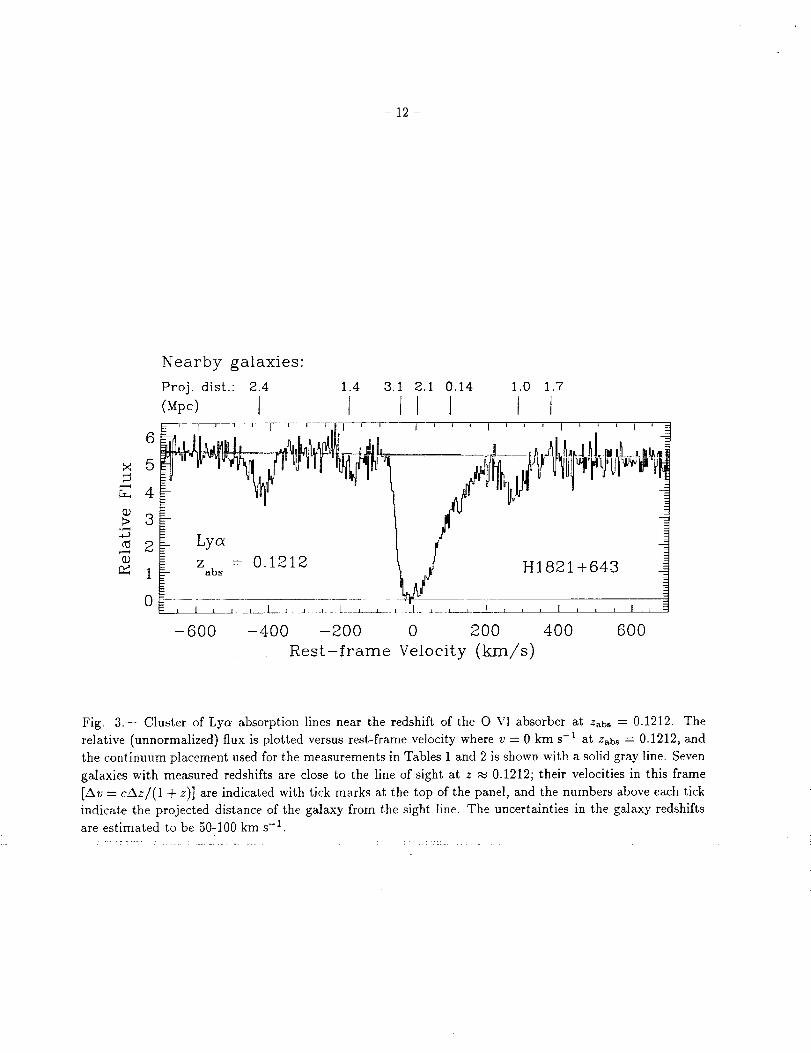
2. Furthermore, there are several galaxies within -t-500 km s -1 of this redshift with projected distances
from the sight line ranging from 144 hT_ kpc to 3.1 Mpc (see Tripp et al. 1998). Figure 3 shows the
velocities and projected distances of these galaxies with respect to the Lya absorption lines [Tripp et
al. (1998) estimate that the galaxy redshiff uncertainties are ,-- 50 - 100 km s-lJ. As noted in §1, the
closest galaxy has an emission line spectrum which suggests that it is actively forming stars.
3. In addition to an ordinary, mildly saturated narrow line, the main Lya profile appears to contain arelatively broad component at v = 72 km s-1 with b _ 85 km S"1 (see Table 2; this broad component
is shown with a heavy dashed line in Figure 1). This implies an upper limit on the temperature of
the gas at this v: T <_ rnb2/2k = 4.3 x 10⁵ K. Therefore this absorption could arise in the warm/hot,
shock-heated phas e predicted by cosmoi0g_cal simulations. This is an upper limit because the profile
could be broadened by factors other than thermal motions such as turbulence, multiple blended
components, or expansion of the Universe. If the broadening is predominantly due to cosmological
expansion, then the implied pathlength l through the absorber is given by Av _ 15.0 km s -1 (l/200
kpc)hTs. Taking Av _ FWHM = 142 km s-1 for the broad H I component, we obtain l N 1.9 h_
Mpc in this case.
4. The O VI absorption is not aligned with the strongest portion of the H I profile (i.e., the saturated
component at v _-. 0 km s-t). Rather, the O VI is reasonably well-aligned with the broad H I
component at v = 72 km s -1.9 The 0 VI line is also apparently broad; the profile fit shown in Figure 2
9Oegerte et al. (2000) suggested that the H I Ly_ and O VI centroids were offset but could not be sure of the magnitude of
r
L •
-ti-
X
(DN
Oz
0
t ' ' I * ' 1 ' ' ' I * ' ' I '
0 VI k1032 ]
0 VI k1038 1
1----LH i = 0.2251_z I , L , I , L , I _ , ,, L _ , , I ,
-400 -200 0 200 400
Rest-frame Velocity (kin/s)
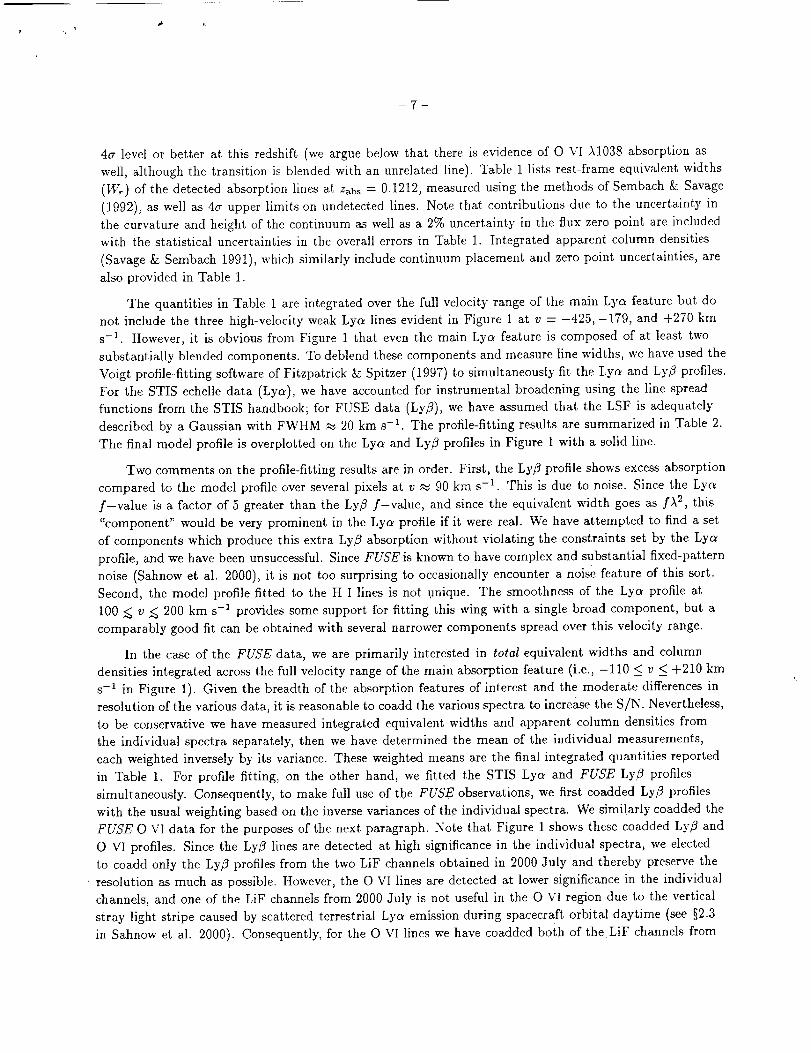
Fig. 2.-- Continuum-normalized absorption profile of the O VIA 1032 line at Zabs -- 0. ] 212 (upper histogram),
and the spectral region where the corresponding O VI A] 038 line is expected (lower histogram), both plotted
versus rest-frame velocity where v = 0 km s -1 at Z_bs = 0.1212. Both profiles are derived from the coadded
data from different channels and observation dates (see text). The O VI )`1038 line is strongly blended with
a Ly5 line at Zabs = 0.225. Nevertheless, there is evidence that the O VI )`1038 line is present. The dashed
line overplotted on the ),1032 profile shows the result of a single-component fit to the 1032 /_ line only.
The velocity, Doppler parameter, and column density from this fit were used to predict the strength of the
corresponding (blended))`1038 transition, and the predicted 1038 _. line is overplotted with a dashed line on
the lower profile. An absorption feature with the predicted velocity, stength, and width is readily apparent.
-12-
6
x 5
a_ 4
(D> 3
.+.9
0_ 2(D
0
Nearby galaxies
Proj. dist." 2.4 1.4 3.1 2.1 0.14 1.0 1.7
li i-600 -400 -200 0 200 400 600
Rest-frame Velocity (kin/s)
Fig. 3.-- Cluster of Lya absorption lines near the redshift of the O VI absorber at Zab s : 0.1212. The
relative (unnormalized) flux is plotted versus rest-frame velocity where v = 0 km s -1 at Z_bs = 0.1212, and
the continuum placement used for the measurements in Tables 1 and 2 is shown with a solid gray line. Seven
galaxies with measured redshifts are close to the line of sight at z _ 0.1212; their velocities in this frame
lay = cAz/(1 + z)] are indicated with tick marks at the top of the panel, and the numbers above each tick
indicate the projected distance 0f the galaxy from the sight line. The uncertainties in the galaxy redshifts
are estimated to be 50-100 km s-1.
-13-
hasb - 59 +3° km s- 1. This would imply a high temperature if entirely due to thermal motions and-20
may be evidence of another source of broadening (see below). The upper limit on the temperature of
theOVIgasforb=59kms -lisT_3.3× 106K.
5. As noted above, no metals apart from O VI are significantly detected despite coverage of very strong
resonance transitions of abundant elements (e.g., C II )d334, C III A977, and Si III A1206). There is
a marginal feature near the expected wavelength of C IV A1548 (see Figure 1), but its significance is
less than 3_ and no feature is evident at the expected wavelength of C IV )d550. Consequently, we
use the 4cr upper limit on C IV for all purposes of this paper, and we obtain N(O VI)/N(C IV) _> 3.0.
4.1. Collisional Ionization
Can collisional ionization produce the observed properties of this O VI absorber? In collisionally
ionized gas in equilibrium (we briefly discuss non-equilibrium models at the end of §4.2), the O VI ionization
fraction is max_mlzed at T _ 300,000 K (Sutherland L: Dopita 1993). The H I ion fraction is small at
such temperatures, but nevertheless, by virtue Of the great abundance of hydrogen, H I Lya absorption
associated with hot O VI should be detectablel Therefore H I absorption lines which are rather broad due
to thermal motions are expected to arise in the warm/hot IGM discussed by Cen & Ostriker (1999a), and
the broad H I and O VI lines shown in Figure 1 seem to provide promising evidence for the warm/hot gas.
Does this hold up under scrutiny? The temperature implied by the apparent breadth of the H I component
aligned with the O VI is about right for collisional ionization. The lower limit on the O VI/C IV ratio
provides a lower limit on the temperature: assuming the gas is in equilibrium, we find from the calculations
of Sutherland _ Dopita (1993) that N(O VI)/N(C IV) _> 3.0 requires T >_ 10S3 K. Combined with the
temperature upper limit from the broad H I component, we have 105.3 _< T _< 10 _6 K.
As noted above, the single-component O VI fit shown in Figure 2 implies T < 3.3 × 10⁶ K. While it is
possible to detect trace O VI absorption in gas with T _ 106 K, the corresponding H I absorption would be
quite broad and inconsistent with the observed Lya profile. It seems more likely that the O VI is at least
partially broadened by non-thermal motions or multiple components. This non-thermal broadening would
affect associated H I as well but would not preclude substantial thermal.broadening in the H ! profile. For
example, if we assume that the broad H I and O VI absorption lines arise in the same gas and that the
non-thermal motions can be adequately described by a Gaussian profile, then we can express the b-value
as b 2 --- b2t -t- 2kT/m and solve for T and bnt, the contribution from non-thermal motions. With b(H I) = 85
km s-I and b(O VI) = 59 km s -1, we obtain in this way T = 2.4 × 10³ K and bnt --- 57 km s-1.
The ionization mechanism can also be usefully tested by considering the metallicity required by the
model - a model which requires an excessively high metallicity may be unrealistic. We estimate the gas
metallicity as follows. Using the usual logarithmic notation, [O/H] = log(O/H) - log(O/H)e, the oxygen
abundance can be expressed as.
(N(O VI) ( f(H I)[O] :log, _((H-_)) +l°g \/-_-V_)) -l°g (O) o (1)
the offset because of problems with the wavelength scale in the early FUSE data. These problems have been rectified, and the
offset is now reliably determined.

- 14-
where f is the ion fraction and (O/H)o is the solar oxygen abundance. 10 Since N(O VI) and N(H I) are
measured quantities and (O/H)o is fixed, [O/H] can be estimated by using an ionization model to estimate
f(H I)/f(O VI).
Assuming the broad H I component shown in Figure 1 originates in the same gas as the O VI
absorption, we have log N(H I) = 13.78 and log N(O VI) = 14.02 from Tables 1 and 2. Then, taking
f(H I)/f(O VI) vs. T from Sutherland & Dopita (1993), we derive from equation 1 the oxygen abundance
as a function of T required to match the measured N(H I) and N(O VI). This is shown in Figure 4. The
lower limit on the temperature from N(O VI)/N(C IV) and the Upper limit on T from the H I line width
are also indicated in Figure 4; the hatched gray regions are not consistent with these constraints. From this
figure, we see that within the temperature limits, the observed column densities can be reproduced in gas
with -1.8 E [O/HI E -0.6, i.e., 0.02 - 0.25 solar metallicity.
This allowed range of metallieities is in reasonable agreement with theoretical expectations for
intergalactic gas. For example, the study of IGM metal enrichment by Cen& Ostriker (1999b) indicates
that this range of metallicity could arise in regions with a wide range of overdensity 6 = p� < p > (see the
z = 0 curve in their Figure 2), and Z k, 0.1 Z o would not be surprising given the H I column density of the
absorber studied here. The models of Aguirre et al. (2001), which use various semi-analytic prescriptions to
explore how metals might be distributed within a previously computed hydrodynamic simulation, predict
somewhat lower mean metallicities at z = 0. The mean metallicity is somewhat less than 0.02 solar for
6 < 100 in their supernova-driven wind models, for example. However, their calculation only includes
enrichment from galaxies with baryonic mass > 3 x 101° Mo, and inclusion of smaller galaxies could increase
the metallicity by a factor of a few. Furthermore, since this is a mean metallicity, there are certainly higher
metallicity regions in the models, and some of these are likely to be consistent with the requirements derived
above for the Zab s = 0.1212 absorber. Of course, it is possible that this absorber does not originate in a
particularly low overdensity region - the presence of several galaxies close to the absorber redshift suggests
that this absorber may be due to gas within a galaxy group, or at least a somewhat overdense filament.
However, the metallicity range shown in Figure 4 is reasonable in this scenario as well: X-ray observations
(e.g., Davis, Mulchaey, & Mushotzky 1999; Hwang et al. 1999) of galaxy groups indicate that the intragroup
medium metallicity is consistent with the upper portion of the range derived for this absorber.
The H I and O VI absorption line kinematics are intriguing in the context of collisional ionization. The
juxtaposition of a relatively narrow H I component at v _ 0 km s -1 with a broad H I + O VI component
separated by ,-,75 km s -_ is suggestive of shock-heating in two colliding clouds, with the O VI and broad H I
arising in the post-shock gas. If we estimate the shock velocity by scaling the apparent velocity separation
of the components by v_ (to account for projection effects), we estimate that two clouds colliding at a
velocity Vs = v_ x 75 km s-1 = 130 km s -1 would be shock-heated to T _ 2.3 x l0 s K, assuming a standard
shock n with specific heat ratio 7 = 5/3. This temperature, shown with a vertical dotted line in Figure 4,
is consistent with the temperature constraints derived above) 2
1°Throughout this paper we adopt the solar abundances reported by Grevesse & Anders (1989) and Grevesse & Noels (1993).These reference abundances have been widely used in recent literature- However, use of the recent revisions of the solar oxygen
abundance (Holweger 2001; Allende Prieto et al. 2001; see also Sofia & Meyer 2001) increases [O/HI by ,,, 0.1 - 0.2dex.
l_For a standard shock with _ = 5/3, the mean post-shock temperature is given by Ts = 1.38 x lOS(vs/lO0 km s-Z) 2 K (see,
e. g., McKee & Hollenbach 1980; Draine & McKee 1993).
12If the scale factor to correct for projection effects is less than v'_, then Ts could drop below the lower limit on the gas
temperature set by N(O VI)/N(C IV). However, the component of the shock velocity which is projected onto the line-of-sight

-15-
O
Fig. 4.-- Thelogarithmicoxygenabundance[O/H]requiredto producetheobservedOVI andH I column
densities in the broad component of the absorber at Z_bs = 0.1212, assuming the gas is collisionally ionized
and in equilibrium, as a function of temperature (solid line). This follows from the O VI and H I ionization
fractions vs. T (from Sutherland & Dopita 1993) and equation 1. The gray regions of the plot indicate regions
which are not allowed by other constraints; the lower limit on T is set by the lower limit on N(O VI)/N(C IV),
and the upper limit on T is set by the b-value of the broad H I component associated with the O VI
absorption. The vertical dotted line indicates the mean post-shock temperature for a standard shock with
vs = 130kms-1.

-16-
Summarizingthissection,wefind that theobservedpropertiesof thisabsorbercanbeproducedby collisionallyionizedgasin equilibriumwith 5.3_<logT _< 5.6 and -1.8 _< [O/H] < -0.6. These
properties are consistent with expectations for the IGM as well as the intragroup medium in galaxy groups.
Equilibrium collisional ionization is evidently a viable ionization mechanism for this absorber.
4.2. Photoionization
Is photoionization also viable for this absorber? To address this question we have constructed standard
models with the photoionization code CLOUDY (Ferland et al. 1998). The models adopt the usual
assumptions: the absorber has constant density and the geometry is plane-parallel, the gas is photoionized
by the UV background from QSOs and AGNs at z _ 0.12 as calculated by Haardt & Madau (1996)] 3
and the mean intensity at 1 Rydberg is set to J,(LL) = 1 x 10⁻²a ergs s -I cm -2 Hz -t sr -1, a value in
reasonable agreement with observations (e.g., Kulkarni & Fall 1993; Maloney 1993; Vogel et al. 1995;
Donahue, Aldering, & Stocke 1995; Tumlinson et al. 1999; Davd & Tripp 2001) and theoretical predictions
(e.g., Haardt & Madau 1996; Fardal, Giroux, & Shull 1998; Davd et al. 1999; Shull et al. 1999b). With
these assumptions, we varied the gas metallicity and ionization parameter U (= n.r/nH = ionizing photon
density/total hydrogen number density) to find the parameter ranges consistent with the observed O VI
and H l column densities in the broad component and the upper limits in Table 1. Note that since
J_, (LL) is fixed at an assumed value, varying U is tantamount to varying nil. Since the photoionization
model computes the H ion fraction, once U is constrained, the total H column density and thickness (or
pathlength) of the absorber are also constrained.
The results of the photoi0nization models are shown in Figure 5 where we have used the f(O VI) and
f(H I) from the ph0toionization code to derive [O/HI vs. log U using equation 1. From the measurements
available in Table 1, we find that the lower limit on N(O VI)/N(C IV) is the most useful for constraining
the ionization parameter; from this ratio we derive log U _> -1.20. A rough upper limit on U is provided
by the required pathlength through the absorber. If the pathlength is too large, the lines would be broader
than the observed lines due to cosmological expansion. Using the rough upper limit on I derived in §4, we
find log U N -0.6. As before, the gray hatching in Figure 5 indicates regions which are not consistent with
these constraints. From this figure, we see that the observational constraints are satisfied if- 1.i _< [O/H]
-0.3 and 85 _< l £ 1900 kpc. To derive these metallicities, we have assumed log N(H I) = 13.78 from the
broad component fit shown in Figure 1. In the photoionized scenario, the H 1 Lya absorption line arising
in the O Vl gas could be substantially narrower, and this would lead to a lower H I column density. This,
in turn, would require an even higher oxygen abundance to produce the observed N(O Vl) [see eqn. 1].
However, log N(I-I I) = 13.78 is likely a reasonable upper limit in this case, and therefore these models
provide lower limits on the metallicity if the gas is photoionized.
The physical properties implied by the photoionization models are reasonable. For example, Schaye
(200i) has analytically derived expressions for the density and size of Lyc_ absorbers, assuming only that
the gas is photoionized and in local hydrostatic equilibrium. Using his equations (8) and (12), and assuming
the gas temperature T _ 104K, the H I photoionization rate F .-- 10 -133 s -1, and the fraction of the mass in
could also be larger than 75 km s -1, which would offset this effect. The point here is that the observed absorption lines have
approximately the right velocities to produce O VI in a shock.
13We have also computed models using the UV background calculated by Shull et al. (1999b), and we obtain very similar
results.

-17-
Ot.....J
-6.004000
3OOO
2000
1000
o"
o
o"
[rQ
W
oV
Fig. 5.-- The logarithmic oxygen abundance [O/HI (solid line) required to produce the observed 0 VI
and H I column densities in the broad component of the absorber at Z_bs = 0.1212, assuming the gas is
photoionized by the UV background from QSOs, as a function of the ionization parameter (bottom axis)
and the total H density (top axis) for J_(H I) = 1 x 10 -23 ergs s -1 cm -_ Hz -_ sr -_. The the O VI and H I
ionization fractions vs. log U were calculated with CLOUDY (see text). The dashed line shows the required
pathlength through the absorber vs. log U using the scale on the right axis.

-18-
gasfg ,-, 0.2, we obtain log nH _ -5.6 and / _ 300 kpc for log N(H I) < 13.78. These properties are entirely
consistent with the properties inferred from the CLOUDY models (see Figure 5). Perhaps the most serious
concern about these photoionization models is that the IGM must be substantially and uniformly enriched
with metals over a long pathlength. This problem is less severe at higher metallicities because the required
pathlengths are smaller. However, the minimum absorber thickness (set by the lower limit on U from
0 VI/C IV) is 85 kpc for [O/Hi -- -0.3. Some QSO absorbers have been observed which apparently have
very low metallicities (e.g., Shull et a]. !999a), so the IGM has not been generally enriched to this level, but
the system of this paper could arise in a more metal-rich region. As noted above, the mean metallicities
predicted by simulations (e.g., Cen _ Ostriker 1999b; Aguirre et al. 2001) are only marginally consistent
with such a high metallicity, but again this could be a particularly; high Z region. Cen & Bryan (2001) have
argued that. most of the metals in the diffuse, low-density intergalactic gas are provided by small galaxies
(M < ]09M®) and are injected into the IGM at z > 4. Because larger galaxies which form later do not
widely disperse their metals, Cen & Bryan expect that low-z, low column density Ly_ clouds will have low
metallicities. A similar picture has been favored by Heckman et al. (2000) based on the observed properties
of supernova-driven "superwinds" from low-z starburst galaxies and high-z Lyman-break galaxies (Pettini
et al. 2001). Heckman et al. argue that metals injected into the IGM via superwinds, primarily from the
lower-mass galaxies, could increase the IGM metallicity to _1/6 solar metallicity in the intracluster medium
as well as the general IGM. However, in most supernova-wind enrichment scenarios, the O V! gas should be
predominantly collisionally ionized. Radiation-pressure driven outflows of dust from galaxies (e.g., Aguirre
et al. 2001) could transport heavy elements more gently.
It is interesting to note that Savage et al. (2001) have identified an intervening O VI absorber at Zab_
= 0.06807 in the spectrum of PG0953+415 which is apparently well-explained by photoionization. In this
case, H I, C III, C IV, and N V are also detected and are well-aligned with the O VI, and all of the column
densities are reasonably matched by a photoionization model, albeit with a somewhat uncomfortably high
metallicity/pathlength combination. Perhaps more importantly, the H I Lya. and Ly_ lines associated with
the O VI are narrow and appear to be composed of only one component, and the upper limit on T from
the width of the H I lines is T < 4.1 x 10⁴ K. This precludes collisional ionization, at least in equilibrium,
unless the H I arises in a different phase from the O VI. A similar situation is found for the O VI system
studied by Tripp & Savage (2000), although in this case it is possible to hide a broad component in the
complicated Lya profile, assuming the absorber is a multiphase medium (see their Figure 6). While these
examples would seem to strongly favor photoionization, it is also possible that they represent cases where
the gas was shock-heated to ,-, 106 K and then cooled more rapidly than it could recombine, as discussed
by various authors (e.g., Edgar _ Chevalier 1986). Table 4 in Tripp _z Savage (2000) summarizes high ion
ratios predicted by four non-equilibrium collisional ionization models. Comparison of the high ion column
densities measured in this paper to that table shows that most non-equilibrium collisional ionization models
satisfy the observational constraints. Of course, in this hypothesis, the substantial breadth of the H l profile
would be unexpected, and some other broadening mechanism would need to be invoked. This could simply
be the kinematics of the gas, e.g., in a galactic wind.
4.3. X-ray Absorption Lines
In principle, one promising means to break the collisional ionization/photoionization degeneracy is
to search for X-ray absorption lines, primarily the resonance transitions of O VII and O VIII at 574 eV
and 654 eV, respectively (21.6 and 19.0 A). Several groups have discussed various aspects of the use of
- 19-
theselinesandtheirdetectionwithcurrentX-rayfacilities(Shapiro& Bahcall1980;Aldcroftet al. (1994);Hellsten,Gnedin, & Miralda-Escud@ 1998; Perna & Loeb 1998; Fang & Canizares 2000; Fang et al. 2001).
A complete summary of this literature is beyond the scope of this paper, but we note that the first attempt
to detect these absorption lines in the diffuse IGM (with the Chandra High Energy Transmission Grating
Spectrometer) has yielded upper limits of N(O VIII) £ 1017 cm -2 (Fang et al. 2001).
Given this rough guideline for detection capabilities with current X-ray telescopes, can we hope to
determine the ionization mechanism of these O VI absorbers by searching for the corresponding X-ray
absorption lines at the same redshifts? To explore this question, we show the O VI/O VII, O VI/O VIII, and
O VII/O VIII column density ratios predicted for collisionally ionized gas (in equlibrium) and photoionized
gas in Figures 6a and 6b, respectively, for the expected ranges of T and U. The ratios for collisionally
ionized gas are based on the calculations of Sutherland & Dopita (1993). The ratios for photoionized gas
are from the CLOUDY models described in §4.2. Equilibrium collisional ionization and photoionization
clearly have different signatures in these ratios. For example, the O VI/O VII ratio has a much broader
range in collisionally ionized gas than in photoionized gas: given the temperature and ionization parameter
constraints derived in §4 for the particular absorber of this paper, the models predi& -1 E log (O VI/O VII)
1 for collisionally ionized gas and log (O VI/O VII) _ 0 for photoionized gas. Furthermore, if log
(O VI/O VII) _ 0, then the O VIII line can distinguish between the two models because in this situation
the O VI/O VIII ratio is much larger in the collisionally ionized model than the photoionized model. I4
While Figure 6 demonstrates the potential of X-ray observations, it unfortunately also shows that for the
O VI system studied here, the O VII and O VIII lines are predicted to have column densities well below 10 ]7
cm -2 and therefore may be difficult or impossible to detect with current instruments. X-ray observations of
other absorbers with larger O VI column densities may be more illuminating. However, if the O VI column
density is too much larger, then the O VI lines will saturate making N(O VI) difficult to reliably measure.
It seems that it will be difficult to study O VI, O VII, and O VIII absorption arising from the same gas. If
the higher oxygen ions were detected at the redshift of one of the H1821+643 O VI systems, this would
likely indicate the presence of multiphase gas with the O VII and O VIII revealing a more highly ionized
phase containing little O VI.
This discussion has several caveats. First, we have assumed that either collisional ionization or
photoionization dominates. In fact, both ionization mechanisms may contribute. Hellsten et al. (1998)
argue that photoionization by the X-ray background dominates in the production of O VII and O VIII,
even if the gas has a temperature of 10 s - 107 K, but this depends on the density of the gas. The O VI
might also be produced by the combined effects of collisional and photoionization. Second, the gas is
assumed to be in ionization equilibrium. We have already noted that this assumption might not hold for
collisionally ionized gas. Photoionized O VI is Iikely to be in equilibrium, but O VII and O VIII produced
by photoionization might be out of equilibrium because the ionization time scales are comparable to the
Hubble time (see, e.g., Hellsten et al. 1998). Again, it would be valuable to evaulate the ratios predicted for
these ions in non-equilibrium models as well. Finally, the intensity of the X-ray background is uncertain. A
full assessment of these issues is beyond the scope of this paper.
14Along these lines we note that in general, the O VII and 0 VIII lines without the O VI constraint may not be able to
distinguish between colllsional ionization and photolonlzatlon because the dotted lines in Figure 6 are degenerate, and the
resolution of current X-ray spectrometers is not sufficient to constrain the temperature of the gas based on line widths.

- 20 -
2
o
¢E
0
OrD
o
-2
-8
l
I
l
l
l
0 VI/0 VIII _I
(a)
• 0 VII/0 VIII
l
l
l
l
I
l
\0 VI/0 VII
\
\\
\
Equilibrium collisional ionizhtion
5.5 6 6.5
log W (K)
2
o.,==q
..).=)
0
--10
U
t_0
-2
' ' ' I ' ' ' I ' I
.... (b)
_'_'_'""*'_':_-_:. 0 VII/O VIII
*_ ,_ "*-....o
- 0 vI/o viii "--..
Photoionization
-1.2 -1 -0.8 -0.6 -0.4
log U
Fig. 61" Logarithmic column density ratios predicted for O VI/O VII (solid line), O VI/O VIII (dashed
line), and 0 VlI/O VIII (dotted line) for (a) collisionally ionized gas in equilibrium, and (b) gas photoionized
by the UV background from QSOs. The ratios in the collisionally ionized case are plotted vs. log T, while
the photoionized gas ratios are shown vs. log of the ionization parameter.
-21 -
5. Summaryand Discussion
High-resolutionSTISandFUSE UV spectra of H1821+643 reveal that the absorption system at
Z_bs = 0.1212 has a number of interesting properties including (1) detection of O VI and H I absorption
without significant detection of any other species, (2) complex H I absorption including an apparently
broad component with b _ 85 km s-1 that is aligned with the O VI absorption, and (3) association with
one or more galaxies close to the sight line. Using constraints from these spectra, we have examined the
ionization mechanism in this absorber. We find that equilibrium collisional ionization is viable with 5.3 <
log T _< 5.6 and -1.8 _< [O/H] < -0.6. However, the absorption line properties can also be explained by
photoionization if -1.1 _< [O/H] _< -0.3 and 85 _< l _ 1900 kpc. In addition, it is possible that the gas is
collisionally ionized but is not in equilibrium (e.g., Edgar & Chevalier 1986).
There are a number of possible sites in which O VI absorption lines could arise in the spectra of
low-z QSOs. In some cases, O VI absorption likely occurs in the immediate environment of the QSO itself
(e.g., Savage et al. 1998; Papovich et al. 2000; Ganguly et al. 2001, and references therein). The large
displacement from the QSO redshift and the close association with galaxies near the line of sight indicates
that the absorber studied in this paper is not in this class. Rather, it is an intervening absorber. However,
the detailed nature of the intervening absorption is stillunclear it could occur in the bound ISM of an
individual galaxy, the escaping gas in a galactic wind, the intragroup medium of a galaxy group, or a more
remote region of a large scale structure or the diffuse IGM.
The galactic wind hypothesis is appealing because O VI absorption has been detected in such an outflow
from the nearby starburst galaxy NGC1705 (Heckman et al. 2001). Gas in the temperature range needed to
produce O VI by collisional ionization is predicted in hydrodynamic simulations of starburst galaxy winds
(e.g., Mac Low & Ferrara 1999; Strickland & Stevens 2000). However, unlike the O VI absorber studied in
this paper, the outflow from NGC1705 shows strong absorption lines due to low and intermediate ionization
stages as well as O VI. This absorption by low ions is consistent with the hydrodynamic models in which
the O VI-bearing gas arises in interfaces between cool, denser gas and much hotter gas (see Figure 4c in
Heckman et al. 2001). In this model, low ion absorption occurs in the cool gas, O VI exists in the interface,
and the hotter gas produces X-ray emission. The NGC1705 observations probe the ISM and outflow close
to the central starburst and its host galaxy, but the Z_bs = 0.1212 O VI system is at a substantially larger
projected distance from any galaxy known to be at the absorber redshift. One could speculate that the
character of absorption from a wind is different at larger distances away from the star cluster, but these
winds have not been observationally or theoretically studied at such large impact parameters.
The hypothesis that the absorption occurs in the ISM of a galaxy like the Milky gray suffers similar
criticisms. While O VI is commonly detected in the disk and halo of the Milky Way (Jenkins 1978; Savage
et al. 2000), it would typically be accompanied by absorption from other heavy elements. Galactic high
velocity clouds, including clouds stripped out of satellite galaxies, also frequently show associated O VI
(Sembach et al. 2000), and high velocity clouds have approximately the same metallieity as the absorber
studied in this paper (Wakker et al. 1999; Gibson et al. 2000; Richter et al. 2001). However, a sight line
through such an entity would have a much higher H I column density and again would be expected to bedetected in other ions. 15
Perhaps the most appealing hypothesis is that the Zabs : 0.1212 absorber is due to gas between galaxies
15The particular absorber studied here is only detected in O VI and H I, but other intervening O VI systems have been
detected in other species (Tripp et al. 2000; Chen& Prochaska 2000; Savage et al. 2001).

- 22-
in a group or unvirialized filamentary structure. Diffuse X-ray emission indicating the presence of a hot
intragroup medium has been detected from many galaxy groups (Mulchaey 2000 and references therein),
but mainly groups that are elliptical-rich (Mulehaey et al. 1996a; Zabludoff & Mulchaey 1998). Mulchaey
et al. (1996b) have suggested that spiral-rich galaxy groups also contain hot intragroup gas, but the gas
is not quite hot enough to be detected in X-ray emission (71._ 4 × 10⁶ K). They predict that the O VI
absorption lines should be detectable in such an intragroup medium. It is interesting that the Z_bs absorber
fits this hypothesis in many respects: (1) there are several galaxies near the sight line at this redshift (see
Figure 3), (2) at least one of the galaxies is a spiral/actively star-forming galaxy, and (3) the breadth of the
O VI absorption is considerably larger than expected from thermal motions (§4), which is consistent with
additional broadening due to the velocity dispersion of the group. 16 However, this may not be a bound
group. Given our currently limited information, it is difficult to derive additional information about the
collection of galaxies near this O VI absorber, but we do note that the spatial extent of the ensemble appears
to be larger than that of a typical poor group (c.f., Zabludoff & Mulchaey 1998). It would be valuable to
obtain additional galaxy redshift measurements and high/resolution images for morphological classification.
In §1 we outlined several areas in which additional effort is needed to elucidate the nature of the O VI
systems and their contribution to the baryon budget. The main goal of this paper has been to scrutinize the
ionization mechanism to test the idea that a substantial quantity of shock-heated hot gas is present in the
IGM at the current epoch. We find that the O VI absorber at Z_bs = 0.1212 in the spectrum of H1821+643
has properties consistent with collisionally ionized hot gas such as a broad H I component aligned with
the O VI and a high O VI/C IV ratio. This is encouraging evidence in support of the shock-heated IGM
hypothesis. However, we cannot rule out photoionization or a combination of collisional and photoionization
processes. The degree of IGM metal enrichment required by photoionization exceeds the predictions of some
models, but given our limited understanding of how metals are transported out of galaxies and the variety
of possibilities for the absorption site, this is not sufficient grounds to dismiss photoionization. Analyses of
other low-z O Vl systems (e.g., Tripp & Savage 2000) have reached similar conclusions regarding collisional
vs. photoionization.
Given the general difficulty encountered in attempts to definitively identify the ionization mechanism
in individual systems, it Will be important carry out statistical analyses of O VI absorber samples including
comparisons to various models. For example, Cen et al. (2001) and Fang & Bryan (2001) have recently
predicted the properties of O VI absorbers based on cosmological simulations. The absorber statistics "
predicted by these models [e.g., dN/dz and ftb(O VI)] appear to be in reasonable agreement with current
observations. In these simulations, O VI absorption arises in both collisionally ionized and photoionized gas.
However, the photoionized systems are narrower and have lower equivalent widths than the collisionally
ionized absorbers. Tripp (2002) has recently presented the b-values and column densities of twenty low-z
O VI lines observed with STIS and FUSE (see his Figure 5). It is interesting to note that while there are a
few apparently narrow O VI lines in the observations compiled by Tripp (2002), the majority of the O VI
lines in that sample have b-values consistent with an origin in hot gas. The b-value of an O VI line in gas
at T _ 300,000 K is "-.18 km s-1, and the median b-value of the observed sample is 22 km s -1. In addition,
the apparently narrow O VI lines tend to be weaker systems as well, as predicted by the simulations. These
preliminary results appear to be fully consistent with the cosmological simulations. We look forward to
similar analyses using larger observational samples and a variety of models.
18The typical velocity dispersion of a spiral-rich group is .o 100 km s -1 (Mulchaey et al. 1996b).

- 23 -
We thank Anthony Aguirre and Joop Schaye for helpful discussions and comments. This research
has made use of software developed by the STIS Team for the reduction of STIS data, and we thank the
STIS Team for access to this software. The coding of the Robertson optimal extraction was carried out
by Bob Hill, and we greatly appreciate this effort. We acknowledge support from NASA through grants
GO-08165.01-97A and GO-08182.01-98A from the Space Telescope Science Institute as well as NASA
Astrophysical Theory grant NAG5-7262. This work is also based on data obtained for the Guaranteed
Time Team by the NASA-CNES-CSA FUSE mission operated by the Johns Hopkins University. Financial
support to US participants has been provided by NASA contract NAS5-32985.
REFERENCES
Aguirre, A., Hernquist, L., Schaye, J., Katz, N., Weinberg, D. H., & Gardner, J. 2001, ApJ, in press (astro-ph/0105065)
Aldcroft, T., Elvis, M., McDowell, J., g: Fiore, F. 1994, ApJ, 437, 584
Allende Prleto, C., Lambert, D. L., & Asplund, M. 2001, ApJ, 556, L63
Bowen, D. V., Pettini, M., & Boyle, B. J. 1998, MNRAS, 297, 239
Bowers, C. A., et al. 2001, in preparation
Brown, T. M., Kimble, R. A., Ferguson, H. C., Gardner, J. P., Collins, N. R., & Hill, R. S. 2000, AJ, 120, 1153
Burles, S., & Tytler, D. 1998, ApJ, 499, 699
Can, R., & Bryan, G. L. 2001, ApJ, 546, L81
Can, R., & Ostriker, J. P. 1999a, ApJ, 514, 1
Can, R., & Ostriker, J. P. 1999b, ApJ, 519, L109
Can, R., Tripp, T. M., Ostriker, J. P., & Jenkins, E. B. 2001, ApJ, in press (astro-ph/0106204)
Chen, H.-W., & Prochaska, J. X. 2000, ApJ, 543, L9
Croft, R. A. C., Di Matteo, T., DayS, R., Hernquist, L., Katz, N., Fardal, M. A., & Weinberg, D. H. 2001, ApJ, 557, 67
Dav_, R., Hernquist, L., Katz, N., & Weinberg, D. H. 1999, ApJ, 511,521
Dave', R., et al. 2001, ApJ, 552,473
Dav_, R., & Tripp, T. M. 2001, ApJ, 553, 528
Davis, D. S., Mulchaey, J. S., & Mushotzky, R. F. 1999, ApJ, 511_ 34
Donahue, M., Alderlng, G., & Stocke, J. T. 1995, ApJ, 450, L45
Draine, B. T., & McKee, C. F. 1993, ARA&A, 31,373
Edgar, R. J., & Chevalier, It. A. 1986, ApJ, 310, L27
Fang, T., & Bryan, G. L., ApJ, submitted
Fang, T., & Canizares, C. R. 2000, ApJ, 539, 532
Fang, T., Marshall, H. L., Bryan, G. L., Canlzares, C. R. 2001, ApJ, 555,356
Fardal, M., Giroux, M. L., g¢ Shull, J. M. 1998, AJ, 115, 2206
Ferland, G. J., Korlsta, K. T., Verner, D. A., Ferguson, J. W., Kingdon, J. B., & Verner, E. M. 1998, PASP, 110, 761
Fitzpatrick, E. L., K: Spltzer, L. 1997, ApJ, 475,623
Fukngita, M., Hogan, C. J., & Peebles, P. J. E. 1998, ApJ, 503,518
Ganguly, R., Bond, N. A., Charlton, J. C., Eracleous, M., Brandt, W. N., & Churchill, C. W. 2001, ApJ, 549, 133
Gibson, B. K., Giroux, M. L., Penton, S. V., Putman, M. E., Stocke, J. T., & Shull, J. M. 2000, A J, 120, 1830
Grevesse, N., & Anders, E. 1989, in AIP Conf. Proc. 183, Cosmic Abundances of Matter, ed. C. J. _Taddlngton (New York:
AIP), I

- 24-
Grevesse,N.,&Noels,A.1993,inOriginandEvolutionoftheElements,ed.N.Prantzos,E.Vangioni-Flam,&M.Cass6
(Cambridge: Cambridge University Press), 15
Haardt, F., & Madau, P. 1996, ApJ, 461, 20
Hamann, F., & Ferland, G. 1999, ARA&A, 37, 487
Heckman, T. M., Lehnert, M. D., Strickland, D. K., & Armus, L. 2000, ApJS, 129,493
Heckman, T. M., Sembach, K. R., Meurer, G. R., Strickland, D. K., Martin, C. L., Calzetti, D., & Leitherer, C. 2001, ApJ,
554, 1021
Hellsten, U., Gnedin, N. Y., & Miralda-Escudd 1998, ApJ, 509, 56
Holweger, H. 2001, in Solar and Galactic Composition, ed. R. F. Wimmer-Schweingruber (Berlin: Springer), in press
Hwang, U., Mushotzky, R. F., Burns, J. O., Fukazawa, Y., & White, R. A. 1999, ApJ, 516, 604
Jenkins, E. B. 1978, ApJ, 219, 845
Kerr, F. J., & Lynden-Bell, D. 1986, MNRAS, 221, 1023
Kimble, B. A., et al. 1998, ApJ, 492, L83
Kulkarni, V. P., & Fall, S. M. 1993, ApJ, 413, L63
Kuntz, K. D., Snowden, S. L., & Mushotzky, R. F. 2001, ApJ, 548, Ll19
Mac Low, M.-M., & Ferrara, A. 1999, ApJ, 513, 142
Maloney, P. 1993, ApJ, 414, 41
McKee, C. F., & Hollenbach, D. J. 1980, ARA&A, 18,219
Moos, H. W., et al. 2000, ApJ, 538, L1
Morton, D. C. 1991, ApJS, 77, 119
Morton, D. C. 2001, in preparation
Mulchaey, J. S. 2000, ARA&A, 38, 289
Mulchaey, J. S., Davis, D. S., Mushotzky, R. F., & Burstein, D. 1996a, ApJ, 456, 80
Mulehaey, J. S., Mushotzky, N. F., Burstein, D., Davls, D. S. 1996b, ApJ, 456, L5
Oegerle, W. R., Tripp, T. M., Sembach, K. R., Jenkins, E. B., Bowen, D. V., Cowie, L. L., Green, R. F., Kruk, J. W., Savage,
B. D., Shull, J. M., & York, D. G. 2000, ApJ, 538, L23
Papovich, C., Norman, C., Bowen, D. V., Heckman, T., Savaglio, S., Koekemoer, A. M., & Blades, J. C. 2000, ApJ, 531,654
Penton, S. V., Shull, J. M., & Stocke, J. T. 2000, ApJ, 544, 150
Perna, P., & Loeb, A. 1998, ApJ, 503, L135
Pettlnl, M., Shapley, A. E., Steidel, C. C., Cuby, J.-G., Dickinson, M., Moorwood, A. F. M., Adelberger, K. L., & Giavalisco,
M. 2001, ApJ, 554,981
Phillips, L. A., Ostriker, J. P., & Cen, R. 2001, ApJ, 554, L9
Persie, M., & Salucci, P. 1992, MNRAS, 258, 14P
Raueh, M., Miralda-Escudfi, J., Sargent, W.L.W., Barlow, T.A., Hernqulst, L., Weinberg D.H., Katz, N., Cen, R., Ostriker,
J.P. 1997b, ApJ, 489, 7
Richter, P., Sembach, K. N., VCakker, B. P., Savage, B. D., Trlpp, T. M., Murphy, E. B., Kalberla, P. M. W., & Jenkins, E. B.
2001, ApJ, in press (astro-ph/0105466)
Nines, K., Mahdavi, A., Geller, M. J., Diaferio, A., Mohr, J. J., & Wegner, G. 2001, ApJ, 555, 558
Robertson, J. G. 1986, PASP, 98, 2000
Sahnow, D. J., et al. 2000, ApJ, 538, L7
Savage, B. D., et al. 2000, ApJ, 538, L27
Savage, B. D., Sembach, K. R., Tripp, T. M., & Richter, P. 2001, ApJ, submitted
Savage, B. D., & Sembach, K. R. 1991, ApJ, 379, 245
Savage, B. D., Tripp, T. M., & Lu, L. 1998, AJ, 115,436

- 25 -
Scharf, C., Donahue, M., Volt, G. M., Rosati, P., & Postman, M. 2000, 528, L73
Schaye, J. 2001, ApJ, in press (astro- ph/0104272)
Sembach, K. R., et al. 2000, ApJ, 538, L31
Sembach, K. R., & Savage, B. D. 1992, ApJS, 83, 147
Shapiro, P. R., & Bahcall, J. N. 1980, ApJ, 241, 1
Shull, J. M., Penton, S. V., Stocke, J. T., Giroux, M. L., van Gorkom, J. H., Lee, Y. H., & Carilli, C. 1999a, AJ, 116, 2094
Shull, J. M., Roberts, D., Giroux, M. L., Penton, S. V., & Fardal, M. A, 1999b, AJ, 118, 1450
Shull, J. M., Stocke, J. T., & Penton, S. V. 1996, AJ, 111, 72
Sofia, U. J., & Meyer, D. M. 2001, ApJ, 554, L221
Strickland, D. K., & Stevens, I. R. 2000, MNRAS, 314,511
Sutherland, R. S., & Doplta, M. A. 1993, ApJS, 88, 253
Tripp, T. M. 2002, in ASP Conf. Ser. Extragalactic Gas at Low Redshlft, A Workshop in Honor of Ray Weymann, ed. J. S.
Mulchaey & J. Stocke (San Francisco: ASP), in press (astro-ph/0108278)
Tripp, T. M., Lu, L., & Savage, B. D. 1998, ApJ, 508, 200
Tripp, T. M., & Savage, B. D. 2000, ApJ, 542, 42
Trlpp, T. M., Savage, B. D., & Jenkins, E. B. 2000, 534, L1
Tumlinson, J., Giroux, M. L., Shull, J. M., & Stocke, J. T. 1999, AJ, 118, 2148
Verner, D. A., Tytler, D., & Barthel, P. D. 1994, ApJ, 430, 186
Vogel, S., VCeymann, R., Rauch, M., & Hamilton, T. 1995, ApJ, 441,162
Volt, G. M., Evrard, A. E., & Bryan, G. L. 2001, ApJ, 548, L123
_Takker,B. P., et al. 1999, Nature, 402,388
Weinberg, D.H., Hernquist, L., Miralda-Escud_, J., & Katz, N., 1997, ApJ, 490,564
Woodgate, B. E., et al. 1998, PASP, 110, 1183
Zabludoff, A. I., & Mulchaey, J. S. 1998, ApJ, 496, 39
This preprint was prepared with the AAS IPTEX macros v4.0.
Related Documents