Weed Society of Victoria Inc. PROCEEDINGS SECOND VICTORIAN WEED CONFERENCE Smart Weed Control, Managing for Success SPONSORED BY Department of Sustainability and Environment

Welcome message from author
This document is posted to help you gain knowledge. Please leave a comment to let me know what you think about it! Share it to your friends and learn new things together.
Transcript
Weed Society of Victoria Inc.
PROCEEDINGS
SECOND VICTORIAN WEED CONFERENCE
Smart Weed Control, Managing for Success
SPONSORED BY
Department ofSustainabilityand Environment

Blank page
PROCEEDINGS
SECOND VICTORIAN WEED CONFERENCE
Smart Weed Control, Managing for Success
17–18 August 2005
All Seasons International Hotel, Bendigo
Weed Society of Victoria Inc.PO Box 987, Frankston, Victoria 3199Tel/fax 03 9576 2949 Email [email protected] www.wsvic.org.au
SESSION 1 Early detection and responseWeeds in botanic gardens
Roger Spencer 1
Review of Victoria’s noxious weed list John Weiss, Trevor Hunt, Robert Edgar and Tereso Morfe 4
SESSION 2 Integrated weed managementIntegrated Weed Management on a National scale
Rachel E. McFadyen 7
Integrating IWM into crop management plans Ken Young, Karl Schilg, Brad Bennett and Kristin Sutton 9
SESSION 3 Early detection and response (concurrent)Site management strategies for six National Environmental Alert List weed species in Victoria
Michael Hansford 11
What is a weed? John Dwyer 14
Invasive garden plant display at the Melbourne International Flower and Garden Show 2005 Daniel Joubert 18
Nursery people aren’t all environmental pests Robert Chin 21
Sustainable garden centre project Mary Trigger 24
Olives – new industry or environmental threat Michael Laity and Ken Young 25
Aquatic weeds of national significance – coming to a waterway near you! Phil Moran, Andrew Petroeschevsky and Steve Wingrave 30
Operation rapid response – dealing with the potential incursion of branched broomrape (Orobanche ramosa Linnaeus) into Victoria, Australia
David A. McLaren, Kate Blood and Geoff Harvey 32
SESSION 4 Integrated weed management (concurrent)Chilean needle grass (Nassella neesiana) – integrated grazing for success
Charles Grech, Aaron Dodd, David McLaren, David Chapman and Brian M. Sindel 35
Enviromark: a system for integrated weed management along roadsides Christine Corbett 36
Delivering strategic conservation outcomes through the integrated management of bitou bush, a Weed of National Significance
Paul O. Downey and Hillary Cherry 41
Gorse task force Jeanette Bellchambers 46
Weed Warriors – engaging and empowering the community Megan McCarthy and Kate McArthur 48
Evidence based verses community driven Weed Action Plans Leigh Dennis 50
Understanding and managing weed effects on establishment of native tree seedlings in riparian zones Nigel Ainsworth and Fiona Ede 52
CONTENTS

SESSION 5 Successful monitoringMonitoring weed eradication programs and evaluating performance
F. Dane Panetta 55
Using geospatial technologies to map and monitor environmental weeds Jennifer Emeny, Anne Wallis and Dianne Simmons 56
The role of monitoring in weed management: a case study from the Victorian Alps Cathy Allan, Kelly Raymond and Lynise Wearne 63
SESSION 6 Getting technicalMolecular genetic breeding to produce non-GM crops
Jim Kollmorgen, Rebecca Ford, Mohan Singh and Paul Taylor 67
Verification of the factors affecting clodinafop efficacy T.S. Andrews, R.W. Medd, R. van de Ven, and D.I. Pickering 68
Ways to improve pesticide application in Australia through new sprayer technology and adoption of sprayer manufacturing and testing standards
J.H. Combellack 69
SESSION 7 Successful monitoring (concurrent)Weed biological control impact assessment in Victoria: notes on current activities
Tom Morley 79
Taking the wind out of willows: a national focus to willow management in Australia Sarah Holland Clift 83
Using community-based networks for the distribution of biological control agents for Paterson’s curse in Victoria
Kerry L. Roberts and Raelene M. Kwong 87
Regional priority-setting for weed management on public land in Victoria Stephen Platt, Robin Adair, Matt White and Steve Sinclair 89
Machinery hygiene – what is on our vehicles? Michael Moerkerk 99
SESSION 8 Getting technical (concurrent)The National Serrated Tussock Survey – impacts and implications of its resistance to the herbicide flupropanate in Australia
D.A. McLaren, S. Ramasamy, A.C. Lawrie, G. Pritchard and T.A. Morfe 102Applying field-based information tools to weed management – an examination of field information issues in DPIS Landscape Protection Program
Naomi Wilson 106
Robotic weeding in grain crops Malcolm Taylor 113
Weed spread prevention wash down trial Byron Crowe 115
Himalayan honeysuckle control at Mt Buffalo Darin Lynch 117
POSTER SUMMARIESAn insecticidal exclusion method for studying biological control impacts on ragwort (Senecio jacobaea L.)
and Paterson’s curse (Echium plantagineum L.) Thomas B. Morley and Julio C. Bonilla 119
Establishment and dispersal of dock moth Pyropteron doryliformis (Ochsenheimer) (Lepidoptera: Sesiidae) in Victoria Thomas B. Morley, Steven Faulkner and Ian G. Faithfull 119
Gallery 750DF Herbicide tankmixes are safe to trees and vines with effective residual weed control Gregory S. Wells, Gregg Baynon, Nicholas Koch and Peter Nott 120
Spraytopping as a management tool to reduce seed production in Chilean needle grass infestations Shiv Gaur, David McLaren and Kym Butler 121
Ecology of the invasive weed Salvia verbenaca (wild sage) in the rangelands of western New South WalesRobyn Fisher, Martin Westbrooke and Singrayer Florentine 125
Flupropanate resistance in serrated tussock (Nassella trichotoma) in VictoriaS. Noble, G. Pritchard, S.G. Casonato, A.C. Lawrie and D.A. McLaren 125
Weed Society of Victoria Second Victorian Weed Conference ‘Smart Weed Control, Managing for Success’ 17–18 August 2005 1
‘Wonder and India, magic and China’Dylan Thomas
Abstract Botanical gardens must play their part in the global attempt to reduce the impacts of invasive plants. The chal-lenge is to minimise the importation, cultivation and promotion of known or potential weeds. An Australian Botanic Gardens Weed Network (ABGWN) has been formed to combine information and expertise in the formulation of a united approach to weed policy and weed man-agement. The ABGWN is also working with the Cooperative Research Centre for Australian Weed Management to produce a weed risk assessment procedure that can be used by Australian botanic gardens. The paper outlines the context of botanic gardens in relation to weeds, the tension between botanic garden and environmen-tal values, and current progress of the AB-GWN.
ThenThe role of Botanic gardens has changed over the years according to the demands and interests of the day.
Botanic gardens are generally assumed to have originated in the sixteenth century with the Italian gardens of Pisa (est. 1543 but site moved) and Padua (est. 1545) still in existence. These gardens hark back still further to earlier monastery gardens which were laid out formally with a section called a ‘herbularis’ or physic garden for medicinal plants known as the ‘simples’ or ‘officinals’. These plants were studied and dispensed by the resident apothecaries in a time when botany had not yet emerged as a scientific discipline. One major aspect of botanic gardens from this time on has been the fascination with plants from oth-er places. From the sixteenth century on-wards European colonial expansion and exploration gathered momentum and the focus of botanic gardens changed as they became the repositories for the beautiful, curious and new plant trophies that were
being returned from distant lands. In the late sixteenth and early seventeenth cen-turies the plants came from Eastern Eu-rope and nearby Asia. Gardens competed with one-another to have the most excit-ing collections and in the late seventeenth century the Jardin des Plantes in Paris was leading other European gardens with its diversity of collections, notably the new introductions from Canada. In the eight-eenth century novelties came from the Cape of South Africa and the East Indies and plants from warm climates initiated a boom in glasshouse collections. Here we have, presumably, the first stirring of glo-balisation – the opening up of the world to Europe. Scientific endeavour was stim-ulated by the myriad newly discovered organisms brought triumphantly home for description and classification. Botanic gardens began to display systems gardens or ‘order beds’ demonstrating the new plant classification schemes of the day. But the demands of economic botany and ornamental horticulture were not to be distracted as, during the late eighteenth and early nineteenth century, the influx of plant treasures continued. Collection sources included Western North America, South America, the Himalayas, China, East Asia and, of course, the tropics and Oceania, especially Australia, Tasmania and New Zealand1,2,3. Of course it was not long before these countries were setting up their own botanic gardens.
In retrospect we can see clearly how botanic gardens were a significant part of the era of Romanticism. There was the intrepid individualism of the botanical ex-plorers in far-off lands and tales of vast rivers, jungles, strange and fascinating for-eign cultures and customs, and the breath-taking wonders of the natural world to be seen on distant parts of the globe. This was an unattainable world, but everyone was keen to share in the bounty gleaned by the few. The plant kingdom was an excit-ing and unrestricted palette of colours and textures with seemingly infinite variety to
be harnessed for commerce and garden decoration.
NowHow dramatically, profoundly and per-manently our perception of these former times has changed. In those days gardens, both public and private, were seen as rela-tively small and insignificant sanctuar-ies in an almost infinite world ruled by the prodigious and unpredictable forces of nature. Now, in a desperately short space of time, the sad reality is that over much of the globe this situation has com-pletely reversed with nature strongly in retreat under the human invasion. Large areas of encroaching cultivated land sur-round small patches of former wilderness. Distant reaches of the globe are a short flight away in a jet airliner.
The recent Millennium Ecosystem As-sessment22 paints the broad picture: ‘The structure of the world’s ecosys-
tems has changed more rapidly in the second half of the twentieth century than at any time in recorded history, and virtually all the Earth’s ecosystems have now been significantly trans-formed through human actions.
Over the past few hundred years, humans have increased the species ex-tinction rate by as much as 1000 times background rates typical over the plan-et’s history (medium certainty).’
Botanic gardens not only display the plant world in all its glory but also, consciously or not, help mould the public perception of what plants mean. The current dire state of the biosphere is not a sexy message to sell – but it is a story that must be told never-theless, for the sake of future generations. We can both enjoy and protect plants and that must be part of the botanic gardens mantra. And high on the agenda must be the environmental and agricultural dam-age caused by invasive plants.
The environmental costSome general statistics:• In 1930 it is estimated that 10% of the
planet’s primary productivity was di-rected to human needs, mostly food crops: by 2000 this had grown to 40%. In other words, towards half of the plant matter on the planet is now ca-tering for human needs4.
• About 24% of the planet’s land surface is now devoted to agriculture22.
• In Australia 60% of the land surface has been harnessed for agriculture and
Weeds in botanic gardens
Roger Spencer, Royal Botanic Gardens and National Herbarium, Birdwood Terrace, South Yarra, Victoria 3141
SESSION 1Early detection and response
2 Weed Society of Victoria Second Victorian Weed Conference ‘Smart Weed Control, Managing for Success’ 17–18 August 2005
approximately one third of the forests that existed prior to European settle-ment have been cleared for agriculture, forestry and mining6.
Garden plants, naturalised plants and declared weeds• 60–70% of the naturalised plants in Aus-
tralia have escaped from gardens7,8.
• In 1999 the Australian National Weeds Strategy Executive Committee an-nounced a list of 20 weeds of national significance (WoNS). These are consid-ered the most damaging weeds in the country based on their invasiveness, potential for spread, and their socio-economic and environmental impacts: 14 of these plants (70%) are garden es-capes.
• About 40% of Australia’s current de-clared weeds are invasive garden plants8.
Present-day figures indicate that, even with the wisdom of hindsight, we have a long way to go in increasing public aware-ness, and managing potential weeds used in horticulture.• Between 1971 and 1995 about 200 of the
300 newly naturalised plants in Aus-tralia were introduced to the country as ornamentals9.
• About 54% of the currently recognised 720 naturalised invasive garden plants were on sale in nurseries in 20028.
The economic cost• Current estimates suggest that the cost
to Australia’s primary industries in lost production and weed control now ex-ceeds $4 billion p.a.10, 11.
Botanic Gardens nowadays are multifac-eted. There is still an interest in rare, at-tractive and curious plants from around the world so horticultural display is well on the agenda. There is still the process of documentation and ordering to be done by classification botanists in Herbaria, the apothecaries of the twenty-first century, but now there is greater emphasis on the less obvious groups – fungi, algae, lichens and mosses. The public, as always, is ever eager for new excitement and entertain-ment. To give them ‘bang for their buck’ there are the events, new structures and garden displays, shops, cafes, art exhibi-tions, sculpture, theatre, music, education-al activities and so on.
On the environmental front botanic gardens began to tackle conservation is-sues as the environmental movement got underway in the 1960s and 1970s. Con-servation collections of rare or threat-ened plants were established, and botanic gardens became plant havens. But the agenda has changed. As the natural world staggers under the pressures of an ever-increasing human population efforts to slow the process of environmental degra-dation have galvanised around the notion
of sustainability, the attempt to leave the biological world in as good a state as pos-sible for future generations. High on the list of priorities is the devastation caused by biological invasions.
To date botanic gardens have played a relatively small role in the effort to stem invasive plants; regulating their own ac-tivities in relation to weeds has been large-ly informal, the result of expert opinion, which nowadays gets pretty bad press. It is a difficult and controversial area. Out-comes are likely to be regulatory or pro-hibitive and the process will involve time, labour and money – factors that discour-age enthusiastic action.
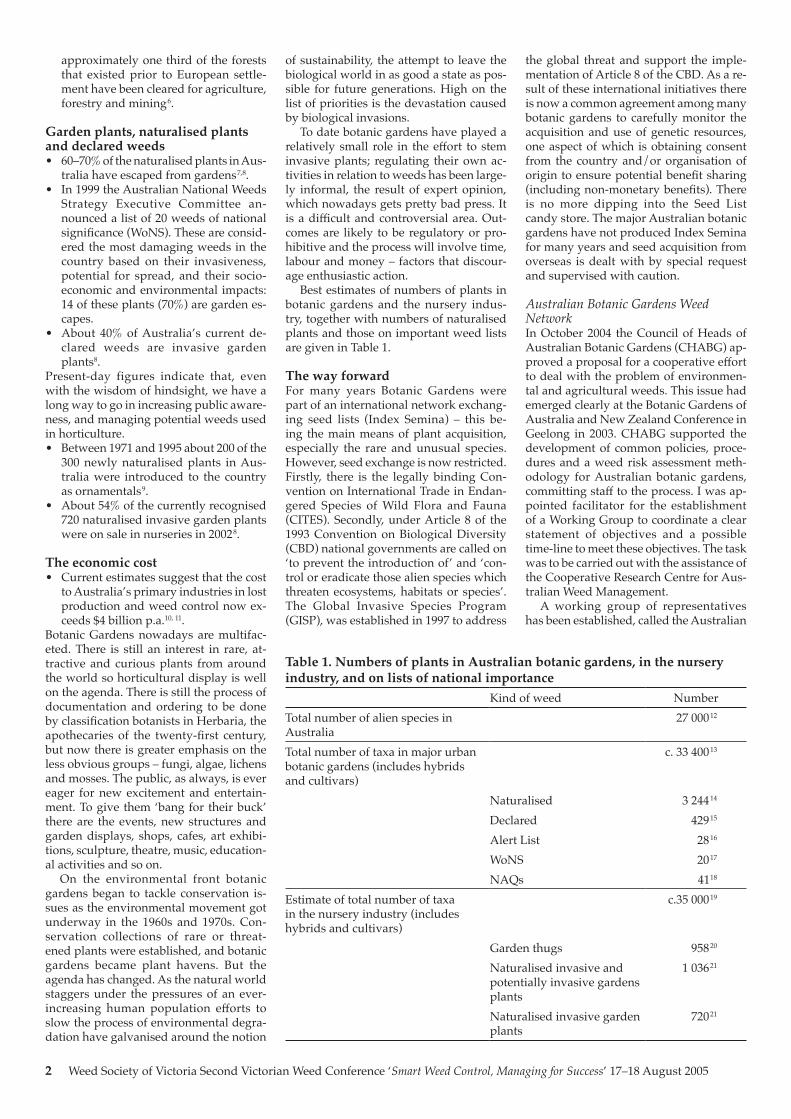
Best estimates of numbers of plants in botanic gardens and the nursery indus-try, together with numbers of naturalised plants and those on important weed lists are given in Table 1.
The way forwardFor many years Botanic Gardens were part of an international network exchang-ing seed lists (Index Semina) – this be-ing the main means of plant acquisition, especially the rare and unusual species. However, seed exchange is now restricted. Firstly, there is the legally binding Con-vention on International Trade in Endan-gered Species of Wild Flora and Fauna (CITES). Secondly, under Article 8 of the 1993 Convention on Biological Diversity (CBD) national governments are called on ‘to prevent the introduction of’ and ‘con-trol or eradicate those alien species which threaten ecosystems, habitats or species’. The Global Invasive Species Program (GISP), was established in 1997 to address
the global threat and support the imple-mentation of Article 8 of the CBD. As a re-sult of these international initiatives there is now a common agreement among many botanic gardens to carefully monitor the acquisition and use of genetic resources, one aspect of which is obtaining consent from the country and/or organisation of origin to ensure potential benefit sharing (including non-monetary benefits). There is no more dipping into the Seed List candy store. The major Australian botanic gardens have not produced Index Semina for many years and seed acquisition from overseas is dealt with by special request and supervised with caution.
Australian Botanic Gardens Weed NetworkIn October 2004 the Council of Heads of Australian Botanic Gardens (CHABG) ap-proved a proposal for a cooperative effort to deal with the problem of environmen-tal and agricultural weeds. This issue had emerged clearly at the Botanic Gardens of Australia and New Zealand Conference in Geelong in 2003. CHABG supported the development of common policies, proce-dures and a weed risk assessment meth-odology for Australian botanic gardens, committing staff to the process. I was ap-pointed facilitator for the establishment of a Working Group to coordinate a clear statement of objectives and a possible time-line to meet these objectives. The task was to be carried out with the assistance of the Cooperative Research Centre for Aus-tralian Weed Management.
A working group of representatives has been established, called the Australian
Table 1. Numbers of plants in Australian botanic gardens, in the nursery industry, and on lists of national importance
Kind of weed NumberTotal number of alien species in Australia
27 00012
Total number of taxa in major urban botanic gardens (includes hybrids and cultivars)
c. 33 40013
Naturalised 3 24414
Declared 42915
Alert List 2816
WoNS 2017
NAQs 4118
Estimate of total number of taxa in the nursery industry (includes hybrids and cultivars)
c.35 00019
Garden thugs 95820
Naturalised invasive and potentially invasive gardens plants
1 03621
Naturalised invasive garden plants
72021
Weed Society of Victoria Second Victorian Weed Conference ‘Smart Weed Control, Managing for Success’ 17–18 August 2005 3
Botanic Gardens Weed Network (ABG-WN). To date the ABGWN has a member-ship of about 75 organisations with rep-resentatives from the major city botanic gardens, the regional botanic gardens of Victoria and New South Wales, and also representation from the zoo community.
The following targets were estab-lished:1. Development of a common Weed Poli-
cy statement2. Establishment of an initial cooperative
sharing of policies, weed procedures, lists, and information resources and ap-proaches to weed risk assessment and weed risk management
3. Development of an effective strategy for the detection and management of weeds in botanic gardens through the use of agreed Weed Risk Assessment and Weed Risk Management Proce-duresAt the time of writing (early July 2005)
Targets 1 and 2 are essentially complete and a combined workshop is due in late July to discuss the way forward with Tar-get 3.
Environmental and botanic garden valuesAustralian Botanic Gardens have a poor reputation in relation to weeds, with blackberry (Rubus spp.) supposedly dis-persed from the Royal Botanic Gardens, Melbourne, and Mimosa pigra from the Darwin Botanic Gardens. A study of those plants originating from botanic gardens and known to be environmental or eco-nomic weeds is yet to be done. Realising I should not pre-empt its conclusions it seems to me that, in most cases, weed dan-gers posed by botanic gardens are more likely to result from the supply of plants to other organisations and people than by their direct escape into the environment.
The difficulties confronting botanic gar-dens will no doubt focus on the tension between environmental values and what may be termed botanic gardens values such as: heritage, education, science and scientific research, conservation, and pub-lic landscape. Botanic gardens also often enjoy good relations with the nursery in-dustry. It is not difficult to think of exam-ples in each of these areas where specific cases are likely to test our weed risk as-sessment methodology to its limits. Here are a few examples.
Botanic gardens have traditionally dis-played a wide range of plant diversity: this not only serves science and a natural human curiosity about the plant kingdom but also has a valuable educational func-tion.
Several of the major botanic gardens are cultural landscapes of such signifi-cance that they have been placed on the National Register and are therefore sub-ject to heritage planning legislation. These
landscapes contain trees of historical sig-nificance within an overall landscape style exemplified by few other sites. They are therefore sites of great cultural, education-al and scientific value and are managed according to recommendations outlined in their Conservation Analyses. Undoubt-edly some of the major structural compo-nents of these landscapes would pose a threat were they to ‘escape’.
Here, an example of difficulties with commerce and education. Wheat and car-rots are widely naturalised plants – should they be grown in a botanic gardens kitch-en garden? If the answer to this is ‘yes’, then what about Olea europaea, olive, and Cynara scolymus, globe artichoke which are possibly more invasive species? And then what about widely grown plants such as mints, nasturtium, asparagus, fennel, and mustards?
And here a difficulty with science and education. The horsetail, Equisetum, is extremely distinctive and botanically im-portant as it is the only genus in the fam-ily Equisetaceae that, in turn, is the only family within the broader Horsetail group Sphenopsida. This unusual plant genus exemplifies the kinds of plants that thrived on the Earth in the Carboniferous period over 350 million years ago. It is valuable for botany students to study the botani-cal structures of such an important plant group, while its form and history make this a very interesting curiosity for the general public and visiting students. However, Eq-uisetum is also a highly destructive weed with underground spreading rhizomes that can penetrate to a depth of 1 m or so and, once established, is extremely diffi-cult to eradicate; it is undoubtedly an en-vironmental threat when it escapes from gardens, whether public or private.
Other factorsNo doubt part of the task ahead will be to develop monitoring procedures for plants that pose some weed potential.
One area of particular concern is the supervision of affiliated organisations. These include: Friends of Botanic Gar-dens; groups that deal with botanic gar-dens plants such as the Growing Friends at Melbourne; retail outlets that might un-wittingly supply the public with invasive plants or seeds; education sections that are not in touch with the latest information; craft groups; commercial agreements or exchange with the nursery industry; and plants going to staff.
Botanic gardens are noted for their in-troduction and cultivation of rare and un-usual plants. These are especially difficult to assess for their weed potential because their cultivation history is non-existent or negligible.
With this combined effort it is to be hoped that botanic gardens can help stem the tide of invasive plants. There will be
scope to share the workload; keeping records of plant performance in particular areas will help together with building up profiles of particular species and genera. It may be possible to do some weed trials to help the process of risk analysis. Certainly botanic gardens can assist with preventing future weed invasions but perhaps their greatest contribution will be to assisting with a necessary change of public percep-tions.
AcknowledgmentI would like to acknowledge the input of the following groups in the formulation of ideas presented in this paper.
Weed Working Group, Melbourne Bo-tanic Gardens: Michael McNabb, Peter Symes, Theresa Turner, Val Stajsic, David Robbins, Ollie Sherlock.
Australian Botanic Gardens Weed Working Group: John Arnott, Trevor Christensen, Bob Dixon, David Griffiths, Paul Janssens, Ross McKinnon, Natalie Papworth, Bernard Proctor, John Sand-ham, Mark Savio.
Australian Weed CRC: Dane Panetta, John Virtue, John Weiss, Kate Blood.
References1. Hill, A.W. (1915). The history and func-
tions of botanic gardens. Annals of the Missouri Botanical Garden 2, 185-240.
2. Mueller, F. von (1871). The objects of a botanic garden in relation to industries, 151-188.
3. Stafleu, F.A. (1969). Botanic Gardens be-fore 1818. Boissiera 14, 31-46.
4. Groombridge, B. and Jenkins M.D. (2000). ‘Global biodiversity Earth’s liv-ing resources in the 21st century’. (World Conservation Press, Cambridge).
5. Glanznig, A. (2005). Making State weed laws work. WWF-Australia, Sydney. www.wwf.org.au/News_and_infor-mation/Publications/PDF/Policies_position/makingstateweedlawswork.pdf
6. Australian Bureau of Statistics. Publica-tion 4613.
7. Groves, R.H. (1998). Recent incursions of weeds to Australia 1971–1995. CRC for Weed Management Systems, Glen Osmond.
8. Groves, R.H., Boden, R. and Lonsdale, W.M. (2005). Jumping the garden fence. Invasive garden plants in Australia and their environmental and agricultural impacts. CSIRO report for WWF Aus-tralia.
9. Environment, Communications, Infor-mation Technology and the Arts Refer-ence Committee. (Dec., 2004). Turning back the tide – the invasive species chal-lenge. Commonwealth Government, Canberra.
10. Sinden, J. et al. (2004). The economic impact of weeds in Australia. CRC for
4 Weed Society of Victoria Second Victorian Weed Conference ‘Smart Weed Control, Managing for Success’ 17–18 August 2005
Summary Weeds are an emotive is-sue throughout Victoria. The ten Victo-rian Catchment Management Authorities (CMAs) have all ranked weeds amongst the top-three natural resource issues in their Regional Catchment Strategies.
A systematic review of Victoria’s nox-ious weed list and potential additions is currently being conducted. This is the first detailed review since 1974. There is the potential that the review will create differences of opinion. To reduce the pos-sible negative impact of the review, species assessments, extensive consultation and extension about the process of the review has been underway since 2001.
The review process is following the principles contained in the Proposed Na-tional Protocol for Post-Border Weed Risk Management produced by the CRC for Australian Weed Management.
This paper describes the strategies, is-sues and difficulties faced in this review.
Keywords Weed risk assessment, con-sultation, implementation, noxious weed review.
IntroductionThe main Victorian weed policy docu-ment, The Victorian Pest Management Framework – Weed Management Frame-work (Anon 2002), requires the CMAs to review the noxious weed list, including the economic, environmental and social impacts, by the end of 2005.
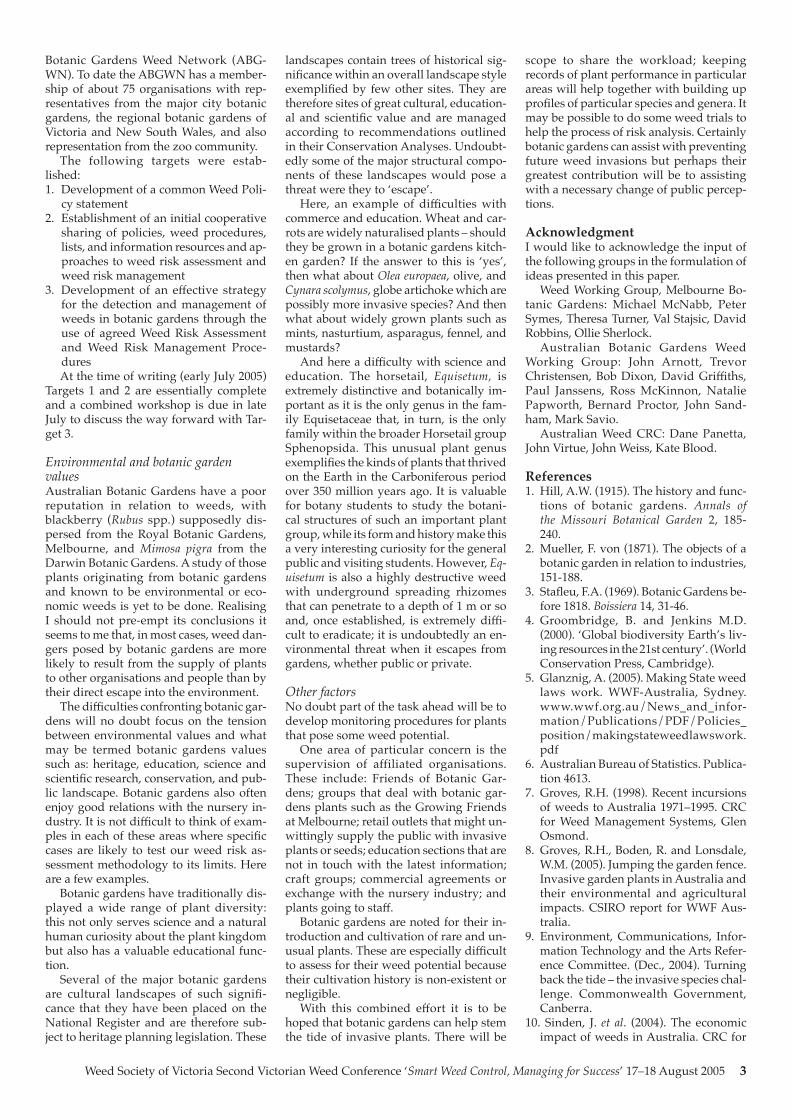
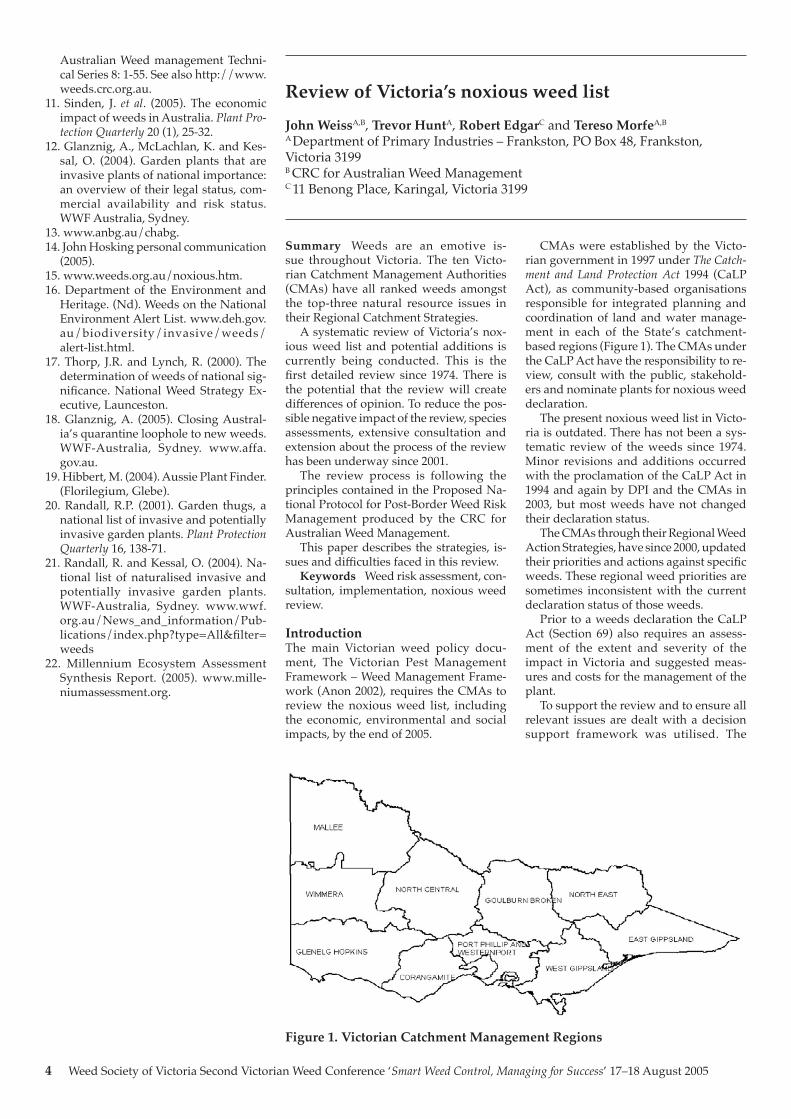
CMAs were established by the Victo-rian government in 1997 under The Catch-ment and Land Protection Act 1994 (CaLP Act), as community-based organisations responsible for integrated planning and coordination of land and water manage-ment in each of the State’s catchment-based regions (Figure 1). The CMAs under the CaLP Act have the responsibility to re-view, consult with the public, stakehold-ers and nominate plants for noxious weed declaration.
The present noxious weed list in Victo-ria is outdated. There has not been a sys-tematic review of the weeds since 1974. Minor revisions and additions occurred with the proclamation of the CaLP Act in 1994 and again by DPI and the CMAs in 2003, but most weeds have not changed their declaration status.
The CMAs through their Regional Weed Action Strategies, have since 2000, updated their priorities and actions against specific weeds. These regional weed priorities are sometimes inconsistent with the current declaration status of those weeds.
Prior to a weeds declaration the CaLP Act (Section 69) also requires an assess-ment of the extent and severity of the impact in Victoria and suggested meas-ures and costs for the management of the plant.
To support the review and to ensure all relevant issues are dealt with a decision support framework was utilised. The
Review of Victoria’s noxious weed list
John WeissA,B, Trevor HuntA, Robert EdgarC and Tereso MorfeA,B
A Department of Primary Industries – Frankston, PO Box 48, Frankston, Victoria 3199B CRC for Australian Weed ManagementC 11 Benong Place, Karingal, Victoria 3199
Figure 1. Victorian Catchment Management Regions
Australian Weed management Techni-cal Series 8: 1-55. See also http://www.weeds.crc.org.au.
11. Sinden, J. et al. (2005). The economic impact of weeds in Australia. Plant Pro-tection Quarterly 20 (1), 25-32.
12. Glanznig, A., McLachlan, K. and Kes-sal, O. (2004). Garden plants that are invasive plants of national importance: an overview of their legal status, com-mercial availability and risk status. WWF Australia, Sydney.
13. www.anbg.au/chabg.14. John Hosking personal communication
(2005).15. www.weeds.org.au/noxious.htm.16. Department of the Environment and
Heritage. (Nd). Weeds on the National Environment Alert List. www.deh.gov.au/biodiversity/invasive/weeds/alert-list.html.
17. Thorp, J.R. and Lynch, R. (2000). The determination of weeds of national sig-nificance. National Weed Strategy Ex-ecutive, Launceston.
18. Glanznig, A. (2005). Closing Austral-ia’s quarantine loophole to new weeds. WWF-Australia, Sydney. www.affa.gov.au.
19. Hibbert, M. (2004). Aussie Plant Finder. (Florilegium, Glebe).
20. Randall, R.P. (2001). Garden thugs, a national list of invasive and potentially invasive garden plants. Plant Protection Quarterly 16, 138-71.
21. Randall, R. and Kessal, O. (2004). Na-tional list of naturalised invasive and potentially invasive garden plants. WWF-Australia, Sydney. www.wwf.org.au/News_and_information/Pub-lications/index.php?type=All&filter=weeds
22. Millennium Ecosystem Assessment Synthesis Report. (2005). www.mille-niumassessment.org.
Weed Society of Victoria Second Victorian Weed Conference ‘Smart Weed Control, Managing for Success’ 17–18 August 2005 5
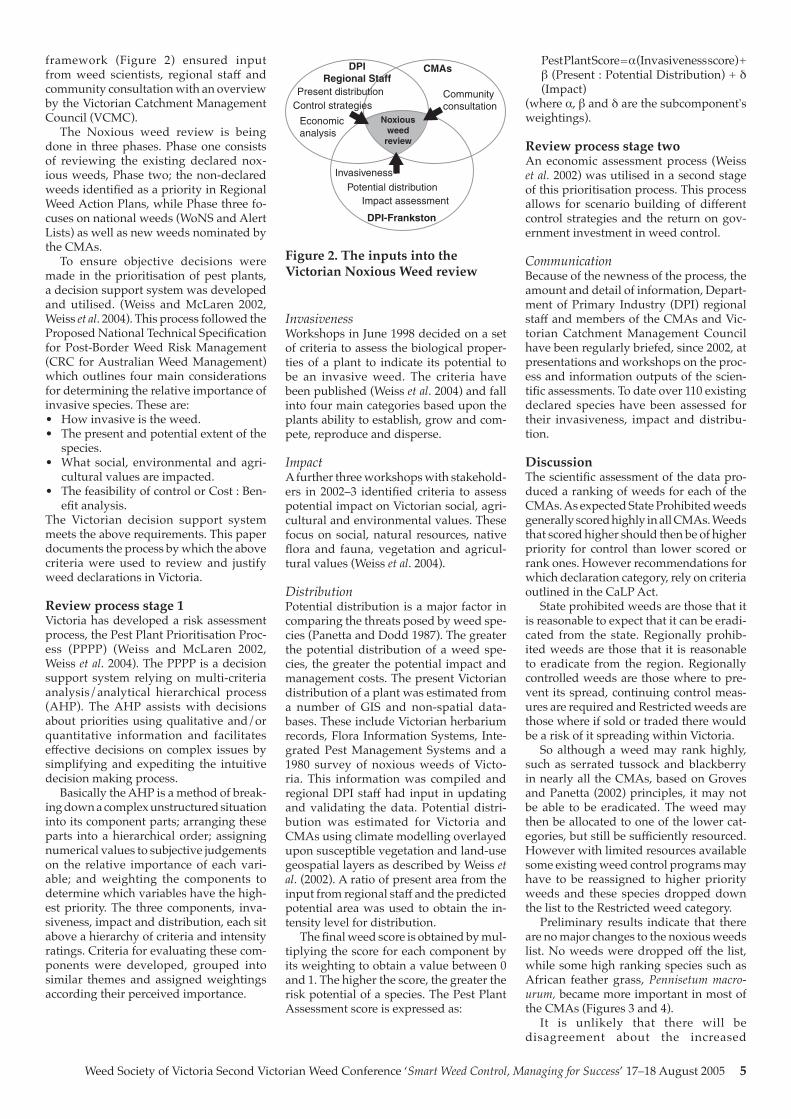
framework (Figure 2) ensured input from weed scientists, regional staff and community consultation with an overview by the Victorian Catchment Management Council (VCMC).
The Noxious weed review is being done in three phases. Phase one consists of reviewing the existing declared nox-ious weeds, Phase two; the non-declared weeds identified as a priority in Regional Weed Action Plans, while Phase three fo-cuses on national weeds (WoNS and Alert Lists) as well as new weeds nominated by the CMAs.
To ensure objective decisions were made in the prioritisation of pest plants, a decision support system was developed and utilised. (Weiss and McLaren 2002, Weiss et al. 2004). This process followed the Proposed National Technical Specification for Post-Border Weed Risk Management (CRC for Australian Weed Management) which outlines four main considerations for determining the relative importance of invasive species. These are:• How invasive is the weed.• The present and potential extent of the
species.• What social, environmental and agri-
cultural values are impacted. • The feasibility of control or Cost : Ben-
efit analysis.The Victorian decision support system meets the above requirements. This paper documents the process by which the above criteria were used to review and justify weed declarations in Victoria.
Review process stage 1Victoria has developed a risk assessment process, the Pest Plant Prioritisation Proc-ess (PPPP) (Weiss and McLaren 2002, Weiss et al. 2004). The PPPP is a decision support system relying on multi-criteria analysis/analytical hierarchical process (AHP). The AHP assists with decisions about priorities using qualitative and/or quantitative information and facilitates effective decisions on complex issues by simplifying and expediting the intuitive decision making process.
Basically the AHP is a method of break-ing down a complex unstructured situation into its component parts; arranging these parts into a hierarchical order; assigning numerical values to subjective judgements on the relative importance of each vari-able; and weighting the components to determine which variables have the high-est priority. The three components, inva-siveness, impact and distribution, each sit above a hierarchy of criteria and intensity ratings. Criteria for evaluating these com-ponents were developed, grouped into similar themes and assigned weightings according their perceived importance.
InvasivenessWorkshops in June 1998 decided on a set of criteria to assess the biological proper-ties of a plant to indicate its potential to be an invasive weed. The criteria have been published (Weiss et al. 2004) and fall into four main categories based upon the plants ability to establish, grow and com-pete, reproduce and disperse.
ImpactA further three workshops with stakehold-ers in 2002–3 identified criteria to assess potential impact on Victorian social, agri-cultural and environmental values. These focus on social, natural resources, native flora and fauna, vegetation and agricul-tural values (Weiss et al. 2004).
DistributionPotential distribution is a major factor in comparing the threats posed by weed spe-cies (Panetta and Dodd 1987). The greater the potential distribution of a weed spe-cies, the greater the potential impact and management costs. The present Victorian distribution of a plant was estimated from a number of GIS and non-spatial data-bases. These include Victorian herbarium records, Flora Information Systems, Inte-grated Pest Management Systems and a 1980 survey of noxious weeds of Victo-ria. This information was compiled and regional DPI staff had input in updating and validating the data. Potential distri-bution was estimated for Victoria and CMAs using climate modelling overlayed upon susceptible vegetation and land-use geospatial layers as described by Weiss et al. (2002). A ratio of present area from the input from regional staff and the predicted potential area was used to obtain the in-tensity level for distribution.
The final weed score is obtained by mul-tiplying the score for each component by its weighting to obtain a value between 0 and 1. The higher the score, the greater the risk potential of a species. The Pest Plant Assessment score is expressed as:
Pest Plant Score = α (Invasiveness score) + β (Present : Potential Distribution) + δ (Impact)
(where α, β and δ are the subcomponent's weightings).
Review process stage twoAn economic assessment process (Weiss et al. 2002) was utilised in a second stage of this prioritisation process. This process allows for scenario building of different control strategies and the return on gov-ernment investment in weed control.
CommunicationBecause of the newness of the process, the amount and detail of information, Depart-ment of Primary Industry (DPI) regional staff and members of the CMAs and Vic-torian Catchment Management Council have been regularly briefed, since 2002, at presentations and workshops on the proc-ess and information outputs of the scien-tific assessments. To date over 110 existing declared species have been assessed for their invasiveness, impact and distribu-tion.
DiscussionThe scientific assessment of the data pro-duced a ranking of weeds for each of the CMAs. As expected State Prohibited weeds generally scored highly in all CMAs. Weeds that scored higher should then be of higher priority for control than lower scored or rank ones. However recommendations for which declaration category, rely on criteria outlined in the CaLP Act.
State prohibited weeds are those that it is reasonable to expect that it can be eradi-cated from the state. Regionally prohib-ited weeds are those that it is reasonable to eradicate from the region. Regionally controlled weeds are those where to pre-vent its spread, continuing control meas-ures are required and Restricted weeds are those where if sold or traded there would be a risk of it spreading within Victoria.
So although a weed may rank highly, such as serrated tussock and blackberry in nearly all the CMAs, based on Groves and Panetta (2002) principles, it may not be able to be eradicated. The weed may then be allocated to one of the lower cat-egories, but still be sufficiently resourced. However with limited resources available some existing weed control programs may have to be reassigned to higher priority weeds and these species dropped down the list to the Restricted weed category.
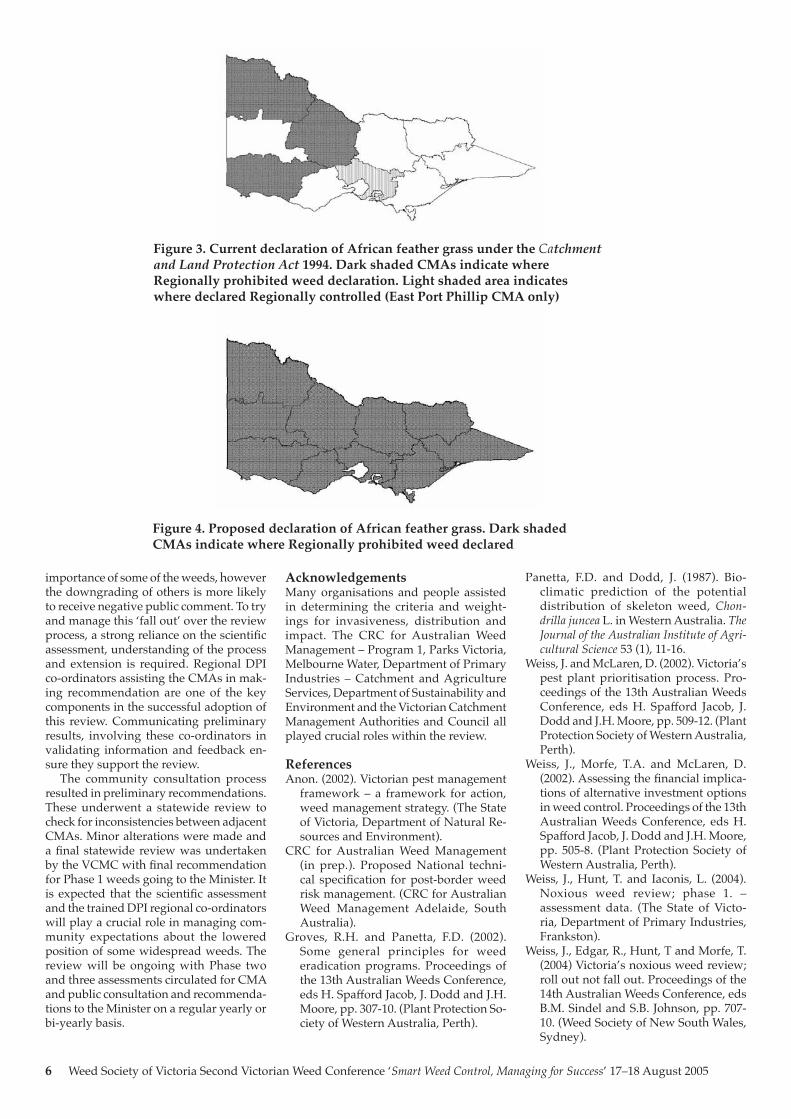
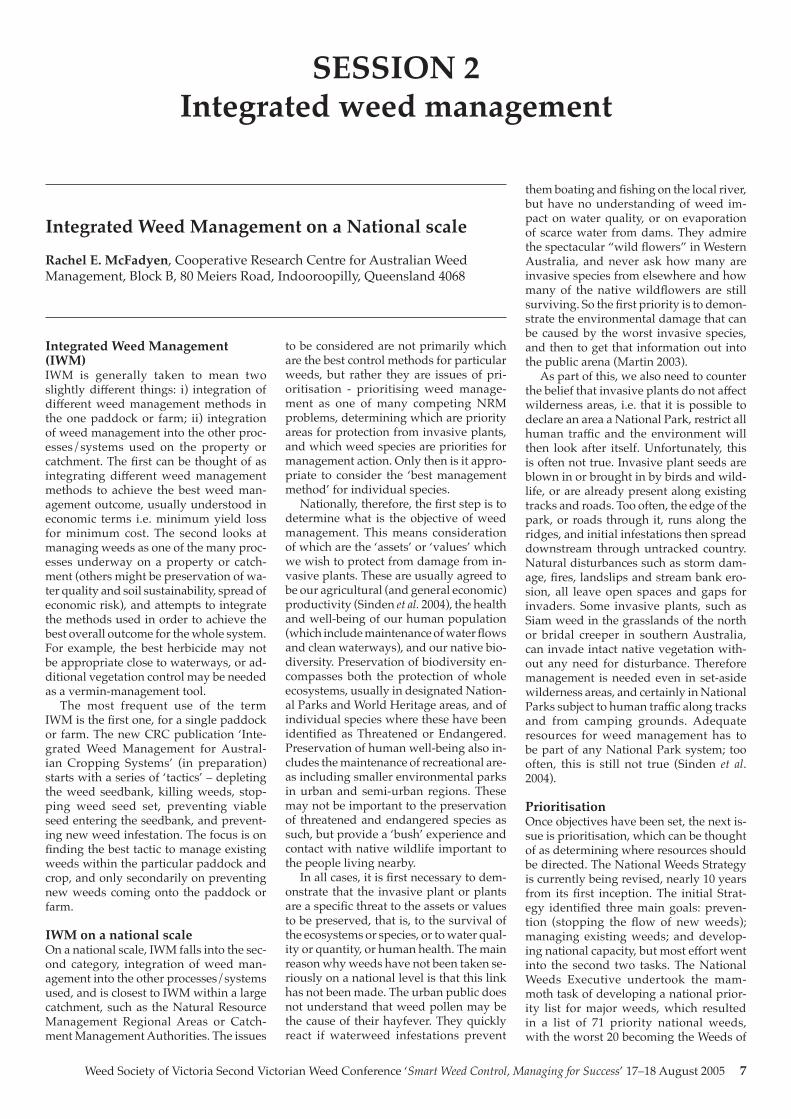
Preliminary results indicate that there are no major changes to the noxious weeds list. No weeds were dropped off the list, while some high ranking species such as African feather grass, Pennisetum macro-urum, became more important in most of the CMAs (Figures 3 and 4).
It is unlikely that there will be disagreement about the increased
Figure 2. The inputs into the Victorian Noxious Weed review
DPIRegional Staff
CMAs
DPI-Frankston
Present distributionControl strategies
Economicanalysis
Communityconsultation
InvasivenessPotential distribution
Impact assessment
Noxiousweed
review
6 Weed Society of Victoria Second Victorian Weed Conference ‘Smart Weed Control, Managing for Success’ 17–18 August 2005
importance of some of the weeds, however the downgrading of others is more likely to receive negative public comment. To try and manage this ‘fall out’ over the review process, a strong reliance on the scientific assessment, understanding of the process and extension is required. Regional DPI co-ordinators assisting the CMAs in mak-ing recommendation are one of the key components in the successful adoption of this review. Communicating preliminary results, involving these co-ordinators in validating information and feedback en-sure they support the review.
The community consultation process resulted in preliminary recommendations. These underwent a statewide review to check for inconsistencies between adjacent CMAs. Minor alterations were made and a final statewide review was undertaken by the VCMC with final recommendation for Phase 1 weeds going to the Minister. It is expected that the scientific assessment and the trained DPI regional co-ordinators will play a crucial role in managing com-munity expectations about the lowered position of some widespread weeds. The review will be ongoing with Phase two and three assessments circulated for CMA and public consultation and recommenda-tions to the Minister on a regular yearly or bi-yearly basis.
AcknowledgementsMany organisations and people assisted in determining the criteria and weight-ings for invasiveness, distribution and impact. The CRC for Australian Weed Management – Program 1, Parks Victoria, Melbourne Water, Department of Primary Industries – Catchment and Agriculture Services, Department of Sustainability and Environment and the Victorian Catchment Management Authorities and Council all played crucial roles within the review.
ReferencesAnon. (2002). Victorian pest management
framework – a framework for action, weed management strategy. (The State of Victoria, Department of Natural Re-sources and Environment).
CRC for Australian Weed Management (in prep.). Proposed National techni-cal specification for post-border weed risk management. (CRC for Australian Weed Management Adelaide, South Australia).
Groves, R.H. and Panetta, F.D. (2002). Some general principles for weed eradication programs. Proceedings of the 13th Australian Weeds Conference, eds H. Spafford Jacob, J. Dodd and J.H. Moore, pp. 307-10. (Plant Protection So-ciety of Western Australia, Perth).
Panetta, F.D. and Dodd, J. (1987). Bio-climatic prediction of the potential distribution of skeleton weed, Chon-drilla juncea L. in Western Australia. The Journal of the Australian Institute of Agri-cultural Science 53 (1), 11-16.
Weiss, J. and McLaren, D. (2002). Victoria’s pest plant prioritisation process. Pro-ceedings of the 13th Australian Weeds Conference, eds H. Spafford Jacob, J. Dodd and J.H. Moore, pp. 509-12. (Plant Protection Society of Western Australia, Perth).
Weiss, J., Morfe, T.A. and McLaren, D. (2002). Assessing the financial implica-tions of alternative investment options in weed control. Proceedings of the 13th Australian Weeds Conference, eds H. Spafford Jacob, J. Dodd and J.H. Moore, pp. 505-8. (Plant Protection Society of Western Australia, Perth).
Weiss, J., Hunt, T. and Iaconis, L. (2004). Noxious weed review; phase 1. – assessment data. (The State of Victo-ria, Department of Primary Industries, Frankston).
Weiss, J., Edgar, R., Hunt, T and Morfe, T. (2004) Victoria’s noxious weed review; roll out not fall out. Proceedings of the 14th Australian Weeds Conference, eds B.M. Sindel and S.B. Johnson, pp. 707-10. (Weed Society of New South Wales, Sydney).
Figure 3. Current declaration of African feather grass under the Catchment and Land Protection Act 1994. Dark shaded CMAs indicate where Regionally prohibited weed declaration. Light shaded area indicates where declared Regionally controlled (East Port Phillip CMA only)
Figure 4. Proposed declaration of African feather grass. Dark shaded CMAs indicate where Regionally prohibited weed declared
Weed Society of Victoria Second Victorian Weed Conference ‘Smart Weed Control, Managing for Success’ 17–18 August 2005 7
Integrated Weed Management on a National scale
Rachel E. McFadyen, Cooperative Research Centre for Australian Weed Management, Block B, 80 Meiers Road, Indooroopilly, Queensland 4068
SESSION 2Integrated weed management
Integrated Weed Management (IWM)IWM is generally taken to mean two slightly different things: i) integration of different weed management methods in the one paddock or farm; ii) integration of weed management into the other proc-esses/systems used on the property or catchment. The first can be thought of as integrating different weed management methods to achieve the best weed man-agement outcome, usually understood in economic terms i.e. minimum yield loss for minimum cost. The second looks at managing weeds as one of the many proc-esses underway on a property or catch-ment (others might be preservation of wa-ter quality and soil sustainability, spread of economic risk), and attempts to integrate the methods used in order to achieve the best overall outcome for the whole system. For example, the best herbicide may not be appropriate close to waterways, or ad-ditional vegetation control may be needed as a vermin-management tool.
The most frequent use of the term IWM is the first one, for a single paddock or farm. The new CRC publication ‘Inte-grated Weed Management for Austral-ian Cropping Systems’ (in preparation) starts with a series of ‘tactics’ – depleting the weed seedbank, killing weeds, stop-ping weed seed set, preventing viable seed entering the seedbank, and prevent-ing new weed infestation. The focus is on finding the best tactic to manage existing weeds within the particular paddock and crop, and only secondarily on preventing new weeds coming onto the paddock or farm.
IWM on a national scale On a national scale, IWM falls into the sec-ond category, integration of weed man-agement into the other processes/systems used, and is closest to IWM within a large catchment, such as the Natural Resource Management Regional Areas or Catch-ment Management Authorities. The issues
to be considered are not primarily which are the best control methods for particular weeds, but rather they are issues of pri-oritisation - prioritising weed manage-ment as one of many competing NRM problems, determining which are priority areas for protection from invasive plants, and which weed species are priorities for management action. Only then is it appro-priate to consider the ‘best management method’ for individual species.
Nationally, therefore, the first step is to determine what is the objective of weed management. This means consideration of which are the ‘assets’ or ‘values’ which we wish to protect from damage from in-vasive plants. These are usually agreed to be our agricultural (and general economic) productivity (Sinden et al. 2004), the health and well-being of our human population (which include maintenance of water flows and clean waterways), and our native bio-diversity. Preservation of biodiversity en-compasses both the protection of whole ecosystems, usually in designated Nation-al Parks and World Heritage areas, and of individual species where these have been identified as Threatened or Endangered. Preservation of human well-being also in-cludes the maintenance of recreational are-as including smaller environmental parks in urban and semi-urban regions. These may not be important to the preservation of threatened and endangered species as such, but provide a ‘bush’ experience and contact with native wildlife important to the people living nearby.
In all cases, it is first necessary to dem-onstrate that the invasive plant or plants are a specific threat to the assets or values to be preserved, that is, to the survival of the ecosystems or species, or to water qual-ity or quantity, or human health. The main reason why weeds have not been taken se-riously on a national level is that this link has not been made. The urban public does not understand that weed pollen may be the cause of their hayfever. They quickly react if waterweed infestations prevent
them boating and fishing on the local river, but have no understanding of weed im-pact on water quality, or on evaporation of scarce water from dams. They admire the spectacular “wild flowers” in Western Australia, and never ask how many are invasive species from elsewhere and how many of the native wildflowers are still surviving. So the first priority is to demon-strate the environmental damage that can be caused by the worst invasive species, and then to get that information out into the public arena (Martin 2003).
As part of this, we also need to counter the belief that invasive plants do not affect wilderness areas, i.e. that it is possible to declare an area a National Park, restrict all human traffic and the environment will then look after itself. Unfortunately, this is often not true. Invasive plant seeds are blown in or brought in by birds and wild-life, or are already present along existing tracks and roads. Too often, the edge of the park, or roads through it, runs along the ridges, and initial infestations then spread downstream through untracked country. Natural disturbances such as storm dam-age, fires, landslips and stream bank ero-sion, all leave open spaces and gaps for invaders. Some invasive plants, such as Siam weed in the grasslands of the north or bridal creeper in southern Australia, can invade intact native vegetation with-out any need for disturbance. Therefore management is needed even in set-aside wilderness areas, and certainly in National Parks subject to human traffic along tracks and from camping grounds. Adequate resources for weed management has to be part of any National Park system; too often, this is still not true (Sinden et al. 2004).
Prioritisation Once objectives have been set, the next is-sue is prioritisation, which can be thought of as determining where resources should be directed. The National Weeds Strategy is currently being revised, nearly 10 years from its first inception. The initial Strat-egy identified three main goals: preven-tion (stopping the flow of new weeds); managing existing weeds; and develop-ing national capacity, but most effort went into the second two tasks. The National Weeds Executive undertook the mam-moth task of developing a national prior-ity list for major weeds, which resulted in a list of 71 priority national weeds, with the worst 20 becoming the Weeds of
8 Weed Society of Victoria Second Victorian Weed Conference ‘Smart Weed Control, Managing for Success’ 17–18 August 2005
National Significance (WoNS). Hopefully the revised Strategy will put more empha-sis on the first goal: just as for an individual landholder, the best return on investment comes from prevention, preventing the weeds getting hold in the first place. On a national scale, this means border control (preventing them coming into Australia) followed by regional-scale containment (keeping them contained into the one or two original infested areas). Our border control system is generally good, even excellent by international standards, but our post-border containment is still woe-ful (Australian Biosecurity Group 2005). For example, in northern Australia, major efforts are made to eradicate new areas of Mimosa pigra in Queensland, or of rubber-vine in the Northern Territory or Western Australia, but gamba grass is still planted and promoted across the north, and hy-menachne, even though it is a WoNS, is still sold and planted in the NT and WA. There are innumerable examples of orna-mental plants which are declared noxious weeds in some states or councils, but are legally sold across the state boundary. So a first priority must be to establish a national system to control the promotion and sale of known invasive plant species (Austral-ian Biosecurity Group 2005).
The next priority must be to determine which areas most need protection. To some extent, this has already been done: World Heritage areas, national biodiversity ‘hot-spots’, and National Parks have been iden-tified and set aside with the priority ob-jective of preserving our native biodiver-sity. There is therefore a clear priority to protect these areas from invasive species, both plants and animals, and, for example, significant national resources have been expended to keep mimosa out of Kakadu (Sinden et al. 2004). Unfortunately, very lit-tle money has been made available to con-trol pond apple in the Wet Tropics World Heritage area, or buffel grass spreading across central Australia, and no doubt there are many other examples.
Other priority areas are those which, on a regional or landscape scale, are most eas-ily invaded, i.e. under most threat. These might be remnant ecosystems which are fragmented and under high human pres-sure, i.e. with many invasive weeds plant-ed nearby. Examples would be the Blue Mountains and the Adelaide Hills, where housing is moving deeper and deeper into previously uninvaded environments, or remnant rainforest east of the Divid-ing Range. Riparian areas generally have richer soils and better water supply and for these reasons are often heavily invad-ed, often by a complex of weed species. Yet the very same features make them key ecosystems for many wildlife species. Management of weed invasions in these key environments must be a high priority for any national IWM system.
Finally, management of existing al-ready-widespread species requires con-sideration of IWM principles, that is, use of all appropriate control methods in ways that integrates with other land uses and values. In practical terms, this may mean use of non-chemical control meth-ods where volunteer labour is available, or use of carefully targeted chemicals (such as gel applications) in sensitive areas. In other heavily-invaded environments, the ‘heavy artillery’ approach, using bull-dozers to clear all vegetation beneath the largest trees, burning the trash and then replanting, can give excellent results (field trip, Qld Weeds Symposium Townsville July 2005). For high-impact widespread weeds, biological control gives the best results and has to be a key part of any na-tional IWM strategy (Walton 2005).
ConclusionIn summary, the principles of IWM on a national scale are similar to those for a catchment or region: consider objectives, then prioritise these and determine avail-able resources. Then decide how to use the best available management methods in each site or system in such a way as to sup-port all land-use objectives for that site. Use adaptive management methods, i.e. be prepared to learn from experience and adapt methods as the situation changes, whether this is due to new weeds or new methods or changes in political or other priorities.
ReferencesAustralian Biosecurity Group. (2005). In-
vasive pests, weeds and diseases: solu-tions to secure Australia. (CRC for Pest Animal Control, CRC for Australian Weed Management, and WWF-Aus-tralia, Canberra.)
Martin, P. (2003). Killing us softly – Aus-tralia’s green stalkers. A call to action on invasive plants, and a way forward. (CRC for Australian Weed Manage-ment, Adelaide.)
Sinden, J., Jones, R., Hester, S., Odom, D., Kalisch, C., James, R. and Cacho, O. (2004). The economic impact of weeds in Australia. (CRC for Australian Weed Management Technical Series 8, Waite Campus, Glen Osmond).
Walton, C.S. (2005). Reclaiming lost prov-inces: a century of weed biological con-trol in Queensland. (Queensland Gov-ernment, NR&M, Brisbane).
Weed Society of Victoria Second Victorian Weed Conference ‘Smart Weed Control, Managing for Success’ 17–18 August 2005 9
Summary When developing integrated weed management systems, it is neces-sary to ensure the broader picture of the whole crop management plan is taken in to consideration. The implementation of weed management practices may impact on other aspects of crop management in the current or future seasons. Many of these impacts have been well understood (e.g. the residual effect of herbicides, weed management on disease and insect popu-lations), however their impact on the soil fauna and flora has not been well under-stood. Since the introduction of biotech-nological techniques, the full range of soil microbes is now becoming evident. The role of these microbes on plant function is still being discovered as is the effects of weed management decisions on these microbes and their interaction with plants. Perhaps it is time for those in main stream agriculture to pay a little more attention to those that have been utilising ‘biological farming systems’ and for us to understand the full interactions that occur between the plant that we are wishing to enhance and their environment.
IntroductionIntegrated weed management (IWM) has been developed from integrated pest man-agement (IPM) utilising biological, chemi-cal, physical, ecological and genetic meth-od to manage weeds (Sindel 2000). IWM as did IPM due to the development of re-sistance of the control species to applied chemicals. The reliance of the chemical management option caused high selection pressure which enhanced the resistance gene within the original population to be-come dominant. Alternating management options then reduced the gene frequency. Initially the change in management was just to another chemical, sometimes even with the same mode of action. This how-ever was short lived before multiple resist-ance started to occur. Then IWM or IPM becomes necessary in order to continue cropping. As the resistance issue was the driving force to ensure crop production there was a tendency for practitioners to solely focus on its management and not consider the side effects of the resistance management options on the whole crop/paddock plan not just in one season but over seasons. This paper reflects on the IWM strategies and the side effects that can occur due to their implementation.
IWM EffectsBiological management effectsWhile biological control has offered many examples of effective weed management (Briese 2000), integrating these into man-agement plan whether these be crop, farm or catchment scale can offer some difficul-ty. For many biological agents the imple-mentation of other IWM techniques can be detrimental to the biocontrol agent, as the agents food source is depleted (Ireson et al. 2000, Huwer et al. 2005). Perhaps another approach is required such as those used to combat insect resistance. For instance, in GM cotton IPM systems; there has been the use of insect refuges to ensure that there remains enough susceptible popu-lations to dilute any effects of resistant insect populations increasing (Carriere et al. 2004). A similar approach has been suggested in theory for herbicide resist-ance utilising a mosaic boomspray pattern (Roux 2004).
Physical management effectsPhysical management techniques include cultivation, cutting, mulches, flooding, and seed collection (Pratley 2000). While cultivation is effective in controlling many arable weeds, the negative effect of culti-vation on soil structure makes it undesir-able on Australian soils. The utilisation of burying seeds (Young 2003) to stop emer-gence again is effective but not practical in continuous large scale cropping enter-prises. The use of mulches can provide both a mechanism of weed management but also increase plant nutrition through improving organic matter but cause issues in sowing crops and harbouring crop pests such as snails and slugs.
Ecological management effectsChanging the ecological balance of plant populations through altering sowing dates, increasing sowing rates (Lemerle et al. 2004), retaining stubble, providing quarantine can also affect populations of other organisms.
Genetic management effectsImmediately these days one thinks of ge-netic engineering, but the whole process of weed management is to manipulate the populations’ genetics through favouring of some species against another, by ap-plying artificial selection pressure. Other methods of genetic effects are to utilise
competitive ability of crop plants in breed-ing programmes (Lemerle et al. 2001a, Le-merle et al. 2001b). Herbicide tolerant crop whether GM or conventional also intro-duce new selection pressures and impli-cations in their use, especially GM crops. While, the release of GM varieties needs to have an approval from the Office of the Gene Technology Regulator to ensure that there are no adverse implications to hu-man health and the environment, their ef-fect on off target species is under question on some fronts (Snow et al. 2005) but other studies have shown no change in soil mi-crobial populations when comparing GM to non GM crops (Lee et al. 2003; Milling et al. 2004).
Chemical management effectsHerbicides can have several non target effects which if used according to label instructions should not occur (e.g. spray drift). Labels also give an indication of the persistence of herbicides in the soil. Here there has been a welcome change in labels getting away from just a time frame (plant back period) to also including informa-tion about biological activity /requiring soil moisture as well (e.g. Syngenta’s Lo-gran® and DuPont’s Glean® labels). While this change in labels occurred due to the prolonged dry season over the last decade, it has allowed users to be more aware of the processes required to degrade herbi- cides.
Plant and soil microbes interactionsAn area that is becoming a major research area is that of the soil microbial popula-tions and how agricultural practices are changing their populations. Only 17% of the known fungal species can be cultured , yet there has been the identification of 80 000 species of fungi from observation of fruiting bodies in situ or by culturing soil extracts, with more species being identi-fied through genomics (Bridge and Spoon-er 2001). Present research is investigating the role of agricultural production systems including GM based systems on their ef-fect of the soil microbial diversity.
In work conducted at the University of Melbourne, Dookie campus, the effect of herbicides on non target soil microbes has been investigated in vitro (Sutton 2003, Bennett 2004, Schilg 2004). The effect of changing canola cropping systems from triazine tolerant canola to either glypho-sate tolerant or glufosinate tolerant canola, indicated that there could be an increase in the amount of sclerotinia present un-der glyphosate tolerant crops(Sutton 2003, Schilg 2004). Though (Lee et al. 2003) re-ported that glyphosate did not affect the defence response of glyphosate resistant soybeans to sclerotinia. The effect of the triazine herbicides atrazine and simazine was to stop the formation of asci hence to the sporolation of sclerotinia. As asci
Integrating IWM into crop management plans
Ken Young, Karl Schilg, Brad Bennett and Kristin Sutton, The University of Melbourne, Dookie Campus, Victoria 3647
10 Weed Society of Victoria Second Victorian Weed Conference ‘Smart Weed Control, Managing for Success’ 17–18 August 2005
formation has a light requirement, the use of herbicides affecting the photosytems, it could be theorised these herbicides act in a similar way in fungi. Glufosinate also stopped the formation of asci. And has been shown to be produced naturally by Streptomyces spp. has some antimicrobial activity (Sessitsch et al. 2004). The dinitro-analine herbicides also have been shown to affect the nodule formation in legumes (Bennett 2004), due to the interference of the bacterial protein FtsZ required for cell division. This protein is of similar struc-ture to tubulin, the site of activity for these dinitroanaline herbicides (Erickson 1998).
Conclusion Herbicides are not always detrimental to soil microbes with some studies reporting an increase in the numbers of bacteria and fungi (eg:(Balasubramanian and Sankaran 2001, Araujo et al. 2003). Also many soil microbes are beneficial to plant growth, with more of these fungi bacteria and in-vertebrates being discovered each year (Bonkowski 2004). Hence, it is important to determine what the effect of herbicides are on the soil microbial populations, not just in numbers but also on which are pro-moted and which are decreased. Those herbicides that enhance the beneficial groups and either suppress or not effect the harmful groups are the herbicides that we need to utilise and conserve within our plant production systems.
ReferencesAraujo, A.S.F., Monteiro, R.T.R. and Abar-
keli R.B. (2003). Effect of glyphosate on the microbial activity of two Brazilian soils. Chemosphere 52 (5), 799-804.
Balasubramanian, K. and Sankaran, S. (2001). Effect of pendimethalin on soil microorganisms. Indian Agriculturist 45(1/2).
Bennett, B. (2004). The effect of dinitroana-line herbicides on the legume rhizobia symbiosis in field peas (Pisum sativum). School of Agriculture and Food Sys-tems. Dookie Campus, The University of Melbourne, pp. 49.
Bonkowski, M. (2004). Protozoa and plant growth: the microbial loop in soil revis-ited. New Phytologist 162 (3), 617-31.
Briese, D.T. (2000). Classical biological con-trol. In Australian weed management systems, ed B.M. Sindel, pp. 161-92. (R.G. and F.J. Richardson, Melbourne).
Bridge, P. and Spooner, B. (2001). Soil fun-gi: diversity and detection. Plant and Soil 232 (1-2), 147-54.
Carriere, Y., Dutilleul, P., Ellers-Kirk, C., Pedersen, B., Haller, S., Antilla, L., Den-nehy, T.J. and Tabashnik, B.E. (2004). Sources, sinks, and the zone of influ-ence of refuges for managing insect re-sistance to Bt crops. Ecological Applica-tions 14 (6), 1615-23.
Erickson, H.P. (1998). Atomic structures of tubulin and FtsZ. Trends in Cell Biology 8, 133-7.
Huwer, R.K., Briese, D.T., Dowling, P.M., Kemp, D.R., Lonsdale, W. M., Michalk, D.L., Neave, M.J., Sheppard, A.W. and Woodburn, T.L. (2005). Can an integrat-ed management approach provide a ba-sis for long-term prevention of weed dominance in Australian pasture sys-tems? Weed Research 45 (3), 175-92.
Ireson, J.E., Leighton, S.M., Holloway, R.J. and Chatterton, W.S. (2000). Establish-ment and redistribution of Longitar-sus flavicornis (Stephens) (Coleoptera: Chrysomelidae) for the biological con-trol of ragwort (Senecio jacobaea L.) in Tasmania. Australian Journal of Entomol-ogy 39, 42-6.
Lee, C.D., Penner, D. and Hammerschmidt, R. (2003). Glyphosate and shade effects on glyphosate-resistant soybean de-fence response to Sclerotinia sclerotio-rum. Weed Science 51 (3), 294-8.
Lemerle, D., Cousens, R.D., Gill, G.S., Pelt-zer, S.J., Moerkerk, M., Murphy, C.E., Collins, D. and Cullis, B.R. (2004). Reli-ability of higher seeding rates of wheat for increased competitiveness with weeds in low rainfall environments. Journal of Agricultural Science 142, 395-409.
Lemerle, D., Gill, G.S., Murphy, C.E., Walker, S.R., Cousens, R.D., Mokhtari, S., Peltzer, S.J., Coleman, R. and Luck-ett, D.J. (2001a). Genetic improvement and agronomy for enhanced wheat competitiveness with weeds. Austral-ian Journal of Agricultural Research 52 (5), 527-48.
Lemerle, D., Verbeek, B. and Orchard, B. (2001b). Ranking the ability of wheat varieties to compete with Lolium rigi-dum. Weed Research 41 (3), 197-209.
Milling, A., Smalla, K., Maidl, F.X., Schlot-er, M. and Munch, J.C. (2004). Effects of transgenic potatoes with an altered starch composition on the diversity of soil and rhizosphere bacteria and fungi. Plant and Soil 266 (1-2), 23-39.
Pratley, J.E. (2000). Tillage and other physi-cal management methods. In Austral-ian weed management systems, ed B.M. Sindel, pp. 105-22. (R.G. and F.J. Richardson, Melbourne).
Roux, F.G.J. and Reboud, X. (2004). A spa-tially based concept to manage herbi-cide resistance: the mosaic strategy. Proceedings 12th International confer-ence on weed biology, Dijon, France, European Weed Research Society.
Schilg, K. (2004). Effect of glufosinate-am-monium and glyphosate herbicides on the carpogenic germination of Sclerotin-ia sclerotiorum. School of Agriculture and Food Systems. Dookie Campus, The University of Melbourne, pp. 55.
Sessitsch, A., Gyamfi, S., Tscherko, D., Gerzabek, M.H. and Kandeler, E.
(2004). Activity of microorganisms in the rhizosphere of herbicide treated and untreated transgenic glufosinate-toler-ant and wildtype oilseed rape grown in containment. Plant and Soil 266 (1-2), 105-16.
Sindel, B.M. (2000). The history of inte-grated weed management. In Austral-ian weed management systems, ed B.M. Sindel, pp. 253-66. (R.G. and F.J. Richardson Melbourne).
Snow, A.A., Andow, D.A., Gepts, P., Hall-erman, E.M., Power, A., Tiedje, J.M. and Wolfenbarger, L.L. (2005). Genetically engineered organisms and the environ-ment: current status and recommenda-tions. Ecological Applications 15 (2), 377-404.
Sutton, K. (2003). Effect of atrazine and simazine on Sclerotinia. School of Ag-riculture and Food Systems. Dookie Campus, The University of Melbourne: pp. 32.
Young, K. R. (2003). Cultural weed control: management of wild radish – a case study. Proceedings of the 1st Victorian Biennial Weeds Conference, Bendigo, pp. 30-2.
Weed Society of Victoria Second Victorian Weed Conference ‘Smart Weed Control, Managing for Success’ 17–18 August 2005 11
Site management strategies for six National Environmental Alert List weed species in Victoria
Michael Hansford, Catchment and Agriculture Services, Department of Primary Industries, Locked Bag 3000, Box Hill, Victoria 3128
SESSION 3Early detection and response (concurrent)
Summary Six National Environmental Alert List weed species (three of which are declared State Prohibited Weeds in Victo-ria) were targeted for early detection and eradication in Victoria by the Department of Primary Industries: Nassella charruana, Acacia karroo, Hieracium aurantiacum, Trian-optiles solitaria, Piptochaetium montevidense, Cytisus multiflorus. During the course of the project, which ran from May 2003 to December 2004, more infestation sites were discovered for several of the species, although Piptochaetium montevidense was unable to be detected in Victoria and may already have been eradicated. All species detected have received at least one treat-ment of the original infestation sites, with the exception of Trianoptiles solitaria, which initially proved difficult to detect. Treat-ment programs for Nassella charruana, Aca-cia karroo, and Hieracium aurantiacum are now well advanced. Critical success fac-tors in eradication programs include that containment of further spread is achieved by the use of weed spread and hygiene protocols, and best-practice control tech-niques are instigated at each site of occur-rence.
Keywords National Environmental Alert List, Nassella charruana, Acacia kar-roo, Hieracium aurantiacum, Trianoptiles soli-taria, Piptochaetium montevidense, Cytisus multiflorus, weed hygiene, eradication.
IntroductionThe National Environmental Alert List (Alert List of Environmental Weeds) iden-tifies 28 weed species in the early stages of establishment which have the potential to become a significant threat to biodiver-sity in Australia if they are not managed (Department of Environment and Herit-age 2004). Six National Alert List weed species were targeted for early detection and eradication in Victoria by the Depart-ment of Primary Industries (DPI): Nassella charruana, lobed needle grass; Acacia kar-roo, Karoo thorn; Hieracium aurantiacum, orange hawkweed; Trianoptiles solitaria,
subterranean Cape sedge; Piptochaetium montevidense, Uruguayan rice grass; Cyti-sus multiflorus, white Spanish broom. The six species were targeted through a Natu-ral Heritage Trust funded project called ‘Victoria’s Dirty Half-Dozen – Alert and action on six new weeds in Victoria’. The project, which ran from May 2003 to De-cember 2004, was delivered as a part of a broader, Victorian Government project tar-geting new weed incursions, called ‘Weed Alert Rapid Response’ (Department of Pri-mary Industries 2005). Three of the target-ed species, N. charruana, A. karroo, and H. aurantiacum are declared State Prohibited weeds in Victoria under The Catchment and Land Protection Act 1994, a status which re-quires these species to be eradicated from the State if possible (Table 1.). In addition, two of the targeted species, N. charruana, and P. montevidense are Priority Sleeper Weeds (Cunningham et al. 2003).
Materials and methodsSite management strategies1. Site hygiene Staff and contractors involved in surveying and treating the weed species were briefed on the impor-tance of site hygiene. For example, they were required to inspect/clean their boots, clothing, tools and vehicles on exiting in-festation sites to help prevent the spread of propagules. In the case of Hieracium au-rantiacum, if flowers and seedheads were present on the plants at the time of treat-ment, it was usually possible to remove and bag these propagules prior to the spot spraying operation to reduce the chances of seed spread from the site.
2. Managing the soil seedbank In the case of Nassella charruana, Hieracium au-rantiacum and Cytisus multiflorus, the strat-egy was to ‘spot spray’ the plants to kill them before they set seed and to enable the germination of soil stored seed and to continue to follow up spray, so exhausting the seedbank over time.
3. Physical removal of the seedbank In the case of Acacia karroo, with so few trees to remove, and a large and persistent seedbank beneath the trees, it was consid-ered advantageous to physically remove the top few centimetres of soil from be-neath the trees. This ‘contaminated soil’ was then disposed of at an appropriate landfill and deeply buried along with the removed A. karroo trees themselves. At the sites of removal, the topsoil was then re-placed with ‘clean’ fill prior to revegeta-tion of the sites.
Physical removal of the seedbank of one entire Nassella charruana infestation was also undertaken. This was done to reduce the risk of seed spread from the soil seedbank at the site, which was about to be developed as a housing estate. With numerous construction workers and their machinery about to start undertaking earthworks at the site, appropriate hygiene measures would have been very difficult to implement. Removal and burial of the seedbank prior to the land development phase was seen as a best-bet option to re-duce the risk of seed spread from the site. With N. charruana, there is certainly scope to further utilise and harness land devel-opment to remove or permanently bury seedbanks. This is because this species is only known to occur on the northern out-skirts of Melbourne, mainly on land about to be developed for housing or other de-velopments in the near future.
4. Site rehabilitation Site rehabilitation was undertaken on a case by case basis, depending on the requirements at each site. No revegetation was normally un-dertaken with spot spraying among other vegetation, because weeds will be normal-ly be replaced by the natural regeneration of the surrounding vegetation. Indeed, in cases where follow-up spraying for several years is required, having to protect plant-ed vegetation at the sites could hinder fur-ther spraying attempts. However, where the large Acacia karroo trees had been re-moved from parks and zoos, revegetation was usually undertaken to rehabilitate the landscape values of these sites.
Site monitoringDPI’s Integrated Pest Management In-formation System (IPMS) is the database used to collect the data for infestations, assessments, and treatments of the six spe-cies in Victoria.
12 Weed Society of Victoria Second Victorian Weed Conference ‘Smart Weed Control, Managing for Success’ 17–18 August 2005
Results and discussionTreatment/eradication strategies for individual speciesNassella charruana – lobed needle grassNassella charruana is a serious weed due to its invasiveness and competitiveness. In Australia, it is limited to a few small infestations on the northern outskirts of Melbourne. It was discovered on a rural property, 20 km to the north of Melbourne in the 1990s. It is not known when or how it was originally introduced to Australia, but the landowner of the original rural property at Epping has recognised the grass’s presence at his property at least since the 1950s (CRC for Australian Weed Management 2003a).
Harnessing land development A small number of the N. charruana infestation sites are in grassland reserves, but the majority of infestation sites are on private land on the northern fringes of Melbourne, in the Epping area (Table 2). It is anticipated that most of the properties with N. charruana infestations will be sold for residential and/or industrial development in a few years time, enabling the harnessing of land development to help eradicate the in-festations. DPI will maintain contact with the landholders regarding the timeframe for land development. This will enable an opportunity for DPI to work with the developers to ensure the use of hygiene protocols during the development process and that any remaining seedbank topsoil is removed or buried on the sites as part of the land development process. This will ensure the eradication of the species from these sites. In the meantime, the strategy is to ‘spot spray’ individual plants to kill in-dividual plants before they set seed and to enable the germination of soil stored seed and to continue to follow-up spray when-ever growth conditions allow, so exhaust-ing the seedbank over time. This strategy will continue to exhaust the seedbank over time to reduce the risk for any eventual removal or burial of the seedbank at these sites.
Freeway construction, has it spread N. charruana? The new Cragieburn Bypass freeway extension was constructed in a northerly direction through the most heav-ily infested N. charruana affected property in late 2002. The freeway construction was the subject of a VicRoads weeds strategy (McMahon 2002), and it is hoped that the road construction has not spread the weed northwards, away from Melbourne. To this end, DPI has engaged with both VicRoads and its contractors regarding the need for DPI to conduct surveys for N. charruana for several years along the construction route.
Acacia karroo – Karoo thornAcacia karroo is considered a serious com-petitor and can form dense thorny thick-ets. In Australia, it is limited to a number of horticultural plantings in zoos, parks and arboreta, and its pre-emptive removal from these sites has been undertaken in light of its weed risk potential to Australia (CRC for Australian Weed Management 2003b).
In Victoria, A. karroo is known from a limited number of Zoo and garden plant-ings (Table 2), and so far it has not been re-corded as naturalised in the State, although seedlings have been observed growing under planted A. karroo trees at Werribee Open Range Zoo (Hansford 2004).
Just a few trees left in zoos and parks The strategy is to physically remove each tree and the top few centimetres of soil from underneath each tree to remove the seedbank and tree to landfill disposal. Site rehabilitation, including topsoil replace-ment and revegetation is then undertaken. There are so few trees to be removed in Victoria that eradication from the State should be achievable in the near future. Six infestations were removed by DPI dur-ing 2003–2004. There are now believed to be only seven remaining trees in Victoria, with five trees remaining at Werribee Open Range Zoo, one tree in the Melbourne area and one at Bendigo. In some cases, the trees have been valued as exhibits. For example, the Werribee Open Range Zoo has based its visitor experience around an African savanna landscape, including the use of A. karroo trees. A staged removal and revegetation program is being nego-tiated to minimise the impact to the Zoo (Hansford 2004). Due to the Melbourne Zoo’s diligence in removing its A. karroo trees in August 2003 (with assistance from DPI in hygiene and disposal), the Zoo won a Special Achievement Certificate at the 2003 Weedbuster Awards (Keel and Jou-bert 2004).
Hieracium aurantiacum – orange hawk-weedHieracium aurantiacum is a threat to the al-pine country and the temperate tablelands of eastern Australia. It was probably intro-duced to Tasmania as a garden plant in the early 20th century, but was not recorded in mainland Australia until much later. H aurantiacum spreads by runners over short distances and by seed over larger areas (CRC for Australian Weed Management 2003c). New Zealand experience with this and other hawkweed species has shown the danger of letting these weeds become established (Espie 2001).
In Victoria, a combination of survey-ing by staff of Falls Creek Resort Man-agement, Parks Victoria, and contractors
has detected infestations in and around the Falls Creek village and in the Alpine National Park (Carr et al. 2004) (Table 2). Strategic management has been under-taken as a cooperative effort between DPI, Parks Victoria and the Falls Creek Resort Management Board. For example, DPI has provided chemical control advice, Parks Victoria has run the spraying operation in the national park areas, Falls Creek Resort Management Board staff and contractors have run the spraying operation within the Falls Creek village area. The strategy is to ‘spot spray’ individual plants or patches of plants to kill these plants before they set seed and to enable the germination of soil stored seed and to continue to follow up spray, so exhausting the seedbank over time. Seed and flower heads should be removed and bagged before spraying, if practical. Ideally, plants would be sprayed prior to flowering. All sites surveyed in the summer of 2003/2004 were revisited and sprayed again in the 2004/2005 sea-son. This work will need to continue and any new outbreaks will also need to be detected and sprayed each time. During the project period, another species of Hier-acium was detected in the Alpine National Park, King devil hawkweed, H. praealtum ssp. bauhinii. This is the first time this spe-cies has been recorded in Australia. The new infestation of H. praealtum ssp. bauhi-nii has since received treatment by spot spraying.
Trianoptiles solitaria – subterranean Cape sedgeTrianoptiles solitaria may out-compete more desirable indigenous plants. The earliest known record of this species in Australia was a population in a reserve at North Balwyn, Melbourne in 1989. The origin of the population is unknown. The weed is a small, leafy annual herb that grows to about 200 mm in height (CRC for Austral-ian Weed Management 2003d).
During the project period, Trianoptiles solitaria proved difficult to detect at the North Balwyn site. It was finally sighted by DPI for the first time in September 2004 (Table 2). However, within a few weeks of the tiny plant’s emergence, it became obscured by grass growth. The grass was then mowed by the landowner, making it difficult to observe the plant, and the plant then progressed to its annual dor-mancy. The brief seasonal opportunity to treat the weed and the regular mowing of the site by the landowner adds complexity to its ease of control. More work needs to be done to forge a closer working relation-ship with the landowner in order to see that the site is treated and the landown-er’s grass mowing is postponed during the brief seasonal opportunity available for treatment each year.
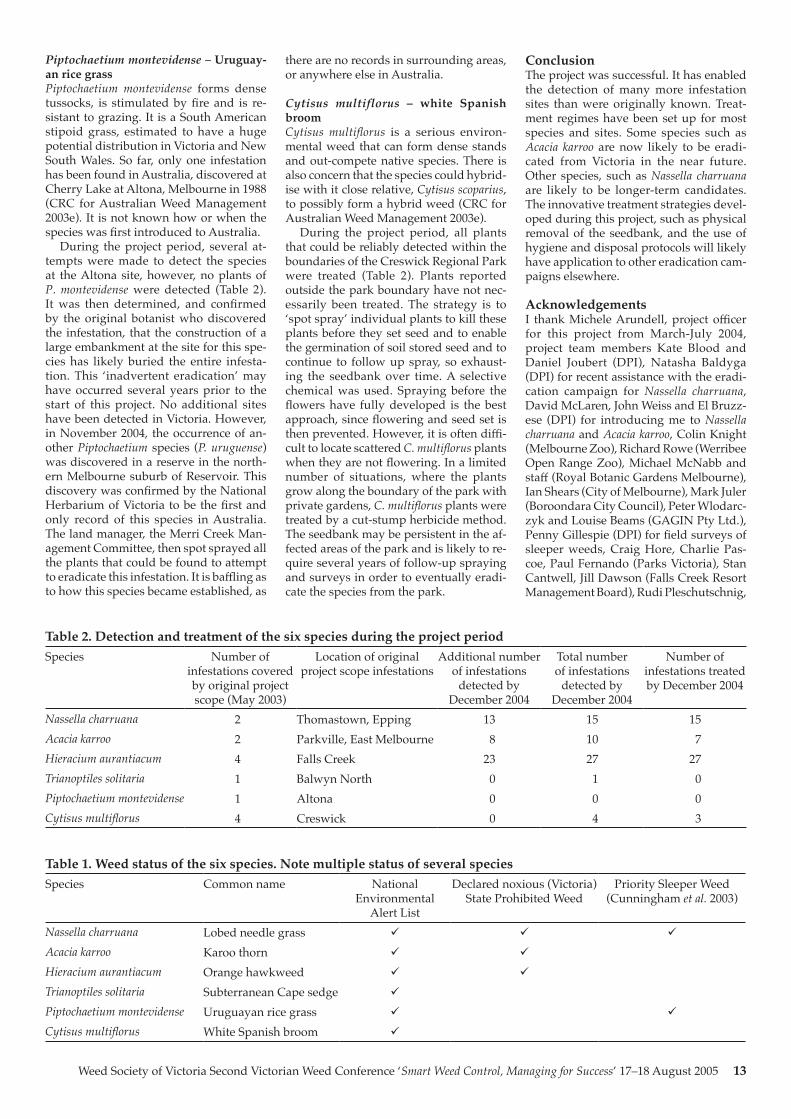
Weed Society of Victoria Second Victorian Weed Conference ‘Smart Weed Control, Managing for Success’ 17–18 August 2005 13
Table 1. Weed status of the six species. Note multiple status of several speciesSpecies Common name National
Environmental Alert List
Declared noxious (Victoria) State Prohibited Weed
Priority Sleeper Weed (Cunningham et al. 2003)
Nassella charruana Lobed needle grass
Acacia karroo Karoo thorn
Hieracium aurantiacum Orange hawkweed
Trianoptiles solitaria Subterranean Cape sedge
Piptochaetium montevidense Uruguayan rice grass
Cytisus multiflorus White Spanish broom
Table 2. Detection and treatment of the six species during the project periodSpecies Number of
infestations covered by original project scope (May 2003)
Location of original project scope infestations
Additional number of infestations
detected by December 2004
Total number of infestations
detected by December 2004
Number of infestations treated by December 2004
Nassella charruana 2 Thomastown, Epping 13 15 15Acacia karroo 2 Parkville, East Melbourne 8 10 7Hieracium aurantiacum 4 Falls Creek 23 27 27Trianoptiles solitaria 1 Balwyn North 0 1 0Piptochaetium montevidense 1 Altona 0 0 0Cytisus multiflorus 4 Creswick 0 4 3
Piptochaetium montevidense – Uruguay-an rice grassPiptochaetium montevidense forms dense tussocks, is stimulated by fire and is re-sistant to grazing. It is a South American stipoid grass, estimated to have a huge potential distribution in Victoria and New South Wales. So far, only one infestation has been found in Australia, discovered at Cherry Lake at Altona, Melbourne in 1988 (CRC for Australian Weed Management 2003e). It is not known how or when the species was first introduced to Australia.
During the project period, several at-tempts were made to detect the species at the Altona site, however, no plants of P. montevidense were detected (Table 2). It was then determined, and confirmed by the original botanist who discovered the infestation, that the construction of a large embankment at the site for this spe-cies has likely buried the entire infesta-tion. This ‘inadvertent eradication’ may have occurred several years prior to the start of this project. No additional sites have been detected in Victoria. However, in November 2004, the occurrence of an-other Piptochaetium species (P. uruguense) was discovered in a reserve in the north-ern Melbourne suburb of Reservoir. This discovery was confirmed by the National Herbarium of Victoria to be the first and only record of this species in Australia. The land manager, the Merri Creek Man-agement Committee, then spot sprayed all the plants that could be found to attempt to eradicate this infestation. It is baffling as to how this species became established, as
there are no records in surrounding areas, or anywhere else in Australia.
Cytisus multiflorus – white Spanish broomCytisus multiflorus is a serious environ-mental weed that can form dense stands and out-compete native species. There is also concern that the species could hybrid-ise with it close relative, Cytisus scoparius, to possibly form a hybrid weed (CRC for Australian Weed Management 2003e).
During the project period, all plants that could be reliably detected within the boundaries of the Creswick Regional Park were treated (Table 2). Plants reported outside the park boundary have not nec-essarily been treated. The strategy is to ‘spot spray’ individual plants to kill these plants before they set seed and to enable the germination of soil stored seed and to continue to follow up spray, so exhaust-ing the seedbank over time. A selective chemical was used. Spraying before the flowers have fully developed is the best approach, since flowering and seed set is then prevented. However, it is often diffi-cult to locate scattered C. multiflorus plants when they are not flowering. In a limited number of situations, where the plants grow along the boundary of the park with private gardens, C. multiflorus plants were treated by a cut-stump herbicide method. The seedbank may be persistent in the af-fected areas of the park and is likely to re-quire several years of follow-up spraying and surveys in order to eventually eradi-cate the species from the park.
ConclusionThe project was successful. It has enabled the detection of many more infestation sites than were originally known. Treat-ment regimes have been set up for most species and sites. Some species such as Acacia karroo are now likely to be eradi-cated from Victoria in the near future. Other species, such as Nassella charruana are likely to be longer-term candidates. The innovative treatment strategies devel-oped during this project, such as physical removal of the seedbank, and the use of hygiene and disposal protocols will likely have application to other eradication cam-paigns elsewhere.
AcknowledgementsI thank Michele Arundell, project officer for this project from March-July 2004, project team members Kate Blood and Daniel Joubert (DPI), Natasha Baldyga (DPI) for recent assistance with the eradi-cation campaign for Nassella charruana, David McLaren, John Weiss and El Bruzz-ese (DPI) for introducing me to Nassella charruana and Acacia karroo, Colin Knight (Melbourne Zoo), Richard Rowe (Werribee Open Range Zoo), Michael McNabb and staff (Royal Botanic Gardens Melbourne), Ian Shears (City of Melbourne), Mark Juler (Boroondara City Council), Peter Wlodarc-zyk and Louise Beams (GAGIN Pty Ltd.), Penny Gillespie (DPI) for field surveys of sleeper weeds, Craig Hore, Charlie Pas-coe, Paul Fernando (Parks Victoria), Stan Cantwell, Jill Dawson (Falls Creek Resort Management Board), Rudi Pleschutschnig,
14 Weed Society of Victoria Second Victorian Weed Conference ‘Smart Weed Control, Managing for Success’ 17–18 August 2005
Geoff Carr and staff (Ecology Australia), Brian Bainbridge (Merri Creek Manage-ment Committee), Kathryn Costello (Bio-sis), Val Stajsic and John Reid (National Herbarium of Victoria).
ReferencesCarr, G.W., Roberts, N.R., Wearne, L.J.
and McMahon, J.B. (2004). Alpine Na-tional Park post-fire mapping of Or-ange Hawkweed and other pest plants. Report to Parks Victoria from Ecology Australia Pty Ltd.
CRC for Australian Weed Management (2003a). Weed Management Guide – Lobed needle grass Nassella charruana.
CRC for Australian Weed Management (2003b). Weed Management Guide – Karroo thorn Acacia karroo.
CRC for Australian Weed Management (2003c). Weed Management Guide – Orange hawkweed Hieracium auran-tiacum.
CRC for Australian Weed Management (2003d). Weed Management Guide – Subterranean Cape sedge Trianoptiles solitaria.
CRC for Australian Weed Management (2003e). Weed Management Guide – Uruguayan rice grass Piptochaetium montevidense.
CRC for Australian Weed Management (2003f). Weed Management Guide – White Spanish broom Cytisus multi-florus.
Cunningham, D.C., Woldendorp, G., Bur-gess, M.B. and Barry, S.C. (2003). Pri-oritising sleeper weeds for eradication: Selection of species based on potential impacts on agriculture and feasibility of eradication. Bureau of Rural Sciences, Canberra.
Department of Environment and Heritage (2004). Weeds on the National Environ-mental Alert List. Available: http://www.deh.gov.au/biodiversity/inva-sive/weeds/alert-list.html (Accessed: 15 July 2005).
Department of Primary Industries (2005). Weed Alert Rapid Response Plan Vic-toria 2004/2005 – A surveillance and response plan for potential, new and emerging weeds in Victoria.
Espie, P.R. (2001). Hieracium in New Zea-land: ecology and management. AgRe-search, Invermay, NZ.
Hansford, M. (2004). Karoo thorn’s last stand. Under Control No. 28 pp. 14-15.
Keel, S. and Joubert, D. (2004). The 2003 Victorian Weedbuster awards. Under Control No. 26 p. 9.
McMahon, R.G. (2002). Craigieburn By-pass Weed Strategy. Prepared for Vic- Roads by Ecology Australia Pty Ltd.
What is a ‘weed’; should we continue to say that whether a plant is a weed is in the eye of the beholder?
IntroductionThe community response to weeds is af-fected by the way we talk about them. The literature provides many examples of ‘weed’ being defined by reference to human preferences, e.g. ‘A plant grow-ing where it is not wanted by man’ (Usher 1996); or ‘weediness is in the eye of the beholder’ (Roth 2001). Stearn wrote that weeds ‘are not so much a botanical as a hu-man psychological category’ (Stearn 1956). It is common to hear that a plant may be a weed to one person and a valued plant to another. It is suggested that this is too per-missive. Although such definitions con-tinue to be given, the true position today is that some plants are weeds by reason of characteristics such as invasiveness, and remain weeds even if some people want to grow them.
Definitions of ‘weed’Edna Walling wrote that in one of her first lectures at the Burnley School of Horticul-ture in 1916 she was told that a ‘weed is a plant out of place’ (Hardy 2005). This definition was probably a standard one for the time (Ewart and Tovey 1909). The bota-nist Dr Winifred Brenchley, however, in Weeds of Farm Land, noted a few years later that the word was used very loosely, and sometimes was made to apply to ‘almost any plant in any situation’. She sought to narrow the meaning down to ‘an exact significance’. What resulted were separate definitions, for each of the two distinct sys-tems of working farm land: land under the plough, and grass-land. A weed of ar-able land was defined as ‘any plant other than the crop sown’. A weed of grass-land was defined as (a) ‘a plant of low feeding value’ or (b) ‘a plant that grows so luxuri-antly or plentifully that it chokes out other plants that possess more valuable nutri-tive properties’ (Brenchley 1920). It may be suggested that these definitions hardly provide the exact significance sought, but serve rather to demonstrate that precision is hard to achieve. The definitions are also confined to what are sometimes called ‘agrestals’, weeds of agricultural land (Usher 1996). Other categories of weeds have long been recognised, e.g. ‘ruderals’, or weeds of waste places and roadsides (Usher 1996). (From the Latin, agrestris,
meaning ‘of the fields’ and, rudus mean-ing ‘broken stone, rubbish, debris’).
The two most frequently used defini-tions in the weeds literature today are: ‘a plant growing where it is not wanted’ and ‘a plant out of place’ (Usher 1996). Al-though sometimes treated as if they are equivalents, or used in combination, there may be differences between them. Dr Wil-liam Parsons, for example, began his Nox-ious Weeds of Victoria with the following: ‘A weed is usually defined as a plant
growing out of place (that is, growing where we do not want it to grow). Both of these definitions involve man’s as-sessment of the plant in a situation – it is growing out of place as we interpret the meaning of “place” or it is growing where “we” do not want it to grow.’
In the weed science literature, texts com-monly begin with the matter of definition, and commonly accept definitions such as those set out above. In 1956 the Terminolo-gy Committee of the Weed Science Society of America adopted the definition, ‘a plant growing where it is not desired’. American weed science texts often accept this defini-tion. For example, Weed Science Principles and Practices begins with an ‘Introduction to Weed Science’ which contains the fol-lowing passage, ‘The first question is “What is a weed?”
Before a plant can be considered a weed, humans must provide a defini-tion. Many varying definitions have been developed for weeds, depending on each particular situation where they occur and the plants involved. For the purpose of this book, we define a weed as a plant growing where it is not desired, or a plant out of place – some plant that, according to human criteria, is undesira-ble. We decide for each particular situa-tion which plants are or are not desired in terms of how they affect our health, our crops, our domesticated animals, or aesthetics. For example, some people consider a dandelion in a lawn a weed and want to control it, whereas others feel the dandelion is desirable and do not control it. The same thinking is in-volved for any weed situation, whether in a crop field, a pasture, a body of wa-ter, or in a non-cropland or natural site’ (Monaco et al. 2002)..
As might be expected from such a begin-ning, this book is mostly about herbicides and other ways of controlling weeds rather than about the weeds themselves.
What is a weed?
John Dwyer, 14 The Valclause, Richmond, Victoria 3121
Weed Society of Victoria Second Victorian Weed Conference ‘Smart Weed Control, Managing for Success’ 17–18 August 2005 15
It does contain a short section on invasive plant species generally, but this is clearly marginal in terms of the book’s concerns. At the same time reference is made, in this work as in other texts, to attempts to iden-tify biological characteristics which may serve to describe weeds, often by reference to the work of the botanist Herbert Baker (1974).
Definitions by ecologistsEcologists also tend to use the ‘plant out of place’ definition. The glossary to Ecology: an Australian Perspective adopts the usual definition: ‘Quite simply, a plant growing in the wrong place (a place where we do not want it to grow). A plant that is neither desired nor appreciated in that place.’ (At-tiwill and Wilson 2003).
The Oxford Dictionary of Ecology takes the definition a little further: ‘A plant in the wrong place, being one
that occurs opportunistically on land or in water that has been disturbed by human activity (see RUDERAL) or on cultivated land where it competes for nutrients, water, sunlight, or other re-sources with cultivated plants…’ (Al-laby 1998).
Such wrong place definitions depend logi-cally on there being a right place, and the right place seems likely to take us back to what humans want. Some ecologists, troubled by the feature of the ‘un-wanted’ definition that one man’s crop may be an-other man’s weed, have preferred to de-fine weeds as ‘pioneers of secondary suc-cession’ (Bunting 1960, Harlan and de Wet 1965). There is something troubling about the standard definition.
Problems with the standard definitionWhen encountered in the scientific lit-erature such definitions of ‘weed’ have a strange uncertainty about them. It is as if the task of developing a definition by which weeds could be distinguished from non-weeds has been avoided. The question, ‘How are we to tell whether this plant is a weed?’ has been given not even the response, ‘It all depends on the circumstances’, but rather, ‘That is not a question for botanical science to answer.’ Dr B. Auld and Dr R. Medd for example, having defined a weed as ‘a plant growing where it is not wanted’, go on to say that ‘Any species in the plant kingdom, includ-ing algae, ferns and trees can be a weed’ (Auld and Medd 1996). A number of writ-ers have taken the view that any plant may be a weed, and that as a corollary, ‘weedi-ness is in the eye of the beholder’, as Roth (2001) put it. If, as Auld and Medd assert, any plant may be a weed, it cannot be by reason of some feature or characteristic of the plant that it is a weed. That definition means that it is always a contingent mat-ter as to whether any particular plant is a
weed. Thus Campbell (1923) wrote, ‘…a plant is a weed – not according to specific qualities – nor by a definite concept in the mind of man, but by human caprice’. This extreme position is not supported by lin-guistic use. There are usually grounds for describing a plant as a weed, and exam-ples of capricious attribution are hard to find.
Alfred Crosby (2000) asserted that weed is not a scientific word, and does not refer to plants of any specific species or genus or any category recognised by scientific taxonomy. This, however, may mean no more than that in formulating the scien-tific categories the features or qualities which make a plant a weed were not taken into account. The question whether such characteristics are able to be discovered is not to be deflected by a definition.
Professor William Stearn suggested that the appropriate sphere of science for considering weeds was psychology rather than botany: ‘Taken as a whole, weeds are not so
much a botanical as a human psycho-logical category within the plant king-dom, for a weed is simply a plant which in a particular place at a particular time arouses human dislike and attempts are made at its eradication or control, usually because it competes with more desirable plants, or sometimes because it serves as a host to their pests and dis-eases or is unpalatable or dangerous to domestic beasts’ (Stearn, 1956).
Despite this suggestion, scientists such as horticulturists, ecologists, botanists, and others persist in the attempt. The New Roy-al Horticultural Society Dictionary of Gar-dening entry begins with the customary definition, but seeks to take the analysis further: ‘A weed is any plant growing where
it is not wanted – the wrong plant in the wrong place at the wrong time. The distinction between weeds and more desirable plants is a subjective one: one gardener’s deliberately grown plant may be a weed to another, and gener-ally desirable plants like Himalayan primroses can under certain circum-stances become weeds needing to be eradicated. All kinds of plants can oc-cur as weeds including algae, ferns and horsetails, but the majority are flow-ering plants, both woody and herba-ceous. Weeds are opportunists, taking full advantage of gaps in plant cover, often showing exceptional plasticity which allows them to thrive under a wide range of environmental condi-tions’ (Huxley 1999).
The last sentence of this quotation illus-trates the muddled thinking which so of-ten accompanies discourse about weeds. It contains a slide from the notion that any plant may be a weed depending on hu-man wants to a proposition, perhaps with
a paradigm weed in mind, about weedy behaviour quite independent of human wants and thus inconsistent with that no-tion.
A paradoxThis paradox of weeds discourse was rec-ognised long ago. The agronomist Pro-fessor Jack Harlan and J. de Wet of the Oklahoma State University pointed out forty years ago that it was characteristic of ‘the professional weed men’ that de-spite adopting the open ended ‘unwanted’ definition; they demonstrated a belief that there is a body of plants which are weeds. They ‘give long lists of “weeds” as though weeds were species’ and speak of ‘weedi-ness’ when they do not mean ‘unwanted-ness’ (Harlan and de Wet 1965). Despite this paper, which has been widely cited, this pattern of behaviour has continued.
An Australian example is provided by Charles Lamp and Frank Collet’s A Field Guide to Weeds in Australia (Lamp and Col-let 1984). The work begins with an interest-ing discussion of ‘What is a weed?’ which adopts as the best working definition, ‘a plant growing in the wrong place’. Their discussion considers the usual point about some plants being welcome additions to the flora to some, and weeds to others. But they proceed to give very useful illustrated descriptions of 283 weeds, the unwanted-ness of which is taken for granted.
The true position appears to be that books about weeds and weed science are directed not to all or any plants but rather to specific plants which are recog-nised as or accepted to be weeds. While adopting the generally accepted defini-tion, the literature is usually prescriptive about what plants are weeds and about the need to prevent their spread. Lists of the world’s worst weeds (Holm et al. 1977) do not appear to be compiled on the basis of mere preference or caprice. They rest on an assumption that there will be ob-jective agreement as to which plants are weeds. It follows that objective, scientific defining characteristics by which plants are included as weeds should be able to be identified. Perhaps we need to look be-yond the standard definitions to see what writers have in mind when they talk about weeds.
Noxious weedsDeclared noxious weeds have always been a special case, standing outside the stand-ard definitions. Weed status is determined by statute. Legislation in Victoria pro-scribed designated plants, first as ‘thistles’ (Thistle Prevention Act 1856 and successive Thistle Acts) and from 1922 as ‘noxious weeds’ (Vermin and Noxious Weeds Act 1922). The statutory regime under which plants were declared ‘noxious’ has now been replaced by the Catchment and Land Protection Act 1994 under which plants
16 Weed Society of Victoria Second Victorian Weed Conference ‘Smart Weed Control, Managing for Success’ 17–18 August 2005
may be declared ‘State prohibited weeds, regionally prohibited weeds, regionally controlled weeds or restricted weeds’. The logical status of declared weeds remains the same, in that weed status is still deter-mined by the declaration; other definitions have been superseded by stipulation, even though the concept of weed has been used in that stipulation.
Environmental weedsIn the 1970s some weeds began to be rec-ognised as environmental weeds. The earliest publication referring to environ-mental weeds was by R.L. Amor and P.L. Stephens from the Keith Turnbull Re-search Institute, Frankston in 1975. Their reference was taken up by W. Holzner from the Institute of Botany, University fur Bodenkultur, Vienna, Austria in Biol-ogy and Ecology of Weeds, where a definition was given; ‘Environmental weeds are in-troduced, aggressive species that colonise natural vegetation and suppress the native species to a certain extent’ (Holzner 1982). This definition provides criteria which are not about human wants or desires, but about what the plants do.
That some plants were behaving in this way was recognised long before the expression ‘environmental weed’ was adopted, even as early as the 1850s, for ex-ample see John Robertson’s 1853 writing about ‘silk-grass’ (Vulpia myuros) in Say-ers (1983). South African bone-seed, (Chry-santhemoides monilifera), the plant which Amor and Stevens called an environmen-tal weed, provides an interesting 20th cen-tury example. The harm which boneseed was causing to native plant communities in the You Yangs was documented by Jack Wheeler in the Victorian Naturalist in 1964 (Wheeler 1964). Soon afterwards boneseed was proclaimed a noxious weed in Victo-ria (Victoria Gazette February 21, 1969).
Concern about environmental weeds increased as the environment movement gathered strength in the 1960s and 1970s. Increasing concern found expression in the 1976 publication by the Australian In-stitute of Agricultural Science, The threat of weeds to bushland. A Victorian study (Anon 1976), which Richard Groves saw as the beginning of ‘the recent attention to en-vironmental weeds’ (Groves 1991). The 1976 study, which did not use the term, is about what would today commonly be called ‘environmental weeds’, and is important as a demonstration of grow-ing concern about the problem. It identi-fied three weeds which posed a serious threat to bushland in Victoria: boneseed (Chrysanthemoides monilifera), blackberry (Rubus fruticosus) and horehound (Marru-bium vulgare); and included Appendix 1 ‘Important Weeds of Public Land in Victo-ria’ containing those plants and a further 21. It is worth noting that many of these plants had been declared noxious weeds
undulatum, for example see Dwyer (2004). There are contentious issues to resolve as to which plants should be regarded as en-vironmental weeds, but this paper cannot be extended to consider them.
Use of the expression ‘environmen-tal weed’ is largely confined to Australia (Randall 1996). But there is concern world wide about plant invasions of indigenous plant communities, as demonstrated by the vast literature on the topic, including Invasive Plant Species of the World (Weber 2003). It may be that invasiveness is a key defining characteristic of weed species. It is, of course, well recognised that many invasive species are not invasive every-where, and that factors such as climate, disturbance and competition from native species may be significant in a plant be-coming invasive.
ConclusionAs has been demonstrated by examples from the weeds literature, weeds have been defined so often as a plant growing out of place or where it is not wanted (or desired) that this can be called the stand-ard definition. The standard definition of weed, however does not accord with agreement in practice about which plants should be included in lists of weeds. The definition does not sit well with the desig-nation of invasive alien plants as weeds, or lists of environmental weeds. In addition, gardeners may not only choose to grow environmental weeds in their gardens, but may also deny weed status on the ground that their desire to grow the plants takes them outside the standard definition (see Blood and Slattery 1996). They may ar-gue that it cannot be said of plants which they choose to grow that they are growing where they are not wanted. It is suggested that efforts to gain community support for the control of invasive plant species should recognise that the standard defi-nition may itself be part of the problem. If it was ever the case that weediness is in the eye of the beholder, environmen-talists may wish to argue that there are grounds for saying that it is no longer ap-propriate to talk about weeds in this way. The standard definition may thus require revision.
AcknowledgementsDr Janet Schapper and Dr Andrew Alex-andra kindly read a draft of this paper and made helpful comments.
ReferencesAllaby, M. (1998). ‘A dictionary of ecol-
ogy’. 2nd edition, p. 427. (Oxford). Amor, R. and Stevens, P. (1975). Spread of
weeds from a roadside into sclerophyll forests at Dartmouth, Australia. Weed Research 16, 111-18.
Anon. (1976). The threat of weeds to bush-land. (Melbourne).
in Victoria for many years. Blackberry was declared for the whole of Victoria in 1908, and horehound in 1932. Both had earlier been proclaimed for particular shires. Of the 24 weeds listed as ‘Important Weeds of Public Land in Victoria’, nineteen were declared noxious weeds, most of very long standing. What was new in this pamphlet is the consideration of well-known weeds, not as weeds of agriculture or horticulture, but of bushland and reserves. The weeds which threaten native plant communities have often been well known agrestal or ruderal weeds.
Following a national conference in 1984, Bitou bush and boneseed (Love and Dyson 1985), there was a series of workshops in Victoria on environmental weeds between 1988 and 1991. Don Saunders (1991) from the Department of Conservation and Envi-ronment, in his invited editorial to a spe-cial number of Plant Protection Quarterly on environmental weeds, said of the 1988 workshop, Weeds on Public Land – an action plan for today (Richardson 1988). ‘Although some people had been con-
cerned about environmental weeds be-fore then, that symposium was respon-sible for bringing more widespread at-tention to the problem of environmental weeds in Victoria’ (Saunders (1991).
The Minister for Conservation, Forests and Lands, Joan Kirner took part in the symposium; as did Dick de Fegely MLC on behalf of the Liberal Party. Both ex-pressed concern at the spread of weeds and supported their eradication and con-trol (Richardson 1988).
By 1991 there was widespread accept-ance by environmentalists of the need for action to deal with environmental weeds. That year also saw the publication of Kowari 2 Plant Invasions: the Incidence of Environmental Weeds in Australia (Hum-phries et al. 1991) and G.W. Carr’s contri-bution to Flora of Melbourne, ‘Environmen-tal weed invasions and their conservation implications’ (Carr 1991).
Publications such as Kate Blood’s En-vironmental weeds: a field guide for SE Aus-tralia, demonstrate increasing concern that effective action be taken regarding environmental weeds. Indeed, the whole movement formalised in the CRC for Australian Weeds Management could be seen as a demonstration of that concern. It should be noted, however, that the lists of plants said to be environmental weeds are now becoming very large. Many plants which have not previously been regarded as weeds, but as popular garden plants are being included in such lists (see for example Carr et al. 1992 and Randall 2001). Further, the lists are not confined to natu-ralised exotic plants. By ‘exotic’ I mean ‘introduced’ or ‘alien’: see Michael (2001) and Ewart and Tovey (1909). Native plants ‘outside their natural range’ are now be-ing classified as weeds, e.g. Pittosporum
Weed Society of Victoria Second Victorian Weed Conference ‘Smart Weed Control, Managing for Success’ 17–18 August 2005 17
Attiwill, P. and Wilson, B. (2003). ‘Ecol-ogy: an Australian perspective’, p. 587. (South Melbourne).
Auld, B.A. and Medd, R.W. (1996). ‘Weeds – an illustrated botanical guide to the weeds of Australia.’ (Inkata Press, Mel-bourne).
Baker, H. (1974). Characteristics and modes of origin of weeds. In ‘Genetics of colo-nizing species’, eds H.G. Baker and G.L. Stebbins, pp. 147-72 (New York).
Blood, K. (2001). ‘Environmental weeds: a field guide for SE Australia’. (C.H. Jer-ram and Associates, Mt Waverley).
Blood, K. and Slattery, D. (1996). I’ve got angled onion in my garden and I reckon it’s OK. Environmental weeds and com-munity education’. Proceedings Elev-enth Australian Weeds Conference, ed. R.C H. Shepherd. (Weed Science Society of Victoria, Frankston).
Brenchley, W. (1920). ‘Weeds of farmland’, p. 2. (London).
Bunting, A. (1960). Some reflections on the ecology of weeds. In ‘The biology of weeds’, ed. J. Harper. (Oxford).
Campbell, E. (1923). What is a weed. Sci-ence, 58.
Carr, G. (1991). Environmental weed in-vasions and their conservation impli-cations. In ‘Flora of Melbourne’. (Mel-bourne).
Carr, G., Yugovic, J. and Robinson, K. (1992). ‘Environmental weeds in Vic-toria; conservation and management implications’. (Department of Conser-vation and Environment and Ecological Horticulture, Melbourne).
Crosby, A. (2000). ‘Ecological imperialism’, p. 28. (Cambridge).
Dwyer, J. (2004). Natural range, nature and weeds. Proceedings of the 14th Austral-ian Weeds Conference, eds B.M. Sindel and S.B. Johnson. (Weed Society of New South Wales, Sydney).
Ewart, A. and Tovey, J. (1909). The weeds, poison plants, and naturalised aliens of Victoria. (Melbourne).
Groves, R. (1991). Status of environmental weed control in Australia. Plant Protec-tion Quarterly 6, 95-8.
Hardy, S. (2005). ‘The unusual life of Edna Walling’. (Melbourne).
Harlan, J. and de Wet, J. (1965). Some thoughts about weeds. Economic Botany 19, 16-24.
Holm, L., Plunknett, D., Pancho, J. and Herberger, J. (1977). ‘The World’s worst weeds’. (Honolulu).
Holzner, W. (1982). Concepts, categories and characteristics of weeds. In ‘Biology and ecology of weeds’, eds W. Holzner and M. Numata. (The Hague).
Humphries, S., Groves, R. and Mitchell, D. (eds) (1991). Plant invasions: the inci-dence of environmental weeds in Aus-tralia. Kowari 2.
Huxley, A. (ed.) (1999). ‘The New Royal Horticultural Society dictionary of
gardening’, Volume 4, p. 697. (Lon-don).
Lamp, C. and Collet, F. (1984). ‘A field guide to weeds in Australia’. (Inkata Press, Melbourne).
Love, A. and Dyson, R. (eds) (1985). ‘Bitou bush and boneseed’. (Sydney).
Parsons, W.T. (1981). ‘Noxious weeds of Victoria’, p. 3. (Inkata Press, Mel-bourne).
Michael, P. (2001). Alien plants. In ‘Aus-tralian vegetation’, ed. R.H. Groves. (Cambridge).
Monaco, T., Weller, S. and Ashton, F. (2002). ‘Weed science: principles and practices’, p. 3. (New York).
Randall, J. (1996). Defining weeds of natu-ral areas. In ‘Assessment and manage-ment of plant invasions’, ed. J. Luken, and J. Thieret. (New York).
Randall, R. (2001). Garden thugs, a na-tional list of invasive and potentially invasive garden plants. Plant Protection Quarterly 16, 138-70.
Richardson, R.G. (ed.) (1988). Weeds on Public Land – an action plan for today. (Weed Science Society of Victoria, Mel-bourne).
Roth, S. (2001). ‘Weeds, friend or foe?’, p. 8 (London).
Saunders, Don (1991). Opening address, third symposium on the control of envi-ronmental weeds. Plant Protection Quar-terly 6, 94.
Sayers, C. (ed.) (1983). ‘Letters from Victo-rian pioneers’, pp. 167-9 (Melbourne).
Stearn, W. (1956). Review of ‘Weeds’ by W.C. Muenscher. Journal of the Royal Horticultural Society, p. 285.
Weber, E. (2003). ‘Invasive plant species of the world’. (Cambridge).
Wheeler, J. (1964). South African bone-seed becoming a curse. Victorian Natu-ralist 81, 255-6.
Usher, G. (1996). ‘The Wordsworth dic-tionary of botany’, p. 398. (Ware, Hert-fordshire).
Zimdahl, R. (1999). ‘Fundamentals of weed science’, p. 14. (San Diego).
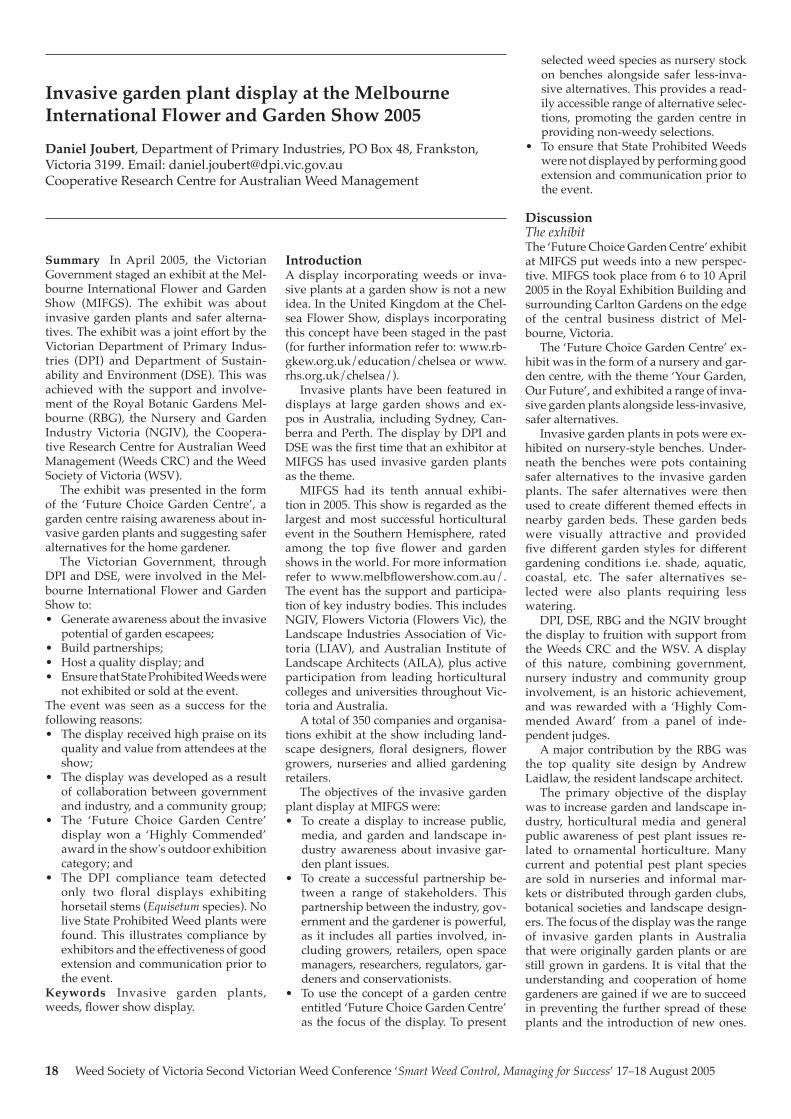
18 Weed Society of Victoria Second Victorian Weed Conference ‘Smart Weed Control, Managing for Success’ 17–18 August 2005
Summary In April 2005, the Victorian Government staged an exhibit at the Mel-bourne International Flower and Garden Show (MIFGS). The exhibit was about invasive garden plants and safer alterna-tives. The exhibit was a joint effort by the Victorian Department of Primary Indus-tries (DPI) and Department of Sustain-ability and Environment (DSE). This was achieved with the support and involve-ment of the Royal Botanic Gardens Mel-bourne (RBG), the Nursery and Garden Industry Victoria (NGIV), the Coopera-tive Research Centre for Australian Weed Management (Weeds CRC) and the Weed Society of Victoria (WSV).
The exhibit was presented in the form of the ‘Future Choice Garden Centre’, a garden centre raising awareness about in-vasive garden plants and suggesting safer alternatives for the home gardener.
The Victorian Government, through DPI and DSE, were involved in the Mel-bourne International Flower and Garden Show to: • Generate awareness about the invasive
potential of garden escapees; • Build partnerships; • Host a quality display; and • Ensure that State Prohibited Weeds were
not exhibited or sold at the event. The event was seen as a success for the following reasons: • The display received high praise on its
quality and value from attendees at the show;
• The display was developed as a result of collaboration between government and industry, and a community group;
• The ‘Future Choice Garden Centre’ display won a ‘Highly Commended’ award in the show's outdoor exhibition category; and
• The DPI compliance team detected only two floral displays exhibiting horsetail stems (Equisetum species). No live State Prohibited Weed plants were found. This illustrates compliance by exhibitors and the effectiveness of good extension and communication prior to the event.
Keywords Invasive garden plants, weeds, flower show display.
IntroductionA display incorporating weeds or inva-sive plants at a garden show is not a new idea. In the United Kingdom at the Chel-sea Flower Show, displays incorporating this concept have been staged in the past (for further information refer to: www.rb-gkew.org.uk/education/chelsea or www.rhs.org.uk/chelsea/).
Invasive plants have been featured in displays at large garden shows and ex-pos in Australia, including Sydney, Can-berra and Perth. The display by DPI and DSE was the first time that an exhibitor at MIFGS has used invasive garden plants as the theme.
MIFGS had its tenth annual exhibi-tion in 2005. This show is regarded as the largest and most successful horticultural event in the Southern Hemisphere, rated among the top five flower and garden shows in the world. For more information refer to www.melbflowershow.com.au/. The event has the support and participa-tion of key industry bodies. This includes NGIV, Flowers Victoria (Flowers Vic), the Landscape Industries Association of Vic-toria (LIAV), and Australian Institute of Landscape Architects (AILA), plus active participation from leading horticultural colleges and universities throughout Vic-toria and Australia.
A total of 350 companies and organisa-tions exhibit at the show including land-scape designers, floral designers, flower growers, nurseries and allied gardening retailers.
The objectives of the invasive garden plant display at MIFGS were:• To create a display to increase public,
media, and garden and landscape in-dustry awareness about invasive gar-den plant issues.
• To create a successful partnership be-tween a range of stakeholders. This partnership between the industry, gov-ernment and the gardener is powerful, as it includes all parties involved, in-cluding growers, retailers, open space managers, researchers, regulators, gar-deners and conservationists.
• To use the concept of a garden centre entitled ‘Future Choice Garden Centre’ as the focus of the display. To present
selected weed species as nursery stock on benches alongside safer less-inva-sive alternatives. This provides a read-ily accessible range of alternative selec-tions, promoting the garden centre in providing non-weedy selections.
• To ensure that State Prohibited Weeds were not displayed by performing good extension and communication prior to the event.
DiscussionThe exhibitThe ‘Future Choice Garden Centre’ exhibit at MIFGS put weeds into a new perspec-tive. MIFGS took place from 6 to 10 April 2005 in the Royal Exhibition Building and surrounding Carlton Gardens on the edge of the central business district of Mel-bourne, Victoria.
The ‘Future Choice Garden Centre’ ex-hibit was in the form of a nursery and gar-den centre, with the theme ‘Your Garden, Our Future’, and exhibited a range of inva-sive garden plants alongside less-invasive, safer alternatives.
Invasive garden plants in pots were ex-hibited on nursery-style benches. Under-neath the benches were pots containing safer alternatives to the invasive garden plants. The safer alternatives were then used to create different themed effects in nearby garden beds. These garden beds were visually attractive and provided five different garden styles for different gardening conditions i.e. shade, aquatic, coastal, etc. The safer alternatives se-lected were also plants requiring less watering.
DPI, DSE, RBG and the NGIV brought the display to fruition with support from the Weeds CRC and the WSV. A display of this nature, combining government, nursery industry and community group involvement, is an historic achievement, and was rewarded with a ‘Highly Com-mended Award’ from a panel of inde-pendent judges.
A major contribution by the RBG was the top quality site design by Andrew Laidlaw, the resident landscape architect.
The primary objective of the display was to increase garden and landscape in-dustry, horticultural media and general public awareness of pest plant issues re-lated to ornamental horticulture. Many current and potential pest plant species are sold in nurseries and informal mar-kets or distributed through garden clubs, botanical societies and landscape design-ers. The focus of the display was the range of invasive garden plants in Australia that were originally garden plants or are still grown in gardens. It is vital that the under standing and cooperation of home gardeners are gained if we are to succeed in preventing the further spread of these plants and the introduction of new ones.
Invasive garden plant display at the Melbourne International Flower and Garden Show 2005
Daniel Joubert, Department of Primary Industries, PO Box 48, Frankston, Victoria 3199. Email: [email protected] Research Centre for Australian Weed Management
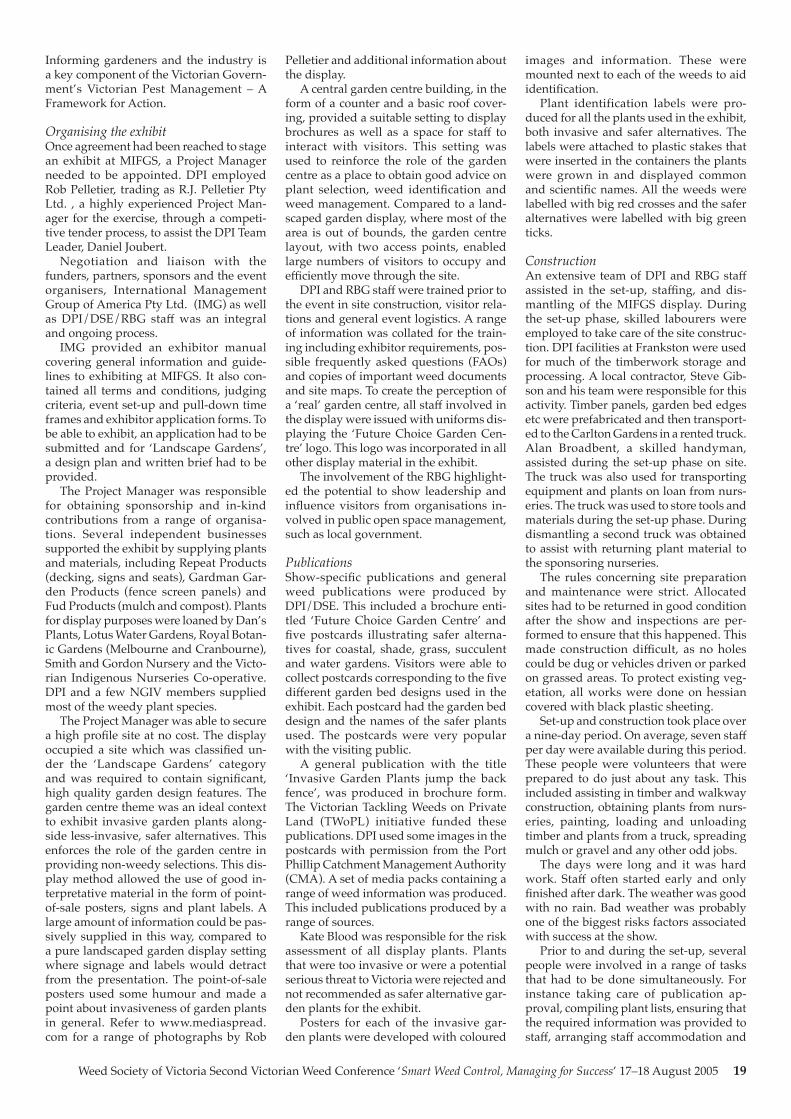
Weed Society of Victoria Second Victorian Weed Conference ‘Smart Weed Control, Managing for Success’ 17–18 August 2005 19
Informing gardeners and the industry is a key component of the Victorian Govern-ment’s Victorian Pest Management – A Framework for Action.
Organising the exhibitOnce agreement had been reached to stage an exhibit at MIFGS, a Project Manager needed to be appointed. DPI employed Rob Pelletier, trading as R.J. Pelletier Pty Ltd. , a highly experienced Project Man-ager for the exercise, through a competi-tive tender process, to assist the DPI Team Leader, Daniel Joubert.
Negotiation and liaison with the funders, partners, sponsors and the event organisers, International Management Group of America Pty Ltd. (IMG) as well as DPI/DSE/RBG staff was an integral and ongoing process.
IMG provided an exhibitor manual covering general information and guide-lines to exhibiting at MIFGS. It also con-tained all terms and conditions, judging criteria, event set-up and pull-down time frames and exhibitor application forms. To be able to exhibit, an application had to be submitted and for ‘Landscape Gardens’, a design plan and written brief had to be provided.
The Project Manager was responsible for obtaining sponsorship and in-kind contributions from a range of organisa-tions. Several independent businesses supported the exhibit by supplying plants and materials, including Repeat Products (decking, signs and seats), Gardman Gar-den Products (fence screen panels) and Fud Products (mulch and compost). Plants for display purposes were loaned by Dan’s Plants, Lotus Water Gardens, Royal Botan-ic Gardens (Melbourne and Cranbourne), Smith and Gordon Nursery and the Victo-rian Indigenous Nurseries Co-operative. DPI and a few NGIV members supplied most of the weedy plant species.
The Project Manager was able to secure a high profile site at no cost. The display occupied a site which was classified un-der the ‘Landscape Gardens’ category and was required to contain significant, high quality garden design features. The garden centre theme was an ideal context to exhibit invasive garden plants along-side less-invasive, safer alternatives. This enforces the role of the garden centre in providing non-weedy selections. This dis-play method allowed the use of good in-terpretative material in the form of point-of-sale posters, signs and plant labels. A large amount of information could be pas-sively supplied in this way, compared to a pure landscaped garden display setting where signage and labels would detract from the presentation. The point-of-sale posters used some humour and made a point about invasiveness of garden plants in general. Refer to www.mediaspread.com for a range of photographs by Rob
Pelletier and additional information about the display.
A central garden centre building, in the form of a counter and a basic roof cover-ing, provided a suitable setting to display brochures as well as a space for staff to interact with visitors. This setting was used to reinforce the role of the garden centre as a place to obtain good advice on plant selection, weed identification and weed management. Compared to a land-scaped garden display, where most of the area is out of bounds, the garden centre layout, with two access points, enabled large numbers of visitors to occupy and efficiently move through the site.
DPI and RBG staff were trained prior to the event in site construction, visitor rela-tions and general event logistics. A range of information was collated for the train-ing including exhibitor requirements, pos-sible frequently asked questions (FAOs) and copies of important weed documents and site maps. To create the perception of a ‘real’ garden centre, all staff involved in the display were issued with uniforms dis-playing the ‘Future Choice Garden Cen-tre’ logo. This logo was incorporated in all other display material in the exhibit.
The involvement of the RBG highlight-ed the potential to show leadership and influence visitors from organisations in-volved in public open space management, such as local government.
PublicationsShow-specific publications and general weed publications were produced by DPI/DSE. This included a brochure enti-tled ‘Future Choice Garden Centre’ and five postcards illustrating safer alterna-tives for coastal, shade, grass, succulent and water gardens. Visitors were able to collect postcards corresponding to the five different garden bed designs used in the exhibit. Each postcard had the garden bed design and the names of the safer plants used. The postcards were very popular with the visiting public.
A general publication with the title ‘Invasive Garden Plants jump the back fence’, was produced in brochure form. The Victorian Tackling Weeds on Private Land (TWoPL) initiative funded these publications. DPI used some images in the postcards with permission from the Port Phillip Catchment Management Authority (CMA). A set of media packs containing a range of weed information was produced. This included publications produced by a range of sources.
Kate Blood was responsible for the risk assessment of all display plants. Plants that were too invasive or were a potential serious threat to Victoria were rejected and not recommended as safer alternative gar-den plants for the exhibit.
Posters for each of the invasive gar-den plants were developed with coloured
images and information. These were mounted next to each of the weeds to aid identification.
Plant identification labels were pro-duced for all the plants used in the exhibit, both invasive and safer alternatives. The labels were attached to plastic stakes that were inserted in the containers the plants were grown in and displayed common and scientific names. All the weeds were labelled with big red crosses and the safer alternatives were labelled with big green ticks.
ConstructionAn extensive team of DPI and RBG staff assisted in the set-up, staffing, and dis-mantling of the MIFGS display. During the set-up phase, skilled labourers were employed to take care of the site construc-tion. DPI facilities at Frankston were used for much of the timberwork storage and processing. A local contractor, Steve Gib-son and his team were responsible for this activity. Timber panels, garden bed edges etc were prefabricated and then transport-ed to the Carlton Gardens in a rented truck. Alan Broadbent, a skilled handyman, assisted during the set-up phase on site. The truck was also used for transporting equipment and plants on loan from nurs-eries. The truck was used to store tools and materials during the set-up phase. During dismantling a second truck was obtained to assist with returning plant material to the sponsoring nurseries.
The rules concerning site preparation and maintenance were strict. Allocated sites had to be returned in good condition after the show and inspections are per-formed to ensure that this happened. This made construction difficult, as no holes could be dug or vehicles driven or parked on grassed areas. To protect existing veg-etation, all works were done on hessian covered with black plastic sheeting.
Set-up and construction took place over a nine-day period. On average, seven staff per day were available during this period. These people were volunteers that were prepared to do just about any task. This included assisting in timber and walkway construction, obtaining plants from nurs-eries, painting, loading and unloading timber and plants from a truck, spreading mulch or gravel and any other odd jobs.
The days were long and it was hard work. Staff often started early and only finished after dark. The weather was good with no rain. Bad weather was probably one of the biggest risks factors associated with success at the show.
Prior to and during the set-up, several people were involved in a range of tasks that had to be done simultaneously. For instance taking care of publication ap-proval, compiling plant lists, ensuring that the required information was provided to staff, arranging staff accommodation and

20 Weed Society of Victoria Second Victorian Weed Conference ‘Smart Weed Control, Managing for Success’ 17–18 August 2005
rosters, and keeping staff updated with the latest information and progress.
Open for businessThe Victorian Minister for Agriculture, The Honourable Robert Cameron MLA, opened the exhibit on the first morning of the show. Other speakers included Ri-chard Barley, Divisional Director of the RBG and David Mathews, President of the NGIV. Ron Harris, Executive Director, Catchment and Agriculture Services, De-partment of Primary Industries, was the master of ceremonies at the official open-ing ceremony.
The show was open for a five-day pe-riod. Because of the long opening hours, each day was divided in approximately four-hour shifts to ensure staff were re-freshed. A range of people was involved in staffing the display for several days in succession and this can be a tiring exercise. To be able to respond to questions from the public a range of reference literature was made available on site. These items were secured in a lockable container or re-moved from site when staff were not there. A visitors logbook was kept at the display where visitors could record their thoughts and comments.
The dismantling of the display took place over a period of three days and the site was handed back to the organisers in good condition.
RBG staff assisted visitors with plant selection advice and many home garden weed control enquiries. A major contribu-tion by the RBG was the top quality site design by Andrew Laidlaw, the resident landscape architect. This was supported by the good plant knowledge represented in the RBG.
DPI staff were able to assist visitors with questions about weeds, invasive gar-den plants and environmental issues.
Compliance activitiesDPI enforces the noxious weed provisions of the Catchment and Land Protection Act 1994 and is also responsible for identifying and acting on new and emerging weeds. The MIFGS exhibit was an effective way for DPI to display and transfer this infor-mation to visitors. After obtaining agree-ment with the NGIV, information about declared State Prohibited Weeds was dis-tributed to all exhibitors through IMG. This included a list of taxa and legal ob-ligations concerning these noxious weeds. To ensure that compliance was discreet and did not impact on show activities, this activity took place before the show opened. During the compliance investi-gation, involving the inspection of all the show sites for declared State Prohibited Weeds, a good result was obtained with no live weeds encountered.
Members of the public visiting the ex-hibit reported occurrences of a number
of noxious weeds which DPI staff were able to record and follow-up on after the show.
CostIt is difficult to do an accurate costing be-cause a large number of activities were performed as an in-kind contribution. In many cases volunteers contributed ad-ditional time (private and official). It is estimated that the cost involved in host-ing the display would be at least one hun-dred thousand dollars with an additional fifty thousand dollars being contributed by sponsors in the form, for example, of plants on loan.
VisitorsA total of approximately 120 000 people visited MIFGS, an estimated one third be-ing international tourists and one third from other Australian States. Feedback about the DPI exhibit from members of the public was overwhelmingly positive. The weed display in the midst of the nurs-ery industry’s premier showcase was a strong and positive way to convey mes-sages, not only to the home gardener, but also to the industry and professional open space managers. From the DSE/DPI per-spective the opportunity to engage with large numbers of gardeners was invalu-able: the event enabled us to present weed awareness messages in positive ways, to receptive audiences. The comment, ‘This exhibit is the best in the show, because it makes you think’ (or words to that effect) was regularly heard.
At the peak visitor times during the show, an estimated 2000 visitors per hour passed through the ‘Future Choice Garden Centre’ exhibit.
The quotation that states ‘Success doesn’t happen by chance, it is the out-come of good planning, team work, com-mitment and a lot of hard work’ is true in this case.
AcknowledgementsThe huge commitment and passion of the DPI and RBG staff to make the display a success is acknowledged. The following DPI staff were involved in training, set-up, compliance, display, dismantling or other activities: Adam Kay, Anthony Wil-son, Byron Crowe, Claire Norris, Drew Gracie, Donna Smithyman, Ian Faithful, Jaye Caldwell, John Weiss, Kristy Roche, Kate Blood, Les Bould, Linda Iaconis, Mark Watt, Marg McKenzie, Megan Mc-Carthy, Michael Hansford, Natasha Bald-yga, Penny Gillespie, Ryan Cooke, Sarah Holland Clift, Sarah Keel, Shane Bettess, Pamm Brittain, Tim Bloomfield and Trevor Hunt. I would like to thank Tony Lovick, Neil Smith and Rob McNally for their con-structive contribution.
Andrew Laidlaw from the Royal Bo-tanic Gardens was responsible for a great
design and was a pleasure to work with. I would like to thank Richard Barley and Michael McNabb as well as the follow-ing Royal Botanic Gardens Melbourne staff involved in staffing the display: Bill Bampton, Dermot Molloy, Ken Lake, Matt Flinn, Matt Howard, Neil Perkins, Olivia Thwaites, Peter Symes, Renee Wierzbicki and Therese Turner.
The contribution of our partners and sponsors made the display a reality. The contribution of Michael Gainger and Rob-ert Chin from the NGIV is appreciated. In-volvement by the Weed Society of Victoria and Peter Martin from the Weeds CRC is acknowledged.
I would especially like to thank a col-league, Kate Blood, and the Project Man-ager, Rob Pelletier, for their enthusiasm and valued contribution to the event.
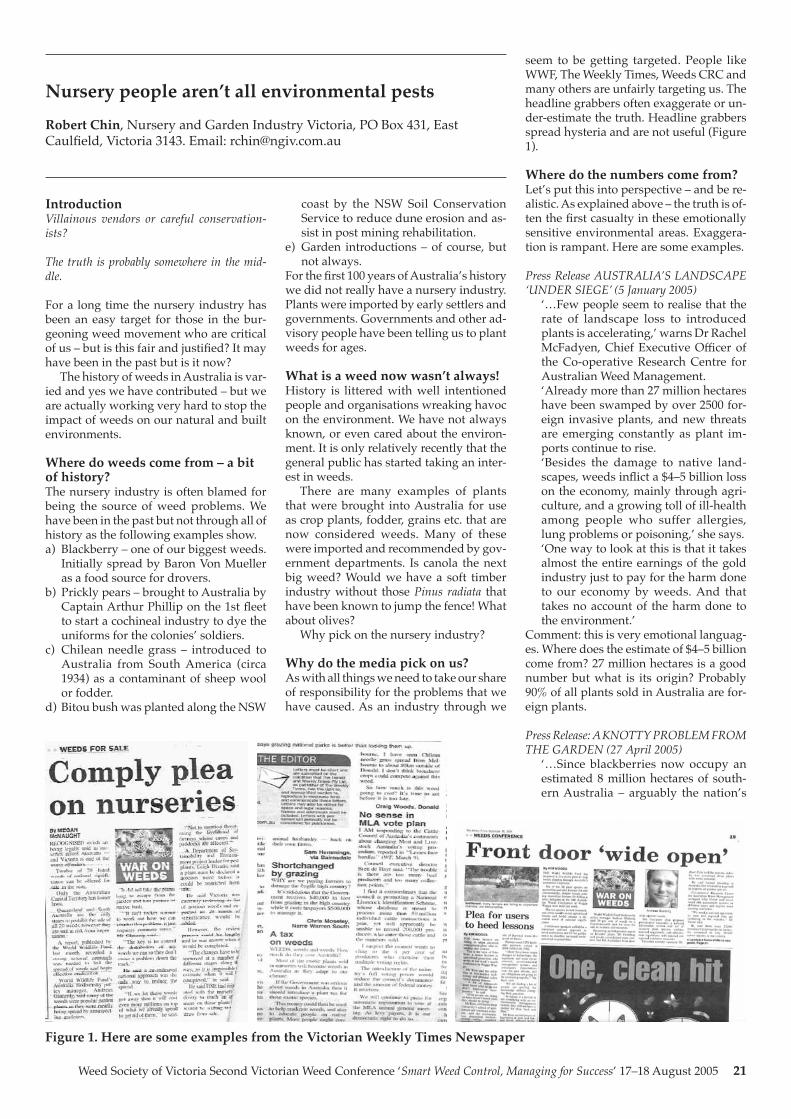
Weed Society of Victoria Second Victorian Weed Conference ‘Smart Weed Control, Managing for Success’ 17–18 August 2005 21
Introduction Villainous vendors or careful conservation-ists?
The truth is probably somewhere in the mid-dle.
For a long time the nursery industry has been an easy target for those in the bur-geoning weed movement who are critical of us – but is this fair and justified? It may have been in the past but is it now?
The history of weeds in Australia is var-ied and yes we have contributed – but we are actually working very hard to stop the impact of weeds on our natural and built environments.
Where do weeds come from – a bit of history?The nursery industry is often blamed for being the source of weed problems. We have been in the past but not through all of history as the following examples show. a) Blackberry – one of our biggest weeds.
Initially spread by Baron Von Mueller as a food source for drovers.
b) Prickly pears – brought to Australia by Captain Arthur Phillip on the 1st fleet to start a cochineal industry to dye the uniforms for the colonies’ soldiers.
c) Chilean needle grass – introduced to Australia from South America (circa 1934) as a contaminant of sheep wool or fodder.
d) Bitou bush was planted along the NSW
coast by the NSW Soil Conservation Service to reduce dune erosion and as-sist in post mining rehabilitation.
e) Garden introductions – of course, but not always.
For the first 100 years of Australia’s history we did not really have a nursery industry. Plants were imported by early settlers and governments. Governments and other ad-visory people have been telling us to plant weeds for ages.
What is a weed now wasn’t always!History is littered with well intentioned people and organisations wreaking havoc on the environment. We have not always known, or even cared about the environ-ment. It is only relatively recently that the general public has started taking an inter-est in weeds.
There are many examples of plants that were brought into Australia for use as crop plants, fodder, grains etc. that are now considered weeds. Many of these were imported and recommended by gov-ernment departments. Is canola the next big weed? Would we have a soft timber industry without those Pinus radiata that have been known to jump the fence! What about olives?
Why pick on the nursery industry?
Why do the media pick on us?As with all things we need to take our share of responsibility for the problems that we have caused. As an industry through we
seem to be getting targeted. People like WWF, The Weekly Times, Weeds CRC and many others are unfairly targeting us. The headline grabbers often exaggerate or un-der-estimate the truth. Headline grabbers spread hysteria and are not useful (Figure 1).
Where do the numbers come from?Let’s put this into perspective – and be re-alistic. As explained above – the truth is of-ten the first casualty in these emotionally sensitive environmental areas. Exaggera-tion is rampant. Here are some examples.
Press Release AUSTRALIA’S LANDSCAPE ‘UNDER SIEGE’ (5 January 2005) ‘…Few people seem to realise that the
rate of landscape loss to introduced plants is accelerating,’ warns Dr Rachel McFadyen, Chief Executive Officer of the Co-operative Research Centre for Australian Weed Management.
‘Already more than 27 million hectares have been swamped by over 2500 for-eign invasive plants, and new threats are emerging constantly as plant im-ports continue to rise.
‘Besides the damage to native land-scapes, weeds inflict a $4–5 billion loss on the economy, mainly through agri-culture, and a growing toll of ill-health among people who suffer allergies, lung problems or poisoning,’ she says.
‘One way to look at this is that it takes almost the entire earnings of the gold industry just to pay for the harm done to our economy by weeds. And that takes no account of the harm done to the environment.’
Comment: this is very emotional languag-es. Where does the estimate of $4–5 billion come from? 27 million hectares is a good number but what is its origin? Probably 90% of all plants sold in Australia are for-eign plants.
Press Release: A KNOTTY PROBLEM FROM THE GARDEN (27 April 2005) ‘…Since blackberries now occupy an
estimated 8 million hectares of south-ern Australia – arguably the nation’s
Nursery people aren’t all environmental pests
Robert Chin, Nursery and Garden Industry Victoria, PO Box 431, East Caulfield, Victoria 3143. Email: [email protected]
Figure 1. Here are some examples from the Victorian Weekly Times Newspaper

22 Weed Society of Victoria Second Victorian Weed Conference ‘Smart Weed Control, Managing for Success’ 17–18 August 2005
largest plant threat – the concern over knotweed isn’t exaggerated’, says John Weiss. ‘The plant has the potential to colonise the wetter areas of the south-ern third of the continent…’
Comment: to do this we would need to displace the other 100 or so weeds that take over the environment, pull down our cities and towns, pull up our roads and fill in our lakes and rivers.)
Let’s try and use less rhetoric and work positively together. The nursery industry is a $6 billion industry employing about 30 000 people. Being negative towards us affects us. Why aren’t you picking on the olive industry, pine plantation industry or even Agriculture because this is where the majority of real environmental weeds are coming from?
What is the Nursery Industry doing? In Victoria the Nursery industry, in other states and nationally are working towards removing pest plants and Greening Aus-tralia. We all need to work together to solve this problem. We are doing our bit. Here are some examples.
Future choice garden centre at Melbourne In-ternational Flower and Garden Show• Showcase at MIFGS• Assisted with lists, concept, supply of
plants• Difficult to find ‘weedy’ plants• Good relationship builder• 120 000 spectators• Offered alternatives
List of 50+ weeds – voluntary removal• Developed list in partnership with
Government• Agreed to list of plants for voluntary
removal• Distributed information/list to indus-
try• First of many to come• No problems with implementing(for a list of voluntary banned pest plants see Appendix I)
Spreading the word• Several articles in our GroundSwell
Magazine• Distribute list of declared weeds
through magazine• Talk about weeds to various industry
bodies• Nursery Papers on weeds and garden
escapes• Best Management Practice manual
– weeds section• Five minute environment checklist• Regular weed column in Australian
Horticulture? (Figure 2)
Sustainable Gardening Australia (SGA) • SGA is a not for profit association total-
ly committed to achieving real, contin-ually improving and easily understood environmental solutions for gardeners
• Support of industry body• Our biggest and best members are in-
volved• Weeds are a component of SGA Ac-
creditation• Nearly 30 and growing• http://www.sgaonline.org.au• Working on projects together
Other things we are doing/planning• Assisting DPI and DSE with various
weed initiatives (time consuming) • ‘Grow me Instead’ brochure• Future regular publication – Australian
Horticulture• On-going communication• Part of the NGIA, national approach
– driving this
In South Australia: • Andreas Glanznig WWF – Speaks at
State Conference• ‘Grow Me Instead’ brochure in con-
junction with Weeds CRC• On-going involvement with govern-
ment and other relevant stakeholders
National – NGIA• On-going dialogue with relevant
Figure 2. Nursery industry publications
stakeholders e.g. CRC, Federal govern-ment departments etc.
• National Weeds Advisory Group – member
• National Invasive Species Framework – member
• Invited WWF to National Board meet-ing
• Work nationally through state NGIs and IDOs
• Nursery Industry EMS nearing com-pletion
• Nursery Papers and other publications
Which list? The biggest problem that we, as an indus-try face is knowing which plants are weeds and which list should we refer to. Is it real-istic to expect every member to stop sell-ing and growing every plant on every list when nobody can agree on which plants should be on a list. This is very difficult. So which list should we use? • B.A. / WWF List – is this a good list?• AQIS List• State Govt – Declared noxious list• WoNS (not all have legal standing)• WoNS 2• Local Government lists• Local Landcare and Green groups lists• Garden thugs/escapees lists• Nursery Industry listsConfusion reigns supreme! No wonder our members struggle. Maybe their needs to be only one list? Who will decide which is the right list though?
Back to basics – what is a weed? Who defines a weed? The perception is that the ‘weed industry’ bureaucracy is growing almost as big as the problem it-self. One of the key jobs of the regulators must be to help out in this area – not make it worse. • Some plants known as weeds are only
plants that people can grow e.g. north of divide
• Must have a basis in scientific fact• Can not rush listings• Just because it is a weed in one area of
one part of the world does not mean it will be a weed here in Oz
• Sterile hybrids• Not just because they are popular• How do we as an industry know if it is
a weed if the Government lets it in? • Whose responsibility is it to define a
weed? e.g. Agapanthus example
The Future – working smarter and harderThere must be a better way. We need to work better and smarter. Working togeth-er and educating must be better than slan-der, exaggeration and taking shots at each other. So how can we go forward? Here are some thoughts: • Better communication – across all
stakeholders
Weed Society of Victoria Second Victorian Weed Conference ‘Smart Weed Control, Managing for Success’ 17–18 August 2005 23
Appendix I. List of 50 plants voluntarily removed from saleBotanical name Common nameAcacia nilotica (L.) Willd. ex Delile* Prickly acaciaAmbrosia L. spp. All ragweedsAnnona glabra L.* Pond appleAnredera cordifolia (Ten.) Steenis Madeira vineAsparagus asparagoides (L.) Druce* Bridal creeperBassia scoparia , B. sieversiana , Kochia alata, K. scoparia var. culta, K. scoparia var. pubsecens , K. scoparia var. subvillosa Moq., K. scoparia var. trichophila (Stapf), K. sieversiana, K. trichophila Stapf.
Kochia
Cabomba Aubl. spp. (all)* CabombaCalystegia silvatica (Kit.) Griseb. Greater bindweedCarthamus glaucus M.Bieb. Glaucus start thistleCenchrus incertus M.A.Curtis Spiny bluegrassCentaurea maculosa Lam. Spotted knapweedChromolaena odorata (L.) R.M.King & H.Robinson Siam weedCryptostegia grandiflora Roxb. ex R.Br.* Rubber vineDisa bracteata Sw. African weed-orchidGymnocoronis spilanthoides DC. Senegal teaHedera helix L. English ivyHymenache amplexicaulis (Rudge) Nees* HymenacheHypericum calycinum L. Grow under permit Large flowered St John’s wortHypericum canariense L. Canary Island St John’s wortHypericum humifusum L. Grow under permit Trailing St John’s wortLantana camara L.* LantanaMiconia Ruiz & Pav. spp.* MiconiaMimosa pigra L.* Giant sensitive plantNassella (Trin.) Desv. spp.* NeedlegrassOnopordum L. spp. Onopordum thistlesOnopordum tauricum Willd. Taurian thistleOpuntia aurantiaca Lindl. Tiger pearParkinsonia aculeata L.* ParkinsoniaRubus alceifolius Poir. Giant brambleRubus argutus Link Florida blackberryRubus rugosus J.E. Smith KeriberrySagittaria graminea Michaux SagittariaSagittaria montevidensis Cham. & Schltdl. ArrowheadSagittaria platyphylla (Engelm.) J.G.Sm. Delta arrowheadSagittaria pygmaea Miq. Dwarf arrowheadSalix aegyptiaca L.* Asian sallowSalix alba L.* White willowSalix cinerea L.* Common sallowSalix exigua Nutt.* Sandbar willowSalix fragilis L.* Crack willowSalix glaucophylloides Fernald* Dune willowSalix humboltiana Willd.* Pencil willowSalix L. spp. (all except S. babylonica L., S. calodendron [= S. × calodendron Wimm. = S. caprea L. × S. purpurea L. × S. viminalis L.], S. × reichardtii A.Kern [= S. caprea L. × S. cinerea L.], S. alba var caerulea)*
Willow, sallow, osier
Salix matsudana Koidz.* Tortured willow
• Working closer together – workshop example
• Which plants are weeds? – Sterile culti-vars – proper scientific basis
• Which list do we use? Lets simplify this
• Don’t play the blame game!• Talk to me – or my counterparts in your
states• Considered education program
References and acknowledgementsThe following resources were used in the preparation of this presentation:• Weeds Australia website: http://www.
weeds.org.au• Weeds CRC – various publications,
press releases and website: http://www.weeds.crc.org.au
• Enviroweeds • Weekly Times – Various clippings and
lettersThank you to WSV for invitation to attend and speak, to the various nurseries that have contributed to this presentation and other stakeholders that I work with in this area that assisted us.
24 Weed Society of Victoria Second Victorian Weed Conference ‘Smart Weed Control, Managing for Success’ 17–18 August 2005
The aim of the Sustainable Garden Cen-tre environmental accreditation project is to provide retail garden businesses and home gardeners with a pathway to sus-tainability
Project development and structureSustainable Gardening Australia (SGA) worked with the University of Melbourne (Burnley Horticultural College), local gov-ernment and retail nurseries across Mel-bourne for 18 months to develop and trial an environmental accreditation for retail garden centres that was industry relevant and customer focused. From the onset SGA recognised the important role local government played, the importance of aligning with council initiatives and the valuable role SGA could play in building communication pathways between retail nurseries and local government.
The working group identified six key areas of sustainability relevant to the gar-dening:• Pesticides and herbicides• Composting and organic waste recy-
cling• Water conservation• Environmental weeds• Indigenous plants• Sustainable purchasing SGA Sustainable Garden Centres have to demonstrate ongoing commitment to all the key areas of the project and to undergo an annual audit. To be an accredited mem-ber of SGA, garden centres have to:• Develop policies and practices that
meet the internal best practice guide-lines of the project;
• Undergo staff training to ensure staff are giving reliable advice to home gar-deners and;
• Pro-actively promote, educate and in-fluence home gardeners to garden in a more sustainable manner by displaying the SGA ratings systems and education material.
Internal operationsTo obtain accreditation garden centres are required to address numerous envi-ronmental issues relating to chemical and water use, waste and energy reduction and promotion of indigenous plants and renewable products. Specifically with re-gard to weeds nurseries must:• Develop an Environmental Weed Poli-
cy and a Purchasing Policy
• Ensure no noxious weeds or DPI banned plants are sold
• Liaise with SGA and council to remove from sale the worst garden escapees of the local area
• Publicly display this list and include in staff manual and plant buyers guide
• Tag with an SGA Weed Warning label any other plants council may be con-cerned about
• Remove any weeds from the nursery display gardens e.g. car park
• Patrol the nursery boundary monthly for escapees
Sustainable Garden Centres are audited annually to encourage businesses to in-crementally and continually improve their environmental performance.
Staff trainingTo achieve accreditation garden centre staff undertake a training course in sustainable gardening to ensure they are aware of the environmental issues and provide appro-priate advice to customers. This training incorporates the free TAFE accredited Our Water Our Future Green Gardeners course developed and delivered by SGA with funding from Our Water Our Future, Mel-bourne Water and the Catchment Man-agement Authorities. Within this training program there is a focus on the impact of weeds on the natural environment, the responsibility of the horticultural and gardening industries, identification of lo-cal environmental weeds and alternative plant species to recommend to customers.
Customer education materialThe SGA working group has developed and trialled a number of customer edu-cation tools including posters displayed at the point of sale when the gardener is making a purchasing decision. SGA en-courages the gardener to think about the issues and make a decision that will have a positive environmental impact beyond their backyard. Sustainable Garden Cen-tres also distribute council publications on weeds and indigenous plants.
SGA has detailed information sheets on their website that customers are referred to as well a monthly magazine that fo-cuses on a weed and alternative species each month. Twenty six mainstream gar-den centres are currently committed to the project.
Sustainable garden centre project
Mary Trigger, Sustainable Gardening Australia, 6 Manningham Road West, Bulleen, Victoria 3105. Email: [email protected]
Weed Society of Victoria Second Victorian Weed Conference ‘Smart Weed Control, Managing for Success’ 17–18 August 2005 25
Summary The olive tree is known world-wide for its symbolism, aesthetics and gas-tronomic value. Unfortunately the olive have also naturalised and invaded native vegetation in many areas, reducing bio-diversity.
The olive industry in Australia is rap-idly developing with many groves being established in new areas. The increased number and distribution of olive groves threatens native vegetation. South Aus-tralia and Tasmania have addressed this issue by developing management strate-gies. Despite significant industry devel-opment in Victoria, the government and industry has not yet addressed the issue.
This paper considers the influence of the environment and potential management on olive dispersal and growth. This data was incorporated into distribution models which showed Victoria’s climate and en-vironment is well suited to olives. Unless properly managed, the current expansion in olives plantings will pose a very high risk to Victoria’s remnant bushland.
It is recommended that: 1). The Victori-an government and olive industry address the issue of feral olives; 2). A stakeholder group be formed to examine the issue; 3). An education and awareness campaign be implemented; 4). Risk management guide-lines be developed for olive groves; 5). Ex-isting and new feral olive trees be control-led; and 6). The potential for preventing new olive groves in high-risk areas using a weed risk assessment be further inves-tigated.
IntroductionThe olive tree (Olea europaea ssp. europaea) is known worldwide for its symbolism, aesthetics, hardiness and the gastronomic value of the olive fruit (drupe). The olive industry is currently undergoing a period of significant expansion in Australia. Large numbers of new olive groves have been established throughout the country, many of them in Victoria. The current industry expansion is in somewhat of a renaissance, as there have been past expansions and contractions in the olive industry, particu-larly in South Australia.
The early development and contrac-tion of the olive industry resulted in olive seeds dispersing from abandoned groves, causing a major weed problem of feral ol-ives. There is concern that if not properly managed, the current industry expansion
with increased numbers and distribution of groves will provide a seed source for new generations of feral olives with a much wider distribution (Bass et al. 2004).
In response to this concern South Aus-tralia and Tasmania have initiated strate-gies to manage the risk of olives dispersing off farm. These have included education campaigns, grove registration, research activities, and the development of Weed Risk Assessments for the approval of new olive groves (APCC 1999, Hanson 2002).
Despite significant olive industry de-velopment in Victoria, the industry or government has not yet developed any management strategies for the issue of feral olives. The management strategies devised by South Australia and Tasmania could provide a guideline for developing strategies for Victoria. However, differing legislative and natural environments re-quire a strategy specific to Victoria.
Present industry situationThe olive industry in Australia has rapidly developed in the past decade. The new and existing groves range in size from very small to large investment driven corporate groves (Kailis and Sweeney 2002). Most growers entering the industry are small, with farm diversification projects or hob-by farms of less than 5000 trees (D’Emden 2001, Davies 2002). While estimations and
surveys of olive tree numbers in Australia have ranged between 3.8–9.6 million trees (Table 1), there is a lack of accurate infor-mation about the size and distribution of the olive industry in Australia (Davies 2002, King 2004).
Victorian olive industryThere is little information about the cur-rent size and distribution of the industry in Victoria. Various estimates of indus-try size place the Victorian industry be-tween 596 000 (ABS 2001) and 2.6 million (Sweeney 2002), (Table 1). Importantly, the census indicated a large number of recent plantings with 89% of the trees less than six years old (ABS 2001), suggesting many trees were yet to come into full produc-tion.
Olives are grown throughout Victoria with the ABS finding the largest concentra-tion of olive trees is in the Swan Hill region (233 529). There are also large numbers of trees in the South Grampians (54 696), Horsham (54 013), Loddon (33 866), and Moira regions (32 252) (Figure 1). Current data sets (Table 1, Figure 1) are likely to underestimate the distribution of olive trees, as there have been significant plant-ings since the time of the census.
Olive ecological attributesRainfallWhile it is considered commercial produc-tion of olives should receive between 700 to 1100 mm of water annually (Booth and Davies 1996). Feral olives are able to grow, reproduce and invade new areas with much lower annual rainfall, being highly invasive where annual rainfall is 500–800 mm (Cooke 1989, Parsons and Cuthbert-son 1992, Muyt 2001) but capable of sur-viving in regions with less than 400 mm annual rainfall (Crossman et al. 2002), but
Table 1. Estimations of tree numbers in AustraliaTree numbers
from 2000/2001 censusA
Tree numbers based on nursery sales and orders
1990–2002B
Approximate olive tree
numbers as of 2001C
Sales as at June 2002 + orders for
2002–2003D
VIC 596 040 1 561 677 2 300 000 2 657 416NSW 785 965 1 926 117 2 000 000 2 209 050SA 856 443 1 255 792 1 500 000 1 767 519WA 843 989 1 602 790 1 300 000 1 418 240QLD 746 429 1 096 520 1 200 000 1 241 020TAS 53 864 107 730 170 000 170 799NT 2 300 5 000 2 300ACT 1 700 Included in
NSWUnknown 100 000 100 100Australia 3 884 432 7 652 926 8 475 000 9 566 344A (ABS 2001); B (RIRDC 2002); C (Miller 2002 in Kailis and Considine 2002); D (Sweeney 2002)
Olives – new industry or environmental threat
Michael Laity and Ken Young, The University of Melbourne, Dookie Campus, Victoria 3647
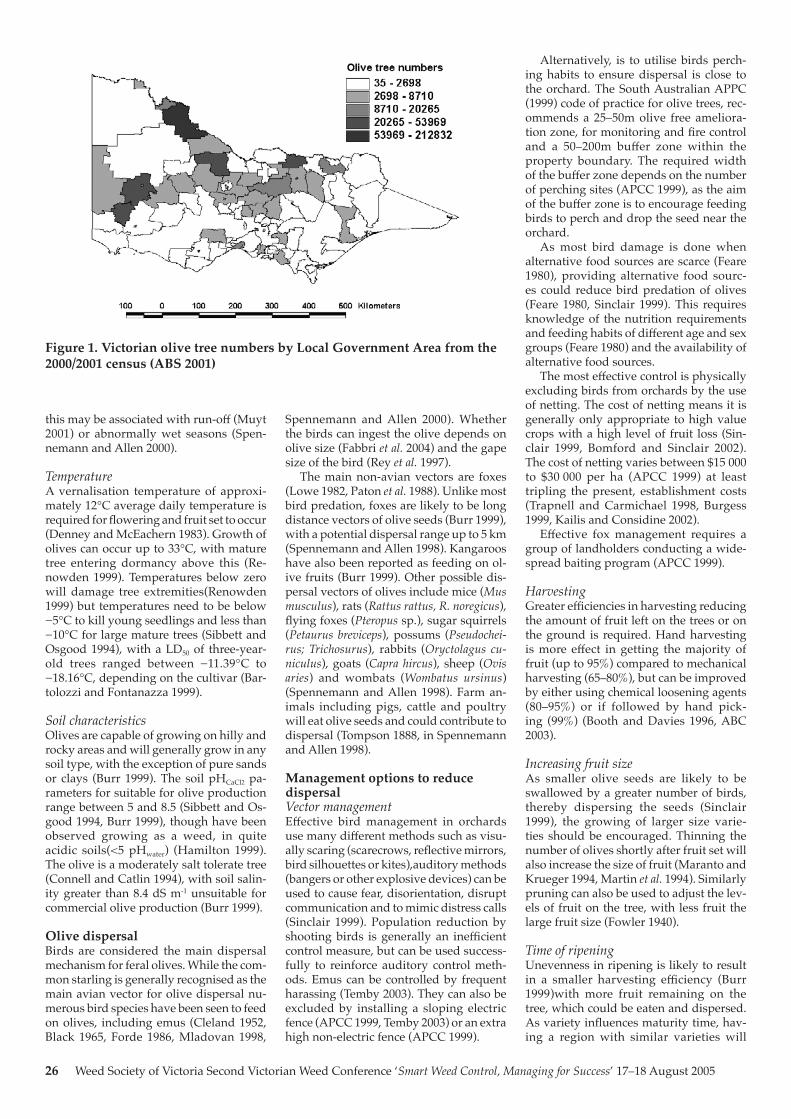
26 Weed Society of Victoria Second Victorian Weed Conference ‘Smart Weed Control, Managing for Success’ 17–18 August 2005
this may be associated with run-off (Muyt 2001) or abnormally wet seasons (Spen-nemann and Allen 2000).
TemperatureA vernalisation temperature of approxi-mately 12°C average daily temperature is required for flowering and fruit set to occur (Denney and McEachern 1983). Growth of olives can occur up to 33°C, with mature tree entering dormancy above this (Re-nowden 1999). Temperatures below zero will damage tree extremities(Renowden 1999) but temperatures need to be below −5°C to kill young seedlings and less than −10°C for large mature trees (Sibbett and Osgood 1994), with a LD50 of three-year-old trees ranged between −11.39°C to −18.16°C, depending on the cultivar (Bar-tolozzi and Fontanazza 1999).
Soil characteristicsOlives are capable of growing on hilly and rocky areas and will generally grow in any soil type, with the exception of pure sands or clays (Burr 1999). The soil pHCaCl2 pa-rameters for suitable for olive production range between 5 and 8.5 (Sibbett and Os-good 1994, Burr 1999), though have been observed growing as a weed, in quite acidic soils(<5 pHwater) (Hamilton 1999). The olive is a moderately salt tolerate tree (Connell and Catlin 1994), with soil salin-ity greater than 8.4 dS m-1 unsuitable for commercial olive production (Burr 1999).
Olive dispersalBirds are considered the main dispersal mechanism for feral olives. While the com-mon starling is generally recognised as the main avian vector for olive dispersal nu-merous bird species have been seen to feed on olives, including emus (Cleland 1952, Black 1965, Forde 1986, Mladovan 1998,
Spennemann and Allen 2000). Whether the birds can ingest the olive depends on olive size (Fabbri et al. 2004) and the gape size of the bird (Rey et al. 1997).
The main non-avian vectors are foxes (Lowe 1982, Paton et al. 1988). Unlike most bird predation, foxes are likely to be long distance vectors of olive seeds (Burr 1999), with a potential dispersal range up to 5 km (Spennemann and Allen 1998). Kangaroos have also been reported as feeding on ol-ive fruits (Burr 1999). Other possible dis-persal vectors of olives include mice (Mus musculus), rats (Rattus rattus, R. noregicus), flying foxes (Pteropus sp.), sugar squirrels (Petaurus breviceps), possums (Pseudochei-rus; Trichosurus), rabbits (Oryctolagus cu-niculus), goats (Capra hircus), sheep (Ovis aries) and wombats (Wombatus ursinus) (Spennemann and Allen 1998). Farm an-imals including pigs, cattle and poultry will eat olive seeds and could contribute to dispersal (Tompson 1888, in Spennemann and Allen 1998).
Management options to reduce dispersalVector managementEffective bird management in orchards use many different methods such as visu-ally scaring (scarecrows, reflective mirrors, bird silhouettes or kites),auditory methods (bangers or other explosive devices) can be used to cause fear, disorientation, disrupt communication and to mimic distress calls (Sinclair 1999). Population reduction by shooting birds is generally an inefficient control measure, but can be used success-fully to reinforce auditory control meth-ods. Emus can be controlled by frequent harassing (Temby 2003). They can also be excluded by installing a sloping electric fence (APCC 1999, Temby 2003) or an extra high non-electric fence (APCC 1999).
Alternatively, is to utilise birds perch-ing habits to ensure dispersal is close to the orchard. The South Australian APPC (1999) code of practice for olive trees, rec-ommends a 25–50m olive free ameliora-tion zone, for monitoring and fire control and a 50–200m buffer zone within the property boundary. The required width of the buffer zone depends on the number of perching sites (APCC 1999), as the aim of the buffer zone is to encourage feeding birds to perch and drop the seed near the orchard.
As most bird damage is done when alternative food sources are scarce (Feare 1980), providing alternative food sourc-es could reduce bird predation of olives (Feare 1980, Sinclair 1999). This requires knowledge of the nutrition requirements and feeding habits of different age and sex groups (Feare 1980) and the availability of alternative food sources.
The most effective control is physically excluding birds from orchards by the use of netting. The cost of netting means it is generally only appropriate to high value crops with a high level of fruit loss (Sin-clair 1999, Bomford and Sinclair 2002). The cost of netting varies between $15 000 to $30 000 per ha (APCC 1999) at least tripling the present, establishment costs (Trapnell and Carmichael 1998, Burgess 1999, Kailis and Considine 2002).
Effective fox management requires a group of landholders conducting a wide-spread baiting program (APCC 1999).
HarvestingGreater efficiencies in harvesting reducing the amount of fruit left on the trees or on the ground is required. Hand harvesting is more effect in getting the majority of fruit (up to 95%) compared to mechanical harvesting (65–80%), but can be improved by either using chemical loosening agents (80–95%) or if followed by hand pick-ing (99%) (Booth and Davies 1996, ABC 2003).
Increasing fruit sizeAs smaller olive seeds are likely to be swallowed by a greater number of birds, thereby dispersing the seeds (Sinclair 1999), the growing of larger size varie-ties should be encouraged. Thinning the number of olives shortly after fruit set will also increase the size of fruit (Maranto and Krueger 1994, Martin et al. 1994). Similarly pruning can also be used to adjust the lev-els of fruit on the tree, with less fruit the large fruit size (Fowler 1940).
Time of ripeningUnevenness in ripening is likely to result in a smaller harvesting efficiency (Burr 1999)with more fruit remaining on the tree, which could be eaten and dispersed. As variety influences maturity time, hav-ing a region with similar varieties will
Figure 1. Victorian olive tree numbers by Local Government Area from the 2000/2001 census (ABS 2001)
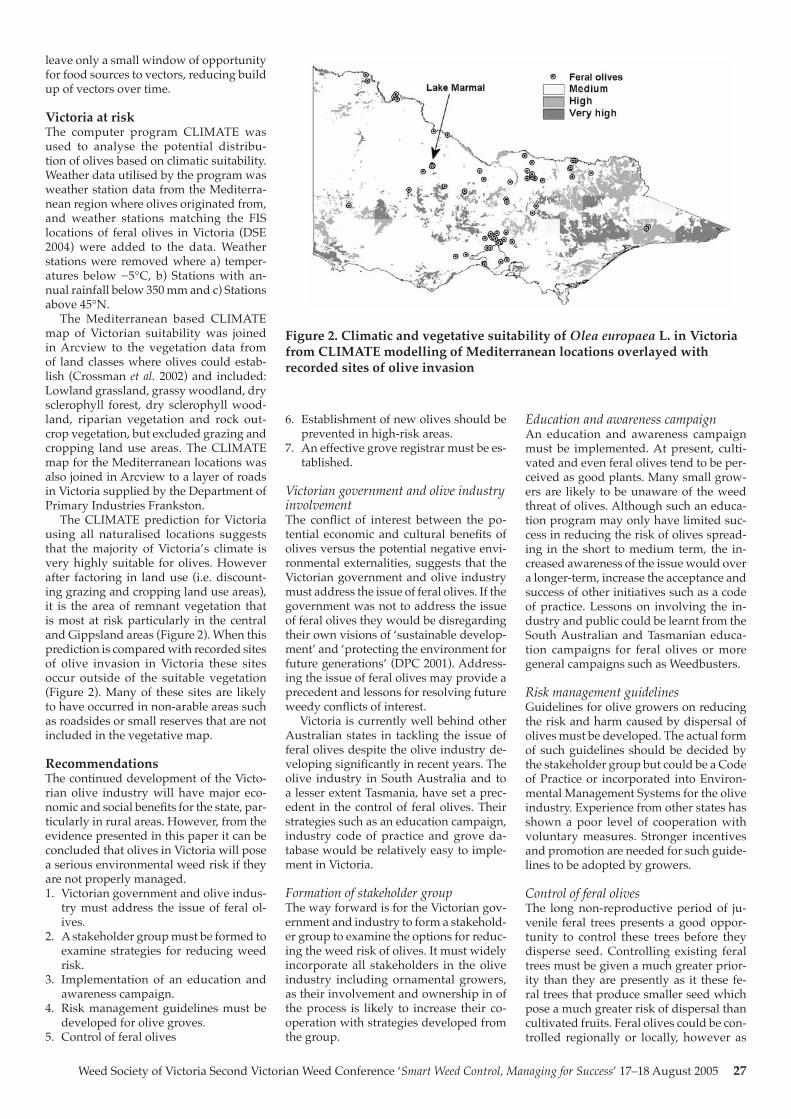
Weed Society of Victoria Second Victorian Weed Conference ‘Smart Weed Control, Managing for Success’ 17–18 August 2005 27
Figure 2. Climatic and vegetative suitability of Olea europaea L. in Victoria from CLIMATE modelling of Mediterranean locations overlayed with recorded sites of olive invasion
leave only a small window of opportunity for food sources to vectors, reducing build up of vectors over time.
Victoria at riskThe computer program CLIMATE was used to analyse the potential distribu-tion of olives based on climatic suitability. Weather data utilised by the program was weather station data from the Mediterra-nean region where olives originated from, and weather stations matching the FIS locations of feral olives in Victoria (DSE 2004) were added to the data. Weather stations were removed where a) temper-atures below −5°C, b) Stations with an-nual rainfall below 350 mm and c) Stations above 45°N.
The Mediterranean based CLIMATE map of Victorian suitability was joined in Arcview to the vegetation data from of land classes where olives could estab-lish (Crossman et al. 2002) and included: Lowland grassland, grassy woodland, dry sclerophyll forest, dry sclerophyll wood-land, riparian vegetation and rock out-crop vegetation, but excluded grazing and cropping land use areas. The CLIMATE map for the Mediterranean locations was also joined in Arcview to a layer of roads in Victoria supplied by the Department of Primary Industries Frankston.
The CLIMATE prediction for Victoria using all naturalised locations suggests that the majority of Victoria’s climate is very highly suitable for olives. However after factoring in land use (i.e. discount-ing grazing and cropping land use areas), it is the area of remnant vegetation that is most at risk particularly in the central and Gippsland areas (Figure 2). When this prediction is compared with recorded sites of olive invasion in Victoria these sites occur outside of the suitable vegetation (Figure 2). Many of these sites are likely to have occurred in non-arable areas such as roadsides or small reserves that are not included in the vegetative map.
RecommendationsThe continued development of the Victo-rian olive industry will have major eco-nomic and social benefits for the state, par-ticularly in rural areas. However, from the evidence presented in this paper it can be concluded that olives in Victoria will pose a serious environmental weed risk if they are not properly managed.1. Victorian government and olive indus-
try must address the issue of feral ol-ives.
2. A stakeholder group must be formed to examine strategies for reducing weed risk.
3. Implementation of an education and awareness campaign.
4. Risk management guidelines must be developed for olive groves.
5. Control of feral olives
6. Establishment of new olives should be prevented in high-risk areas.
7. An effective grove registrar must be es-tablished.
Victorian government and olive industry involvementThe conflict of interest between the po-tential economic and cultural benefits of olives versus the potential negative envi-ronmental externalities, suggests that the Victorian government and olive industry must address the issue of feral olives. If the government was not to address the issue of feral olives they would be disregarding their own visions of ‘sustainable develop-ment’ and ‘protecting the environment for future generations’ (DPC 2001). Address-ing the issue of feral olives may provide a precedent and lessons for resolving future weedy conflicts of interest.
Victoria is currently well behind other Australian states in tackling the issue of feral olives despite the olive industry de-veloping significantly in recent years. The olive industry in South Australia and to a lesser extent Tasmania, have set a prec-edent in the control of feral olives. Their strategies such as an education campaign, industry code of practice and grove da-tabase would be relatively easy to imple-ment in Victoria.
Formation of stakeholder groupThe way forward is for the Victorian gov-ernment and industry to form a stakehold-er group to examine the options for reduc-ing the weed risk of olives. It must widely incorporate all stakeholders in the olive industry including ornamental growers, as their involvement and ownership in of the process is likely to increase their co-operation with strategies developed from the group.
Education and awareness campaignAn education and awareness campaign must be implemented. At present, culti-vated and even feral olives tend to be per-ceived as good plants. Many small grow-ers are likely to be unaware of the weed threat of olives. Although such an educa-tion program may only have limited suc-cess in reducing the risk of olives spread-ing in the short to medium term, the in-creased awareness of the issue would over a longer-term, increase the acceptance and success of other initiatives such as a code of practice. Lessons on involving the in-dustry and public could be learnt from the South Australian and Tasmanian educa-tion campaigns for feral olives or more general campaigns such as Weedbusters.
Risk management guidelinesGuidelines for olive growers on reducing the risk and harm caused by dispersal of olives must be developed. The actual form of such guidelines should be decided by the stakeholder group but could be a Code of Practice or incorporated into Environ-mental Management Systems for the olive industry. Experience from other states has shown a poor level of cooperation with voluntary measures. Stronger incentives and promotion are needed for such guide-lines to be adopted by growers.
Control of feral olivesThe long non-reproductive period of ju-venile feral trees presents a good oppor-tunity to control these trees before they disperse seed. Controlling existing feral trees must be given a much greater prior-ity than they are presently as it these fe-ral trees that produce smaller seed which pose a much greater risk of dispersal than cultivated fruits. Feral olives could be con-trolled regionally or locally, however as
28 Weed Society of Victoria Second Victorian Weed Conference ‘Smart Weed Control, Managing for Success’ 17–18 August 2005
olives appear to pose a weed risk through-out the state, a statewide approach should be adopted. Although the current Victo-rian noxious weed legislation doesn’t cur-rently have the capacity to differentiate between commercial and feral plants, as the South Australian legislation does, it is recommended that unharvested or feral olives should be declared a noxious weed, requiring control and a legally enforceable requirement to control or remove unhar-vested groves.
Olives in high-risk areas.The single most effective method to pre-vent invasion of feral olives into ecologi-cally sensitive areas is by not allowing high-risk groves to be established near those areas. This could be done in Victo-ria, as it has been in South Australia by developing a Weed Risk Assessment for new olive groves. Such a Weed Risk As-sessment would need to assess the likeli-hood of dispersal and the harm caused by successful dispersal. The South Austral-ian model provides a good example where groves assessed as higher risk are more restricted.
A detailed study of dispersal from com-mercial groves would benefit both the de-velopment of a WRA and code of practice. The study should include historical studies of distances and pattern of dispersal and current studies of dispersal, examining the dispersal characteristics of commer-cial groves, particularly the relationship between management, drupe size and dis-persal. Some of this information may arise from current and planned research activi-ties around the Dookie district by the Uni-versity of Melbourne (Hamilton personal communication 2004).
Grove registration A complete grove register is particularly important for groves in high-risk areas as it would provide information for im-plementing monitoring and control pro-grams. The experience from South Aus-tralia and Tasmania suggest voluntary grove registers are unlikely to be effective in Victoria, without significant incentives. Victoria should investigate the potential for compulsory registration or compiling a register of existing groves using tech-niques such as remote sensing or drive by surveys.
A National approachThere have been calls for a national ap-proach to the problem of feral olives (Bass et al. 2004) and a levy to help fund olive removal (ABC News 2003). Initiatives such as an education program led by the Australian Olive Association would have long-term benefits and should be imple-mented. The Adoption a similar weed management strategy to other states (e.g. WRA and COP), would be beneficial in
presenting a united effort to tackle the is-sue.
ConclusionVictoria is well suited to grow olives as is demonstrated by the increase in the number of orchards being established. This suitability also presents a risk to the native vegetation as olives have proven to be a major invasive species in Australia and overseas. It is imperative that both the olive industry and the Victorian govern-ment implement strategies to stop or at least minimise off farm dispersal of olives, while allowing for the expansion of this industry.
ReferencesABC (2003). Olive harvester special. ABC,
Landline, Australia.ABC News (2003). Weed controllers ask
olive growers to foot bill for ‘feral’ trees. ABC Rural News, 11 Feb.
ABS (2001). Agricultural Census Data for 2000/01. Australian Bureau of Statis-tics, Canberra, ACT.
APCC (1999). Risk assessment and man-agement of olives. Animal and Plant Control Commission, Primary Indus-tries and Resources South Australia.
Bartolozzi, F. and Fontanazza, G. (1999). Assessment of frost tolerance in olive (Olea europaea L.). Scientia Horticulturae 81, 309-19.
Bass, D., Crossman, N.D., Richards, N. and Virtue, J.G. (2004). WMSSA Inc. submis-sion to the Inquiry into the regulation, control and management of invasive species and the Environment Protection and Biodiversity Conservation Amend-ment (Invasive Species) Bill 2002. Weed Management Society of South Australia Inc, Adelaide, SA.
Black, J.M. (1965). ‘Flora of South Aus-tralia: Part IV Oleaceae–Compositae’. (South Australian Branch of the British Science Guild Handbooks Committee, Adelaide).
Bomford, M. and Sinclair, R. (2002). Aus-tralian research on bird pests: impact, management and future directions. Emu 102, 29-45.
Booth, N. and Davies, G. (1996). Olive growing in Southern Australia. Primary Industries South Australia.
Burgess, A. (1999). Initial cost estimates for the establishment of a 120 hectare olive grove. In ‘Realising the potential of olives’, ed. S. Field, pp. 32-43. (Salsi Pty Ltd, St Arnaud, Victoria).
Burr, M. (1999). Australian olives: A guide for growers and producers of virgin oils. Stepney, South Australia.
Cleland, J.B. (1952). Dispersal of plants by birds. South Australian Ornithologist 20 (7), 72-7.
Connell, J.H. and Catlin, P.B. (1994). Root physiology and rootstock characteris-tics. In ‘Olive production manual’, eds
L. Ferguson, G.S. Sibbett and G.C. Mar-tin. pp. 43-50. (University of California, Oakland, CA, USA).
Cooke, D.A. (1989). New records in the naturalised Flora of South Australia, II. South Australian Naturalist 63 (4), 100-6.
Crossman, N.D., Bass, D.A., Virtue, J.G. and Jupp, P.W. (2002). Feral olives (Olea europaea L.) in southern Australia: an issue of conservation concern. Ad-vances in Horticultural Science 16 (3/4), 175-83.
Davies, G. (2002). A discussion paper for updating the research and development plan for the Australian olive industry 2003–2008. R&D Plan for the Austral-ian Olive Industry 2003-2008. Rural Industries Research and Development Corporation, Kingston, ACT.
D’Emden, F. (2001). A strategic marketing analysis of the Western Australian ol-ive industry. AGWEST Trade and Mar-ket Development, Agriculture Western Australia.
Denney, J.O. and McEachern, G.R. (1983). An analysis of several climatic tempera-ture variables dealing with olive repro-duction. Journal of the American Society for Horticultural Science 108 (4), 578-81.
DPC (2001). Growing Victoria together. Department of Premier and Cabinet, Melbourne, Victoria.
DSE (2004). Flora Information System.Fabbri, A., Bartolini, G., Lambardi, M. and
Kailis S.G. (2004). ‘Olive propagation manual’. (Landlinks Press Colling-wood, Victoria)
Feare, D.J. (1980). The economics of star-ling damage. In ‘Bird problems in ag-riculture’, ed. E.N. Wright. pp. 39-55 (British Crop Protection Council Publi-cations, Croydon, UK).
Forde, N. (1986). Relationships between birds and fruits in temperate Austral-ia. In The dynamic partnership: birds and plants in Southern Australia, eds H.A. Ford and D.C. Paton, pp. 42-58. (The flora and fauna of South Australia Handbooks Committee, South Aus-tralia).
Fowler, R. (1940). Cultivation of the olive. The Journal of Agriculture, South Aus-tralia.
Hamilton, S. (1999). Dookie bushland re-serve draft management plan, p. 72. (The University of Melbourne, Dookie College).
Hamilton, S. (2004). Senior Lecturer, Dookie College, The University of Mel-bourne.
Hanson, C. (2002). A weed risk minimisa-tion strategy for the Tasmanian olive in-dustry. Department of Primary Indus-tries, Water and Environment, Kings Meadows, Tasmania.
Kailis, S.G. and Considine, J.A. (2002). The olive Olea europaea L. in Australia: 2000 onwards. Advances in Horticultural Sci-ence 16 (3/4), 299-306.
Weed Society of Victoria Second Victorian Weed Conference ‘Smart Weed Control, Managing for Success’ 17–18 August 2005 29
Kailis, S.G. and Sweeney, S. (2002). Olives in Australia. Acta Horticulturae 586, 385-3.
King, G. (2004). National olive growers levy: Consultative Draft – April 2004. Horticulture Australia and Kingsgrove Consulting, West Lakes, South Aus-tralia.
Lowe, D.W. (1982). The analysis of 701 fox scats from Morialta conservation park, South Australia. South Australian Natu-ralist 56 (4), 52-7.
Maranto, J. and Krueger, W.H. (1994). Ol-ive fruit thinning. In ‘Olive production manual’, eds. L. Ferguson, G.S. Sibbett and G.C. Martin pp. 87-89. (University of California Oakland, CA, USA).
Martin, G.C., Connell, J.H., Freeman, M.W., Krueger, W.H. and Sibbett, G.S. (1994). Efficacy of foliar application of two naphthaleneacetic acid salts for olive fruit thinning. Acta Horticulturae 356, 302-5.
Mladovan, L.M. (1998). Avian dispersal of the European olive Olea europaea, espe-cially by the common starling Sturnus vulgaris: ecological implications for weed management, p. 62. University of Adelaide, South Australia.
Muyt, A. (2001). ‘Bush Invaders of South-East Australia: a guide to the identifi-cation and control of environmental weeds found in South-East Australia’. (R.G. and F.J. Richardson, Melbourne, Victoria).
Parsons, W.T. and Cuthbertson, E.G. (1992). ‘Noxious weeds of Australia’. (Inkata Press, Melbourne).
Paton, D.C., Tucker, J.R., Paton, J.B. and Paton, P.A. (1988). Avian vectors of the seed of the European olive. Olea euro-paea. South Australian Ornithologist 30, 158-9.
Renowden, G. (1999). ‘The olive book’. (Canterbury University Press, Christch-urch, New Zealand).
Rey, P.J., Gutiérrez, J.E., Alcántara, J. and Valera, F. (1997). Fruit size in wild ol-ives: implications for avian seed disper-sal. Functional Ecology 11 (5), 611-18.
RIRDC (2002). R&D plant for the Aus-tralian olive industry 2003–2008, pp. 30. Rural Industries and Research and Development Corporation, Kingston, ACT.
Sibbett, G.S. and Osgood, J. (1994). Site selection and preparation, tree spacing and design, planting, and initial train-ing. In ‘Olive production manual’, eds L. Ferguson, G.S. Sibbett and G.C. Mar-tin, pp. 31-7. (University of California, Oakland, CA, USA).
Sinclair, R. (1999). Birds: guidelines for best practice bird control to protect commercial olive orchards and mini-mise the risk of seed dispersal. Risk As-sessment and Management of Olives, Animal and Plant Control Commis-sion, Primary Industries and Resources South Australia.
Spennemann, D.H.R. and Allen, L.R. (1998). The spread of Olives (Olea sp.) on Wagga Wagga Campus. II. Distribu-tion and dispersal. Johnstone Centre of Parks, Recreation and Heritage, Albury, NSW.
Spennemann, D.H.R. and Allen, L.R. (2000). The avian dispersal of olives Olea europaea: implications for Austral-ia. Emu, Journal of the Royal Australasian Ornithologists Union 100 (4), 264-73.
Sweeney, S. (2002). Olive tree numbers 2002. The Olive Press 26, Summer 2002.
Temby, I. (2003). Emu. Victoria, Flora and Fauna Notes, Department of Sustain-ability and Environment.
Trapnell, L. and Carmichael, S. (1998). Making money from olives – a possi-bility for diversification in north east-ern Victoria. Department of Natural Resources and Environment, Benalla, Victoria.
30 Weed Society of Victoria Second Victorian Weed Conference ‘Smart Weed Control, Managing for Success’ 17–18 August 2005
Abstract Early detection of the aquatic Weeds of National Significance (WoNS) is essential for successful eradication or containment. Unfortunately this concept has not been widely adopted in Australia, resulting in these and many other aquatic weed species proliferating largely unnoticed at many locations.
Cabomba (Cabomba caroliniana), one of the aquatic WoNS, poses a serious threat to waterways in all States and Territories. Attractive, hardy and easy to grow, ably describes this plant that enjoyed immense popularity with aquarium and fishpond enthusiasts. It’s widely believed that this plant was deliberately planted in water-ways to meet retail demand and many such plantings may remain undiscovered today, posing a `serious risk to water-ways.
Keywords Aquatic weeds, cabomba, early detection, waterways.
IntroductionThe aquatic Weeds of National Signifi-cance (WoNS) include alligator weed (Alternanthera philoxeroides), cabomba (Cabomba caroliniana) and salvinia (Salvinia molesta), each an aquatic plant from South America. These species cause considerable environmental and economic impacts and have potential to spread to waterways in all states and territories. This paper will outline the threat of the aquatic Weeds of National Significance, using cabomba as a case study and will highlight processes and benefits for implementing aquatic WoNS early detection procedures.
What is cabomba? Cabomba, a submerged aquatic plant native to parts of both North and South America, is a hardy perennial that fa-vours slow moving or still waterbodies. Although cabomba flowers it is known to only reproduce vegetatively, although there are anecdotal reports of seeding populations in the Northern Territory. It tolerates a wide range of water tempera-tures, including tropical and cool temper-ate waters. CLIMEX modelling suggests its potential distribution includes all states and territories with excellent habitat
conditions in eastern and southern Aus-tralia (ARMCANZ 2000).
Cabomba was introduced to Australia for the aquarium trade and by the mid 1980s naturalised populations of cabomba were been discovered. Such infestations were either the result of aquatic plant trad-ers deliberately seeding waterways for commercial purposes or through aquarium dumpings. Infestations of cabomba have since been discovered at various sites on coastal Queensland and NSW from Cairns to Sydney, Katoomba NSW, Darwin and the nearby Darwin River, and Lake Nag-ambie and Lake Benalla in Victoria.
These infestations occupy only a frac-tion of its potential range. It’s feared that due to the plants submerged and hard to detect nature many infestations are yet to be discovered so its true distribution could be much greater than what is cur-rently known.
The cabomba threat Cabomba is a WoNS due to its invasive-ness, potential to spread and its potential economic, social and environmental im-pacts (Thorp and Lynch 2000). Cabomba tends to invade slow moving or ponded waterways where it can form dense un-derwater thickets. Such thickets can:• dangerously interfere with swimming
and boating activities• deplete oxygen and light levels in the
water, which reduces fish stocks• replace native aquatic plants • clog irrigation channels and water in-
takes• increase water treatment costs.In addition cabomba is proving to be a dif-ficult plant to manage. Herbicide appli-cations are difficult due to its submerged nature and currently there are no biologi-cal controls. Mechanical harvesting and lowering of water bodies are feasible but are expensive.
The problematic nature of cabomba and its status as a WoNS has seen the plant banned from sale in all states and territories except Victoria. The ongoing legal trade of cabomba in Victoria poses an unnecessary risk of further cabom-ba infestations eventuating through
either plant trading or dumped aquarium plants in Victoria but in all states and territories.
The following two case studies illus-trate the problematic nature of this aquatic WoNS.
Case study 1 – Impacts of cabomba on Northern Territory waterwaysSince its detection in the Northern Ter-ritory (NT) in 1997 in a man made lake, cabomba has proven to be a difficult plant to manage. All attempts at control using various physical methods including hand-pulling, draining the lake, dredging the lake and shading infestations failed over the next four years. In 2002 a single ap-plication of 2,4-D n-butyl ester plus dia-tomaceous earth resulted in the disappear-ance of the species from the lake which has been confirmed by monitoring the site on a monthly basis since then.
In October 2004 cabomba was again re-corded in the NT, however this time it was found in a natural and pristine waterway over an 11 km stretch of the Darwin River. A massive publicity and awareness cam-paign immediately following this resulted in a further 13 sites being positively identi-fied in backyards, ponds and fish tanks in suburban Darwin, with one record 200 km south at Pine Creek.
The Darwin river site is complex from the point of management due to the wide range of land use groups and land tenures in addition to the river being a potable wa-ter supply. A herbicide control program commenced late in 2004, with three treat-ments occurring before the on set of the Wet Season in late December. Only one live plant was found on December 17 2004, however by July 2005 cabomba had recov-ered to approximately 60% of the infesta-tion level mapped prior to treatment. Fur-ther control operations are scheduled to recommence in August with priority given to fine tuning application techniques as further developments occur.
Case Study 2 – Sunshine Coast, South-East QueenslandCabomba was first noticed in Lake Mac-donald and the Ewen Maddock Dam in 1991. At the time these two impound-ments were the major potable water sup-plies for Noosa and Caloundra Shires, respectively.
Various methods have been used in the fight against this most tenacious of aquatic bullies. At Ewen Maddock dam, mechanical harvesting, draw down, and the current method of using a venturi (or underwater vacuum cleaner), operated by divers, have achieved some degree of control but at considerable economic cost. Cost as at June 2005 was $176.00 per hour to operate.
At Lake Macdonald, in the Noosa hin-terland, cabomba grows in water up to
Aquatic weeds of national significance – coming to a waterway near you!
Phil MoranA, Andrew PetroeschevskyB and Steve WingraveC
A Lake Macdonald Catchment Care Group, Tewantin, Queensland 4565B New South Wales Department of Primary Industries, Grafton, New South Wales 2460C Department of Infrastructure, Planning and Environment, Palmerston, Northern Territory 0830
Weed Society of Victoria Second Victorian Weed Conference ‘Smart Weed Control, Managing for Success’ 17–18 August 2005 31
10 metres deep, with foliage increasing to-wards the light (surface). This foliage pre-vents light from reaching the floor of the Lake resulting in the decimation of a once vibrant native aquatic plant population. Where healthy clumps of Potamogeton cris-pus and Vallisneria nana once thrived, the area is now an underwater desert. Watch-ing underwater video transects is depress-ing, as well as boring… pitch black, and nothing, apart from cabomba. This South American bully has drastically reduced the ecological diversity of this water body.
Adding to these ecological impacts was the need to ban swimming and boating activities in the lake due to safety concerns and to reduce the risk of the plant spread-ing. Other recreational activities such as sailing, canoeing and fishing are all activi-ties hampered by cabomba.
Managing the Lake Macdonald infes-tation is an expensive and ongoing task, made more difficult due to it being a po-table water supply (thus herbicides are not an option). A purpose built aquatic harvester has actively cut and removed cabomba from the lake for the last four years. At its peak, the harvester was re-moving up to nine tons of cut Cabomba per day. Due to heavy metal concerns (no-tably manganese at 5400 mg kg-1) harvest-ed Cabomba is classified as contaminated waste and requires disposal at landfill sites, thus increasing treatment costs.
Unsuccessful attempts to reintroduce native plants to help manage cabomba were made by the Lake Macdonald Catch-ment Care Group, and Caloundra Council (Ewen Maddock Dam). Whilst establish-ment was successful, predation by birds and other aquatic animals severely limited the long-term survival of these introduc-tions.
How early detection programs can helpEarly detection and treatment of cabomba and other aquatic weed infestations is an essential preventative measure that can help avoid the problems listed previously. Containment or eradication of submerged aquatic weeds such as cabomba are only possible if infestations are detected and treated whilst small (generally less than 1 ha in size). Early detection efforts increase the likelihood of successful eradication or containment whilst populations are still low, resulting in significant long term cost savings and protection of downstream aquatic habitat (National Invasive Species Council 2003).
Early detection can involve:1. active detection programs, and2. passive detection programs.Active detection programs involve weed control authorities methodically survey-ing designated areas for prioritised aquat-ic weeds. In Australia, methodologies for undertaking such surveys have been
developed that provide effective detec-tion tools whilst meeting end user re-quirements in terms of minimal time and skill levels required (Watts 2003, NAWMG 2005). Such methodologies provide a proc-ess to:1. identify and prioritise high risk aquatic
weeds,2. identifying high risk sites of aquatic
weed invasion and establishment,3. inspecting high risk sites,4. data collection, and5. post reconnaissance survey tasks. These methodologies are also simple enough to allow participation from exist-ing volunteer weed detection networks or community organisations such as Water-watch. With minimal training and provi-sion of identification aids, volunteers can increase the effectiveness of established active detection programs.
Passive detection programs involve people reporting infestations they fortui-tously detect as they conduct other activi-ties. Such programs can be established by increasing awareness and identification skills amongst those people most likely to notice an aquatic weed incursion. They in-clude natural resource management staff, fishing and boating enthusiasts, Water-watch and other community groups.
Early detection of aquatic weeds is a relatively new concept in Australia with only few existing efforts, mostly conduct-ed at local scales. However, implementing early detection programs is a key national priority listed in the National Cabomba strategy and for the National Aquatic Weeds Management Group. It is hoped that through the Defeating the Weeds Menace program adequate resources can help establish such programs in areas of Australia thought to be at high risk of aquatic weed invasion. Once established, such programs will require long term sup-port and commitment from weed control authorities, weed detection networks and community groups.
ConclusionDespite its limited distribution cabomba, a WoNS, poses significant management challenges to weed control authorities where established populations exist. Its significant impacts and submerged habi-tat, rapid growth and hidden nature make it an extremely difficult plant to effectively manage. National management is also not helped by the fact that it can still be traded legally in Victoria.
A lesson learnt from infestations throughout Australia is the important role early detection programs could play in preventing future cabomba and other aquatic weed outbreaks. Methodologies for aquatic weed early detection are avail-able. Long term benefits of their imple-mentation will out way their costs and will help preserve our waterways.
ReferencesAgriculture and Resource Management
Council of Australia and New Zealand. (2000). Weeds of national significance, cabomba strategic plan. (National Weeds Strategy Executive Committee Launceston).
National Aquatic Weeds Management Group (2005). ‘Aquatic weeds recon-naissance survey’. (Unpublished docu-ment).
National Invasive Species Council (2003). ‘General guidelines for the establish-ment and evaluation of infestive species early detection and response systems. Version 1’. (National Invasive Species Council, Washington DC).
Thorp, J.R. and Lynch, R. (2000). ‘The de-termination of weeds of national sig-nificance’. (National Weeds Strategy Executive Committee, Launceston).
Watt, J. (2003). ‘Management plan for early detection and response to aquatic weed to aquatic weed incursions’. (Flinders University, Adelaide).
32 Weed Society of Victoria Second Victorian Weed Conference ‘Smart Weed Control, Managing for Success’ 17–18 August 2005
Summary The Victorian Government is placing a high priority on potential, new and emerging weeds. Preventing the es-tablishment of serious weeds is a worth-while government investment. It saves money, protects the environment and may reduce the impact on human health.
The Department of Primary Industries (DPI), and the Department of Sustainabil-ity and Environment (DSE) have devel-oped the Weed Alert Rapid Response pro-gram to target potential, new and emerg-ing weeds in Victoria. The main focus is on surveillance, collection, identification, assessment and response. A network of Weed Spotters has been established to look for new weeds and report them when found. More intensive surveillance programs are being conducted for serious potential weeds.
An outbreak of the parasitic weed branched broomrape (Orobanche ramosa) in the Murray Bridge region of South Australia is threatening agricultural pro-duction in Victoria. Trace-back opera-tions in South Australia have identified 34 Victorian properties linked to the South Australia infestation. To stop this poten-tial incursion, the Victorian Government has set up an “Operation Rapid Response – Branched Broomrape Team” in much the same way as a team is put together to deal with natural disasters. This team has over-seen the surveillance for this weed in Vic-toria and raised awareness of the problem with key stakeholders and the Victorian community.
Keywords Branched broomrape, Orobanche ramosa, eradication, weed alert, weed incursion, weed surveillance.
IntroductionHistorically, weed management priorities have been dictated by weed economics. Weed policy was directed by the number of weed complaints government depart-ments received from farmers. This meant that by the time action happened, the weed was already out of control and be-yond eradication. More recently, weed
science has provided more information on the potential distributions and impacts of new and emerging weeds (Kriticos and Randall 2001). It has become evident that governments can get much better value by either preventing weed species com-ing into Australia or by identifying new weed species very early in their colonisa-tion phase and targeting their suppression or eradication. Today’s management pays attention to the principle of ‘prevention is better than cure’ as opposed to the past philosophy of ‘treating weed problems as they arise’ (Csurhes and Edwards 1998).
The recent identification of new out-breaks of branched broomrape, Orobanche ramosa Linnaeus in South Australia has highlighted the importance of pro-active weed alerts and rapid responses in Victo-ria. O. ramosa is an obligate root parasite of a wide range of broad-leaved plants and its distribution extends from central Europe, the Middle East and northern Africa. It has been introduced to a number of other re-gions, including South Africa, Mali, Aus-tralia, Cuba and several sites in Central America and the USA (Parker and Riches 1993). The potential hosts of O. ramosa in Australia have been listed by Virtue et al. (2002) and include species such as canola, cabbage, tomato, potato, carrot, coriander, vetch, faba bean, lupin, chickpea, lucerne, burr medic, annual white clover, lettuce, safflower and sunflower. It has also been found attacking various weeds and na-tive herbs. An economic assessment of the potential costs of O. ramosa to Australia has estimated that if left uncontrolled, infestations could cost Australia $240.7 million within five years and as much as $2.1 billion within 25 years, with the main impacts on oilseed, pulse and vegetable cropping and through rejection of exports such as cereal grains contaminated with broomrape seed (Milne 2000).
The history of O. ramosa introduction and spread in Australia is described in Jupp et al. 1992. The infestation is located in the Murray Bridge area of South Australia and extends over an area of approximately 70
km by 70 km. In 2005, infestations in this region are confined to an area of approxi-mately 6500 ha with 457 properties under quarantine (Nick Secomb personal com-munication). There is a nationally funded eradication and containment program for this region costing approximately $2 mil-lion per annum, supported by the Federal and State Governments and industry. It has seen extensive surveys, tracebacks, imple-mentation of quarantine (Jupp et al. 1992), research into herbicides (Mathews 2002), and research into its host range (Virtue et al. 2002). Concurrently, ongoing research is being carried out on fumigation, seed de-cay, identification (a genetic probe, sniffer dogs), vectors, lifecycle and seed disper-sal. Through the strict eradication and containment program in South Australia, approximately 32% of paddocks infested with O. ramosa in 2000 have remained free of O. ramosa through host denial (Nick Se-comb personal communication).
All broomrape (Orobanche) species are prohibited imports to Australia and have largely been kept out by quarantine con-trols, but the seeds could easily enter un-detected. The Australian Quarantine and Inspection Service (AQIS) is responsible for screening and vetting plant and plant product imports to ensure new weeds are not introduced. For example, AQIS is re-sponsible for monitoring the 52 000 aircraft that arrive annually, carrying in excess of 7.3 million passengers and aircrew and 1.8 million airfreight containers. Intercepting each and every illegal item and contami-nant is impossible. At seaports Australia wide, 10 000 ships dock annually carrying 1 million cargo containers, of which ap-proximately 5% are checked (Anon. 1999). Many of our trading partners prohibit all broomrapes, so Australian export markets will be severely affected if these plants be-come widely established. Branched broom-rape is a declared exotic disease under the Victorian Plant Health and Plant Products Act 1995 and is a State Prohibited Weed under the Victorian Catchment and Land Protection Act of 1994.
Materials and methodsUpon receiving notification in 1999 of the outbreaks of O. ramosa in South Australia and trace-backs (links to infected prop-erties through movement of produce, stock, machinery or other materials) to Victorian properties to infested areas in South Australia, the Victorian DPI called a meeting to develop a plan of how Vic-toria would respond. It was decided that branched broomrape should be treated like an emergency (i.e. bushfires) and a ‘Branched Broomrape Operation Rapid Response Team’ was set up. The team was structured according to the Australian Interservice Incident Management Sys-tem – Incident Control System. As such the team was composed of a program
Operation rapid response – dealing with the potential incursion of branched broomrape (Orobanche ramosa Linnaeus) into Victoria, Australia
David A. McLarenA,D, Kate BloodB,D and Geoff HarveyC
A Department of Primary Industries Frankston, PO Box 48, Frankston, Victoria 3199, email: [email protected] Department of Primary Industries, PO Box 7, Beaufort, Victoria 3373C Department of Primary Industries, PO Box 120, St Arnaud, Victoria 3478D CRC for Australian Weed Management
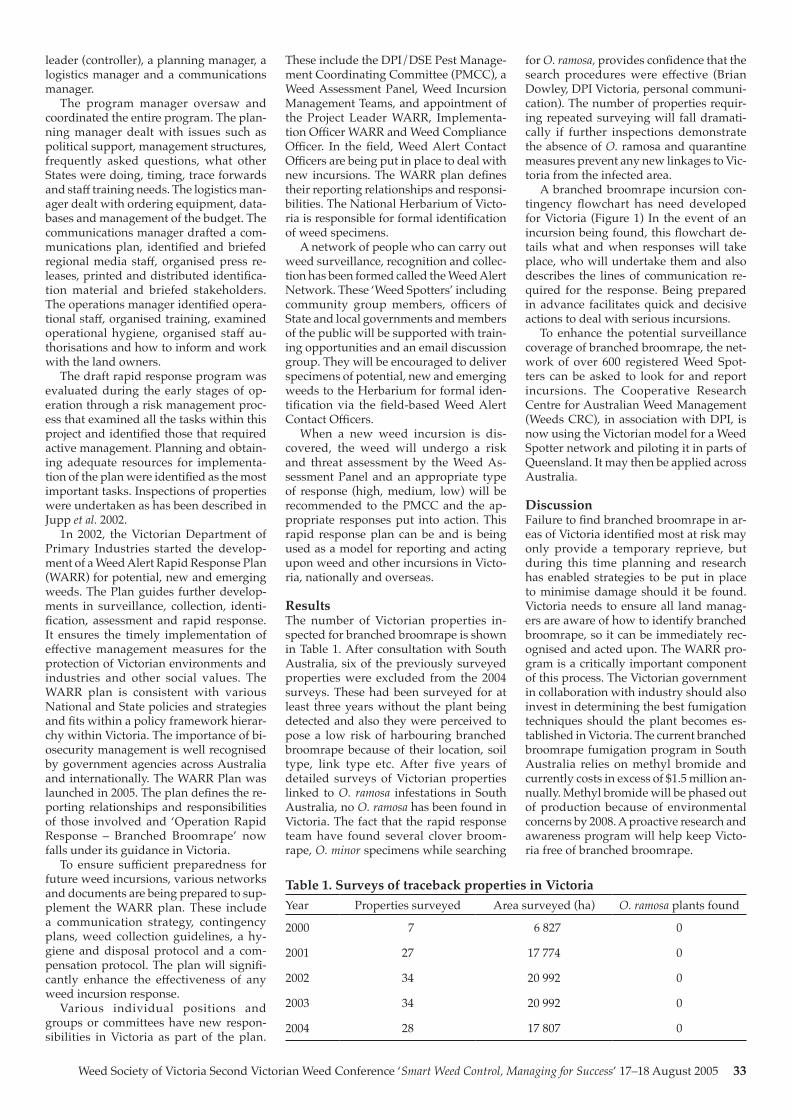
Weed Society of Victoria Second Victorian Weed Conference ‘Smart Weed Control, Managing for Success’ 17–18 August 2005 33
leader (controller), a planning manager, a logistics manager and a communications manager.
The program manager oversaw and coordinated the entire program. The plan-ning manager dealt with issues such as political support, management structures, frequently asked questions, what other States were doing, timing, trace forwards and staff training needs. The logistics man-ager dealt with ordering equipment, data-bases and management of the budget. The communications manager drafted a com-munications plan, identified and briefed regional media staff, organised press re-leases, printed and distributed identifica-tion material and briefed stakeholders. The operations manager identified opera-tional staff, organised training, examined operational hygiene, organised staff au-thorisations and how to inform and work with the land owners.
The draft rapid response program was evaluated during the early stages of op-eration through a risk management proc-ess that examined all the tasks within this project and identified those that required active management. Planning and obtain-ing adequate resources for implementa-tion of the plan were identified as the most important tasks. Inspections of properties were undertaken as has been described in Jupp et al. 2002.
1n 2002, the Victorian Department of Primary Industries started the develop-ment of a Weed Alert Rapid Response Plan (WARR) for potential, new and emerging weeds. The Plan guides further develop-ments in surveillance, collection, identi-fication, assessment and rapid response. It ensures the timely implementation of effective management measures for the protection of Victorian environments and industries and other social values. The WARR plan is consistent with various National and State policies and strategies and fits within a policy framework hierar-chy within Victoria. The importance of bi-osecurity management is well recognised by government agencies across Australia and internationally. The WARR Plan was launched in 2005. The plan defines the re-porting relationships and responsibilities of those involved and ‘Operation Rapid Response – Branched Broomrape’ now falls under its guidance in Victoria.
To ensure sufficient preparedness for future weed incursions, various networks and documents are being prepared to sup-plement the WARR plan. These include a communication strategy, contingency plans, weed collection guidelines, a hy-giene and disposal protocol and a com-pensation protocol. The plan will signifi-cantly enhance the effectiveness of any weed incursion response.
Various individual positions and groups or committees have new respon-sibilities in Victoria as part of the plan.
These include the DPI/DSE Pest Manage-ment Coordinating Committee (PMCC), a Weed Assessment Panel, Weed Incursion Management Teams, and appointment of the Project Leader WARR, Implementa-tion Officer WARR and Weed Compliance Officer. In the field, Weed Alert Contact Officers are being put in place to deal with new incursions. The WARR plan defines their reporting relationships and responsi-bilities. The National Herbarium of Victo-ria is responsible for formal identification of weed specimens.
A network of people who can carry out weed surveillance, recognition and collec-tion has been formed called the Weed Alert Network. These ‘Weed Spotters’ including community group members, officers of State and local governments and members of the public will be supported with train-ing opportunities and an email discussion group. They will be encouraged to deliver specimens of potential, new and emerging weeds to the Herbarium for formal iden-tification via the field-based Weed Alert Contact Officers.
When a new weed incursion is dis-covered, the weed will undergo a risk and threat assessment by the Weed As-sessment Panel and an appropriate type of response (high, medium, low) will be recommended to the PMCC and the ap-propriate responses put into action. This rapid response plan can be and is being used as a model for reporting and acting upon weed and other incursions in Victo-ria, nationally and overseas.
ResultsThe number of Victorian properties in-spected for branched broomrape is shown in Table 1. After consultation with South Australia, six of the previously surveyed properties were excluded from the 2004 surveys. These had been surveyed for at least three years without the plant being detected and also they were perceived to pose a low risk of harbouring branched broomrape because of their location, soil type, link type etc. After five years of detailed surveys of Victorian properties linked to O. ramosa infestations in South Australia, no O. ramosa has been found in Victoria. The fact that the rapid response team have found several clover broom-rape, O. minor specimens while searching
for O. ramosa, provides confidence that the search procedures were effective (Brian Dowley, DPI Victoria, personal communi-cation). The number of properties requir-ing repeated surveying will fall dramati-cally if further inspections demonstrate the absence of O. ramosa and quarantine measures prevent any new linkages to Vic-toria from the infected area.
A branched broomrape incursion con-tingency flowchart has need developed for Victoria (Figure 1) In the event of an incursion being found, this flowchart de-tails what and when responses will take place, who will undertake them and also describes the lines of communication re-quired for the response. Being prepared in advance facilitates quick and decisive actions to deal with serious incursions.
To enhance the potential surveillance coverage of branched broomrape, the net-work of over 600 registered Weed Spot-ters can be asked to look for and report incursions. The Cooperative Research Centre for Australian Weed Management (Weeds CRC), in association with DPI, is now using the Victorian model for a Weed Spotter network and piloting it in parts of Queensland. It may then be applied across Australia.
DiscussionFailure to find branched broomrape in ar-eas of Victoria identified most at risk may only provide a temporary reprieve, but during this time planning and research has enabled strategies to be put in place to minimise damage should it be found. Victoria needs to ensure all land manag-ers are aware of how to identify branched broomrape, so it can be immediately rec-ognised and acted upon. The WARR pro-gram is a critically important component of this process. The Victorian government in collaboration with industry should also invest in determining the best fumigation techniques should the plant becomes es-tablished in Victoria. The current branched broomrape fumigation program in South Australia relies on methyl bromide and currently costs in excess of $1.5 million an-nually. Methyl bromide will be phased out of production because of environmental concerns by 2008. A proactive research and awareness program will help keep Victo-ria free of branched broomrape.
Table 1. Surveys of traceback properties in VictoriaYear Properties surveyed Area surveyed (ha) O. ramosa plants found
2000 7 6 827 0
2001 27 17 774 0
2002 34 20 992 0
2003 34 20 992 0
2004 28 17 807 0
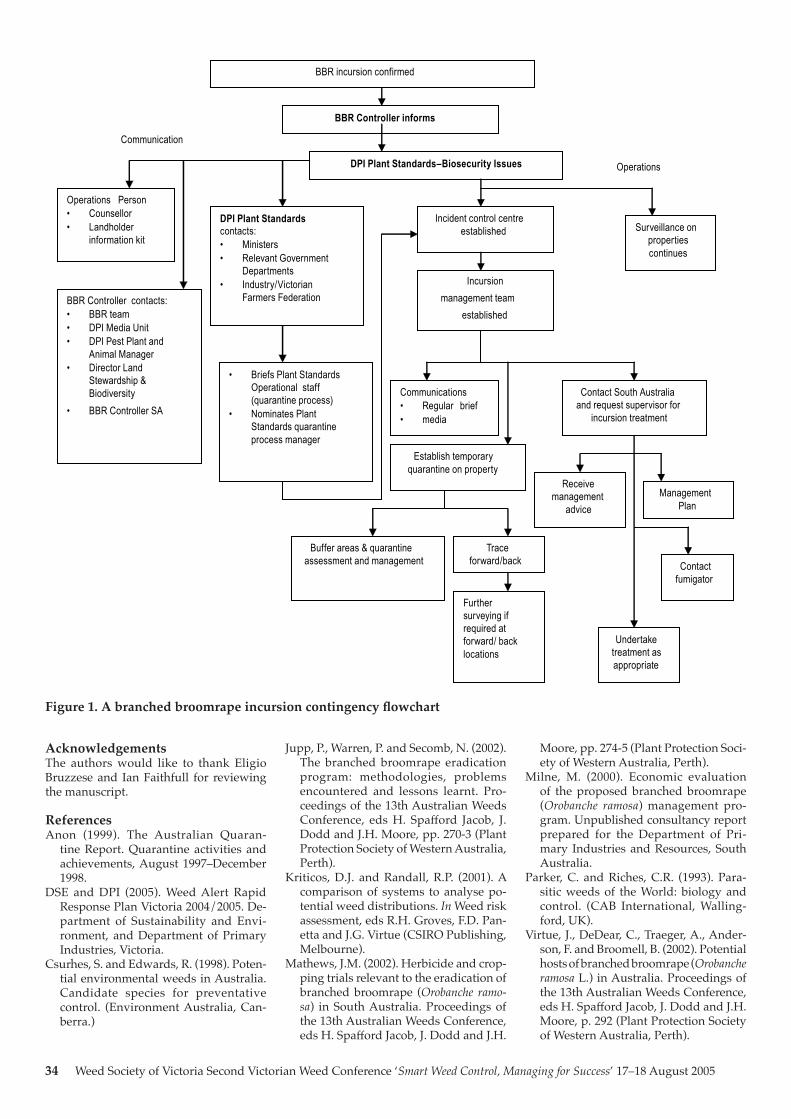
34 Weed Society of Victoria Second Victorian Weed Conference ‘Smart Weed Control, Managing for Success’ 17–18 August 2005
Acknowledgements The authors would like to thank Eligio Bruzzese and Ian Faithfull for reviewing the manuscript.
ReferencesAnon (1999). The Australian Quaran-
tine Report. Quarantine activities and achievements, August 1997–December 1998.
DSE and DPI (2005). Weed Alert Rapid Response Plan Victoria 2004/2005. De-partment of Sustainability and Envi-ronment, and Department of Primary Industries, Victoria.
Csurhes, S. and Edwards, R. (1998). Poten-tial environmental weeds in Australia. Candidate species for preventative control. (Environment Australia, Can-berra.)
BBR incursion confirmed
DPI Plant Standards–Biosecurity Issues
Operations Person• Counsellor• Landholder
information kit
BBR Controller contacts:• BBR team• DPI Media Unit• DPI Pest Plant and
Animal Manager• Director Land
Stewardship & Biodiversity
• BBR Controller SA
DPI Plant Standards contacts:• Ministers• Relevant Government
Departments • Industry/Victorian
Farmers Federation
Incident control centre established
Incursion management team
established
• Briefs Plant Standards Operational staff (quarantine process)
• Nominates Plant Standards quarantine process manager
Surveillance on properties continues
Communications • Regular brief• media
Establish temporary quarantine on property
Buffer areas & quarantine assessment and management
Trace forward/back
Further surveying if required at forward/ back locations
Contact South Australia and request supervisor for
incursion treatment
Receive management
adviceManagement
Plan
Contact fumigator
Undertake treatment as appropriate
BBR Controller informs
Communication
Operations
Jupp, P., Warren, P. and Secomb, N. (2002). The branched broomrape eradication program: methodologies, problems encountered and lessons learnt. Pro-ceedings of the 13th Australian Weeds Conference, eds H. Spafford Jacob, J. Dodd and J.H. Moore, pp. 270-3 (Plant Protection Society of Western Australia, Perth).
Kriticos, D.J. and Randall, R.P. (2001). A comparison of systems to analyse po-tential weed distributions. In Weed risk assessment, eds R.H. Groves, F.D. Pan-etta and J.G. Virtue (CSIRO Publishing, Melbourne).
Mathews, J.M. (2002). Herbicide and crop-ping trials relevant to the eradication of branched broomrape (Orobanche ramo-sa) in South Australia. Proceedings of the 13th Australian Weeds Conference, eds H. Spafford Jacob, J. Dodd and J.H.
Moore, pp. 274-5 (Plant Protection Soci-ety of Western Australia, Perth).
Milne, M. (2000). Economic evaluation of the proposed branched broomrape (Orobanche ramosa) management pro-gram. Unpublished consultancy report prepared for the Department of Pri-mary Industries and Resources, South Australia.
Parker, C. and Riches, C.R. (1993). Para-sitic weeds of the World: biology and control. (CAB International, Walling-ford, UK).
Virtue, J., DeDear, C., Traeger, A., Ander-son, F. and Broomell, B. (2002). Potential hosts of branched broomrape (Orobanche ramosa L.) in Australia. Proceedings of the 13th Australian Weeds Conference, eds H. Spafford Jacob, J. Dodd and J.H. Moore, p. 292 (Plant Protection Society of Western Australia, Perth).
Figure 1. A branched broomrape incursion contingency flowchart
Weed Society of Victoria Second Victorian Weed Conference ‘Smart Weed Control, Managing for Success’ 17–18 August 2005 35
SESSION 4Integrated weed management (concurrent)
Chilean needle grass (Nassella neesiana, CNG) is able to over-run pastures resulting in canopy cover of up to 60%. Such infesta-tions can lead to a substantial reduction in livestock carrying capacity as the grass produces large numbers of unpalatable flower stalks and sharp seeds that pose a risk to animal welfare, particularly sheep. A large scale grazing study was initiated over spring 2004 to compare the ability of set stocked or rotationally grazed sheep and cattle, to reduce CNG seed produc-tion, as well as to monitor the effects on animal production and the botanical com-position of the pasture regrowth.
Sheep (Suffolk X ewes and lambs) and cattle (Angus cows and calves) were grazed in separate paddocks stocked at 12 DSE ha-1 in a set stock or simple rotational system. Simple rotational treatments con-sisted of a four paddock time based rota-tion. Rotation length at the start of spring was eight weeks and was reduced to four weeks by the end of spring.
Grazing significantly reduced the amount of standing panicle seed (P =
0.015), and stem cleistogene seed (P = 0.015) when compared with the ungrazed controls. Within the grazed treatments, cattle grazed significantly (P = 0.043) more CNG panicle seeds compared with sheep. Pasture regrowth of grazed treatments had significantly less CNG dry matter than ungrazed treatments in early spring (P = 0.039, day 56) although there was no dif-ference later in spring. Animals in the trial gained weight satisfactorily. Cattle gained significantly more (P = 0.015) weight than the sheep during the first month although this trend did not continue. The method of grazing, whether set stocked or rotational, did not significantly affect any of the pa-rameters listed above.
Grazing significantly reduced the number of both CNG panicle and stem seeds whilst changing early spring re-growth to a more palatable composition. Managed grazing with cattle could po-tentially be used therefore to reduce the amount of CNG seeds entering the soil seedbank whilst not compromising ani-mal productivity or welfare.
Chilean needle grass (Nassella neesiana) – integrated grazing for success
Charles GrechA,B,C, Aaron DoddC, David McLarenC,D, David ChapmanE and Brian M. SindelB,C
A Department of Primary Industries, 475 Mickleham Road, Attwood, Victoria 3049B School of Rural Science and Agriculture, The University of New England, Armidale, New South Wales 2351C Cooperative Research Centre for Australian Weed ManagementD Department of Primary Industries, PO Box 48, Frankston, Victoria 3199E School of Agriculture and Food Systems, The University of Melbourne, Parkville, Victoria 3010
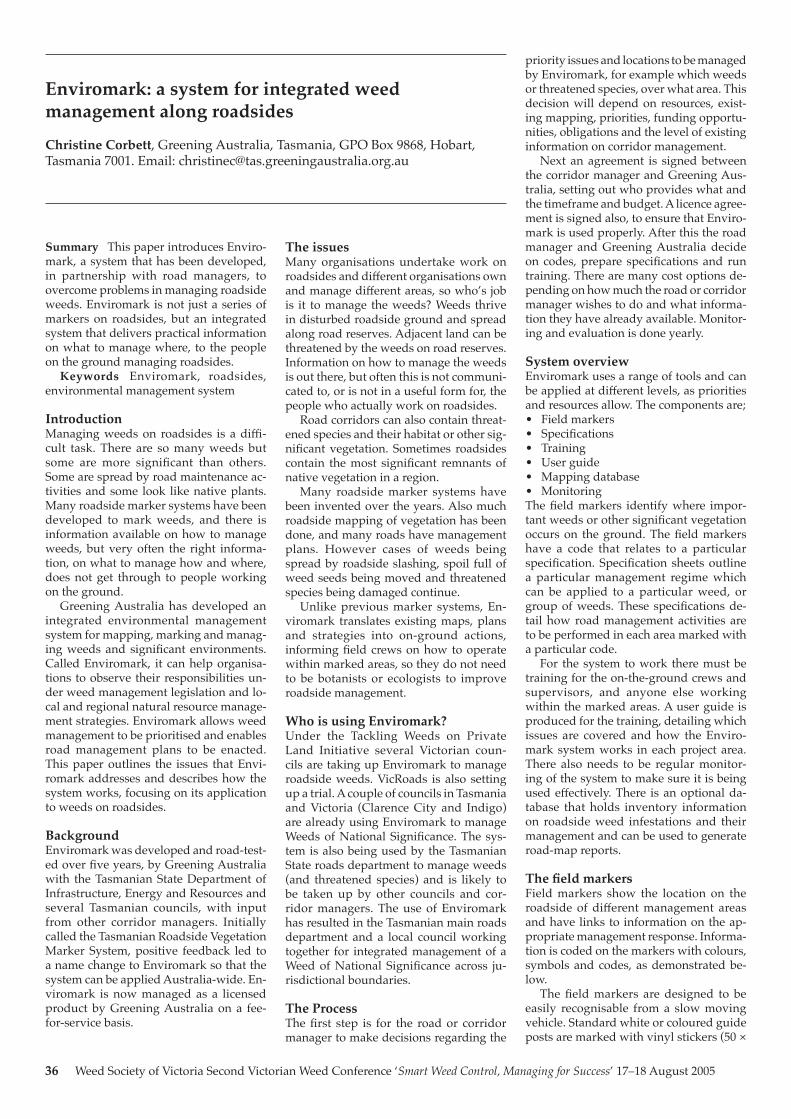
36 Weed Society of Victoria Second Victorian Weed Conference ‘Smart Weed Control, Managing for Success’ 17–18 August 2005
Summary This paper introduces Enviro-mark, a system that has been developed, in partnership with road managers, to overcome problems in managing roadside weeds. Enviromark is not just a series of markers on roadsides, but an integrated system that delivers practical information on what to manage where, to the people on the ground managing roadsides.
Keywords Enviromark, roadsides, environmental management system
IntroductionManaging weeds on roadsides is a diffi-cult task. There are so many weeds but some are more significant than others. Some are spread by road maintenance ac-tivities and some look like native plants. Many roadside marker systems have been developed to mark weeds, and there is information available on how to manage weeds, but very often the right informa-tion, on what to manage how and where, does not get through to people working on the ground.
Greening Australia has developed an integrated environmental management system for mapping, marking and manag-ing weeds and significant environments. Called Enviromark, it can help organisa-tions to observe their responsibilities un-der weed management legislation and lo-cal and regional natural resource manage-ment strategies. Enviromark allows weed management to be prioritised and enables road management plans to be enacted. This paper outlines the issues that Envi-romark addresses and describes how the system works, focusing on its application to weeds on roadsides.
BackgroundEnviromark was developed and road-test-ed over five years, by Greening Australia with the Tasmanian State Department of Infrastructure, Energy and Resources and several Tasmanian councils, with input from other corridor managers. Initially called the Tasmanian Roadside Vegetation Marker System, positive feedback led to a name change to Enviromark so that the system can be applied Australia-wide. En-viromark is now managed as a licensed product by Greening Australia on a fee-for-service basis.
The issuesMany organisations undertake work on roadsides and different organisations own and manage different areas, so who’s job is it to manage the weeds? Weeds thrive in disturbed roadside ground and spread along road reserves. Adjacent land can be threatened by the weeds on road reserves. Information on how to manage the weeds is out there, but often this is not communi-cated to, or is not in a useful form for, the people who actually work on roadsides.
Road corridors can also contain threat-ened species and their habitat or other sig-nificant vegetation. Sometimes roadsides contain the most significant remnants of native vegetation in a region.
Many roadside marker systems have been invented over the years. Also much roadside mapping of vegetation has been done, and many roads have management plans. However cases of weeds being spread by roadside slashing, spoil full of weed seeds being moved and threatened species being damaged continue.
Unlike previous marker systems, En-viromark translates existing maps, plans and strategies into on-ground actions, informing field crews on how to operate within marked areas, so they do not need to be botanists or ecologists to improve roadside management.
Who is using Enviromark?Under the Tackling Weeds on Private Land Initiative several Victorian coun-cils are taking up Enviromark to manage roadside weeds. VicRoads is also setting up a trial. A couple of councils in Tasmania and Victoria (Clarence City and Indigo) are already using Enviromark to manage Weeds of National Significance. The sys-tem is also being used by the Tasmanian State roads department to manage weeds (and threatened species) and is likely to be taken up by other councils and cor-ridor managers. The use of Enviromark has resulted in the Tasmanian main roads department and a local council working together for integrated management of a Weed of National Significance across ju-risdictional boundaries.
The ProcessThe first step is for the road or corridor manager to make decisions regarding the
priority issues and locations to be managed by Enviromark, for example which weeds or threatened species, over what area. This decision will depend on resources, exist-ing mapping, priorities, funding opportu-nities, obligations and the level of existing information on corridor management.
Next an agreement is signed between the corridor manager and Greening Aus-tralia, setting out who provides what and the timeframe and budget. A licence agree-ment is signed also, to ensure that Enviro-mark is used properly. After this the road manager and Greening Australia decide on codes, prepare specifications and run training. There are many cost options de-pending on how much the road or corridor manager wishes to do and what informa-tion they have already available. Monitor-ing and evaluation is done yearly.
System overviewEnviromark uses a range of tools and can be applied at different levels, as priorities and resources allow. The components are;• Field markers• Specifications• Training• User guide• Mapping database• MonitoringThe field markers identify where impor-tant weeds or other significant vegetation occurs on the ground. The field markers have a code that relates to a particular specification. Specification sheets outline a particular management regime which can be applied to a particular weed, or group of weeds. These specifications de-tail how road management activities are to be performed in each area marked with a particular code.
For the system to work there must be training for the on-the-ground crews and supervisors, and anyone else working within the marked areas. A user guide is produced for the training, detailing which issues are covered and how the Enviro-mark system works in each project area. There also needs to be regular monitor-ing of the system to make sure it is being used effectively. There is an optional da-tabase that holds inventory information on roadside weed infestations and their management and can be used to generate road-map reports.
The field markersField markers show the location on the roadside of different management areas and have links to information on the ap-propriate management response. Informa-tion is coded on the markers with colours, symbols and codes, as demonstrated be-low.
The field markers are designed to be easily recognisable from a slow moving vehicle. Standard white or coloured guide posts are marked with vinyl stickers (50 ×
Enviromark: a system for integrated weed management along roadsides
Christine Corbett, Greening Australia, Tasmania, GPO Box 9868, Hobart, Tasmania 7001. Email: [email protected]
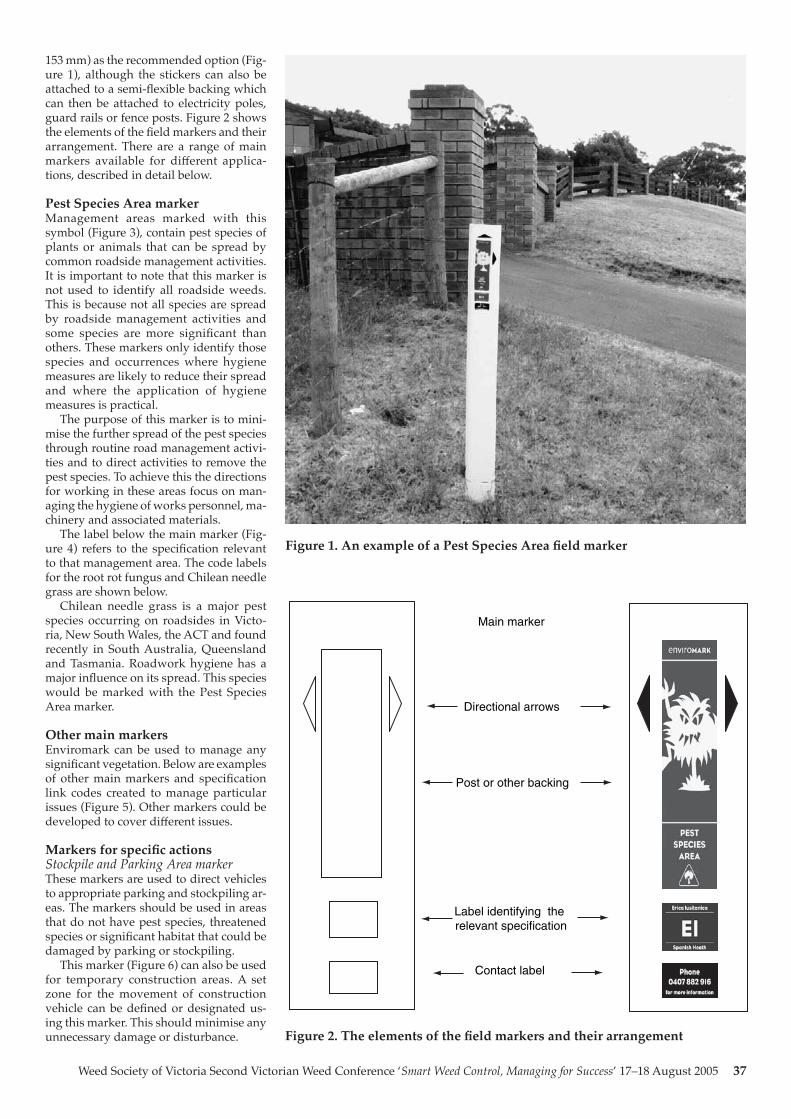
Weed Society of Victoria Second Victorian Weed Conference ‘Smart Weed Control, Managing for Success’ 17–18 August 2005 37
153 mm) as the recommended option (Fig-ure 1), although the stickers can also be attached to a semi-flexible backing which can then be attached to electricity poles, guard rails or fence posts. Figure 2 shows the elements of the field markers and their arrangement. There are a range of main markers available for different applica-tions, described in detail below.
Pest Species Area markerManagement areas marked with this symbol (Figure 3), contain pest species of plants or animals that can be spread by common roadside management activities. It is important to note that this marker is not used to identify all roadside weeds. This is because not all species are spread by roadside management activities and some species are more significant than others. These markers only identify those species and occurrences where hygiene measures are likely to reduce their spread and where the application of hygiene measures is practical.
The purpose of this marker is to mini-mise the further spread of the pest species through routine road management activi-ties and to direct activities to remove the pest species. To achieve this the directions for working in these areas focus on man-aging the hygiene of works personnel, ma-chinery and associated materials.
The label below the main marker (Fig-ure 4) refers to the specification relevant to that management area. The code labels for the root rot fungus and Chilean needle grass are shown below.
Chilean needle grass is a major pest species occurring on roadsides in Victo-ria, New South Wales, the ACT and found recently in South Australia, Queensland and Tasmania. Roadwork hygiene has a major influence on its spread. This species would be marked with the Pest Species Area marker.
Other main markersEnviromark can be used to manage any significant vegetation. Below are examples of other main markers and specification link codes created to manage particular issues (Figure 5). Other markers could be developed to cover different issues.
Markers for specific actionsStockpile and Parking Area markerThese markers are used to direct vehicles to appropriate parking and stockpiling ar-eas. The markers should be used in areas that do not have pest species, threatened species or significant habitat that could be damaged by parking or stockpiling.
This marker (Figure 6) can also be used for temporary construction areas. A set zone for the movement of construction vehicle can be defined or designated us-ing this marker. This should minimise any unnecessary damage or disturbance.
Figure 1. An example of a Pest Species Area field marker
Main marker
Directional arrows
Post or other backing
Label identifying the relevant specification
Contact label
Figure 2. The elements of the field markers and their arrangement
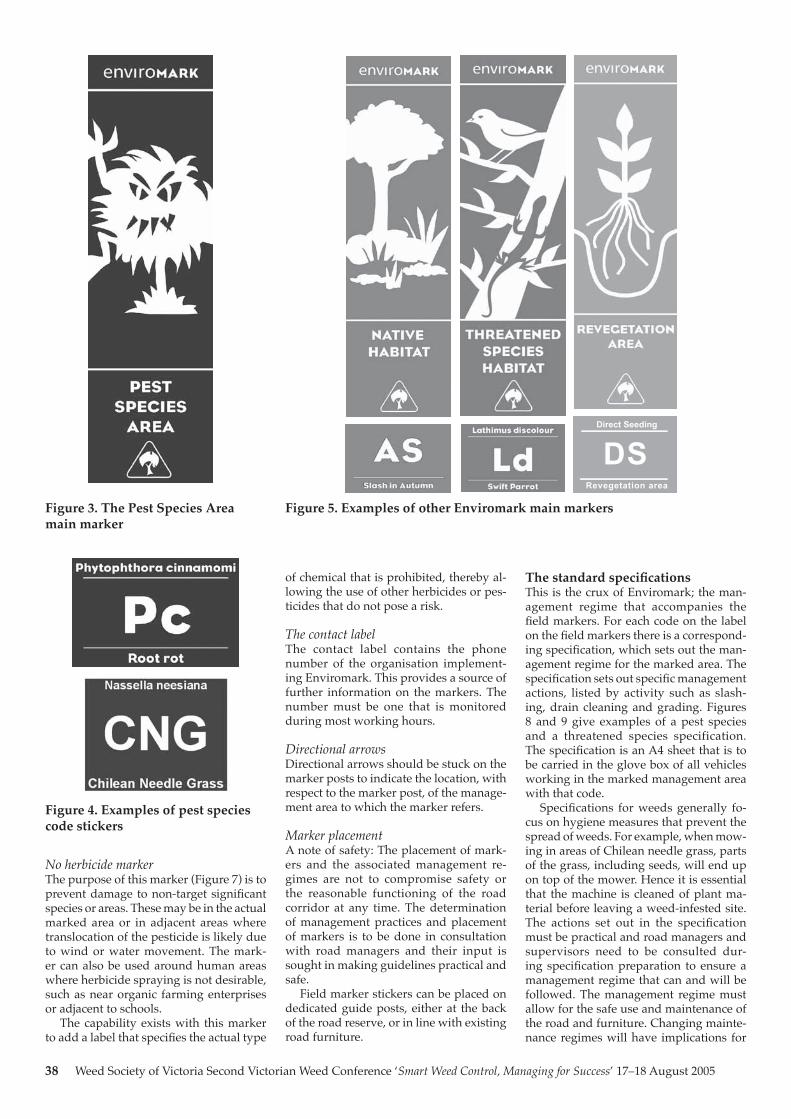
38 Weed Society of Victoria Second Victorian Weed Conference ‘Smart Weed Control, Managing for Success’ 17–18 August 2005
No herbicide markerThe purpose of this marker (Figure 7) is to prevent damage to non-target significant species or areas. These may be in the actual marked area or in adjacent areas where translocation of the pesticide is likely due to wind or water movement. The mark-er can also be used around human areas where herbicide spraying is not desirable, such as near organic farming enterprises or adjacent to schools.
The capability exists with this marker to add a label that specifies the actual type
The standard specificationsThis is the crux of Enviromark; the man-agement regime that accompanies the field markers. For each code on the label on the field markers there is a correspond-ing specification, which sets out the man-agement regime for the marked area. The specification sets out specific management actions, listed by activity such as slash-ing, drain cleaning and grading. Figures 8 and 9 give examples of a pest species and a threatened species specification. The specification is an A4 sheet that is to be carried in the glove box of all vehicles working in the marked management area with that code.
Specifications for weeds generally fo-cus on hygiene measures that prevent the spread of weeds. For example, when mow-ing in areas of Chilean needle grass, parts of the grass, including seeds, will end up on top of the mower. Hence it is essential that the machine is cleaned of plant ma-terial before leaving a weed-infested site. The actions set out in the specification must be practical and road managers and supervisors need to be consulted dur-ing specification preparation to ensure a management regime that can and will be followed. The management regime must allow for the safe use and maintenance of the road and furniture. Changing mainte-nance regimes will have implications for
of chemical that is prohibited, thereby al-lowing the use of other herbicides or pes-ticides that do not pose a risk.
The contact labelThe contact label contains the phone number of the organisation implement-ing Enviromark. This provides a source of further information on the markers. The number must be one that is monitored during most working hours.
Directional arrowsDirectional arrows should be stuck on the marker posts to indicate the location, with respect to the marker post, of the manage-ment area to which the marker refers.
Marker placementA note of safety: The placement of mark-ers and the associated management re-gimes are not to compromise safety or the reasonable functioning of the road corridor at any time. The determination of management practices and placement of markers is to be done in consultation with road managers and their input is sought in making guidelines practical and safe.
Field marker stickers can be placed on dedicated guide posts, either at the back of the road reserve, or in line with existing road furniture.
Direct Seeding
DSRevegetation area
Figure 3. The Pest Species Area main marker
Figure 4. Examples of pest species code stickers
Figure 5. Examples of other Enviromark main markers
Direct Seeding
DSRevegetation area
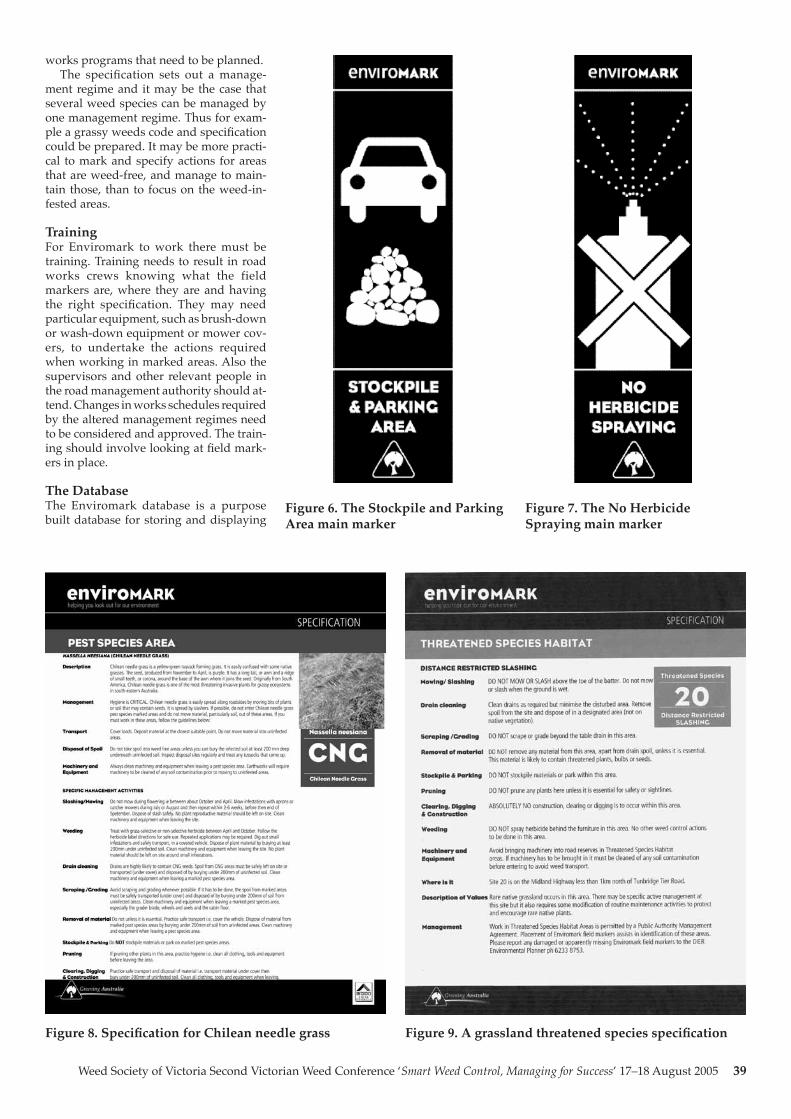
Weed Society of Victoria Second Victorian Weed Conference ‘Smart Weed Control, Managing for Success’ 17–18 August 2005 39
Figure 8. Specification for Chilean needle grass
works programs that need to be planned.The specification sets out a manage-
ment regime and it may be the case that several weed species can be managed by one management regime. Thus for exam-ple a grassy weeds code and specification could be prepared. It may be more practi-cal to mark and specify actions for areas that are weed-free, and manage to main-tain those, than to focus on the weed-in-fested areas.
TrainingFor Enviromark to work there must be training. Training needs to result in road works crews knowing what the field markers are, where they are and having the right specification. They may need particular equipment, such as brush-down or wash-down equipment or mower cov-ers, to undertake the actions required when working in marked areas. Also the supervisors and other relevant people in the road management authority should at-tend. Changes in works schedules required by the altered management regimes need to be considered and approved. The train-ing should involve looking at field mark-ers in place.
The DatabaseThe Enviromark database is a purpose built database for storing and displaying
Figure 6. The Stockpile and Parking Area main marker
Figure 7. The No Herbicide Spraying main marker
Figure 9. A grassland threatened species specification
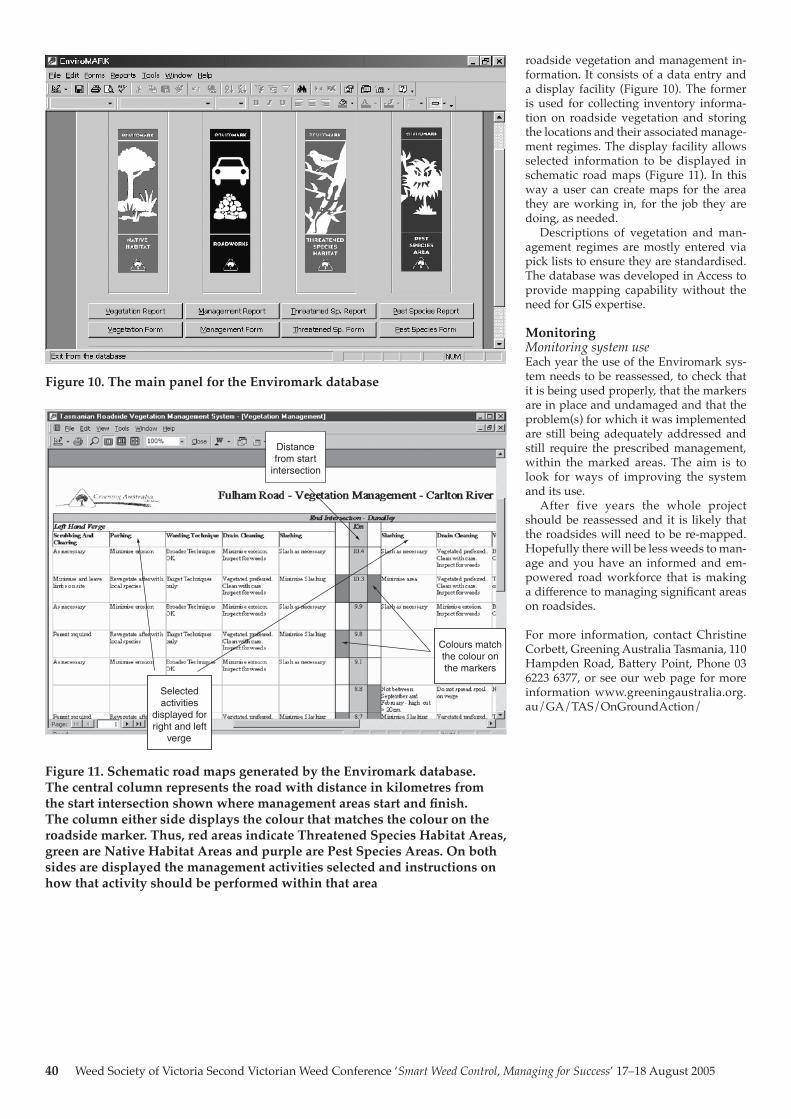
40 Weed Society of Victoria Second Victorian Weed Conference ‘Smart Weed Control, Managing for Success’ 17–18 August 2005
Figure 10. The main panel for the Enviromark database
Distance from start
intersection
Selected activities
displayed for right and left
verge
Colours match the colour on the markers
roadside vegetation and management in-formation. It consists of a data entry and a display facility (Figure 10). The former is used for collecting inventory informa-tion on roadside vegetation and storing the locations and their associated manage-ment regimes. The display facility allows selected information to be displayed in schematic road maps (Figure 11). In this way a user can create maps for the area they are working in, for the job they are doing, as needed.
Descriptions of vegetation and man-agement regimes are mostly entered via pick lists to ensure they are standardised. The database was developed in Access to provide mapping capability without the need for GIS expertise.
Monitoring Monitoring system useEach year the use of the Enviromark sys-tem needs to be reassessed, to check that it is being used properly, that the markers are in place and undamaged and that the problem(s) for which it was implemented are still being adequately addressed and still require the prescribed management, within the marked areas. The aim is to look for ways of improving the system and its use.
After five years the whole project should be reassessed and it is likely that the roadsides will need to be re-mapped. Hopefully there will be less weeds to man-age and you have an informed and em-powered road workforce that is making a difference to managing significant areas on roadsides.
For more information, contact Christine Corbett, Greening Australia Tasmania, 110 Hampden Road, Battery Point, Phone 03 6223 6377, or see our web page for more information www.greeningaustralia.org.au/GA/TAS/OnGroundAction/
Figure 11. Schematic road maps generated by the Enviromark database. The central column represents the road with distance in kilometres from the start intersection shown where management areas start and finish. The column either side displays the colour that matches the colour on the roadside marker. Thus, red areas indicate Threatened Species Habitat Areas, green are Native Habitat Areas and purple are Pest Species Areas. On both sides are displayed the management activities selected and instructions on how that activity should be performed within that area
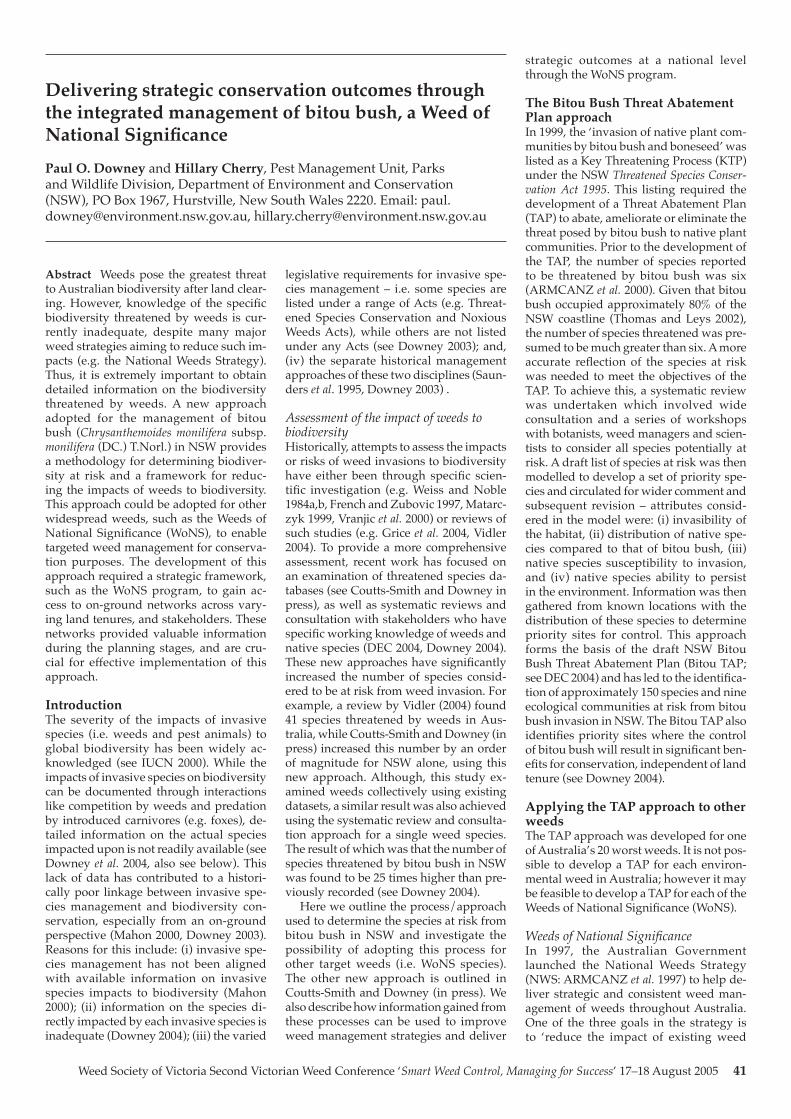
Weed Society of Victoria Second Victorian Weed Conference ‘Smart Weed Control, Managing for Success’ 17–18 August 2005 41
Abstract Weeds pose the greatest threat to Australian biodiversity after land clear-ing. However, knowledge of the specific biodiversity threatened by weeds is cur-rently inadequate, despite many major weed strategies aiming to reduce such im-pacts (e.g. the National Weeds Strategy). Thus, it is extremely important to obtain detailed information on the biodiversity threatened by weeds. A new approach adopted for the management of bitou bush (Chrysanthemoides monilifera subsp. monilifera (DC.) T.Norl.) in NSW provides a methodology for determining biodiver-sity at risk and a framework for reduc-ing the impacts of weeds to biodiversity. This approach could be adopted for other widespread weeds, such as the Weeds of National Significance (WoNS), to enable targeted weed management for conserva-tion purposes. The development of this approach required a strategic framework, such as the WoNS program, to gain ac-cess to on-ground networks across vary-ing land tenures, and stakeholders. These networks provided valuable information during the planning stages, and are cru-cial for effective implementation of this approach.
IntroductionThe severity of the impacts of invasive species (i.e. weeds and pest animals) to global biodiversity has been widely ac-knowledged (see IUCN 2000). While the impacts of invasive species on biodiversity can be documented through interactions like competition by weeds and predation by introduced carnivores (e.g. foxes), de-tailed information on the actual species impacted upon is not readily available (see Downey et al. 2004, also see below). This lack of data has contributed to a histori-cally poor linkage between invasive spe-cies management and biodiversity con-servation, especially from an on-ground perspective (Mahon 2000, Downey 2003). Reasons for this include: (i) invasive spe-cies management has not been aligned with available information on invasive species impacts to biodiversity (Mahon 2000); (ii) information on the species di-rectly impacted by each invasive species is inadequate (Downey 2004); (iii) the varied
legislative requirements for invasive spe-cies management – i.e. some species are listed under a range of Acts (e.g. Threat-ened Species Conservation and Noxious Weeds Acts), while others are not listed under any Acts (see Downey 2003); and, (iv) the separate historical management approaches of these two disciplines (Saun-ders et al. 1995, Downey 2003) .
Assessment of the impact of weeds to biodiversityHistorically, attempts to assess the impacts or risks of weed invasions to biodiversity have either been through specific scien-tific investigation (e.g. Weiss and Noble 1984a,b, French and Zubovic 1997, Matarc-zyk 1999, Vranjic et al. 2000) or reviews of such studies (e.g. Grice et al. 2004, Vidler 2004). To provide a more comprehensive assessment, recent work has focused on an examination of threatened species da-tabases (see Coutts-Smith and Downey in press), as well as systematic reviews and consultation with stakeholders who have specific working knowledge of weeds and native species (DEC 2004, Downey 2004). These new approaches have significantly increased the number of species consid-ered to be at risk from weed invasion. For example, a review by Vidler (2004) found 41 species threatened by weeds in Aus-tralia, while Coutts-Smith and Downey (in press) increased this number by an order of magnitude for NSW alone, using this new approach. Although, this study ex-amined weeds collectively using existing datasets, a similar result was also achieved using the systematic review and consulta-tion approach for a single weed species. The result of which was that the number of species threatened by bitou bush in NSW was found to be 25 times higher than pre-viously recorded (see Downey 2004).
Here we outline the process/approach used to determine the species at risk from bitou bush in NSW and investigate the possibility of adopting this process for other target weeds (i.e. WoNS species). The other new approach is outlined in Coutts-Smith and Downey (in press). We also describe how information gained from these processes can be used to improve weed management strategies and deliver
strategic outcomes at a national level through the WoNS program.
The Bitou Bush Threat Abatement Plan approachIn 1999, the ‘invasion of native plant com-munities by bitou bush and boneseed’ was listed as a Key Threatening Process (KTP) under the NSW Threatened Species Conser-vation Act 1995. This listing required the development of a Threat Abatement Plan (TAP) to abate, ameliorate or eliminate the threat posed by bitou bush to native plant communities. Prior to the development of the TAP, the number of species reported to be threatened by bitou bush was six (ARMCANZ et al. 2000). Given that bitou bush occupied approximately 80% of the NSW coastline (Thomas and Leys 2002), the number of species threatened was pre-sumed to be much greater than six. A more accurate reflection of the species at risk was needed to meet the objectives of the TAP. To achieve this, a systematic review was undertaken which involved wide consultation and a series of workshops with botanists, weed managers and scien-tists to consider all species potentially at risk. A draft list of species at risk was then modelled to develop a set of priority spe-cies and circulated for wider comment and subsequent revision – attributes consid-ered in the model were: (i) invasibility of the habitat, (ii) distribution of native spe-cies compared to that of bitou bush, (iii) native species susceptibility to invasion, and (iv) native species ability to persist in the environment. Information was then gathered from known locations with the distribution of these species to determine priority sites for control. This approach forms the basis of the draft NSW Bitou Bush Threat Abatement Plan (Bitou TAP; see DEC 2004) and has led to the identifica-tion of approximately 150 species and nine ecological communities at risk from bitou bush invasion in NSW. The Bitou TAP also identifies priority sites where the control of bitou bush will result in significant ben-efits for conservation, independent of land tenure (see Downey 2004).
Applying the TAP approach to other weedsThe TAP approach was developed for one of Australia’s 20 worst weeds. It is not pos-sible to develop a TAP for each environ-mental weed in Australia; however it may be feasible to develop a TAP for each of the Weeds of National Significance (WoNS).
Weeds of National SignificanceIn 1997, the Australian Government launched the National Weeds Strategy (NWS: ARMCANZ et al. 1997) to help de-liver strategic and consistent weed man-agement of weeds throughout Australia. One of the three goals in the strategy is to ‘reduce the impact of existing weed
Delivering strategic conservation outcomes through the integrated management of bitou bush, a Weed of National Significance
Paul O. Downey and Hillary Cherry, Pest Management Unit, Parks and Wildlife Division, Department of Environment and Conservation (NSW), PO Box 1967, Hurstville, New South Wales 2220. Email: [email protected], [email protected]
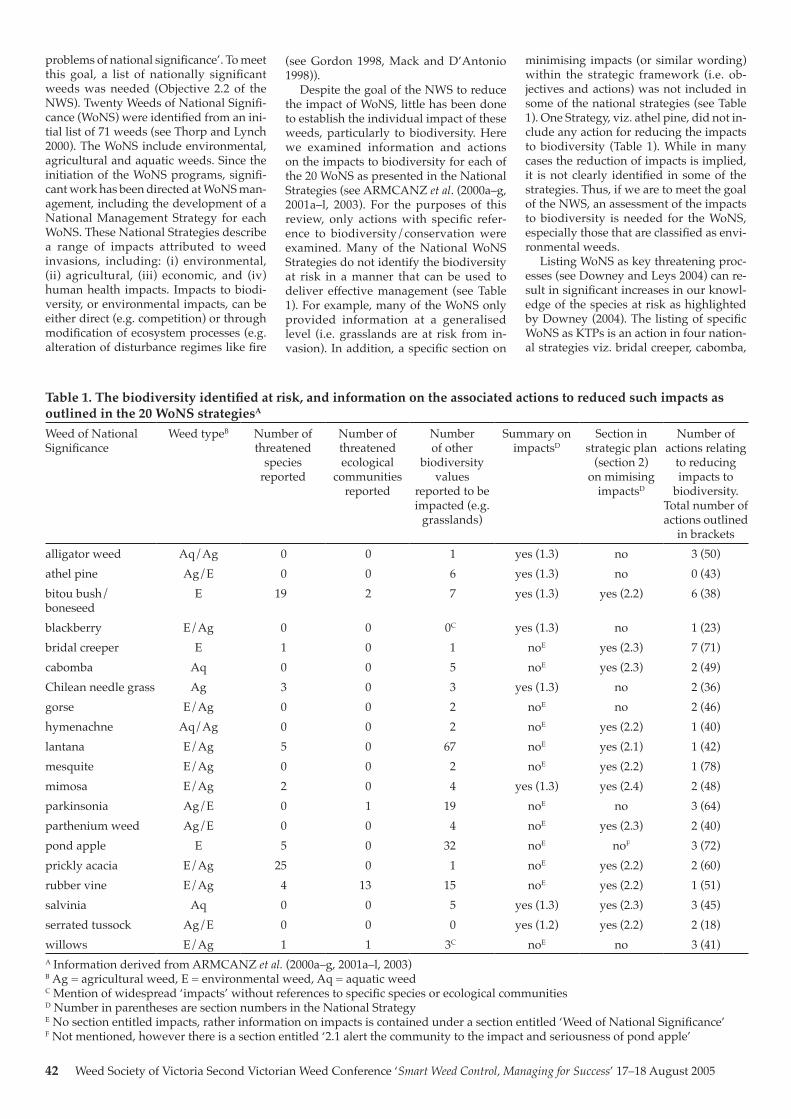
42 Weed Society of Victoria Second Victorian Weed Conference ‘Smart Weed Control, Managing for Success’ 17–18 August 2005
problems of national significance’. To meet this goal, a list of nationally significant weeds was needed (Objective 2.2 of the NWS). Twenty Weeds of National Signifi-cance (WoNS) were identified from an ini-tial list of 71 weeds (see Thorp and Lynch 2000). The WoNS include environmental, agricultural and aquatic weeds. Since the initiation of the WoNS programs, signifi-cant work has been directed at WoNS man-agement, including the development of a National Management Strategy for each WoNS. These National Strategies describe a range of impacts attributed to weed invasions, including: (i) environmental, (ii) agricultural, (iii) economic, and (iv) human health impacts. Impacts to biodi-versity, or environmental impacts, can be either direct (e.g. competition) or through modification of ecosystem processes (e.g. alteration of disturbance regimes like fire
(see Gordon 1998, Mack and D’Antonio 1998)).
Despite the goal of the NWS to reduce the impact of WoNS, little has been done to establish the individual impact of these weeds, particularly to biodiversity. Here we examined information and actions on the impacts to biodiversity for each of the 20 WoNS as presented in the National Strategies (see ARMCANZ et al. (2000a–g, 2001a–l, 2003). For the purposes of this review, only actions with specific refer-ence to biodiversity/conservation were examined. Many of the National WoNS Strategies do not identify the biodiversity at risk in a manner that can be used to deliver effective management (see Table 1). For example, many of the WoNS only provided information at a generalised level (i.e. grasslands are at risk from in-vasion). In addition, a specific section on
minimising impacts (or similar wording) within the strategic framework (i.e. ob-jectives and actions) was not included in some of the national strategies (see Table 1). One Strategy, viz. athel pine, did not in-clude any action for reducing the impacts to biodiversity (Table 1). While in many cases the reduction of impacts is implied, it is not clearly identified in some of the strategies. Thus, if we are to meet the goal of the NWS, an assessment of the impacts to biodiversity is needed for the WoNS, especially those that are classified as envi-ronmental weeds.
Listing WoNS as key threatening proc-esses (see Downey and Leys 2004) can re-sult in significant increases in our knowl-edge of the species at risk as highlighted by Downey (2004). The listing of specific WoNS as KTPs is an action in four nation-al strategies viz. bridal creeper, cabomba,
Table 1. The biodiversity identified at risk, and information on the associated actions to reduced such impacts as outlined in the 20 WoNS strategiesA
Weed of National Significance
Weed typeB Number of threatened
species reported
Number of threatened ecological
communities reported
Number of other
biodiversity values
reported to be impacted (e.g.
grasslands)
Summary on impactsD
Section in strategic plan
(section 2) on mimising
impactsD
Number of actions relating
to reducing impacts to
biodiversity. Total number of actions outlined
in bracketsalligator weed Aq/Ag 0 0 1 yes (1.3) no 3 (50)athel pine Ag/E 0 0 6 yes (1.3) no 0 (43)bitou bush/boneseed
E 19 2 7 yes (1.3) yes (2.2) 6 (38)
blackberry E/Ag 0 0 0C yes (1.3) no 1 (23)bridal creeper E 1 0 1 noE yes (2.3) 7 (71)cabomba Aq 0 0 5 noE yes (2.3) 2 (49)Chilean needle grass Ag 3 0 3 yes (1.3) no 2 (36)gorse E/Ag 0 0 2 noE no 2 (46)hymenachne Aq/Ag 0 0 2 noE yes (2.2) 1 (40)lantana E/Ag 5 0 67 noE yes (2.1) 1 (42)mesquite E/Ag 0 0 2 noE yes (2.2) 1 (78)mimosa E/Ag 2 0 4 yes (1.3) yes (2.4) 2 (48)parkinsonia Ag/E 0 1 19 noE no 3 (64)parthenium weed Ag/E 0 0 4 noE yes (2.3) 2 (40)pond apple E 5 0 32 noE noF 3 (72)prickly acacia E/Ag 25 0 1 noE yes (2.2) 2 (60)rubber vine E/Ag 4 13 15 noE yes (2.2) 1 (51)salvinia Aq 0 0 5 yes (1.3) yes (2.3) 3 (45)serrated tussock Ag/E 0 0 0 yes (1.2) yes (2.2) 2 (18)willows E/Ag 1 1 3C noE no 3 (41)A Information derived from ARMCANZ et al. (2000a–g, 2001a–l, 2003)B Ag = agricultural weed, E = environmental weed, Aq = aquatic weedC Mention of widespread ‘impacts’ without references to specific species or ecological communitiesD Number in parentheses are section numbers in the National StrategyE No section entitled impacts, rather information on impacts is contained under a section entitled ‘Weed of National Significance’F Not mentioned, however there is a section entitled ‘2.1 alert the community to the impact and seriousness of pond apple’
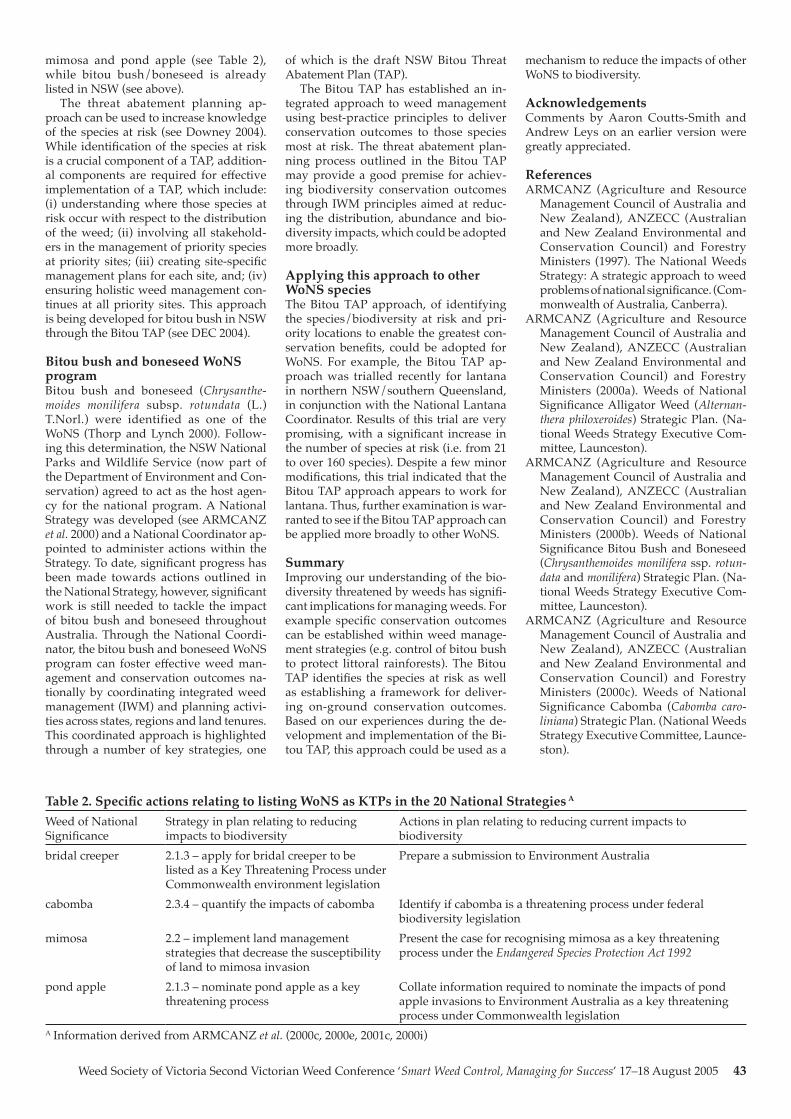
Weed Society of Victoria Second Victorian Weed Conference ‘Smart Weed Control, Managing for Success’ 17–18 August 2005 43
mimosa and pond apple (see Table 2), while bitou bush/boneseed is already listed in NSW (see above).
The threat abatement planning ap-proach can be used to increase knowledge of the species at risk (see Downey 2004). While identification of the species at risk is a crucial component of a TAP, addition-al components are required for effective implementation of a TAP, which include: (i) understanding where those species at risk occur with respect to the distribution of the weed; (ii) involving all stakehold-ers in the management of priority species at priority sites; (iii) creating site-specific management plans for each site, and; (iv) ensuring holistic weed management con-tinues at all priority sites. This approach is being developed for bitou bush in NSW through the Bitou TAP (see DEC 2004).
Bitou bush and boneseed WoNS programBitou bush and boneseed (Chrysanthe-moides monilifera subsp. rotundata (L.) T.Norl.) were identified as one of the WoNS (Thorp and Lynch 2000). Follow-ing this determination, the NSW National Parks and Wildlife Service (now part of the Department of Environment and Con-servation) agreed to act as the host agen-cy for the national program. A National Strategy was developed (see ARMCANZ et al. 2000) and a National Coordinator ap-pointed to administer actions within the Strategy. To date, significant progress has been made towards actions outlined in the National Strategy, however, significant work is still needed to tackle the impact of bitou bush and boneseed throughout Australia. Through the National Coordi-nator, the bitou bush and boneseed WoNS program can foster effective weed man-agement and conservation outcomes na-tionally by coordinating integrated weed management (IWM) and planning activi-ties across states, regions and land tenures. This coordinated approach is highlighted through a number of key strategies, one
of which is the draft NSW Bitou Threat Abatement Plan (TAP).
The Bitou TAP has established an in-tegrated approach to weed management using best-practice principles to deliver conservation outcomes to those species most at risk. The threat abatement plan-ning process outlined in the Bitou TAP may provide a good premise for achiev-ing biodiversity conservation outcomes through IWM principles aimed at reduc-ing the distribution, abundance and bio-diversity impacts, which could be adopted more broadly.
Applying this approach to other WoNS speciesThe Bitou TAP approach, of identifying the species/biodiversity at risk and pri-ority locations to enable the greatest con-servation benefits, could be adopted for WoNS. For example, the Bitou TAP ap-proach was trialled recently for lantana in northern NSW/southern Queensland, in conjunction with the National Lantana Coordinator. Results of this trial are very promising, with a significant increase in the number of species at risk (i.e. from 21 to over 160 species). Despite a few minor modifications, this trial indicated that the Bitou TAP approach appears to work for lantana. Thus, further examination is war-ranted to see if the Bitou TAP approach can be applied more broadly to other WoNS.
SummaryImproving our understanding of the bio-diversity threatened by weeds has signifi-cant implications for managing weeds. For example specific conservation outcomes can be established within weed manage-ment strategies (e.g. control of bitou bush to protect littoral rainforests). The Bitou TAP identifies the species at risk as well as establishing a framework for deliver-ing on-ground conservation outcomes. Based on our experiences during the de-velopment and implementation of the Bi-tou TAP, this approach could be used as a
mechanism to reduce the impacts of other WoNS to biodiversity.
AcknowledgementsComments by Aaron Coutts-Smith and Andrew Leys on an earlier version were greatly appreciated.
ReferencesARMCANZ (Agriculture and Resource
Management Council of Australia and New Zealand), ANZECC (Australian and New Zealand Environmental and Conservation Council) and Forestry Ministers (1997). The National Weeds Strategy: A strategic approach to weed problems of national significance. (Com-monwealth of Australia, Canberra).
ARMCANZ (Agriculture and Resource Management Council of Australia and New Zealand), ANZECC (Australian and New Zealand Environmental and Conservation Council) and Forestry Ministers (2000a). Weeds of National Significance Alligator Weed (Alternan-thera philoxeroides) Strategic Plan. (Na-tional Weeds Strategy Executive Com-mittee, Launceston).
ARMCANZ (Agriculture and Resource Management Council of Australia and New Zealand), ANZECC (Australian and New Zealand Environmental and Conservation Council) and Forestry Ministers (2000b). Weeds of National Significance Bitou Bush and Boneseed (Chrysanthemoides monilifera ssp. rotun-data and monilifera) Strategic Plan. (Na-tional Weeds Strategy Executive Com-mittee, Launceston).
ARMCANZ (Agriculture and Resource Management Council of Australia and New Zealand), ANZECC (Australian and New Zealand Environmental and Conservation Council) and Forestry Ministers (2000c). Weeds of National Significance Cabomba (Cabomba caro-liniana) Strategic Plan. (National Weeds Strategy Executive Committee, Launce-ston).
Table 2. Specific actions relating to listing WoNS as KTPs in the 20 National Strategies A
Weed of National Significance
Strategy in plan relating to reducing impacts to biodiversity
Actions in plan relating to reducing current impacts to biodiversity
bridal creeper 2.1.3 – apply for bridal creeper to be listed as a Key Threatening Process under Commonwealth environment legislation
Prepare a submission to Environment Australia
cabomba 2.3.4 – quantify the impacts of cabomba Identify if cabomba is a threatening process under federal biodiversity legislation
mimosa 2.2 – implement land management strategies that decrease the susceptibility of land to mimosa invasion
Present the case for recognising mimosa as a key threatening process under the Endangered Species Protection Act 1992
pond apple 2.1.3 – nominate pond apple as a key threatening process
Collate information required to nominate the impacts of pond apple invasions to Environment Australia as a key threatening process under Commonwealth legislation
A Information derived from ARMCANZ et al. (2000c, 2000e, 2001c, 2000i)
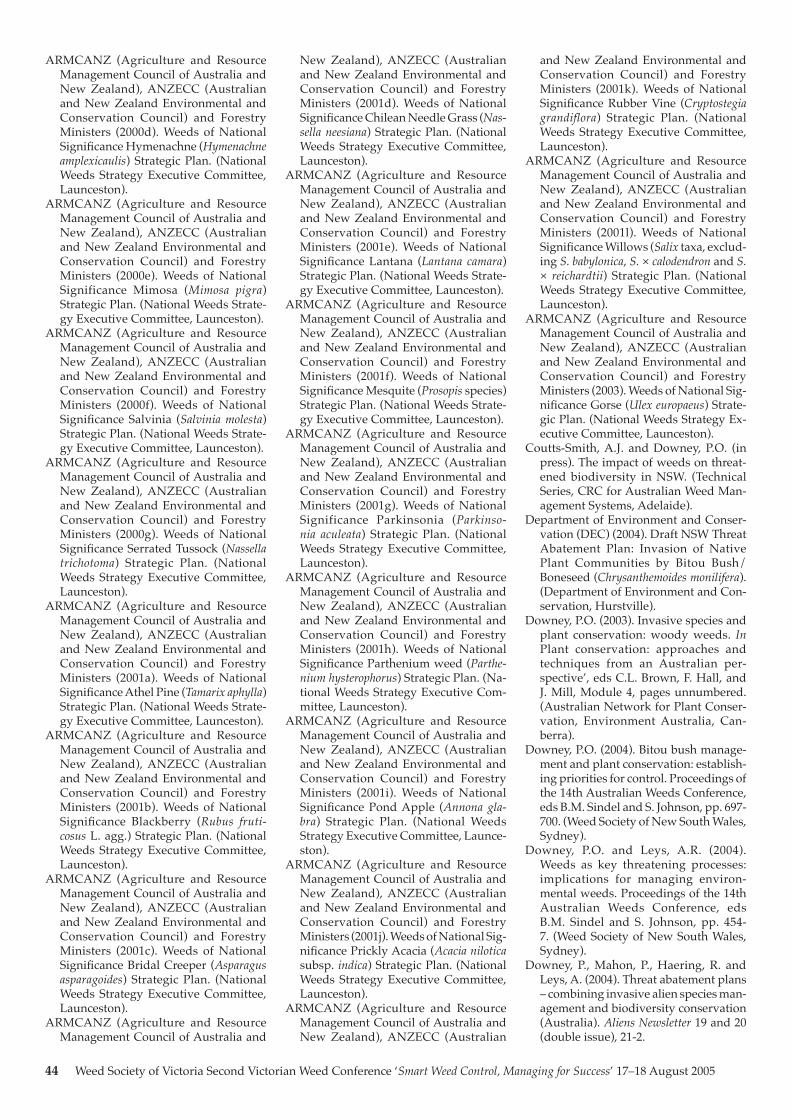
44 Weed Society of Victoria Second Victorian Weed Conference ‘Smart Weed Control, Managing for Success’ 17–18 August 2005
ARMCANZ (Agriculture and Resource Management Council of Australia and New Zealand), ANZECC (Australian and New Zealand Environmental and Conservation Council) and Forestry Ministers (2000d). Weeds of National Significance Hymenachne (Hymenachne amplexicaulis) Strategic Plan. (National Weeds Strategy Executive Committee, Launceston).
ARMCANZ (Agriculture and Resource Management Council of Australia and New Zealand), ANZECC (Australian and New Zealand Environmental and Conservation Council) and Forestry Ministers (2000e). Weeds of National Significance Mimosa (Mimosa pigra) Strategic Plan. (National Weeds Strate-gy Executive Committee, Launceston).
ARMCANZ (Agriculture and Resource Management Council of Australia and New Zealand), ANZECC (Australian and New Zealand Environmental and Conservation Council) and Forestry Ministers (2000f). Weeds of National Significance Salvinia (Salvinia molesta) Strategic Plan. (National Weeds Strate-gy Executive Committee, Launceston).
ARMCANZ (Agriculture and Resource Management Council of Australia and New Zealand), ANZECC (Australian and New Zealand Environmental and Conservation Council) and Forestry Ministers (2000g). Weeds of National Significance Serrated Tussock (Nassella trichotoma) Strategic Plan. (National Weeds Strategy Executive Committee, Launceston).
ARMCANZ (Agriculture and Resource Management Council of Australia and New Zealand), ANZECC (Australian and New Zealand Environmental and Conservation Council) and Forestry Ministers (2001a). Weeds of National Significance Athel Pine (Tamarix aphylla) Strategic Plan. (National Weeds Strate-gy Executive Committee, Launceston).
ARMCANZ (Agriculture and Resource Management Council of Australia and New Zealand), ANZECC (Australian and New Zealand Environmental and Conservation Council) and Forestry Ministers (2001b). Weeds of National Significance Blackberry (Rubus fruti-cosus L. agg.) Strategic Plan. (National Weeds Strategy Executive Committee, Launceston).
ARMCANZ (Agriculture and Resource Management Council of Australia and New Zealand), ANZECC (Australian and New Zealand Environmental and Conservation Council) and Forestry Ministers (2001c). Weeds of National Significance Bridal Creeper (Asparagus asparagoides) Strategic Plan. (National Weeds Strategy Executive Committee, Launceston).
ARMCANZ (Agriculture and Resource Management Council of Australia and
New Zealand), ANZECC (Australian and New Zealand Environmental and Conservation Council) and Forestry Ministers (2001d). Weeds of National Significance Chilean Needle Grass (Nas-sella neesiana) Strategic Plan. (National Weeds Strategy Executive Committee, Launceston).
ARMCANZ (Agriculture and Resource Management Council of Australia and New Zealand), ANZECC (Australian and New Zealand Environmental and Conservation Council) and Forestry Ministers (2001e). Weeds of National Significance Lantana (Lantana camara) Strategic Plan. (National Weeds Strate-gy Executive Committee, Launceston).
ARMCANZ (Agriculture and Resource Management Council of Australia and New Zealand), ANZECC (Australian and New Zealand Environmental and Conservation Council) and Forestry Ministers (2001f). Weeds of National Significance Mesquite (Prosopis species) Strategic Plan. (National Weeds Strate-gy Executive Committee, Launceston).
ARMCANZ (Agriculture and Resource Management Council of Australia and New Zealand), ANZECC (Australian and New Zealand Environmental and Conservation Council) and Forestry Ministers (2001g). Weeds of National Significance Parkinsonia (Parkinso-nia aculeata) Strategic Plan. (National Weeds Strategy Executive Committee, Launceston).
ARMCANZ (Agriculture and Resource Management Council of Australia and New Zealand), ANZECC (Australian and New Zealand Environmental and Conservation Council) and Forestry Ministers (2001h). Weeds of National Significance Parthenium weed (Parthe-nium hysterophorus) Strategic Plan. (Na-tional Weeds Strategy Executive Com-mittee, Launceston).
ARMCANZ (Agriculture and Resource Management Council of Australia and New Zealand), ANZECC (Australian and New Zealand Environmental and Conservation Council) and Forestry Ministers (2001i). Weeds of National Significance Pond Apple (Annona gla-bra) Strategic Plan. (National Weeds Strategy Executive Committee, Launce-ston).
ARMCANZ (Agriculture and Resource Management Council of Australia and New Zealand), ANZECC (Australian and New Zealand Environmental and Conservation Council) and Forestry Ministers (2001j). Weeds of National Sig-nificance Prickly Acacia (Acacia nilotica subsp. indica) Strategic Plan. (National Weeds Strategy Executive Committee, Launceston).
ARMCANZ (Agriculture and Resource Management Council of Australia and New Zealand), ANZECC (Australian
and New Zealand Environmental and Conservation Council) and Forestry Ministers (2001k). Weeds of National Significance Rubber Vine (Cryptostegia grandiflora) Strategic Plan. (National Weeds Strategy Executive Committee, Launceston).
ARMCANZ (Agriculture and Resource Management Council of Australia and New Zealand), ANZECC (Australian and New Zealand Environmental and Conservation Council) and Forestry Ministers (2001l). Weeds of National Significance Willows (Salix taxa, exclud-ing S. babylonica, S. × calodendron and S. × reichardtii) Strategic Plan. (National Weeds Strategy Executive Committee, Launceston).
ARMCANZ (Agriculture and Resource Management Council of Australia and New Zealand), ANZECC (Australian and New Zealand Environmental and Conservation Council) and Forestry Ministers (2003). Weeds of National Sig-nificance Gorse (Ulex europaeus) Strate-gic Plan. (National Weeds Strategy Ex-ecutive Committee, Launceston).
Coutts-Smith, A.J. and Downey, P.O. (in press). The impact of weeds on threat-ened biodiversity in NSW. (Technical Series, CRC for Australian Weed Man-agement Systems, Adelaide).
Department of Environment and Conser-vation (DEC) (2004). Draft NSW Threat Abatement Plan: Invasion of Native Plant Communities by Bitou Bush/Boneseed (Chrysanthemoides monilifera). (Department of Environment and Con-servation, Hurstville).
Downey, P.O. (2003). Invasive species and plant conservation: woody weeds. In Plant conservation: approaches and techniques from an Australian per-spective’, eds C.L. Brown, F. Hall, and J. Mill, Module 4, pages unnumbered. (Australian Network for Plant Conser-vation, Environment Australia, Can-berra).
Downey, P.O. (2004). Bitou bush manage-ment and plant conservation: establish-ing priorities for control. Proceedings of the 14th Australian Weeds Conference, eds B.M. Sindel and S. Johnson, pp. 697-700. (Weed Society of New South Wales, Sydney).
Downey, P.O. and Leys, A.R. (2004). Weeds as key threatening processes: implications for managing environ-mental weeds. Proceedings of the 14th Australian Weeds Conference, eds B.M. Sindel and S. Johnson, pp. 454-7. (Weed Society of New South Wales, Sydney).
Downey, P., Mahon, P., Haering, R. and Leys, A. (2004). Threat abatement plans – combining invasive alien species man-agement and biodiversity conservation (Australia). Aliens Newsletter 19 and 20 (double issue), 21-2.
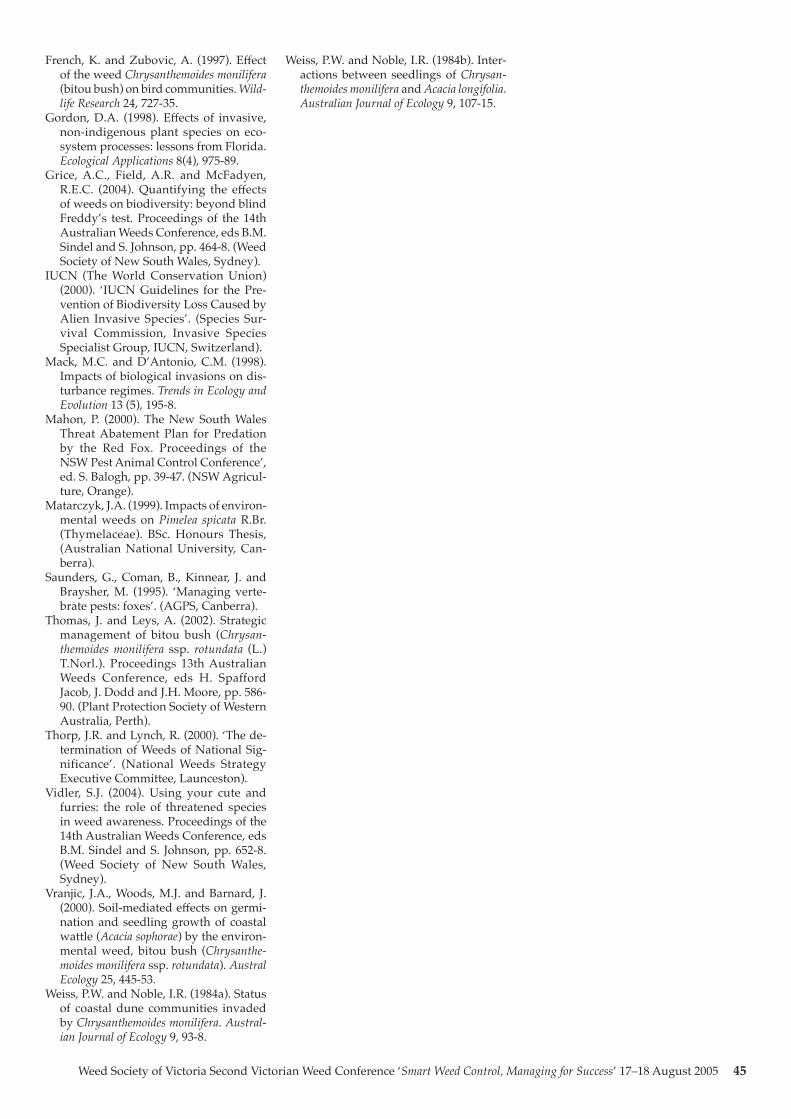
Weed Society of Victoria Second Victorian Weed Conference ‘Smart Weed Control, Managing for Success’ 17–18 August 2005 45
French, K. and Zubovic, A. (1997). Effect of the weed Chrysanthemoides monilifera (bitou bush) on bird communities. Wild-life Research 24, 727-35.
Gordon, D.A. (1998). Effects of invasive, non-indigenous plant species on eco-system processes: lessons from Florida. Ecological Applications 8(4), 975-89.
Grice, A.C., Field, A.R. and McFadyen, R.E.C. (2004). Quantifying the effects of weeds on biodiversity: beyond blind Freddy’s test. Proceedings of the 14th Australian Weeds Conference, eds B.M. Sindel and S. Johnson, pp. 464-8. (Weed Society of New South Wales, Sydney).
IUCN (The World Conservation Union) (2000). ‘IUCN Guidelines for the Pre-vention of Biodiversity Loss Caused by Alien Invasive Species’. (Species Sur-vival Commission, Invasive Species Specialist Group, IUCN, Switzerland).
Mack, M.C. and D’Antonio, C.M. (1998). Impacts of biological invasions on dis-turbance regimes. Trends in Ecology and Evolution 13 (5), 195-8.
Mahon, P. (2000). The New South Wales Threat Abatement Plan for Predation by the Red Fox. Proceedings of the NSW Pest Animal Control Conference’, ed. S. Balogh, pp. 39-47. (NSW Agricul-ture, Orange).
Matarczyk, J.A. (1999). Impacts of environ-mental weeds on Pimelea spicata R.Br. (Thymelaceae). BSc. Honours Thesis, (Australian National University, Can-berra).
Saunders, G., Coman, B., Kinnear, J. and Braysher, M. (1995). ‘Managing verte-brate pests: foxes’. (AGPS, Canberra).
Thomas, J. and Leys, A. (2002). Strategic management of bitou bush (Chrysan-themoides monilifera ssp. rotundata (L.) T.Norl.). Proceedings 13th Australian Weeds Conference, eds H. Spafford Jacob, J. Dodd and J.H. Moore, pp. 586-90. (Plant Protection Society of Western Australia, Perth).
Thorp, J.R. and Lynch, R. (2000). ‘The de-termination of Weeds of National Sig-nificance’. (National Weeds Strategy Executive Committee, Launceston).
Vidler, S.J. (2004). Using your cute and furries: the role of threatened species in weed awareness. Proceedings of the 14th Australian Weeds Conference, eds B.M. Sindel and S. Johnson, pp. 652-8. (Weed Society of New South Wales, Sydney).
Vranjic, J.A., Woods, M.J. and Barnard, J. (2000). Soil-mediated effects on germi-nation and seedling growth of coastal wattle (Acacia sophorae) by the environ-mental weed, bitou bush (Chrysanthe-moides monilifera ssp. rotundata). Austral Ecology 25, 445-53.
Weiss, P.W. and Noble, I.R. (1984a). Status of coastal dune communities invaded by Chrysanthemoides monilifera. Austral-ian Journal of Ecology 9, 93-8.
Weiss, P.W. and Noble, I.R. (1984b). Inter-actions between seedlings of Chrysan-themoides monilifera and Acacia longifolia. Australian Journal of Ecology 9, 107-15.
46 Weed Society of Victoria Second Victorian Weed Conference ‘Smart Weed Control, Managing for Success’ 17–18 August 2005
In general, it is pretty much, a take it or leave it attitude with weeds in our com-munity.
The situation of weeds abounding in many locations creates much discussion and inevitably, they are always someone else’s problem and responsibility.
Some of the most common weed state-ments that we are all familiar with are:• It is the Governments problem because
we used to have those people who came along and sprayed the roadside weeds regularly.
• It is a neighbours problem, because they are quite neglectful and seem to do nothing about a particular problem weed.
• It is a Local Government problem, be-cause we didn't have those weeds in our locality until there was that heavy machinery work, the movement of gravel or re-sheeting of the road.
• Not to mention the state of many Crown Land Reserves – so why doesn't Land-care do something about that!
Gorse Task ForceGorse was deliberately introduced into Australia in the early 1800s and used ex-tensively for hedgerows and has grown out along hundreds of kilometres of fence line. Eventually it invaded many stream and river locations and as a legacy of ex-tensive mining around Ballarat, in any dis-turbed areas of soil, it readily established. So comfortable was the Ballarat locality with gorse, that the Ballarat region was possibly the largest operating maze of roadside and riparian gorse.
In 1998 a small but representative group, mainly the central highland Local Government region, a number of Land-care groups, some really committed peo-ple and the then Department Natural Re-sources and Environment (DNRE) formed the community driven – Ballarat Region Gorse Task Force (BRGTF).
Looking back on our early achievements…These were very optimistic times, with a small budget of about $50 000, which enabled two facilitators working part time, 2–3 days per week and considerable DNRE operational support. Each year our primary funding source has been Second Generation funding from the State Gov-ernment’s Victorian Landcare Program. The task had begun, tackling the huge
infestations of gorse in the Ballarat re-gion.
In 1999, a Gorse Control Strategy was developed, one of the main aims is to increase community awareness of re-sponsibility and possible control options – thereby, overall reducing infestations of gorse. The two principle goals of the strat-egy are:1. Reduce overall extent of gorse within
the GTF area by 25% within five years (2000 ha).
2. Reduce the extent of gorse by 15% within five years on all roadsides and waterways (1000 ha).
Ballarat Region Gorse Task Force, as it was then known, focuses on targeted agricul-tural areas that are nominated by Landcare groups. A small financial incentive is paid to the landholder, towards gorse clearance costs in roadside and riparian locations; as this delivers the greatest public benefit in reducing the spread of seed, but remov-al of gorse on the landholders adjoining property is at their own expense.
The facilitation component of Task Force operation is an important part of the interaction and guidance process. This enables the two parties to develop a Work Plan Agreement (WPA) which is an agree-ment between the facilitator and land-holder about how and when the work is to be achieved. This agreement allows lati-tude and is considerate of the landholder’s circumstances – it is usually preceded by letters, individual contact and the actual WPA allows at least 2–3 months for the control work.
With support from Corangamite, Glenelg /Hopkins, and North Central CMAs a co-operative roadside program was established that involved Local Gov-ernment areas around Ballarat and in some cases dollars were matched by that shire, increasing roadside outcomes.
Change began to occur…In 2001, Gorse Control Strategy was adopted as an Interim Statewide Strategy for Victoria after the BRGTF committee successfully gained Weeds of National Significance (WoNS) funding of $615 000 for 2002–2004 years of operation.
Part of this funding enabled a greater emphasis on removing Gorse from the Ballarat region and really accelerated our Ballarat program. WoNS funding benefit-ed many other strategic locations across the state, allowing GTF to target gorse
infestations from the South Australian bor-der, across to Gippsland. The Gorse Task Force (GTF) now named because of this statewide approach managed the WoNS process.
Weeds of National Significance and DSE Good Neighbour program allow work to be achieved on public land and 75 ha of public land is under long term gorse control as a result. The GTF encour-ages projects to involve all land managers whether freehold, linear managers such as Vic Rail and Vic Roads, DSE and Parks Victoria.
During the time of GTF operation 1782.2 ha of gorse has been treated from 121 708 ha of agricultural land in the South West region, involving 6500 properties and a similar number of landholders.
An extremely rewarding result for the GTF Committee who are representatives from the 40 Landcare groups, three CMA regions of Corangamite, Glenelg/Hop-kins and North Central and the six Lo-cal Government areas of Golden Plains, Ballarat, Ararat, Hepburn, Pyrenees and Moorabool.
Clearly, additional change has occurred outside of target areas because of the in-fluence of target area work. This supports the fact that, while we do nothing there will be no change, we stay ‘comfortable’ with weeds in our environment, but when change occurs it inspires others to do something about their weeds!
In July 2004, the GTF invested in the evaluation of the Gorse Control Strategy (GCS) with the evaluation split into two distinct components:1. The use of an independent consultant
to provide the GTF a clear picture of its partners and stakeholders satisfaction with current programs, and to high-light issues with these programs that need to be addressed.
2. A desktop study to determine progress towards the key actions outlined in the GCS.
The GTF has evolved over the five years, adapting to the complexities of funding changes, improving the operational proc-ess with Landcare groups and harnessing new partners in the task of gorse reduc-tion.
However, it has not been all clear sailing! Gorse Task Force is constantly challenged by the lack of clarity with The Catchment and Land Protection Act (CaLP Act) and in particular the roadside responsibility issue for regionally controlled weeds on undeclared roads. We have been able to advance this situation with funding from the Department of Sustainability and En-vironment for an Interim Roadside Pro-gram. This has enabled six Local Govern-ment regions to arrange control work on priority roadsides and protect previous investment in these locations.
Gorse task force
Jeanette Bellchambers, Gorse Task Force, RMB 1250, Shelford, Victoria 3329

Weed Society of Victoria Second Victorian Weed Conference ‘Smart Weed Control, Managing for Success’ 17–18 August 2005 47
Each year the uncertainty of continu-ing funding is disruptive to our programs. Considerable legal training for facilitators working under the CaLP Act, short-term tenure and twelve-month employment ar-rangements do not deliver the best return for the dollars invested.
The GTF has also realised that when work is undertaken in an area, return and possible follow-up of that area, must re-main for several years to achieve perma-nent change.
As well as those who invest in our work, we also want the best outcome for the dollars invested; weeds are possibly our greatest Natural Resource Manage-ment challenge and need long term sup-port and focus. The GTF realises there is much more work still to be done, but it is possible to see considerable change in and around Ballarat
To secure the process…Weed action needs to be fair but F.I.E.R.C.E. and most of these six components have helped the GTF deliver success!
Facilitation – one on one with landholders, facilitators work with many community members who are not necessarily Landcare members. Facilitators work with Landcare executive committees to estimate gorse infestations and calculate incentive pay-ments, this helps build human capacity at many levels and has helped to lessen the burden on Landcare groups.
Information – there has been an increasing number of calls to DPI requesting informa-tion on gorse control and many requests for assistance in urban and small township areas. Urban areas are presently not the focus of the Gorse Control Strategy and the restrictions of funding limit control work to designated areas. The GTF are presently supporting the feasibility of an existing Local Government By Law, that could assist the clean up of gorse in town-ship locations.In 2001, GTF printed 30 000 brochures (sponsored by Dow AgriServices) detail-ing the options for gorse control, (not just chemical) – so great was the demand, we had to get another 20 000 printed!
Education – about changing the landscape from weed encroachment and the apathy that allows it to happen. This is the interac-tion fore front that can inform of produc-tivity benefits and establishes the continu-ity of regular weed control. In partnership with Keith Turnbull Research Institute, GTF have assisted the Weed Warriors pro-gram that has operated the gorse spider mite breeding and release program involv-ing school children at many schools.
Responsibility, this requires an attitude change, a responsibility to the landscape,
to our many unique ecosystems, our neighbours and the broader region.
Compliance – from the first knock on the door, letter or phone contact, the landhold-er becomes part of the compliance process. This is what the community wants – eve-ryone being involved, ‘not just a scatter-gun approach’.
Enforcement – in fairness to the work planned, delivered and those of the com-munity who accept the challenge and do the work, enforcement is a necessary push for a minority. Often it is only the threat of enforcement that gets the work done.
F.I.E.R.C.E. is the acronym for – everyone desiring and working towards the goal of weed eradication. The benefit is that, all the stakeholders desire the same outcome – we all want a reduction in weed infesta-tions.
Because weeds are everyone’s problem!To achieve this united outcome requires an integrated approach. We need stronger partnerships with State and Local Govern-ment, Catchment Management Authori-ties, Landcare and the broader commu-nity, to work towards this goal.
Every partner needs to be sending out the same message, encouraging better land management, which delivers productivity benefits but most importantly, enforces landowner responsibility.
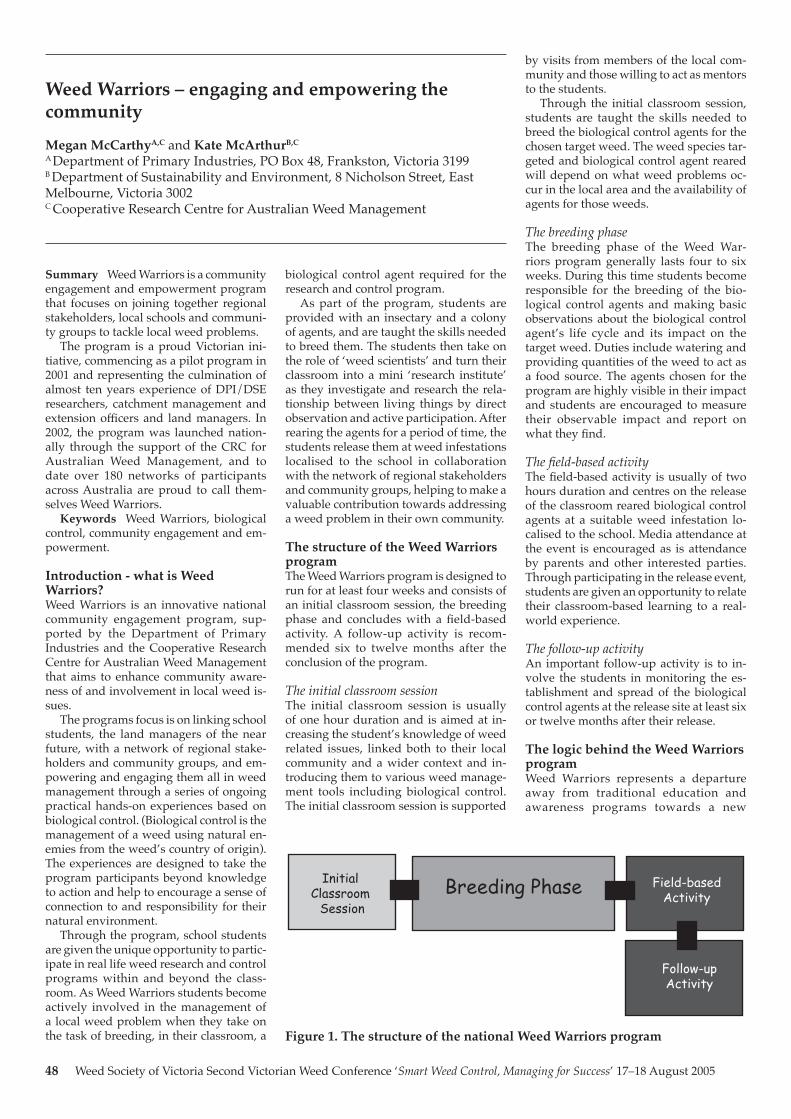
48 Weed Society of Victoria Second Victorian Weed Conference ‘Smart Weed Control, Managing for Success’ 17–18 August 2005
Summary Weed Warriors is a community engagement and empowerment program that focuses on joining together regional stakeholders, local schools and communi-ty groups to tackle local weed problems.
The program is a proud Victorian ini-tiative, commencing as a pilot program in 2001 and representing the culmination of almost ten years experience of DPI/DSE researchers, catchment management and extension officers and land managers. In 2002, the program was launched nation-ally through the support of the CRC for Australian Weed Management, and to date over 180 networks of participants across Australia are proud to call them-selves Weed Warriors.
Keywords Weed Warriors, biological control, community engagement and em-powerment.
Introduction - what is Weed Warriors?Weed Warriors is an innovative national community engagement program, sup-ported by the Department of Primary Industries and the Cooperative Research Centre for Australian Weed Management that aims to enhance community aware-ness of and involvement in local weed is-sues.
The programs focus is on linking school students, the land managers of the near future, with a network of regional stake-holders and community groups, and em-powering and engaging them all in weed management through a series of ongoing practical hands-on experiences based on biological control. (Biological control is the management of a weed using natural en-emies from the weed’s country of origin). The experiences are designed to take the program participants beyond knowledge to action and help to encourage a sense of connection to and responsibility for their natural environment.
Through the program, school students are given the unique opportunity to partic-ipate in real life weed research and control programs within and beyond the class-room. As Weed Warriors students become actively involved in the management of a local weed problem when they take on the task of breeding, in their classroom, a
biological control agent required for the research and control program.
As part of the program, students are provided with an insectary and a colony of agents, and are taught the skills needed to breed them. The students then take on the role of ‘weed scientists’ and turn their classroom into a mini ‘research institute’ as they investigate and research the rela-tionship between living things by direct observation and active participation. After rearing the agents for a period of time, the students release them at weed infestations localised to the school in collaboration with the network of regional stakeholders and community groups, helping to make a valuable contribution towards addressing a weed problem in their own community.
The structure of the Weed Warriors programThe Weed Warriors program is designed to run for at least four weeks and consists of an initial classroom session, the breeding phase and concludes with a field-based activity. A follow-up activity is recom-mended six to twelve months after the conclusion of the program.
The initial classroom sessionThe initial classroom session is usually of one hour duration and is aimed at in-creasing the student’s knowledge of weed related issues, linked both to their local community and a wider context and in-troducing them to various weed manage-ment tools including biological control. The initial classroom session is supported
by visits from members of the local com-munity and those willing to act as mentors to the students.
Through the initial classroom session, students are taught the skills needed to breed the biological control agents for the chosen target weed. The weed species tar-geted and biological control agent reared will depend on what weed problems oc-cur in the local area and the availability of agents for those weeds.
The breeding phaseThe breeding phase of the Weed War-riors program generally lasts four to six weeks. During this time students become responsible for the breeding of the bio-logical control agents and making basic observations about the biological control agent’s life cycle and its impact on the target weed. Duties include watering and providing quantities of the weed to act as a food source. The agents chosen for the program are highly visible in their impact and students are encouraged to measure their observable impact and report on what they find.
The field-based activityThe field-based activity is usually of two hours duration and centres on the release of the classroom reared biological control agents at a suitable weed infestation lo-calised to the school. Media attendance at the event is encouraged as is attendance by parents and other interested parties. Through participating in the release event, students are given an opportunity to relate their classroom-based learning to a real-world experience.
The follow-up activityAn important follow-up activity is to in-volve the students in monitoring the es-tablishment and spread of the biological control agents at the release site at least six or twelve months after their release.
The logic behind the Weed Warriors programWeed Warriors represents a departure away from traditional education and awareness programs towards a new
Figure 1. The structure of the national Weed Warriors program
Field-basedActivity
Follow-upActivity
Initial Classroom
SessionBreeding Phase
Weed Warriors – engaging and empowering the community
Megan McCarthyA,C and Kate McArthurB,C
A Department of Primary Industries, PO Box 48, Frankston, Victoria 3199B Department of Sustainability and Environment, 8 Nicholson Street, East Melbourne, Victoria 3002C Cooperative Research Centre for Australian Weed Management
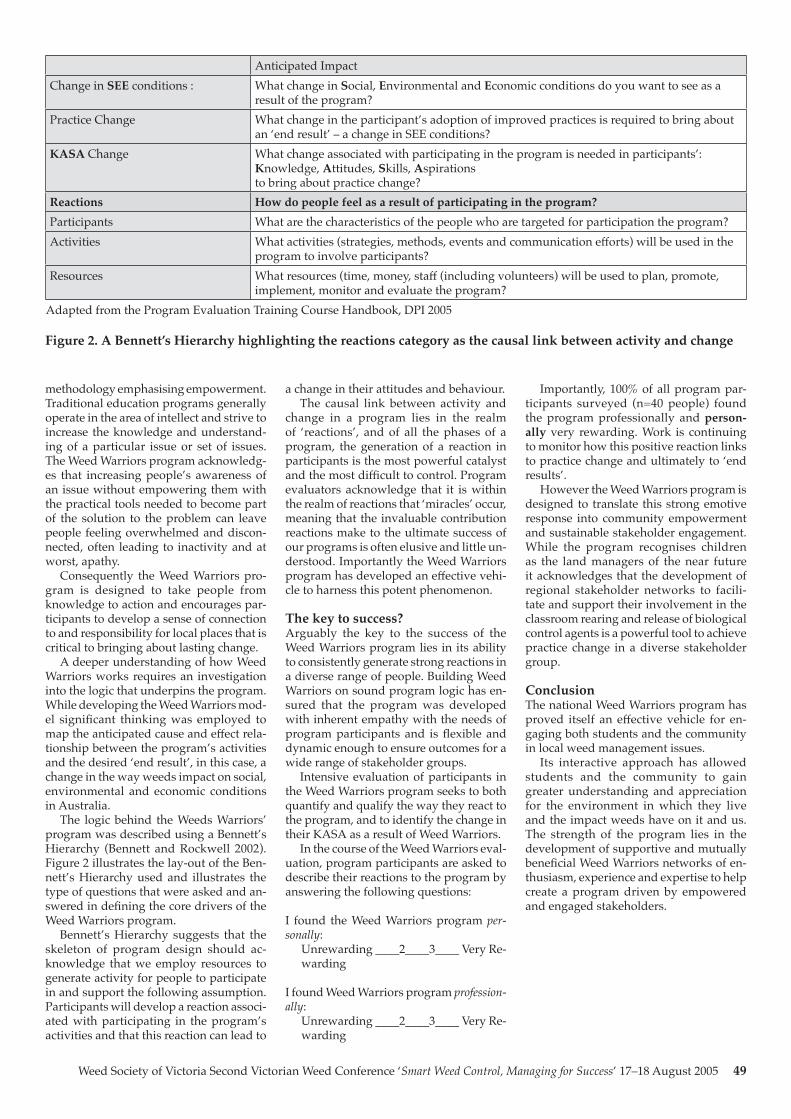
Weed Society of Victoria Second Victorian Weed Conference ‘Smart Weed Control, Managing for Success’ 17–18 August 2005 49
methodology emphasising empowerment. Traditional education programs generally operate in the area of intellect and strive to increase the knowledge and understand-ing of a particular issue or set of issues. The Weed Warriors program acknowledg-es that increasing people’s awareness of an issue without empowering them with the practical tools needed to become part of the solution to the problem can leave people feeling overwhelmed and discon-nected, often leading to inactivity and at worst, apathy.
Consequently the Weed Warriors pro-gram is designed to take people from knowledge to action and encourages par-ticipants to develop a sense of connection to and responsibility for local places that is critical to bringing about lasting change.
A deeper understanding of how Weed Warriors works requires an investigation into the logic that underpins the program. While developing the Weed Warriors mod-el significant thinking was employed to map the anticipated cause and effect rela-tionship between the program’s activities and the desired ‘end result’, in this case, a change in the way weeds impact on social, environmental and economic conditions in Australia.
The logic behind the Weeds Warriors’ program was described using a Bennett’s Hierarchy (Bennett and Rockwell 2002). Figure 2 illustrates the lay-out of the Ben-nett’s Hierarchy used and illustrates the type of questions that were asked and an-swered in defining the core drivers of the Weed Warriors program.
Bennett’s Hierarchy suggests that the skeleton of program design should ac-knowledge that we employ resources to generate activity for people to participate in and support the following assumption. Participants will develop a reaction associ-ated with participating in the program’s activities and that this reaction can lead to
a change in their attitudes and behaviour.The causal link between activity and
change in a program lies in the realm of ‘reactions’, and of all the phases of a program, the generation of a reaction in participants is the most powerful catalyst and the most difficult to control. Program evaluators acknowledge that it is within the realm of reactions that ‘miracles’ occur, meaning that the invaluable contribution reactions make to the ultimate success of our programs is often elusive and little un-derstood. Importantly the Weed Warriors program has developed an effective vehi-cle to harness this potent phenomenon.
The key to success?Arguably the key to the success of the Weed Warriors program lies in its ability to consistently generate strong reactions in a diverse range of people. Building Weed Warriors on sound program logic has en-sured that the program was developed with inherent empathy with the needs of program participants and is flexible and dynamic enough to ensure outcomes for a wide range of stakeholder groups.
Intensive evaluation of participants in the Weed Warriors program seeks to both quantify and qualify the way they react to the program, and to identify the change in their KASA as a result of Weed Warriors.
In the course of the Weed Warriors eval-uation, program participants are asked to describe their reactions to the program by answering the following questions:
I found the Weed Warriors program per-sonally: Unrewarding ____2____3____ Very Re-
warding
I found Weed Warriors program profession-ally: Unrewarding ____2____3____ Very Re-
warding
Anticipated ImpactChange in SEE conditions : What change in Social, Environmental and Economic conditions do you want to see as a
result of the program?Practice Change What change in the participant’s adoption of improved practices is required to bring about
an ‘end result’ – a change in SEE conditions?KASA Change What change associated with participating in the program is needed in participants’:
Knowledge, Attitudes, Skills, Aspirationsto bring about practice change?
Reactions How do people feel as a result of participating in the program?Participants What are the characteristics of the people who are targeted for participation the program?Activities What activities (strategies, methods, events and communication efforts) will be used in the
program to involve participants?Resources What resources (time, money, staff (including volunteers) will be used to plan, promote,
implement, monitor and evaluate the program?Adapted from the Program Evaluation Training Course Handbook, DPI 2005
Figure 2. A Bennett’s Hierarchy highlighting the reactions category as the causal link between activity and change
Importantly, 100% of all program par-ticipants surveyed (n=40 people) found the program professionally and person-ally very rewarding. Work is continuing to monitor how this positive reaction links to practice change and ultimately to ‘end results’.
However the Weed Warriors program is designed to translate this strong emotive response into community empowerment and sustainable stakeholder engagement. While the program recognises children as the land managers of the near future it acknowledges that the development of regional stakeholder networks to facili-tate and support their involvement in the classroom rearing and release of biological control agents is a powerful tool to achieve practice change in a diverse stakeholder group.
ConclusionThe national Weed Warriors program has proved itself an effective vehicle for en-gaging both students and the community in local weed management issues.
Its interactive approach has allowed students and the community to gain greater understanding and appreciation for the environment in which they live and the impact weeds have on it and us. The strength of the program lies in the development of supportive and mutually beneficial Weed Warriors networks of en-thusiasm, experience and expertise to help create a program driven by empowered and engaged stakeholders.
50 Weed Society of Victoria Second Victorian Weed Conference ‘Smart Weed Control, Managing for Success’ 17–18 August 2005
Abstract Meeting expectations are the key to the success of any plan of action. All forms of investment are based on achiev-ing a return on those resources invested through some form of change. If Weed Ac-tion Plans are to provide the basis for in-vestment in weed management they must be able to demonstrate how they will meet expectations and provide return on invest-ment. Community driven plans have the strength of ownership but may be sus-ceptible if the outcomes they seek are not achievable. Evidence based plans provide the logic for weed management but may not represent the aspirations of the com-munity in the location to which they apply. The success of any plan is dependent on the resources that are available to imple-ment it, the likelihood of success and the acceptance of those stakeholders involved. All Weed Action Plans need to incorporate the ownership of the community based on logical and achievable outcomes.
IntroductionWhat are Weed Action Plans? In Australia at present there are a range of documents that could be classified as weed action plans. The various state and federal leg-islations that have provisions to deal with species of plants considered to be weeds are a form of action plan. The various state and federal strategies such as the National Weeds Strategy and in this state, the Victo-rian Pest Management Framework and the associated Victorian Weed Management Strategy, could be considered as weed ac-tion plans. At the regional level Catchment Management Authority Regional Weed Action Plans also comply with the defini-tion. Species based strategies such as those for serrated tussock, gorse, blackberry, rag-wort, and Chilean needle grass are also ac-tion plans for weeds. Localised programs that are articulated within a document of some form can also be defined as weed action plans as such.
The basis of most of these plans has been that they have been developed be-cause the community has identified the need to strategically plan and implement weed management programs. The major-ity of these plans have been developed by the community on what they perceived are the species of plants that present the greatest threat and have the most impact. In recent times there has been the recogni-tion for the need to base decisions about
weed management around assessing the actual threat that these plants present through a vigorous understanding of the plant’s capacity to invade and cause impact. This thinking has been clarified through the Victorian Weed Management Strategy (VWMS) under the Victorian Pest Management Framework with key objec-tives being to ‘assess the threat and risk posed by new plant species with weed po-tential’ and to ‘assess the current and po-tential impact of existing weed problems in Victoria’. Strategic action nine of the VWMS is to assess the benefits and costs of weed management. The required action to achieve this is to ‘develop a decision-making process for investment in weed management that considers economic, en-vironmental and social values’.
BackgroundAustralia’s first noxious weed legislation was enacted in South Australia in 1851 through an ‘Act for Preventing the Further Spread of the Scotch Thistle’ (Parsons and Cuthbertson 1992).
In Victoria over recent years weed man-agement has taken a more strategic focus, this focus has been articulated through the development of weed action plans. Prior to this approach being adopted weed management was very much the responsi-bility of the individual land manager, with the consequence of their management and its associated impact, not being considered by the community as a whole. Govern-ment intervention on behalf of the com-munity occurred through the provisions of noxious weeds legislation where land managers could be required to comply with managing species of plants declared under such legislation.
In Victoria the first concerted effort to develop regionally based weed action plans occurred at the turn of last century. The provisions of the Catchment and Land Protection Act state that a Catchment Man-agement Authority has the function to pre-pare a regional catchment strategy for the region and to co-ordinate and monitor its implementation. Regional Weed Action Plans were seen by government to be an appropriate mechanism to ensure that the weeds deemed by the community of that region to present the greatest threat to the values of that region, were dealt with in a strategic, cost-effective manner.
DiscussionWith all the effort that has been put into managing weeds in Australia since Eu-ropean settlement, why are weeds still a problem? There are believed to be about 2700 naturalised species of non-native plants in this country. Thirty percent of these (798) are considered to be a major problem (Groves et al. 2003). Introduced plants are perceived in different ways by different individuals, what is seen as being a useful plant by one individual or group is seen as a serious threat by others.
Perceptions of individuals, groups and the community provide the drivers as to why plants are considered weeds. To rural communities plants that effect primary in-dustries such as agriculture, horticulture, animal production and forestry reduce economic output and have a direct effect on those communities are considered to be weeds. Users of waterways, irrigation and drainage systems consider plants that hinder fishing, reduce flows, effect water quality and effect habitats to be weeds. Plants that effect human or animal wel-fare are considered by those affected to be weeds. Plants that are fire hazards, re-duce aesthetic values, impede visibility or cause structural damage are considered to be weeds. Plants that adversely affect the integrity, conservation value or diversity of natural ecosystems are viewed as weeds within that context.
A plant is not necessarily a weed in all circumstances, it is only when it is hav-ing an adverse impact that its weedy at-tributes comes to the fore. Some plant spe-cies have this propensity in a number of situations due to their physiology (spiny or injurious), their habit (smothering) or their biochemistry (odour, poisonous, al-lergenic) and these are generally consid-ered our worst weeds. On the other hand some plants only cause impact in certain situations, so if they are not occurring in locations where they can cause this impact or have the potential to cause impact, they are not necessarily weeds.
Given that not all introduced plant spe-cies are weeds and that some plant spe-cies are only considered to be weeds when they cause an impact on something that an individual or the community values, for Weed Action Plans to be effective they need to consider this. Another considera-tion is that weeds need to be managed to minimise their impact and that all forms of management have a cost, then utilising the available resources to manage them in the most cost-effective, efficient man-ner should be the outcome sought by any Weed Action Plan. A Weed Action Plan that does not consider these factors will be unlikely to succeed.
What then is a community driven Weed Action Plan and how is it different to an evidence based plan? Traditionally, community driven plans concentrate on
Evidence based verses community driven Weed Action Plans
Leigh Dennis, Corangamite Catchment Management Authority, 64 Dennis Street, Colac, Victoria 3250
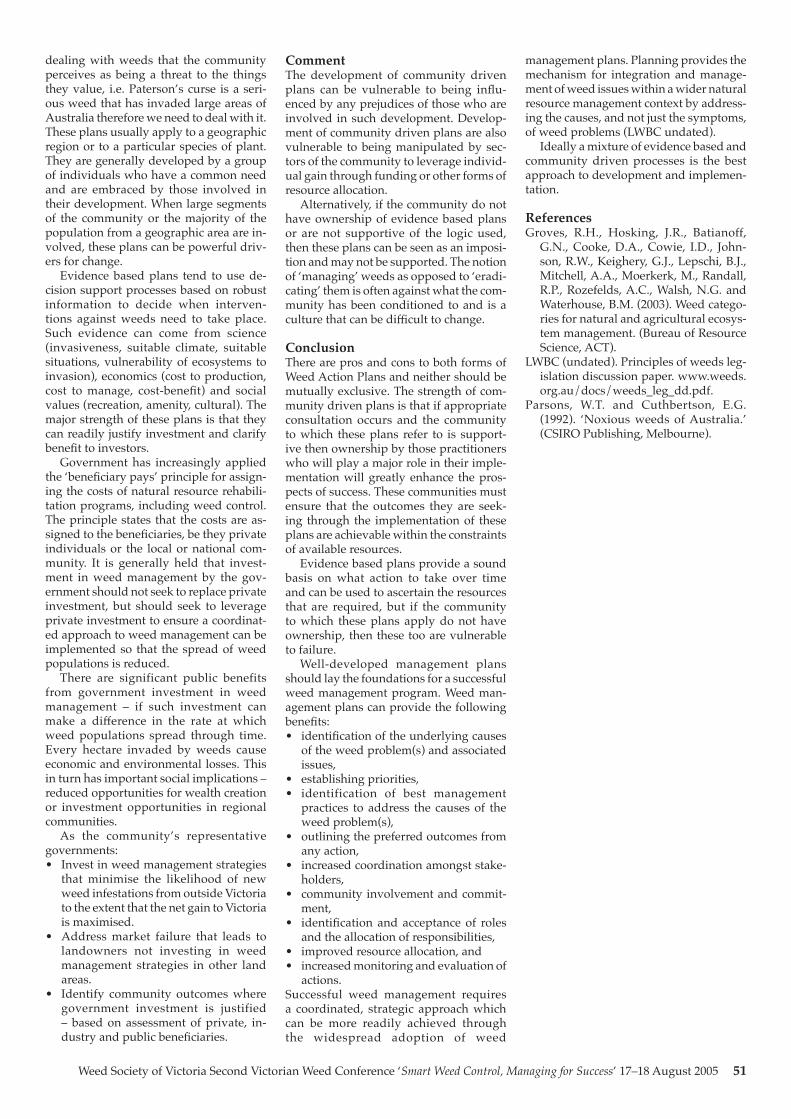
Weed Society of Victoria Second Victorian Weed Conference ‘Smart Weed Control, Managing for Success’ 17–18 August 2005 51
dealing with weeds that the community perceives as being a threat to the things they value, i.e. Paterson’s curse is a seri-ous weed that has invaded large areas of Australia therefore we need to deal with it. These plans usually apply to a geographic region or to a particular species of plant. They are generally developed by a group of individuals who have a common need and are embraced by those involved in their development. When large segments of the community or the majority of the population from a geographic area are in-volved, these plans can be powerful driv-ers for change.
Evidence based plans tend to use de-cision support processes based on robust information to decide when interven-tions against weeds need to take place. Such evidence can come from science (invasiveness, suitable climate, suitable situations, vulnerability of ecosystems to invasion), economics (cost to production, cost to manage, cost-benefit) and social values (recreation, amenity, cultural). The major strength of these plans is that they can readily justify investment and clarify benefit to investors.
Government has increasingly applied the ‘beneficiary pays’ principle for assign-ing the costs of natural resource rehabili-tation programs, including weed control. The principle states that the costs are as-signed to the beneficiaries, be they private individuals or the local or national com-munity. It is generally held that invest-ment in weed management by the gov-ernment should not seek to replace private investment, but should seek to leverage private investment to ensure a coordinat-ed approach to weed management can be implemented so that the spread of weed populations is reduced.
There are significant public benefits from government investment in weed management – if such investment can make a difference in the rate at which weed populations spread through time. Every hectare invaded by weeds cause economic and environmental losses. This in turn has important social implications – reduced opportunities for wealth creation or investment opportunities in regional communities.
As the community’s representative governments:• Invest in weed management strategies
that minimise the likelihood of new weed infestations from outside Victoria to the extent that the net gain to Victoria is maximised.
• Address market failure that leads to landowners not investing in weed management strategies in other land areas.
• Identify community outcomes where government investment is justified – based on assessment of private, in-dustry and public beneficiaries.
CommentThe development of community driven plans can be vulnerable to being influ-enced by any prejudices of those who are involved in such development. Develop-ment of community driven plans are also vulnerable to being manipulated by sec-tors of the community to leverage individ-ual gain through funding or other forms of resource allocation.
Alternatively, if the community do not have ownership of evidence based plans or are not supportive of the logic used, then these plans can be seen as an imposi-tion and may not be supported. The notion of ‘managing’ weeds as opposed to ‘eradi-cating’ them is often against what the com-munity has been conditioned to and is a culture that can be difficult to change.
ConclusionThere are pros and cons to both forms of Weed Action Plans and neither should be mutually exclusive. The strength of com-munity driven plans is that if appropriate consultation occurs and the community to which these plans refer to is support-ive then ownership by those practitioners who will play a major role in their imple-mentation will greatly enhance the pros-pects of success. These communities must ensure that the outcomes they are seek-ing through the implementation of these plans are achievable within the constraints of available resources.
Evidence based plans provide a sound basis on what action to take over time and can be used to ascertain the resources that are required, but if the community to which these plans apply do not have ownership, then these too are vulnerable to failure.
Well-developed management plans should lay the foundations for a successful weed management program. Weed man-agement plans can provide the following benefits:• identification of the underlying causes
of the weed problem(s) and associated issues,
• establishing priorities,• identification of best management
practices to address the causes of the weed problem(s),
• outlining the preferred outcomes from any action,
• increased coordination amongst stake-holders,
• community involvement and commit-ment,
• identification and acceptance of roles and the allocation of responsibilities,
• improved resource allocation, and• increased monitoring and evaluation of
actions.Successful weed management requires a coordinated, strategic approach which can be more readily achieved through the widespread adoption of weed
management plans. Planning provides the mechanism for integration and manage-ment of weed issues within a wider natural resource management context by address-ing the causes, and not just the symptoms, of weed problems (LWBC undated).
Ideally a mixture of evidence based and community driven processes is the best approach to development and implemen-tation.
ReferencesGroves, R.H., Hosking, J.R., Batianoff,
G.N., Cooke, D.A., Cowie, I.D., John-son, R.W., Keighery, G.J., Lepschi, B.J., Mitchell, A.A., Moerkerk, M., Randall, R.P., Rozefelds, A.C., Walsh, N.G. and Waterhouse, B.M. (2003). Weed catego-ries for natural and agricultural ecosys-tem management. (Bureau of Resource Science, ACT).
LWBC (undated). Principles of weeds leg-islation discussion paper. www.weeds.org.au/docs/weeds_leg_dd.pdf.
Parsons, W.T. and Cuthbertson, E.G. (1992). ‘Noxious weeds of Australia.’ (CSIRO Publishing, Melbourne).
52 Weed Society of Victoria Second Victorian Weed Conference ‘Smart Weed Control, Managing for Success’ 17–18 August 2005
Summary This paper reports early results of a field experiment in which cover of two exotic weed species was modified to ex-amine the effect on seedling establishment of two native tree species. The weeds were blackberry (Rubus fruticosus agg.) and blue periwinkle (Vinca major). Both commonly form extensive near-monocultures in ripar-ian zones. Blackwood (Acacia melanoxylon) and manna gum (Eucalyptus viminalis) were the native tree species. Experiments were set up in October 2004 at six riparian sites in southern Victoria. Three sites were used for each weed. Treatments consisting of 0, 40, 80 or 120 cm diameter gaps in the weed cover were planted with seedlings of either blackwood or manna gum. Once created the gaps were allowed to close up without further interference. There were six replicate plots of each treatment per site, giving a total of 48 plots per site.
Overall survival to March of manna gum (30%) was much less than that of blackwood (74%). There were very highly significant effects of tree species and gap size and a significant influence of weed species. Initial seedling size had no sig-nificant influence on survival. Generally seedlings of both species were taller at blue periwinkle sites than at blackberry sites, across all gap sizes. Gap size was a significant factor for height of blackwoods but not for manna gums, however there were only three gap sizes for manna gum heights, due to death of all manna gums in zero gap plots. Results from the remainder of the experiment will be useful for priori-tisation of weed species for management. The results will also define the minimum weed-free space that must be created when planting different native trees
Introduction The riparian zone is the interface between terrestrial and freshwater systems and can be defined as ‘the area of land that adjoins, regularly influences, or is influenced by, a river’ (DNRE 2002). In Victoria, as else-where in Australia, riparian vegetation communities have been degraded by a number of processes, and are particularly vulnerable to invasion by environmental weeds in comparison with other habitats
(Humphries et al. 1991, Carr et al. 1992). The frequency of natural disturbance that creates the mosaic of habitats within the riparian zone is thought to contribute to the high invasibility of riparian commu-nities by exotic species (Naiman and De-camps 1997).
It is often stated that weed species pre-vent the recruitment of native trees and shrubs in various habitats (e.g. Randall 1996, Muyt 2001), but empirical evidence to support such claims is often lacking. In riparian habitats, understanding the im-pact that weeds have on the recruitment of native trees is further limited by the pau-city of information relating to the natural recruitment processes of key overstorey species. A study of weed cover and native seedling occurrence at riparian sites in Vic-toria (Ede et al. 2004) found that contrary to expectations, the abundant riparian weed blackberry (Rubus fruticosus agg.) did not appear to influence the abundance of native tree seedlings. Furthermore, high cover of some exotic groundcover plants was in fact associated with finding greater numbers of native tree seedlings. One rea-son for these findings could be that data were collected at a site (3000–4000 m2) scale, whilst the assumed competition be-tween exotic weeds and native tree seed-lings occurs at a smaller scale.
This paper reports early results of an ongoing field experiment in which cover of two exotic weed species was modified and the responses of two species of native tree seedling examined. The weed species chosen were the shrub blackberry and the perennial herb blue periwinkle (Vinca ma-jor). Both of these species commonly form extensive near-monocultures in riparian zones. Blackwood (Acacia melanoxylon) and manna gum (Eucalyptus viminalis) were the native tree species used. Both of these trees are common in riparian vegeta-tion but have very different phenologies. The objectives were to determine how different levels of weed cover affected the survival and growth of the native tree seedlings, whether the weeds differed in their effects and whether the two native tree species differed in their susceptibili-ties to competition from weeds.
Materials and methodsThe experiments were set up at six riparian sites in southern Victoria, five in Gippsland and one on the Morning-ton peninsula. Three sites were used for blackberry and the remaining three for blue periwinkle. Experimental areas were chosen that as far as possible contained only the weed species of interest. With the exception of one blackberry site all had a canopy of mature native trees. Potential plot locations were marked out at each site and then assigned at random to one of eight treatments in a totally randomised design. Treatments were clearing of 0, 40, 80 or 120 cm diameter gaps in the weed cover, which were then planted with two seedlings of either blackwood or manna gum. One seedling of each pair was des-ignated the primary plant for the plot and the other was a reserve plant to be used only in case of death of the primary plant. Due to a shortage of suitable blackwood seedlings not all blackwood plots had re-serve seedlings. There were six replicate plots of each treatment at every site, giv-ing a total of 48 plots per site. Seedlings had been purchased from a commercial nursery and were selected for uniform size and appearance. When planted in October 2004 mean the height of manna gum seed-lings was 10.7 cm (range 6 to 20) and for blackwoods 7.6 cm (4 to 16). Remaining backup plants were removed in January 2005 unless the primary plant in the plot was dead, which happened in only six of 288 plots. Only data from primary plants are considered here.
Gaps in blackberry cover were created by cutting canes around a central marker to create a gap of the required diameter, with any canes arising within the plot cut at ground level. Root material was not re-moved because the resultant disturbance would have been excessive due to the deep rooting habit of blackberry. Since blackberry canes can grow up to 7 m in a single growing season it was considered that removal of root material within the plots would in any case have little effect on the rate of gap closure. Blue periwinkle gaps were created similarly but in this case the much shallower roots were removed. Once created the gaps were allowed to close up without further interference.
Seedlings were watered in and then covered with wire mesh guards to exclude browsing. No further watering was pro-vided. Survival and height growth were recorded in November and December 2004 and January and March 2005. On each occasion remaining gap size was as-sessed by measuring the total remaining gap (any lengths greater than 10 cm) along four equally spaced diameters.
Number of surviving tree seedlings were analysed by logistic regression and seedling height data by analysis of
Understanding and managing weed effects on establishment of native tree seedlings in riparian zones
Nigel Ainsworth and Fiona Ede, CRC Australian Weed Management, Department of Primary Industries Frankston, PO Box 48, Frankston, Victoria 3199
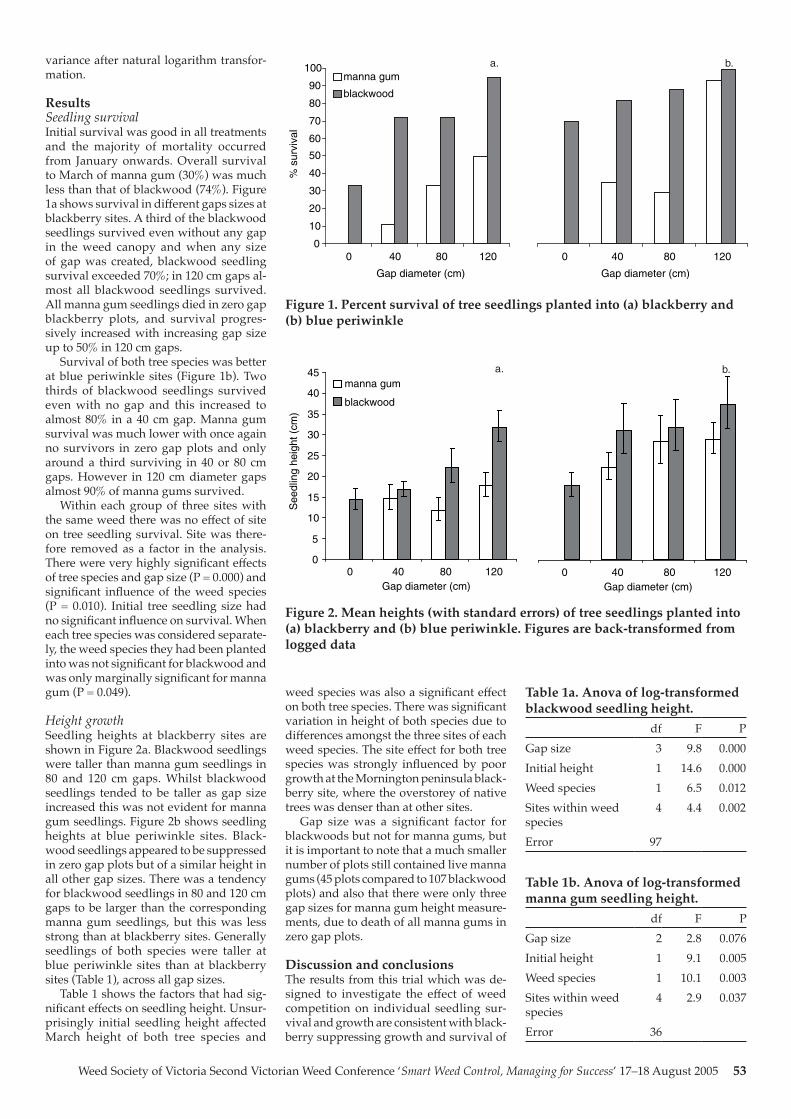
Weed Society of Victoria Second Victorian Weed Conference ‘Smart Weed Control, Managing for Success’ 17–18 August 2005 53
variance after natural logarithm transfor-mation.
ResultsSeedling survival Initial survival was good in all treatments and the majority of mortality occurred from January onwards. Overall survival to March of manna gum (30%) was much less than that of blackwood (74%). Figure 1a shows survival in different gaps sizes at blackberry sites. A third of the blackwood seedlings survived even without any gap in the weed canopy and when any size of gap was created, blackwood seedling survival exceeded 70%; in 120 cm gaps al-most all blackwood seedlings survived. All manna gum seedlings died in zero gap blackberry plots, and survival progres-sively increased with increasing gap size up to 50% in 120 cm gaps.
Survival of both tree species was better at blue periwinkle sites (Figure 1b). Two thirds of blackwood seedlings survived even with no gap and this increased to almost 80% in a 40 cm gap. Manna gum survival was much lower with once again no survivors in zero gap plots and only around a third surviving in 40 or 80 cm gaps. However in 120 cm diameter gaps almost 90% of manna gums survived.
Within each group of three sites with the same weed there was no effect of site on tree seedling survival. Site was there-fore removed as a factor in the analysis. There were very highly significant effects of tree species and gap size (P = 0.000) and significant influence of the weed species (P = 0.010). Initial tree seedling size had no significant influence on survival. When each tree species was considered separate-ly, the weed species they had been planted into was not significant for blackwood and was only marginally significant for manna gum (P = 0.049).
Height growth Seedling heights at blackberry sites are shown in Figure 2a. Blackwood seedlings were taller than manna gum seedlings in 80 and 120 cm gaps. Whilst blackwood seedlings tended to be taller as gap size increased this was not evident for manna gum seedlings. Figure 2b shows seedling heights at blue periwinkle sites. Black-wood seedlings appeared to be suppressed in zero gap plots but of a similar height in all other gap sizes. There was a tendency for blackwood seedlings in 80 and 120 cm gaps to be larger than the corresponding manna gum seedlings, but this was less strong than at blackberry sites. Generally seedlings of both species were taller at blue periwinkle sites than at blackberry sites (Table 1), across all gap sizes.
Table 1 shows the factors that had sig-nificant effects on seedling height. Unsur-prisingly initial seedling height affected March height of both tree species and
Table 1a. Anova of log-transformed blackwood seedling height.
df F PGap size 3 9.8 0.000Initial height 1 14.6 0.000Weed species 1 6.5 0.012Sites within weed species
4 4.4 0.002
Error 97
Table 1b. Anova of log-transformed manna gum seedling height.
df F PGap size 2 2.8 0.076Initial height 1 9.1 0.005Weed species 1 10.1 0.003Sites within weed species
4 2.9 0.037
Error 36
Figure 1. Percent survival of tree seedlings planted into (a) blackberry and (b) blue periwinkle
Figure 2. Mean heights (with standard errors) of tree seedlings planted into (a) blackberry and (b) blue periwinkle. Figures are back-transformed from logged data
0
10
20
30
40
50
60
70
80
90
100
0 40 80 120
Gap diameter (cm)
% s
urvi
val
manna gum
blackwood
0 40 80 120
Gap diameter (cm)
a. b.
0
5
10
15
20
25
30
35
40
45
0 40 80 120Gap diameter (cm)
See
dlin
g he
ight
(cm
)
manna gum
blackwood
0 40 80 120Gap diameter (cm)
a. b.
weed species was also a significant effect on both tree species. There was significant variation in height of both species due to differences amongst the three sites of each weed species. The site effect for both tree species was strongly influenced by poor growth at the Mornington peninsula black-berry site, where the overstorey of native trees was denser than at other sites.
Gap size was a significant factor for blackwoods but not for manna gums, but it is important to note that a much smaller number of plots still contained live manna gums (45 plots compared to 107 blackwood plots) and also that there were only three gap sizes for manna gum height measure-ments, due to death of all manna gums in zero gap plots.
Discussion and conclusionsThe results from this trial which was de-signed to investigate the effect of weed competition on individual seedling sur-vival and growth are consistent with black-berry suppressing growth and survival of
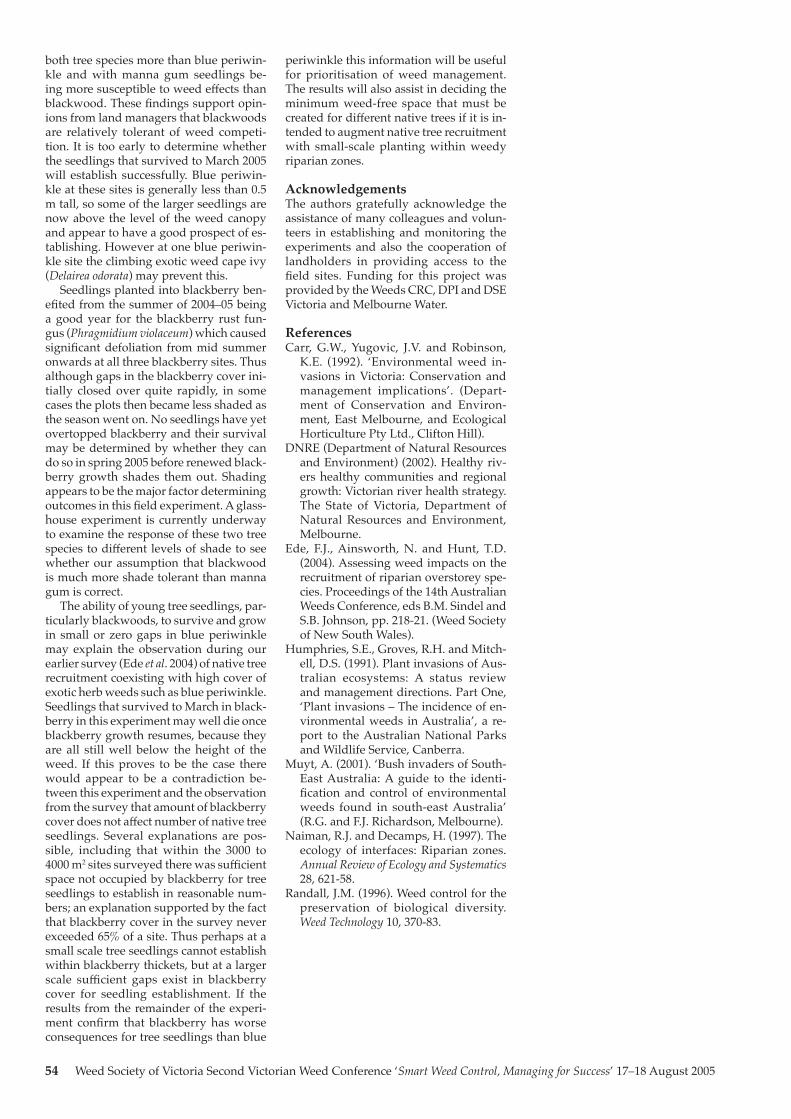
54 Weed Society of Victoria Second Victorian Weed Conference ‘Smart Weed Control, Managing for Success’ 17–18 August 2005
both tree species more than blue periwin-kle and with manna gum seedlings be-ing more susceptible to weed effects than blackwood. These findings support opin-ions from land managers that blackwoods are relatively tolerant of weed competi-tion. It is too early to determine whether the seedlings that survived to March 2005 will establish successfully. Blue periwin-kle at these sites is generally less than 0.5 m tall, so some of the larger seedlings are now above the level of the weed canopy and appear to have a good prospect of es-tablishing. However at one blue periwin-kle site the climbing exotic weed cape ivy (Delairea odorata) may prevent this.
Seedlings planted into blackberry ben-efited from the summer of 2004–05 being a good year for the blackberry rust fun-gus (Phragmidium violaceum) which caused significant defoliation from mid summer onwards at all three blackberry sites. Thus although gaps in the blackberry cover ini-tially closed over quite rapidly, in some cases the plots then became less shaded as the season went on. No seedlings have yet overtopped blackberry and their survival may be determined by whether they can do so in spring 2005 before renewed black-berry growth shades them out. Shading appears to be the major factor determining outcomes in this field experiment. A glass-house experiment is currently underway to examine the response of these two tree species to different levels of shade to see whether our assumption that blackwood is much more shade tolerant than manna gum is correct.
The ability of young tree seedlings, par-ticularly blackwoods, to survive and grow in small or zero gaps in blue periwinkle may explain the observation during our earlier survey (Ede et al. 2004) of native tree recruitment coexisting with high cover of exotic herb weeds such as blue periwinkle. Seedlings that survived to March in black-berry in this experiment may well die once blackberry growth resumes, because they are all still well below the height of the weed. If this proves to be the case there would appear to be a contradiction be-tween this experiment and the observation from the survey that amount of blackberry cover does not affect number of native tree seedlings. Several explanations are pos-sible, including that within the 3000 to 4000 m2 sites surveyed there was sufficient space not occupied by blackberry for tree seedlings to establish in reasonable num-bers; an explanation supported by the fact that blackberry cover in the survey never exceeded 65% of a site. Thus perhaps at a small scale tree seedlings cannot establish within blackberry thickets, but at a larger scale sufficient gaps exist in blackberry cover for seedling establishment. If the results from the remainder of the experi-ment confirm that blackberry has worse consequences for tree seedlings than blue
periwinkle this information will be useful for prioritisation of weed management. The results will also assist in deciding the minimum weed-free space that must be created for different native trees if it is in-tended to augment native tree recruitment with small-scale planting within weedy riparian zones.
AcknowledgementsThe authors gratefully acknowledge the assistance of many colleagues and volun-teers in establishing and monitoring the experiments and also the cooperation of landholders in providing access to the field sites. Funding for this project was provided by the Weeds CRC, DPI and DSE Victoria and Melbourne Water.
ReferencesCarr, G.W., Yugovic, J.V. and Robinson,
K.E. (1992). ‘Environmental weed in-vasions in Victoria: Conservation and management implications’. (Depart-ment of Conservation and Environ-ment, East Melbourne, and Ecological Horticulture Pty Ltd., Clifton Hill).
DNRE (Department of Natural Resources and Environment) (2002). Healthy riv-ers healthy communities and regional growth: Victorian river health strategy. The State of Victoria, Department of Natural Resources and Environment, Melbourne.
Ede, F.J., Ainsworth, N. and Hunt, T.D. (2004). Assessing weed impacts on the recruitment of riparian overstorey spe-cies. Proceedings of the 14th Australian Weeds Conference, eds B.M. Sindel and S.B. Johnson, pp. 218-21. (Weed Society of New South Wales).
Humphries, S.E., Groves, R.H. and Mitch-ell, D.S. (1991). Plant invasions of Aus-tralian ecosystems: A status review and management directions. Part One, ‘Plant invasions – The incidence of en-vironmental weeds in Australia’, a re-port to the Australian National Parks and Wildlife Service, Canberra.
Muyt, A. (2001). ‘Bush invaders of South-East Australia: A guide to the identi-fication and control of environmental weeds found in south-east Australia’ (R.G. and F.J. Richardson, Melbourne).
Naiman, R.J. and Decamps, H. (1997). The ecology of interfaces: Riparian zones. Annual Review of Ecology and Systematics 28, 621-58.
Randall, J.M. (1996). Weed control for the preservation of biological diversity. Weed Technology 10, 370-83.
Weed Society of Victoria Second Victorian Weed Conference ‘Smart Weed Control, Managing for Success’ 17–18 August 2005 55
SESSION 5Successful monitoring
Eradication is a management strategy that has considerable appeal because of its potential to provide substantial benefits when invading pest organisms are elimi-nated. Eradication programs for weeds that develop persistent seed populations will require relatively long-term funding and institutional commitment by compari-son with those targeting other pest organ-isms. Such programs typically require 10 years or more to complete. A procedure for the evaluation of eradication programs is required to distinguish potentially suc-cessful programs from those that are des-tined to become indefinite control efforts.
There are three basic criteria by which progress towards the weed eradication ob-jective may be evaluated. The most funda-mental of these is the delimitation criterion, which relates to the degree of knowledge of the total extent of a weed incursion. The other two criteria (containment and ex-tinction) relate to the prevention of further spread of an incursion and the elimination of individual infestations, respectively. As-sessing conformity to the containment cri-terion is problematic owing to practical difficulties in demonstrating containment failure. However, if containment failure
does occur, it will be reflected by increas-ing total area of infestation, hence will be covered by the delimitation criterion. The delimitation and extinction criteria are examined with regard to eradication programs targeting kochia (Bassia scoparia (L.) A.J. Scott), skeleton weed (Chondrilla juncea L.) (both in Western Australia) and branched broomrape (Orobanche ramosa L.) in South Australia.
A scoring system for the evaluation of progress towards the eradication objec-tive is presented. This system takes into account five-year trends in cumulative in-fested area, the detection ratio (infested area detected/area searched) and the av-erage distance between new infestations and known infestations. It also includes an extinction score, which is a composite of the percentage of infestations in the monitoring phase (no plants detected for at least 12 months) and the percent-age of infestations eradicated. The system is applied to the previously successful eradication program targeting bitterweed (Helenium amarum L.) and to the ongoing program targeting branched broomrape. The data required for this scoring system are fairly simple.
Monitoring weed eradication programs and evaluating performance
F. Dane Panetta, Alan Fletcher Research Station, Queensland Department of Natural Resources and Mines, PO Box 36, Sherwood, Queensland 4075CRC for Australian Weed Management

56 Weed Society of Victoria Second Victorian Weed Conference ‘Smart Weed Control, Managing for Success’ 17–18 August 2005
Summary Since development of the first geospatial technologies (remote sensing, GIS and GPS), there has been consider-able interest in their application to weed management. Remote sensing in particu-lar has been presented as a cost-effec-tive means for mapping and monitoring weeds, with the ability to obtain complete spatial coverage and repeat acquisition over time. Whilst there has been consider-able progress in this area for detecting and mapping and agricultural weeds, the prac-tical application to environmental weeds remains uncertain.
This paper addresses the question of whether remote sensing can be used suc-cessfully to map and monitor environmen-tal weeds in Australia, including discus-sion specific to Victorian conditions. Two components are presented: a review of the current use of remote sensing for mapping and monitoring environmental weeds in Australia, and a case study using remote sensing to map and monitor a single envi-ronmental weed in south-west Victoria.
Although not suitable for all species and conditions, it is concluded that current remote sensing technologies can be used successfully in weed mapping, provided careful consideration is made in matching imagery to the species and mapping envi-ronment. Recent advances in technology may greatly increase our ability to do this, the main limit now being cost. The op-erational use of remote sensing for weed monitoring is yet to be realised in Austral-ia; however, Australian pilot studies and overseas examples indicate considerable possibilities.
IntroductionWeed mapping and monitoring are both recognised as key steps in strategic weed management. Weed mapping is gener-ally carried out as a single assessment that aims to identify and delineate weed populations on the ground (Dewey and Anderson 2004, Cooksey 2002). It is used for assessing the severity of infestation, planning management strategies, and al-locating resources. Weed monitoring on the other hand aims to repeatedly and consistently map weed populations over time in order to detect change (Dewey and
Anderson 2004, Cooksey 2002), and is gen-erally used for assessing the effectiveness of weed control strategies.
Demand for accurate weed mapping and monitoring data is great as govern-ment and funding agencies increasingly need to prioritise weed control and assess-es management outcomes. Yet mapping and monitoring are often neglected from weed management programs due to the difficulties of obtaining adequate spatial and temporal information on weed loca-tion. Traditional weed mapping methods such as on ground surveying or question-naires are time consuming and expensive (Pitt and Miller 1988, McGowen et al. 2001, Grice 2004), and as a result are often lim-ited in extent and coverage.
Remote sensing and other geospatial technologies have greatly enhanced our ability to map land features and land cover change. Remote sensing provides a cost effective means of obtaining data over extensive areas, and has the advan-tage of complete coverage and temporal repetition. Operational use of remote sens-ing in Australia for large scale mapping and monitoring has already been taken up in areas such as broadscale vegetation as-sessment and salinity monitoring (Wallace et al. 2004).
Unlike the ready uptake in other areas of natural resource management, remote sensing has not been widely used in weed management (McGowen et al. 2001). Un-certainties remain over its practicality due to past technical difficulties with single-species mapping (McGowen 2001, Lass et al. 2005). This is highlighted in titles of re-cent agricultural-based papers on the sub-ject, including ‘Is the application of remote sensing to weed mapping just ‘S-pie in the sky?’ and ‘Remote sensing for broadscale weed mapping – is it possible?’ (Bulman 2000, McGowen et al. 2001). Whilst there was much promise for weed mapping applications when remote imagery first emerged, there have since been lingering doubts over its widespread applicabil-ity for this purpose. Can remote sensing, combined with associated geospatial tech-nologies, be useful in practice for weed mapping and monitoring in Australia? Are there many successful examples of
this? What factors influence mapping suc-cess?
This paper attempts to answer some of these questions. Firstly, a review will be presented on the application of remote sensing to environmental weed mapping and monitoring in Australia. The species, study conditions, methods and levels of success will be discussed. A case study will then be presented to explore the choices in-volved in method selection in practice. Fi-nally, implications for future applications will be discussed, and an attempt made at answering the broader question: Can remote sensing can be used successfully in mapping and monitoring environmental weeds in Australia?
The role of geospatial technologies in weed mapping and monitoringGeospatial technologies refer collectively to remote sensing, Geographic Positioning Systems (GPS), and Geographic Informa-tion Systems (GIS). All of these technolo-gies may play an independent or com-bined role in weed management.
Remote sensing may be operationally defined as the acquisition of image data from a remote airborne or satellite plat-form. The primary use of remote sensing in weed management is to collect data from which weed distribution informa-tion can be extracted to create weed maps. A wide range of imagery is available with varying spatial coverage (area), spatial resolution (smallest image unit), and spectral resolution (number of recorded spectral bands in different regions of the electromagnetic spectrum) (Table 1). For a weed species to be accurately mapped using remotely sensed imagery, it must be spectrally distinct from surrounding land cover types, and the characteristics of the imagery must be such that this difference can be detected (Bulman 2000, McGowen et al. 2001). A complete review of remote sensing principles and their application to weed mapping may be found in Bulman (2000) and Lass et al. (2005).
A Geographic Positioning System (GPS) is a hand held unit which can ac-curately identify geographic position on the ground. In weed management, GPS units are used by managers to record point locations of weed infestations or control efforts in the field, which can then be up-loaded into a computer for storage and analysis (Tucker personal communication, Honan personal communication.). The ac-curacy of GPS units can vary considerably according to price and the presence or ab-sence of differential correction (i.e. remov-al of noise signals introduced by the US Army to reduce positional accuracy). Top of the range units with differential correc-tion can now obtain sub-meter accuracies, although some cheaper units (less than AU$500) can achieve accuracies of within 10 m or better. A number of GPS units have
Using geospatial technologies to map and monitor environmental weeds
Jennifer EmenyA, Anne WallisA and Dianne SimmonsB
A School of Ecology and Environment, Deakin University, PO Box 423, Warrnambool, Victoria 3280B School of Ecology and Environment, Deakin University, 221 Burwood Highway, Burwood, Victoria 3125
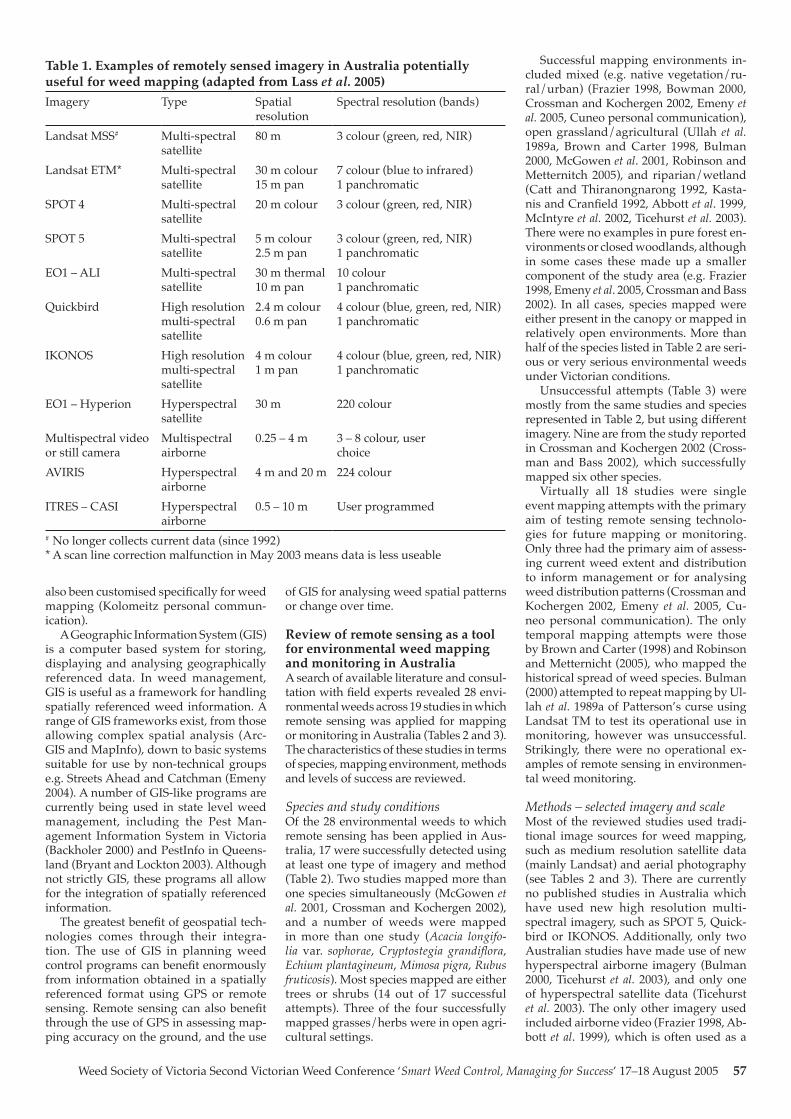
Weed Society of Victoria Second Victorian Weed Conference ‘Smart Weed Control, Managing for Success’ 17–18 August 2005 57
also been customised specifically for weed mapping (Kolomeitz personal commun- ication).
A Geographic Information System (GIS) is a computer based system for storing, displaying and analysing geographically referenced data. In weed management, GIS is useful as a framework for handling spatially referenced weed information. A range of GIS frameworks exist, from those allowing complex spatial analysis (Arc-GIS and MapInfo), down to basic systems suitable for use by non-technical groups e.g. Streets Ahead and Catchman (Emeny 2004). A number of GIS-like programs are currently being used in state level weed management, including the Pest Man-agement Information System in Victoria (Backholer 2000) and PestInfo in Queens-land (Bryant and Lockton 2003). Although not strictly GIS, these programs all allow for the integration of spatially referenced information.
The greatest benefit of geospatial tech-nologies comes through their integra-tion. The use of GIS in planning weed control programs can benefit enormously from information obtained in a spatially referenced format using GPS or remote sensing. Remote sensing can also benefit through the use of GPS in assessing map-ping accuracy on the ground, and the use
of GIS for analysing weed spatial patterns or change over time.
Review of remote sensing as a tool for environmental weed mapping and monitoring in Australia A search of available literature and consul-tation with field experts revealed 28 envi-ronmental weeds across 19 studies in which remote sensing was applied for mapping or monitoring in Australia (Tables 2 and 3). The characteristics of these studies in terms of species, mapping environment, methods and levels of success are reviewed.
Species and study conditionsOf the 28 environmental weeds to which remote sensing has been applied in Aus-tralia, 17 were successfully detected using at least one type of imagery and method (Table 2). Two studies mapped more than one species simultaneously (McGowen et al. 2001, Crossman and Kochergen 2002), and a number of weeds were mapped in more than one study (Acacia longifo-lia var. sophorae, Cryptostegia grandiflora, Echium plantagineum, Mimosa pigra, Rubus fruticosis). Most species mapped are either trees or shrubs (14 out of 17 successful attempts). Three of the four successfully mapped grasses/herbs were in open agri-cultural settings.
Successful mapping environments in-cluded mixed (e.g. native vegetation/ru-ral/urban) (Frazier 1998, Bowman 2000, Crossman and Kochergen 2002, Emeny et al. 2005, Cuneo personal communication), open grassland/agricultural (Ullah et al. 1989a, Brown and Carter 1998, Bulman 2000, McGowen et al. 2001, Robinson and Metternitch 2005), and riparian/wetland (Catt and Thiranongnarong 1992, Kasta-nis and Cranfield 1992, Abbott et al. 1999, McIntyre et al. 2002, Ticehurst et al. 2003). There were no examples in pure forest en-vironments or closed woodlands, although in some cases these made up a smaller component of the study area (e.g. Frazier 1998, Emeny et al. 2005, Crossman and Bass 2002). In all cases, species mapped were either present in the canopy or mapped in relatively open environments. More than half of the species listed in Table 2 are seri-ous or very serious environmental weeds under Victorian conditions.
Unsuccessful attempts (Table 3) were mostly from the same studies and species represented in Table 2, but using different imagery. Nine are from the study reported in Crossman and Kochergen 2002 (Cross-man and Bass 2002), which successfully mapped six other species.
Virtually all 18 studies were single event mapping attempts with the primary aim of testing remote sensing technolo-gies for future mapping or monitoring. Only three had the primary aim of assess-ing current weed extent and distribution to inform management or for analysing weed distribution patterns (Crossman and Kochergen 2002, Emeny et al. 2005, Cu-neo personal communication). The only temporal mapping attempts were those by Brown and Carter (1998) and Robinson and Metternicht (2005), who mapped the historical spread of weed species. Bulman (2000) attempted to repeat mapping by Ul-lah et al. 1989a of Patterson’s curse using Landsat TM to test its operational use in monitoring, however was unsuccessful. Strikingly, there were no operational ex-amples of remote sensing in environmen-tal weed monitoring.
Methods – selected imagery and scaleMost of the reviewed studies used tradi-tional image sources for weed mapping, such as medium resolution satellite data (mainly Landsat) and aerial photography (see Tables 2 and 3). There are currently no published studies in Australia which have used new high resolution multi-spectral imagery, such as SPOT 5, Quick-bird or IKONOS. Additionally, only two Australian studies have made use of new hyperspectral airborne imagery (Bulman 2000, Ticehurst et al. 2003), and only one of hyperspectral satellite data (Ticehurst et al. 2003). The only other imagery used included airborne video (Frazier 1998, Ab-bott et al. 1999), which is often used as a
Table 1. Examples of remotely sensed imagery in Australia potentially useful for weed mapping (adapted from Lass et al. 2005)Imagery Type Spatial
resolutionSpectral resolution (bands)
Landsat MSS# Multi-spectral satellite
80 m 3 colour (green, red, NIR)
Landsat ETM* Multi-spectral satellite
30 m colour 15 m pan
7 colour (blue to infrared) 1 panchromatic
SPOT 4 Multi-spectral satellite
20 m colour 3 colour (green, red, NIR)
SPOT 5 Multi-spectral satellite
5 m colour 2.5 m pan
3 colour (green, red, NIR) 1 panchromatic
EO1 – ALI Multi-spectral satellite
30 m thermal 10 m pan
10 colour 1 panchromatic
Quickbird High resolution multi-spectral satellite
2.4 m colour 0.6 m pan
4 colour (blue, green, red, NIR) 1 panchromatic
IKONOS High resolution multi-spectral satellite
4 m colour 1 m pan
4 colour (blue, green, red, NIR) 1 panchromatic
EO1 – Hyperion Hyperspectral satellite
30 m 220 colour
Multispectral video or still camera
Multispectral airborne
0.25 – 4 m 3 – 8 colour, user choice
AVIRIS Hyperspectral airborne
4 m and 20 m 224 colour
ITRES – CASI Hyperspectral airborne
0.5 – 10 m User programmed
# No longer collects current data (since 1992)* A scan line correction malfunction in May 2003 means data is less useable
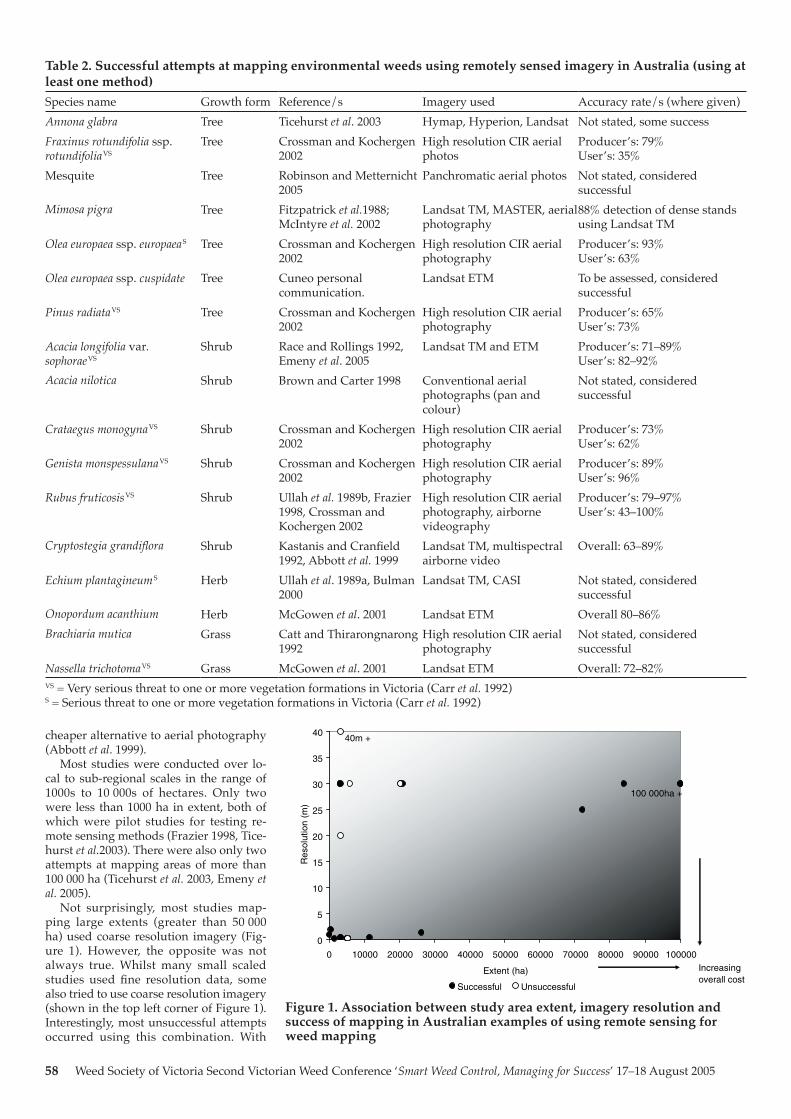
58 Weed Society of Victoria Second Victorian Weed Conference ‘Smart Weed Control, Managing for Success’ 17–18 August 2005
cheaper alternative to aerial photography (Abbott et al. 1999).
Most studies were conducted over lo-cal to sub-regional scales in the range of 1000s to 10 000s of hectares. Only two were less than 1000 ha in extent, both of which were pilot studies for testing re-mote sensing methods (Frazier 1998, Tice-hurst et al.2003). There were also only two attempts at mapping areas of more than 100 000 ha (Ticehurst et al. 2003, Emeny et al. 2005).
Not surprisingly, most studies map-ping large extents (greater than 50 000 ha) used coarse resolution imagery (Fig-ure 1). However, the opposite was not always true. Whilst many small scaled studies used fine resolution data, some also tried to use coarse resolution imagery (shown in the top left corner of Figure 1). Interestingly, most unsuccessful attempts occurred using this combination. With
Table 2. Successful attempts at mapping environmental weeds using remotely sensed imagery in Australia (using at least one method)Species name Growth form Reference/s Imagery used Accuracy rate/s (where given)Annona glabra Tree Ticehurst et al. 2003 Hymap, Hyperion, Landsat Not stated, some successFraxinus rotundifolia ssp. rotundifoliaVS
Tree Crossman and Kochergen 2002
High resolution CIR aerial photos
Producer’s: 79% User’s: 35%
Mesquite Tree Robinson and Metternicht 2005
Panchromatic aerial photos Not stated, considered successful
Mimosa pigra Tree Fitzpatrick et al.1988; McIntyre et al. 2002
Landsat TM, MASTER, aerial photography
88% detection of dense stands using Landsat TM
Olea europaea ssp. europaeaS Tree Crossman and Kochergen 2002
High resolution CIR aerial photography
Producer’s: 93% User’s: 63%
Olea europaea ssp. cuspidate Tree Cuneo personal communication.
Landsat ETM To be assessed, considered successful
Pinus radiataVS Tree Crossman and Kochergen 2002
High resolution CIR aerial photography
Producer’s: 65% User’s: 73%
Acacia longifolia var. sophoraeVS
Shrub Race and Rollings 1992, Emeny et al. 2005
Landsat TM and ETM Producer’s: 71–89% User’s: 82–92%
Acacia nilotica Shrub Brown and Carter 1998 Conventional aerial photographs (pan and colour)
Not stated, considered successful
Crataegus monogynaVS Shrub Crossman and Kochergen 2002
High resolution CIR aerial photography
Producer’s: 73% User’s: 62%
Genista monspessulanaVS Shrub Crossman and Kochergen 2002
High resolution CIR aerial photography
Producer’s: 89% User’s: 96%
Rubus fruticosisVS Shrub Ullah et al. 1989b, Frazier 1998, Crossman and Kochergen 2002
High resolution CIR aerial photography, airborne videography
Producer’s: 79–97% User’s: 43–100%
Cryptostegia grandiflora Shrub Kastanis and Cranfield 1992, Abbott et al. 1999
Landsat TM, multispectral airborne video
Overall: 63–89%
Echium plantagineumS Herb Ullah et al. 1989a, Bulman 2000
Landsat TM, CASI Not stated, considered successful
Onopordum acanthium Herb McGowen et al. 2001 Landsat ETM Overall 80–86%Brachiaria mutica Grass Catt and Thirarongnarong
1992High resolution CIR aerial photography
Not stated, considered successful
Nassella trichotomaVS Grass McGowen et al. 2001 Landsat ETM Overall: 72–82%VS = Very serious threat to one or more vegetation formations in Victoria (Carr et al. 1992)S = Serious threat to one or more vegetation formations in Victoria (Carr et al. 1992)
Figure 1. Association between study area extent, imagery resolution and success of mapping in Australian examples of using remote sensing for weed mapping
0
5
10
15
20
25
30
35
40
0 10000 20000 30000 40000 50000 60000 70000 80000 90000 100000
Extent (ha)
Res
olut
ion
(m)
Successful Unsuccessful
100 000ha +
40m +
Increasing overall cost
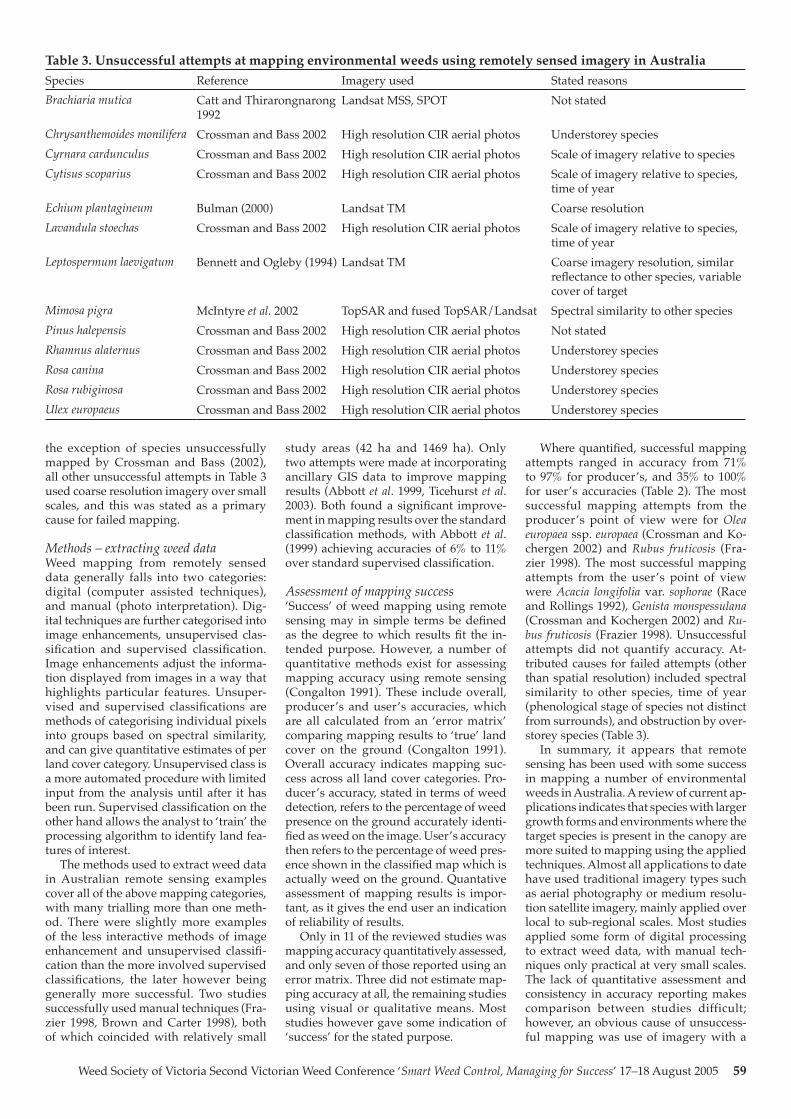
Weed Society of Victoria Second Victorian Weed Conference ‘Smart Weed Control, Managing for Success’ 17–18 August 2005 59
the exception of species unsuccessfully mapped by Crossman and Bass (2002), all other unsuccessful attempts in Table 3 used coarse resolution imagery over small scales, and this was stated as a primary cause for failed mapping.
Methods – extracting weed data Weed mapping from remotely sensed data generally falls into two categories: digital (computer assisted techniques), and manual (photo interpretation). Dig-ital techniques are further categorised into image enhancements, unsupervised clas-sification and supervised classification. Image enhancements adjust the informa-tion displayed from images in a way that highlights particular features. Unsuper-vised and supervised classifications are methods of categorising individual pixels into groups based on spectral similarity, and can give quantitative estimates of per land cover category. Unsupervised class is a more automated procedure with limited input from the analysis until after it has been run. Supervised classification on the other hand allows the analyst to ‘train’ the processing algorithm to identify land fea-tures of interest.
The methods used to extract weed data in Australian remote sensing examples cover all of the above mapping categories, with many trialling more than one meth-od. There were slightly more examples of the less interactive methods of image enhancement and unsupervised classifi-cation than the more involved supervised classifications, the later however being generally more successful. Two studies successfully used manual techniques (Fra-zier 1998, Brown and Carter 1998), both of which coincided with relatively small
study areas (42 ha and 1469 ha). Only two attempts were made at incorporating ancillary GIS data to improve mapping results (Abbott et al. 1999, Ticehurst et al. 2003). Both found a significant improve-ment in mapping results over the standard classification methods, with Abbott et al. (1999) achieving accuracies of 6% to 11% over standard supervised classification.
Assessment of mapping success‘Success’ of weed mapping using remote sensing may in simple terms be defined as the degree to which results fit the in-tended purpose. However, a number of quantitative methods exist for assessing mapping accuracy using remote sensing (Congalton 1991). These include overall, producer’s and user’s accuracies, which are all calculated from an ‘error matrix’ comparing mapping results to ‘true’ land cover on the ground (Congalton 1991). Overall accuracy indicates mapping suc-cess across all land cover categories. Pro-ducer’s accuracy, stated in terms of weed detection, refers to the percentage of weed presence on the ground accurately identi-fied as weed on the image. User’s accuracy then refers to the percentage of weed pres-ence shown in the classified map which is actually weed on the ground. Quantative assessment of mapping results is impor-tant, as it gives the end user an indication of reliability of results.
Only in 11 of the reviewed studies was mapping accuracy quantitatively assessed, and only seven of those reported using an error matrix. Three did not estimate map-ping accuracy at all, the remaining studies using visual or qualitative means. Most studies however gave some indication of ‘success’ for the stated purpose.
Where quantified, successful mapping attempts ranged in accuracy from 71% to 97% for producer’s, and 35% to 100% for user’s accuracies (Table 2). The most successful mapping attempts from the producer’s point of view were for Olea europaea ssp. europaea (Crossman and Ko-chergen 2002) and Rubus fruticosis (Fra-zier 1998). The most successful mapping attempts from the user’s point of view were Acacia longifolia var. sophorae (Race and Rollings 1992), Genista monspessulana (Crossman and Kochergen 2002) and Ru-bus fruticosis (Frazier 1998). Unsuccessful attempts did not quantify accuracy. At-tributed causes for failed attempts (other than spatial resolution) included spectral similarity to other species, time of year (phenological stage of species not distinct from surrounds), and obstruction by over-storey species (Table 3).
In summary, it appears that remote sensing has been used with some success in mapping a number of environmental weeds in Australia. A review of current ap-plications indicates that species with larger growth forms and environments where the target species is present in the canopy are more suited to mapping using the applied techniques. Almost all applications to date have used traditional imagery types such as aerial photography or medium resolu-tion satellite imagery, mainly applied over local to sub-regional scales. Most studies applied some form of digital processing to extract weed data, with manual tech-niques only practical at very small scales. The lack of quantitative assessment and consistency in accuracy reporting makes comparison between studies difficult; however, an obvious cause of unsuccess-ful mapping was use of imagery with a
Table 3. Unsuccessful attempts at mapping environmental weeds using remotely sensed imagery in AustraliaSpecies Reference Imagery used Stated reasonsBrachiaria mutica Catt and Thirarongnarong
1992Landsat MSS, SPOT Not stated
Chrysanthemoides monilifera Crossman and Bass 2002 High resolution CIR aerial photos Understorey speciesCyrnara cardunculus Crossman and Bass 2002 High resolution CIR aerial photos Scale of imagery relative to speciesCytisus scoparius Crossman and Bass 2002 High resolution CIR aerial photos Scale of imagery relative to species,
time of yearEchium plantagineum Bulman (2000) Landsat TM Coarse resolution Lavandula stoechas Crossman and Bass 2002 High resolution CIR aerial photos Scale of imagery relative to species,
time of yearLeptospermum laevigatum Bennett and Ogleby (1994) Landsat TM Coarse imagery resolution, similar
reflectance to other species, variable cover of target
Mimosa pigra McIntyre et al. 2002 TopSAR and fused TopSAR/Landsat Spectral similarity to other species Pinus halepensis Crossman and Bass 2002 High resolution CIR aerial photos Not statedRhamnus alaternus Crossman and Bass 2002 High resolution CIR aerial photos Understorey speciesRosa canina Crossman and Bass 2002 High resolution CIR aerial photos Understorey speciesRosa rubiginosa Crossman and Bass 2002 High resolution CIR aerial photos Understorey speciesUlex europaeus Crossman and Bass 2002 High resolution CIR aerial photos Understorey species
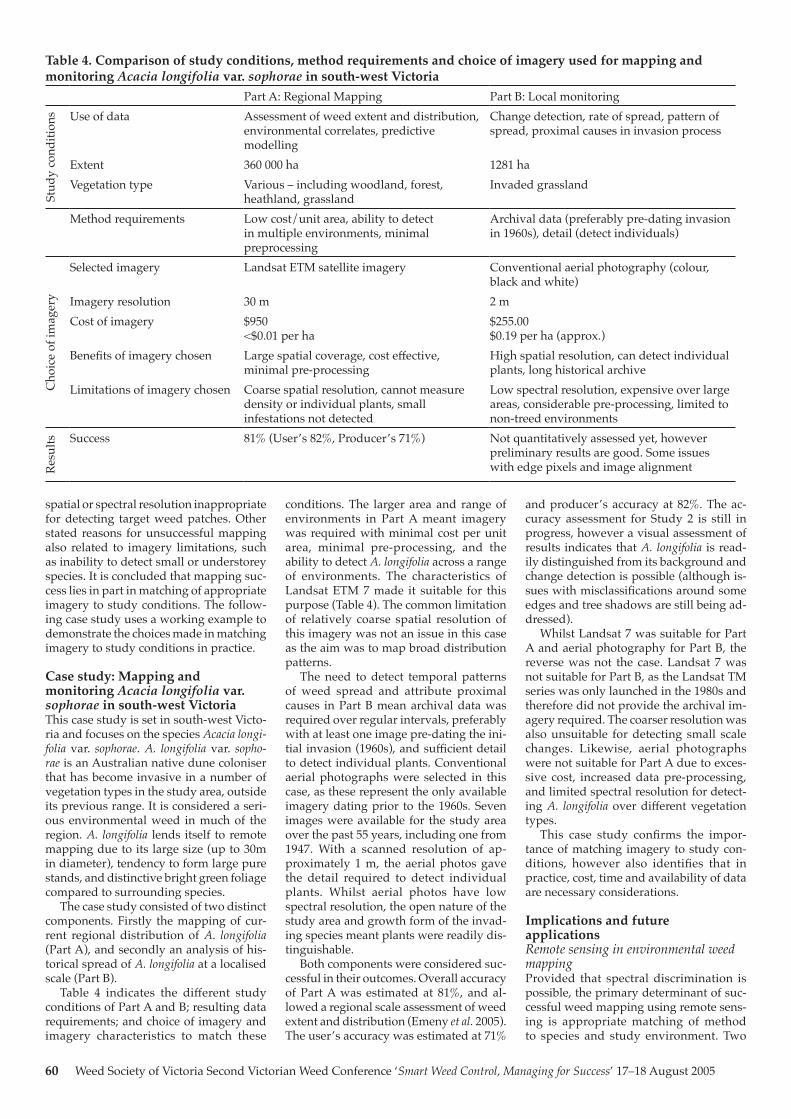
60 Weed Society of Victoria Second Victorian Weed Conference ‘Smart Weed Control, Managing for Success’ 17–18 August 2005
spatial or spectral resolution inappropriate for detecting target weed patches. Other stated reasons for unsuccessful mapping also related to imagery limitations, such as inability to detect small or understorey species. It is concluded that mapping suc-cess lies in part in matching of appropriate imagery to study conditions. The follow-ing case study uses a working example to demonstrate the choices made in matching imagery to study conditions in practice.
Case study: Mapping and monitoring Acacia longifolia var. sophorae in south-west VictoriaThis case study is set in south-west Victo-ria and focuses on the species Acacia longi-folia var. sophorae. A. longifolia var. sopho-rae is an Australian native dune coloniser that has become invasive in a number of vegetation types in the study area, outside its previous range. It is considered a seri-ous environmental weed in much of the region. A. longifolia lends itself to remote mapping due to its large size (up to 30m in diameter), tendency to form large pure stands, and distinctive bright green foliage compared to surrounding species.
The case study consisted of two distinct components. Firstly the mapping of cur-rent regional distribution of A. longifolia (Part A), and secondly an analysis of his-torical spread of A. longifolia at a localised scale (Part B).
Table 4 indicates the different study conditions of Part A and B; resulting data requirements; and choice of imagery and imagery characteristics to match these
conditions. The larger area and range of environments in Part A meant imagery was required with minimal cost per unit area, minimal pre-processing, and the ability to detect A. longifolia across a range of environments. The characteristics of Landsat ETM 7 made it suitable for this purpose (Table 4). The common limitation of relatively coarse spatial resolution of this imagery was not an issue in this case as the aim was to map broad distribution patterns.
The need to detect temporal patterns of weed spread and attribute proximal causes in Part B mean archival data was required over regular intervals, preferably with at least one image pre-dating the ini-tial invasion (1960s), and sufficient detail to detect individual plants. Conventional aerial photographs were selected in this case, as these represent the only available imagery dating prior to the 1960s. Seven images were available for the study area over the past 55 years, including one from 1947. With a scanned resolution of ap-proximately 1 m, the aerial photos gave the detail required to detect individual plants. Whilst aerial photos have low spectral resolution, the open nature of the study area and growth form of the invad-ing species meant plants were readily dis-tinguishable.
Both components were considered suc-cessful in their outcomes. Overall accuracy of Part A was estimated at 81%, and al-lowed a regional scale assessment of weed extent and distribution (Emeny et al. 2005). The user’s accuracy was estimated at 71%
and producer’s accuracy at 82%. The ac-curacy assessment for Study 2 is still in progress, however a visual assessment of results indicates that A. longifolia is read-ily distinguished from its background and change detection is possible (although is-sues with misclassifications around some edges and tree shadows are still being ad-dressed).
Whilst Landsat 7 was suitable for Part A and aerial photography for Part B, the reverse was not the case. Landsat 7 was not suitable for Part B, as the Landsat TM series was only launched in the 1980s and therefore did not provide the archival im-agery required. The coarser resolution was also unsuitable for detecting small scale changes. Likewise, aerial photographs were not suitable for Part A due to exces-sive cost, increased data pre-processing, and limited spectral resolution for detect-ing A. longifolia over different vegetation types.
This case study confirms the impor-tance of matching imagery to study con-ditions, however also identifies that in practice, cost, time and availability of data are necessary considerations.
Implications and future applicationsRemote sensing in environmental weed mappingProvided that spectral discrimination is possible, the primary determinant of suc-cessful weed mapping using remote sens-ing is appropriate matching of method to species and study environment. Two
Table 4. Comparison of study conditions, method requirements and choice of imagery used for mapping and monitoring Acacia longifolia var. sophorae in south-west Victoria
Part A: Regional Mapping Part B: Local monitoring
Stud
y co
nditi
ons Use of data Assessment of weed extent and distribution,
environmental correlates, predictive modelling
Change detection, rate of spread, pattern of spread, proximal causes in invasion process
Extent 360 000 ha 1281 haVegetation type Various – including woodland, forest,
heathland, grasslandInvaded grassland
Method requirements Low cost/unit area, ability to detect in multiple environments, minimal preprocessing
Archival data (preferably pre-dating invasion in 1960s), detail (detect individuals)
Cho
ice
of im
ager
y
Selected imagery Landsat ETM satellite imagery Conventional aerial photography (colour, black and white)
Imagery resolution 30 m 2 mCost of imagery $950
<$0.01 per ha$255.00 $0.19 per ha (approx.)
Benefits of imagery chosen Large spatial coverage, cost effective, minimal pre-processing
High spatial resolution, can detect individual plants, long historical archive
Limitations of imagery chosen Coarse spatial resolution, cannot measure density or individual plants, small infestations not detected
Low spectral resolution, expensive over large areas, considerable pre-processing, limited to non-treed environments
Resu
lts Success 81% (User’s 82%, Producer’s 71%) Not quantitatively assessed yet, however preliminary results are good. Some issues with edge pixels and image alignment
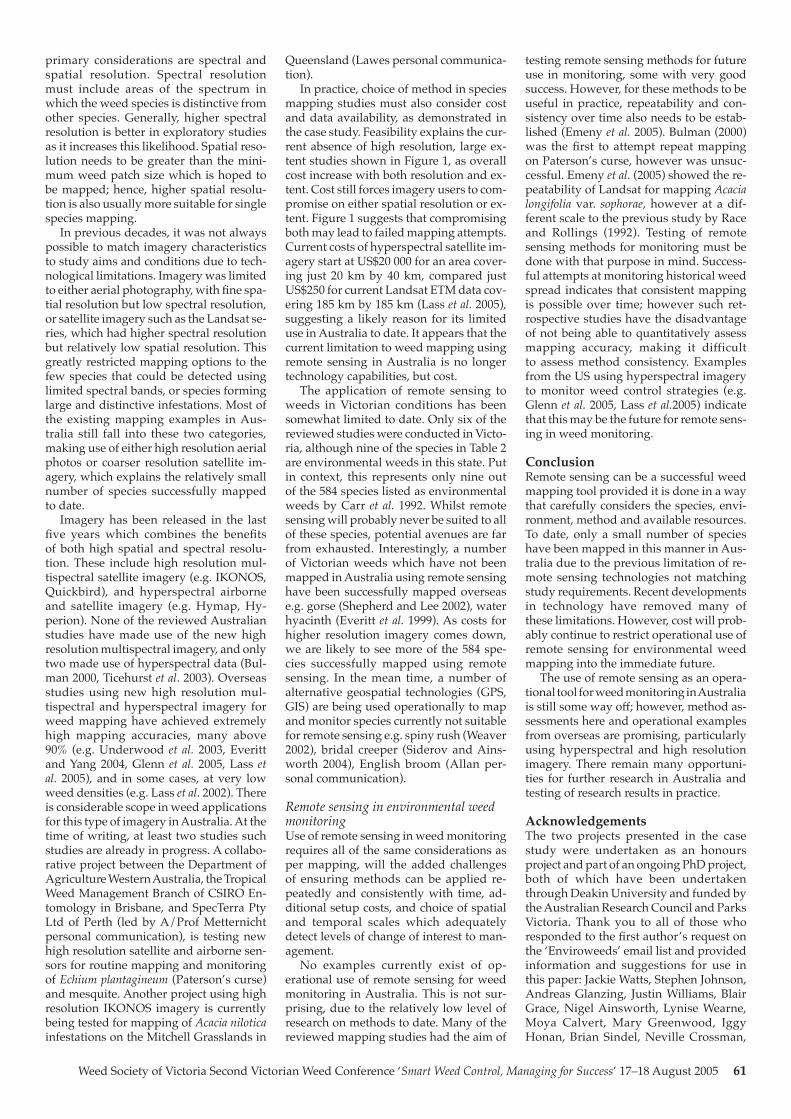
Weed Society of Victoria Second Victorian Weed Conference ‘Smart Weed Control, Managing for Success’ 17–18 August 2005 61
primary considerations are spectral and spatial resolution. Spectral resolution must include areas of the spectrum in which the weed species is distinctive from other species. Generally, higher spectral resolution is better in exploratory studies as it increases this likelihood. Spatial reso-lution needs to be greater than the mini-mum weed patch size which is hoped to be mapped; hence, higher spatial resolu-tion is also usually more suitable for single species mapping.
In previous decades, it was not always possible to match imagery characteristics to study aims and conditions due to tech-nological limitations. Imagery was limited to either aerial photography, with fine spa-tial resolution but low spectral resolution, or satellite imagery such as the Landsat se-ries, which had higher spectral resolution but relatively low spatial resolution. This greatly restricted mapping options to the few species that could be detected using limited spectral bands, or species forming large and distinctive infestations. Most of the existing mapping examples in Aus-tralia still fall into these two categories, making use of either high resolution aerial photos or coarser resolution satellite im-agery, which explains the relatively small number of species successfully mapped to date.
Imagery has been released in the last five years which combines the benefits of both high spatial and spectral resolu-tion. These include high resolution mul-tispectral satellite imagery (e.g. IKONOS, Quickbird), and hyperspectral airborne and satellite imagery (e.g. Hymap, Hy-perion). None of the reviewed Australian studies have made use of the new high resolution multispectral imagery, and only two made use of hyperspectral data (Bul-man 2000, Ticehurst et al. 2003). Overseas studies using new high resolution mul-tispectral and hyperspectral imagery for weed mapping have achieved extremely high mapping accuracies, many above 90% (e.g. Underwood et al. 2003, Everitt and Yang 2004, Glenn et al. 2005, Lass et al. 2005), and in some cases, at very low weed densities (e.g. Lass et al. 2002). There is considerable scope in weed applications for this type of imagery in Australia. At the time of writing, at least two studies such studies are already in progress. A collabo-rative project between the Department of Agriculture Western Australia, the Tropical Weed Management Branch of CSIRO En-tomology in Brisbane, and SpecTerra Pty Ltd of Perth (led by A/Prof Metternicht personal communication), is testing new high resolution satellite and airborne sen-sors for routine mapping and monitoring of Echium plantagineum (Paterson’s curse) and mesquite. Another project using high resolution IKONOS imagery is currently being tested for mapping of Acacia nilotica infestations on the Mitchell Grasslands in
Queensland (Lawes personal communica-tion).
In practice, choice of method in species mapping studies must also consider cost and data availability, as demonstrated in the case study. Feasibility explains the cur-rent absence of high resolution, large ex-tent studies shown in Figure 1, as overall cost increase with both resolution and ex-tent. Cost still forces imagery users to com-promise on either spatial resolution or ex-tent. Figure 1 suggests that compromising both may lead to failed mapping attempts. Current costs of hyperspectral satellite im-agery start at US$20 000 for an area cover-ing just 20 km by 40 km, compared just US$250 for current Landsat ETM data cov-ering 185 km by 185 km (Lass et al. 2005), suggesting a likely reason for its limited use in Australia to date. It appears that the current limitation to weed mapping using remote sensing in Australia is no longer technology capabilities, but cost.
The application of remote sensing to weeds in Victorian conditions has been somewhat limited to date. Only six of the reviewed studies were conducted in Victo-ria, although nine of the species in Table 2 are environmental weeds in this state. Put in context, this represents only nine out of the 584 species listed as environmental weeds by Carr et al. 1992. Whilst remote sensing will probably never be suited to all of these species, potential avenues are far from exhausted. Interestingly, a number of Victorian weeds which have not been mapped in Australia using remote sensing have been successfully mapped overseas e.g. gorse (Shepherd and Lee 2002), water hyacinth (Everitt et al. 1999). As costs for higher resolution imagery comes down, we are likely to see more of the 584 spe-cies successfully mapped using remote sensing. In the mean time, a number of alternative geospatial technologies (GPS, GIS) are being used operationally to map and monitor species currently not suitable for remote sensing e.g. spiny rush (Weaver 2002), bridal creeper (Siderov and Ains-worth 2004), English broom (Allan per-sonal communication).
Remote sensing in environmental weed monitoringUse of remote sensing in weed monitoring requires all of the same considerations as per mapping, will the added challenges of ensuring methods can be applied re-peatedly and consistently with time, ad-ditional setup costs, and choice of spatial and temporal scales which adequately detect levels of change of interest to man-agement.
No examples currently exist of op-erational use of remote sensing for weed monitoring in Australia. This is not sur-prising, due to the relatively low level of research on methods to date. Many of the reviewed mapping studies had the aim of
testing remote sensing methods for future use in monitoring, some with very good success. However, for these methods to be useful in practice, repeatability and con-sistency over time also needs to be estab-lished (Emeny et al. 2005). Bulman (2000) was the first to attempt repeat mapping on Paterson’s curse, however was unsuc-cessful. Emeny et al. (2005) showed the re-peatability of Landsat for mapping Acacia longifolia var. sophorae, however at a dif-ferent scale to the previous study by Race and Rollings (1992). Testing of remote sensing methods for monitoring must be done with that purpose in mind. Success-ful attempts at monitoring historical weed spread indicates that consistent mapping is possible over time; however such ret-rospective studies have the disadvantage of not being able to quantitatively assess mapping accuracy, making it difficult to assess method consistency. Examples from the US using hyperspectral imagery to monitor weed control strategies (e.g. Glenn et al. 2005, Lass et al.2005) indicate that this may be the future for remote sens-ing in weed monitoring.
ConclusionRemote sensing can be a successful weed mapping tool provided it is done in a way that carefully considers the species, envi-ronment, method and available resources. To date, only a small number of species have been mapped in this manner in Aus-tralia due to the previous limitation of re-mote sensing technologies not matching study requirements. Recent developments in technology have removed many of these limitations. However, cost will prob-ably continue to restrict operational use of remote sensing for environmental weed mapping into the immediate future.
The use of remote sensing as an opera-tional tool for weed monitoring in Australia is still some way off; however, method as-sessments here and operational examples from overseas are promising, particularly using hyperspectral and high resolution imagery. There remain many opportuni-ties for further research in Australia and testing of research results in practice.
Acknowledgements The two projects presented in the case study were undertaken as an honours project and part of an ongoing PhD project, both of which have been undertaken through Deakin University and funded by the Australian Research Council and Parks Victoria. Thank you to all of those who responded to the first author’s request on the ‘Enviroweeds’ email list and provided information and suggestions for use in this paper: Jackie Watts, Stephen Johnson, Andreas Glanzing, Justin Williams, Blair Grace, Nigel Ainsworth, Lynise Wearne, Moya Calvert, Mary Greenwood, Iggy Honan, Brian Sindel, Neville Crossman,
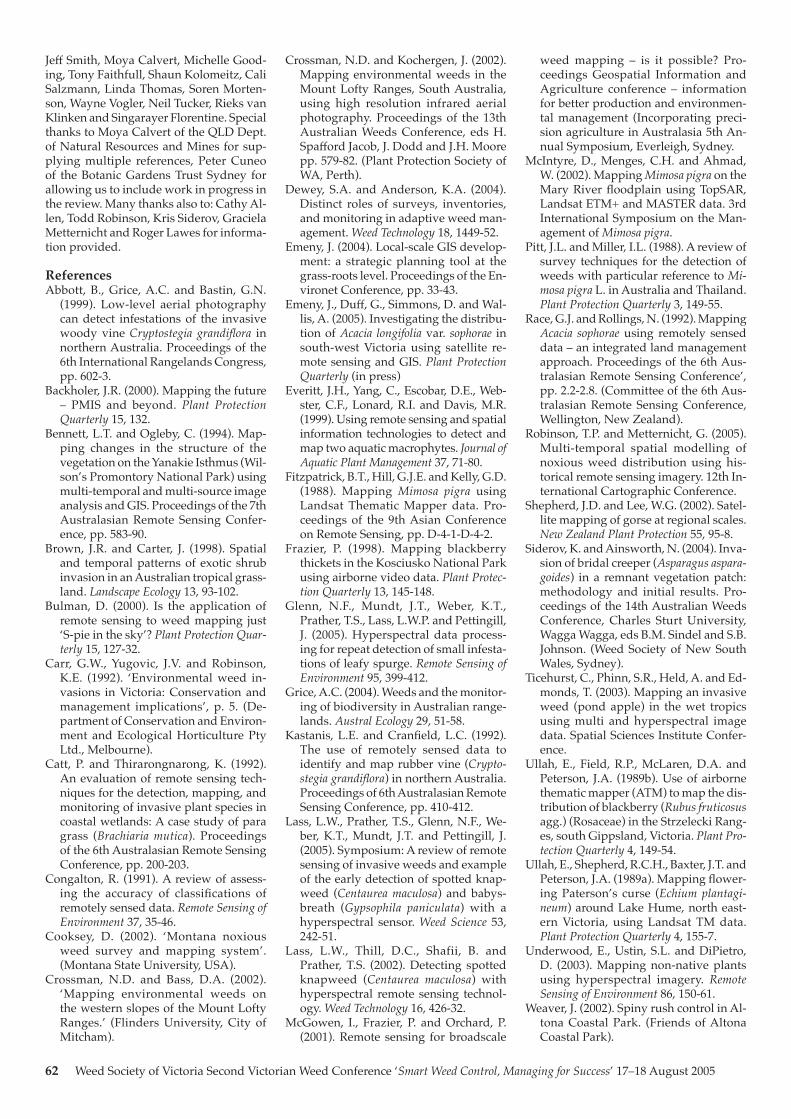
62 Weed Society of Victoria Second Victorian Weed Conference ‘Smart Weed Control, Managing for Success’ 17–18 August 2005
Jeff Smith, Moya Calvert, Michelle Good-ing, Tony Faithfull, Shaun Kolomeitz, Cali Salzmann, Linda Thomas, Soren Morten-son, Wayne Vogler, Neil Tucker, Rieks van Klinken and Singarayer Florentine. Special thanks to Moya Calvert of the QLD Dept. of Natural Resources and Mines for sup-plying multiple references, Peter Cuneo of the Botanic Gardens Trust Sydney for allowing us to include work in progress in the review. Many thanks also to: Cathy Al-len, Todd Robinson, Kris Siderov, Graciela Metternicht and Roger Lawes for informa-tion provided.
ReferencesAbbott, B., Grice, A.C. and Bastin, G.N.
(1999). Low-level aerial photography can detect infestations of the invasive woody vine Cryptostegia grandiflora in northern Australia. Proceedings of the 6th International Rangelands Congress, pp. 602-3.
Backholer, J.R. (2000). Mapping the future – PMIS and beyond. Plant Protection Quarterly 15, 132.
Bennett, L.T. and Ogleby, C. (1994). Map-ping changes in the structure of the vegetation on the Yanakie Isthmus (Wil-son’s Promontory National Park) using multi-temporal and multi-source image analysis and GIS. Proceedings of the 7th Australasian Remote Sensing Confer-ence, pp. 583-90.
Brown, J.R. and Carter, J. (1998). Spatial and temporal patterns of exotic shrub invasion in an Australian tropical grass-land. Landscape Ecology 13, 93-102.
Bulman, D. (2000). Is the application of remote sensing to weed mapping just ‘S-pie in the sky’? Plant Protection Quar-terly 15, 127-32.
Carr, G.W., Yugovic, J.V. and Robinson, K.E. (1992). ‘Environmental weed in-vasions in Victoria: Conservation and management implications’, p. 5. (De-partment of Conservation and Environ-ment and Ecological Horticulture Pty Ltd., Melbourne).
Catt, P. and Thirarongnarong, K. (1992). An evaluation of remote sensing tech-niques for the detection, mapping, and monitoring of invasive plant species in coastal wetlands: A case study of para grass (Brachiaria mutica). Proceedings of the 6th Australasian Remote Sensing Conference, pp. 200-203.
Congalton, R. (1991). A review of assess-ing the accuracy of classifications of remotely sensed data. Remote Sensing of Environment 37, 35-46.
Cooksey, D. (2002). ‘Montana noxious weed survey and mapping system’. (Montana State University, USA).
Crossman, N.D. and Bass, D.A. (2002). ‘Mapping environmental weeds on the western slopes of the Mount Lofty Ranges.’ (Flinders University, City of Mitcham).
Crossman, N.D. and Kochergen, J. (2002). Mapping environmental weeds in the Mount Lofty Ranges, South Australia, using high resolution infrared aerial photography. Proceedings of the 13th Australian Weeds Conference, eds H. Spafford Jacob, J. Dodd and J.H. Moore pp. 579-82. (Plant Protection Society of WA, Perth).
Dewey, S.A. and Anderson, K.A. (2004). Distinct roles of surveys, inventories, and monitoring in adaptive weed man-agement. Weed Technology 18, 1449-52.
Emeny, J. (2004). Local-scale GIS develop-ment: a strategic planning tool at the grass-roots level. Proceedings of the En-vironet Conference, pp. 33-43.
Emeny, J., Duff, G., Simmons, D. and Wal-lis, A. (2005). Investigating the distribu-tion of Acacia longifolia var. sophorae in south-west Victoria using satellite re-mote sensing and GIS. Plant Protection Quarterly (in press)
Everitt, J.H., Yang, C., Escobar, D.E., Web-ster, C.F., Lonard, R.I. and Davis, M.R. (1999). Using remote sensing and spatial information technologies to detect and map two aquatic macrophytes. Journal of Aquatic Plant Management 37, 71-80.
Fitzpatrick, B.T., Hill, G.J.E. and Kelly, G.D. (1988). Mapping Mimosa pigra using Landsat Thematic Mapper data. Pro-ceedings of the 9th Asian Conference on Remote Sensing, pp. D-4-1-D-4-2.
Frazier, P. (1998). Mapping blackberry thickets in the Kosciusko National Park using airborne video data. Plant Protec-tion Quarterly 13, 145-148.
Glenn, N.F., Mundt, J.T., Weber, K.T., Prather, T.S., Lass, L.W.P. and Pettingill, J. (2005). Hyperspectral data process-ing for repeat detection of small infesta-tions of leafy spurge. Remote Sensing of Environment 95, 399-412.
Grice, A.C. (2004). Weeds and the monitor-ing of biodiversity in Australian range-lands. Austral Ecology 29, 51-58.
Kastanis, L.E. and Cranfield, L.C. (1992). The use of remotely sensed data to identify and map rubber vine (Crypto-stegia grandiflora) in northern Australia. Proceedings of 6th Australasian Remote Sensing Conference, pp. 410-412.
Lass, L.W., Prather, T.S., Glenn, N.F., We-ber, K.T., Mundt, J.T. and Pettingill, J. (2005). Symposium: A review of remote sensing of invasive weeds and example of the early detection of spotted knap-weed (Centaurea maculosa) and babys-breath (Gypsophila paniculata) with a hyperspectral sensor. Weed Science 53, 242-51.
Lass, L.W., Thill, D.C., Shafii, B. and Prather, T.S. (2002). Detecting spotted knapweed (Centaurea maculosa) with hyperspectral remote sensing technol-ogy. Weed Technology 16, 426-32.
McGowen, I., Frazier, P. and Orchard, P. (2001). Remote sensing for broadscale
weed mapping – is it possible? Pro-ceedings Geospatial Information and Agriculture conference – information for better production and environmen-tal management (Incorporating preci-sion agriculture in Australasia 5th An-nual Symposium, Everleigh, Sydney.
McIntyre, D., Menges, C.H. and Ahmad, W. (2002). Mapping Mimosa pigra on the Mary River floodplain using TopSAR, Landsat ETM+ and MASTER data. 3rd International Symposium on the Man-agement of Mimosa pigra.
Pitt, J.L. and Miller, I.L. (1988). A review of survey techniques for the detection of weeds with particular reference to Mi-mosa pigra L. in Australia and Thailand. Plant Protection Quarterly 3, 149-55.
Race, G.J. and Rollings, N. (1992). Mapping Acacia sophorae using remotely sensed data – an integrated land management approach. Proceedings of the 6th Aus-tralasian Remote Sensing Conference’, pp. 2.2-2.8. (Committee of the 6th Aus-tralasian Remote Sensing Conference, Wellington, New Zealand).
Robinson, T.P. and Metternicht, G. (2005). Multi-temporal spatial modelling of noxious weed distribution using his-torical remote sensing imagery. 12th In-ternational Cartographic Conference.
Shepherd, J.D. and Lee, W.G. (2002). Satel-lite mapping of gorse at regional scales. New Zealand Plant Protection 55, 95-8.
Siderov, K. and Ainsworth, N. (2004). Inva-sion of bridal creeper (Asparagus aspara-goides) in a remnant vegetation patch: methodology and initial results. Pro-ceedings of the 14th Australian Weeds Conference, Charles Sturt University, Wagga Wagga, eds B.M. Sindel and S.B. Johnson. (Weed Society of New South Wales, Sydney).
Ticehurst, C., Phinn, S.R., Held, A. and Ed-monds, T. (2003). Mapping an invasive weed (pond apple) in the wet tropics using multi and hyperspectral image data. Spatial Sciences Institute Confer-ence.
Ullah, E., Field, R.P., McLaren, D.A. and Peterson, J.A. (1989b). Use of airborne thematic mapper (ATM) to map the dis-tribution of blackberry (Rubus fruticosus agg.) (Rosaceae) in the Strzelecki Rang-es, south Gippsland, Victoria. Plant Pro-tection Quarterly 4, 149-54.
Ullah, E., Shepherd, R.C.H., Baxter, J.T. and Peterson, J.A. (1989a). Mapping flower-ing Paterson’s curse (Echium plantagi-neum) around Lake Hume, north east-ern Victoria, using Landsat TM data. Plant Protection Quarterly 4, 155-7.
Underwood, E., Ustin, S.L. and DiPietro, D. (2003). Mapping non-native plants using hyperspectral imagery. Remote Sensing of Environment 86, 150-61.
Weaver, J. (2002). Spiny rush control in Al-tona Coastal Park. (Friends of Altona Coastal Park).
Weed Society of Victoria Second Victorian Weed Conference ‘Smart Weed Control, Managing for Success’ 17–18 August 2005 63
Summary Parks Victoria is incorporat-ing robust scientific monitoring into weed and pest management programs through the use of standard monitoring and map-ping protocols. These protocols are being trialled in a number of parks to quantify changes in pest and weed abundance (through monitoring) and distribution (through mapping). The weed monitoring protocols are also being used in an adap-tive experimental management (AEM) program for English broom (Cytisus sco-parius) in the Alpine National Park. Eng-lish broom is managed intensively and on-going monitoring has been implemented to improve understanding of the efficien-cy, effectiveness and environmental out-comes of various best-practice herbicide applications. Preliminary results indicate the benefit of controlling English broom in the initial stages with substantial re-ductions in broom abundance after initial treatment with selective and non-selective herbicides in April 2004. However the re-moval of English broom using herbicides may not necessarily result in the return of the native flora. Ongoing results from this experiment will guide the future use of se-lected herbicides to control English broom populations and restore vegetation com-munities after wildfires. As this program is ‘adaptive’ in its nature, there is poten-tial to incorporate use of fire, physical or mechanical removal, and establishment of biological control into the experiment.
IntroductionRole of monitoring in weed managementNatural resource monitoring (i.e. deter-mining the status and trends in the condi-tion of selected park resources) is a major component of park stewardship. Without monitoring, how do public land manag-ers know if their management actions are making a difference and if management objectives are being met? Parks Victoria has developed a series of protocols for monitoring weeds and pests using sci-entifically robust techniques. Monitoring enables Parks Victoria to evaluate per-formance, identify emerging threats and increase understanding of the ecosystems being managed. Establishing monitoring standards ensures that park management decisions are made with the best available information.
Parks Victoria’s weed protocol includes both mapping and monitoring techniques. Mapping weeds provides information on the extent of weed populations, which can be used to direct management programs. While weed mapping is not aimed at de-tecting changes in the abundance of popu-lations over time, it can help detect chang-es in distribution over time, if undertaken at an appropriate scale. By monitoring changes in weed abundance at the site level using the techniques recommended in the monitoring protocols, the effective-ness of management programs can be de-termined. These methods, which are cur-rently being trialled in a number of parks, can also be adapted to record abundance and composition of native species.
Park managers generally have a very good knowledge and understanding of best-practice weed management tech-niques. However, for many weed con-trol programs there is uncertainty about the effectiveness and cost-efficiency of various control techniques: eg for vari-ous best-practice treatments, how do the costs compare, what level of reduction in weed abundance should we expect, and what grows on a site once the weed has been removed? Parks Victoria is establish-ing adaptive experimental management (AEM) programs to address such ques-tions.
Case Study – English broom control and monitoring in the Alpine National Park, VictoriaIntroductionEnglish broom is a highly invasive woody weed which forms dense thickets and can out-compete native species (Hosking et al. 1996, DNRE 1998). The dense canopy and continuous input of litter as a result of the establishment of broom are thought to be largely responsible for the loss of native species richness (Waterhouse 1988, Foga-rty and Facelli 1999, Wearne and Morgan 2004). English broom can also fix nitrogen, which may result in substantial changes to the surrounding ecosystem (Fogarty and Facelli 1999). Seed density in the soil beneath mature broom infestations can be in excess of 65 000 seeds m-2 and seed can remain viable (if stored dry) for up to 80 years (DNRE 1998). Control programs must aim to deplete the soil seed bank, so
prevention of flowering and seed set are of highest priority.
The integrated English broom control program in the Alpine National Park uses chemical control, biological control and physical removal and involves work-ing with other agencies and landholders. Chemical control programs have been in place in the Alpine National Park for ap-proximately fifteen years and are the pri-mary management tool. Physical removal can be used in sensitive sites and where populations are small, while biological control will be important for long-term management. Since 1996, three biological control insects (broom twig-mining moth Leucoptera spartifoliella, broom bud psyllid Arytainilla spartiophila, broom seed-feed-ing beetle Bruchidius villosus) have been re-leased in the park. However, all sites were destroyed by wildfires in early 2003. New releases are underway and additional bio-logical control agents are being tested for release.
The current management strategy aims to contain English broom within desig-nated areas to prevent further spread, and progressive control programs are in place in sites of high biodiversity value and in catchment headwaters. The only feasible option for immediate management of dense broom infestations is the use of her-bicides with high volume spraying. When used in combination with fire, which pro-motes mass germination of English Broom seeds, this can result in effective control, but few studies have assessed what grows back after such intensive weed control. Herbicide application usually occurs dur-ing late spring/early summer when broom is actively growing and flowering. Parks Victoria commonly uses two herbicides in the Alpine National Park to control broom: a woody-weed specific herbicide (300 g L-1 triclopyr with 100 g L-1 piclo-ram), and a non-selective herbicide (360 g L-1 glyphosate) considered safer to use near waterways. However, the environ-mental effects of both these herbicides are poorly understood. This has prompted the establishment of an adaptive experimental management (AEM) approach to manag-ing English broom with herbicides after wildfires (Allan et al. 2004). The project aims to quantify the cost-efficiency of dif-ferent herbicide treatments, the effective-ness of control under different scenarios and the environmental outcomes of these treatments. This paper outlines some pre-liminary findings of the project.
Materials and methodsAEM experimental designThree replicates of seven one-hectare plots were established and permanently marked in the Omeo Valley, Alpine National Park, in April 2004 (Table 1). Sites with water-ways were allocated to non-treatment plots or spraying with the non-selective
The role of monitoring in weed management: a case study from the Victorian Alps
Cathy AllanA, Kelly RaymondB and Lynise WearneB
A Parks Victoria, PO Box 206, Omeo, Victoria 3898B Parks Victoria, Level 10, 535 Bourke Street, Melbourne, Victoria 3000
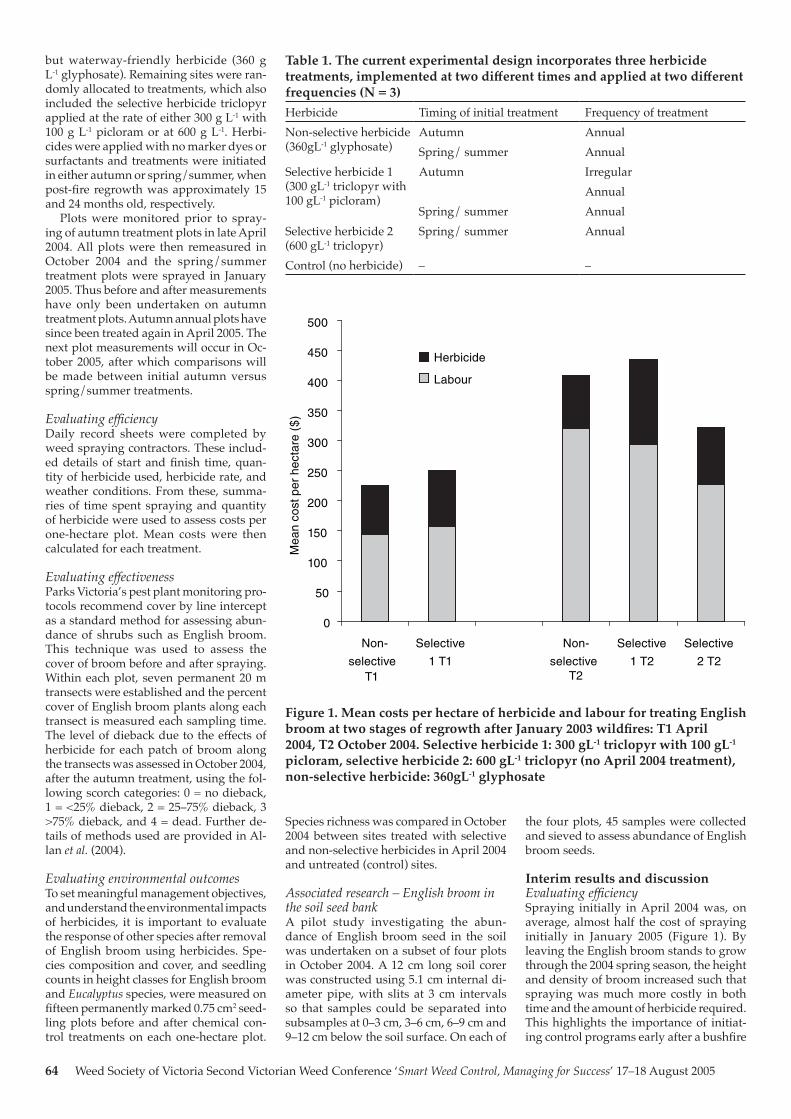
64 Weed Society of Victoria Second Victorian Weed Conference ‘Smart Weed Control, Managing for Success’ 17–18 August 2005
Table 1. The current experimental design incorporates three herbicide treatments, implemented at two different times and applied at two different frequencies (N = 3)Herbicide Timing of initial treatment Frequency of treatmentNon-selective herbicide (360gL-1 glyphosate)
Autumn AnnualSpring/ summer Annual
Selective herbicide 1 (300 gL-1 triclopyr with 100 gL-1 picloram)
Autumn IrregularAnnual
Spring/ summer AnnualSelective herbicide 2 (600 gL-1 triclopyr)
Spring/ summer Annual
Control (no herbicide) – –
Figure 1. Mean costs per hectare of herbicide and labour for treating English broom at two stages of regrowth after January 2003 wildfires: T1 April 2004, T2 October 2004. Selective herbicide 1: 300 gL-1 triclopyr with 100 gL-1 picloram, selective herbicide 2: 600 gL-1 triclopyr (no April 2004 treatment), non-selective herbicide: 360gL-1 glyphosate
0
50
100
150
200
250
300
350
400
450
500
Non-
selectiveT1
Selective
1 T1
Non-
selectiveT2
Selective
1 T2
Selective
2 T2
Mea
n co
st p
er h
ecta
re (
$)
Herbicide
Labour
Species richness was compared in October 2004 between sites treated with selective and non-selective herbicides in April 2004 and untreated (control) sites.
Associated research – English broom in the soil seed bankA pilot study investigating the abun-dance of English broom seed in the soil was undertaken on a subset of four plots in October 2004. A 12 cm long soil corer was constructed using 5.1 cm internal di-ameter pipe, with slits at 3 cm intervals so that samples could be separated into subsamples at 0–3 cm, 3–6 cm, 6–9 cm and 9–12 cm below the soil surface. On each of
the four plots, 45 samples were collected and sieved to assess abundance of English broom seeds.
Interim results and discussionEvaluating efficiencySpraying initially in April 2004 was, on average, almost half the cost of spraying initially in January 2005 (Figure 1). By leaving the English broom stands to grow through the 2004 spring season, the height and density of broom increased such that spraying was much more costly in both time and the amount of herbicide required. This highlights the importance of initiat-ing control programs early after a bushfire
but waterway-friendly herbicide (360 g L-1 glyphosate). Remaining sites were ran-domly allocated to treatments, which also included the selective herbicide triclopyr applied at the rate of either 300 g L-1 with 100 g L-1 picloram or at 600 g L-1. Herbi-cides were applied with no marker dyes or surfactants and treatments were initiated in either autumn or spring/summer, when post-fire regrowth was approximately 15 and 24 months old, respectively.
Plots were monitored prior to spray-ing of autumn treatment plots in late April 2004. All plots were then remeasured in October 2004 and the spring/summer treatment plots were sprayed in January 2005. Thus before and after measurements have only been undertaken on autumn treatment plots. Autumn annual plots have since been treated again in April 2005. The next plot measurements will occur in Oc-tober 2005, after which comparisons will be made between initial autumn versus spring/summer treatments.
Evaluating efficiencyDaily record sheets were completed by weed spraying contractors. These includ-ed details of start and finish time, quan-tity of herbicide used, herbicide rate, and weather conditions. From these, summa-ries of time spent spraying and quantity of herbicide were used to assess costs per one-hectare plot. Mean costs were then calculated for each treatment.
Evaluating effectiveness Parks Victoria’s pest plant monitoring pro-tocols recommend cover by line intercept as a standard method for assessing abun-dance of shrubs such as English broom. This technique was used to assess the cover of broom before and after spraying. Within each plot, seven permanent 20 m transects were established and the percent cover of English broom plants along each transect is measured each sampling time. The level of dieback due to the effects of herbicide for each patch of broom along the transects was assessed in October 2004, after the autumn treatment, using the fol-lowing scorch categories: 0 = no dieback, 1 = <25% dieback, 2 = 25–75% dieback, 3 >75% dieback, and 4 = dead. Further de-tails of methods used are provided in Al-lan et al. (2004).
Evaluating environmental outcomes To set meaningful management objectives, and understand the environmental impacts of herbicides, it is important to evaluate the response of other species after removal of English broom using herbicides. Spe-cies composition and cover, and seedling counts in height classes for English broom and Eucalyptus species, were measured on fifteen permanently marked 0.75 cm2 seed-ling plots before and after chemical con-trol treatments on each one-hectare plot.
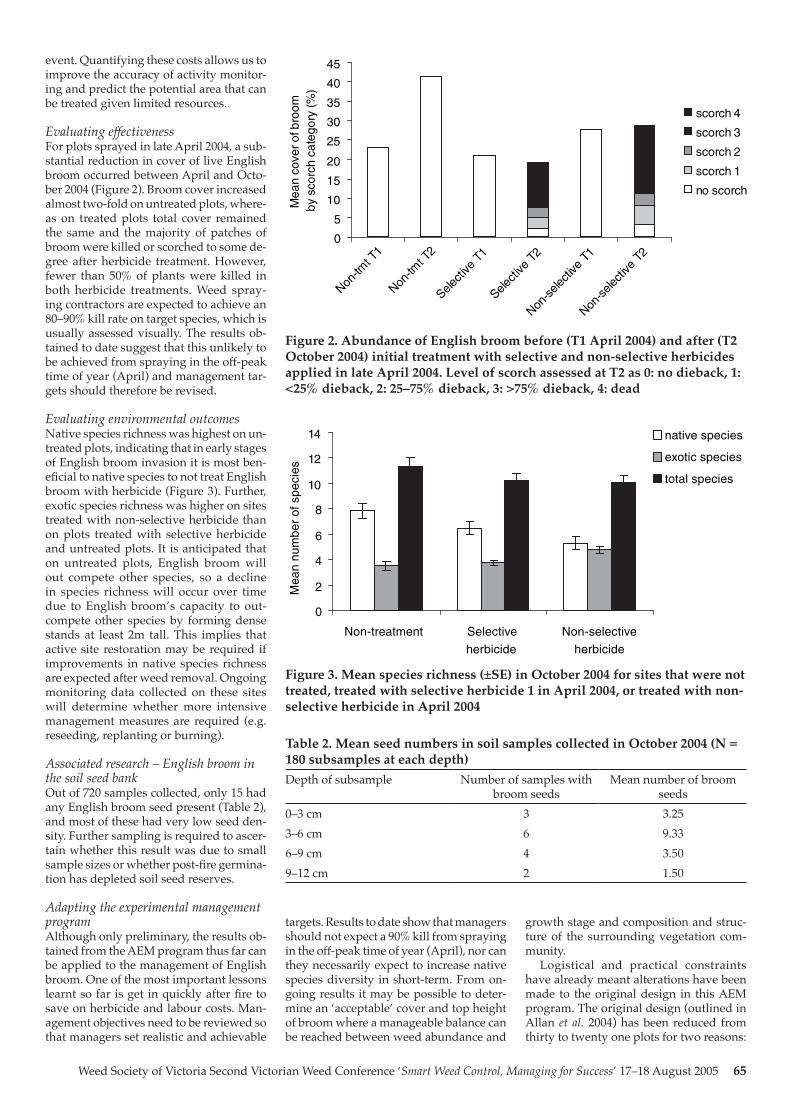
Weed Society of Victoria Second Victorian Weed Conference ‘Smart Weed Control, Managing for Success’ 17–18 August 2005 65
event. Quantifying these costs allows us to improve the accuracy of activity monitor-ing and predict the potential area that can be treated given limited resources.
Evaluating effectiveness For plots sprayed in late April 2004, a sub-stantial reduction in cover of live English broom occurred between April and Octo-ber 2004 (Figure 2). Broom cover increased almost two-fold on untreated plots, where-as on treated plots total cover remained the same and the majority of patches of broom were killed or scorched to some de-gree after herbicide treatment. However, fewer than 50% of plants were killed in both herbicide treatments. Weed spray-ing contractors are expected to achieve an 80–90% kill rate on target species, which is usually assessed visually. The results ob-tained to date suggest that this unlikely to be achieved from spraying in the off-peak time of year (April) and management tar-gets should therefore be revised.
Evaluating environmental outcomes Native species richness was highest on un-treated plots, indicating that in early stages of English broom invasion it is most ben-eficial to native species to not treat English broom with herbicide (Figure 3). Further, exotic species richness was higher on sites treated with non-selective herbicide than on plots treated with selective herbicide and untreated plots. It is anticipated that on untreated plots, English broom will out compete other species, so a decline in species richness will occur over time due to English broom’s capacity to out-compete other species by forming dense stands at least 2m tall. This implies that active site restoration may be required if improvements in native species richness are expected after weed removal. Ongoing monitoring data collected on these sites will determine whether more intensive management measures are required (e.g. reseeding, replanting or burning).
Associated research – English broom in the soil seed bankOut of 720 samples collected, only 15 had any English broom seed present (Table 2), and most of these had very low seed den-sity. Further sampling is required to ascer-tain whether this result was due to small sample sizes or whether post-fire germina-tion has depleted soil seed reserves.
Adapting the experimental management program Although only preliminary, the results ob-tained from the AEM program thus far can be applied to the management of English broom. One of the most important lessons learnt so far is get in quickly after fire to save on herbicide and labour costs. Man-agement objectives need to be reviewed so that managers set realistic and achievable
Figure 2. Abundance of English broom before (T1 April 2004) and after (T2 October 2004) initial treatment with selective and non-selective herbicides applied in late April 2004. Level of scorch assessed at T2 as 0: no dieback, 1: <25% dieback, 2: 25–75% dieback, 3: >75% dieback, 4: dead
Figure 3. Mean species richness (±SE) in October 2004 for sites that were not treated, treated with selective herbicide 1 in April 2004, or treated with non-selective herbicide in April 2004
Table 2. Mean seed numbers in soil samples collected in October 2004 (N = 180 subsamples at each depth)Depth of subsample Number of samples with
broom seedsMean number of broom
seeds0–3 cm 3 3.253–6 cm 6 9.336–9 cm 4 3.509–12 cm 2 1.50
0
5
10
15
20
25
30
35
40
45
Non-tm
t T1
Non-tm
t T2
Selecti
ve T
1
Selecti
ve T
2
Non-se
lectiv
e T1
Non-se
lectiv
e T2
Mea
n co
ver o
f bro
om b
y sc
orch
cat
egor
y (%
)
scorch 4
scorch 3
scorch 2
scorch 1
no scorch
0
2
4
6
8
10
12
14
Non-treatment Selective
herbicide
Non-selective
herbicide
Mea
n nu
mbe
r of
spe
cies
native species
exotic species
total species
targets. Results to date show that managers should not expect a 90% kill from spraying in the off-peak time of year (April), nor can they necessarily expect to increase native species diversity in short-term. From on-going results it may be possible to deter-mine an ‘acceptable’ cover and top height of broom where a manageable balance can be reached between weed abundance and
growth stage and composition and struc-ture of the surrounding vegetation com-munity.
Logistical and practical constraints have already meant alterations have been made to the original design in this AEM program. The original design (outlined in Allan et al. 2004) has been reduced from thirty to twenty one plots for two reasons:

66 Weed Society of Victoria Second Victorian Weed Conference ‘Smart Weed Control, Managing for Success’ 17–18 August 2005
we underestimated the resources required to establish and carefully monitor all vari-ables; and preliminary observations in-dicated that annual follow-up would be required on all plots due to the extremely high density of broom.
A number of new questions are arising in relation to best-practice English broom control after bushfires. In areas where her-bicides have been effective, we are now faced with dense stands of dead matter which could potentially be a fire hazard. In sites where herbicide control has not yet occurred, English broom is so tall that spraying with herbicide is not practical or affordable, and other options such as slash-ing and burning need to be considered. A workshop is proposed to be held in early autumn 2006 to discuss future options to test control techniques such as burning, slashing, re-seeding, and interactions be-tween chemical control and establishing biological control agents.
Further research will be carried out to investigate the levels of depletion in the soil seed bank on treated sites versus untreated sites, where prolific seeding is expected to occur in summer 2005–06. Presence and abundance of other species’ seeds may also be assessed through glass-house trials. Opportunities exist to investi-gate soil nitrogen levels and soil moisture, both of which would have local effects on regeneration of other species after removal of English broom.
This study also highlights the impor-tance of an integrated approach to manage-ment. It is widely known that a combina-tion of herbicide and fire treatment results in effective removal of English broom, and that physical removal results in less dis-turbance on vegetation communities than use of herbicide. This experimental pro-gram will allow various combinations of integrated management approaches to be tested which will add to managers’ under-standing of the likely outcomes of removal of this highly invasive woody weed.
AcknowledgementsSupport for this project has been received gratefully from Parks Victoria staff in the Alpine District and National Parks and Conservation Research, and many indi-viduals from DSE, DPI, High Country Landcare Network.
ReferencesAllan, C., Wright, J. and Raymond, K.
(2004). An adaptive experimental man-agement program for English broom Cytisus scoparius in Victoria. Proceed-ings 14th Australian Weeds Confer-ence.
DNRE. (1998). Landcare notes – English broom. Department of Natural Re-sources and Environment (Keith Turn-bull Research Institute, Frankston, Vic-toria).
Fogarty, G. and Facelli, J.M. (1999). Growth and competition of Cytisus scoparius, an invasive shrub, and Australian native shrubs. Plant Ecology 144, 27-35.
Hosking, J.R., Smith, J.M.B. and Sheppard, A.W. (1996). The biology of Australian weeds 28. Cytisus scoparius (L.) Link subsp. scoparius. Plant Protection Quar-terly 11, 102-8.
McArthur, K. (2000). Broom (Cytisus sco-parius) management strategy for the Australian Alps National Parks (Keith Turnbull Research Institute, Frankston, Victoria).
Waterhouse, B.M. (1988). Broom (Cyti-sus scoparius) at Barrington Tops, New South Wales. Australian Geographical Studies 26, 239-48.
Wearne, L.J. and Morgan, J.W. (2004). Community-level changes in subalpine vegetation following invasion by the non-native shrub Cytisus scoparius. Jour-nal of Vegetation Science 15, 595-604.
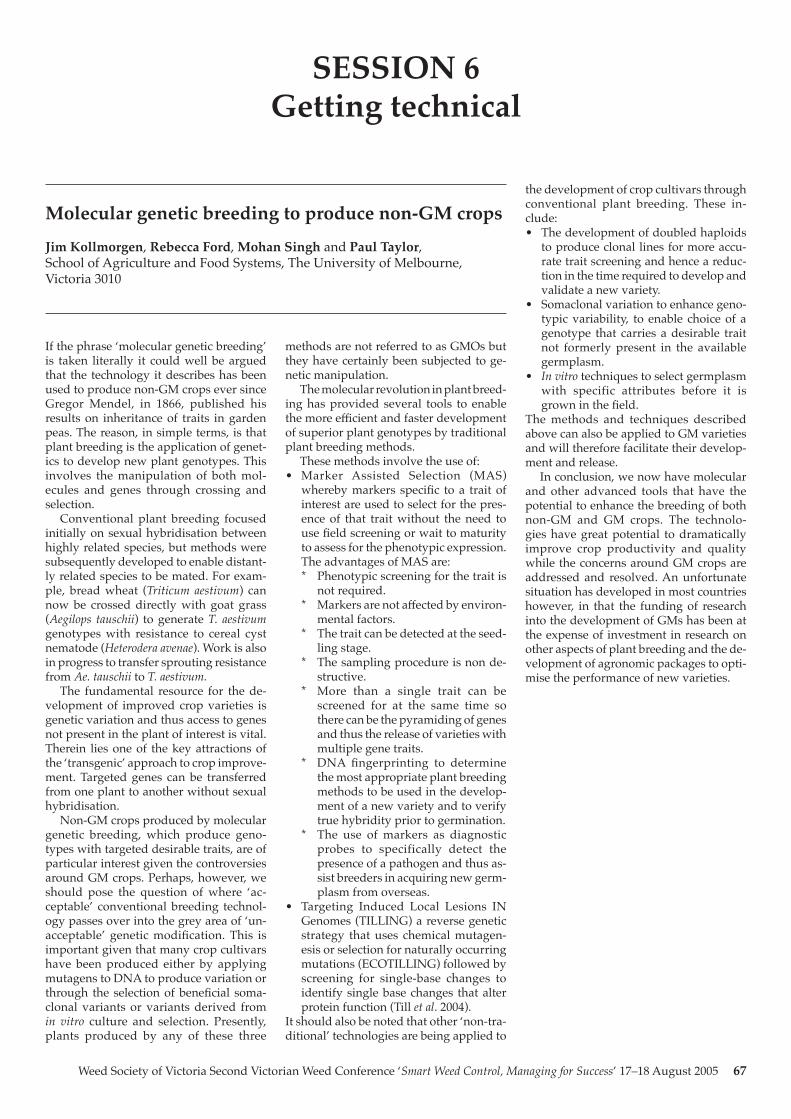
Weed Society of Victoria Second Victorian Weed Conference ‘Smart Weed Control, Managing for Success’ 17–18 August 2005 67
SESSION 6Getting technical
If the phrase ‘molecular genetic breeding’ is taken literally it could well be argued that the technology it describes has been used to produce non-GM crops ever since Gregor Mendel, in 1866, published his results on inheritance of traits in garden peas. The reason, in simple terms, is that plant breeding is the application of genet-ics to develop new plant genotypes. This involves the manipulation of both mol-ecules and genes through crossing and selection.
Conventional plant breeding focused initially on sexual hybridisation between highly related species, but methods were subsequently developed to enable distant-ly related species to be mated. For exam-ple, bread wheat (Triticum aestivum) can now be crossed directly with goat grass (Aegilops tauschii) to generate T. aestivum genotypes with resistance to cereal cyst nematode (Heterodera avenae). Work is also in progress to transfer sprouting resistance from Ae. tauschii to T. aestivum.
The fundamental resource for the de-velopment of improved crop varieties is genetic variation and thus access to genes not present in the plant of interest is vital. Therein lies one of the key attractions of the ‘transgenic’ approach to crop improve-ment. Targeted genes can be transferred from one plant to another without sexual hybridisation.
Non-GM crops produced by molecular genetic breeding, which produce geno-types with targeted desirable traits, are of particular interest given the controversies around GM crops. Perhaps, however, we should pose the question of where ‘ac-ceptable’ conventional breeding technol-ogy passes over into the grey area of ‘un-acceptable’ genetic modification. This is important given that many crop cultivars have been produced either by applying mutagens to DNA to produce variation or through the selection of beneficial soma-clonal variants or variants derived from in vitro culture and selection. Presently, plants produced by any of these three
methods are not referred to as GMOs but they have certainly been subjected to ge-netic manipulation.
The molecular revolution in plant breed-ing has provided several tools to enable the more efficient and faster development of superior plant genotypes by traditional plant breeding methods.
These methods involve the use of:• Marker Assisted Selection (MAS)
whereby markers specific to a trait of interest are used to select for the pres-ence of that trait without the need to use field screening or wait to maturity to assess for the phenotypic expression. The advantages of MAS are:* Phenotypic screening for the trait is
not required.* Markers are not affected by environ-
mental factors. * The trait can be detected at the seed-
ling stage. * The sampling procedure is non de-
structive. * More than a single trait can be
screened for at the same time so there can be the pyramiding of genes and thus the release of varieties with multiple gene traits.
* DNA fingerprinting to determine the most appropriate plant breeding methods to be used in the develop-ment of a new variety and to verify true hybridity prior to germination.
* The use of markers as diagnostic probes to specifically detect the presence of a pathogen and thus as-sist breeders in acquiring new germ-plasm from overseas.
• Targeting Induced Local Lesions IN Genomes (TILLING) a reverse genetic strategy that uses chemical mutagen-esis or selection for naturally occurring mutations (ECOTILLING) followed by screening for single-base changes to identify single base changes that alter protein function (Till et al. 2004).
It should also be noted that other ‘non-tra-ditional’ technologies are being applied to
the development of crop cultivars through conventional plant breeding. These in-clude:• The development of doubled haploids
to produce clonal lines for more accu-rate trait screening and hence a reduc-tion in the time required to develop and validate a new variety.
• Somaclonal variation to enhance geno-typic variability, to enable choice of a genotype that carries a desirable trait not formerly present in the available germplasm.
• In vitro techniques to select germplasm with specific attributes before it is grown in the field.
The methods and techniques described above can also be applied to GM varieties and will therefore facilitate their develop-ment and release.
In conclusion, we now have molecular and other advanced tools that have the potential to enhance the breeding of both non-GM and GM crops. The technolo-gies have great potential to dramatically improve crop productivity and quality while the concerns around GM crops are addressed and resolved. An unfortunate situation has developed in most countries however, in that the funding of research into the development of GMs has been at the expense of investment in research on other aspects of plant breeding and the de-velopment of agronomic packages to opti-mise the performance of new varieties.
Molecular genetic breeding to produce non-GM crops
Jim Kollmorgen, Rebecca Ford, Mohan Singh and Paul Taylor, School of Agriculture and Food Systems, The University of Melbourne, Victoria 3010
68 Weed Society of Victoria Second Victorian Weed Conference ‘Smart Weed Control, Managing for Success’ 17–18 August 2005
BackgroundMedd et al. (2001) used Syngenta registra-tion data collected prior to 1995 to identify correlations between clodinafop (Topik®) efficacy and environmental variables at the time of spraying. They showed that clodinafop efficacy on wild oat was corre-lated with clodinafop dose, adjuvant use, sum of minimum temperatures from sev-en previous days (TMINPRE7), soil mois-ture deficit 10 days prior to spraying (SM-PRE10), maximum temperature on day of spraying (TMAX), spray water volume (VOL) and a TMAX × VOL interaction.
Interestingly, the temperature by spray volume interaction inferred that increasing spray water volume increased herbicide efficacy under adverse conditions. Those analyses also indicated that geographic location in Australia, and wild oat density and growth stage did not affect efficacy. An aim of ongoing work is to validate these findings with analyses of independ-ent data collated from industry and data generated in field trials.
Industry data Additional data were collated from 64 experiments, conducted between 1995 and 2003 by either Novartis, Bayer Crop-Science or Dow AgroSciences. The result-ing data set contained 174 discrete entries of mean clodinafop efficacy. Experiments were conducted on commercial wheat crops naturally infested with wild oats on farms located throughout Australia’s cropping region.
Site specific weather data around the time of spraying were generally unavail-able in the reports and so were derived for the nearest locality using the Climate Im-pacts and Natural Resource Systems web-site (www.nrm.qld.gov.au/silo/). These interpolated data are based on hourly in-formation supplied by the Australian Bu-reau of Meteorology and map coordinates of the experimental sites.
Soil moisture levels were estimated with a model that utilised soil physical parameters (such as wilting point and field capacity), environmental data (daily radiation, wind speed, rainfall, tempera-ture readings) and agronomic information (planting date, ground cover, crop height, rooting depth). Some data that was miss-ing from individual reports, such as crop planting date, were estimated using the methods described in Medd et al. (2001). Other information, such as the density of wild oats and other grass weeds, was in-cluded where possible.
Field trial dataTrial sites were established in NSW at Breeza, Cowra, Condobolin and Temora in 2003, and Cowra, Condobolin, Orange and Wagga Wagga in 2004. Clodinafop was applied to wild oat infestations from four to nine times at each of the sites, to give a total of 46 separate applications over the two years. On each occasion, the herbicide was applied at four dose rates and in three water volumes, plus non treated controls. Efficacy was quantitatively assessed, in
terms of plant mortality, approximately 30 days after application and wild oat panicle density around anthesis. Fully automated stations collected a comprehensive set of soil and weather data at each site except Orange in 2004. Other measurements such as growth stage and leaf extension rates at the time of spraying, were also included in the analyses.
Results and discussionThe correlation of numerous plant, spray and environmental variables with clodi-nafop efficacy on wild oat was quanti-fied. Generally, the factors found to be correlated with clodinafop efficacy were consistent in both the industry and field generated data sets (Table 1). For exam-ple, of the factors identified by Medd et al. (2001), only VOL and therefore TMAX × VOL, were not correlated with clodinafop efficacy in the data set collated from indus-try trials conducted from 1995 to 2003.
Analyses of data generated in field tri-als showed that TMAX was correlated with clodinafop as a quadratic effect, where maximum efficacy was achieved with a temperature of around 19°C Mini-mum temperatures were not correlated with clodinafop efficacy. This was clearly demonstrated at one site where excellent wild oat control was achieved despite suc-cessive heavy frosts. Interestingly, maxi-mum daytime temperatures at that site were optimal.
Adjuvant rate was not varied in the field trials and so was not included in the analyses of those results. Soil moisture on the day of spraying (SM), rather than SMPRE10, was correlated with clodinafop efficacy in the field data. That may have been influenced by results from the dry Condobolin site, where wild oat control was improved by rainfall immediately prior to spraying.
Medd et al. (2001) adopted the novel approach of analysing industry generated data and nominated a number of environ-mental and spray factors that were cor-related with clodinafop efficacy in their analyses. Analyses of an additional indus-try data set and field trial results support the findings of that study. This suggests that the data could be combined and used to develop an applied, predictive model of clodinafop efficacy on wild oat.
ReferencesMedd, R.W., van de Ven, R., Pickering, D.I.
and Nordblom, T. (2001). Determination of environment-specific dose-response relationships for clodinafop-propargyl on Avena spp. Weed Research 41, 351-68.
Table 1. A comparison of the factors correlated with clodinafop efficacy in Medd et al. (2001) and in subsequent analyses of additional data sets (refer to text for full names of abbreviated variables)Factors correlated with clodinafop efficacy: industry trial data prior to 1995
Factors correlated in industry data (1995–2003)
Factors correlated in field trial data
(2003–4)Topik dose
Adjuvant use
TMAX
SMPRE10 / SM TMINPRE7
VOL
TMAX × VOL
Verification of the factors affecting clodinafop efficacy
T.S. Andrews, R.W. Medd, R. van de Ven, and D.I. Pickering, Cooperative Research Centre for Australian Weed Management, Orange Agricultural Institute, Orange, New South Wales 2800 Email: [email protected]
Weed Society of Victoria Second Victorian Weed Conference ‘Smart Weed Control, Managing for Success’ 17–18 August 2005 69
Abstract Even though pesticide applica-tion equipment has improved and spray-ing efficiency increased, operator safety and reduced environmental contamina-tion remain a significant public concern when pesticides are used. This has been reflected in direct government interven-tion by the imposition of stricter drift and storage regulations in some states as well as necessitating certification for users and resellers in many states. It is also recog-nised that further Government restrictions are under active consideration relating to better advice on product labels. An alter-native approach to Government involve-ment is the imposition of self regulation, based on standards for sprayer manu-facture and testing of sprayers in use as well as the development of sprayers able to vary liquid volume and spray quality without the intervention of the operator. It is suggested that basic to such a strategy is the recognition, by both growers and buyers of produce, that pesticides must be applied as efficiently and effectively as currently possible. It is also argued that for an acceptable strategy pesticide us-ers need to accept the need to ensure that their equipment is properly maintained. It is predicted that even if all of these changes were implemented the publics’ concerns are unlikely to be totally allevi-ated. It is therefore argued that to achieve even greater public acceptance the indus-try needs to simultaneously adopt the aforesaid strategy as well as adopt a more pro-active transparent stance on educat-ing the public about the advantages and disadvantages of pesticide use.
IntroductionThe public continue to maintain that pes-ticide use is a threat to human health, through residues in food and water and via direct contamination of users and by-standers, as well as contributing to envi-ronmental degradation though their ef-fects on biota within and outside the treat-ed areas (Bruhn 1999). This perception has been particularly the case in the EU where pesticides are often used in fields above water aquifers or close to water courses and therefore where leaching of pesticides into underground (Anon 1995) or surface water (Anon 1997) is very important as it can reach the water consumed by the
public. Such concerns have led to govern-ment restrictions on pesticide use, for ex-ample in the UK Local Environmental Risk Assessment for Pesticides (LERAP) (Anon 2001 and 2002) and the development of standards relating to their use (e.g. EN 907; 12761-1; EN 12761-2 and EN 12761-3).
It has been suggested that the devel-opment and adoption of these standards will improve pesticide application as well as operator, bystander and environmen-tal safety (Herbst and Ganzelmeier 2002). This is entirely possible when application equipment is frequently not accurately calibrated and inappropriate droplet sizes are used. Rider and Dickey (1980) for ex-ample reported that only 40% of the users were applying within 10% of the desired dose; even more alarming are the stud-ies of Cupery (1987) who found only 19% within the same limits. These reports only reflect poor calibration and mixing. These are exacerbated during application by for example boom instability which is reported to account for variations in the dose applied of up to 100% across and 30% along the swathe (Maybank et al. 1974). They concluded that if the distribution was improved the dose could be halved. These data are supported by those of Van De Zande et al. (2004) who found that spray deposits along the sprayed track in potatoes varied from -20 to +90% of that sprayed and their results also showed the efficacy was related to deposit. In other studies spray mixtures have been shown to vary in lateral distribution by two to three fold (Richardson and Combellack 1996). A similar situation exists in fruit crops where a two fold variation is typical (Manktelow et al. 2004). Therefore reported data sup-port the notion that pesticides are applied inefficiently and that this is reflected as higher than necessary dose rates and or off target losses.
This paper will consider recent changes in sprayers to apply pesticides in Australia the Standards used and their likely impact on application efficiency and operator and environmental safety.
I. Recent changes in application technologyThere have been a number of structural changes to sprayers which have led to im-proved work rates, a key need, and safety.
In particular: booms made entirely or in part from aluminium to reduce weight and enable widths of up to 48 m; booms that have recirculating lines with air actu-ated diaphragm check valves so that the spray lines can be primed before spray-ing and also enable line cleaning; twin liq-uid lines to accommodate a wider range of travel speed, booms that when folded are not over 4 m in height to prevent con-tact with over head electric wires; devices to aid in the automatic control of boom height; larger pumps with deliveries up to 320 L min-1; larger, up to 8000 L, and better designed tanks that have better ac-cess, drain better, have less rough surfaces and which are fitted with cleaning noz-zles; typically two fresh water tanks one specifically for operators and the other to rinse the tank; levers to control fluid flow direction that are simpler to use due to better labelling; induction hoppers that are easier to clean and which typically in-clude a drum washing facility that is ef-fective; more durable pipes that are less prone to product infiltration and/or deg-radation; improved rate controllers which provide more accurate speed and liquid flow measurement as well as indicating remaining product and area treated; the use of GPS to aid in spraying accuracy us-ing a light bar or through autosteer; faster acting and improved electric shut-off and flow direction valves to control liquid flow; developments in nozzle technology for example increased use of air induction nozzles to reduce drift while maintain-ing similar efficacy in most cases (Wolf 2002).
Some recent developments that have yet to be widely used but are worthy of consideration in Australia include: patch treatment of weeds using either histori-cal records or image analysis to deline-ate spatial location and then applying the herbicide using for example pulse width modulation nozzles (Giles, Ander-son and Nilars 2002, Giles et al. 2004) or direct injection (Christensen, Walter and Heisel 1999); an ultrasonic detection sys-tem for detecting height and presence of tree crops to limit spray wastage (Giles, Slaughter and Upadhyaya 2002); use of double spray nozzles i.e. two nozzles the same, or different, type and size in the same holder (Wolf and Caldwell 2002) or the ‘double nozzle’ designed to exploit the air entrainment characteristics of a down-wardly pointing coarse spraying nozzle to entrain droplets from a fine spraying noz-zle pointed at the spray sheet of the coarse nozzle (Hall et al. 1996); an improved twin fluid nozzle able to generate fine to extra coarse droplets over a wide range of flow rates(Combellack et al. 2004); a novel vari-able flow fan nozzle also able to accom-modate a wider range in flow rate than conventional flat fan nozzles (Womac and Bui 2002) the development of a wetter
Ways to improve pesticide application in Australia through new sprayer technology and adoption of sprayer manufacturing and testing standards
J.H. Combellack, Spray Smart Enterprises, 7 Michelle Drive, Maiden Gully, Victoria 3551

70 Weed Society of Victoria Second Victorian Weed Conference ‘Smart Weed Control, Managing for Success’ 17–18 August 2005
that is much less drift prone (Combellack, Illingworth and Miller 2004).
It can be rationalised from this that there have been, and continue to be, con-tinued improvements in sprayer design to apply pesticides in Australia. However the adoption of new technologies and the standards used by manufacturers varies enormously (Nugent 2001). For exam-ple even though AS/ANZ 2153.6:1996. Equipment for Crop Protection has been published as a standard for manufacture of sprayers it appears not to have been widely adopted.
II. Standards for pesticide application that could be usedThere are three levels of standards; inter-national which are identified by an ISO number and which have the highest de-gree of consensus; regional or country the second level of consensus (the most obvi-ous regional standards are those for the EU which are identified by an EN number and which are recognised by all EU mem-bers) or National which are recognised within that country and the lowest level of are those defined by a manufacturer. Herbst and Ganzelmeier (2002) argued that harmonisation of standards within the EU, and with global institutions, will benefit all by overcoming trade barriers. They further argued that standards influ-ence economic development more than patents. It is therefore regrettable that Aus-tralia is not active on most of the Interna-tional committees that relate to pesticide application. For example ISO standards have been established for: Test methods for nozzles (ISO 5682-1); Test methods for sprayers (ISO 5682-2); Test method for flow control devices (ISO 5682-3); Anti-drip devices (ISO 6686); Nominal tank vol-ume and filling hole diameter (ISO 9357); Data sheet for field crop sprayer – Typi-cal layout (ISO 10627-2); Test method for air-assisted sprayers (ISO 10625); Deter-mination of residues (ISO 13440); Data sheets for air-assisted sprayers – Typical layout (ISO 13441-1) without significant Australian involvement. Even though Australia was not officially represented in the deliberations on these standards the manufacturers of sprayers, as well as those who provide components and or tests sprayers, should be aware of the stand-ards and where possible embrace the out- comes.
There are also a number of EU stand-ards for example: • EN907:1997 Agricultural and forestry
machinery – Sprayers and liquid ferti-liser distributors – Safety;
• EN 12761-1:2001 Agricultural and for-estry machinery – Sprayers and liquid fertiliser distributors – Environmental protection–Part 1: General;
• EN 12761-2:2001 Agricultural and forestry machinery – Sprayers and
liquid fertiliser distributors – Environ-mental protection – Part 2: Field crop sprayers;
• EN 12761-3:2001 Agricultural and for-estry machinery – Sprayers and liquid fertiliser distributors – Environmental protection – Part 3: Air assist sprayers for bushes and tree crops;
• EN 13790-1:2003 Agricultural machin-ery – Sprayers – Inspection of sprayers in use – Part 1: Field crop sprayers;
• EN 13790-2:2003 Agricultural machin-ery – Sprayers – Inspection of sprayers in use – Part 2: Air-assisted sprayers for bush and tree crops.
Both ISO and EU standards should be con-sidered, and where appropriate embraced, by Australian sprayer manufacturers so as to ensure that producers are using sprayers made to the same standards as their EU counterparts thus averting the possibility of this being used as a restric-tion to trade. The relevant standards will thus be reviewed.
A. Suggested mandatory safety standards for Australian made sprayers These suggestions are based on: EN 907 Standard for ‘Agricultural and forestry machinery. Sprayers and liquid fertilisers – Safety’. The key requirements should be:1. Ensuring sprayer can be operated on
8.5° slopes,2. Have a cab if the boom is in the front of
the sprayer,3. If a front mounted boom is fitted to
a self propelled sprayer the drivers seat must be at least 1000 mm above the maximum working height of the boom,
4. Ensure maximum height of folded boom is less than 4.0 meters,
5. Details how location of handles on manually folding booms must be 300 mm from nearest articulation point,
6. Boom to have a locking device when folded in transport position,
7. Have a device to lock the boom in verti-cal position,
8. The manual force necessary to raise the boom must not exceed 230 N,
9. If manual boom raised by a winch it shall be self arresting and able to with-stand a load at least 1.3 times the weight of the boom,
10. If the boom is raised by hydraulics the downward speed must not exceed 10 mm sec-1 and must ensure a minimum height of 500 mm between boom and ground,
11. Provide a device for chemical transfer which is no more than 1500 mm above the ground or platform,
12. Filling hole of the tank must be no more than 1500 mm from the ground and/or 300 mm from the edge of the tank,
13. The tank must be at least 5% oversize of claimed volume,
14. The tank must have a tight lid that al-lows for pressure compensation,
15. There must be an accessible safe drain-ing outlet that can be opened without a tool,
16. The pressure indicator must be read-able from the drivers position,
17. The pressure indicator must have a diameter of 63 mm if within hand reach or 100 mm if beyond,
18. There must be no operator contamina-tion if the pressure indicator leaks,
19. A safety valve must be fitted and oper-ate at no greater than 120% of allowed value,
20. If a fan is fitted it must be protected from drawing in or discharging foreign matter and from access,
21. The fan drive must be able to be disen-gaged,
22. If a cab is fitted no hoses allowed in the cab,
23. If no cab the hoses have to be covered,24. Hoses have to be marked with maxi-
mum pressure,25. If there is a manual sprayer control it
has to be within reach of the operator,26. After switching boom off the maxi-
mum dripping volume must not ex-ceed 2 mL timed over a 5 min period. The measuring to start 8 s after boom closed,
27. A clean water tank of at least 15 L has to be fitted that is isolated and fitted with a tap that does not need to be continu-ously pressed,
28. A rinsing water tank shall be provided. It shall not be combined with the clean water tank. It shall have a volume at least 10% of the main tank volume or at least 10 times the volume of the re-sidual which is to be diluted as speci-fied in the Instruction Handbook and,
29. An instruction manual has to be sup-plied.
B. Suggested basis for an Australian standard for Australian made sprayersIt is suggested that the Standard should be on those of EN 12761 parts 1, 2 and 3:2002 and aim to meet three objectives viz.:1. Even distribution and effective deposi-
tion of spray on the target,2. Avoidance of unintentional loss of pes-
ticide into off target areas, and3. Improvements in the handling of spray-
ing equipment.
B 1. Suggested guidelines on sprayer design to achieve the three objectives:
1. Sprayers and their components shall be reliable and designed so that they can be used properly,
2. Sprayers shall be designed so that they can be safely operated and switched off immediately from the operators posi-tion,
3. Easy and safe filling and emptying shall be possible,

Weed Society of Victoria Second Victorian Weed Conference ‘Smart Weed Control, Managing for Success’ 17–18 August 2005 71
4. Unintentional dispersal of liquid shall be avoided,
5. Adjustment of application volume rate shall be easy, accurate and reproduc-ible,
6. Adjusting and controlling the intended rate required,
7. Means of calibration of the equipment,8. Means of adjustment and control of the
volume rate,9. Adequate and accurate measuring sys-
tems,10. Readability of instruments,11. Instructions for adjusting the volume
rate.(Comment: standard tests for most of these are detailed below.)
B 2. Suggested sprayer design to evenly distribute and deposit pesticides to ensure:1. Evenness of distribution along the boom
in the case of field crop sprayers,2. Evenness in distribution in the driv-
ing direction in the case of field crop sprayers,
(Comment: it is suggested that 1 and 2 should be possible using flow rate data by testing nozzles within their approved pressure range when new and then carrying out subsequent flow rate comparisons. If there is not >10% increase in flow there should be no change. A more stringent test would be for the sprayer manufacturer to carry out and detail CV tests, it should not be above10% when nozzles are new, and when retested if flow has not increased by >10% then CV should be accept-able.)
3. Evenness of mixing of the mixture, (Comment: while a standard of 15%
has been set using ISO 5682-2, this is difficult to measure and needs careful consideration before making manda-tory.)
4. Adequate deposition and distribution of the spray mixture on the target area,
5. Minimising losses to non target areas.
B 3. Suggested standard to ensure sprayers are easy and safe to clean by ensuring:1. Complete emptying is possible and
changing of worn parts shall be easy and safe. Fundamental to this is a tank which has a smooth inner and outer surface. For example an Rz ≤100 µm, see ISO 4287 (measured using ISO 4288 on surface texture assessment) and which drains completely.
(Comment: cleaning is an activity that is known to be major contributor to point source environmental pollution (e.g. Bal-sari et al. 2002, Basford, Rose and Carter 2004) and procedures are poorly described in sprayer manuals and difficult to carry
out both internally and externally (Balsari et al. 2002, Ramwell and Johnson 2004, Holst, Neilsen and Anderson 2004) this is an area which requires serious consid-eration by sprayer manufacturers in Aus-tralia because of the legal liability implica-tions.)
B 4. Mandatory markings affixed on the sprayer to include:1. Name and address of the manufactur-
er,2. Year of construction,3. Designation of series or type.4. Serial number if any,5. Allowable circuit pressure,6. Allowable maximum travel speed,7. Allowable maximum spraying speed,8. Mass when empty,9. Allowable total weight,10. Nominal rpm. and direction of pto,11. Nominal power in kW (for self pro-
pelled machines),12. Tank warning not to enter,13. Warning if boom height when folded is
over 4 m,14. Warning on clean water tank to be filled
only with clean water,15. Tap alignment when filling, recirculat-
ing, rinsing and spraying. (Comment: there is no mention of dura-
bility and or size, colour or type face of lettering, all need to be considered and included.)
B 5. Mandatory markings on the pump to include:1. Name and address of manufacturer,2. Serial number,3. Maximum pump output,4. Maximum pump pressure,5. Maximum pump output at maximum
pump pressure,6. Nominal and maximum rpm.(Comment: there is no mention of durabil-ity and or size of lettering, both need to be considered.)
B 6. Mandatory markings on the hoses should show:1. The maximum allowable pressure,2. Minimum bend.(Comment: there is no mention of durabil-ity and or size of lettering, both need to be considered; should chemical resistance be advised?)
B 7. Mandatory markings on, and colour of, nozzle tips, so that they can be:1. Identified directly for type and size
and or from information given in the instruction handbook. (Comment: or nozzle manufacturers handbook.)
B 8. Mandatory markings on filters to show:1. The manufacturers name or sign, mod-
el and the mesh size.
B 9. Suggested contents for the mandatory sprayer instruction handbook:Comprehensive instructions and informa-tion on all aspects of maintenance and safe use of the sprayer shall be provided. In particular the following shall be empha-sised: 1. Issue warning that additional equip-
ment or attachments for the sprayer must be used in accordance with the intended use,
2. Outline ways of filling to avoid con-tamination of the environment,
3. Delineate conditions of use, e.g. maxi-mum driving speed when travelling and spraying and any corresponding adjustment to the sprayer.
(Comment: sprayer speed has impor-tant implications in Australia for both operator and environmental safety as they are driven faster than in most countries. An agreed maximum speed should be agreed to by sprayer manu-facturers for three point linkage, trailed and self propelled sprayers which could be different for different sized tanks and or booms and tractor size. Therefore they should be agreed to in consultation with tractor manufactur-ers.)
4. Outline ways of avoiding drift tak-ing into account different parameters such as nozzles, pressure, boom height, wind speed, driving speed etc.
(Comment: this has serious litiga-tion implications and wording needs to be carefully considered by sprayer manufacturers. It is suggested that the sprayer manufacturer should advise the user to refer the pesticide manufac-turers label for advice on spray qual-ity to be used and then consult with the nozzle manufacturer’s handbook for guidance on what nozzles to use. It would be advisable to stress to the user that drift is more important than effica-cy. A copy of the nozzle manufacturers handbook should therefore be included in the Instruction Handbook.)
5. Provide an indication of total residual, which should be less than 0.5% of nom-inal capacity of the tank plus 2 litre m-1 of boom
6. Detail instructions on emptying and cleaning,
(Comment: This also needs careful con-sideration because of possible litigation when sprayers are used for a range of products on a range of crops. It is sug-gested that the sprayer manufacturer direct the user to the pesticide label for advice on what chemical cleaners are appropriate. The user should then be asked to refer to the cleaner label for advice on how to use the product. The Instruction handbook should detail how to operate the sprayer to ensure both lines and tank are cleaned.)

72 Weed Society of Victoria Second Victorian Weed Conference ‘Smart Weed Control, Managing for Success’ 17–18 August 2005
7. Outline methods to check the applica-tion volume rate,
8. Detail mesh size of the strainers, 9. Nominate intervals for checking the
sprayer, (Comment: this should be done on
number of hours of use or annually?)10. Identify restrictions on use of special
crop protection products, (Comment: refer the user to the pesti-
cide product label for advice.)11. Outline necessary preparations for dif-
ferent conditions of use,12. Identify possibilities of connecting oth-
er equipment and the necessary pre-cautions,
13. Outline procedure for checking the sprayer on a daily, monthly, as well as yearly basis,
14. Detail the restarting procedures after winter,
15. Outline methods for adjusting pres-sure,
16. Detail adjustments to be made to the sprayer when various nozzles are used,
17. Detail the folding/unfolding proce-dure for the boom. Warn about dangers of overhead wires,
18. Give warning that before maintenance, particularly welding, is to be carried out the spray lines have to be emptied and rinsed,
19. Outline the procedures to deal with blocked nozzles in the field,
20. Detail precautions to be taken by op-erators against contamination for ex-ample use of protective clothing in, the safe use of transfer systems at each of the following stages of use:• filling the tank and adding chemi-
cals • spraying • adjustments • draining and cleaning • changing chemicals • servicing (Comment: should the sprayer manu-
facturers be responsible for this or should they merely advise the user to read and adhere to the label?)
21. Issue warning that booms mounted on the front of the tractor shall not be used where there is no cab,
22. Warn against entering the tank as it is prohibited,
23. Emphasise the need to ensure that no other person is standing near the ma-chine, particularly near a fan,
24. Detail the procedures to be used when parking the machine.
B 10. Suggested specific design require- ments for Field crop sprayers. These have been based on: EN 12761-2 Part 2.1. When filling
I. A design that avoids any return from the main tank to the filling supply,
II. Filling hole of the tank must be no
more than 1500 mm from the ground and or 300 mm from the edge of the tank edge (ref. ISO 9357),
III. Tank volume to be at least 5% more than nominated,
IV. Strainers to have a minimum depth of 60 to 250 mm depending on tank size (ref EN 12761-2:2002) and a mesh size less than 2 mm,
V. Filling should be at a rate of at least 100 L min-1 for tanks >100 L.
2. When fitting emptying device ensure:I. The volume of residual shall not ex-
ceed 0.5% of the nominal tank vol-ume plus 2 litre m-1 of boom (ref. 2.1 ISO 13440:1996),
(Comment: many sprayers in Aus-tralia would not meet this stand-ard.)
II. The emptying device shall allow complete emptying, i.e. no vis-ible puddles after 5 min, when in a horizontal position (ref.4.5.3 EN 907:1997),
III. It shall be possible to collect the liquid from the drain exit without contaminating the operator or other parts of the sprayer.
3. When fitting the tank contents indica-tor ensure that:I. It is visible from the drivers seat and
when filling,II. Has acceptable tolerances e.g. • ± 7.5% for each graduation for up
to 20% of the volume, • ± 5% for each graduation for vol-
umes >20%. The accepted tolerances shall be meas-
ured with a maximum error of ± 1% with the sprayer horizontal and that other ways shall be allowable if same accuracy.
4. When fitting an agitating device/sys-tem to the sprayer ensure that:I. They are capable of producing a mix-
ture that is within ± 15% throughout the tank.
(Comment: this would be difficult to measure for a sprayer manufacturer and it should conform to ISO 5682-2.)
5. When fitting hoses and lines ensure:I. That they have a bending radius that
will be within the limits specified by hose manufacturer,
II. That they have no bends which could affect liquid flow,
6. When fitting a spray boom ensure:I. That it shall have maximum section
widths of 4.5 m for booms ≤24 m and 6 m if >24 m (ref.4.1.3.1 EN 12761-2:2001),
II. That it shall be possible to use any one section when required (ref.4.1.3.1 EN 12761-2:2001).
7. When fitting a spray boom ensure that its height adjustment:I. Shall have a minimum boom height
range of 1.0 m (ref.4.1.3.1 EN 12761-2:2001),
II. Shall be able to be adjusted to suit the crops to be sprayed thus if crop is 1.0 m boom must be able to be raised to 1.5 m (ref.4.1.3.2 EN 12761-2:2001),
III. Shall be able to adjust boom height continuously or in a maximum of 100 mm increments (ref.4.1.3.2 EN 12761-2:2001),
IV. Shall ensure spray is not intercepted by the structure of the sprayer,
V. Shall have a boom structure that aligns parallel to the ground (ref.4.1.3.2 EN 12761-2:2001).
8. When the spray boom hits obstacles:I. Shall if up to 10 m be able to auto-
matically move backwards to their original position (ref.4.1.3.3 EN 12761-2:2001) and be undamaged if hitting an object >0.9 from the mid point to the end of the boom when moving forward at 4 ± 0.2 km h-1 (ref.4.1.3.3 EN 12761-2:2001),
II. Shall if >10 m be able to move au-tomatically backwards and be un-damaged if hitting an object >0.9 from the mid point to the end of the boom when moving forward at 4 ± 0.2 km h-1 or move forwards when moving backwards at 2 ± 0.2 km h-1 (ref.4.1.3.3 EN 12761-2:2001).
9. When fitting filters to the sprayer:I. Which has positive displacement
pump it shall have a filter on the suction side,
II. They shall have on the delivery lines one or more fitted central or in the lines of boom sections,
III. They shall have a mesh size appro-priate to the nozzle size to be fitted,
IV. They must be easily accessible and their inserts easily removed,
V. It shall be possible to remove the fil-ters when the tank is full with only the liquid in the filter and or in the suction and delivery lines leaking out (ref.4.1.4 EN 12761-2:2001).
10. When fitting nozzles:I. It shall be possible to fix nozzles in
set positions to ensure the spray is correctly directed.
II. Dripping from nozzles post an 8 s elapse shall not exceed 2 mL per nozzle after 5 min when the spray is turned off, to achieve this dia-phragm check valves shall be fitted (ref.4.1.5 EN 12761-2:2001),
III. On booms over 10 m the end noz-zles shall be protected from contact-ing the ground (ref.4.1.5 EN 12761-2:2001),

Weed Society of Victoria Second Victorian Weed Conference ‘Smart Weed Control, Managing for Success’ 17–18 August 2005 73
IV. The flow rate from an individual nozzle shall not deviate by more than 5% from the data in the flow rate tables (ref. ISO 5682-1).
11. When fitting measuring systems:I. The relevant dials shall be clearly
visible from the vehicle seat,II. Each measuring system shall be ac-
curate to within a maximum of ± 5% of the true value.
III. The pressure gauges shall be within ± 20 kPa for 100 to 800 kPa working pressure gauges; ± 50 kPa for 800 to 2000 kPa gauges and ± 100 kPa for working pressure gauges over 2000 kPa (ref.4.6 EN 907:1997).
IV. The pressure gauge shall be clearly readable and the needle stable.
V. The scale on the pressure gauge shall be every 20 kPa for working pres-sures <500 kPa; 100 kPa for working pressures between 500 and 2000 kPa and every 200 kPa for pressures over 2000 kPa. (ref. EN 4.6 907:1997).
12. If supplying a test adapter it shall:I. Enable the pressure gauge to be test-
ed using a ¼” female thread connec-tor,
II. Be possible to connect a flowmeter between the pump and pressure regulator without damaging any hoses or removing the couplers from the hoses. Suitable ¾”, 1” or 2” adapters shall be provided by the manufacturer.
13. That adjustment of application volume rate shall:I. Have a maximum tolerance for all
measurements of ± 2.5%,II. Have pressure adjustment devices
that maintain a constant working pressure at constant pump rpm. After switching the boom or its sec-tions on and off the working pres-sure shall return to its original val-ue ± 7.5% even if the pressure has been changed (ref. 4.2.1 En 12761-2:2002),
III. Have volume per hectare adjustment systems able to adapt to changes such as switching off nozzles, boom sections or to reflect travel speed to within ± 10% within 7 s (ref. 5.3 ISO 5682-3:1996),
IV. During repeated adjustments of the same volume rate have coefficient of variation from seven readings not exceeding 3% (ref. 5.3 ISO 5682-3:1996),
V. If spraying at a constant ground and pto speed have a maximum devia-tion from the mean rate that does not exceed 5% (ref. 5.3 ISO 5682-3:1996),
VI. Have a maximum acceptable vari-ation in measured flow rate or
application volume rate of ± 6% of the mean or a 3% coefficient of vari-ation (ref. 5.3 ISO 5682-3:1996),
VII. Have a maximum pressure drop between where the gauge is located and when taken at the nozzle (in-cluding the check valve) not exceed-ing 10%,
VIII. Provide a measuring jug with a capacity of at least one litre and an accuracy of ± 2.5% with the sprayer.
14. That spray distribution shall:I. Have a transverse coefficient of vari-
ation volume distribution, measured using a 100 mm wide patternator, not exceeding 8% at one boom height specified by the manufacturer of the nozzles (ref. ISO 5682-2:1996),
II. Have for other boom heights speci-fied by the nozzle manufacturer a coefficient of variation not exceed-ing 10% (ref. ISO 5682-2:1996; 5682-3:1996),
III. For nozzles with overlapping pat-terns determine the CV only on those parts of the boom where there is total overlap,
15. That the flow rate for each nozzle shall:I. Not vary by more than 10% from
that stated by the nozzle manufac-turer,
II. If of the same type across the boom not vary by more than 5% from the mean flow rate for all nozzles when tested at 250 kPa (ref.7.1 ISO 5682-1:1996),
III. Be measured with an accuracy of ± 2.5% of the true value at 250 kPa (ref.7.1 ISO 5682-1:1996).
16. That to reduce spray drift the nozzles fitted shall have:I. A 10% volumetric droplet diameter
not smaller than that for a 11002 flat fan nozzle delivering 720 mL min-1 at a pressure of 250 kPa (ref.7.5 ISO 5682-1:1996;5682-1:1996).
17. A rinsing water tank will be fitted that:I. Shall not be combined with the clean
water tank for the operators use (ref.4.11 EN:907),
II. Shall have a volume of at least 10% of the nominal tank volume or at least 10 times the volume of residual after draining (ref. 2.2 ISO 13440:1996),
III. Shall be designed so that they can be connected to clean the pipes even when the tank is filled,
IV. Shall also be connected so as to en-able dilution of the residual.
18. Drum cleaning device when fitted shall:I. Be designed so that the volume of
residue after cleaning is less than 0.01% of the drums volume (ref. Annex. A EN 12761-2:2002 also con-sider Balsari 2004).
B 11. Suggested requirements for the manufacture of Air- assisted sprayers for bush and tree crops based on: EN 12761 2003 Part 3. These proposed requirement standards should be encouraged:1. When filling:
I. There shall be a design that avoids any return from the main tank to the filling supply,
II. There shall be a filling hole on the tank that is no more than 1500 mm from the ground or more than 300 mm from the edge of the tank edge (ref. ISO 9357),
III. The tank volume shall be at least 5% more than nominated,
IV. There shall be strainers that have a minimum depth of 60 to 250 mm de-pending on tank size (ref EN 12761-2:2002) and a mesh size less than 2 mm,
V. Filling should be at a rate of at least 100 L min-1 if tank >100 L,
VI. If chemical induction bowl is fitted it shall have a filter with a maximum mesh size of 20 mm.
2. When emptying:I. The volume of residual shall not
exceed 4% of the nominal tank vol-ume for a tank volume of <400 litres; 3% if tank volume between 400 and 1000 litres and 2% if the tank volume is more than 1000 litres (ref. 2.1 ISO 13440:1996),
II. The emptying device shall allow complete emptying, i.e. no vis-ible puddles after 5 min, when in a horizontal position (ref.4.5.3 ISO 907:1997),
III. It shall be possible to collect the liquid from the drain exit without contaminating the operator or other parts of the sprayer,
IV. The tank outlet shall be guarded against accidental opening
3. When fitting tank contents indicator ensure that:I. It is visible from the drivers seat and
when filling (ref ISO 9357),II. It conforms to accepted tolerances
which are: • ± 7.5% for each graduation for up
to 20% of the volume, • ± 5% for each graduation for vol-
umes >20%. (N.B. The accepted tolerances shall
be measured with a maximum error of ± 1% with the sprayer horizon-tal.)
III. If other ways are used they have the same accuracy,

74 Weed Society of Victoria Second Victorian Weed Conference ‘Smart Weed Control, Managing for Success’ 17–18 August 2005
4. When fitting agitators or other devic-es to the tank for mixing ensure that they:I. Produce a mixture that is within ±
15% (ref. ISO 5682-2).
5. When fitting hoses and lines ensure:I. Bending radius will be within the
limits specified by hose manufac-turer
II. There will be no bends which could affect liquid flow
III. Pressure lines will be equipped with quick acting shut off valves
6. When fitting filters ensure that:I. Sprayers with positive displacement
pumps shall have a filter on the suc-tion side,
II. On the delivery lines there shall be central filter(s) or filters in the lines of boom sections,
III. The mesh size of the filter shall be appropriate to the nozzle size fit-ted,
IV. Blockages will be indicated to the operator by for example positioning of the central pressure filters and pressure gauge,
V. Filters shall be easily accessible and their inserts easily removed,
VI. It shall be possible to remove the fil-ter when the tank is full with only the liquid in the filter and or in the suction and delivery lines leaking out.
7. When fitting nozzles ensure that:I. It shall be possible to fix nozzles in
set positions to ensure the spray is correctly directed,
II. When the spray is turned off drip-ping from nozzles post an 8 s elapse shall not exceed 2 mL per nozzle af-ter 5 min., to achieve this diaphragm check valves shall be fitted,
III. The flow rate from an individual nozzle shall not deviate by more than 5% from the data in the flow rate tables (ref. ISO 5682-1),
IV. Swivel nuts shall conform to ISO 14710.
8. When fitting measuring systems ensure that:I. The relevant dials shall be clearly
visible from the vehicle seat,II. Each measuring system shall be ac-
curate to within a maximum of ± 5% of the true value,
III. Pressure gauges shall be within ± 20 kPa for 100 to 800 kPa working pressure gauges; ± 50 kPa for 800 to 2000 kPa gauges and ± 100 kPa for working pressure gauges over 2000 kPa (ref 4.6 EN 907:1996),
IV. The pressure gauge shall be clearly readable and the needle stable,
V. The scale on the pressure gauge shall
be every 20 kPa for working pres-sures <500 kPa, 100 kPa for working pressures between 500 and 2000 kPa and every 200 kPa for pressures over 2000 kPa.
9. When fitting nozzles ensure that:I. It shall be possible to measure the
flow rate for each individual noz-zle,
II. If multi-head nozzles are used this applies to each multi-head nozzle.
10. When fitting adjustment of liquid and air-flow devices:I. It shall be possible to switch off the
blower(s) independently from other driven parts,
II. It shall be possible to independently turn off the spray from each side,
III. It shall be possible for one person to adjust the liquid and air-jets to spray different crops and crop heights in a reproducible way by means of mark-ings, locking systems or the like,
IV. It shall be possible to switch each nozzle off and to adjust the direction of their spray independently,
V. In the case of multi-head nozzles this requirement applies to each multi-head nozzle.
11. When fitting an adjustment of applica-tion volume rate device:I. The maximum tolerance for all
measurements shall be ± 2.5%,II. Pressure adjustment devices shall
maintain a constant working pres-sure at constant pump rpm. After switching the boom or its sections on and off the working pressure shall return to its original value ± 7.5% even if the pressure has been changed,
III. Volume per hectare adjustment sys-tems shall be able to adapt to changes such as switching off nozzles, boom sections or to reflect travel speed to within ± 10% within 7 s (ref.5.1 & 5.2 ISO 5682-3),
IV. During repeated adjustments of the same volume rate the coefficient of variation from seven readings shall not exceed 3% (ref. 5.3 ISO 5682-3:1996),
V. If spraying at a constant ground and pto speed the maximum deviation from the mean rate shall not exceed 5% (ref. 5.3 ISO 5682-3:1996),
VI. The maximum acceptable variation in measured flow rate or applica-tion volume rate shall be ± 6% of the mean or a 3% coefficient of variation (ref. 5.3 ISO 5682-3:1996),
VII. The maximum pressure drop between where the gauge is located and when taken at the nozzle (in-cluding the check valve) shall not exceed 10%,
VIII. A measuring jug with a capacity of at least one litre and an accuracy of ± 2.5% shall be supplied with the sprayer.
13. When measuring liquid output from nozzles they shall not vary by:I. More than 10% from that stated by
the nozzle manufacturer for each nozzle,
II. More than 10% from the mean flow rate for all nozzles,
III. More than 50 ± 5% for left and right hand sides,
IV. More than ± 2.5% of the true value for the testing device.
14. When measuring distribution of airI. The real output of the fan shall not
deviate more than 10% from the nominal output,
II. It shall be possible to adjust the sprayer so that the maximum air ve-locity is the same for both right and left hand sides (ref. ISO 9898:1999).
15. When fitting a rinsing water tank it shall:I. Not be combined with the clean wa-
ter tank for the operator (ref. 4.11 EN 907:1997),
II. Have a volume of at least 10% of the nominal tank volume or at least 10 times the volume of residual after draining (ref. 2.2 ISO 13440:1996),
III. Be designed so that it can be con-nected to clean the pipes even when the tank is filled,
IV. Be connected so as to enable dilution of the residual.
16. If a drum cleaning device is fitted it shall:I. Be designed so that the volume of
residue after cleaning is less than 0.01% of the drums volume (ref. Annex. A EN 12761-2:2002 also con-sider Balsari 2004).
The above standards relate to the manufac-ture of new sprayers. Of equal importance are standards that can be used to assess the efficiency of sprayers in use. The EU has developed two such standards one for: ‘Field crop sprayers (EN 13790-1:2003)’ and one for ‘Air-assisted sprayers for bush and tree crops (EN 13790-2:2003)’. These have been used as the basis for a voluntary ‘National Sprayer Testing Scheme’ in the UK and a mandatory scheme in Belgium (Braekman and Sonck 2004).
EN 13790 lists three arguments for in-spection:i. Operator safety,ii. Less potential risk of environmental
contamination,iii. Good control of pests with the mini-
mum input of product.Inspection can be done on a mandatory or,

Weed Society of Victoria Second Victorian Weed Conference ‘Smart Weed Control, Managing for Success’ 17–18 August 2005 75
as is suggested for Australia, on a voluntary basis. For this to be acceptable there would have to be an organisation that would be acceptable to the clients (e.g. sprayer and component manufacturers; users; produce purchasers; pesticide manufacturers; gov-ernment and public) willing to be respon-sible for implementing and managing the scheme. The said organisation would also have to indicate who is authorised to carry out the inspections, write standards, train inspectors and suggest time intervals between inspections etc. The basis for a standard for such a scheme is outlined be-low separately for crop sprayers and bush and tree crop sprayers.
C 1. Suggested inspection procedure for: Field crop sprayers in use It is suggested that and Australian Inspec-tion of Sprayers in use Standard should be based on the EU standard EN 13790-1:2003:
1. Preparation of the sprayer: The owner to carefully clean the sprayer inside and out including filters and filter inserts. Visible faults to be rectified by the owner before the inspection. An initial overview assess-ment should be made to decide whether to proceed.
2. Power transmission parts:• Shaft, universal joints and locking sys-
tems no excessive wear and operate correctly,
• Guard for soundness and functional-ity,
• Restraining device to prevent shaft ro-tating shall work reliably.
Verify above by: Inspection and function test
3. Pump • Either the pump must be suitable for
purpose and deliver at least 90% its original flow. Verify by: Inspection and function test (Ref. 5.2.1 EN 1390-1:2003).
• or the pump shall deliver sufficient flow to attain maximum pressure with largest nozzles whilst maintaining adequate agitation (ref. 4.3 EN 1390-1:2003). Verify by: measurement (Ref. 5.2.1 EN 1390-1:2003).
• There shall be no visible pulsations caused by the pump. Verify by: Inspec-tion and function test
• Pump safety valve if fitted shall work reliably, verify by: Inspection and func-tion test
• There shall be no Leaks from pump. Verify by: Inspection
4 Agitation • Visible recirculation shall be achieved
when operating normally with the tank half filled. Verify by: Inspection
5. Spray liquid tank • There shall be no leaks from the tank
or its cover when closed. Verify by: In-spection
• There shall be a strainer in good con-dition in the filling hole which meets length in relation to tank size (ref 4.1.1.2 EN 12761-2:2002). Verify by: Inspec-tion
• There shall be a grating in the induction hopper if fitted. Verify by: Inspection
• Pressure compensation for the tank shall be ensured. Verify by: Inspection
• There shall be a clearly readable liquid level indicator for the tank which is visible from the drivers seat. Verify by: Inspection
• It shall be possible to collect the emp-tied spray liquid simply, reliably, with-out tools and without spillage. Verify by: Function test.
• If there is a non-return valve on the wa-ter filling device it shall work reliably. Verify by: Inspection and function test,
• If an induction hopper is fitted it shall function reliably. Verify by: Function test
• If a drum cleaner is fitted it shall work reliably. Verify by: Function test
6. Measuring systems and controls • All devices for measuring, switching
on and off and to adjust pressure and or flow rate shall work accurately and reliably and there shall be no leakages. Verify by: Inspection and function test
• Switching on and off of nozzles shall be possible simultaneously. Verify by: Inspection and function test
• The scale of the pressure gauge shall be clear and suitable for the pressure range used. Verify by: Inspection,
• The scale on the pressure gauges shall be marked at least every 20 kPa for working pressures <500 kPa; 100 kPa for working pressures 500 to 2000 kPa and 200 kPa for working pressures over 2000 kPa (refs 4.6 EN 907:1997; 5.2.2.1 EN 13790-1:2003). Verify by: Inspec-tion,
• The minimum diameter of the pressure gauge case shall be 63 mm if within arms reach otherwise 100 mm. Verify by: Inspection.
• The accuracy of the pressure gauge shall be ± 20 kPa for working pressures between 100 to 200 kPa; for pressures >200 kPa it shall measure with an ac-curacy of ± 10% of the real value. The pointer shall remain stable. Verify by: Inspection and function test (Ref. 5.2.3 EN 1390-1:2003)
7. Pipes and hoses • There shall be no leakages from pipes
or hoses when tested up to the maxi-mum working pressure. Verify by: In-spection and function test.
• Hoses shall be fitted so that there will be no sharp bends and have no visible abrasion. Verify by: Inspection
8. Filtering • There shall be at least one filter on the
pressure side of the pump and if a pos-itive displacement pump one also on the suction side. Verify by: Inspection
• The filters shall be in sound condition and the mesh size appropriate to the nozzles used. Verify by: Inspection and function test
• If an isolation device is fitted it shall be possible, with the tank filled, to clean the filters without any spray liquid leaking out except that which may be present in the filter casing and suction lines. Verify by: Inspection
• Filters shall be replaceable. Verify by: Inspection
9. Spray Boom • The boom shall be stable in all direc-
tions and not worn in the joints or bent. Verify by: Inspection
• Both sides will be of the same length, verify by: Inspection,
• If fitted with beak away device it shall return to its original position when simulated to come into contact with an obstacle. Verify by: Inspection and func-tion test (ref 4.1.3.3 EN 12761-2:2002),
• The boom shall be securely locked when in the transport position. Verify by: Inspection and function test,
• The nozzle spacing and orientation shall be uniform along the boom, ex-cept for special end boom nozzles. Ver-ify by: Inspection and measurement,
• When stationary on a level surface the distance from the bottom of the nozzle to the ground shall not vary by more than 100 mm or 1% of the half working width. Verify by: Inspection and meas-urement,
• Regardless of the operating height of the boom the liquid will not be sprayed onto any part of the sprayer, verify by: Inspection and function test,
• On booms >10 m a device shall be fitted to prevent nozzle damage if the boom hits the ground. Verify by: Inspection,
• It shall be possible to shut on and off individual boom sections. Verify by: Inspection and function test,
• Boom height adjustment shall work re-liably and conform to safety standards. Verify by: Inspection and function test (ref 4.4.4 EN 907:1997),
• Devices for damping boom movement and slope compensation shall work re-liably. Verify by: Inspection and func-tion test,
• When measured at the inlet of the boom sections the pressure shall not vary by more than 10% when the sections are closed one by one. Verify by: Function test (ref 5.2.7 EN 13790-1:2003).

76 Weed Society of Victoria Second Victorian Weed Conference ‘Smart Weed Control, Managing for Success’ 17–18 August 2005
10. Nozzles• All nozzles shall be identical (type, size,
material and origin) all along the boom except for special end nozzles. Verify by: Inspection.
• Anti drip devices and nozzle filters shall also be identical. Verify by: In-spection,
• After turning off the nozzles they shall not drip more than 2 mL in 5 s after the spray jet has collapsed. Verify by: Inspection and function test (ref 4.1.5 EN 12761-2:2002).
11. Transverse distribution • The transverse distribution within the
total overlapped area shall be uniform thus not exceed a coefficient of variation of more than 10% when an approved 100 mm patternator (ref ISO 5682.2) is used (ref 5.2.4 EN 13790-1:2003). Verify by: Inspection and function test. (Com-ment: this function test should be op-tional in Australia?)
• The volume of liquid collected in each groove on the patternator will not de-viate more than ± 20% (ref 5.2.4 EN 13790-1:2003). Verify by: Inspection and function test (Comment: a function test should be optional in Australia?)
• The flow rate of each nozzle of the same type used on the boom shall not deviate by more than 5% from the mean flow rate of all the nozzles on the boom and shall not show an increase >10% com-pared to the mean of the nozzles when new when tested at 250 kPa. Verify by: Inspection and function test (ref. 7.1 ISO 5682-1:1996) (Comment: this test should indicate whether distribution is sound and could be used rather than patternation tests? However as nozzle wear increases CV, nozzles should be changed if flow increases by more than 10% compared to when new)
• The pressure drop between the measur-ing point for pressure on the sprayer and the end of each boom section shall not exceed 10% of the pressure shown on the pressure gauge. Verify by: In-spection and function test (ref 5.2.6 EN 13790-1:2003)
C 2. Testing procedure for “Air-assisted sprayers for bush and tree crops” based on EN 13790-2:2003. The following shall be checked by inspec-tion:
1. Preparation of the sprayer The owner to carefully clean the sprayer inside and out including filters and filter inserts. Visible faults to be rectified by the owner before the inspection. An initial overview assessment should be made to decide whether to proceed.
2. Power transmission parts and blower:• Shaft, universal joints and locking sys-
tems. Verify by: Inspection,• Guard for soundness and functionality.
Verify by: Inspection,• Restraining device shall work reliably.
Verify by: Inspection and function test.
3. Blower • The blower (fan, blades and air deflec-
tors) shall be in good condition and mounted in a functional manner. Verify by: Inspection and function,
• All parts shall be free of mechanical deformation, wear, tear, corrosion and vibrations. Verify by: Inspection and function,
• The guard shall be present and have no faults in its mesh. Verify by: Inspec-tion.
4. Pump • Either the pump must be suitable for
purpose and deliver at least 90% its original flow. Verify by: Inspection and function test (Ref. 5.2.1 EN 1390-1:2003),
• Or the pump shall deliver sufficient flow to attain maximum pressure with largest nozzles whilst maintaining ade-quate agitation (ref. 4.3 EN 1390-2:2003). Verify by: inspection and measurement (Ref. 5.2.1 EN 1390-2:2003),
• There shall be no visible pulsations caused by the pump. Verify by: Inspec-tion and function test,
• Pump safety valve if fitted shall work reliably. Verify by: Inspection and func-tion test,
• There shall be no leaks from pump. Verify by: Inspection.
5. Agitation • Visible recirculation shall be achieved
when operating normally with the tank half filled. Verify by: Inspection.
6. Spray liquid tank • The tank shall have smooth inner sur-
faces and shall have no leaks from the tank or its cover when closed. Verify by: Inspection,
• There shall be a strainer in good condi-tion in the filling hole that conforms to length for the tank size. Verify by: In-spection (ref. 4.1.1.2 EN 12761-3:2001),
• There shall be a grating in the induction hopper if fitted. Verify by: Inspection,
• Pressure compensation for the tank shall be ensured. Verify by: Inspection,
• There shall be a clearly readable liquid level indicator for the tank which is visible from the drivers seat. Verify by: Inspection,
• It shall be possible to collect the emp-tied spray liquid simply, reliably, with-out tools and without spillage. Verify by: Function test,
• If there is a non-return valve on the wa-ter filling device it shall work reliably. Verify by: Inspection and function test,
• If an induction hopper is fitted it shall function reliably. Verify by: Function test,
• If a drum cleaner is fitted it shall work reliably. Verify by: Function test.
7. Measuring systems and controls • All devices for measuring, switching
on and off and to adjust pressure and or flow rate shall work accurately and reliably and there shall be no leakages. Switching on and off of nozzles shall be possible simultaneously. Verify by: In-spection and function test (ref. 5.3 ISO 5682-3:1996),
• All devices for adjusting pressure shall maintain a constant working pressure with a tolerance of ± 10% at a constant rotational speed and reach the same working pressure after the equipment has been switched on and off again. Verify by: Inspection and function test,
• Switching on and off of all nozzles si-multaneously shall be possible. Verify by: Inspection and function test (ref. 5.3 ISO 5682-3:1996),
• The scale of the pressure gauge shall be clear and suitable for the pressure range used. Verify by: Inspection,
• The scale on the pressure gauge shall be marked at least every 20 kPa for working pressures <500 kPa; 100 kPa for working pressures 500 to 2000 kPa and 200 kPa for working pressures over 2000 kPa (refs 4.6 EN 907:1997; 5.2.2.1 EN 13790-1:2003).Verify by: Inspec-tion,
• The minimum diameter of the pressure gauge case shall be 63 mm. Verify by: Inspection,
• The accuracy of the pressure gauge shall be ± 20 kPa for working pressures between 100 to 200 kPa; for pressures >200 kPa it shall measure with an ac-curacy of ± 10% of the real value. The pointer shall remain stable when oper-ating. Verify by: Inspection and func-tion test (Ref. 4.6 EN 907:1996; 5.2.2.1 EN 1390-2:2003),
• All other measuring devices, especially flow meters (used for controlling rate/hectare) shall measure within a maxi-mum error of 5% of the real value. Ver-ify by: Function test (ref. 5.3 ISO 5682-3:1996; 5.2.3 EN 13790-2:2003).
8. Pipes and hoses • There shall be no leakages from pipes
or hoses when tested up to the maxi-mum working pressure. Verify by: In-spection and function test,
• Hoses shall be fitted so that there will be no sharp bends and have no visible abrasion. Verify by: Inspection,
• Hoses shall not be located in the spray plume. Verify by: Inspection.

Weed Society of Victoria Second Victorian Weed Conference ‘Smart Weed Control, Managing for Success’ 17–18 August 2005 77
9. Filtering • There shall be at least one filter on the
pressure side of the pump and if a posi-tive displacement pump is fitted one also on the suction side. Verify by: In-spection,
• The filters shall be in sound condition, and the mesh size appropriate to the nozzles used. Verify by: Inspection,
• If an isolation device is fitted it shall be possible, with the tank filled, to clean the filters without any spray liquid leaking out except that which may be present in the filter casing and suction lines. Verify by: Inspection,
• Filters shall be replaceable. Verify by: Inspection.
10. Nozzles • The nozzles shall be suitable to apply
the products to be used on the crops to be sprayed. Verify by: Inspection,
• The nozzles they shall not drip more than 2 mL in 5 s after the spray jet has collapsed. Verify by: Inspection and function test (ref 4.1.5 EN 12761-2:2002),
• The nozzle type and size shall be the same on the left and right hand sides, except when only one side is used or where different nozzles are used to compensate for asymmetrical blower capacity. Verify by: Inspection,
• It shall be possible to switch off each nozzle separately. This would apply also to multi head nozzles. Verify by: Inspection and function test,
• It shall be possible to adjust the position of the nozzles in a reproducible man-ner. Verify by: Inspection and function test.
11. Distribution and nozzle output • Each nozzle shall generate a uniform
shape and a spray of similar droplet size range. Verify by: Inspection and function,
• test using blower off for hydraulic noz-zles and blower on for air shear nozzles. Verify by: Inspection and function,
• The flow rate of each nozzle of the same type used shall not deviate by more than 15% from the nominal output nor show an increase >10% compared to the mean from all of the nozzles and the difference between the left and right hand sides shall be a maximum of 10%. Verify by: Inspection and func-tion test (ref. 7.1 ISO 5682-1:1996; 5.2.5 EN 13790-2:2003),
• The pressure drop between the measur-ing point for pressure on the sprayer and the end of each boom section shall not exceed 15% of the pressure shown on the pressure gauge. Verify by: In-spection and function test (ref 5.2.5 EN 13790-2:2003).
11. Blower/fan output • The fan shall rotate at the speed speci-
fied by the manufacturer. Verify by: Function test,
• If the fan can be switched off separately from the pump the clutch shall work. Verify by: Function test,
• Adjustable air deflectors on the blades and outlets shall function properly. Verify by: Inspection and function test,
• The spray shall not impinge on other parts of the sprayer so as to cause drip-ping. Verify by: Inspection and func-tion test,
• Air velocity shall be measured with the fan operating at maximum recommend-ed rpm at three points, top middle and bottom, on each side of the air outlet to compare output with that claimed. Verify by: Inspection and function test.
12. Test Facilities and measurements • Pump capacity measurement should
comply with 5.2.1 EN 13790-1:2003; 5.2.1 EN 13790-:2003,
• Verification of pressure gauges should comply with 5.2.2.2 and 5.2.2.1 EN 13790-1:2003,
• Flow meters for controlling volume per hectare rate should shall not give an error over 1.5% (ref 5.2.3 EN 13790-1:2003),
• Transverse uniformity if to be measured should use a patternator that conforms to 5.2.4 EN 13790-1:2003,
• Patternators should conform to 4.10.1 EN 13790:2003,
• The measuring error for nozzle flow rate shall not exceed 2.5% (ref 5.2.5 EN 13790-1:2003),
• Measurement of flow rate of nozzles fitted on the boom shall be made in accordance with clause 8 ISO 5682-2:1997,
• Measurement of nozzle flow can also be made removed from the boom on attests bench,
• Measurement of pressure drop shall be made using a standard test gauge,
• Measurement of pressure variation when sections are closed should be done in accordance with the procedure in 5.2.7 EN 13790-1:2003 or 5.2.5 EN 13790-2:2003.
13. Other test facilities required: Tachom-eter (P.T.O.), measuring tape, stop watch, measuring cylinder 2 litre with 20 mL divi-sions or a flow meter, air pressure gauge for pulsation damper on pump.
ConclusionsIn most developed nations senior admin-istrators continue to accept the assump-tion that pesticides are a threat to human health. These concerns are reflected as direct government intervention, imposi-tion of stricter registration and application
requirements. Adoption of ‘new’ sprayer designs and application technologies have led to improvements in efficiency but also complexity. Even so there are some ‘new’ technologies which have yet to be used, and which may well be of benefit, but will add to the complication. It is rationalised that because spraying typically takes up less than 10% of the year’s activity for an operator the majority of applicators are not in a position to understand all of the inter-acting complexities involved. Therefore a change in accountability from the operator to the sprayer or pesticide manufacturer or ways to reduce the complication must to be found. It is suggested that the design of a sprayer that is able to vary flow and spray quality in real time, to reflect chang-es in adjacent hazard or weather, without the intervention of the operator to be best option. The technology exists for this to be done.
Another area of identified concern is the lack of standards governing the manufac-ture of sprayers as well as its functionality when in use. Standards are important in minimising operator and environmental hazard. This is an area of considerable interest in Europe, admittedly driven by the purchasers of food and consumers of water. It is therefore surmised that if food is grown in Australia with sprayers that do not conform to standards similar to those in Europe this may well be used as a reason to limit their importation. Further if the standards for sprayers were imple-mented it could be argued that food pur-chasers in Australia should not be satisfied with product from other countries unless sprayed with sprayers governed by simi-lar standards. It is recognised that some sprayer manufacturers comply with ISO 9002 which guarantees quality control of components during the manufacture, de-livery and aftercare of a sprayer but it does not address the issue of operator or envi-ronmental safety. The Europeans have de-veloped and implemented standards that address their concerns about environmen-tal and user risk. AS/ANZ 2153.6:1996. Equipment for crop protection. has been published as a standard for manufacture of sprayers but appears not to have been implemented. The suggested standards herein aim to update the latter as well as promote a testing procedure for sprayers in use that should be suitable for Australia and yet comply with EU requirements.
The main beneficiaries of the suggested pro-active strategy will be the produce buyers, consumers and public.
ReferencesAnon. (1995). FOCUS modelling work-
group leaching models and EU registra-tion guidance document 4952/VI/95, Commission of the European Commu-nities, Directorate-General for Agricul-ture VI B II-1, Brussels, 123 pp.
78 Weed Society of Victoria Second Victorian Weed Conference ‘Smart Weed Control, Managing for Success’ 17–18 August 2005
Anon. (1997). FOCUS modelling work-group surface water models and EU registration of plant protection prod-ucts. Guidance document 6476/VI/96, Commission of the European Commu-nities, Directorate-General for Agricul-ture VI B II-1, Brussels, 217 pp.
Anon. (2001). Local environment risk as-sessment for pesticides (LERAP), hori-zontal boom sprayers. 8 pp., DEFRA Publications, ADMAIL 6000, London.
Anon. (2002). Local environment risk as-sessment for pesticides (LERAP), 8 pp., Broadcast Air-Assisted Sprayers.12 pp., DEFRA Publications, ADMAIL 6000, London.
Balsari, P. (2004). A new international standard proposal for assessing the ef-ficiency of sprayer hoppers. In Aspects of Applied Biology 71; International advances in pesticide application 2004; Pub. Assoc. Applied Biologists, 1-7.
Balsari, P., Marucco, P., Tamognone, M., Ganzelmeier, H. and Wehmann, H.J. (2002). Cleaning of sprayers: New European test standard proposal and first test results In Aspects of Applied Biology 66; International advances in pesticide application 2002; Pub. Assoc. Applied Biologists, 9-16.
Basford, W.D., Rose, S.C. and Carter, A.D. (2004). On-farm bioremediation (biobed) systems to limit point source pesticide pollution from sprayer mix-ing and washdown areas. In Aspects of Applied Biology 71; International advances in pesticide application 2004; Pub. Assoc. Applied Biologists, 27-34.
Braekman, P and Sonck, B. (2004). Accredi-tation according to EN45004 as a guar-antee for a correct, reliable and objec-tive mandatory inspection of sprayers in Flanders, Belgium. In Aspects of Ap-plied Biology 71; International advanc-es in pesticide application 2004; Pub. Assoc. Applied Biologists, 27-34.
Bruhn, C.M. (1999). Public communication on the food chain, the foundation of glo-bal progress. Proc. The 1999 Brighton Conference – Weeds Vol. 1, 3-12.
Christensen, S., Walter, A.M. and Heisel, T. (1999). The patch treatment of weeds. The 1999 Brighton Conference Weeds, Vol. 2, 591-600.
Combellack, J.H., Illingworth, J and Miller, P (2004). SST 0107/03 A wetting agent that unexpectedly reduces drift. Proc. 7th International Symposium Adju-vants for Agrochemicals Cape Town 2004, pp. 99-104.
Combellack, J.H., Miller, P.C.H., Tuck, C.R. and Christian, C.B. (2002) Some performance characteristics of a novel twin fluid nozzle. In Aspects of Applied Biology 66; International advances in pesticide application 2002; Pub. Assoc. Applied Biologists, 237-244.
Combellack, J.H., Tuck, C.R., Miller, P.C.H. and Christian, C.B. (2004). Performance
characteristics of a double chamber twin fluid nozzle. In Aspects of Applied Biology 71; International advances in pesticide application 2004; Pub. Assoc. Applied Biologists, 537-42.
Cupery, W.E. (1987). Application accuracy. In Methods of applying herbicides, eds C.G. McWhorter and M.R. Gebhardt, pp. 63-83 (Champaign: Weed Science Society of America, Ill.).
Giles, D.K., Slaughter, D.C. and Upad-hyaya, S.K. (2002). Biological target sensing and sprayer control. In Aspects of Applied Biology 66; International advances in pesticide application 2002; Pub. Assoc. Applied Biologists, 129-38.
Giles, D.K., Anderson, P.G. and Nilars, M. (2002). Flow control and spray cloud dynamics from hydraulic nozzles. Trans. ASAE 45 (3) 539-46.
Giles, D.K., Slaughter, D.C., Downey, D., Brevis-Acuna, J.C. and Lanini, W.T. (2004). Application design for machine vision guided selective spraying of weeds in high value crops. In Aspects of Applied Biology 71; International advances in pesticide application 2004; Pub. Assoc. Applied Biologists, 75-82.
Hall, F.R., Downwer, R.A., Wolf, T.M. and Chapple, A.C. (1996). The ‘Double Nozzle’ – A new way of reducing drift and improving dose transfer? Pesticide Formulations and Application Systems: 16th Volume, ASTM STP 1312, eds Hop-kinson, Colins and Goss. American So-ciety for Testing Materials.
Herbst, A. and Ganzelmeier, H. (2002). In-ternational standards and their impact on pesticide application. In Aspects of Applied Biology 66; International ad-vances in pesticide application 2002; Pub. Assoc. Applied Biologists 1-8.
Holst, C.D., Neilsen, C. and Andersen, P.G. (2002). Developments with the internal and external cleaning of sprayers in the field use. In Aspects of Applied Biology 66; International advances in pesticide application 2002; Pub. Assoc. Applied Biologists, 395-400.
Manktelow, D.W., Gurnsey, S.J. and Mac-Gregor, A.M. (2004). Deposit variability and prediction in fruit crops: What use are label rates anyway? In Aspects of Applied Biology 71; International ad-vances in pesticide application 2004; Pub. Assoc. Applied Biologists, 91-98.
Maybank, J., Yoshida, K. and Grover, R. (1974). Droplet size spectra, drift po-tential and ground deposition pattern of herbicide sprays. Canadian Journal of Plant Science 54, 541-6.
Nugent, T. (2001). ‘Spraying solutions’, (Kondinon Group, WA).
Ramwell, C.T. and Johnson, P.D. (2002). Pesticide residues on agricultural sprayers. In Aspects of Applied Biology 66; International advances in pesticide application 2002; Pub. Assoc. Applied Biologists, 387-94.
Van De Zande, J.M., Michielsen, J.M.G.P., Stallinga, H., Meier, R. and Schiepers, A.M. (2004). Effect of sprayer boom movement on spray deposition and bi-ological efficacy. In Aspects of Applied Biology 71; International advances in pesticide application 2004; Pub. Assoc. Applied Biologists, 91-98.
Wolf, T.M. (2002). Optimising herbicide performance-biological consequences of using-low drift nozzles. In Aspects of Applied Biology 66; International advances in pesticide application 2002; Pub. Assoc. Applied Biologists, 99-106.
Wolf, T.M. and Caldwell, T.M. (2002). Evaluation of double spray nozzle de-posits on vertical targets. In Aspects of Applied Biology 66; International ad-vances in pesticide application 2002; Pub. Assoc. Applied Biologists.
Womac, A.R. and Bui, Q.D. (2002). Design and tests of a variable-flow fan nozzle. Trans. ASAE. 45 (2) 287-95.
Weed Society of Victoria Second Victorian Weed Conference ‘Smart Weed Control, Managing for Success’ 17–18 August 2005 79
SESSION 7Successful monitoring (concurrent)
Summary Notes are presented on weed biological control impact assessment ac-tivities currently in progress in Victoria.
IntroductionBiological control impact assessment is a necessary component of weed biological control programs (Delfosse 2004, Roush 2003). Such activities help to determine weed biological control success or failure, value of investments to end users, fund-ing agencies and other stakeholders, can be used to persuade funding agencies to make further investments and help to improve the science of weed biological control.
The impact of biological control on weed populations can be evaluated in a variety of ways. These include comparing weed infestations before and after biologi-cal control, contemporaneous compari-sons of weed infestations at sites with and sites without biological control agents, as-sessments of correlations between agent numbers and parameters indicative of weed population dynamics (e.g. Swirepik and Smyth 2003, Smyth et al. 2004), experi-ments to manipulate biological control agent attack levels by physical exclusion or containment or pesticidal exclusion methods (e.g. Adair and Holtkamp 1999)
Bridal creeper Asparagus asparagoides L.Site/s: One site at Warrandyte State Park and one within the Point Nepean National Park at Rye. The trial is
part of a national project, with sites also set up in SA, WA and NSW.Situation: Bushland.Agent/s: Bridal creeper rust Puccinia myrsiphylli.Basis of assessment method: Comparisons before and after colonisation by rust.Indicators of impacts: Bridal creeper biomass, fruiting, height of growth and ground cover, vegetation composition, photo
point.DPI1 project staff: Greg Lefoe and Raelene Kwong, Sarah Holland Clift2.Collaborators: CSIRO Entomology.Biological control impacts: • The rust is causing significant reductions in the bridal creeper above ground biomass and fruit
production.• At Warrandyte, the biomass was reduced by an average of 76% and seed production by 94% over a
three year period (Kwong and Holland Clift 2004).
Site/s: Basic monitoring at many sites across Victoria.Situation: Bushland, roadsides, citrus orchards, shelterbelts.Agent/s: Bridal creeper rust P. myrsiphylli and/or bridal creeper leaf hopper Zygina sp.Basis of assessment method: Comparisons before and after colonisation by rust and or leaf hopper.Indicators of impacts: Photo point, estimation of damage and defoliation.DPI Project Staff: Greg Lefoe and Sarah Holland Clift.Collaborators: Community stakeholders.Biological control impacts: • At high population levels, the leaf hoppers can cause severe defoliation and reduce fruit and seed
production (Batchelor and Woodburn 2002, Holland Clift and Kwong 2004).
and combinations of these (e.g. Smyth and Sheppard 2002).
Each methodology has certain advan-tages and disadvantages. For example during the interval between before and after biological control, effects of other factors may accrue. These effects may be overlooked or difficult or impossible to resolve from the biological control effects. On the other hand, pesticidal exclusion methods enable studies in which it is pos-sible and practical to compare indicators of fitness of weed populations with and without biological control agents while adequately controlling extraneous vari-ables that in other methodologies may occur uncontrollably in association with temporal or spatial separation of treat-ment and control observations.
There are several weeds in Victoria for which studies to investigate the impacts of biological control are in progress. These notes briefly outline some of these stud-ies and give preliminary assessments of biological control impacts based on obser-vations and interpretations of researchers involved.
Weed biological control impact assessment in Victoria: notes on current activities
Tom Morley, Department of Primary Industries, PO Box 48, Frankston, Victoria 3199

80 Weed Society of Victoria Second Victorian Weed Conference ‘Smart Weed Control, Managing for Success’ 17–18 August 2005
Spear thistle, Cirsium vulgare (Savi) Ten.Site/s: Marysville, North East Victoria; Wilkin, and Strathdownie, South West Victoria.Agent/s: Spear thistle gall fly, Urophora stylata (Fabricius).Basis of assessment method: Comparison of attacked and unattacked plants.Indicators of impacts: Numbers of capitula attacked, reduction in seed production.DPI Project Staff:3 Jean Louis Sagliocco and Tom Morley.Collaborators: CSIRO Entomology.Biological control impacts: • Gall flies reduced seed production by up to 46% at Marysville in 2002, but this level is not sufficient
to affect thistle populations (Sagliocco and Hinksman 2002).• Attack rates of capitula by the fly fluctuate widely from year to year.
English broom, Cytisus scopariusSite/s: Basic monitoring at many sites.Agent/s: Twig miner, Leucoptera spartifoliella (Hubner).Basis of assessment method: ‘Before and after’ agent colonisation comparisons.Indicators of impacts: Photo points, plant biomass.DPI Project Staff: Jean Louis Sagliocco.
Collaborators: CSIRO Entomology, Landcare research New Zealand.Biological control impacts: • Impact trials to commence in 2005.
Paterson’s curse Echium plantagineum L.Site/s: Balmattum Hills, North East Victoria.Situation: Pasture grazed by sheep for wool and fat lamb production.Agent/s: Paterson’s curse crown weevil Mogulones larvatus (Schultz).
Paterson’s curse flea beetle Longitarsus echii (Koch).Basis of assessment method: Insecticidal exclusion.Indicators of impacts: Pasture composition, Paterson’s curse plant density, biomass and seed bank.DPI project staff: Tom Morley and Julio Bonilla.Biological control impacts: • Both agents improve pasture composition by suppressing Paterson’s curse growth such that
Paterson’s curse plant density and biomass are reduced and clover (Trifolium spp.) and grass proportions of the pasture are increased.
• Paterson’s curse soil seed bank has declined since 1997 in associated with colonisation and population increases of biological control agents.
• The crown weevil’s ability to cause these changes diminishes as grazing intensity increases.
Site/s: Six sites in North East Victoria, one in South West Victoria.Agent/s: Paterson’s curse crown weevil Mogulones larvatus (Schultz) and or Paterson’s curse flea beetle
Longitarsus echii (Koch).Basis of assessment method: i) Correlation of Paterson’s curse plant density and agent prevalence.
ii) ‘Before and after’ agent colonisation comparisons.Indicators of impacts: i) Paterson’s curse plant density and agent prevalence.
ii) Soil seed bank.DPI Project Staff: Kerry Roberts.Collaborators: CSIRO Entomology, Department of Primary Industries NSW, South Australian Research and
Development Institute and the Department of Agriculture Western Australia.Biological control impacts: • Based on assessments of sites across South Eastern Australia increases in the prevalence of the
crown weevil over the last decade are positively correlated with an increase in Paterson’s curse plant mortality (Swirepik and Smyth 2003).
• Flea beetle appears to be responsible for substantial decreases in Paterson’s curse plant density.
Horehound Marrubium vulgare L.Site/s: Wyperfeld National Park, North West Victoria.Agent/s: Horehound clearwing moth Chamaesphecia mysiniformis Boisduval.Basis of assessment method: Detailed studies on plant and insect densities.Indicators of impacts: Weed density, insect dispersal.

Weed Society of Victoria Second Victorian Weed Conference ‘Smart Weed Control, Managing for Success’ 17–18 August 2005 81
DPI Project Staff: Jean Louis Sagliocco and John Weiss.Biological control impacts: • Steady increase of insect frequency, documented insect dispersal, documented reduction in weed
density and weed population age structure (Sagliocco and Weiss 2004).
Blackberry, weedy Rubus L. spp.Site/s: Central Gippsland; Murrindindi; Tallangatta.Situation: Large infestations of R. anglocandicans A. Newton and R. leucostachys in pasture.Agent/s: Blackberry rust Phragmidium violaceum (C.F. Shcultz)Wint.Basis of assessment method: Fungicidal exclusion.Indicators of impacts: Foliage cover, cane cover, luxuriance (using point quadrats), cane length, cane mass, crown mass,
cover and luxuriance of associated vegetation.DPI Project Staff: Robin Adair, Franz Mahr, Aline Bruzzese, Julio Bonilla.Biological control impacts: • Significant differences in blackberry growth detected after one season.
• Foliage cover, stem cover, cane mass and luxuriance are reduced when blackberry rust is present at high levels on host plants, although not all indicators were significant at all sites.
• Impact effects are apparent across a climatic gradient in Victoria.• Rust intensity can vary from season to season.• The project will monitor rust impact over at least 3 seasons.
Ragwort, Senecio jacobaea L.Site/s: Foster North, South Gippsland.Situation: Verges, vehicular track, Pinus radiata D.Don plantation, altitude 265 m.Agent/s: Ragwort plume moth Platyptilia isodactyla (Zeller).Basis of assessment method: Insecticidal exclusion.Indicators of impacts: Seed production inference, plant size, plant survival, plant density.DPI project staff: Tom Morley and Julio Bonilla.Biological control impacts: • Ragwort seed production, plant size and survival appear to be being suppressed by P. isodactyla in
this study.• No difference in ragwort plant density between P. isodactyla-infested and insecticidally treated plots
has been observed.
Site/s: Mt Tassie, South Gippsland.Situation: Undisturbed open space between silviculture plots, altitude 700 m.Agent/s: Ragwort crown boring moth Cochylis atricapitana (Stephens).
Ragwort flea beetle Longitarsus flavicornis (Stephens).Basis of assessment method: Insecticidal exclusion.Indicators of impacts: Seed production inference, plant size, plant survival.DPI project staff: Tom Morley and Julio Bonilla.Biological control impacts: • Ragwort seed production, plant size and survival appear to be being suppressed by the combined
impact of the crown boring moth and flea beetle in this study.
Site/s: Callignee South, South Gippsland.Situation: Pasture grazed by cattle for beef production, altitude 500 m.Agent/s: Ragwort crown boring moth Cochylis atricapitana (Stephens).Basis of assessment method: Insecticidal exclusion.Indicators of impacts: Pasture composition, seed production inference.DPI project staff: Tom Morley and Julio Bonilla.Biological control impacts: • It has not yet been possible to detect any effect of the crown boring moth on ragwort plant density
in this study.• It is not certain whether this is due to absence of significant impact by the moth in this situation or
the fact that the insecticidal exclusion method is only partially effective.
Gorse, Ulex europaeus L.Site/s: Basic monitoring at many sites across Victoria.

82 Weed Society of Victoria Second Victorian Weed Conference ‘Smart Weed Control, Managing for Success’ 17–18 August 2005
Agent/s: Gorse spider mite Tetranychus lintearius Dufour, Gorse thrips Sericothrips staphylinus Haliday.Basis of assessment method: ‘Before and after’ agent colonisation comparisons.Indicators of impacts: Gorse biomass seed production.DPI Project Staff: Kylie MacGregor, Raelene Kwong.Collaborators: Tasmanian Institute for Agricultural Research.Biological control impacts: • Tasmanian studies have found that gorse spider mite can reduce foliage dry weight of infested
branches by 37% over a 2.5 year period (Jamie Davies unpublished).• An integrated control experiment in Tasmania indicated that a combination of gorse thrips, rye-
grass competition and simulated grazing resulted in a gorse seedling mortality of 93% (Ireson et al. in press).
• No comparable data are available for Victoria.
(Tasmanian Weeds Society, Devonport, Tasmania).
Kwong, R.M., and Holland Clift, S. (2004). Biological control of bridal creeper, As-paragus asparagoides (L.) W.Wight, in citrus orchards. Proceedings of the 14th Australian Weeds Conference, eds B.M Sindel and S.B. Johnson, pp. 329-332. (Weed Society of New South Wales, Sydney).
Morley, T.B., Faulkner, S. and Faithfull, I.G. (2004). Establishment and dispersal of dock moth Pyropteron doryliformis (Och-senheimer) (Lepidoptera: Sesiidae) in Victoria. Proceedings of the 14th Aus-tralian Weeds Conference, eds B.M. Sin-del and S.B. Johnson, pp. 381-4. (Weed Society of New South Wales, Sydney).
Roush, R. ( 2003). Putting more science into the art of biological control. In Improv-ing the selection, testing and evaluation of weed biological control agents, eds H. Spafford Jacob and T.D. Briese, pp. v-vi. (CRC for Australian Weed Man-agement, Adelaide).
Sagliocco, J.-L., Hinksman, M., Kwong, R.M. and Bruzzese, A. (2002). Impact as-sessment study of the gall fly, Urophora stylata on spear thistle, Cirsium vulgare, in Victoria 2001–2002. DPI Frankston Annual Report to Meat and Livestock Australia and Australian Wool Innova-tion Pty Ltd.
Sagliocco, J.-L., Weiss, J. (2004). Importa-tion, establishment and preliminary impact assessment of Chamaesphecia mysiniformis (Lepidoptera: Sesiidae) for the biological control of horehound in Australia. Proceedings of the 14th Aus-tralian Weeds Conference, eds B.M. Sindel and S.B. Johnson, pp. 380-390. (Weed Society of New South Wales, Sydney).
Smyth, M. and Sheppard, A. (2002). Lon-gitarsus echii and its impact on Echium plantagineum (Paterson’s curse): the insect for the Mediterranean rainfall range of the weed? Proceedings of the 13th Australian Weeds Conference, eds H. Spafford Jacob, J. Dodd and J.H. Moore, pp. 422-5. (Plant Protection So-ciety of Western Australia, Perth).
Smyth M., Sheppard, A. and Huwer R.
(2004). The population and impact of Longitarsus echii Kock (Coleoptera:Chrysomelidae) a root feeding beetle on Echium plantagineum L. under field grazing conditions. Proceedings of the 14th Australian Weeds Conference, eds B.M. Sindel and S.B. Johnson, pp. 349-52. (Weeds Society of New South Wales, Sydney).
Swirepik, A.E. and Smyth, M.J. (2003) Evaluating biological control at the re-gional scale. In Improving the selection. testing and evaluation of weed biologi-cal control agents, eds H. Spafford Jacob and D.T. Briese, pp. 61-7. (CRC for Aus-tralian Weed Management, Adelaide, Australia).
Footnotes1 Department of Primary Industries, Vic-
toria.2 Not currently involved in bridal creep-
er research.3 No Victorian researcher are currently
involved in this project.
Docks (Rumex L. spp.), spear thistle and gorse are all weeds in Victoria on which biological control agents are established but about which knowledge of biological control impacts is insufficient to reliably judge if any benefits are accruing (e.g. Morley et al. 2004). Stakeholders in the management of weeds such as these and the Victorian community at large could benefit from further investment in study and publication of the biological control impacts on them.
AcknowledgementsThanks to Raelene Kwong, Jean-Louis Sagliocco and Robin Adair for helping to compile these notes.
ReferencesAdair, R.J. and Holtkamp, R.H. (1999).
Development of a pesticide exclusion technique for assessing the impact of biological control agents for Chrysanthe-moides monilifera. Biocontrol Science and Technology 9, 383-90.
Batchelor, K.L. and Woodburn, T.L. (2002). Population development and impact of the bridal creeper leafhopper Zygina sp. in Western Australia. Proceedings of the 13th Australian Weeds Conference, eds H. Spafford Jacob, J. Dodd and J.H. Moore, pp.381-384. (Plant Protection Society of Western Australia, Perth).
Delfosse, E.S. (2004). Introduction. In Bio-logical control of invasive plants in the United States’, eds Eric M. Coombs, Janet K. Clark, Gary L. Piper and Al-fred F. Cofrancesco Jr. pp. 1-11. (Oregon State University Press. Corvalis).
Holland Clift, S. and Kwong, R.M. (2004). Community involvement in biological control: towards the development of an improved evaluation model. Proceed-ings of the 14th Australian Weeds Con-ference, eds B.M Sindel and S.B. John-son, pp. 631-5. (Weed Society of New South Wales, Sydney).
Ireson, J.E., Davies, J.T., Kwong, R.M., Holloway, R.J. and Chatterton, W.S. (in press). Biological control of gorse, Ulex europaeus L. in Australia: Where to next? Proceedings of the Tasmani-an Weed Science Society Conference,
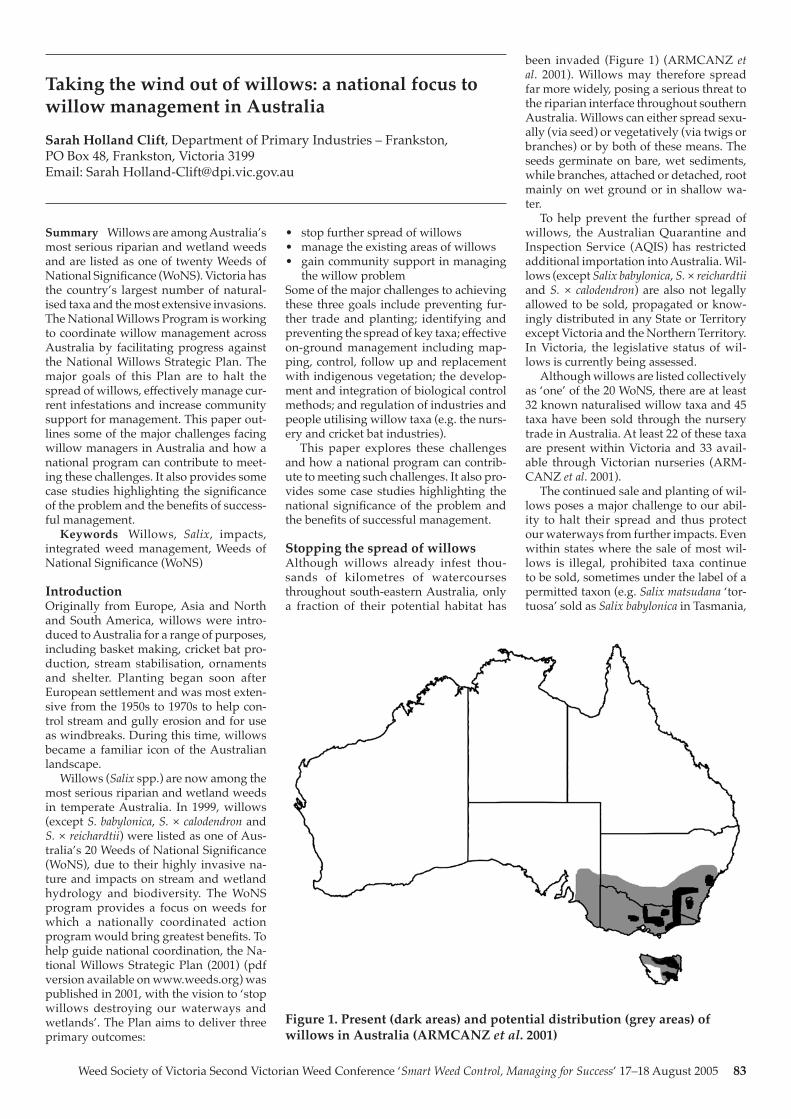
Weed Society of Victoria Second Victorian Weed Conference ‘Smart Weed Control, Managing for Success’ 17–18 August 2005 83
Summary Willows are among Australia’s most serious riparian and wetland weeds and are listed as one of twenty Weeds of National Significance (WoNS). Victoria has the country’s largest number of natural-ised taxa and the most extensive invasions. The National Willows Program is working to coordinate willow management across Australia by facilitating progress against the National Willows Strategic Plan. The major goals of this Plan are to halt the spread of willows, effectively manage cur-rent infestations and increase community support for management. This paper out-lines some of the major challenges facing willow managers in Australia and how a national program can contribute to meet-ing these challenges. It also provides some case studies highlighting the significance of the problem and the benefits of success-ful management.
Keywords Willows, Salix, impacts, integrated weed management, Weeds of National Significance (WoNS)
IntroductionOriginally from Europe, Asia and North and South America, willows were intro-duced to Australia for a range of purposes, including basket making, cricket bat pro-duction, stream stabilisation, ornaments and shelter. Planting began soon after European settlement and was most exten-sive from the 1950s to 1970s to help con-trol stream and gully erosion and for use as windbreaks. During this time, willows became a familiar icon of the Australian landscape.
Willows (Salix spp.) are now among the most serious riparian and wetland weeds in temperate Australia. In 1999, willows (except S. babylonica, S. × calodendron and S. × reichardtii) were listed as one of Aus-tralia’s 20 Weeds of National Significance (WoNS), due to their highly invasive na-ture and impacts on stream and wetland hydrology and biodiversity. The WoNS program provides a focus on weeds for which a nationally coordinated action program would bring greatest benefits. To help guide national coordination, the Na-tional Willows Strategic Plan (2001) (pdf version available on www.weeds.org) was published in 2001, with the vision to ‘stop willows destroying our waterways and wetlands’. The Plan aims to deliver three primary outcomes:
• stop further spread of willows• manage the existing areas of willows• gain community support in managing
the willow problemSome of the major challenges to achieving these three goals include preventing fur-ther trade and planting; identifying and preventing the spread of key taxa; effective on-ground management including map-ping, control, follow up and replacement with indigenous vegetation; the develop-ment and integration of biological control methods; and regulation of industries and people utilising willow taxa (e.g. the nurs-ery and cricket bat industries).
This paper explores these challenges and how a national program can contrib-ute to meeting such challenges. It also pro-vides some case studies highlighting the national significance of the problem and the benefits of successful management.
Stopping the spread of willowsAlthough willows already infest thou-sands of kilometres of watercourses throughout south-eastern Australia, only a fraction of their potential habitat has
been invaded (Figure 1) (ARMCANZ et al. 2001). Willows may therefore spread far more widely, posing a serious threat to the riparian interface throughout southern Australia. Willows can either spread sexu-ally (via seed) or vegetatively (via twigs or branches) or by both of these means. The seeds germinate on bare, wet sediments, while branches, attached or detached, root mainly on wet ground or in shallow wa-ter.
To help prevent the further spread of willows, the Australian Quarantine and Inspection Service (AQIS) has restricted additional importation into Australia. Wil-lows (except Salix babylonica, S. × reichardtii and S. × calodendron) are also not legally allowed to be sold, propagated or know-ingly distributed in any State or Territory except Victoria and the Northern Territory. In Victoria, the legislative status of wil-lows is currently being assessed.
Although willows are listed collectively as ‘one’ of the 20 WoNS, there are at least 32 known naturalised willow taxa and 45 taxa have been sold through the nursery trade in Australia. At least 22 of these taxa are present within Victoria and 33 avail-able through Victorian nurseries (ARM-CANZ et al. 2001).
The continued sale and planting of wil-lows poses a major challenge to our abil-ity to halt their spread and thus protect our waterways from further impacts. Even within states where the sale of most wil-lows is illegal, prohibited taxa continue to be sold, sometimes under the label of a permitted taxon (e.g. Salix matsudana ‘tor-tuosa’ sold as Salix babylonica in Tasmania,
Figure 1. Present (dark areas) and potential distribution (grey areas) of willows in Australia (ARMCANZ et al. 2001)
Taking the wind out of willows: a national focus to willow management in Australia
Sarah Holland Clift, Department of Primary Industries – Frankston, PO Box 48, Frankston, Victoria 3199 Email: Sarah [email protected]
84 Weed Society of Victoria Second Victorian Weed Conference ‘Smart Weed Control, Managing for Success’ 17–18 August 2005
Andrew Crane personal communication). In addition, willows have a remarkable ability to form hybrids, making accurate identification difficult (Cremer 1995). Al-most all willow taxa are capable of hybrid-ising with one or more other taxa (mostly within the same subgenus) if they flower simultaneously and fertile male and fe-male plants grow near enough for polli-nation to occur (Cremer 2001). While some resulting hybrids may not flourish, some have proved to be more invasive and there is potential for strains to develop that are even better adapted to local conditions within Australia (Cremer 2001). Even the iconic weeping willow (Salix babylonica), one of three taxa excluded from the WoNS listing, has the potential to hybridise with other willow taxa (e.g. S. matsudana x× alba and S. fragilis), with some of the resulting hybrids apparently more invasive than their parents (Cremer 2001).
An interesting example of willow hy-bridisation is the Kilmarnock Willow, which comprises a weeping pussy willow scion grafted onto an upright pussy wil-low rootstock. One such plant recently dis-covered in Tasmania comprised a female weeping scion grafted onto an upright male plant (Baker and Conod 2003). The upright male section had begun to sucker and catkin formation occurred simultane-ously on both sections of the plant. Seed collected from this plant was sown and successfully germinated (Baker and Con-od 2003). Seed from this plant may be the source of the recently discovered northern infestation of wild pussy willows in Tas-mania, found just 20 km to the west, but further research is needed to confirm this (Baker and Conod 2003). A similar or iden-tical product is for sale at some nurseries in Victoria, traded as Celtic Cascade®, Salix caprea ‘Pendula’, or Kilmarnock Willow. At one nursery it is advertised as ‘the plant you just can’t kill’.
The buying and planting of all wil-lows, including the three taxa not listed as WoNS, should always be approached with caution, given the ease with which they can hybridise and the potential for other-wise less invasive taxa to become more ag-gressive and unpredictable once hybridi-sation has occurred. It is therefore critical to ensure that compatible male and female plants are kept well away from each other to prevent the formation of viable seed.
The ability of willows to spread by seed highlights the national significance of the willow problem. Whereas vegetatively re-producing willows are generally confined to streams and are dispersed downstream, the great mobility of some seeding wil-lows requires that effective control be co-ordinated across regions and states. For example, Cremer (2003) observed that the seed of S. nigra (black willow) had spread up to 50–100 km in every direction from a site near Tumut in New South Wales since
it had been originally planted there 30 years earlier. In addition, Cremer (2003) observed that S. cinerea (grey sallow or wild pussy willow) seed can travel by air or water for tens of kilometres.
Such mobility provides these two seed-ing willows with the ability to move into streams and wetlands and other unex-pected environments. S. cinerea has proven to be extremely adaptable, invading just about any boggy and intermittently moist sites, anywhere from sea level to above the alpine tree line (Cremer 2003). For ex-ample, the first known population of S. cinerea seedlings to occur in Tasmania was recently discovered along a road cutting near Hobart (Matthew Baker personal communication). Areas where vegetative willows are being removed could also eas-ily be colonised by seeding willows if not adequately managed and rehabilitated. Infestations of seeding willows therefore urgently need to be identified and incor-porated into a national control strategy.
The spread of S. cinerea can be slow, as specific conditions are required for suc-cessful seed germination. However, while spread may appear restricted for many years, a catastrophic explosion may oc-cur at any time given the right conditions. Sites most likely to be invaded by S. cinerea are areas where bare, wet ground exists for a month following seed shed (around October/November) (Cremer 2001). Such conditions conducive to a population ex-plosion of S. cinerea occurred at Winge-carribee Swamp in southern New South Wales in August 1998 (Cremer 2001). Heavy rains resulted in canyons of ex-posed bare wet peat which were invaded by 100 000 S. cinerea seedlings in Novem-ber 1998 and a further 1 000 000 seedlings in November 1999.
Another more recent example has oc-curred in Victoria’s Alpine National Park. Major bushfires in early 2003 resulted in significant stands of native vegetation be-ing burnt. Subsequently, S. cinerea seedlings readily established in newly exposed moss beds. These beds form the initial collection and filtering point of a substantial part of Victoria’s water catchment. Invasion of S. cinerea therefore not only threatens the value of the National Park but threatens water quality throughout the catchment. It has been suggested that this may neces-sitate increased government spending on water quality infrastructure improvement to compensate for the loss of these alpine moss beds (Parke 2005). A rapid response program was established to control new seedlings and their parent plants through partnership between Parks Victoria, North East Catchment Management Authority, Mt Hotham and Falls Creek Alpine Resort Management Boards, Southern Hydro Pty Ltd. and 4WD Victoria. In one year of con-trol effort so far, it is estimated that more than 50 000 seedlings have been removed
and 50 km of mature willows controlled (Mandar Services Pty Ltd. 2005). Contin-ued follow up over a number of years is now required to ensure that all plants are removed.
Such case studies demonstrate the clear need for accurate identification and con-trol of the most invasive taxa, including early detection of and response to the es-tablishment of seedlings and new stems.
Manage the existing areas Effective and strategic management of willows is not a simple issue and needs to occur over many years as part of a broader program of riparian management and re-habilitation (ARMCANZ et al. 2001). Total eradication of willows is clearly not feasi-ble, due to the extent and number of infes-tations (Groves and Panetta 2002). There is therefore a need to establish clearly de-fined priorities for control of populations that focus on geographic areas and willow taxa. However, further information is still required on the extent, rate and pattern of spread and impacts of certain willows (e.g. seeding willows), in order to best prioritise which areas and taxa to target. Gaining such information is hindered by difficulty in identifying different species, varieties and hybrids and by the inaccessi-bility of some areas due to difficult terrain or ownership consideration. Willow man-agement also needs to be approached with the recognition of limited resources and within the constraints of funding bodies and funding periods. Identification and strategic planning, mapping and control of the most invasive willows are therefore the highest priorities in the national plan (ARMCANZ et al. 2001).
Numerous willow projects have been undertaken at local and regional scales across Victoria and Australia. While local management efforts are important, broad-ening the area of control to encompass ad-joining areas and catchments that are con-tributing propagation material would be of most benefit. In this case, partnerships between affected land managers, such as that described for the Alpine National Park project, is the only way to achieve the desired outcome. Otherwise, there is a high chance of reinvasion by willows, and control efforts and funding may therefore be wasted. In addition, a staged control ef-fort over many years is required, to allow the river to gradually adjust to the remov-al of willows. Willow control funds need to be managed to ensure monitoring and follow-up control occurs in treated areas in subsequent years, even if this means re-moving fewer willows in the short term.
Mechanical and chemical control meth-ods for willows have been developed over many years. There are now a number of methods to choose from, with the best op-tion dependent on the location, taxa and extent of the willow infestation. Given the
Weed Society of Victoria Second Victorian Weed Conference ‘Smart Weed Control, Managing for Success’ 17–18 August 2005 85
complex nature of rivers and the need to understand geomorphological, hydrologi-cal and ecological concepts when removing willows, willow control along rivers gener-ally requires expert advice from a number of specialists. Removal of mature willows generally also requires the help of an expe-rienced contractor, due to the operational hazards associated with their removal.
A national best management and case studies guide for willows is currently being compiled to assist managers in adopting best practices in different envi-ronments and situations. It will contain detailed information on biology, impacts and identification, options for manage-ment in various situations, relevant case studies, management protocols, national data sheets, mapping guidelines and ad-vice for funding applications. The guide is expected to be available free of charge in July 2006.
The recent arrival of the willow sawfly (Nematus oligospilus), and other potential organisms associated with willows, may shape future best management practice for willows. The willow sawfly was first found in Australia in Canberra in March 2004, and was already present in such high densities that, even if desired, eradication was not feasible. The sawfly is now well established in the ACT and surrounding areas and there have also been reports of its presence along the south coast of New South Wales, the Adelaide Hills of South Australia and in Keilor in Victoria (Eligio Bruzzese personal communication).
The arrival of the sawfly has already created some controversy, with specula-tion that it was deliberately introduced. It is not known, however, how this insect arrived in Australia – it has not been de-liberately introduced as part of any official biological control program. The sawfly has been present in New Zealand since 1997 and is now common across the country, having dispersed at a rate of approxi-mately 300 km per year. In New Zealand, the sawfly appears to be specific to certain willow taxa (Charles et al. 1999).
The potential severity and the dynam-ics of sawfly outbreaks in Australia are as yet largely unknown. However, it has already been observed on several willow taxa, including S. fragilis, S. matsudana and S. babylonica. By as early as January this year, the sawfly had almost completely de-foliated S. alba vitellina and S. fragilis trees at a site near Canberra Airport, while hav-ing minimal affect on nearby S. babylonica weeping willow (Lynton Bond personal communication). Work is currently being undertaken nationally to assess the distri-bution and status of the sawfly and other organisms associated with willows in Aus-tralia, with a view to understanding their impacts and facilitating the development of a broader range of willow management options than is currently available.
Gain community support Engendering support for the willow problem poses a major challenge to wil-low management in Australia due to the utilitarian and cultural values of willows. However, in order to prevent further spread and effectively manage current in-festations of problem willows, community support is desperately needed.
It is only over the last 20 years or so that the problems with willows have been broadly recognised, and now the same trusts and boards that originally advo-cated their use often conduct extensive willow removal operations (ARMCANZ et al. 2001). Given this relatively dramatic shift in waterway management, it is not surprising that people still advocate the planting of willows and/or resist their re-moval. After all, why should such a useful and beautiful tree so suddenly become a target for those wishing to rehabilitate the environment?
The reason for such a profound shift in perspective has been the mounting evi-dence of the impacts that willows cause to both aquatic and riparian environments and their ability to so readily and aggres-sively colonise new areas. Despite having been previously planted along waterways to combat bank instability, willows actu-ally form multitudes of stems that obstruct and divert floods and subsequently erode riverbanks, particularly along small, nar-row rivers (Cremer 1999). Being decidu-ous, willows produce dense shade cover during summer, drop all of their leaves in autumn and remain bare for the win-ter, compared with native evergreens that provide a constant, less dense shade cov-er and drop their leaves gradually year round. The dense summer shade cover of willows combined with their impen-etrable root system greatly inhibits both terrestrial and aquatic plant growth. In contrast to native trees, willows drop all of their leaves at once in autumn and the leaves break down more rapidly (Hladyz 2001). Such extreme variation in leaf cover and the pulse of nutrients entering the wa-ter can alter the temperature and oxygen content and subsequently cause changes to the primary production of algae (Lest-er et al. 1994) and to aquatic food webs (Glova and Sagar 1994, Read and Barmuta 1999).
A common misconception has been that willows provide good faunal habitat. Research has demonstrated that willows cause significant reductions in terrestrial and in-stream insects (Read and Barmuta 1999, Yeates and Barmuta 1999, Greenwood et al. 2004), platypus (Graeme Rooney per-sonal communication) and birds (Holland 2002) when compared with native trees and shrubs. In addition, Holland (2002) found that willow-lined reaches did not provide much better habitat for terrestrial birds than did cleared reaches.
Several angling groups have become involved with removal programs in order to create more favourable habitats for fish. For example, $165 000 in funds collected from angling licences in Victoria is being dedicated to willow removal along the banks of the Goulburn River near Thorn-ton in order to improve trout fisheries. The New South Wales Council of Freshwater Anglers has developed a ‘Willow Eradica-tion Policy’ for use in lobbying landhold-ers, local councils and State government. Numerous other groups are also working towards managing the problem in Aus-tralia. In Victoria, this includes numer-ous Landcare groups, Catchment Man-agement Authorities, local governments, State Government departments and local landholders.
Gaining such community support can lead to early identification of potentially threatening adult or seedling willows. This is critical to our ability to most effectively manage willows with the limited resources available. For example, S. cinerea and other seeding willows may be growing in dams, wetlands, drainage lines and any other place that happens to remain moist for the month following seed shed. Without the support and active participation of land-owners, it is extremely difficult to detect such plants out of sight of nearby roads.
A network of people who are able to identify, look out for and report on new outbreaks would be of great benefit to our ability to stop the spread of, and most effectively manage, current infestations. General community awareness of willow taxa has so far focussed on the most wide-spread willows in the context of large-scale removal programs. For example, crack willow (Salix fragilis) is widespread throughout Tasmania and Victoria and is widely recognised as an invasive plant, while other taxa are still highly valued. In southern New South Wales, there is greater awareness of the black willow (Sa-lix nigra), because a targeted eradication and awareness campaign has taken place. By working together and addressing wil-lows from a national perspective we can learn from the lessons of different states and regions and act on them before they become a problem.
ConclusionWillows pose a significant challenge to the conservation and rehabilitation of many of Australia’s temperate rivers and wet-lands. The number of different taxa and their ability to rapidly disperse and to hy-bridise complicates our ability to manage them, as does their utilitarian and cultural value. To most effectively manage willows across Australia, a national management focus is clearly required. For example, the great mobility of some seeding willows requires that effective control is coordi-nated across regions and States, as local
86 Weed Society of Victoria Second Victorian Weed Conference ‘Smart Weed Control, Managing for Success’ 17–18 August 2005
control will otherwise only be temporary. A national approach will help facilitate in-formation sharing amongst regions and States to more effectively manage infesta-tions and prevent spread into new areas. For a nationally coordinated effort to be a success, all landholders, Landcare groups, Catchment Management Authorities and public land managers need to work to-gether to reduce the impacts of willows and improve and protect the health of our waterways for the future.
AcknowledgementsThe National WoNS Coordinator for Wil-lows is funded by the Department of the Environment and Heritage and hosted by Department of Primary Industries, Victo-ria. I would like to thank Matthew Baker and Brooke Ryan for providing case stud-ies, Graeme Rooney and Andrew Crane for providing personal communications and Ian Faithfull, John Weiss, Bob Wilson and Andrew Crane for their review of this paper.
DedicationAustralian willow expert Kurt Cremer re-cently passed away. Kurt was the original champion of the willow cause, pushing willows into the national spotlight and leading the way in willow research in Aus-tralia. Anyone who has ever been involved with willows will know Kurt’s name and many knew him personally. His dedica-tion to willow research and assisting peo-ple in the management of willows across Australia was impressive. Kurt has left a great legacy, and will be greatly missed.
ReferencesAgriculture and Resource Management
Council of Australia and New Zealand (ARMCANZ), Australian and New Zealand Environment and Conserva-tion Council (ANZECC) and Forestry Ministers (FM), (2001). ‘Weeds of Na-tional Significance Willow (Salix taxa, excluding S. babylonica, S. × calodendron and S. × reichardtii) Strategic Plan’ (Na-tional Weeds Strategy Executive Com-mittee, Launceston). (pdf version at weeds.org.au).
Baker, M.L. and Conod, N. (2003). Wild pussy willows loose in Tasmania. Tas-weeds 21, 4-6.
Charles, J.G, Allan, D.J., Froud, K.J. and Fung, L.E. (1999). A guide to willow sawfly in New Zealand. Horticulture and Food Research Institute of New Zealand. www.hortnet.co.nz/publica-tions/guides/willow_sawfly/wsaw-fly.htm.
Cremer, K.W. (1995). Willow identifica-tion for river management in Australia. CSIRO Forestry, Technical Paper 3. 22 pp.
Cremer, K.W. (2001). ‘Wild pussy willow’ Salix cinerea – priorities for eradication.
CSIRO Publications. www.ffp.csiro.au/publicat/articles/willows.
Cremer, K.W. (2003). Introduced willows can become invasive pests in Australia. Biodiversity 4 (4), 17-24.
Glova, G.J. and Sagar, P.M. (1994). Com-parison of fish and macroinvertebrate standing stock in relation to riparian willows (Salix spp.) in three New Zea-land streams. New Zealand Journal of Ma-rine and Freshwater Research 28, 255-66.
Greenwood, H., O’Dowd, D.J. and Lake, P.S. (2004). Willow (Salix × rubens) inva-sion of the riparian zone: impacts on terrestrial arthropod abundance and diversity. Diversity and Distributions 10, 485-92.
Holland (2002). Impacts of willows on riparian bird assemblages along the Tarago River, West Gippsland, Victoria. Honours thesis, Monash University, Australia.
Hladyz, S. (2001). Invasion of the riparian zone by basket willow (Salix × rubens Schrank): impacts on leaf litter decom-position. Honours thesis, Monash Uni-versity, Australia.
Lester, P.J., Mitchell, S.F. and Scott, D. (1994). Effects of riparian willow trees (Salix fragilis) on macroinvertebrate densities in two small Central Otago, New Zealand, streams. New Zealand Journal of Marine and Freshwater Research 28, 267-76.
Mandar Services Pty Ltd (2005). Parks Victoria Bogong Management Unit wil-lows project final report to North East Catchment Management Authority. Prepared by Bob Jones, pp. 1-12.
Parke, G. (2005). Bogong willows extrac-tion. Trackwatch. Summer 30th Anniver-sary Ball Edition, pp. 5-6 (Four Wheel Drive Victoria).
Read, M.G. and Barmuta, L.A. (1999). Comparison of benthic communities adjacent to riparian native eucalypt and introduce willow vegetation. Freshwater Biology 42, 359-74.
Yeates, L.V. and Barmuta, L.A. (1999). The effects of willow and eucalypt leaves on feeding preference and growth of some Australian aquatic macroinvertebrates. Australian Journal of Ecology 24, 593-8.
Weed Society of Victoria Second Victorian Weed Conference ‘Smart Weed Control, Managing for Success’ 17–18 August 2005 87
Summary The biological control of Pa-terson’s curse program in Australia has pioneered ways to fast track the release and spread of biocontrol agents through-out temperate Australia. By setting up ex-tensive networks involving Landcare and farmer groups, Local Government, Pest Plant officers and hundreds of individual landowners, biocontrol agents have been released over a much wider area and in a shorter amount of time than would have been possible without such involvement. This paper uses the Victorian program to highlight the important role that commu-nity-based distribution networks can play in speeding up the success of biological control.
Keywords Biological control, Pater-son’s curse, Echium plantagineum, commu-nity groups.
IntroductionPaterson’s curse has been the subject of a biological control program since the 1970s, during which time a total of six insect spe-cies have been imported from Europe and released across temperate Australia (Swirepik et al. 2003). With a suite of bio-control agents available, coupled with the enthusiastic demand for biocontrol by the community, an excellent opportunity existed to develop a network of commu-nity groups to assist in distributing these agents as efficiently as possible.
In 1995, a national collaborative pro-gram was initiated involving research agencies from New South Wales, the Aus-tralian Capital Territory, Victoria, South Australia and Western Australia.
Over the past 10 years, this program has proven to be a highly successful model in demonstrating effective collaboration between research agencies in the develop-ment of a national, community-based net-work for the distribution of biological con-trol agents (Swirepik and Smyth 2002).
This paper focuses on the Victorian ex-perience, with particular emphasis on the development of the community network and its achievements in the release, moni-toring and redistribution of biocontrol agents for Paterson’s curse.
Materials and methodsProduction of agentsMost of the insects used for the initial re-leases in Victoria were reared at the insec-tary facilities at Department of Primary Industries (DPI) – Frankston using meth-ods similar to those described by Swirepik et al. (2003). Occasionally, top-up colonies were received from other cooperators if insufficient numbers were reared, and similarly, DPI provided colonies to other states when necessary.
Between 1995 to 1997 the focus of the Victorian program was on the mass rear-ing and release of the crown weevil, Mo-gulones larvatus which proved relatively easy to rear and were released in numbers of 100 adults per site.
In 1996 two further agents, the taproot flea beetle, Longitarsus echii and the root weevil, M. geographicus were added to the release program. The root weevil proved difficult rear in large numbers resulting in only a few releases being conducted each year. Releases of the pollen beetle, Meligeth-es planiusculus commenced in 1998. Anoth-er agent, the stem boring beetle, Phytoecia coerulescens was also approved for release in Australia, but proved to be a less dam-aging agent. This insect was only released at one site and was not incorporated into the mass-release program.
Community distribution networkThe formation of the community distri-bution network followed the three tiered model as described by Kwong (2003). Tier 1 represented the state coordination role, which was provided by the Paterson’s curse Project Officer. Tier 2, referred to as Nursery Site Coordinators, consisted of extension staff such as DPI Catchment Management Officers and community group facilitators. Their role was to plan and coordinate the implementation of biocontrol at a regional scale. The Nurs-ery Site Managers (Tier 3) represented the end-users, such as individual landholders and community groups. Their role in the program was to release biological control at a local level and to feed back informa-tion on the progress of agent releases up through the network.
The network participants required train-ing and resources, such as information
leaflets, kits and equipment, to undertake their respective roles. Nursery Site Coordi-nators (Tier 2) were trained through one-on-one contact with the Project Officer on how to select suitable nursery sites based on regional weed management priorities, and how to educate landholders about the role of biocontrol in integrated weed man-agement.
Nursery Site Managers (Tier 3) attended workshops and field days where hands-on training was provided on how to release the agents, look after the nursery sites and monitor agent survival and spread.
RedistributionAt the heart of the strategy was an annual series of Redistribution Field Days. These were conducted in spring, at sites where the agents were present in such large num-bers that thousands could be collected without risk of affecting the viability of the population. Landholders and other in-terested parties wishing to make a release would participate in a field day by helping to collect the agents using sweep nets or beating trays and mouth-aspiration devis-es called pooters. The participants would then return to their own properties with the insects they collected for release.
MonitoringEvaluating the progress of biocontrol agents was conducted at three levels as described by Swirepik et al. (2003). Level Three monitoring provided information on the establishment and spread of agents at all release sites. Nursery Site Manag-ers were encouraged to monitor their re-lease sites and feed this information back to the Project Officer. Level Two monitor-ing was conducted at sites where agents had become established and provided data on the population densities of the biocontrol agent and of Paterson’s curse. This information was used to determine when nursery sites were ready for redis-tribution. Level One monitoring was initi-ated at a long-term study site near Euroa in north-east Victoria and was designed to determine the impact of the biocontrol agents on Paterson’s curse populations (see Morley in this publication). Only Level Three monitoring was conducted as part of the community network program, while Level One and Level Two monitor-ing was conducted by DPI weed scientists (Morley 2004).
ResultsInvolving Landcare and other community groups in the redistribution process has led to a dramatic increase in the amount of releases being conducted (Table 1). All crown weevil releases prior to 1998 were conducted using laboratory-reared agents with 100 adults per release in autumn. Crown weevil redistribution resulted in 124 new sites being established in just
Using community-based networks for the distribution of biological control agents for Paterson’s curse in Victoria
Kerry L. Roberts and Raelene M. Kwong, Department of Primary Industries, PO Box 48, Frankston, Victoria 3199
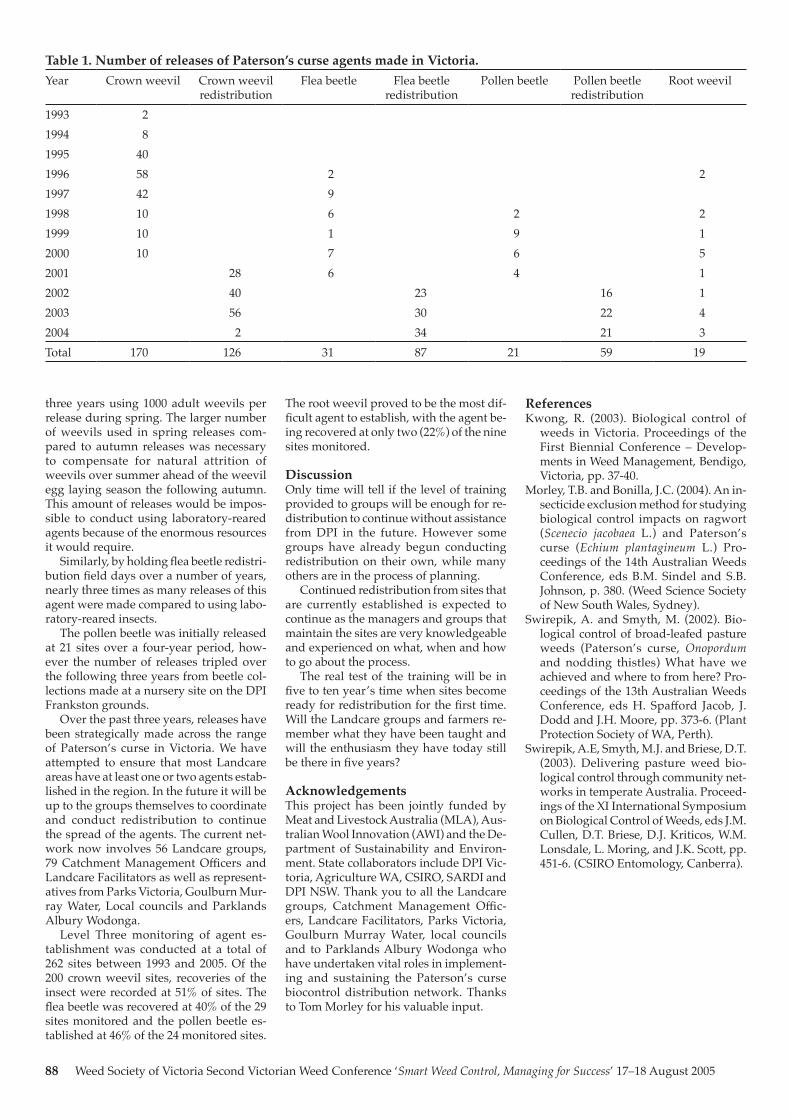
88 Weed Society of Victoria Second Victorian Weed Conference ‘Smart Weed Control, Managing for Success’ 17–18 August 2005
three years using 1000 adult weevils per release during spring. The larger number of weevils used in spring releases com-pared to autumn releases was necessary to compensate for natural attrition of weevils over summer ahead of the weevil egg laying season the following autumn. This amount of releases would be impos-sible to conduct using laboratory-reared agents because of the enormous resources it would require.
Similarly, by holding flea beetle redistri-bution field days over a number of years, nearly three times as many releases of this agent were made compared to using labo-ratory-reared insects.
The pollen beetle was initially released at 21 sites over a four-year period, how-ever the number of releases tripled over the following three years from beetle col-lections made at a nursery site on the DPI Frankston grounds.
Over the past three years, releases have been strategically made across the range of Paterson’s curse in Victoria. We have attempted to ensure that most Landcare areas have at least one or two agents estab-lished in the region. In the future it will be up to the groups themselves to coordinate and conduct redistribution to continue the spread of the agents. The current net-work now involves 56 Landcare groups, 79 Catchment Management Officers and Landcare Facilitators as well as represent-atives from Parks Victoria, Goulburn Mur-ray Water, Local councils and Parklands Albury Wodonga.
Level Three monitoring of agent es-tablishment was conducted at a total of 262 sites between 1993 and 2005. Of the 200 crown weevil sites, recoveries of the insect were recorded at 51% of sites. The flea beetle was recovered at 40% of the 29 sites monitored and the pollen beetle es-tablished at 46% of the 24 monitored sites.
The root weevil proved to be the most dif-ficult agent to establish, with the agent be-ing recovered at only two (22%) of the nine sites monitored.
DiscussionOnly time will tell if the level of training provided to groups will be enough for re-distribution to continue without assistance from DPI in the future. However some groups have already begun conducting redistribution on their own, while many others are in the process of planning.
Continued redistribution from sites that are currently established is expected to continue as the managers and groups that maintain the sites are very knowledgeable and experienced on what, when and how to go about the process.
The real test of the training will be in five to ten year’s time when sites become ready for redistribution for the first time. Will the Landcare groups and farmers re-member what they have been taught and will the enthusiasm they have today still be there in five years?
AcknowledgementsThis project has been jointly funded by Meat and Livestock Australia (MLA), Aus-tralian Wool Innovation (AWI) and the De-partment of Sustainability and Environ-ment. State collaborators include DPI Vic-toria, Agriculture WA, CSIRO, SARDI and DPI NSW. Thank you to all the Landcare groups, Catchment Management Offic-ers, Landcare Facilitators, Parks Victoria, Goulburn Murray Water, local councils and to Parklands Albury Wodonga who have undertaken vital roles in implement-ing and sustaining the Paterson’s curse biocontrol distribution network. Thanks to Tom Morley for his valuable input.
Table 1. Number of releases of Paterson’s curse agents made in Victoria.Year Crown weevil Crown weevil
redistributionFlea beetle Flea beetle
redistributionPollen beetle Pollen beetle
redistributionRoot weevil
1993 21994 81995 401996 58 2 21997 42 91998 10 6 2 21999 10 1 9 12000 10 7 6 52001 28 6 4 12002 40 23 16 12003 56 30 22 42004 2 34 21 3Total 170 126 31 87 21 59 19
ReferencesKwong, R. (2003). Biological control of
weeds in Victoria. Proceedings of the First Biennial Conference – Develop-ments in Weed Management, Bendigo, Victoria, pp. 37-40.
Morley, T.B. and Bonilla, J.C. (2004). An in-secticide exclusion method for studying biological control impacts on ragwort (Scenecio jacobaea L.) and Paterson’s curse (Echium plantagineum L.) Pro-ceedings of the 14th Australian Weeds Conference, eds B.M. Sindel and S.B. Johnson, p. 380. (Weed Science Society of New South Wales, Sydney).
Swirepik, A. and Smyth, M. (2002). Bio-logical control of broad-leafed pasture weeds (Paterson’s curse, Onopordum and nodding thistles) What have we achieved and where to from here? Pro-ceedings of the 13th Australian Weeds Conference, eds H. Spafford Jacob, J. Dodd and J.H. Moore, pp. 373-6. (Plant Protection Society of WA, Perth).
Swirepik, A.E, Smyth, M.J. and Briese, D.T. (2003). Delivering pasture weed bio-logical control through community net-works in temperate Australia. Proceed-ings of the XI International Symposium on Biological Control of Weeds, eds J.M. Cullen, D.T. Briese, D.J. Kriticos, W.M. Lonsdale, L. Moring, and J.K. Scott, pp. 451-6. (CSIRO Entomology, Canberra).
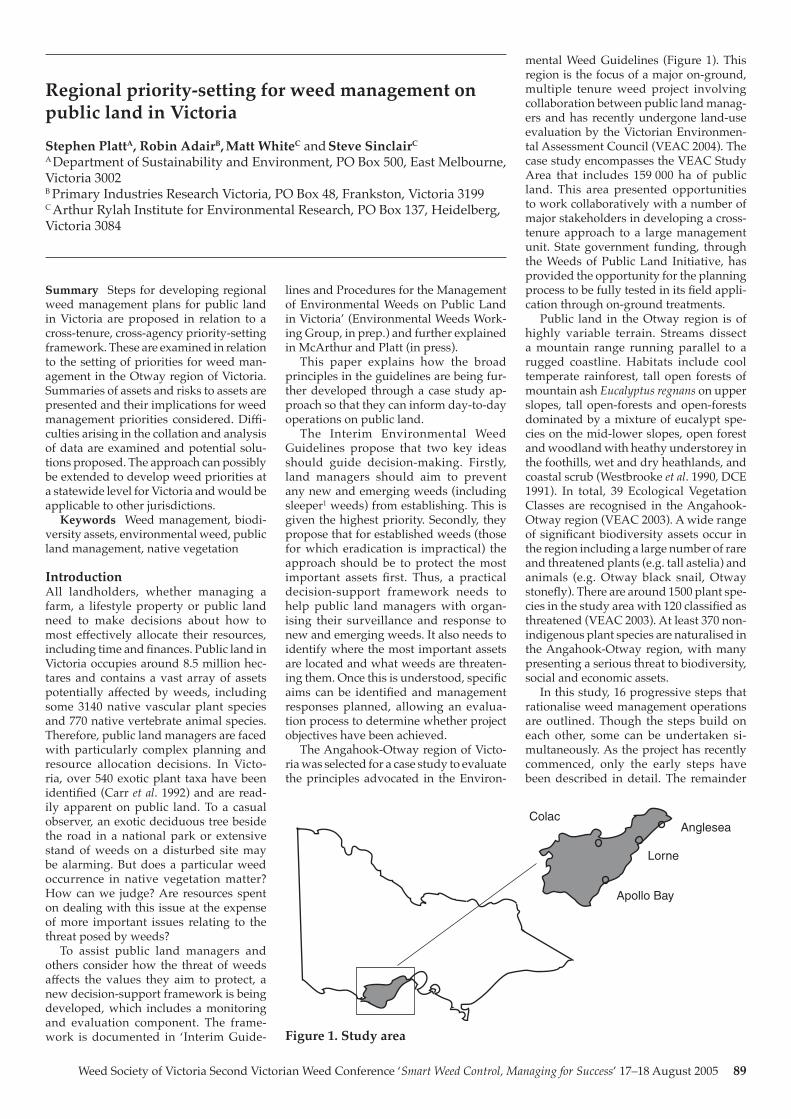
Weed Society of Victoria Second Victorian Weed Conference ‘Smart Weed Control, Managing for Success’ 17–18 August 2005 89
Summary Steps for developing regional weed management plans for public land in Victoria are proposed in relation to a cross-tenure, cross-agency priority-setting framework. These are examined in relation to the setting of priorities for weed man-agement in the Otway region of Victoria. Summaries of assets and risks to assets are presented and their implications for weed management priorities considered. Diffi-culties arising in the collation and analysis of data are examined and potential solu-tions proposed. The approach can possibly be extended to develop weed priorities at a statewide level for Victoria and would be applicable to other jurisdictions.
Keywords Weed management, biodi-versity assets, environmental weed, public land management, native vegetation
IntroductionAll landholders, whether managing a farm, a lifestyle property or public land need to make decisions about how to most effectively allocate their resources, including time and finances. Public land in Victoria occupies around 8.5 million hec-tares and contains a vast array of assets potentially affected by weeds, including some 3140 native vascular plant species and 770 native vertebrate animal species. Therefore, public land managers are faced with particularly complex planning and resource allocation decisions. In Victo-ria, over 540 exotic plant taxa have been identified (Carr et al. 1992) and are read-ily apparent on public land. To a casual observer, an exotic deciduous tree beside the road in a national park or extensive stand of weeds on a disturbed site may be alarming. But does a particular weed occurrence in native vegetation matter? How can we judge? Are resources spent on dealing with this issue at the expense of more important issues relating to the threat posed by weeds?
To assist public land managers and others consider how the threat of weeds affects the values they aim to protect, a new decision-support framework is being developed, which includes a monitoring and evaluation component. The frame-work is documented in ‘Interim Guide-
lines and Procedures for the Management of Environmental Weeds on Public Land in Victoria’ (Environmental Weeds Work-ing Group, in prep.) and further explained in McArthur and Platt (in press).
This paper explains how the broad principles in the guidelines are being fur-ther developed through a case study ap-proach so that they can inform day-to-day operations on public land.
The Interim Environmental Weed Guidelines propose that two key ideas should guide decision-making. Firstly, land managers should aim to prevent any new and emerging weeds (including sleeper1 weeds) from establishing. This is given the highest priority. Secondly, they propose that for established weeds (those for which eradication is impractical) the approach should be to protect the most important assets first. Thus, a practical decision-support framework needs to help public land managers with organ-ising their surveillance and response to new and emerging weeds. It also needs to identify where the most important assets are located and what weeds are threaten-ing them. Once this is understood, specific aims can be identified and management responses planned, allowing an evalua-tion process to determine whether project objectives have been achieved.
The Angahook-Otway region of Victo-ria was selected for a case study to evaluate the principles advocated in the Environ-
mental Weed Guidelines (Figure 1). This region is the focus of a major on-ground, multiple tenure weed project involving collaboration between public land manag-ers and has recently undergone land-use evaluation by the Victorian Environmen-tal Assessment Council (VEAC 2004). The case study encompasses the VEAC Study Area that includes 159 000 ha of public land. This area presented opportunities to work collaboratively with a number of major stakeholders in developing a cross-tenure approach to a large management unit. State government funding, through the Weeds of Public Land Initiative, has provided the opportunity for the planning process to be fully tested in its field appli-cation through on-ground treatments.
Public land in the Otway region is of highly variable terrain. Streams dissect a mountain range running parallel to a rugged coastline. Habitats include cool temperate rainforest, tall open forests of mountain ash Eucalyptus regnans on upper slopes, tall open-forests and open-forests dominated by a mixture of eucalypt spe-cies on the mid-lower slopes, open forest and woodland with heathy understorey in the foothills, wet and dry heathlands, and coastal scrub (Westbrooke et al. 1990, DCE 1991). In total, 39 Ecological Vegetation Classes are recognised in the Angahook-Otway region (VEAC 2003). A wide range of significant biodiversity assets occur in the region including a large number of rare and threatened plants (e.g. tall astelia) and animals (e.g. Otway black snail, Otway stonefly). There are around 1500 plant spe-cies in the study area with 120 classified as threatened (VEAC 2003). At least 370 non-indigenous plant species are naturalised in the Angahook-Otway region, with many presenting a serious threat to biodiversity, social and economic assets.
In this study, 16 progressive steps that rationalise weed management operations are outlined. Though the steps build on each other, some can be undertaken si-multaneously. As the project has recently commenced, only the early steps have been described in detail. The remainder
Regional priority-setting for weed management on public land in Victoria
Stephen PlattA, Robin AdairB, Matt WhiteC and Steve SinclairC
A Department of Sustainability and Environment, PO Box 500, East Melbourne, Victoria 3002B Primary Industries Research Victoria, PO Box 48, Frankston, Victoria 3199C Arthur Rylah Institute for Environmental Research, PO Box 137, Heidelberg, Victoria 3084
ColacAnglesea
Lorne
Apollo Bay
Figure 1. Study area
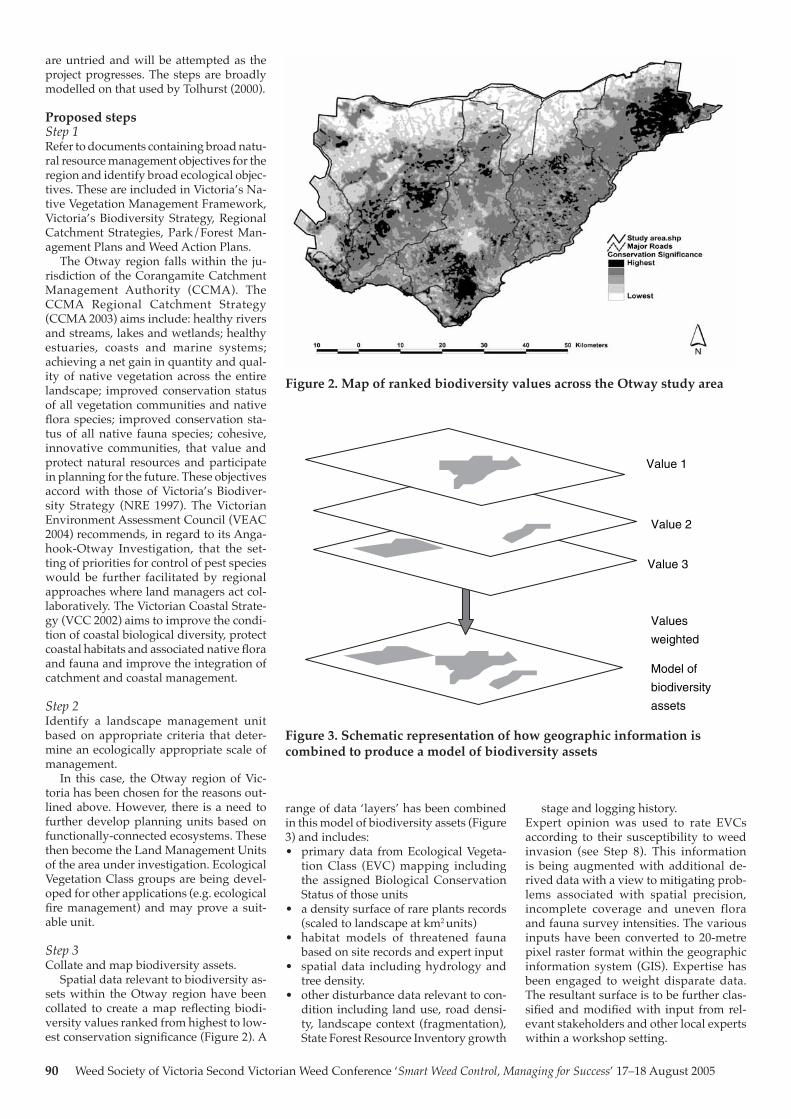
90 Weed Society of Victoria Second Victorian Weed Conference ‘Smart Weed Control, Managing for Success’ 17–18 August 2005
are untried and will be attempted as the project progresses. The steps are broadly modelled on that used by Tolhurst (2000).
Proposed stepsStep 1Refer to documents containing broad natu-ral resource management objectives for the region and identify broad ecological objec-tives. These are included in Victoria’s Na-tive Vegetation Management Framework, Victoria’s Biodiversity Strategy, Regional Catchment Strategies, Park/Forest Man-agement Plans and Weed Action Plans.
The Otway region falls within the ju-risdiction of the Corangamite Catchment Management Authority (CCMA). The CCMA Regional Catchment Strategy (CCMA 2003) aims include: healthy rivers and streams, lakes and wetlands; healthy estuaries, coasts and marine systems; achieving a net gain in quantity and qual-ity of native vegetation across the entire landscape; improved conservation status of all vegetation communities and native flora species; improved conservation sta-tus of all native fauna species; cohesive, innovative communities, that value and protect natural resources and participate in planning for the future. These objectives accord with those of Victoria’s Biodiver-sity Strategy (NRE 1997). The Victorian Environment Assessment Council (VEAC 2004) recommends, in regard to its Anga-hook-Otway Investigation, that the set-ting of priorities for control of pest species would be further facilitated by regional approaches where land managers act col-laboratively. The Victorian Coastal Strate-gy (VCC 2002) aims to improve the condi-tion of coastal biological diversity, protect coastal habitats and associated native flora and fauna and improve the integration of catchment and coastal management.
Step 2Identify a landscape management unit based on appropriate criteria that deter-mine an ecologically appropriate scale of management.
In this case, the Otway region of Vic-toria has been chosen for the reasons out-lined above. However, there is a need to further develop planning units based on functionally-connected ecosystems. These then become the Land Management Units of the area under investigation. Ecological Vegetation Class groups are being devel-oped for other applications (e.g. ecological fire management) and may prove a suit-able unit.
Step 3Collate and map biodiversity assets.
Spatial data relevant to biodiversity as-sets within the Otway region have been collated to create a map reflecting biodi-versity values ranked from highest to low-est conservation significance (Figure 2). A
range of data ‘layers’ has been combined in this model of biodiversity assets (Figure 3) and includes:• primary data from Ecological Vegeta-
tion Class (EVC) mapping including the assigned Biological Conservation Status of those units
• a density surface of rare plants records (scaled to landscape at km2 units)
• habitat models of threatened fauna based on site records and expert input
• spatial data including hydrology and tree density.
• other disturbance data relevant to con-dition including land use, road densi-ty, landscape context (fragmentation), State Forest Resource Inventory growth
stage and logging history. Expert opinion was used to rate EVCs according to their susceptibility to weed invasion (see Step 8). This information is being augmented with additional de-rived data with a view to mitigating prob-lems associated with spatial precision, incomplete coverage and uneven flora and fauna survey intensities. The various inputs have been converted to 20-metre pixel raster format within the geographic information system (GIS). Expertise has been engaged to weight disparate data. The resultant surface is to be further clas-sified and modified with input from rel-evant stakeholders and other local experts within a workshop setting.
Value 1
Value 3
Model of
biodiversity
assets
Value 2
Values
weighted
Figure 2. Map of ranked biodiversity values across the Otway study area
Figure 3. Schematic representation of how geographic information is combined to produce a model of biodiversity assets
Weed Society of Victoria Second Victorian Weed Conference ‘Smart Weed Control, Managing for Success’ 17–18 August 2005 91
Step 4Collate and map social and economic as-sets of significant value, likely to be at risk from environmental weeds.
Geospatial datasets for these values on public land in a format useful for identify-ing those assets at risk from weeds are yet to be developed. Therefore, it is proposed that an expert panel of stakeholders will collate the information for the Otway case study.
Step 5Identify potential sources of introduc-tion and pathways of weed spread. This step can be undertaken concurrently with Steps 2–4.
At the present time, analysis of data on weed sources and a model of weed spread/invasion within the study area is unavail-able and beyond the scope of this project. However, data on the coincidence of po-tential new and emerging weeds, such as known weed hotspots, towns, roads, rub-bish tips, ornamental and trial plantations, can be collated. This information will then contribute to the surveillance component of the management plan. The Weed Alert Rapid Response Plan Victoria (DPI 2005) deals in detail with the issue of new and emerging weeds. Complementary activi-ties in the WARR Plan include establishing and maintaining a network of ‘weed spot-ters’ and rapid response teams to manage emergency weed issues.
Step 6Using available data, collate and map weed distribution records. Classify weeds as new and emerging/sleeper or estab-lished.
A census of the exotic plant flora and their distribution is the basis for develop-ment of weed management priorities and its application within a framework of pro-tection of biodiversity assets. In Victoria, four main databases are available for ex-amining weed records: • Flora Information Systems (FIS), the
centralised database of the Department of Sustainability and Environment (DSE);
• Environmental Information System (EIS), the management database used by Parks Victoria;
• Integrated Pest Management System (IPMS), used by Department of Prima-ry Industries principally for noxious weed data; and
• State Forests Resource Inventory (SFRI), a natural resource database used by DSE for forest stewardship planning.
In the Otway region, close to 371 species2 of exotic plants are known from 7991 cas-es, approximately 17% of Victoria’s exotic flora (75% of records used were located in the FIS making it the main source of data). Distribution records covered most of the region, but were concentrated in areas
along the coastal fringe and a central band running NE-SW covering a diverse range of land use types.
Government database records are being augmented by spatial weed occurrence knowledge held by community organisa-tions and individuals in the study region, following a targeted request for informa-tion. Significant weed species likely to oc-cur in the Otway region, but absent from government databases were the focus of this survey (Appendix 1), together with any weed records from defined areas of biodiversity importance. This process is currently underway and its value is yet to be evaluated.
Datasets could not be used to accurately determine the abundance status of weed species in the study area, as weed case numbers were biased by collection his-tories. The noxious biennial herb Senecio jacobaea had the highest number of records (1285 cases), but is a weed of agriculture or disturbed native vegetation in the region, and has limited ecological impact. In con-trast, a widely distributed and abundant weed Hypocheris radicata had relatively few records (419 cases). Local knowledge and further survey input are required to accurately ascertain the abundance status of key environmental weeds in the study area, and particularly in areas of high bio-diversity importance. Rapid vegetation survey techniques that initially focus on areas with a high probability of weed oc-currence are recommended.
Step 7Supplement and verify weed occurrence and distribution with field surveys, espe-cially at and in the vicinity of priority bio-diversity assets.
Weed management decisions should be made using data that accurately reflect ac-tual status of weed occurrence and abun-dance in landscape management units. De-cisions based on poor data-sets are likely to fail in meeting ecological outcomes. In the Otway case study, the adequacy of as-sessing weed occurrence using the State’s principal databases was determined by undertaking weed surveys in five areas of high biodiversity importance. The ar-eas surveyed were Parker River (Otway National Park), Carlisle heathlands (Ot-way National Park), Tomahawk Creek Na-ture Reserve, Bald Hills-Angahook forest (Otway National Park), and Carpendeit Nature Reserve. In all cases, new records of weeds with potential moderate to high ecological impact and high ranking scores were located. Nearly all records were in the early invasion stages, and therefore likely to have been missed in previous data collection or survey exercises. While few new weed species to the study area were located in the five survey areas of biodiversity importance, the presence of unrecorded, significant environmental
weeds at the landscape management unit scale highlighted the need for more de-tailed weed distribution data.
While existing databases provide a general overview of weed records in the region, they are insufficiently detailed to provide large-scale mapping data required for effective management decisions. In the Otway case study, additional survey input using rapid vegetation survey techniques will improve the credibility status of ex-isting databases, particularly for new and emerging weeds in areas of high biodiver-sity importance.
Step 8To the extent possible, identify the relative risk/threat that each species/group poses to environmental assets.
Weed species were ranked using a se-ries of weighted criteria to produce classes of weeds grouped according to their threat to native vegetation integrity in the region. This system was modified from White and Carr (2001), where weeds of the alpine re-gion at Falls Creek were ranked. Weighting criteria listed according to importance are: invasiveness (establishes in native vegeta-tion or not), ecological impact (high, me-dium, low); distribution currently occu-pied (extensive, moderate, limited); range of ecological vegetation classes suscepti-ble to invasion (high, medium, low); and rate of dispersal (rapid, moderate, slow). The ranking system allocated scores be-tween 1 and 81. Weeds with the higher ecological impact received lower scores than those with negligible ecological im-pacts. Weeds were grouped into classes of (I) high impact weeds (score 1–10), (ii) weeds of importance (scores 11–30) (iii) weeds of concern (scores 31–50) (iv) mi-nor weeds (scores 51–70) (v) weeds of least significance (scores 71–81) (Appendix 2).
The remaining proposed steps are yet to be undertaken in the Otway case study. Thus, there is no indication of their cur-rent status.
Step 9On the basis of the known assets and
perceived weed threats, set the more spe-cific ecological management objectives (eg. ‘to conserve the grassy woodlands against the threat of (name high impact weeds)’) for the management unit.
Step 10Prioritise sites according to the framework described above and identify areas on the ground that are candidates for manage-ment of the threat of weeds. Pay particular attention to sources of new and emerging weeds and opportunities for co-ordinating activities between private and public land (largely covered by the Good Neighbour Program (NRE 2002).
92 Weed Society of Victoria Second Victorian Weed Conference ‘Smart Weed Control, Managing for Success’ 17–18 August 2005
Step 11Assess the practicality of achieving the required ecological objective. This should also consider issues such as the causes of vegetation decline, the feasibility of weed management, the community interest, ca-pacity and commitment to contribute to the project and the likelihood of re-inva-sion.
Step 12Define specific site objectives of environ-mental weed management (compare with the ecological management objectives) and performance indicators based on Specific, Measurable, Achievable, Relevant and Time-framed (SMART) principles (Platt 2002) and record these in the site plan. For example, an ecological objective at the site level might be ‘to maintain natural proc-esses within the grassland ecosystem lead-ing to a minimum of three viable popula-tions of Diuris fragrantissima by reducing the threat from *Nassella neesiana and *Vul-pia bromoides by January 2010’.
Step 13Document the results of the above steps and incorporate in appropriate plans (eg. Park/Forest Management plans, Weed Action Plans).
Step 14Design a management process that will deal with the causes of risks at priority sites.
Step 15Undertake the management actions, re-cording biodiversity asset condition be-fore, during, and after treatment according to monitoring and evaluation procedures. These procedures should be designed to accommodate the needs of adaptive man-agement of landscape management units and target a range of environmental assets but particularly the key assets identified as important.
Step 16Evaluate the results against the specific management objectives. Return to Step 3 and if necessary update and repeat.
DiscussionThis paper describes a project that aims to develop an operations plan for pub-lic land managers that is independent of land tenure and based on a set of accepted management principles for reducing the threat of weeds. In achieving this, large and complex information about the val-ues on public land needs to be considered. Progress to date has shown that there is great potential to use GIS-based models to help plan for both prevention of new and emerging weeds and to identify key areas containing important assets that can be protected against the threat posed by
established weeds. The areas derived from the GIS model have been checked against the expectations of local stakeholders and generally correspond with their views. Using geographic information systems to support decision-making has a number of advantages including the ability to deal with spatially complex data, objectivity, a capacity to provide transparency (the process is open to scrutiny), and adjust-able weightings.
The model developed for ranking as-sets (Steps 3 and 4) attempts to represent a range of values humans place on the natu-ral world. These values are not fixed at-tributes. In developing the model, values have been captured through existing proc-esses, such as the value given to threatened species. Values are also being captured through discussions with stakeholders and the community over the weightings given to the various inputs used in devel-oping the model and in understanding the criteria they use to allocate value. The map produced as a result of the model is highly sensitive to the weightings given to particular components. For example, whether the conservation status of the vegetation type is given equal or higher/lower weight than the threatened species surface. The environment in which the model is built enables an iterative process that can be run again as further informa-tion becomes available or as community values change. Thus the process should be seen as dynamic and facilitating exchange of views about values and their expression in the landscape.
Though progress has been made, prob-lems with the adequacy of datasets have arisen. Whilst in Victoria valuable data-sets for identifying biodiversity assets are available, similar datasets for assessing social and economic assets at risk from weeds have not yet been identified. Deci-sion-making processes based on data are heavily reliant on the quality and repre-sentativeness of the data. Though support-ed by some of the leading information sys-tems in the country, data limitations have already become obvious. Whilst around 371 species of weeds are recorded on gov-ernment databases for the Otway case study area, a further 66 species expected to occur in the Otways are not recorded. Tar-geted surveys indicate many unrecorded weeds occur in areas of high biodiversity importance. Processes for increasing the flow of weed data are under discussion. The issues associated with data availabil-ity and adequacy need to be addressed in the future management of the threat of weeds in the Otway region.
Whilst it has been possible to rank bio-diversity assets relative to each other, it is less clear what advice can be offered to land managers having to make choices across environmental, social and econom-ic asset classes. There are currently no
frameworks available to guide decision-making where assets must be compared across classes. For example, guidance when a land manager must decide wheth-er resources be put toward conservation of an area of native vegetation versus an recreational asset, such as a picnic area. A system that ranks all assets in an unbiased way would be beneficial in making such decisions. The ecosystem services concept, which attempts to allocate economic value to a wide range of services provided by nature (and thus a common currency for comparing assets) may be valuable in re-solving this issue in the future. Whilst this issue is beyond the scope of the current project, by providing data-rich mapping products, land managers utilising the re-sults of this case study will be in a position to interrogate the various attributes that confer priority on a place.
During the development of the Interim Guidelines it became apparent that pre-vention of new and emerging weeds re-quires a weed-led approach. That is, for new and emerging weeds it is necessary for the land manager to go to where the weed is and apply treatments. Whereas, for established weeds, the focus is on managing weeds at a particular location (a site-led approach). From the perspec-tive of management activity, this is an im-portant distinction. Typically, most weed management tends to focus on the weed, rather than the assets or values at risk from weeds and thereby risks losing the purpose of the activity. Focussing on the prevention aspect of a weed led approach means that not all weed occurrences need to draw attention during surveillance ac-tivities, just the subset of new and emerg-ing weeds.
A major benefit of an asset-based ap-proach to the threat posed by estab-lished weeds is that the places identified as a priority for management action are also sites of biodiversity importance and likely to correspond with other natural resource management activity. This helps to facilitate an integrated approach to a site whereby a number of threats can be addressed simultaneously in order to maintain functionality of the ecosystem. Focussing on the asset rather than the suite of established weeds provides a clear fo-cus for the land manager when dealing with established weeds.
This process does not presuppose the appropriate management approaches but rather enables management to be focussed on addressing a particular threat. The man-agement tools applied need to be based on addressing the causes of weed invasion. For example, reducing potential sources of weed spread into native vegetation may involve closing a walking track. Reduc-ing soil disturbance (potentially leading to weed invasion) might involve chang-ing procedures for road making. Use of
Weed Society of Victoria Second Victorian Weed Conference ‘Smart Weed Control, Managing for Success’ 17–18 August 2005 93
chemical herbicides should be considered in the wider context of the management objectives and tools available.
A Regional Working Group assisting the project, comprising representatives of the major public land stakeholders, has proven invaluable in validating and fine-tuning the methodology, in assigning weightings and assisting in networking with the wider community.
The Interim Guidelines place a strong emphasis on achieving outcomes for the protection or improvement in quality of biodiversity assets. A prerequisite for identifying meaningful outcomes is to set clear objectives. The steps described above aim to provide the information required for an explicit statement of objectives. For example, once the values at a particular site are known and the specific risks iden-tified then the objective is around protect-ing those particular values.
Protocols for monitoring biodiversity and weed occurrences at sites are reason-ably well understood and documented. However, our understanding of what is happening at a landscape scale requires further development. The Otway case study aims to develop a set of indicators applicable at the broad level of under-standing. For example, by asking whether the threat from weeds is increasing or de-creasing at a land management unit scale. This will be done at a later stage of the project. Greater understanding of the actu-al, rather than assumed, impact of weeds on biodiversity assets is also urgently re-quired (Adair and Groves 1998).
The processes articulated above are rel-evant to other bioregions in Victoria. The project aims ultimately to broaden its anal-ysis, based on the experiences gained in the Otway case study, to assist in identify-ing weed management priorities on public land at the statewide level.
Interstate and internationally, weed invasions are regarded as one of the key threats to natural ecosystems on pub-lic lands (Holzner et al. 1983, Lake and Lieshman 2004). In line with the approach proposed in the Interim Guidelines, pre-vention is seen to be the most effective approach. However, in many jurisdic-tions, the emphasis is on a weed-led ap-proach to all weed occurrences without a complimentary asset-based approach as described in this paper. Public educa-tion and coalitions of stakeholders aim-ing to prevent weeds from public lands affecting private lands are also common. However, there are few cases of a strategic approach to environmental weeds on pub-lic land. In Western Australia, an environ-mental weed strategy has been prepared that recognises weed-led and site-led approaches but stops short of explicitly defining the steps for achieving this in a practical, operational, framework (CALM 1999).
Though yet to be fully tested and as-sessed, the approach being used in the Otway case study promises to deliver a transparent and thorough new approach to dealing with weed threats that enables resources to be better targeted. It will also provide an opportunity to determine with greater precision whether management actions are achieving desired outcomes.
AcknowledgementsThe authors wish to thank members of the Otway Weed Project Regional Working Group and Environmental Weeds Work-ing Group for their contributions to dis-cussions relevant to this paper. Dr Robert Begg provided helpful comments on the draft manuscript. Funding for this project is provided by the Victorian Government’s ‘Weeds and Pests on Public Land Initia-tive’.
We also acknowledge the contributions of John Weiss and David Cheal to this project including data extraction, ranking weed ‘seriousness’ and EVC susceptibility.
ReferencesAdair, R.J. and Groves, R.H., (1998). Im-
pact of environmental weeds on biodi-versity: a review and development of a methodology. Environment Australia, Canberra.
CALM (1999). Environmental Weed Strat-egy for Western Australia. Department of Conservation and Land Manage-ment, Western Australia.
Carr, G.W., Yugovic, J.V. and Robinson, K.E. (1992). Environmental weed invasions in Victoria—conservation and manage-ment implications. Department of Con-servation and Environment, Victoria and Ecological Horticulture Pty Ltd.
CCMA (2003). Corangamite Regional Catchment Strategy 2003-2008. Coran-gamite Catchment Management Au-thority, Colac.
DCE (1991). Proposed Forest Management Plan for the Otway Forest Management Area. Department of Conservation and Environment, Melbourne.
DPI (2005). Weed Alert Rapid Response Plan Victoria: a surveillance and re-sponse plan for potential, new and emerging weeds in Victoria 2004–2005. Department of Primary Industries, Melbourne.
Holzner, W. Werger, M.G.A. and Ikasima, J. (eds.) (1983). ‘Man’s impact on veg-etation’, (Dr W. Junk, The Hague).
Lake, J.C. and Leishman, M.R., (2004). Invasion success of invasive plants in natural ecosystems: the role of distur-bance plant attributes and freedom from herbivores. Biological Conservation 117, 215-26.
McArthur, K. and Platt, S.J. (2005). New initiatives for weed management on public land in Victoria. Plant Protection Quarterly (in press).
NRE (1997). Victoria’s biodiversity—di-rections in management. Department of Natural Resources and Environment, Melbourne.
NRE (2002). Victorian Pest Management: a framework for action – public land pest management strategy. Department of Natural Resources and Environment, Melbourne.
Platt, S.J. (2002). How to plan wildlife landscapes: A guide for community organisations. Department of Natu-ral Resources and Environment, Mel- bourne.
Tolhurst, K. (2000). Guidelines for ecologi-cal burning in foothill forests of Victo-ria: Mt Cole Case Study. Forest Science Centre, University of Melbourne, Mel-bourne.
VCC (2002). Victorian Coastal Strategy 2002. Victorian Coastal Council, Mel-bourne.
VEAC (2003). Angahook-Otway inves-tigation – discussion paper. Victorian Environmental Assessment Council, Melbourne.
VEAC (2004). Angahook-Otway inves-tigation, final report. Victorian Envi-ronmental Assessment Council, Mel-bourne.
Westbrooke, M., Wilson, B. and Laidlaw, S. (1990). The Otways – flora, fauna, con-servation, management. Deakin Uni-versity, Geelong.
White, M.D. and Carr, G.W.C. (2001). Falls Creek Alpine Resort Weed Strategy. Re-port for the Falls Creek Resort Manage-ment. Ecology Australia Pty, Ltd, un-published report.
Footnotes1 Sleeper weeds are exotic plants that
have naturalised in a region but have not yet rapidly increased in population size.
2 Some species were listed as an aggre-gate e.g. Avena spp., therefore the total number of species in the study area is slightly higher than that quoted.
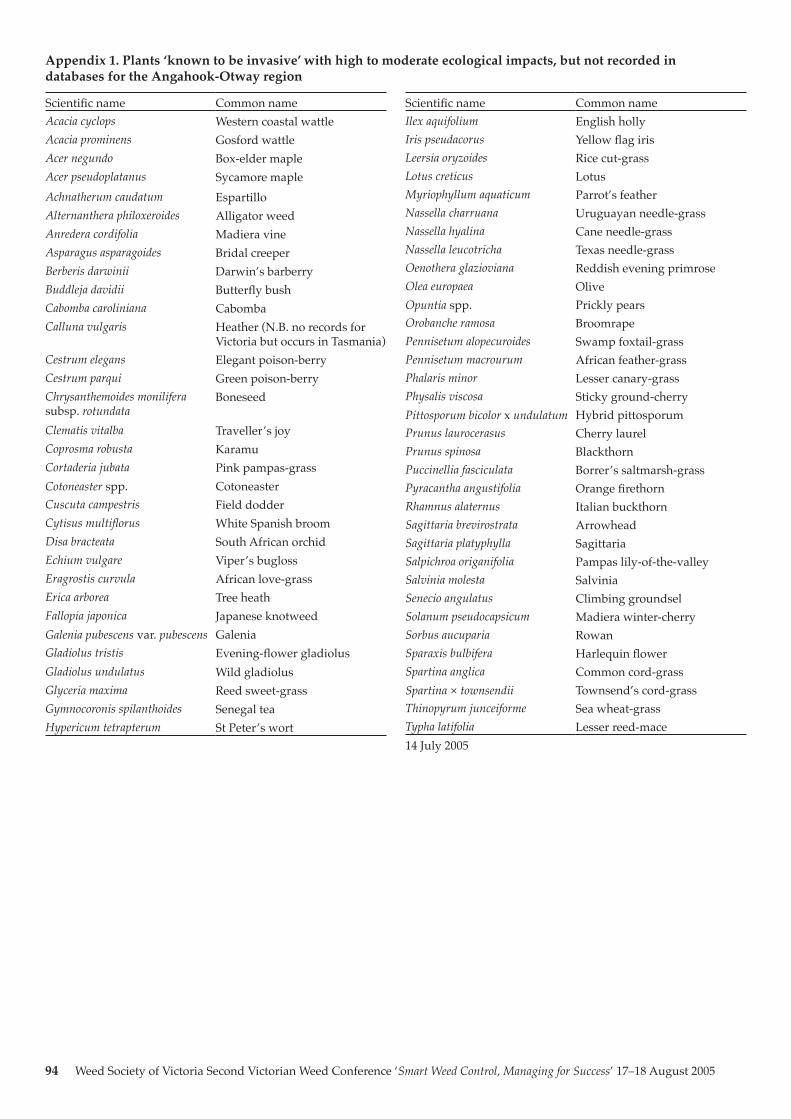
94 Weed Society of Victoria Second Victorian Weed Conference ‘Smart Weed Control, Managing for Success’ 17–18 August 2005
Scientific name Common nameAcacia cyclops Western coastal wattleAcacia prominens Gosford wattleAcer negundo Box-elder mapleAcer pseudoplatanus Sycamore mapleAchnatherum caudatum EspartilloAlternanthera philoxeroides Alligator weedAnredera cordifolia Madiera vineAsparagus asparagoides Bridal creeperBerberis darwinii Darwin’s barberryBuddleja davidii Butterfly bushCabomba caroliniana CabombaCalluna vulgaris Heather (N.B. no records for
Victoria but occurs in Tasmania)Cestrum elegans Elegant poison-berryCestrum parqui Green poison-berryChrysanthemoides monilifera subsp. rotundata
Boneseed
Clematis vitalba Traveller’s joyCoprosma robusta KaramuCortaderia jubata Pink pampas-grassCotoneaster spp. CotoneasterCuscuta campestris Field dodderCytisus multiflorus White Spanish broomDisa bracteata South African orchidEchium vulgare Viper’s buglossEragrostis curvula African love-grassErica arborea Tree heathFallopia japonica Japanese knotweedGalenia pubescens var. pubescens GaleniaGladiolus tristis Evening-flower gladiolusGladiolus undulatus Wild gladiolusGlyceria maxima Reed sweet-grassGymnocoronis spilanthoides Senegal teaHypericum tetrapterum St Peter’s wort
Scientific name Common nameIlex aquifolium English hollyIris pseudacorus Yellow flag irisLeersia oryzoides Rice cut-grassLotus creticus LotusMyriophyllum aquaticum Parrot’s featherNassella charruana Uruguayan needle-grassNassella hyalina Cane needle-grassNassella leucotricha Texas needle-grassOenothera glazioviana Reddish evening primroseOlea europaea OliveOpuntia spp. Prickly pearsOrobanche ramosa BroomrapePennisetum alopecuroides Swamp foxtail-grassPennisetum macrourum African feather-grassPhalaris minor Lesser canary-grassPhysalis viscosa Sticky ground-cherryPittosporum bicolor x undulatum Hybrid pittosporumPrunus laurocerasus Cherry laurelPrunus spinosa BlackthornPuccinellia fasciculata Borrer’s saltmarsh-grassPyracantha angustifolia Orange firethornRhamnus alaternus Italian buckthornSagittaria brevirostrata ArrowheadSagittaria platyphylla SagittariaSalpichroa origanifolia Pampas lily-of-the-valleySalvinia molesta SalviniaSenecio angulatus Climbing groundselSolanum pseudocapsicum Madiera winter-cherrySorbus aucuparia RowanSparaxis bulbifera Harlequin flowerSpartina anglica Common cord-grassSpartina × townsendii Townsend’s cord-grassThinopyrum junceiforme Sea wheat-grassTypha latifolia Lesser reed-mace14 July 2005
Appendix 1. Plants ‘known to be invasive’ with high to moderate ecological impacts, but not recorded in databases for the Angahook-Otway region

Weed Society of Victoria Second Victorian Weed Conference ‘Smart Weed Control, Managing for Success’ 17–18 August 2005 95
Species
Ecol
ogic
al im
pact
2
Impa
ct a
ttrib
utes
3
Pote
ntia
l dis
trib
utio
n4
Hab
itat r
ange
5
Rate
of d
ispe
rsal
6
Rank
ing
scor
e
HIGH IMPACT WEEDSAsparagus scandens H 6,7,8,9 E H R 1Cotoneaster pannosus H E H R 1Hedera helix H 6,7,8,9 E H R 1Lonicera japonica H E H R 1Sollya heterophylla H E H R 1Acacia longifolia H 1,2,4,6,7,8,9 E H M 2Chamaecytisus palmensis H 2,6,7,8,9 E H M 2Fraxinus spp. H E H M 2Passiflora tarminiana H 6,7,8,9 E H M 2Pittosporum undulatum H 6,7,8,9,10 E H M 2Acacia elata H 1,2,7 E H S 3Allium triquetrum H 1,2,6,8 E H S 3Genista linifolia H E H S 3Genista monspessulana H 1,6,7,8,9 E H S 3Vinca major H 4,6,7,8,9 E H S 3Chrysanthemoides monilifera subsp. monilifera
H 1,4,5,6,7,9 E M R 4
Coprosma repens H 1,4,6,7,8,9 E M R 4Cortaderia selloana H 1,6,7,8,9 E M R 4Leycesteria formosa H 1,6,7,8,9 E M R 4Agrostis gigantea H E M M 5Callistachys lanceolata H E M M 5Cytisus scoparius H 1,2,6,7,8,9 E M M 5Dipogon lignosus H 2,4,6,7,8,9 E M M 5Leptospermum laevigatum H 1, 6,7,8,9 E M M 5Calystegia silvatica H 1,6,7,8,9 E M S 6Crocosmia × crocosmiiflora H 1,6,8,9 E M S 6Erica lusitanica H 1,6,7,8,9 E M S 6Leucanthemum maximum H E M S 6Leucanthemum vulgare H 6,7,8,9 E M S 6Pinus radiata H 6,7,8,9,10 E M S 6Tradescantia fluminensis H 1,4,6,7,8,9 E M S 6Ulex europaeus H 1,2,4,6,7,8,9 E M S 6Watsonia meriana var. bulbillifera
H 1,4,6,7,8,9 E M S 6
Watsonia versfeldii H E M S 6Fuchsia magellanica H 6,7,8,9 E L R 7Nassella tenuissima H E L R 7Zantedeschia aethiopica H 6,7,8,9 E L R 7Delairea odorata H 1,6,7.8,9 E H M 8
Polygala myrtifolia var. myrtifolia
H 6,7,8,9 E L M 8
Salix spp. H 1,2,3,6,7,8,9 E L M 8Acacia sophorae H 1,2,4,6,7,8,9 E L S 9Alstroemeria aurea H 7,9 E L S 9Cupressus macrocarpa H 1,6,7,8,9, 10 E L S 9Lamium galeobdolon subsp. argentatum
H 6,7,8,9 E L S 9
Pennisetum clandestinum H E L S 9Pinus nigra H E L S 9Pinus pinaster H 6,7,8,9,10 E L S 9Populus alba H E L S 9Spartium junceum H 3,4,5,6,7,8,9 E L S 9Rubus fruticosus agg. H 4,6,7,8,9 M H R 10
WEEDS OF IMPORTANCE
Ehrharta erecta H 8,9 M H M 11Ehrharta longiflora H 8.9 M H M 11Holcus lanatus H 1,6,7,8,9 M M M 14Myosotis discolor, M. laxa subsp. caespitose, M. sylvatica
H 1,6,7,8,9 M M M 14
Lycium ferocissimum H 1,6,7,8,9 M L R 16Nassella neesiana H M L R 16Nassella trichotoma H 1,8,9 M L R 16Parapholis incurva H 6,7,8,9 M L M 17Dactylis glomerata H 1,3,6,7,8,9 M L S 18Stenotaphrum secundatum H 6,7,8,9 M L S 18Anthoxanthum odoratum H 1,4,6,7,8,9,10 L H M 20Phalaris aquatica H L M M 23Ammophila arenaria H 4,5,6,7,8,9 L L M 26Prunus cerasifera M E H R 28Acacia baileyana M 2,6,7 E H S 30Acacia decurrens M 2,6,7 E M S 30
WEEDS OF CONCERN
Sambucus nigra M E M R 31Freesia alba × F. leichtlinii M E M M 32Ixia polystachya M E M M 32Sparaxis tricolor M E M M 32Acacia saligna M 2, 6, 7 E M S 33Agapanthus praecox subsp. orientalis
M 1,6,7, E M S 33
Erica baccans M E M S 33Erica quadrangularis M E M S 33Melaleuca armillaris M 9 E M S 33Echium plantagineum M 9 E L R 34Chenopodium murale M E L M 35Gladiolus undulatus M E L M 35Selaginella kraussiana M 9 E L M 35
Appendix 2. Ranking of environmental weeds recorded from the Angahook-Otways study area – sorted by score
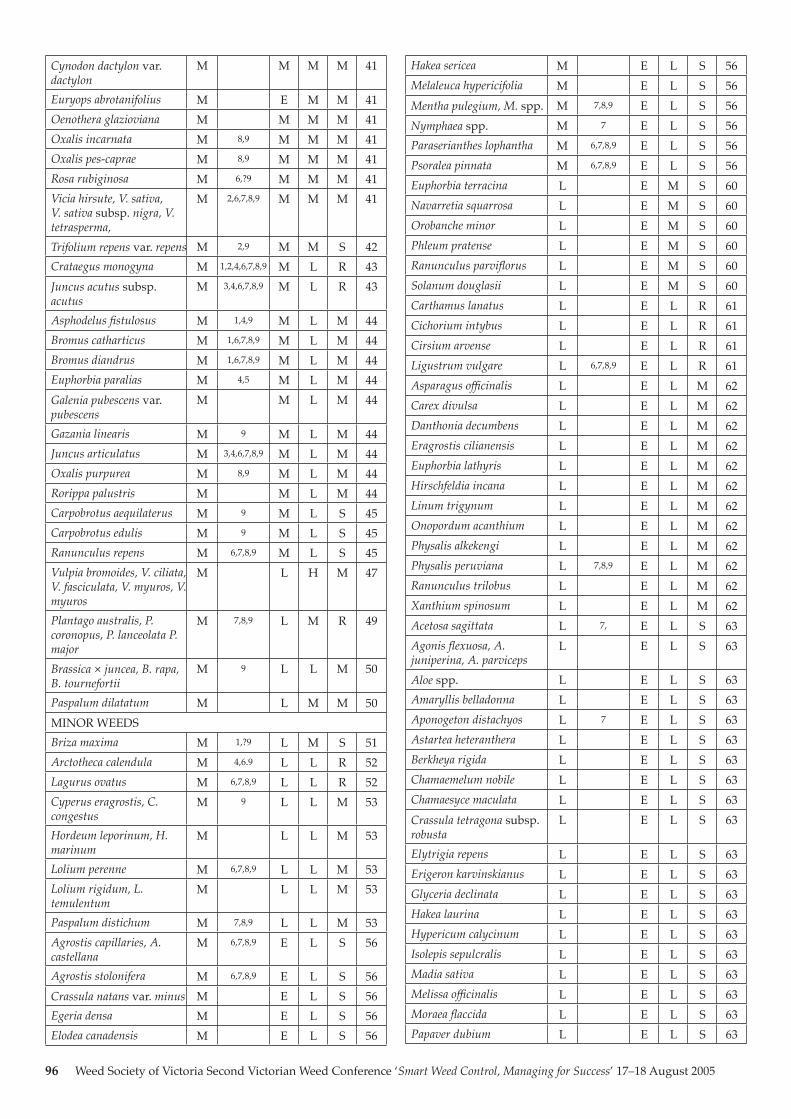
96 Weed Society of Victoria Second Victorian Weed Conference ‘Smart Weed Control, Managing for Success’ 17–18 August 2005
Cynodon dactylon var. dactylon
M M M M 41
Euryops abrotanifolius M E M M 41Oenothera glazioviana M M M M 41Oxalis incarnata M 8,9 M M M 41Oxalis pes-caprae M 8,9 M M M 41Rosa rubiginosa M 6,?9 M M M 41Vicia hirsute, V. sativa, V. sativa subsp. nigra, V. tetrasperma,
M 2,6,7,8,9 M M M 41
Trifolium repens var. repens M 2,9 M M S 42Crataegus monogyna M 1,2,4,6,7,8,9 M L R 43Juncus acutus subsp. acutus
M 3,4,6,7,8,9 M L R 43
Asphodelus fistulosus M 1,4,9 M L M 44Bromus catharticus M 1,6,7,8,9 M L M 44Bromus diandrus M 1,6,7,8,9 M L M 44Euphorbia paralias M 4,5 M L M 44Galenia pubescens var. pubescens
M M L M 44
Gazania linearis M 9 M L M 44Juncus articulatus M 3,4,6,7,8,9 M L M 44Oxalis purpurea M 8,9 M L M 44Rorippa palustris M M L M 44Carpobrotus aequilaterus M 9 M L S 45Carpobrotus edulis M 9 M L S 45Ranunculus repens M 6,7,8,9 M L S 45Vulpia bromoides, V. ciliata, V. fasciculata, V. myuros, V. myuros
M L H M 47
Plantago australis, P. coronopus, P. lanceolata P. major
M 7,8,9 L M R 49
Brassica × juncea, B. rapa, B. tournefortii
M 9 L L M 50
Paspalum dilatatum M L M M 50MINOR WEEDSBriza maxima M 1,?9 L M S 51Arctotheca calendula M 4,6.9 L L R 52Lagurus ovatus M 6,7,8,9 L L R 52Cyperus eragrostis, C. congestus
M 9 L L M 53
Hordeum leporinum, H. marinum
M L L M 53
Lolium perenne M 6,7,8,9 L L M 53Lolium rigidum, L. temulentum
M L L M 53
Paspalum distichum M 7,8,9 L L M 53Agrostis capillaries, A. castellana
M 6,7,8,9 E L S 56
Agrostis stolonifera M 6,7,8,9 E L S 56Crassula natans var. minus M E L S 56Egeria densa M E L S 56Elodea canadensis M E L S 56
Hakea sericea M E L S 56Melaleuca hypericifolia M E L S 56Mentha pulegium, M. spp. M 7,8,9 E L S 56Nymphaea spp. M 7 E L S 56Paraserianthes lophantha M 6,7,8,9 E L S 56Psoralea pinnata M 6,7,8,9 E L S 56Euphorbia terracina L E M S 60Navarretia squarrosa L E M S 60Orobanche minor L E M S 60Phleum pratense L E M S 60Ranunculus parviflorus L E M S 60Solanum douglasii L E M S 60Carthamus lanatus L E L R 61Cichorium intybus L E L R 61Cirsium arvense L E L R 61Ligustrum vulgare L 6,7,8,9 E L R 61Asparagus officinalis L E L M 62Carex divulsa L E L M 62Danthonia decumbens L E L M 62Eragrostis cilianensis L E L M 62Euphorbia lathyris L E L M 62Hirschfeldia incana L E L M 62Linum trigynum L E L M 62Onopordum acanthium L E L M 62Physalis alkekengi L E L M 62Physalis peruviana L 7,8,9 E L M 62Ranunculus trilobus L E L M 62Xanthium spinosum L E L M 62Acetosa sagittata L 7, E L S 63Agonis flexuosa, A. juniperina, A. parviceps
L E L S 63
Aloe spp. L E L S 63Amaryllis belladonna L E L S 63Aponogeton distachyos L 7 E L S 63Astartea heteranthera L E L S 63Berkheya rigida L E L S 63Chamaemelum nobile L E L S 63Chamaesyce maculata L E L S 63Crassula tetragona subsp. robusta
L E L S 63
Elytrigia repens L E L S 63Erigeron karvinskianus L E L S 63Glyceria declinata L E L S 63Hakea laurina L E L S 63Hypericum calycinum L E L S 63Isolepis sepulcralis L E L S 63Madia sativa L E L S 63Melissa officinalis L E L S 63Moraea flaccida L E L S 63Papaver dubium L E L S 63
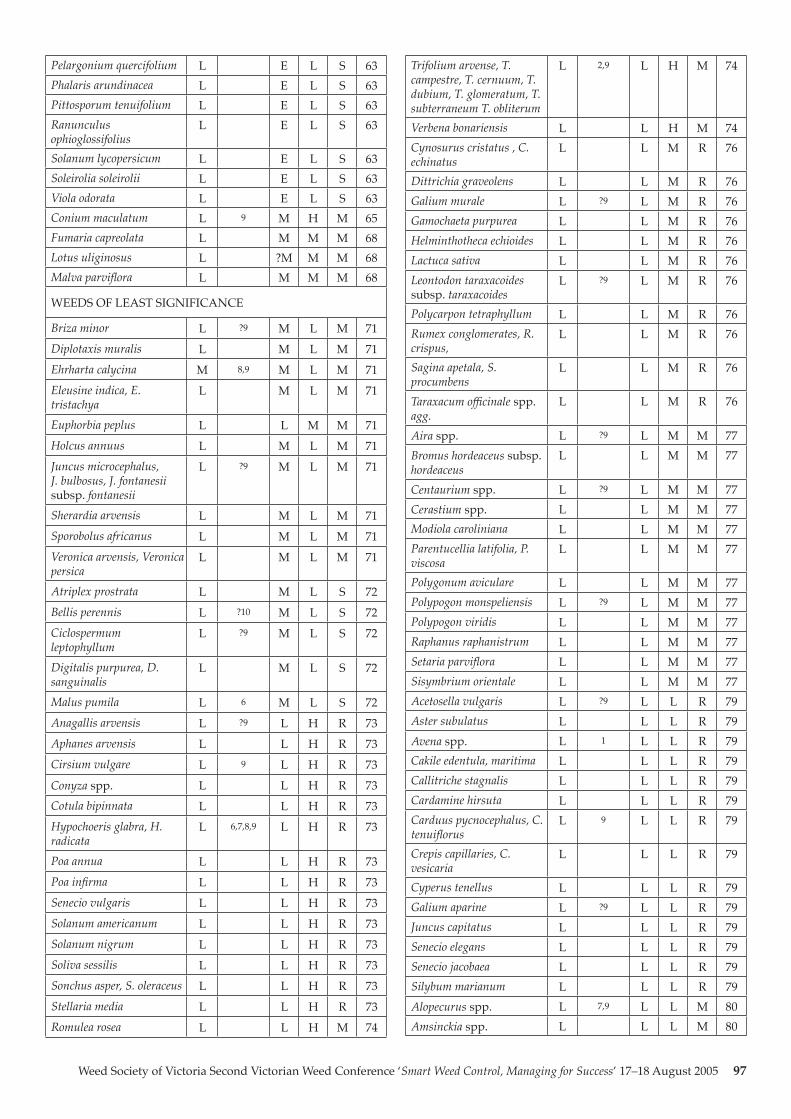
Weed Society of Victoria Second Victorian Weed Conference ‘Smart Weed Control, Managing for Success’ 17–18 August 2005 97
Pelargonium quercifolium L E L S 63Phalaris arundinacea L E L S 63Pittosporum tenuifolium L E L S 63Ranunculus ophioglossifolius
L E L S 63
Solanum lycopersicum L E L S 63Soleirolia soleirolii L E L S 63Viola odorata L E L S 63Conium maculatum L 9 M H M 65Fumaria capreolata L M M M 68Lotus uliginosus L ?M M M 68Malva parviflora L M M M 68
WEEDS OF LEAST SIGNIFICANCE
Briza minor L ?9 M L M 71Diplotaxis muralis L M L M 71Ehrharta calycina M 8,9 M L M 71Eleusine indica, E. tristachya
L M L M 71
Euphorbia peplus L L M M 71Holcus annuus L M L M 71Juncus microcephalus, J. bulbosus, J. fontanesii subsp. fontanesii
L ?9 M L M 71
Sherardia arvensis L M L M 71Sporobolus africanus L M L M 71Veronica arvensis, Veronica persica
L M L M 71
Atriplex prostrata L M L S 72Bellis perennis L ?10 M L S 72Ciclospermum leptophyllum
L ?9 M L S 72
Digitalis purpurea, D. sanguinalis
L M L S 72
Malus pumila L 6 M L S 72Anagallis arvensis L ?9 L H R 73Aphanes arvensis L L H R 73Cirsium vulgare L 9 L H R 73Conyza spp. L L H R 73Cotula bipinnata L L H R 73Hypochoeris glabra, H. radicata
L 6,7,8,9 L H R 73
Poa annua L L H R 73Poa infirma L L H R 73Senecio vulgaris L L H R 73Solanum americanum L L H R 73Solanum nigrum L L H R 73Soliva sessilis L L H R 73Sonchus asper, S. oleraceus L L H R 73Stellaria media L L H R 73Romulea rosea L L H M 74
Trifolium arvense, T. campestre, T. cernuum, T. dubium, T. glomeratum, T. subterraneum T. obliterum
L 2,9 L H M 74
Verbena bonariensis L L H M 74Cynosurus cristatus , C. echinatus
L L M R 76
Dittrichia graveolens L L M R 76Galium murale L ?9 L M R 76Gamochaeta purpurea L L M R 76Helminthotheca echioides L L M R 76Lactuca sativa L L M R 76Leontodon taraxacoides subsp. taraxacoides
L ?9 L M R 76
Polycarpon tetraphyllum L L M R 76Rumex conglomerates, R. crispus,
L L M R 76
Sagina apetala, S. procumbens
L L M R 76
Taraxacum officinale spp. agg.
L L M R 76
Aira spp. L ?9 L M M 77Bromus hordeaceus subsp. hordeaceus
L L M M 77
Centaurium spp. L ?9 L M M 77Cerastium spp. L L M M 77Modiola caroliniana L L M M 77Parentucellia latifolia, P. viscosa
L L M M 77
Polygonum aviculare L L M M 77Polypogon monspeliensis L ?9 L M M 77Polypogon viridis L L M M 77Raphanus raphanistrum L L M M 77Setaria parviflora L L M M 77Sisymbrium orientale L L M M 77Acetosella vulgaris L ?9 L L R 79Aster subulatus L L L R 79Avena spp. L 1 L L R 79Cakile edentula, maritima L L L R 79Callitriche stagnalis L L L R 79Cardamine hirsuta L L L R 79Carduus pycnocephalus, C. tenuiflorus
L 9 L L R 79
Crepis capillaries, C. vesicaria
L L L R 79
Cyperus tenellus L L L R 79Galium aparine L ?9 L L R 79Juncus capitatus L L L R 79Senecio elegans L L L R 79Senecio jacobaea L L L R 79Silybum marianum L L L R 79Alopecurus spp. L 7,9 L L M 80Amsinckia spp. L L L M 80
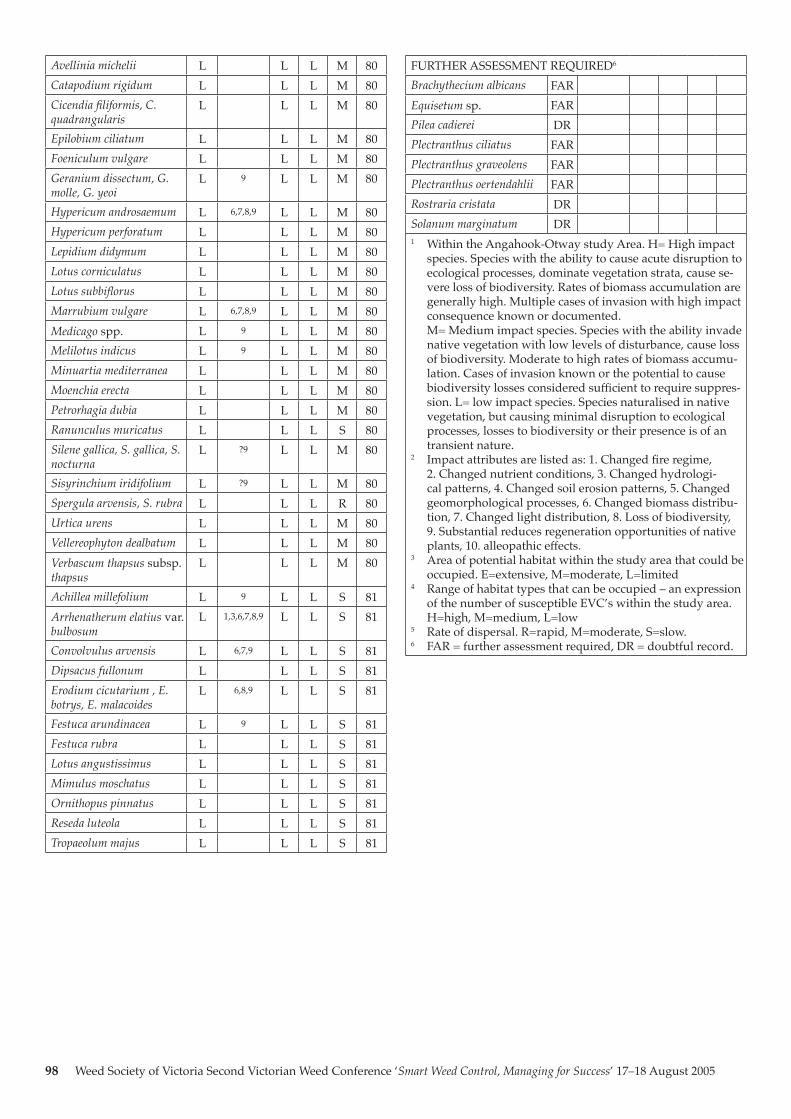
98 Weed Society of Victoria Second Victorian Weed Conference ‘Smart Weed Control, Managing for Success’ 17–18 August 2005
Avellinia michelii L L L M 80Catapodium rigidum L L L M 80Cicendia filiformis, C. quadrangularis
L L L M 80
Epilobium ciliatum L L L M 80Foeniculum vulgare L L L M 80Geranium dissectum, G. molle, G. yeoi
L 9 L L M 80
Hypericum androsaemum L 6,7,8,9 L L M 80Hypericum perforatum L L L M 80Lepidium didymum L L L M 80Lotus corniculatus L L L M 80Lotus subbiflorus L L L M 80Marrubium vulgare L 6,7,8,9 L L M 80Medicago spp. L 9 L L M 80Melilotus indicus L 9 L L M 80Minuartia mediterranea L L L M 80Moenchia erecta L L L M 80Petrorhagia dubia L L L M 80Ranunculus muricatus L L L S 80Silene gallica, S. gallica, S. nocturna
L ?9 L L M 80
Sisyrinchium iridifolium L ?9 L L M 80Spergula arvensis, S. rubra L L L R 80Urtica urens L L L M 80Vellereophyton dealbatum L L L M 80Verbascum thapsus subsp. thapsus
L L L M 80
Achillea millefolium L 9 L L S 81Arrhenatherum elatius var. bulbosum
L 1,3,6,7,8,9 L L S 81
Convolvulus arvensis L 6,7,9 L L S 81Dipsacus fullonum L L L S 81Erodium cicutarium , E. botrys, E. malacoides
L 6,8,9 L L S 81
Festuca arundinacea L 9 L L S 81Festuca rubra L L L S 81Lotus angustissimus L L L S 81Mimulus moschatus L L L S 81Ornithopus pinnatus L L L S 81Reseda luteola L L L S 81Tropaeolum majus L L L S 81
FURTHER ASSESSMENT REQUIRED6
Brachythecium albicans FAREquisetum sp. FARPilea cadierei DRPlectranthus ciliatus FARPlectranthus graveolens FARPlectranthus oertendahlii FARRostraria cristata DRSolanum marginatum DR1 Within the Angahook-Otway study Area. H= High impact
species. Species with the ability to cause acute disruption to ecological processes, dominate vegetation strata, cause se-vere loss of biodiversity. Rates of biomass accumulation are generally high. Multiple cases of invasion with high impact consequence known or documented. M= Medium impact species. Species with the ability invade native vegetation with low levels of disturbance, cause loss of biodiversity. Moderate to high rates of biomass accumu-lation. Cases of invasion known or the potential to cause biodiversity losses considered sufficient to require suppres-sion. L= low impact species. Species naturalised in native vegetation, but causing minimal disruption to ecological processes, losses to biodiversity or their presence is of an transient nature.
2 Impact attributes are listed as: 1. Changed fire regime, 2. Changed nutrient conditions, 3. Changed hydrologi-cal patterns, 4. Changed soil erosion patterns, 5. Changed geomorphological processes, 6. Changed biomass distribu-tion, 7. Changed light distribution, 8. Loss of biodiversity, 9. Substantial reduces regeneration opportunities of native plants, 10. alleopathic effects.
3 Area of potential habitat within the study area that could be occupied. E=extensive, M=moderate, L=limited
4 Range of habitat types that can be occupied – an expression of the number of susceptible EVC’s within the study area. H=high, M=medium, L=low
5 Rate of dispersal. R=rapid, M=moderate, S=slow.6 FAR = further assessment required, DR = doubtful record.
Weed Society of Victoria Second Victorian Weed Conference ‘Smart Weed Control, Managing for Success’ 17–18 August 2005 99
Summary Recent assessment of mate-rial for weed contamination, manually removed from vehicles during training in weed movement, machinery inspection and cleaning workshops has identified over 130 contaminant species. Fourteen species were declared noxious weeds in Victoria and six have regionally prohibited status. One weed of national significance was identified on two separate vehicles. Of the 18 utilities/4wd vehicles assessed an average of 617g of dry material was removed and 44% were carrying noxious weeds or Weeds of National Significance. Two vehicles were carrying multiple nox-ious species.
IntroductionThe Victorian pest management frame-work identifies that risk of introduction and spread of pests needs to be commu-nicated to the community so attitudes and behaviour are modified (DNRE 2002). It is well known amongst weed professionals that vehicles can disperse an array of weed species. Wace (1977) in his survey of car wash facilities in Canberra identified over 259 species or taxonomic entities that are potentially dispersed by vehicles. Gath-ering some hard data on the actual con-taminants on each vehicle and comparing between vehicle types can be an expensive and time-consuming activity.
Workshops have been developed, that are aimed at increasing participants awareness of their obligations under the Victorian Catchment and Land Protection Act 1994 in particular to the movement and dispersal of noxious weeds and how they can implement practices to help them meet their obligations (Lardner et al. 2004). These workshops have been conducted for 12 local or state government organisations both within Victoria and South Australia since July 2004.
These workshops provided a unique opportunity to assess contaminants cleaned from a variety of equipment for weed contamination. Assessment of much of the material is still on-going.
Materials and methodsAn opportunity existed for assessing material carried on vehicles and equip-ment used as part of training courses in weed movement, machinery inspection and cleaning run by DPI over the last 12 months. A manual clean down and collection of samples from vehicles was required to be performed by participants
as part of their assessment against na-tional competencies. This generated over 100 individual samples from 35 items of machinery or passenger vehicles. Samples were collected and stored in zip-lock plas-tic bags.
Visual assessment was made on all samples for seed contamination and where possible seeds were identified to species. All samples were tested for ger-minants. Many of the samples, due to their volume, required sub sampling for economical germination assessment. Ap-proximately 380 mL (one punnet 12.1 × 6.7 × 4.7 cm) of loose sample was spread thinly over half of a 30 × 27 cm trays con-taining three litres of commercial sterile, potting mix. Two samples were placed on each tray and were separated by a ridge of potting mix to stop seed/soil movement from one sample to the adjoining sample. Trays were watered overhead and placed in an un-heated glasshouse and watered as required.
Germinated plants were assessed ap-proximately fortnightly and identified as early as possible in their lifecycle. Due to time constraints species emerging were recorded but numbers of individuals of each species were not. Germination as-sessments continued for at least 12 weeks and for some samples up to 26 weeks. At the time of writing this paper samples col-lected after March 2005 were still being assessed.
Results have been recorded for the location of the sample on each vehicle, weight of sample taken and sub-sample assessed. Samples were not necessarily taken from all locations on all vehicles and total weights of samples are not necessar-ily all the material that could be removed off the vehicle. Hence results are likely to be an underestimate of the species present as germination conditions generally fa-voured winter germinators and not spe-cies likely to germinate in the summer. As a result of the sub sampling some species may have been missed in the assessment.
ResultsResults presented in this paper are a sum-mary of the samples taken from each vehi-cle. A total of 35 items of vehicles and ma-chinery have been cleaned and assessed for weed contamination. This consisted of; 18 utilities and 4wd vehicles, five tractors and slasher units, three out-front mowers, three graders, three backhoes and three trucks and trailers. The utilities are mainly
from local government and state govern-ment organisations with three vehicles be-longing to private contractors. All the ve-hicles are exposed in their daily business to weed propagules, some of them are put into high-risk situations on a frequent ba-sis (i.e. spray units and, slashers for CNG control). Details for of material collected from each vehicle or machine, weights of material collected and assessed and the number of species identified for each vehi-cle are listed in Table 1. The noxious weeds and weeds of national significance are also listed.
Over 130 species have been identified from the samples assessed. The highest number of species on one vehicle was 38. No vehicles were contaminant and species free. Almost 40 families are represented in the flora observed on the vehicles and Table 2 lists the families represented. The most frequent family observed was Poace-ae followed by Asteraceae and Fabaceae.
The top 15 weed species identified on vehicles and machinery are presented in Table 3 along with the noxious weeds de-tected. 39% of passenger vehicles and 29% of machinery carried noxious weeds, while 11% of all vehicles carried multiple noxious weed species. The sample size is possibly too small to draw any conclusions regard-ing the type of propagule that is likely to be carried on particular vehicles or plant and machinery. It is more likely that the situation the vehicles are exposed to deter-mines the species they will pick up.
ConclusionVehicles play an important role in the po-tential spread of weeds. Passenger 4wd vehicles used by local government and government business that are exposed to weed propagules pose a significant risk in spreading weed species of concern. The movement of plant and machinery will also spread weeds. Thorough cleaning of vehicles will significantly reduce this weed spread risk.
ReferencesDepartment of Natural Resources and
Environment (DNRE) (2002). Victorian Pest Management. A framework for ac-tion. The State of Victoria.
Faithfull, I. (2004). Declared noxious weeds. Landcare Notes LC0252. Department of Sustainability and Environment.
Lardner, S., Moerkerk, M., Jochinke, D. and Wachsmann, N. (2004). Weed movement, machinery inspection and cleaning workshop. Participant work-book, Department of Primary Indus-tries, Horsham.
Wace, N. (1977). Assessment of dispersal of plant species – the car-borne flora of Canberra. In Exotic species in Australia – their establishment and success, ed. D. Anderson. Proceedings of the Ecological Society of Australia Volume 10, 167-86.
Machinery hygiene – what is on our vehicles?
Michael Moerkerk, Department of Primary Industries Horsham, Private Bag 260, Horsham, Victoria 3401
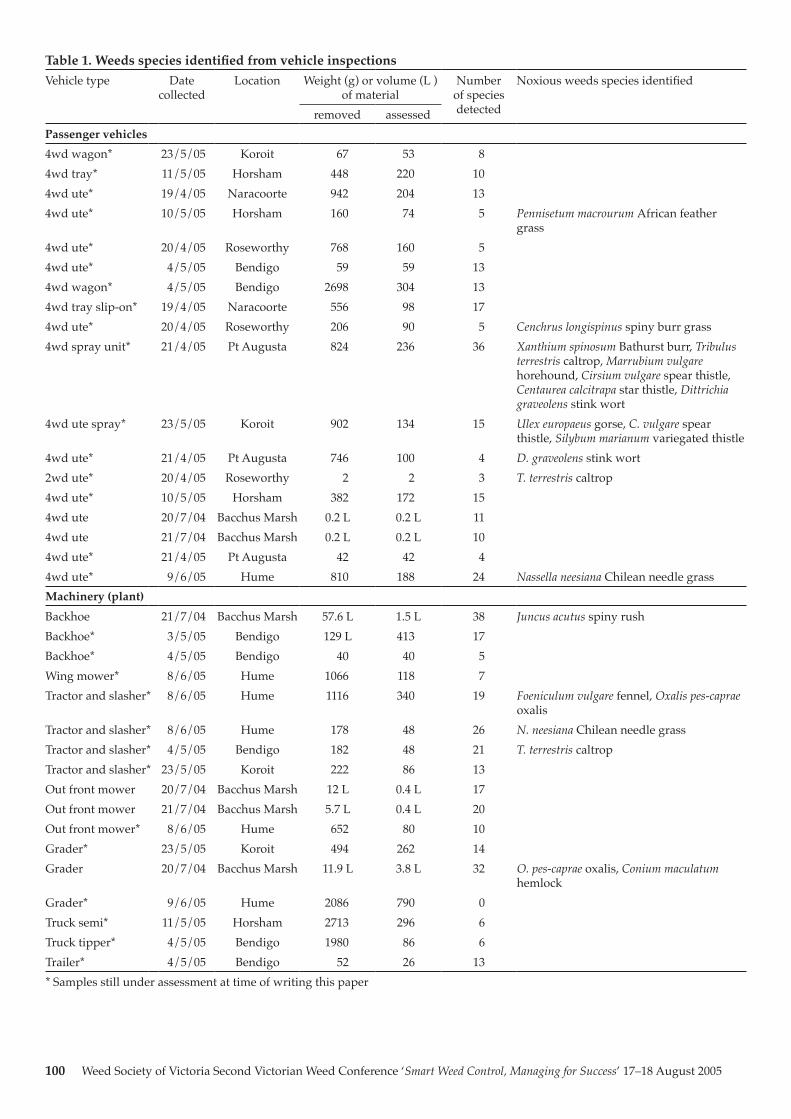
100 Weed Society of Victoria Second Victorian Weed Conference ‘Smart Weed Control, Managing for Success’ 17–18 August 2005
Table 1. Weeds species identified from vehicle inspectionsVehicle type Date
collectedLocation Weight (g) or volume (L )
of materialNumber
of species detected
Noxious weeds species identified
removed assessedPassenger vehicles 4wd wagon* 23/5/05 Koroit 67 53 84wd tray* 11/5/05 Horsham 448 220 104wd ute* 19/4/05 Naracoorte 942 204 134wd ute* 10/5/05 Horsham 160 74 5 Pennisetum macrourum African feather
grass4wd ute* 20/4/05 Roseworthy 768 160 54wd ute* 4/5/05 Bendigo 59 59 134wd wagon* 4/5/05 Bendigo 2698 304 134wd tray slip-on* 19/4/05 Naracoorte 556 98 174wd ute* 20/4/05 Roseworthy 206 90 5 Cenchrus longispinus spiny burr grass4wd spray unit* 21/4/05 Pt Augusta 824 236 36 Xanthium spinosum Bathurst burr, Tribulus
terrestris caltrop, Marrubium vulgare horehound, Cirsium vulgare spear thistle, Centaurea calcitrapa star thistle, Dittrichia graveolens stink wort
4wd ute spray* 23/5/05 Koroit 902 134 15 Ulex europaeus gorse, C. vulgare spear thistle, Silybum marianum variegated thistle
4wd ute* 21/4/05 Pt Augusta 746 100 4 D. graveolens stink wort2wd ute* 20/4/05 Roseworthy 2 2 3 T. terrestris caltrop4wd ute* 10/5/05 Horsham 382 172 154wd ute 20/7/04 Bacchus Marsh 0.2 L 0.2 L 114wd ute 21/7/04 Bacchus Marsh 0.2 L 0.2 L 104wd ute* 21/4/05 Pt Augusta 42 42 44wd ute* 9/6/05 Hume 810 188 24 Nassella neesiana Chilean needle grassMachinery (plant)Backhoe 21/7/04 Bacchus Marsh 57.6 L 1.5 L 38 Juncus acutus spiny rushBackhoe* 3/5/05 Bendigo 129 L 413 17Backhoe* 4/5/05 Bendigo 40 40 5Wing mower* 8/6/05 Hume 1066 118 7Tractor and slasher* 8/6/05 Hume 1116 340 19 Foeniculum vulgare fennel, Oxalis pes-caprae
oxalisTractor and slasher* 8/6/05 Hume 178 48 26 N. neesiana Chilean needle grassTractor and slasher* 4/5/05 Bendigo 182 48 21 T. terrestris caltropTractor and slasher* 23/5/05 Koroit 222 86 13Out front mower 20/7/04 Bacchus Marsh 12 L 0.4 L 17Out front mower 21/7/04 Bacchus Marsh 5.7 L 0.4 L 20Out front mower* 8/6/05 Hume 652 80 10Grader* 23/5/05 Koroit 494 262 14Grader 20/7/04 Bacchus Marsh 11.9 L 3.8 L 32 O. pes-caprae oxalis, Conium maculatum
hemlockGrader* 9/6/05 Hume 2086 790 0Truck semi* 11/5/05 Horsham 2713 296 6Truck tipper* 4/5/05 Bendigo 1980 86 6Trailer* 4/5/05 Bendigo 52 26 13* Samples still under assessment at time of writing this paper
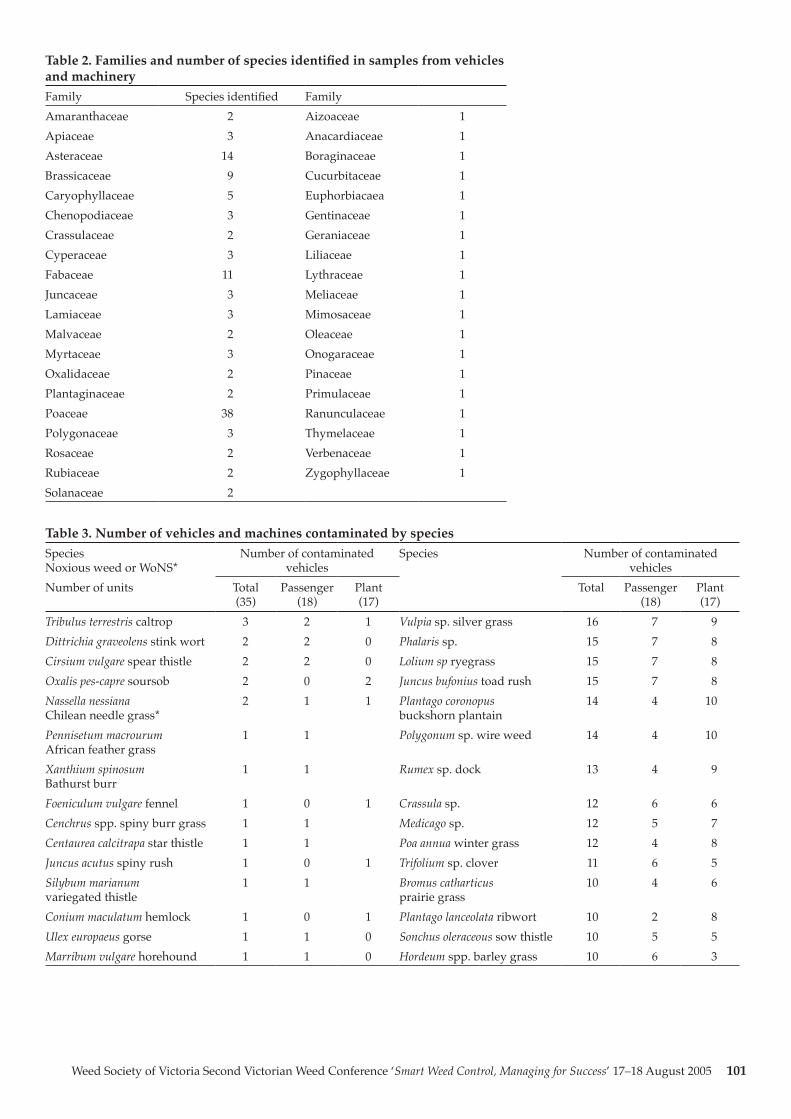
Weed Society of Victoria Second Victorian Weed Conference ‘Smart Weed Control, Managing for Success’ 17–18 August 2005 101
Table 2. Families and number of species identified in samples from vehicles and machineryFamily Species identified FamilyAmaranthaceae 2 Aizoaceae 1Apiaceae 3 Anacardiaceae 1Asteraceae 14 Boraginaceae 1Brassicaceae 9 Cucurbitaceae 1Caryophyllaceae 5 Euphorbiacaea 1Chenopodiaceae 3 Gentinaceae 1Crassulaceae 2 Geraniaceae 1Cyperaceae 3 Liliaceae 1Fabaceae 11 Lythraceae 1Juncaceae 3 Meliaceae 1Lamiaceae 3 Mimosaceae 1Malvaceae 2 Oleaceae 1Myrtaceae 3 Onogaraceae 1Oxalidaceae 2 Pinaceae 1Plantaginaceae 2 Primulaceae 1Poaceae 38 Ranunculaceae 1Polygonaceae 3 Thymelaceae 1Rosaceae 2 Verbenaceae 1Rubiaceae 2 Zygophyllaceae 1Solanaceae 2
Table 3. Number of vehicles and machines contaminated by speciesSpecies Noxious weed or WoNS*
Number of contaminated vehicles
Species Number of contaminated vehicles
Number of units Total (35)
Passenger (18)
Plant (17)
Total Passenger (18)
Plant (17)
Tribulus terrestris caltrop 3 2 1 Vulpia sp. silver grass 16 7 9Dittrichia graveolens stink wort 2 2 0 Phalaris sp. 15 7 8Cirsium vulgare spear thistle 2 2 0 Lolium sp ryegrass 15 7 8Oxalis pes-capre soursob 2 0 2 Juncus bufonius toad rush 15 7 8Nassella nessiana Chilean needle grass*
2 1 1 Plantago coronopus buckshorn plantain
14 4 10
Pennisetum macrourum African feather grass
1 1 Polygonum sp. wire weed 14 4 10
Xanthium spinosum Bathurst burr
1 1 Rumex sp. dock 13 4 9
Foeniculum vulgare fennel 1 0 1 Crassula sp. 12 6 6Cenchrus spp. spiny burr grass 1 1 Medicago sp. 12 5 7Centaurea calcitrapa star thistle 1 1 Poa annua winter grass 12 4 8Juncus acutus spiny rush 1 0 1 Trifolium sp. clover 11 6 5Silybum marianum variegated thistle
1 1 Bromus catharticus prairie grass
10 4 6
Conium maculatum hemlock 1 0 1 Plantago lanceolata ribwort 10 2 8Ulex europaeus gorse 1 1 0 Sonchus oleraceous sow thistle 10 5 5Marribum vulgare horehound 1 1 0 Hordeum spp. barley grass 10 6 3
102 Weed Society of Victoria Second Victorian Weed Conference ‘Smart Weed Control, Managing for Success’ 17–18 August 2005
Abstract A population of serrated tus-sock at Diggers Rest just north-west of Melbourne has been identified as being resistant to the herbicide flupropanate. This has prompted a national mail sur-vey of 5000 land managers impacted by serrated tussock across Australia. Survey results have shown that serrated tussock has spread widely throughout Victoria, NSW, ACT and Tasmania with 15 out of 399 respondents reporting resistance and requiring further investigation. The sur-vey has also shown that serrated tussock is costing each land manager between $15 000 and $20 000 annually in control and lost production costs. This emphasises the importance of promoting integrated management of serrated tussock.
Keywords Survey, serrated tussock, Nassella trichotoma, economic impact, her-bicide resistance, flupropanate
IntroductionSerrated tussock (Nassella trichotoma Trin. & Rupr Barkworth) is a perennial, drought resistant tussock grass species that is na-tive to the pampas grasslands of Argen-tina, Uruguay, Chile and Peru (Parodi 1930, Rosengurtt et al. 1970) and Bolivia (Walsh and Entwisle 1994). Serrated tus-sock is a proclaimed noxious weed in the Australian Capital Territory, New South Wales, Victoria, South Australia and Tas-mania. It has been described as causing a greater reduction in pasture carrying ca-pacity than any other weed in Australia with heavily infested paddocks in NSW carrying only 0.5 dry sheep equivalent (dse) per hectare compared to 7 to 15 dse on improved pasture without the weed (Parsons and Cuthbertson 1992). Serrated tussock is a Weed of National Significance
(Thorp and Lynch, 2000) that has been es-timated to conservatively cost Victoria $5 million per year (Nicholson et al. 1997) and the economy of New South Wales $40.3 million per year (Jones and Vere 1998). In 1977 it occupied 680 000 ha (Campbell 1977) and now occupies more than 870 000 ha in New South Wales with an estimat-ed 2 000 000 ha at risk of infestation (Ian McGowan, NSW Department of Primary Industries, personal communication). In Victoria, serrated tussock was first col-lected at Broadmeadows (15 km NNW of Melbourne) in 1954 where it occupied 4 ha (Parsons 1973). By 1979 it had spread to oc-cupy approximately 30 000 ha (Lane et al. 1980) and by 1998 it occupied in excess of 130 000 ha (McLaren et al. 1998). Serrated tussock is also found in Tasmania where it is currently spread in scattered popula-tions over an area of approximately 1000 ha (Christian Gonninon, Tasmanian De-partment of Primary Industries Water and Environment, personal communication). The potential distribution of serrated tus-sock based on its current infestations in Australia has been estimated at 32 million ha with substantial areas of New South Wales, Victoria and Tasmania at risk of in-vasion (McLaren et al. 1998). Serrated tus-sock is being increasingly recognised as a serious environmental weed and the asso-ciated native vegetation being invaded by serrated tussock is described in McLaren et al. 1998.
Despite years of research, there are still limited control options for managing ser-rated tussock in Australia (Michalk et al. 1999). The only registered herbicides for control of serrated tussock in pastures are flupropanate, glyphosate, and 2,2-DPA. Flupropanate is widely regarded as the
most selective and effective herbicide for controlling serrated tussock (Campbell and Vere 1995). Species such as phalaris, cocksfoot and kangaroo grass have some tolerance to flupropanate (Campbell 1979, Campbell et el. 1979, Campbell and Rid-ings 1988) while its residual action in the soil can prevent serrated tussock regrow-ing for three to five years (Campbell and Vere 1995). Flupropanate resistance has been identified in a population of serrated tussock in Victoria (Noble 2002). Serrated tussock plants suspected of being resistant to flupropanate were grown in a pot trial and treated with a range of flupropanate rates. The resistant serrated tussock sur-vived application rates as high as 8L ha-1 which is four times the recommended rate used for controlling this species (Noble 2002). Similarly, Petri dish dose response trials undertaken on serrated tussock seeds have shown that the flupropanate dose required to reduce the germination of seeds from resistant plants by 50 % was approximately 10 times higher than for susceptible seeds (Graeme Pritchard, Victorian Department of Primary Indus-tries, personal communication) This has prompted a national survey to try and de-termine whether serrated tussock resist-ance to flupropanate is wide spread and to raise resistance awareness and promote integrated management of serrated tus-sock.
Materials and methodsIn November 2004, a tick-box question-naire was sent out to land managers in Vic-toria, NSW, ACT and Tasmania. In Victoria and Tasmania, questionnaires were sent out directly to landholders that had been recorded with serrated tussock on the land they managed. This also included a mail-ing list of 1130 within the Melton Shire in Victoria. The Melton Shire was targeted because the property identified with ser-rated tussock resistant to flupropanate was located within this Shire. A further 931 questionnaires were mailed directly to land managers recorded with serrated tussock on the Victorian Department of Sustainability and Environment’s Inte-grated Pest Management System (IPMS). Twenty questionnaires were sent out to Victorian park rangers, 10 to VicRoads and 30 directly to Victorian spray con-tractors. In Tasmania, 275 questionnaires were mailed out directly to land managers recorded with serrated tussock. In New South Wales 338 questionnaires were sent
The National Serrated Tussock Survey – impacts and implications of its resistance to the herbicide flupropanate in Australia
D.A. McLarenA,C, S. RamasamyB,C, A.C. LawrieB, G. PritchardA and T.A. MorfeA,C
A Department of Primary Industries, Frankston Centre, PO Box 48, Frankston,Victoria 3199B RMIT University, Bundoora West Campus, PO Box 71, Bundoora, Victoria 3083C CRC for Australian Weed Management
SESSION 8Getting technical (concurrent)
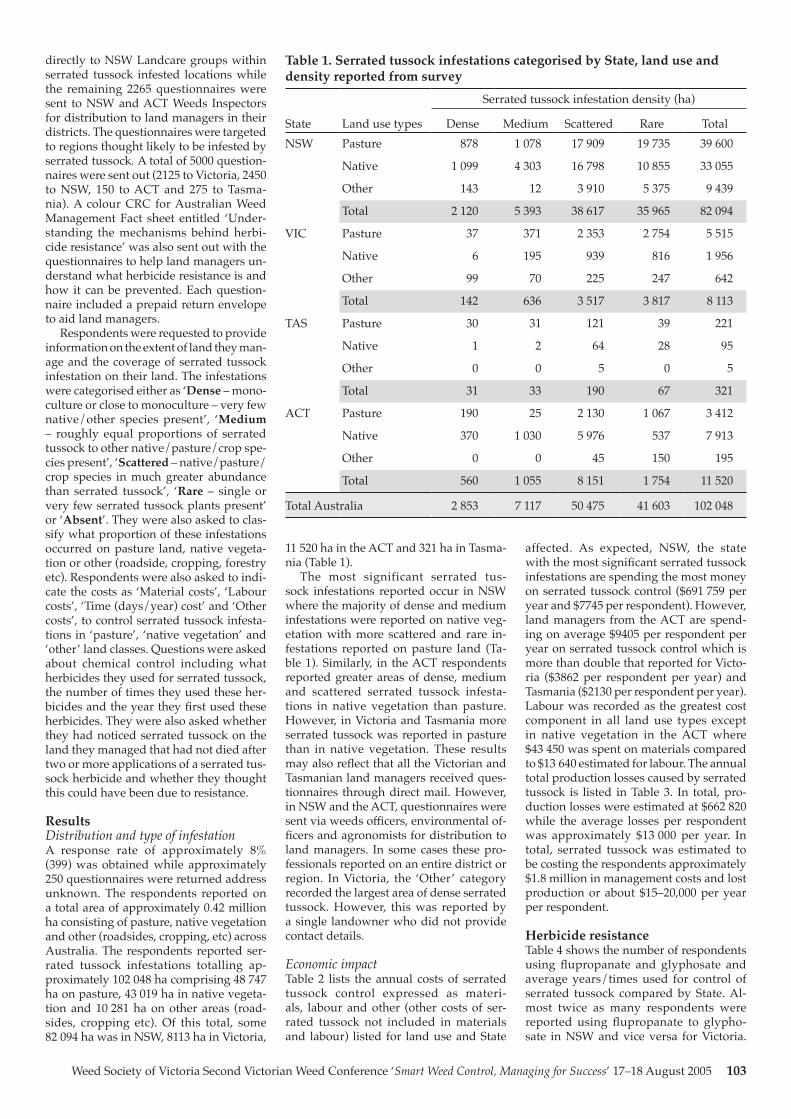
Weed Society of Victoria Second Victorian Weed Conference ‘Smart Weed Control, Managing for Success’ 17–18 August 2005 103
directly to NSW Landcare groups within serrated tussock infested locations while the remaining 2265 questionnaires were sent to NSW and ACT Weeds Inspectors for distribution to land managers in their districts. The questionnaires were targeted to regions thought likely to be infested by serrated tussock. A total of 5000 question-naires were sent out (2125 to Victoria, 2450 to NSW, 150 to ACT and 275 to Tasma-nia). A colour CRC for Australian Weed Management Fact sheet entitled ‘Under-standing the mechanisms behind herbi-cide resistance’ was also sent out with the questionnaires to help land managers un-derstand what herbicide resistance is and how it can be prevented. Each question-naire included a prepaid return envelope to aid land managers.
Respondents were requested to provide information on the extent of land they man-age and the coverage of serrated tussock infestation on their land. The infestations were categorised either as ‘Dense – mono-culture or close to monoculture – very few native/other species present’, ‘Medium – roughly equal proportions of serrated tussock to other native/pasture/crop spe-cies present’, ‘Scattered – native/pasture/crop species in much greater abundance than serrated tussock’, ‘Rare – single or very few serrated tussock plants present’ or ‘Absent’. They were also asked to clas-sify what proportion of these infestations occurred on pasture land, native vegeta-tion or other (roadside, cropping, forestry etc). Respondents were also asked to indi-cate the costs as ‘Material costs’, ‘Labour costs’, ‘Time (days/year) cost’ and ‘Other costs’, to control serrated tussock infesta-tions in ‘pasture’, ‘native vegetation’ and ‘other’ land classes. Questions were asked about chemical control including what herbicides they used for serrated tussock, the number of times they used these her-bicides and the year they first used these herbicides. They were also asked whether they had noticed serrated tussock on the land they managed that had not died after two or more applications of a serrated tus-sock herbicide and whether they thought this could have been due to resistance.
ResultsDistribution and type of infestationA response rate of approximately 8% (399) was obtained while approximately 250 questionnaires were returned address unknown. The respondents reported on a total area of approximately 0.42 million ha consisting of pasture, native vegetation and other (roadsides, cropping, etc) across Australia. The respondents reported ser-rated tussock infestations totalling ap-proximately 102 048 ha comprising 48 747 ha on pasture, 43 019 ha in native vegeta-tion and 10 281 ha on other areas (road-sides, cropping etc). Of this total, some 82 094 ha was in NSW, 8113 ha in Victoria,
11 520 ha in the ACT and 321 ha in Tasma-nia (Table 1).
The most significant serrated tus-sock infestations reported occur in NSW where the majority of dense and medium infestations were reported on native veg-etation with more scattered and rare in-festations reported on pasture land (Ta-ble 1). Similarly, in the ACT respondents reported greater areas of dense, medium and scattered serrated tussock infesta-tions in native vegetation than pasture. However, in Victoria and Tasmania more serrated tussock was reported in pasture than in native vegetation. These results may also reflect that all the Victorian and Tasmanian land managers received ques-tionnaires through direct mail. However, in NSW and the ACT, questionnaires were sent via weeds officers, environmental of-ficers and agronomists for distribution to land managers. In some cases these pro-fessionals reported on an entire district or region. In Victoria, the ‘Other’ category recorded the largest area of dense serrated tussock. However, this was reported by a single landowner who did not provide contact details.
Economic impact Table 2 lists the annual costs of serrated tussock control expressed as materi-als, labour and other (other costs of ser-rated tussock not included in materials and labour) listed for land use and State
affected. As expected, NSW, the state with the most significant serrated tussock infestations are spending the most money on serrated tussock control ($691 759 per year and $7745 per respondent). However, land managers from the ACT are spend-ing on average $9405 per respondent per year on serrated tussock control which is more than double that reported for Victo-ria ($3862 per respondent per year) and Tasmania ($2130 per respondent per year). Labour was recorded as the greatest cost component in all land use types except in native vegetation in the ACT where $43 450 was spent on materials compared to $13 640 estimated for labour. The annual total production losses caused by serrated tussock is listed in Table 3. In total, pro-duction losses were estimated at $662 820 while the average losses per respondent was approximately $13 000 per year. In total, serrated tussock was estimated to be costing the respondents approximately $1.8 million in management costs and lost production or about $15–20,000 per year per respondent.
Herbicide resistanceTable 4 shows the number of respondents using flupropanate and glyphosate and average years/times used for control of serrated tussock compared by State. Al-most twice as many respondents were reported using flupropanate to glypho-sate in NSW and vice versa for Victoria.
Table 1. Serrated tussock infestations categorised by State, land use and density reported from survey
State Land use types
Serrated tussock infestation density (ha)
Dense Medium Scattered Rare TotalNSW Pasture 878 1 078 17 909 19 735 39 600
Native 1 099 4 303 16 798 10 855 33 055
Other 143 12 3 910 5 375 9 439
Total 2 120 5 393 38 617 35 965 82 094
VIC Pasture 37 371 2 353 2 754 5 515
Native 6 195 939 816 1 956
Other 99 70 225 247 642
Total 142 636 3 517 3 817 8 113
TAS Pasture 30 31 121 39 221
Native 1 2 64 28 95
Other 0 0 5 0 5
Total 31 33 190 67 321
ACT Pasture 190 25 2 130 1 067 3 412
Native 370 1 030 5 976 537 7 913
Other 0 0 45 150 195
Total 560 1 055 8 151 1 754 11 520
Total Australia 2 853 7 117 50 475 41 603 102 048
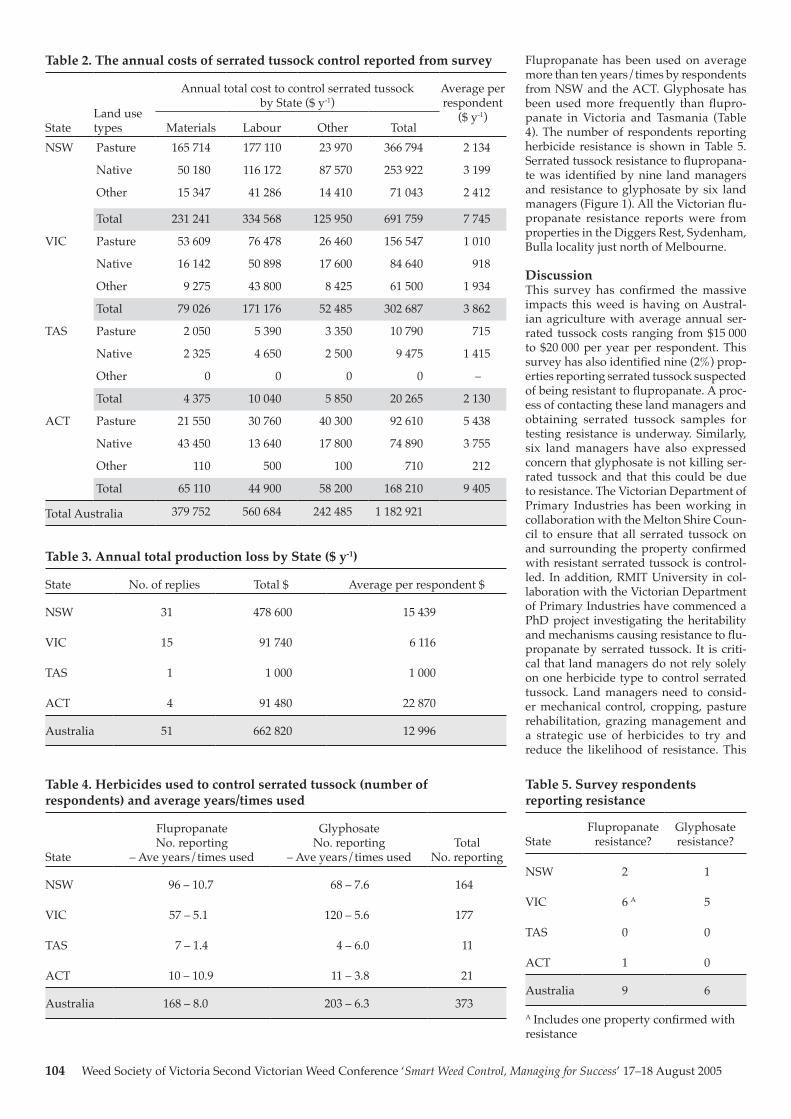
104 Weed Society of Victoria Second Victorian Weed Conference ‘Smart Weed Control, Managing for Success’ 17–18 August 2005
Flupropanate has been used on average more than ten years/times by respondents from NSW and the ACT. Glyphosate has been used more frequently than flupro-panate in Victoria and Tasmania (Table 4). The number of respondents reporting herbicide resistance is shown in Table 5. Serrated tussock resistance to flupropana-te was identified by nine land managers and resistance to glyphosate by six land managers (Figure 1). All the Victorian flu-propanate resistance reports were from properties in the Diggers Rest, Sydenham, Bulla locality just north of Melbourne.
DiscussionThis survey has confirmed the massive impacts this weed is having on Austral-ian agriculture with average annual ser-rated tussock costs ranging from $15 000 to $20 000 per year per respondent. This survey has also identified nine (2%) prop-erties reporting serrated tussock suspected of being resistant to flupropanate. A proc-ess of contacting these land managers and obtaining serrated tussock samples for testing resistance is underway. Similarly, six land managers have also expressed concern that glyphosate is not killing ser-rated tussock and that this could be due to resistance. The Victorian Department of Primary Industries has been working in collaboration with the Melton Shire Coun-cil to ensure that all serrated tussock on and surrounding the property confirmed with resistant serrated tussock is control-led. In addition, RMIT University in col-laboration with the Victorian Department of Primary Industries have commenced a PhD project investigating the heritability and mechanisms causing resistance to flu-propanate by serrated tussock. It is criti-cal that land managers do not rely solely on one herbicide type to control serrated tussock. Land managers need to consid-er mechanical control, cropping, pasture rehabilitation, grazing management and a strategic use of herbicides to try and reduce the likelihood of resistance. This
Table 3. Annual total production loss by State ($ y-1)
State No. of replies Total $ Average per respondent $
NSW 31 478 600 15 439
VIC 15 91 740 6 116
TAS 1 1 000 1 000
ACT 4 91 480 22 870
Australia 51 662 820 12 996
Table 4. Herbicides used to control serrated tussock (number of respondents) and average years/times used
State
Flupropanate No. reporting
– Ave years/times used
Glyphosate No. reporting
– Ave years/times usedTotal
No. reporting
NSW 96 – 10.7 68 – 7.6 164
VIC 57 – 5.1 120 – 5.6 177
TAS 7 – 1.4 4 – 6.0 11
ACT 10 – 10.9 11 – 3.8 21
Australia 168 – 8.0 203 – 6.3 373
Table 5. Survey respondents reporting resistance
StateFlupropanate
resistance?Glyphosate resistance?
NSW 2 1
VIC 6 A 5
TAS 0 0
ACT 1 0
Australia 9 6
A Includes one property confirmed with resistance
Table 2. The annual costs of serrated tussock control reported from survey
StateLand use types
Annual total cost to control serrated tussock by State ($ y-1)
Average per respondent
($ y-1)Materials Labour Other Total
NSW Pasture 165 714 177 110 23 970 366 794 2 134
Native 50 180 116 172 87 570 253 922 3 199
Other 15 347 41 286 14 410 71 043 2 412
Total 231 241 334 568 125 950 691 759 7 745
VIC Pasture 53 609 76 478 26 460 156 547 1 010
Native 16 142 50 898 17 600 84 640 918
Other 9 275 43 800 8 425 61 500 1 934
Total 79 026 171 176 52 485 302 687 3 862
TAS Pasture 2 050 5 390 3 350 10 790 715
Native 2 325 4 650 2 500 9 475 1 415
Other 0 0 0 0 –
Total 4 375 10 040 5 850 20 265 2 130
ACT Pasture 21 550 30 760 40 300 92 610 5 438
Native 43 450 13 640 17 800 74 890 3 755
Other 110 500 100 710 212
Total 65 110 44 900 58 200 168 210 9 405
Total Australia 379 752 560 684 242 485 1 182 921
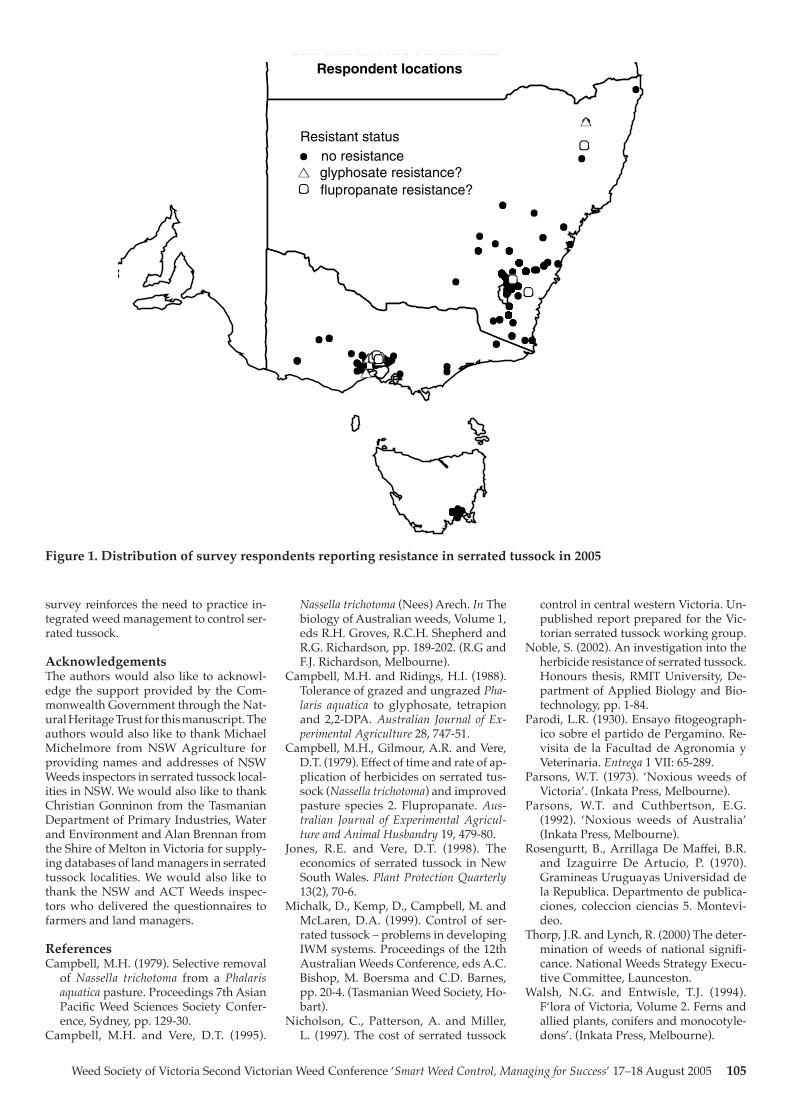
Weed Society of Victoria Second Victorian Weed Conference ‘Smart Weed Control, Managing for Success’ 17–18 August 2005 105
survey reinforces the need to practice in-tegrated weed management to control ser-rated tussock.
AcknowledgementsThe authors would also like to acknowl-edge the support provided by the Com-monwealth Government through the Nat-ural Heritage Trust for this manuscript. The authors would also like to thank Michael Michelmore from NSW Agriculture for providing names and addresses of NSW Weeds inspectors in serrated tussock local-ities in NSW. We would also like to thank Christian Gonninon from the Tasmanian Department of Primary Industries, Water and Environment and Alan Brennan from the Shire of Melton in Victoria for supply-ing databases of land managers in serrated tussock localities. We would also like to thank the NSW and ACT Weeds inspec-tors who delivered the questionnaires to farmers and land managers.
ReferencesCampbell, M.H. (1979). Selective removal
of Nassella trichotoma from a Phalaris aquatica pasture. Proceedings 7th Asian Pacific Weed Sciences Society Confer-ence, Sydney, pp. 129-30.
Campbell, M.H. and Vere, D.T. (1995).
Figure 1. Distribution of survey respondents reporting resistance in serrated tussock in 2005
Respondent locations
Resistant statusno resistanceglyphosate resistance?flupropanate resistance?
Nassella trichotoma (Nees) Arech. In The biology of Australian weeds, Volume 1, eds R.H. Groves, R.C.H. Shepherd and R.G. Richardson, pp. 189-202. (R.G and F.J. Richardson, Melbourne).
Campbell, M.H. and Ridings, H.I. (1988). Tolerance of grazed and ungrazed Pha-laris aquatica to glyphosate, tetrapion and 2,2-DPA. Australian Journal of Ex-perimental Agriculture 28, 747-51.
Campbell, M.H., Gilmour, A.R. and Vere, D.T. (1979). Effect of time and rate of ap-plication of herbicides on serrated tus-sock (Nassella trichotoma) and improved pasture species 2. Flupropanate. Aus-tralian Journal of Experimental Agricul-ture and Animal Husbandry 19, 479-80.
Jones, R.E. and Vere, D.T. (1998). The economics of serrated tussock in New South Wales. Plant Protection Quarterly 13(2), 70-6.
Michalk, D., Kemp, D., Campbell, M. and McLaren, D.A. (1999). Control of ser-rated tussock – problems in developing IWM systems. Proceedings of the 12th Australian Weeds Conference, eds A.C. Bishop, M. Boersma and C.D. Barnes, pp. 20-4. (Tasmanian Weed Society, Ho-bart).
Nicholson, C., Patterson, A. and Miller, L. (1997). The cost of serrated tussock
control in central western Victoria. Un-published report prepared for the Vic-torian serrated tussock working group.
Noble, S. (2002). An investigation into the herbicide resistance of serrated tussock. Honours thesis, RMIT University, De-partment of Applied Biology and Bio-technology, pp. 1-84.
Parodi, L.R. (1930). Ensayo fitogeograph-ico sobre el partido de Pergamino. Re-visita de la Facultad de Agronomia y Veterinaria. Entrega 1 VII: 65-289.
Parsons, W.T. (1973). ‘Noxious weeds of Victoria’. (Inkata Press, Melbourne).
Parsons, W.T. and Cuthbertson, E.G. (1992). ‘Noxious weeds of Australia’ (Inkata Press, Melbourne).
Rosengurtt, B., Arrillaga De Maffei, B.R. and Izaguirre De Artucio, P. (1970). Gramineas Uruguayas Universidad de la Republica. Departmento de publica-ciones, coleccion ciencias 5. Montevi-deo.
Thorp, J.R. and Lynch, R. (2000) The deter-mination of weeds of national signifi-cance. National Weeds Strategy Execu-tive Committee, Launceston.
Walsh, N.G. and Entwisle, T.J. (1994). F‘lora of Victoria, Volume 2. Ferns and allied plants, conifers and monocotyle-dons’. (Inkata Press, Melbourne).
106 Weed Society of Victoria Second Victorian Weed Conference ‘Smart Weed Control, Managing for Success’ 17–18 August 2005
Introduction Information is one of the main assets of the Department of Primary Industries Land-scape Protection program – the way in which it uses information is a major deter-minant of how successful the program will be in managing the pest plant problem in Victoria. Business-specific information is one of the main factors that influences how Landscape Protection field staff behave in their day-to-day business context. It im-pacts on how they meet challenges and solve problems, how they interact with clients, investors and each other, make decisions, take action and respond to the primary needs of the program. In turn, it is the information that field staff collect that informs the program leaders’ deci-sion making processes and communicates success to investors. It is this information that determines the future direction of the Landscape Protection program.
In this light, it seems obvious that the Landscape Protection program needs to ensure that it provides its field staff with the best information tools it practically can. In doing this it must ensure that it doesn’t simply design more ways to hold its information, but instead focuses on de-veloping a suite of innovative customised tools that meet specific information needs. Rather than tools that simply contribute from outside the process, it must employ tools that become an integral part of the process itself. Any tool developed for use by Landscape Protection field staff must be designed with their needs as the pri-mary focus. And most importantly, these tools must represent value to field staff – they must represent something that con-tributes to their work and enables them to perform at a level that realises their true potential.
One way in which this can be achieved is through providing information tools filed staff actually do their work rather than limiting them to office bound or low value hard copy field based systems. Field based information tools have the potential to unlock some significant gains for the Landscape Protection program in not only increased efficiency, but also improve-ments in the quality of the work the pro-gram does and the value it represents to investors, the community and other stake-holders in the weeds issue in Victoria.
The primary weed management infor-mation tool in Landscape Protection is the Integrated Pest Management System (IPMS). Use and user perception of IPMS is highly variable. While a few staff apply IPMS with a level of success, many feel that IPMS is not a tool that effectively meets their day-to-day needs – a tool designed to meet business management, not opera-tional information needs. Regardless of the validity of these perceptions, the very real fact remains that developers have to date been unsuccessful in effectively meet-ing field staff information needs.
The most common complaint in relation to IPMS is the limited ability for staff to ex-tract useable information. IPMS contains a variety of standard reports readily avail-able to all registered users. In addition to this, a team of support officers across the state is available to provide customised in-formation products such as queries and re-ports using InfoMaker. Yet these negative perceptions remain reflected in comments such as ‘its like an information black hole’, ‘I put information in, but I can’t get it back out in a form that I can use’ and ‘IPMS doesn’t help me do my job’.
Assuming that the reports in IPMS do provide the type of information field staff require, the Landscape Protection pro-gram needs to look at why their informa-tion needs still aren’t being satisfactorily met. If it is not the reports themselves – the information they contain – is it the format and delivery mechanism that is proving inadequate?
Current information practicesSo what are the basic information needs of field staff and how are they currently meeting their own information needs as well as the data capture requirements of program leaders? There are three main types of information currently being uti-lised in Landscape Protection – spatial, photographic and textual. All of these play a role at various stages in the core Land-scape Protection education, extension and compliance processes. Throughout these processes there is a constant two-way ex-change of information taking place (Table 1).
Data supports and informs program decisions, is used to measure, and is re-corded throughout the entire process. The
methods and tools used vary considerably across the program and range from use of local knowledge, to electronically auto-mated processes.• Local knowledge—What the team
members knows about his or her work and local area. This extends to where infestations are, ownership history, works history and the results of pre-vious contacts. Local knowledge ob-viously grows over time and in many cases, the longer a person has worked an area, the more likely they are to rely on local knowledge as their primary in-formation tool. There are many obvious issues with the reliability of this type of information tool and it should always be supported by a reliable electronic or hardcopy resource. However, there are some distinct advantages – the human brain is after all a powerful database – though these are limited to the indi-vidual holding the knowledge.
• Land holder file—Hardcopy files that record the contacts and the outcomes of contacts with each land holder in a work area. These are formed and maintained purely by the choice of the individual staff member and are not a standard tool. There are no standard formats, contents or storage protocols. They can be a useful tool recording a level of detail not contained in other standard databases such as IPMS. However they do perpetuate all the issues associated with a purely hardcopy system.
• Paper based forms—Work Plan Agree-ments record the actions agreed to and required of the land holder and consti-tute a request made by DPI to the land holder. Data entry forms are used as a field tool to capture the mandatory information required by IPMS.
• IPMS—The primary database of the Landscape Protection program which records information on assessments, infestations, properties, land holders, contacts, treatments and the like. IPMS can provide information of previous contacts in the form of a reassessment report.
• Spatial databases and related tools Spatial data and associated tools are themselves the subject of great vari-ability in terms of sophistication and functionality and the means in which they are applied. IPMS itself records some spatial information in the form of points describing the location of each infestation. In addition to this, DPI has access to a wide array of corporate spa-tial data. Some tools include ArcView, MapShare (an intranet based map serv-ice based on ESRIs ArcIMS), mobile GIS (primarily ArcPad), and various GPS tools.
Because of the number of contrasting in-formation sources available to field staff, it is obvious that there is no one standard
Applying field-based information tools to weed management – an examination of field information issues in DPIS Landscape Protection Program
Naomi Wilson, Department of Primary Industries, Benalla, Victoria 3672
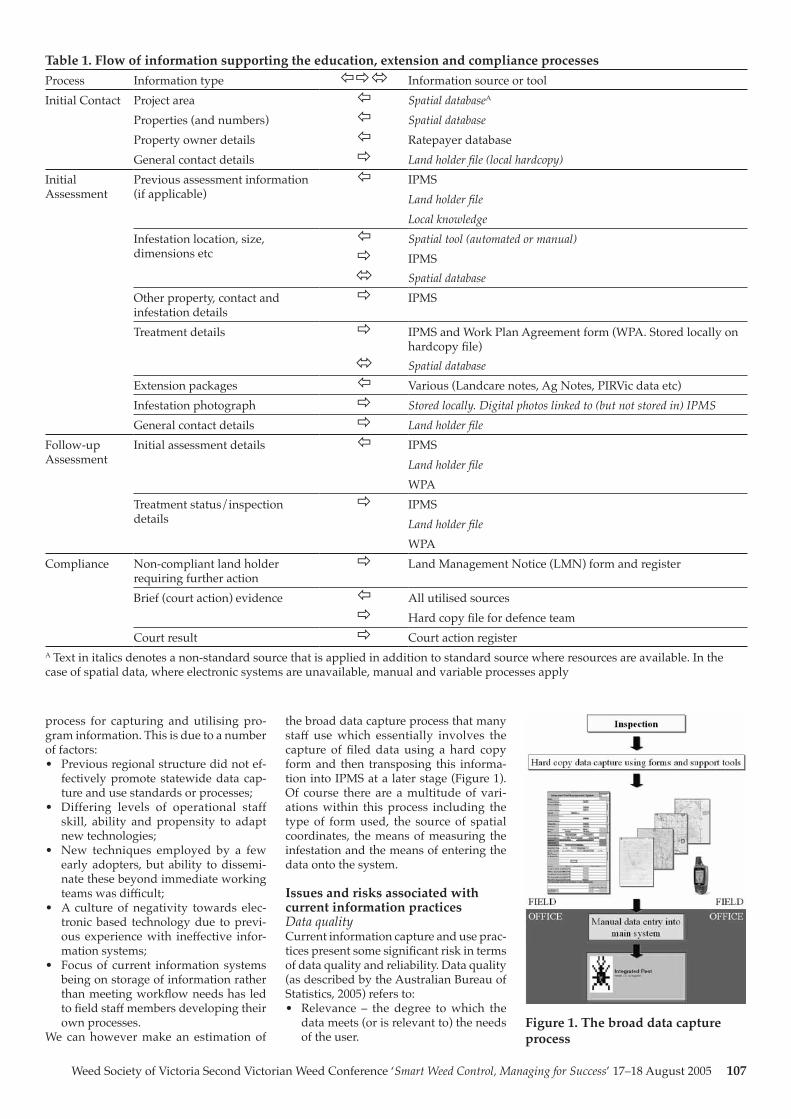
Weed Society of Victoria Second Victorian Weed Conference ‘Smart Weed Control, Managing for Success’ 17–18 August 2005 107
process for capturing and utilising pro-gram information. This is due to a number of factors:• Previous regional structure did not ef-
fectively promote statewide data cap-ture and use standards or processes;
• Differing levels of operational staff skill, ability and propensity to adapt new technologies;
• New techniques employed by a few early adopters, but ability to dissemi-nate these beyond immediate working teams was difficult;
• A culture of negativity towards elec-tronic based technology due to previ-ous experience with ineffective infor-mation systems;
• Focus of current information systems being on storage of information rather than meeting workflow needs has led to field staff members developing their own processes.
We can however make an estimation of
the broad data capture process that many staff use which essentially involves the capture of filed data using a hard copy form and then transposing this informa-tion into IPMS at a later stage (Figure 1). Of course there are a multitude of vari-ations within this process including the type of form used, the source of spatial coordinates, the means of measuring the infestation and the means of entering the data onto the system.
Issues and risks associated with current information practices Data qualityCurrent information capture and use prac-tices present some significant risk in terms of data quality and reliability. Data quality (as described by the Australian Bureau of Statistics, 2005) refers to: • Relevance – the degree to which the
data meets (or is relevant to) the needs of the user.
Table 1. Flow of information supporting the education, extension and compliance processesProcess Information type Information source or toolInitial Contact Project area Spatial databaseA
Properties (and numbers) Spatial database Property owner details Ratepayer databaseGeneral contact details Land holder file (local hardcopy)
Initial Assessment
Previous assessment information (if applicable)
IPMS Land holder file Local knowledge
Infestation location, size, dimensions etc
Spatial tool (automated or manual) IPMS Spatial database
Other property, contact and infestation details
IPMS
Treatment details IPMS and Work Plan Agreement form (WPA. Stored locally on hardcopy file)
Spatial databaseExtension packages Various (Landcare notes, Ag Notes, PIRVic data etc)Infestation photograph Stored locally. Digital photos linked to (but not stored in) IPMS General contact details Land holder file
Follow-up Assessment
Initial assessment details IPMS Land holder file WPA
Treatment status/inspection details
IPMS Land holder file WPA
Compliance Non-compliant land holder requiring further action
Land Management Notice (LMN) form and register
Brief (court action) evidence All utilised sources Hard copy file for defence team
Court result Court action registerA Text in italics denotes a non-standard source that is applied in addition to standard source where resources are available. In the case of spatial data, where electronic systems are unavailable, manual and variable processes apply
Figure 1. The broad data capture process
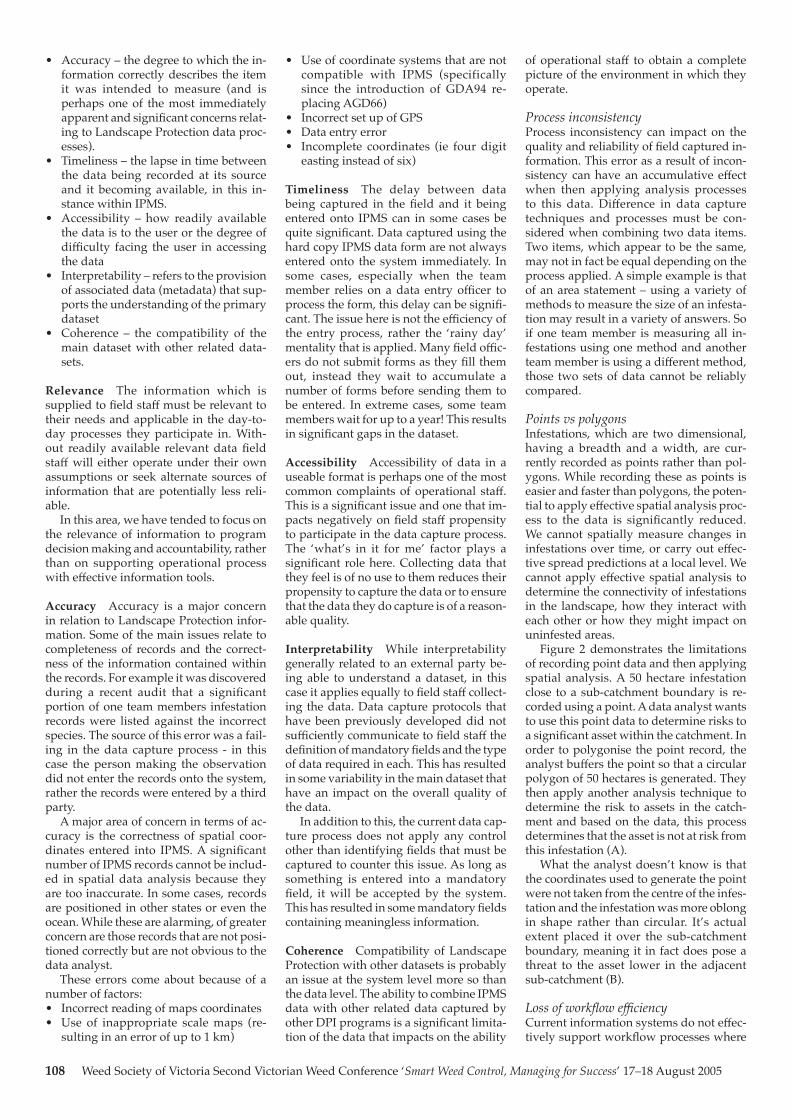
108 Weed Society of Victoria Second Victorian Weed Conference ‘Smart Weed Control, Managing for Success’ 17–18 August 2005
• Accuracy – the degree to which the in-formation correctly describes the item it was intended to measure (and is perhaps one of the most immediately apparent and significant concerns relat-ing to Landscape Protection data proc-esses).
• Timeliness – the lapse in time between the data being recorded at its source and it becoming available, in this in-stance within IPMS.
• Accessibility – how readily available the data is to the user or the degree of difficulty facing the user in accessing the data
• Interpretability – refers to the provision of associated data (metadata) that sup-ports the understanding of the primary dataset
• Coherence – the compatibility of the main dataset with other related data-sets.
Relevance—The information which is supplied to field staff must be relevant to their needs and applicable in the day-to-day processes they participate in. With-out readily available relevant data field staff will either operate under their own assumptions or seek alternate sources of information that are potentially less reli-able.
In this area, we have tended to focus on the relevance of information to program decision making and accountability, rather than on supporting operational process with effective information tools.
Accuracy—Accuracy is a major concern in relation to Landscape Protection infor-mation. Some of the main issues relate to completeness of records and the correct-ness of the information contained within the records. For example it was discovered during a recent audit that a significant portion of one team members infestation records were listed against the incorrect species. The source of this error was a fail-ing in the data capture process - in this case the person making the observation did not enter the records onto the system, rather the records were entered by a third party.
A major area of concern in terms of ac-curacy is the correctness of spatial coor-dinates entered into IPMS. A significant number of IPMS records cannot be includ-ed in spatial data analysis because they are too inaccurate. In some cases, records are positioned in other states or even the ocean. While these are alarming, of greater concern are those records that are not posi-tioned correctly but are not obvious to the data analyst.
These errors come about because of a number of factors:• Incorrect reading of maps coordinates• Use of inappropriate scale maps (re-
sulting in an error of up to 1 km)
• Use of coordinate systems that are not compatible with IPMS (specifically since the introduction of GDA94 re-placing AGD66)
• Incorrect set up of GPS• Data entry error• Incomplete coordinates (ie four digit
easting instead of six)
Timeliness—The delay between data being captured in the field and it being entered onto IPMS can in some cases be quite significant. Data captured using the hard copy IPMS data form are not always entered onto the system immediately. In some cases, especially when the team member relies on a data entry officer to process the form, this delay can be signifi-cant. The issue here is not the efficiency of the entry process, rather the ‘rainy day’ mentality that is applied. Many field offic-ers do not submit forms as they fill them out, instead they wait to accumulate a number of forms before sending them to be entered. In extreme cases, some team members wait for up to a year! This results in significant gaps in the dataset.
Accessibility—Accessibility of data in a useable format is perhaps one of the most common complaints of operational staff. This is a significant issue and one that im-pacts negatively on field staff propensity to participate in the data capture process. The ‘what’s in it for me’ factor plays a significant role here. Collecting data that they feel is of no use to them reduces their propensity to capture the data or to ensure that the data they do capture is of a reason-able quality.
Interpretability—While interpretability generally related to an external party be-ing able to understand a dataset, in this case it applies equally to field staff collect-ing the data. Data capture protocols that have been previously developed did not sufficiently communicate to field staff the definition of mandatory fields and the type of data required in each. This has resulted in some variability in the main dataset that have an impact on the overall quality of the data.
In addition to this, the current data cap-ture process does not apply any control other than identifying fields that must be captured to counter this issue. As long as something is entered into a mandatory field, it will be accepted by the system. This has resulted in some mandatory fields containing meaningless information.
Coherence—Compatibility of Landscape Protection with other datasets is probably an issue at the system level more so than the data level. The ability to combine IPMS data with other related data captured by other DPI programs is a significant limita-tion of the data that impacts on the ability
of operational staff to obtain a complete picture of the environment in which they operate.
Process inconsistencyProcess inconsistency can impact on the quality and reliability of field captured in-formation. This error as a result of incon-sistency can have an accumulative effect when then applying analysis processes to this data. Difference in data capture techniques and processes must be con-sidered when combining two data items. Two items, which appear to be the same, may not in fact be equal depending on the process applied. A simple example is that of an area statement – using a variety of methods to measure the size of an infesta-tion may result in a variety of answers. So if one team member is measuring all in-festations using one method and another team member is using a different method, those two sets of data cannot be reliably compared.
Points vs polygonsInfestations, which are two dimensional, having a breadth and a width, are cur-rently recorded as points rather than pol-ygons. While recording these as points is easier and faster than polygons, the poten-tial to apply effective spatial analysis proc-ess to the data is significantly reduced. We cannot spatially measure changes in infestations over time, or carry out effec-tive spread predictions at a local level. We cannot apply effective spatial analysis to determine the connectivity of infestations in the landscape, how they interact with each other or how they might impact on uninfested areas.
Figure 2 demonstrates the limitations of recording point data and then applying spatial analysis. A 50 hectare infestation close to a sub-catchment boundary is re-corded using a point. A data analyst wants to use this point data to determine risks to a significant asset within the catchment. In order to polygonise the point record, the analyst buffers the point so that a circular polygon of 50 hectares is generated. They then apply another analysis technique to determine the risk to assets in the catch-ment and based on the data, this process determines that the asset is not at risk from this infestation (A).
What the analyst doesn’t know is that the coordinates used to generate the point were not taken from the centre of the infes-tation and the infestation was more oblong in shape rather than circular. It’s actual extent placed it over the sub-catchment boundary, meaning it in fact does pose a threat to the asset lower in the adjacent sub-catchment (B).
Loss of workflow efficiencyCurrent information systems do not effec-tively support workflow processes where
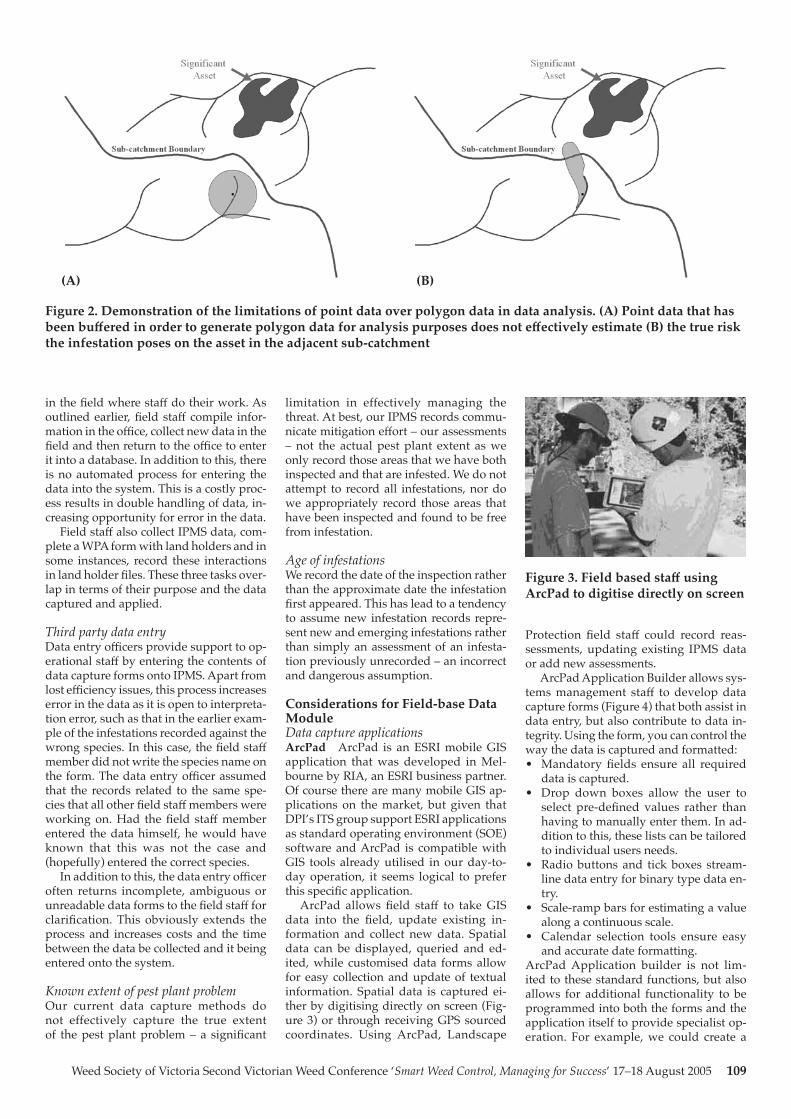
Weed Society of Victoria Second Victorian Weed Conference ‘Smart Weed Control, Managing for Success’ 17–18 August 2005 109
in the field where staff do their work. As outlined earlier, field staff compile infor-mation in the office, collect new data in the field and then return to the office to enter it into a database. In addition to this, there is no automated process for entering the data into the system. This is a costly proc-ess results in double handling of data, in-creasing opportunity for error in the data.
Field staff also collect IPMS data, com-plete a WPA form with land holders and in some instances, record these interactions in land holder files. These three tasks over-lap in terms of their purpose and the data captured and applied.
Third party data entryData entry officers provide support to op-erational staff by entering the contents of data capture forms onto IPMS. Apart from lost efficiency issues, this process increases error in the data as it is open to interpreta-tion error, such as that in the earlier exam-ple of the infestations recorded against the wrong species. In this case, the field staff member did not write the species name on the form. The data entry officer assumed that the records related to the same spe-cies that all other field staff members were working on. Had the field staff member entered the data himself, he would have known that this was not the case and (hopefully) entered the correct species.
In addition to this, the data entry officer often returns incomplete, ambiguous or unreadable data forms to the field staff for clarification. This obviously extends the process and increases costs and the time between the data be collected and it being entered onto the system.
Known extent of pest plant problemOur current data capture methods do not effectively capture the true extent of the pest plant problem – a significant
limitation in effectively managing the threat. At best, our IPMS records commu-nicate mitigation effort – our assessments – not the actual pest plant extent as we only record those areas that we have both inspected and that are infested. We do not attempt to record all infestations, nor do we appropriately record those areas that have been inspected and found to be free from infestation.
Age of infestationsWe record the date of the inspection rather than the approximate date the infestation first appeared. This has lead to a tendency to assume new infestation records repre-sent new and emerging infestations rather than simply an assessment of an infesta-tion previously unrecorded – an incorrect and dangerous assumption.
Considerations for Field-base Data ModuleData capture applicationsArcPad—ArcPad is an ESRI mobile GIS application that was developed in Mel-bourne by RIA, an ESRI business partner. Of course there are many mobile GIS ap-plications on the market, but given that DPI’s ITS group support ESRI applications as standard operating environment (SOE) software and ArcPad is compatible with GIS tools already utilised in our day-to-day operation, it seems logical to prefer this specific application.
ArcPad allows field staff to take GIS data into the field, update existing in-formation and collect new data. Spatial data can be displayed, queried and ed-ited, while customised data forms allow for easy collection and update of textual information. Spatial data is captured ei-ther by digitising directly on screen (Fig-ure 3) or through receiving GPS sourced coordinates. Using ArcPad, Landscape
Protection field staff could record reas-sessments, updating existing IPMS data or add new assessments.
ArcPad Application Builder allows sys-tems management staff to develop data capture forms (Figure 4) that both assist in data entry, but also contribute to data in-tegrity. Using the form, you can control the way the data is captured and formatted:• Mandatory fields ensure all required
data is captured. • Drop down boxes allow the user to
select pre-defined values rather than having to manually enter them. In ad-dition to this, these lists can be tailored to individual users needs.
• Radio buttons and tick boxes stream-line data entry for binary type data en-try.
• Scale-ramp bars for estimating a value along a continuous scale.
• Calendar selection tools ensure easy and accurate date formatting.
ArcPad Application builder is not lim-ited to these standard functions, but also allows for additional functionality to be programmed into both the forms and the application itself to provide specialist op-eration. For example, we could create a
Figure 3. Field based staff using ArcPad to digitise directly on screen
(A) (B)
Figure 2. Demonstration of the limitations of point data over polygon data in data analysis. (A) Point data that has been buffered in order to generate polygon data for analysis purposes does not effectively estimate (B) the true risk the infestation poses on the asset in the adjacent sub-catchment
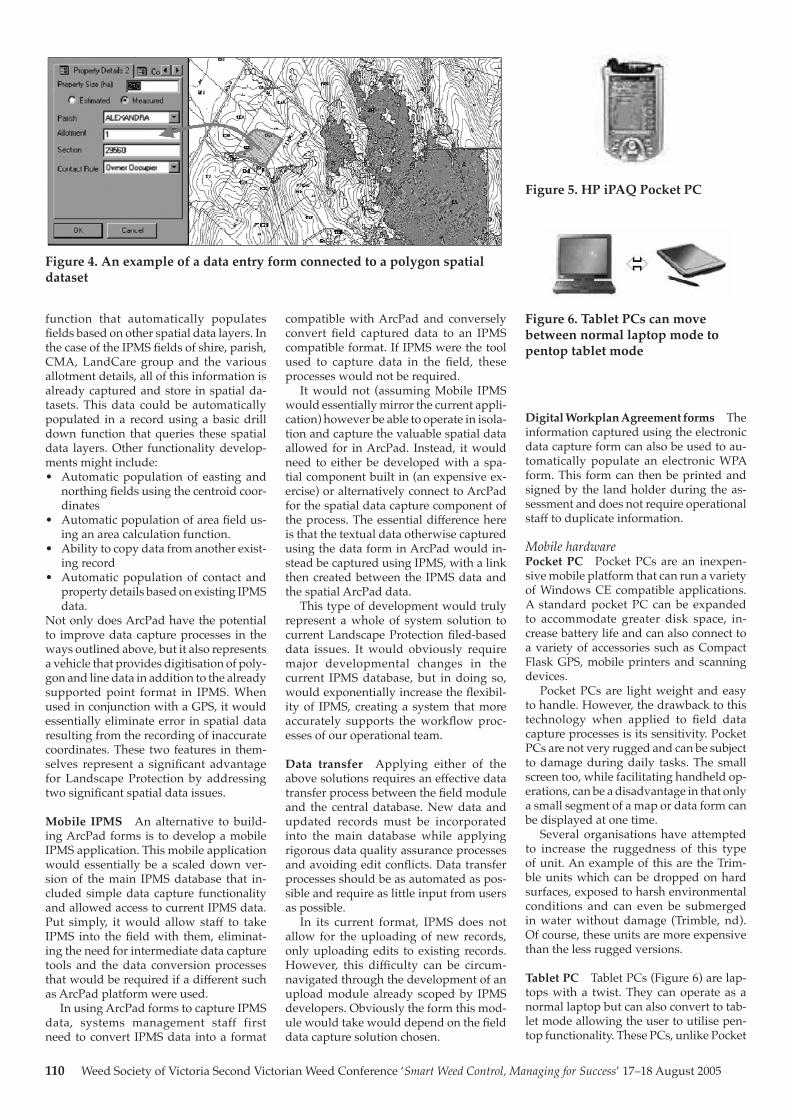
110 Weed Society of Victoria Second Victorian Weed Conference ‘Smart Weed Control, Managing for Success’ 17–18 August 2005
function that automatically populates fields based on other spatial data layers. In the case of the IPMS fields of shire, parish, CMA, LandCare group and the various allotment details, all of this information is already captured and store in spatial da-tasets. This data could be automatically populated in a record using a basic drill down function that queries these spatial data layers. Other functionality develop-ments might include:• Automatic population of easting and
northing fields using the centroid coor-dinates
• Automatic population of area field us-ing an area calculation function.
• Ability to copy data from another exist-ing record
• Automatic population of contact and property details based on existing IPMS data.
Not only does ArcPad have the potential to improve data capture processes in the ways outlined above, but it also represents a vehicle that provides digitisation of poly-gon and line data in addition to the already supported point format in IPMS. When used in conjunction with a GPS, it would essentially eliminate error in spatial data resulting from the recording of inaccurate coordinates. These two features in them-selves represent a significant advantage for Landscape Protection by addressing two significant spatial data issues.
Mobile IPMS—An alternative to build-ing ArcPad forms is to develop a mobile IPMS application. This mobile application would essentially be a scaled down ver-sion of the main IPMS database that in-cluded simple data capture functionality and allowed access to current IPMS data. Put simply, it would allow staff to take IPMS into the field with them, eliminat-ing the need for intermediate data capture tools and the data conversion processes that would be required if a different such as ArcPad platform were used.
In using ArcPad forms to capture IPMS data, systems management staff first need to convert IPMS data into a format
compatible with ArcPad and conversely convert field captured data to an IPMS compatible format. If IPMS were the tool used to capture data in the field, these processes would not be required.
It would not (assuming Mobile IPMS would essentially mirror the current appli-cation) however be able to operate in isola-tion and capture the valuable spatial data allowed for in ArcPad. Instead, it would need to either be developed with a spa-tial component built in (an expensive ex-ercise) or alternatively connect to ArcPad for the spatial data capture component of the process. The essential difference here is that the textual data otherwise captured using the data form in ArcPad would in-stead be captured using IPMS, with a link then created between the IPMS data and the spatial ArcPad data.
This type of development would truly represent a whole of system solution to current Landscape Protection filed-based data issues. It would obviously require major developmental changes in the current IPMS database, but in doing so, would exponentially increase the flexibil-ity of IPMS, creating a system that more accurately supports the workflow proc-esses of our operational team.
Data transfer—Applying either of the above solutions requires an effective data transfer process between the field module and the central database. New data and updated records must be incorporated into the main database while applying rigorous data quality assurance processes and avoiding edit conflicts. Data transfer processes should be as automated as pos-sible and require as little input from users as possible.
In its current format, IPMS does not allow for the uploading of new records, only uploading edits to existing records. However, this difficulty can be circum-navigated through the development of an upload module already scoped by IPMS developers. Obviously the form this mod-ule would take would depend on the field data capture solution chosen.
Digital Workplan Agreement forms—The information captured using the electronic data capture form can also be used to au-tomatically populate an electronic WPA form. This form can then be printed and signed by the land holder during the as-sessment and does not require operational staff to duplicate information.
Mobile hardwarePocket PC—Pocket PCs are an inexpen-sive mobile platform that can run a variety of Windows CE compatible applications. A standard pocket PC can be expanded to accommodate greater disk space, in-crease battery life and can also connect to a variety of accessories such as Compact Flask GPS, mobile printers and scanning devices.
Pocket PCs are light weight and easy to handle. However, the drawback to this technology when applied to field data capture processes is its sensitivity. Pocket PCs are not very rugged and can be subject to damage during daily tasks. The small screen too, while facilitating handheld op-erations, can be a disadvantage in that only a small segment of a map or data form can be displayed at one time.
Several organisations have attempted to increase the ruggedness of this type of unit. An example of this are the Trim-ble units which can be dropped on hard surfaces, exposed to harsh environmental conditions and can even be submerged in water without damage (Trimble, nd). Of course, these units are more expensive than the less rugged versions.
Tablet PC—Tablet PCs (Figure 6) are lap-tops with a twist. They can operate as a normal laptop but can also convert to tab-let mode allowing the user to utilise pen-top functionality. These PCs, unlike Pocket
Figure 4. An example of a data entry form connected to a polygon spatial dataset
Figure 5. HP iPAQ Pocket PC
Figure 6. Tablet PCs can move between normal laptop mode to pentop tablet mode
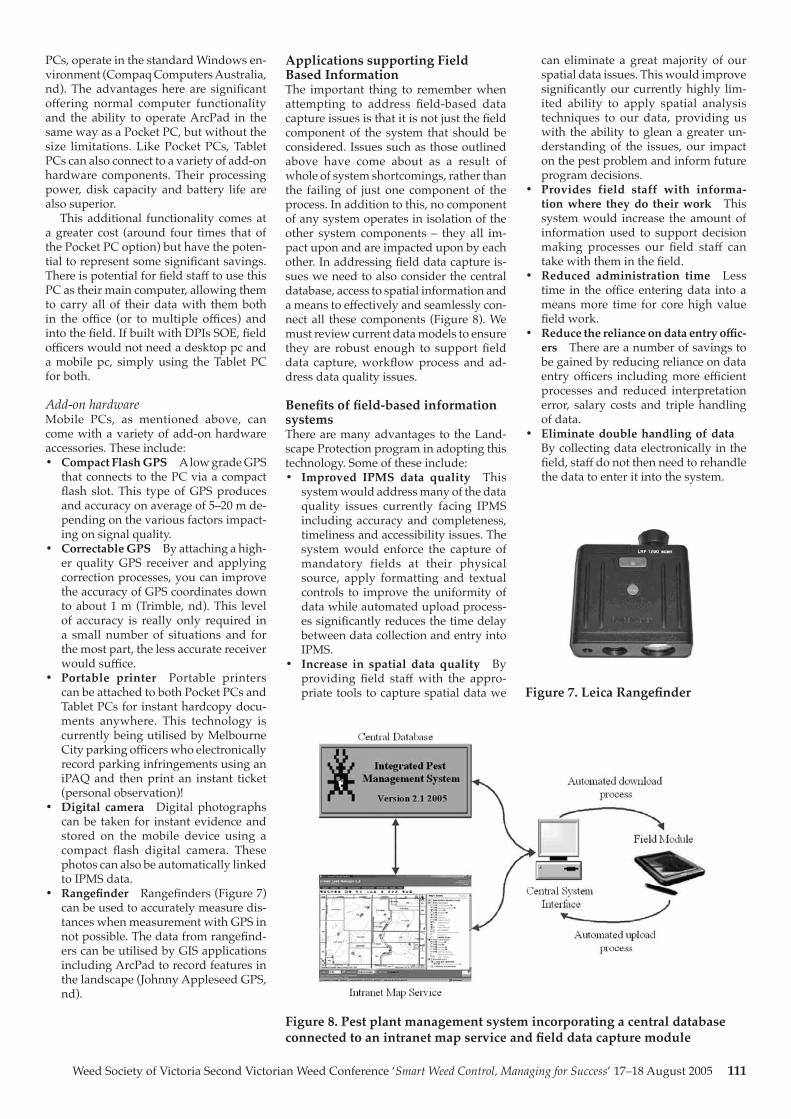
Weed Society of Victoria Second Victorian Weed Conference ‘Smart Weed Control, Managing for Success’ 17–18 August 2005 111
PCs, operate in the standard Windows en-vironment (Compaq Computers Australia, nd). The advantages here are significant offering normal computer functionality and the ability to operate ArcPad in the same way as a Pocket PC, but without the size limitations. Like Pocket PCs, Tablet PCs can also connect to a variety of add-on hardware components. Their processing power, disk capacity and battery life are also superior.
This additional functionality comes at a greater cost (around four times that of the Pocket PC option) but have the poten-tial to represent some significant savings. There is potential for field staff to use this PC as their main computer, allowing them to carry all of their data with them both in the office (or to multiple offices) and into the field. If built with DPIs SOE, field officers would not need a desktop pc and a mobile pc, simply using the Tablet PC for both.
Add-on hardwareMobile PCs, as mentioned above, can come with a variety of add-on hardware accessories. These include:• Compact Flash GPS—A low grade GPS
that connects to the PC via a compact flash slot. This type of GPS produces and accuracy on average of 5–20 m de-pending on the various factors impact-ing on signal quality.
• Correctable GPS—By attaching a high-er quality GPS receiver and applying correction processes, you can improve the accuracy of GPS coordinates down to about 1 m (Trimble, nd). This level of accuracy is really only required in a small number of situations and for the most part, the less accurate receiver would suffice.
• Portable printer—Portable printers can be attached to both Pocket PCs and Tablet PCs for instant hardcopy docu-ments anywhere. This technology is currently being utilised by Melbourne City parking officers who electronically record parking infringements using an iPAQ and then print an instant ticket (personal observation)!
• Digital camera—Digital photographs can be taken for instant evidence and stored on the mobile device using a compact flash digital camera. These photos can also be automatically linked to IPMS data.
• Rangefinder—Rangefinders (Figure 7) can be used to accurately measure dis-tances when measurement with GPS in not possible. The data from rangefind-ers can be utilised by GIS applications including ArcPad to record features in the landscape (Johnny Appleseed GPS, nd).
Applications supporting Field Based InformationThe important thing to remember when attempting to address field-based data capture issues is that it is not just the field component of the system that should be considered. Issues such as those outlined above have come about as a result of whole of system shortcomings, rather than the failing of just one component of the process. In addition to this, no component of any system operates in isolation of the other system components – they all im-pact upon and are impacted upon by each other. In addressing field data capture is-sues we need to also consider the central database, access to spatial information and a means to effectively and seamlessly con-nect all these components (Figure 8). We must review current data models to ensure they are robust enough to support field data capture, workflow process and ad-dress data quality issues.
Benefits of field-based information systemsThere are many advantages to the Land-scape Protection program in adopting this technology. Some of these include:• Improved IPMS data quality—This
system would address many of the data quality issues currently facing IPMS including accuracy and completeness, timeliness and accessibility issues. The system would enforce the capture of mandatory fields at their physical source, apply formatting and textual controls to improve the uniformity of data while automated upload process-es significantly reduces the time delay between data collection and entry into IPMS.
• Increase in spatial data quality—By providing field staff with the appro-priate tools to capture spatial data we
can eliminate a great majority of our spatial data issues. This would improve significantly our currently highly lim-ited ability to apply spatial analysis techniques to our data, providing us with the ability to glean a greater un-derstanding of the issues, our impact on the pest problem and inform future program decisions.
• Provides field staff with informa-tion where they do their work—This system would increase the amount of information used to support decision making processes our field staff can take with them in the field.
• Reduced administration time—Less time in the office entering data into a means more time for core high value field work.
• Reduce the reliance on data entry offic-ers—There are a number of savings to be gained by reducing reliance on data entry officers including more efficient processes and reduced interpretation error, salary costs and triple handling of data.
• Eliminate double handling of data—By collecting data electronically in the field, staff do not then need to rehandle the data to enter it into the system.
Figure 7. Leica Rangefinder
Figure 8. Pest plant management system incorporating a central database connected to an intranet map service and field data capture module
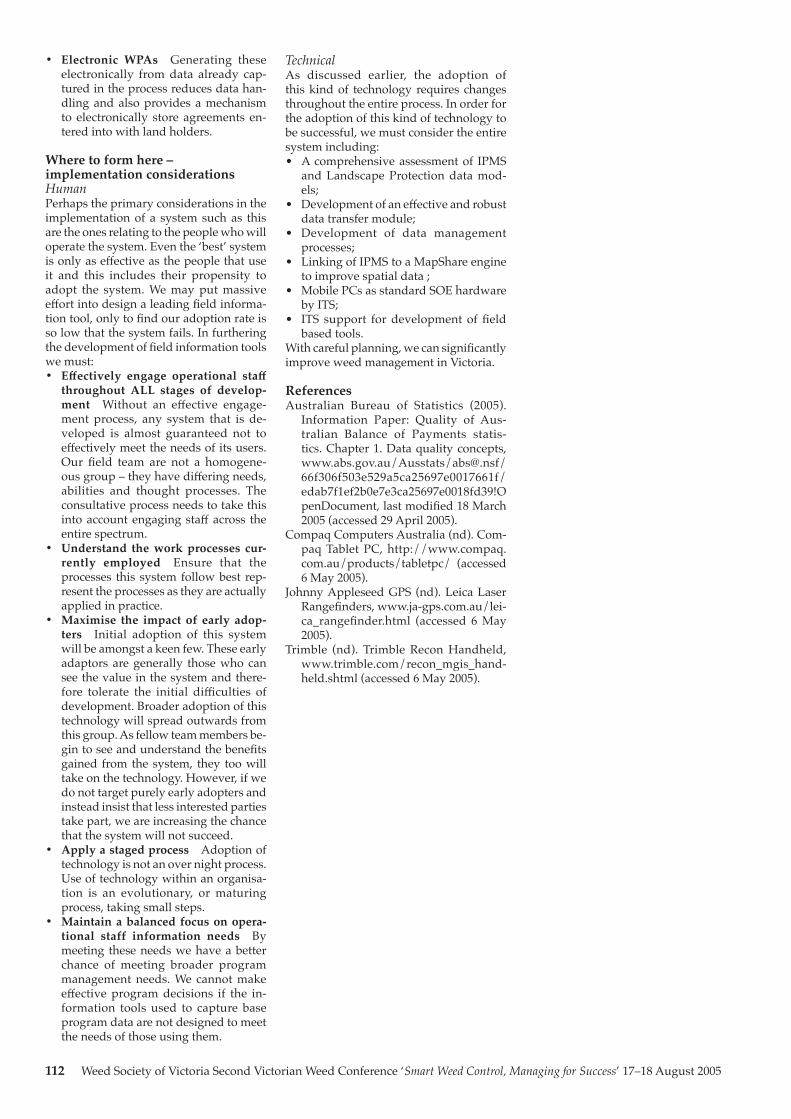
112 Weed Society of Victoria Second Victorian Weed Conference ‘Smart Weed Control, Managing for Success’ 17–18 August 2005
• Electronic WPAs—Generating these electronically from data already cap-tured in the process reduces data han-dling and also provides a mechanism to electronically store agreements en-tered into with land holders.
Where to form here – implementation considerationsHuman Perhaps the primary considerations in the implementation of a system such as this are the ones relating to the people who will operate the system. Even the ‘best’ system is only as effective as the people that use it and this includes their propensity to adopt the system. We may put massive effort into design a leading field informa-tion tool, only to find our adoption rate is so low that the system fails. In furthering the development of field information tools we must:• Effectively engage operational staff
throughout ALL stages of develop-ment—Without an effective engage-ment process, any system that is de-veloped is almost guaranteed not to effectively meet the needs of its users. Our field team are not a homogene-ous group – they have differing needs, abilities and thought processes. The consultative process needs to take this into account engaging staff across the entire spectrum.
• Understand the work processes cur-rently employed—Ensure that the processes this system follow best rep-resent the processes as they are actually applied in practice.
• Maximise the impact of early adop-ters—Initial adoption of this system will be amongst a keen few. These early adaptors are generally those who can see the value in the system and there-fore tolerate the initial difficulties of development. Broader adoption of this technology will spread outwards from this group. As fellow team members be-gin to see and understand the benefits gained from the system, they too will take on the technology. However, if we do not target purely early adopters and instead insist that less interested parties take part, we are increasing the chance that the system will not succeed.
• Apply a staged process—Adoption of technology is not an over night process. Use of technology within an organisa-tion is an evolutionary, or maturing process, taking small steps.
• Maintain a balanced focus on opera-tional staff information needs—By meeting these needs we have a better chance of meeting broader program management needs. We cannot make effective program decisions if the in-formation tools used to capture base program data are not designed to meet the needs of those using them.
TechnicalAs discussed earlier, the adoption of this kind of technology requires changes throughout the entire process. In order for the adoption of this kind of technology to be successful, we must consider the entire system including:• A comprehensive assessment of IPMS
and Landscape Protection data mod-els;
• Development of an effective and robust data transfer module;
• Development of data management processes;
• Linking of IPMS to a MapShare engine to improve spatial data ;
• Mobile PCs as standard SOE hardware by ITS;
• ITS support for development of field based tools.
With careful planning, we can significantly improve weed management in Victoria.
ReferencesAustralian Bureau of Statistics (2005).
Information Paper: Quality of Aus-tralian Balance of Payments statis-tics. Chapter 1. Data quality concepts, www.abs.gov.au/Ausstats/[email protected]/66f306f503e529a5ca25697e0017661f/edab7f1ef2b0e7e3ca25697e0018fd39!OpenDocument, last modified 18 March 2005 (accessed 29 April 2005).
Compaq Computers Australia (nd). Com-paq Tablet PC, http://www.compaq.com.au/products/tabletpc/ (accessed 6 May 2005).
Johnny Appleseed GPS (nd). Leica Laser Rangefinders, www.ja-gps.com.au/lei-ca_rangefinder.html (accessed 6 May 2005).
Trimble (nd). Trimble Recon Handheld, www.trimble.com/recon_mgis_hand-held.shtml (accessed 6 May 2005).
Weed Society of Victoria Second Victorian Weed Conference ‘Smart Weed Control, Managing for Success’ 17–18 August 2005 113
Many old hands will tell you there is noth-ing new in agriculture. I hope to persuade you otherwise in this paper, despite many elements of ‘re-discovery’ that will un-fold.
Sowing of crops in rows was adopted some 300 years ago when Jethro Tull in-vented his horse drawn seed drill and hoe to enable inter-row tillage. For the next 250 years, weed management in grain crops relied in the main upon cleanly tilled seedbeds and manual guidance of hand pushed or horse pulled inter-row cultiva-tors. Today, the vast majority of Australian winter grain crops are grown in rows, yet inter-row tillage is conspicuously absent. In the relentless quest for economies of scale, equipment and crop size became too large to permit tillage using manual guidance; especially at the high levels of precision required for crop rows spaced less than 50 cm apart.
Prior to the advent of selective herbi-cides, crop losses due to weed competi-tion were often substantial. Grain grow-ers regularly resorted to strategies to deplete weed seedbanks, including long fallowing, haycutting and delayed seed-ing which often entailed negative impacts upon soil structure, fertility and crop yield.
During the 40 years after World War 2, remarkable innovations in organic chem-istry produced a proliferation of new her-bicides with differing modes of action and crop selectivity. Herbicide development has, by and large stalled however, with no new herbicide groups presented to Aus-tralian grain farmers in the past twenty years. Research endeavours with herbi-cides are declining as a result of fewer prospects, patent maturation leading to in-tense generic competition and widespread company mergers. Consequences in the marketplace are the triumph of image over substance, as advertising agencies attempt to become the drivers of change, rather than the technical attributes of the prod-ucts. This is often achieved by re-badging of the same active ingredients to create an illusion of innovation.
Pre-sowing tillage for seedbed prepara-tion has been progressively discarded over the past 30 years in southern cropping systems of Australia by the substitution of herbicides for cultivation.
No-tillage agriculture has benefited from major and patient investments by
the agricultural chemical industry and machinery manufacturers during this pe-riod. Strong financial incentives to advo-cates (i.e. herbicide and machinery sales) and regular use of ‘product champions’ to spread the word been a consistent feature of no-tillage agriculture. Growers have also identified many agronomic, biologi-cal, logistical and economic benefits with no-till systems and their adoption has been exponential across southern crop-ping systems. Some critical problems are now emerging however that threaten the practical and financial continuation of no-till systems.
Herbicide resistance is common in a number of crop weeds to almost all chemi-cal groups suited to their management and threatens their viability as on-going tools of crop agronomy. Resistance is evolving in most intense cropping systems with many attempts at prevention or delay fail-ing. In Australia, regular use of herbicides alone for annual ryegrass (Lolium rigidum) control has led to thousands of hectares infested with this weed, for which no se-lective herbicide remains effective.
Glyphosate resistance is expected to increase exponentially in no-till systems. Adoption of disc seeding equipment is likely to exacerbate glyphosate resistance as the opportunity to kill weeds surviving pre-sowing glyphosate is lost when no-till discs are substituted for the full seedbed disturbance offered by tyned implements.
Internationally, glyphosate resistance has been reported in seven species to date; particularly in the USA with fields grow-ing glyphosate-tolerant crops such as cot-ton and soybean.
A common factor in the development of herbicide resistance is a lack of tillage after application of the herbicide. Tillage enables any surviving (resistant) individu-als to be killed prior to them setting seed, preventing the irreversible drift towards dominance of the weed population by her-bicide resistant biotypes.
Tillage kills by physically breaking roots and enabling subsequent desiccation and/or burial of the weed. For tillage to be effective in preventing herbicide resist-ance, it must be timed to act against the same cohort of weeds as were affected by the herbicide. For example, if glyphosate is applied prior to seeding a crop, tillage must occur after the glyphosate is ap-plied or, if a selective in-crop herbicide is
applied, tillage must occur in-crop after the herbicide.
Inter-row cultivation relies upon dis-turbance very close to each side of a drill row. A high proportion of the field ought to be disturbed during the operation, as weeds surviving in the crop row (intra-row) can compete with the crop and set seed. Manual systems tend to be slow and tiring, although skilled operators can com-monly till to within 3 cm of a crop row.
Attempts to use GPS navigation for inter-row cultivation in Australia have been disappointing due to a lack of reli-ability and accuracy. Whilst finding utility in wide-spaced crops (85–100 cm) where high precision is not essential, autosteer options for tractors currently on offer in Australia appear unlikely to meet expecta-tions for inter-row cultivation of narrowly-spaced (<50 cm) winter crops.
Given that GPS technology is unable to recognise any crop, one is left to ask; why communicate with six satellites orbiting the globe when you can obtain a visual fix on your crop immediately in front of the implement ?
Computerised vision guidance for in-ter-row tillage has been in development for at least 17 years. These devices use video cameras and image analysis soft-ware to guide toolbars mounted behind linkage tractors. Commercial systems first appeared in Europe in 2001; with initial adoption in the sugar beet and vegetable industries. Adoption to date by cereal growers has been limited to organic pro-ducers.
Silsoe Research Institute and Garford Farm Machinery in Britain have developed the ROBOCROP vision guidance system. To date over 60 units have been sold and successfully used in cereals, canola, sugar beet, cotton, soybeans, field peas, carrots, parsnips, leeks, brassicas, field beans and pumpkins. This device won a silver medal at the Royal Agricultural Society of Eng-land Show in 2003.
Robocrop uses a colour video camera to scan ahead of the tillage bar. Images are analysed twenty times per second to de-termine a fix on the crop rows. Signals are relayed back to electro-hydraulic valves that control a sideshift used to position the tillage bar in relation to the crop rows. No satellite signals are used, just a real-time video image of the crop ahead. Multiple rows and discontinuity of the row are not a problem. Robocrop will follow curves, thus it will correct for GPS errors incurred during sowing or follow contours (in dry-land crops). Cultivators up to 12 m wide for any crop row configuration are avail-able.
Parallelograms are fitted across the bar to enable accurate depth control, thus pre-venting root damage or excessive mois-ture loss from cultivating too deeply. Even soil flow also occurs when knives are
Robotic weeding in grain crops
Malcolm Taylor, Robocrop Australia Pty Ltd., RMB 1553A, Cobram, Victoria 3644
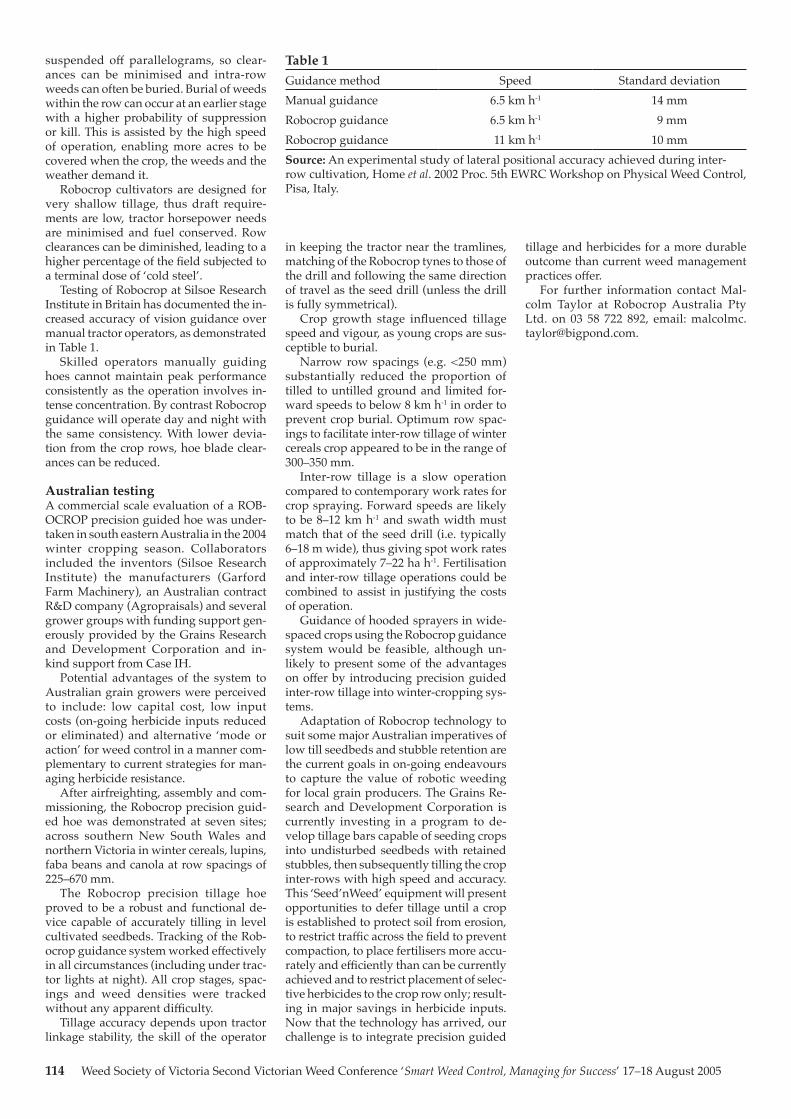
114 Weed Society of Victoria Second Victorian Weed Conference ‘Smart Weed Control, Managing for Success’ 17–18 August 2005
suspended off parallelograms, so clear-ances can be minimised and intra-row weeds can often be buried. Burial of weeds within the row can occur at an earlier stage with a higher probability of suppression or kill. This is assisted by the high speed of operation, enabling more acres to be covered when the crop, the weeds and the weather demand it.
Robocrop cultivators are designed for very shallow tillage, thus draft require-ments are low, tractor horsepower needs are minimised and fuel conserved. Row clearances can be diminished, leading to a higher percentage of the field subjected to a terminal dose of ‘cold steel’.
Testing of Robocrop at Silsoe Research Institute in Britain has documented the in-creased accuracy of vision guidance over manual tractor operators, as demonstrated in Table 1.
Skilled operators manually guiding hoes cannot maintain peak performance consistently as the operation involves in-tense concentration. By contrast Robocrop guidance will operate day and night with the same consistency. With lower devia-tion from the crop rows, hoe blade clear-ances can be reduced.
Australian testingA commercial scale evaluation of a ROB-OCROP precision guided hoe was under-taken in south eastern Australia in the 2004 winter cropping season. Collaborators included the inventors (Silsoe Research Institute) the manufacturers (Garford Farm Machinery), an Australian contract R&D company (Agropraisals) and several grower groups with funding support gen-erously provided by the Grains Research and Development Corporation and in-kind support from Case IH.
Potential advantages of the system to Australian grain growers were perceived to include: low capital cost, low input costs (on-going herbicide inputs reduced or eliminated) and alternative ‘mode or action’ for weed control in a manner com-plementary to current strategies for man-aging herbicide resistance.
After airfreighting, assembly and com-missioning, the Robocrop precision guid-ed hoe was demonstrated at seven sites; across southern New South Wales and northern Victoria in winter cereals, lupins, faba beans and canola at row spacings of 225–670 mm.
The Robocrop precision tillage hoe proved to be a robust and functional de-vice capable of accurately tilling in level cultivated seedbeds. Tracking of the Rob-ocrop guidance system worked effectively in all circumstances (including under trac-tor lights at night). All crop stages, spac-ings and weed densities were tracked without any apparent difficulty.
Tillage accuracy depends upon tractor linkage stability, the skill of the operator
in keeping the tractor near the tramlines, matching of the Robocrop tynes to those of the drill and following the same direction of travel as the seed drill (unless the drill is fully symmetrical).
Crop growth stage influenced tillage speed and vigour, as young crops are sus-ceptible to burial.
Narrow row spacings (e.g. <250 mm) substantially reduced the proportion of tilled to untilled ground and limited for-ward speeds to below 8 km h-1 in order to prevent crop burial. Optimum row spac-ings to facilitate inter-row tillage of winter cereals crop appeared to be in the range of 300–350 mm.
Inter-row tillage is a slow operation compared to contemporary work rates for crop spraying. Forward speeds are likely to be 8–12 km h-1 and swath width must match that of the seed drill (i.e. typically 6–18 m wide), thus giving spot work rates of approximately 7–22 ha h-1. Fertilisation and inter-row tillage operations could be combined to assist in justifying the costs of operation.
Guidance of hooded sprayers in wide-spaced crops using the Robocrop guidance system would be feasible, although un-likely to present some of the advantages on offer by introducing precision guided inter-row tillage into winter-cropping sys-tems.
Adaptation of Robocrop technology to suit some major Australian imperatives of low till seedbeds and stubble retention are the current goals in on-going endeavours to capture the value of robotic weeding for local grain producers. The Grains Re-search and Development Corporation is currently investing in a program to de-velop tillage bars capable of seeding crops into undisturbed seedbeds with retained stubbles, then subsequently tilling the crop inter-rows with high speed and accuracy. This ‘Seed’nWeed’ equipment will present opportunities to defer tillage until a crop is established to protect soil from erosion, to restrict traffic across the field to prevent compaction, to place fertilisers more accu-rately and efficiently than can be currently achieved and to restrict placement of selec-tive herbicides to the crop row only; result-ing in major savings in herbicide inputs. Now that the technology has arrived, our challenge is to integrate precision guided
Table 1Guidance method Speed Standard deviationManual guidance 6.5 km h-1 14 mmRobocrop guidance 6.5 km h-1 9 mmRobocrop guidance 11 km h-1 10 mmSource: An experimental study of lateral positional accuracy achieved during inter-row cultivation, Home et al. 2002 Proc. 5th EWRC Workshop on Physical Weed Control, Pisa, Italy.
tillage and herbicides for a more durable outcome than current weed management practices offer.
For further information contact Mal-colm Taylor at Robocrop Australia Pty Ltd. on 03 58 722 892, email: [email protected].
Weed Society of Victoria Second Victorian Weed Conference ‘Smart Weed Control, Managing for Success’ 17–18 August 2005 115
Summary Weed prevention measures are the most effective way of protecting assets from weed invasion. Educating the com-munity and industry on issues associated with high-risk activities such as movement of machinery will save time and money in the long term. The precautionary approach is a concept being widely employed to guide future environmental planning processes and funding decisions.
The Weed Spread Prevention Wash Down Trial aims to raise awareness and increase the capacity of Local Government in improved machinery hygiene to pre-vent the spread of weeds. The trial was conducted over a period of twelve months and involved three municipalities. The equipment selected for the trial consisted of a portable wash down unit and a con-tainment mat, designed to wash tractor slashers used to cut roadside vegetation while also recycling the water used back into the unit.
In each of the three municipalities, five trial sites were selected and surveyed for weed species. The sites were slashed and vegetative samples taken to determine the viability and amount of weed seeds from each of the fifteen trial sites.
The preliminary findings from both weed seed counts and viability study found large amounts of viable weed seeds are collected by the process of slashing. Surveys of the municipalities involved showed an increase in understanding of both the responsibilities concerning weed hygiene principals as well as the rate of use of machinery hygiene principles and practices.
IntroductionMany of the alien plant species introduced into Australia have become weeds and have invaded a wide range of environ-ments. These invasive plants are reducing yields in crops and pastures and changing the natural environment (Castles 1992). In the recent past, the rate and risk associ-ated with alien species introductions have increased enormously because human population growth and human activities altering the environment have escalated rapidly (Pimental et al. 2000).
Prevention of weed spread is a key consideration for cost effective control in resource management. The Federal and Victorian Governments have identi-fied in their policies the protection of our
landscapes as one of their most impor-tant duties. The Weed Spread Prevention Wash Down Trial is a part of the Victorian Governments’ ‘Tackling Weeds on Private Land Initiative’. The aim of the initiative is to have key stakeholders accepting and acting on their weed management respon-sibilities in a collaborative manner in new and innovative ways to reflect the goals of the Victorian Pest Management Frame-work (VPMF). The Trial involved three major stakeholders the Department of Sustainability and Environment, Depart-ment of Primary Industries and the mu-nicipalities of Surf Coast, Golden Plains and Moorabool.
Why conduct a wash down Trial? Seeds and other viable plant parts can hitch a ride on machinery and contaminate previously ‘weed-free’ areas. The trial concentrated on tractor slashers, typical local govern-ment equipment. Slashing is done for many reasons; it aims to reduce biomass and fire risk, improves driver safety by im-proving roadside visibility, and it reduces or prevents the flowering of weed species thus reducing their spread into neighbour-ing properties. However, a previous study has also shown slashing actively disperses weed seeds scattering them around the slasher deck during the performance of the slashing process and carrying them further afield if the machinery is not kept clean (Erakovic et al. 2003). It is therefore essential that machinery operators inspect and thoroughly wash down machinery before it enters a clean area.
This funding opportunity has allowed Local Government to build internal ca-pacity by improving hygiene controls on equipment, which have the potential to spread weeds through their daily activi-ties.
The final aim of the project is to inves-tigate the amount and type of weed seed taken from the slashers at the trial sites. Once this has been achieved the viability of the weed seeds found will be tested to determine the value of the wash down process and the threat that slashing pro-poses in the spread of weeds.
Materials and methodsWash down equipmentThe selected equipment for the trial is portable, has the ability to contain the wa-ter and vegetable matter washed from the tractor and slasher and recycle the water
back into the holding tank to be reused. The tray or trailer mounted polyurethane tank has a capacity of 300 L and is driven by a top mounted five horsepower petrol pump. The water pressure rate was low-ered to conserve water and enable the op-erator more time to clean down machinery. The containment matt is constructed from an industrial strength vinyl with bunted walls containing memory foam. The mem-ory foam allows a vehicle to move over the bunted wall and then immediately assume its shape. To recycle the water a twelve-volt marine pump, which has 100 litres per minute flow rate, removed water from the mat back to the unit through a vortex filter. The vortex filter is designed to cap-ture vegetable matter and large suspended solids.
Trial sites Five sites were selected for their infesta-tions of Chilean needle grass and serrated tussock in each of the participating Local Government municipalities. The sites oc-curred on roadside verge and were four metres in width and fifty metres long. A Global Positioning System marked the corners of each site and a star picket was placed as a visual marker. To measure the weed density at each of the fifteen loca-tions a flora survey was undertaken using a metre square quadrant.
LogbooksMachinery wash down logbooks were developed by the Department of Primary Industries and then provided to each of the participating municipalities. The ma-chinery checklist in the log book leads the machinery operator through a systematic search for contamination points on the tractor slasher. The logbook also captures information on the use of the equipment, how the inspection and clean process was undertaken and other factors such as weather.
Field samplesSamples were taken between October and December 2004, during the municipalities’ roadside slashing program. Two types of samples were taken – dry and wet. The dry sample was collected prior to the wash down process and sourced from the chaff on top of the slasher. The wet sample came from the contents of the mat after the clean-ing process had been undertaken. Each sample was labelled with site information then packed and couriered to the LaTrobe University Department of Botany.
Weed seed counts and chemical testing To perform the seed counts and identify the weed seeds contained within the sam-ple all other matter was removed includ-ing mud and chaff. Due to Chilean needle grass’ larger seed size this weed species was used as a representative species to
Weed spread prevention wash down trial
Byron Crowe, Department of Primary Industries, PO Box 103, Geelong, Victoria 3220
116 Weed Society of Victoria Second Victorian Weed Conference ‘Smart Weed Control, Managing for Success’ 17–18 August 2005
determine the amount of weed seed. A grab sample of Chilean needle grass seed was then taken and treated with tetrazo-lium chloride to determine seed viability.
EvaluationThe project evaluation consisted of semi-structured interviews and questionnaires. The semi-structured interviews were con-ducted with Environmental Officers and the questionnaires were targeted at the Field Operators from each of the three municipalities.
DiscussionAlthough each of the Local Government Municipalities had unlimited use of the equipment for a twelve-month period the use of the equipment outside the trial sites was minimal. The weight of the equipment provided a barrier to its use as the machin-ery operator predominantly works alone. This presented issues with Occupational Health and Safety policies. The Environ-mental Officers were targeted to be advo-cates of the project. All were supportive and cooperative throughout the life of the project. However, as the field staff were part of a different business within local government the amount of influence the Environmental Officers had was limited. A training program was to be implemented for the field staff involved with the project, however, it was discovered that the mu-nicipalities had already organised their own weed spread prevention training. Consequently the Weed Spread Preven-tion wash down trial dovetailed into this process by providing training in the use of the equipment. All participants in the trial commented on the amount of plant material obtained at the trial sites due to the cleaning process. It was a clear exam-ple of how effective machinery hygiene procedures can be.
Through the implementation of the VPMF the move toward preventative weed management is being recognised as a sound investment by Government. Conse-quently the DPI compliance program has purchased two units to enable adequate clean down of equipment used to perform compliance entry in the administration of the Catchment and Land Protection Act 1994.
The benefits of the equipment for man-aging Phytophthora dieback were recog-nised by Parks Victoria who also purchased a unit. Comments from local government staff regarding improvements to the de-sign of the pump were incorporated by Parks Victoria making the unit effective in the removal of water from the mat. Some of the benefits of using this equipment in the management of Phytophthora dieback included low water pressure, ability to recycle chemical and the use of recycled water in remote locations.
ConclusionPreliminary results of the weed seed counts and chemical testing study showed that the process of slashing roadside veg-etation has the potential to spread viable weed seed to other locations.
For clean down equipment to be adopt-ed by Local Government field operators of tractor slashers, it needs to be able to be operated by a single person and the proc-ess of cleaning performed quickly. The understanding by the participants of the principles and practices concerning ma-chinery hygiene increased over the course of the Trial.
It is apparent that the provision of appropriate training is a corner stone to increase the capacity of field staff in the practice of effective clean down. Also, the prudent purchasing of the equipment used in the Trial (clean down unit and mat) will benefit other departments with its contin-ued use.
ReferencesCastles, I. (1992). Australia’s environment:
issues and facts. Australian Bureau of Statistics. (Commonwealth of Austral-ia, Sydney).
Department of Natural Resources and Environment (2002). Victorian pest management: framework for action. (Department of Natural Resources and Environment, Melbourne).
Erakovic, Lj., Subic, A., Abu-Hijleh, B. and McLaren, D. (2003). Modelling and sim-ulation of Chilean needle grass spread during slashing. Under Control No. 23 Department of Primary Industries.
Pimental, D., Lach, L., Zuniga, R. and Mor-rison, D. (2000). Environmental and economic cost associated with non-in-digenous species in the United States. BioScience 50(10), 53-65.
Weed Society of Victoria Second Victorian Weed Conference ‘Smart Weed Control, Managing for Success’ 17–18 August 2005 117
Himalayan honeysuckle (Leycesteria for-mosa) is a native of western China, India, Nepal and Burma, and was imported to Australia as a garden species. It is a de-ciduous multi-stemmed shrub to 3 (rarely to 4) m high, with erect hollow stems and ovate leaves. Fruit are ovoid and fleshy (Australian Weeds Committee 2005). A fact that makes them highly attractive to parrots and smaller forest birds, foxes and browsing animals such as wallaby and deer, all are believed to be vectors of spread.
It is a highly invasive weed capable of out-competing Australian natives to the point of completely altering the floristics of a forest understorey if left uncontrolled. Established infestations are known in a considerable area of the foothill forest of Mount Buffalo National Park on sections of the eastern boundary. Efforts to control the species have been carried out for many years to varying degrees of effect.
Observations of Rangers stationed at Mt Buffalo in the 1970s were that the plant was seen at certain sites on roadsides on the lower section of the mountain. These plants were hand pulled and not consid-ered a major threat at the time. Its occur-rence on roadsides suggests it was trans-ported in the gravel used to surface the roads of the area. Once established on the roadsides however, it is now presumed that infestations rapidly spread deeper into the surrounding forest.
During the mid-1980s concern began to increase regarding the extent and impact Himalayan honeysuckle was having on the foot hills of the Park. As a result an extensive survey was undertaken by Steve Millington (Ranger) in 1988. He walked much of the eastern side of Mt Buffalo to determine the extent and concentration of infestations. Maps were made of these infestations and identified three catch-ments in which Himalayan honeysuckle was present: the Eurobin, Kangaroo and Buffalo Creeks. These catchments are concentrated in an area to the north and north-west of Eurobin Falls covering ap-proximately 700 hectares. At that stage the extremity of the infestation appeared to be no higher than 900 m in elevation, with infestations being thickest in the base of drainage lines, becoming scattered on gully flanks.
Control programs gained momentum using park and forestry staff, with hand pulling, and high volume spraying being undertaken off roadsides. These efforts
although considerable, were unfortunate-ly not tackling the root of the problem.
By the 1990s it was apparent that the plant had established itself in significant infestations that would require a more concentrated effort. A formal control strat-egy was developed that formed the basis for planning and consolidated a more stra-tegic approach, from this control lines and priority areas for works were identified.
In the mid-nineties the park purchased a 4WD mounted self retracting dual-reel spray unit, which together with a more conventional trailer type unit combined to enable staff to tackle infestations deeper in the bush. Remote work was undertaken using hand-pulling and gas gun chemi-cal applicators. Metsulfuron-methyl and glyphosate achieving excellent results.
Significant funding compared to previ-ous years allowed a targeted annual con-trol program. By 2002 an annual budget of $20 000 was standard. Rather than using internal staff, the program now used the services of short-term casual employees chosen for their fitness and weed control experience. The 4–5 person team were dedicated to the program, having no in-volvement in any other park maintenance duties.
Control works focused on the Eurobin, Kangaroo and Buffalo creek catchments, especially the Eurobin which remains to-day as the most heavily infested. There are a number of reasons for this. The first being the favourable habitat provided by the forest type and moist gullies, the sec-ond being the very steep and rough terrain which makes going extremely difficult and slow, and has hindered control ef-forts. Hence the requirement for the spray team to possess a high fitness level. And the third which is perhaps the least sup-ported by substantial evidence is that the area harbours a significant Sambar deer population. It is proven that Sambar eat the fruit of Himalayan honeysuckle and spread seed in their faeces (Eyles 2003), but the degree to which infestation spread can be attributed to them is unknown.
High volume spraying with metsul-furon-methyl from the vehicle mounted unit off the tourist road at the top of the catchments, and from the bottom on the park boundary was successful in push-ing the extremities of the infestations in-wards. By joining hoses spraying could be achieved up to 400 m from the vehicle. At this length, combined with the steep and rough terrain, all team members would
be involved as integral participants in the operation. One person would remain at the vehicle to monitor chemical and fuel levels and the hose that would regularly become tangled if left alone. Two would be spaced at intervals along the hose to assist with pulling it through the vegetation, and the fourth person would operate the spray gun. Communication between team mem-bers was via departmental radios.
The safety of staff in these situations was a constant consideration. There was a high potential for slipping and tripping, snake and insect bite, and with protective overalls on, heat exhaustion could occur quickly.
Despite being able to spray plants up to 400 m into the bush, there remained significant infestations just out of reach, some of these being very dense. This meant that there was a source from which seed could be spread each year. These ar-eas were treated to some degree by using 7 litre pump-up spray bottles that could be carried deep into the bush, the basal bark method being applied (glyphosate mix) to each plant. The sheer number of plants, small chemical carrying capac-ity and inherently slow control technique meant that the infestations out of reach of the high volume spray were never effec-tively treated.
In early January 2003, what started as two small fires ignited from lightning strikes combined to change the approach to Himalayan honeysuckle control at Mt Buffalo. The Alpine Fires that burnt an es-timated 1.19 million hectares of public land in North East Victoria and Gippsland had at their conclusion burnt approximately 90% of Mt Buffalo National Park.
All but a very small percentage of ma-ture infestations were consumed in the fire. And inspections post-fire showed that all plants that were burnt showed no signs of recovery. This was an exciting time. Sites that were heavily infested and had proven difficult to access and treat were now de-void of honeysuckle. In one fowl swoop, for a brief period, the whole of Mt Buffalo excepting a few small pockets were free of Himalayan honeysuckle.
As months after the fire passed, further inspection revealed germination from seed bank. In drainage lines germination was crop-like. Heavy rain following the fires had washed large quantities of soil into creeks and the middle of gullies, carrying with it the seed that had accumulated over many years. Seedlings could be found on the flanks of gullies and on ridges, but too much less extent.
With these findings the opportunity was seized to embark on a large scale con-trol program in the summer of 2003/2004. The Victorian Government – Bushfire Re-covery Program that provided for the re-pair and replacement of assets, research and protection of natural and cultural
Himalayan honeysuckle control at Mt Buffalo
Darin Lynch, Parks Victoria, Bright, Victoria 3741
118 Weed Society of Victoria Second Victorian Weed Conference ‘Smart Weed Control, Managing for Success’ 17–18 August 2005
values, and support of neighbouring com-munities ensured that the program was well funded. $75 000 was committed to the project in its first year.
The fire had provided a window of op-portunity. Areas that were once almost impossible to walk through due to fallen timber and a thick shrub layer were now accessed with far less effort. As well, the juvenile state of the infestations meant that plants were easier to treat with less volume of herbicide. Those infestations that had been out of reach to high volume spray-ing, yet were too large to treat properly with small volume pump-up spray bottles could now be targeted. There would also be a timeframe of two growing seasons where these plants would not produce vi-able seed.
Rather than using casual staff, the project went to tender and was imple-mented using a pest plant management contractor. Gullies with semi-permanent and permanent water were targeted as a priority due to the high density of plants, and the fact that if not treated at the seed-ling stage and left to grow there would have been a requirement to use greater quantities of chemical. Highly undesirable in an aquatic environment with sensitive riparian native vegetation. By focusing on these areas at this stage of the plants growth, many infestations were removed by hand-pulling and through cautious use of the ‘water friendly’ form of glyphosate at a 2% rate.
Chemical was applied to foliage using 7 litre pump-up spray bottles, with a team of 4–5 people moving down gullies from their origin. The team would be spaced at a distance to ensure as best as possi-ble that all plants were treated. In areas where infestations were well away from vehicle access and relatively high quanti-ties of chemical was necessary, a hose with a tap at the end would be dragged in to a centralised point. At the nearest point on a road, the hose at the other end was connected to a vehicle mounted tank con-taining the chemical mix. This meant that crew members would not have to walk out to the vehicle each time they needed to re-fill. High volume spraying methods were not used.
In general, areas away from gullies on the flanks and ridges were left untreated. In many locations regrowth by primary colonisers was phenomenal, with brack-en in particular rapidly forming a dense blanket obscuring the smaller honeysuck-le seedlings. This meant that control ef-forts were unfeasible with search efforts to locate each plant too difficult and time consuming. Nevertheless it was recog-nised that these sites would require at-tention. And it was decided that they be left until the following season when the honeysuckle had grown and was easier to find.
Instead efforts were concentrated on gaining a better picture of the overall in-festation. Surveying and mapping was completed for all previously known sites and also far wider into areas that had not previously been specifically searched to identify honeysuckle, but possessed fa-vourable habitat. Where feasible control works were also undertaken. The results revealed the presence of the plant over a wider area than was recorded. This infor-mation was invaluable for the planning of the following year’s program, and will continue to be vital for managers into the future.
The second year of the Bushfire Re-covery Program saw a similar amount of money dedicated to the project, and in the 2004/2005 summer control works were again let to contract.
Areas that had seen control works the previous year were revisited, especially wet gullies that were targeted again as a priority. Works were undertaken in areas that had been left the previous year to due to native vegetation regrowth, however in most circumstances searching for and identifying honeysuckle was still very te-dious. These areas will continue to pose a problem until such time that the hon-eysuckle has grown to a point where it is easily found. Control methods used were the same as those in 2003/2004.
Surveying and mapping continued, with results showing that in the majority of cases the severity of infestations had been significantly reduced by the previous year’s efforts. In one of only a few sites remaining with a mature infestation, the Gorge area was visited. This area of the park is famous for its series of magnificent cliff faces, the longest of which is a 300 m vertical drop. An abseiling guide was engaged to enable park staff to gain access to the plants that hung precariously from the cliff walls.
By the conclusion of the two year post-fire program a great deal was learnt about Himalayan honeysuckle at Mt Buffalo. Much more is known about the spread and severity of the infestation across the park, and results of control works were very promising. However it is true that if the importance of managing this pest plant is not seen as an ongoing priority the infestation may return to its former sever-ity. The next few years will ultimately tell whether the widespread fire of 2003 has been of benefit or hindrance to the control of this species at Mt Buffalo.
ReferencesAustralian Weeds Committee (2005).
Weeds Australia – weed identifica-tion – Himalayan honeysuckle. www.weeds.org.au.
Eyles, Dan (2003). Is Sambar deer (Cervus unicolour) a vector of Himalayan Hon-eysuckle (Leycesteria formosa). Power
Point presentation, The University of Melbourne.
Weed Society of Victoria Second Victorian Weed Conference ‘Smart Weed Control, Managing for Success’ 17–18 August 2005 119
POSTER SUMMARIES
A biological control agent for docks (Rumex species) has been found in large popula-tions in parts of northern Victoria, where it is dispersing widely and probably hav-ing a substantial impact. The Moroccan clearwing moth or dock moth (Pyropteron doryliformis (Ochsenheimer) was released in Victoria from 1991 to 1999. Most of these releases were undertaken by inserting ‘egg sticks’ (toothpicks with moth eggs glued onto them) into the cut stalks of dock plants. The most successful dock moth populations in Victoria occur on Rumex crispus in northern regions of the state.
Establishment and dispersal of dock moth Pyropteron doryliformis (Ochsenheimer) (Lepidoptera: Sesiidae) in Victoria
Thomas B. MorleyA, Steven FaulknerB and Ian G. FaithfullA
A Department of Primary Industries Frankston, PO Box 48, Frankston, Victoria 3199B Cooperative Research Centre for Australian Weed Management, University of Melbourne, Dookie Campus, Victoria 3647
This is a summary of research that was originally presented as a poster at and arti-cle in the proceedings of the 14th Austral-ian Weeds Conference as: Morley, T.B., Faulkner, S. and Faithfull
I.G. (2004). Establishment and disper-sal of dock moth Pyropteron doryliformis (Ochsenheimer) (Lepidoptera: Sesiidae) in Victoria. Proceedings of the 14th Aus-tralian Weeds Conference, eds B.M. Sin-del and S.B. Johnson, pp. 381-4. (Weed Society of New South Wales, Sydney).
The impact of biological control on weed populations can be evaluated in a variety of ways. These include:• comparing weed infestations before
and after biological control,• contemporaneous comparisons of
weed infestations at sites with and sites without biological control agents,
• assessments of correlations between agent numbers and parameters indica-tive of weed population dynamics (e.g. Swirepik and Smyth 2003),
and• experiments to manipulate biological
control agent attack levels by physical exclusion or containment or pesticid-al exclusion methods (e.g. Adair and
Holtkamp 1999), or combinations of these (e.g. Smyth and Sheppard 2002).
This poster briefly outlines the insecti-cidal exclusion method we use for eval-uating the effect of biological control on Senecio jacobaea L. (ragwort) Echium plan-tagineum L. (Paterson’s curse) in Victoria and presents some information considered for insecticide selection.
ReferencesAdair, R.J. and Holtkamp, R.H. (1999).
Development of a pesticide exclusion technique for assessing the impact of biological control agents for Chrysanthe-moides monilifera. Biocontrol Science and Technology 9, 383-90.
Smyth, M. and Sheppard, A. (2002). Lon-gitarsus echii and its impact on Echium plantagineum (Paterson’s curse): the in-sect for the Mediterranean rainfall range of the weed? Proceedings of the 13th Australian Weeds Conference, eds H. Spafford Jacob, J. Dodd and J.H. Moore, pp. 341-5. (Plant Protection Society of Western Australia, Perth).
Swirepik, A. and Smyth, M. (2003). Evalu-ating biological control at the regional scale. In ‘Improving the selection, test-ing and evaluation of weed biological control agents’, eds H. Spafford Jacob and D.T. Briese, pp. 61-7. (CRC for Aus-tralian Weed Management, Adelaide, Australia).
This summary is of a poster that was origi-nally presented at 14th Australian Weeds Conference as: Morley, T.B. and Bonilla J.C. (2004).
An insecticidal exclusion method for studying biological control impacts on ragwort (Senecio jacobaea L.) and Paterson’s curse (Echium plantagineum L.). Proceedings of the 14th Australian Weeds Conference, eds B.M. Sindel and S.B. Johnson, p. 380. (Weed Society of New South Wales, Sydney).
An insecticidal exclusion method for studying biological control impacts on ragwort (Senecio jacobaea L.) and Paterson’s curse (Echium plantagineum L.)
Thomas B. Morley and Julio C. Bonilla, Department of Primary Industries Frankston, PO Box 48, Frankston, Victoria 3199
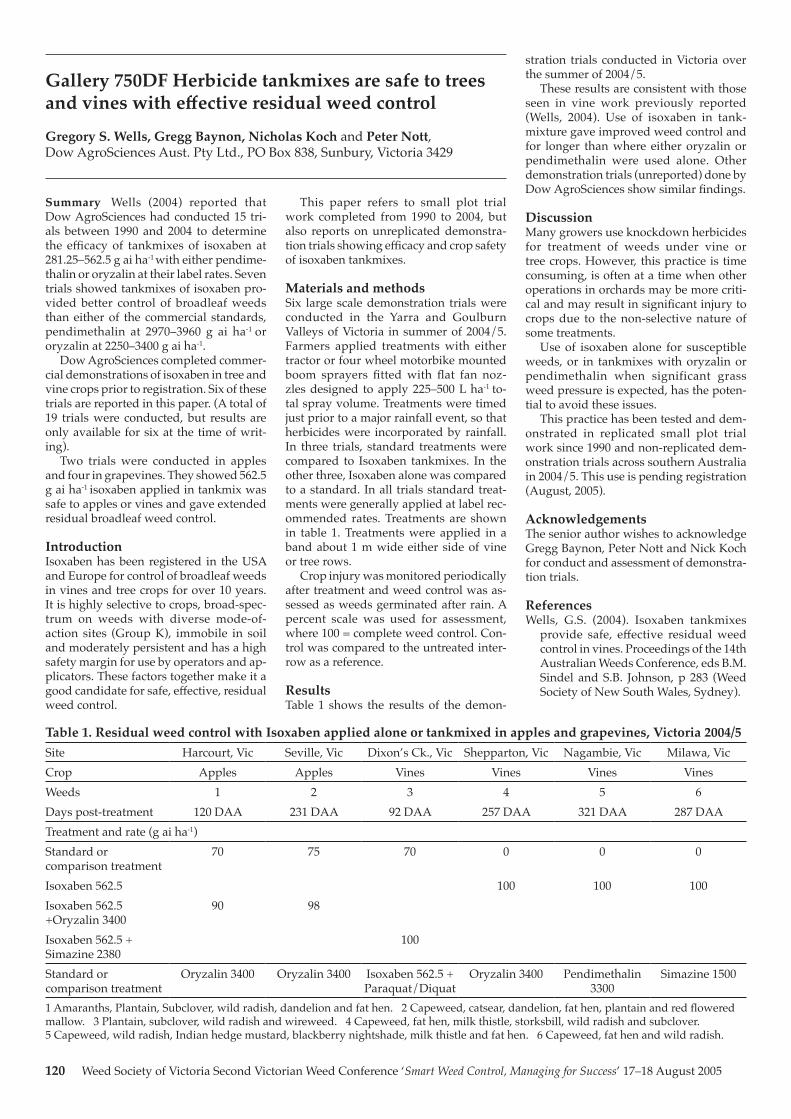
120 Weed Society of Victoria Second Victorian Weed Conference ‘Smart Weed Control, Managing for Success’ 17–18 August 2005
Summary Wells (2004) reported that Dow AgroSciences had conducted 15 tri-als between 1990 and 2004 to determine the efficacy of tankmixes of isoxaben at 281.25–562.5 g ai ha-1 with either pendime-thalin or oryzalin at their label rates. Seven trials showed tankmixes of isoxaben pro-vided better control of broadleaf weeds than either of the commercial standards, pendimethalin at 2970–3960 g ai ha-1 or oryzalin at 2250–3400 g ai ha-1.
Dow AgroSciences completed commer-cial demonstrations of isoxaben in tree and vine crops prior to registration. Six of these trials are reported in this paper. (A total of 19 trials were conducted, but results are only available for six at the time of writ-ing).
Two trials were conducted in apples and four in grapevines. They showed 562.5 g ai ha-1 isoxaben applied in tankmix was safe to apples or vines and gave extended residual broadleaf weed control.
IntroductionIsoxaben has been registered in the USA and Europe for control of broadleaf weeds in vines and tree crops for over 10 years. It is highly selective to crops, broad-spec-trum on weeds with diverse mode-of-action sites (Group K), immobile in soil and moderately persistent and has a high safety margin for use by operators and ap-plicators. These factors together make it a good candidate for safe, effective, residual weed control.
This paper refers to small plot trial work completed from 1990 to 2004, but also reports on unreplicated demonstra-tion trials showing efficacy and crop safety of isoxaben tankmixes.
Materials and methodsSix large scale demonstration trials were conducted in the Yarra and Goulburn Valleys of Victoria in summer of 2004/5. Farmers applied treatments with either tractor or four wheel motorbike mounted boom sprayers fitted with flat fan noz-zles designed to apply 225–500 L ha-1 to-tal spray volume. Treatments were timed just prior to a major rainfall event, so that herbicides were incorporated by rainfall. In three trials, standard treatments were compared to Isoxaben tankmixes. In the other three, Isoxaben alone was compared to a standard. In all trials standard treat-ments were generally applied at label rec-ommended rates. Treatments are shown in table 1. Treatments were applied in a band about 1 m wide either side of vine or tree rows.
Crop injury was monitored periodically after treatment and weed control was as-sessed as weeds germinated after rain. A percent scale was used for assessment, where 100 = complete weed control. Con-trol was compared to the untreated inter-row as a reference.
ResultsTable 1 shows the results of the demon-
stration trials conducted in Victoria over the summer of 2004/5.
These results are consistent with those seen in vine work previously reported (Wells, 2004). Use of isoxaben in tank-mixture gave improved weed control and for longer than where either oryzalin or pendimethalin were used alone. Other demonstration trials (unreported) done by Dow AgroSciences show similar findings.
DiscussionMany growers use knockdown herbicides for treatment of weeds under vine or tree crops. However, this practice is time consuming, is often at a time when other operations in orchards may be more criti-cal and may result in significant injury to crops due to the non-selective nature of some treatments.
Use of isoxaben alone for susceptible weeds, or in tankmixes with oryzalin or pendimethalin when significant grass weed pressure is expected, has the poten-tial to avoid these issues.
This practice has been tested and dem-onstrated in replicated small plot trial work since 1990 and non-replicated dem-onstration trials across southern Australia in 2004/5. This use is pending registration (August, 2005).
AcknowledgementsThe senior author wishes to acknowledge Gregg Baynon, Peter Nott and Nick Koch for conduct and assessment of demonstra-tion trials.
ReferencesWells, G.S. (2004). Isoxaben tankmixes
provide safe, effective residual weed control in vines. Proceedings of the 14th Australian Weeds Conference, eds B.M. Sindel and S.B. Johnson, p 283 (Weed Society of New South Wales, Sydney).
Table 1. Residual weed control with Isoxaben applied alone or tankmixed in apples and grapevines, Victoria 2004/5Site Harcourt, Vic Seville, Vic Dixon’s Ck., Vic Shepparton, Vic Nagambie, Vic Milawa, VicCrop Apples Apples Vines Vines Vines VinesWeeds 1 2 3 4 5 6Days post-treatment 120 DAA 231 DAA 92 DAA 257 DAA 321 DAA 287 DAATreatment and rate (g ai ha-1)Standard or comparison treatment
70 75 70 0 0 0
Isoxaben 562.5 100 100 100Isoxaben 562.5 +Oryzalin 3400
90 98
Isoxaben 562.5 + Simazine 2380
100
Standard or comparison treatment
Oryzalin 3400 Oryzalin 3400 Isoxaben 562.5 + Paraquat/Diquat
Oryzalin 3400 Pendimethalin 3300
Simazine 1500
1 Amaranths, Plantain, Subclover, wild radish, dandelion and fat hen. 2 Capeweed, catsear, dandelion, fat hen, plantain and red flowered mallow. 3 Plantain, subclover, wild radish and wireweed. 4 Capeweed, fat hen, milk thistle, storksbill, wild radish and subclover. 5 Capeweed, wild radish, Indian hedge mustard, blackberry nightshade, milk thistle and fat hen. 6 Capeweed, fat hen and wild radish.
Gallery 750DF Herbicide tankmixes are safe to trees and vines with effective residual weed control
Gregory S. Wells, Gregg Baynon, Nicholas Koch and Peter Nott, Dow AgroSciences Aust. Pty Ltd., PO Box 838, Sunbury, Victoria 3429
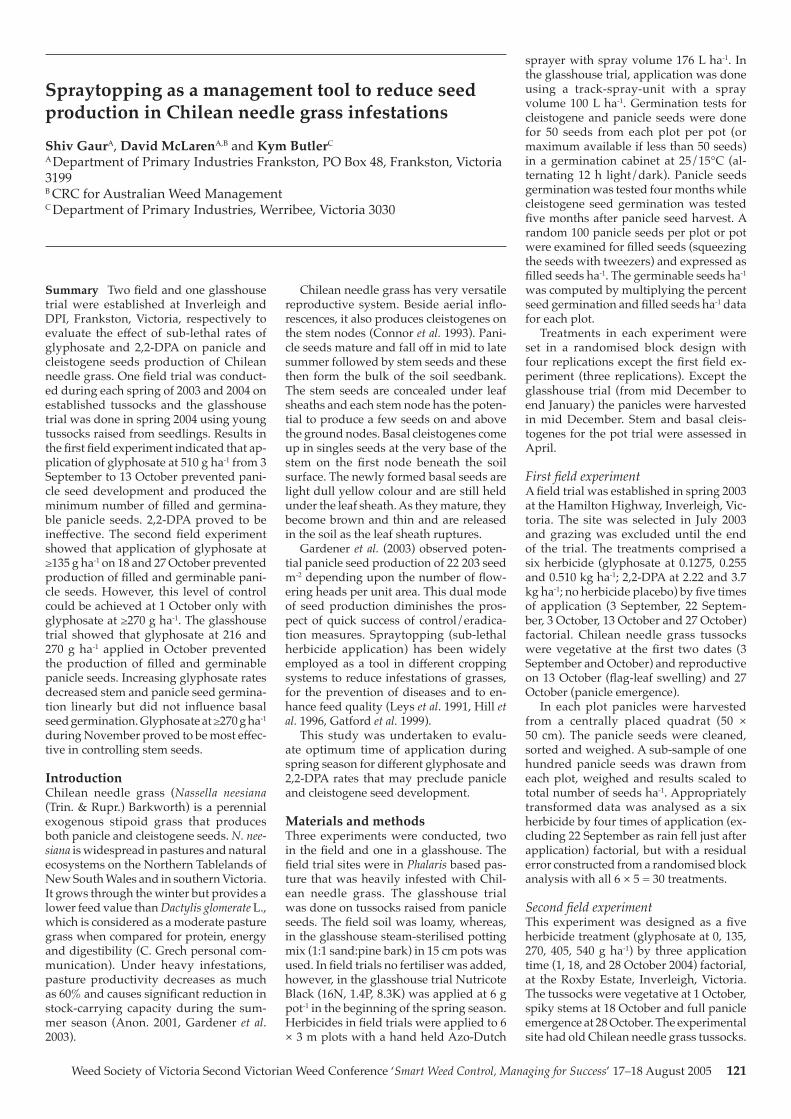
Weed Society of Victoria Second Victorian Weed Conference ‘Smart Weed Control, Managing for Success’ 17–18 August 2005 121
Summary Two field and one glasshouse trial were established at Inverleigh and DPI, Frankston, Victoria, respectively to evaluate the effect of sub-lethal rates of glyphosate and 2,2-DPA on panicle and cleistogene seeds production of Chilean needle grass. One field trial was conduct-ed during each spring of 2003 and 2004 on established tussocks and the glasshouse trial was done in spring 2004 using young tussocks raised from seedlings. Results in the first field experiment indicated that ap-plication of glyphosate at 510 g ha-1 from 3 September to 13 October prevented pani-cle seed development and produced the minimum number of filled and germina-ble panicle seeds. 2,2-DPA proved to be ineffective. The second field experiment showed that application of glyphosate at ≥135 g ha-1 on 18 and 27 October prevented production of filled and germinable pani-cle seeds. However, this level of control could be achieved at 1 October only with glyphosate at ≥270 g ha-1. The glasshouse trial showed that glyphosate at 216 and 270 g ha-1 applied in October prevented the production of filled and germinable panicle seeds. Increasing glyphosate rates decreased stem and panicle seed germina-tion linearly but did not influence basal seed germination. Glyphosate at ≥270 g ha-1 during November proved to be most effec-tive in controlling stem seeds.
IntroductionChilean needle grass (Nassella neesiana (Trin. & Rupr.) Barkworth) is a perennial exogenous stipoid grass that produces both panicle and cleistogene seeds. N. nee-siana is widespread in pastures and natural ecosystems on the Northern Tablelands of New South Wales and in southern Victoria. It grows through the winter but provides a lower feed value than Dactylis glomerate L., which is considered as a moderate pasture grass when compared for protein, energy and digestibility (C. Grech personal com-munication). Under heavy infestations, pasture productivity decreases as much as 60% and causes significant reduction in stock-carrying capacity during the sum-mer season (Anon. 2001, Gardener et al. 2003).
Chilean needle grass has very versatile reproductive system. Beside aerial inflo-rescences, it also produces cleistogenes on the stem nodes (Connor et al. 1993). Pani-cle seeds mature and fall off in mid to late summer followed by stem seeds and these then form the bulk of the soil seedbank. The stem seeds are concealed under leaf sheaths and each stem node has the poten-tial to produce a few seeds on and above the ground nodes. Basal cleistogenes come up in singles seeds at the very base of the stem on the first node beneath the soil surface. The newly formed basal seeds are light dull yellow colour and are still held under the leaf sheath. As they mature, they become brown and thin and are released in the soil as the leaf sheath ruptures.
Gardener et al. (2003) observed poten-tial panicle seed production of 22 203 seed m-2 depending upon the number of flow-ering heads per unit area. This dual mode of seed production diminishes the pros-pect of quick success of control/eradica-tion measures. Spraytopping (sub-lethal herbicide application) has been widely employed as a tool in different cropping systems to reduce infestations of grasses, for the prevention of diseases and to en-hance feed quality (Leys et al. 1991, Hill et al. 1996, Gatford et al. 1999).
This study was undertaken to evalu-ate optimum time of application during spring season for different glyphosate and 2,2-DPA rates that may preclude panicle and cleistogene seed development.
Materials and methodsThree experiments were conducted, two in the field and one in a glasshouse. The field trial sites were in Phalaris based pas-ture that was heavily infested with Chil-ean needle grass. The glasshouse trial was done on tussocks raised from panicle seeds. The field soil was loamy, whereas, in the glasshouse steam-sterilised potting mix (1:1 sand:pine bark) in 15 cm pots was used. In field trials no fertiliser was added, however, in the glasshouse trial Nutricote Black (16N, 1.4P, 8.3K) was applied at 6 g pot-1 in the beginning of the spring season. Herbicides in field trials were applied to 6 × 3 m plots with a hand held Azo-Dutch
sprayer with spray volume 176 L ha-1. In the glasshouse trial, application was done using a track-spray-unit with a spray volume 100 L ha-1. Germination tests for cleistogene and panicle seeds were done for 50 seeds from each plot per pot (or maximum available if less than 50 seeds) in a germination cabinet at 25/15°C (al-ternating 12 h light/dark). Panicle seeds germination was tested four months while cleistogene seed germination was tested five months after panicle seed harvest. A random 100 panicle seeds per plot or pot were examined for filled seeds (squeezing the seeds with tweezers) and expressed as filled seeds ha-1. The germinable seeds ha-1 was computed by multiplying the percent seed germination and filled seeds ha-1 data for each plot.
Treatments in each experiment were set in a randomised block design with four replications except the first field ex-periment (three replications). Except the glasshouse trial (from mid December to end January) the panicles were harvested in mid December. Stem and basal cleis-togenes for the pot trial were assessed in April.
First field experimentA field trial was established in spring 2003 at the Hamilton Highway, Inverleigh, Vic-toria. The site was selected in July 2003 and grazing was excluded until the end of the trial. The treatments comprised a six herbicide (glyphosate at 0.1275, 0.255 and 0.510 kg ha-1; 2,2-DPA at 2.22 and 3.7 kg ha-1; no herbicide placebo) by five times of application (3 September, 22 Septem-ber, 3 October, 13 October and 27 October) factorial. Chilean needle grass tussocks were vegetative at the first two dates (3 September and October) and reproductive on 13 October (flag-leaf swelling) and 27 October (panicle emergence).
In each plot panicles were harvested from a centrally placed quadrat (50 × 50 cm). The panicle seeds were cleaned, sorted and weighed. A sub-sample of one hundred panicle seeds was drawn from each plot, weighed and results scaled to total number of seeds ha-1. Appropriately transformed data was analysed as a six herbicide by four times of application (ex-cluding 22 September as rain fell just after application) factorial, but with a residual error constructed from a randomised block analysis with all 6 × 5 = 30 treatments.
Second field experimentThis experiment was designed as a five herbicide treatment (glyphosate at 0, 135, 270, 405, 540 g ha-1) by three application time (1, 18, and 28 October 2004) factorial, at the Roxby Estate, Inverleigh, Victoria. The tussocks were vegetative at 1 October, spiky stems at 18 October and full panicle emergence at 28 October. The experimental site had old Chilean needle grass tussocks.
Spraytopping as a management tool to reduce seed production in Chilean needle grass infestations
Shiv GaurA, David McLarenA,B and Kym ButlerC
A Department of Primary Industries Frankston, PO Box 48, Frankston, Victoria 3199B CRC for Australian Weed ManagementC Department of Primary Industries, Werribee, Victoria 3030
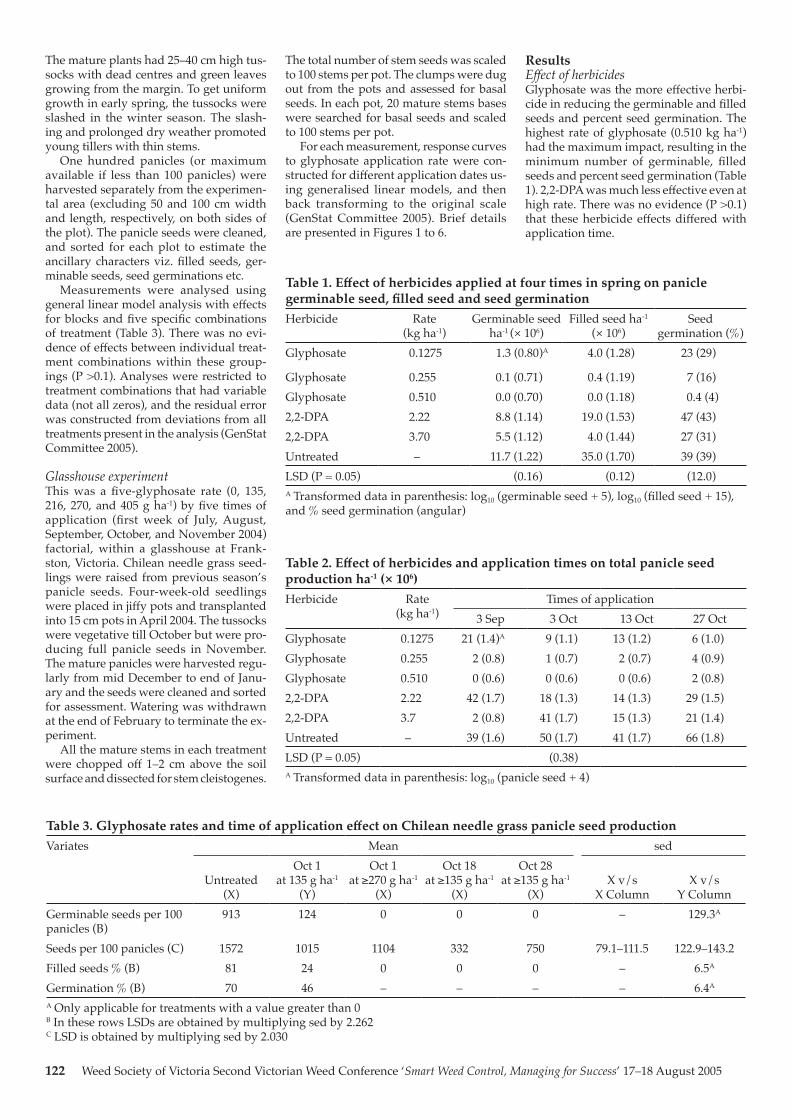
122 Weed Society of Victoria Second Victorian Weed Conference ‘Smart Weed Control, Managing for Success’ 17–18 August 2005
The mature plants had 25–40 cm high tus-socks with dead centres and green leaves growing from the margin. To get uniform growth in early spring, the tussocks were slashed in the winter season. The slash-ing and prolonged dry weather promoted young tillers with thin stems.
One hundred panicles (or maximum available if less than 100 panicles) were harvested separately from the experimen-tal area (excluding 50 and 100 cm width and length, respectively, on both sides of the plot). The panicle seeds were cleaned, and sorted for each plot to estimate the ancillary characters viz. filled seeds, ger-minable seeds, seed germinations etc.
Measurements were analysed using general linear model analysis with effects for blocks and five specific combinations of treatment (Table 3). There was no evi-dence of effects between individual treat-ment combinations within these group-ings (P >0.1). Analyses were restricted to treatment combinations that had variable data (not all zeros), and the residual error was constructed from deviations from all treatments present in the analysis (GenStat Committee 2005).
Glasshouse experiment This was a five-glyphosate rate (0, 135, 216, 270, and 405 g ha-1) by five times of application (first week of July, August, September, October, and November 2004) factorial, within a glasshouse at Frank-ston, Victoria. Chilean needle grass seed-lings were raised from previous season’s panicle seeds. Four-week-old seedlings were placed in jiffy pots and transplanted into 15 cm pots in April 2004. The tussocks were vegetative till October but were pro-ducing full panicle seeds in November. The mature panicles were harvested regu-larly from mid December to end of Janu-ary and the seeds were cleaned and sorted for assessment. Watering was withdrawn at the end of February to terminate the ex-periment.
All the mature stems in each treatment were chopped off 1–2 cm above the soil surface and dissected for stem cleistogenes.
The total number of stem seeds was scaled to 100 stems per pot. The clumps were dug out from the pots and assessed for basal seeds. In each pot, 20 mature stems bases were searched for basal seeds and scaled to 100 stems per pot.
For each measurement, response curves to glyphosate application rate were con-structed for different application dates us-ing generalised linear models, and then back transforming to the original scale (GenStat Committee 2005). Brief details are presented in Figures 1 to 6.
Results Effect of herbicidesGlyphosate was the more effective herbi-cide in reducing the germinable and filled seeds and percent seed germination. The highest rate of glyphosate (0.510 kg ha-1) had the maximum impact, resulting in the minimum number of germinable, filled seeds and percent seed germination (Table 1). 2,2-DPA was much less effective even at high rate. There was no evidence (P >0.1) that these herbicide effects differed with application time.
Table 1. Effect of herbicides applied at four times in spring on panicle germinable seed, filled seed and seed germinationHerbicide Rate
(kg ha-1)Germinable seed
ha-1 (× 106)Filled seed ha-1
(× 106)Seed
germination (%)Glyphosate 0.1275 1.3 (0.80)A 4.0 (1.28) 23 (29)
Glyphosate 0.255 0.1 (0.71) 0.4 (1.19) 7 (16)Glyphosate 0.510 0.0 (0.70) 0.0 (1.18) 0.4 (4)2,2-DPA 2.22 8.8 (1.14) 19.0 (1.53) 47 (43)2,2-DPA 3.70 5.5 (1.12) 4.0 (1.44) 27 (31)Untreated – 11.7 (1.22) 35.0 (1.70) 39 (39)LSD (P = 0.05) (0.16) (0.12) (12.0)A Transformed data in parenthesis: log10 (germinable seed + 5), log10 (filled seed + 15), and % seed germination (angular)
Table 2. Effect of herbicides and application times on total panicle seed production ha-1 (× 106)Herbicide Rate
(kg ha-1)Times of application
3 Sep 3 Oct 13 Oct 27 OctGlyphosate 0.1275 21 (1.4)A 9 (1.1) 13 (1.2) 6 (1.0)Glyphosate 0.255 2 (0.8) 1 (0.7) 2 (0.7) 4 (0.9)Glyphosate 0.510 0 (0.6) 0 (0.6) 0 (0.6) 2 (0.8)2,2-DPA 2.22 42 (1.7) 18 (1.3) 14 (1.3) 29 (1.5)2,2-DPA 3.7 2 (0.8) 41 (1.7) 15 (1.3) 21 (1.4)Untreated – 39 (1.6) 50 (1.7) 41 (1.7) 66 (1.8)LSD (P = 0.05) (0.38)A Transformed data in parenthesis: log10 (panicle seed + 4)
Table 3. Glyphosate rates and time of application effect on Chilean needle grass panicle seed productionVariates Mean sed
Untreated
(X)
Oct 1 at 135 g ha-1
(Y)
Oct 1 at ≥270 g ha-1
(X)
Oct 18 at ≥135 g ha-1
(X)
Oct 28 at ≥135 g ha-1
(X)X v/s
X ColumnX v/s
Y ColumnGerminable seeds per 100 panicles (B)
913 124 0 0 0 – 129.3A
Seeds per 100 panicles (C) 1572 1015 1104 332 750 79.1–111.5 122.9–143.2Filled seeds % (B) 81 24 0 0 0 – 6.5A
Germination % (B) 70 46 – – – – 6.4A
A Only applicable for treatments with a value greater than 0B In these rows LSDs are obtained by multiplying sed by 2.262 C LSD is obtained by multiplying sed by 2.030
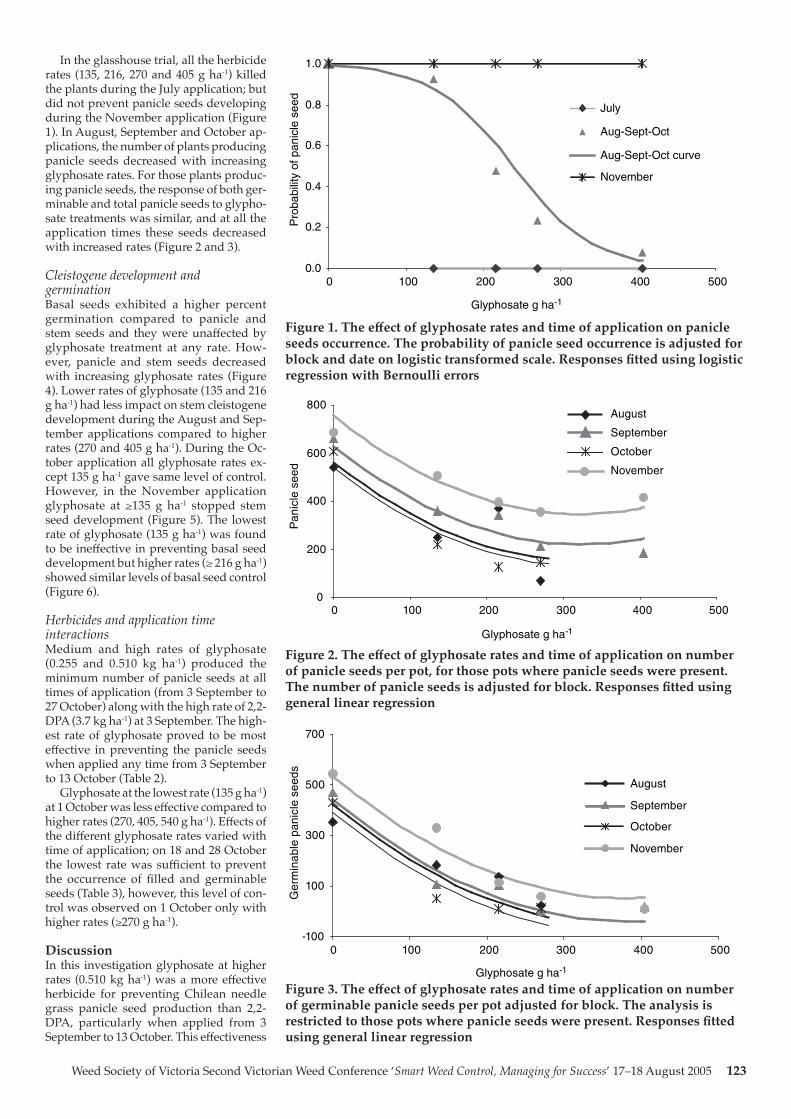
Weed Society of Victoria Second Victorian Weed Conference ‘Smart Weed Control, Managing for Success’ 17–18 August 2005 123
In the glasshouse trial, all the herbicide rates (135, 216, 270 and 405 g ha-1) killed the plants during the July application; but did not prevent panicle seeds developing during the November application (Figure 1). In August, September and October ap-plications, the number of plants producing panicle seeds decreased with increasing glyphosate rates. For those plants produc-ing panicle seeds, the response of both ger-minable and total panicle seeds to glypho-sate treatments was similar, and at all the application times these seeds decreased with increased rates (Figure 2 and 3).
Cleistogene development and germinationBasal seeds exhibited a higher percent germination compared to panicle and stem seeds and they were unaffected by glyphosate treatment at any rate. How-ever, panicle and stem seeds decreased with increasing glyphosate rates (Figure 4). Lower rates of glyphosate (135 and 216 g ha-1) had less impact on stem cleistogene development during the August and Sep-tember applications compared to higher rates (270 and 405 g ha-1). During the Oc-tober application all glyphosate rates ex-cept 135 g ha-1 gave same level of control. However, in the November application glyphosate at ≥135 g ha-1 stopped stem seed development (Figure 5). The lowest rate of glyphosate (135 g ha-1) was found to be ineffective in preventing basal seed development but higher rates (≥ 216 g ha-1) showed similar levels of basal seed control (Figure 6).
Herbicides and application time interactionsMedium and high rates of glyphosate (0.255 and 0.510 kg ha-1) produced the minimum number of panicle seeds at all times of application (from 3 September to 27 October) along with the high rate of 2,2-DPA (3.7 kg ha-1) at 3 September. The high-est rate of glyphosate proved to be most effective in preventing the panicle seeds when applied any time from 3 September to 13 October (Table 2).
Glyphosate at the lowest rate (135 g ha -1) at 1 October was less effective compared to higher rates (270, 405, 540 g ha-1). Effects of the different glyphosate rates varied with time of application; on 18 and 28 October the lowest rate was sufficient to prevent the occurrence of filled and germinable seeds (Table 3), however, this level of con-trol was observed on 1 October only with higher rates (≥270 g ha-1).
DiscussionIn this investigation glyphosate at higher rates (0.510 kg ha-1) was a more effective herbicide for preventing Chilean needle grass panicle seed production than 2,2-DPA, particularly when applied from 3 September to 13 October. This effectiveness
0.0
0.2
0.4
0.6
0.8
1.0
0 100 200 300 400 500
Glyphosate g ha-1P
roba
bilit
y of
pan
icle
see
d
July
Aug-Sept-Oct
Aug-Sept-Oct curve
November
Figure 1. The effect of glyphosate rates and time of application on panicle seeds occurrence. The probability of panicle seed occurrence is adjusted for block and date on logistic transformed scale. Responses fitted using logistic regression with Bernoulli errors
Figure 2. The effect of glyphosate rates and time of application on number of panicle seeds per pot, for those pots where panicle seeds were present. The number of panicle seeds is adjusted for block. Responses fitted using general linear regression
Figure 3. The effect of glyphosate rates and time of application on number of germinable panicle seeds per pot adjusted for block. The analysis is restricted to those pots where panicle seeds were present. Responses fitted using general linear regression
0
200
400
600
800
0 100 200 300 400 500
Glyphosate g ha-1
Pan
icle
see
d
August
September
October
November
-100
100
300
500
700
0 100 200 300 400 500
Glyphosate g ha-1
Ger
min
able
pan
icle
see
ds
August
September
October
November
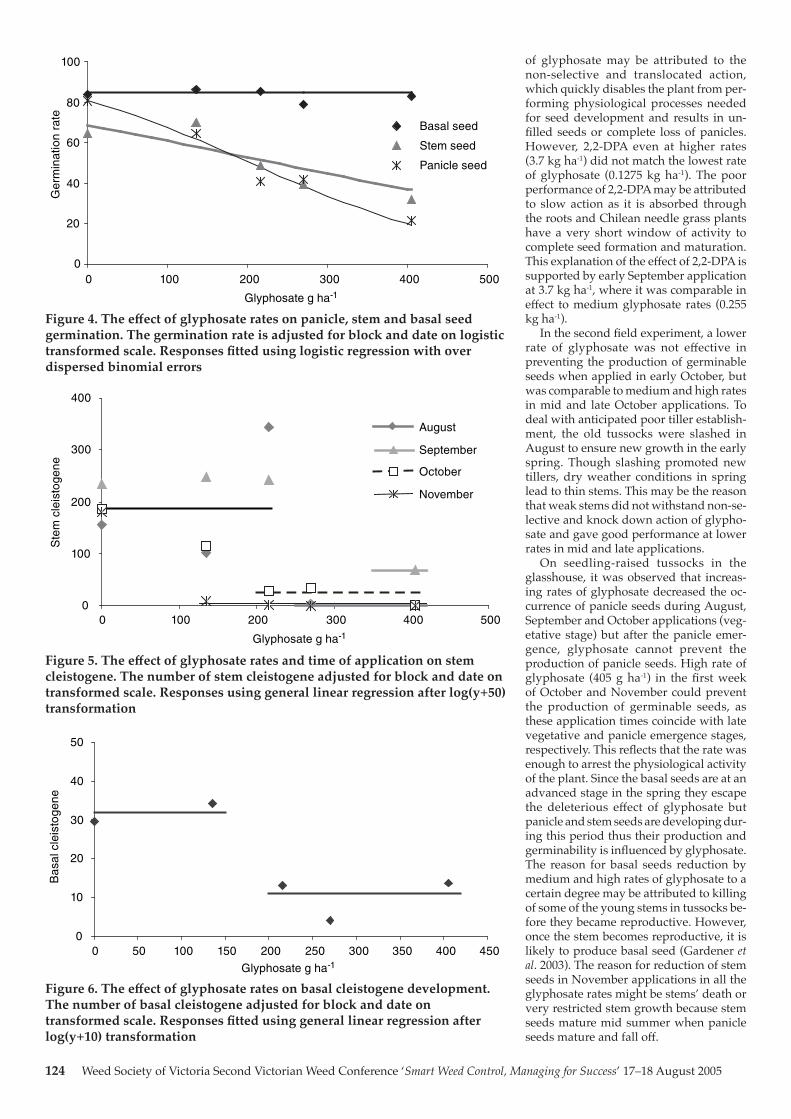
124 Weed Society of Victoria Second Victorian Weed Conference ‘Smart Weed Control, Managing for Success’ 17–18 August 2005
of glyphosate may be attributed to the non-selective and translocated action, which quickly disables the plant from per-forming physiological processes needed for seed development and results in un-filled seeds or complete loss of panicles. However, 2,2-DPA even at higher rates (3.7 kg ha-1) did not match the lowest rate of glyphosate (0.1275 kg ha-1). The poor performance of 2,2-DPA may be attributed to slow action as it is absorbed through the roots and Chilean needle grass plants have a very short window of activity to complete seed formation and maturation. This explanation of the effect of 2,2-DPA is supported by early September application at 3.7 kg ha-1, where it was comparable in effect to medium glyphosate rates (0.255 kg ha-1).
In the second field experiment, a lower rate of glyphosate was not effective in preventing the production of germinable seeds when applied in early October, but was comparable to medium and high rates in mid and late October applications. To deal with anticipated poor tiller establish-ment, the old tussocks were slashed in August to ensure new growth in the early spring. Though slashing promoted new tillers, dry weather conditions in spring lead to thin stems. This may be the reason that weak stems did not withstand non-se-lective and knock down action of glypho-sate and gave good performance at lower rates in mid and late applications.
On seedling-raised tussocks in the glasshouse, it was observed that increas-ing rates of glyphosate decreased the oc-currence of panicle seeds during August, September and October applications (veg-etative stage) but after the panicle emer-gence, glyphosate cannot prevent the production of panicle seeds. High rate of glyphosate (405 g ha-1) in the first week of October and November could prevent the production of germinable seeds, as these application times coincide with late vegetative and panicle emergence stages, respectively. This reflects that the rate was enough to arrest the physiological activity of the plant. Since the basal seeds are at an advanced stage in the spring they escape the deleterious effect of glyphosate but panicle and stem seeds are developing dur-ing this period thus their production and germinability is influenced by glyphosate. The reason for basal seeds reduction by medium and high rates of glyphosate to a certain degree may be attributed to killing of some of the young stems in tussocks be-fore they became reproductive. However, once the stem becomes reproductive, it is likely to produce basal seed (Gardener et al. 2003). The reason for reduction of stem seeds in November applications in all the glyphosate rates might be stems’ death or very restricted stem growth because stem seeds mature mid summer when panicle seeds mature and fall off.
Figure 4. The effect of glyphosate rates on panicle, stem and basal seed germination. The germination rate is adjusted for block and date on logistic transformed scale. Responses fitted using logistic regression with over dispersed binomial errors
Figure 5. The effect of glyphosate rates and time of application on stem cleistogene. The number of stem cleistogene adjusted for block and date on transformed scale. Responses using general linear regression after log(y+50) transformation
Figure 6. The effect of glyphosate rates on basal cleistogene development. The number of basal cleistogene adjusted for block and date on transformed scale. Responses fitted using general linear regression after log(y+10) transformation
0
20
40
60
80
100
0 100 200 300 400 500
Glyphosate g ha-1
Ger
min
atio
n ra
te
Basal seed
Stem seed
Panicle seed
0
100
200
300
400
0 100 200 300 400 500
Glyphosate g ha-1
Ste
m c
leis
toge
ne
August
September
October
November
0
10
20
30
40
50
0 50 100 150 200 250 300 350 400 450
Glyphosate g ha-1
Bas
al c
leis
toge
ne
Weed Society of Victoria Second Victorian Weed Conference ‘Smart Weed Control, Managing for Success’ 17–18 August 2005 125
The overall conclusion from these ex-periments is that application of glyphosate at rates of 250 g ha-1 between August and October are likely to very substantially re-duce production of viable Chilean needle grass seeds and may be a useful contri-bution to Chilean needle grass manage-ment. However 2,2-DPA is ineffective for this purpose unless applied early and at high rates. For glyphosate application as a spraytopping the timing is critical.
AcknowledgementsThe assistance of Julio Bonilla in estab-lishing the trials and final assessments is greatly acknowledged. The authors are grateful to Nigel Ainsworth for his valu-able comments on earlier version of this article.
ReferencesAnon. (2001). Chilean needle grass Nassella
neesiana. Weeds of national significance – National Strategy.
Connor, H.E., Edgar, E. and Bourdôt, G.W. (1993). Ecology and distribution of nat-uralised species of Stipa in New Zea-land. New Zealand Journal of Agricultural Research 36, 301-7.
Gardener, M.R., Whalley, R.D.B. and Sin-del, B.M. (2003). Ecology of Nassella nee-siana, Chilean needle grass, in pastures on the Northern Tablelands of New South Wales. I. Seed production and dispersal. Australian Journal of Agricul-tural Research 54, 613-19.
GenStat Committee (2005). The guide to GenStat Release 8. Part 2: Statistics. VSN International, Oxford, UK.
Hill, R.D., Missen, D.J. and Taylor, R.J. (1996). Use of glyphosate to prevent de-velopment of reproductive tillers and extend vegetative growth of bent grass (Agrostis castellana). Australian Journal of Experimental Agriculture 36, 661- 4.
Gatford, K.L., Simpson, R.J., Siever-Kelly, C., Leury, B.J., Dove, H. and Ciavarella, T.A. (1999). Spray-topping annual grass pasture with glyphosate to delay loss of feeding value during summer. I. Effects on pasture yield and nutritive value. Australian Journal of Agricultural Research 50, 453-64.
Leys, A.R., Cullis, B.R. and Plater, B. (1991). Effect of spraytopping applications of paraquat and glyphosate on the nutri-tive value and regeneration of Vulpia (Vulpia bromoides (L.) S.F.Gray). Austral-ian Journal of Agricultural Research 42, 1405-15.
Abstract Salvia verbenaca, wild sage (La-miaceae) is widespread in western and southern Europe. In Australia S. verbenaca is considered an environmental weed of-ten growing on disturbed sites: tracks, roadsides and around earth tanks. Little is known about the ecology of this inva-sive species in Australia, in particular, optimum temperature requirements and density of soil stored seed bank. Objec-tives of this study were to determine: (i) seed longevity, (ii) optimum temperature requirements for seed germination and (iii) density of soil seedbank. Seeds were germinated under controlled conditions at temperatures of 20, 25, 30 and 35°C under 12 hour light/12 hour dark and 24 hour dark conditions. Thirty-two soil samples were collected from areas of S. verbenaca infestation. Soil samples were placed in trays in a heated glasshouse and watered
daily. A significant difference was ob-served between the effects of the different light treatments (P=0.0000) and tempera-tures (P=0.0000). The highest germina-tion observed for seed collected in 1996 was at 20°C under 12 h light/12 h dark with 100% germination occurring by the fourth day. The highest germination for seed collected in 2004 was at 25°C under 12 h light/12 h dark with 96% germina-tion occurring by the sixth day. The soil seed bank study showed that the mean number of seedlings recruited per hectare was 6.23 ± SE 3.76. It appears that S. ver-benaca qualifies as an invasive. As such, it is always safer to take appropriate action at an early phase of invasion rather than at a late stage in the infestation. To do this, we must first undertake studies such as this to understand the plant’s ecological characteristics.
Ecology of the invasive weed Salvia verbenaca (wild sage) in the rangelands of western New South Wales
Robyn Fisher, Martin Westbrooke and Singrayer Florentine, Centre for Environmental Management, University of Ballarat, PO Box 663, Ballarat, Victoria 3353
Field resistance to flupropanate, the only selective herbicide for serrated tussock, was suspected in 2001 at Diggers Rest, near Melbourne, Victoria. ‘Resistant’ and ‘sus-ceptible’ plants were collected and grown on in a glasshouse. Seeds and re-potted tillers were tested with flupropanate at up to 6 kg ha-1. At 15 weeks after spraying, only ‘resistant’ tillers showed no reduction in leaf number or height per plant. At 12 months, susceptible plants were killed by
Flupropanate resistance in serrated tussock (Nassella trichotoma) in Victoria
S. NobleA, G. PritchardB, S.G. CasonatoA, A.C. LawrieA,C and D.A. McLarenB
A Biotechnology and Environmental Biology, School of Applied Sciences, RMIT University, PO Box 71, Bundoora, Victoria 3083B Department of Primary Industry Frankston, PO Box 48, Frankston, Victoria 3199C Corresponding author email: [email protected]
0.37 kg ha-1, while most ‘resistant’ plants were alive. At 18 months with 6 kg ha-1, plant height and inflorescence number in ‘resistant’ plants were no different from those of control plants. Shoots in seed-lings from ‘resistant’ plants were longer than shoots in seedlings from ‘susceptible’ plants in flupropanate concentrations of 100–1000 mg L-1. This resistance to flu-propanate has potentially serious conse-quences for control.

Blank page
Related Documents