2 Economic Growth, Savings and Investment 2.1 Summary The robust 6.4 percent FY04 growth is not only substantially higher than the 5.1 percent increase recorded in FY03, it is also well above the 5.3 percent GDP growth target for the year. This strong performance reinforces the view that Pakistan’s economy has begun to move out of the downtrend evident for the past 15 years (see Figure 2.1). 1 Such a movement was discerned in the mid 1990s also. Thus the record for the coming few years will decisively indicate whether the country has resumed its 6 percent growth path or not. Key factors in this medium-term recovery appear to be successful implementation of market liberalization reforms, the focus on long-term policies as well as a degree of good fortune, (as implicit in favorable agri-sector performances and improvement in the country’s external balances in recent years). While the higher net forex inflows played an important role in sustaining the easy monetary policy in recent years, the restoration of confidence in the domestic banking system arguably played an important role and the international environment was helpful in facilitating capital flows. Similarly, it was the fiscal reforms of late 1990s that led to a reduction in the fiscal deficit and therefore provided room to SBP to sustain the accommodative monetary stance. This was reinforced by the banking system reforms that gave banks the wherewithal to diversify lending towards consumer financing by stimulating aggregate demand, which with investment and consumption consequently drove the exceptional rise in large-scale manufacturing (LSM), particularly during FY04 (see Table 2.1). It is precisely these structural changes that lent resilience to the domestic economy, and raised 1 If the growth does indeed meet the 6.6 percent target for FY05 (as SBP forecasts indicate), this would strongly confirm the reversal in the long-term growth trend. Table 2.1: Sector-wise Growth Rates and Shares percent; at constant price of 1999-2000 Growth rates Shares FY03 R FY04 P FY03 R FY04 P Commodity producing sector 4.9 7.7 47.2 47.8 Agriculture 4.1 2.6 24.2 23.3 Crops 6.9 2.8 11.3 10.9 Major crops 6.9 2.8 8.3 8.0 Minor crops 0.4 1.7 3.0 2.9 Livestock 2.8 2.6 11.8 11.4 Fishing 3.4 2.0 0.3 0.3 Forestry 11.1 2.9 0.7 0.7 Industry 5.8 13.1 23.1 24.5 Manufacturing 6.9 13.4 16.4 17.5 Large scale 7.2 17.1 1 10.7 11.8 Small scale 7.5 7.5 4.2 4.3 Slaughtering 3.0 2.8 1.5 1.4 Mining & quarrying 16.1 0.0 1.5 1.4 Construction 3.1 7.9 2.4 2.4 Electricity & gas distribution -2.6 22.5 2.8 3.2 Services sector 5.3 5.2 52.8 52.2 Wholesale & retail trade 5.9 8.0 18.1 18.4 Transport, storage and comm. 4.0 3.9 11.4 11.1 Finance & insurance -3.2 -3.7 3.3 3.0 Ownership of dwellings 3.5 3.5 3.2 3.1 Public admin. & defense 10.1 5.9 6.8 6.8 Other services 6.3 4.8 10.0 9.8 Gross domestic product (GDP) 5.1 6.4 100.0 100.0 R: Revised; P: Provisional; 1: LSM growth rate is 18.1 percent based on full year production data. Source: FBS. Figure 2.1: Real GDP Growth 1 2 3 4 5 6 7 8 9 FY85 FY86 FY87 FY88 FY89 FY90 FY91 FY92 FY93 FY94 FY95 FY96 FY97 FY98 FY99 FY00 FY01 FY02 FY03 FY04 percent

Welcome message from author
This document is posted to help you gain knowledge. Please leave a comment to let me know what you think about it! Share it to your friends and learn new things together.
Transcript
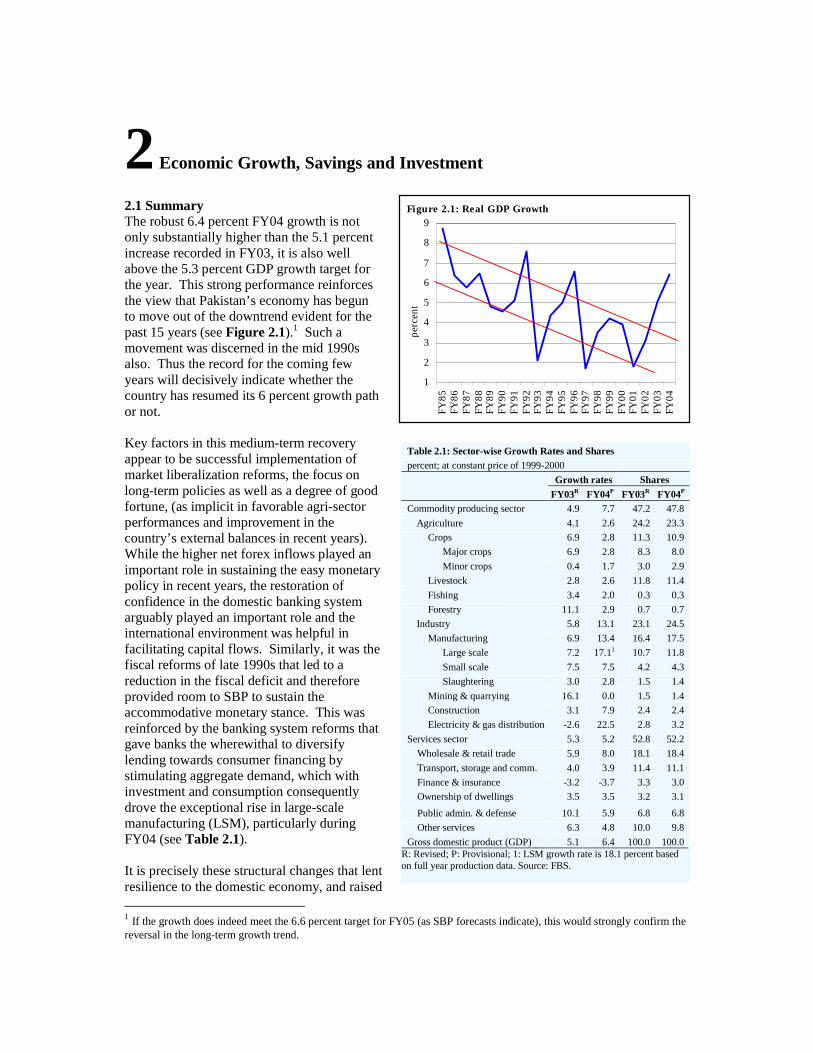
2 Economic Growth, Savings and Investment 2.1 Summary The robust 6.4 percent FY04 growth is not only substantially higher than the 5.1 percent increase recorded in FY03, it is also well above the 5.3 percent GDP growth target for the year. This strong performance reinforces the view that Pakistan’s economy has begun to move out of the downtrend evident for the past 15 years (see Figure 2.1).1 Such a movement was discerned in the mid 1990s also. Thus the record for the coming few years will decisively indicate whether the country has resumed its 6 percent growth path or not. Key factors in this medium-term recovery appear to be successful implementation of market liberalization reforms, the focus on long-term policies as well as a degree of good fortune, (as implicit in favorable agri-sector performances and improvement in the country’s external balances in recent years). While the higher net forex inflows played an important role in sustaining the easy monetary policy in recent years, the restoration of confidence in the domestic banking system arguably played an important role and the international environment was helpful in facilitating capital flows. Similarly, it was the fiscal reforms of late 1990s that led to a reduction in the fiscal deficit and therefore provided room to SBP to sustain the accommodative monetary stance. This was reinforced by the banking system reforms that gave banks the wherewithal to diversify lending towards consumer financing by stimulating aggregate demand, which with investment and consumption consequently drove the exceptional rise in large-scale manufacturing (LSM), particularly during FY04 (see Table 2.1). It is precisely these structural changes that lent resilience to the domestic economy, and raised 1 If the growth does indeed meet the 6.6 percent target for FY05 (as SBP forecasts indicate), this would strongly confirm the reversal in the long-term growth trend.
Table 2.1: Sector-wise Growth Rates and Shares percent; at constant price of 1999-2000 Growth rates Shares FY03R FY04P FY03R FY04P Commodity producing sector 4.9 7.7 47.2 47.8
Agriculture 4.1 2.6 24.2 23.3Crops 6.9 2.8 11.3 10.9
Major crops 6.9 2.8 8.3 8.0Minor crops 0.4 1.7 3.0 2.9
Livestock 2.8 2.6 11.8 11.4Fishing 3.4 2.0 0.3 0.3Forestry 11.1 2.9 0.7 0.7
Industry 5.8 13.1 23.1 24.5Manufacturing 6.9 13.4 16.4 17.5
Large scale 7.2 17.11 10.7 11.8Small scale 7.5 7.5 4.2 4.3Slaughtering 3.0 2.8 1.5 1.4
Mining & quarrying 16.1 0.0 1.5 1.4Construction 3.1 7.9 2.4 2.4Electricity & gas distribution -2.6 22.5 2.8 3.2
Services sector 5.3 5.2 52.8 52.2Wholesale & retail trade 5.9 8.0 18.1 18.4Transport, storage and comm. 4.0 3.9 11.4 11.1Finance & insurance -3.2 -3.7 3.3 3.0Ownership of dwellings 3.5 3.5 3.2 3.1
Public admin. & defense 10.1 5.9 6.8 6.8Other services 6.3 4.8 10.0 9.8
Gross domestic product (GDP) 5.1 6.4 100.0 100.0R: Revised; P: Provisional; 1: LSM growth rate is 18.1 percent based on full year production data. Source: FBS.
Figure 2.1: Real GDP Growth
1
2
3
4
5
6
7
8
9
FY85
FY86
FY87
FY88
FY89
FY90
FY91
FY92
FY93
FY94
FY95
FY96
FY97
FY98
FY99
FY00
FY01
FY02
FY03
FY04
perc
ent
State Bank of Pakistan Annual Report FY04
12
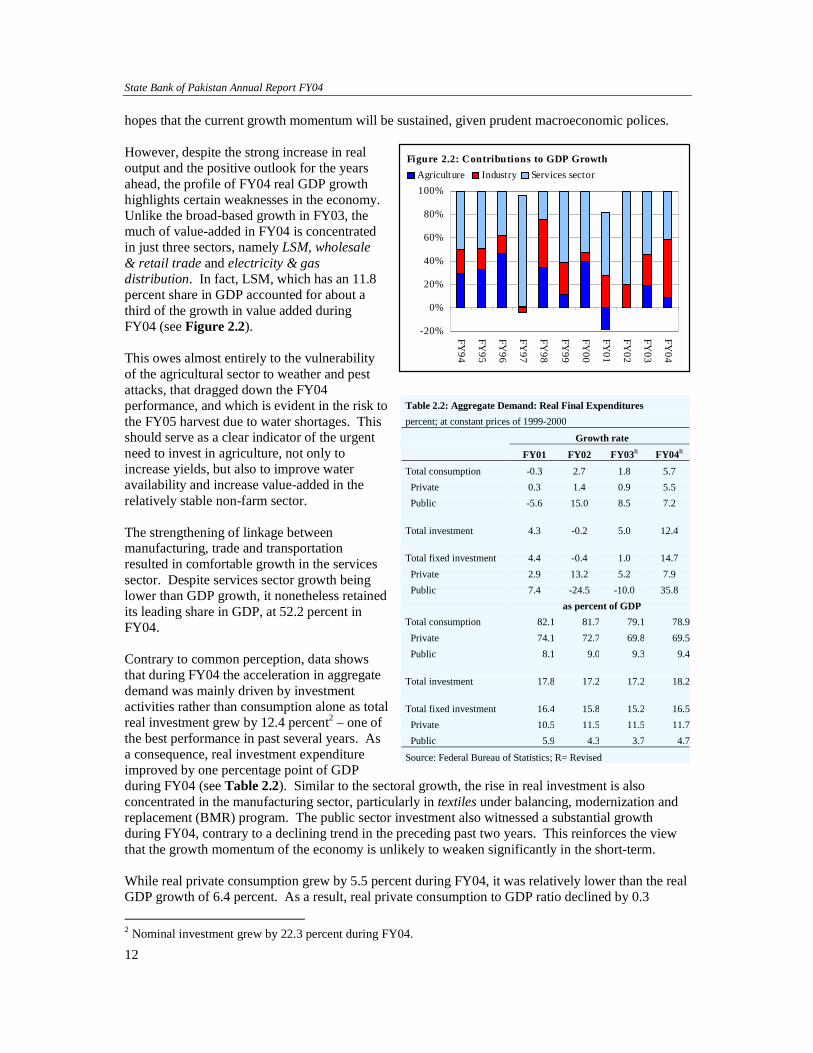
hopes that the current growth momentum will be sustained, given prudent macroeconomic polices. However, despite the strong increase in real output and the positive outlook for the years ahead, the profile of FY04 real GDP growth highlights certain weaknesses in the economy. Unlike the broad-based growth in FY03, the much of value-added in FY04 is concentrated in just three sectors, namely LSM, wholesale & retail trade and electricity & gas distribution. In fact, LSM, which has an 11.8 percent share in GDP accounted for about a third of the growth in value added during FY04 (see Figure 2.2). This owes almost entirely to the vulnerability of the agricultural sector to weather and pest attacks, that dragged down the FY04 performance, and which is evident in the risk to the FY05 harvest due to water shortages. This should serve as a clear indicator of the urgent need to invest in agriculture, not only to increase yields, but also to improve water availability and increase value-added in the relatively stable non-farm sector. The strengthening of linkage between manufacturing, trade and transportation resulted in comfortable growth in the services sector. Despite services sector growth being lower than GDP growth, it nonetheless retained its leading share in GDP, at 52.2 percent in FY04. Contrary to common perception, data shows that during FY04 the acceleration in aggregate demand was mainly driven by investment activities rather than consumption alone as total real investment grew by 12.4 percent2 – one of the best performance in past several years. As a consequence, real investment expenditure improved by one percentage point of GDP during FY04 (see Table 2.2). Similar to the sectoral growth, the rise in real investment is also concentrated in the manufacturing sector, particularly in textiles under balancing, modernization and replacement (BMR) program. The public sector investment also witnessed a substantial growth during FY04, contrary to a declining trend in the preceding past two years. This reinforces the view that the growth momentum of the economy is unlikely to weaken significantly in the short-term. While real private consumption grew by 5.5 percent during FY04, it was relatively lower than the real GDP growth of 6.4 percent. As a result, real private consumption to GDP ratio declined by 0.3 2 Nominal investment grew by 22.3 percent during FY04.
Table 2.2: Aggregate Demand: Real Final Expenditures percent; at constant prices of 1999-2000
Growth rate FY01 FY02 FY03R FY04R
Total consumption -0.3 2.7 1.8 5.7 Private 0.3 1.4 0.9 5.5 Public -5.6 15.0 8.5 7.2 Total investment 4.3 -0.2 5.0 12.4 Total fixed investment 4.4 -0.4 1.0 14.7 Private 2.9 13.2 5.2 7.9 Public 7.4 -24.5 -10.0 35.8 as percent of GDP Total consumption 82.1 81.7 79.1 78.9 Private 74.1 72.7 69.8 69.5 Public 8.1 9.0 9.3 9.4 Total investment 17.8 17.2 17.2 18.2 Total fixed investment 16.4 15.8 15.2 16.5 Private 10.5 11.5 11.5 11.7 Public 5.9 4.3 3.7 4.7
Source: Federal Bureau of Statistics; R= Revised
Figure 2.2: Contributions to GDP Growth
-20%
0%
20%
40%
60%
80%
100%
FY94
FY95
FY96
FY97
FY98
FY99
FY00
FY01
FY02
FY03
FY04
Agriculture Industry Services sector
Economic Growth, Savings and Investments
13
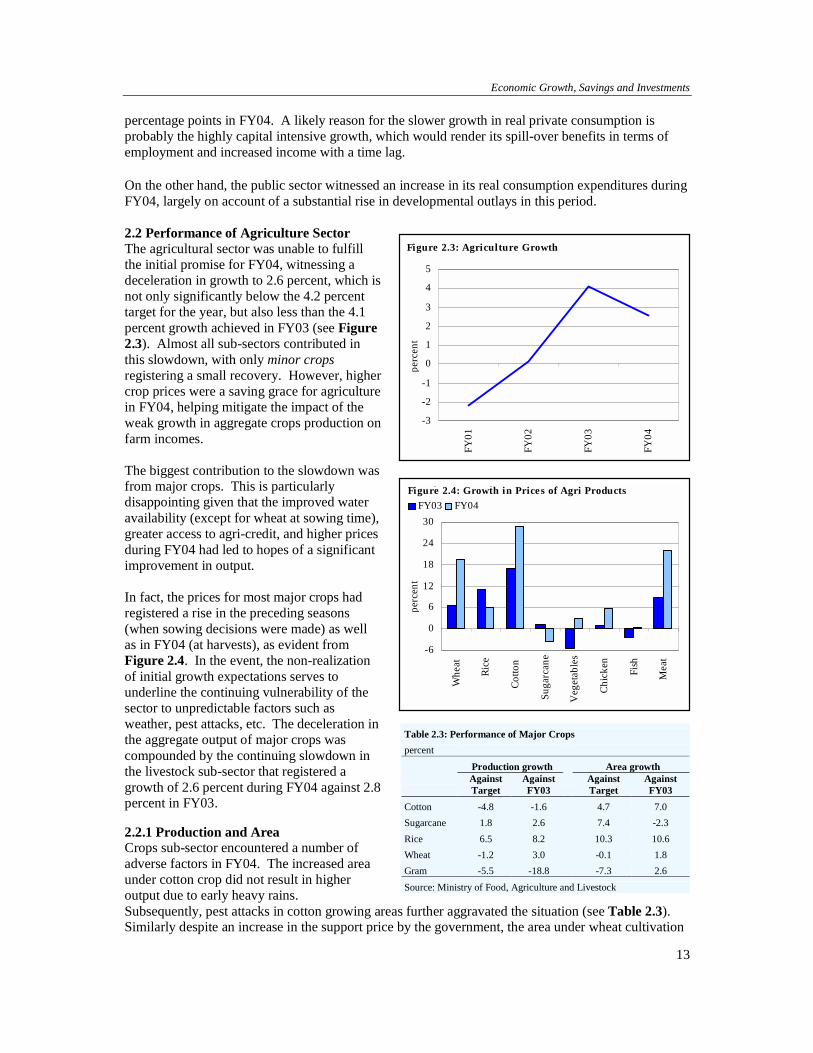
percentage points in FY04. A likely reason for the slower growth in real private consumption is probably the highly capital intensive growth, which would render its spill-over benefits in terms of employment and increased income with a time lag. On the other hand, the public sector witnessed an increase in its real consumption expenditures during FY04, largely on account of a substantial rise in developmental outlays in this period. 2.2 Performance of Agriculture Sector The agricultural sector was unable to fulfill the initial promise for FY04, witnessing a deceleration in growth to 2.6 percent, which is not only significantly below the 4.2 percent target for the year, but also less than the 4.1 percent growth achieved in FY03 (see Figure 2.3). Almost all sub-sectors contributed in this slowdown, with only minor crops registering a small recovery. However, higher crop prices were a saving grace for agriculture in FY04, helping mitigate the impact of the weak growth in aggregate crops production on farm incomes. The biggest contribution to the slowdown was from major crops. This is particularly disappointing given that the improved water availability (except for wheat at sowing time), greater access to agri-credit, and higher prices during FY04 had led to hopes of a significant improvement in output. In fact, the prices for most major crops had registered a rise in the preceding seasons (when sowing decisions were made) as well as in FY04 (at harvests), as evident from Figure 2.4. In the event, the non-realization of initial growth expectations serves to underline the continuing vulnerability of the sector to unpredictable factors such as weather, pest attacks, etc. The deceleration in the aggregate output of major crops was compounded by the continuing slowdown in the livestock sub-sector that registered a growth of 2.6 percent during FY04 against 2.8 percent in FY03. 2.2.1 Production and Area Crops sub-sector encountered a number of adverse factors in FY04. The increased area under cotton crop did not result in higher output due to early heavy rains. Subsequently, pest attacks in cotton growing areas further aggravated the situation (see Table 2.3). Similarly despite an increase in the support price by the government, the area under wheat cultivation
Table 2.3: Performance of Major Crops percent Production growth Area growth
Against Target
Against FY03
Against Target
Against FY03
Cotton -4.8 -1.6 4.7 7.0 Sugarcane 1.8 2.6 7.4 -2.3 Rice 6.5 8.2 10.3 10.6 Wheat -1.2 3.0 -0.1 1.8 Gram -5.5 -18.8 -7.3 2.6 Source: Ministry of Food, Agriculture and Livestock
Figure 2.3: Agriculture Growth
-3
-2
-1
0
1
2
3
4
5
FY01
FY02
FY03
FY04
perc
ent
-6
0
6
12
18
24
30
Whe
at
Rice
Cotto
n
Suga
rcan
e
Veg
etab
les
Chic
ken
Fish
Mea
t
perc
ent
FY03 FY04G h i P i f I A i P dFigure 2.4: Growth in Prices of Agri Products
State Bank of Pakistan Annual Report FY04
14
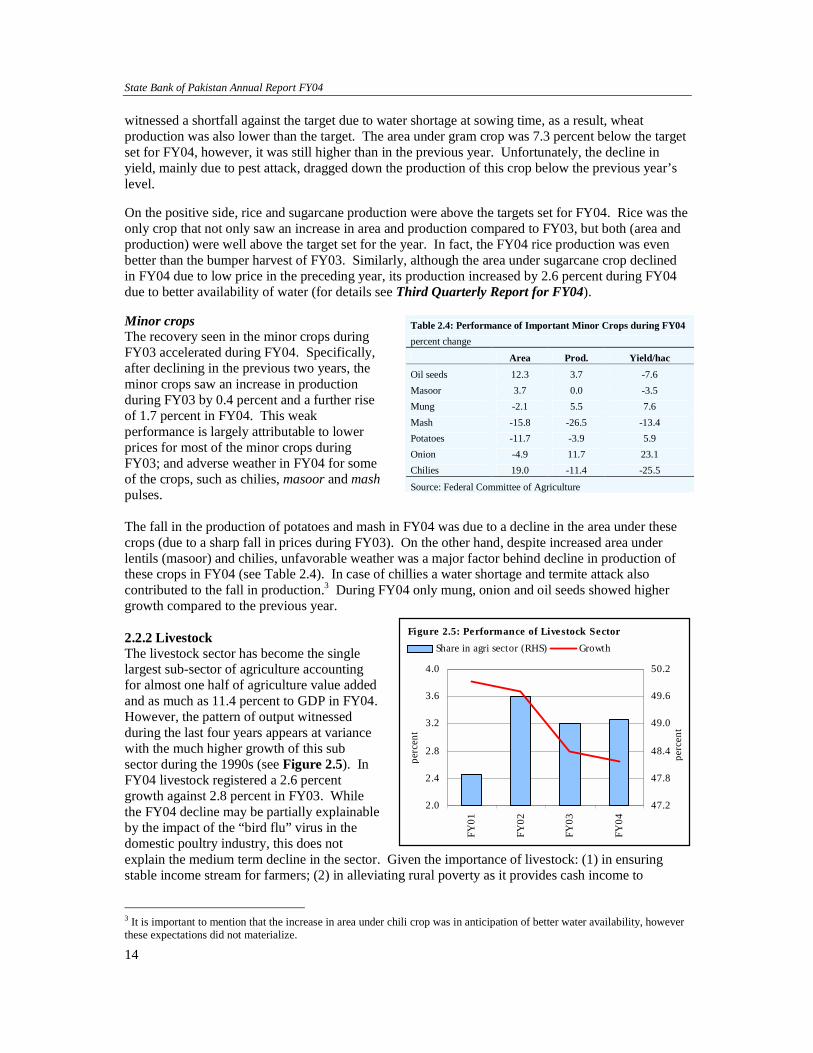
witnessed a shortfall against the target due to water shortage at sowing time, as a result, wheat production was also lower than the target. The area under gram crop was 7.3 percent below the target set for FY04, however, it was still higher than in the previous year. Unfortunately, the decline in yield, mainly due to pest attack, dragged down the production of this crop below the previous year’s level. On the positive side, rice and sugarcane production were above the targets set for FY04. Rice was the only crop that not only saw an increase in area and production compared to FY03, but both (area and production) were well above the target set for the year. In fact, the FY04 rice production was even better than the bumper harvest of FY03. Similarly, although the area under sugarcane crop declined in FY04 due to low price in the preceding year, its production increased by 2.6 percent during FY04 due to better availability of water (for details see Third Quarterly Report for FY04). Minor crops The recovery seen in the minor crops during FY03 accelerated during FY04. Specifically, after declining in the previous two years, the minor crops saw an increase in production during FY03 by 0.4 percent and a further rise of 1.7 percent in FY04. This weak performance is largely attributable to lower prices for most of the minor crops during FY03; and adverse weather in FY04 for some of the crops, such as chilies, masoor and mash pulses. The fall in the production of potatoes and mash in FY04 was due to a decline in the area under these crops (due to a sharp fall in prices during FY03). On the other hand, despite increased area under lentils (masoor) and chilies, unfavorable weather was a major factor behind decline in production of these crops in FY04 (see Table 2.4). In case of chillies a water shortage and termite attack also contributed to the fall in production.3 During FY04 only mung, onion and oil seeds showed higher growth compared to the previous year. 2.2.2 Livestock The livestock sector has become the single largest sub-sector of agriculture accounting for almost one half of agriculture value added and as much as 11.4 percent to GDP in FY04. However, the pattern of output witnessed during the last four years appears at variance with the much higher growth of this sub sector during the 1990s (see Figure 2.5). In FY04 livestock registered a 2.6 percent growth against 2.8 percent in FY03. While the FY04 decline may be partially explainable by the impact of the “bird flu” virus in the domestic poultry industry, this does not explain the medium term decline in the sector. Given the importance of livestock: (1) in ensuring stable income stream for farmers; (2) in alleviating rural poverty as it provides cash income to
3 It is important to mention that the increase in area under chili crop was in anticipation of better water availability, however these expectations did not materialize.
Table 2.4: Performance of Important Minor Crops during FY04 percent change
Area Prod. Yield/hac Oil seeds 12.3 3.7 -7.6 Masoor 3.7 0.0 -3.5 Mung -2.1 5.5 7.6 Mash -15.8 -26.5 -13.4 Potatoes -11.7 -3.9 5.9 Onion -4.9 11.7 23.1 Chilies 19.0 -11.4 -25.5
Source: Federal Committee of Agriculture
2.0
2.4
2.8
3.2
3.6
4.0
FY01
FY02
FY03
FY04
perc
ent
47.2
47.8
48.4
49.0
49.6
50.2pe
rcen
t
Share in agri sector (RHS) GrowthFigure 2.5: Performance of Livestock Sector
Economic Growth, Savings and Investments
15
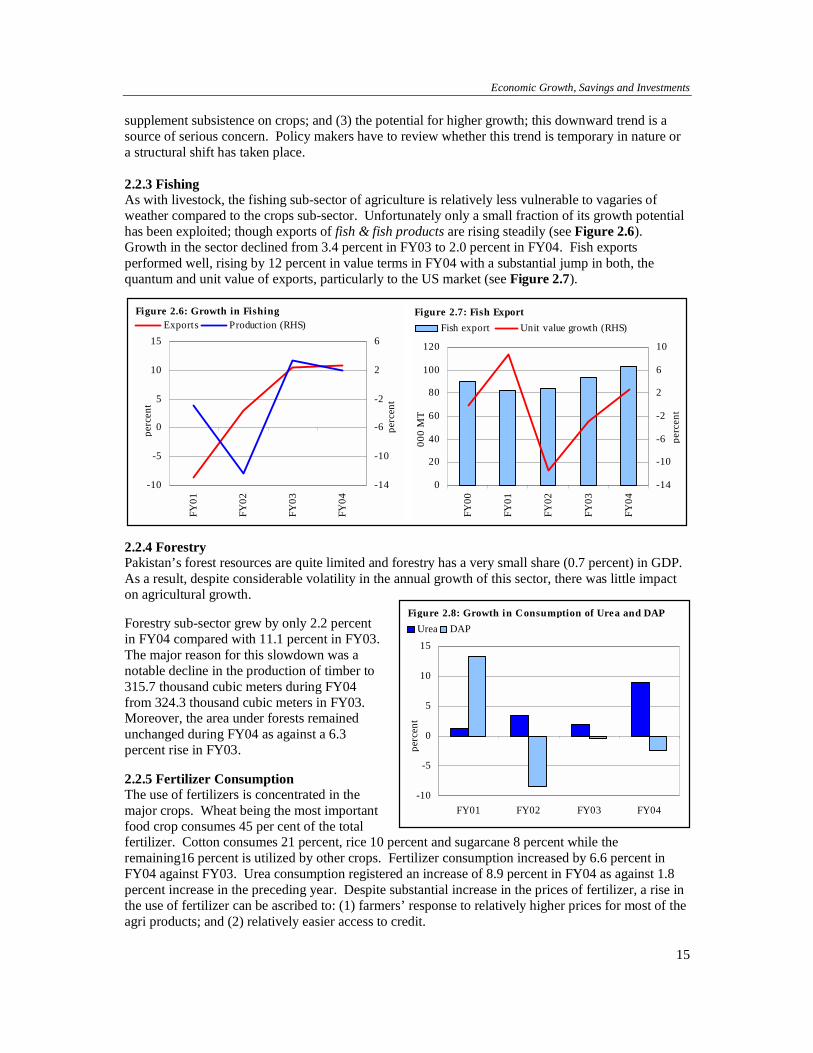
supplement subsistence on crops; and (3) the potential for higher growth; this downward trend is a source of serious concern. Policy makers have to review whether this trend is temporary in nature or a structural shift has taken place. 2.2.3 Fishing As with livestock, the fishing sub-sector of agriculture is relatively less vulnerable to vagaries of weather compared to the crops sub-sector. Unfortunately only a small fraction of its growth potential has been exploited; though exports of fish & fish products are rising steadily (see Figure 2.6). Growth in the sector declined from 3.4 percent in FY03 to 2.0 percent in FY04. Fish exports performed well, rising by 12 percent in value terms in FY04 with a substantial jump in both, the quantum and unit value of exports, particularly to the US market (see Figure 2.7).
2.2.4 Forestry Pakistan’s forest resources are quite limited and forestry has a very small share (0.7 percent) in GDP. As a result, despite considerable volatility in the annual growth of this sector, there was little impact on agricultural growth. Forestry sub-sector grew by only 2.2 percent in FY04 compared with 11.1 percent in FY03. The major reason for this slowdown was a notable decline in the production of timber to 315.7 thousand cubic meters during FY04 from 324.3 thousand cubic meters in FY03. Moreover, the area under forests remained unchanged during FY04 as against a 6.3 percent rise in FY03. 2.2.5 Fertilizer Consumption The use of fertilizers is concentrated in the major crops. Wheat being the most important food crop consumes 45 per cent of the total fertilizer. Cotton consumes 21 percent, rice 10 percent and sugarcane 8 percent while the remaining16 percent is utilized by other crops. Fertilizer consumption increased by 6.6 percent in FY04 against FY03. Urea consumption registered an increase of 8.9 percent in FY04 as against 1.8 percent increase in the preceding year. Despite substantial increase in the prices of fertilizer, a rise in the use of fertilizer can be ascribed to: (1) farmers’ response to relatively higher prices for most of the agri products; and (2) relatively easier access to credit.
0
20
40
60
80
100
120
FY00
FY01
FY02
FY03
FY04
000
MT
-14
-10
-6
-2
2
6
10
perc
ent
Fish export Unit value growth (RHS)Figure 2.7: Fish Export
-10
-5
0
5
10
15
FY01
FY02
FY03
FY04
perc
ent
-14
-10
-6
-2
2
6
perc
ent
Exports Production (RHS)Figure 2.6: Growth in Fishing
-10
-5
0
5
10
15
FY01 FY02 FY03 FY04
perc
ent
Urea DAPFigure 2.8: Growth in Consumption of Urea and DAP
State Bank of Pakistan Annual Report FY04
16
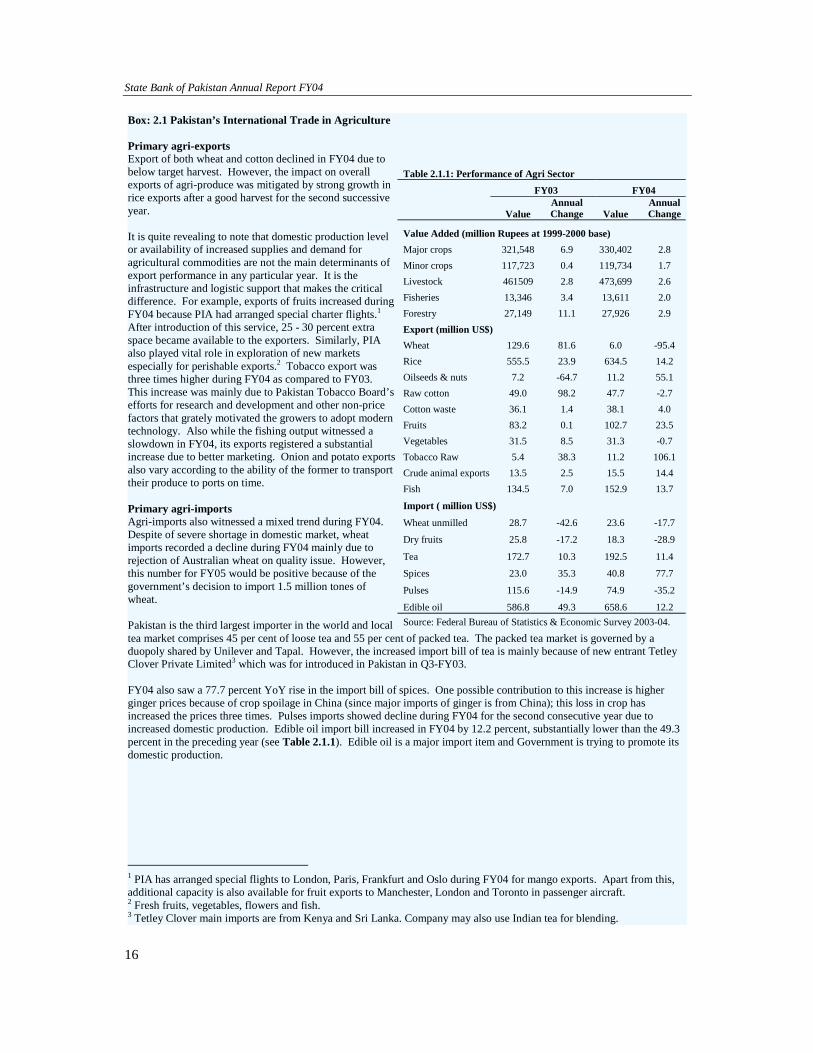
Box: 2.1 Pakistan’s International Trade in Agriculture Primary agri-exports Export of both wheat and cotton declined in FY04 due to below target harvest. However, the impact on overall exports of agri-produce was mitigated by strong growth in rice exports after a good harvest for the second successive year. It is quite revealing to note that domestic production level or availability of increased supplies and demand for agricultural commodities are not the main determinants of export performance in any particular year. It is the infrastructure and logistic support that makes the critical difference. For example, exports of fruits increased during FY04 because PIA had arranged special charter flights.1 After introduction of this service, 25 - 30 percent extra space became available to the exporters. Similarly, PIA also played vital role in exploration of new markets especially for perishable exports.2 Tobacco export was three times higher during FY04 as compared to FY03. This increase was mainly due to Pakistan Tobacco Board’s efforts for research and development and other non-price factors that grately motivated the growers to adopt modern technology. Also while the fishing output witnessed a slowdown in FY04, its exports registered a substantial increase due to better marketing. Onion and potato exports also vary according to the ability of the former to transport their produce to ports on time. Primary agri-imports Agri-imports also witnessed a mixed trend during FY04. Despite of severe shortage in domestic market, wheat imports recorded a decline during FY04 mainly due to rejection of Australian wheat on quality issue. However, this number for FY05 would be positive because of the government’s decision to import 1.5 million tones of wheat. Pakistan is the third largest importer in the world and local tea market comprises 45 per cent of loose tea and 55 per cent of packed tea. The packed tea market is governed by a duopoly shared by Unilever and Tapal. However, the increased import bill of tea is mainly because of new entrant Tetley Clover Private Limited3 which was for introduced in Pakistan in Q3-FY03. FY04 also saw a 77.7 percent YoY rise in the import bill of spices. One possible contribution to this increase is higher ginger prices because of crop spoilage in China (since major imports of ginger is from China); this loss in crop has increased the prices three times. Pulses imports showed decline during FY04 for the second consecutive year due to increased domestic production. Edible oil import bill increased in FY04 by 12.2 percent, substantially lower than the 49.3 percent in the preceding year (see Table 2.1.1). Edible oil is a major import item and Government is trying to promote its domestic production.
1 PIA has arranged special flights to London, Paris, Frankfurt and Oslo during FY04 for mango exports. Apart from this, additional capacity is also available for fruit exports to Manchester, London and Toronto in passenger aircraft. 2 Fresh fruits, vegetables, flowers and fish. 3 Tetley Clover main imports are from Kenya and Sri Lanka. Company may also use Indian tea for blending.
Table 2.1.1: Performance of Agri Sector FY03 FY04
Value Annual Change Value
Annual Change
Value Added (million Rupees at 1999-2000 base) Major crops 321,548 6.9 330,402 2.8 Minor crops 117,723 0.4 119,734 1.7 Livestock 461509 2.8 473,699 2.6 Fisheries 13,346 3.4 13,611 2.0 Forestry 27,149 11.1 27,926 2.9 Export (million US$) Wheat 129.6 81.6 6.0 -95.4 Rice 555.5 23.9 634.5 14.2 Oilseeds & nuts 7.2 -64.7 11.2 55.1 Raw cotton 49.0 98.2 47.7 -2.7 Cotton waste 36.1 1.4 38.1 4.0 Fruits 83.2 0.1 102.7 23.5 Vegetables 31.5 8.5 31.3 -0.7 Tobacco Raw 5.4 38.3 11.2 106.1 Crude animal exports 13.5 2.5 15.5 14.4 Fish 134.5 7.0 152.9 13.7
Import ( million US$)
Wheat unmilled 28.7 -42.6 23.6 -17.7
Dry fruits 25.8 -17.2 18.3 -28.9
Tea 172.7 10.3 192.5 11.4
Spices 23.0 35.3 40.8 77.7
Pulses 115.6 -14.9 74.9 -35.2
Edible oil 586.8 49.3 658.6 12.2 Source: Federal Bureau of Statistics & Economic Survey 2003-04.
Economic Growth, Savings and Investments
17
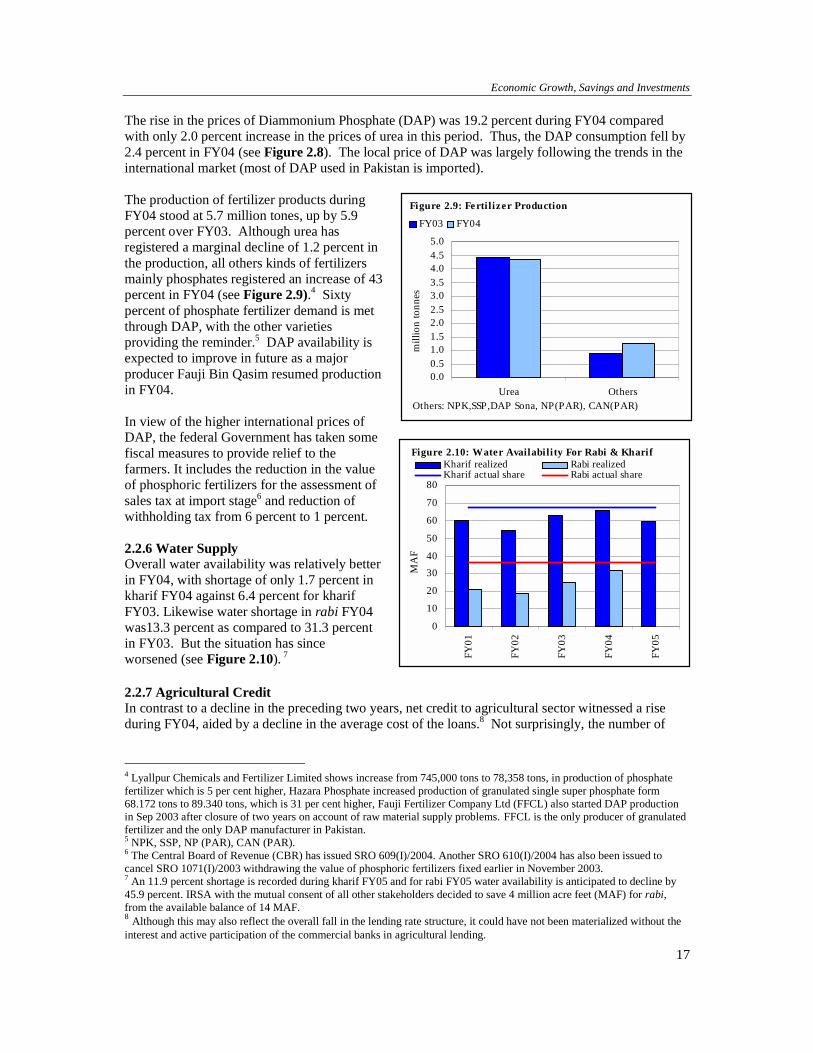
The rise in the prices of Diammonium Phosphate (DAP) was 19.2 percent during FY04 compared with only 2.0 percent increase in the prices of urea in this period. Thus, the DAP consumption fell by 2.4 percent in FY04 (see Figure 2.8). The local price of DAP was largely following the trends in the international market (most of DAP used in Pakistan is imported). The production of fertilizer products during FY04 stood at 5.7 million tones, up by 5.9 percent over FY03. Although urea has registered a marginal decline of 1.2 percent in the production, all others kinds of fertilizers mainly phosphates registered an increase of 43 percent in FY04 (see Figure 2.9).4 Sixty percent of phosphate fertilizer demand is met through DAP, with the other varieties providing the reminder.5 DAP availability is expected to improve in future as a major producer Fauji Bin Qasim resumed production in FY04. In view of the higher international prices of DAP, the federal Government has taken some fiscal measures to provide relief to the farmers. It includes the reduction in the value of phosphoric fertilizers for the assessment of sales tax at import stage6 and reduction of withholding tax from 6 percent to 1 percent. 2.2.6 Water Supply Overall water availability was relatively better in FY04, with shortage of only 1.7 percent in kharif FY04 against 6.4 percent for kharif FY03. Likewise water shortage in rabi FY04 was13.3 percent as compared to 31.3 percent in FY03. But the situation has since worsened (see Figure 2.10). 7 2.2.7 Agricultural Credit In contrast to a decline in the preceding two years, net credit to agricultural sector witnessed a rise during FY04, aided by a decline in the average cost of the loans.8 Not surprisingly, the number of
4 Lyallpur Chemicals and Fertilizer Limited shows increase from 745,000 tons to 78,358 tons, in production of phosphate fertilizer which is 5 per cent higher, Hazara Phosphate increased production of granulated single super phosphate form 68.172 tons to 89.340 tons, which is 31 per cent higher, Fauji Fertilizer Company Ltd (FFCL) also started DAP production in Sep 2003 after closure of two years on account of raw material supply problems. FFCL is the only producer of granulated fertilizer and the only DAP manufacturer in Pakistan. 5 NPK, SSP, NP (PAR), CAN (PAR). 6 The Central Board of Revenue (CBR) has issued SRO 609(I)/2004. Another SRO 610(I)/2004 has also been issued to cancel SRO 1071(I)/2003 withdrawing the value of phosphoric fertilizers fixed earlier in November 2003. 7 An 11.9 percent shortage is recorded during kharif FY05 and for rabi FY05 water availability is anticipated to decline by 45.9 percent. IRSA with the mutual consent of all other stakeholders decided to save 4 million acre feet (MAF) for rabi, from the available balance of 14 MAF. 8 Although this may also reflect the overall fall in the lending rate structure, it could have not been materialized without the interest and active participation of the commercial banks in agricultural lending.
0.00.51.01.52.02.53.03.54.04.55.0
Urea Others
mill
ion
tonn
es
FY03 FY04
Figure 2.9: Ferti lizer Production
Others: NPK,SSP,DAP Sona, NP(PAR), CAN(PAR)
0
10
20
30
40
50
60
70
80FY
01
FY02
FY03
FY04
FY05
MA
F
Kharif realized Rabi realizedKharif actual share Rabi actual share
Figure 2.10: Water Availability For Rabi & Kharif
State Bank of Pakistan Annual Report FY04
18
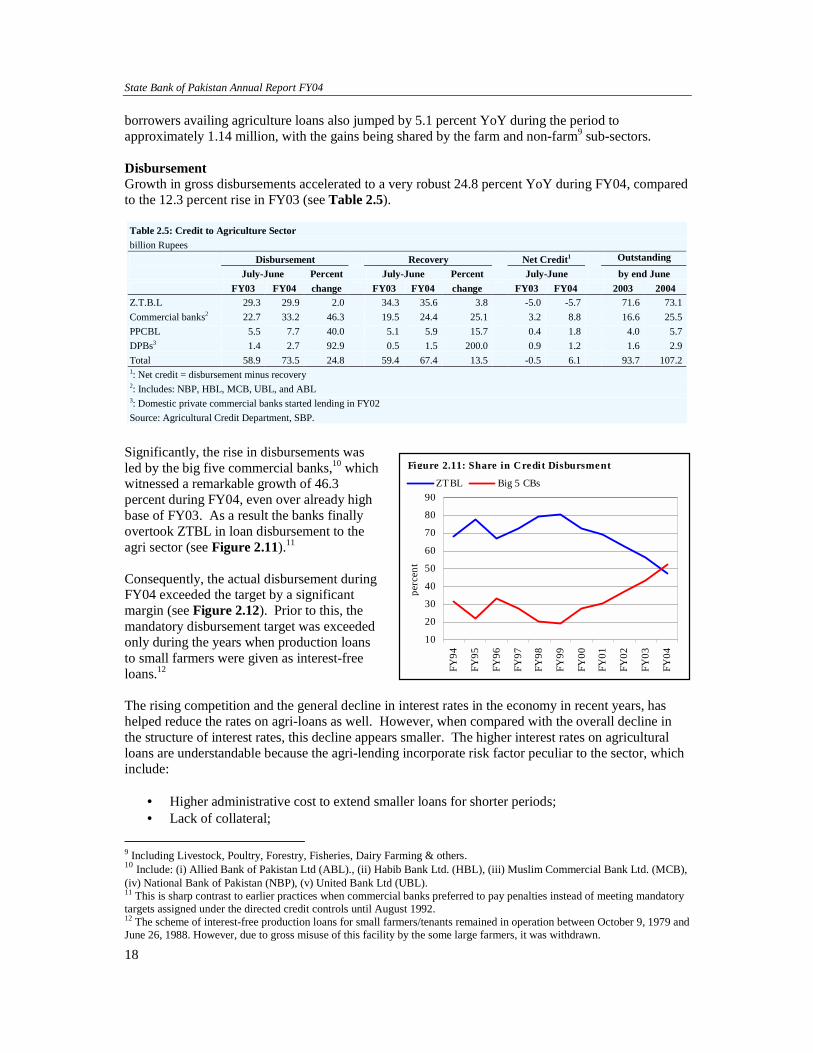
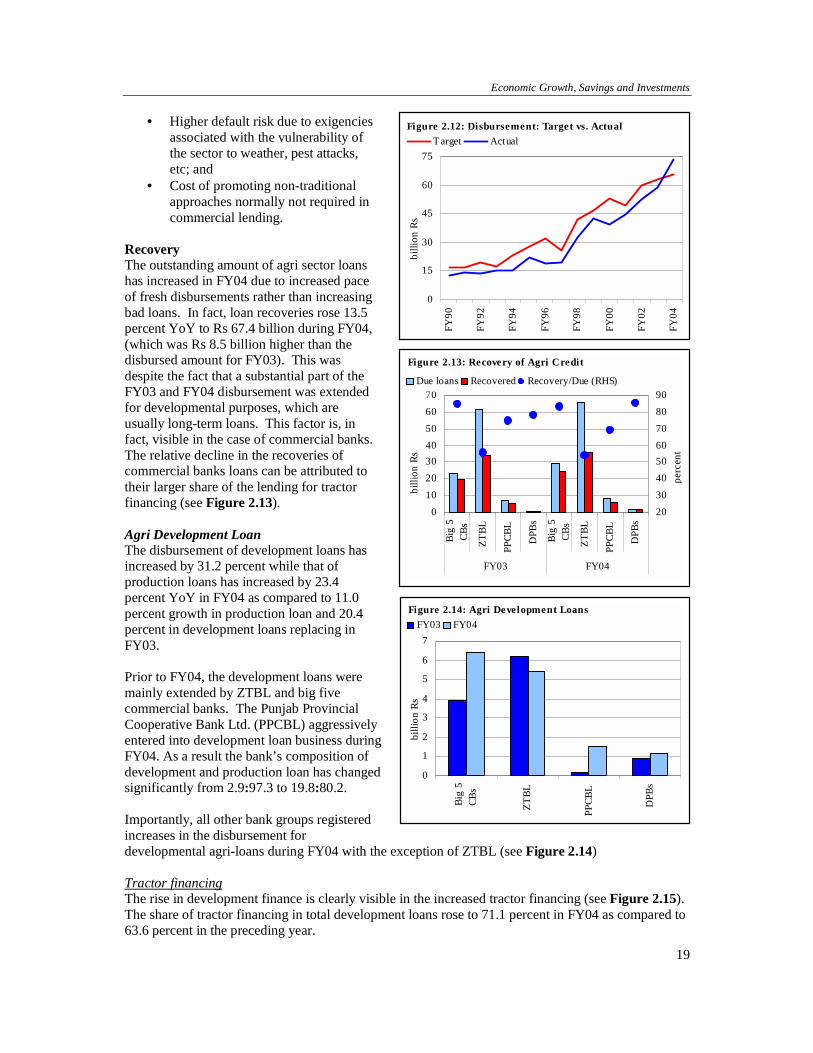
borrowers availing agriculture loans also jumped by 5.1 percent YoY during the period to approximately 1.14 million, with the gains being shared by the farm and non-farm9 sub-sectors. Disbursement Growth in gross disbursements accelerated to a very robust 24.8 percent YoY during FY04, compared to the 12.3 percent rise in FY03 (see Table 2.5).
Significantly, the rise in disbursements was led by the big five commercial banks,10 which witnessed a remarkable growth of 46.3 percent during FY04, even over already high base of FY03. As a result the banks finally overtook ZTBL in loan disbursement to the agri sector (see Figure 2.11).11 Consequently, the actual disbursement during FY04 exceeded the target by a significant margin (see Figure 2.12). Prior to this, the mandatory disbursement target was exceeded only during the years when production loans to small farmers were given as interest-free loans.12 The rising competition and the general decline in interest rates in the economy in recent years, has helped reduce the rates on agri-loans as well. However, when compared with the overall decline in the structure of interest rates, this decline appears smaller. The higher interest rates on agricultural loans are understandable because the agri-lending incorporate risk factor peculiar to the sector, which include:
• Higher administrative cost to extend smaller loans for shorter periods; • Lack of collateral;
9 Including Livestock, Poultry, Forestry, Fisheries, Dairy Farming & others. 10 Include: (i) Allied Bank of Pakistan Ltd (ABL)., (ii) Habib Bank Ltd. (HBL), (iii) Muslim Commercial Bank Ltd. (MCB), (iv) National Bank of Pakistan (NBP), (v) United Bank Ltd (UBL). 11 This is sharp contrast to earlier practices when commercial banks preferred to pay penalties instead of meeting mandatory targets assigned under the directed credit controls until August 1992. 12 The scheme of interest-free production loans for small farmers/tenants remained in operation between October 9, 1979 and June 26, 1988. However, due to gross misuse of this facility by the some large farmers, it was withdrawn.
Table 2.5: Credit to Agriculture Sector billion Rupees
Disbursement Recovery Net Credit1 Outstanding C i July-June Percent July-June Percent July-June by end June
FY03 FY04 change FY03 FY04 change FY03 FY04 2003 2004 Z.T.B.L 29.3 29.9 2.0 34.3 35.6 3.8 -5.0 -5.7 71.6 73.1Commercial banks2 22.7 33.2 46.3 19.5 24.4 25.1 3.2 8.8 16.6 25.5PPCBL 5.5 7.7 40.0 5.1 5.9 15.7 0.4 1.8 4.0 5.7DPBs3 1.4 2.7 92.9 0.5 1.5 200.0 0.9 1.2 1.6 2.9Total 58.9 73.5 24.8 59.4 67.4 13.5 -0.5 6.1 93.7 107.21: Net credit = disbursement minus recovery 2: Includes: NBP, HBL, MCB, UBL, and ABL 3: Domestic private commercial banks started lending in FY02 Source: Agricultural Credit Department, SBP.
10
20
30
40
50
60
70
80
90
FY94
FY95
FY96
FY97
FY98
FY99
FY00
FY01
FY02
FY03
FY04
perc
ent
ZTBL Big 5 CBs
Figure 2.11: Share in Credit Disbursment
Economic Growth, Savings and Investments
19
• Higher default risk due to exigencies associated with the vulnerability of the sector to weather, pest attacks, etc; and
• Cost of promoting non-traditional approaches normally not required in commercial lending.
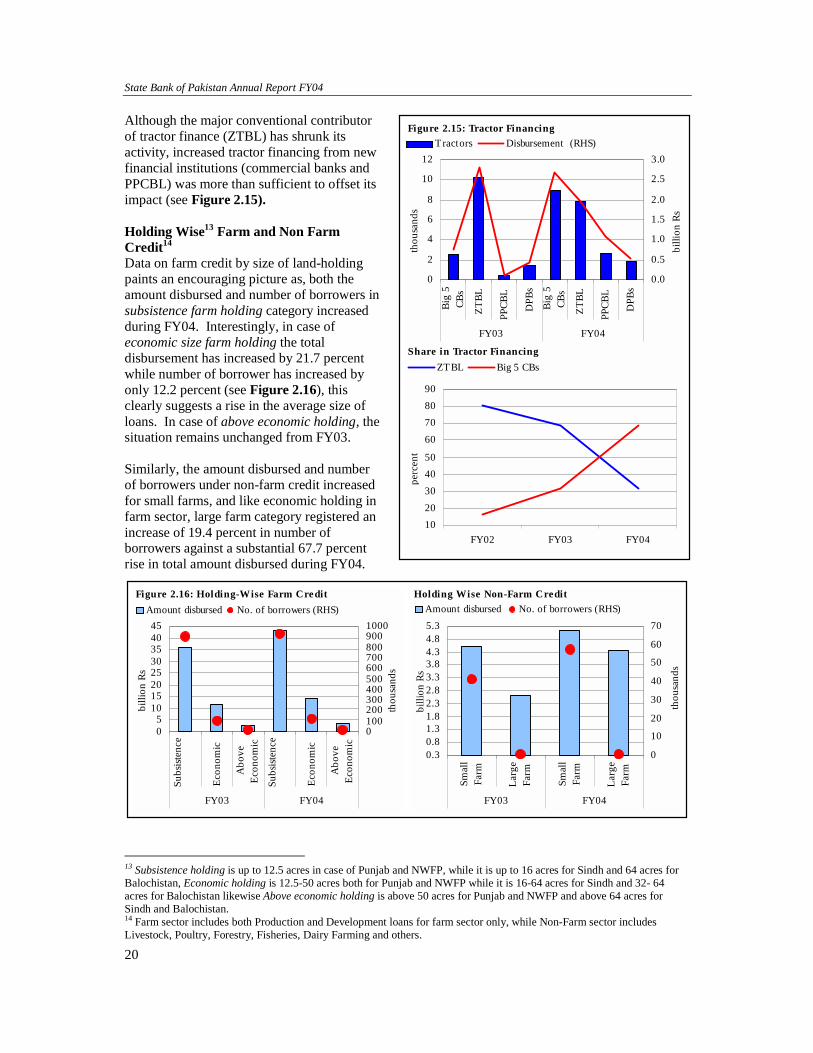
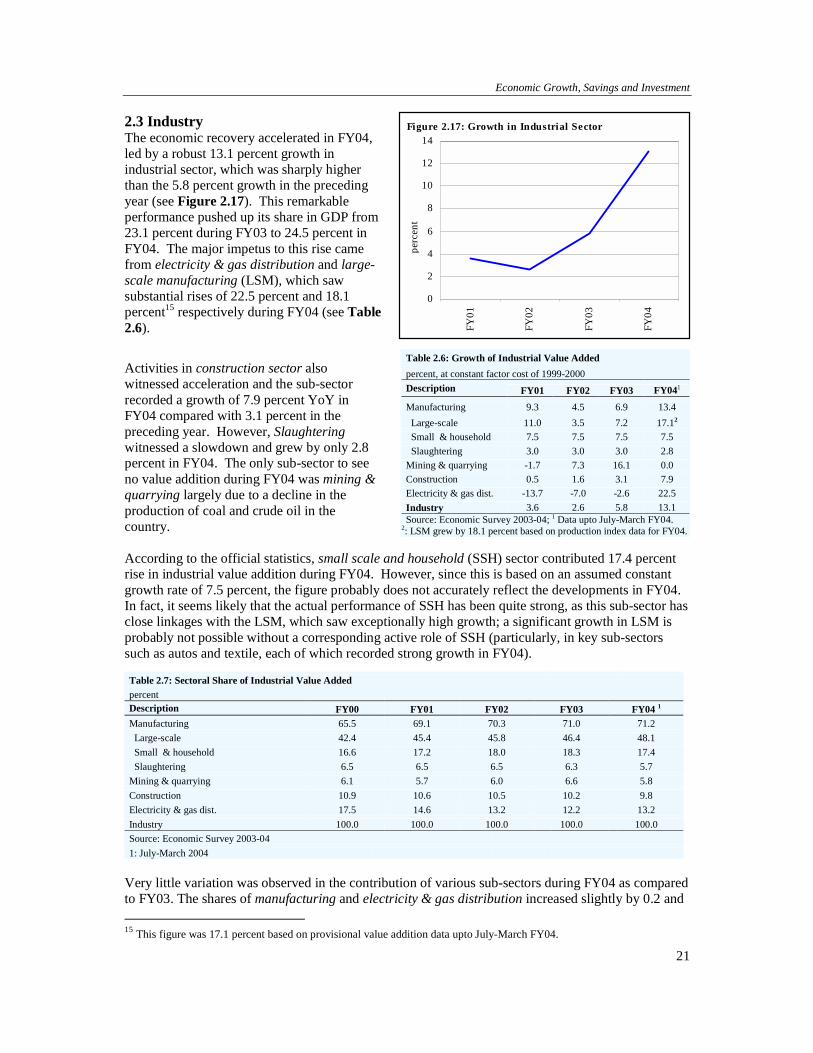
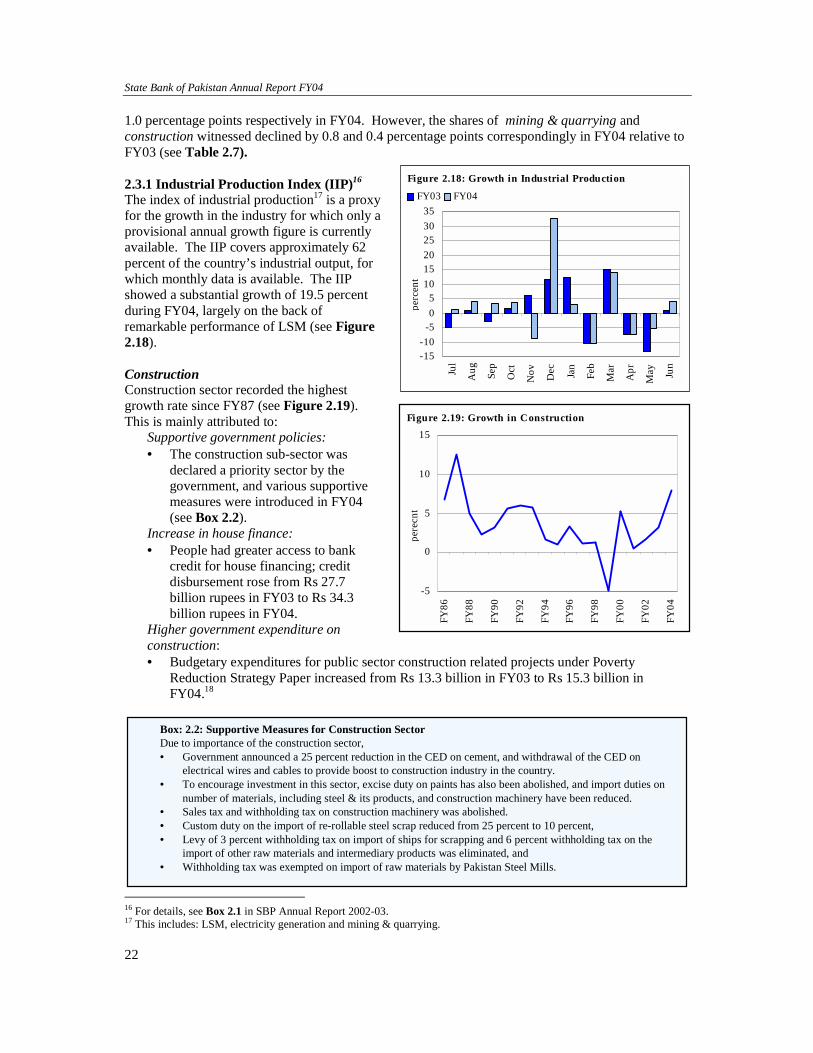
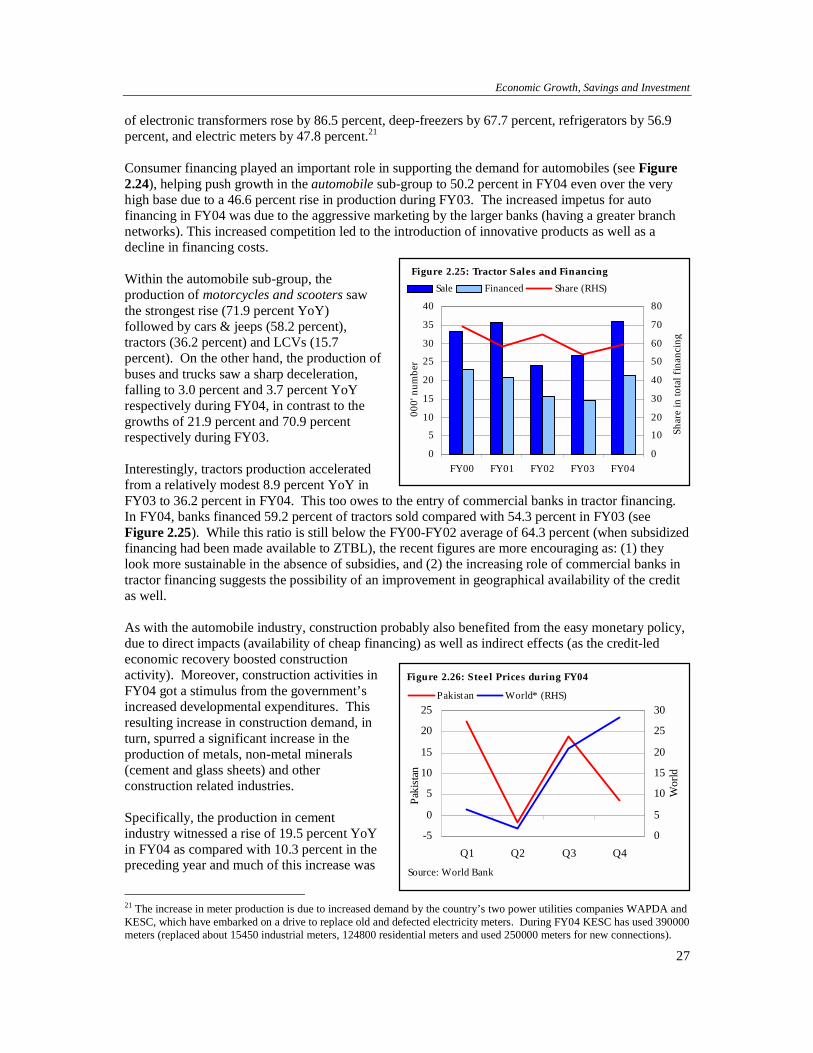
Recovery The outstanding amount of agri sector loans has increased in FY04 due to increased pace of fresh disbursements rather than increasing bad loans. In fact, loan recoveries rose 13.5 percent YoY to Rs 67.4 billion during FY04, (which was Rs 8.5 billion higher than the disbursed amount for FY03). This was despite the fact that a substantial part of the FY03 and FY04 disbursement was extended for developmental purposes, which are usually long-term loans. This factor is, in fact, visible in the case of commercial banks. The relative decline in the recoveries of commercial banks loans can be attributed to their larger share of the lending for tractor financing (see Figure 2.13). Agri Development Loan The disbursement of development loans has increased by 31.2 percent while that of production loans has increased by 23.4 percent YoY in FY04 as compared to 11.0 percent growth in production loan and 20.4 percent in development loans replacing in FY03. Prior to FY04, the development loans were mainly extended by ZTBL and big five commercial banks. The Punjab Provincial Cooperative Bank Ltd. (PPCBL) aggressively entered into development loan business during FY04. As a result the bank’s composition of development and production loan has changed significantly from 2.9:97.3 to 19.8:80.2. Importantly, all other bank groups registered increases in the disbursement for developmental agri-loans during FY04 with the exception of ZTBL (see Figure 2.14) Tractor financing The rise in development finance is clearly visible in the increased tractor financing (see Figure 2.15). The share of tractor financing in total development loans rose to 71.1 percent in FY04 as compared to 63.6 percent in the preceding year.
Figure 2.12: Disbursement: Target vs. Actual
0
15
30
45
60
75
FY90
FY92
FY94
FY96
FY98
FY00
FY02
FY04
billi
on R
s
T arget Actual
0
10
20304050
60
70
Big
5CB
s
ZTBL
PPCB
L
DPB
s
Big
5CB
s
ZTBL
PPCB
L
DPB
s
FY03 FY04
billi
on R
s
20
30
40506070
80
90
perc
ent
Due loans Recovered Recovery/Due (RHS)
Figure 2.13: Recovery of Agri Credit
0
1
2
3
4
5
6
7
Big
5CB
s
ZTBL
PPCB
L
DPB
s
billi
on R
s
FY03 FY04Figure 2.14: Agri Development Loans
State Bank of Pakistan Annual Report FY04
20
Although the major conventional contributor of tractor finance (ZTBL) has shrunk its activity, increased tractor financing from new financial institutions (commercial banks and PPCBL) was more than sufficient to offset its impact (see Figure 2.15). Holding Wise13 Farm and Non Farm Credit14 Data on farm credit by size of land-holding paints an encouraging picture as, both the amount disbursed and number of borrowers in subsistence farm holding category increased during FY04. Interestingly, in case of economic size farm holding the total disbursement has increased by 21.7 percent while number of borrower has increased by only 12.2 percent (see Figure 2.16), this clearly suggests a rise in the average size of loans. In case of above economic holding, the situation remains unchanged from FY03. Similarly, the amount disbursed and number of borrowers under non-farm credit increased for small farms, and like economic holding in farm sector, large farm category registered an increase of 19.4 percent in number of borrowers against a substantial 67.7 percent rise in total amount disbursed during FY04.
13 Subsistence holding is up to 12.5 acres in case of Punjab and NWFP, while it is up to 16 acres for Sindh and 64 acres for Balochistan, Economic holding is 12.5-50 acres both for Punjab and NWFP while it is 16-64 acres for Sindh and 32- 64 acres for Balochistan likewise Above economic holding is above 50 acres for Punjab and NWFP and above 64 acres for Sindh and Balochistan. 14 Farm sector includes both Production and Development loans for farm sector only, while Non-Farm sector includes Livestock, Poultry, Forestry, Fisheries, Dairy Farming and others.
05
1015202530354045
Subs
isten
ce
Econ
omic
Abo
veEc
onom
ic
Subs
isten
ce
Econ
omic
Abo
veEc
onom
ic
FY03 FY04
billi
on R
s
01002003004005006007008009001000
thou
sand
s
Amount disbursed No. of borrowers (RHS)Figure 2.16: Holding-Wise Farm Credit
0.30.81.31.82.32.83.33.84.34.85.3
Smal
lFa
rm
Larg
eFa
rm
Smal
lFa
rm
Larg
eFa
rm
FY03 FY04
billi
on R
s
0
10
20
30
40
50
60
70
thou
sand
s
Amount disbursed No. of borrowers (RHS)Holding Wise Non-Farm Credit
0
2
4
6
8
10
12
Big
5CB
s
ZTBL
PPCB
L
DPB
s
Big
5CB
s
ZTBL
PPCB
L
DPB
s
FY03 FY04
thou
sand
s
0.0
0.5
1.0
1.5
2.0
2.5
3.0
billi
on R
s
T ractors Disbursement (RHS)Figure 2.15: Tractor Financing
1020304050
60708090
FY02 FY03 FY04
perc
ent
ZTBL Big 5 CBs Share in Tractor Financing
Economic Growth, Savings and Investment
21
2.3 Industry The economic recovery accelerated in FY04, led by a robust 13.1 percent growth in industrial sector, which was sharply higher than the 5.8 percent growth in the preceding year (see Figure 2.17). This remarkable performance pushed up its share in GDP from 23.1 percent during FY03 to 24.5 percent in FY04. The major impetus to this rise came from electricity & gas distribution and large-scale manufacturing (LSM), which saw substantial rises of 22.5 percent and 18.1 percent15 respectively during FY04 (see Table 2.6).
Activities in construction sector also witnessed acceleration and the sub-sector recorded a growth of 7.9 percent YoY in FY04 compared with 3.1 percent in the preceding year. However, Slaughtering witnessed a slowdown and grew by only 2.8 percent in FY04. The only sub-sector to see no value addition during FY04 was mining & quarrying largely due to a decline in the production of coal and crude oil in the country. According to the official statistics, small scale and household (SSH) sector contributed 17.4 percent rise in industrial value addition during FY04. However, since this is based on an assumed constant growth rate of 7.5 percent, the figure probably does not accurately reflect the developments in FY04. In fact, it seems likely that the actual performance of SSH has been quite strong, as this sub-sector has close linkages with the LSM, which saw exceptionally high growth; a significant growth in LSM is probably not possible without a corresponding active role of SSH (particularly, in key sub-sectors such as autos and textile, each of which recorded strong growth in FY04).
Very little variation was observed in the contribution of various sub-sectors during FY04 as compared to FY03. The shares of manufacturing and electricity & gas distribution increased slightly by 0.2 and 15 This figure was 17.1 percent based on provisional value addition data upto July-March FY04.
Table 2.6: Growth of Industrial Value Added percent, at constant factor cost of 1999-2000 Description FY01 FY02 FY03 FY041 Manufacturing 9.3 4.5 6.9 13.4 Large-scale 11.0 3.5 7.2 17.12 Small & household 7.5 7.5 7.5 7.5 Slaughtering 3.0 3.0 3.0 2.8 Mining & quarrying -1.7 7.3 16.1 0.0 Construction 0.5 1.6 3.1 7.9 Electricity & gas dist. -13.7 -7.0 -2.6 22.5 Industry 3.6 2.6 5.8 13.1 Source: Economic Survey 2003-04; 1 Data upto July-March FY04.
2: LSM grew by 18.1 percent based on production index data for FY04.
Table 2.7: Sectoral Share of Industrial Value Added percent Description FY00 FY01 FY02 FY03 FY04 1 Manufacturing 65.5 69.1 70.3 71.0 71.2 Large-scale 42.4 45.4 45.8 46.4 48.1 Small & household 16.6 17.2 18.0 18.3 17.4 Slaughtering 6.5 6.5 6.5 6.3 5.7 Mining & quarrying 6.1 5.7 6.0 6.6 5.8 Construction 10.9 10.6 10.5 10.2 9.8 Electricity & gas dist. 17.5 14.6 13.2 12.2 13.2 Industry 100.0 100.0 100.0 100.0 100.0 Source: Economic Survey 2003-04 1: July-March 2004
Figure 2.17: Growth in Industrial Sector
0
2
4
6
8
10
12
14
FY01
FY02
FY03
FY04
perc
ent
State Bank of Pakistan Annual Report FY04
22
Box: 2.2: Supportive Measures for Construction Sector Due to importance of the construction sector, • Government announced a 25 percent reduction in the CED on cement, and withdrawal of the CED on
electrical wires and cables to provide boost to construction industry in the country. • To encourage investment in this sector, excise duty on paints has also been abolished, and import duties on
number of materials, including steel & its products, and construction machinery have been reduced. • Sales tax and withholding tax on construction machinery was abolished. • Custom duty on the import of re-rollable steel scrap reduced from 25 percent to 10 percent, • Levy of 3 percent withholding tax on import of ships for scrapping and 6 percent withholding tax on the
import of other raw materials and intermediary products was eliminated, and • Withholding tax was exempted on import of raw materials by Pakistan Steel Mills.
1.0 percentage points respectively in FY04. However, the shares of mining & quarrying and construction witnessed declined by 0.8 and 0.4 percentage points correspondingly in FY04 relative to FY03 (see Table 2.7). 2.3.1 Industrial Production Index (IIP)16 The index of industrial production17 is a proxy for the growth in the industry for which only a provisional annual growth figure is currently available. The IIP covers approximately 62 percent of the country’s industrial output, for which monthly data is available. The IIP showed a substantial growth of 19.5 percent during FY04, largely on the back of remarkable performance of LSM (see Figure 2.18). Construction Construction sector recorded the highest growth rate since FY87 (see Figure 2.19). This is mainly attributed to:
Supportive government policies: • The construction sub-sector was
declared a priority sector by the government, and various supportive measures were introduced in FY04 (see Box 2.2).
Increase in house finance: • People had greater access to bank
credit for house financing; credit disbursement rose from Rs 27.7 billion rupees in FY03 to Rs 34.3 billion rupees in FY04.
Higher government expenditure on construction: • Budgetary expenditures for public sector construction related projects under Poverty
Reduction Strategy Paper increased from Rs 13.3 billion in FY03 to Rs 15.3 billion in FY04.18
16 For details, see Box 2.1 in SBP Annual Report 2002-03. 17 This includes: LSM, electricity generation and mining & quarrying.
Figure 2.19: Growth in Construction
-5
0
5
10
15FY
86
FY88
FY90
FY92
FY94
FY96
FY98
FY00
FY02
FY04
pere
cnt
Figure 2.18: Growth in Industrial Production
-15-10
-505
101520253035
Jul
Aug Sep
Oct
Nov Dec Jan
Feb
Mar
Apr
May Ju
n
perc
ent
FY03 FY04
Economic Growth, Savings and Investment
23
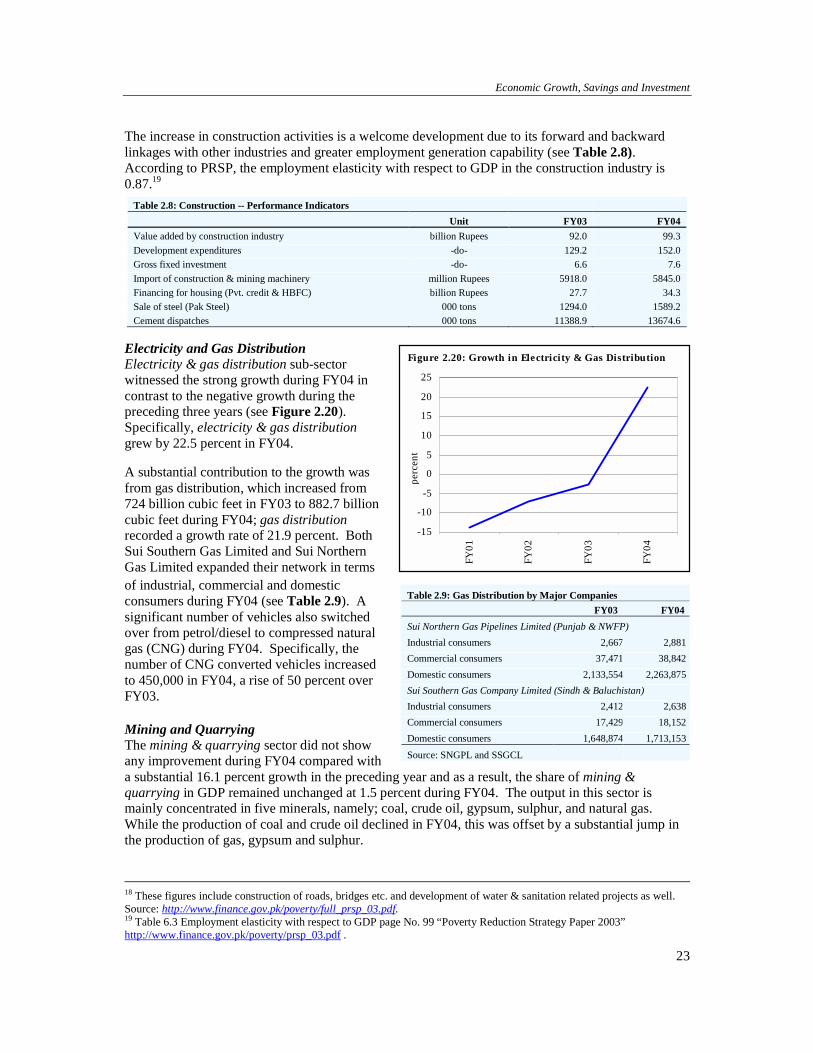
The increase in construction activities is a welcome development due to its forward and backward linkages with other industries and greater employment generation capability (see Table 2.8). According to PRSP, the employment elasticity with respect to GDP in the construction industry is 0.87.19
Electricity and Gas Distribution Electricity & gas distribution sub-sector witnessed the strong growth during FY04 in contrast to the negative growth during the preceding three years (see Figure 2.20). Specifically, electricity & gas distribution grew by 22.5 percent in FY04. A substantial contribution to the growth was from gas distribution, which increased from 724 billion cubic feet in FY03 to 882.7 billion cubic feet during FY04; gas distribution recorded a growth rate of 21.9 percent. Both Sui Southern Gas Limited and Sui Northern Gas Limited expanded their network in terms of industrial, commercial and domestic consumers during FY04 (see Table 2.9). A significant number of vehicles also switched over from petrol/diesel to compressed natural gas (CNG) during FY04. Specifically, the number of CNG converted vehicles increased to 450,000 in FY04, a rise of 50 percent over FY03. Mining and Quarrying The mining & quarrying sector did not show any improvement during FY04 compared with a substantial 16.1 percent growth in the preceding year and as a result, the share of mining & quarrying in GDP remained unchanged at 1.5 percent during FY04. The output in this sector is mainly concentrated in five minerals, namely; coal, crude oil, gypsum, sulphur, and natural gas. While the production of coal and crude oil declined in FY04, this was offset by a substantial jump in the production of gas, gypsum and sulphur.
18 These figures include construction of roads, bridges etc. and development of water & sanitation related projects as well. Source: http://www.finance.gov.pk/poverty/full_prsp_03.pdf. 19 Table 6.3 Employment elasticity with respect to GDP page No. 99 “Poverty Reduction Strategy Paper 2003” http://www.finance.gov.pk/poverty/prsp_03.pdf .
Table 2.8: Construction -- Performance Indicators Unit FY03 FY04 Value added by construction industry billion Rupees 92.0 99.3 Development expenditures -do- 129.2 152.0 Gross fixed investment -do- 6.6 7.6 Import of construction & mining machinery million Rupees 5918.0 5845.0 Financing for housing (Pvt. credit & HBFC) billion Rupees 27.7 34.3 Sale of steel (Pak Steel) 000 tons 1294.0 1589.2 Cement dispatches 000 tons 11388.9 13674.6
Table 2.9: Gas Distribution by Major Companies FY03 FY04 Sui Northern Gas Pipelines Limited (Punjab & NWFP) Industrial consumers 2,667 2,881Commercial consumers 37,471 38,842Domestic consumers 2,133,554 2,263,875Sui Southern Gas Company Limited (Sindh & Baluchistan) Industrial consumers 2,412 2,638Commercial consumers 17,429 18,152Domestic consumers 1,648,874 1,713,153
Source: SNGPL and SSGCL
-15
-10
-5
0
5
10
15
20
25
FY01
FY02
FY03
FY04
perc
ent
Figure 2.20: Growth in Electricity & Gas Distribution
State Bank of Pakistan Annual Report FY04
24
Although domestic demand for coal increased due to switch over of most of the cement plants from furnace oil to coal, the coal extraction fell by 6.3 percent during FY04. This is explained by the substitution of domestic coal with better quality-imported coal. Imports of coal rose from US$ 72.3 million in FY03 to US$ 144.3 million during FY04. The production of crude oil and dolomite recorded a decline of 3.7 percent and 21.3 percent respectively during FY04 (see Table 2.10). The fall in the production of crude oil is probably reflecting the fact that output from old oil wells is gradually declining and addition of new oil wells is slow. However, due to the enormous potential of success in the field of mining & quarrying, oil & gas exploration in Pakistan and government’s supportive policies, this sub-sector has fetched substantial foreign direct investment (FDI) in recent years. This was also evident in FY04, when this sub-sector accounted for 22.3 percent of the annual FDI. Large Scale Manufacturing (LSM) The exceptionally strong growth momentum of LSM was sustained through FY04, pushing the annual growth rate for the sector to a remarkable 18.1 percent, which is the strongest growth recorded in the last three decades (see Figure 2.21). In fact, the change in value addition of LSM in FY04 at Rs. 71.4 billion was 91.3 percent of that in the preceding three years combined. Moreover, as in the previous year, this growth was quite broad-based. This is evident from the fact that even after excluding the sub-sectors recording exceptionally high growth, i.e., automobile, fertilizers and electronics, the LSM growth rate remains impressive in FY04, especially compared to the relatively anemic growth in the preceding years (see Table 2.11). As evident from Figure 2.22 and Table 2.12, only one of the 15 LSM sub-groups witnessed a decline in output20 (mainly due to competition from cheap Chinese imports). Furthermore, of the 14 sub-sectors for which comparable data is available, it is also instructive to note that during FY03, seven sub-sectors had registered growth rates that were either negative or low (below 5 percent), and only
20 Unfortunately comparable data for FY03 is not available; it is therefore unclear whether this represents deterioration or a relative improvement.
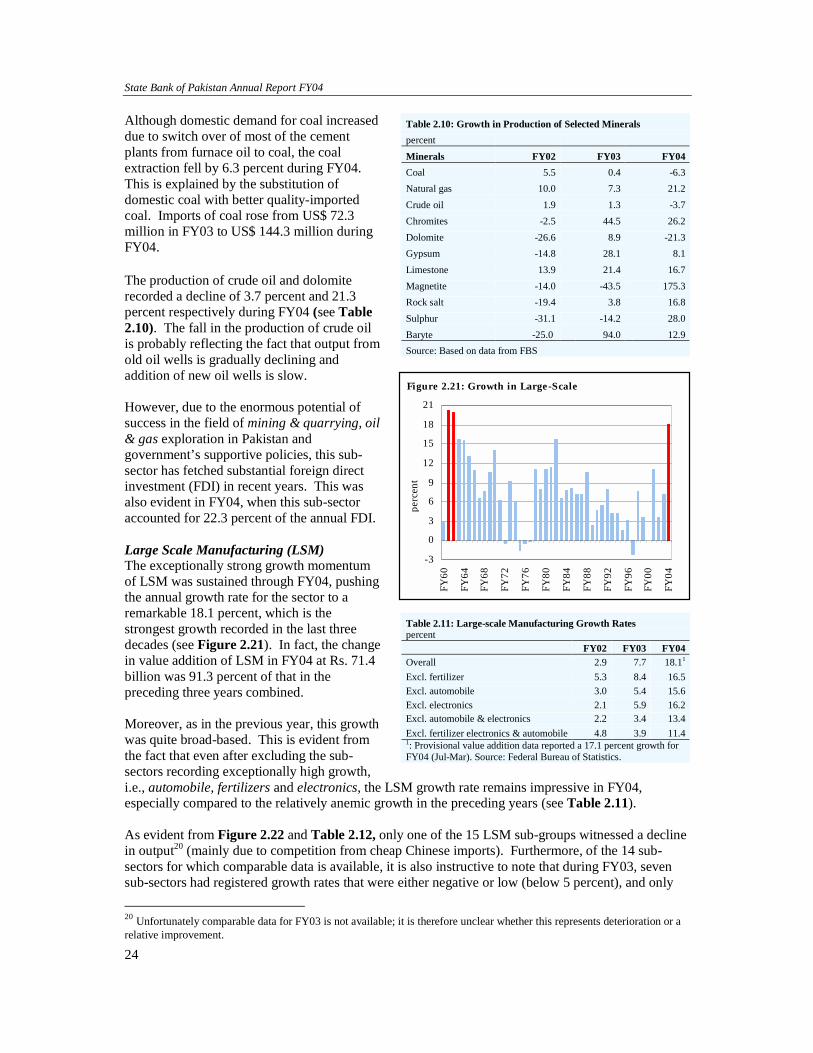
Table 2.10: Growth in Production of Selected Minerals percent Minerals FY02 FY03 FY04Coal 5.5 0.4 -6.3Natural gas 10.0 7.3 21.2Crude oil 1.9 1.3 -3.7Chromites -2.5 44.5 26.2Dolomite -26.6 8.9 -21.3Gypsum -14.8 28.1 8.1Limestone 13.9 21.4 16.7Magnetite -14.0 -43.5 175.3Rock salt -19.4 3.8 16.8Sulphur -31.1 -14.2 28.0Baryte -25.0 94.0 12.9Source: Based on data from FBS
Table 2.11: Large-scale Manufacturing Growth Rates percent FY02 FY03 FY04Overall 2.9 7.7 18.11
Excl. fertilizer 5.3 8.4 16.5Excl. automobile 3.0 5.4 15.6Excl. electronics 2.1 5.9 16.2Excl. automobile & electronics 2.2 3.4 13.4Excl. fertilizer electronics & automobile 4.8 3.9 11.41: Provisional value addition data reported a 17.1 percent growth for FY04 (Jul-Mar). Source: Federal Bureau of Statistics.
Figure 2.21: Growth in Large-Scale
-3
0
3
6
9
12
15
18
21
FY60
FY64
FY68
FY72
FY76
FY80
FY84
FY88
FY92
FY96
FY00
FY04
perc
ent
Economic Growth, Savings and Investment
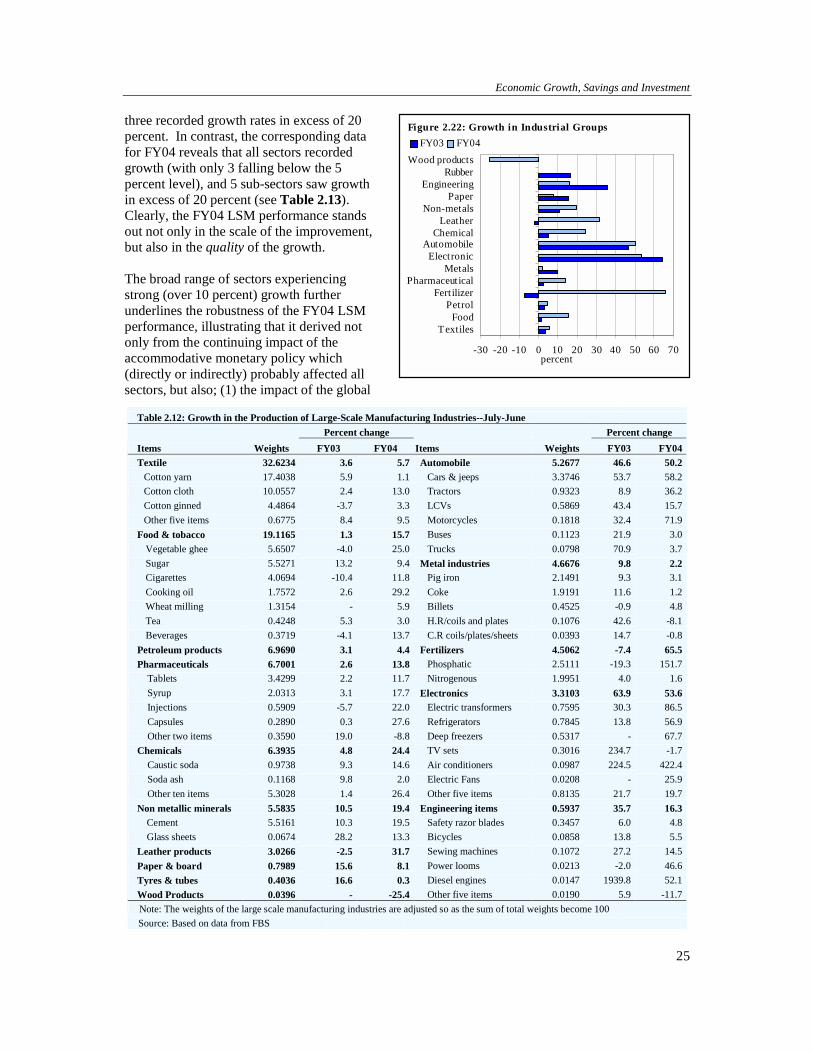
25
three recorded growth rates in excess of 20 percent. In contrast, the corresponding data for FY04 reveals that all sectors recorded growth (with only 3 falling below the 5 percent level), and 5 sub-sectors saw growth in excess of 20 percent (see Table 2.13). Clearly, the FY04 LSM performance stands out not only in the scale of the improvement, but also in the quality of the growth. The broad range of sectors experiencing strong (over 10 percent) growth further underlines the robustness of the FY04 LSM performance, illustrating that it derived not only from the continuing impact of the accommodative monetary policy which (directly or indirectly) probably affected all sectors, but also; (1) the impact of the global
Table 2.12: Growth in the Production of Large-Scale Manufacturing Industries--July-June Percent change Percent change Items Weights FY03 FY04 Items Weights FY03 FY04Textile 32.6234 3.6 5.7 Automobile 5.2677 46.6 50.2
Cotton yarn 17.4038 5.9 1.1 Cars & jeeps 3.3746 53.7 58.2Cotton cloth 10.0557 2.4 13.0 Tractors 0.9323 8.9 36.2Cotton ginned 4.4864 -3.7 3.3 LCVs 0.5869 43.4 15.7Other five items 0.6775 8.4 9.5 Motorcycles 0.1818 32.4 71.9
Food & tobacco 19.1165 1.3 15.7 Buses 0.1123 21.9 3.0Vegetable ghee 5.6507 -4.0 25.0 Trucks 0.0798 70.9 3.7Sugar 5.5271 13.2 9.4 Metal industries 4.6676 9.8 2.2Cigarettes 4.0694 -10.4 11.8 Pig iron 2.1491 9.3 3.1Cooking oil 1.7572 2.6 29.2 Coke 1.9191 11.6 1.2Wheat milling 1.3154 - 5.9 Billets 0.4525 -0.9 4.8Tea 0.4248 5.3 3.0 H.R/coils and plates 0.1076 42.6 -8.1Beverages 0.3719 -4.1 13.7 C.R coils/plates/sheets 0.0393 14.7 -0.8
Petroleum products 6.9690 3.1 4.4 Fertilizers 4.5062 -7.4 65.5Pharmaceuticals 6.7001 2.6 13.8 Phosphatic 2.5111 -19.3 151.7
Tablets 3.4299 2.2 11.7 Nitrogenous 1.9951 4.0 1.6Syrup 2.0313 3.1 17.7 Electronics 3.3103 63.9 53.6Injections 0.5909 -5.7 22.0 Electric transformers 0.7595 30.3 86.5Capsules 0.2890 0.3 27.6 Refrigerators 0.7845 13.8 56.9Other two items 0.3590 19.0 -8.8 Deep freezers 0.5317 - 67.7
Chemicals 6.3935 4.8 24.4 TV sets 0.3016 234.7 -1.7Caustic soda 0.9738 9.3 14.6 Air conditioners 0.0987 224.5 422.4Soda ash 0.1168 9.8 2.0 Electric Fans 0.0208 - 25.9Other ten items 5.3028 1.4 26.4 Other five items 0.8135 21.7 19.7
Non metallic minerals 5.5835 10.5 19.4 Engineering items 0.5937 35.7 16.3Cement 5.5161 10.3 19.5 Safety razor blades 0.3457 6.0 4.8Glass sheets 0.0674 28.2 13.3 Bicycles 0.0858 13.8 5.5
Leather products 3.0266 -2.5 31.7 Sewing machines 0.1072 27.2 14.5Paper & board 0.7989 15.6 8.1 Power looms 0.0213 -2.0 46.6Tyres & tubes 0.4036 16.6 0.3 Diesel engines 0.0147 1939.8 52.1Wood Products 0.0396 - -25.4 Other five items 0.0190 5.9 -11.7Note: The weights of the large scale manufacturing industries are adjusted so as the sum of total weights become 100 Source: Based on data from FBS
-30 -20 -10 0 10 20 30 40 50 60 70
TextilesFood
PetrolFert ilizer
PharmaceuticalMetals
ElectronicAutomobile
ChemicalLeather
Non-metalsPaper
EngineeringRubber
Wood products
percent
FY03 FY04Figure 2.22: Growth in Industrial Groups
State Bank of Pakistan Annual Report FY04
26
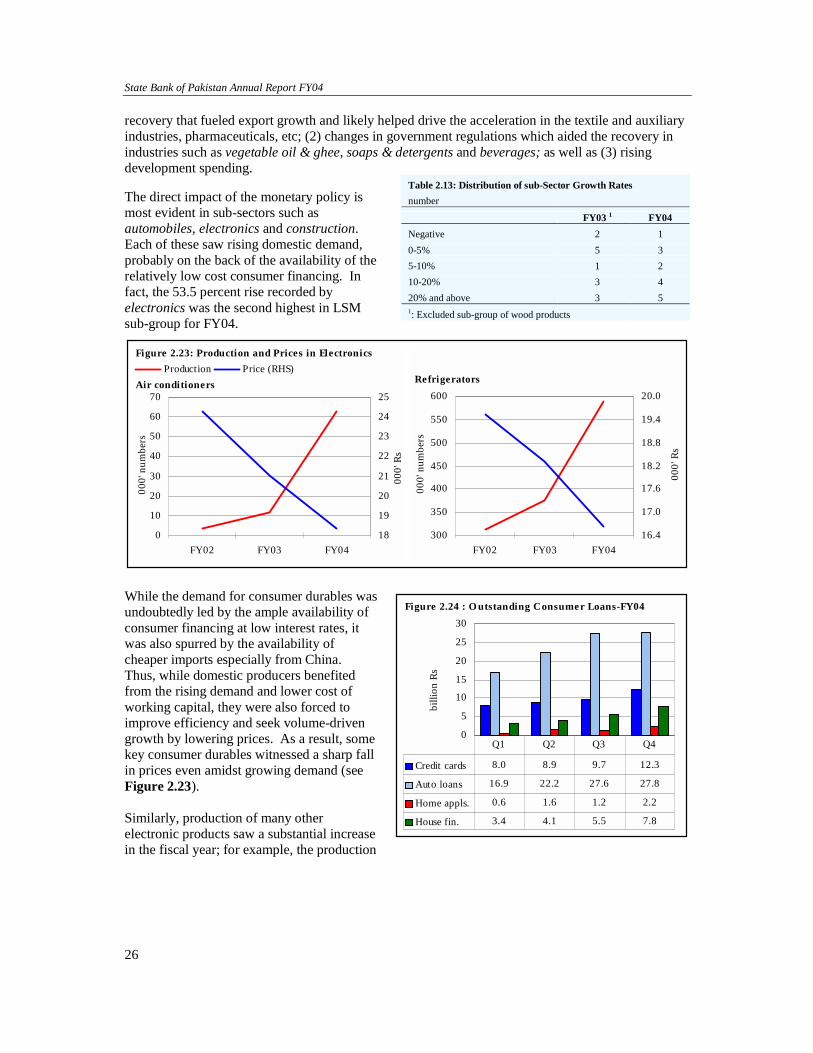
recovery that fueled export growth and likely helped drive the acceleration in the textile and auxiliary industries, pharmaceuticals, etc; (2) changes in government regulations which aided the recovery in industries such as vegetable oil & ghee, soaps & detergents and beverages; as well as (3) rising development spending. The direct impact of the monetary policy is most evident in sub-sectors such as automobiles, electronics and construction. Each of these saw rising domestic demand, probably on the back of the availability of the relatively low cost consumer financing. In fact, the 53.5 percent rise recorded by electronics was the second highest in LSM sub-group for FY04.
While the demand for consumer durables was undoubtedly led by the ample availability of consumer financing at low interest rates, it was also spurred by the availability of cheaper imports especially from China. Thus, while domestic producers benefited from the rising demand and lower cost of working capital, they were also forced to improve efficiency and seek volume-driven growth by lowering prices. As a result, some key consumer durables witnessed a sharp fall in prices even amidst growing demand (see Figure 2.23). Similarly, production of many other electronic products saw a substantial increase in the fiscal year; for example, the production
Table 2.13: Distribution of sub-Sector Growth Rates number
FY03 1 FY04 Negative 2 1 0-5% 5 3 5-10% 1 2 10-20% 3 4 20% and above 3 5 1: Excluded sub-group of wood products
Refrigerators
300
350
400
450
500
550
600
FY02 FY03 FY04
000'
num
bers
16.4
17.0
17.6
18.2
18.8
19.4
20.0
000'
Rs
0
10
20
30
40
50
60
70
FY02 FY03 FY04
000'
num
bers
18
19
20
21
22
23
24
2500
0' R
s
Production Price (RHS)Figure 2.23: Production and Prices in Electronics
Air conditioners
0
5
10
15
20
25
30
billi
on R
s
Credit cards 8.0 8.9 9.7 12.3
Auto loans 16.9 22.2 27.6 27.8
Home appls. 0.6 1.6 1.2 2.2
House fin. 3.4 4.1 5.5 7.8
Q1 Q2 Q3 Q4
Figure 2.24 : O utstanding Consumer Loans-FY04
Economic Growth, Savings and Investment
27
of electronic transformers rose by 86.5 percent, deep-freezers by 67.7 percent, refrigerators by 56.9 percent, and electric meters by 47.8 percent.21 Consumer financing played an important role in supporting the demand for automobiles (see Figure 2.24), helping push growth in the automobile sub-group to 50.2 percent in FY04 even over the very high base due to a 46.6 percent rise in production during FY03. The increased impetus for auto financing in FY04 was due to the aggressive marketing by the larger banks (having a greater branch networks). This increased competition led to the introduction of innovative products as well as a decline in financing costs. Within the automobile sub-group, the production of motorcycles and scooters saw the strongest rise (71.9 percent YoY) followed by cars & jeeps (58.2 percent), tractors (36.2 percent) and LCVs (15.7 percent). On the other hand, the production of buses and trucks saw a sharp deceleration, falling to 3.0 percent and 3.7 percent YoY respectively during FY04, in contrast to the growths of 21.9 percent and 70.9 percent respectively during FY03. Interestingly, tractors production accelerated from a relatively modest 8.9 percent YoY in FY03 to 36.2 percent in FY04. This too owes to the entry of commercial banks in tractor financing. In FY04, banks financed 59.2 percent of tractors sold compared with 54.3 percent in FY03 (see Figure 2.25). While this ratio is still below the FY00-FY02 average of 64.3 percent (when subsidized financing had been made available to ZTBL), the recent figures are more encouraging as: (1) they look more sustainable in the absence of subsidies, and (2) the increasing role of commercial banks in tractor financing suggests the possibility of an improvement in geographical availability of the credit as well. As with the automobile industry, construction probably also benefited from the easy monetary policy, due to direct impacts (availability of cheap financing) as well as indirect effects (as the credit-led economic recovery boosted construction activity). Moreover, construction activities in FY04 got a stimulus from the government’s increased developmental expenditures. This resulting increase in construction demand, in turn, spurred a significant increase in the production of metals, non-metal minerals (cement and glass sheets) and other construction related industries. Specifically, the production in cement industry witnessed a rise of 19.5 percent YoY in FY04 as compared with 10.3 percent in the preceding year and much of this increase was
21 The increase in meter production is due to increased demand by the country’s two power utilities companies WAPDA and KESC, which have embarked on a drive to replace old and defected electricity meters. During FY04 KESC has used 390000 meters (replaced about 15450 industrial meters, 124800 residential meters and used 250000 meters for new connections).
Figure 2.26: Steel Prices during FY04
-5
0
5
10
15
20
25
Q1 Q2 Q3 Q4
Paki
stan
0
5
10
15
20
25
30
Wor
ld
Pakistan World* (RHS)
Source: World Bank
0
5
10
15
20
25
30
35
40
FY00 FY01 FY02 FY03 FY04
000'
num
ber
0
10
20
30
40
50
60
70
80
Shar
e in
tota
l fin
anci
ng
Sale Financed Share (RHS)Figure 2.25: Tractor Sales and Financing
State Bank of Pakistan Annual Report FY04
28
Box: 2.3: Measures to Reduce the Steel Products Prices • Cut in the custom duty on the import of re-rollable
steel scrap from 25 percent to 10 percent, • Elimination of the levy of 3 percent withholding tax
on import of ships for scrapping. • Withdrawal of 6 percent withholding tax on the
import of other raw materials and intermediary products, and
• Exemption of withholding tax on import of raw materials by Pakistan Steel Mills.
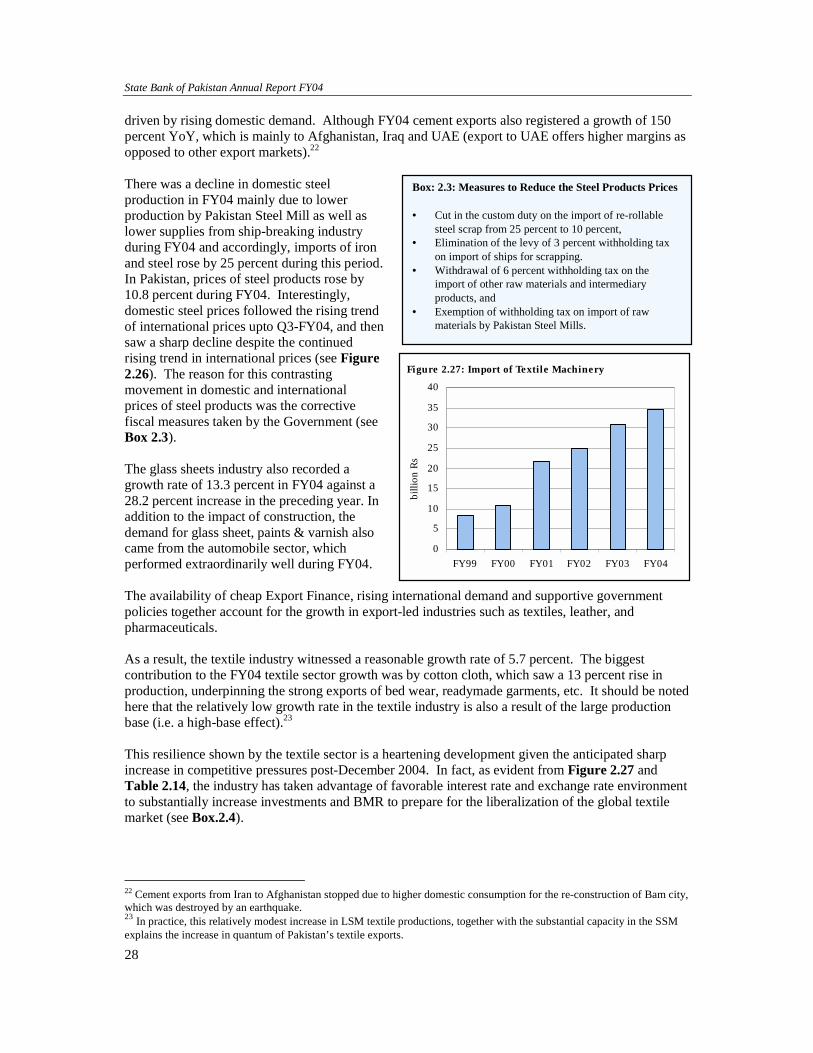
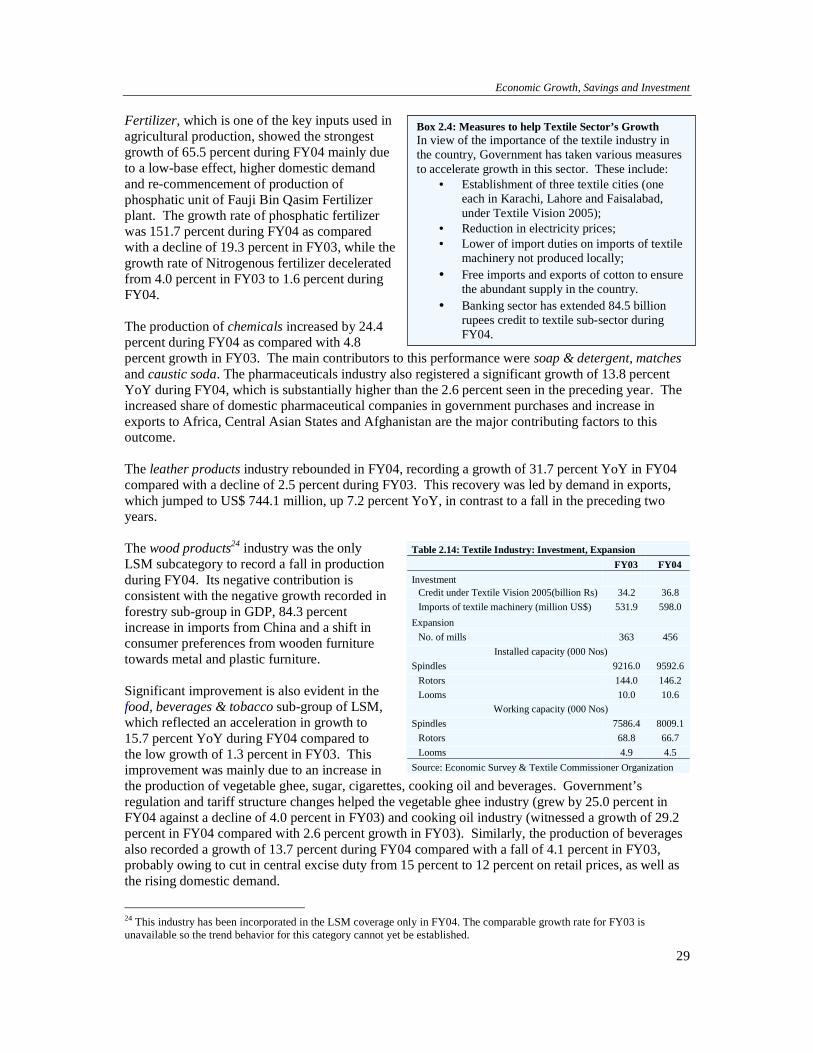
driven by rising domestic demand. Although FY04 cement exports also registered a growth of 150 percent YoY, which is mainly to Afghanistan, Iraq and UAE (export to UAE offers higher margins as opposed to other export markets).22 There was a decline in domestic steel production in FY04 mainly due to lower production by Pakistan Steel Mill as well as lower supplies from ship-breaking industry during FY04 and accordingly, imports of iron and steel rose by 25 percent during this period. In Pakistan, prices of steel products rose by 10.8 percent during FY04. Interestingly, domestic steel prices followed the rising trend of international prices upto Q3-FY04, and then saw a sharp decline despite the continued rising trend in international prices (see Figure 2.26). The reason for this contrasting movement in domestic and international prices of steel products was the corrective fiscal measures taken by the Government (see Box 2.3). The glass sheets industry also recorded a growth rate of 13.3 percent in FY04 against a 28.2 percent increase in the preceding year. In addition to the impact of construction, the demand for glass sheet, paints & varnish also came from the automobile sector, which performed extraordinarily well during FY04. The availability of cheap Export Finance, rising international demand and supportive government policies together account for the growth in export-led industries such as textiles, leather, and pharmaceuticals. As a result, the textile industry witnessed a reasonable growth rate of 5.7 percent. The biggest contribution to the FY04 textile sector growth was by cotton cloth, which saw a 13 percent rise in production, underpinning the strong exports of bed wear, readymade garments, etc. It should be noted here that the relatively low growth rate in the textile industry is also a result of the large production base (i.e. a high-base effect).23 This resilience shown by the textile sector is a heartening development given the anticipated sharp increase in competitive pressures post-December 2004. In fact, as evident from Figure 2.27 and Table 2.14, the industry has taken advantage of favorable interest rate and exchange rate environment to substantially increase investments and BMR to prepare for the liberalization of the global textile market (see Box.2.4).
22 Cement exports from Iran to Afghanistan stopped due to higher domestic consumption for the re-construction of Bam city, which was destroyed by an earthquake. 23 In practice, this relatively modest increase in LSM textile productions, together with the substantial capacity in the SSM explains the increase in quantum of Pakistan’s textile exports.
Figure 2.27: Import of Textile Machinery
0
5
10
15
20
25
30
35
40
FY99 FY00 FY01 FY02 FY03 FY04
billi
on R
s
Economic Growth, Savings and Investment
29
Box 2.4: Measures to help Textile Sector’s Growth In view of the importance of the textile industry in the country, Government has taken various measures to accelerate growth in this sector. These include:
• Establishment of three textile cities (one each in Karachi, Lahore and Faisalabad, under Textile Vision 2005);
• Reduction in electricity prices; • Lower of import duties on imports of textile
machinery not produced locally; • Free imports and exports of cotton to ensure
the abundant supply in the country. • Banking sector has extended 84.5 billion
rupees credit to textile sub-sector during FY04.
Fertilizer, which is one of the key inputs used in agricultural production, showed the strongest growth of 65.5 percent during FY04 mainly due to a low-base effect, higher domestic demand and re-commencement of production of phosphatic unit of Fauji Bin Qasim Fertilizer plant. The growth rate of phosphatic fertilizer was 151.7 percent during FY04 as compared with a decline of 19.3 percent in FY03, while the growth rate of Nitrogenous fertilizer decelerated from 4.0 percent in FY03 to 1.6 percent during FY04. The production of chemicals increased by 24.4 percent during FY04 as compared with 4.8 percent growth in FY03. The main contributors to this performance were soap & detergent, matches and caustic soda. The pharmaceuticals industry also registered a significant growth of 13.8 percent YoY during FY04, which is substantially higher than the 2.6 percent seen in the preceding year. The increased share of domestic pharmaceutical companies in government purchases and increase in exports to Africa, Central Asian States and Afghanistan are the major contributing factors to this outcome. The leather products industry rebounded in FY04, recording a growth of 31.7 percent YoY in FY04 compared with a decline of 2.5 percent during FY03. This recovery was led by demand in exports, which jumped to US$ 744.1 million, up 7.2 percent YoY, in contrast to a fall in the preceding two years. The wood products24 industry was the only LSM subcategory to record a fall in production during FY04. Its negative contribution is consistent with the negative growth recorded in forestry sub-group in GDP, 84.3 percent increase in imports from China and a shift in consumer preferences from wooden furniture towards metal and plastic furniture. Significant improvement is also evident in the food, beverages & tobacco sub-group of LSM, which reflected an acceleration in growth to 15.7 percent YoY during FY04 compared to the low growth of 1.3 percent in FY03. This improvement was mainly due to an increase in the production of vegetable ghee, sugar, cigarettes, cooking oil and beverages. Government’s regulation and tariff structure changes helped the vegetable ghee industry (grew by 25.0 percent in FY04 against a decline of 4.0 percent in FY03) and cooking oil industry (witnessed a growth of 29.2 percent in FY04 compared with 2.6 percent growth in FY03). Similarly, the production of beverages also recorded a growth of 13.7 percent during FY04 compared with a fall of 4.1 percent in FY03, probably owing to cut in central excise duty from 15 percent to 12 percent on retail prices, as well as the rising domestic demand.
24 This industry has been incorporated in the LSM coverage only in FY04. The comparable growth rate for FY03 is unavailable so the trend behavior for this category cannot yet be established.
Table 2.14: Textile Industry: Investment, Expansion FY03 FY04 Investment
Credit under Textile Vision 2005(billion Rs) 34.2 36.8 Imports of textile machinery (million US$) 531.9 598.0
Expansion No. of mills 363 456
Installed capacity (000 Nos) Spindles 9216.0 9592.6
Rotors 144.0 146.2 Looms 10.0 10.6
Working capacity (000 Nos) Spindles 7586.4 8009.1
Rotors 68.8 66.7 Looms 4.9 4.5
Source: Economic Survey & Textile Commissioner Organization
State Bank of Pakistan Annual Report FY04
30
Box 2.5: Factors Aiding Profitability of Pakistan Steel Mill in FY04 • Pakistan Steel has increased ex-factory prices of all products from the range of Rs 2300 to Rs 3360 per tonne.
Extra charges for special grades have also been increased. • The retirement of about 7100 permanent employees during FY03-FY04 under Volunteer Retirement Scheme. • Privatization of Steel Mill transportation. • Reduced the Steel Mill employees’ OPD medical limit from unlimited to Rs 700 per month. • The increase in the profitability seems more impressive during FY04 as Pakistan Steel Mill has retired a Rs
7.7 billion debt to the banking system, thus reduced debt-servicing burden for years ahead, and • Withholding tax on import of raw materials by Pakistan Steel Mills has been exempted.
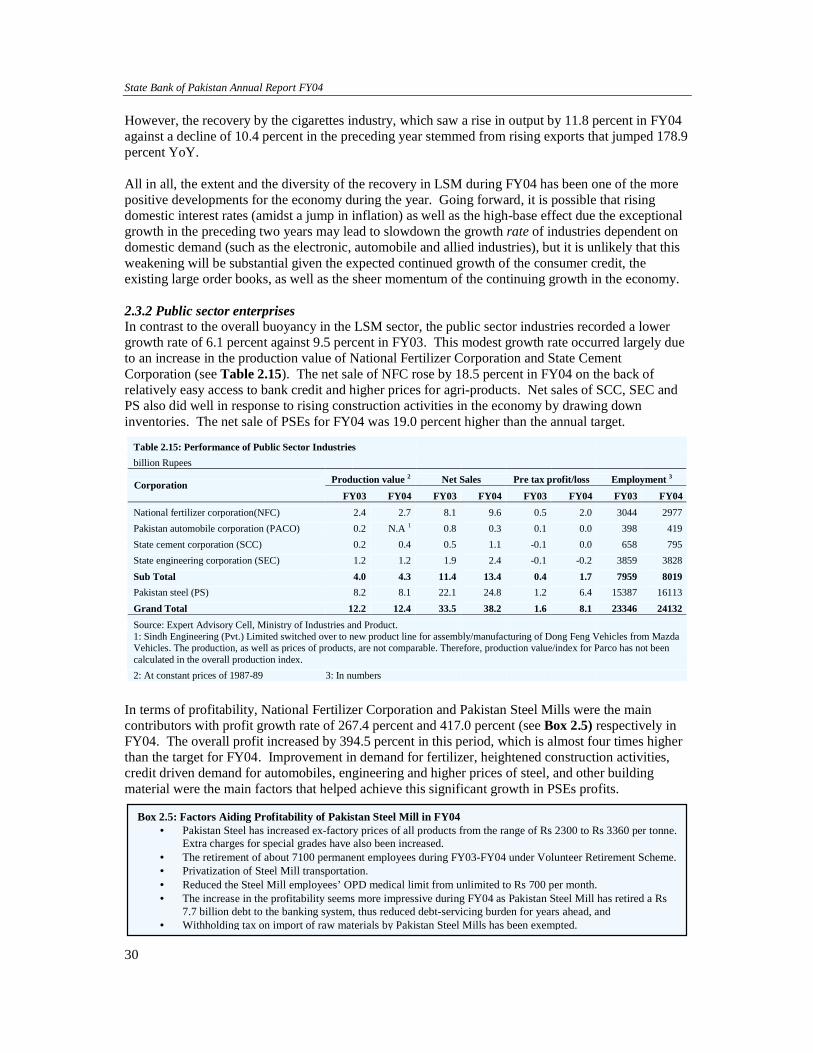
However, the recovery by the cigarettes industry, which saw a rise in output by 11.8 percent in FY04 against a decline of 10.4 percent in the preceding year stemmed from rising exports that jumped 178.9 percent YoY. All in all, the extent and the diversity of the recovery in LSM during FY04 has been one of the more positive developments for the economy during the year. Going forward, it is possible that rising domestic interest rates (amidst a jump in inflation) as well as the high-base effect due the exceptional growth in the preceding two years may lead to slowdown the growth rate of industries dependent on domestic demand (such as the electronic, automobile and allied industries), but it is unlikely that this weakening will be substantial given the expected continued growth of the consumer credit, the existing large order books, as well as the sheer momentum of the continuing growth in the economy. 2.3.2 Public sector enterprises In contrast to the overall buoyancy in the LSM sector, the public sector industries recorded a lower growth rate of 6.1 percent against 9.5 percent in FY03. This modest growth rate occurred largely due to an increase in the production value of National Fertilizer Corporation and State Cement Corporation (see Table 2.15). The net sale of NFC rose by 18.5 percent in FY04 on the back of relatively easy access to bank credit and higher prices for agri-products. Net sales of SCC, SEC and PS also did well in response to rising construction activities in the economy by drawing down inventories. The net sale of PSEs for FY04 was 19.0 percent higher than the annual target.
In terms of profitability, National Fertilizer Corporation and Pakistan Steel Mills were the main contributors with profit growth rate of 267.4 percent and 417.0 percent (see Box 2.5) respectively in FY04. The overall profit increased by 394.5 percent in this period, which is almost four times higher than the target for FY04. Improvement in demand for fertilizer, heightened construction activities, credit driven demand for automobiles, engineering and higher prices of steel, and other building material were the main factors that helped achieve this significant growth in PSEs profits.
Table 2.15: Performance of Public Sector Industries billion Rupees
Production value 2 Net Sales Pre tax profit/loss Employment 3 Corporation FY03 FY04 FY03 FY04 FY03 FY04 FY03 FY04
National fertilizer corporation(NFC) 2.4 2.7 8.1 9.6 0.5 2.0 3044 2977Pakistan automobile corporation (PACO) 0.2 N.A 1 0.8 0.3 0.1 0.0 398 419State cement corporation (SCC) 0.2 0.4 0.5 1.1 -0.1 0.0 658 795State engineering corporation (SEC) 1.2 1.2 1.9 2.4 -0.1 -0.2 3859 3828Sub Total 4.0 4.3 11.4 13.4 0.4 1.7 7959 8019Pakistan steel (PS) 8.2 8.1 22.1 24.8 1.2 6.4 15387 16113Grand Total 12.2 12.4 33.5 38.2 1.6 8.1 23346 24132Source: Expert Advisory Cell, Ministry of Industries and Product. 1: Sindh Engineering (Pvt.) Limited switched over to new product line for assembly/manufacturing of Dong Feng Vehicles from Mazda Vehicles. The production, as well as prices of products, are not comparable. Therefore, production value/index for Parco has not been calculated in the overall production index. 2: At constant prices of 1987-89 3: In numbers
Economic Growth, Savings and Investment
31
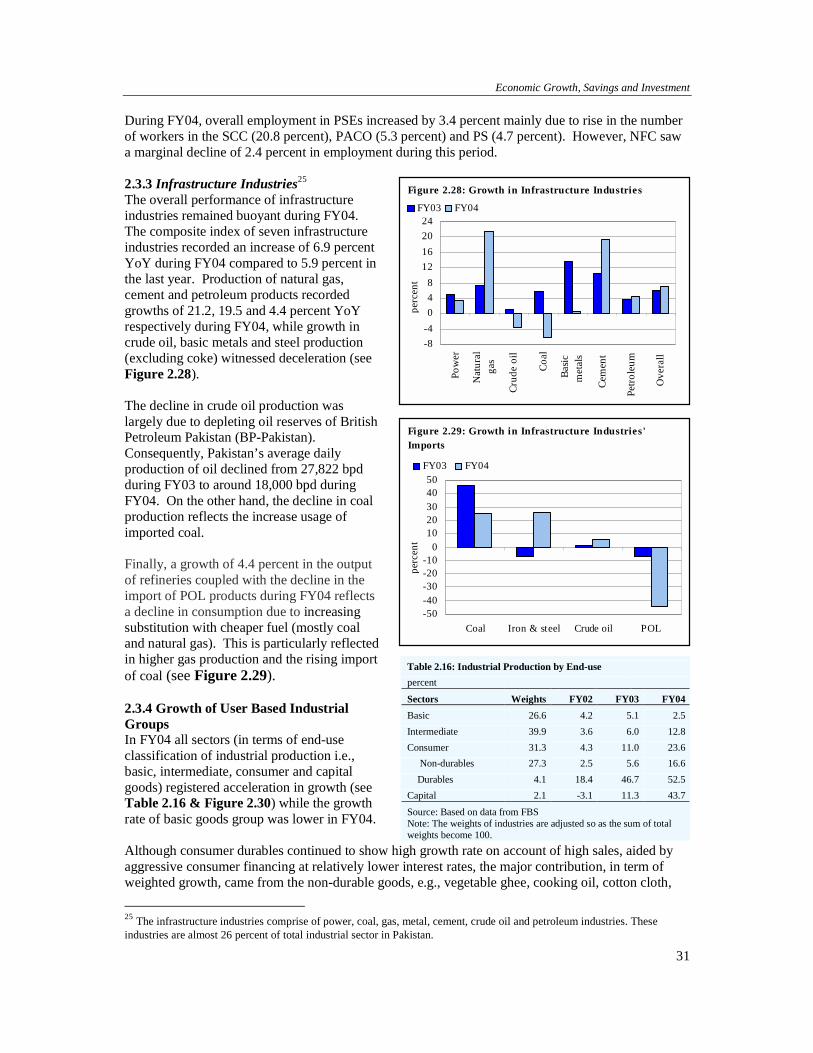
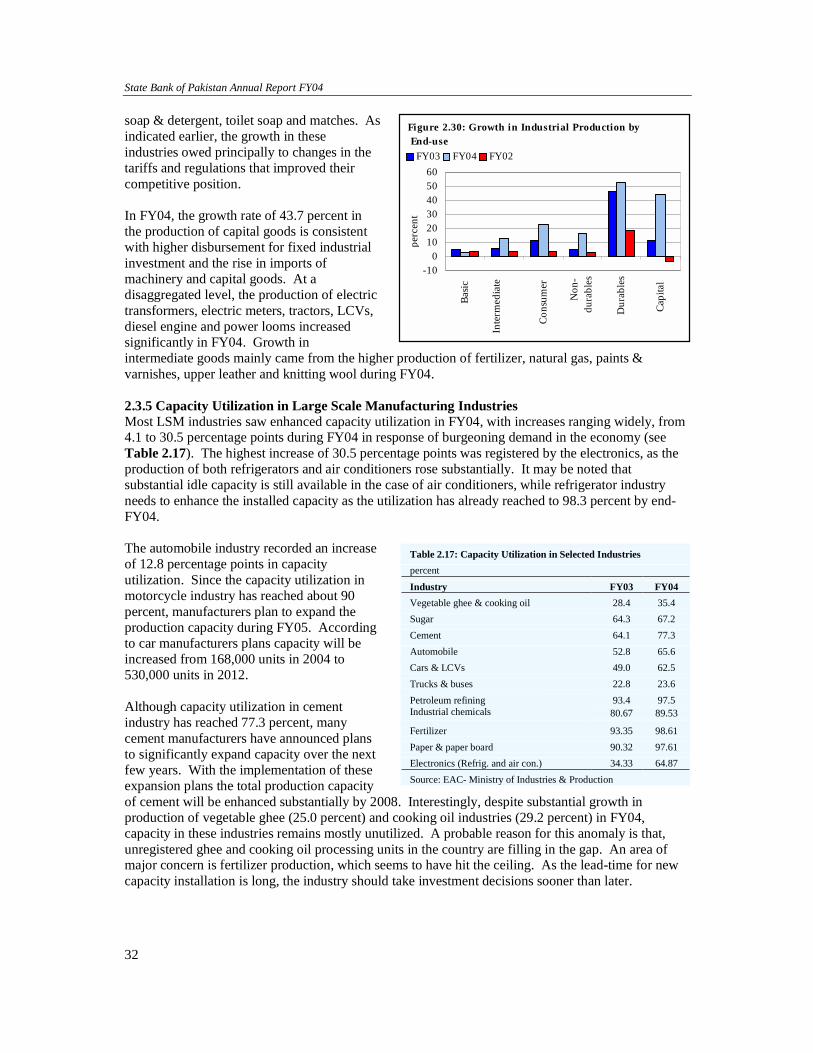
During FY04, overall employment in PSEs increased by 3.4 percent mainly due to rise in the number of workers in the SCC (20.8 percent), PACO (5.3 percent) and PS (4.7 percent). However, NFC saw a marginal decline of 2.4 percent in employment during this period. 2.3.3 Infrastructure Industries25 The overall performance of infrastructure industries remained buoyant during FY04. The composite index of seven infrastructure industries recorded an increase of 6.9 percent YoY during FY04 compared to 5.9 percent in the last year. Production of natural gas, cement and petroleum products recorded growths of 21.2, 19.5 and 4.4 percent YoY respectively during FY04, while growth in crude oil, basic metals and steel production (excluding coke) witnessed deceleration (see Figure 2.28). The decline in crude oil production was largely due to depleting oil reserves of British Petroleum Pakistan (BP-Pakistan). Consequently, Pakistan’s average daily production of oil declined from 27,822 bpd during FY03 to around 18,000 bpd during FY04. On the other hand, the decline in coal production reflects the increase usage of imported coal. Finally, a growth of 4.4 percent in the output of refineries coupled with the decline in the import of POL products during FY04 reflects a decline in consumption due to increasing substitution with cheaper fuel (mostly coal and natural gas). This is particularly reflected in higher gas production and the rising import of coal (see Figure 2.29). 2.3.4 Growth of User Based Industrial Groups In FY04 all sectors (in terms of end-use classification of industrial production i.e., basic, intermediate, consumer and capital goods) registered acceleration in growth (see Table 2.16 & Figure 2.30) while the growth rate of basic goods group was lower in FY04. Although consumer durables continued to show high growth rate on account of high sales, aided by aggressive consumer financing at relatively lower interest rates, the major contribution, in term of weighted growth, came from the non-durable goods, e.g., vegetable ghee, cooking oil, cotton cloth,
25 The infrastructure industries comprise of power, coal, gas, metal, cement, crude oil and petroleum industries. These industries are almost 26 percent of total industrial sector in Pakistan.
Table 2.16: Industrial Production by End-use percent
Sectors Weights FY02 FY03 FY04Basic 26.6 4.2 5.1 2.5Intermediate 39.9 3.6 6.0 12.8Consumer 31.3 4.3 11.0 23.6 Non-durables 27.3 2.5 5.6 16.6 Durables 4.1 18.4 46.7 52.5Capital 2.1 -3.1 11.3 43.7
Source: Based on data from FBS Note: The weights of industries are adjusted so as the sum of total weights become 100.
-8-4048
12162024
Pow
er
Nat
ural
gas
Crud
e oi
l
Coal
Basic
met
als
Cem
ent
Petro
leum
Ove
rall
perc
ent
FY03 FY04
Figure 2.28: Growth in Infrastructure Industries
-50-40-30-20-10
01020304050
Coal Iron & steel Crude oil POL
perc
ent
FY03 FY04
Figure 2.29: Growth in Infrastructure Industries' Imports
State Bank of Pakistan Annual Report FY04
32
soap & detergent, toilet soap and matches. As indicated earlier, the growth in these industries owed principally to changes in the tariffs and regulations that improved their competitive position. In FY04, the growth rate of 43.7 percent in the production of capital goods is consistent with higher disbursement for fixed industrial investment and the rise in imports of machinery and capital goods. At a disaggregated level, the production of electric transformers, electric meters, tractors, LCVs, diesel engine and power looms increased significantly in FY04. Growth in intermediate goods mainly came from the higher production of fertilizer, natural gas, paints & varnishes, upper leather and knitting wool during FY04. 2.3.5 Capacity Utilization in Large Scale Manufacturing Industries Most LSM industries saw enhanced capacity utilization in FY04, with increases ranging widely, from 4.1 to 30.5 percentage points during FY04 in response of burgeoning demand in the economy (see Table 2.17). The highest increase of 30.5 percentage points was registered by the electronics, as the production of both refrigerators and air conditioners rose substantially. It may be noted that substantial idle capacity is still available in the case of air conditioners, while refrigerator industry needs to enhance the installed capacity as the utilization has already reached to 98.3 percent by end-FY04. The automobile industry recorded an increase of 12.8 percentage points in capacity utilization. Since the capacity utilization in motorcycle industry has reached about 90 percent, manufacturers plan to expand the production capacity during FY05. According to car manufacturers plans capacity will be increased from 168,000 units in 2004 to 530,000 units in 2012. Although capacity utilization in cement industry has reached 77.3 percent, many cement manufacturers have announced plans to significantly expand capacity over the next few years. With the implementation of these expansion plans the total production capacity of cement will be enhanced substantially by 2008. Interestingly, despite substantial growth in production of vegetable ghee (25.0 percent) and cooking oil industries (29.2 percent) in FY04, capacity in these industries remains mostly unutilized. A probable reason for this anomaly is that, unregistered ghee and cooking oil processing units in the country are filling in the gap. An area of major concern is fertilizer production, which seems to have hit the ceiling. As the lead-time for new capacity installation is long, the industry should take investment decisions sooner than later.
Table 2.17: Capacity Utilization in Selected Industries percent
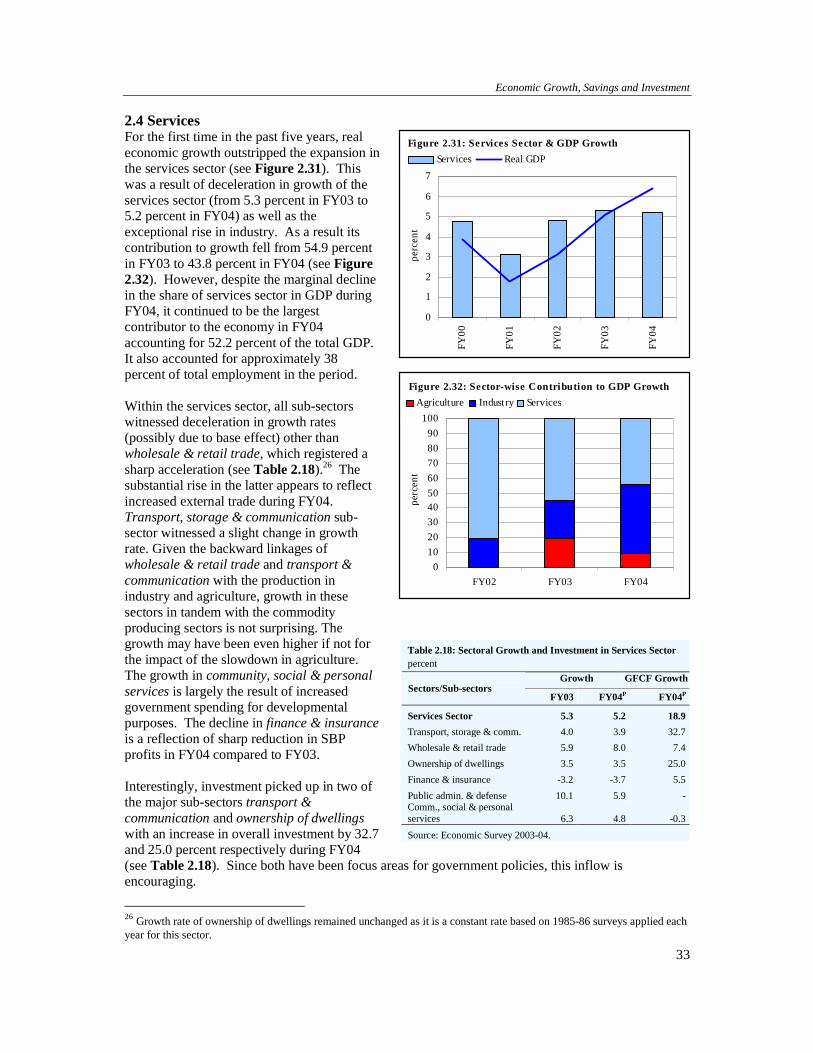
Industry FY03 FY04 Vegetable ghee & cooking oil 28.4 35.4 Sugar 64.3 67.2 Cement 64.1 77.3 Automobile 52.8 65.6 Cars & LCVs 49.0 62.5 Trucks & buses 22.8 23.6 Petroleum refining 93.4 97.5 Industrial chemicals 80.67 89.53
Fertilizer 93.35 98.61 Paper & paper board 90.32 97.61 Electronics (Refrig. and air con.) 34.33 64.87 Source: EAC- Ministry of Industries & Production
-100
102030405060
Basic
Inte
rmed
iate
Cons
umer
N
on-
dura
bles
D
urab
les
Capi
tal
perc
ent
FY03 FY04 FY02
Figure 2.30: Growth in Industrial Production byEnd-use
Economic Growth, Savings and Investment
33
2.4 Services For the first time in the past five years, real economic growth outstripped the expansion in the services sector (see Figure 2.31). This was a result of deceleration in growth of the services sector (from 5.3 percent in FY03 to 5.2 percent in FY04) as well as the exceptional rise in industry. As a result its contribution to growth fell from 54.9 percent in FY03 to 43.8 percent in FY04 (see Figure 2.32). However, despite the marginal decline in the share of services sector in GDP during FY04, it continued to be the largest contributor to the economy in FY04 accounting for 52.2 percent of the total GDP. It also accounted for approximately 38 percent of total employment in the period. Within the services sector, all sub-sectors witnessed deceleration in growth rates (possibly due to base effect) other than wholesale & retail trade, which registered a sharp acceleration (see Table 2.18).26 The substantial rise in the latter appears to reflect increased external trade during FY04. Transport, storage & communication sub-sector witnessed a slight change in growth rate. Given the backward linkages of wholesale & retail trade and transport & communication with the production in industry and agriculture, growth in these sectors in tandem with the commodity producing sectors is not surprising. The growth may have been even higher if not for the impact of the slowdown in agriculture. The growth in community, social & personal services is largely the result of increased government spending for developmental purposes. The decline in finance & insurance is a reflection of sharp reduction in SBP profits in FY04 compared to FY03. Interestingly, investment picked up in two of the major sub-sectors transport & communication and ownership of dwellings with an increase in overall investment by 32.7 and 25.0 percent respectively during FY04 (see Table 2.18). Since both have been focus areas for government policies, this inflow is encouraging.
26 Growth rate of ownership of dwellings remained unchanged as it is a constant rate based on 1985-86 surveys applied each year for this sector.
Table 2.18: Sectoral Growth and Investment in Services Sector percent
Growth GFCF Growth Sectors/Sub-sectors
FY03 FY04P FY04P
Services Sector 5.3 5.2 18.9Transport, storage & comm. 4.0 3.9 32.7Wholesale & retail trade 5.9 8.0 7.4Ownership of dwellings 3.5 3.5 25.0Finance & insurance -3.2 -3.7 5.5Public admin. & defense 10.1 5.9 -Comm., social & personal services 6.3 4.8 -0.3Source: Economic Survey 2003-04.
0102030405060708090
100
FY02 FY03 FY04
perc
ent
Agriculture Industry ServicesFigure 2.32: Sector-wise Contribution to GDP Growth
0
1
2
3
4
5
6
7
FY00
FY01
FY02
FY03
FY04
perc
ent
Services Real GDP Figure 2.31: Services Sector & GDP Growth
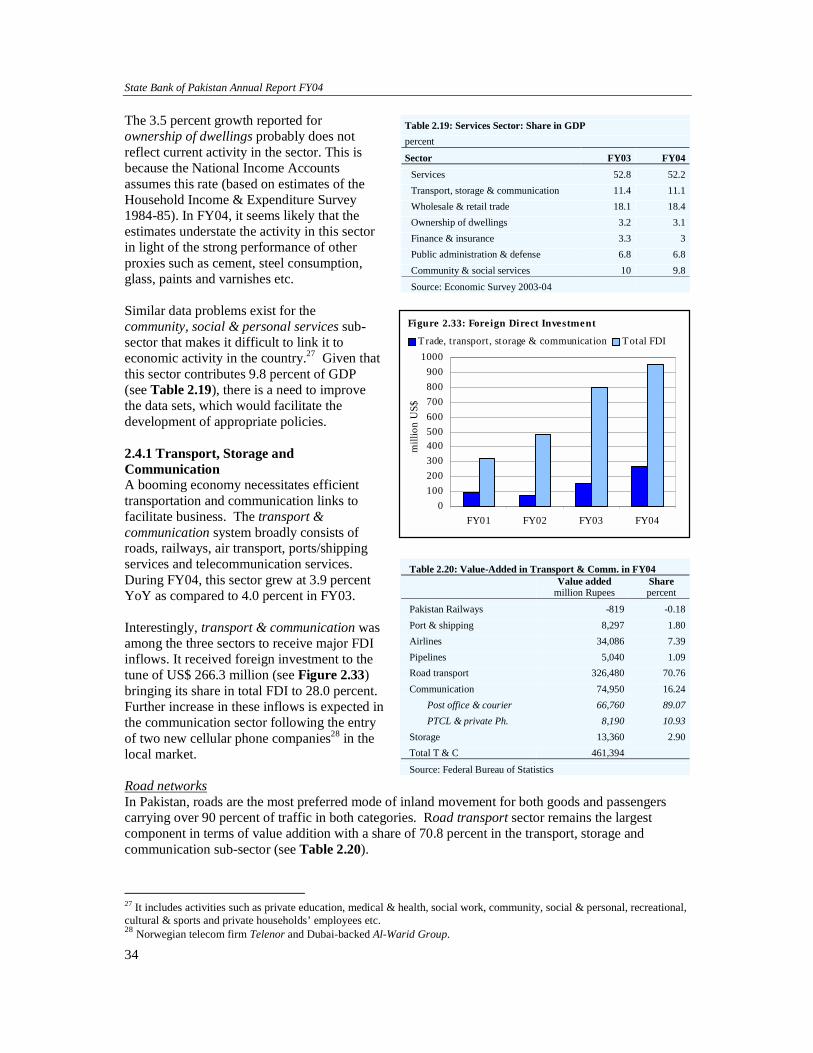
State Bank of Pakistan Annual Report FY04
34
The 3.5 percent growth reported for ownership of dwellings probably does not reflect current activity in the sector. This is because the National Income Accounts assumes this rate (based on estimates of the Household Income & Expenditure Survey 1984-85). In FY04, it seems likely that the estimates understate the activity in this sector in light of the strong performance of other proxies such as cement, steel consumption, glass, paints and varnishes etc. Similar data problems exist for the community, social & personal services sub-sector that makes it difficult to link it to economic activity in the country.27 Given that this sector contributes 9.8 percent of GDP (see Table 2.19), there is a need to improve the data sets, which would facilitate the development of appropriate policies. 2.4.1 Transport, Storage and Communication A booming economy necessitates efficient transportation and communication links to facilitate business. The transport & communication system broadly consists of roads, railways, air transport, ports/shipping services and telecommunication services. During FY04, this sector grew at 3.9 percent YoY as compared to 4.0 percent in FY03. Interestingly, transport & communication was among the three sectors to receive major FDI inflows. It received foreign investment to the tune of US$ 266.3 million (see Figure 2.33) bringing its share in total FDI to 28.0 percent. Further increase in these inflows is expected in the communication sector following the entry of two new cellular phone companies28 in the local market. Road networks In Pakistan, roads are the most preferred mode of inland movement for both goods and passengers carrying over 90 percent of traffic in both categories. Road transport sector remains the largest component in terms of value addition with a share of 70.8 percent in the transport, storage and communication sub-sector (see Table 2.20).
27 It includes activities such as private education, medical & health, social work, community, social & personal, recreational, cultural & sports and private households’ employees etc. 28 Norwegian telecom firm Telenor and Dubai-backed Al-Warid Group.
Table 2.19: Services Sector: Share in GDP percent
Sector FY03 FY04Services 52.8 52.2Transport, storage & communication 11.4 11.1Wholesale & retail trade 18.1 18.4Ownership of dwellings 3.2 3.1Finance & insurance 3.3 3Public administration & defense 6.8 6.8Community & social services 10 9.8Source: Economic Survey 2003-04
Table 2.20: Value-Added in Transport & Comm. in FY04
Value added
million Rupees Share percent
Pakistan Railways -819 -0.18Port & shipping 8,297 1.80Airlines 34,086 7.39Pipelines 5,040 1.09Road transport 326,480 70.76Communication 74,950 16.24 Post office & courier 66,760 89.07 PTCL & private Ph. 8,190 10.93Storage 13,360 2.90Total T & C 461,394
Source: Federal Bureau of Statistics
0100200300400500600700800900
1000
FY01 FY02 FY03 FY04
mill
ion
US$
T rade, transport, storage & communication Total FDI
Figure 2.33: Foreign Direct Investment
Economic Growth, Savings and Investment
35
The National Highway Authority (NHA) is responsible for developing and administering the national highways and strategic roads that carry 80 percent of inter-city traffic. According to a survey by NHA, only 28 percent of its network was in good condition and almost 47 percent required immediate uplift. Efforts during the year for improvement of road networks in the country resulted in the conversion of almost 1,062 km of low-type roads into high type roads and construction of approximately 3,688 km of new high-type roads. The major development projects currently underway include, among others, the construction of Makran Coastal Highway, Karachi Northern Bypass and Peshawar-Islamabad Motorway. Pakistan Railways Pakistan Railways has remained the subject of much criticism in the past due to poor administration and maintenance. However, restructuring and improvement of passenger and freight services over the past two years has increased the earnings of Railways. Railways posted nearly the same gross income i.e. Rs 1.5 billion as last year (see Figure 2.34), its contribution in value-addition declined to a negative Rs 819 million. This could be a result of a drop in freight revenue, as passenger traffic grew by 10 percent during July-March 2004 (see Table 2.21). Air transport Pakistan International Airline’s (PIA) posted a record pre-tax profit of Rs. 3.7 billion, which was 75 percent higher than in the previous year (see Figure 2.35). 29 Profitability over the last two and a half years coupled with equity injection by GoP has improved PIA’s financial health substantially. PIA experienced passenger traffic growth of 11.4 percent YoY and improved its load factor to 69.9 percent during 2003 compared with 68.3 percent in 2002 (see Figure 2.36). However, its operating profits declined despite growth of 9.8 percent YoY in operating revenue. This was due to an increase in operating expenditure by 11.9 percent YoY, mainly on account on higher fuel bill. Port and Shipping Services Port and shipping services saw increased activity due to the high growth of imports and exports during FY04. Pakistan National Shipping Corporation (PNSC) posted an operating profit of Rs.1.3 billion during the first nine months of FY04, compared to Rs.0.5 billion for the corresponding period 29 PIA’s financial year is Jan-Dec.
Table 2.21: Passenger & Freight Traffic by Railways Year Passenger Km (million) Tonne Km (million)
FY01 19,590 4,520 FY02 20,783 4,573 FY03 22,306 4,820 FY04* 18,976 3,912 *July-April Source: Pakistan Railways
0
1
2
3
4
5
6
7
8
2002 2003
billi
on R
s
Profit bfore tax Net worthFigure 2.35: PIA's Financial Performance
11
12
13
14
15
FY01 FY02 FY03 FY04
billi
on R
s
Figure 2.34: Gross Earnings of Pakistan Railways
State Bank of Pakistan Annual Report FY04
36
last year. The major source of profitability was an increase in freight revenue that rose nearly 76.0 percent YoY in FY04. Increased demand for freight and water transportation services reflects the increased volume of trade during the period. Karachi Port Trust experienced an increase of 8.1 percent YoY in total cargo handling during FY04. Interestingly, while export cargo handling by the KPT declined, this was more than offset by a 41.0 percent YoY increase in the box trade at Port Qasim during the year (see Figure 2.37). Provisional estimates suggest that KPT will post a profit of approximately Rs 4.0 billion during FY04. Initiatives by KPT during the year include infrastructure development, revision of tariff structure and computerization of daily procedures. Communication The telecom sector saw a lot of activity during the year with PTCL’s monopoly officially ending in December 2003 and the announcement of the Telecom Deregulation Policy (2003) and Cellular Phone Policy (2004). Two new national licenses were granted for cellular phone operations and Wireless Local Loop (WLL) licenses were issued to PTCL, Telecard and WorldCall. PTCL in particular improved its performance, posting a after tax profit of Rs 29.2 billion for FY04 compared to Rs 23.0 billion in FY03 (see Figure 2.38). Such outstanding performance can probably be attributed to growth in voice traffic, tightening of expenses and lower financing costs. The cellular phone sector continued to grow at a tremendous pace with total net profits for the sector jumping by approximately 108.9 percent YoY during FY04. Anticipating increased competition in the future, cellular companies aggressively pursued policies to expand subscriber base that led to a growth of 109 percent YoY in cellular subscribers during the period 2.4.2. Wholesale and Retail Trade During FY04, the gross value added in the wholesale & retail trade sector grew at 8.0 percent YoY, up from the 5.9 percent growth in FY03 largely on the back of a sharp increase in LSM activity and a
0
15
30
45
60
75
2002 2003
perc
ent
Passenger load factor Cargo load factorFigure 2.36: PIA's Traffic Performance
0
4
8
12
16
20
24
FY03 FY04
mill
ion
tonn
esImports Exports
Figure 2.37: Cargo Handling at Karachi Port Trust
0
5
10
15
20
25
30
35
FY00 FY01 FY02 FY03 FY04
billi
on R
s
PTCL Cellular firmsFigure 2.38: Profitability in Telecom Sector
Economic Growth, Savings and Investment
37
sharp jump in exports. As a result, its share in GDP rose from 18.1 percent in FY03 to 18.4 percent YoY during FY04. Trends in value-addition remained the same as in the preceding year with the largest share being of manufactured goods at 43.7 percent YoY in FY04, followed by agriculture, imports and hotels & restaurants at 30.1, 13.7 and 12.5 percent respectively (see Figure 2.39). 2.4.3. Finance and Insurance The performance of the finance and insurance sector remained disappointing for the second consecutive year as value-added in the sector declined by 3.7 percent YoY during FY04 compared to a decline of 3.2 percent in FY03. Although profitability of the banking sector improved over the past fiscal year, the shrinking profitability of State Bank of Pakistan overshadowed the impact of this growth. Despite declining interest rates, net interest income of banks increased due to the surge in volume of credit. Massive capital gains on equity and fixed income investments were the other major contributor towards banking sector profitability. On the other hand, SBP incurred losses during the year due to lower interest income (including sterilization costs) coupled with revaluation losses on its reserves. The insurance sector and the NBFIs also performed better during the year. The total insurance premiums of life and non-life insurance for calendar year 2003 (CY03) amounted to Rs 55 billion compared to Rs 44.3 billion for CY02 (see Figure 2.40). 2.5 Savings Contrary to a double-digit growth in national savings in recent years, the rise in national savings decelerated to only 9.0 percent YoY during FY04, well below the nominal GDP growth. As a result, the ratio of national savings to GDP fell to 19.8 percent from a record high of 20.6 percent in FY03 (see Figure 2.41). The deceleration in the growth of national savings during FY04 is attributed to (1) a substantial decline of 12.7 percent YoY in the private savings; and (2) negative growth in net factor income from abroad (see Table 2.22). Thus, the rise in national savings in
0.0
0.2
0.4
0.6
0.8
1.0
1.2
2001 2002 2003
perc
ent
0
10
20
30
40
50
60
billi
on R
s
Gross premium Net premiumTotal premium (RHS) Premium as % of GDP
Figure 2.40: Growth of Insurance Premiums
Imports14%
Hotels & restaurants
13%
Agriculture30%
Figure 2.39: Structure of W & R Trade in FY04
Manufactures43%
Figure 2.41: Savings and Investment
15
16
17
18
19
20
21
FY00
FY01
FY02
FY03
FY04
as p
erce
nt o
f GD
P
Investment Savings
State Bank of Pakistan Annual Report FY04
38
FY04 is entirely due to a sharp jump in public savings. More specifically, a rise of Rs 206.2 billion in public savings during FY04 was partially offset by a decline of Rs 116.9 billion in private savings and a fall of Rs 33.6 billion in net factor income from abroad.
The robust increase in the public savings appears to reflect an increase in fiscal discipline as well as substantial rise in revenues during FY04. In particular, an enormous rise in savings under general government has improved its ratio to GDP from (-0.2) percent in FY03 to 2.9 percent during FY04. Since data for national savings is derived as a residual instead of using actual statistics, an analysis of financial savings and its components would be more instructive. In aggregate terms, financial savings, which account for about half of national savings, witnessed a marginal decline during FY04 mainly due to a substantial deceleration of inflows into NSS instruments (see Table 2.23). All other
Table 2.22: Investment and Savings at current prices FY01 FY02 FY03R FY04P
Growth rates 1 Gross total investment 8.6 3.2 9.3 22.32 Gross fixed investment 8.5 3.2 4.9 25.0 Public sector 11.1 -22.1 -6.6 47.5 Private sector 7.2 17.3 9.2 17.93 Net external resource inflow -49.3 -374.2 -125.3 49.04 National savings 14.3 19.7 20.9 9.0 Public savings -1992.7 39.6 -13.7 294.1 General government 61.0 180.1 -211.0 1456.8 Others 134.5 -0.7 15.5 45.2 Private savings 4.0 17.8 24.7 -12.7 House-hold 4.0 17.8 24.7 -12.7 Corporate 4.0 17.8 24.7 -12.75 Net factor income from abroad -13.6 143.4 541.5 -22.16 Domestic savings 14.2 7.7 5.4 14.6As percent of GDP 1 Gross total investment 17.2 16.8 16.7 18.12 Gross fixed investment 15.8 15.5 14.8 16.4 Public sector 5.7 4.2 3.6 4.6 Private sector 10.2 11.3 11.2 11.73 Net external resource inflow 0.7 -1.9 -3.8 -1.74 National savings 16.5 18.6 20.6 19.8 Public savings 1.4 1.8 1.5 5.1 General government -0.3 0.2 -0.2 2.9 Others 1.7 1.6 1.7 2.2 Private savings 15.1 16.8 19.1 14.7 House-hold 13.3 14.8 16.9 13.0 Corporate 1.8 2.0 2.3 1.75 Net factor income from abroad -1.3 0.5 3.1 2.26 Domestic savings 17.8 18.1 17.4 17.6As percent of gross to total investment 1 Net external resource inflow 4.2 -11.1 -22.9 -9.62 National savings 95.8 111.1 122.9 109.6
R=Revised, P=Provisional Source: Federal Bureau of Statistics & Planning and Development Division, GoP.
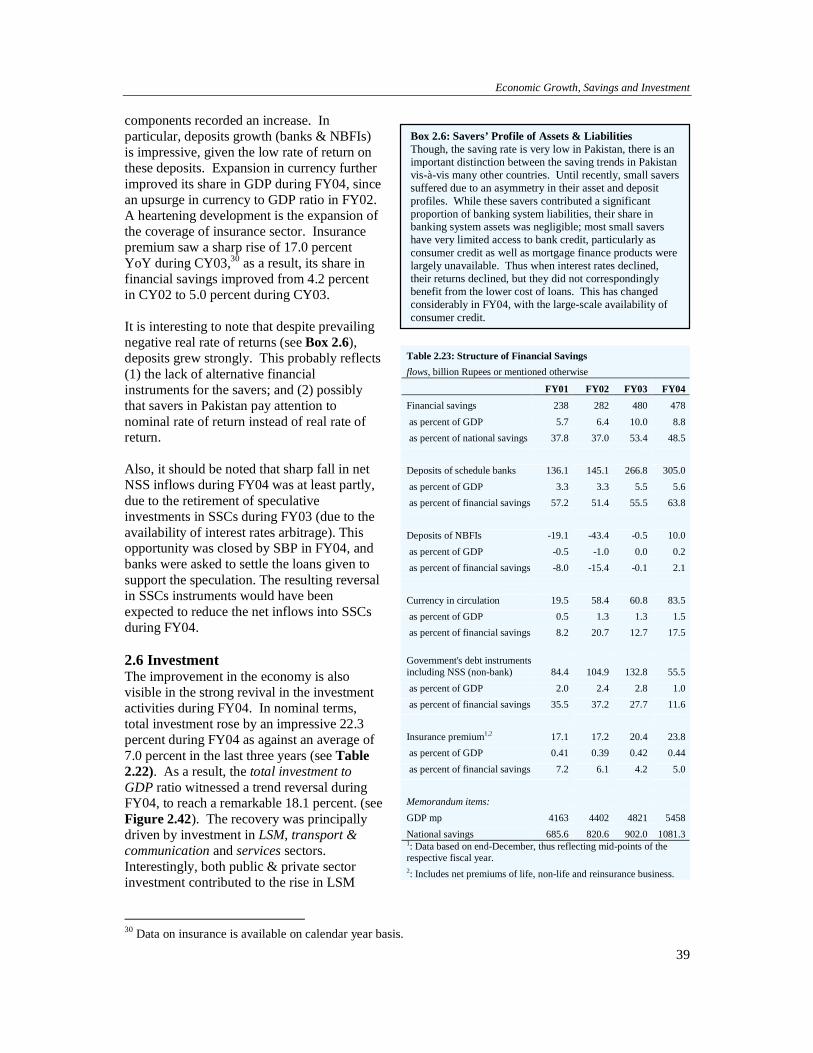
Economic Growth, Savings and Investment
39
Box 2.6: Savers’ Profile of Assets & Liabilities Though, the saving rate is very low in Pakistan, there is an important distinction between the saving trends in Pakistan vis-à-vis many other countries. Until recently, small savers suffered due to an asymmetry in their asset and deposit profiles. While these savers contributed a significant proportion of banking system liabilities, their share in banking system assets was negligible; most small savers have very limited access to bank credit, particularly as consumer credit as well as mortgage finance products were largely unavailable. Thus when interest rates declined, their returns declined, but they did not correspondingly benefit from the lower cost of loans. This has changed considerably in FY04, with the large-scale availability of consumer credit.
components recorded an increase. In particular, deposits growth (banks & NBFIs) is impressive, given the low rate of return on these deposits. Expansion in currency further improved its share in GDP during FY04, since an upsurge in currency to GDP ratio in FY02. A heartening development is the expansion of the coverage of insurance sector. Insurance premium saw a sharp rise of 17.0 percent YoY during CY03,30 as a result, its share in financial savings improved from 4.2 percent in CY02 to 5.0 percent during CY03. It is interesting to note that despite prevailing negative real rate of returns (see Box 2.6), deposits grew strongly. This probably reflects (1) the lack of alternative financial instruments for the savers; and (2) possibly that savers in Pakistan pay attention to nominal rate of return instead of real rate of return. Also, it should be noted that sharp fall in net NSS inflows during FY04 was at least partly, due to the retirement of speculative investments in SSCs during FY03 (due to the availability of interest rates arbitrage). This opportunity was closed by SBP in FY04, and banks were asked to settle the loans given to support the speculation. The resulting reversal in SSCs instruments would have been expected to reduce the net inflows into SSCs during FY04. 2.6 Investment The improvement in the economy is also visible in the strong revival in the investment activities during FY04. In nominal terms, total investment rose by an impressive 22.3 percent during FY04 as against an average of 7.0 percent in the last three years (see Table 2.22). As a result, the total investment to GDP ratio witnessed a trend reversal during FY04, to reach a remarkable 18.1 percent. (see Figure 2.42). The recovery was principally driven by investment in LSM, transport & communication and services sectors. Interestingly, both public & private sector investment contributed to the rise in LSM
30 Data on insurance is available on calendar year basis.
Table 2.23: Structure of Financial Savings flows, billion Rupees or mentioned otherwise
FY01 FY02 FY03 FY04Financial savings 238 282 480 478 as percent of GDP 5.7 6.4 10.0 8.8 as percent of national savings 37.8 37.0 53.4 48.5 Deposits of schedule banks 136.1 145.1 266.8 305.0 as percent of GDP 3.3 3.3 5.5 5.6 as percent of financial savings 57.2 51.4 55.5 63.8 Deposits of NBFIs -19.1 -43.4 -0.5 10.0 as percent of GDP -0.5 -1.0 0.0 0.2 as percent of financial savings -8.0 -15.4 -0.1 2.1 Currency in circulation 19.5 58.4 60.8 83.5 as percent of GDP 0.5 1.3 1.3 1.5 as percent of financial savings 8.2 20.7 12.7 17.5 Government's debt instruments including NSS (non-bank) 84.4 104.9 132.8 55.5 as percent of GDP 2.0 2.4 2.8 1.0 as percent of financial savings 35.5 37.2 27.7 11.6 Insurance premium1,2 17.1 17.2 20.4 23.8 as percent of GDP 0.41 0.39 0.42 0.44 as percent of financial savings 7.2 6.1 4.2 5.0 Memorandum items: GDP mp 4163 4402 4821 5458National savings 685.6 820.6 902.0 1081.31: Data based on end-December, thus reflecting mid-points of the respective fiscal year. 2: Includes net premiums of life, non-life and reinsurance business.
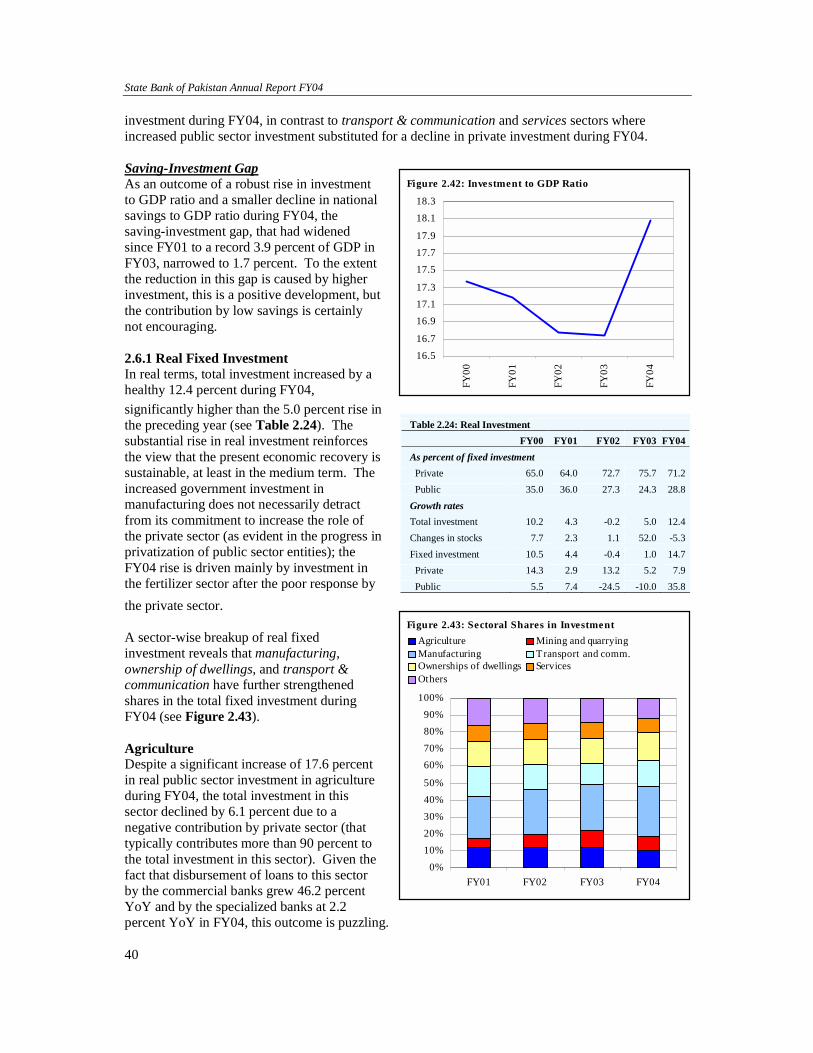
State Bank of Pakistan Annual Report FY04
40
investment during FY04, in contrast to transport & communication and services sectors where increased public sector investment substituted for a decline in private investment during FY04. Saving-Investment Gap As an outcome of a robust rise in investment to GDP ratio and a smaller decline in national savings to GDP ratio during FY04, the saving-investment gap, that had widened since FY01 to a record 3.9 percent of GDP in FY03, narrowed to 1.7 percent. To the extent the reduction in this gap is caused by higher investment, this is a positive development, but the contribution by low savings is certainly not encouraging. 2.6.1 Real Fixed Investment In real terms, total investment increased by a healthy 12.4 percent during FY04, significantly higher than the 5.0 percent rise in the preceding year (see Table 2.24). The substantial rise in real investment reinforces the view that the present economic recovery is sustainable, at least in the medium term. The increased government investment in manufacturing does not necessarily detract from its commitment to increase the role of the private sector (as evident in the progress in privatization of public sector entities); the FY04 rise is driven mainly by investment in the fertilizer sector after the poor response by the private sector. A sector-wise breakup of real fixed investment reveals that manufacturing, ownership of dwellings, and transport & communication have further strengthened shares in the total fixed investment during FY04 (see Figure 2.43). Agriculture Despite a significant increase of 17.6 percent in real public sector investment in agriculture during FY04, the total investment in this sector declined by 6.1 percent due to a negative contribution by private sector (that typically contributes more than 90 percent to the total investment in this sector). Given the fact that disbursement of loans to this sector by the commercial banks grew 46.2 percent YoY and by the specialized banks at 2.2 percent YoY in FY04, this outcome is puzzling.
Table 2.24: Real Investment FY00 FY01 FY02 FY03 FY04As percent of fixed investment Private 65.0 64.0 72.7 75.7 71.2 Public 35.0 36.0 27.3 24.3 28.8Growth rates Total investment 10.2 4.3 -0.2 5.0 12.4Changes in stocks 7.7 2.3 1.1 52.0 -5.3Fixed investment 10.5 4.4 -0.4 1.0 14.7 Private 14.3 2.9 13.2 5.2 7.9 Public 5.5 7.4 -24.5 -10.0 35.8
Figure 2.43: Sectoral Shares in Investment
0%
10%
20%30%
40%50%
60%70%
80%90%
100%
FY01 FY02 FY03 FY04
Agriculture Mining and quarryingManufacturing Transport and comm.Ownerships of dwellings ServicesOthers
Figure 2.42: Investment to GDP Ratio
16.5
16.7
16.9
17.117.3
17.517.7
17.9
18.1
18.3
FY00
FY01
FY02
FY03
FY04
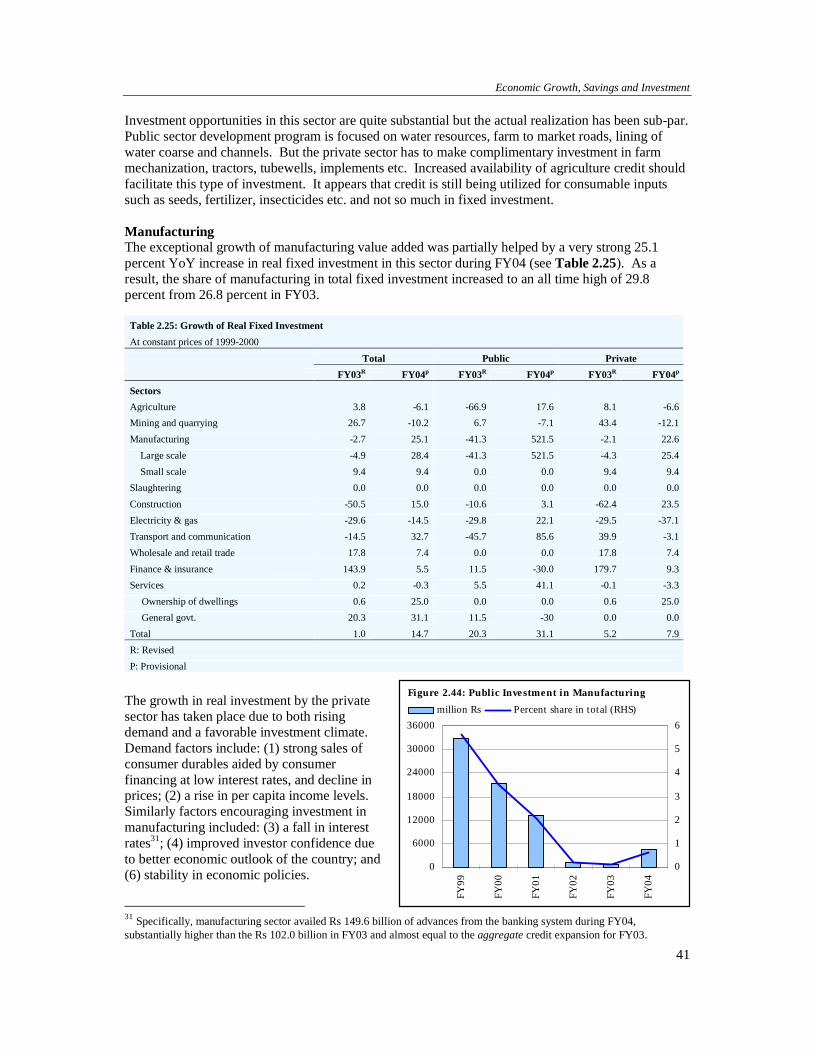
Economic Growth, Savings and Investment
41
Investment opportunities in this sector are quite substantial but the actual realization has been sub-par. Public sector development program is focused on water resources, farm to market roads, lining of water coarse and channels. But the private sector has to make complimentary investment in farm mechanization, tractors, tubewells, implements etc. Increased availability of agriculture credit should facilitate this type of investment. It appears that credit is still being utilized for consumable inputs such as seeds, fertilizer, insecticides etc. and not so much in fixed investment. Manufacturing The exceptional growth of manufacturing value added was partially helped by a very strong 25.1 percent YoY increase in real fixed investment in this sector during FY04 (see Table 2.25). As a result, the share of manufacturing in total fixed investment increased to an all time high of 29.8 percent from 26.8 percent in FY03.
The growth in real investment by the private sector has taken place due to both rising demand and a favorable investment climate. Demand factors include: (1) strong sales of consumer durables aided by consumer financing at low interest rates, and decline in prices; (2) a rise in per capita income levels. Similarly factors encouraging investment in manufacturing included: (3) a fall in interest rates31; (4) improved investor confidence due to better economic outlook of the country; and (6) stability in economic policies.
31 Specifically, manufacturing sector availed Rs 149.6 billion of advances from the banking system during FY04, substantially higher than the Rs 102.0 billion in FY03 and almost equal to the aggregate credit expansion for FY03.
Table 2.25: Growth of Real Fixed Investment At constant prices of 1999-2000 Total Public Private FY03R FY04p FY03R FY04p FY03R FY04p
Sectors Agriculture 3.8 -6.1 -66.9 17.6 8.1 -6.6Mining and quarrying 26.7 -10.2 6.7 -7.1 43.4 -12.1Manufacturing -2.7 25.1 -41.3 521.5 -2.1 22.6
Large scale -4.9 28.4 -41.3 521.5 -4.3 25.4Small scale 9.4 9.4 0.0 0.0 9.4 9.4
Slaughtering 0.0 0.0 0.0 0.0 0.0 0.0Construction -50.5 15.0 -10.6 3.1 -62.4 23.5Electricity & gas -29.6 -14.5 -29.8 22.1 -29.5 -37.1Transport and communication -14.5 32.7 -45.7 85.6 39.9 -3.1Wholesale and retail trade 17.8 7.4 0.0 0.0 17.8 7.4Finance & insurance 143.9 5.5 11.5 -30.0 179.7 9.3Services 0.2 -0.3 5.5 41.1 -0.1 -3.3
Ownership of dwellings 0.6 25.0 0.0 0.0 0.6 25.0General govt. 20.3 31.1 11.5 -30 0.0 0.0
Total 1.0 14.7 20.3 31.1 5.2 7.9R: Revised P: Provisional
0
6000
12000
18000
24000
30000
36000
FY99
FY00
FY01
FY02
FY03
FY04
0
1
2
3
4
5
6million Rs Percent share in total (RHS)
Figure 2.44: Public Investment in Manufacturing
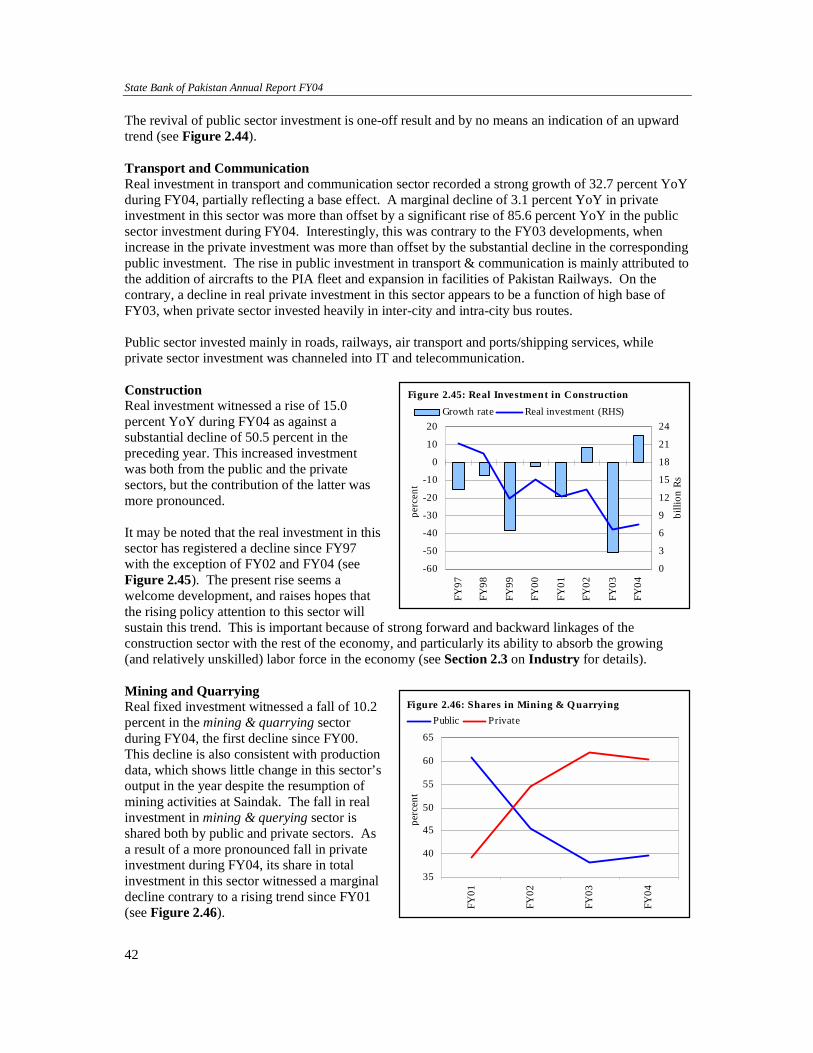
State Bank of Pakistan Annual Report FY04
42
The revival of public sector investment is one-off result and by no means an indication of an upward trend (see Figure 2.44). Transport and Communication Real investment in transport and communication sector recorded a strong growth of 32.7 percent YoY during FY04, partially reflecting a base effect. A marginal decline of 3.1 percent YoY in private investment in this sector was more than offset by a significant rise of 85.6 percent YoY in the public sector investment during FY04. Interestingly, this was contrary to the FY03 developments, when increase in the private investment was more than offset by the substantial decline in the corresponding public investment. The rise in public investment in transport & communication is mainly attributed to the addition of aircrafts to the PIA fleet and expansion in facilities of Pakistan Railways. On the contrary, a decline in real private investment in this sector appears to be a function of high base of FY03, when private sector invested heavily in inter-city and intra-city bus routes. Public sector invested mainly in roads, railways, air transport and ports/shipping services, while private sector investment was channeled into IT and telecommunication. Construction Real investment witnessed a rise of 15.0 percent YoY during FY04 as against a substantial decline of 50.5 percent in the preceding year. This increased investment was both from the public and the private sectors, but the contribution of the latter was more pronounced. It may be noted that the real investment in this sector has registered a decline since FY97 with the exception of FY02 and FY04 (see Figure 2.45). The present rise seems a welcome development, and raises hopes that the rising policy attention to this sector will sustain this trend. This is important because of strong forward and backward linkages of the construction sector with the rest of the economy, and particularly its ability to absorb the growing (and relatively unskilled) labor force in the economy (see Section 2.3 on Industry for details). Mining and Quarrying Real fixed investment witnessed a fall of 10.2 percent in the mining & quarrying sector during FY04, the first decline since FY00. This decline is also consistent with production data, which shows little change in this sector’s output in the year despite the resumption of mining activities at Saindak. The fall in real investment in mining & querying sector is shared both by public and private sectors. As a result of a more pronounced fall in private investment during FY04, its share in total investment in this sector witnessed a marginal decline contrary to a rising trend since FY01 (see Figure 2.46).
-60
-50
-40
-30
-20
-10
0
10
20
FY97
FY98
FY99
FY00
FY01
FY02
FY03
FY04
perc
ent
0
3
6
9
12
15
18
21
24
billi
on R
s
Growth rate Real investment (RHS)Figure 2.45: Real Investment in Construction
Figure 2.46: Shares in Mining & Quarrying
35
40
45
50
55
60
65
FY01
FY02
FY03
FY04
perc
ent
Public Private
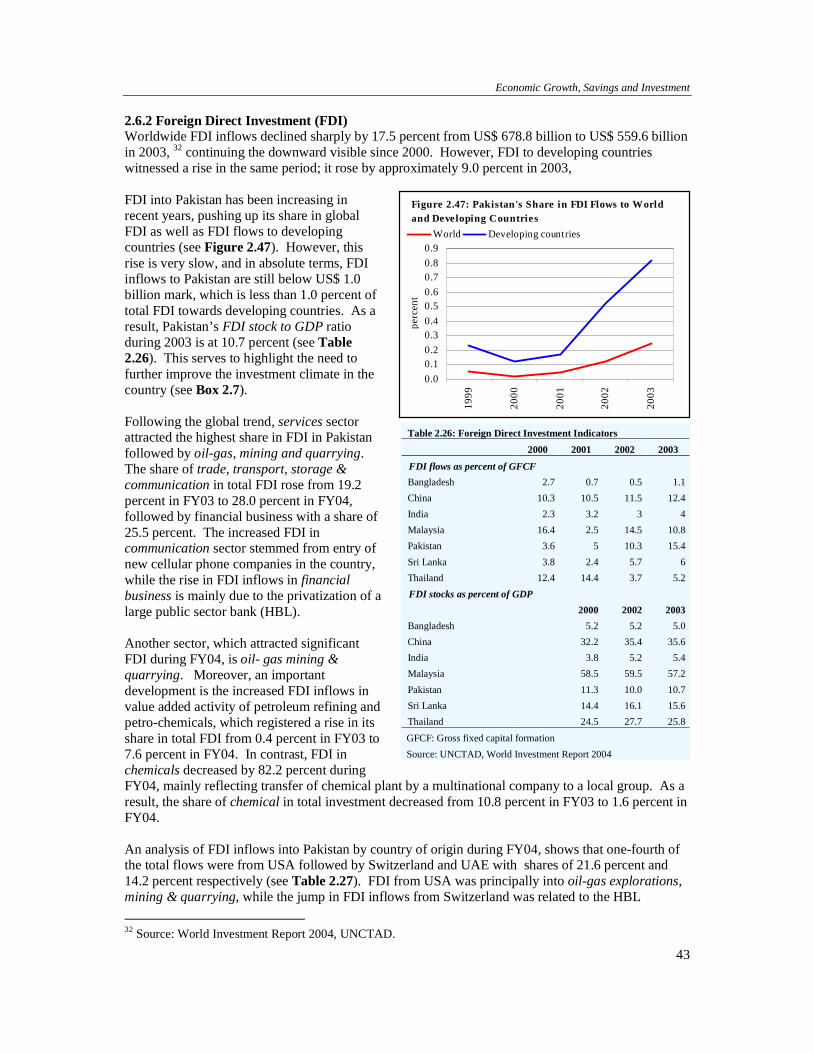
Economic Growth, Savings and Investment
43
2.6.2 Foreign Direct Investment (FDI) Worldwide FDI inflows declined sharply by 17.5 percent from US$ 678.8 billion to US$ 559.6 billion in 2003, 32 continuing the downward visible since 2000. However, FDI to developing countries witnessed a rise in the same period; it rose by approximately 9.0 percent in 2003, FDI into Pakistan has been increasing in recent years, pushing up its share in global FDI as well as FDI flows to developing countries (see Figure 2.47). However, this rise is very slow, and in absolute terms, FDI inflows to Pakistan are still below US$ 1.0 billion mark, which is less than 1.0 percent of total FDI towards developing countries. As a result, Pakistan’s FDI stock to GDP ratio during 2003 is at 10.7 percent (see Table 2.26). This serves to highlight the need to further improve the investment climate in the country (see Box 2.7). Following the global trend, services sector attracted the highest share in FDI in Pakistan followed by oil-gas, mining and quarrying. The share of trade, transport, storage & communication in total FDI rose from 19.2 percent in FY03 to 28.0 percent in FY04, followed by financial business with a share of 25.5 percent. The increased FDI in communication sector stemmed from entry of new cellular phone companies in the country, while the rise in FDI inflows in financial business is mainly due to the privatization of a large public sector bank (HBL). Another sector, which attracted significant FDI during FY04, is oil- gas mining & quarrying. Moreover, an important development is the increased FDI inflows in value added activity of petroleum refining and petro-chemicals, which registered a rise in its share in total FDI from 0.4 percent in FY03 to 7.6 percent in FY04. In contrast, FDI in chemicals decreased by 82.2 percent during FY04, mainly reflecting transfer of chemical plant by a multinational company to a local group. As a result, the share of chemical in total investment decreased from 10.8 percent in FY03 to 1.6 percent in FY04. An analysis of FDI inflows into Pakistan by country of origin during FY04, shows that one-fourth of the total flows were from USA followed by Switzerland and UAE with shares of 21.6 percent and 14.2 percent respectively (see Table 2.27). FDI from USA was principally into oil-gas explorations, mining & quarrying, while the jump in FDI inflows from Switzerland was related to the HBL 32 Source: World Investment Report 2004, UNCTAD.
Table 2.26: Foreign Direct Investment Indicators 2000 2001 2002 2003 FDI flows as percent of GFCF Bangladesh 2.7 0.7 0.5 1.1China 10.3 10.5 11.5 12.4India 2.3 3.2 3 4Malaysia 16.4 2.5 14.5 10.8Pakistan 3.6 5 10.3 15.4Sri Lanka 3.8 2.4 5.7 6Thailand 12.4 14.4 3.7 5.2FDI stocks as percent of GDP 2000 2002 2003Bangladesh 5.2 5.2 5.0China 32.2 35.4 35.6India 3.8 5.2 5.4Malaysia 58.5 59.5 57.2Pakistan 11.3 10.0 10.7Sri Lanka 14.4 16.1 15.6Thailand 24.5 27.7 25.8GFCF: Gross fixed capital formation Source: UNCTAD, World Investment Report 2004
0.00.10.20.30.40.50.60.70.80.9
1999
2000
2001
2002
2003
perc
ent
World Developing countries
Figure 2.47: Pakistan's Share in FDI Flows to World and Developing Countries
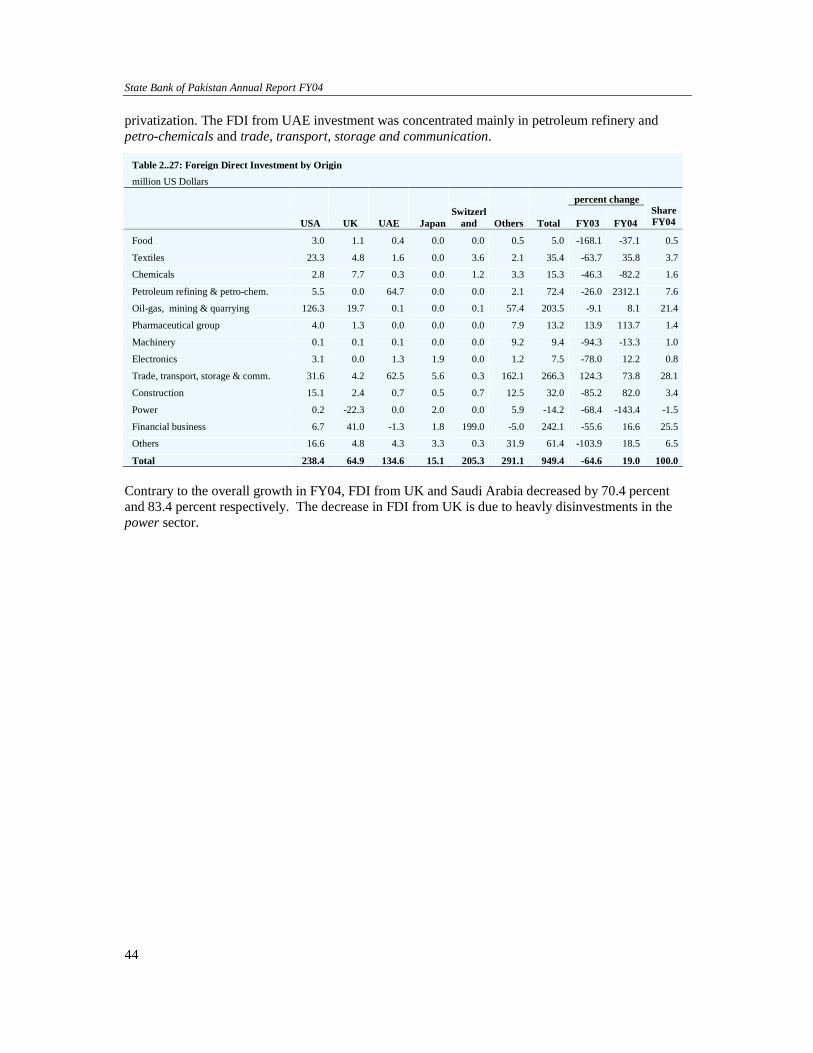
State Bank of Pakistan Annual Report FY04
44
privatization. The FDI from UAE investment was concentrated mainly in petroleum refinery and petro-chemicals and trade, transport, storage and communication.
Contrary to the overall growth in FY04, FDI from UK and Saudi Arabia decreased by 70.4 percent and 83.4 percent respectively. The decrease in FDI from UK is due to heavly disinvestments in the power sector.
Table 2..27: Foreign Direct Investment by Origin million US Dollars
percent change
USA UK UAE Japan Switzerl
and Others Total FY03 FY04 Share FY04
Food 3.0 1.1 0.4 0.0 0.0 0.5 5.0 -168.1 -37.1 0.5
Textiles 23.3 4.8 1.6 0.0 3.6 2.1 35.4 -63.7 35.8 3.7
Chemicals 2.8 7.7 0.3 0.0 1.2 3.3 15.3 -46.3 -82.2 1.6
Petroleum refining & petro-chem. 5.5 0.0 64.7 0.0 0.0 2.1 72.4 -26.0 2312.1 7.6
Oil-gas, mining & quarrying 126.3 19.7 0.1 0.0 0.1 57.4 203.5 -9.1 8.1 21.4
Pharmaceutical group 4.0 1.3 0.0 0.0 0.0 7.9 13.2 13.9 113.7 1.4
Machinery 0.1 0.1 0.1 0.0 0.0 9.2 9.4 -94.3 -13.3 1.0
Electronics 3.1 0.0 1.3 1.9 0.0 1.2 7.5 -78.0 12.2 0.8
Trade, transport, storage & comm. 31.6 4.2 62.5 5.6 0.3 162.1 266.3 124.3 73.8 28.1
Construction 15.1 2.4 0.7 0.5 0.7 12.5 32.0 -85.2 82.0 3.4
Power 0.2 -22.3 0.0 2.0 0.0 5.9 -14.2 -68.4 -143.4 -1.5
Financial business 6.7 41.0 -1.3 1.8 199.0 -5.0 242.1 -55.6 16.6 25.5
Others 16.6 4.8 4.3 3.3 0.3 31.9 61.4 -103.9 18.5 6.5
Total 238.4 64.9 134.6 15.1 205.3 291.1 949.4 -64.6 19.0 100.0
Economic Growth, Savings and Investment
45
Box 2.7: Regulatory Hurdles and Businesses33 A conducive business environment is an obvious pre-requisite for any country’s ability to attract investment, and indeed to its relative competitiveness in the global markets. However, the term ‘conducive environment’ is a catch phrase that incorporates a number of different elements, including amongst others tax policy, profitability, market size, security, governance, macroeconomic and political stability, consistent policy scenario, accounting standards, etc. Thus, efforts to assess the relative standing of countries in specific elements provide valuable insights for policy makers, as evident from the WB report “Doing Business in 2004: Understanding Regulations”, that attempts to compare the regulatory environment across countries. Some insights from the report are presented here for Pakistan and key countries from ASEAN and South Asia. • Starting a business in Pakistan requires only 22 days (the lowest in the sample), with India at the bottom with 65 days.
However, businessmen have to go through the highest number of procedures in China and Pakistan and the least in Bangladesh. The cost of starting a new business requires less than US$ 200 in Pakistan, Sri Lanka, China and Thailand, while it is US$ 272, US$ 309 and US$ 960 in Bangladesh, India, and Malaysia respectively. This area offers Pakistan an opportunity for quick improvement. The availability of a true one-window operation would help significantly cut down the number of procedures and costs for start-ups.
• Similarly, Pakistan ranked second for the availability of full time and part time worker (as measured through a flexibility of hiring index), with Thailand providing businesses the most flexibility. In terms of legislation related to well-being of the workers,34 India is at the top followed by Bangladesh and Pakistan. However, it is more difficult to fire a worker in China, Sri Lanka and Pakistan than in Malaysia or India. The overall employment law index suggests that Pakistan’s labor market is subject to rigid regulations, ranked at second worst after Thailand in the sample, while the Malaysian economy offers the least protection to labor. There does not appear to be any easy solution to this problem, as the introduction of legislation to increase labor market flexibility is likely to prove controversial. Nonetheless, international experience does indicate that very rigid labor laws increase inefficiency and reduce productivity in an economy.
• Businesses have to face about 30 legal procedures to enforce contract procedures in Pakistan, the highest amongst the selected countries. It also requires substantially more time and cost for a settlement in Pakistan. Enforcement of contract is the quickest in China, with relatively lower cost. However, procedural complexity index in aggregate suggests that the more complicated procedures exist in South Asian countries (Sri Lanka, India & Pakistan). Efforts towards judicial reforms, etc. are in progress in Pakistan.
• Credit market failures are a major cause of low investment in a country even when profitable business opportunities
are available. Thus the report assesses whether the rules of public registry are formed in way to support credit transactions, through a public registry index. China ranks highest in the sample with the index value of 159 indicating an extremely conducive environment for credit transactions. India, Sri Lanka and Thailand register zeros. All sample countries other than Bangladesh had functional private credit information bureaus. Pakistan has the lowest score in the index for creditor’s rights.35 This area is expected to see significant improvement as the financial sector reforms take root. The efforts to extend the coverage of the existing credit information bureau to cover all loans by financial institutions as well as the increase in financial intermediation should significantly improve Pakistan’s standing.
• Insolvency laws are very important in ensuring that the most efficient firms remain in business and weaker entities
have orderly exit processes. In almost all selected countries insolvency takes less than three years, except India where it takes more than 11 years, while no legal process exists in Bangladesh. Interestingly, goals of the insolvency index shows that the insolvency system functional in Pakistan is the best amongst the sample countries. A related
33 This box is based on World Bank’s publication Doing Business in 2004: Understanding Regulations. 34 Condition of employment index covers: working time requirements, number of hours in a normal workweek, premium for overtime work, restrictions on weekly holidays, mandatory payment for nonworking days and minimum wage legislation. 35 This indicator explains the rights of a secured creditor during the process of liquidation and reorganization of a business: (a) Restrictions on entering reorganization: whether there are restrictions, such as creditor consent, when a debtor files for reorganization—as opposed to cases where debtors can seek unilateral protection from creditors’ claims by filing for reorganization. (b) No automatic stay: whether secured creditors are able to seize their collateral after the decision for reorganization is approved, in other words whether there is no “automatic stay” or “asset freeze” imposed by the court. (c) Secured creditors are paid first: whether secured creditors are paid first out of the proceeds from liquidating a bankrupt firm, as opposed to other parties such as government (e.g., for taxes) or workers. (d) Management does not stay in reorganization: Whether an administrator is responsible for management of the business during the resolution of reorganization, instead of having the management of the bankrupt debtor continue to run the business.
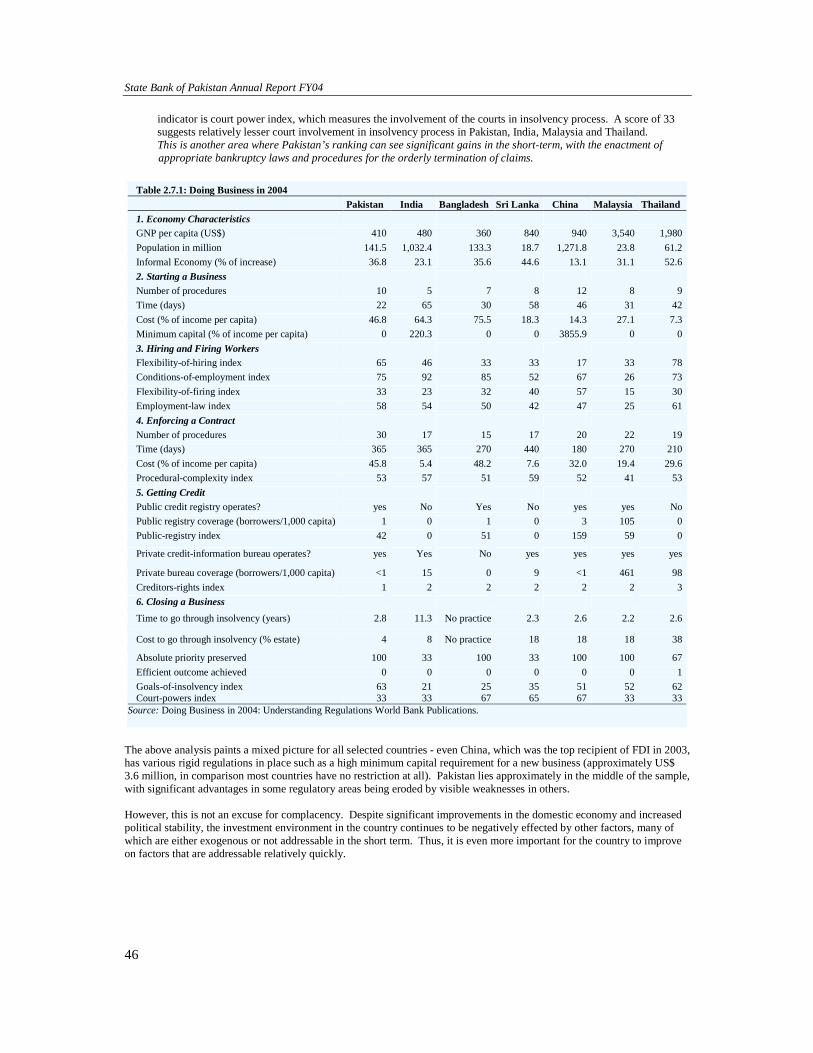
State Bank of Pakistan Annual Report FY04
46
indicator is court power index, which measures the involvement of the courts in insolvency process. A score of 33 suggests relatively lesser court involvement in insolvency process in Pakistan, India, Malaysia and Thailand. This is another area where Pakistan’s ranking can see significant gains in the short-term, with the enactment of appropriate bankruptcy laws and procedures for the orderly termination of claims.
The above analysis paints a mixed picture for all selected countries - even China, which was the top recipient of FDI in 2003, has various rigid regulations in place such as a high minimum capital requirement for a new business (approximately US$ 3.6 million, in comparison most countries have no restriction at all). Pakistan lies approximately in the middle of the sample, with significant advantages in some regulatory areas being eroded by visible weaknesses in others. However, this is not an excuse for complacency. Despite significant improvements in the domestic economy and increased political stability, the investment environment in the country continues to be negatively effected by other factors, many of which are either exogenous or not addressable in the short term. Thus, it is even more important for the country to improve on factors that are addressable relatively quickly.
Table 2.7.1: Doing Business in 2004 Pakistan India Bangladesh Sri Lanka China Malaysia Thailand 1. Economy Characteristics GNP per capita (US$) 410 480 360 840 940 3,540 1,980Population in million 141.5 1,032.4 133.3 18.7 1,271.8 23.8 61.2Informal Economy (% of increase) 36.8 23.1 35.6 44.6 13.1 31.1 52.62. Starting a Business Number of procedures 10 5 7 8 12 8 9Time (days) 22 65 30 58 46 31 42Cost (% of income per capita) 46.8 64.3 75.5 18.3 14.3 27.1 7.3Minimum capital (% of income per capita) 0 220.3 0 0 3855.9 0 03. Hiring and Firing Workers Flexibility-of-hiring index 65 46 33 33 17 33 78Conditions-of-employment index 75 92 85 52 67 26 73Flexibility-of-firing index 33 23 32 40 57 15 30Employment-law index 58 54 50 42 47 25 614. Enforcing a Contract Number of procedures 30 17 15 17 20 22 19Time (days) 365 365 270 440 180 270 210Cost (% of income per capita) 45.8 5.4 48.2 7.6 32.0 19.4 29.6Procedural-complexity index 53 57 51 59 52 41 535. Getting Credit Public credit registry operates? yes No Yes No yes yes NoPublic registry coverage (borrowers/1,000 capita) 1 0 1 0 3 105 0Public-registry index 42 0 51 0 159 59 0
Private credit-information bureau operates? yes Yes No yes yes yes yes
Private bureau coverage (borrowers/1,000 capita) <1 15 0 9 <1 461 98Creditors-rights index 1 2 2 2 2 2 36. Closing a Business
Time to go through insolvency (years) 2.8 11.3 No practice 2.3 2.6 2.2 2.6
Cost to go through insolvency (% estate) 4 8 No practice 18 18 18 38
Absolute priority preserved 100 33 100 33 100 100 67Efficient outcome achieved 0 0 0 0 0 0 1Goals-of-insolvency index 63 21 25 35 51 52 62Court-powers index 33 33 67 65 67 33 33
Source: Doing Business in 2004: Understanding Regulations World Bank Publications.
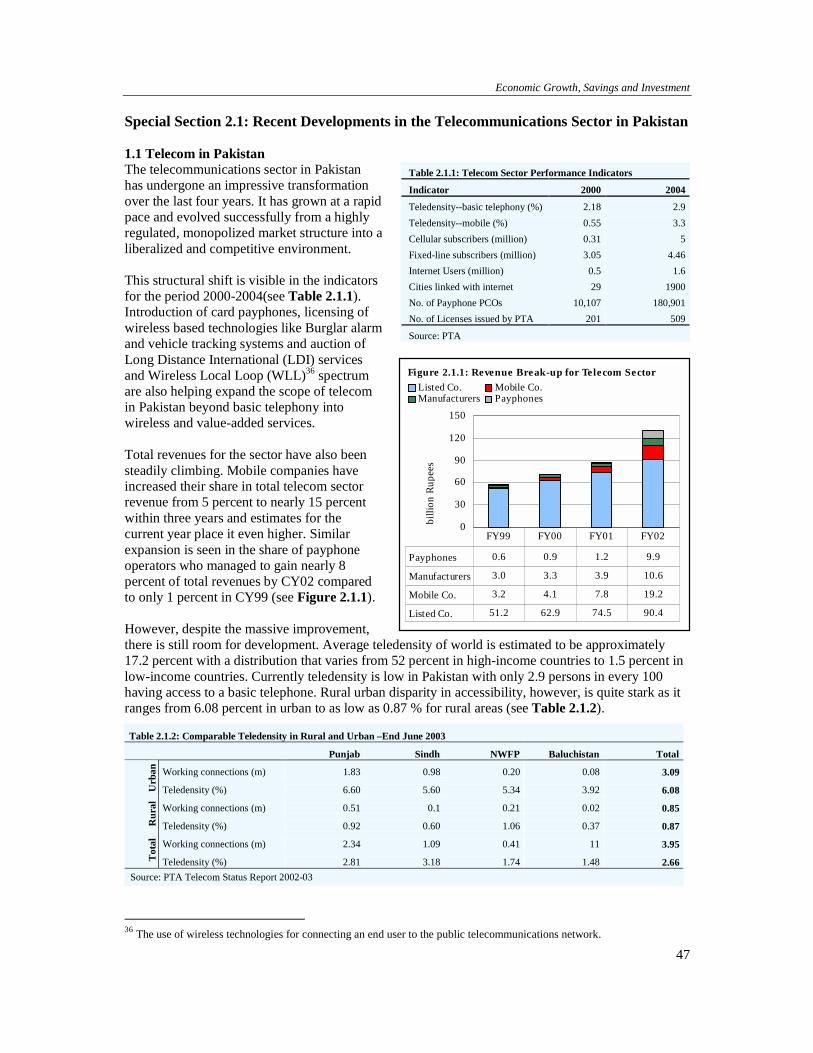
Economic Growth, Savings and Investment
47
Special Section 2.1: Recent Developments in the Telecommunications Sector in Pakistan 1.1 Telecom in Pakistan The telecommunications sector in Pakistan has undergone an impressive transformation over the last four years. It has grown at a rapid pace and evolved successfully from a highly regulated, monopolized market structure into a liberalized and competitive environment. This structural shift is visible in the indicators for the period 2000-2004(see Table 2.1.1). Introduction of card payphones, licensing of wireless based technologies like Burglar alarm and vehicle tracking systems and auction of Long Distance International (LDI) services and Wireless Local Loop (WLL)36 spectrum are also helping expand the scope of telecom in Pakistan beyond basic telephony into wireless and value-added services. Total revenues for the sector have also been steadily climbing. Mobile companies have increased their share in total telecom sector revenue from 5 percent to nearly 15 percent within three years and estimates for the current year place it even higher. Similar expansion is seen in the share of payphone operators who managed to gain nearly 8 percent of total revenues by CY02 compared to only 1 percent in CY99 (see Figure 2.1.1). However, despite the massive improvement, there is still room for development. Average teledensity of world is estimated to be approximately 17.2 percent with a distribution that varies from 52 percent in high-income countries to 1.5 percent in low-income countries. Currently teledensity is low in Pakistan with only 2.9 persons in every 100 having access to a basic telephone. Rural urban disparity in accessibility, however, is quite stark as it ranges from 6.08 percent in urban to as low as 0.87 % for rural areas (see Table 2.1.2).
36 The use of wireless technologies for connecting an end user to the public telecommunications network.
Table 2.1.1: Telecom Sector Performance Indicators
Indicator 2000 2004
Teledensity--basic telephony (%) 2.18 2.9Teledensity--mobile (%) 0.55 3.3Cellular subscribers (million) 0.31 5Fixed-line subscribers (million) 3.05 4.46Internet Users (million) 0.5 1.6Cities linked with internet 29 1900No. of Payphone PCOs 10,107 180,901No. of Licenses issued by PTA 201 509
Source: PTA
Table 2.1.2: Comparable Teledensity in Rural and Urban –End June 2003
Punjab Sindh NWFP Baluchistan Total
Working connections (m) 1.83 0.98 0.20 0.08 3.09
Urb
an
Teledensity (%) 6.60 5.60 5.34 3.92 6.08
Working connections (m) 0.51 0.1 0.21 0.02 0.85
Rur
al
Teledensity (%) 0.92 0.60 1.06 0.37 0.87
Working connections (m) 2.34 1.09 0.41 11 3.95
Tot
al
Teledensity (%) 2.81 3.18 1.74 1.48 2.66Source: PTA Telecom Status Report 2002-03
0
30
60
90
120
150bi
llion
Rup
ees
Listed Co. Mobile Co.Manufacturers Payphones
Payphones 0.6 0.9 1.2 9.9
Manufacturers 3.0 3.3 3.9 10.6
Mobile Co. 3.2 4.1 7.8 19.2
Listed Co. 51.2 62.9 74.5 90.4
FY99 FY00 FY01 FY02
Figure 2.1.1: Revenue Break-up for Telecom Sector
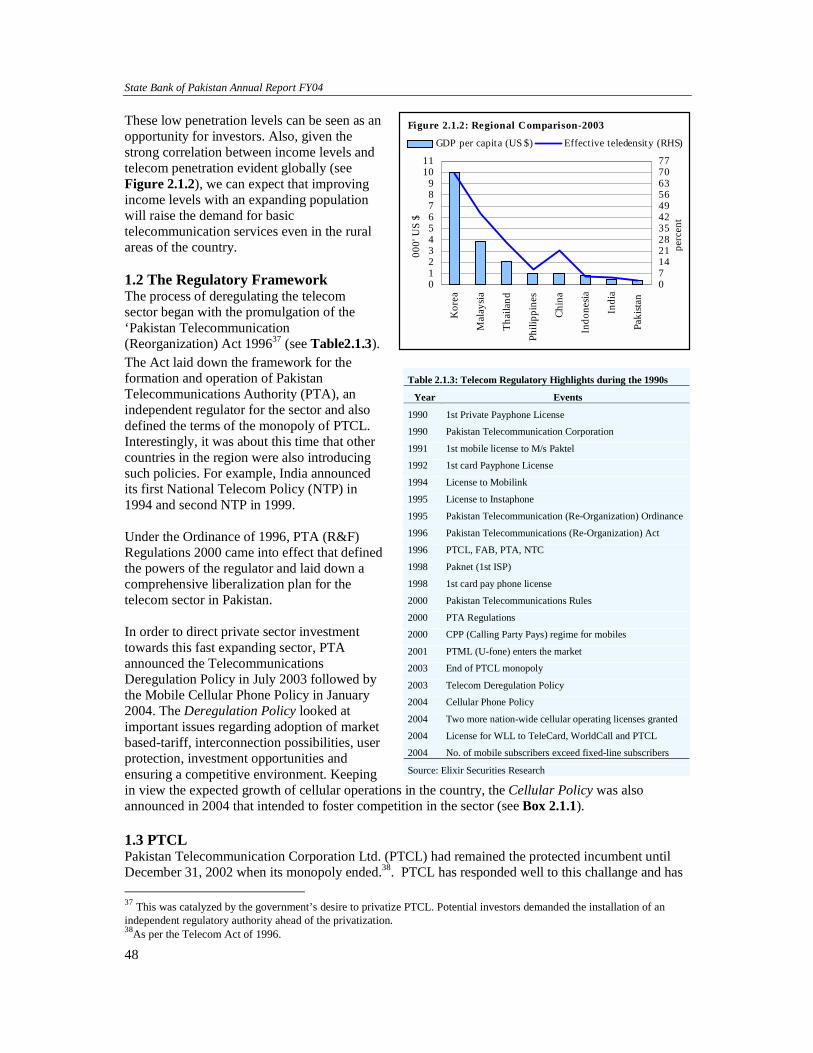
State Bank of Pakistan Annual Report FY04
48
These low penetration levels can be seen as an opportunity for investors. Also, given the strong correlation between income levels and telecom penetration evident globally (see Figure 2.1.2), we can expect that improving income levels with an expanding population will raise the demand for basic telecommunication services even in the rural areas of the country. 1.2 The Regulatory Framework The process of deregulating the telecom sector began with the promulgation of the ‘Pakistan Telecommunication (Reorganization) Act 199637 (see Table2.1.3). The Act laid down the framework for the formation and operation of Pakistan Telecommunications Authority (PTA), an independent regulator for the sector and also defined the terms of the monopoly of PTCL. Interestingly, it was about this time that other countries in the region were also introducing such policies. For example, India announced its first National Telecom Policy (NTP) in 1994 and second NTP in 1999. Under the Ordinance of 1996, PTA (R&F) Regulations 2000 came into effect that defined the powers of the regulator and laid down a comprehensive liberalization plan for the telecom sector in Pakistan. In order to direct private sector investment towards this fast expanding sector, PTA announced the Telecommunications Deregulation Policy in July 2003 followed by the Mobile Cellular Phone Policy in January 2004. The Deregulation Policy looked at important issues regarding adoption of market based-tariff, interconnection possibilities, user protection, investment opportunities and ensuring a competitive environment. Keeping in view the expected growth of cellular operations in the country, the Cellular Policy was also announced in 2004 that intended to foster competition in the sector (see Box 2.1.1). 1.3 PTCL Pakistan Telecommunication Corporation Ltd. (PTCL) had remained the protected incumbent until December 31, 2002 when its monopoly ended.38. PTCL has responded well to this challange and has 37 This was catalyzed by the government’s desire to privatize PTCL. Potential investors demanded the installation of an independent regulatory authority ahead of the privatization. 38As per the Telecom Act of 1996.
Table 2.1.3: Telecom Regulatory Highlights during the 1990s
Year Events
1990 1st Private Payphone License
1990 Pakistan Telecommunication Corporation
1991 1st mobile license to M/s Paktel
1992 1st card Payphone License
1994 License to Mobilink
1995 License to Instaphone
1995 Pakistan Telecommunication (Re-Organization) Ordinance
1996 Pakistan Telecommunications (Re-Organization) Act
1996 PTCL, FAB, PTA, NTC
1998 Paknet (1st ISP)
1998 1st card pay phone license
2000 Pakistan Telecommunications Rules
2000 PTA Regulations
2000 CPP (Calling Party Pays) regime for mobiles
2001 PTML (U-fone) enters the market
2003 End of PTCL monopoly
2003 Telecom Deregulation Policy
2004 Cellular Phone Policy
2004 Two more nation-wide cellular operating licenses granted
2004 License for WLL to TeleCard, WorldCall and PTCL
2004 No. of mobile subscribers exceed fixed-line subscribers
Source: Elixir Securities Research
0123456789
1011
Kor
ea
Mal
aysia
Thai
land
Phili
ppin
es
Chin
a
Indo
nesia
Indi
a
Paki
stan
000'
US
$
0714212835424956637077
perc
ent
GDP per capita (US $) Effective teledensity (RHS)
Figure 2.1.2: Regional Comparison-2003
Economic Growth, Savings and Investment
49
improved its profitability in the post-2000 era despite a significant reduction in its tariffs during the same period. The telecom giant posted a profit after tax of Rs. 29.2 billion for FY04--an improvement of 26.4 percent over the last year. Such outstanding performance was largely due to growth in voice traffic, tightening of expenses and lower financing costs.
In order to maintain its edge in the basic telephony market, PTCL is pursuing an aggressive growth strategy. It has cut domestic call charges by over 15 percent, international call charges by 23 percent and line rent by 33 percent while expanding its installed capacity by over 12 percent in 2003. It has simultaneously increased its aggregate fixed-line customer base to over 4.4 million (see Table 2.1.4), nearly doubling it from the 2.6 million in 1997.
Box 2.1.1: The Telecom Deregulation Policy & Cellular Policy Highlights of the Deregulation Policy include:
• Licenses for fixed-line operators would include two types i.e. Local Loop (LL) and Long-Distance and International (LDI) for a period of 20 years. Both markets will be unrestricted and open.
• LDI licensees are obliged to share the financial premium over costs on net incoming international traffic through the “Access Promotion Contribution” to promote infrastructure expansion.
• Both type of licensees have the right to inter-connection, leased lines and co-location from incumbents with prices based on international benchmarks.
• Licensees who do not hold Significant Market Power (SMP) will not be subject to tariff regulation by PTA. • Universal Service Fund (USF) will be established under the universal service policy of the government. • The policy is valid for five years and subject to review subsequently.
The road map outlined by the Cellular Policy includes:
• New national technology-neutral cellular operations licenses for a 15 year period. Each company will be required to submit a performance bond worth US$ 15m for new entrants for the first year to ensure compliance with roll out obligations, which include at least 70 percent of tehsil headquarters in four years with a minimum of 10% in each province).
• The mobile cellular spectrum will be auctioned in blocks according to recognized international standards. �• Mobile operators will be eligible for LDI and WLL licenses. • Mobile and fixed line licensees who emerge with Significant Market Power (SMP) shall be prohibited from
abusing their dominant positions through anticompetitive conduct. • Licensees are encouraged to implement infrastructure sharing in accordance with the guidelines issued by
PTA and FAB and have the right to interconnect. • PTA will immediately undertake a consultation process on the implementation of Mobile Number Portability
with the aim to implement number portability within two years of policy notification (see Box 2.1.2).
0
1
2
3
4
5
FY01 FY02 FY03 FY04
billi
on m
inut
es
8
10
12
14
16
18
billi
on R
s
Total minutes Total revenue(RHS)
NWD Calls
0
4
8
12
16
20
24
FY01 FY02 FY03 FY04
billi
on m
inut
es
12
13
14
15
16
17
18
billi
on R
s
Local Calls
Figure 2.1.3: Trends in PTCL Revenues & Call Minutes
State Bank of Pakistan Annual Report FY04
50
PTCL’s strategy of cutting tariffs in order to take advantage of price elasticities in the sector has resulted in higher volumes of calls as well as higher revenues (see Figure 2.1.3). Similar trends are also visible in revenues from line rent and installation fees. PTCL has also acquired Wireless Local Loop (WLL) spectrum license in order to remain competitive in the fast emerging wireless market.
1.4. Cellular Industry Major take-off in the cellular market was observed in the post-2001 period when the Calling Party Pays (CPP) regime was introduced and a new company entered the market. Within a short span of four years, the number of cellular subscribers jumped from only 0.3 million in FY01 to 5 million by FY04, growing at an average rate of nearly 105 percent per year. Such impressive growth has resulted in the number of mobile subscribers exceeding the fixed-line subscribers in Pakistan by end of FY04 (see Figure 2.1.4). Mobile companies currently operating in the market have shown an upward trend in earnings despite a reduction in their tariffs39 due to a rapidly expanding subscriber base. However, most of this expansion in subscribers is accredited to Mobilink and U-fone (see Figure 2.1.5). Interestingly both of these operate on GSM technology unlike Instaphone and Paktel that make use of AMPS-based technology. With nearly 62 percent and 21 percent shares respectively, in total cellular subscriber base (see Figure 2.1.6), Mobilink and U-fone are currently acting as market leaders. However, the arrival of two new companies40 with similar GSM technology will spur competition and force the existing companies to decrease tariffs further along with improving the quality of their services. Declining prices for mobile sets in secondary markets may also be a contributor towards increasing affordability. This combined with lower tariffs could have led to such impressive expansion in cellular subscribers.
39 Reduced connection fee and recently reduced roaming charges. 40 Norwegian firm Telenor and Dubai-backed Al-Warid Group have been granted nation-wide mobile operations licenses.
Table 2.1.4: PTCL Network Growth Jan 04 June 04
Installed capacity (ALI) 5,020,655 5,273,091
Working connections (ALIS) 4,171,633 4,460,957Total exchanges 2,888 2,962Pending demand 277,011 274,672Telephone density per 100 population 2.7 3Transit exchanges 36 36Digital switch boards i) Positions 347 150 ii) Stations 25 10Countries on ISD 242 242Customer services centers 153 154Telegraph offices 296 288Card pay phones 156,452 180,901ED PCO's 218 197Long distance VHF PCO's 3,252 3,178
NWD stations 2,044 2,092UIA stations 1,898Optical Fiber Links Total length of main optical fiber link 4,591 KM 4,591 KM
Optical fiber short haul links 117 KM 127.2 KMOptical fiber spur links 2,688 KM 3,241 KM
Source: PTCL
0
1
2
3
4
5
6
FY94
FY95
FY96
FY97
FY98
FY99
FY00
FY01
FY02
FY03
FY04
mill
ion
num
bers
Fixed line subscribers Cellular subscribersFigure 2.1.4: Subscriber Trends
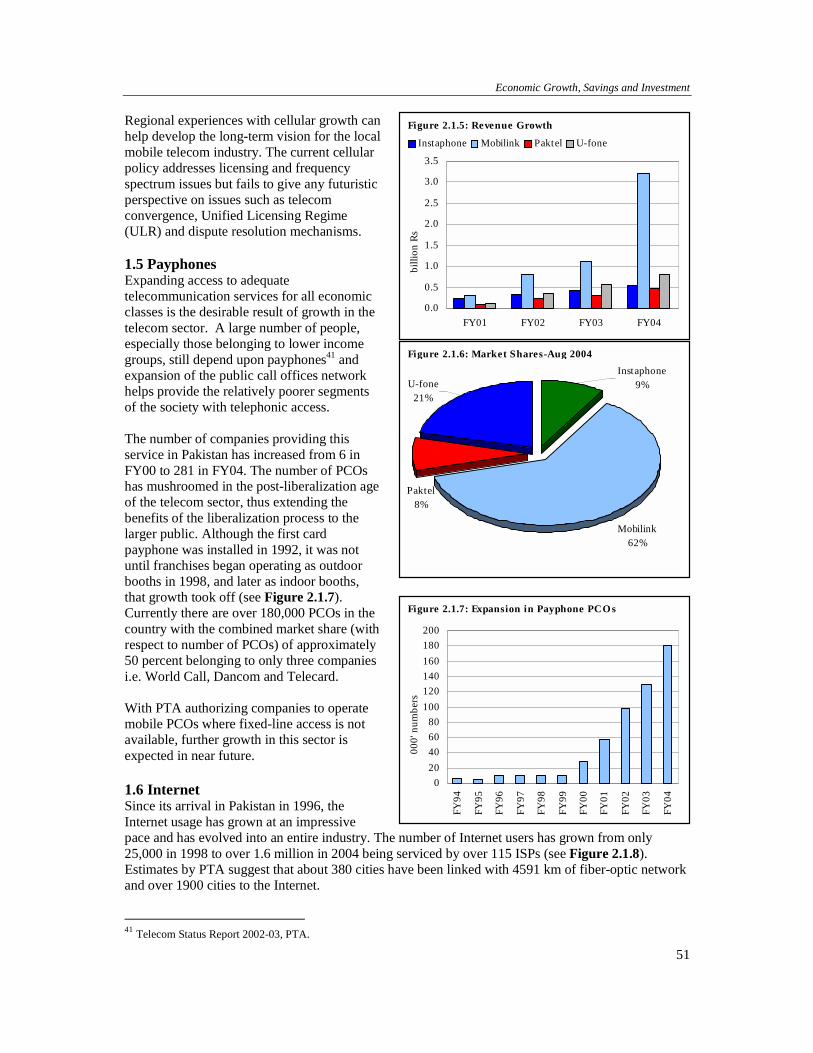
Economic Growth, Savings and Investment
51
Regional experiences with cellular growth can help develop the long-term vision for the local mobile telecom industry. The current cellular policy addresses licensing and frequency spectrum issues but fails to give any futuristic perspective on issues such as telecom convergence, Unified Licensing Regime (ULR) and dispute resolution mechanisms. 1.5 Payphones Expanding access to adequate telecommunication services for all economic classes is the desirable result of growth in the telecom sector. A large number of people, especially those belonging to lower income groups, still depend upon payphones41 and expansion of the public call offices network helps provide the relatively poorer segments of the society with telephonic access. The number of companies providing this service in Pakistan has increased from 6 in FY00 to 281 in FY04. The number of PCOs has mushroomed in the post-liberalization age of the telecom sector, thus extending the benefits of the liberalization process to the larger public. Although the first card payphone was installed in 1992, it was not until franchises began operating as outdoor booths in 1998, and later as indoor booths, that growth took off (see Figure 2.1.7). Currently there are over 180,000 PCOs in the country with the combined market share (with respect to number of PCOs) of approximately 50 percent belonging to only three companies i.e. World Call, Dancom and Telecard. With PTA authorizing companies to operate mobile PCOs where fixed-line access is not available, further growth in this sector is expected in near future. 1.6 Internet Since its arrival in Pakistan in 1996, the Internet usage has grown at an impressive pace and has evolved into an entire industry. The number of Internet users has grown from only 25,000 in 1998 to over 1.6 million in 2004 being serviced by over 115 ISPs (see Figure 2.1.8). Estimates by PTA suggest that about 380 cities have been linked with 4591 km of fiber-optic network and over 1900 cities to the Internet.
41 Telecom Status Report 2002-03, PTA.
0.0
0.5
1.0
1.5
2.0
2.5
3.0
3.5
FY01 FY02 FY03 FY04
billi
on R
s
Instaphone Mobilink Paktel U-fone
Figure 2.1.5: Revenue Growth
020406080
100120140160180200
FY94
FY95
FY96
FY97
FY98
FY99
FY00
FY01
FY02
FY03
FY04
000'
num
bers
Figure 2.1.7: Expansion in Payphone PCOs
Mobilink62%
U-fone21%
Instaphone9%
Paktel8%
Figure 2.1.6: Market Shares-Aug 2004
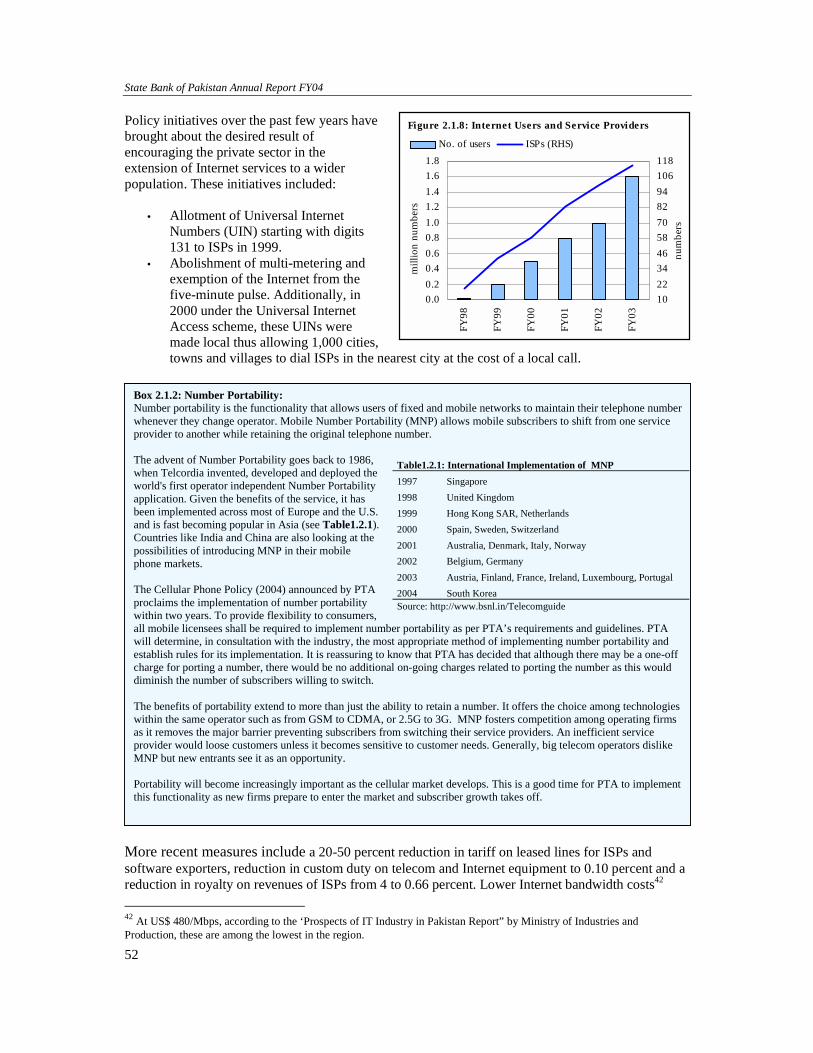
State Bank of Pakistan Annual Report FY04
52
Policy initiatives over the past few years have brought about the desired result of encouraging the private sector in the extension of Internet services to a wider population. These initiatives included:
• Allotment of Universal Internet Numbers (UIN) starting with digits 131 to ISPs in 1999.
• Abolishment of multi-metering and exemption of the Internet from the five-minute pulse. Additionally, in 2000 under the Universal Internet Access scheme, these UINs were made local thus allowing 1,000 cities, towns and villages to dial ISPs in the nearest city at the cost of a local call.
More recent measures include a 20-50 percent reduction in tariff on leased lines for ISPs and software exporters, reduction in custom duty on telecom and Internet equipment to 0.10 percent and a reduction in royalty on revenues of ISPs from 4 to 0.66 percent. Lower Internet bandwidth costs42 42 At US$ 480/Mbps, according to the ‘Prospects of IT Industry in Pakistan Report” by Ministry of Industries and Production, these are among the lowest in the region.
0.00.20.40.60.81.01.21.41.61.8
FY98
FY99
FY00
FY01
FY02
FY03
mill
ion
num
bers
1022344658708294106118
num
bers
No. of users ISPs (RHS)
Figure 2.1.8: Internet Users and Service Providers
Box 2.1.2: Number Portability: Number portability is the functionality that allows users of fixed and mobile networks to maintain their telephone number whenever they change operator. Mobile Number Portability (MNP) allows mobile subscribers to shift from one service provider to another while retaining the original telephone number. The advent of Number Portability goes back to 1986, when Telcordia invented, developed and deployed the world's first operator independent Number Portability application. Given the benefits of the service, it has been implemented across most of Europe and the U.S. and is fast becoming popular in Asia (see Table1.2.1). Countries like India and China are also looking at the possibilities of introducing MNP in their mobile phone markets. The Cellular Phone Policy (2004) announced by PTA proclaims the implementation of number portability within two years. To provide flexibility to consumers, all mobile licensees shall be required to implement number portability as per PTA’s requirements and guidelines. PTA will determine, in consultation with the industry, the most appropriate method of implementing number portability and establish rules for its implementation. It is reassuring to know that PTA has decided that although there may be a one-off charge for porting a number, there would be no additional on-going charges related to porting the number as this would diminish the number of subscribers willing to switch. The benefits of portability extend to more than just the ability to retain a number. It offers the choice among technologies within the same operator such as from GSM to CDMA, or 2.5G to 3G. MNP fosters competition among operating firms as it removes the major barrier preventing subscribers from switching their service providers. An inefficient service provider would loose customers unless it becomes sensitive to customer needs. Generally, big telecom operators dislike MNP but new entrants see it as an opportunity. Portability will become increasingly important as the cellular market develops. This is a good time for PTA to implement this functionality as new firms prepare to enter the market and subscriber growth takes off.
Table1.2.1: International Implementation of MNP 1997 Singapore 1998 United Kingdom 1999 Hong Kong SAR, Netherlands 2000 Spain, Sweden, Switzerland 2001 Australia, Denmark, Italy, Norway 2002 Belgium, Germany 2003 Austria, Finland, France, Ireland, Luxembourg, Portugal 2004 South Korea Source: http://www.bsnl.in/Telecomguide
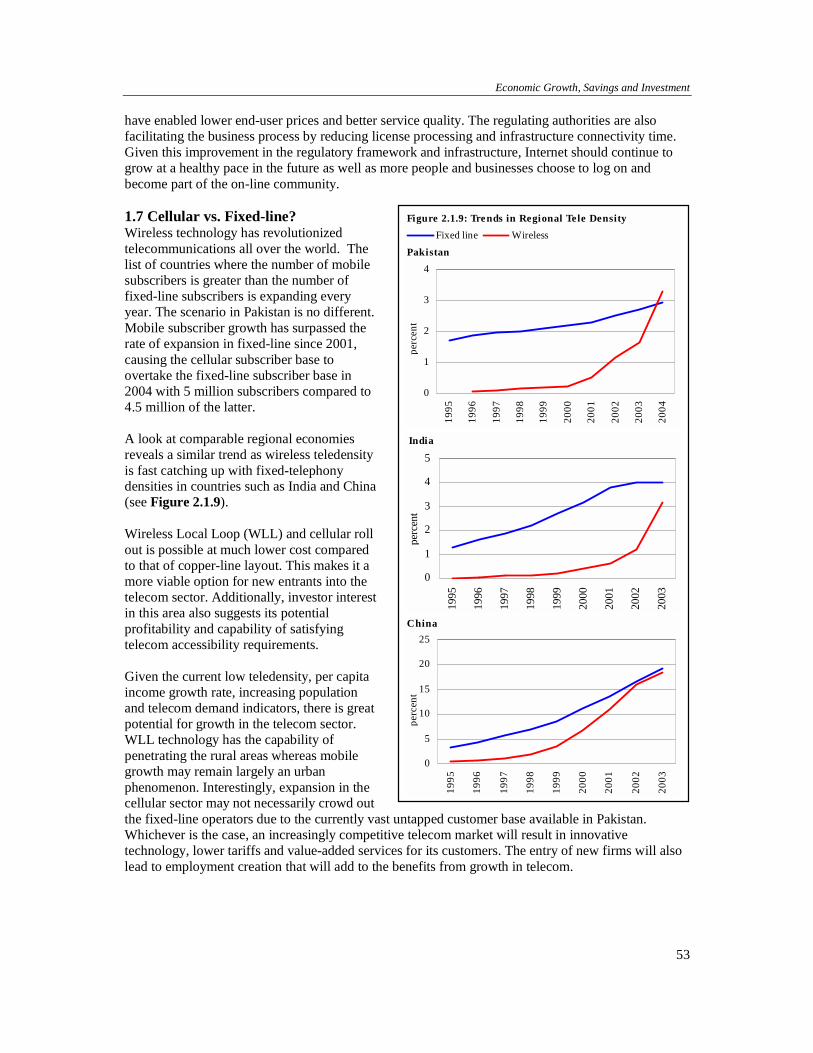
Economic Growth, Savings and Investment
53
have enabled lower end-user prices and better service quality. The regulating authorities are also facilitating the business process by reducing license processing and infrastructure connectivity time. Given this improvement in the regulatory framework and infrastructure, Internet should continue to grow at a healthy pace in the future as well as more people and businesses choose to log on and become part of the on-line community. 1.7 Cellular vs. Fixed-line? Wireless technology has revolutionized telecommunications all over the world. The list of countries where the number of mobile subscribers is greater than the number of fixed-line subscribers is expanding every year. The scenario in Pakistan is no different. Mobile subscriber growth has surpassed the rate of expansion in fixed-line since 2001, causing the cellular subscriber base to overtake the fixed-line subscriber base in 2004 with 5 million subscribers compared to 4.5 million of the latter. A look at comparable regional economies reveals a similar trend as wireless teledensity is fast catching up with fixed-telephony densities in countries such as India and China (see Figure 2.1.9). Wireless Local Loop (WLL) and cellular roll out is possible at much lower cost compared to that of copper-line layout. This makes it a more viable option for new entrants into the telecom sector. Additionally, investor interest in this area also suggests its potential profitability and capability of satisfying telecom accessibility requirements.
Given the current low teledensity, per capita income growth rate, increasing population and telecom demand indicators, there is great potential for growth in the telecom sector. WLL technology has the capability of penetrating the rural areas whereas mobile growth may remain largely an urban phenomenon. Interestingly, expansion in the cellular sector may not necessarily crowd out the fixed-line operators due to the currently vast untapped customer base available in Pakistan. Whichever is the case, an increasingly competitive telecom market will result in innovative technology, lower tariffs and value-added services for its customers. The entry of new firms will also lead to employment creation that will add to the benefits from growth in telecom.
0
1
2
3
4
1995
1996
1997
1998
1999
2000
2001
2002
2003
2004
perc
ent
Fixed line Wireless
Pakistan
Figure 2.1.9: Trends in Regional Tele Density
0
1
2
3
4
519
95
1996
1997
1998
1999
2000
2001
2002
2003
perc
ent
India
0
5
10
15
20
25
1995
1996
1997
1998
1999
2000
2001
2002
2003
perc
ent
China
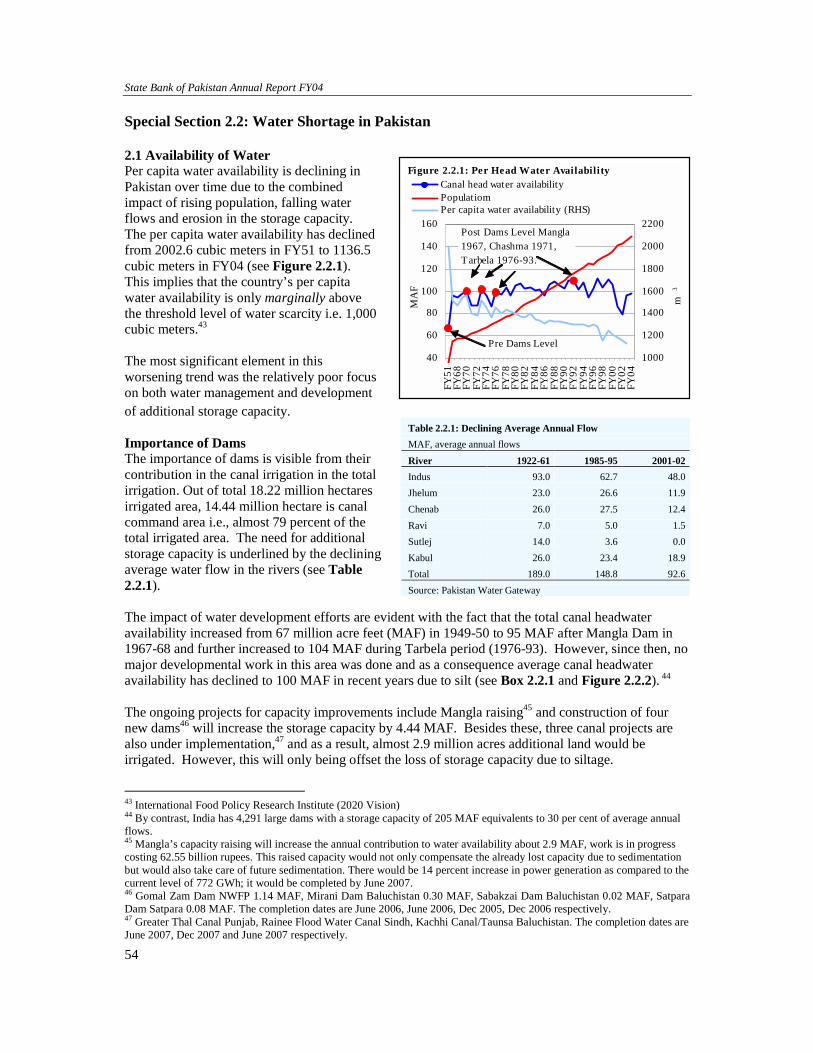
State Bank of Pakistan Annual Report FY04
54
Special Section 2.2: Water Shortage in Pakistan 2.1 Availability of Water Per capita water availability is declining in Pakistan over time due to the combined impact of rising population, falling water flows and erosion in the storage capacity. The per capita water availability has declined from 2002.6 cubic meters in FY51 to 1136.5 cubic meters in FY04 (see Figure 2.2.1). This implies that the country’s per capita water availability is only marginally above the threshold level of water scarcity i.e. 1,000 cubic meters.43 The most significant element in this worsening trend was the relatively poor focus on both water management and development of additional storage capacity. Importance of Dams The importance of dams is visible from their contribution in the canal irrigation in the total irrigation. Out of total 18.22 million hectares irrigated area, 14.44 million hectare is canal command area i.e., almost 79 percent of the total irrigated area. The need for additional storage capacity is underlined by the declining average water flow in the rivers (see Table 2.2.1). The impact of water development efforts are evident with the fact that the total canal headwater availability increased from 67 million acre feet (MAF) in 1949-50 to 95 MAF after Mangla Dam in 1967-68 and further increased to 104 MAF during Tarbela period (1976-93). However, since then, no major developmental work in this area was done and as a consequence average canal headwater availability has declined to 100 MAF in recent years due to silt (see Box 2.2.1 and Figure 2.2.2). 44 The ongoing projects for capacity improvements include Mangla raising45 and construction of four new dams46 will increase the storage capacity by 4.44 MAF. Besides these, three canal projects are also under implementation,47 and as a result, almost 2.9 million acres additional land would be irrigated. However, this will only being offset the loss of storage capacity due to siltage.
43 International Food Policy Research Institute (2020 Vision) 44 By contrast, India has 4,291 large dams with a storage capacity of 205 MAF equivalents to 30 per cent of average annual flows. 45 Mangla’s capacity raising will increase the annual contribution to water availability about 2.9 MAF, work is in progress costing 62.55 billion rupees. This raised capacity would not only compensate the already lost capacity due to sedimentation but would also take care of future sedimentation. There would be 14 percent increase in power generation as compared to the current level of 772 GWh; it would be completed by June 2007. 46 Gomal Zam Dam NWFP 1.14 MAF, Mirani Dam Baluchistan 0.30 MAF, Sabakzai Dam Baluchistan 0.02 MAF, Satpara Dam Satpara 0.08 MAF. The completion dates are June 2006, June 2006, Dec 2005, Dec 2006 respectively. 47 Greater Thal Canal Punjab, Rainee Flood Water Canal Sindh, Kachhi Canal/Taunsa Baluchistan. The completion dates are June 2007, Dec 2007 and June 2007 respectively.
Table 2.2.1: Declining Average Annual Flow MAF, average annual flows
River 1922-61 1985-95 2001-02Indus 93.0 62.7 48.0Jhelum 23.0 26.6 11.9Chenab 26.0 27.5 12.4Ravi 7.0 5.0 1.5Sutlej 14.0 3.6 0.0Kabul 26.0 23.4 18.9Total 189.0 148.8 92.6Source: Pakistan Water Gateway
40
60
80
100
120
140
160
FY51
FY68
FY70
FY72
FY74
FY76
FY78
FY80
FY82
FY84
FY86
FY88
FY90
FY92
FY94
FY96
FY98
FY00
FY02
FY04
MA
F
1000
1200
1400
1600
1800
2000
2200
m3
Canal head water availability Populatiom Per capita water availability (RHS)
Pre Dams Level
Post Dams Level Mangla 1967, Chashma 1971, Tarbela 1976-93.
Figure 2.2.1: Per Head Water Availability
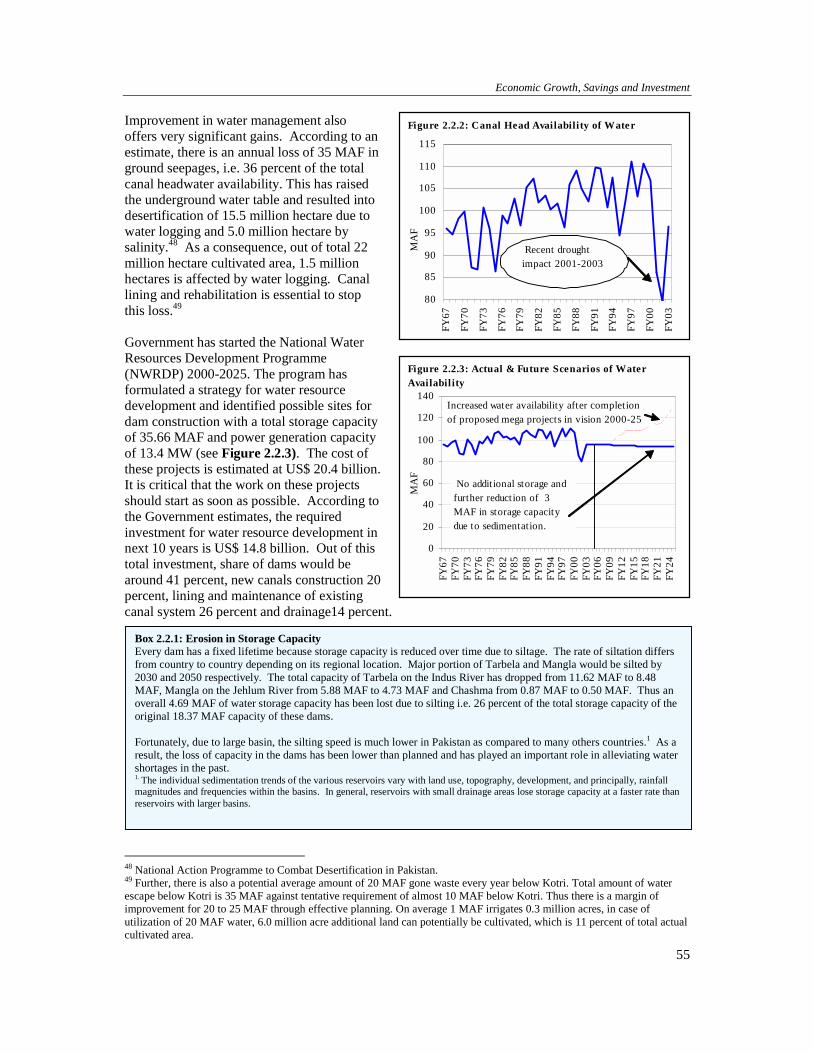
Economic Growth, Savings and Investment
55
Box 2.2.1: Erosion in Storage Capacity Every dam has a fixed lifetime because storage capacity is reduced over time due to siltage. The rate of siltation differs from country to country depending on its regional location. Major portion of Tarbela and Mangla would be silted by 2030 and 2050 respectively. The total capacity of Tarbela on the Indus River has dropped from 11.62 MAF to 8.48 MAF, Mangla on the Jehlum River from 5.88 MAF to 4.73 MAF and Chashma from 0.87 MAF to 0.50 MAF. Thus an overall 4.69 MAF of water storage capacity has been lost due to silting i.e. 26 percent of the total storage capacity of the original 18.37 MAF capacity of these dams. Fortunately, due to large basin, the silting speed is much lower in Pakistan as compared to many others countries.1 As a result, the loss of capacity in the dams has been lower than planned and has played an important role in alleviating water shortages in the past. 1. The individual sedimentation trends of the various reservoirs vary with land use, topography, development, and principally, rainfall magnitudes and frequencies within the basins. In general, reservoirs with small drainage areas lose storage capacity at a faster rate than reservoirs with larger basins.
Improvement in water management also offers very significant gains. According to an estimate, there is an annual loss of 35 MAF in ground seepages, i.e. 36 percent of the total canal headwater availability. This has raised the underground water table and resulted into desertification of 15.5 million hectare due to water logging and 5.0 million hectare by salinity.48 As a consequence, out of total 22 million hectare cultivated area, 1.5 million hectares is affected by water logging. Canal lining and rehabilitation is essential to stop this loss.49 Government has started the National Water Resources Development Programme (NWRDP) 2000-2025. The program has formulated a strategy for water resource development and identified possible sites for dam construction with a total storage capacity of 35.66 MAF and power generation capacity of 13.4 MW (see Figure 2.2.3). The cost of these projects is estimated at US$ 20.4 billion. It is critical that the work on these projects should start as soon as possible. According to the Government estimates, the required investment for water resource development in next 10 years is US$ 14.8 billion. Out of this total investment, share of dams would be around 41 percent, new canals construction 20 percent, lining and maintenance of existing canal system 26 percent and drainage14 percent.
48 National Action Programme to Combat Desertification in Pakistan. 49 Further, there is also a potential average amount of 20 MAF gone waste every year below Kotri. Total amount of water escape below Kotri is 35 MAF against tentative requirement of almost 10 MAF below Kotri. Thus there is a margin of improvement for 20 to 25 MAF through effective planning. On average 1 MAF irrigates 0.3 million acres, in case of utilization of 20 MAF water, 6.0 million acre additional land can potentially be cultivated, which is 11 percent of total actual cultivated area.
80
85
90
95
100
105
110
115
FY67
FY70
FY73
FY76
FY79
FY82
FY85
FY88
FY91
FY94
FY97
FY00
FY03
MA
F
Figure 2.2.2: Canal Head Availability of Water
Recent drought impact 2001-2003
0
20
40
60
80
100
120
140
FY67
FY70
FY73
FY76
FY79
FY82
FY85
FY88
FY91
FY94
FY97
FY00
FY03
FY06
FY09
FY12
FY15
FY18
FY21
FY24
MA
F
Figure 2.2.3: Actual & Future Scenarios of Water Availabil ity
Increased water availability after completion of proposed mega projects in vision 2000-25
No addit ional storage and further reduction of 3 MAF in storage capacity due to sedimentation.

State Bank of Pakistan Annual Report FY04
56
This page has been intentionally left blank.
Related Documents