2D NMR Spectrum Processing with Mnova Hongjun Zhou Dept of Chem & Biochem UC Santa Barbara April 09, 2012

Welcome message from author
This document is posted to help you gain knowledge. Please leave a comment to let me know what you think about it! Share it to your friends and learn new things together.
Transcript

2D NMR Spectrum Processing with Mnova
Hongjun Zhou Dept of Chem & Biochem UC Santa Barbara
April 09, 2012
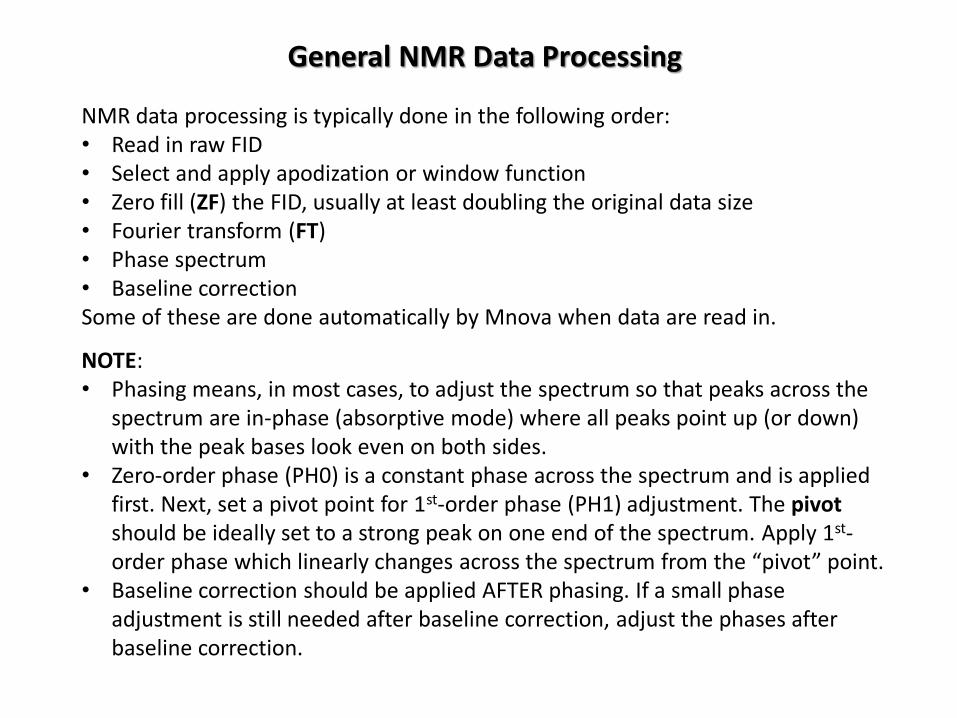
General NMR Data Processing
NMR data processing is typically done in the following order: • Read in raw FID • Select and apply apodization or window function • Zero fill (ZF) the FID, usually at least doubling the original data size • Fourier transform (FT) • Phase spectrum • Baseline correction Some of these are done automatically by Mnova when data are read in. NOTE: • Phasing means, in most cases, to adjust the spectrum so that peaks across the
spectrum are in-phase (absorptive mode) where all peaks point up (or down) with the peak bases look even on both sides.
• Zero-order phase (PH0) is a constant phase across the spectrum and is applied first. Next, set a pivot point for 1st-order phase (PH1) adjustment. The pivot should be ideally set to a strong peak on one end of the spectrum. Apply 1st-order phase which linearly changes across the spectrum from the “pivot” point.
• Baseline correction should be applied AFTER phasing. If a small phase adjustment is still needed after baseline correction, adjust the phases after baseline correction.

2D NMR Spectrum Processing with Mnova
The two dimensions in a 2D spectrum is specified as t2 or f2 (horizontal) and t1 or f1 (vertical) dimensions, respectively. t1 and t2 refer to the time-domain data; f1 and f2 refer to the frequency domain data after FT of t1 and t2 dimensions. The processing command below is often applied to f2 and f1 (or t2 and t1) separately. Select either f2 or f1 from the top menu buttons before applying the processing command. 2D spectrum should be processed in the following order: 1. Open *.fid data 2. Select appropriate window functions for t2 and t1 under Processing->Apodization 3. Decide whether the spectra need phase adjustment
1. For all absolute-value (or magnitude) mode spectra, such as typical COSY and HMBC, DO NOT apply phase correction.
2. For phase-sensitive spectra, such as typical HSQC/HMQC/NOESY etc., phase both f2 and f1 dimensions. Apply both zero-order (ph0) and 1st-order (ph1) phases if necessary.
4. Apply baseline correction to f2 and f1 dimensions. 5. Play with other optional processing tricks such as t1 noise reduction or
symmetrization, etc. Be cautious that these routines may introduce artifacts or reduce signal/noise. Always compare results with those from simple processing.

Two spectra after zero-order phase correction
1st-order phase is NOT needed 1st-order phase is needed. Note the linear change in phase from left to right.
When 1st-Order Phase Is Needed
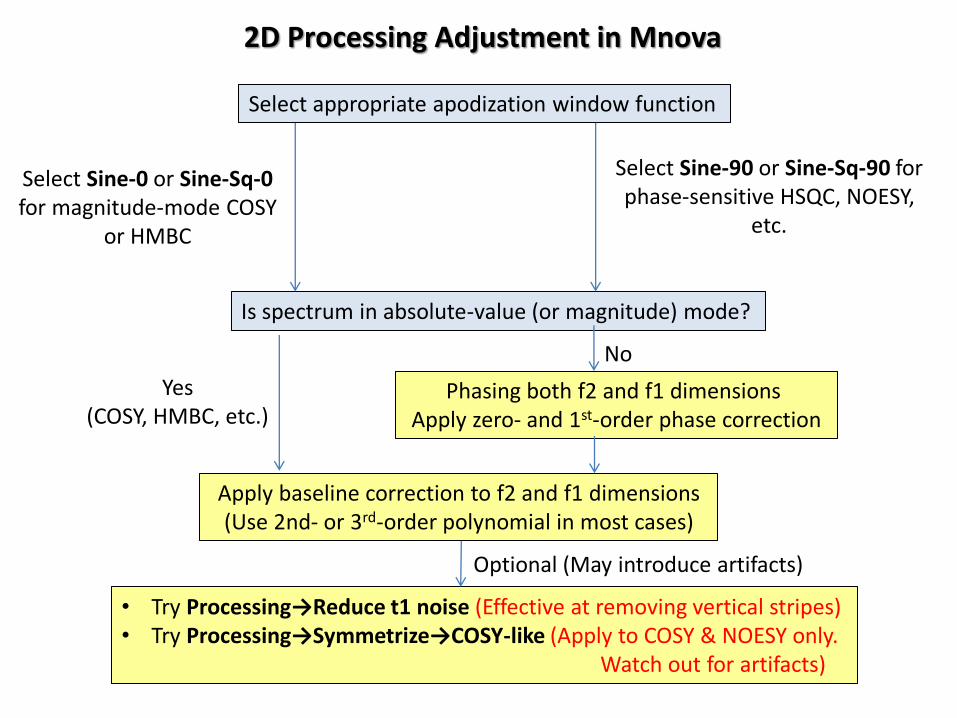
2D Processing Adjustment in Mnova
Is spectrum in absolute-value (or magnitude) mode?
Yes (COSY, HMBC, etc.)
No
Phasing both f2 and f1 dimensions Apply zero- and 1st-order phase correction
Apply baseline correction to f2 and f1 dimensions (Use 2nd- or 3rd-order polynomial in most cases)
• Try Processing→Reduce t1 noise (Effective at removing vertical stripes) • Try Processing→Symmetrize→COSY-like (Apply to COSY & NOESY only. Watch out for artifacts)
Optional (May introduce artifacts)
Select appropriate apodization window function
Select Sine-0 or Sine-Sq-0 for magnitude-mode COSY
or HMBC
Select Sine-90 or Sine-Sq-90 for phase-sensitive HSQC, NOESY,
etc.
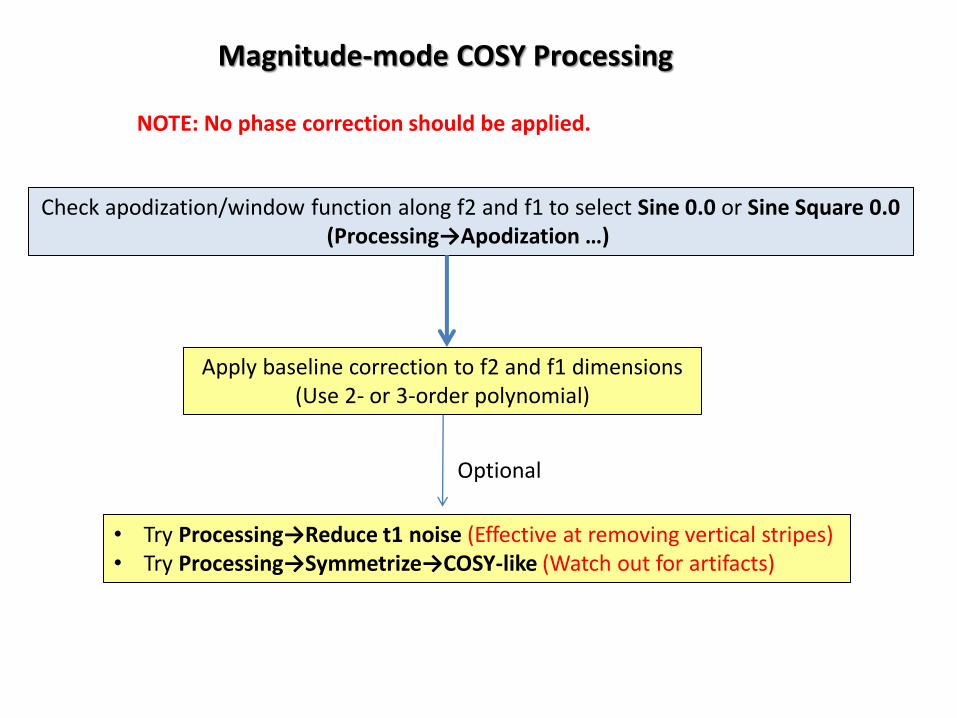
Magnitude-mode COSY Processing
Check apodization/window function along f2 and f1 to select Sine 0.0 or Sine Square 0.0 (Processing→Apodization …)
Apply baseline correction to f2 and f1 dimensions (Use 2- or 3-order polynomial)
• Try Processing→Reduce t1 noise (Effective at removing vertical stripes) • Try Processing→Symmetrize→COSY-like (Watch out for artifacts)
Optional
NOTE: No phase correction should be applied.

gCOSY: Initial look after automatic processing • Vertical stripes are called t1 noise
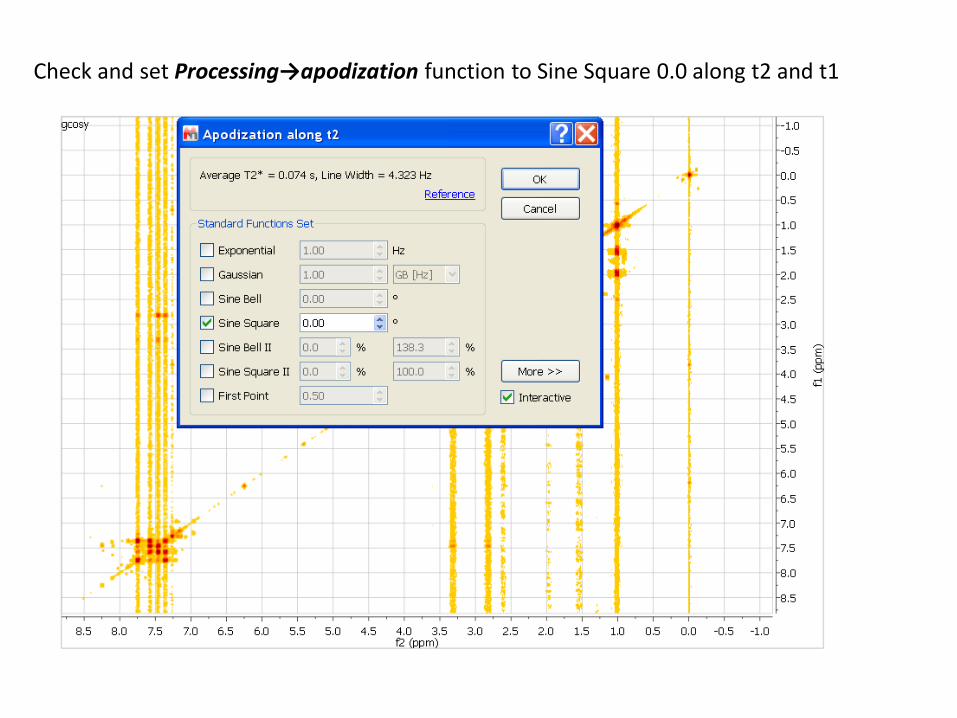
Check and set Processing→apodization function to Sine Square 0.0 along t2 and t1

Apply baseline correction along f1 (vertical)
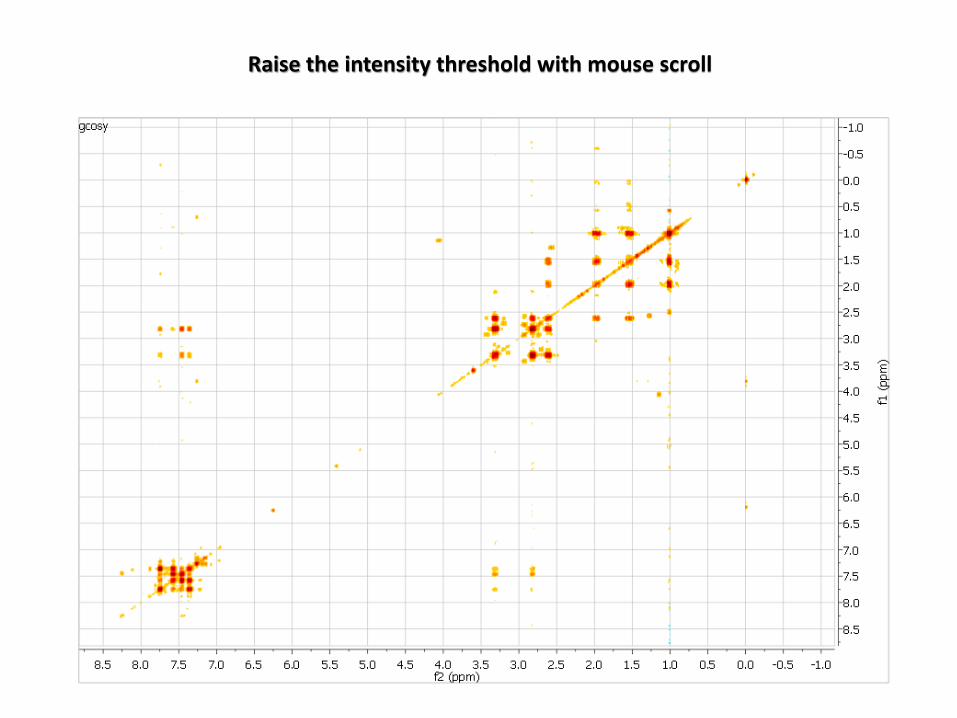
Raise the intensity threshold with mouse scroll

Turn on Processing→Reduce t1 noise. In this case, the improvement is significant, but be cautious with artifacts. To turn off t1 noise correction, toggle off Processing→Reduce t1 noise

Use View→Crosshair (or press C) to check symmetry of COSY crosspeaks Hold the left mouse button and drag to show a box

Select View→2D Plotting Method→Contour Plot or right mouse button click. Contour drawing on the fly is slower. Do this after data processing.

NOESY Processing: Initial look • Reference is wrong • Apodization/window function need to change
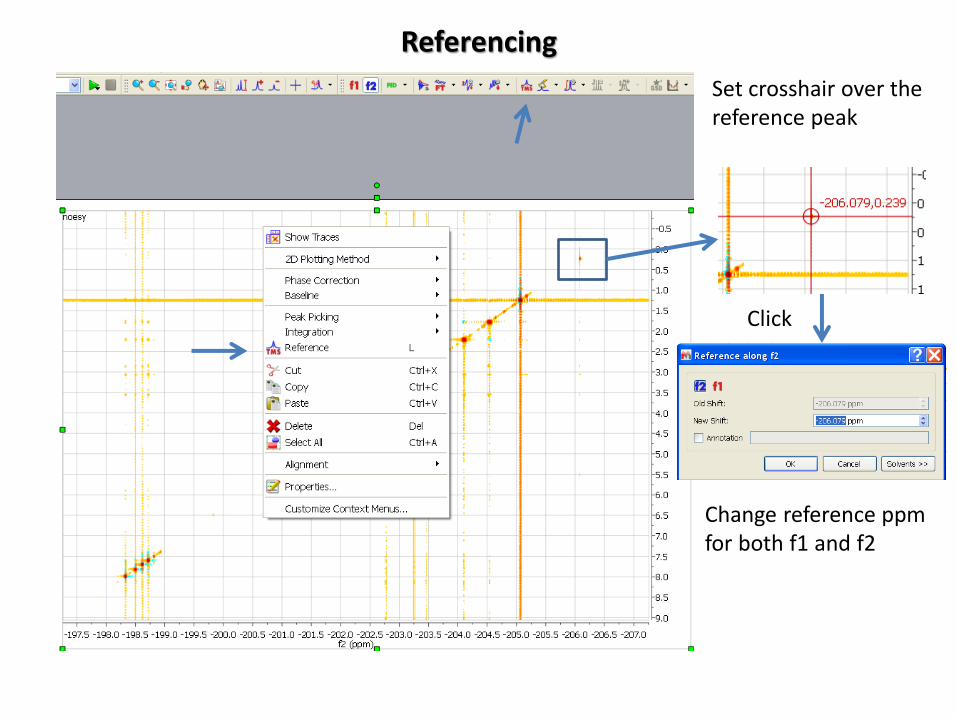
Referencing
Set crosshair over the reference peak
Click
Change reference ppm for both f1 and f2
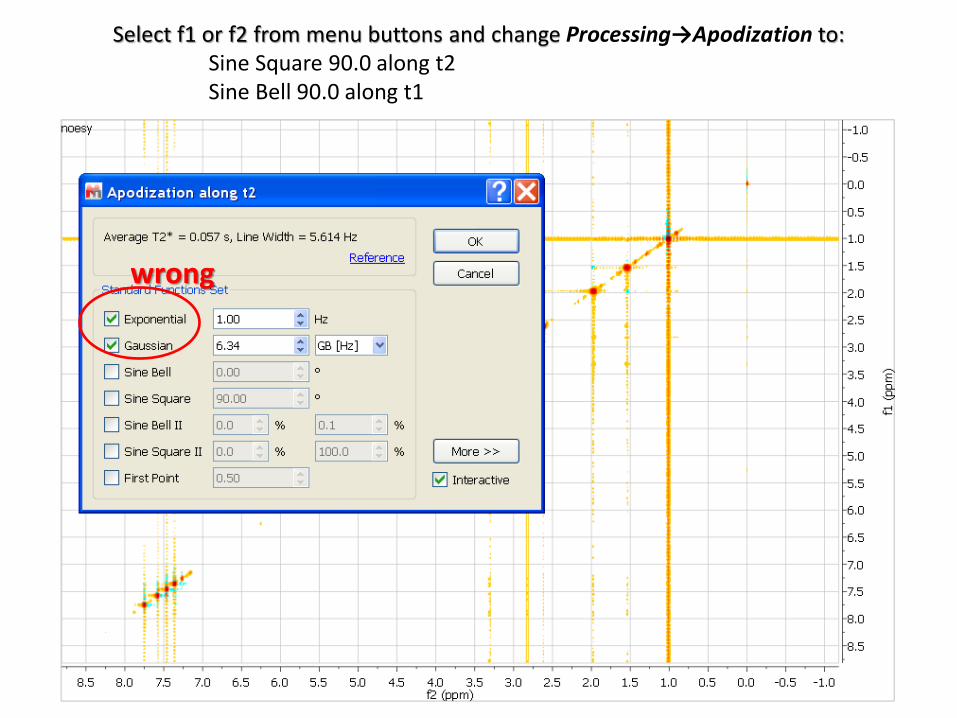
Select f1 or f2 from menu buttons and change Processing→Apodization to: Sine Square 90.0 along t2 Sine Bell 90.0 along t1
wrong

The 2D peaks will look smoother and the baseline noise is less with the new window function

• Select manual phase correction • Select f2. Drag pivot line (vertical blue line) to line up with a strong peak on left • Adjust PH0 so that the selected peak is perfectly in phase • Adjust PH1 so that the peaks on right also come into phase

After PH0 adjustment along f2
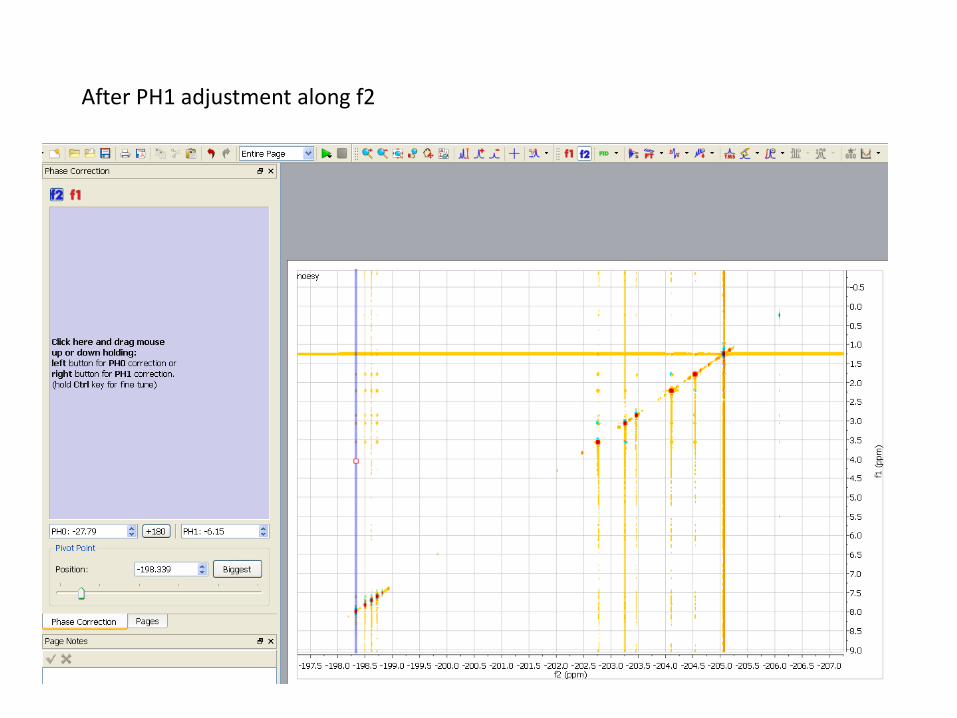
After PH1 adjustment along f2

• For f1, select a peak near the bottom (or top) as the pivot • Spectrum after PH0 adjustment • PH1 seems OK. NO linear phase correction necessary.

• Lower threshold so that baseline defects are seen • Apply Polynomial baseline correction order 2 or 3 to f2 and f1 separately

After f2 baseline correction

After both f2 and f1 baseline correction

Additional processing • Processing→Symmetrize→COSY-like • Spectrum quality improves.
NOTE: • Be careful with the “reduce t1
noise” or symmetrization procedure. Artificial crosspeaks may be created in the process if the background noise is strong.

Incomplete suppression of COSY-type peaks (peaks have both positive and negative signals)
• For small molecules, NOEs mostly have opposite signs with the diagonal peaks. • Typical artifacts are:
• dispersive peaks (with mixed up/down signals) that come from through-bond COSY-correlations. These are suppressed but not completely.
• exchange crosspeaks having same sign with diagonal peaks
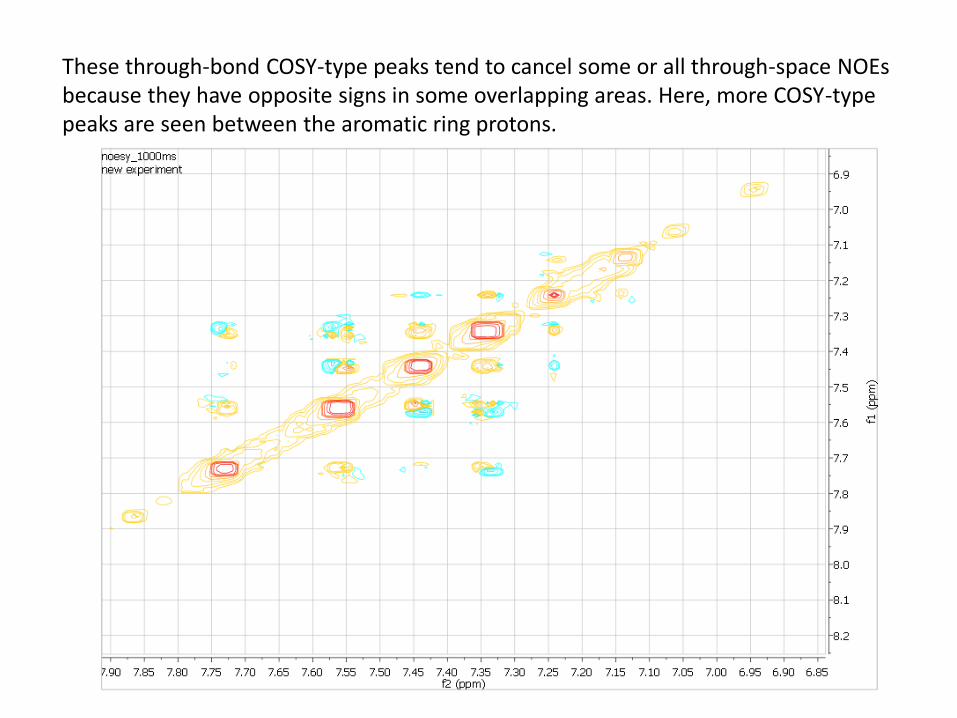
These through-bond COSY-type peaks tend to cancel some or all through-space NOEs because they have opposite signs in some overlapping areas. Here, more COSY-type peaks are seen between the aromatic ring protons.
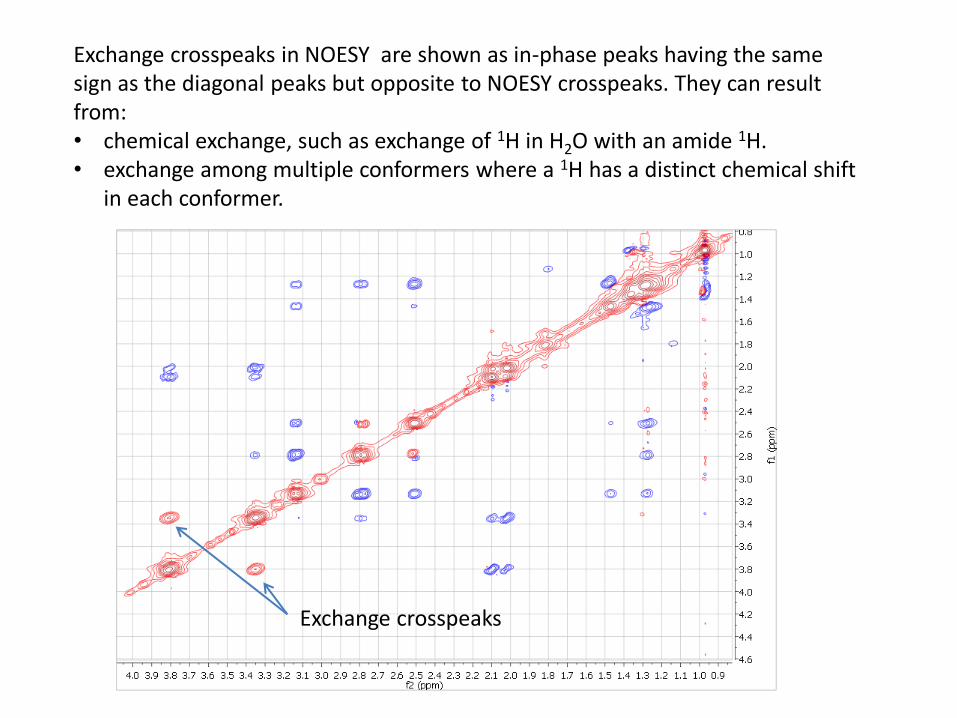
Exchange crosspeaks in NOESY are shown as in-phase peaks having the same sign as the diagonal peaks but opposite to NOESY crosspeaks. They can result from: • chemical exchange, such as exchange of 1H in H2O with an amide 1H. • exchange among multiple conformers where a 1H has a distinct chemical shift
in each conformer.
Exchange crosspeaks
Related Documents