2D and 3D visualization of OpenStreetMap Data Candan Eylül Kilsedar 1 , Jakub Balhar 2 , Maria Antonia Brovelli 1 , Patrick Hogan 3 1 Politecnico di Milano, Department of Civil and Environmental Engineering, Milano, Italy, 2 Gisat s.r.o., Prague, Czech Republic ³ NASA Ames Research Center, Mofett Field, CA, USA

Welcome message from author
This document is posted to help you gain knowledge. Please leave a comment to let me know what you think about it! Share it to your friends and learn new things together.
Transcript
2D and 3D visualization of OpenStreetMap Data
Candan Eylül Kilsedar1, Jakub Balhar2, Maria Antonia Brovelli1, Patrick Hogan3
1 Politecnico di Milano, Department of Civil and Environmental Engineering, Milano, Italy,2 Gisat s.r.o., Prague, Czech Republic
³ NASA Ames Research Center, Mofett Field, CA, USA
OpenStreetMap (OSM) visualization
✔ OSM data have big data characteristics, such as velocity, veracity and
volume.
✔ Visualizing big data is one of the challenges regarding the big data
phenomenon (Li et al., 2016).
✔ A plugin Application Programming Interface (API) has been developed
for NASA Web WorldWind during Google Summer of Code (GSoC) in
2017 for OSM visualization.
✔ NASA Web WorldWind is a free and open source API for building
virtual globes and maps, built using JavaScript and WebGL. It is
developed in partnership with European Space Agency (ESA).
An open source plugin API
✔ OSM may hold for each building its height or number of levels, which
can be used for 3D visualization. The rest of the OSM data are
overlayed on the virtual globe in 2D.
✔ The source code of the plugin API is available at
https://github.com/kilsedar/3dosm.
✔ http://osm.eoapps.eu & http://osm.eoapps.eu/application/ can be used
to visualize the data, which reached the inals at NASA Europa
Challenge in 2017.
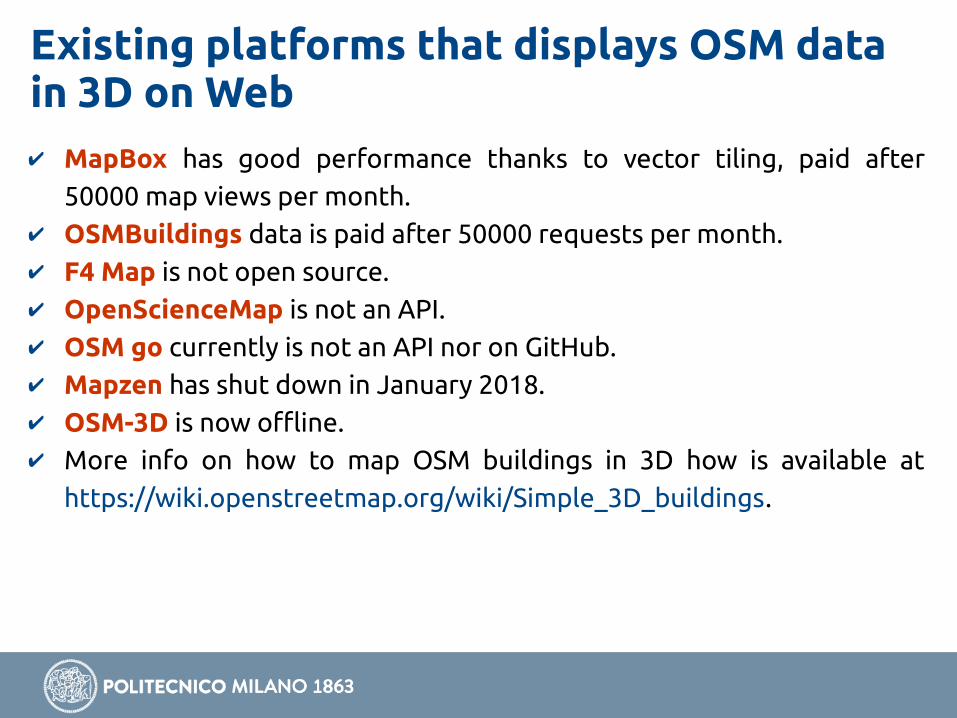
Existing platforms that displays OSM data in 3D on Web
✔ MapBox has good performance thanks to vector tiling, paid after
50000 map views per month.
✔ OSMBuildings data is paid after 50000 requests per month.
✔ F4 Map is not open source.
✔ OpenScienceMap is not an API.
✔ OSM go currently is not an API nor on GitHub.
✔ Mapzen has shut down in January 2018.
✔ OSM-3D is now oline.
✔ More info on how to map OSM buildings in 3D how is available at
https://wiki.openstreetmap.org/wiki/Simple_3D_buildings.
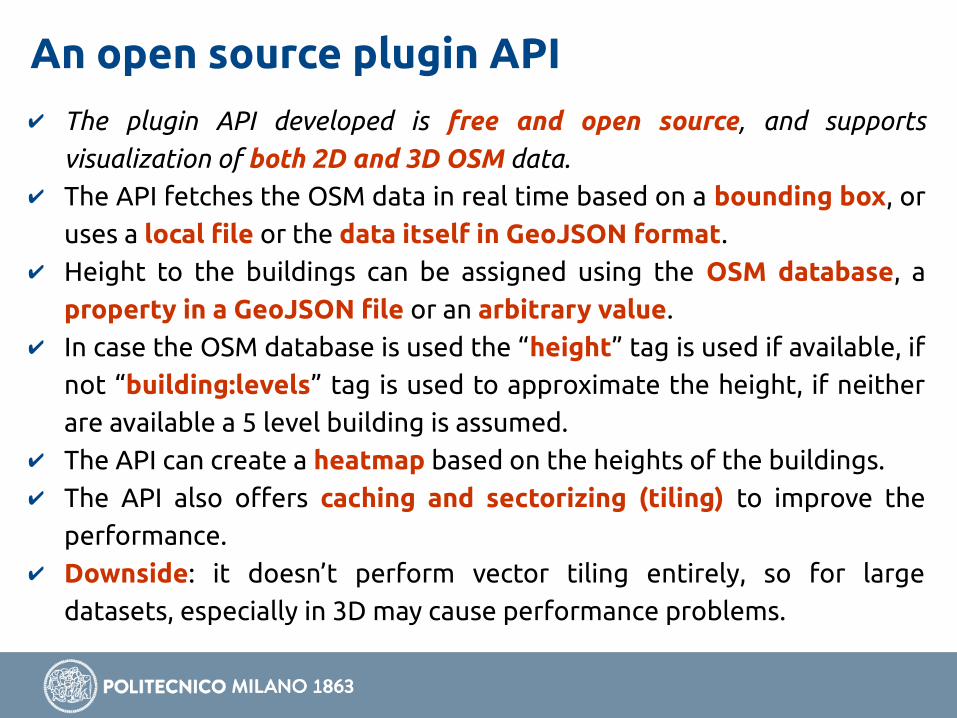
✔ The plugin API developed is free and open source, and supports
visualization of both 2D and 3D OSM data.
✔ The API fetches the OSM data in real time based on a bounding box, or
uses a local ile or the data itself in GeoJSON format.
✔ Height to the buildings can be assigned using the OSM database, a
property in a GeoJSON ile or an arbitrary value.
✔ In case the OSM database is used the “height” tag is used if available, if
not “building:levels” tag is used to approximate the height, if neither
are available a 5 level building is assumed.
✔ The API can create a heatmap based on the heights of the buildings.
✔ The API also ofers caching and sectorizing (tiling) to improve the
performance.
✔ Downside: it doesn’t perform vector tiling entirely, so for large
datasets, especially in 3D may cause performance problems.
An open source plugin API
2D and 3D visualization of OSM data
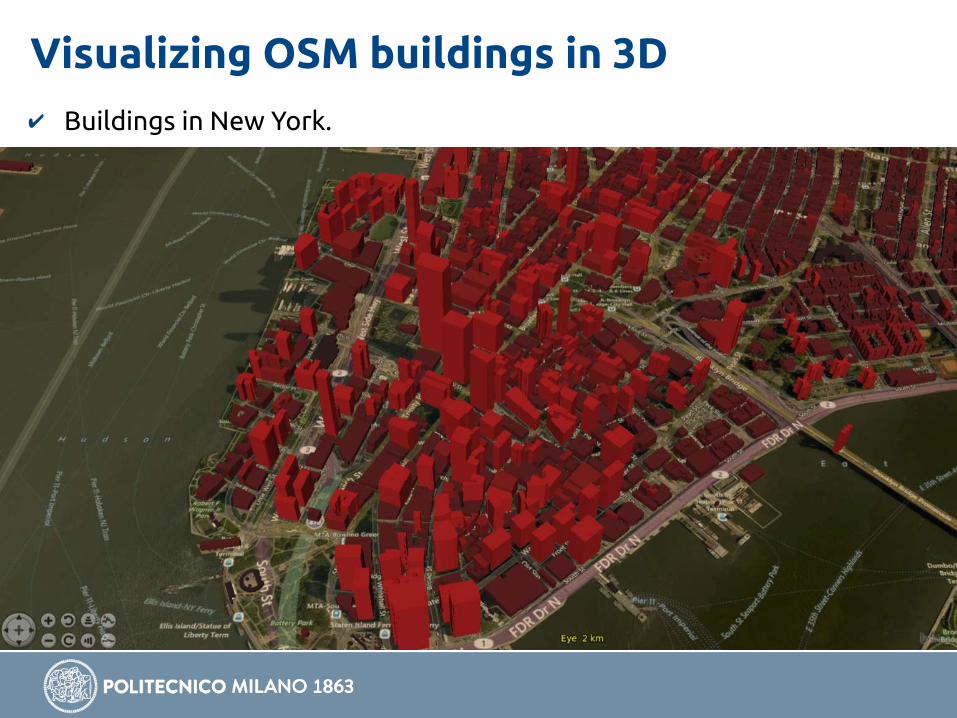
Visualizing OSM buildings in 3D
✔ Buildings in New York.
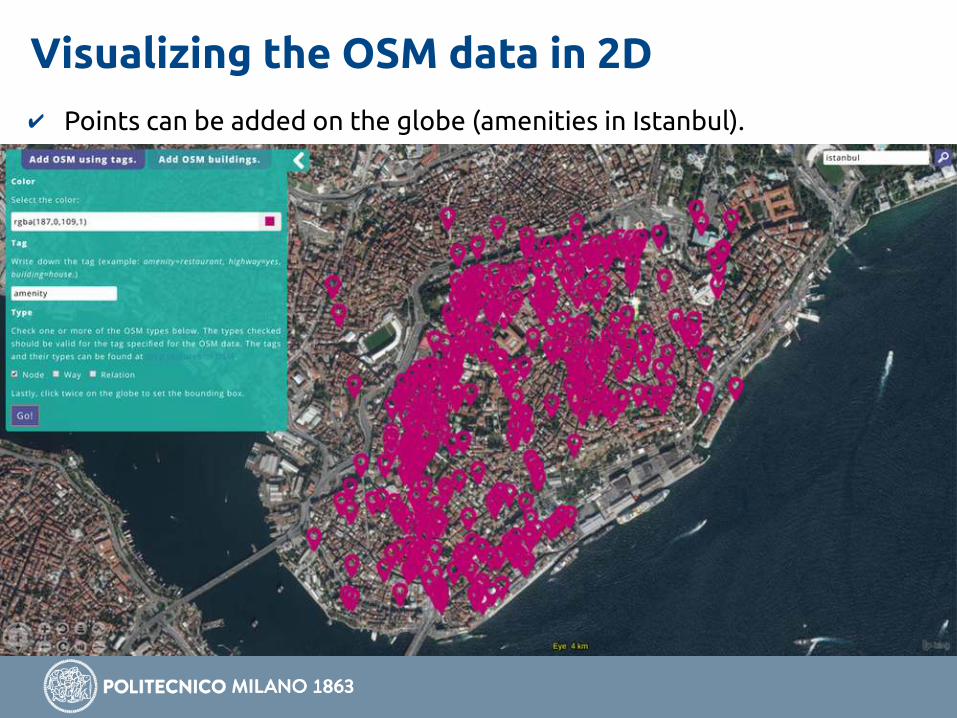
Visualizing the OSM data in 2D
✔ Points can be added on the globe (amenities in Istanbul).
Visualizing the OSM data in 2D
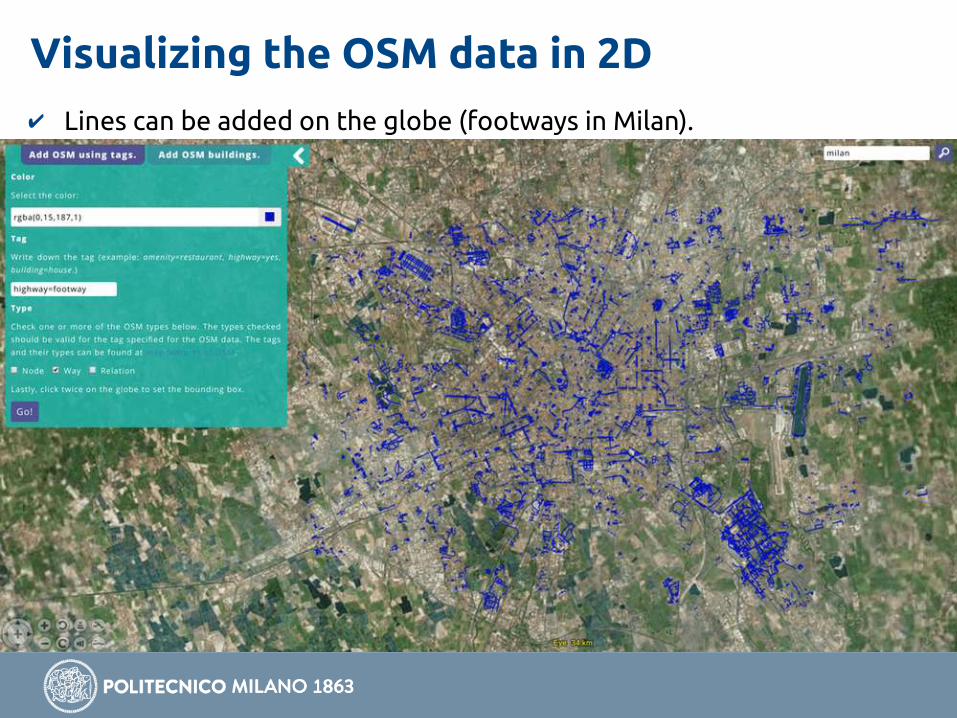
✔ Lines can be added on the globe (footways in Milan).
Visualizing the OSM data in 2D
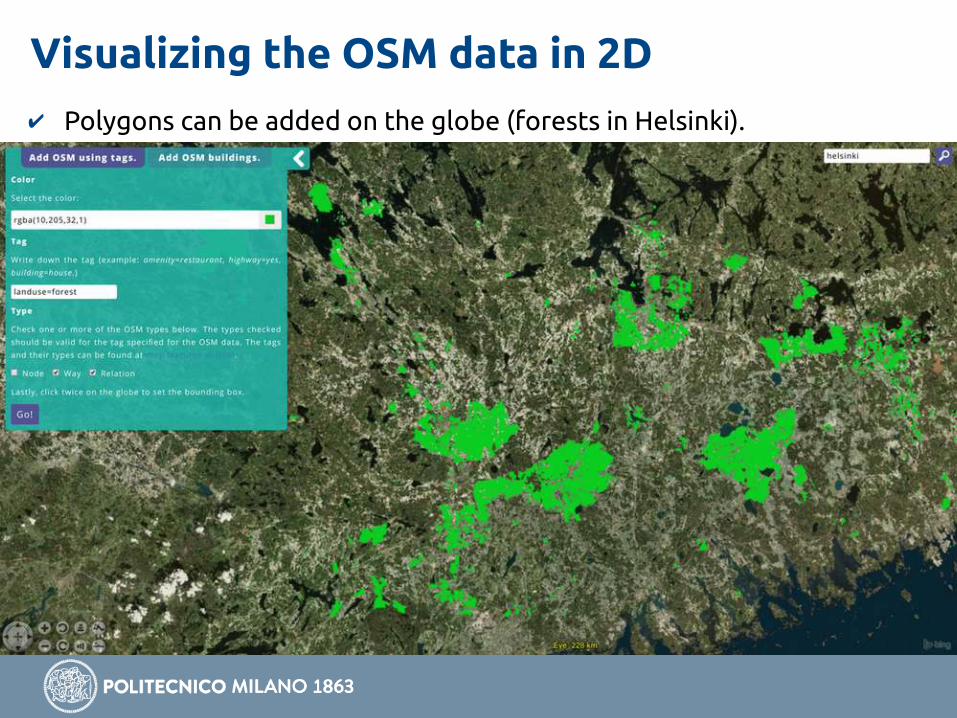
✔ Polygons can be added on the globe (forests in Helsinki).

Research aspects
✔ The project also improves the painting and rendering performance of
3D buildings in the browser, in total by 15%. To achieve the improved
performance, using the footprint and height of the buildings and the
earcut algorithm (https://github.com/mapbox/earcut) triangle meshes
are created, instead of extruding the footprints.
✔ Lidar data for Milan and GRASS GIS were used to extract the building
heights, store the results in GeoJSON, and visualize this data.
Extracting OpenStreetMap (OSM) building heights using GRASS GIS and Lidar
✔ Create a Vector Virtual Format (VRT) of the irst (DSM) and last (DTM)
returns of the lidar data using GDAL (Geospatial Data Abstraction
Library). (gdalbuildvrt)
✔ Subtract DTM from DSM. (r.mapcalc)
✔ Generate a new layer in GeoJSON format with an additional attribute
to the GeoJSON layer of the OSM data for the region of interest,
denoting the median of the points inside the polygon of each building
(v.rast.stats: calculates statistics from a raster map based on a vector
map and uploads statistics to new attribute columns).

Research aspects
✔ A similar procedure has been followed for Rome. Rome building
heights are obtained using the Urban Atlas - Building Height 2012 data
of the Copernicus programme and OSM GeoJSON in GRASS GIS.

✔ Fetches a subset of the data for a speciic region and visualizes it
instantly, which enables:✔ overlay of diferent data in OSM with preferred colors, ✔ comparing OSM data visually with satellite imagery detecting
where OSM data is missing (applies to entities visible in satellite
imagery).
✔ Heatmaps enable visual analysis.
So?
Future directions
✔ Use the “min_height” and “building:min_level” tags, roof tags, surface
color and material tags to improve visualization (move forward from
LoD1).
✔ Develop vector tiling fully.
✔ Fetch and display data based on visible area (frustum culling).

✔ Li, S., Dragicevic, S., Castro, F.A., Sester, M., Winter, S., Çöltekin, A.,
Pettit, C., Jiang, B., Haworth, J., Stein, A., Cheng T., 2016. Geospatial big
data handling theory and methods: A review and research challenges.
ISPRS Journal of Photogrammetry and Remote Sensing, 115, pp. 119-
133. https://doi.org/10.1016/j.isprsjprs.2015.10.012
References

Thank you!
Candan Eylül Kilsedar1, Jakub Balhar2, Maria Antonia Brovelli1, Patrick Hogan3
1 Politecnico di Milano, Department of Civil and Environmental Engineering, Milano, Italy,2 Gisat s.r.o., Prague, Czech Republic
³ NASA Ames Research Center, Mofett Field, CA, USA
29/07/2018
Related Documents