International Journal of Speleology 41 (2) 75-85 Tampa, FL (USA) July 2012 Available online at scholarcommons.usf.edu/ijs/ & www.ijs.speleo.it International Journal of Speleology Official Journal of Union Internationale de Spéléologie 2D and 3D imaging of the metamorphic carbonates at Omalos plateau/polje, Crete, Greece by employing independent and joint inversion on resistivity and seismic data INTRODUCTION Environmental and engineering investigations in karst terrains involve the use of geophysical and bore- hole information for the site characterization. Sink- holes are the major hazard when developing struc- tures at sites where the bedrock consists of carbon- ate rocks (Zhou et al., 2008). Geophysical methods extrapolate the borehole information. Among them, electrical methods have become a valuable tool for subsurface investigation due to their low cost in com- bination with the effectiveness and quick interpreta- tion (Zhou et al., 1999; Stepisnik & Mihevc, 2008). Since the 1920’s electrical methods have been used for imaging the subsurface, mainly electrical sounding (VES). However, VES does not take into consideration the lateral geological heterogeneity and suffers from the ambiguities of a one dimensional in- version. The evolution of two-dimensional inversion 1 Laboratory of Applied Geophysics, Department of Mineral Re- sources Engineering, Technical University of Crete, Polytechni- oupolis, Chania, Greece ([email protected]) 2 Tectonic, Stratigraphy, Environmental geology lab, Depart- ment of Mineral Resources Engineering, Technical University of Crete, Polytechnioupolis, Chania, Greece Hamdan H., Economou N., Kritikakis G., Andronikidis N., Manoutsoglou E., Vafidis A., Pangratis P. and Apostolidou G., 2012. 2D and 3D imaging of the metamorphic carbonates at Omalos plateau/polje, Crete, Greece by employing independent and joint inversion on resistivity and seismic data. International Jourmal of Speleology, 41(2), 75-85. Tampa, FL (USA). ISSN 0392-6672. http://dx.doi.org/10.5038/1827-806X.41.2.7 A geophysical survey carried out at Omalos plateau in Chania, Western Crete, Greece employed seismic as well as electrical tomography methods in order to image karstic structures and the metamorphic carbonates (Tripali unit and Plattenkalk group) which are covered by post-Mesozoic deposits (terra rossa, clays, sands and gravels). The geoelectrical sections image the metamorphic carbonates which exhibit a highly irregular relief. At the central part of the plateau the thickness of post-Mesozoic deposits (terra rossa, clays, sands and gravels) ranges from 40-130 m. A 3D resistivity image was generated by inverting resistivity data collected on a grid to the south west at the Omalos plateau. The 3D resistivity image delineated a karstic structure at a depth of 25 to 55 m. On the same grid the depth to the top of the karstified carbonates ranges from 25-70 m. This is also verified on the resistivity sections and seismic velocity sections along lines 5 and 7 of the above mentioned grid which are derived from the cross-gradients joint inversion. Keywords: karst; geophysics; electrical tomography; seismic tomography; joint inversion Received 12 January 2012; Revised 27 February 2012; Accepted 22 March 2012 algorithms (Loke & Barker, 1996; Tsourlos et al., 1998) increased inversion robustness by processing the sequential electrical soundings as resistivity sec- tions. Meanwhile, the development of multi-electrode resistivity surveying instruments, which enabled au- tomated data collection, made the electrical tomogra- phy method one of the most widely used geophysical methods for near-surface investigations. Currently, fast acquisition 3D data instruments and inversion algorithms (Papadopoulos et al., 2007) enhance the reliability of the method. The Electrical Resistivity Tomography (ERT) meth- od has been effectively used in bedrock investigations, soil and rock characterization, as well as in imaging voids and fractures in rocks (Seaton & Dean, 2004). The use of different electrode arrays over karstic for- mations was studied by Zhou et al. (2008). They con- cluded that the use of the dipole-dipole array is the most suitable method for assessing dolines or sink- holes in carbonate rocks. Hamdan & Vafidis (2009) applied combined inversion of the resistivity data from both the Wenner-Schlumberger and dipole-dipole ar- rays for imaging karstic structures. The difficulty in imaging karstic heterogeneities is usually handled by employing at least two geophysi- cal methods, such as microgravity, electrical methods and GPR (Sumanovac & Weisser, 2001; Barbadello et Abstract: Hamdan Hamdan 1 , Nikos Economou 1 , Giorgos Kritikakis 1 , Nikos Andronikidis 1 , Emmanuil Manoutsoglou 2 , Antonis Vafidis 1 , Pangratis Pangratis 1 , and Georgina Apostolidou 1

Welcome message from author
This document is posted to help you gain knowledge. Please leave a comment to let me know what you think about it! Share it to your friends and learn new things together.
Transcript

International Journal of Speleology 41 (2) 75-85 Tampa, FL (USA) July 2012
Available online at scholarcommons.usf.edu/ijs/ & www.ijs.speleo.it
International Journal of SpeleologyOfficial Journal of Union Internationale de Spéléologie
2D and 3D imaging of the metamorphic carbonates at Omalos plateau/polje, Crete, Greece by employing independent and joint inversion on resistivity and seismic data
INTRODUCTIONEnvironmental and engineering investigations in
karst terrains involve the use of geophysical and bore-hole information for the site characterization. Sink-holes are the major hazard when developing struc-tures at sites where the bedrock consists of carbon-ate rocks (Zhou et al., 2008). Geophysical methods extrapolate the borehole information. Among them, electrical methods have become a valuable tool for subsurface investigation due to their low cost in com-bination with the effectiveness and quick interpreta-tion (Zhou et al., 1999; Stepisnik & Mihevc, 2008).
Since the 1920’s electrical methods have been used for imaging the subsurface, mainly electrical sounding (VES). However, VES does not take into consideration the lateral geological heterogeneity and suffers from the ambiguities of a one dimensional in-version. The evolution of two-dimensional inversion
1 Laboratory of Applied Geophysics, Department of Mineral Re-sources Engineering, Technical University of Crete, Polytechni-oupolis, Chania, Greece ([email protected])
2 Tectonic, Stratigraphy, Environmental geology lab, Depart-ment of Mineral Resources Engineering, Technical University of Crete, Polytechnioupolis, Chania, Greece
Hamdan H., Economou N., Kritikakis G., Andronikidis N., Manoutsoglou E., Vafidis A., Pangratis P. and Apostolidou G., 2012. 2D and 3D imaging of the metamorphic carbonates at Omalos plateau/polje, Crete, Greece by employing independent and joint inversion on resistivity and seismic data. International Jourmal of Speleology, 41(2), 75-85. Tampa, FL (USA). ISSN 0392-6672. http://dx.doi.org/10.5038/1827-806X.41.2.7
A geophysical survey carried out at Omalos plateau in Chania, Western Crete, Greece employed seismic as well as electrical tomography methods in order to image karstic structures and the metamorphic carbonates (Tripali unit and Plattenkalk group) which are covered by post-Mesozoic deposits (terra rossa, clays, sands and gravels). The geoelectrical sections image the metamorphic carbonates which exhibit a highly irregular relief. At the central part of the plateau the thickness of post-Mesozoic deposits (terra rossa, clays, sands and gravels) ranges from 40-130 m. A 3D resistivity image was generated by inverting resistivity data collected on a grid to the south west at the Omalos plateau. The 3D resistivity image delineated a karstic structure at a depth of 25 to 55 m. On the same grid the depth to the top of the karstified carbonates ranges from 25-70 m. This is also verified on the resistivity sections and seismic velocity sections along lines 5 and 7 of the above mentioned grid which are derived from the cross-gradients joint inversion.
Keywords: karst; geophysics; electrical tomography; seismic tomography; joint inversion
Received 12 January 2012; Revised 27 February 2012; Accepted 22 March 2012
algorithms (Loke & Barker, 1996; Tsourlos et al., 1998) increased inversion robustness by processing the sequential electrical soundings as resistivity sec-tions. Meanwhile, the development of multi-electrode resistivity surveying instruments, which enabled au-tomated data collection, made the electrical tomogra-phy method one of the most widely used geophysical methods for near-surface investigations. Currently, fast acquisition 3D data instruments and inversion algorithms (Papadopoulos et al., 2007) enhance the reliability of the method.
The Electrical Resistivity Tomography (ERT) meth-od has been effectively used in bedrock investigations, soil and rock characterization, as well as in imaging voids and fractures in rocks (Seaton & Dean, 2004). The use of different electrode arrays over karstic for-mations was studied by Zhou et al. (2008). They con-cluded that the use of the dipole-dipole array is the most suitable method for assessing dolines or sink-holes in carbonate rocks. Hamdan & Vafidis (2009) applied combined inversion of the resistivity data from both the Wenner-Schlumberger and dipole-dipole ar-rays for imaging karstic structures.
The difficulty in imaging karstic heterogeneities is usually handled by employing at least two geophysi-cal methods, such as microgravity, electrical methods and GPR (Sumanovac & Weisser, 2001; Barbadello et
Abstract:
Hamdan Hamdan1, Nikos Economou1, Giorgos Kritikakis1, Nikos Andronikidis1, Emmanuil Manoutsoglou2, Antonis Vafidis1, Pangratis Pangratis1, and Georgina Apostolidou1

76
al., 2002; Leucci, 2003; Vafidis et al., 2004; Elawadi et al., 2006; Hamdan et al., 2010). This integrated geophysical approach produces a more reliable sub-surface image. However, the integrated interpreta-tion of such plethora of geophysical data sets is very difficult and usually it is almost impossible to find a subsurface model which satisfies all the geophysical data sets.
Recently, joint inversion techniques have been de-veloped to simultaneously invert data sets from two geophysical methods. Such techniques improve the subsurface model, which is consistent with all the available geophysical data. Initially, these methods focused on 1D inversion (Vozof & Jupp, 1975; Lines
et al., 1988; Dobroka et al., 1991; Hering et al., 1995) and later, on 2D inversion (Zhang & Morgan, 1997; Haber & Oldenburg, 1997; Gallardo & Meju, 2003, 2004; Fregoso-Becerra & Gallardo, 2007). The use of such techniques helps geophysical methods to over-come uncertainties, often encountered in imaging karstic structures.
In this study we present a geophysical survey carried out at the Omalos Plateau, Western Crete, Greece. This survey employed seismic refraction and geoelectrical methods. The later, consisted of Vertical Electrical Sounding (VES) and Electrical Resistivity Tomography (ERT). The objective of this survey was
Hamdan Hamdan, Nikos Economou, Giorgos Kritikakis, Nikos Andronikidis, Emmanuil Manoutsoglou, Antonis Vafidis, Pangratis Pangratis, and Georgina Apostolidou
International Journal of Speleology, 41 (2), 75-85. Tampa, FL (USA). July 2012
Figure 1. Survey area on the Omalos plateau.

77
to image the complex tectonic structure of the active karstic system of the Omalos polje. Initially, VES and ERT were employed to estimate the maximum thick-ness of the recent deposits, which cover the karstified carbonates. Later, a grid of ERT lines, in combination with two seismic refraction lines was utilized to map the subsurface of an area dedicated to the construc-tion of a reservoir. In this paper we examine the po-tential of ERT and seismic methods in delineating the relief of the karstic bedrock and present preliminary results from the joint inversion of seismic refraction and ERT data.
GEOPHYSICAL SURVEYSThe Omalos plateau is the largest active polje of
Western Crete (Greece) and covers an area of approxi-mately 6 km2 (3x2 km) (Fig. 1). The plateau consists of Post-Mesozoic sediments which lie on the “Tryp-ali” metamorphic carbonates and the Plattenkalk car-bonate group. The later formations are karstified at Omalos. The term karstification refers to geological processes mainly involving dissolution. These pro-cesses create unique morphological characteristics such as dolines, whose size varies from several me-ters to few hundreds of meters, or a polje which often results from more than one dolines or karstic struc-tures. Electrical and seismic methods are very useful in delineating karstic structures such as these.
The geophysical survey at Omalos Plateau was conducted during four periods, from 2002 to 2009 (Vafidis et al., 2004; Alevras et al., 2007) by employ-ing the VES, ERT and seismic refraction methods. The former method estimates the average thickness of the recent deposits, while the ERT and seismic refraction methods map the relief of the karstic carbonates. The data collected during the first (September 2002) and second (September 2003) periods include 3 VES (B2, B3 and B4 - Fig. 1), as well as 4 ERT lines (T1, T2, T3 and T5 - Fig. 1). The electrode spacing of the Wenner-Schlumberger array was set to 30 m for these ERT lines. In September 2008, we collected data along the lines 1 and 2 (Fig. 1), using the Wenner-Schlumberger array, 10 m electrode spacing and the roll along tech-
nique. During the last period (October 2009), an ERT grid (lines G1 – G7, Fig. 1) was scanned using also the Wenner-Schlumberger array and 10 m electrode spacing. The length of these ERT lines was 470 m. During the same period, a seismic refraction survey was conducted along two lines (lines S5 and S7 - Fig. 1). Each seismic line consisted of two spreads having 5 m geophone interval and five shots per spread. The record length and the sampling interval were 512 ms and 0.125 ms, respectively.
Omalos poljeThe first phase of the geophysical survey at Omalos
plateau (2002-2008) aimed at estimating the thick-ness of the recent deposits at the central parts of the polje (Fig. 1). Three (3) VES (B2, B3 and B4) and 6 ERT lines (T1, T2, T3, T5 and Lines 1 and 2) were surveyed (Fig. 1). The least squares approach was employed for the inversion of both 1D electric sound-ing (Ip2Win, Bobachow, 2002) and the 2D geoelectri-cal sections (RES2DINV, Loke & Barker, 1996). The smoothness constraint regularizes the ill-posed 2D inversion method and provides smooth images of the subsurface.
ERT line T3, located to the southwest of the polje, is close to borehole 325 (Fig. 1). Borehole 325 drilled mainly Terra Rossa with gravels (55 m), clay with sand (35 m) and carbonates. ERT section T3 and Borehole 325, indicate that the top of the bedrock corresponds to approximately 300 ��m (light green to yellow bor-��m (light green to yellow bor-�m (light green to yellow bor-der line, Fig. 2). This information was used to cali-brate the geoelectric sections in order to estimate the thickness of the recent deposits.
Three geoelectrical zones are delineated from B3 and B4 VES resistivity curves and ERT sections T2, T5, T1 and line 1 (Fig. 3). A shallow non-homoge-neous zone with electrical resistivity values ranging from 300 ��m to 3500 ��m, a lower resistivity (less than 200 ��m) zone and another high resistivity zone (more than 300 ��m). According to geological setting deduced from borehole 325, the deeper layer is at-tributed to the carbonates, while the other two to the recent deposits (Post-Mesozoic).
Geophysical imaging of karstic structures
International Journal of Speleology, 41 (2), 75-85. Tampa, FL (USA). July 2012
Figure 2. Comparison of the electrical tomography section T3 with borehole 325 where the dotted line depicts 300 Ωm contour.

78
Fig. 4 illustrates a 3D perspective view from the south of the ERT sections, where the carbonates (deeper high resistivity zone) exhibit a rough paleo-relief. The thickness of post-Mesozoic deposits ranges from 40 m to more than 140 m (Fig. 3). Carbonates are expected at shallower depth along two ridges, with trend from S-SW to N-NE (purple curves on Fig. 4), delineating a valley. This valley is deeper at the north-ern part of the ERT line T5, since the bedrock is not present at depths less than 140 m at 420 m distance of line T5.
Electrical Tomography GridAt the southwest part of Omalos plateau, an ERT
grid (lines G1 – G7, Fig. 1) was surveyed (7 ERT paral-lel lines). According to the ERT sections G1 – G7 (Fig. 5), the depth to the bedrock (300 ��m) ranges from 15 m to 70 m. The relatively high RMS errors (10-15%) are justified by the highly heterogeneous shallow lay-ers.
A total of 3153 apparent resistivity datum points for 8 depth levels, were extracted from the parallel to-mography lines and combined into a 7x48 grid before being processed using 3-D inversion (Res3Dinv). This
inversion technique employed finite elements using 2256 cells for the calculation of the apparent resistiv-ity data (forward problem) and the blocky (robust) in-version (Claerbout & Muir, 1973). This gives reason-ably accurate images of three-dimensional structures, bigger than 5x5x10 m, enabling the 3D imaging of the subsurface using cost–effective 2D electric tomogra-phy techniques (Dahlin & Loke, 1997; Papadopoulos et al., 2006; Tsokas et al., 2008; Chang et al., 2011). The depth slices (Fig. 6) show a geoelectrical anomaly of low resistivity values in the northeastern part of the grid, at depths between 25 and 55 meters. This anomaly delineated by the 3D inversion of the resis-tivity data is attributed to a karstic structure (circled with the dotted ellipse).
On the same grid two seismic refraction lines were also surveyed (Fig. 1). The seismic velocity sections, generated using SeisImager software, indicate three distinct seismic layers (Fig. 7); a low velocity shallow layer (800 m/s and 5-7 m thickness, red color) over-lies a layer with a seismic velocity of 1500 m/s and thickness less than 15 m (yellow color). The deeper layer exhibits seismic velocity greater than 2100 m/s (green and blue color). According to Fig. 8 the top of
International Journal of Speleology, 41 (2), 75-85. Tampa, FL (USA). July 2012
Hamdan Hamdan, Nikos Economou, Giorgos Kritikakis, Nikos Andronikidis, Emmanuil Manoutsoglou, Antonis Vafidis, Pangratis Pangratis, and Georgina Apostolidou
Figure 3. (a) Comparison of the electrical tomography section T2 with the vertical electrical sounding B3, (b) The geoelectrical tomography section Line 2, (c) The geoelectrical tomography section T5 where the dotted line depicts the 300 Ωm contour and (d) Comparison of the electrical tomography section T1 with the vertical electrical sounding B4.

79
this higher velocity layer coincides with the electri-cal resistivity contour of 300 ��m. From the compari-��m. From the compari-�m. From the compari-son of the resistivity image and the seismic velocity section one can conclude that the carbonates exhibit resistivity greater than 300 ��m and seismic veloc-��m and seismic veloc-�m and seismic veloc-ity greater than 2100 m/s. The shallower seismic and electric layers are attributed to the unsaturated re-cent deposits (Post-Mesozoic). This is in agreement with the B2 VES (northeast of the grid) which exhibits three geoelectrical layres. In particular the thickness of the recent deposits on the B2 VES resistivity curve is within the range of the thickness estimated on the grid (Fig. 9).
Joint inversion of electrical and seismic tomog-raphy
Joint inversion of electrical and seismic data was applied on lines G5/S5 and G7/S7. The goal was to achieve a unified geological model which will satisfy both seismic and electrical data sets. The cross-gradi-ents constraint was adopted, in order to jointly invert resistivity and seismic first arrival data (Gallardo & Meju, 2003, 2004). The basic idea of this approach is to quantitatively estimate the structural similarity between resistivity and seismic velocity models, using the cross product of their gradients.
The cross-gradients joint inversion algorithm that was applied on these lines (Hamdan, 2010; Gal-lardo & Meju, 2003, 2004), utilizes the gradients of both the seismic t(ms) and resistivity t(mr) models as a constraint inserted into the objective non-linear least squares equation. In order to achieve structural similarity between both models the cross product of their gradients should be zeroed at all locations (t(mr, ms)=0). To satisfy this constraint, the gradient vectors must be parallel (same or opposite direction), at all locations where variation in the physical parameters (resistivity and velocity) occurs. This means that the boundaries of the geological layers, detected by both methods, are located at the same position.
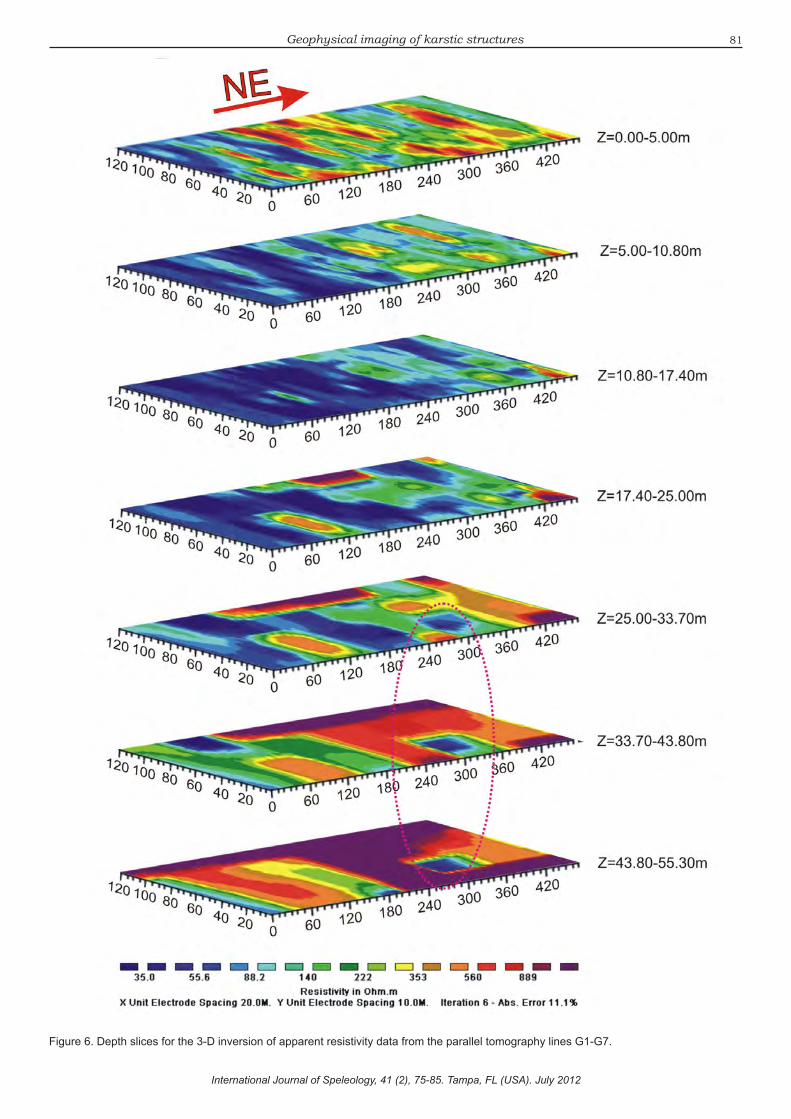
To apply the joint inversion scheme on line 5, the apparent resistivity data corresponding to the loca-tion of the seismic tomography were extracted keep-ing only the resistivity data between 230-340 m and depths between 0-50 m. The joint inversion for this line (Fig. 10) shows good structural similarity between both sections, detecting the depth of the bedrock be-tween 15-25 m, even though the seismic velocity de-creases at depth greater than 25 m, due to poor low ray coverage at these depths. The joint inversion for line 7 was less satisfactory. Although, the resistivity sections from the joint and from the 3D inversion are similar (Fig. 11).
Geophysical imaging of karstic structures
International Journal of Speleology, 41 (2), 75-85. Tampa, FL (USA). July 2012
Figure 4. 3D perspective view from the south of the ERT sections T1, T2, T5 and Line 2 where the deeper high resistivity zone is attributed to carbonates. Two ridges, with trend from S-SW to N-NE (purple curves), delineate a valley.

80
International Journal of Speleology, 41 (2), 75-85. Tampa, FL (USA). July 2012
Hamdan Hamdan, Nikos Economou, Giorgos Kritikakis, Nikos Andronikidis, Emmanuil Manoutsoglou, Antonis Vafidis, Pangratis Pangratis, and Georgina Apostolidou
Figure 5. Electrical tomography sections G1-G7.
81Geophysical imaging of karstic structures
International Journal of Speleology, 41 (2), 75-85. Tampa, FL (USA). July 2012
Figure 6. Depth slices for the 3-D inversion of apparent resistivity data from the parallel tomography lines G1-G7.

82
International Journal of Speleology, 41 (2), 75-85. Tampa, FL (USA). July 2012
Hamdan Hamdan, Nikos Economou, Giorgos Kritikakis, Nikos Andronikidis, Emmanuil Manoutsoglou, Antonis Vafidis, Pangratis Pangratis, and Georgina Apostolidou
Figure 7. Seismic velocity sections S5 and S7.
Figure 8. (a) Seismic velocity section S5 on top of electrical tomography section G5 (b) Seismic velocity section S7 on top of electrical tomography section G7. The black dotted line depicts the 300 Ωm contour.

83
CONCLUSIONSAt the Omalos plateau, seismic as well as electrical
tomography methods imaged karstic structures of the metamorphic carbonates (Tripali unit and Plattenkalk group) which are covered by post-Mesozoic deposits. By combining the geoelectrical sections, we obtained a 3D perspective view of the metamorphic carbonates which exhibit a highly irregular relief in the central
Geophysical imaging of karstic structures
International Journal of Speleology, 41 (2), 75-85. Tampa, FL (USA). July 2012
Figure 10. (a) Electrical tomography section (60-80 m) extracted from the 3D inversion of the resistivity data along lines G1-G5. (b) Electrical tomography section and (c) seismic velocity section generated by cross-gradient inversion for line 5. (d) Electrical tomography section (80-100 m) extracted from the 3D inversion of the resistivity data along lines G1-G5. The black dotted line depicts the 300 Ωm contour from the electrical joint inversion section.
Figure 9. Geoelectrical curve for VES B2 and its corresponding resistivity model.
part of the plateau. Furthermore, the geoelectrical im-Furthermore, the geoelectrical im-ages have outlined deeper karstic structures on the Omalos plateau.
A 3D resistivity image was generated by inverting resistivity data collected on a grid to the south west at the Omalos plateau. The 3D resistivity image delineat-ed a karstic structure at a depth of 25 to 55m. Based on borehole information we calibrated the resistivity sections of this grid and estimated the thickness of post-Mesozoic deposits which ranges from 25-70 m.
The seismic velocity sections image the bedrock along two selected lines of the above mentioned grid. The resistivity and seismic tomography images at the SW Omalos plateau area indicate that the bedrock exhibits a seismic velocity more than 2100 m/s and resistivity more than 300 �m.
On the same survey lines we jointly inverted trav-el time and apparent resistivity data by applying the cross gradients. The resistivity sections extracted from the joint inversion and from the 3D inversion are comparable regarding the top of the bedrock relief.
REFERENCESAlevras A., Hamdan H., Vafidis A & Manutsoglu E.,
2007 - Geoelectrical Mapping of the Omalos Pla-teau/Polje, Chania, Western Crete, Greece. Pro-ceedings of Near Surface 2007: the 13th European Meeting of Environmental and Engineering Geo-physics of the Near Surface Geoscience Division of EAGE, 3-5 September, Istanbul, Turkey, 32.
84
Barbadello L., Bratus A., Yabar D.N., Paganini P. & Palmieri F., 2002 - Integrated geophysical methods to define hypogenous karstic features. Atti del Museo Civico di Storia Naturale di Trieste, 49: 15-21.
Bobachow A., 2002 - Ipi2win user’s guide. Moscow State University.
Chang P., Chang S., Liu H. & Wang S., 2011 - Us-ing Integrated 2D and 3D Resistivity Imaging Meth-ods for Illustrating the Mud-Fluid Conduits of the Wushanting Mud Volcanoes in Southwestern Tai-wan. Terrestrial, Atmospheric and Oceanic Sci-ences, 22: 1-14.
http://dx.doi.org/10.3319/TAO.2010.06.21.01(TT)Claerbout F. & Muir F., 1973 - Robust Modeling with
Erratic Data. Geophysics, 38: 826-844. http://dx.doi.org/10.1190/1.1440378Dahlin T. & Loke M., 1997 - Quasi-3D resistivity im-
aging - Mapping of three dimensional structures using two dimensional DC resistivity techniques. Proceedings of the 3rd Meeting Environmental and Engineering Geophysics, Aarhus, Denmark, 8-11 September 1997, Extended Abstracts: 143-146.
Dobroka M., Gyulai A., Ormos T., Csokas J. & Dre-sen L., 1991 - Joint inversion of seismic and geo-electric data recorded in an underground coal mine. Geophysical prospecting, 39: 643-665.
http://dx.doi.org/10.1111/j.1365-2478.1991.tb00334.xFregoso-Becerra, E., & Gallardo, L.A., 2007 - Cross-
Gradient joint 3D inversion of Geophysical Data with Applications to Gravity and Magnetics. EGM 2007 International Workshop, Innovation in EM, Gravity and Magnetic methods: a new perspective for exploration, Italy.
Elawadi E., El-Qady G., Nigm A., Shaaban F. & Ushiji-ma K., 2006. - Integrated Geophysical survey for site investigation at a dwelling area, Egypt. Journal of Environmental & Engineering Geophysics, 11: 249-259. http://dx.doi.org/10.2113/JEEG11.4.249
Gallardo L.A. & Meju M.A., 2003 - Characterization of heterogeneous near-surface materials by joint 2D inversion of DC resistivity and seismic data. Geo-physical Research Letters, 30: 1658-1661.
http://dx.doi.org/10.1029/2003GL017370Gallardo L.A. & Meju M.A., 2004 - Joint two-dimen-
sional DC resistivity and seismic travel time inver-sion with cross-gradients constrains. Journal of Geophysical Research, 109: 1-11.
http://dx.doi.org/10.1029/2003JB002716Haber E. & Oldenburg D., 1997 - Joint inversion: a
structural approach. Inverse problems, 13: 63-77. http://dx.doi.org/10.1088/0266-5611/13/1/006
Hamdan H. & Vafidis A., 2009 - Inversion techniques to improve the resistivity images over karstic struc-tures. Proceedings of the 15th European Meeting of Environmental and Engineering Geophysics, 3–5 September 2009 Dublin, Ireland, 2.
Hamdan H., Kritikakis G., Andronikidis N., Econo-mou N., Manoutsoglou E. & Vafidis A., 2010 - In-tegrated geophysical methods for imaging saline karst aquifers: A case study of Stylos, Chania, Greece. Journal of the Balkan Geophysical Soci-ety, 13: 1-8.
Hamdan H., 2010 - Development of joint inversion techniques of geophysical data (Electrical resistivity and P-waves velocity) for the imaging of salt water intrusion in coastal areas. PhD Thesis, Technical University of Crete Chania, Greece. (in Greek).
Hering A., Misiek R., Gyulai A., Ormos T., Dobroka M. & Dersen L., 1995 - A joint inversion algorithm to process geoelectrical and surface wave seismic data. Geophysical Prospecting, 43: 135-156.
http://dx.doi.org/10.1111/j.1365-2478.1995.tb00128.xLeucci G., 2003 - Evaluation of karstic cave stability
using integrated geophysical methods. GeoActa, 2: 75-88.
International Journal of Speleology, 41 (2), 75-85. Tampa, FL (USA). July 2012
Hamdan Hamdan, Nikos Economou, Giorgos Kritikakis, Nikos Andronikidis, Emmanuil Manoutsoglou, Antonis Vafidis, Pangratis Pangratis, and Georgina Apostolidou
Figure 11. (a) Electrical tomography sections (100-120 m) extracted from the 3D inversion of the resistivity data along lines G1-G5. (b) Electrical tomography section and (c) seismic velocity section generated by a cross-gradient inversion for line 5. The black dotted line depicts the 300 Ωm contour from the electrical joint inversion section.

85
Lines L.R., Schultz A.T. & Treitel S., 1988 - Coopera-tive inversion of geophysical data. Geophysics, 53: 8-20. http://dx.doi.org/10.1190/1.1442403
Loke M. & Barker R., 1996 - Rapid least-squares in-version of apparent resistivity pseudosections using a quasi-Newton method. Geophysical Prospecting, 44: 131-152.
http://dx.doi.org/10.1111/j.1365-2478.1996.tb00142.xPapadopoulos N., Tsourlos P., Tsokas G & Sarris A.,
2006 - Two dimensional and Three-dimensional Resistivity Imaging in Archaeological Site Investi-gation, Archaeological Prospection, 13:163-181. http://dx.doi.org/10.1002/arp.276
Papadopoulos N.G., Tsourlos P., Tsokas G.N. & Sar-ris A., 2007 - Efficient ERT measuring and inver-sion strategies for 3D imaging of buried antiquities. Near Surface Geophysics, 5: 349-361.
Seaton W. & Dean T., 2004 - Engineering site char-acterization with electrical resistivity surveys, No-DIG 2004, NASTT, New Orleans, Lousiana, March: 22-24.
Stepisnik U. & Mihevc A., 2008 - Investigation of structure of various surface jarst formations in lime-stone and dolomite bedrock with application of the Electrical Resistivity Imaging. Acta Carsologica, 37: 133-140.
Sumanovac F. & Weisser M., 2001 - Evaluation of resistivity and seismic methods for hydrogeologic mapping in karst terrains. Journal of Applied Geo-physics, 33: 119-124.
Tsourlos P., Szymanski J. & Tsokas G., 1998 - A smoothness constraint algorithm for the fast 2-D inversion of DC resistivity data. Journal of the Balkan Geophysical Society, 1: 3-13.
Tsokas G., Tsourlos P. & Papadopoulos N., 2008 - Electrical resistivity tomography: a flexible technique in solving problems of archaeological research. In: Piro S. & Campana S. (Eds.), In Seeing the Unseen, Geophysics and Landscape Archaeology, Taylor & Francis: 83-104.
Vafidis A., Manoutsoglou E., Andronikidis N., Hamdan H., Koukadaki M., Kritikakis G., Econ-omou E. & Spanoudakis N., 2004 - Geophysi-cal survey at the Omalos Plateau, Chania, Crete. Proceedings of the 10th International Congress of the Hellenic Geological Society, 15-17 April 2004, Thessaloniki, Greece: 1204-1213.
Vozof K. & Jupp D.B., 1975 - Joint inversion of geo-physical data. Geophysical Journal of the Royal Astronomical Society, 42: 977-991.
http://dx.doi.org/10.1111/j.1365-246X.1975.tb06462.x Zhang J. & Morgan F.D., 1997 - Joint seismic and
electrical tomography. EEGS Symposium on Appli-cations of Geophysics to Engineering and Environ-mental Problems. Keystone, Colorado, 391-396. http://dx.doi.org/10.4133/1.2922412
Zhou WF., Beck BF. & Stephenson BJ., 1999 - De-fining the bedrock/ overburden boundary in cov-ered karst terranes using dipole– dipole electrical resistivity tomography. In: Powers M.H., Ibrahim A.B. & Cramer L. (Eds.), Proc Symp Application of Geophysics to Engineering and Environmental Prob-lems, Oakland, California, 14-18 March 1999. Col-orado: Environmental and Engineering Geophysi-cal Society: 331-339.
Zhou W., Beck B. & Adams A., 2008 - Effective elec-trode array in mapping karst hazards in electrical resistivity tomography. Environmental Geology, 42: 922-928.
http://dx.doi.org/10.1007/s00254-002-0594-z
Geophysical imaging of karstic structures
International Journal of Speleology, 41 (2), 75-85. Tampa, FL (USA). July 2012
Related Documents