2b. Verification: statistics 2b. Verification: statistics

Welcome message from author
This document is posted to help you gain knowledge. Please leave a comment to let me know what you think about it! Share it to your friends and learn new things together.
Transcript
2b. Verification: statistics2b. Verification: statistics
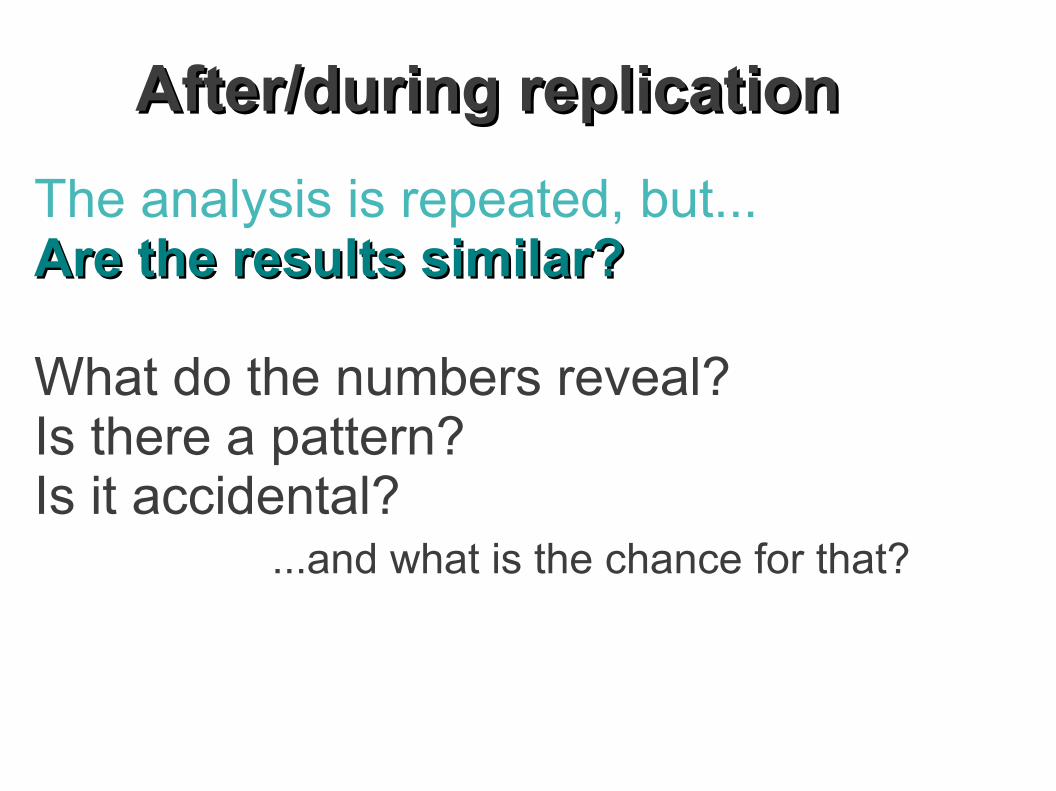
After/during replicationAfter/during replication
The analysis is repeated, but...Are the results similar?Are the results similar?
What do the numbers reveal?Is there a pattern?Is it accidental? ...and what is the chance for that?

Model skill
What is our objective?
Depends on the purpose of the model. Weather model – can it tell us when/where it's going to rain? What are our expectations?
What is skill?
A measure of precision. “Skill assessment is an objective measurement of how well the model nowcast or forecast guidance does when compared to observations”.1
Also a question of utility – how useful is the model?
If an incorrect model is useful, does it have skill?http://www.nauticalcharts.noaa.gov/csdl/skillassess.html
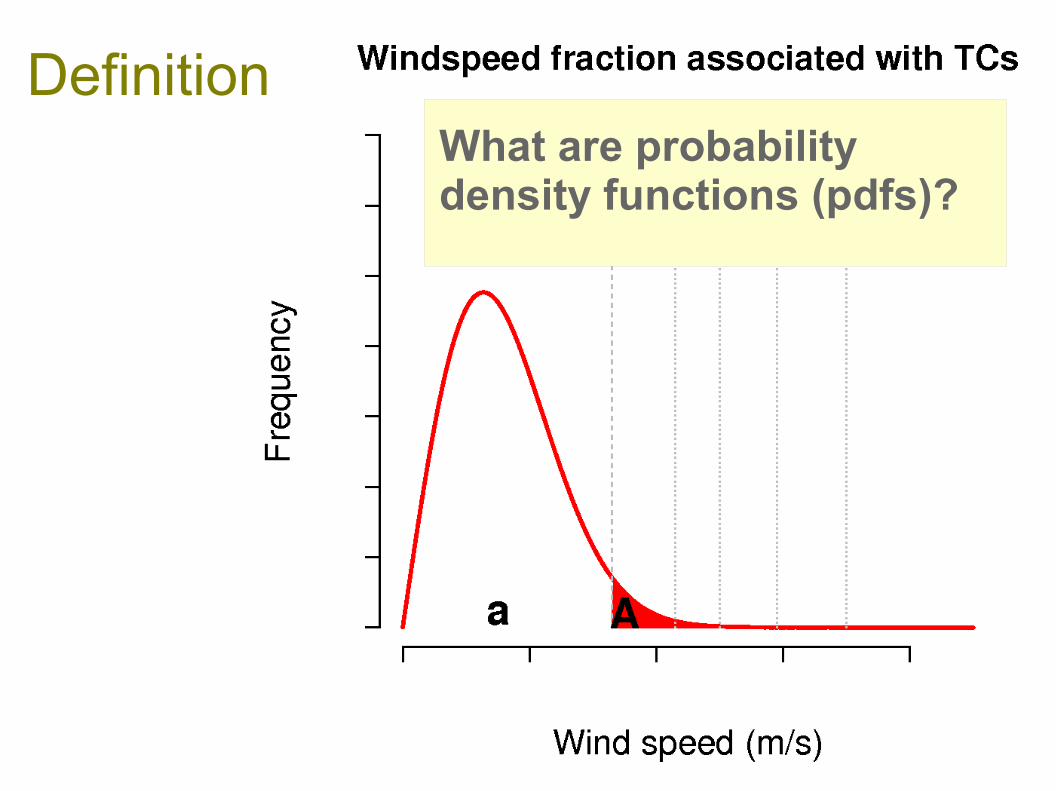
DefinitionWhat are probability density functions (pdfs)?

Terning
Frequency & ProbabilitiesRelated: low probability → rare → low frequency: Related: low probability → rare → low frequency: p = fp = f
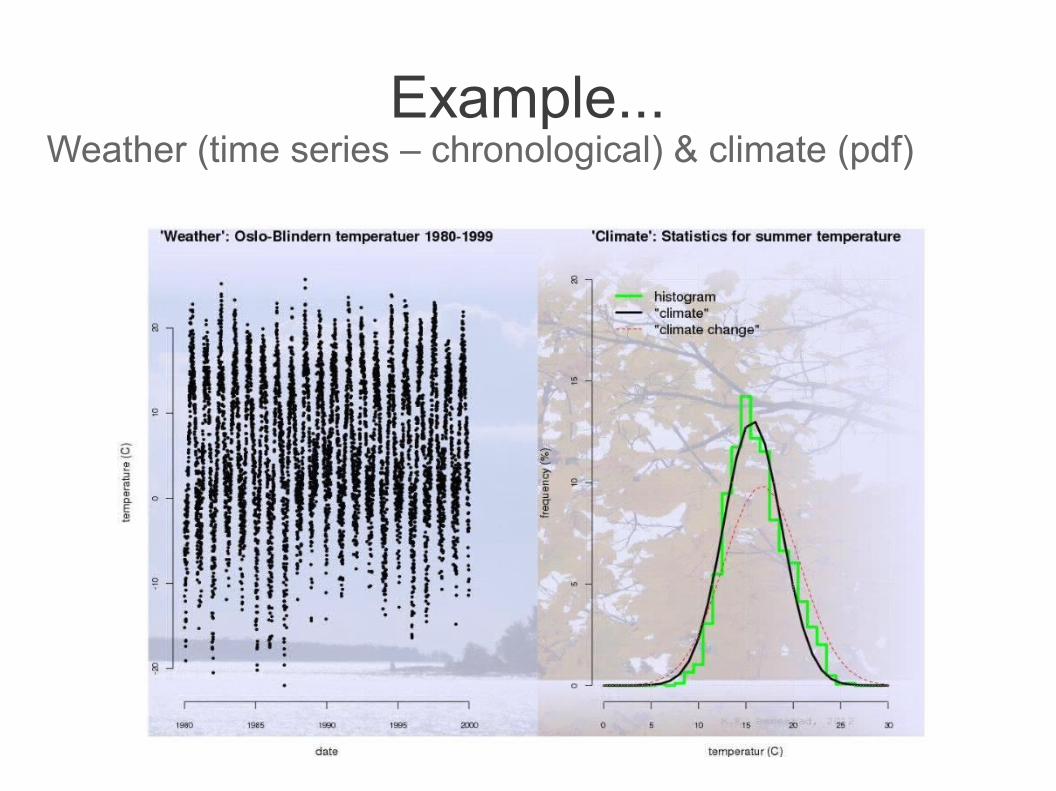
Example...Weather (time series – chronological) & climate (pdf)
Skill

How do we measure skill?
● How closely a model describes the real world.● Measure of reliability.● Measure of precision.
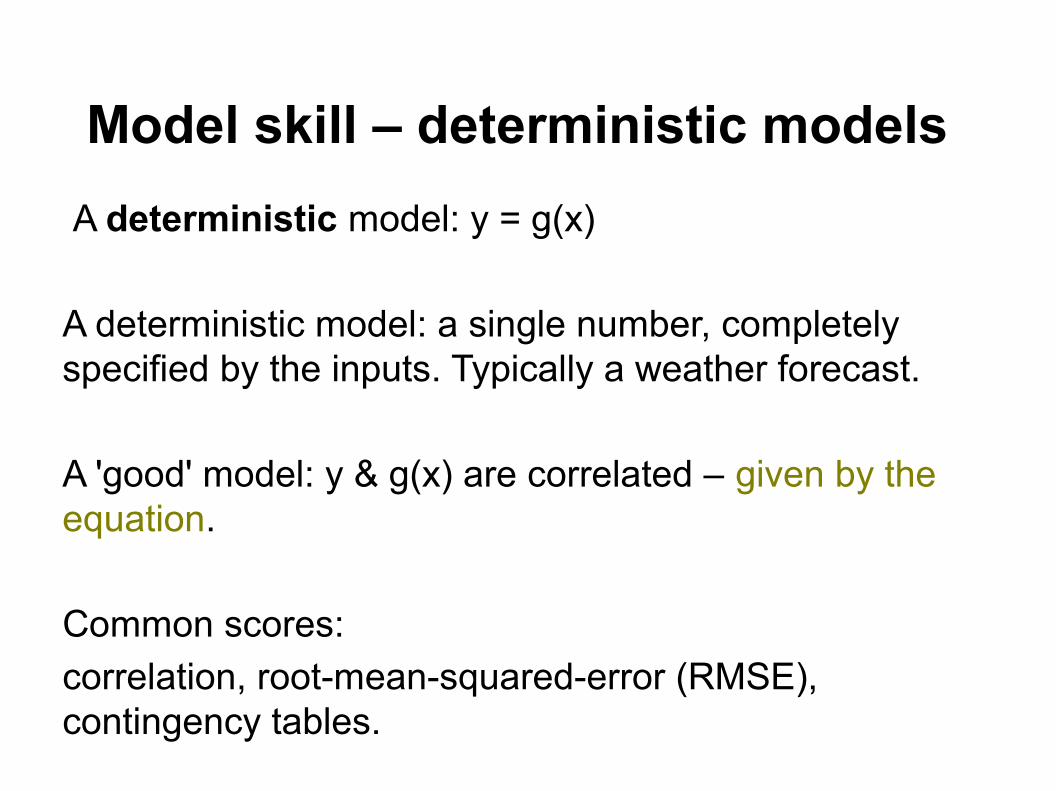
Model skill – deterministic models
A deterministic model: y = g(x)
A deterministic model: a single number, completely specified by the inputs. Typically a weather forecast.
A 'good' model: y & g(x) are correlated – given by the equation.
Common scores:
correlation, root-mean-squared-error (RMSE), contingency tables.
Correlation
● A verification of dependency● X = Y?● Scatter plots● Pearson and ranked correlation.● What correlation means dependency?
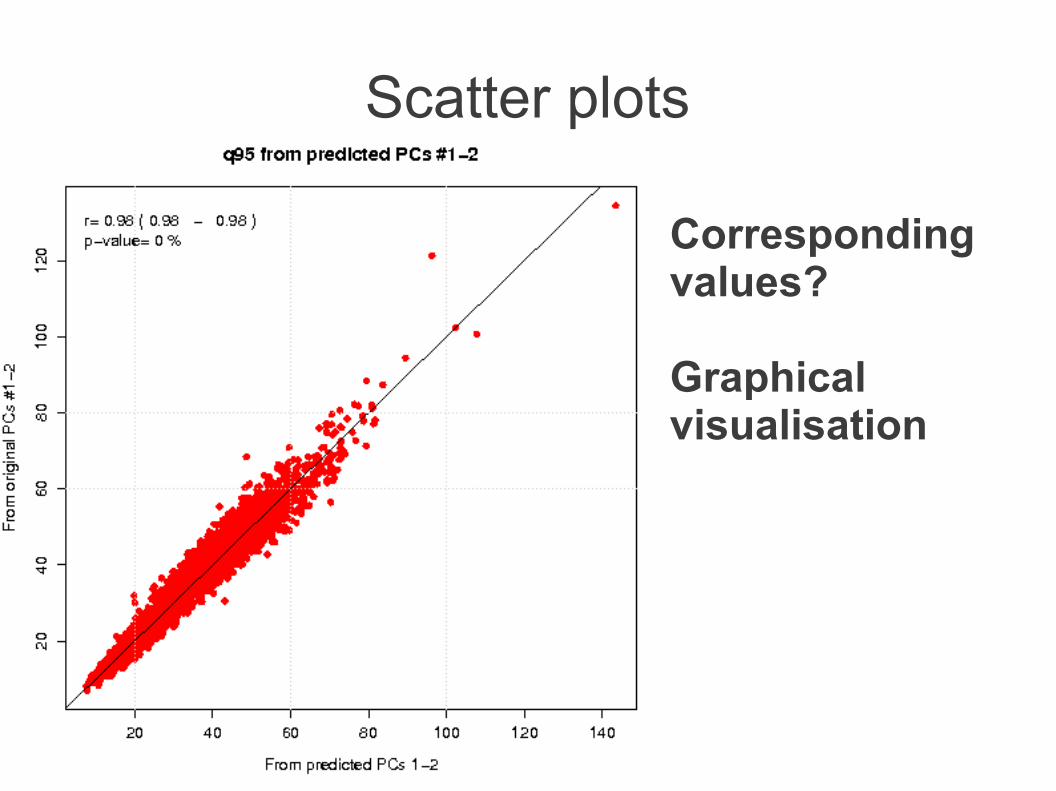
Scatter plots
Corresponding values?
Graphical visualisation

Root mean Square Error (RMSE)
● Estimation of precision● Emphasise differences:● Regression – a weighted
combination of vectors that minimize the RMSE.
● Analysis of variance (ANOVA).

Least squares
2 types: minimizing the perpendicular distance to a line-fit and the errors in y:
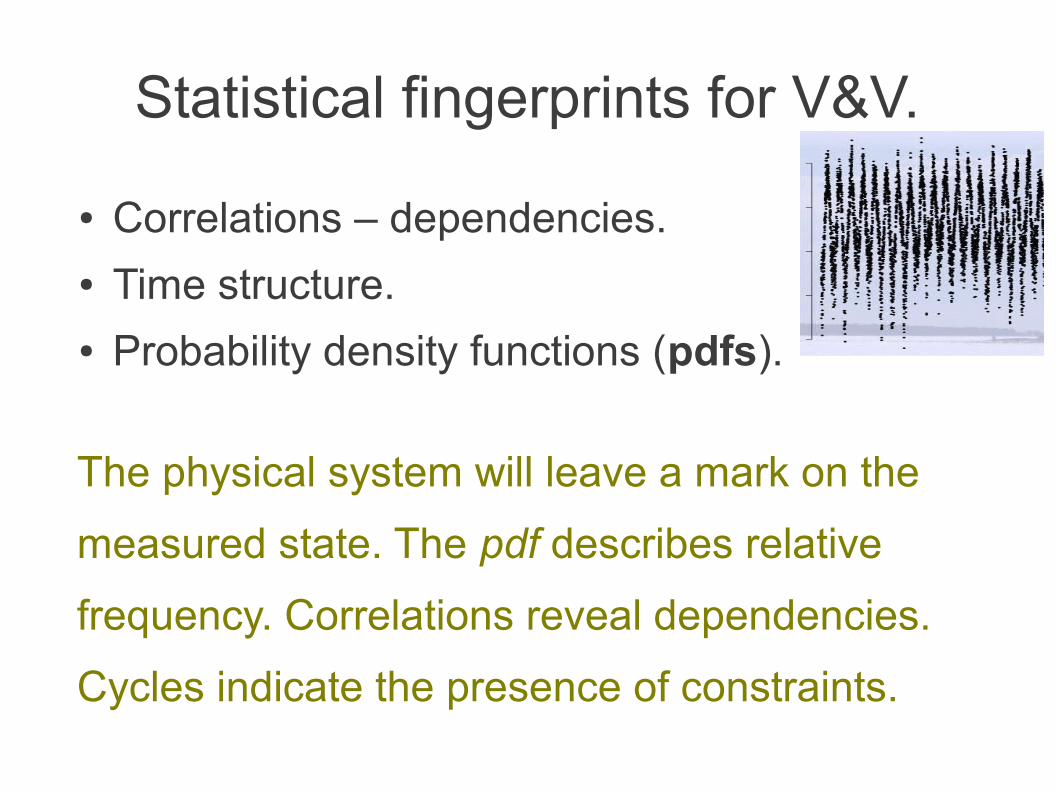
Statistical fingerprints for V&V.
● Correlations – dependencies.● Time structure.● Probability density functions (pdfs).
The physical system will leave a mark on the
measured state. The pdf describes relative
frequency. Correlations reveal dependencies.
Cycles indicate the presence of constraints.
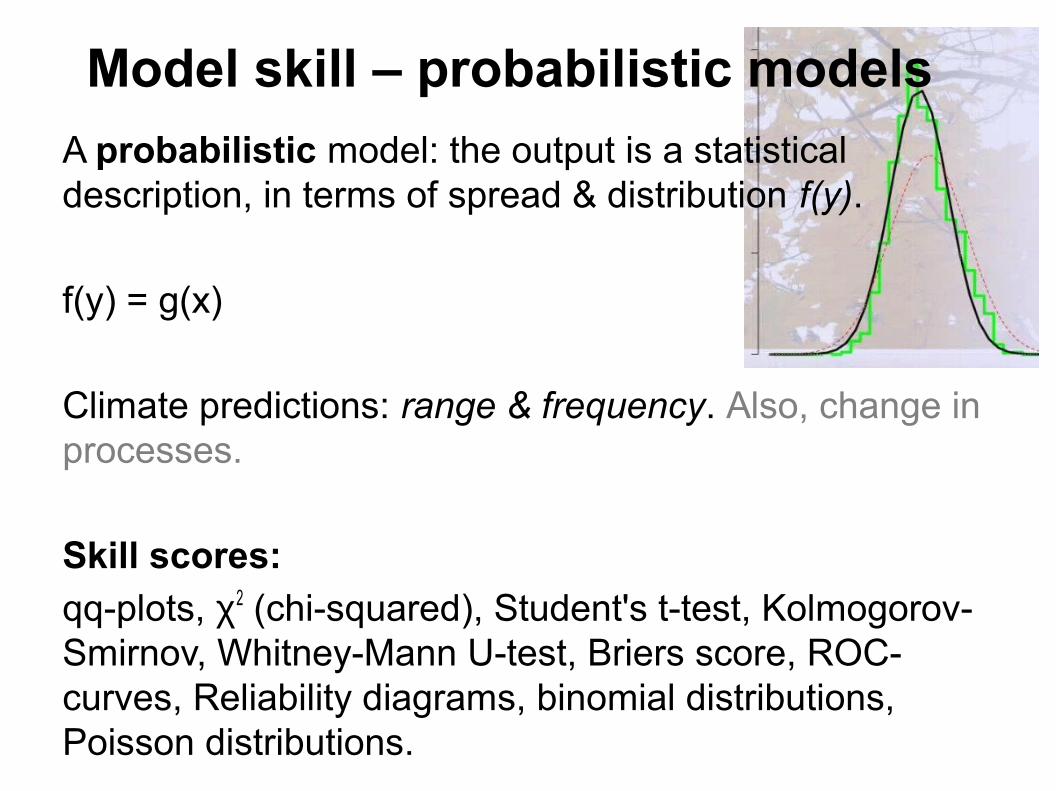
Model skill – probabilistic models
A probabilistic model: the output is a statistical description, in terms of spread & distribution f(y).
f(y) = g(x)
Climate predictions: range & frequency. Also, change in processes.
Skill scores:
qq-plots, χ2 (chi-squared), Student's t-test, Kolmogorov-Smirnov, Whitney-Mann U-test, Briers score, ROC-curves, Reliability diagrams, binomial distributions, Poisson distributions.

V&V: Are the distributions Gaussian?
CM
IP5
long
-ter
m tr
end
coef
ficie
nts

V&V: The student's t-test
OK
Fails

Bias and spread
● Often used in validating climate models● Difference in mean ● Ignores a great deal of information● Spread & Annual cycle
– Simulate the processes well enough?
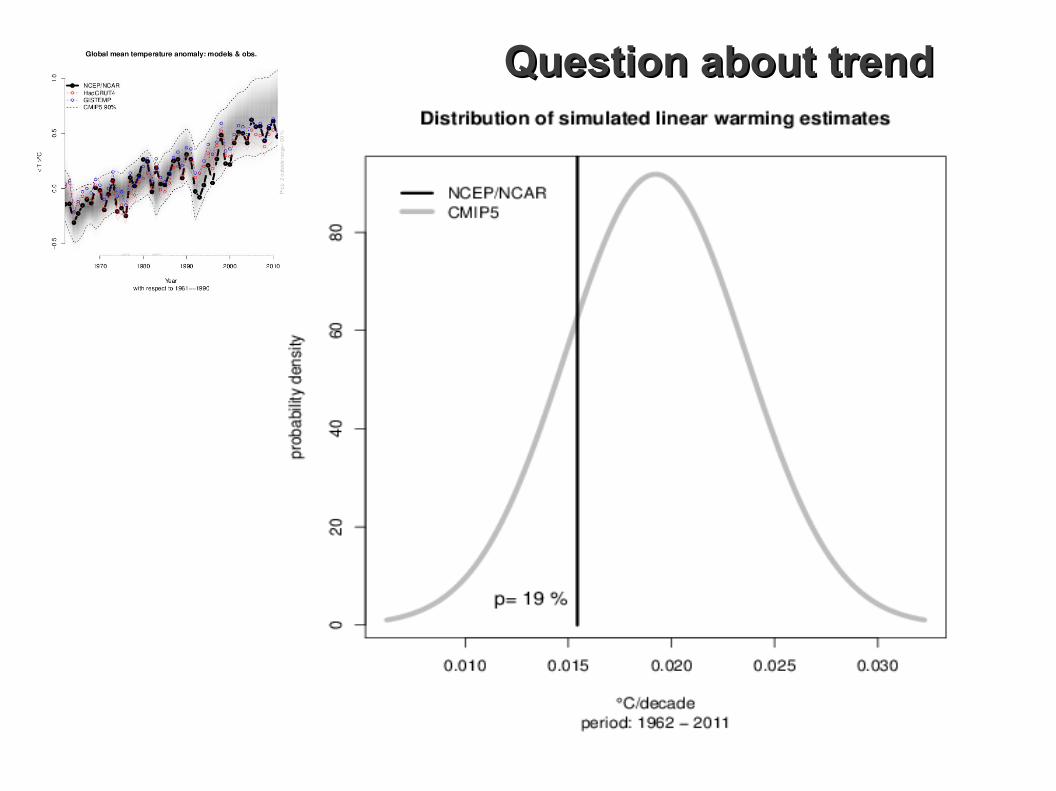
Question about trendQuestion about trend

Predicting probabilities● Rank verification
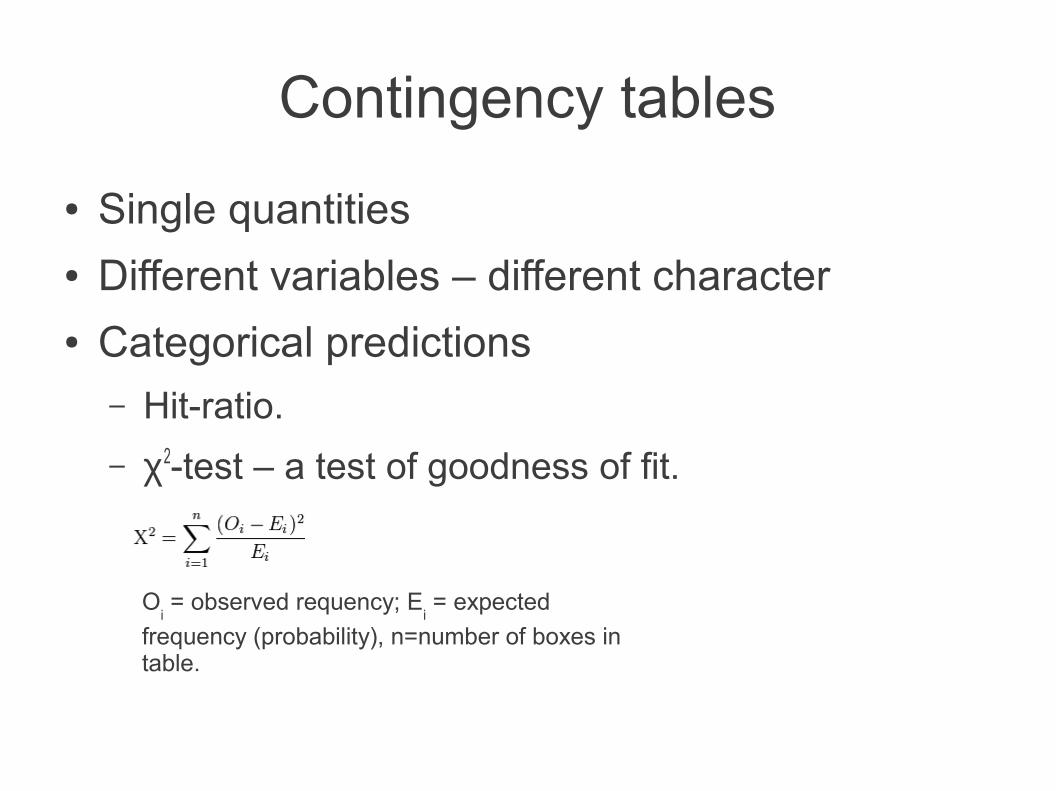
Contingency tables
● Single quantities● Different variables – different character● Categorical predictions
– Hit-ratio.
– χ2-test – a test of goodness of fit.
Oi = observed requency; E
i = expected
frequency (probability), n=number of boxes in table.
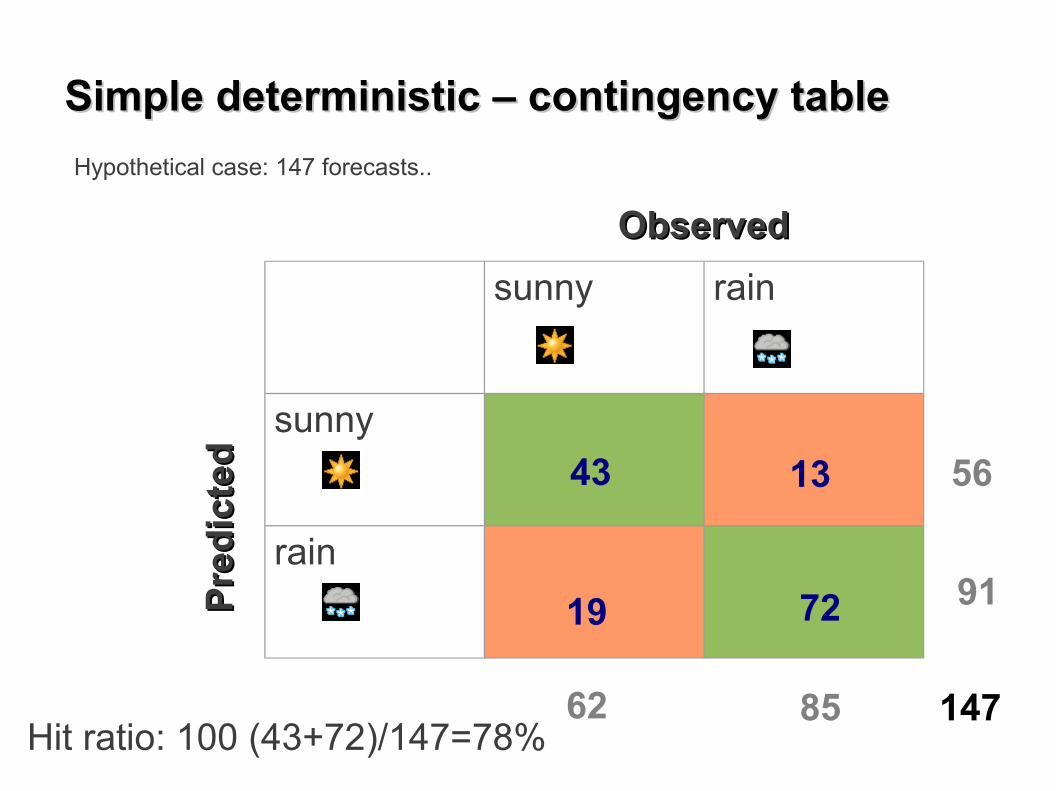
Simple deterministic – contingency tableSimple deterministic – contingency table
sunny rain
sunny
rain
ObservedObservedP
red
icte
dP
red
icte
d
19
13
72
43
Hypothetical case: 147 forecasts..
56
91
8562 147Hit ratio: 100 (43+72)/147=78%
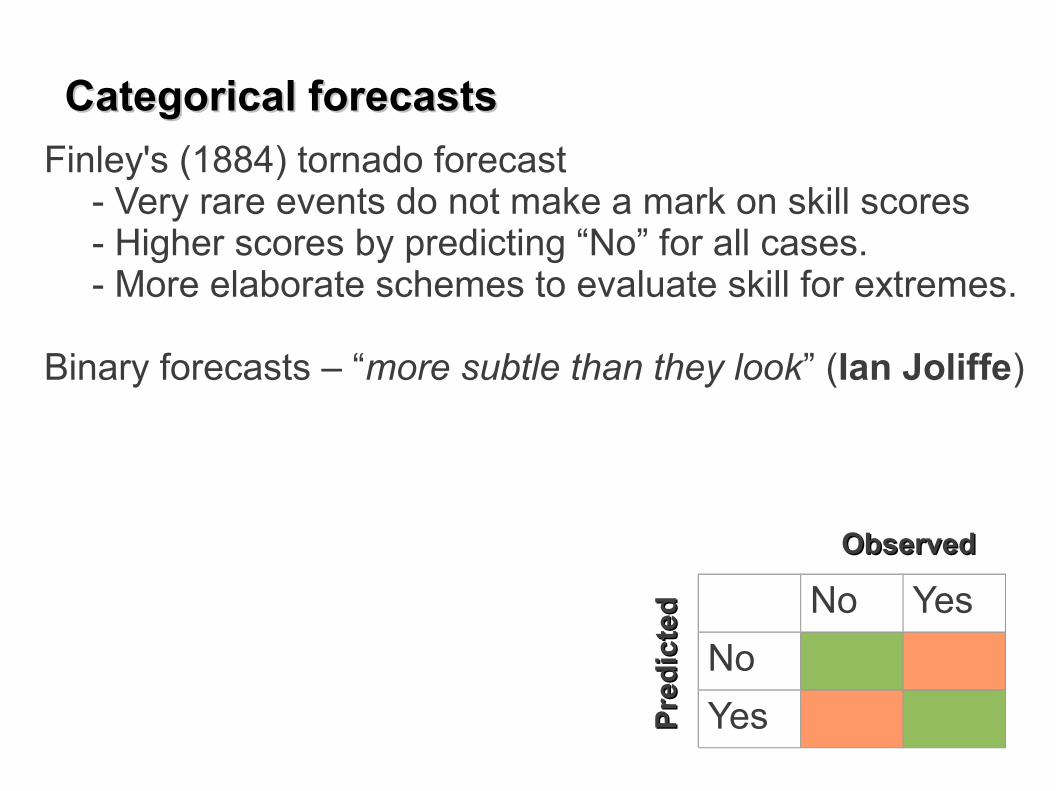
Categorical forecastsCategorical forecasts
No Yes
No
Yes
ObservedObserved
Pre
dic
ted
Pre
dic
ted
Finley's (1884) tornado forecast- Very rare events do not make a mark on skill scores- Higher scores by predicting “No” for all cases.- More elaborate schemes to evaluate skill for extremes.
Binary forecasts – “more subtle than they look” (Ian Joliffe)
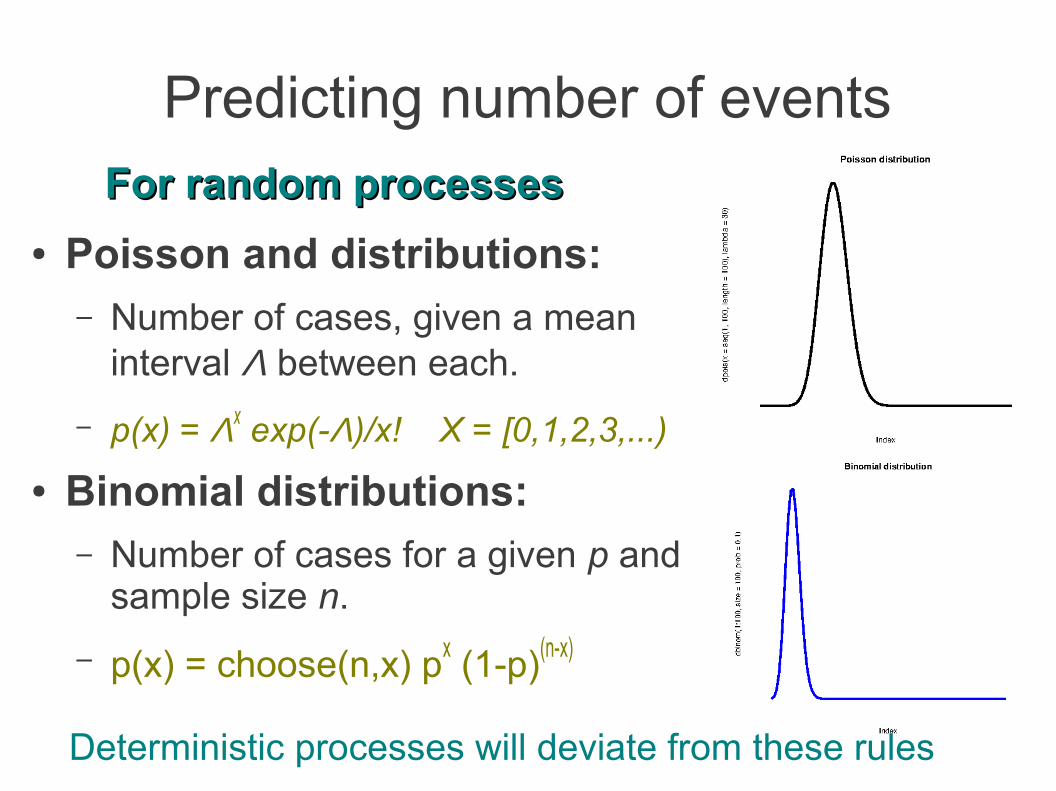
Predicting number of events
● Poisson and distributions:– Number of cases, given a mean
interval Λ between each.
– p(x) = Λx exp(-Λ)/x! X = [0,1,2,3,...)
● Binomial distributions:– Number of cases for a given p and
sample size n.
– p(x) = choose(n,x) px (1-p)(n-x)
For random processesFor random processes
Deterministic processes will deviate from these rules
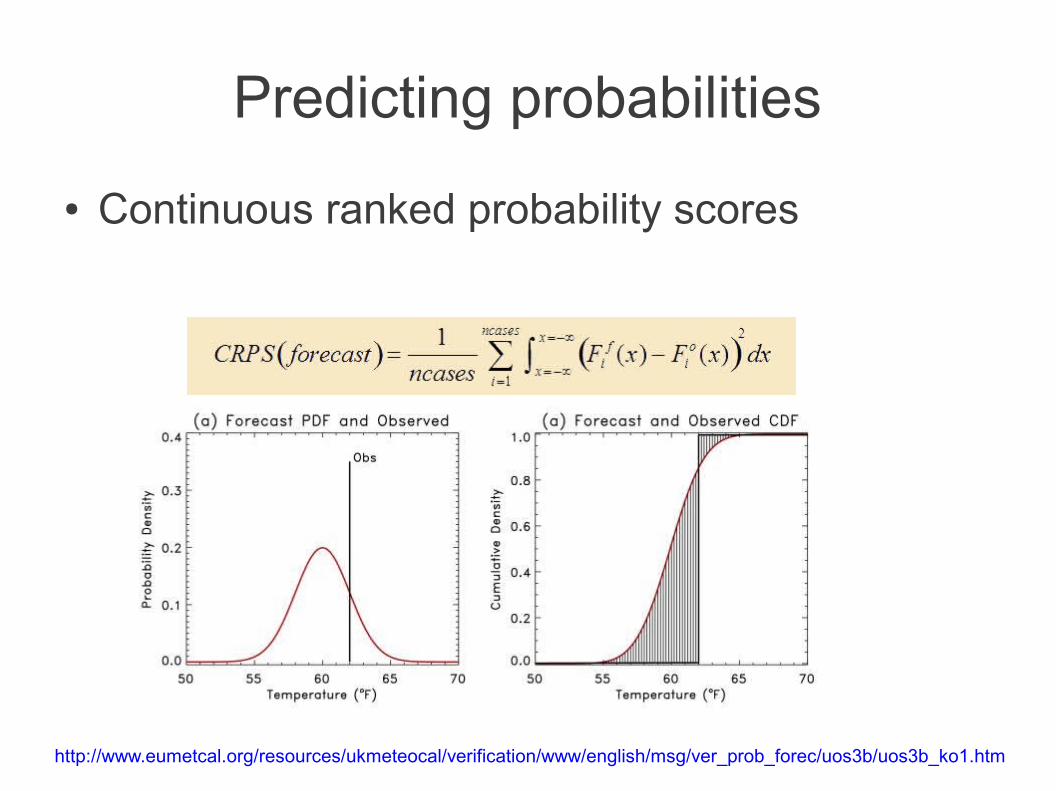
Predicting probabilities
● Continuous ranked probability scores
http://www.eumetcal.org/resources/ukmeteocal/verification/www/english/msg/ver_prob_forec/uos3b/uos3b_ko1.htm
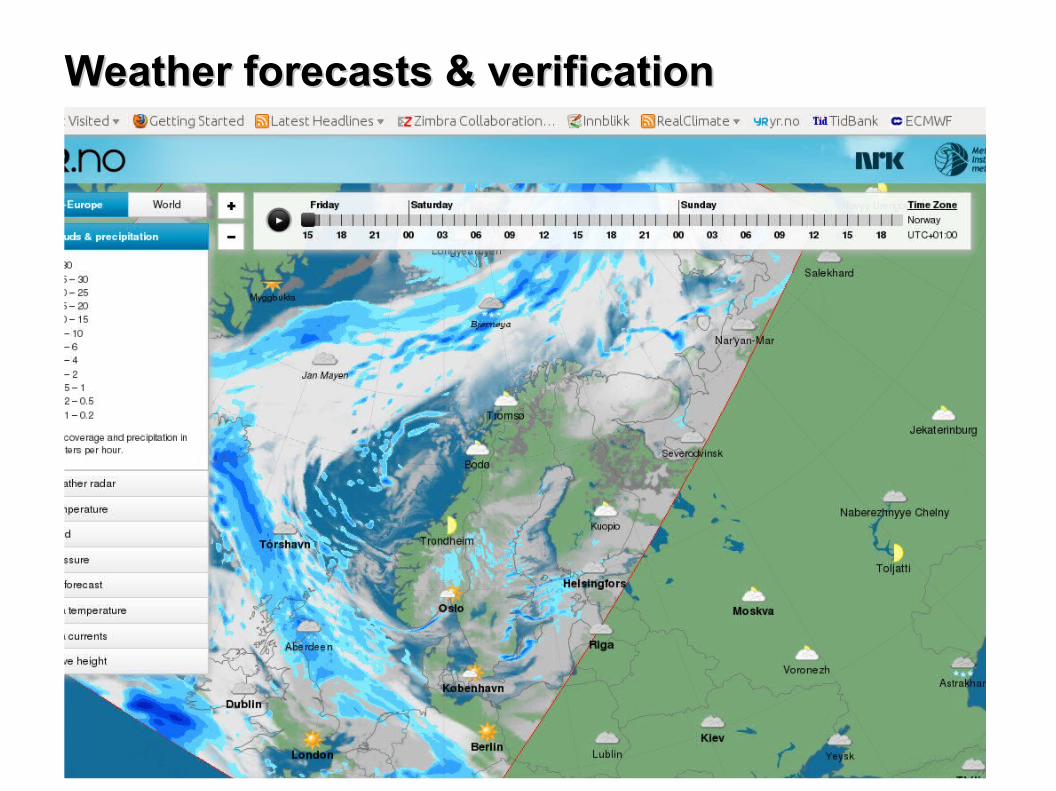
Weather forecasts & verificationWeather forecasts & verification
Weather forecasts – how to assess skill?Weather forecasts – how to assess skill?
● Model simulations take current situation and compute the subsequent evolution.
● Atmospheric motion, temperatures, moisture, and phases (vapour or liquid).
● Time and space: right time or right place?
● Deterministic or probabilistic? How to evaluate predicted chances for rain?
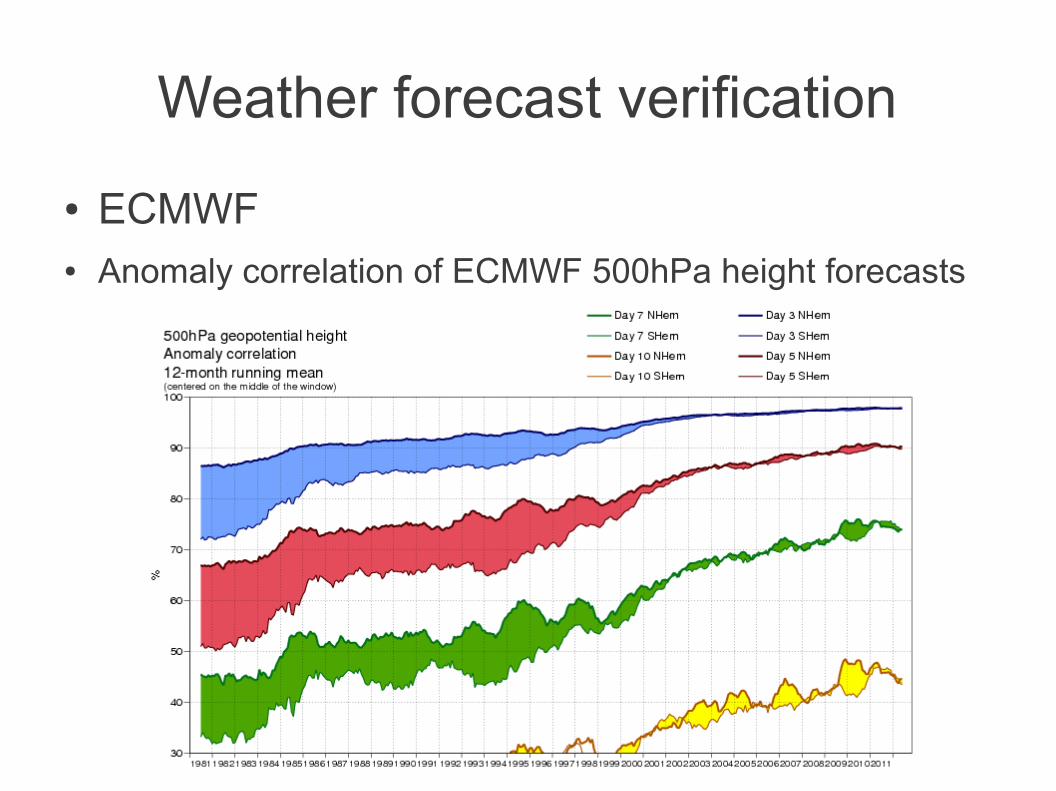
Weather forecast verification
● ECMWF● Anomaly correlation of ECMWF 500hPa height forecasts
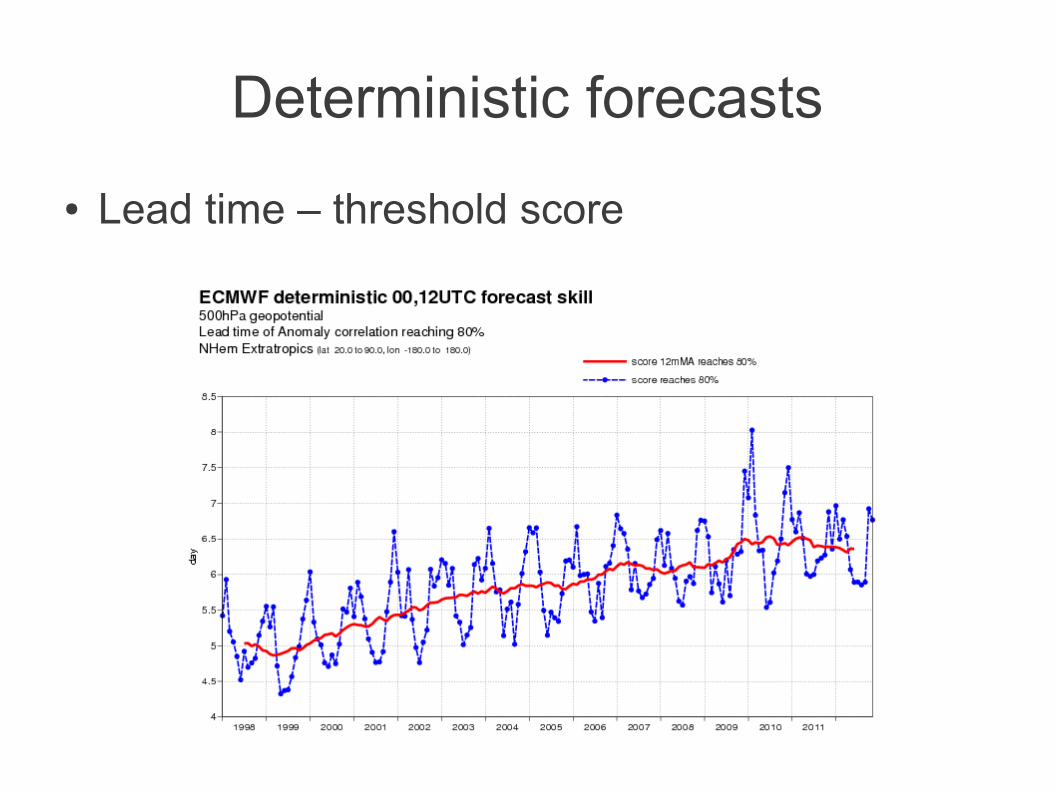
Deterministic forecasts
● Lead time – threshold score
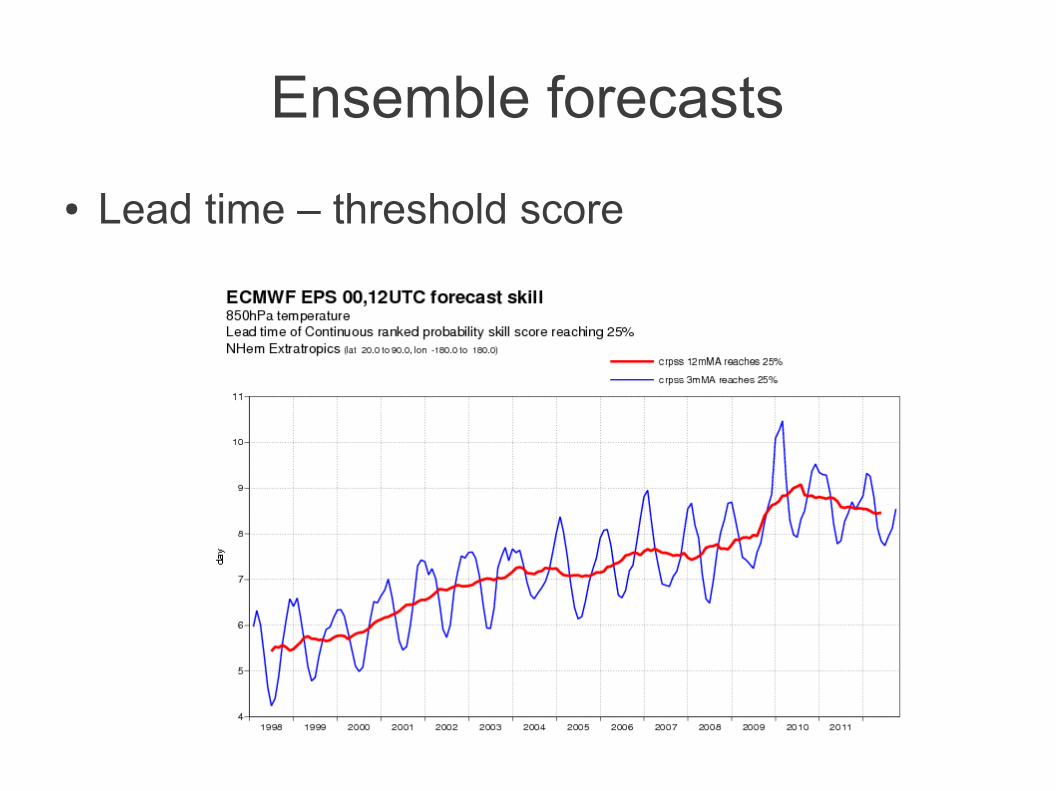
Ensemble forecasts
● Lead time – threshold score
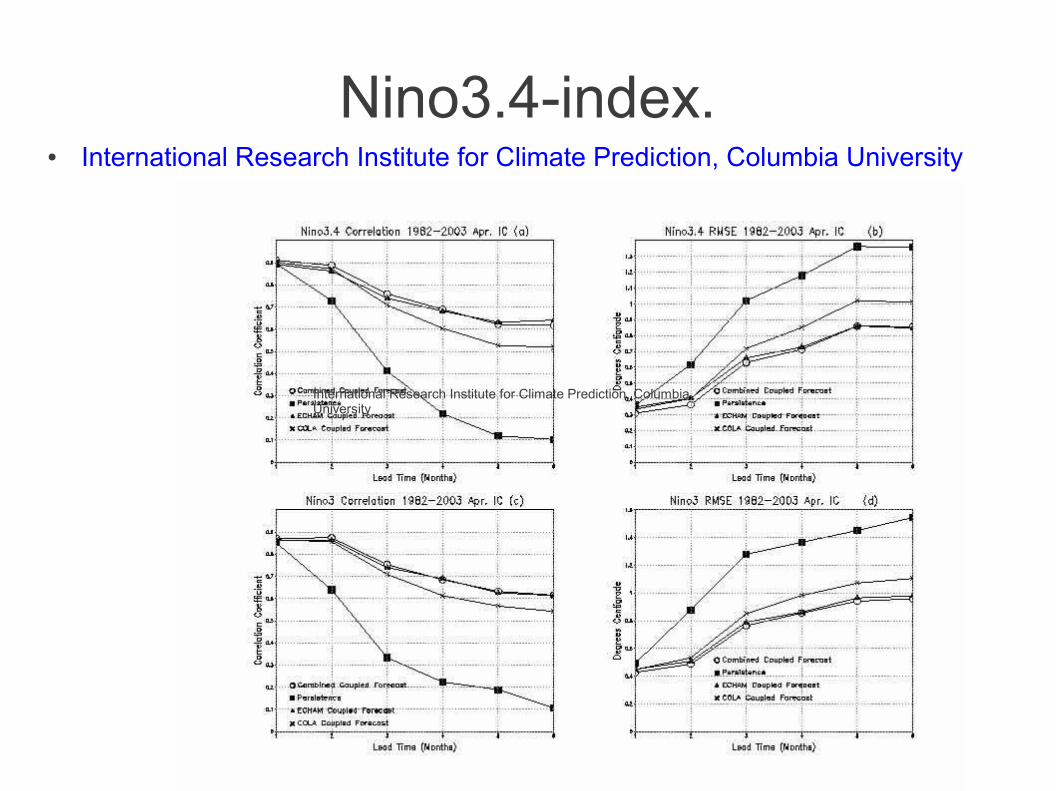
Nino3.4-index.● International Research Institute for Climate Prediction, Columbia University
International Research Institute for Climate Prediction, Columbia University
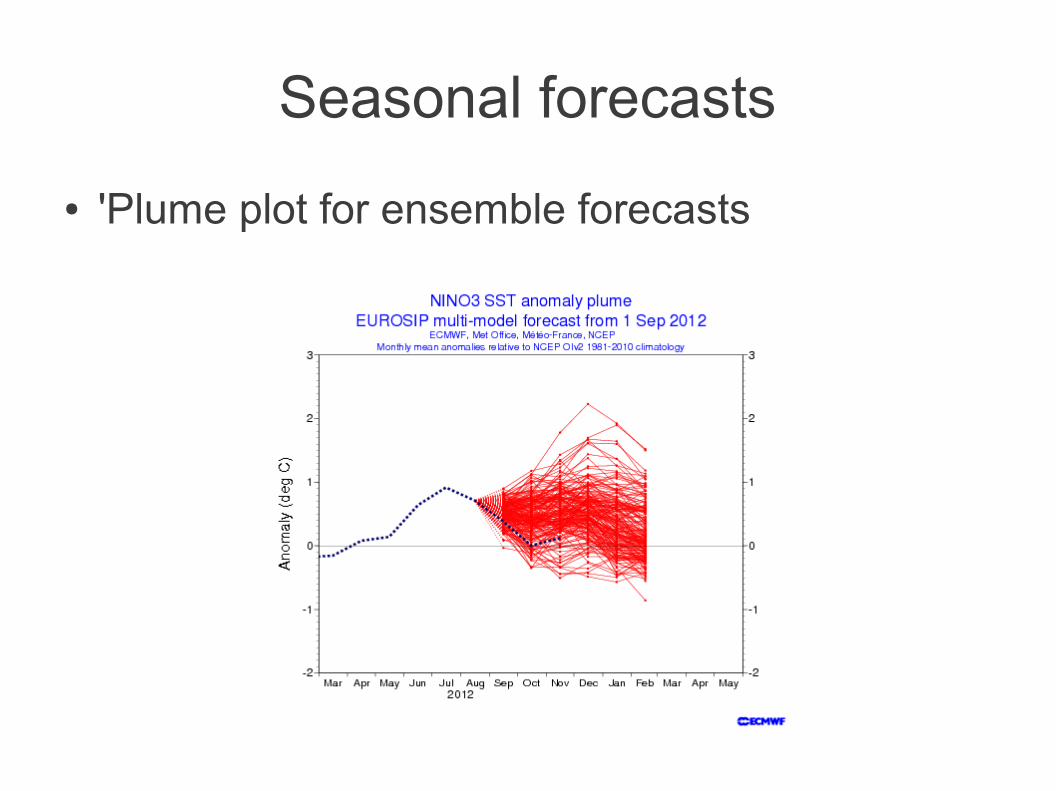
Seasonal forecasts
● 'Plume plot for ensemble forecasts

Reliability diagrams
● WWRP/WGNE Joint Working Group on Forecast Verification Research
http://www.cawcr.gov.au/projects/verification/verif_web_page.html
The Brier score:
http://www.metoffice.gov.uk/media/pdf/j/6/SVSLRF.pdf
http://www.metoffice.gov.uk/research/areas/seasonal-to-decadal/gpc-outlooks/user-guide/interpret-reliability

Relative operating characteristic
● WWRP/WGNE Joint Working Group on Forecast Verification Research
http://www.cawcr.gov.au/projects/verification/verif_web_page.html

Monthly forecasts
● Maps of anomalies.● Spatial correlations

Related Documents


