29 July 2008 JRC Customer Satisfaction Survey 2008 Final report www.technopolis-group.com EPEC Contact name and address for this study: Sophie Bussillet Technopolis France S.A.R.L. 55 rue des Petites Ecuries 75010 Paris France T +33 1 49 49 09 22 F +33 1 49 49 09 29 [email protected] www.technopolis-group.com European Policy Evaluation Consortium (EPEC) Brussels contact address: 25 rue de la Sablonnière – B-1000 Brussels Tel: +32 2 275 0100 Fax: +32 2 275 0109 E-mail: [email protected] URL: www.epec.info

Welcome message from author
This document is posted to help you gain knowledge. Please leave a comment to let me know what you think about it! Share it to your friends and learn new things together.
Transcript
29 July 2008
JRC Customer Satisfaction Survey 2008
Final report
www.technopolis-group.com
EPEC Contact name and address for this study:
Sophie Bussillet
Technopolis France S.A.R.L.
55 rue des Petites Ecuries
75010 Paris
France
T +33 1 49 49 09 22
F +33 1 49 49 09 29
www.technopolis-group.com
European Policy Evaluation Consortium (EPEC) Brussels contact address: 25 rue de la Sablonnière – B-1000 Brussels Tel: +32 2 275 0100 Fax: +32 2 275 0109 E-mail: [email protected] URL: www.epec.info

JRC Customer Satisfaction Survey 2008 i
Table of Contents 1. Objectives of the CSS 2008 3
1.1 Context of the survey 3 1.2 Objectives 3 1.3 Perimeter of customers 3
2. Presentation of the survey stakeholders 5
2.1 The JRC… 5 2.2 …and its customers 5
3. Methodology of the survey 7
3.1 Revision and adaptation of 2005 JRC web-based questionnaire 7 3.2 Setting-up of web-based questionnaire 8 3.3 Customer sample population 8 3.4 Data collecting, processing and analysis 8 3.5 Limitation of the 2008 survey 10 3.6 Interviews with JRC customers 10
4. Profile of respondents and responses 13
4.1 Identification of respondents 13 4.2 The JRC Institutes and Directorates 15
5. Nature of collaboration with the JRC Institutes/ Directorate 18
5.1 Nature of the contact with the JRC 18 5.2 Duration of the collaboration between JRC and its customers 18 5.3 Customer relation with the JRC 19 5.4 Types of support from the JRC 24
6. Reasons for collaborating with the JRC 32
6.1 Origin of partnership 32 6.2 Specific reasons for choosing to collaborate with the JRC 33
7. Customer satisfaction 37
7.1 Satisfaction with the JRC products and services by project phase 37 7.2 General satisfaction with the JRC products and services 46 7.3 Satisfaction regarding communication about the project 50
8. Overall assessment 53
8.1 General opinion on the project 53
JRC Customer Satisfaction Survey 2008 ii
8.2 Satisfaction of paying customers 57 8.3 Importance of the JRC contribution 59 8.4 Coverage of JRC activities 61 8.5 Personal plans for future collaboration and recommendation to others 63 8.6 The JRC compared to its alternatives 66
9. Improvements: opinions of JRC customers 67
9.1 Expressions of satisfaction or dissatisfaction 67 9.2 Alternatives to the JRC 68 9.3 Future improvements 69 9.4 Final comments 70
10. Recommendations 71
10.1 Strengths of JRC 71 10.2 Weaknesses of JRC 71 10.3 Recommendations 71
Appendix A 73
A.1. Table of Exhibits 73 A.2. Table of Figures 74
Appendix B 77
B.1. Introduction 77 B.2. Your profile [of Internal customers] 78 B.3. Your profile [of External customers] 80 B.4. Relation with the JRC [both External and Internal customers] 83 B.5. Customer satisfaction by project phase [both External and Internal customers] 84 B.6. General satisfaction [both External and Internal customers] 85 B.7. Your Profile 86 B.8. Conclusion [both External and Internal customers] 87 B.9. Thank you 88
Appendix C 89
C.1. Index calculation 89 C.2. Overall results 90 C.3. Results for the main aspects of collaboration 91 C.4. Global adherence index 91 C.5. Adherence indexes per JRC Institute/Directorate 92
Appendix D 93
Appendix E 95
JRC Customer Satisfaction Survey 2008 iii
E.1. Internal respondents 95 E.2. External respondents 95
Appendix F 97
F.1. Internal respondents 97 F.2. External respondents 97
Appendix G 99
G.1. Internal respondents 99 G.2. External respondents 99
Appendix H 101
H.1. Internal respondents 101 H.2. External respondents 101
Appendix I 102
I.1. Internal respondents 102 I.2. External respondents 102


JRC Customer Satisfaction Survey 2008 i
Executive summary
Building on the surveys carried out in 2003 and 2005, the JRC wants to assess its customers’ opinions and needs, in order to improve its services and products. To this end, the JRC gave its customers the opportunity to express their views on various aspects of their interactions with the JRC with a new edition of the survey: the 2008 JRC Customer Satisfaction Survey (CSS).
The CSS aims to collect statistically relevant information in order to extract indices that will enable a tracking and analysis of the temporal evolution of customer satisfaction at corporate and Institute level. Precisely, its objectives are to :
• monitor JRC’s customers' satisfaction;
• identify shortcomings and the way to improve working with customers;
• analyse the survey results at Institute level;
• understand needs and expectations of customers with regard to the activities of JRC and its communication vis-à-vis its customers.
The CSS identifies the opinion and needs of JRC customers through an analysis of:
• reasons and motivations that lead to working with the JRC;
• how customers perceive the JRC;
• the nature of customers’ relationship with the JRC;
• the rationale for customers’ satisfaction or dissatisfaction;
• the overall assessment of collaboration with the JRC and customers’ interest in continuing this collaboration.
The survey included a web-based questionnaire addressed to customers internal to the European Commission (with a response rate of 33%) and to customers external to the European Commission (with a response rate of 30%). EPEC guaranteed the confidentiality of the responses, which have been processed anonymously, in respect of the JRC Customer Survey privacy statement.
The questionnaire was divided into five sections addressing the following issues:
• organisation of respondents and identification of the Institutes/Directorate they collaborate with
• reasons for teaming up with JRC
• characterisation of the relationship
• satisfaction of respondents
• overall assessment
Each customer was offered the possibility to answer to the questionnaire for one or several Institutes/Directorate they have been working with. Thus, respondents that have received a final product or a service from more than one JRC Institute were given the opportunity to respond to several questionnaires for each JRC Institute and/or Directorate they have been cooperating with during the period 2005-2008.
Additionally, 18 interviews with these two types of customers provided a deeper understanding of some of survey results.
JRC Customer Satisfaction Survey 2008 ii
This executive summary highlights general results regarding JRC customers’ satisfaction on the main aspects of JRC support.
Contact database and sample of respondents
EPEC constructed the contact database based on the contacts provided by JRC Institutes/Directorate. This approach created a sufficient number of survey responses to guarantee the significance and representativeness of the results.
Four Directorates-General make up 42% of Internal respondents: DG Environment, DG Health and Consumer Protection, DG Energy and Transports and DG Enterprise and Industry. External respondents mainly belong to authorities/administrations in EU Member States and to research organisations, as well as international organisations and stakeholders (i.e. industry, NGOs…).
The Institute with most Internal respondents in percentage is the IPSC, and most External respondents work with the IES. The other two main partners of Internal respondents are IES and IPTS, while External respondents collaborate mostly with IRMM and IPSC. In all cases (both External and Internal customers) collaborations are built upon a mid- to long-term relationship with the JRC.
Policy support documents are by far the most numerous outputs of JRC.
The main Commission policy areas from which the respondents have received support from the JRC are Environment for Internal customers, as well as both Research and innovation and Energy for External customers.
Reasons for collaborating with JRC
A majority of respondents consider that they have worked with the JRC because it is the organisation charged with the product, activity or service they looked for – especially External ones. Internal customers consider for more than 50% that they have directly chosen to work with the JRC.
The comparison with 2005 shows an increase in the respondents (both External and Internal) considering they work with the JRC because it is the organisation charged with the product, activity or service they looked for.
The first main reason for directly choosing the JRC as a partner for a project is its competence in the field.
Characterisation of the relationship
The majority of JRC customers are non-paying customers. Most of External customers are non-paying customers.
The comparison with the 2003 and 2005 surveys highlights a strong increase in the proportion of paying customers among Internal customers.
General satisfaction
The approach chosen for the survey consisted of employing a number of related questions to investigate the overall results of projects carried out by JRC. By combining these various angles, one obtains a better understanding of both the level of the achievements of the partnerships with JRC, and the added value created by JRC during these partnerships.
A first approach deals with scientific quality, management quality, relevance and overall performance of JRC support.

JRC Customer Satisfaction Survey 2008 iii
An overview of the satisfaction of JRC customers is provided by the calculation of adherence indexes1 for the four principal aspects of collaborations between the JRC and its customers (Exhibit 1). An adherence index is a synthetic measure of the distribution of customers’ expressed satisfaction that varies from 100 if all respondents claimed they were satisfied to 0 if all respondents claimed they were not satisfied.
As in 2005, it appears that the strengths and the added value of the JRC relate to the scientific quality of its products and services. The relevance of these services and products, which is an expression of the JRC’s understanding of its customer needs, also appears highly satisfactory. However, the ability of the JRC to manage the project only partially lives up to the customers’ expectations. The overall performance of the project, which combines these three aspects, is assessed positively.
Exhibit 1 Adherence indexes of satisfaction on four aspects of the collaboration, all customers
Adherence indexes The overall scientific quality of the product or service 78,0 The overall quality of the management of the project 71,6 The relevance of the product or service to your purpose 76,5 The overall performance of the project was satisfactory 73,0
These results are valid for all customers taken together. However, when customers from inside and outside the European Commission (respectively Internal customers and External customers) are distinguished, the analysis shows that External customers are more satisfied with the quality of the management of the project and the overall performance of the project, and Internal ones with the overall scientific quality of the support provided and the relevance of the product or service to their purpose.
These results are robust as they are supported by a more detailed analysis across different phases of the collaborative projects. These results are also fully supported by the interviews with a sample of customers. Moreover, when balancing these strengths and weaknesses, the net result is by far positive. Evidence of this positive assessment is to be found in the customers’ willingness to cooperate again with JRC and to recommend JRC to other potential customers. This assessment is confirmed through interviews.
Satisfaction of respondents by project phase
The survey allows an in-depth investigation of the satisfaction of respondents, according to the three main phases of the project(s) they have carried out with the JRC: planning, implementation and completion of the project.
The results confirm the general results: the large majority of customers are satisfied with the scientific and technical competencies and facilities provided by the JRC during the project. Customers are more particularly satisfied with the communication with the JRC (the level of satisfaction regarding communication has moreover increased since 2005), as well as interactions during the planning of the project. However, implementation and completion phases are judged less satisfactory, especially:
• the JRC adequacy of human resources;
• its ability to give sufficient and appropriate response to new or changing needs;
1 The methods of calculation of adherence indexes as well as a synthesis of results obtained with this proxy are presented in Appendix C.

JRC Customer Satisfaction Survey 2008 iv
• its administrative and financial handling of the project;
• its reliability in meeting deadlines.
Management abilities of JRC in coordinating and operating the project are therefore still a weak point of the organisation, like in 2005, although overall the level of satisfaction (“very satisfied” and “satisfied” customers) is higher in 2008 than in 2005, including for these weak points.
Possible improvements: opinions of JRC customers
Respondents had the opportunity to express the reasons behind their satisfaction and dissatisfaction, and also to suggest recommendations to improve the activities of JRC. Overall these open questions completed and deepened the quantitative data of the web-based consultation analysed supra, and a cross-analysis with interview results raised issues that otherwise would have remained unknown.
Very satisfied respondents underline a good cooperation with the JRC mainly explained by its high technical and scientific knowledge and expertise, high human resources capacities, good management (timely response, expected results achieved), good understanding of customers needs, quality of the work achieved, and good communication. Internal customers also highlight the independence of the JRC as a strong factor of satisfaction. External customers highlight a granted access to information and technology not available otherwise.
Very unsatisfied customers mainly emphasise the lack of human resources competencies and involvement, bad management (deadlines, quality of delivery), bureaucratic procedures, products and services not enough oriented towards the customers demand, and the fact that areas of competence of each Institute are not well defined. Interviews moreover highlighted that the JRC has its own (research) priorities, which can lead to the abandon of a research area of interest for a customer, or to the impossibility to negotiate the content/priorities of the service or product provided.

JRC Customer Satisfaction Survey 2008 1
Introduction This report is the final report of the Corporate Customer Satisfaction Survey (hereafter CSS) 2008 of the Joint Research Centre (JRC) of the European Commission. The report is produced by EPEC eeig2. The grouping comprises three companies: the Tavistock Institute; GHK Consulting Ltd and Technopolis Group.
Technopolis Group and the Tavistock Institute are both assigned to implement the Corporate Customer Satisfaction Survey 2008.
This study is produced within the framework of the Request for Services from the Joint Research Centre, dated 23 August 2007, and undertaken within the Lot 1 Framework Contract for ex-ante evaluation (reference BUDG-02-01-L1).
Building on the surveys carried out in 2003 and 2005, the JRC wants to assess its customers’ opinions and needs, in order to improve its services and products. To this end, the JRC gave its customers the opportunity to express their views on various aspects of their interactions with the JRC with a new edition of the survey.
The survey included a web-based questionnaire addressed to customers internal to the European Commission and to customers external to the European Commission. Additionally, interviews with these two types of customers provided a deeper understanding of some of the survey results.
This report drafts the results of the quantitative investigations phase, completed by the results of qualitative investigations (interviews with JRC customers).
The report is set out in 10 sections:
• Objectives of the CSS 2008
• Presentation of the survey stakeholders
• Methodology of the survey
• Profile of respondents and responses
• Nature of collaboration with the JRC Institutes/Directorate
• Reasons for collaborating with the JRC
• Customer satisfaction
• Overall assessment
• Improvements: opinions of JRC customers
• Recommendations from EPEC
2 Eeig : European Economic Interest Grouping; EPEC : European Policy Evaluation Consortium

JRC Customer Satisfaction Survey 2008 3
1. Objectives of the CSS 2008
1.1 Context of the survey
Since 2003, the JRC carries out corporate Satisfaction Surveys in order to assess the quality of the support provided to its customers and their degree of satisfaction, and therefore to enable improvement initiatives.
The Customer Satisfaction Survey (CSS) 2008 is the 3rd edition of the survey, following the 2003 and 2005 editions3. It includes data collection through a web-based questionnaire as well as a series of telephone interviews on a subset of customers to be implemented in the qualitative investigations phase of the study.
1.2 Objectives
The CSS aims to collect statistically relevant information in order to extract indices that will enable a tracking and analysis of the temporal evolution of customer satisfaction at corporate and Institute level.
Precisely, its objectives are to :
• monitor JRC’s customers' satisfaction;
• identify shortcomings of JRC support and the way to improve working with customers;
• analyse the survey results at Institute level;
• understand needs and expectations of customers with regard to the activities of JRC and its communication vis-à-vis its customers.
The CSS identifies the opinion and needs of JRC customers through an analysis of:
• reasons and motivations that lead to working with the JRC;
• how customers perceive the JRC;
• the nature of customers’ relationship with the JRC;
• the rationale for customers’ satisfaction or dissatisfaction;
• the overall assessment of collaboration with the JRC and customers’ interest in continuing this collaboration.
1.3 Perimeter of customers
JRC customers included in the survey are defined as those that have received a final product or a service from at least one of the JRC Institutes and/or the Directorate for Programmes and Stakeholders Relations since 1 September 2005.
3 Previous surveys were called "User satisfaction surveys" (USS).

JRC Customer Satisfaction Survey 2008 4
Partners in research networks, including Indirect Actions, and beneficiaries of the JRC’s work within the JRC are not considered customers and they are therefore not included in the survey.

JRC Customer Satisfaction Survey 2008 5
2. Presentation of the survey stakeholders
The two relevant entities of this survey are the JRC Institutes and one Directorate on the one hand, and their customers on the other hand, which can be either external or internal to the European Commission (hereafter, respectively referred to as “External” and “Internal” customers).
2.1 The JRC…
The JRC is a Directorate-General of the European Commission, staffed with about 2 700 people. It employs researchers as well as technical and administrative personnel.
The mission of the JRC is to provide customer-driven scientific and technical support for the conception, implementation and monitoring of EU policies. As a service of the European Commission, the JRC functions as a reference centre of science and technology for the European Union. Close to the policy-making process, it serves the common interest of the Member States, while being independent of special interests, whether private or national.
The JRC consists of seven Institutes, each with its own focus of expertise, located in five separate sites around Europe (cf. below) and three "horizontal" Directorates located in Brussels and Ispra4. The Directorate for Programmes and Stakeholders Relations (DPSR) provides co-ordination and serves as a link between the institutes on the one hand and policymakers and stakeholders on the other hand. The Directorate co-ordinates the research performed by the seven institutes and helps to ensure its quality by interacting with the international scientific community and industry. An important role of the Directorate is to promote technology transfer of JRC’s own research results both to create industrial added value for competitiveness and growth in Europe and to support the Community’s policies on innovation.
The seven JRC Institutes, located in Belgium, Germany, Italy, the Netherlands and Spain, are:
• the Institute for Reference Materials and Measurements (IRMM, Geel, Belgium)
• the Institute for Transuranium Elements (ITU, Karlsruhe, Germany)
• the Institute for Energy (IE, Petten, Netherlands)
• the Institute for the Protection and the Security of the Citizen (IPSC, Ispra, Italy)
• the Institute for Environment and Sustainability (IES, Ispra, Italy)
• the Institute for Health and Consumer Protection (IHCP, Ispra, Italy)
• the Institute for Prospective Technological Studies (IPTS, Sevilla, Spain)
2.2 …and its customers
The final beneficiary of the work of the JRC is the European citizen, since JRC’s work should be beneficial to, among other domains, the environment, the social welfare and the economy. The major stakeholders in the implementation of its mission are
4 Directorate for Programmes and Stakeholders Relations (Brussels), Directorate for Resource Management (Brussels and Ispra), Ispra Site Directorate (Ispra).

JRC Customer Satisfaction Survey 2008 6
therefore the European Parliament and Member States’ organisations responsible for the implementation and monitoring of EU policy.
However, in the context of the CSS it is important to focus on the direct customers of the JRC. These are defined as those who have received a final product or service from the JRC. The different types of JRC customers are classified in Exhibit 2. A final product or service can be defined as a JRC deliverable (reports, samples, databases, algorithms, analyses, etc.) supplied to support:
• European policy makers;
• National competent authorities;
• International organisations, and/or
• Third party contractors.
Exhibit 2 Types of JRC customers
Type Definition
Internal to the European Commission
Individual working in a Directorate-General of the European Commission that has received a product or service since 2005
External to the European Commission
Individual working in an organisation other than the European Commission and that has received a product or service since 2005: Representative of another European Union institution or Agency, a
national authority or a private firm
Paying customers
Customers that have paid for the reception of a product or service in the framework of an Administrative Arrangement between the JRC
and a customer DG or in the framework of Third Party Work contracts
Non-paying customers Non-paying customers receiving products and services as defined in the JRC annual Work Programme financed by institutional budget
Single Customers that have received a final product or a service from only
one JRC Institute
Multiple Customers that have received a final product or a service from more
than one JRC Institute

JRC Customer Satisfaction Survey 2008 7
3. Methodology of the survey
The JRC Customer Satisfaction Survey 2008 relies upon data collected through a web-based questionnaire as well as upon a series of telephone interviews with a subset of customers of the services of the different JRC Institutes/Directorate.
The following sections outline the methodology followed for the 2008 CSS.
3.1 Revision and adaptation of 2005 JRC web-based questionnaire
The questionnaire of the 2005 JRC survey has been revised and adapted ensuring that:
• it allows analysis of results at corporate and Institute level
• the new version enables a comparability of results with the previous satisfaction surveys.
The 2005 structure of the questionnaires for Internal and External customers was kept. The main changes to the questionnaire were built upon the lessons learned from the 2005 survey.
Firstly, the distinction between multiple and single customer (cf. definition in Exhibit 2) made statistical treatments very difficult in the previous survey. Moreover, 2005 results have pointed out that there are only few multiple customers. Consequently, in the 2008 CSS, the same questionnaire was sent to both multiple and single customers offering the possibility for each customer to answer to the questionnaire for one or several Institutes/Directorate they have been working with. Thus, respondents that have received a final product or a service from more than one JRC Institute and that have wished to respond to more than one questionnaire were given the opportunity to respond to several questionnaires (in general, maximum three5), for each JRC Institute and/or Directorate they have been cooperating with during the period 2005-2008.
Secondly, a significant modification concerned Directorates: The Directorate for Programmes and Stakeholders Relations (DPSR) is the sole Directorate included in the survey since it is the only one, through its Intellectual Property and Scientific Co-operation Unit and Customer and Stakeholder Relations Unit, to have customers in the sense used in the survey.
Thirdly, some questions have been added, for instance the duration of the collaboration between JRC and its customers, and a mapping of JRC competitors. Some questions have also been simplified to appear as clear and as short as possible. This is especially the case for the questions regarding satisfaction: instead of proposing the choices “strongly agree, somewhat agree, somewhat disagree, strongly disagree” (as in the 2003 and 2005 surveys), EPEC simplified these choices in “strongly agree, agree, disagree, strongly disagree”.
The new version of the questionnaire for the 2008 CSS has been approved by the JRC. It is presented in Appendix A.
5 Only one respondent completed more than three questionnaires (5 questionnaires).

JRC Customer Satisfaction Survey 2008 8
3.2 Setting-up of web-based questionnaire
The 2008 CSS was uploaded on a dedicated, protected Internet server. The on-line questionnaire allows quick statistical treatments and immediate results. The on-line survey contains integrated list management and mailing software that generates the emails and assigns each participant a dedicated questionnaire link that allows their responses to be individually tracked.
The survey is anonymous and all data protection issues have been scrupulously observed, in compliance with Regulation (EC) No. 45/2001 of the European Parliament and of the Council of 18 December 2000 on the protection of individuals with regard to the processing of personal data by the Community institutions and bodies and on the free movement of such data.
The questionnaire was tested on-line, in real conditions, by the JRC and EPEC, and modified accordingly.
The close interaction with the JRC also concerned the design of the information letter to be sent by the JRC to DGs in the Commission, and the confidentiality statement made available to respondents.
3.3 Customer sample population
The JRC provided a customer database including contact information and name of customer organisation.
An invitation to participate in the survey was sent to all contacts in the JRC customer database (customers since 1 September 2005). This approach allowed a sufficient number of responses, which guarantees the robustness of results.
The survey treated Internal and External customers irrespective of their hierarchical position in the organisation. This policy was adopted since the 2005 survey had revealed that responses from sub-populations belonging to higher and lower positions respectively, had no statistical differences.
3.4 Data collecting, processing and analysis
Once the questionnaires, email message and contact databases prepared and approved by the JRC, the survey was launched after a series of test messages.
All individuals of each category of respondent (cf. Exhibit 2) received a dedicated electronic invitation to respond to the relevant questionnaire (Internal or External).
The invitation was sent two weeks after the Director General of the JRC had sent a formal announcement of the survey to the Directors General of the Commission DGs .
The web-based survey was implemented as follows:
• the two surveys (for Internal and External customers) were available on-line from 21 February to 12 March 2008;
• the invitations to respond to the survey were sent to all the contacts provided by the JRC;
• two reminders were also sent to all non-respondents.
JRC Customer Satisfaction Survey 2008 9
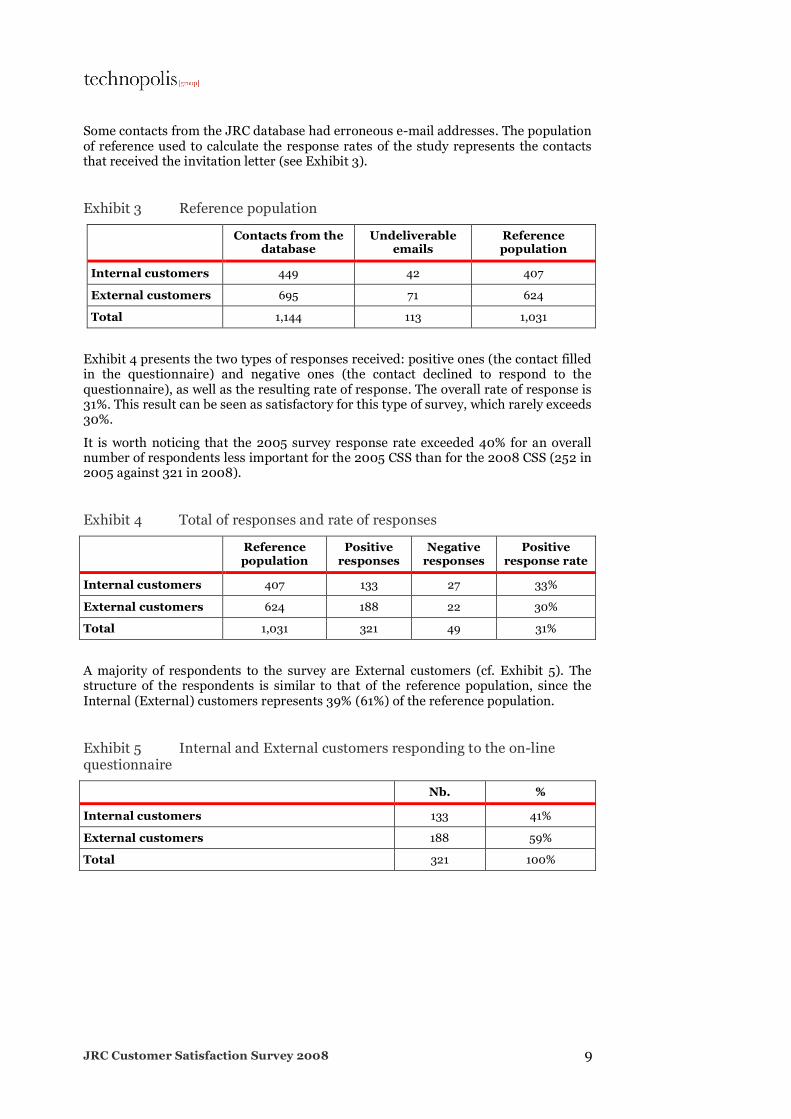
Some contacts from the JRC database had erroneous e-mail addresses. The population of reference used to calculate the response rates of the study represents the contacts that received the invitation letter (see Exhibit 3).
Exhibit 3 Reference population
Contacts from the
database Undeliverable
emails Reference population
Internal customers 449 42 407
External customers 695 71 624
Total 1,144 113 1,031
Exhibit 4 presents the two types of responses received: positive ones (the contact filled in the questionnaire) and negative ones (the contact declined to respond to the questionnaire), as well as the resulting rate of response. The overall rate of response is 31%. This result can be seen as satisfactory for this type of survey, which rarely exceeds 30%.
It is worth noticing that the 2005 survey response rate exceeded 40% for an overall number of respondents less important for the 2005 CSS than for the 2008 CSS (252 in 2005 against 321 in 2008).
Exhibit 4 Total of responses and rate of responses
Reference population
Positive responses
Negative responses
Positive response rate
Internal customers 407 133 27 33%
External customers 624 188 22 30%
Total 1,031 321 49 31%
A majority of respondents to the survey are External customers (cf. Exhibit 5). The structure of the respondents is similar to that of the reference population, since the Internal (External) customers represents 39% (61%) of the reference population.
Exhibit 5 Internal and External customers responding to the on-line questionnaire
Nb. %
Internal customers 133 41%
External customers 188 59%
Total 321 100%

JRC Customer Satisfaction Survey 2008 10
Exhibit 6 compares the number of respondents that filled in only one questionnaire to the number of multiple respondents that have received a final product or a service from more than one JRC Institute and that have wished to respond to more than one questionnaire. About 11% of the respondents are multiple customers.
Exhibit 6 Single and Multiple respondents
Nb. of single respondents Nb. of multiple
respondents Total
Internal customers 119 14 133
External customers 169 19 188
Total 288 33 321
Exhibit 7 highlights the number of questionnaires filled-in in comparison to the number of respondents.
Exhibit 7 Number of questionnaires filled-in and number of respondents
Nb. of questionnaires filled-in Nb. respondents
Internal customers 151 133
External customers 212 188
Total 363 321
Note: the possibility was offered to fill in several questionnaires, one per Institute/Directorate.
As regards analysis, we used a specific method to ensure comparability between CSS editions and between Institutes/Directorate. Adherence index is an indicator that measures the global satisfaction level of the sample by weighting responses according to the respondents’ level of satisfaction. See calculation and overall results in Appendix C.
3.5 Limitation of the 2008 survey
As said earlier, the process of simplifying the questionnaire led to the simplification of the set of questions regarding satisfaction: instead of proposing the choices “strongly agree, somewhat agree, somewhat disagree, strongly disagree” (as in the 2003 and 2005 surveys), EPEC simplified these choices in “strongly agree, agree, disagree, strongly disagree”.
Adherence indexes are calculated upon these satisfaction questions.
As a consequence, it is not possible, methodologically speaking, to compare the 2008 CSS with the previous editions based on adherence indexes. We used therefore in the present report a comparison based on the percentage of all satisfied customers (“very satisfied’’ and “satisfied” customers).
3.6 Interviews with JRC customers
3.6.1 Interviews: selection method
EPEC performed 18 interviews with JRC customers to deepen the findings of the on-line questionnaire. Three criteria were taken into account to select interviewees, so as to have a diversified sample:

JRC Customer Satisfaction Survey 2008 11
• the Institute or Directorate they cooperate with;
• the type of organisation they belong to;
• their status of external or internal customer.
The selection of interviewees was carried out on the basis of the results of the questionnaire, especially according to the relevance of their response to the questionnaire (quantity and quality-wise, for example, their participation in open questions at the end of the questionnaire).
3.6.2 Checklist of customer interviews
EPEC proposed semi-structured interviews to the chosen contacts.
Main points of interviews were:
• History of the cooperation
− Date of the beginning of the cooperation, projects with the JRC, general knowledge of the JRC and its Institutes, etc.
• Characterisation of the cooperation
− Frequency and intensity of the contacts, what type of information is exchanged and how, etc.
• Satisfaction of the interviewee
− Strong points and weak points of the JRC, eventual improvements, comparison with other Institutes, etc.
− Factors of success, problems encountered (e.g. management of the project)
− Perspectives for future cooperation
A specific question was asked to External customers regarding the phase of policy support. They were asked to explain if relevant why it was not applicable (cf. question 8: “In which phase of the policy cycle did you receive support from the JRC?”).

JRC Customer Satisfaction Survey 2008 12
3.6.3 Interviews performed
Exhibit 8 presents the 18 interviewees and their organisation (with respect to their anonymity we will not provide their names).
Exhibit 8 List of interviewees
Type of customer Organisation
JRC Institutes/Directorate
External Authority/administration in EU Member State DPSR External National contact point in New Member State DPSR, IES External National contact point in associated country IHCP External European Agency IPSC, IES, External Intergovernmental organization IRMM External Authority/administration in EU Member State ITU, IPSC External Research organisation ITU External Research organisation ITU, IES
Internal DG Translation, Interinstitutional relations and
general affairs DPSR
Internal Secretariat General IE Internal DG Agriculture and Rural Development IES, IE, IPTS Internal DG Enterprise and Industry IHCP Internal DG Health and Consumer Protection IHCP Internal DG Enterprise and Industry IPSC, IPTS, IES Internal DG Environment IPTS, IES Internal DG Trade IPTS Internal DG Energy and Transport ITU, IE, IES, IPSC Internal DG Enterprise and Industry ITU
JRC Customer Satisfaction Survey 2008 13
4. Profile of respondents and responses
This section relates to the characterisation of the respondents to the 2008 JRC Customer Satisfaction Survey: their organisation, their position, and the Institutes/Directorate they collaborate with.
4.1 Identification of respondents
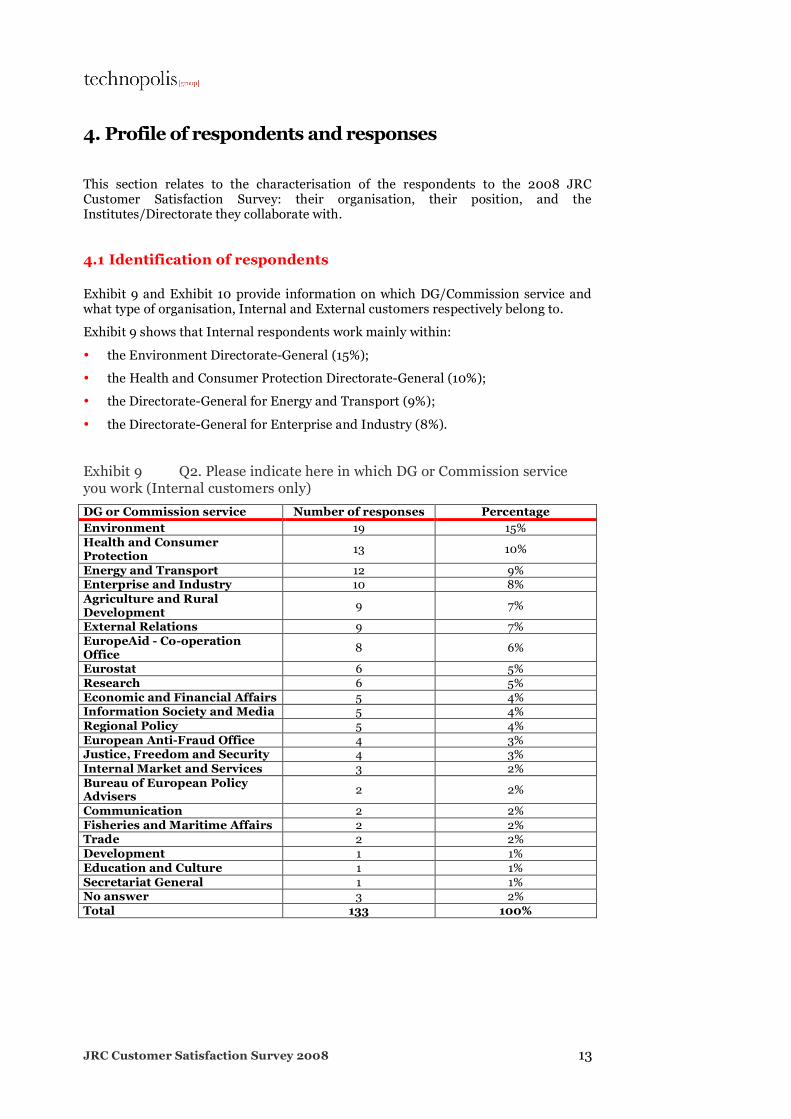
Exhibit 9 and Exhibit 10 provide information on which DG/Commission service and what type of organisation, Internal and External customers respectively belong to.
Exhibit 9 shows that Internal respondents work mainly within:
• the Environment Directorate-General (15%);
• the Health and Consumer Protection Directorate-General (10%);
• the Directorate-General for Energy and Transport (9%);
• the Directorate-General for Enterprise and Industry (8%).
Exhibit 9 Q2. Please indicate here in which DG or Commission service you work (Internal customers only)
DG or Commission service Number of responses Percentage Environment 19 15% Health and Consumer Protection
13 10%
Energy and Transport 12 9% Enterprise and Industry 10 8% Agriculture and Rural Development
9 7%
External Relations 9 7% EuropeAid - Co-operation Office
8 6%
Eurostat 6 5% Research 6 5% Economic and Financial Affairs 5 4% Information Society and Media 5 4% Regional Policy 5 4% European Anti-Fraud Office 4 3% Justice, Freedom and Security 4 3% Internal Market and Services 3 2% Bureau of European Policy Advisers
2 2%
Communication 2 2% Fisheries and Maritime Affairs 2 2% Trade 2 2% Development 1 1% Education and Culture 1 1% Secretariat General 1 1% No answer 3 2% Total 133 100%
JRC Customer Satisfaction Survey 2008 14
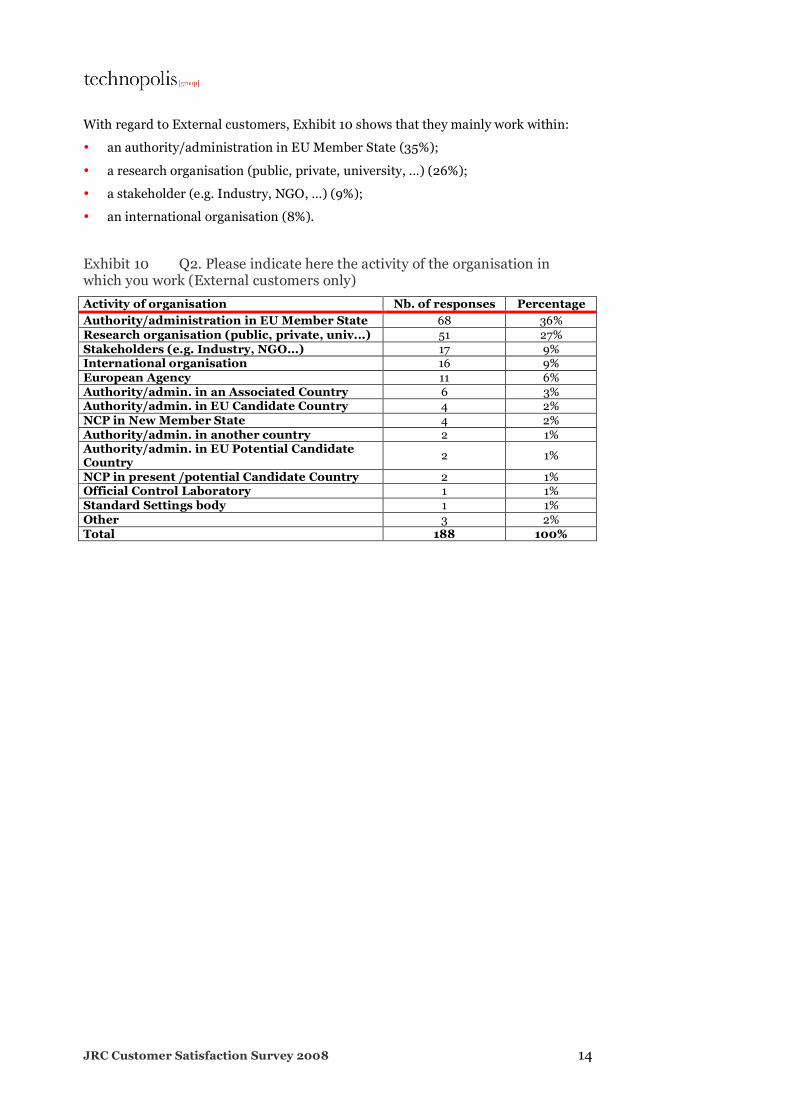
With regard to External customers, Exhibit 10 shows that they mainly work within:
• an authority/administration in EU Member State (35%);
• a research organisation (public, private, university, …) (26%);
• a stakeholder (e.g. Industry, NGO, …) (9%);
• an international organisation (8%).
Exhibit 10 Q2. Please indicate here the activity of the organisation in which you work (External customers only)
Activity of organisation Nb. of responses Percentage Authority/administration in EU Member State 68 36% Research organisation (public, private, univ...) 51 27% Stakeholders (e.g. Industry, NGO...) 17 9% International organisation 16 9% European Agency 11 6% Authority/admin. in an Associated Country 6 3% Authority/admin. in EU Candidate Country 4 2% NCP in New Member State 4 2% Authority/admin. in another country 2 1% Authority/admin. in EU Potential Candidate Country
2 1%
NCP in present /potential Candidate Country 2 1% Official Control Laboratory 1 1% Standard Settings body 1 1% Other 3 2% Total 188 100%
JRC Customer Satisfaction Survey 2008 15
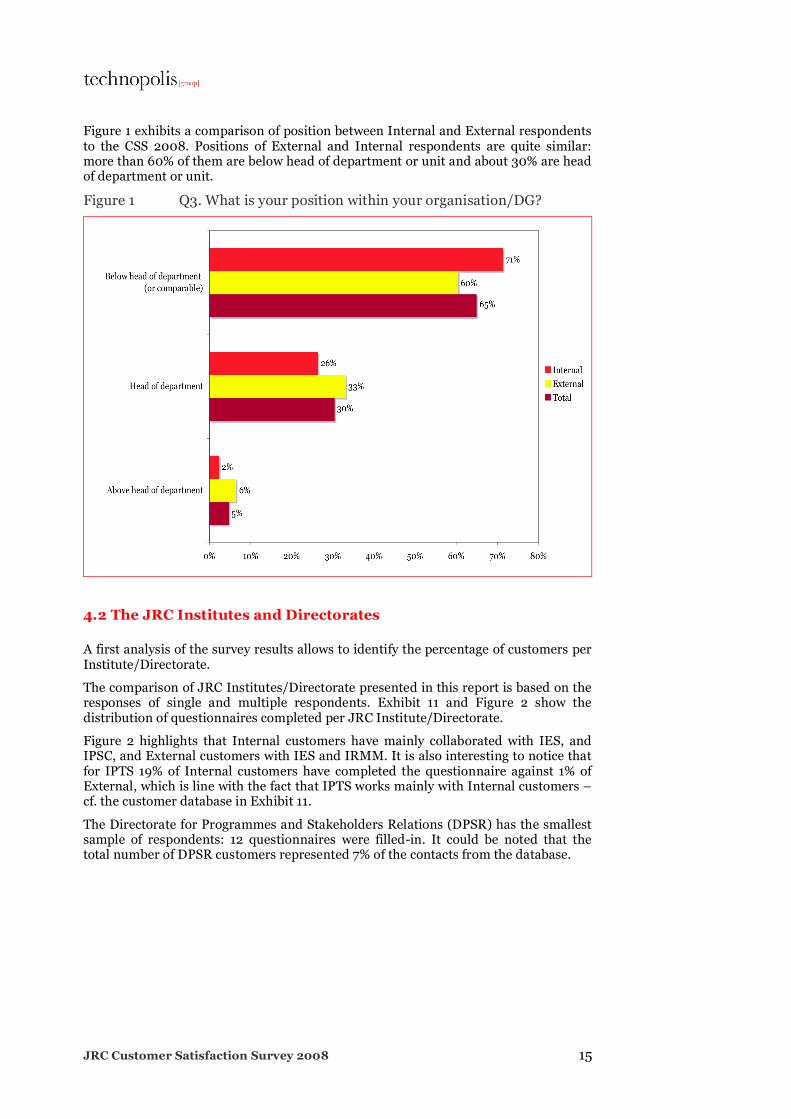
Figure 1 exhibits a comparison of position between Internal and External respondents to the CSS 2008. Positions of External and Internal respondents are quite similar: more than 60% of them are below head of department or unit and about 30% are head of department or unit.
Figure 1 Q3. What is your position within your organisation/DG?
4.2 The JRC Institutes and Directorates
A first analysis of the survey results allows to identify the percentage of customers per Institute/Directorate.
The comparison of JRC Institutes/Directorate presented in this report is based on the responses of single and multiple respondents. Exhibit 11 and Figure 2 show the distribution of questionnaires completed per JRC Institute/Directorate.
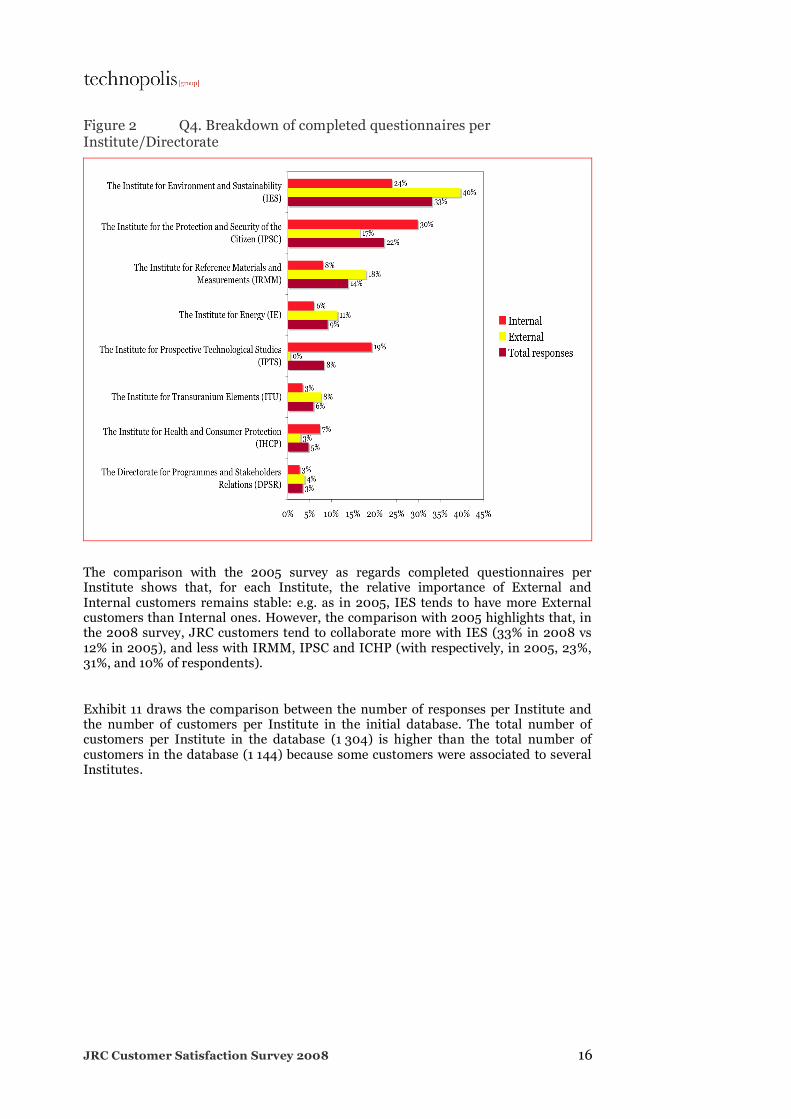
Figure 2 highlights that Internal customers have mainly collaborated with IES, and IPSC, and External customers with IES and IRMM. It is also interesting to notice that for IPTS 19% of Internal customers have completed the questionnaire against 1% of External, which is line with the fact that IPTS works mainly with Internal customers – cf. the customer database in Exhibit 11.
The Directorate for Programmes and Stakeholders Relations (DPSR) has the smallest sample of respondents: 12 questionnaires were filled-in. It could be noted that the total number of DPSR customers represented 7% of the contacts from the database.
JRC Customer Satisfaction Survey 2008 16
Figure 2 Q4. Breakdown of completed questionnaires per Institute/Directorate
The comparison with the 2005 survey as regards completed questionnaires per Institute shows that, for each Institute, the relative importance of External and Internal customers remains stable: e.g. as in 2005, IES tends to have more External customers than Internal ones. However, the comparison with 2005 highlights that, in the 2008 survey, JRC customers tend to collaborate more with IES (33% in 2008 vs 12% in 2005), and less with IRMM, IPSC and ICHP (with respectively, in 2005, 23%, 31%, and 10% of respondents).
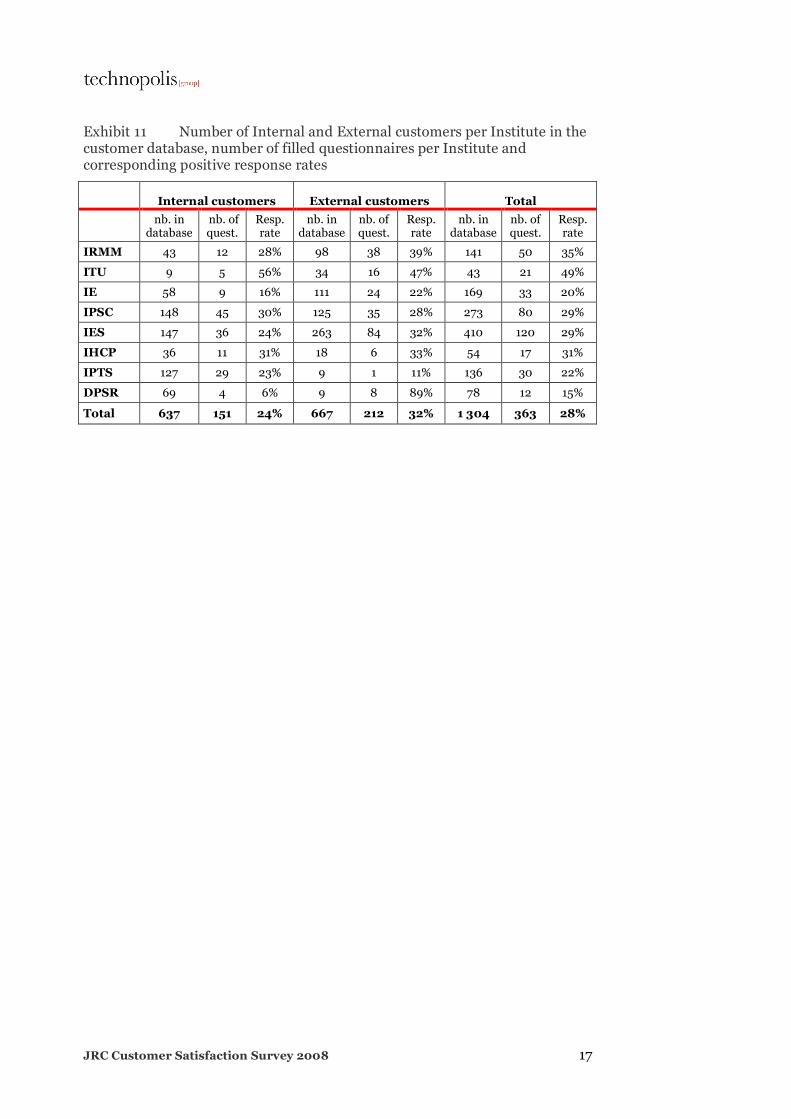
Exhibit 11 draws the comparison between the number of responses per Institute and the number of customers per Institute in the initial database. The total number of customers per Institute in the database (1 304) is higher than the total number of customers in the database (1 144) because some customers were associated to several Institutes.
JRC Customer Satisfaction Survey 2008 17
Exhibit 11 Number of Internal and External customers per Institute in the customer database, number of filled questionnaires per Institute and corresponding positive response rates
Internal customers External customers Total
nb. in
database nb. of quest.
Resp. rate
nb. in database
nb. of quest.
Resp. rate
nb. in database
nb. of quest.
Resp. rate
IRMM 43 12 28% 98 38 39% 141 50 35%
ITU 9 5 56% 34 16 47% 43 21 49%
IE 58 9 16% 111 24 22% 169 33 20%
IPSC 148 45 30% 125 35 28% 273 80 29%
IES 147 36 24% 263 84 32% 410 120 29%
IHCP 36 11 31% 18 6 33% 54 17 31%
IPTS 127 29 23% 9 1 11% 136 30 22%
DPSR 69 4 6% 9 8 89% 78 12 15%
Total 637 151 24% 667 212 32% 1 304 363 28%
JRC Customer Satisfaction Survey 2008 18
5. Nature of collaboration with the JRC Institutes/ Directorate
This section aims at informing on the nature of respondents’ collaboration with JRC Institutes/Directorate: the history of collaboration, the paying status of customers, and the types of support provided by JRC.
This perception provides important information regarding the institutional set-up of the relationship as well as regarding the overall “atmosphere” of the relationship.
5.1 Nature of the contact with the JRC
Question 6 targeted only Internal customers, asking them to specify the nature of their relations with the JRC. 93% of the respondents have direct relations with the JRC. Only 7% of Internal customers do not have direct relations with the JRC, but are a recipient of JRC support.
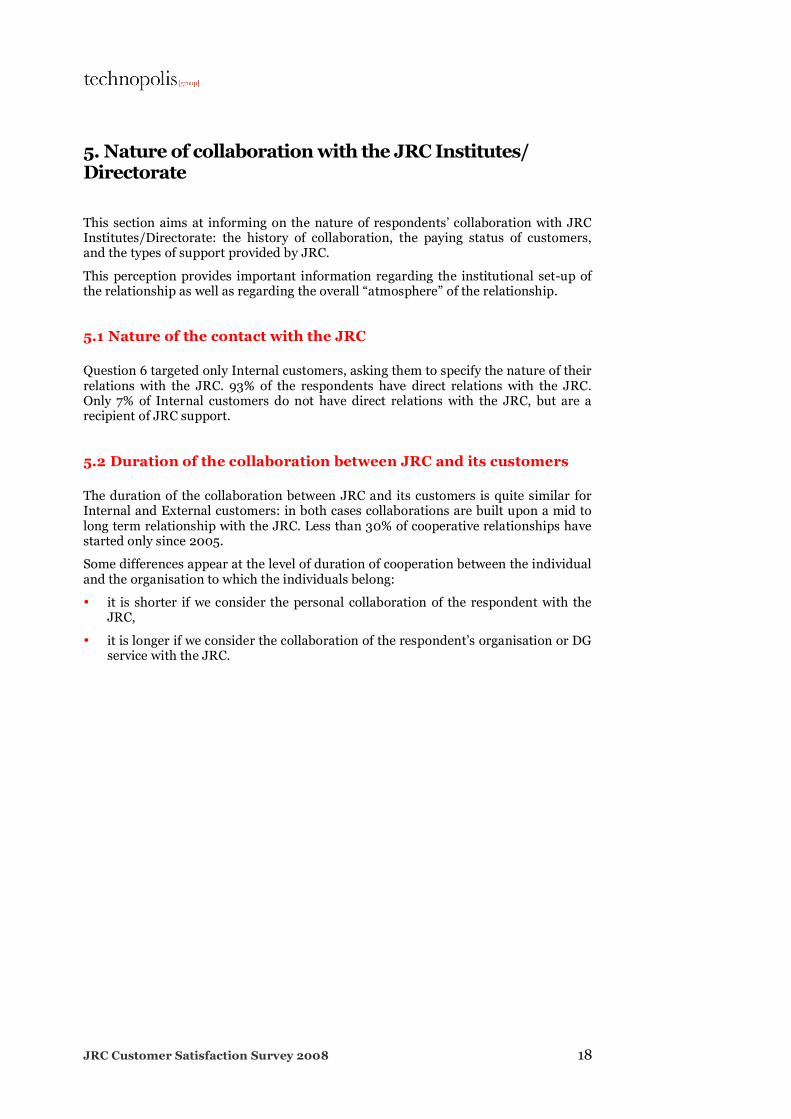
5.2 Duration of the collaboration between JRC and its customers
The duration of the collaboration between JRC and its customers is quite similar for Internal and External customers: in both cases collaborations are built upon a mid to long term relationship with the JRC. Less than 30% of cooperative relationships have started only since 2005.
Some differences appear at the level of duration of cooperation between the individual and the organisation to which the individuals belong:
• it is shorter if we consider the personal collaboration of the respondent with the JRC,
• it is longer if we consider the collaboration of the respondent’s organisation or DG service with the JRC.
JRC Customer Satisfaction Survey 2008 19
Figure 3 Q1. Please indicate when did you start collaborating with the JRC (Internal and External)
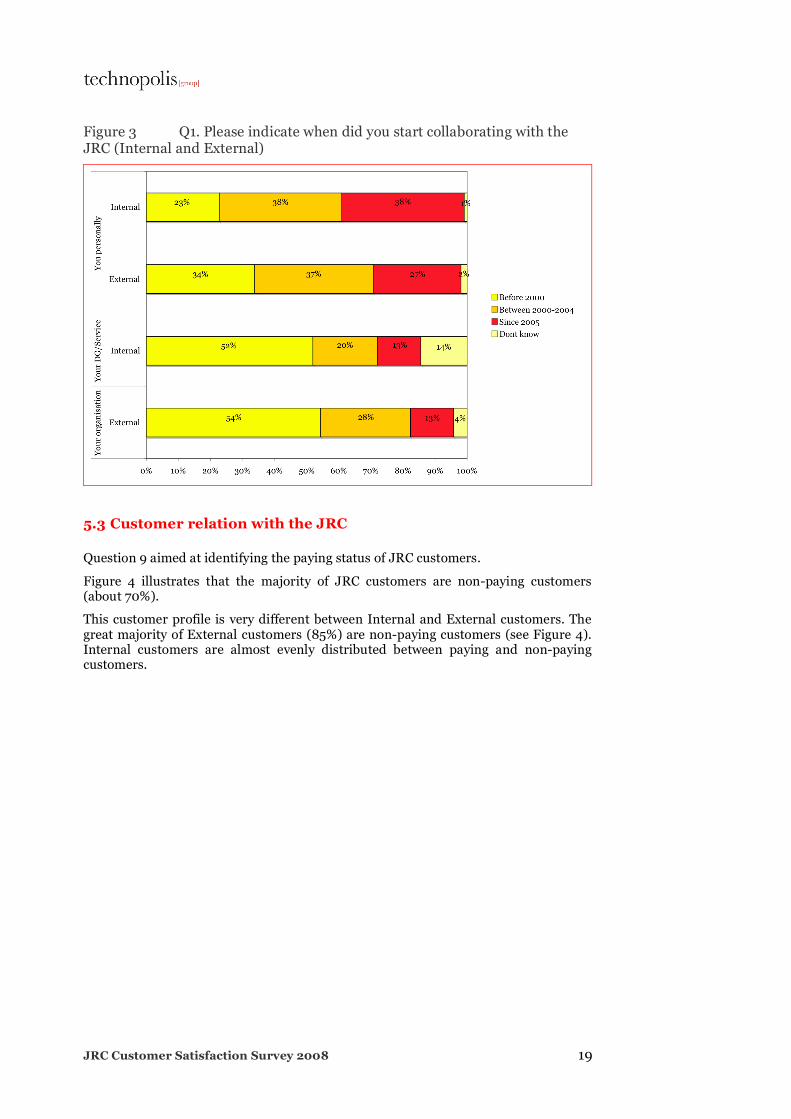
5.3 Customer relation with the JRC
Question 9 aimed at identifying the paying status of JRC customers.
Figure 4 illustrates that the majority of JRC customers are non-paying customers (about 70%).
This customer profile is very different between Internal and External customers. The great majority of External customers (85%) are non-paying customers (see Figure 4). Internal customers are almost evenly distributed between paying and non-paying customers.
JRC Customer Satisfaction Survey 2008 20
Figure 4 Q9. Which statement would best describe your or your organisation’s customer-relation with the JRC?
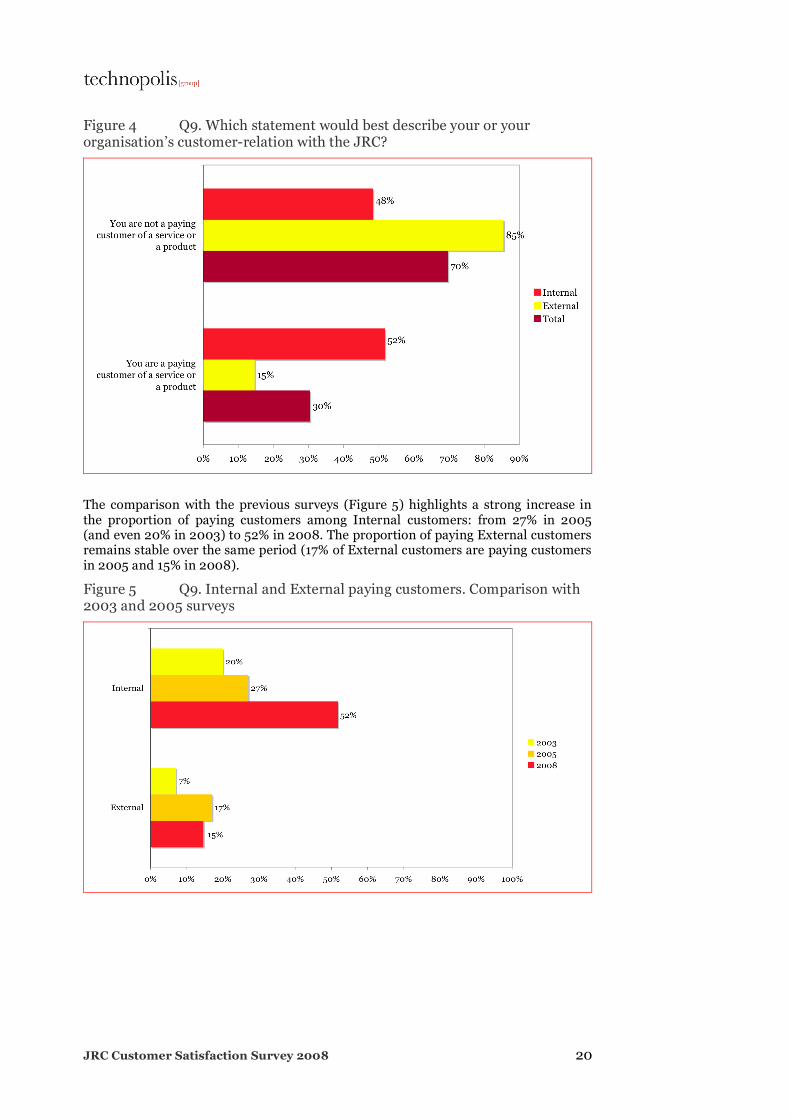
The comparison with the previous surveys (Figure 5) highlights a strong increase in the proportion of paying customers among Internal customers: from 27% in 2005 (and even 20% in 2003) to 52% in 2008. The proportion of paying External customers remains stable over the same period (17% of External customers are paying customers in 2005 and 15% in 2008).
Figure 5 Q9. Internal and External paying customers. Comparison with 2003 and 2005 surveys
JRC Customer Satisfaction Survey 2008 21
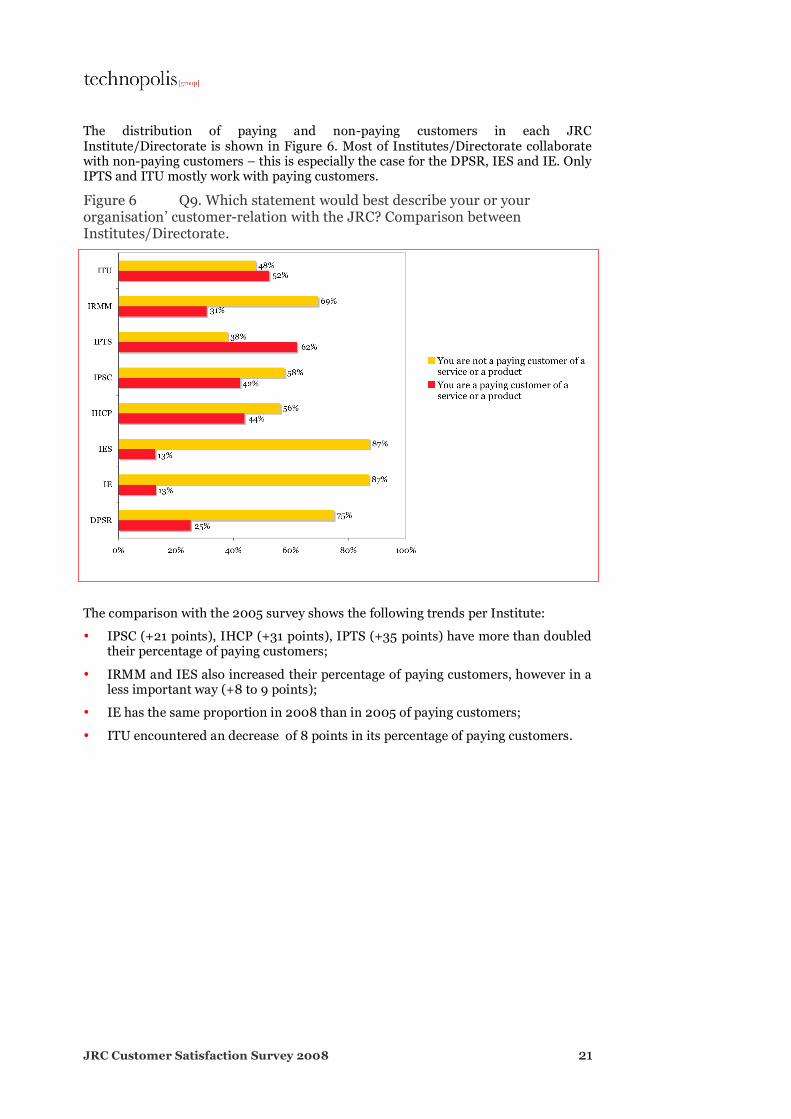
The distribution of paying and non-paying customers in each JRC Institute/Directorate is shown in Figure 6. Most of Institutes/Directorate collaborate with non-paying customers – this is especially the case for the DPSR, IES and IE. Only IPTS and ITU mostly work with paying customers.
Figure 6 Q9. Which statement would best describe your or your organisation’ customer-relation with the JRC? Comparison between Institutes/Directorate.
The comparison with the 2005 survey shows the following trends per Institute:
• IPSC (+21 points), IHCP (+31 points), IPTS (+35 points) have more than doubled their percentage of paying customers;
• IRMM and IES also increased their percentage of paying customers, however in a less important way (+8 to 9 points);
• IE has the same proportion in 2008 than in 2005 of paying customers;
• ITU encountered an decrease of 8 points in its percentage of paying customers.

JRC Customer Satisfaction Survey 2008 22
Figure 7 shows that among non-paying customers, respondents are mainly beneficiaries among others of the services provided by the JRC. The figure also shows that Internal customers are slightly more numerous to declare that they are the main direct beneficiaries of the services provided by the JRC (33%, against 14% for External customers). 86% of External customers claim they are beneficiaries among others of the services provided by the JRC (86%, against 67% of Internal).
Figure 7 Q9 bis. In case you are a non-paying customer, are you the direct beneficiary of the service or product provided? (non-paying Internal and External)
JRC Customer Satisfaction Survey 2008 23
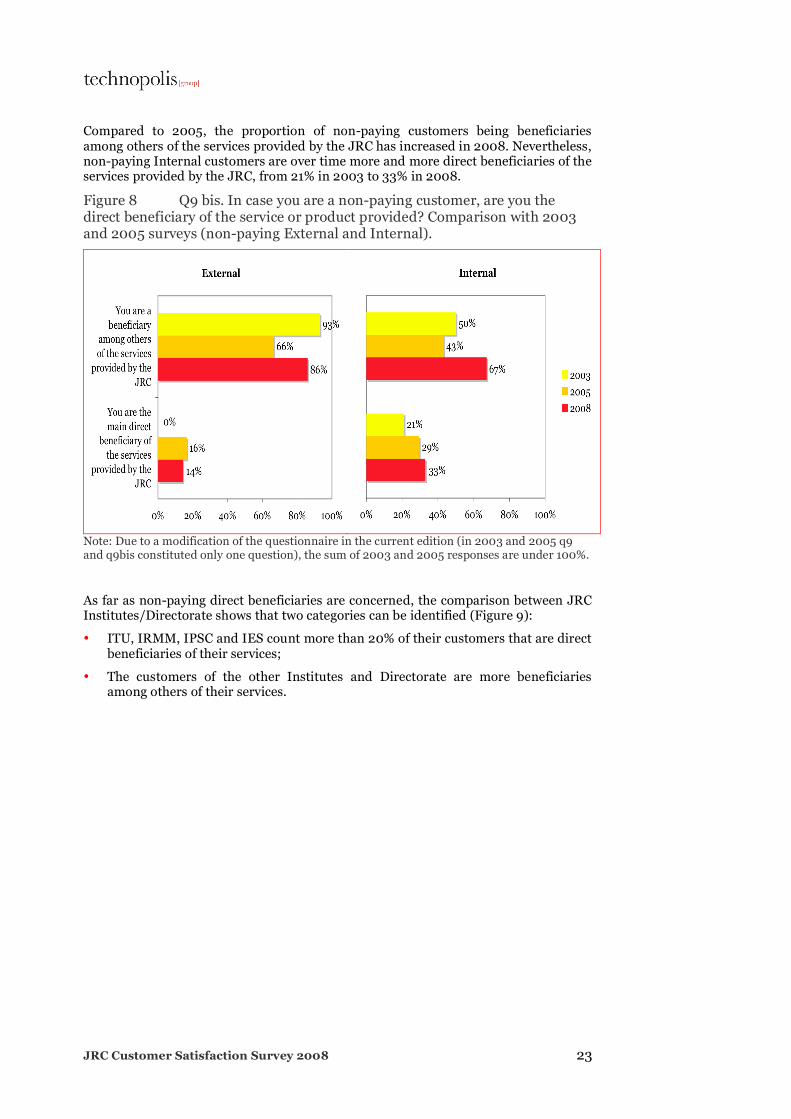
Compared to 2005, the proportion of non-paying customers being beneficiaries among others of the services provided by the JRC has increased in 2008. Nevertheless, non-paying Internal customers are over time more and more direct beneficiaries of the services provided by the JRC, from 21% in 2003 to 33% in 2008.
Figure 8 Q9 bis. In case you are a non-paying customer, are you the direct beneficiary of the service or product provided? Comparison with 2003 and 2005 surveys (non-paying External and Internal).
Note: Due to a modification of the questionnaire in the current edition (in 2003 and 2005 q9 and q9bis constituted only one question), the sum of 2003 and 2005 responses are under 100%.
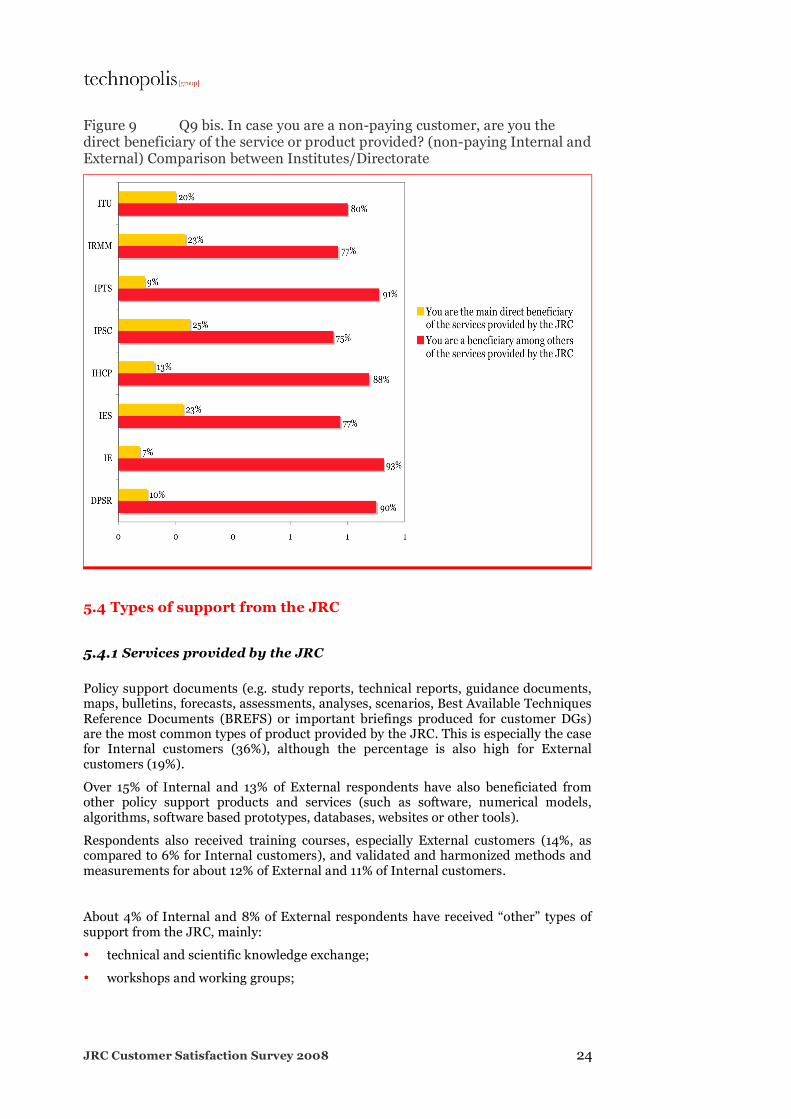
As far as non-paying direct beneficiaries are concerned, the comparison between JRC Institutes/Directorate shows that two categories can be identified (Figure 9):
• ITU, IRMM, IPSC and IES count more than 20% of their customers that are direct beneficiaries of their services;
• The customers of the other Institutes and Directorate are more beneficiaries among others of their services.
JRC Customer Satisfaction Survey 2008 24
Figure 9 Q9 bis. In case you are a non-paying customer, are you the direct beneficiary of the service or product provided? (non-paying Internal and External) Comparison between Institutes/Directorate
5.4 Types of support from the JRC
5.4.1 Services provided by the JRC
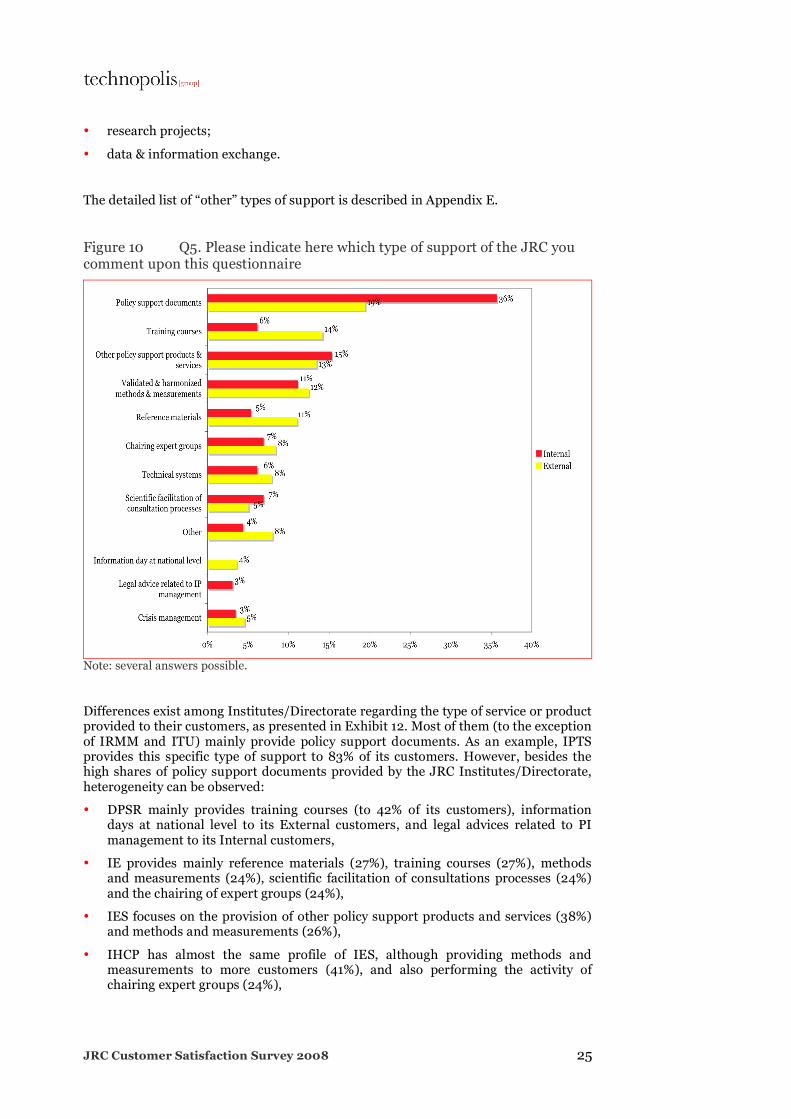
Policy support documents (e.g. study reports, technical reports, guidance documents, maps, bulletins, forecasts, assessments, analyses, scenarios, Best Available Techniques Reference Documents (BREFS) or important briefings produced for customer DGs) are the most common types of product provided by the JRC. This is especially the case for Internal customers (36%), although the percentage is also high for External customers (19%).
Over 15% of Internal and 13% of External respondents have also beneficiated from other policy support products and services (such as software, numerical models, algorithms, software based prototypes, databases, websites or other tools).
Respondents also received training courses, especially External customers (14%, as compared to 6% for Internal customers), and validated and harmonized methods and measurements for about 12% of External and 11% of Internal customers.
About 4% of Internal and 8% of External respondents have received “other” types of support from the JRC, mainly:
• technical and scientific knowledge exchange;
• workshops and working groups;
JRC Customer Satisfaction Survey 2008 25
• research projects;
• data & information exchange.
The detailed list of “other” types of support is described in Appendix E.
Figure 10 Q5. Please indicate here which type of support of the JRC you comment upon this questionnaire
Note: several answers possible.
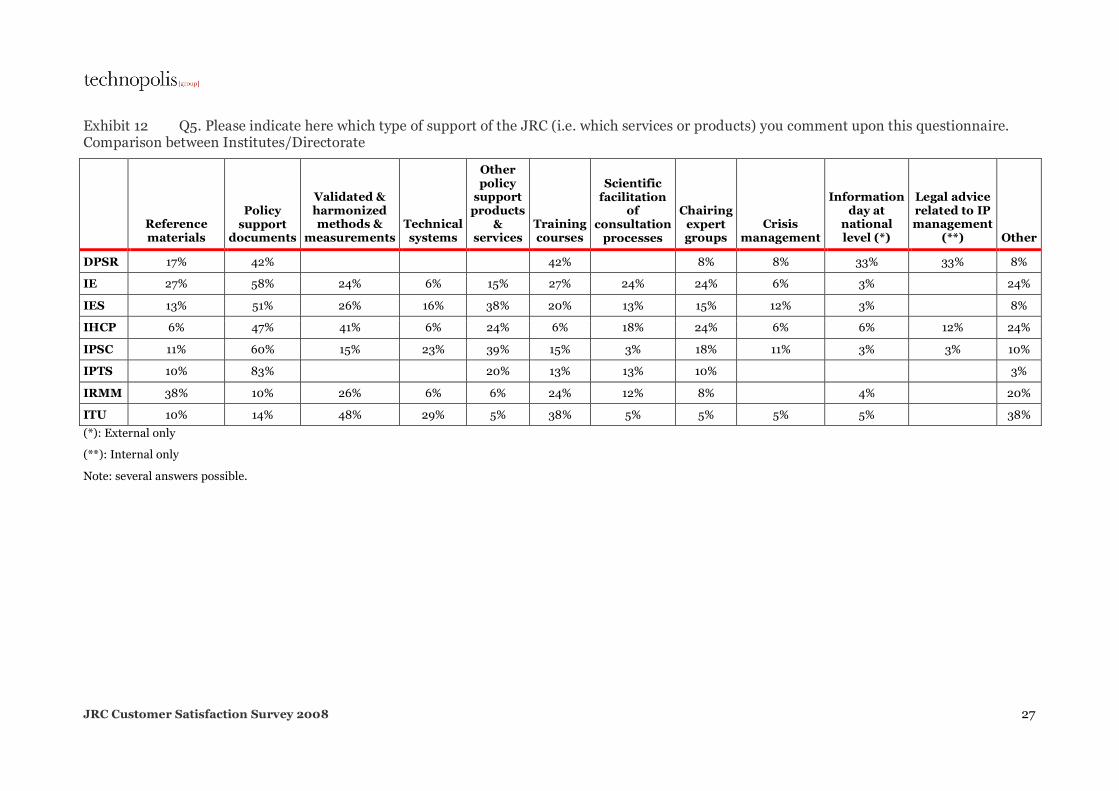
Differences exist among Institutes/Directorate regarding the type of service or product provided to their customers, as presented in Exhibit 12. Most of them (to the exception of IRMM and ITU) mainly provide policy support documents. As an example, IPTS provides this specific type of support to 83% of its customers. However, besides the high shares of policy support documents provided by the JRC Institutes/Directorate, heterogeneity can be observed:
• DPSR mainly provides training courses (to 42% of its customers), information days at national level to its External customers, and legal advices related to PI management to its Internal customers,
• IE provides mainly reference materials (27%), training courses (27%), methods and measurements (24%), scientific facilitation of consultations processes (24%) and the chairing of expert groups (24%),
• IES focuses on the provision of other policy support products and services (38%) and methods and measurements (26%),
• IHCP has almost the same profile of IES, although providing methods and measurements to more customers (41%), and also performing the activity of chairing expert groups (24%),

JRC Customer Satisfaction Survey 2008 26
• IPSC appears specialised in the provision of other policy support products and services (39%),
• IRMM produces mainly reference materials (38%) and training courses (24%),
• ITU focuses on methods and measurements (48%) and also training courses (38%).
JRC Customer Satisfaction Survey 2008 27
Exhibit 12 Q5. Please indicate here which type of support of the JRC (i.e. which services or products) you comment upon this questionnaire. Comparison between Institutes/Directorate
Reference materials
Policy support
documents
Validated & harmonized methods &
measurements Technical systems
Other policy
support products
& services
Training courses
Scientific facilitation
of consultation
processes
Chairing expert groups
Crisis management
Information day at
national level (*)
Legal advice related to IP management
(**) Other
DPSR 17% 42% 42% 8% 8% 33% 33% 8%
IE 27% 58% 24% 6% 15% 27% 24% 24% 6% 3% 24%
IES 13% 51% 26% 16% 38% 20% 13% 15% 12% 3% 8%
IHCP 6% 47% 41% 6% 24% 6% 18% 24% 6% 6% 12% 24%
IPSC 11% 60% 15% 23% 39% 15% 3% 18% 11% 3% 3% 10%
IPTS 10% 83% 20% 13% 13% 10% 3%
IRMM 38% 10% 26% 6% 6% 24% 12% 8% 4% 20%
ITU 10% 14% 48% 29% 5% 38% 5% 5% 5% 5% 38%
(*): External only
(**): Internal only
Note: several answers possible.
JRC Customer Satisfaction Survey 2008 28
5.4.2 Main Commission policy areas
Question 7 aimed at identifying for which specific policies and/or thematic areas JRC customers have received support from the organisation.
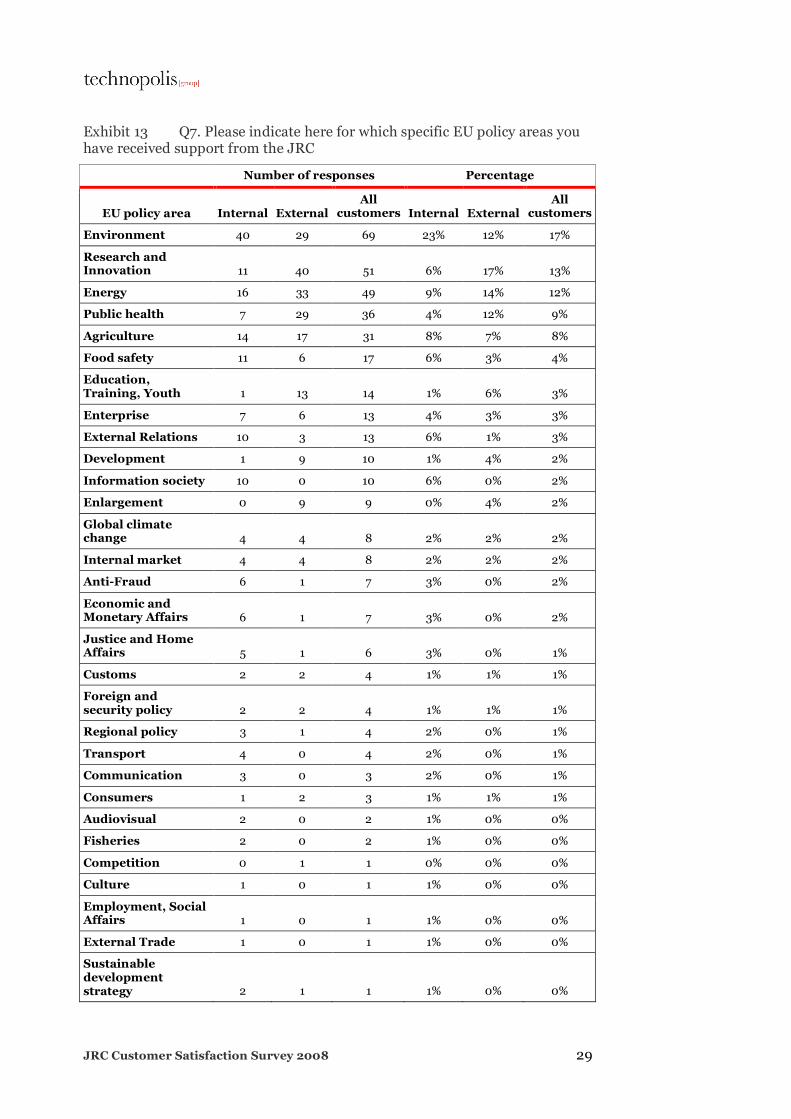
The main Commission policy areas from which the respondents have received support from the JRC are the following (see Exhibit 13):
• Environment (17%), especially for Internal customers (23% against 12% for External respondents);
• Research and innovation (13%), especially for External customers (17% against only 6% for Internal respondents);
• Energy (12%), particularly for External customers (14% against 9% for Internal respondents).
JRC Customer Satisfaction Survey 2008 29
Exhibit 13 Q7. Please indicate here for which specific EU policy areas you have received support from the JRC
Number of responses Percentage
EU policy area Internal External All
customers Internal External All
customers
Environment 40 29 69 23% 12% 17%
Research and Innovation 11 40 51 6% 17% 13%
Energy 16 33 49 9% 14% 12%
Public health 7 29 36 4% 12% 9%
Agriculture 14 17 31 8% 7% 8%
Food safety 11 6 17 6% 3% 4%
Education, Training, Youth 1 13 14 1% 6% 3%
Enterprise 7 6 13 4% 3% 3%
External Relations 10 3 13 6% 1% 3%
Development 1 9 10 1% 4% 2%
Information society 10 0 10 6% 0% 2%
Enlargement 0 9 9 0% 4% 2%
Global climate change 4 4 8 2% 2% 2%
Internal market 4 4 8 2% 2% 2%
Anti-Fraud 6 1 7 3% 0% 2%
Economic and Monetary Affairs 6 1 7 3% 0% 2%
Justice and Home Affairs 5 1 6 3% 0% 1%
Customs 2 2 4 1% 1% 1%
Foreign and security policy 2 2 4 1% 1% 1%
Regional policy 3 1 4 2% 0% 1%
Transport 4 0 4 2% 0% 1%
Communication 3 0 3 2% 0% 1%
Consumers 1 2 3 1% 1% 1%
Audiovisual 2 0 2 1% 0% 0%
Fisheries 2 0 2 1% 0% 0%
Competition 0 1 1 0% 0% 0%
Culture 1 0 1 1% 0% 0%
Employment, Social Affairs 1 0 1 1% 0% 0%
External Trade 1 0 1 1% 0% 0%
Sustainable development strategy 2 1 1 1% 0% 0%
JRC Customer Satisfaction Survey 2008 30
Number of responses Percentage
EU policy area Internal External All
customers Internal External All
customers
Budget 0 0 0 0% 0% 0%
Human rights 0 0 0 0% 0% 0%
Humanitarian aid 0 0 0 0% 0% 0%
Taxation 0 0 0 0% 0% 0%
Total 177 234 408 100% 100% 100%
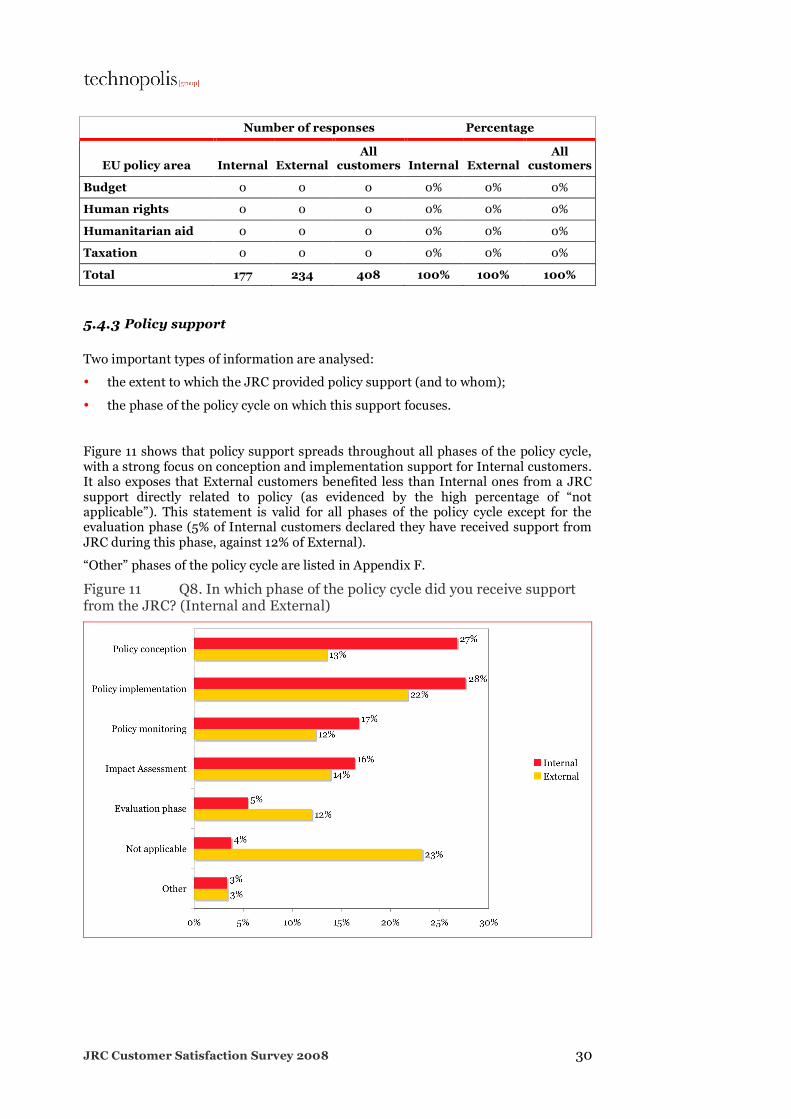
5.4.3 Policy support
Two important types of information are analysed:
• the extent to which the JRC provided policy support (and to whom);
• the phase of the policy cycle on which this support focuses.
Figure 11 shows that policy support spreads throughout all phases of the policy cycle, with a strong focus on conception and implementation support for Internal customers. It also exposes that External customers benefited less than Internal ones from a JRC support directly related to policy (as evidenced by the high percentage of “not applicable”). This statement is valid for all phases of the policy cycle except for the evaluation phase (5% of Internal customers declared they have received support from JRC during this phase, against 12% of External).
“Other” phases of the policy cycle are listed in Appendix F.
Figure 11 Q8. In which phase of the policy cycle did you receive support from the JRC? (Internal and External)
JRC Customer Satisfaction Survey 2008 31
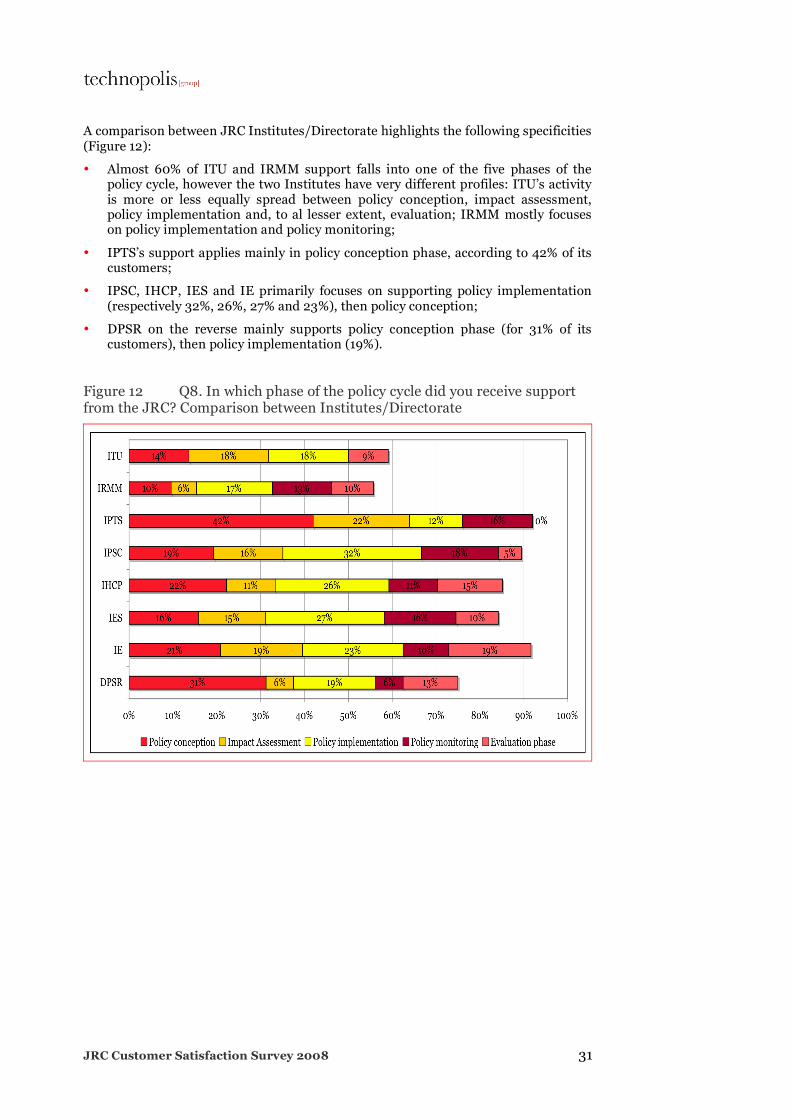
A comparison between JRC Institutes/Directorate highlights the following specificities (Figure 12):
• Almost 60% of ITU and IRMM support falls into one of the five phases of the policy cycle, however the two Institutes have very different profiles: ITU’s activity is more or less equally spread between policy conception, impact assessment, policy implementation and, to al lesser extent, evaluation; IRMM mostly focuses on policy implementation and policy monitoring;
• IPTS’s support applies mainly in policy conception phase, according to 42% of its customers;
• IPSC, IHCP, IES and IE primarily focuses on supporting policy implementation (respectively 32%, 26%, 27% and 23%), then policy conception;
• DPSR on the reverse mainly supports policy conception phase (for 31% of its customers), then policy implementation (19%).
Figure 12 Q8. In which phase of the policy cycle did you receive support from the JRC? Comparison between Institutes/Directorate
JRC Customer Satisfaction Survey 2008 32
6. Reasons for collaborating with the JRC
This section highlights the origins of the relationship with the JRC as well as the customers’ rationales for teaming-up with JRC.
6.1 Origin of partnership
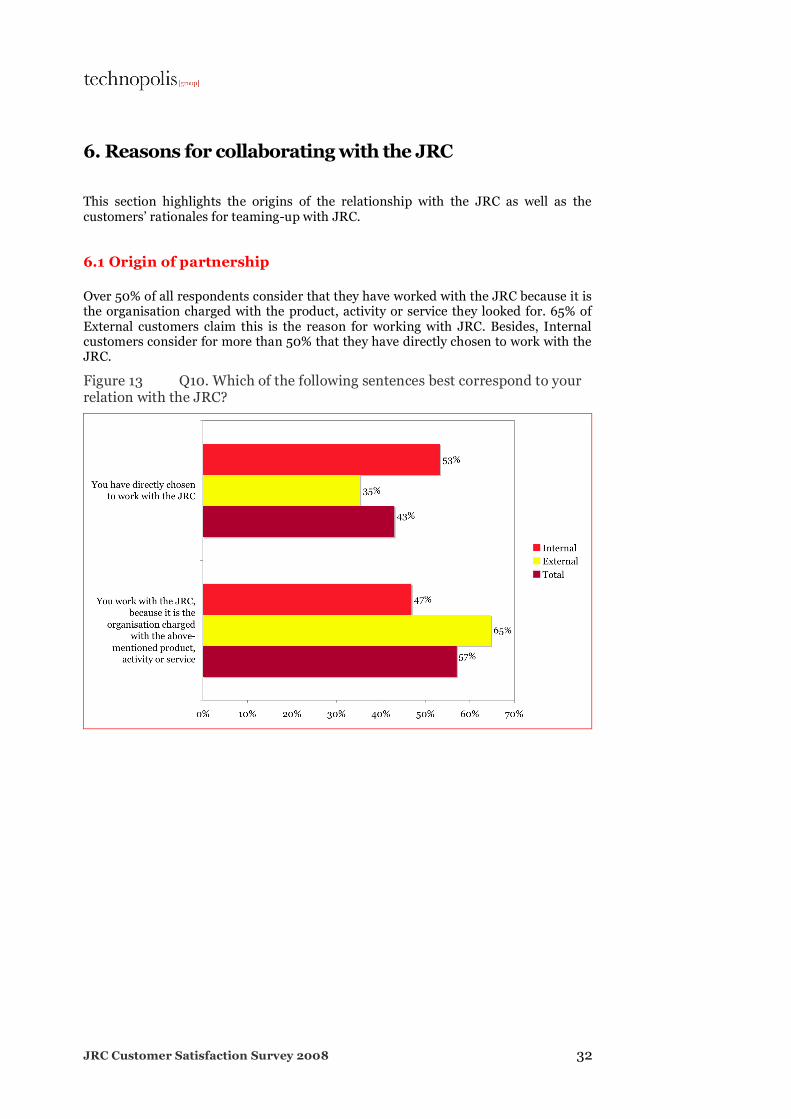
Over 50% of all respondents consider that they have worked with the JRC because it is the organisation charged with the product, activity or service they looked for. 65% of External customers claim this is the reason for working with JRC. Besides, Internal customers consider for more than 50% that they have directly chosen to work with the JRC.
Figure 13 Q10. Which of the following sentences best correspond to your relation with the JRC?
JRC Customer Satisfaction Survey 2008 33
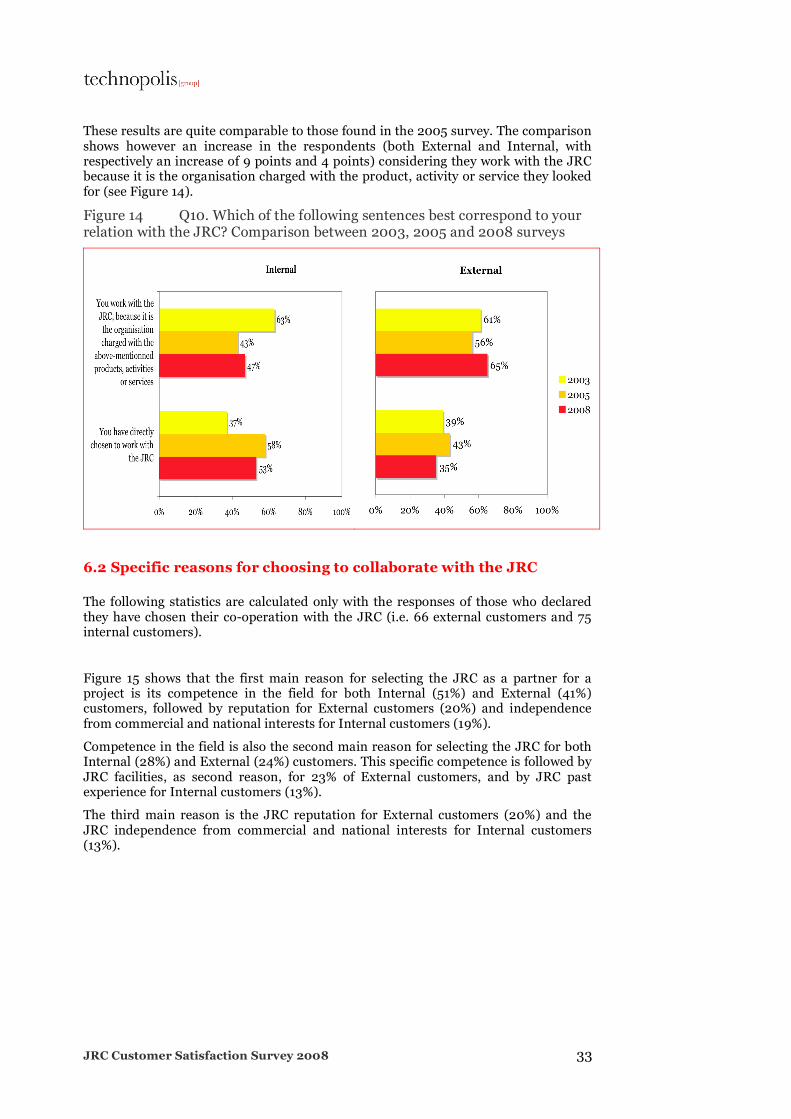
These results are quite comparable to those found in the 2005 survey. The comparison shows however an increase in the respondents (both External and Internal, with respectively an increase of 9 points and 4 points) considering they work with the JRC because it is the organisation charged with the product, activity or service they looked for (see Figure 14).
Figure 14 Q10. Which of the following sentences best correspond to your relation with the JRC? Comparison between 2003, 2005 and 2008 surveys
6.2 Specific reasons for choosing to collaborate with the JRC
The following statistics are calculated only with the responses of those who declared they have chosen their co-operation with the JRC (i.e. 66 external customers and 75 internal customers).
Figure 15 shows that the first main reason for selecting the JRC as a partner for a project is its competence in the field for both Internal (51%) and External (41%) customers, followed by reputation for External customers (20%) and independence from commercial and national interests for Internal customers (19%).
Competence in the field is also the second main reason for selecting the JRC for both Internal (28%) and External (24%) customers. This specific competence is followed by JRC facilities, as second reason, for 23% of External customers, and by JRC past experience for Internal customers (13%).
The third main reason is the JRC reputation for External customers (20%) and the JRC independence from commercial and national interests for Internal customers (13%).

JRC Customer Satisfaction Survey 2008 34
Figure 15 Q10 bis. What are the main reasons for selecting the JRC as a partner for your project?
JRC Customer Satisfaction Survey 2008 35
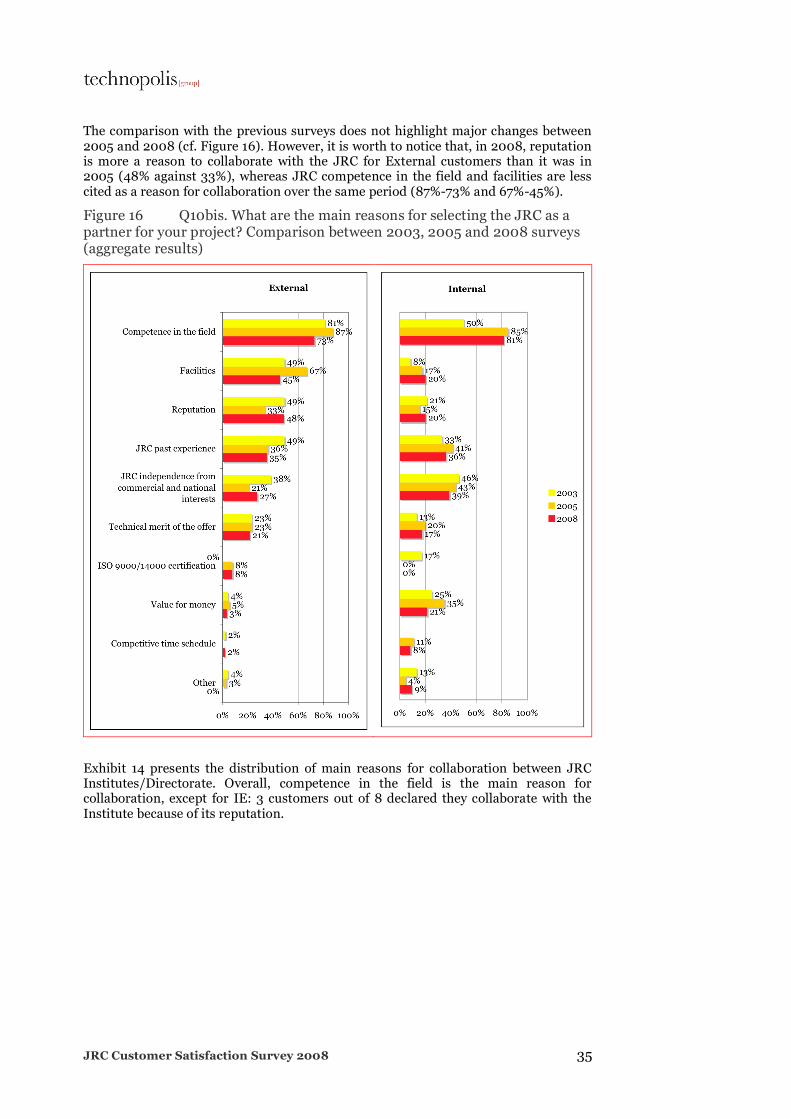
The comparison with the previous surveys does not highlight major changes between 2005 and 2008 (cf. Figure 16). However, it is worth to notice that, in 2008, reputation is more a reason to collaborate with the JRC for External customers than it was in 2005 (48% against 33%), whereas JRC competence in the field and facilities are less cited as a reason for collaboration over the same period (87%-73% and 67%-45%).
Figure 16 Q10bis. What are the main reasons for selecting the JRC as a partner for your project? Comparison between 2003, 2005 and 2008 surveys (aggregate results)
Exhibit 14 presents the distribution of main reasons for collaboration between JRC Institutes/Directorate. Overall, competence in the field is the main reason for collaboration, except for IE: 3 customers out of 8 declared they collaborate with the Institute because of its reputation.

JRC Customer Satisfaction Survey 2008 36
Exhibit 14 Q10 bis. What is the main reason for selecting the JRC as a partner for your project? Comparison between Institutes/Directorate (Main reason only)
Reputation Facilities Competence in
the field
Value for
money
Technical merit of the
offer Competitive
time schedule JRC past
experience
JRC independence
from commercial and national
interests
ISO 9000/14000 certification Other
Total respondents to
Q10bis DPSR 0 0 1 0 0 0 0 0 0 0 1 IE 3 1 1 0 1 0 0 2 0 0 8 IES 4 2 17 0 0 0 3 1 0 0 31 IHCP 0 1 3 0 0 0 0 0 0 1 7 IPSC 1 2 18 2 1 1 5 5 0 2 40 IPTS 0 2 11 1 0 0 2 4 0 1 21 IRMM 5 5 11 1 1 0 2 3 0 0 28 ITU 1 1 3 0 0 0 0 0 0 0 5
JRC Customer Satisfaction Survey 2008 37
7. Customer satisfaction
The web-based questionnaire asked respondents to assess their level of satisfaction on various dimensions of the project they have carried out with JRC. These dimensions relate first to the three project phases (planning, implementation and completion), then to the three main aspects of the product or services provided by the JRC (overall scientific quality, overall quality of management, relevance to the purpose of respondent), and finally to communication aspects.
7.1 Satisfaction with the JRC products and services by project phase
The survey allows an in-depth investigation of the satisfaction of respondents, according to the three main phases of the project(s) they have carried out with the JRC: planning, implementation and completion of the project.
7.1.1 Planning
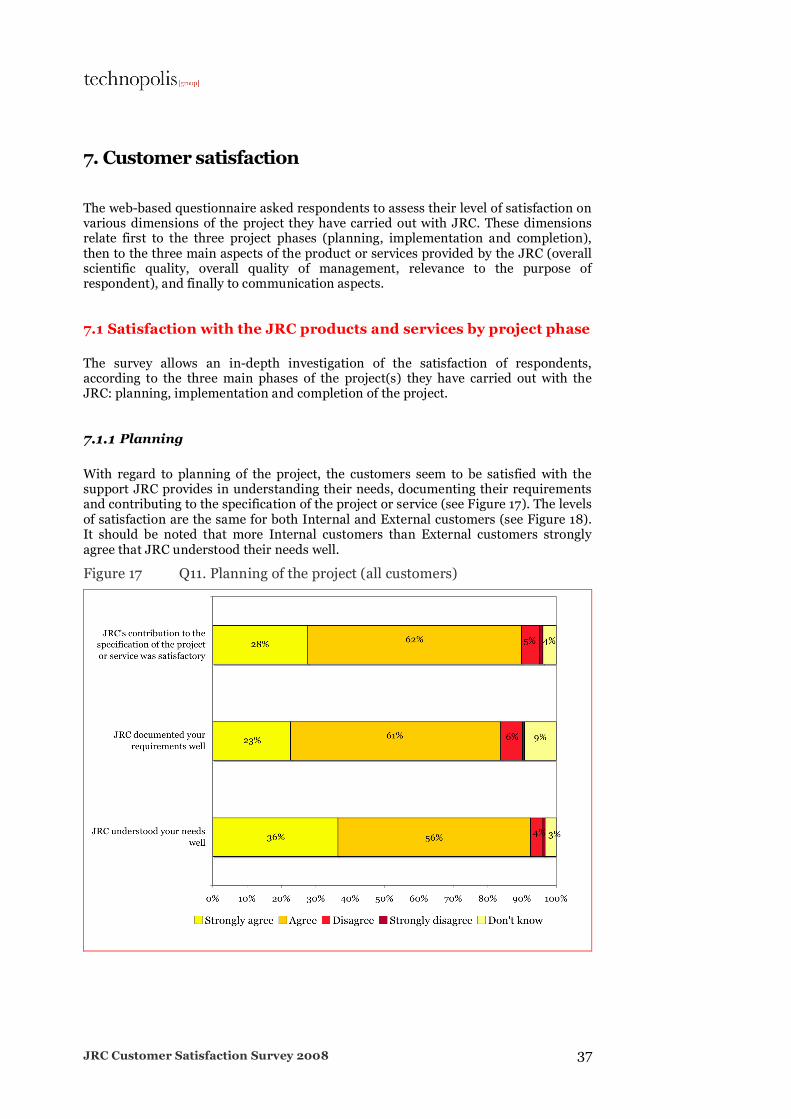
With regard to planning of the project, the customers seem to be satisfied with the support JRC provides in understanding their needs, documenting their requirements and contributing to the specification of the project or service (see Figure 17). The levels of satisfaction are the same for both Internal and External customers (see Figure 18). It should be noted that more Internal customers than External customers strongly agree that JRC understood their needs well.
Figure 17 Q11. Planning of the project (all customers)
JRC Customer Satisfaction Survey 2008 38
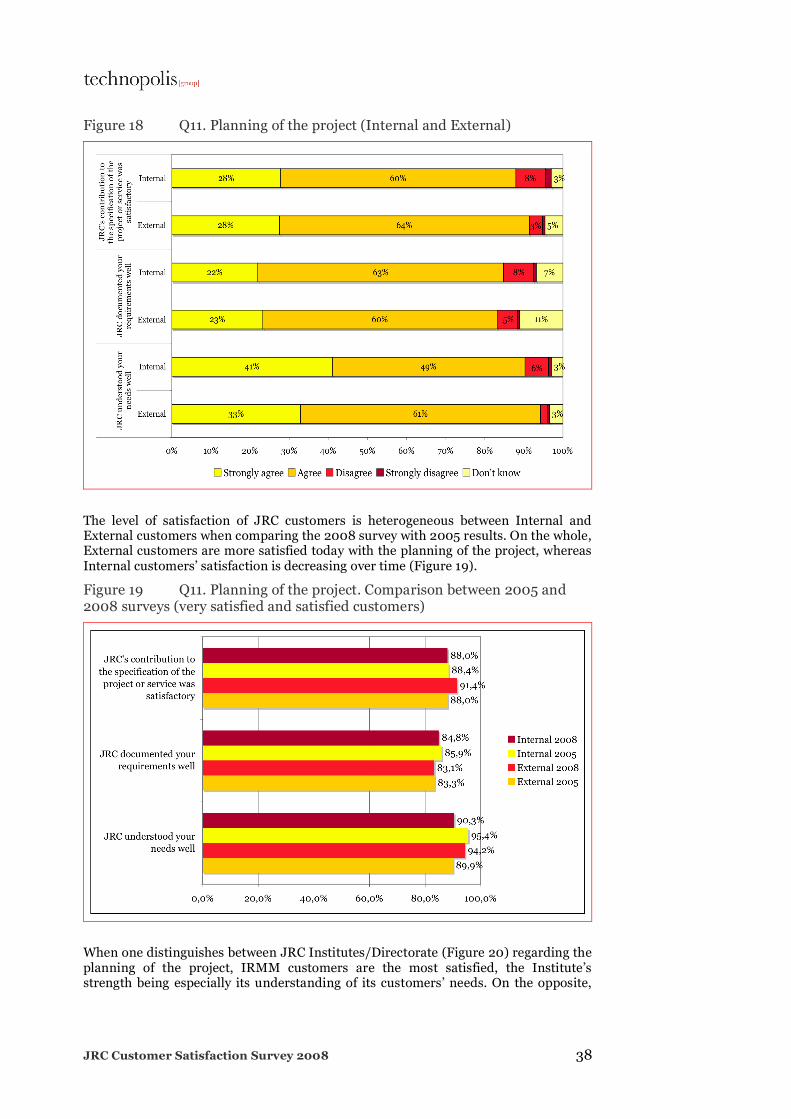
Figure 18 Q11. Planning of the project (Internal and External)
The level of satisfaction of JRC customers is heterogeneous between Internal and External customers when comparing the 2008 survey with 2005 results. On the whole, External customers are more satisfied today with the planning of the project, whereas Internal customers’ satisfaction is decreasing over time (Figure 19).
Figure 19 Q11. Planning of the project. Comparison between 2005 and 2008 surveys (very satisfied and satisfied customers)
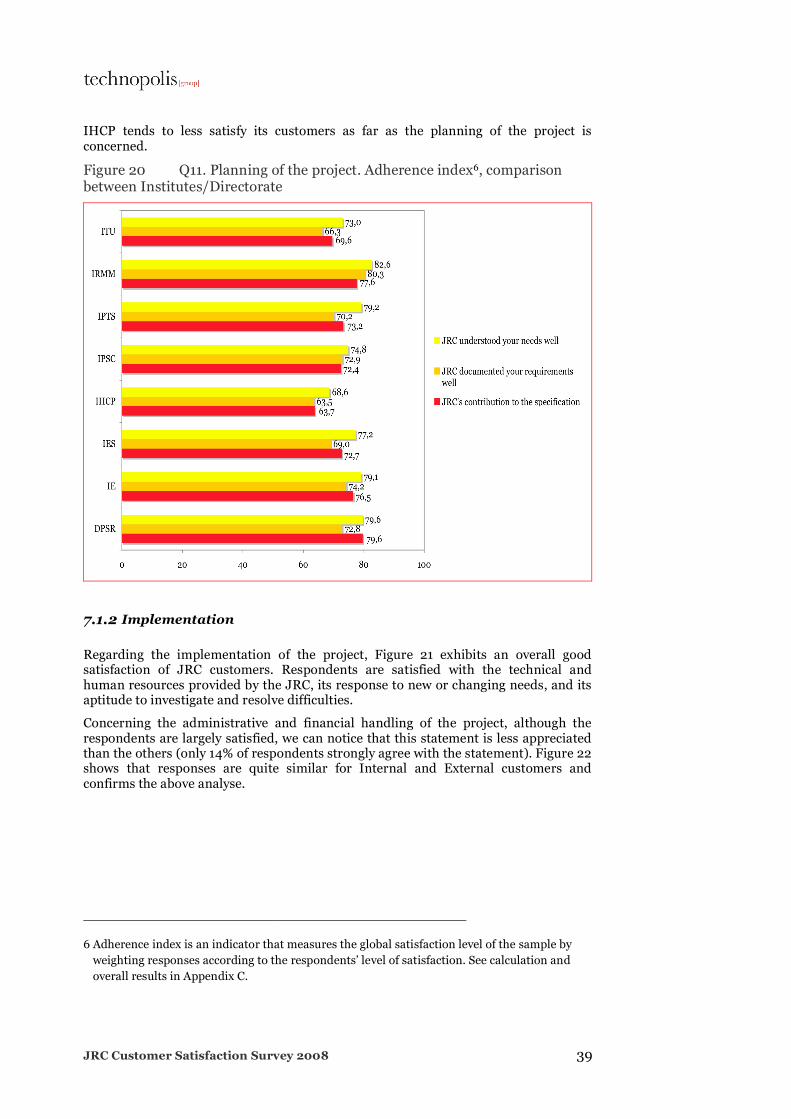
When one distinguishes between JRC Institutes/Directorate (Figure 20) regarding the planning of the project, IRMM customers are the most satisfied, the Institute’s strength being especially its understanding of its customers’ needs. On the opposite,
JRC Customer Satisfaction Survey 2008 39
IHCP tends to less satisfy its customers as far as the planning of the project is concerned.
Figure 20 Q11. Planning of the project. Adherence index6, comparison between Institutes/Directorate
7.1.2 Implementation
Regarding the implementation of the project, Figure 21 exhibits an overall good satisfaction of JRC customers. Respondents are satisfied with the technical and human resources provided by the JRC, its response to new or changing needs, and its aptitude to investigate and resolve difficulties.
Concerning the administrative and financial handling of the project, although the respondents are largely satisfied, we can notice that this statement is less appreciated than the others (only 14% of respondents strongly agree with the statement). Figure 22 shows that responses are quite similar for Internal and External customers and confirms the above analyse.
6 Adherence index is an indicator that measures the global satisfaction level of the sample by weighting responses according to the respondents’ level of satisfaction. See calculation and overall results in Appendix C.

JRC Customer Satisfaction Survey 2008 40
Figure 21 Q12. Implementation of the project (all customers)
Figure 22 Q12. Implementation of the project (Internal and External)
JRC Customer Satisfaction Survey 2008 41
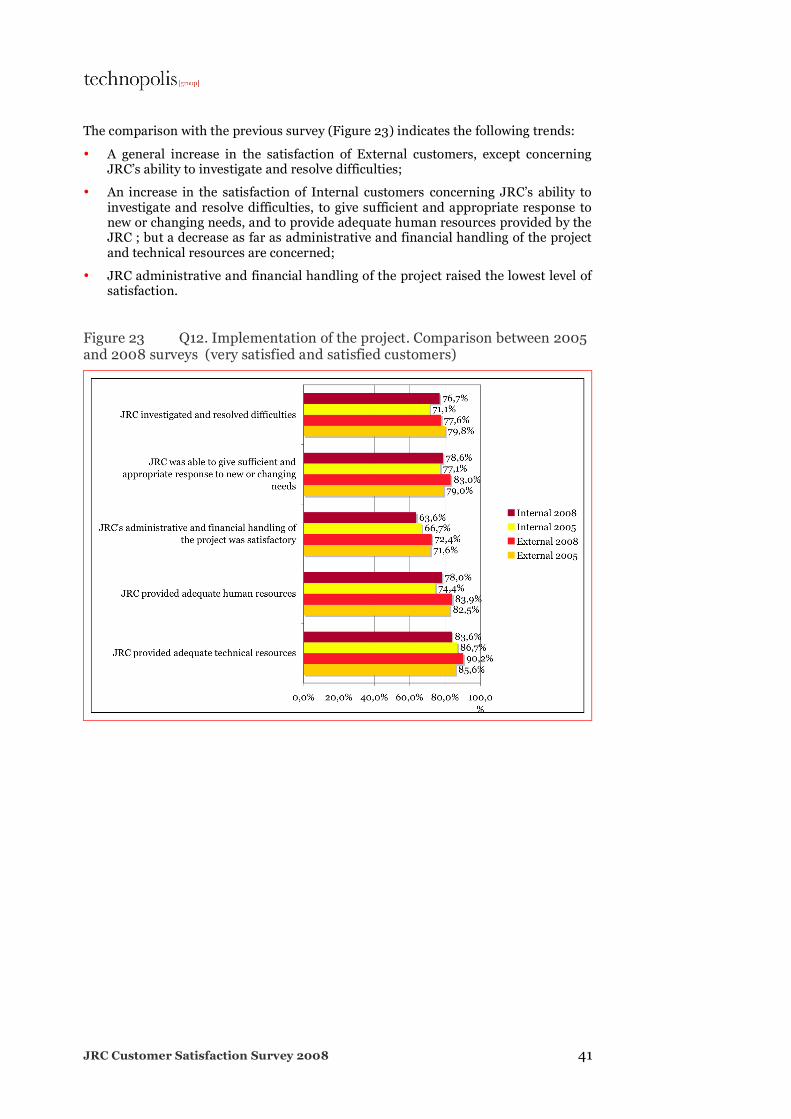
The comparison with the previous survey (Figure 23) indicates the following trends:
• A general increase in the satisfaction of External customers, except concerning JRC’s ability to investigate and resolve difficulties;
• An increase in the satisfaction of Internal customers concerning JRC’s ability to investigate and resolve difficulties, to give sufficient and appropriate response to new or changing needs, and to provide adequate human resources provided by the JRC ; but a decrease as far as administrative and financial handling of the project and technical resources are concerned;
• JRC administrative and financial handling of the project raised the lowest level of satisfaction.
Figure 23 Q12. Implementation of the project. Comparison between 2005 and 2008 surveys (very satisfied and satisfied customers)
JRC Customer Satisfaction Survey 2008 42
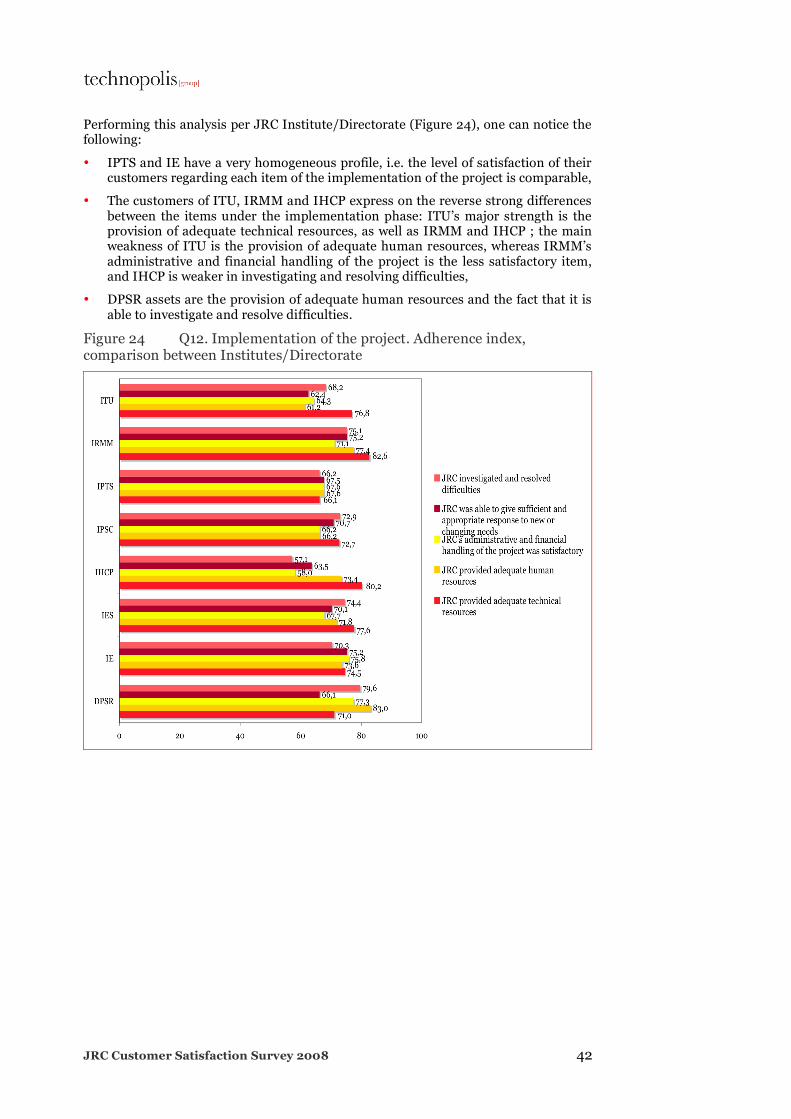
Performing this analysis per JRC Institute/Directorate (Figure 24), one can notice the following:
• IPTS and IE have a very homogeneous profile, i.e. the level of satisfaction of their customers regarding each item of the implementation of the project is comparable,
• The customers of ITU, IRMM and IHCP express on the reverse strong differences between the items under the implementation phase: ITU’s major strength is the provision of adequate technical resources, as well as IRMM and IHCP ; the main weakness of ITU is the provision of adequate human resources, whereas IRMM’s administrative and financial handling of the project is the less satisfactory item, and IHCP is weaker in investigating and resolving difficulties,
• DPSR assets are the provision of adequate human resources and the fact that it is able to investigate and resolve difficulties.
Figure 24 Q12. Implementation of the project. Adherence index, comparison between Institutes/Directorate

JRC Customer Satisfaction Survey 2008 43
7.1.3 Completion
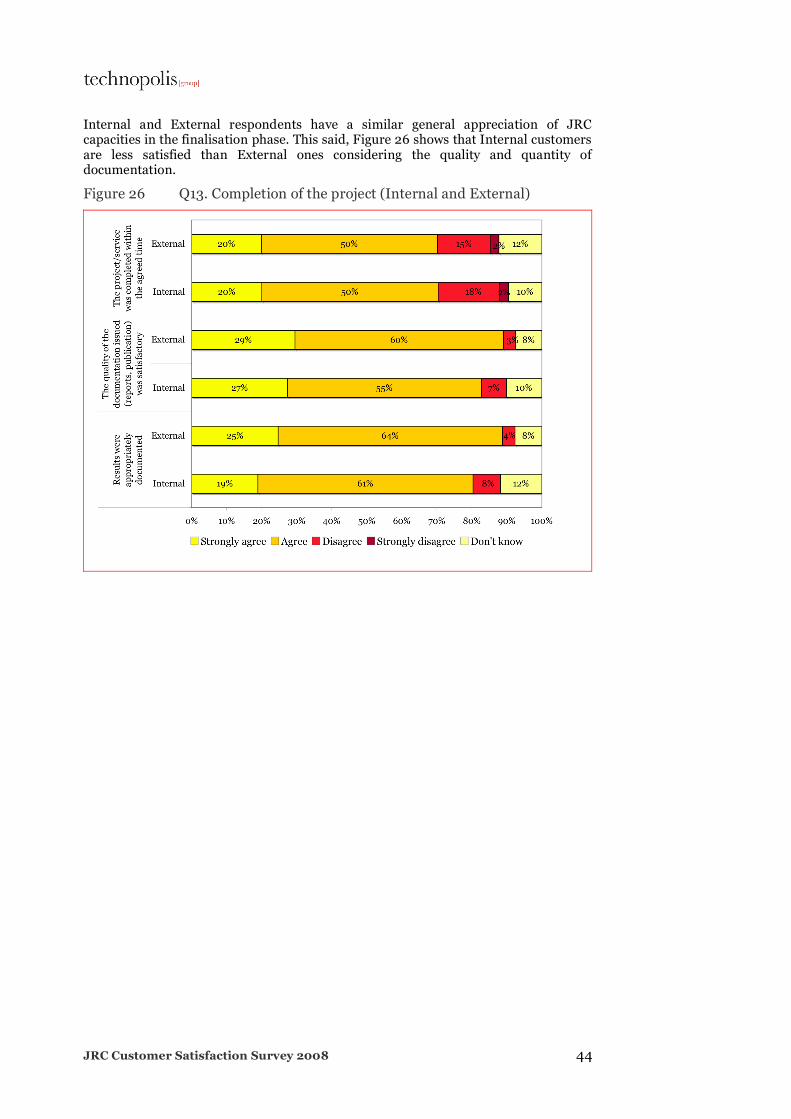
The scientific and technical excellence of JRC appears to be transformed appropriately into projects results and deliveries such as reports and publications (Figure 25): more than 58% of the respondents agree with the statement and about 29% strongly agree. Corresponding to the earlier results regarding the management abilities of JRC, satisfaction is about 10% lower when deliveries are considered with regard to agreed deadlines (only 70% of respondents strongly agree or agree that JRC completed the project on time against more then 85% for the other statements).
Figure 25 Q13. Completion of the project (all customers)
JRC Customer Satisfaction Survey 2008 44
Internal and External respondents have a similar general appreciation of JRC capacities in the finalisation phase. This said, Figure 26 shows that Internal customers are less satisfied than External ones considering the quality and quantity of documentation.
Figure 26 Q13. Completion of the project (Internal and External)

JRC Customer Satisfaction Survey 2008 45
The already observed heterogeneity in the level of satisfaction of External and Internal customers also exists for the completion of the project (Figure 27): Internal customers are less satisfied with the completion of the project in 2008 than in 2005, whereas External customers’ satisfaction is increasing over time.
The timely completion of the project is the less satisfactory item for both types of customers. External customers are particularly more satisfied with the appropriate documentation in 2008 than in 2005.
Figure 27 Q13. Completion of the project. Comparison between 2005 and 2008 surveys (very satisfied and satisfied customers)
JRC Customer Satisfaction Survey 2008 46
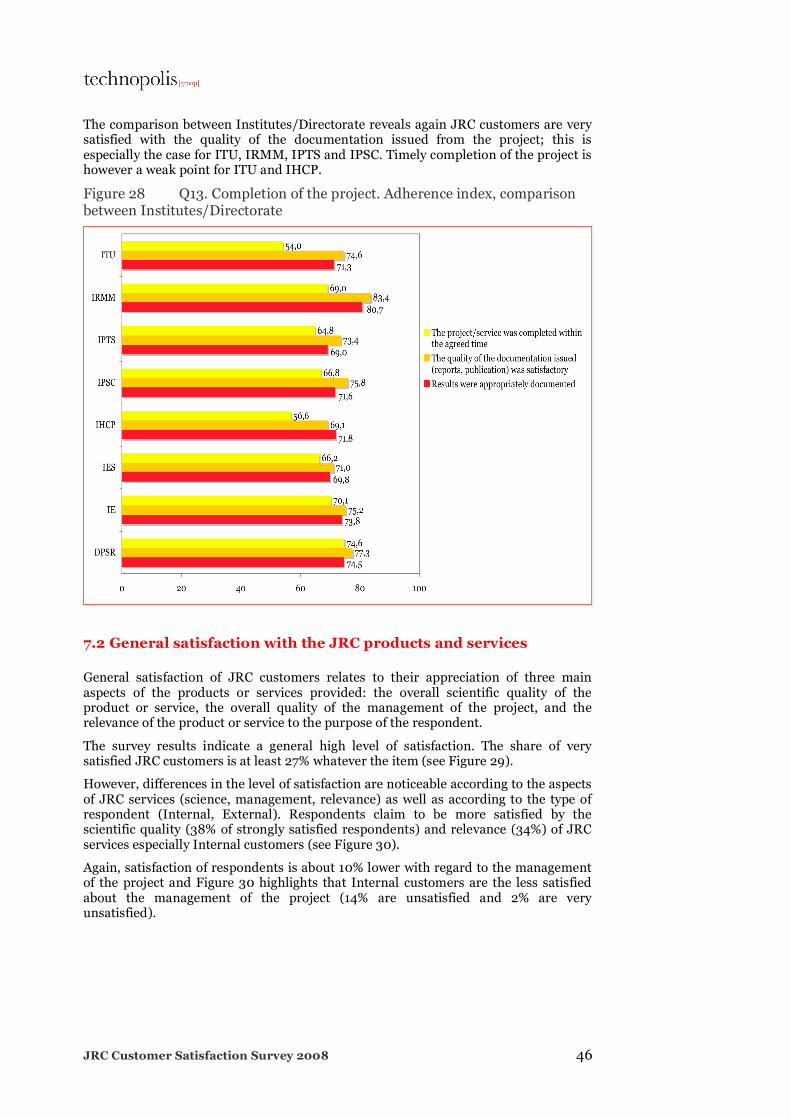
The comparison between Institutes/Directorate reveals again JRC customers are very satisfied with the quality of the documentation issued from the project; this is especially the case for ITU, IRMM, IPTS and IPSC. Timely completion of the project is however a weak point for ITU and IHCP.
Figure 28 Q13. Completion of the project. Adherence index, comparison between Institutes/Directorate
7.2 General satisfaction with the JRC products and services
General satisfaction of JRC customers relates to their appreciation of three main aspects of the products or services provided: the overall scientific quality of the product or service, the overall quality of the management of the project, and the relevance of the product or service to the purpose of the respondent.
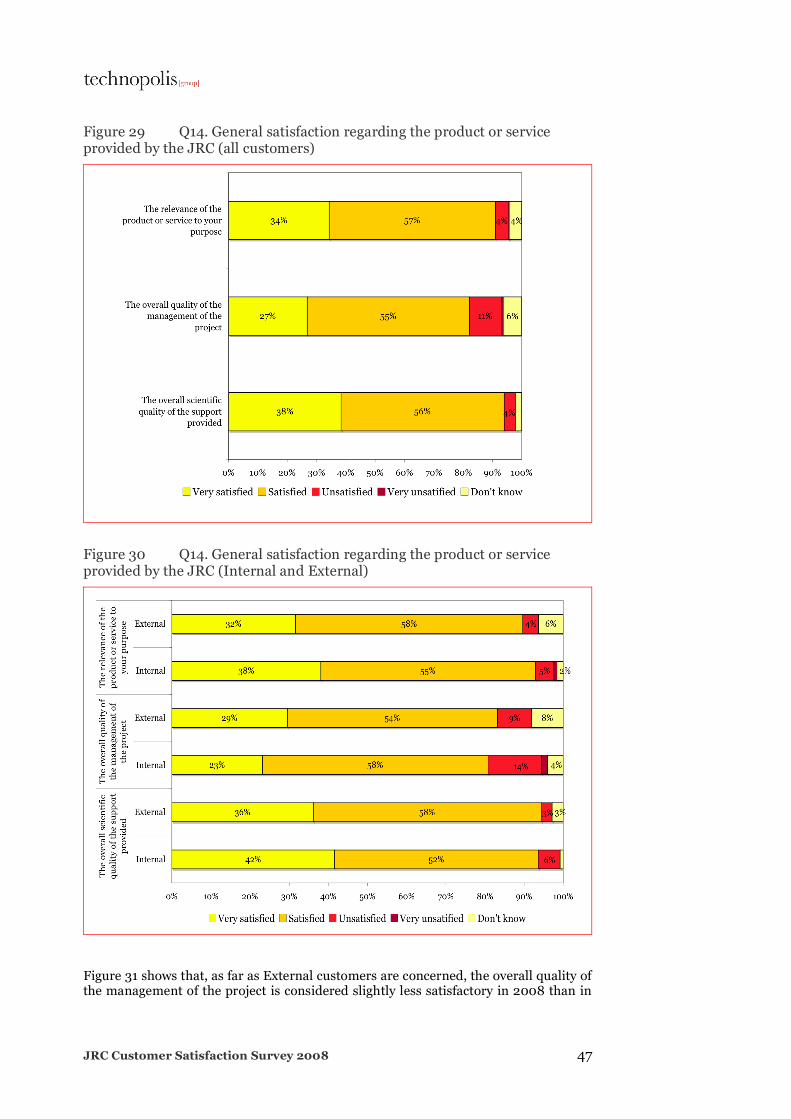
The survey results indicate a general high level of satisfaction. The share of very satisfied JRC customers is at least 27% whatever the item (see Figure 29).
However, differences in the level of satisfaction are noticeable according to the aspects of JRC services (science, management, relevance) as well as according to the type of respondent (Internal, External). Respondents claim to be more satisfied by the scientific quality (38% of strongly satisfied respondents) and relevance (34%) of JRC services especially Internal customers (see Figure 30).
Again, satisfaction of respondents is about 10% lower with regard to the management of the project and Figure 30 highlights that Internal customers are the less satisfied about the management of the project (14% are unsatisfied and 2% are very unsatisfied).
JRC Customer Satisfaction Survey 2008 47
Figure 29 Q14. General satisfaction regarding the product or service provided by the JRC (all customers)
Figure 30 Q14. General satisfaction regarding the product or service provided by the JRC (Internal and External)
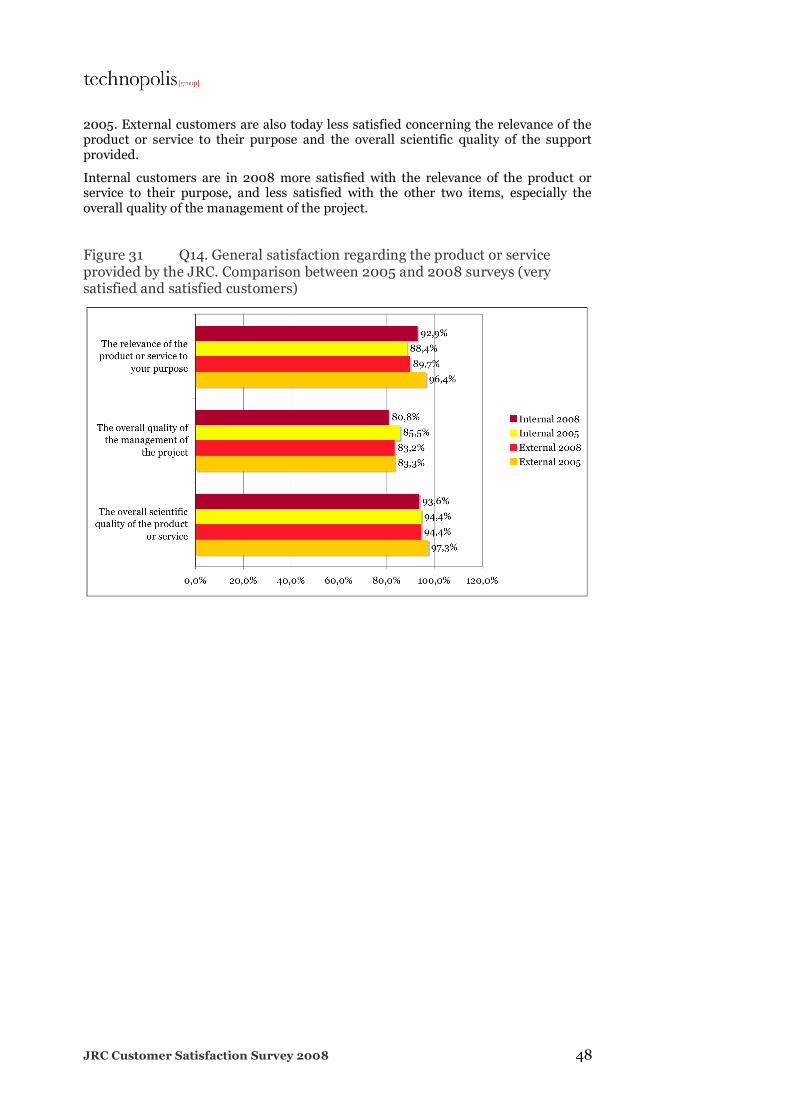
Figure 31 shows that, as far as External customers are concerned, the overall quality of the management of the project is considered slightly less satisfactory in 2008 than in
JRC Customer Satisfaction Survey 2008 48
2005. External customers are also today less satisfied concerning the relevance of the product or service to their purpose and the overall scientific quality of the support provided.
Internal customers are in 2008 more satisfied with the relevance of the product or service to their purpose, and less satisfied with the other two items, especially the overall quality of the management of the project.
Figure 31 Q14. General satisfaction regarding the product or service provided by the JRC. Comparison between 2005 and 2008 surveys (very satisfied and satisfied customers)

JRC Customer Satisfaction Survey 2008 49
As presented in Figure 32, levels of general satisfaction are homogeneous among JRC Institutes/Directorate, either overall or per each individual item. The overall quality of the services provided by IRMM and ITU is put forward by their customers.
Figure 32 Q14. General satisfaction regarding the product or service provided by the JRC. Adherence index, comparison between Institutes/Directorate
JRC Customer Satisfaction Survey 2008 50
7.3 Satisfaction regarding communication about the project
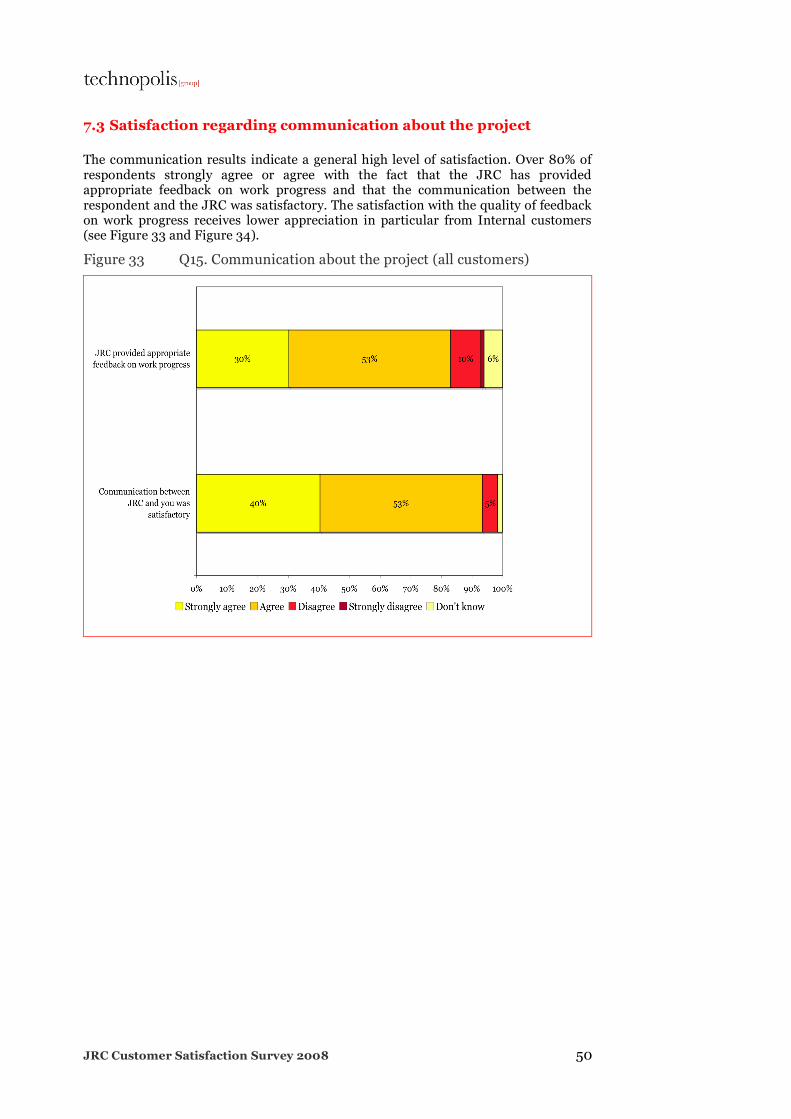
The communication results indicate a general high level of satisfaction. Over 80% of respondents strongly agree or agree with the fact that the JRC has provided appropriate feedback on work progress and that the communication between the respondent and the JRC was satisfactory. The satisfaction with the quality of feedback on work progress receives lower appreciation in particular from Internal customers (see Figure 33 and Figure 34).
Figure 33 Q15. Communication about the project (all customers)

JRC Customer Satisfaction Survey 2008 51
Figure 34 Q15. Communication about the project (Internal and External)
The comparison between the 2005 and 2008 surveys reveals that communication about the project is overall considered as more satisfactory today for all JRC customers (cf. Figure 35) – to the exception of the JRC’s appropriate feedback on work progress for Internal customers.
Figure 35 Q15. Communication about the project. Comparison between 2005 and 2008 surveys (very satisfied and satisfied customers)
JRC Customer Satisfaction Survey 2008 52
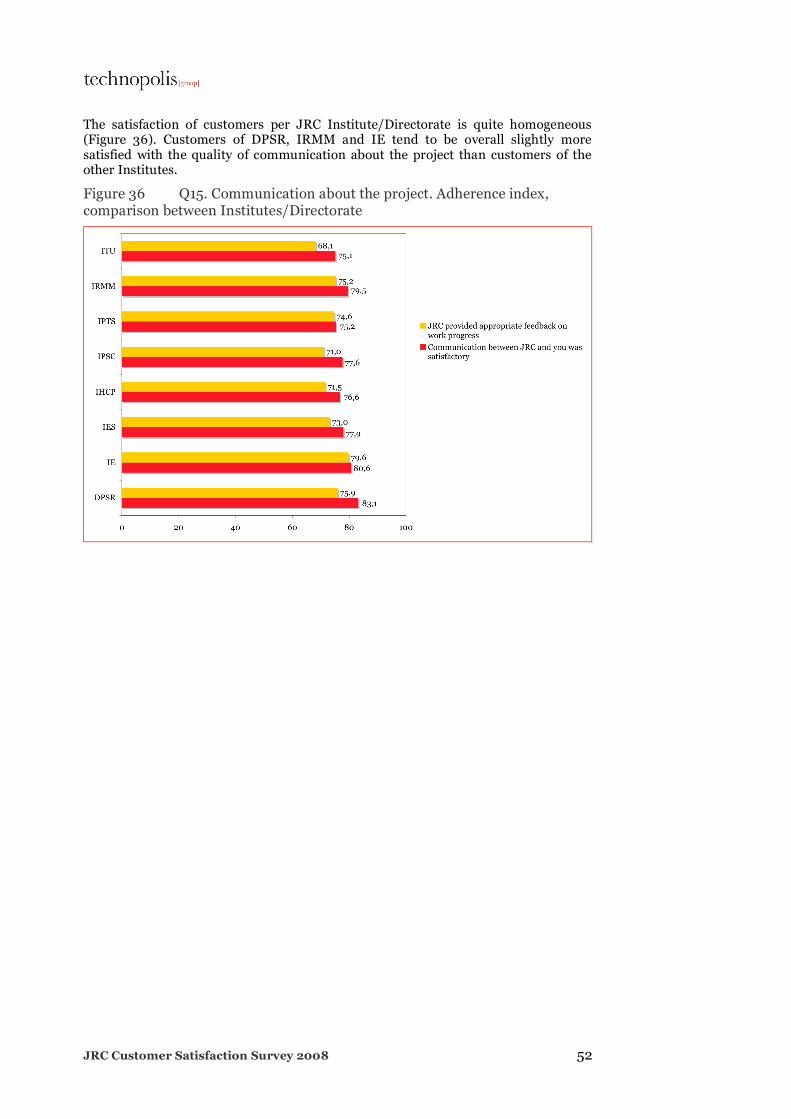
The satisfaction of customers per JRC Institute/Directorate is quite homogeneous (Figure 36). Customers of DPSR, IRMM and IE tend to be overall slightly more satisfied with the quality of communication about the project than customers of the other Institutes.
Figure 36 Q15. Communication about the project. Adherence index, comparison between Institutes/Directorate

JRC Customer Satisfaction Survey 2008 53
8. Overall assessment
The approach chosen in this survey consists of using different items to investigate the overall results of the projects customers have carried out with JRC. By combining these various angles one obtains a better understanding regarding the level of achievements of the partnerships with JRC and the value added by JRC into these partnerships.
This section is also the opportunity to understand the personal plans of customers for future collaboration with JRC.
8.1 General opinion on the project
The ability of JRC to indicate relevant partners for customers’ projects appears less satisfactory than the performance and added value of JRC in the project (only 20% of respondents strongly agree that JRC has put them in contact with appropriate partners). Respectively, 87 % and 89 % of the respondents strongly agree or agree that the overall performance of the project and the added value brought by the project is satisfactory.
Figure 37 Q17. General opinion on the project (all customers)
JRC Customer Satisfaction Survey 2008 54
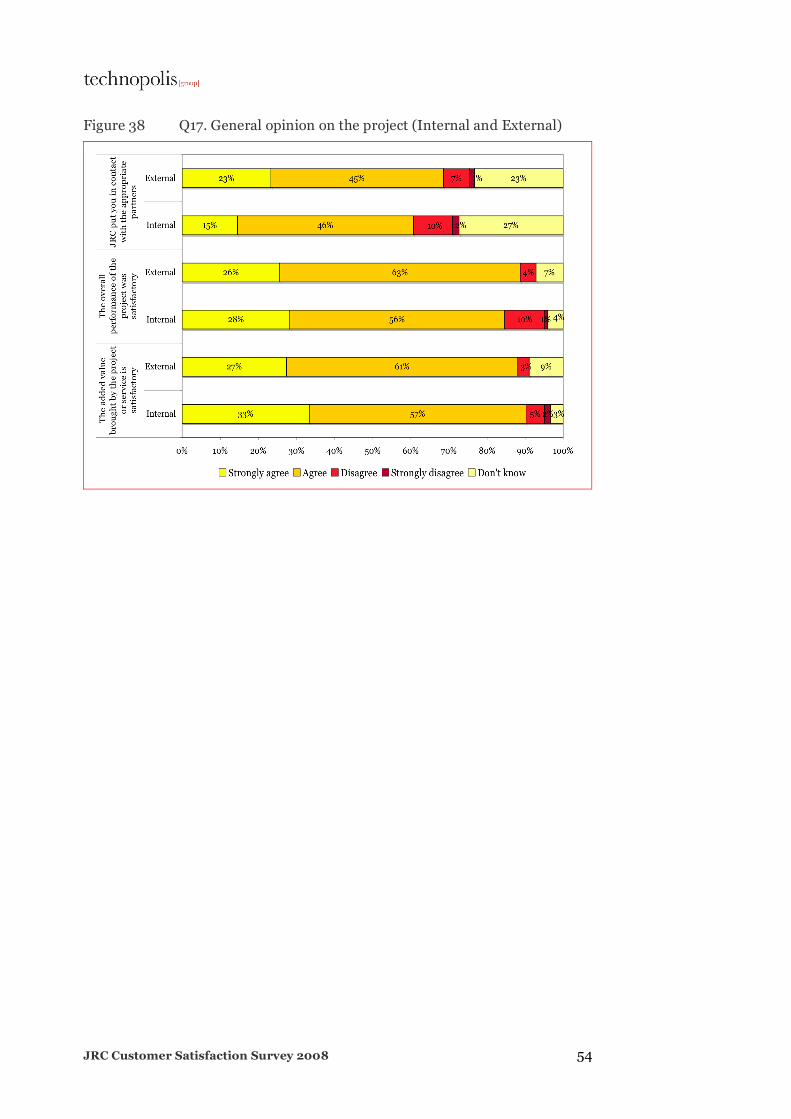
Figure 38 Q17. General opinion on the project (Internal and External)
JRC Customer Satisfaction Survey 2008 55
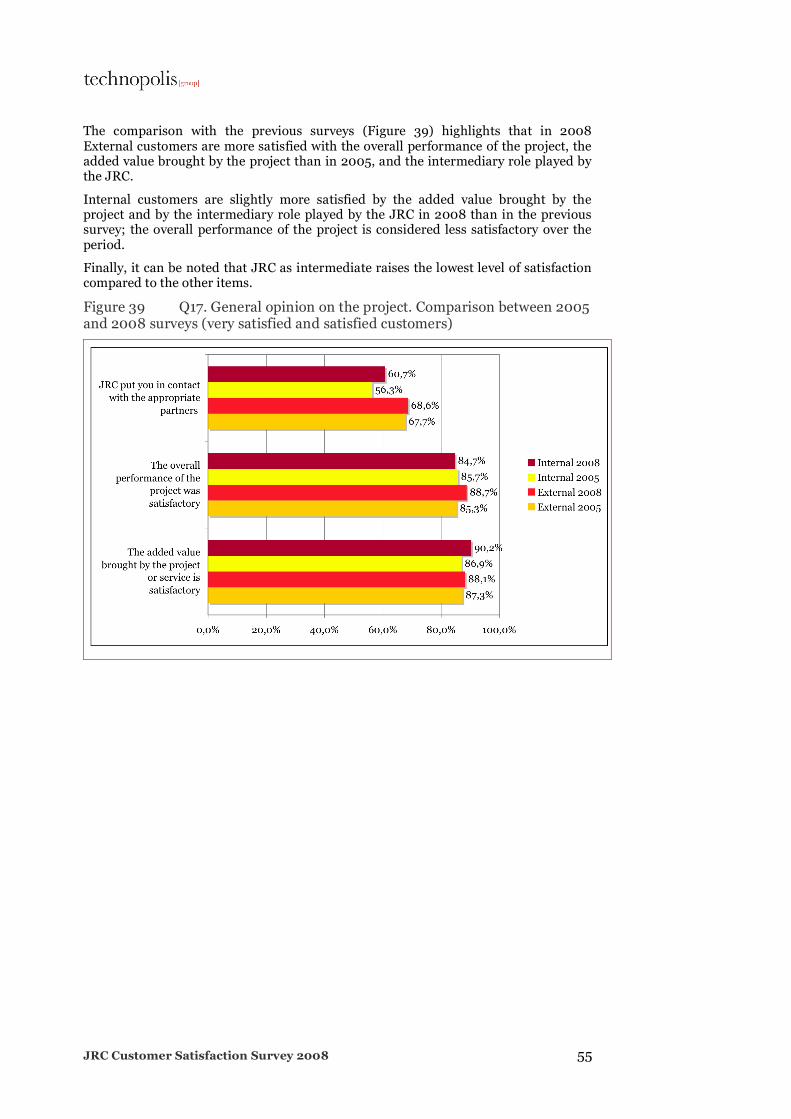
The comparison with the previous surveys (Figure 39) highlights that in 2008 External customers are more satisfied with the overall performance of the project, the added value brought by the project than in 2005, and the intermediary role played by the JRC.
Internal customers are slightly more satisfied by the added value brought by the project and by the intermediary role played by the JRC in 2008 than in the previous survey; the overall performance of the project is considered less satisfactory over the period.
Finally, it can be noted that JRC as intermediate raises the lowest level of satisfaction compared to the other items.
Figure 39 Q17. General opinion on the project. Comparison between 2005 and 2008 surveys (very satisfied and satisfied customers)
JRC Customer Satisfaction Survey 2008 56
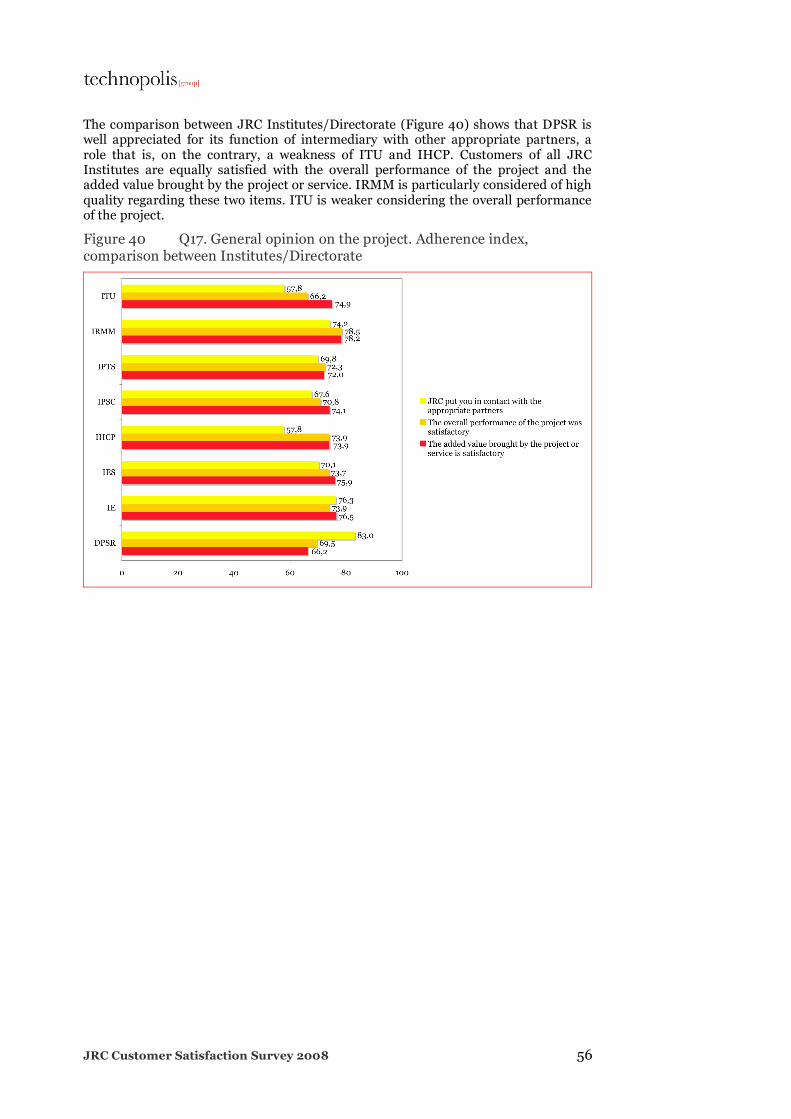
The comparison between JRC Institutes/Directorate (Figure 40) shows that DPSR is well appreciated for its function of intermediary with other appropriate partners, a role that is, on the contrary, a weakness of ITU and IHCP. Customers of all JRC Institutes are equally satisfied with the overall performance of the project and the added value brought by the project or service. IRMM is particularly considered of high quality regarding these two items. ITU is weaker considering the overall performance of the project.
Figure 40 Q17. General opinion on the project. Adherence index, comparison between Institutes/Directorate
JRC Customer Satisfaction Survey 2008 57
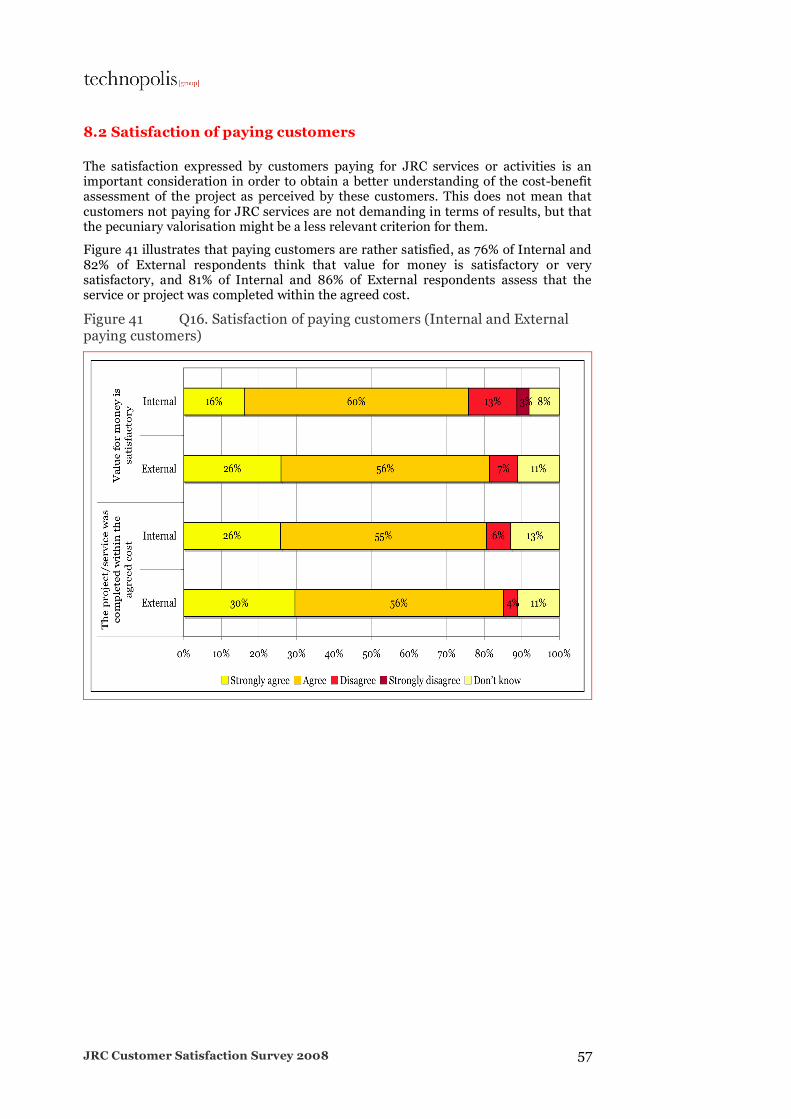
8.2 Satisfaction of paying customers
The satisfaction expressed by customers paying for JRC services or activities is an important consideration in order to obtain a better understanding of the cost-benefit assessment of the project as perceived by these customers. This does not mean that customers not paying for JRC services are not demanding in terms of results, but that the pecuniary valorisation might be a less relevant criterion for them.
Figure 41 illustrates that paying customers are rather satisfied, as 76% of Internal and 82% of External respondents think that value for money is satisfactory or very satisfactory, and 81% of Internal and 86% of External respondents assess that the service or project was completed within the agreed cost.
Figure 41 Q16. Satisfaction of paying customers (Internal and External paying customers)
JRC Customer Satisfaction Survey 2008 58
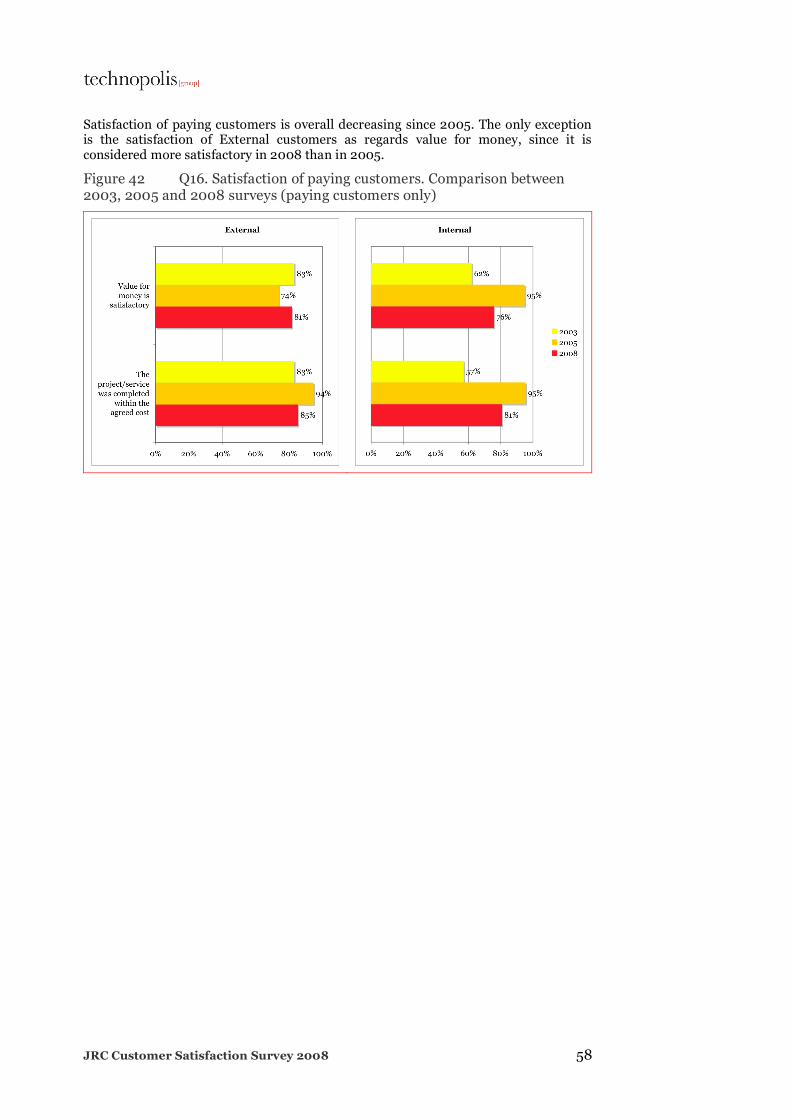
Satisfaction of paying customers is overall decreasing since 2005. The only exception is the satisfaction of External customers as regards value for money, since it is considered more satisfactory in 2008 than in 2005.
Figure 42 Q16. Satisfaction of paying customers. Comparison between 2003, 2005 and 2008 surveys (paying customers only)
JRC Customer Satisfaction Survey 2008 59
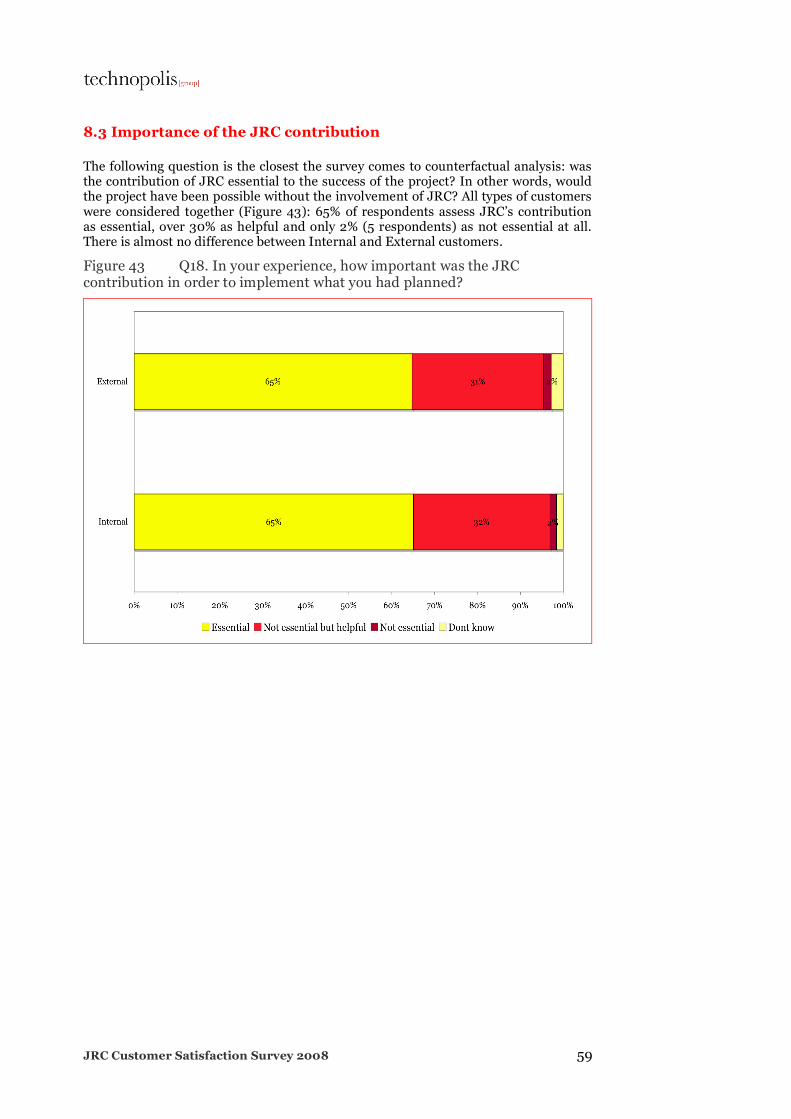
8.3 Importance of the JRC contribution
The following question is the closest the survey comes to counterfactual analysis: was the contribution of JRC essential to the success of the project? In other words, would the project have been possible without the involvement of JRC? All types of customers were considered together (Figure 43): 65% of respondents assess JRC’s contribution as essential, over 30% as helpful and only 2% (5 respondents) as not essential at all. There is almost no difference between Internal and External customers.
Figure 43 Q18. In your experience, how important was the JRC contribution in order to implement what you had planned?
JRC Customer Satisfaction Survey 2008 60
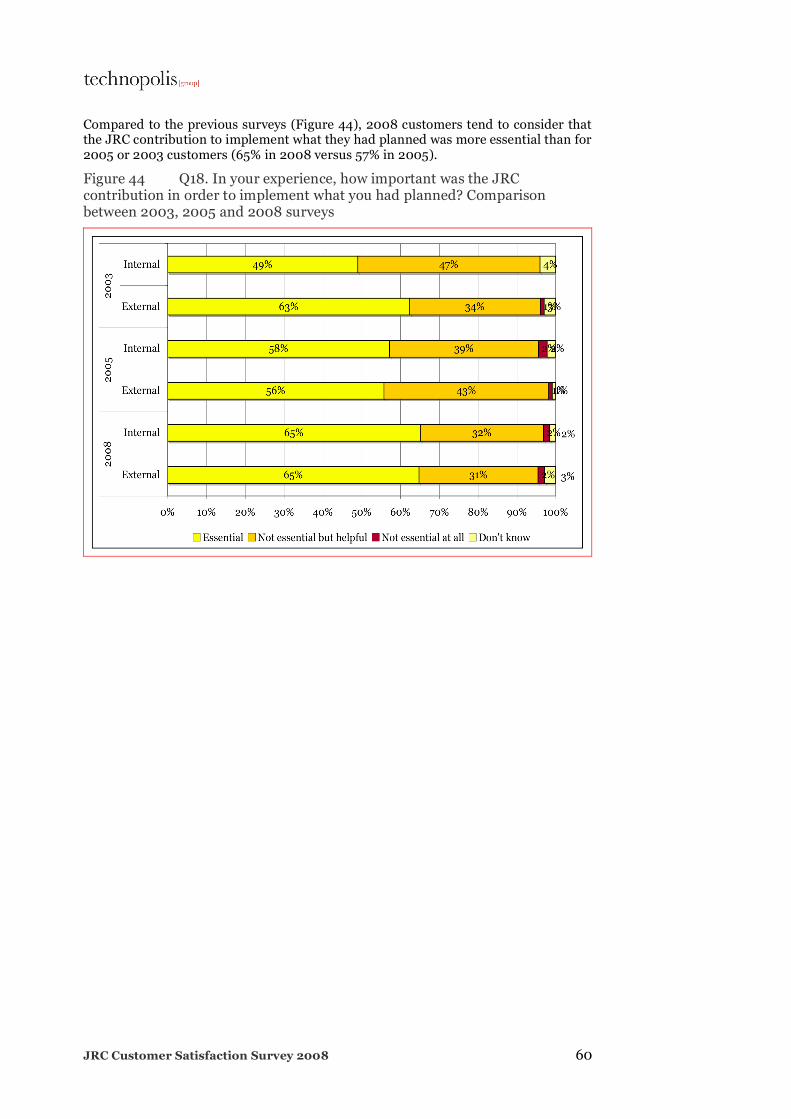
Compared to the previous surveys (Figure 44), 2008 customers tend to consider that the JRC contribution to implement what they had planned was more essential than for 2005 or 2003 customers (65% in 2008 versus 57% in 2005).
Figure 44 Q18. In your experience, how important was the JRC contribution in order to implement what you had planned? Comparison between 2003, 2005 and 2008 surveys
JRC Customer Satisfaction Survey 2008 61
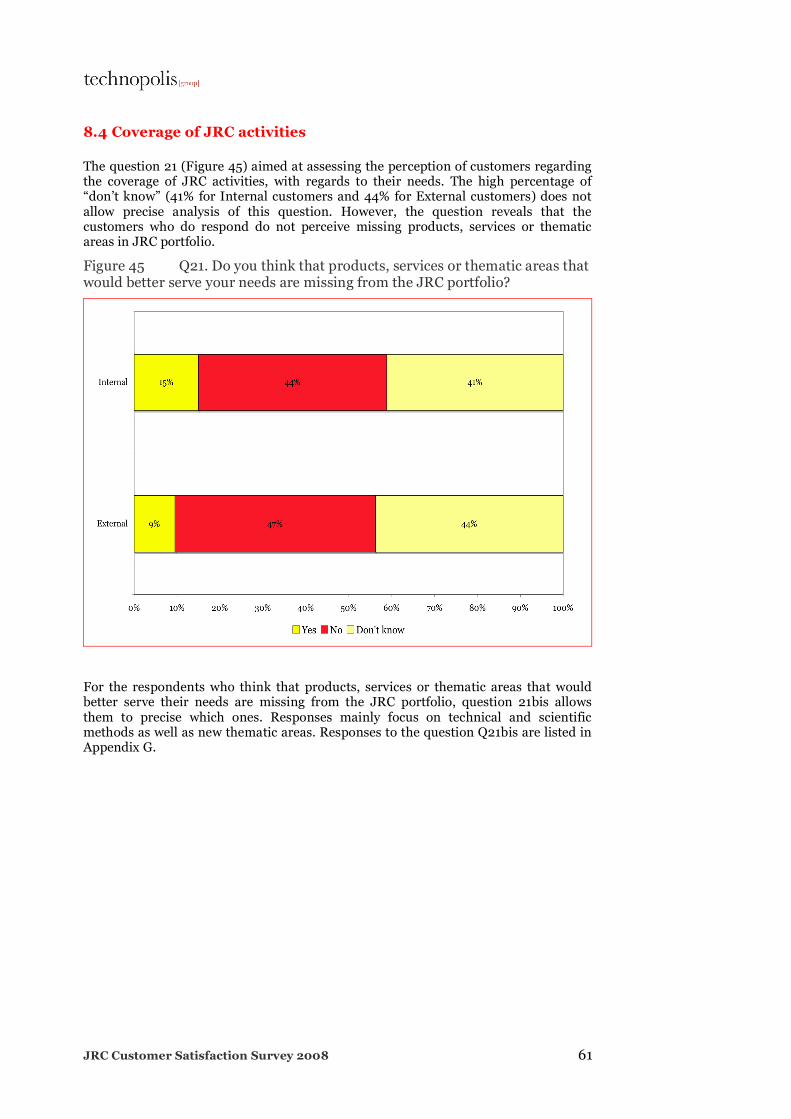
8.4 Coverage of JRC activities
The question 21 (Figure 45) aimed at assessing the perception of customers regarding the coverage of JRC activities, with regards to their needs. The high percentage of “don’t know” (41% for Internal customers and 44% for External customers) does not allow precise analysis of this question. However, the question reveals that the customers who do respond do not perceive missing products, services or thematic areas in JRC portfolio.
Figure 45 Q21. Do you think that products, services or thematic areas that would better serve your needs are missing from the JRC portfolio?
For the respondents who think that products, services or thematic areas that would better serve their needs are missing from the JRC portfolio, question 21bis allows them to precise which ones. Responses mainly focus on technical and scientific methods as well as new thematic areas. Responses to the question Q21bis are listed in Appendix G.

JRC Customer Satisfaction Survey 2008 62
26% of IPTS customers, 25% of ITU customers, 18% of IE customers, 13% of IES customers, 10% of DPSR customers and 9% of IPSC customers consider there are missing products, services or thematic areas from these Institutes/Directorate portfolios.
Figure 46 Q21. Do you think that products, services or thematic areas that would better serve your needs are missing from the JRC portfolio? Comparison between Institutes/Directorate
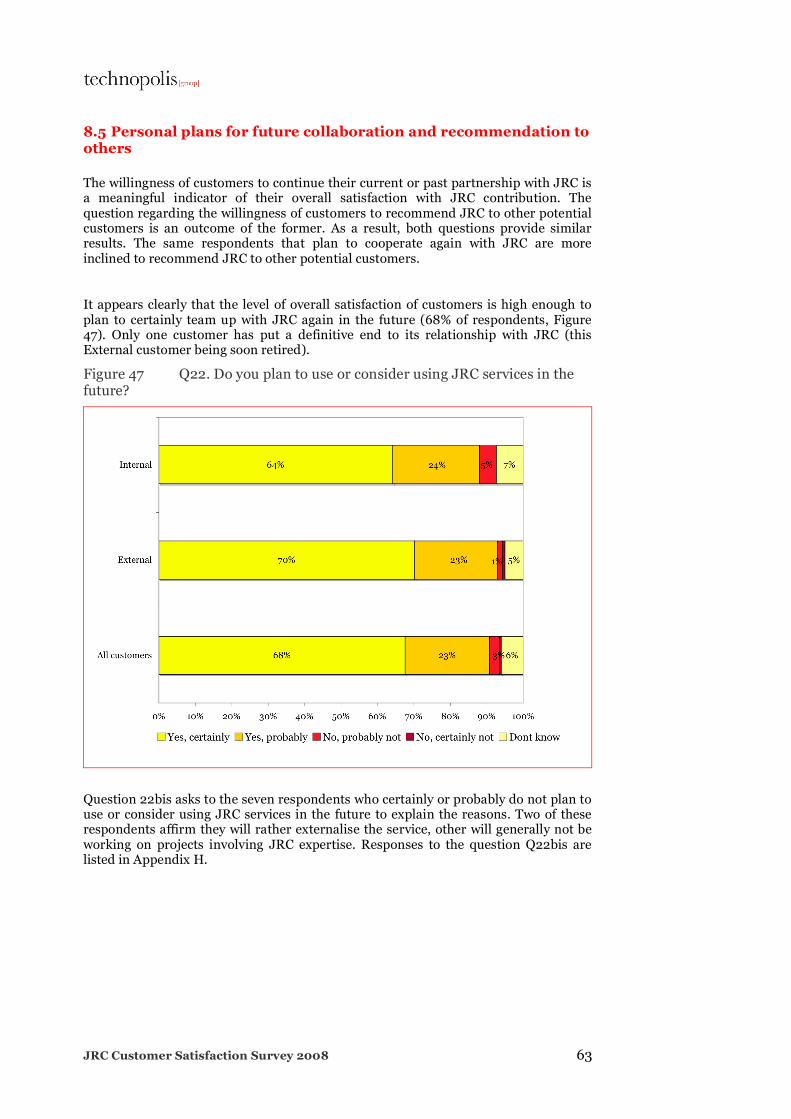
JRC Customer Satisfaction Survey 2008 63
8.5 Personal plans for future collaboration and recommendation to others
The willingness of customers to continue their current or past partnership with JRC is a meaningful indicator of their overall satisfaction with JRC contribution. The question regarding the willingness of customers to recommend JRC to other potential customers is an outcome of the former. As a result, both questions provide similar results. The same respondents that plan to cooperate again with JRC are more inclined to recommend JRC to other potential customers.
It appears clearly that the level of overall satisfaction of customers is high enough to plan to certainly team up with JRC again in the future (68% of respondents, Figure 47). Only one customer has put a definitive end to its relationship with JRC (this External customer being soon retired).
Figure 47 Q22. Do you plan to use or consider using JRC services in the future?
Question 22bis asks to the seven respondents who certainly or probably do not plan to use or consider using JRC services in the future to explain the reasons. Two of these respondents affirm they will rather externalise the service, other will generally not be working on projects involving JRC expertise. Responses to the question Q22bis are listed in Appendix H.

JRC Customer Satisfaction Survey 2008 64
Moreover, 64% of customers appear ready to certainly recommend JRC as a scientific and technical service provider to other relevant stakeholders (see Figure 48).
Figure 48 Q23. Would you recommend the JRC as a scientific and technical service provider to others?
Question 23bis asks to the five respondents who probably would not recommend the JRC as a scientific and technical service provider to others to explain why. Three of these five respondents have expressed their reasons, which are listed in Appendix I.
The plans for future cooperation and recommendations of the JRC to others as declared in 2008 are consistent with those claimed in 2003 and 2005 (Exhibit 15). The main finding here is the renewed willingness of internal customers to recommend JRC to others.
Exhibit 15 Personal plans and recommendations to others regarding JRC (adherence index), comparison between 2003, 2005 and 2008 surveys
Do you plan to use or consider
using JRC services in the future?
Would you recommend the JRC as a scientific and technical service provider to others?
2003 2005 2008 2003 2005 2008
Internal customers
89,7 87,3 87,9 88,1 83,1 87,4
External customers
90,2 93,3 90,1 91,3 90,4 88,9
All customers 90,0 90,3 89,2 89,7 86,8 88,3
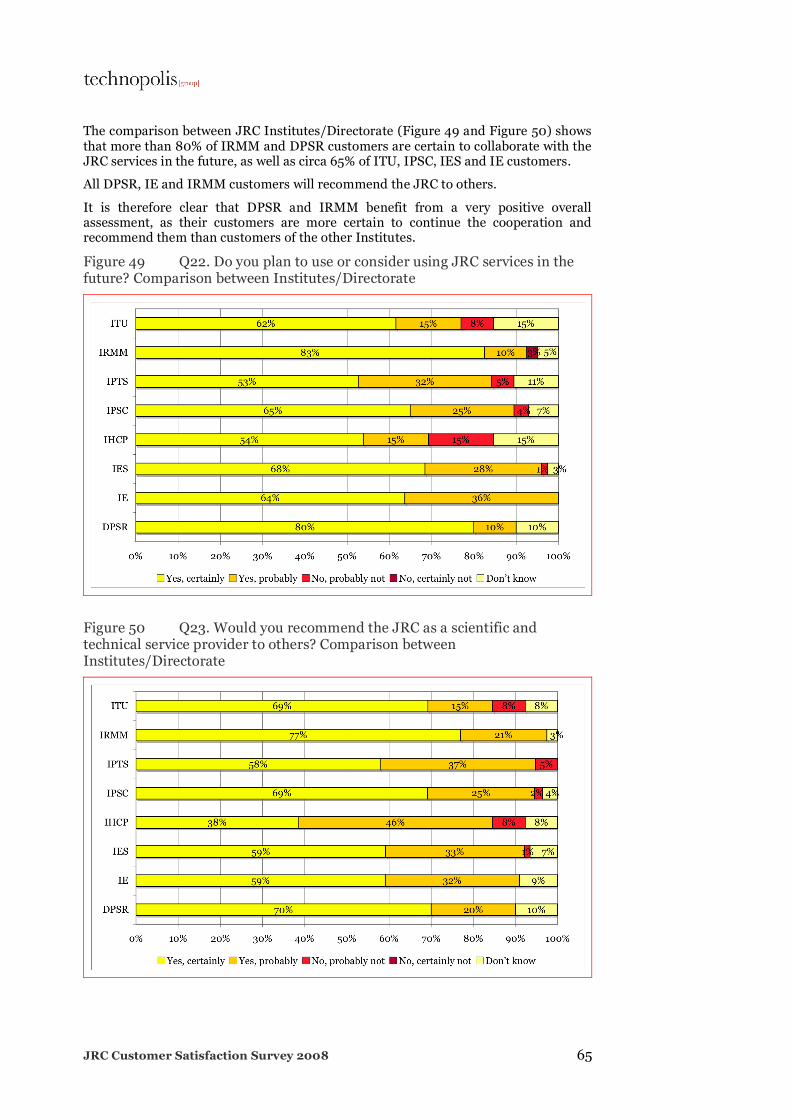
JRC Customer Satisfaction Survey 2008 65
The comparison between JRC Institutes/Directorate (Figure 49 and Figure 50) shows that more than 80% of IRMM and DPSR customers are certain to collaborate with the JRC services in the future, as well as circa 65% of ITU, IPSC, IES and IE customers.
All DPSR, IE and IRMM customers will recommend the JRC to others.
It is therefore clear that DPSR and IRMM benefit from a very positive overall assessment, as their customers are more certain to continue the cooperation and recommend them than customers of the other Institutes.
Figure 49 Q22. Do you plan to use or consider using JRC services in the future? Comparison between Institutes/Directorate
Figure 50 Q23. Would you recommend the JRC as a scientific and technical service provider to others? Comparison between Institutes/Directorate

JRC Customer Satisfaction Survey 2008 66
8.6 The JRC compared to its alternatives
In order to benchmark JRC Institutes/Directorate with their counterparts, respondents were asked to compare the overall quality of JRC with that of known alternatives. These benchmarks were differentiated by whether they were local, regional, national or international organisations able to provide similar services.
Differences in the results obtained for local, regional, national or international alternatives originate mainly from the customers’ knowledge in alternative organisations. The high percentage of “no alternative” reveals the JRC’s unique competences and role. Figure 51 highlights that the closer we get to the local level the more unique JRC’s competence and role appear (“there is no alternative” ranges from 20% for international organisations to 39% for local organisations).
Nevertheless, results are very close for all categories: about 20% of customers consider JRC of far better quality and 25% of better quality than the alternative organisation they know. About 20% of customers consider JRC of equal quality. Only a minority of respondents (around 3%) claims that JRC does not meet quality standards of its alternatives.
Figure 51 Q24. Please assess the quality of the JRC compared to alternatives you might know: the rank “-2” meaning the JRC is far worse quality; the rank “2” meaning the JRC is much better quality

JRC Customer Satisfaction Survey 2008 67
9. Improvements: opinions of JRC customers
The questionnaire offered respondents the opportunity to express the motives of their satisfaction or dissatisfaction, and to express recommendations to improve the support of JRC. All together, these open comments complete the quantitative data whose results were presented in the previous sections. They also provide a cross-analysis with issues raised during the interviews that otherwise would have remained unknown.
This chapter deals then with the results of the five open questions asked to respondents of the web-based questionnaire as presented in Exhibit 16.
Exhibit 16 Number of responses to open questions
Internal
respondents External
respondents
q19. If you have been very satisfied with your cooperation with the JRC, please indicate why.
46 63
q20. If you have been very unsatisfied with your cooperation with the JRC, please indicate why.
11 13
q25. Can you please indicate any scientific support organisation alternative to the JRC you are currently, or have been recently, working with?
41 60
q26bis. In your opinion, what are the main areas for improvement for the JRC?
10 7
q27. Would you like to add any further comment on your relationship with the JRC?
17 36
9.1 Expressions of satisfaction or dissatisfaction
Expressions of satisfaction or dissatisfaction have been expressed through the on-line questionnaire in questions 19 and 20, and during the qualitative interviews.
Expressions of dissatisfaction are a minority compared to satisfaction comments (a ratio near 4 for Internal customers and 5 for External customers).
Very satisfied respondents underline a good cooperation with the JRC mainly explained by:
• high technical and scientific knowledge and expertise,
• high human resources capacities,
• good management (timely response, expected results achieved),
• good understanding of customers needs,
• quality of the work achieved,
• good communication.
Internal customers also highlight the independence of the JRC as a strong factor of satisfaction. External customers stress a granted access to information and technology not available otherwise.
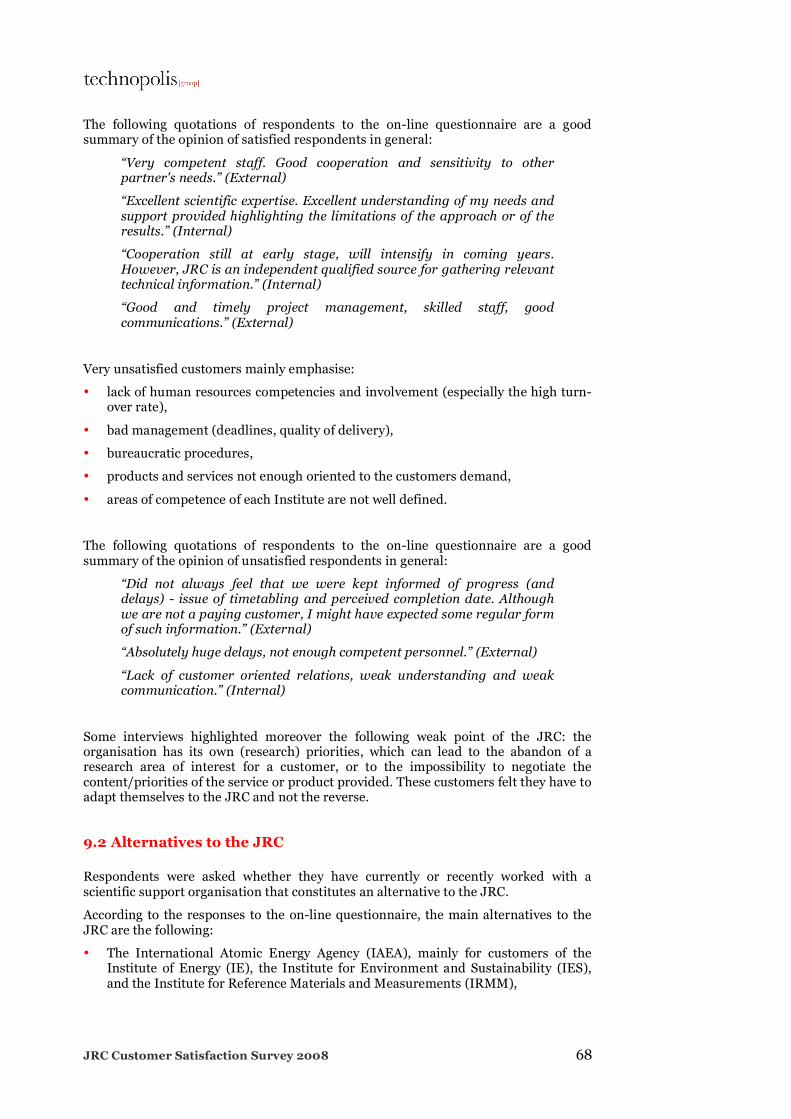
JRC Customer Satisfaction Survey 2008 68
The following quotations of respondents to the on-line questionnaire are a good summary of the opinion of satisfied respondents in general:
“Very competent staff. Good cooperation and sensitivity to other partner's needs.” (External)
“Excellent scientific expertise. Excellent understanding of my needs and support provided highlighting the limitations of the approach or of the results.” (Internal)
“Cooperation still at early stage, will intensify in coming years. However, JRC is an independent qualified source for gathering relevant technical information.” (Internal)
“Good and timely project management, skilled staff, good communications.” (External)
Very unsatisfied customers mainly emphasise:
• lack of human resources competencies and involvement (especially the high turn-over rate),
• bad management (deadlines, quality of delivery),
• bureaucratic procedures,
• products and services not enough oriented to the customers demand,
• areas of competence of each Institute are not well defined.
The following quotations of respondents to the on-line questionnaire are a good summary of the opinion of unsatisfied respondents in general:
“Did not always feel that we were kept informed of progress (and delays) - issue of timetabling and perceived completion date. Although we are not a paying customer, I might have expected some regular form of such information.” (External)
“Absolutely huge delays, not enough competent personnel.” (External)
“Lack of customer oriented relations, weak understanding and weak communication.” (Internal)
Some interviews highlighted moreover the following weak point of the JRC: the organisation has its own (research) priorities, which can lead to the abandon of a research area of interest for a customer, or to the impossibility to negotiate the content/priorities of the service or product provided. These customers felt they have to adapt themselves to the JRC and not the reverse.
9.2 Alternatives to the JRC
Respondents were asked whether they have currently or recently worked with a scientific support organisation that constitutes an alternative to the JRC.
According to the responses to the on-line questionnaire, the main alternatives to the JRC are the following:
• The International Atomic Energy Agency (IAEA), mainly for customers of the Institute of Energy (IE), the Institute for Environment and Sustainability (IES), and the Institute for Reference Materials and Measurements (IRMM),

JRC Customer Satisfaction Survey 2008 69
• National universities, research institutes and laboratories are mainly an alternative to the Institute for Health and Consumer Protection (IHCP), the Institute for the Protection and Security of the Citizen (IPSC) and the Institute for Prospective Technological Studies (IPTS),
• The Organisation for Economic Co-operation and Development (OECD) mainly for customers of the Institute for Health and Consumer Protection (IHCP) and the Institute for Prospective Technological Studies (IPTS),
• The French Agency for Atomic Energy (Commissariat à l'Énergie Atomique - CEA) was quoted as an alternative to the Institute for Transuranium Elements (ITU) and to the Institute of Energy (IE),
• The Food and Agriculture Organization of the United Nations (FAO) is the main alternative to the Institute for Environment and Sustainability (IES).
During the qualitative interviews respondents were also asked to compare their collaboration with these alternatives to their collaboration with the JRC. Although comparison is difficult according to the mission and the size of the organisation, it seems i) that the JRC is quite equal to its alternatives in terms of deadlines, quality of deliverables, competencies of human resources, etc. and ii) that respondents stressed that the JRC has unique scientific and technical capabilities in certain areas and has a European dimension.
9.3 Future improvements
The overall performance of the projects carried out with the JRC and the added value of the project seem very satisfactory for the customers. Figure 52 shows that 77% of the respondents consider JRC as well equipped to deliver its mission.
Figure 52 Q26. Based on your experience, what is your perception of the JRC as an organisation?
JRC Customer Satisfaction Survey 2008 70
Suggestions for improvements mainly address reasons for dissatisfaction, such as:
• Better redeployment of human resources,
• More flexibility / customers-oriented response,
• Need for clarification on JRC missions and services,
• More European added value, the JRC should act more as part of the Commission and less like an external research institute,
• More reliability in respecting commitments and delays,
• Avoid taking political positions,
• Enhance administrative procedures, too rigid bureaucracy.
On this last point, qualitative interviews highlight that the JRC should provide contracts faster and decide faster on what it could do or not. Respondents have also pointed out that the JRC should be more reactive and should take decisions faster.
The following quotations of respondents to the on-line questionnaire are a good summary of the suggestions for improvement in general:
“Clear decisions on which fields JRC will be a world leading centre of competence and investing in these areas. Ability to recruit staff with the necessary high level of expertise.” (Internal)
“To cover additional policy areas; improve the match between tasks and resources.” (Internal)
“Better understanding of Commission needs in policy support. More customer's oriented attitude is needed.” (Internal)
9.4 Final comments
Final comments are mainly expressions of satisfaction (55%), especially regarding the human aspect of the collaboration. About 22% of final comments express dissatisfaction primarily regarding bad administration and heavy bureaucracy procedures. The 24% remaining responses had “no other comment”.

JRC Customer Satisfaction Survey 2008 71
10. Recommendations
Recommendations are drawn from the previous analysis based on the results of the surveys and interviews. For this purpose, EPEC recalls apparent strengths and weaknesses of JRC. Following this presentation, EPEC makes proposals for improvement.
10.1 Strengths of JRC
The large majority of JRC customers are satisfied with their collaboration with the JRC. Moreover, satisfaction is increasing over time.
The main assets of JRC lie in its human and technical resources, its scientific and technical competencies and facilities, allowing the provision of high-quality products and services. Communication with the JRC is considered increasingly satisfying since 2005. Interviewees also emphasise the good working relationship with JRC staff. Satisfied customers underlined an overall good management quality of the project by JRC.
The definitive evidence of JRC’s strength is to be found in the customers’ willingness to continue collaboration and to recommend the organisation to other potential customers.
10.2 Weaknesses of JRC
Although the overall level of satisfaction increased since 2005, management abilities of JRC in coordinating and operating projects are still a weakness of the organisation. The lack of staff capacity, the high turn-over rate pointed out by unsatisfied customers indicates a weak human resources management. This leads to difficulties, for JRC, to give sufficient and appropriate response to new or changing needs and to meet deadlines (the timely completion of projects is one of the main weaknesses of JRC). The weight of bureaucratic procedures, problems in administrative and financial handling of projects were also underlined by unsatisfied customers.
Another weakness is that JRC products and services are not enough oriented towards the customers demand. JRC new strategies and research priorities can differ from its customers needs. For example, new JRC orientations can lead to the abandon of a research field that is of high interest and strategic importance for a customer.
Finally, a third weakness relates to a lack of communication on the mission of JRC and its various services. Unsatisfied customers emphasized that the areas of competence of each Institute are not well defined.
10.3 Recommendations
Two recommendations expressed in the 2005 CSS report apply in 2008:
• more efficient attention and resources should be devoted to management, improved normalised and top-down management procedures for monitoring and control of projects should be set, especially at institute level in order to homogenise the treatment of projects; 2008 qualitative interviews recommended moreover that the JRC should provide contracts faster and decide faster on what it

JRC Customer Satisfaction Survey 2008 72
could do or not, pointing out that the JRC should be more reactive and should take decisions faster.
• communication on JRC’s Institute/Directorates, resources, activities as well as strategy should be improved and systematised toward Internal and External customers.
A third recommendation concerns the problem of the JRC strategy being not enough customer-oriented: this would claim for a better dialogue with JRC customers to define the organisation’s priorities.
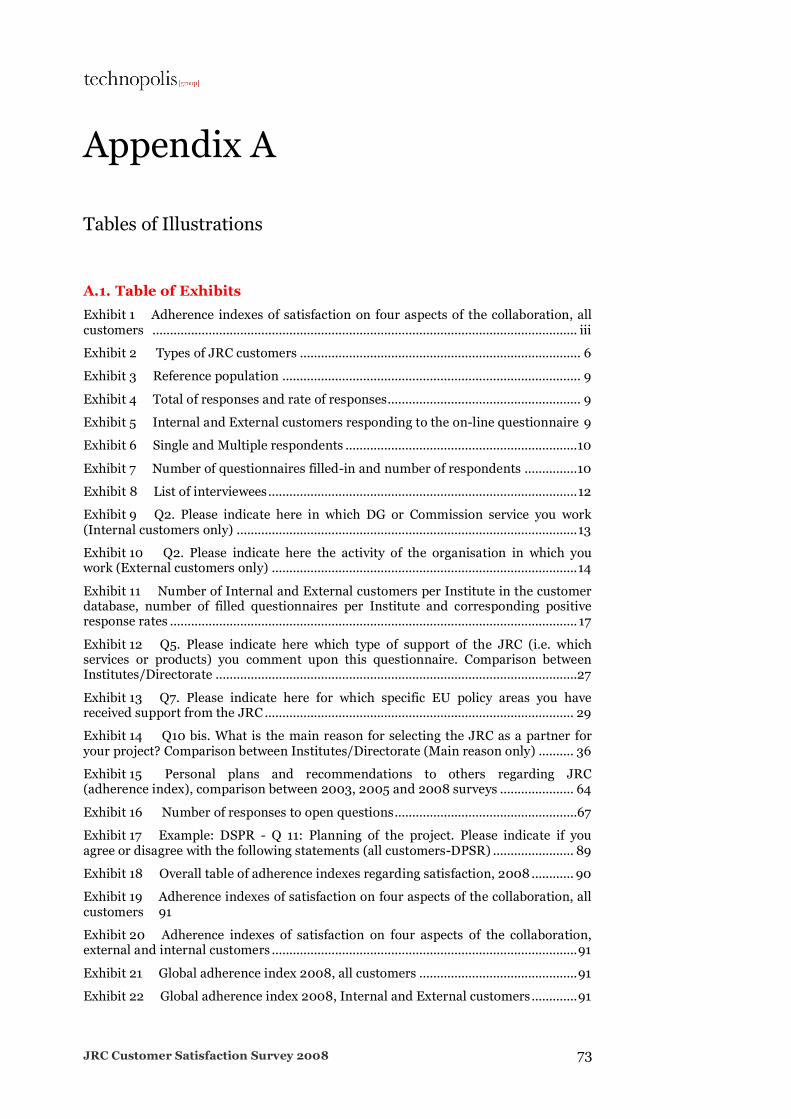
JRC Customer Satisfaction Survey 2008 73
Appendix A
Tables of Illustrations
A.1. Table of Exhibits
Exhibit 1 Adherence indexes of satisfaction on four aspects of the collaboration, all customers ......................................................................................................................... iii Exhibit 2 Types of JRC customers ................................................................................ 6 Exhibit 3 Reference population ..................................................................................... 9 Exhibit 4 Total of responses and rate of responses....................................................... 9 Exhibit 5 Internal and External customers responding to the on-line questionnaire 9 Exhibit 6 Single and Multiple respondents ..................................................................10 Exhibit 7 Number of questionnaires filled-in and number of respondents ...............10 Exhibit 8 List of interviewees........................................................................................12 Exhibit 9 Q2. Please indicate here in which DG or Commission service you work (Internal customers only) .................................................................................................13 Exhibit 10 Q2. Please indicate here the activity of the organisation in which you work (External customers only) .......................................................................................14 Exhibit 11 Number of Internal and External customers per Institute in the customer database, number of filled questionnaires per Institute and corresponding positive response rates .................................................................................................................... 17 Exhibit 12 Q5. Please indicate here which type of support of the JRC (i.e. which services or products) you comment upon this questionnaire. Comparison between Institutes/Directorate .......................................................................................................27 Exhibit 13 Q7. Please indicate here for which specific EU policy areas you have received support from the JRC ........................................................................................ 29 Exhibit 14 Q10 bis. What is the main reason for selecting the JRC as a partner for your project? Comparison between Institutes/Directorate (Main reason only) .......... 36 Exhibit 15 Personal plans and recommendations to others regarding JRC (adherence index), comparison between 2003, 2005 and 2008 surveys ..................... 64 Exhibit 16 Number of responses to open questions....................................................67 Exhibit 17 Example: DSPR - Q 11: Planning of the project. Please indicate if you agree or disagree with the following statements (all customers-DPSR) ....................... 89 Exhibit 18 Overall table of adherence indexes regarding satisfaction, 2008 ............ 90 Exhibit 19 Adherence indexes of satisfaction on four aspects of the collaboration, all customers 91 Exhibit 20 Adherence indexes of satisfaction on four aspects of the collaboration, external and internal customers .......................................................................................91 Exhibit 21 Global adherence index 2008, all customers .............................................91 Exhibit 22 Global adherence index 2008, Internal and External customers.............91

JRC Customer Satisfaction Survey 2008 74
Exhibit 23 Overall table of adherence indexes regarding satisfaction, comparison between Institutes/Directorate........................................................................................ 92 Exhibit 24 “Very satisfied” and “satisfied” customers: comparison between the 2005 and 2008 surveys ............................................................................................................. 93
A.2. Table of Figures
Figure 1 Q3. What is your position within your organisation/DG? ...........................15 Figure 2 Q4. Breakdown of completed questionnaires per Institute/Directorate ....16 Figure 3 Q1. Please indicate when did you start collaborating with the JRC (Internal and External) .....................................................................................................19 Figure 4 Q9. Which statement would best describe your or your organisation’s customer-relation with the JRC?..................................................................................... 20 Figure 5 Q9. Internal and External paying customers. Comparison with 2003 and 2005 surveys ..................................................................................................................... 20 Figure 6 Q9. Which statement would best describe your or your organisation’ customer-relation with the JRC? Comparison between Institutes/Directorate............21 Figure 7 Q9 bis. In case you are a non-paying customer, are you the direct beneficiary of the service or product provided? (non-paying Internal and External).. 22 Figure 8 Q9 bis. In case you are a non-paying customer, are you the direct beneficiary of the service or product provided? Comparison with 2003 and 2005 surveys (non-paying External and Internal)................................................................... 23 Figure 9 Q9 bis. In case you are a non-paying customer, are you the direct beneficiary of the service or product provided? (non-paying Internal and External) Comparison between Institutes/Directorate .................................................................. 24 Figure 10 Q5. Please indicate here which type of support of the JRC you comment upon this questionnaire ................................................................................................... 25 Figure 11 Q8. In which phase of the policy cycle did you receive support from the JRC? (Internal and External) .......................................................................................... 30 Figure 12 Q8. In which phase of the policy cycle did you receive support from the JRC? Comparison between Institutes/Directorate .........................................................31 Figure 13 Q10. Which of the following sentences best correspond to your relation with the JRC?.................................................................................................................... 32 Figure 14 Q10. Which of the following sentences best correspond to your relation with the JRC? Comparison between 2003, 2005 and 2008 surveys ............................ 33 Figure 15 Q10 bis. What are the main reasons for selecting the JRC as a partner for your project? ..................................................................................................................... 34 Figure 16 Q10bis. What are the main reasons for selecting the JRC as a partner for your project? Comparison between 2003, 2005 and 2008 surveys (aggregate results) 35 Figure 17 Q11. Planning of the project (all customers) ...............................................37 Figure 18 Q11. Planning of the project (Internal and External) ................................ 38 Figure 19 Q11. Planning of the project. Comparison between 2005 and 2008 surveys (very satisfied and satisfied customers) .......................................................................... 38 Figure 20 Q11. Planning of the project. Adherence index, comparison between Institutes/Directorate ...................................................................................................... 39
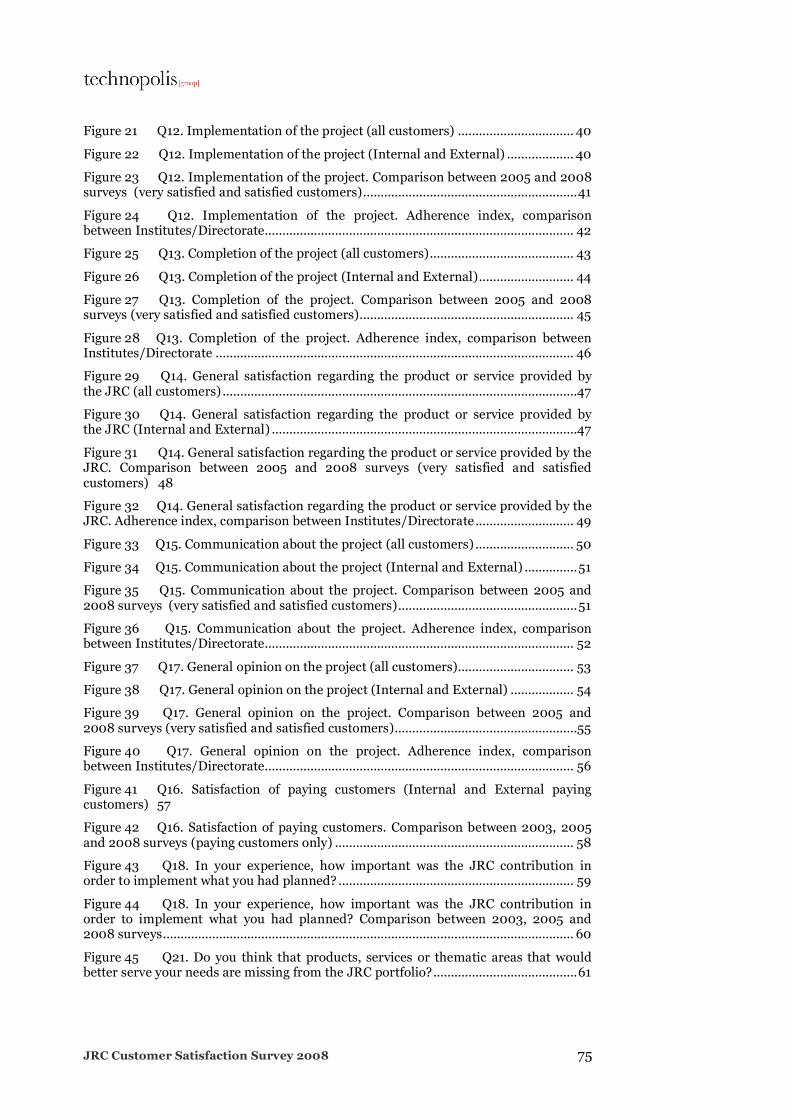
JRC Customer Satisfaction Survey 2008 75
Figure 21 Q12. Implementation of the project (all customers) ................................. 40 Figure 22 Q12. Implementation of the project (Internal and External) ................... 40 Figure 23 Q12. Implementation of the project. Comparison between 2005 and 2008 surveys (very satisfied and satisfied customers).............................................................41 Figure 24 Q12. Implementation of the project. Adherence index, comparison between Institutes/Directorate........................................................................................ 42 Figure 25 Q13. Completion of the project (all customers)......................................... 43 Figure 26 Q13. Completion of the project (Internal and External)........................... 44 Figure 27 Q13. Completion of the project. Comparison between 2005 and 2008 surveys (very satisfied and satisfied customers)............................................................. 45 Figure 28 Q13. Completion of the project. Adherence index, comparison between Institutes/Directorate ...................................................................................................... 46 Figure 29 Q14. General satisfaction regarding the product or service provided by the JRC (all customers) .....................................................................................................47 Figure 30 Q14. General satisfaction regarding the product or service provided by the JRC (Internal and External) .......................................................................................47 Figure 31 Q14. General satisfaction regarding the product or service provided by the JRC. Comparison between 2005 and 2008 surveys (very satisfied and satisfied customers) 48 Figure 32 Q14. General satisfaction regarding the product or service provided by the JRC. Adherence index, comparison between Institutes/Directorate............................ 49 Figure 33 Q15. Communication about the project (all customers) ............................ 50 Figure 34 Q15. Communication about the project (Internal and External) ...............51 Figure 35 Q15. Communication about the project. Comparison between 2005 and 2008 surveys (very satisfied and satisfied customers)...................................................51 Figure 36 Q15. Communication about the project. Adherence index, comparison between Institutes/Directorate........................................................................................ 52 Figure 37 Q17. General opinion on the project (all customers)................................. 53 Figure 38 Q17. General opinion on the project (Internal and External) .................. 54 Figure 39 Q17. General opinion on the project. Comparison between 2005 and 2008 surveys (very satisfied and satisfied customers)....................................................55 Figure 40 Q17. General opinion on the project. Adherence index, comparison between Institutes/Directorate........................................................................................ 56 Figure 41 Q16. Satisfaction of paying customers (Internal and External paying customers) 57 Figure 42 Q16. Satisfaction of paying customers. Comparison between 2003, 2005 and 2008 surveys (paying customers only) .................................................................... 58 Figure 43 Q18. In your experience, how important was the JRC contribution in order to implement what you had planned? ................................................................... 59 Figure 44 Q18. In your experience, how important was the JRC contribution in order to implement what you had planned? Comparison between 2003, 2005 and 2008 surveys..................................................................................................................... 60 Figure 45 Q21. Do you think that products, services or thematic areas that would better serve your needs are missing from the JRC portfolio?.........................................61

JRC Customer Satisfaction Survey 2008 76
Figure 46 Q21. Do you think that products, services or thematic areas that would better serve your needs are missing from the JRC portfolio? Comparison between Institutes/Directorate ...................................................................................................... 62 Figure 47 Q22. Do you plan to use or consider using JRC services in the future?... 63 Figure 48 Q23. Would you recommend the JRC as a scientific and technical service provider to others? ........................................................................................................... 64 Figure 49 Q22. Do you plan to use or consider using JRC services in the future? Comparison between Institutes/Directorate .................................................................. 65 Figure 50 Q23. Would you recommend the JRC as a scientific and technical service provider to others? Comparison between Institutes/Directorate ................................. 65 Figure 51 Q24. Please assess the quality of the JRC compared to alternatives you might know: the rank “-2” meaning the JRC is far worse quality; the rank “2” meaning the JRC is much better quality......................................................................................... 66 Figure 52 Q26. Based on your experience, what is your perception of the JRC as an organisation? .................................................................................................................... 69
JRC Customer Satisfaction Survey 2008 77
Appendix B
Questionnaires for the 2008 JRC Customer Satisfaction Survey
B.1. Introduction
Madam, Sir,
The European Commission's Joint Research Centre (JRC) kindly asks you to complete its Customer Satisfaction Survey questionnaire. We estimate that the survey will take about 15 minutes to complete.
By answering this questionnaire you will allow the JRC to gain a better understanding of its customers' perception as regards its performance since the last survey in 2005. It will also enable the JRC to explore further into their needs and expectations. The JRC will use your feedback to deliver better services and products to its customers.
For that purpose, you will have the opportunity to express your opinion regarding the JRC Institute(s) you cooperated with since 2005:
• The Institute for Reference Materials and Measurements (IRMM)
• The Institute for Transuranium Elements (ITU)
• The Institute for Energy (IE)
• The Institute for the Protection and Security of the Citizen (IPSC)
• The Institute for Environment and Sustainability (IES)
• The Institute for Health and Consumer Protection (IHCP)
• The Institute for Prospective Technological Studies (IPTS)
• The Directorate for Programmes and Stakeholders Relations (DPSR)
The JRC has chosen the European Policy Evaluation Consortium (EPEC7) for the implementation of the survey. The latter will be done according to the ICC/ ESOMAR International Code of Marketing and Social Research Practice. EPEC guarantees the confidentiality of your responses, which will be processed anonymously, in respect of the JRC Customer Survey privacy statement.
Your opinion is essential to us. We appreciate your effort and thank you very much in advance for your collaboration.
EPEC on behalf of the Joint Research Centre
For any questions, please contact Soheir Dani, [email protected]
7 The EPEC team dedicated to this survey includes consultants from Technopolis France and the Tavistock Institute.
JRC Customer Satisfaction Survey 2008 78
B.2. Your profile [of Internal customers]
This first section aims at specifying the profile of the respondents and the nature of their collaboration with the JRC.
1. Please indicate when did you start collaborating with the JRC?
• You personally
• Your DG/Service
Since 2005
Between 2000-2004
Before 2000
Don’t know
All upcoming questions concern your collaboration with the JRC since 2005.
2. Please enter here in which DG or Commission service you work:
3. What is your function within your DG? [only one answer]
Below head of unit
Head of unit (or comparable)
Above head of unit
4. You will be able to respond to one questionnaire per JRC Institute or Directorate you collaborated with since 2005.
Please indicate hear a first JRC Institute/Directorate from which you have received a product or service, and for which you which to complete a questionnaire: [Questions 5 to 20 will relate to this first JRC Institute/Directorate]
The Institute for Reference Materials and Measurements (IRMM)
The Institute for Transuranium Elements (ITU)
The Institute for Energy (IE)
The Institute for the Protection and Security of the Citizen (IPSC)
The Institute for Environment and Sustainability (IES)
The Institute for Health and Consumer Protection (IHCP)
The Institute for Prospective Technological Studies (IPTS)
The Directorate for Programmes and Stakeholders Relations (DPSR)
5. Please indicate here which type of support of the JRC (i.e. which services or products) you comment upon in this questionnaire: [several answers possible]
• Reference materials

JRC Customer Satisfaction Survey 2008 79
• Policy support documents (e.g. Study reports, technical reports, guidance documents, maps, bulletins, forecasts, assessments, analyses, scenarios, BREFs or important briefings produced for customer DGs).
• Validated and harmonized methods and measurements
• Technical systems (Pieces of engineering hardware, including technical prototypes, developed and manufactured by the JRC)
• Other policy support products and services (such as new software, numerical models, algorithms, software based prototypes, databases, websites or other tools).
• Training courses (Training courses developed and delivered by the JRC, either in-house or outside).
• Scientific facilitation of consultation processes
• Chairing expert groups
• Crisis management
• Legal advice related to intellectual property management
• Other (please specify other products/services received)
6. Please indicate the nature of your contact with the JRC. [only one answer]
You have direct relations with the JRC
You do not have direct relations with the JRC, but you are a recipient/customer of JRC support
7. Please indicate here for which specific policies and/or thematic areas (e.g. Water Framework Directive, Climate Change, Nuclear Safety) you have received support from the JRC:
Policy 1:
Policy 2:
• Environment
• Energy & transport
• Agriculture and rural développement
• Competition
• Education and culture
• Europe aid cooperation office
• External Relations
• Enterprise & Industry
• Information society & Media
• Health & Consumer Protection
• Humanitarian aid
• European Anti-Fraud Office
• Economic and Financial Affairs
• Research and Innovation
• Internal market & services

JRC Customer Satisfaction Survey 2008 80
• Justice Freedom & Security
• Regional policy
• Communication
• Fisheries & Maritime Affairs
• Eurostat
• Informatics
• Taxation and Customs Union
• Development
• Employment, Social Affairs & Equal Opportunities
• Trade
• Bureau of European Policy Advisers
• Secretariat General
• Enlargement
Other - specify:
B.3. Your profile [of External customers]
This first section aims at specifying the profile of the respondents and the nature of their collaboration with the JRC.
1. Please indicate when did you start collaborating with the JRC
• You personally
• Your organisation
Since 2005
Between 2000-2004
Before 2000
Don’t know
All upcoming questions concern your collaboration with the JRC since 2005.
2. Please indicate here the activity of the organisation in which you work: [only one answer]
Authority/administration in EU Member State
Authority/administration in EU Candidate Country
Authority/administration in EU Potential Candidate Country
Authority/administration in an Associated Country
Authority/administration in another country
Stakeholders (e.g. Industry, Non-governmental organisation...)
Official Control Laboratory
Customs Laboratory
Standard Settings body
JRC Customer Satisfaction Survey 2008 81
European Agency
Research organisation (public, private, university...)
National contact point in New Member State
National contact point in present /potential Candidate Country
International organisation
Other (please specify)
3. What is your position within your organisation? [only one answer]
Below head of department
Head of department (or comparable)
Above head of department
4. You will be able to respond to one questionnaire per JRC Institute or Directorate you collaborated with since 2005.
Please indicate hear a first JRC Institute/Directorate from which you have received a product or service, and for which you which to complete a questionnaire [Questions 5 to 20 will relate to this first JRC Institute/Directorate]:
The Institute for Reference Materials and Measurements (IRMM)
The Institute for Transuranium Elements (ITU)
The Institute for Energy (IE)
The Institute for the Protection and Security of the Citizen (IPSC)
The Institute for Environment and Sustainability (IES)
The Institute for Health and Consumer Protection (IHCP)
The Institute for Prospective Technological Studies (IPTS)
The Directorate for Programmes and Stakeholders Relations (DPSR)
5. Please indicate here which type of service(s) or product(s) of the JRC you comment upon in this questionnaire: [several answers possible]
• Reference materials
• Policy support documents (e.g. Study reports, technical reports, guidance documents, maps, bulletins, forecasts, assessments, analyses, scenarios, BREFs or important briefings produced for customer DGs).
• Validated and harmonized methods and measurements
• Technical systems (Pieces of engineering hardware, including technical prototypes, developed and manufactured by the JRC)
• Other policy support products and services (such as new software, numerical models, algorithms, software based prototypes, databases, websites or other tools).
• Training courses (Training courses developed and delivered by the JRC, either in-house or outside).
• Scientific facilitation of consultation processes

JRC Customer Satisfaction Survey 2008 82
• Chairing expert groups
• Crisis management
• Information day at national level
• Other (please specify other products/services received)
6. Please indicate here for which specific Commission policy areas you have received support from the JRC:
Policy 1:
Policy 2:
• Environment
• Energy & transport
• Agriculture and rural développement
• Competition
• Education and culture
• Europe aid cooperation office
• External Relations
• Enterprise & Industry
• Information society & Media
• Health & Consumer Protection
• Humanitarian aid
• European Anti-Fraud Office
• Economic and Financial Affairs
• Research and Innovation
• Internal market & services
• Justice Freedom & Security
• Regional policy
• Communication
• Fisheries & Maritime Affairs
• Eurostat
• Informatics
• Taxation and Customs Union
• Development
• Employment, Social Affairs & Equal Opportunities
• Trade
• Bureau of European Policy Advisers
• Secretariat General
• Enlargement
Other - specify:
JRC Customer Satisfaction Survey 2008 83
B.4. Relation with the JRC [both External and Internal customers]
The following questions aim to identify the nature of your relation with the JRC, as well as the reasons for choosing JRC products and services.
8. In which phase of the policy cycle did you receive support from the JRC? [several answers possible]
Policy conception
Impact Assessment
Policy implementation
Policy monitoring
Evaluation phase
Other: please specify
Not applicable
9. Which statement would best describe your or your organisation's customer-relation with the JRC? [only one answer]
You are a paying customer of a service or a product
You are not a paying customer of a service or a product
9bis. Are you the direct beneficiary of the service or product provided? [for those who do not have to pay – only one answer]
You are the main direct beneficiary of the services provided by the JRC
You are a beneficiary among others of the services provided by the JRC
10. Which of the following sentences best correspond to your relation with the JRC? [only one answer]
You have directly chosen to work with the JRC
You work with the JRC, because it is the organisation charged with the above-mentioned product, activity or service
10 bis. What are the main reasons for selecting the JRC as a partner for your project? [for those who have directly chosen to work with the JRC - only one answer per item]
• Main reason
• Second reason
• Third reason
Reputation
Facilities
Competence in the field
Value for money
Technical merit of the offer

JRC Customer Satisfaction Survey 2008 84
Competitive time schedule
JRC past experience
JRC independence from commercial and national interests
ISO 9000/14000 certification
Other, please specify
B.5. Customer satisfaction by project phase [both External and Internal customers]
The following section intends to assess your satisfaction with the JRC products and services received after 2005, by project phase.
11. Planning of the project. Please indicate if you agree or disagree with the following statements. [only one answer per item]
• Strongly agree
• Agree
• Disagree
• Strongly disagree
• Don't know
JRC understood your needs well
JRC documented your requirements well
JRC's contribution to the specification of the project or service was satisfactory
12. Implementation of the project. Please indicate if you agree or disagree with the following statements. [only one answer per item]
• Strongly agree
• Agree
• Disagree
• Strongly disagree
• Don't know
JRC provided adequate technical resources
JRC provided adequate human resources
JRC's administrative and financial handling of the project was satisfactory
JRC was able to give sufficient and appropriate response to new or changing needs
JRC investigated and resolved difficulties
13. Completion of the project. Please indicate if you agree or disagree with the following statements. [only one answer per item]
• Strongly agree
• Agree
• Disagree
JRC Customer Satisfaction Survey 2008 85
• Strongly disagree
• Don't know
Results were appropriately documented
The quality of the documentation issued (reports, publication) was satisfactory
The project/service was completed within the agreed time
B.6. General satisfaction [both External and Internal customers]
The following section intends to assess your general satisfaction with the JRC products and services received after 2005.
14. How satisfied are you with each of the following aspects of the product or service provided by the JRC? [only one answer per item]
• Very satisfied
• Satisfied
• Unsatisfied
• Very unsatisfied
• Don't know
The overall scientific quality of the support provided
The overall quality of the management of the project
The relevance of the product or service to your purpose
15. Communication about the project. Please indicate if you agree or disagree with the following statements. [only one answer per item]
• Strongly agree
• Agree
• Disagree
• Strongly disagree
• Don't know
Communication between JRC and you was satisfactory
JRC provided appropriate feedback on work progress
16. If you are a paying customer of a service or a product, do you agree or disagree with each of the following statements? [only one answer per item]
• Strongly agree
• Agree
• Disagree
• Strongly disagree
• Don’t know
The project/service was completed within the agreed cost
JRC Customer Satisfaction Survey 2008 86
Value for money is satisfactory
17. General opinion on the project. Please indicate if you agree or disagree with the following statements. [only one answer per item]
• Strongly agree
• Agree
• Disagree
• Strongly disagree
• Don't know / not applicable
The added value brought by the project or service is satisfactory
The overall performance of the project was satisfactory
JRC put you in contact with the appropriate partners
18. In your experience, how important was the JRC contribution in order to implement what you had planned? [only one answer]
Essential
Not essential but helpful
Not essential
Don’t know
19. If you have been very satisfied with your cooperation with the JRC, please indicate why.
20. If you have been very unsatisfied with your cooperation with the JRC, please indicate why.
B.7. Your Profile
4 bis. Please indicate hear for which JRC Institute/Directorate you wish to complete another questionnaire
[If you indicate another JRC Institute/Directorate you will answer questions 5 to 20 accordingly, and you will have again the possibility to complete other questionnaires for other JRC Institutes/Directorate. If you do not wish to complete another questionnaire you will go to section A8 Conclusion]:
The Institute for Reference Materials and Measurements (IRMM)
The Institute for Transuranium Elements (ITU)
The Institute for Energy (IE)
The Institute for the Protection and Security of the Citizen (IPSC)
The Institute for Environment and Sustainability (IES)
The Institute for Health and Consumer Protection (IHCP)
The Institute for Prospective Technological Studies (IPTS)

JRC Customer Satisfaction Survey 2008 87
The Directorate for Programmes and Stakeholders Relations (DPSR)
I do not wish to complete another questionnaire
B.8. Conclusion [both External and Internal customers]
This last section aims to draw conclusions on the performance of JRC services and products from 2005 to date and to suggest recommendations for the future.
21. Do you think that products, services or thematic areas that would better serve your needs are missing from the JRC portfolio?
Yes
No
Don’t know
21bis. If yes, which ones?
22. Do you plan to use or consider using JRC services again in the future? [only one answer]
Yes, certainly
Yes, probably
No, probably not
No, certainly not
Don’t know
22bis. If you answered “No, certainly not" or "No, probably not”, why?
23. Would you recommend the JRC as a scientific and technical service provider to others?
Yes, certainly
Yes, probably
No, probably not
No, certainly not
Don’t know
23bis. If you answered “No, certainly not”, or "No, probably not”, why?
24. Please assess the quality of the JRC compared to alternatives you might know:
(the rank "-2" meaning the JRC is of far worse quality ; the rank "2" meaning the JRC is of much better quality) [only one answer per item]
• 2

JRC Customer Satisfaction Survey 2008 88
• 1
• 0
• -1
• -2
• There is no alternative
Local organisations
Regional organisations
National organisations
International organisations
25 Can you please indicate any scientific support organisation alternative to the JRC you are currently, or have been recently, working with?
26. Based on your experience, what is your perception of the JRC as an organisation?
It is fairly well equipped to deliver on its mission
It requires major improvements to its operations
Don’t know
26bis. In your opinion, what are the main areas for improvement for the JRC? [for those who responded “It requires major improvements to its operations”]
27. Would you like to add any further comment on your relationship with the JRC?
B.9. Thank you
Thank your very much for your participation to this survey.
For any question or comment, please feel free to contact Soheir Dani, [email protected]
Technopolis France S.A.R.L.
55 rue des Petites Ecuries
75010 Paris
France
Tel: +33 1 49 49 09 23
Fax:+33 1 49 49 09 29
http://www.technopolis-group.com/

JRC Customer Satisfaction Survey 2008 89
Appendix C
Adherence index
C.1. Index calculation
The calculation of adherence index is illustrated below.
Exhibit 17 Example: DSPR - Q 11: Planning of the project. Please indicate if you agree or disagree with the following statements (all customers-DPSR)
Strongly
agree Agree Disagree Strongly disagree
Adherence index
JRC understood your needs well 4 6 0 0 79,6 JRC documented your requirements well
2 8 0 0 72,8
JRC's contribution to the specification of the project or service was satisfactory
4 6 0 0 79,6
JRC understood your needs well :
Index calculation=((100*4)+(66*6)+(33*0)+(0*0))/(4+6+0+0)= 79,6

JRC Customer Satisfaction Survey 2008 90
C.2. Overall results
Exhibit 18 Overall table of adherence indexes regarding satisfaction, 2008
Rank External Index Rank Internal Index
1 The overall scientific quality of
the support provided 77,7
1
Communication between JRC and you was satisfactory
78,5
2 Communication between JRC
and you was satisfactory 77,7
2
The overall scientific quality of the support provided
78,4
3 JRC understood your needs
well 76,6
3 JRC understood your needs well 77,8
4 The project/service was
completed within the agreed cost
76,5
4 The relevance of the product or
service to your purpose 77,0
5 JRC provided adequate
technical resources 76,4
5
The added value brought by the project or service is satisfactory
74,9
6 The relevance of the product or
service to your purpose 76,1
6
JRC provided adequate technical resources
74,9
7 The quality of the
documentation issued (reports, publication) was satisfactory
75,6
7 The quality of the documentation issued (reports, publication) was
satisfactory 73,8
8 The added value brought by the project or service is satisfactory
75,1
8 The project/service was
completed within the agreed cost 73,3
9 Value for money is satisfactory 75,0
9 JRC's contribution to the
specification of the project or service was satisfactory
72,2
10 JRC provided appropriate feedback on work progress
74,9
10 The overall performance of the
project was satisfactory 71,8
11 JRC's contribution to the
specification of the project or service was satisfactory
74,2
11 JRC provided appropriate feedback on work progress
71,1
12 The overall performance of the
project was satisfactory 73,9
12
JRC documented your requirements well
70,8
13 JRC investigated and resolved
difficulties 73,8
13
Results were appropriately documented
70,3
14 Results were appropriately
documented 73,8
14
JRC investigated and resolved difficulties
69,6
15 The overall quality of the
management of the project 73,8
15
JRC was able to give sufficient and appropriate response to new
or changing needs 69,5
16 JRC provided adequate human
resources 72,7
16
The overall quality of the management of the project
68,4
17 JRC documented your
requirements well 72,5
17
JRC provided adequate human resources
68,1
18 JRC put you in contact with the
appropriate partners 72,3
18
JRC put you in contact with the appropriate partners
66,6
19 JRC was able to give sufficient and appropriate response to
new or changing needs 70,9
19
JRC's administrative and financial handling of the project was
satisfactory 66,2
20 JRC's administrative and
financial handling of the project was satisfactory
69,4
20 Value for money is satisfactory 65,7
21 The project/service was
completed within the agreed time
66,2
21 The project/service was
completed within the agreed time 65,3

JRC Customer Satisfaction Survey 2008 91
C.3. Results for the main aspects of collaboration
By focusing the analysis of adherence indexes on the four main aspects of the collaboration allows a more in-depth investigation of JRC Customers satisfaction.
Exhibit 19 Adherence indexes of satisfaction on four aspects of the collaboration, all customers
Adherence indexes The overall scientific quality of the product or service 78,0 The overall quality of the management of the project 71,6 The relevance of the product or service to your purpose 76,5 The overall performance of the project was satisfactory 73,0
Exhibit 20 Adherence indexes of satisfaction on four aspects of the collaboration, external and internal customers
External Internal The overall scientific quality of the support provided 77,7 78,4 The overall quality of the management of the project 73,8 68,4 The relevance of the product or service to your purpose 76,1 77,0 The overall performance of the project was satisfactory 73,9 71,8
C.4. Global adherence index
A global adherence index can be calculated using the same perimeter of responses : all questions on customers’ satisfaction (satisfaction of customers during project phases and overall assessment) but the question on overall satisfaction (i.e. the overall quality of the product or service, the relevance of the product or service to your purpose, the overall quality of the management of the project).
Exhibit 21 Global adherence index 2008, all customers
Global adherence index 2008
All customers 72,61
Exhibit 22 Global adherence index 2008, Internal and External customers
Global adherence index 2008
External 73,5
Internal 71,3
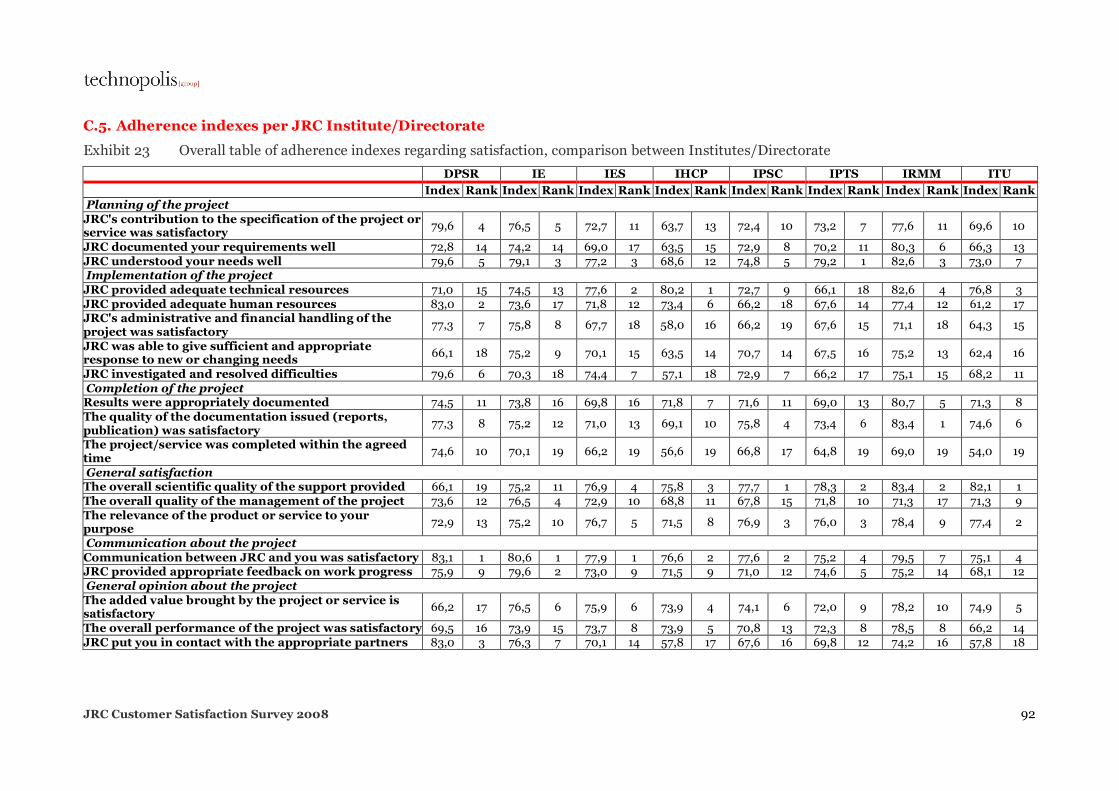
JRC Customer Satisfaction Survey 2008 92
C.5. Adherence indexes per JRC Institute/Directorate
Exhibit 23 Overall table of adherence indexes regarding satisfaction, comparison between Institutes/Directorate
DPSR IE IES IHCP IPSC IPTS IRMM ITU Index Rank Index Rank Index Rank Index Rank Index Rank Index Rank Index Rank Index Rank Planning of the project JRC's contribution to the specification of the project or service was satisfactory
79,6 4 76,5 5 72,7 11 63,7 13 72,4 10 73,2 7 77,6 11 69,6 10
JRC documented your requirements well 72,8 14 74,2 14 69,0 17 63,5 15 72,9 8 70,2 11 80,3 6 66,3 13 JRC understood your needs well 79,6 5 79,1 3 77,2 3 68,6 12 74,8 5 79,2 1 82,6 3 73,0 7 Implementation of the project JRC provided adequate technical resources 71,0 15 74,5 13 77,6 2 80,2 1 72,7 9 66,1 18 82,6 4 76,8 3 JRC provided adequate human resources 83,0 2 73,6 17 71,8 12 73,4 6 66,2 18 67,6 14 77,4 12 61,2 17 JRC's administrative and financial handling of the project was satisfactory
77,3 7 75,8 8 67,7 18 58,0 16 66,2 19 67,6 15 71,1 18 64,3 15
JRC was able to give sufficient and appropriate response to new or changing needs
66,1 18 75,2 9 70,1 15 63,5 14 70,7 14 67,5 16 75,2 13 62,4 16
JRC investigated and resolved difficulties 79,6 6 70,3 18 74,4 7 57,1 18 72,9 7 66,2 17 75,1 15 68,2 11 Completion of the project Results were appropriately documented 74,5 11 73,8 16 69,8 16 71,8 7 71,6 11 69,0 13 80,7 5 71,3 8 The quality of the documentation issued (reports, publication) was satisfactory
77,3 8 75,2 12 71,0 13 69,1 10 75,8 4 73,4 6 83,4 1 74,6 6
The project/service was completed within the agreed time
74,6 10 70,1 19 66,2 19 56,6 19 66,8 17 64,8 19 69,0 19 54,0 19
General satisfaction The overall scientific quality of the support provided 66,1 19 75,2 11 76,9 4 75,8 3 77,7 1 78,3 2 83,4 2 82,1 1 The overall quality of the management of the project 73,6 12 76,5 4 72,9 10 68,8 11 67,8 15 71,8 10 71,3 17 71,3 9 The relevance of the product or service to your purpose
72,9 13 75,2 10 76,7 5 71,5 8 76,9 3 76,0 3 78,4 9 77,4 2
Communication about the project Communication between JRC and you was satisfactory 83,1 1 80,6 1 77,9 1 76,6 2 77,6 2 75,2 4 79,5 7 75,1 4 JRC provided appropriate feedback on work progress 75,9 9 79,6 2 73,0 9 71,5 9 71,0 12 74,6 5 75,2 14 68,1 12 General opinion about the project The added value brought by the project or service is satisfactory
66,2 17 76,5 6 75,9 6 73,9 4 74,1 6 72,0 9 78,2 10 74,9 5
The overall performance of the project was satisfactory 69,5 16 73,9 15 73,7 8 73,9 5 70,8 13 72,3 8 78,5 8 66,2 14 JRC put you in contact with the appropriate partners 83,0 3 76,3 7 70,1 14 57,8 17 67,6 16 69,8 12 74,2 16 57,8 18

JRC Customer Satisfaction Survey 2008 93
Appendix D
Satisfied customers: comparison 2005-2008
Exhibit 24 “Very satisfied” and “satisfied” customers: comparison between the 2005 and 2008 surveys
Total satisfied
- External Total satisfied
- Internal
2005 2008 2005 2008 JRC understood your needs well 89,9% 94,2% 95,4% 90,3% JRC documented your requirements well 83,3% 83,1% 85,9% 84,8% Planning JRC's contribution to the specification of the project or service was satisfactory 88,0% 91,4% 88,4% 88,0% JRC provided adequate technical resources 85,6% 90,2% 86,7% 83,6% JRC provided adequate human resources 82,5% 83,9% 74,4% 78,0% JRC's administrative and financial handling of the project was satisfactory 71,6% 72,4% 66,7% 63,6% JRC was able to give sufficient and appropriate response to new or changing needs 79,0% 83,0% 77,1% 78,6%
Implementation
JRC investigated and resolved difficulties 79,8% 77,6% 71,1% 76,7% Results were appropriately documented 84,0% 88,8% 81,0% 80,3% The quality of the documentation issued (reports, publication) was satisfactory 81,0% 89,0% 85,5% 82,8% Completion The project/service was completed within the agreed time 68,3% 70,2% 71,4% 70,4% The overall scientific quality of the product or service 97,3% 94,4% 94,4% 93,6% The overall quality of the management of the project 83,3% 83,2% 85,5% 80,8%
General satisfaction
The relevance of the product or service to your purpose 96,4% 89,7% 88,4% 92,9% Communication between JRC and you was satisfactory 91,8% 92,0% 87,5% 94,5%
Communication JRC provided appropriate feedback on work progress 84,8% 85,8% 81,4% 80,6% The added value brought by the project or service is satisfactory 87,3% 88,1% 86,9% 90,2% The overall performance of the project was satisfactory 85,3% 88,7% 85,7% 84,7%
General opinion on the project
JRC put you in contact with the appropriate partners 67,7% 68,6% 56,3% 60,7%


JRC Customer Satisfaction Survey 2008 95
Appendix E
Responses to the open question 5: “Other” type of support provided by the JRC
E.1. Internal respondents
• Guidance in analysis
• Evaluation of offers in tenders
• Participation in inter-service groups
• Map
• Projects review
• GIS
• Scientific support in regulatory committees
• Technical advise in project monitoring
• Close collaboration with the ECB
• Seminar and w research work on biotechnology
• Operation of Laboratories in UK & France
• Programme on satellite images
E.2. External respondents
• Running international project (HBRP)
• R&D projects
• Irradiation testing
• Scientific collaboration
• ESIS, ECB website, IUCLID 5
• Joint Workshop
• Newsletter
• Technical Research projects based on collaboration
• Nuclear data for innovative energy systems
• Participation of JRC-IES Staff in workshops as experts and resource persons
• Radionuclide samples for the SIR
• Materials and Measurements related to basic research
• Annual report

JRC Customer Satisfaction Survey 2008 96
• Co-operative research
• Statistical results of the AMT-TOOL via http://theseus.JRC.IT
• Contract research/scientific collaboration
• Beam time
• Workshops
• Collaboration on nuclear data measurements and evgaluation
• Collaboration in working group
• EURDEP/EURDEP Data Exchange/ECURIE/
• Software solutions
• Cyber security assessment and design service
• Computer code
• Technical and technical secretarial support
• Satellite imagery
• Spent fuel dissolution studies
• Expert working group; drawing up accounts
• Data of forest fires/ EFFIS
• Participation in intercomparison
• Swipe sample analysis
• Certification
• Proficiency testing
• Experience and knowledge exchange
• Workshop
• Tests in hot cells
• High Delegation visit from Turkey

JRC Customer Satisfaction Survey 2008 97
Appendix F
Responses to the open question 8: “Other” phases of the policy cycle in which you received support from the JRC
F.1. Internal respondents
• Contribution to the building up of tools useful for policy advise
• Statistical and other data (maps)
• Input through model results into international climate change negotiations
• During drafting legislation
• Implementation of Commission regulations
• Regulation and Euratom Treaty monitoring
• Economic/market monitoring
F.2. External respondents
• JRC was partner of R&D projects
• REACH
• Equipment development
• ENSEMBLE Modelling
• European Data exchange of radiological data
• Emergency preparedness
• Disaster prevention
• Risk finding

JRC Customer Satisfaction Survey 2008 99
Appendix G
Responses to the open question 21bis: “Which products, services or thematic areas, which would better serve your needs are missing from the JRC portfolio?”
G.1. Internal respondents
• Global economic relations more broadly defined than just agricultural trade
• Forest fires: I think data should be collected on how better forecasts and co-operation between Mediterranean countries have reduced the impact/extent of fires. Forest defoliation and other monitoring: an in-depth discussion is needed about improving basic data in order to base real statistics on it.
• Ensuring an effective 'science-policy' interface, i.e. helping to make sure that EU funded research is effectively transferred to customers/users
• Math, photonics, neuroscience, biogenetics... what Americans call nbic (nano bio cogno)
• JRC-I.E would be in the best position to set up a real Nuclear Energy Database, which is missing in the Commission at all
• Detailed modelling capacity to match those of the IEA or to match the capabilities of the PRIMES model (it can not be sustainable that central and vital policy analysis has to rely on modelling capacity outside the commission - this has to be build up in the IPTS
• We need better modelling capacity on greenhouse gas mitigation policies within the EU with a level of detail at the 27 Member States
• Material testing reactor
• I think that training capacity could be reinforced and would be very helpful for EC services, member countries and civil society partners.
• Competence in innovation measurement and policy analysis, which is divided in different JRC institutes
• Would be better if IPTS providing policy analysis etc. would be placed in Brussels
• Research on precursors of explosives
• CBRN
• Urban mobility: data basis, demographic studies, technology assessment, economic studies, environmental studies
• Anti-fraud specific theme
G.2. External respondents
• Higher resolution impact assessments
• More detailed maps on the daily risk of forest fires will be helpful
• Planning and contract management
JRC Customer Satisfaction Survey 2008 100
• A peer reviewed journal where we could publish our findings instead of in reports with limited circulation and considered to be "grey" papers
• Cooperation in fusion nuclear energy
• Floods predictions on small catchments.
• Tailor made and timely consultancy services in the field of forest (carbon) monitoring
• Goal should be: one unified system for international information exchange in case of nuclear or radiological incidents or accidents, i.a. Combine ENAC (IAEA) and CoDecS (EU/ECURIE). Not two systems connected.
• POLARIS test facility
• ENSEMBLE platform for European chemical weather forecasts
• Support for other OS platforms than Microsoft.
• Capacity to manufacture high-purity targets of radioactive materials for measurements at GELINA
• Controller unit that has programming capacities with the compatibility with Matlab and Simulink.
• energy research targeting Mediterranean and Black sea regions, Earthquake engineering, More focus on space and security matters, upgrading of research infrastructure of Balkan region
JRC Customer Satisfaction Survey 2008 101
Appendix H
Responses to the open question 22bis: Reasons for certainly or probably not planning to use or consider using JRC services again in the future
H.1. Internal respondents
• No specific projects requiring JRC expertise/knowledge foreseen in the near
future.
• I prefer to tender my needs externally
• Because JRC will no longer have the capacity in this area.
• I can have better value for money by externalising the service
H.2. External respondents
• I will take retirement soon.
• It must be better resolution at the local data
• Projects taken in own hands

JRC Customer Satisfaction Survey 2008 102
Appendix I
Responses to the open question 23bis: Reasons why you would certainly or probably not recommend the JRC as a scientific and technical service provider to others
I.1. Internal respondents
• Not in the area of expertise that I know
• Because JRC will no longer have the capacity in this area.
• I can have better value for money by externalising the service
I.2. External respondents
• Our experience hasn't been satisfactory.
• Ispra seems to be unflexible with collaboration and sharing their products with other EU sponsored projects, e.g within Radiation protection


Technopolis France S.A.R.L. 55 rue des Petites Ecuries 75010 Paris France T +33 1 49 49 09 20 F +33 1 49 49 09 29 E [email protected] www.technopolis-group.com
Related Documents


![Self-esteem and Satisfaction With Life_deaf People[2008]](https://static.cupdf.com/doc/110x72/577cd7901a28ab9e789f4c83/self-esteem-and-satisfaction-with-lifedeaf-people2008.jpg)