Unicon Research www.unicon.in Long Term Investment Call Company Report CMP : 92 Rating : Buy Target : 143 Sector : Glass 26-Dec-11 Piramal Glass Ltd. Investment Rationale: Valuation: Focus on high-margin C&P business to drive revenues: Capacity expansion to meet the future demand: Stronger balance sheet to support growth: PGL believes the market share in the C&P premium segment can grow to 7-8% over the next two years from current levels of ~3%. PGL currently has a global leadership position in the colour cosmetic (Nail polish bottles) segment with a 50% market share. We believe that as the contribution of the C&P segment to the revenue increases and with the share of the premium segment within the C&P segment also increasing rapidly, will drive growth and improve margins going forward. For FY12 and FY13, the company has a planned capex of INR 2600 mn, with INR 1000 mn assigned to a Greenfield expansion of 160 TPD for the C&P segment to the at Jambusar. This project is scheduled to be operational by March 2012. The remaining INR 1600 mn will be spent on realignment of 4 existing furnaces which will increase the capacity by ~50-60 TPD and will increase the total capacity by ~210 TPD. PGL had a debt of INR 9200 mn (as per FY11 Consol. balance sheet) and debt/equity of 3:1. In H1FY12 the debt/equity ratio was reduced to 2.5:1 from 3.4:1 in H1FY11. The debt service cover improved to 3.2 in H1FY12 as compared to 3.4 in H1FY12. PGL has been able to restructure its debt by going into to relatively lower interest rate of 7.5% foreign currency loan from peak rate of 13% to strength its cash flow. PGL follows an active hedging policy to its naked exposure which is currently to the tune of USD 12-14 mn. Significant cost advantages Labour Arbitrage: In countries like US, which accounts for 37% of the global C&P premium segment, 80% of the C&P requirement is imported. The total cost of production in India, where manpower is among the cheapest in the world is ~60% of the global costs and is less than half of that in France and almost half of that in the US. This gives PGL to have a significant cost advantage over its global peers. At the CMP of ~INR 92, the stock trades at ~8.0x and 5.2x of its FY12E and FY13E earning respectively. The company has been steadily shifting its product mix from low margin commodity business to high yield specialized business of C&P. We expect the C&Pcontribution to company's revenue to increase from 49% in FY11 to 56% in FY13E which is expected to boost EBITDA margins from 23% in FY11 to 25% in FY13E. We have valued the company at ~8x of it FY13E earnings which is at premium compared to other domestic peers, due to PGL's better margins profile and return ratios. We maintain our BUY rating on the stock with a target price of INR 143. Source: Bloomberg, Unicon Research Ashish Tiwari | Rohan Shetty | [email protected] [email protected] Piramal Glass Ltd (PGL) has a multi product industrial profile and is a global leader in delivering world-class packaging solutions. It is a manufacturer of glass containers for the Cosmetics & Perfumery (C&P), Pharmaceutical and Specialty Food & Beverages (SF&B) industries. PGL has its manufacturing facilities in India, US and Sri Lanka with 11 furnaces having a total installed capacity of 1145 TPD (tonnes per day). (INR mn) 40 60 80 100 120 140 160 Dec Jan Feb Mar Apr May Jun Jul Aug Sep Oct Nov Piramal Glass Nifty Key Data Year End Face Value (INR) BSE Code Reuters Code Bloomberg Code Shares Outstanding (Mn) Market Cap (INR Mn) 52 Week High/Low BSE Sensex / CNX Nifty 1-Year Average Volume ('000) Key Financials FY10 FY11 FY12E FY13E Revenue 11,039 12,185 13,080 15,383 Operating Profit 1,822 2,851 2,995 3,769 Operating Profit (%) 16.5 23.4 22.9 24.5 Net Profit 32 1,033 1,038 1,543 Net Profit (%) 0.3 8.5 7.9 10.0 Book Value 30 38 49 67 Key Ratio FY10 FY11 FY12E FY13E P/E (x) 168.0 8.0 8.0 5.2 P/BV (x) 3.1 2.5 1.9 1.4 RONW (%) 1.3 34.2 26.3 28.7 ROCE (%) 8.8 16.3 15.6 20.1 Share Holding Pattern Promoters FII FI/MF/Other Institutes Others 23.7 Relative Price Performance 7,465 156/79 0.6 15970 / 4779 78 3.4 72.3 Mar 10 PIRAMGLAS PRML.BO PIRA IN 804.4

Welcome message from author
This document is posted to help you gain knowledge. Please leave a comment to let me know what you think about it! Share it to your friends and learn new things together.
Transcript

Unicon Research
www.unicon.in
Long Term Investment Call
Company Report
CMP : 92 Rating : Buy Target : 143
Sector : Glass
26-Dec-11
Piramal Glass Ltd.
Investment Rationale:
Valuation:
Focus on high-margin C&P business to drive revenues:
Capacity expansion to meet the future demand:
Stronger balance sheet to support growth:
PGL believes the
market share in the C&P premium segment can grow to 7-8% over the next two
years from current levels of ~3%. PGLcurrently has a global leadership position
in the colour cosmetic (Nail polish bottles) segment with a 50% market share.
We believe that as the contribution of the C&P segment to the revenue increases
and with the share of the premium segment within the C&P segment also
increasing rapidly, will drive growth and improve margins going forward.
For FY12 and FY13, the
company has a planned capex of INR 2600 mn, with INR 1000 mn assigned to a
Greenfield expansion of 160 TPD for the C&P segment to the at Jambusar. This
project is scheduled to be operational by March 2012. The remaining INR 1600
mn will be spent on realignment of 4 existing furnaces which will increase the
capacity by ~50-60 TPD and will increase the total capacity by ~210 TPD.
PGL had a debt of INR 9200 mn (as
per FY11 Consol. balance sheet) and debt/equity of 3:1. In H1FY12 the
debt/equity ratio was reduced to 2.5:1 from 3.4:1 in H1FY11. The debt service
cover improved to 3.2 in H1FY12 as compared to 3.4 in H1FY12. PGL has been
able to restructure its debt by going into to relatively lower interest rate of 7.5%
foreign currency loan from peak rate of 13% to strength its cash flow. PGL
follows an active hedging policy to its naked exposure which is currently to the
tune of USD 12-14 mn.
Significant cost advantages Labour Arbitrage: In countries like US, which
accounts for 37% of the global C&P premium segment, 80% of the C&P
requirement is imported. The total cost of production in India, where
manpower is among the cheapest in the world is ~60% of the global costs and is
less than half of that in France and almost half of that in the US. This gives PGL
to have a significant cost advantage over its global peers.
At the CMP of ~INR 92, the stock trades at ~8.0x and 5.2x of its FY12E and FY13E
earning respectively. The company has been steadily shifting its product mix
from low margin commodity business to high yield specialized business of
C&P. We expect the C&P contribution to company's revenue to increase from
49% in FY11 to 56% in FY13E which is expected to boost EBITDA margins from
23% in FY11 to 25% in FY13E. We have valued the company at ~8x of it FY13E
earnings which is at premium compared to other domestic peers, due to PGL's
better margins profile and return ratios. We maintain our BUY rating on the
stock with a target price of INR 143.
Source: Bloomberg, Unicon Research
Ashish Tiwari |
Rohan Shetty |
Piramal Glass Ltd (PGL) has a multi product industrial profile and is a global leader in delivering world-class packaging solutions.
It is a manufacturer of glass containers for the Cosmetics & Perfumery (C&P), Pharmaceutical and Specialty Food & Beverages
(SF&B) industries. PGL has its manufacturing facilities in India, US and Sri Lanka with 11 furnaces having a total installed capacity
of 1145 TPD (tonnes per day).
3.0126.862
2.8621.417
(INR mn)
40
60
80
100
120
140
160
Dec Jan Feb Mar Apr May Jun Jul Aug Sep Oct Nov
Piramal Glass Nifty
Key Data
Year End
Face Value (INR)
BSE Code
Reuters Code
Bloomberg Code
Shares Outstanding (Mn)
Market Cap (INR Mn)
52 Week High/Low
BSE Sensex / CNX Nifty
1-Year Average Volume ('000)
Key Financials FY10 FY11 FY12E FY13E
Revenue 11,039 12,185 13,080 15,383
Operating Profit 1,822 2,851 2,995 3,769
Operating Profit (%) 16.5 23.4 22.9 24.5
Net Profit 32 1,033 1,038 1,543
Net Profit (%) 0.3 8.5 7.9 10.0
Book Value 30 38 49 67
Key Ratio FY10 FY11 FY12E FY13E
P/E (x) 168.0 8.0 8.0 5.2
P/BV (x) 3.1 2.5 1.9 1.4
RONW (%) 1.3 34.2 26.3 28.7
ROCE (%) 8.8 16.3 15.6 20.1
Share Holding Pattern
Promoters
FII
FI/MF/Other Institutes
Others 23.7
Relative Price Performance
7,465
156/79
0.6
15970 / 4779
78
3.4
72.3
Mar
10
PIRAMGLAS
PRML.BO
PIRA IN
804.4

Piramal Glass Ltd.
2Unicon Research
www.unicon.in
CONTENTS
Particulars Page
Company Background ..............................................................................................................................................3
Milestones ....................................................................................................................................................................4
Industry Overview ......................................................................................................................................................5
Business Overview ......................................................................................................................................................8
Investment Rationale ................................................................................................................................................10
Concerns ....................................................................................................................................................................13
Peer Comparison ......................................................................................................................................................13
Valuation & Outlook ................................................................................................................................................13
Financial Statements ................................................................................................................................................14

Piramal Glass Ltd.
3Unicon Research
www.unicon.in
Piramal Glass Ltd (PGL) has a multi product industrial profile and is a global leader indelivering world-class packaging solutions. It is a manufacturer of glass containers forthe Cosmetics & Perfumery (C&P), Pharmaceutical and Specialty Food & Beverages(SF&B) industries. PGL has its manufacturing facilities in India, US and Sri Lanka with11 furnaces having a total installed capacity of 1145 TPD. International operationscontributed to 74% of FY11 revenues. PGL commands ~3-4% market share in worldpremium C&P segment and ~50% market share in colour cosmetics C&P segment. Itcontrols ~35% market share in domestic pharmaceutical segment and ~91% marketshare in SF&B segment in Sri Lanka. The Company has offices in 10 countries and adistribution network in 44 countries. PGL is also the largest producer of nail-polishbottles globally.
COMPANY BACKGROUND
54% 44% 39% 37%39% 31% 28% 11%
17%18%
18% 18%
24%26% 23% 30%
30%
39%
43%45%
36%44%
49% 35%
0
200
400
600
800
1000
1200
FY05 FY06 FY07 FY08 FY09 FY10 FY11
Pharma SF&B C&P
Segment-wise CAGR
(From FY 05 to FY 11
annualized)
Sales CAGR : 24%
336
493
701779
1008
1104
1218
Segment Contribution & GrowthSegment wise breakup
Source: Company, Unicon Research Source: Company, Unicon Research
C&P
49%
Pharma
28%
SF&B
23%
End
Product
Price
Bottle Price
1000 Pcs
Market
Segment
Market Size
Total market : US $ 2.3 bnROCE
$ 1016 (44%)
$ 616 (27%)
$ 500 (22%)
$ 155
(7%)
Select
Perfumes
Mass Perfumes
& Skin Care
Low Mass Perfumes
Color Cosmetics
$ 60
$ 15
$ 8
$ 1.5
$ 330 - $ 1000 +
$ 160 - $ 330
$ 85 - $ 160
$ 20 - $ 40
25 - 30 %
20 - 25 %
15 - 20 %
15 - 20 %Mas
sS
egm
ent
Mas
sS
egm
ent
Pre
miu
mS
egm
ent
Pre
miu
mS
egm
ent
>
>
>
>
>
>
>>
>>
>>
>>
>
>
Market Overview
Source: Company, Unicon Research

Piramal Glass Ltd.
4Unicon Research
www.unicon.in
Source: Company, Unicon Research
1984
1990
1998
1999
2003
2005
2008
Gujarat Glass
acquired by
Piramal Group
Merges with
group company
Nicolas Piramal
India Ltd.
(NPIL) and
becomes its
division
Demerges as
subsidiary, PE
investors buy
45% in the
demerged entity
Acquires Ceylon
Glass Company
Ltd., Sri Lanka,
And marks entry
into SF&B
segment
NPIL demerges
its 54% holding
to Kojam Finvest
which gets listed
Kojan merges
into Gujarat
Glass Ltd., which
gets relisted
as PGL
PGL turnaournds
after three years
of consecutive
losses
Acquires a part
of The Glass Group
(erstwhile Wheaton
Glass) and marks
entry into
premium C&P
market
2010
MILESTONES

Piramal Glass Ltd.
5Unicon Research
www.unicon.in
INDUSTRY OVERVIEW
Indian Glass Packaging
The Indian Packaging Industry is a USD 14 bn industry and has been growing at ~15%over the last few years. The industry is expected to accelerate further due to increasingurbanization, growing middle class and expansion in modern retail. The Indian glasscontainer market stood at ~ USD 1 bn in FY10 and grew by ~12% YoY. The industry hassignificant entry barriers due to the capital intensive nature of the business. Theindustry has strong economic drivers for end-user segments (liquor and beer,pharmaceuticals, food, cosmetics, etc.)
The liquor and beer industries are the main users of container glass with ~70%contribution, followed by pharmaceuticals ~10%, food products ~10%, beverages ~6%and cosmetics ~4%.
• The Indian Made Foreign Liquor (IMFL) segment has been registering a strong12% CAGR over the past four years. The alcohol consumption has increased inthe recent past due to growing inclination towards social drinking and higherdisposable income. This in turn is expected to drive container glass demand.
• The Indian pharmaceuticals industry is expected to grow to ~USD 37 bn by2013 from the levels of USD 17 bn in 2008. Glass bottles and molded vialsrepresent a significant share of packaging medium for cough syrups, tonics,pediatric suspensions, dry powder and liquid injectibles. Moreover, tubularvials and ampoules are finding an extensive acceptance by pharmaceuticalcompanies for their product packaging.
• In India, currently 10-12% of all food and beverages are packed in containerglasses, vis-à-vis 40-50% in developed economies. India’s retail food sector isexpected to grow to ~USD 150 bn by 2025 (from the levels of USD 70 bn in 2008).The fruit-drinks category is growing at 25% annually, one of the fastest in thebeverages market. Even sports and energy drinks, with low penetration inIndia, are expected to grow in the coming years. Attractive packaging besidesinnovative advertising and celebrity endorsements has gained importance inproducts marketing.We believe this growth will drive the demand forprocessed food packaging, especially container glass as it is considered nonreactive and food-grade.
We believe growth in India’s retail food sector will drive the demand for processedfood packaging, especially container glass as it is considered non reactive and food-grade.

Piramal Glass Ltd.
6Unicon Research
www.unicon.in
World Glass Container per capita consumption (kg)
Source: Company, Unicon Research
1.2
1.4
4.8
5.5
5.9
9.5
10.2
10.5
10.6
14.4
18.8
19.5
22.5
27.5
27.5
30.3
35.6
36.5
38.8
50.3
50.5
52.5
63.9
89.0
Indonesia
India
Brazil
Turkey
China
Greece
Japan
Belgium
Phillippines
Chile
Argentina
Mexico
Hungary
USA
UK
Poland
Austria
Czech Republic
Ireland
Spain
Germany
Italy
France
South korea
India’s per capita consumption of container glass, at 1.4 per kg, is far lower than theglobal average, indicating an immense growth potential.

Piramal Glass Ltd.
7Unicon Research
www.unicon.in
Global Glass Packaging
The World Packaging Organization estimates the global packaging industry to haverevenues of USD 425 bn, with a ten year historical CAGR growth of ~3.1% and isexpected to grow to USD 597 bn by 2014. The industry is projected to grow at ~3.5%CAGR in the next five years mainly driven by growth in emerging markets.
Global Glass Packaging Market Size
Glass Packaging
$ 30 bn
Moulded Glass
Packaging
$ 28 bn
Tubular Glass
Packaging
$ 2 bn
Food &
Beverages
$ 24.1 bn
Pharmaceuticals
$ 2.0 bn
Cosmetics &
Perfumery
$ 2.3 bn
Specialty Food
& Beverages
$ 1.3 bn
Addressable niche global markets
Sources: Industry reports, Market size in FY 08-09/ CY-08
Addressable niche “high value glass” market
Market size ~ 20% of overall market
34%
34%
27%
5%Europe
Asia, Oceana, Africa & ME
North America
South & Central America
52%
15%
11%
9%
13%
Liquor
Beer
Food
Pharma
Others
Geography End User
The global glass packaging market size is estimated to be at USD 30 bn. With C&Psegment having a size of USD 2.3 bn, Pharmaceuticals having a market size of USD2 bn and SF&B having a size of USD 1.3 bn.
Source: Owens-Illinois, Inc. - Investor Presentation, March 2010

Piramal Glass Ltd.
8Unicon Research
www.unicon.in
Gerresheimer
8%
Vitro
8%
Zignago Brosse
11%
Bormiolli Luigi
6%
Heinz
16%SGD
16%
Pochet
10%
Bormiolli Rocco
6%
Piramal Glass
6%
Others
13%
C&P market share
Source: Company, Unicon Research
PGL currently commands 5.8% market share in the ~ USD 2.3 bn Cosmetic &Perfumery (C&P) segment which has significant entry barriers like high qualityand skill requirements. PGL is the latest global entrant into this segment and hasgrown by CAGR of 19% over the last 3 years. PGL also holds the distinction of beingthe only major player in this segment from Asia and hence has a significant costadvantage over its peers in the segment due to the comparatively low cost ofmanufacturing glass in India compared to other developed markets.
The C&P segment constitutes the mass segment and the premium segment. Thesesegments are further divided as follows:
Mass Segment
• Colour Cosmetics: - This segment constitutes of nail polish bottles whoseprice ranges from USD 20-40 per 1000 bottles. The growth in the segment isdriven by the emerging economies particularly China and Brazil. Thismarket is very fragmented and regionalized and requires new designs,particularly in the mass market.
• Low Mass Perfumes: - This segment constitutes of perfume bottles with anend prices in the range of USD 8 and are primarily sold in emergingeconomies. The price range in the segment is USD 85-160 per 1000 bottles.The market is fragmented and characterised by frequent new productlaunches and short production runs. Customers in this segment preferintegrated packaging (Caps, Cartons etc.). Low mass perfumes are the easiestto produce in terms of quality and have higher manufacturing efficiencies.Competition in this space is driven by regional players in China and Poland.
BUSINESS OVERVIEW
Piramal Glass Ltd.
9Unicon Research
www.unicon.in
End
Product
Price
Bottle Price
1000 Pcs
Market
Segment
Market Size
Total market : US $ 2.3 bnMarket
$ 1016 (44%)
$ 616 (27%)
$ 500 (22%)
$ 155
(7%)
Select
Perfumes
Mass Perfumes
& Skin Care
Low Mass Perfumes
Color Cosmetics
$ 60
$ 15
$ 8
$ 1.5
$ 330 - $ 1000 +
$ 160 - $ 330
$ 85 - $ 160
$ 20 - $ 40
France
& USA
West Europe,
North America
& Latin America
Middle East, CIS
Turkey, SE Asia,
India.
Across Globe
Mas
sS
egm
ent
Mas
sS
egm
ent
Pre
miu
mS
egm
ent
Pre
miu
mS
egm
ent
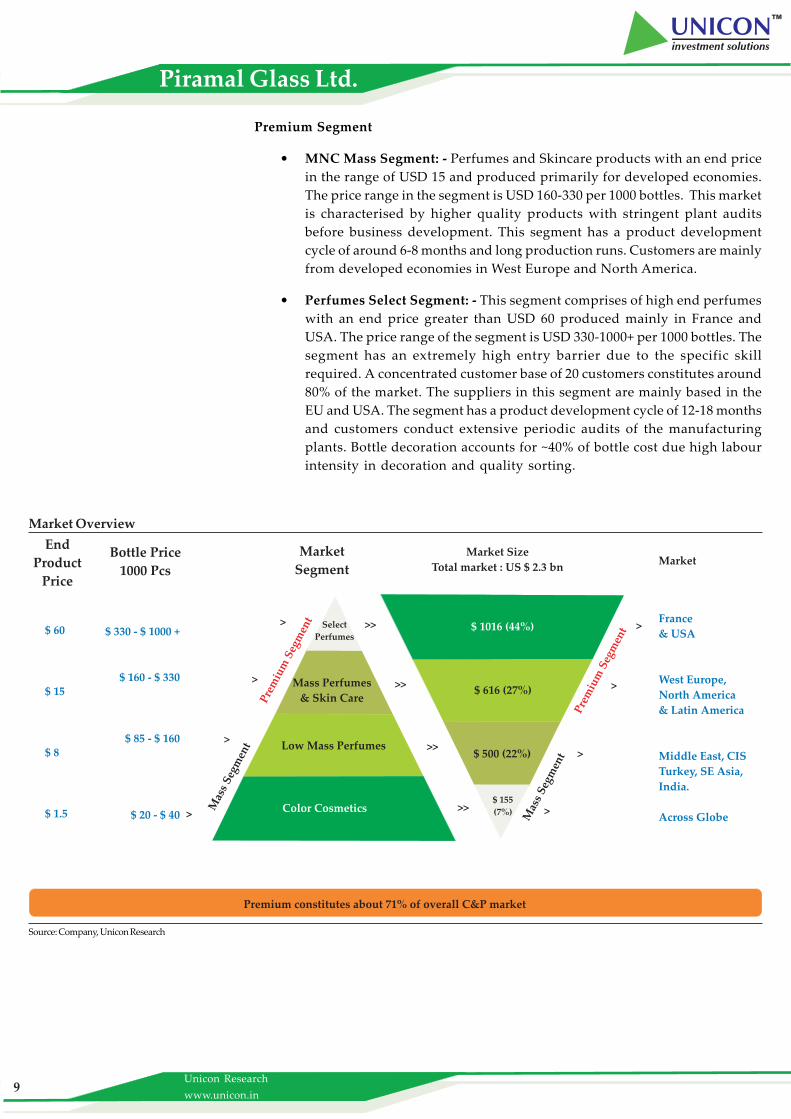
Premium constitutes about 71% of overall C&P market
>
>
>
>
>
>
>>
>>
>>
>>
>
>
Market Overview
Source: Company, Unicon Research
Premium Segment
• MNC Mass Segment: - Perfumes and Skincare products with an end pricein the range of USD 15 and produced primarily for developed economies.The price range in the segment is USD 160-330 per 1000 bottles. This marketis characterised by higher quality products with stringent plant auditsbefore business development. This segment has a product developmentcycle of around 6-8 months and long production runs. Customers are mainlyfrom developed economies in West Europe and North America.
• Perfumes Select Segment: - This segment comprises of high end perfumeswith an end price greater than USD 60 produced mainly in France andUSA. The price range of the segment is USD 330-1000+ per 1000 bottles. Thesegment has an extremely high entry barrier due to the specific skillrequired. A concentrated customer base of 20 customers constitutes around80% of the market. The suppliers in this segment are mainly based in theEU and USA. The segment has a product development cycle of 12-18 monthsand customers conduct extensive periodic audits of the manufacturingplants. Bottle decoration accounts for ~40% of bottle cost due high labourintensity in decoration and quality sorting.

Piramal Glass Ltd.
10Unicon Research
www.unicon.in
INVESTMENT RATIONALE
Focus on high-margin C&P business to drive revenues
PGL has 5.8% market share in USD 2.3 bn global C&P segment. The company hasattained a global leadership position in the colour cosmetics and low mass perfumessegments with 50% and 10% market share respectively. The company has adopted along term strategy which focuses on increasing the market share in the high marginpremium segment which has a better ROCE as compared to the mass segment. Thecompany has shown a steady increase in revenue contribution of premium segment tothe total C&P revenue over the last few years. PGL currently has a market share of 3-4% in the premium segment; the management believes that the company is wellpositioned to grow its market share to 7-8% over the next two years, which in-turnwould contribute to revenue and margin growth. We believe that the contribution ofthe C&P segment to the total revenue will increase to ~ 53% and 56% in FY12E andFY13E respectively. With the change in the product mix in the C&P segment and itsgrowing contribution to the overall business will drive margins and revenue goingforward.
C&P is a high value business commandingbetter realization & higher operating margin
75%72% 62% 68% 57% 55%
54%25%
28%38% 32%
43%45%
46%
0
1000
2000
3000
4000
5000
6000
7000
8000
FY06 FY07 FY08 FY09 FY10 FY11 FY13E
Premium Mass
CAGR : 26%
CAGR : 26%
Premium CAGR of 28-30%
Premium C&P Growth Trajectory
Source: Company, Unicon Research

Piramal Glass Ltd.
11Unicon Research
www.unicon.in
Significant cost advantages - Labour Arbitrage
Flacconage is a labour and skill intensive industry. Though the manufacturing of glassitself is highly automated, critical functions such as quality control need large teams ofskilled professionals. In countries like US, which accounts for 37% of the global C&Ppremium segment, 80% of the C&P requirement is imported thus giving significantadvantage to companies having manufacturing facilities in countries which have lowerlabour costs. The total cost of production in India, where manpower is among thecheapest in the world, is less than half of that in France and almost half of that in the US.The project costs in India amount to ~60% of the global costs. PGL is able to produceglass at significantly lower costs than its competitors in other parts of the world givingthe company a significant advantage over its peers. For FY11, global sales accountedfor 74% of the total sales. We believe that the global sales will increase further over thenext two years and contribute ~75% of the total sales.
Cost India France
Freight 6 1
Overheads 10 12
Depreciation 7 12
Mold cost 1 4
Labour 4 53
Energy 8 8
Packing material 4 4
Raw material 6 6
Total 46 100
Sustainable Cost Advantage
Source: Company, Unicon Research
0
20
40
60
80
100
120
India France
Raw material
Co
st
Packing material
Energy
Labour
Mold cost
Depreciation
Overheads
Freight
Capacity expansion to meet the future demand
Between FY12-FY13, the company has a planned capex of INR 2600 mn, with INR 1000mn assigned to a Greenfield expansion of 160 TPD for the C&P segment to the at Jambusar.This project is scheduled to be operational by March 2012. The remaining INR 1600 mnwill be spent on realignment of 4 existing furnaces which will increase the capacity by~50-60 TPD and will increase the total capacity by ~210 TPD. PGL has strategicallyfocussed on expanding its C&P furnace capacities as it has higher margins. We believethat with the further capacity expansion will enable the company to capture highermarket share in the C&P segment.
Piramal Glass Ltd.
12Unicon Research
www.unicon.in
Strong client base
PGL derives 74% of its revenues from global sales. PGL's acquisition of Glass Group,USA gave it access to 37 % of the global C&P premium segment. Today, PGL has expandedits customer base to 17 of top 20 top customers which constitute ~80% of premiummarket. These being premium brands have quite stringent eligibility criteria for itsvendors which include environmental norms, design norms, design history, etc. Thecompany has reputed brands like Coty, Elizabeth Arden, Estee Lauder, L'Oreal, Revlon,Unilever, etc as its customers which enable PGL to maintain regular order flows due tothe nature of the business where clients do not regularly change their vendors. Moreover,such reputed clients, help to form a quality client portfolio.
Stronger balance sheet to support growth
PGL had a debt of INR 9200 mn (as per FY11 Consol. balance sheet) and debt/equity of3:1. In H1FY12 the debt/equity ratio was further reduced to 2.5:1 from 3.4:1 in H1FY11.The debt service cover improved to 3.2 in H1FY12 as compared to 3.4 in H1FY12. PGLhas been able to restructure its debt by going into to relatively lower interest rate of7.5% foreign currency loan from peak rate of 13% to strength its cash flow. The Indianoperations have foreign debt of USD 40 mn in form of PCFC and will have a minimalimpact on the P&L due to the receivables (Exports to the range of 60% of standalonesales). Other foreign currency loan are in their respective currency (USA - USD 60mn &Sri Lanka -USD 40 mn) which is only for the translation and has a natural hedgebecause of the distribution of their foreign currency denominated assets and liabilities.PGL follows an active hedging policy to its naked exposure which is currently to thetune of USD 12-14 mn. Moreover, the company is also planning one time sale of 21 acresof land in Sri Lanka in FY12 with an estimated value of ~ INR 300-400 mn will gotowards debt servicing. Given the strong cash flows from operations, we believe thatthe debt equity ratio will improve to 1.6 in FY13E.

Piramal Glass Ltd.
13Unicon Research
www.unicon.in
CONCERNS
Revenue concentration from few clients
80% of C&P revenues are generated from the top 20% C&P clients. Any order executiondelays or failure on the part of PGL to retain such clients can dent revenues of thecompany.
Currency Risk
PGL is subject to risks from fluctuations in the currency as exports contributesubstantially to its revenues.
At the CMP of ~INR 92, the stock trades at ~8.0x and 5.2x of its FY12E and FY13E earningrespectively. The company has been steadily shifting its product mix from low margincommodity business to high yield specialized business of C&P. We expect the C&Pcontribution to company's revenue to increase from 49% in FY11 to 56% in FY13Ewhich is expected to boost EBITDA margins from 23% in FY11 to 25% in FY13E. Thecompany's increasing focus on C&P business, significant cost advantage over its com-petitors in other parts of the world would able PGL to increase its market share in C&Pspecially premium segment.
Most of the domestic peers are trading at a one year forward multiple of 3.6x-5.6x butare not exactly comparable given the difference in product mix and target markets.Globally glass companies which have similar product mix are commanding an aver-age P/E multiple of 10.1x. We have valued the company at ~8x of it FY13E earningswhich is at premium compared to other domestic peers, due to PGL's better marginsprofile and return ratios. We maintain our BUY rating on the stock with a target priceof INR 143.
VALUATION & OUTLOOK
PEER COMPARISON
Domestic Peers
FY12 FY13 FY12 FY13 FY12 FY13 FY12 FY13
HSIL Ltd 125.0 8,250.0 17.0 22.8 7.3 5.4 1.0 0.9 5.3 4.0
HNG 144.9 12,655.4 19.1 28.5 7.6 5.1 0.9 0.8 4.5 2.9
Piramal Glass 92.0 7,464.5 11.5 17.8 8.0 5.2 1.9 1.4 5.8 5.7
International Peers
CY11 CY12 CY11 CY12 CY11 CY12 CY11 CY12
Zignago Vetro SpA 4.5 360.0 0.4 0.5 10.3 9.7 4.5 2.8 5.6 5.3
Gerresheimer AG 32.1 1,007.5 2.3 2.6 13.9 12.5 1.9 1.7 6.5 6.0
SGD 28.9 15,480.4 3.3 3.5 8.7 8.2 0.8 0.8 5.0 4.9
EV / EBITDACompany
Price
(EUR)
Market Cap
(mn)
EPS P/E P/B
CompanyEV / EBITDAPrice
(INR)
Market Cap
(mn)
EPS P/E P/B

Piramal Glass Ltd.
14Unicon Research
www.unicon.in
FINANCIAL STATEMENTS
Source: Company, Unicon Research
Profit & Loss FY09 FY10 FY11E FY12E FY13E Balance Sheet FY09 FY10 FY11E FY12E FY13E
Total Revenue 10,088 11,039 12,185 13,080 15,383 SOURCES OF FUNDS
growth % 29.6 9.4 10.4 7.3 17.6 Share Capital 180 804 804 804 804
Total operating expenditure 9,348 9,218 9,333 10,085 11,614 Reserves & Surplus 254 1,595 2,216 3,143 4,577
EBITDA 740 1,822 2,851 2,995 3,769 Shareholder's Funds 434 2,399 3,020 3,948 5,381
EBITDA Margin % 7.3 16.5 23.4 22.9 24.5 Total Loans 13,571 9,824 9,200 9,600 8,541
Other Income 209 221 215 226 237 Deferred Tax Liab./ (Asset) 93 113 143 143 143
Depreciation & Amortisation 892 907 1,069 1,107 1,205 Total Liabilities 14,544 12,713 12,862 14,300 14,784
Interest 1,314 1,049 720 818 744 APPLICATION OF FUNDS
PBT -1,258 87 1,277 1,297 2,058 Gross Block 14,052 13,673 15,174 16,441 17,974
PBT Margin % -12.5 0.8 10.5 9.9 13.4 Less: Accu. Depreciation 4,489 5,252 6,580 7,686 8,891
Total Tax -186 54 244 259 514 Net Block 9,562 8,421 8,595 8,755 9,084
% of PBT 14.8 62.6 19.1 20.0 25.0 Capital Work-in-Progress 148 141 402 1,277 352
Reported PAT -1,072 32 1,033 1,038 1,543 Investments 1 1 1 1 1
growth % -572.7 N.A. 3095.7 0.4 48.7 Current Assets 6,429 5,873 6,349 6,822 8,183
PAT Margin % -10.6 0.3 8.5 7.9 10.0 Current Liabilities 1,033 1,070 1,326 1,397 1,677
Adjusted PAT -1,118 44 930 928 1,433 Net Current Assets 4,834 4,150 3,865 4,267 5,348
Adjusted PAT Margin % -11.1 0.4 7.6 7.1 9.3 Total Assets 14,544 12,713 12,862 14,300 14,784
Cash Flow FY09 FY10 FY11E FY12E FY13E Ratios FY09 FY10 FY11E FY12E FY13E
PBT -1,258 87 1,277 1,297 2,058 Per Share Data (INR)
Depreciation 892 907 1,069 1,107 1,205 Adj. EPS -62.2 0.6 11.6 11.5 17.8
Interest 1314 1049 720 818 744 Adj. Cash EPS -10.0 11.7 26.1 26.7 34.2
Change in Working Capital -465 260 228 0 0 BookValue 24.1 29.8 37.5 49.1 66.9
Other Exp/(Inc)
Cash Flow from Operations -253 2,580 3,195 2,285 2,192 Operating Ratios
Purchase of Fixed Assets/WIP -1,645 -244 -1,508 -2,142 -608 Inventory (days) 103.3 84.1 75.0 78.0 82.8
Sale of Fixed Assets 97 36 5 - - Debtors (days) 97.3 87.1 83.3 84.0 86.8
Other Exp/(Inc) - - - 226 237 Creditors (days) 27.1 29.6 30.8 30.7 32.7
Cash Flow from Investments -1,547 -208 -1,502 -1,916 -371 Debt / Equity (x) 31.3 4.1 3.0 2.4 1.6
(Repayment)/ Proceeds From Borrowings 3,158 -3,150 -624 400 -1,059
Proceeds from Right Issue - 625 - - - Returns (%)
Share Premium Received - 1,232 - - - RONW -247.2 1.3 34.2 26.3 28.7
Interest Paid -1,322 -1,059 -703 -818 -744 ROCE 0.5 8.8 16.3 15.6 20.1
Cash Flow from Financing 1,832 -2,352 -1,420 -418 -1,803
Inc./(Dec.) in Cash 32 21 272 -49 19 Valuation Ratios (x)
Opening Cash balances 86 118 71 133 84 P/E (x) -1.5 168.0 8.0 8.0 5.2
Closing Cash balance 118 71 133 84 102 P/CashEPS (x) -9.2 7.9 3.5 3.5 2.7
P/BV (x) 3.8 3.1 2.5 1.9 1.4
EV/Total Sales (x) 1.5 1.5 1.6 1.4 1.3
EV/EBITDA (x) 11.8 20.4 9.4 5.8 5.7
Piramal Glass Ltd.
15Unicon Research
www.unicon.in
RESEARCH RECOMMENDATIONS
Date of
RecommendationCompany Name Report Type Sector Recommendation
Recommended
PriceTarget
24-Sep-11 Development Credit Bank Ltd. Initiating Coverage Banking Buy 46.0 64.0
15-Sep-11 Supreme Infrastructure India Ltd. Investment Idea Constructions Buy 230.0 280.0
30-Aug-11 Persistent Systems Ltd. Initiating Coverage Information Technology Buy 309.0 381.0
2-Aug-11 Tamil Nadu News Print Ltd. Initiating Coverage Paper & Paperboard Buy 117.0 161.0
18-Jul-11 KEC International Ltd. Initiating Coverage Power Transmission Buy 79.0 104.0
12-Jul-11 Visa Steel Ltd. Investment Idea Metal Buy 59.0 75.0
30-Jun-11 Tecpro Systems Ltd. Investment Idea Material Handling Buy 250.0 300.0
16-May-11 Camson Biotechnologies Ltd. Investment Idea Agri Biotech Buy 116.0 156.0
4-May-11 Ganesh Polytex Ltd. Initiating Coverage Waste Recycling Buy 62.0 102.0
28-Apr-11 CESC Ltd. Initiating Coverage Power Buy 311.0 411.0
1-Apr-11 Unity Infraprojects Ltd. Investment Idea Infrastructure Buy 69.0 86.0
31-Mar-11 Rolta India Ltd. Investment Idea IT / ITES Buy 139.0 191.0
29-Mar-11 West Coast Paper Mills Ltd. Investment Idea Paper & Paperboard Buy 77.0 95.0
7-Mar-11 Hindusthan National Glass & Industries Ltd. Initiating Coverage Glass Buy 212.0 351.0
28-Feb-11 Deepak Fertilisers & Petrochemicals Ltd. Initiating Coverage Fertilisers Buy 152.0 202.0
3-Feb-11 Ceat Ltd. Investment Idea Auto Ancillaries Buy 109.0 149.0
31-Jan-11 MIC Electronics Ltd. Initiating Coverage Led Display & Lighting Buy 31.6 51.0
12-Jan-11 Diamond Power & Infrastructure Ltd. Initiating Coverage Power Buy 193.0 257.0
31-Dec-10 Hathway Cable & Datacom Ltd. Initiating Coverage Media Buy 164.0 227.0
31-Dec-10 Jindal Poly Films Ltd. Investment Idea Packaging Accumulate 525.0 620.0
31-Dec-10 Allahabad Bank Investment Idea Banking Buy 225.0 304.0
22-Dec-10 Sasken Communication Tech. Ltd. Investment Idea IT / ITES Buy 168.0 226.0
30-Nov-10 Banco Product Initiating Coverage Auto Buy 93.0 149.0
30-Nov-10 Allcargo Global Logistics Investment Idea Shipping & Logistics Buy 155.0 233.0
18-Nov-10 Jyoti Structure Investment Idea Power Buy 137.0 171.0
16-Nov-10 Pennar Industries Investment Idea Steel Buy 49.0 63.0
3-Nov-10 HSIL Ltd. Initiating Coverage Building Product Buy 141.0 171.0
27-Oct-10 IDBI Bank Initiating Coverage Banking Buy 171.0 228.0
26-Oct-10 MSP Steel and Power Initiating Coverage Steel Buy 72.0 114.0
29-Sep-10 Nakoda Textiles Investment Idea Textiles Buy 15.0 23.0
16-Sep-10 Kajaria Ceramics Investment Idea Ceramic Tiles Buy 70.0 88.0
15-Sep-10 Gokul Refoils Investment Idea Food Processing Accumulate 97.3 109.0
14-Sep-10 Aqua Logistic Investment Idea Logistic Hold 59.1 60.8
31-Aug-10 Lakshmi Precision Screws Investment Idea Fastner Accumulate 79.8 91.8
27-Aug-10 BGR Energy System Initiating Coverage Power Buy 786.0 1020.0
30-Jul-10 Patel Engineering Initiating Coverage Infrastructure Buy 416.0 480.0
26-Jul-10 KPR Mills Ltd. Investment Idea Textiles Accumulate 156.0 181.0
14-Jul-10 IDBI Bank Investment Idea Banking Accumulate 125.0 142.0
9-Jul-10 Opto Circuit Initiating Coverage Healthcare Buy 243.0 293.0
26-Jun-10 BGR Energy System Ltd. Investment Idea Capital Goods Accumulate 697.0 820.0
23-Jun-10 Biocon Ltd. Investment Idea Pharmaceuticals Buy 321.0 387.0
19-Jun-10 Emmbi Polyarns Investment Idea Packaging Buy 15.6 26.0
18-Jun-10 Indian Bank Investment Idea Banking Buy 221.0 276.0
17-Jun-10 Diamond Power & Infrastructure Ltd. Investment Idea Power Ancillary Accumulate 196.0 226.0
12-Jun-10 Man Industries Investment Idea Steel Pipes Buy 85.0 102.0
5-Jun-10 Usher Agro Investment Idea Food Processing Buy 79.0 110.0
10-May-10 Greaves Cotton Investment Idea Construction Buy 67.0 82.0
30-Apr-10 Indraprastha Gas Ltd. Initiating Coverage Gas Distribution Buy 233.0 290.0

Piramal Glass Ltd.
16Unicon Research
www.unicon.in
DisclaimerThis document has been issued by Unicon Financial Intermediaries Pvt Ltd. (“UNICON”) for the information of its customers only. UNICON is governedby the Securities and Exchange Board of India. This document is not for public distribution and has been furnished to you solely for your information andmust not be reproduced or redistributed to any other person. Persons into whose possession this document may come are required to observe theserestrictions. The information and opinions contained herein have been compiled or arrived at based upon information obtained in good faith from publicsources believed to be reliable. Such information has not been independently verified and no guarantee, representation or warranty, express or impliedis made as to its accuracy, completeness or correctness. All such information and opinions are subject to change without notice. This document has beenproduced independently of any company or companies mentioned herein, and forward looking statements; opinions and expectations contained hereinare subject to change without notice. This document is for information purposes only and is provided on an “as is” basis. Descriptions of any companyor companies or their securities mentioned herein are not intended to be complete and this document is not, and should not be construed as an offer, orsolicitation of an offer, to buy or sell or subscribe to any securities or other financial instruments. We are not soliciting any action based on this document.UNICON, its associate and group companies its directors or employees do not take any responsibility, financial or otherwise, of the losses or the damagessustained due to the investments made or any action taken on basis of this document, including but not restricted to, fluctuation in the prices of the sharesand bonds, reduction in the dividend or income, etc. This document is not directed to or intended for display, downloading, printing, reproducing or fordistribution to or use by any person or entity who is a citizen or resident or located in any locality, state, country or other jurisdiction where suchdistribution, publication, reproduction, availability or use would be contrary to law or regulation or would subject UNICON or its associates or groupcompanies to any registration or licensing requirement within such jurisdiction. If this document is inadvertently sent or has reached any individual in suchcountry, the same may be ignored and brought to the attention of the sender. This document may not be reproduced, distributed or published for anypurpose without prior written approval of UNICON. This document is for the general information and does not take into account the particular investmentobjectives, financial situation or needs of any individual customer, and it does not constitute a personalised recommendation of any particular security orinvestment strategy. Before acting on any advice or recommendation in this document, a customer should consider whether it is suitable given thecustomer's particular circumstances and, if necessary, seek professional advice. Certain transactions, including those involving futures, options, and highyield securities, give rise to substantial risk and are not suitable for all investors. UNICON, its associates or group companies do not represent or endorsethe accuracy or reliability of any of the information or content of the document and reliance upon it is at your own risk.
UNICON, its associates or group companies, expressly disclaims any and all warranties, express or implied, including without limitation warranties ofmerchantability and fitness for a particular purpose with respect to the document and any information in it. UNICON, its associates or group companies,shall not be liable for any direct, indirect, incidental, punitive or consequential damages of any kind with respect to the document. No part of thispublication may be reproduced, stored in a retrieval system, or transmitted, on any form or by any means, electronic, mechanical, photocopying,recording, or otherwise, without the prior written permission of Unicon Financial Intermediaries Pvt Ltd.
Unicon Investment Ranking Methodology
Rating Buy Accumulate Hold Reduce Sell
Return Range >= 20% 10% to 20% -10% to 10% -10% to -20% <= -20%
Address:
Unicon Financial Intermediaries Pvt. Ltd.
3rd Floor, VILCO Center, Opp Garware House,
8, Subhash Road, Vile Parle (East), Mumbai - 400057.
Ph: 022-33901234
Email: [email protected]
Visit us at www.unicon.in
Related Documents