281 WHAT HAPPENS IF THE CANAL BREAKS? TOOLS FOR ESTIMATING CANAL-BREACH FLOOD HYDROGRAPHS Tony L. Wahl 1 ABSTRACT A program of physical model tests and numerical unsteady-flow simulations has led to the development of appraisal-level tools for predicting the characteristics of floods caused by the breaching of homogeneous canal embankments. The procedures yield estimates of the time needed for initiation and development of a breach, the magnitude of the peak outflow, and the duration of the recession limb of the flood hydrograph. These tools can help water managers identify canal reaches that have the potential to produce floods with serious consequences. This can aid emergency management planning and help to prioritize the need for more detailed investigations. This paper demonstrates the use of the procedures and illustrates the importance of key input parameters, especially the erodibility of the soil in the embankment. The method has not yet been tested against real-world canal failures. INTRODUCTION The Bureau of Reclamation (Reclamation) is responsible for more than 8,000 miles of irrigation canals in the western U.S., and failures of canal embankments have occurred periodically throughout its history. When these canals were constructed, the adjacent lands were primarily agricultural or undeveloped. Development of these lands has led to greater interest in understanding the potential impacts and consequences of canal embankment failures on surrounding areas. Threats to canals include animal burrows, tree roots, penetrations by turnout pipes and utilities, embankment and foundation issues, seismic events, internal erosion under static loading, hydrologic events, and operational incidents. Numerical modeling of breach outflows and downstream flooding can be used to evaluate potential consequences of a canal breach. To facilitate appraisal-level investigations of Reclamation’s canal inventory, a research program was undertaken to study the canal breach process and develop tools for predicting canal breach outflow hydrographs (Wahl and Lentz 2011). This work included both physical hydraulic modeling of the erosion and breaching processes and numerical modeling of transient canal behavior during a hypothetical breach event. Results from these studies were used to develop procedures for estimating breach initiation and breach enlargement rates and associated canal breach outflows. This paper illustrates the use of these procedures and demonstrates the sensitivity of results to key input parameters. 1 Hydraulic Engineer, Bureau of Reclamation, Hydraulic Investigations and Laboratory Services, Denver, CO, 303- 445-2155, [email protected]. USCID -- April 15-19, 2013 -- Scottsdale, AZ

Welcome message from author
This document is posted to help you gain knowledge. Please leave a comment to let me know what you think about it! Share it to your friends and learn new things together.
Transcript

281
WHAT HAPPENS IF THE CANAL BREAKS? TOOLS FOR ESTIMATING CANAL-BREACH FLOOD HYDROGRAPHS
Tony L. Wahl1
ABSTRACT
A program of physical model tests and numerical unsteady-flow simulations has led to the development of appraisal-level tools for predicting the characteristics of floods caused by the breaching of homogeneous canal embankments. The procedures yield estimates of the time needed for initiation and development of a breach, the magnitude of the peak outflow, and the duration of the recession limb of the flood hydrograph. These tools can help water managers identify canal reaches that have the potential to produce floods with serious consequences. This can aid emergency management planning and help to prioritize the need for more detailed investigations. This paper demonstrates the use of the procedures and illustrates the importance of key input parameters, especially the erodibility of the soil in the embankment. The method has not yet been tested against real-world canal failures.
INTRODUCTION
The Bureau of Reclamation (Reclamation) is responsible for more than 8,000 miles of irrigation canals in the western U.S., and failures of canal embankments have occurred periodically throughout its history. When these canals were constructed, the adjacent lands were primarily agricultural or undeveloped. Development of these lands has led to greater interest in understanding the potential impacts and consequences of canal embankment failures on surrounding areas. Threats to canals include animal burrows, tree roots, penetrations by turnout pipes and utilities, embankment and foundation issues, seismic events, internal erosion under static loading, hydrologic events, and operational incidents.
Numerical modeling of breach outflows and downstream flooding can be used to evaluate potential consequences of a canal breach. To facilitate appraisal-level investigations of Reclamation’s canal inventory, a research program was undertaken to study the canal breach process and develop tools for predicting canal breach outflow hydrographs (Wahl and Lentz 2011). This work included both physical hydraulic modeling of the erosion and breaching processes and numerical modeling of transient canal behavior during a hypothetical breach event. Results from these studies were used to develop procedures for estimating breach initiation and breach enlargement rates and associated canal breach outflows. This paper illustrates the use of these procedures and demonstrates the sensitivity of results to key input parameters.
1 Hydraulic Engineer, Bureau of Reclamation, Hydraulic Investigations and Laboratory Services, Denver, CO, 303-445-2155, [email protected].
USCID -- April 15-19, 2013 -- Scottsdale, AZ
Copyright notice
This article was prepared by a Bureau of Reclamation employee acting within the scope of their official duties. Copyright protection under U.S. copyright law is not available for such works. Although the publication in which the article appears is itself copyrighted, this does not affect works of the U.S. Government, which can be freely reproduced by the public.

282 Seventh International Conference on Irrigation and Drainage
BACKGROUND
Although canal breaches have occurred throughout history, there have been remarkably few efforts to generalize experiences from these events. Prior to this study, there was no guidance specific to canals for predicting breach parameters or breach outflow hydrographs. Dun (2007) provided the most notable prior work on the hydraulics of a canal breach in a study of a navigation canal that failed in the United Kingdom in 2004. Dun concluded that the hydraulics of canal breaches were significantly different from breaches of traditional dams and storage reservoirs. For a traditional dam breach, outflow is typically limited by the breach geometry and the reservoir storage, but for a canal breach, outflow is also limited by the conveyance capacity of the reaches of canal that deliver water to the breach site.
Nearly all canal embankments contain soils that may be conducive to headcut development during erosion. Even canal embankment soils that do not demonstrate plasticity contain enough fine materials to resist seepage loss of water and thus exhibit enough apparent cohesion to allow headcuts to develop. Recognizing this general characteristic, the typical stages of a canal breach can be described as follows:
1. Initial overtopping of the embankment, or development of a defect in an embankment that allows erosive flow through the embankment or foundation (typically described as internal erosion or “piping”).
2. Development of a headcut that begins on the downstream (outer) slope of the embankment and migrates upstream toward the canal. In this stage, erosion is primarily taking place downstream from the section (the hydraulic control) that controls the outflow rate. The breach outflow rate is small and normal canal flow can continue past the developing breach site.
3. Migration of the headcut through the hydraulic control, which enlarges the control section rapidly and allows a dramatic increase in outflow. As the breach enlarges during this stage, the size of the breach and the water level maintained in the canal are the primary factors determining the outflow rate. In this phase, the breach outflow becomes so large that flow reverses in the canal reach that was initially downstream from the breach site.
4. The breach eventually enlarges to the point that the hydraulic control shifts from the breach opening to the two canal sections. Critical-depth flow occurs in the leg of the canal upstream from the breach and also in the leg of the canal downstream from the breach. The breach may continue to widen, but the outflow rate cannot increase. As the canal drains, the flow rate through the two critical sections drops and the breach outflow rate is reduced.
One potential modification of this staged breach process is a situation in which the embankment is weak enough to allow the overtopping channel or initial pipe to enlarge so rapidly that steps 2 and 3 are not distinct from one another but are effectively combined into one step in which erosion and enlargement of the hydraulic control section
USCID -- April 15-19, 2013 -- Scottsdale, AZ

Tools for Estimating Canal-Breach Flood Hydrographs 283
occurs simultaneously with headcut development and advance. This would not change the hydraulic control shift that still occurs during the last step of the process.
The research studies carried out at Reclamation have focused on the last three steps of the process outlined above. These studies assumed that the occurrence of the first step in the process is given; there has been no attempt to model the initiation of piping, which is a complex process that can occur through a large variety of specific mechanisms (e.g., Von Thun 1996; Engemoen 2012). These studies have also been based on the conservative assumption that there is no intervention, such as early shutdown of the canal or closing of check gates at the upstream and downstream ends of a reach experiencing a breach event. This provides results that are appropriate for the worst-case scenario of a breach that develops so rapidly that intervention is not possible.
PHYSICAL MODELING
Physical modeling to support this research was described in detail by Wahl and Lentz (2011). The facility used in the hydraulics laboratory (Figure 1) recreated a typical canal flow situation prior to development of a breach. Water could be provided into both ends of a non-erodible canal with an erodible test section in the middle. Each test started with normal canal flow past the test embankment, and as the breach developed, the flow into both ends of the model canal was increased to maintain boundary conditions at the breach site that were representative of a fast-developing breach in a long canal reach (i.e., a relatively steady canal water surface). The upper limit of inflow provided to each end of the canal was the theoretical critical-flow discharge capacity of the canal sections.
Figure 1. Overview of canal breach model test facility, looking in the upstream direction.
The three tested embankments were constructed in the model as simulated fill sections in a canal reach that is elevated above the surrounding landscape. Soil used to construct the embankments was a silty sand (SM) obtained from a local landscape materials supplier.
USCID -- April 15-19, 2013 -- Scottsdale, AZ

284 Seventh International Conference on Irrigation and Drainage
To simulate the wide range of erodibility properties that can occur in real canal embankments, we varied both the water content at compaction and the level of compaction effort. The test soil contained about 10% clay fines and exhibited some plasticity (PI=5), so its erodibility was sensitive to the placement conditions. The erodibility of each test embankment was measured during embankment construction and after the completion of each breach test using submerged jet testing (Hanson and Cook 2004; ASTM D5852). Across three breach tests, the erodibility of the embankments varied by about three orders of magnitude as indicated by detachment rate coefficients obtained from the jet tests.
The breach tests exhibited three canal breach development scenarios, all initiated by erosion through a pre-formed pipe in the embankment (a #4 rebar embedded in the embankment and removed to start the test). The first test with a well-compacted and erosion-resistant embankment produced a very slow headcut migration and breach widening process, without a sudden and catastrophic breach outflow. This test was representative of a scenario in which there would likely be adequate time to shut down the canal and reduce the severity of the breach outflow. The second test demonstrated the breach behavior of a poorly-compacted and very erodible embankment, with rapid headcut development, headcut migration, and breach widening. The third test illustrated an intermediate situation in which the embankment was very erodible, but the initial pipe was located so high in the embankment that flow through it was small and initial headcut development and migration were slow. However, when the headcut finally migrated into the canal prism, failure and breach widening were nearly as rapid as that seen in the second test.
Data collected from the three tests were used to relate the soil erodibility parameters (detachment rate coefficient and critical shear stress) and hydraulic attack (estimated shear stresses and energy dissipation rates) to observed headcut migration and breach widening rates. The relations between these variables were found to be consistent with observations from breach testing of traditional embankment dams (Hunt et al. 2005; Temple et al. 2005; Hanson et al. 2011). This led to the development of simplified mathematical models for predicting headcut advance, piping hole enlargement, and breach widening rates. The first two models are relevant to estimating the time required for breach initiation (the time preceding headcut advance through the hydraulic control), which affects the amount of time available for detection of a breach in progress and warning of the downstream population at risk. The last model can be used to estimate the rate of breach enlargement after breach initiation has been completed.
NUMERICAL MODELING
The physical model tests provide a means to predict how a breach will develop. The other significant question is what breach outflow hydrograph will be produced through this opening. This is dependent on both the characteristics of the breach and the transient behavior of the water within the canal reach in which the breach occurs, since drawdown of the canal and development of a varying water surface profile in the canal will change the head acting on the breach opening and the amount of flow that can be delivered to the breach site. To quantify these effects, one-dimensional unsteady flow modeling was
USCID -- April 15-19, 2013 -- Scottsdale, AZ

Tools for Estimating Canal-Breach Flood Hydrographs 285
undertaken using HEC-RAS (Wahl and Lentz 2011). Numerous canal breach scenarios were simulated with varying canal sizes, breach times, canal reach lengths, and breach locations within the canal reach. This led to the development of dimensionless relationships that yield estimates of breach hydrograph parameters (peak outflow and recession time) as a function of breach development time, breach location within the canal reach, and canal hydraulic properties.
CANAL BREACH OUTFLOW PREDICTION PROCEDURE
The essential characteristics of a canal breach hydrograph are the time required for breach initiation, the time required for breach development, and the resulting breach outflow hydrograph. The hydrograph may be defined by the peak outflow magnitude, the time at which peak outflow occurs, and the time required for the hydrograph to recede. The physical embankment breach tests and HEC-RAS modeling conducted in this research project provide a basis for estimating all of these characteristics of a canal breach event.
Breach Initiation
Breach initiation may take place through one or a combination of three different processes: headcut advance caused by overtopping flow; headcut advance due to flow through an existing piping channel that is not enlarging significantly; or continuous enlargement of an existing piping defect. Models for all three processes were developed (Wahl and Lentz 2011), but only the first two based on headcutting are presented here, as they are believed to be more reliable at this time.
Breach Initiation by Headcut Advance due to Overtopping Flow. Consider the canal embankment shown in Figure 2, which is depicted as a fill section deeper than the canal prism. Flow overtops the embankment with head Hov. The unit discharge over the embankment can be estimated from a broad-crested weir equation as q=2.6Hov
1.5 with Hov in ft and q in ft3/s/ft. Assuming that headcutting initiates at the toe of the embankment, the time for breach initiation is the time required for the headcut to advance the distance L back to the upstream edge of the embankment crest. The headcut advance rate can be estimated from (Temple et al. 2005)
( ) 3/1hqHC
dtdX = (1)
where:
dX/dt = headcut advance rate (ft/hr); C = headcut advance rate coefficient (s1/3/hr); q = unit discharge (ft3/s/ft); and Hh = headcut height (ft).
Hanson et al. (2011) showed (and the physical hydraulic model testing of canal breaches confirmed) that C can be estimated as C=0.44kd, with kd being the detachment rate coefficient obtained from a submerged jet erosion test with units of ft/hr/psf. In the event
USCID -- April 15-19, 2013 -- Scottsdale, AZ
286 Seventh International Conference on Irrigation and Drainage
that a jet test is unavailable, values of kd may be estimated using Table 1 (Hanson et al. 2011) which relates kd to the clay content, compaction effort, and water content of the soil during compaction (relative to the optimum water content that yields maximum dry density during a compaction test). Note that this table gives values of kd in metric units, but they may be converted using the factor shown with the table.
Figure 2. Canal embankment parameters for estimating headcut advance rate due to overtopping flow.
Combining these equations, the time for breach initiation in hours is:
( )( ) 3/11.5ov
initiation6.244.0 hd HHkLt = (2)
where:
L = required headcut advance distance, from toe of exterior slope (ft); Hh = potential height of headcut (ft); Hov = overtopping head (ft); and
kd = detachment rate coefficient (ft/hr/psf).
One could argue that the headcut should be assumed to initiate at the top of the slope to conservatively shorten the migration distance required, but in that case the head acting on the headcut would be initially small. The headcut would eventually deepen to approach Hh, and it is believed that the time required for this to occur is comparable to the time needed for headcut migration from the toe back to the head of the slope.
Table 1. — Approximate values of kd in cm3/(N-s) as a function of compaction conditions and % clay (Hanson et al. 2011). [1 cm3/(N-s) = 0.5655 ft/hr/psf]
% Clay (<0.002 mm)
Modified Compaction (56,250 ft-lb/ft3)
Standard Compaction (12,375 ft-lb/ft3)
Low Compaction (2,475 ft-lb/ft3)
≥Opt WC% <Opt WC% ≥Opt WC% <Opt WC% ≥Opt WC% <Opt WC%
Erodibility, kd, cm3/(N·s)>25 0.05 0.5 0.1 1 0.2 2
14-25 0.5 5 1 10 2 20 8-13 5 50 10 100 20 200 0-7 50 200 100 400 200 800
USCID -- April 15-19, 2013 -- Scottsdale, AZ

Tools for Estimating Canal-Breach Flood Hydrographs 287
Breach Initiation by Headcut Advance due to Piping Flow. Analysis of this case is similar to the previous situation, except that the overtopping flow is replaced by orifice flow through a piping defect in the embankment. The elevation of this defect and its diameter and length must be specified to allow estimation of the flow rate through the pipe. The starting diameter should be a practical value relating to the size of piping defect that might prompt notice of the piping condition by project personnel and begin the cycle of potential operational responses to a canal emergency. The key variables are illustrated in Figure 3.
Figure 3. Canal embankment parameters for estimating headcut advance rate due to piping flow.
The flow rate through the pipe can be estimated by applying the energy equation
( )
pipe
pipe
pipe2
pipe
14
2
dL
f
gHdQ
+=
π
(3)
where:
Q = discharge (ft3/s); dpipe = pipe diameter (ft); g = acceleration due to gravity (ft/s2); Hpipe = head across pipe (ft); f = friction factor, assumed to be 0.05 for a relatively rough pipe interior; and Lpipe = length of pipe (ft).
The unit discharge effective in advancing the headcut can then be estimated by converting the flow through the round pipe into the unit discharge of an equivalent square jet, q=(π/4)1/2(Q/dpipe)=0.886Q/dpipe. The time required for headcut advance is then computed as
( )( ) 3/1
pipe
initiation/886.044.0 dQHk
Lthd
= (4)
USCID -- April 15-19, 2013 -- Scottsdale, AZ

288 Seventh International Conference on Irrigation and Drainage
Note that the distance L is shown in Figure 3 as the distance to the upstream crest, not the full distance to the upstream end of the pipe. This leads to a shorter, more conservative estimate of the breach initiation time and is consistent with the observed behavior of the test embankments, which seemed to experience collapse of the bridge over the pipe at about the time that headcutting reached the upstream side of the crest.
Breach Initiation by Pipe Enlargement. A model for pipe enlargement was developed by Wahl and Lentz (2011), but was extremely sensitive to the values of kd and the critical shear stress of the soil, τc, as well as the choice of a starting condition for the piping erosion analysis. The model may be of interest for future research.
Breach Development. The breach development phase is characterized by headcut advancement through the upstream (canal side) slope of the embankment down to its toe, followed by widening of the breach in both directions until the breach becomes wide enough that it no longer serves as the hydraulic control. At this point, control of the flow shifts to the critical-flow sections that will exist in the upstream and downstream canals. For purposes of this appraisal-level model, the period of headcut advance into the canal is assumed to be short compared to the time for breach widening and is incorporated into the estimate of the widening time by assuming that widening begins from a breach width of zero. The breach is assumed to have vertical sidewalls during the widening phase and a rectangular cross-section, as observed in physical model tests and real embankment failures.
To estimate the breach development time, it is necessary to first define the ending condition for this phase. We need to determine the maximum theoretical flow that can be provided to the breach site by the upstream and downstream canals. This is accomplished by iteratively solving a system of three equations applying to critical flow (Clemmens et al. 2001):
c
c
TgAQ
3
= (5)
c
cc T
AHy21 −= (6)
21
2
11 2gAQhH += (7)
where:
yc = critical depth, Ac = area of the critical section, Tc = top width of the critical section, h1 = normal flow depth in the canal, H1 = total energy head in the canal at normal flow, and A1 = area of the canal at normal depth.
USCID -- April 15-19, 2013 -- Scottsdale, AZ

Tools for Estimating Canal-Breach Flood Hydrographs 289
For the design normal-depth flow condition of the canal, the flow depth h1 is known and a value of H1 can be computed using Eq. 7. Next, assume a starting value for critical depth, yc, such as yc=0.7H1. For this critical depth, the cross-sectional area, Ac, and top width, Tc, of the canal may be computed. The critical discharge can then be computed from Eq. 5 and a refined estimate of yc computed with Eq. 6. H1 should be kept constant, so the iteration between Eqs. 7 and 8 is continued until convergence is obtained. The maximum theoretical breach outflow, Qc,max, will be two times the critical discharge computed with Eq. 5, assuming that both canals have the same cross section. This flow must pass through the breach opening in the canal embankment, and we will assume again that it does so in a critical-flow condition. The critical flow depth through the rectangular breach opening will be estimated as (2/3)yn, where yn is the normal depth of flow in the canal. (This is a crude estimation that ignores any head loss that occurs in the canal as flow approaches the breach). For a rectangular channel, the critical flow depth is yc=(q2/g)1/3, so the unit discharge at the end of breach widening is q=([2yn/3]3g)1/2 and the final width of the breach is
gy
Qb
n
c
3
max,max
3
2
= (8)
The breach widening rate is estimated using a relation developed by Hunt et al. (2005) and confirmed in the physical model tests discussed previously.
])49.1/(7.0[2 23/1ccwd nygk
dtdb τγ −= (9)
where db/dt is the change in breach width per unit time, the constant 1.49 comes from the Manning equation in English units, and Manning’s n is taken to be 0.020 in the breach opening. With the final breach width and widening rates known, the time required for breach widening is
])49.1/(7.0[2 23/1max
fccwd nygk
btτγ −
= (10)
The critical shear stress, τc, may be assumed to be zero to obtain a conservatively short estimate of the breach widening time. Once the breach widening time is estimated, it is converted to a dimensionless quantity, t*f=tf/tref, with tref being a reference time based on the hydraulic depth of the canal, D, and the wave celerity, c
gDDgD
cDt /ref === (11)
In this equation the hydraulic depth, D, is defined to be the canal flow area divided by the wetted top width, and g is the acceleration due to gravity.
USCID -- April 15-19, 2013 -- Scottsdale, AZ
290 Seventh International Conference on Irrigation and Drainage
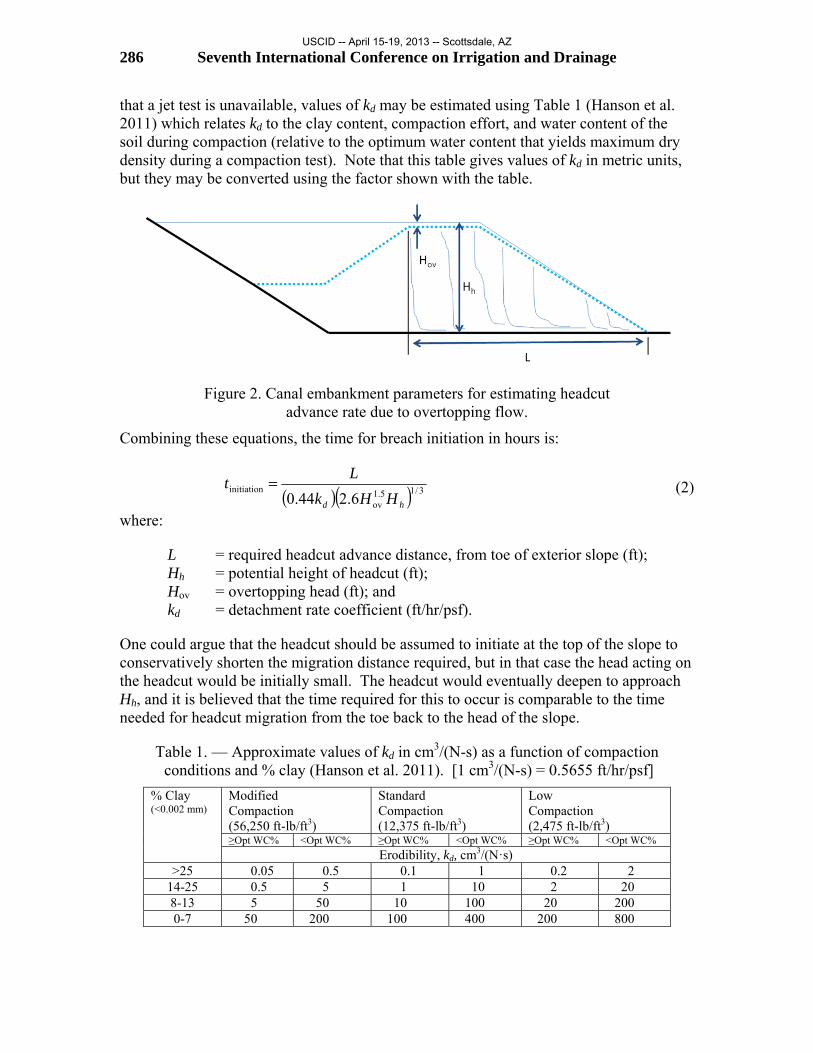
Numerical modeling of hypothetical canal failures (Wahl and Lentz 2011) was used to develop relations for predicting the dimensionless peak outflow, Q*peak=Qpeak/Qc,max. Figure 4 shows the dimensionless peak outflow versus the dimensionless breach development time. Data points at or just below the upper envelope curve come from simulations in which the hypothetical breach site is a long distance upstream from the next downstream check structure along the canal, so there is a significant volume of water in the downstream canal that can drain back upstream to add to the breach outflow. Points lying well below the envelope curve are for simulations in which the breach site was closer to the downstream end of the canal reach. Figure 5 shows the percentage of the envelope value that was actually developed as a function of the dimensionless distance from the breach site to the downstream end of the reach. Note that the curve shown in Figure 5 is modified from that shown in Wahl and Lentz (2011) so that the curve passes through 50% at a dimensionless distance of 1. Thus, if the breach is located very near the downstream end of the reach, then the downstream channel is short and contributes almost nothing to the peak outflow, so the maximum possible outflow is 50% of the value obtained from the envelope curve. Note also that in the numerical simulations the distance from the breach to the upstream end of the canal reach had much less effect on the peak outflow than did the downstream distance. Combining the two relations shown on these figures produces one equation for estimating the peak outflow:
( ) ( )
−==
4/1ds
6/1f
max,peakmax,peak*
5.01
*
9.1)*(
LtQQQQ cc (12)
where t*f is the dimensionless breach development time defined earlier and L*ds is the downstream canal reach length nondimensionalized by the hydraulic radius, Lds/Rh. The value of L*ds is never allowed to be less than 1.
Figure 4. Dimensionless peak outflow from hypothetical canal breaches as a function of dimensionless breach development time.
0.10
1.00
10 100 1000 10000 100000
Q* p
eak
t*f
Q*peak
Envelope curve
1.9(t*f)-1/6
USCID -- April 15-19, 2013 -- Scottsdale, AZ

Tools for Estimating Canal-Breach Flood Hydrographs 291
Figure 5. Effect of downstream canal reach length on peak breach outflow. Lds is the length of the downstream canal and Rh is the hydraulic radius.
The peak discharge is assumed to occur at the end of the breach widening phase. The other parameter of significant interest is the time required for the breach outflow to recede back toward the normal canal flow rate. (Since we assume that the canal is not shut down during a hypothetical “fast” breach, the canal continues to supply water from upstream at the normal rate.) To describe the recession curve, the duration for the flow to drop back to a flow rate of Qnormal+0.5(Qpeak-Qnormal) can be estimated with Eq. 13 (Wahl and Lentz 2011), which defines the curve shown in Figure 6.
f0.66f
recession *
123 tt
t =
(13)
Figure 6. Hydrograph recession time as a function of breach development time.
0.0
0.1
0.2
0.3
0.4
0.5
0.6
0.7
0.8
0.9
1.0
1 10 100 1000 10000 100000
Q* p
eak/
Q* e
nvel
ope
Dimensionless downstream canal length, L*ds=Lds/Rh
1-0.5(L*ds)-0.25
t*recession = 123(t*f)-0.66
0.01
0.1
1
10
100
10 100 1,000 10,000 100,000 1,000,000t*re
cess
ion
= t r
eces
sion/
t f
t*f = tf/tref
USCID -- April 15-19, 2013 -- Scottsdale, AZ

292 Seventh International Conference on Irrigation and Drainage
SPREADSHEET MODEL
The set of equations described above has been programmed into a spreadsheet model that allows a user to describe the canal properties, the embankment dimensions, and the embankment materials, and then estimate breach initiation time, breach development time, and the breach outflow hydrograph. The next step in the development of this tool is to validate it against actual canal failures. This will require case studies with the necessary input data and good estimates of the actual breach outflow hydrograph.
EXAMPLE APPLICATION
To illustrate the use of the procedures described in this paper, consider a hypothetical example as follows:
• Earthen canal with design discharge of 800 ft3/s;
• Canal cross section in the reach of interest is trapezoidal with 15 ft base width, 2:1 (H:V) side slopes, bed slope = 0.000379 (2 ft/mile), and Manning’s n = 0.028. Normal depth of flow for the design discharge is 8.32 ft.
• The canal reach being considered is a 3-mi-long fill section, with gated check structures at each end of the reach. The check structures are assumed to remain at their normal operating positions during a breach event (worst-case, very rapid breach scenario).
• The canal embankments on both sides of the canal are 15 ft tall from land-side toe to crest, and the freeboard between the crest and the normal operating water surface is 2 ft. The crest width is 16 ft, and the external embankment slope is 2:1.
• The embankment is constructed from a silty sand (SM) with 4% clay. The embankment was constructed in about 1910 and is believed to have been compacted by animal traffic (low compaction effort) at a water content that was equal to or wetter than optimum.
• Locations of greatest concern are near the downstream end of the reach and about 1 mile upstream from the downstream check structure. Several homes are located near the toe of the embankment at each of these locations.
The canal was operated for two years at a reduced discharge of 500 ft3/s, and the flow depth during this time was only 6.61 ft. When the canal is returned to service this year at the original design flow rate, a potential failure mode is piping through muskrat burrows located at the water line corresponding to the previous years’ operations (3.71 ft below the embankment crest). We will assume that a muskrat burrow has a starting diameter of 2 inches and passes straight through the embankment.
Before considering specific breach locations and material parameters, we can use Eqs. 5-7 to compute the maximum theoretical peak outflow, which will be the reference discharge for any breach scenario. The maximum critical-flow discharge in one canal
USCID -- April 15-19, 2013 -- Scottsdale, AZ

Tools for Estimating Canal-Breach Flood Hydrographs 293
reach is 2054 ft3/s, before the canal drains significantly, and thus, the maximum theoretical breach outflow is Qc,max = 4108 ft3/s.
Soil erodibility parameters are estimated by referring to Table 1. For the compaction conditions described, the table suggests kd = 200 cm3/(N-s) = 113.1 ft/hr/psf. We will assume that the critical shear stress for this material is 0 psf. Applying the equations describing the model for headcut advance caused by flow through the pipe (muskrat hole), the initial flow through the pipe is 32 GPM, and the time needed for breach initiation is 34 minutes. For comparison, a scenario in which the canal is misoperated so that the banks are overtopped by 3 inches yields a breach initiation time of 33 min. If we return to the piping scenario and the initial pipe is raised 1 ft higher in the embankment, the breach initiation time increases to 38 min; if lowered by 1 ft the time reduces to 33 min, so the result is relatively insensitive to the initial pipe elevation.
The breach widening phase of the process is analyzed next. The breach widening rate is estimated to be 181 ft/hr, using Eq. 9. The maximum breach width needed to release the theoretical peak outflow previously calculated is only 55 ft, so the time needed for breach widening is only 18.4 min.
To predict the peak outflow from the breach, we must select a location for the breach. We consider two possible locations, one at the end of the reach (Lds=5 ft; L*ds=1), and the second located 1 mile upstream from the end of the reach (L*ds≈1000). Applying Eqs. 11-12 we obtain a peak outflow of 1050 ft3/s at the downstream site and 1910 ft3/s at the upstream site.
To test the sensitivity of the results to the soil erodibility parameters, let us revisit Table 1 and assume that the embankments were compacted dry of optimum. This changes the
estimated value of kd to 800 cm3/(N-s), or 452 ft/hr/psf. Assuming again that the piping failure initiates at 3.71 ft below the embankment crest, the breach initiation time is now
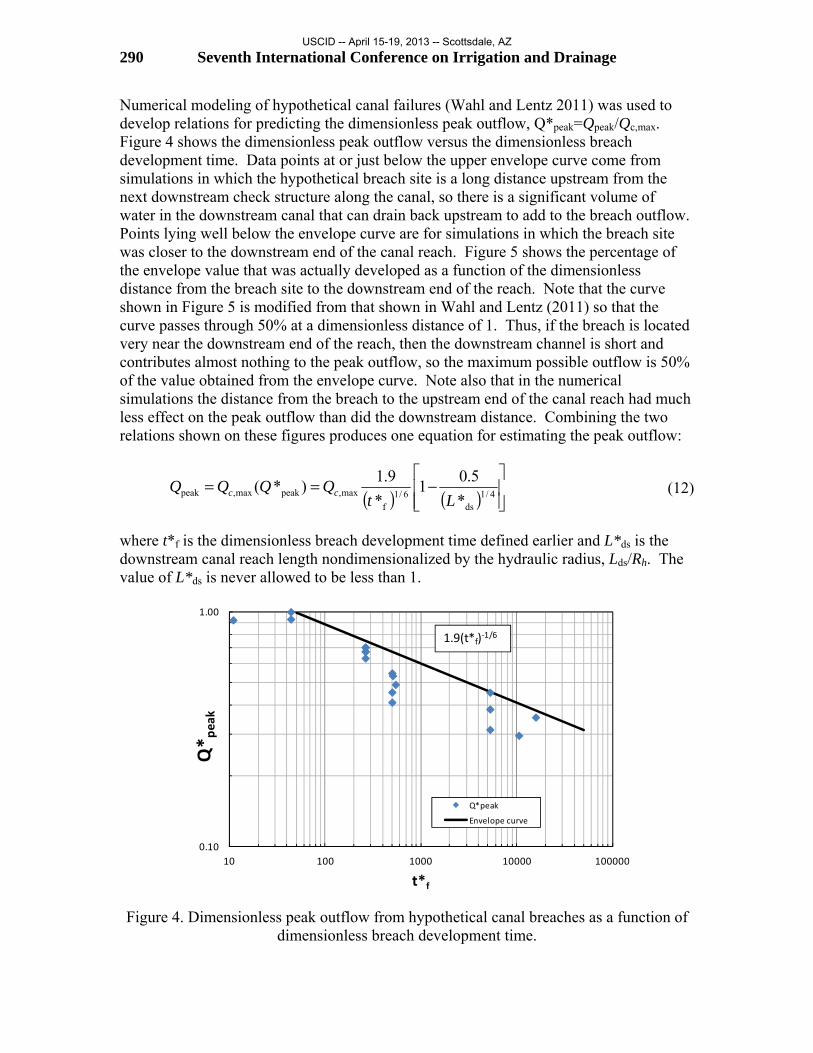
reduced to 8.5 min and the breach widening time is only 4.6 min. The peak outflow for a breach at the downstream end of the reach is increased to 1320 ft3/s and the peak outflow for a breach 1 mile upstream is 2410 ft3/s. Figure 7 shows a predicted breach hydrograph for this latter case. The figure includes a plot of the estimated product of flow depth and
velocity (DV) at the breach opening. This parameter can be useful for assessing the lethality of the flood and its potential to cause property damage, although if the flood is able to spread rapidly downstream from the breach, the DV values will drop accordingly
and the potential for damage will diminish. A one or two-dimensional flood routing simulation may be needed to predict inundation depths and flooding severity at a distance
from the breach site.
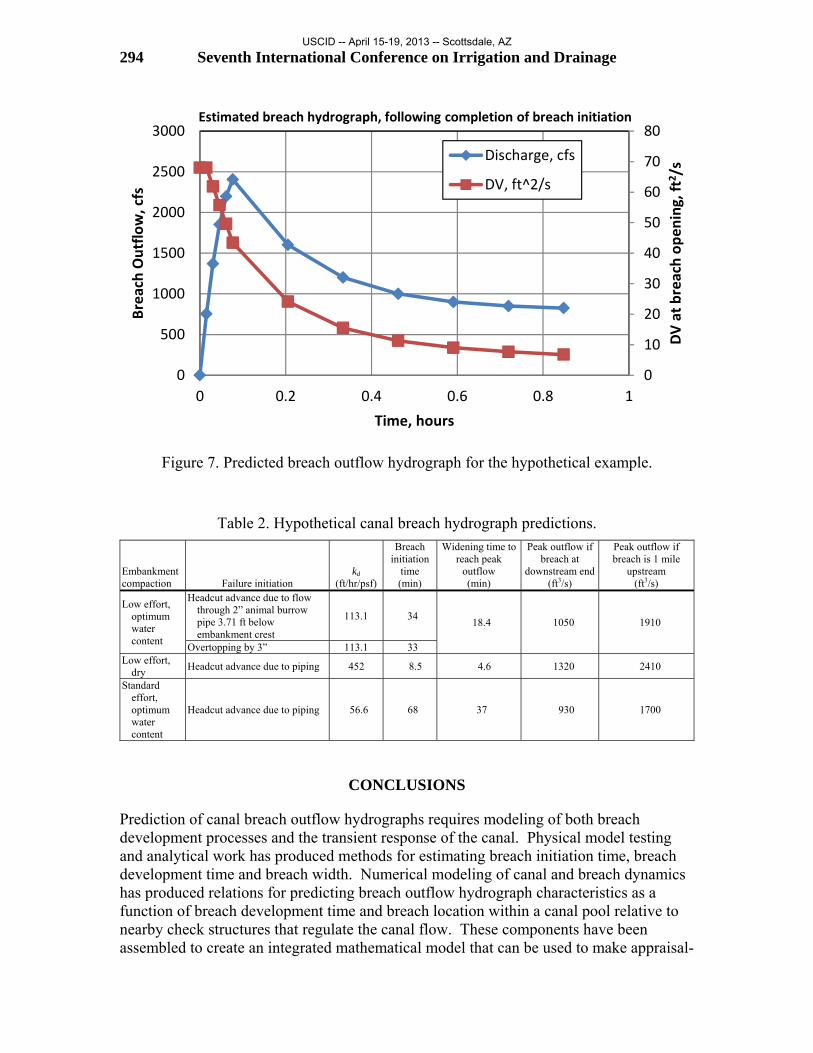
Table 2 summarizes results for the scenarios discussed above, and one other involving an assumption that the embankment was constructed with standard compaction effort near optimum water content.
USCID -- April 15-19, 2013 -- Scottsdale, AZ
294 Seventh International Conference on Irrigation and Drainage
Figure 7. Predicted breach outflow hydrograph for the hypothetical example.
Table 2. Hypothetical canal breach hydrograph predictions.
Embankment compaction Failure initiation
kd (ft/hr/psf)
Breach initiation
time (min)
Widening time to reach peak
outflow (min)
Peak outflow if breach at
downstream end (ft3/s)
Peak outflow if breach is 1 mile
upstream (ft3/s)
Low effort, optimum water content
Headcut advance due to flow through 2” animal burrow pipe 3.71 ft below embankment crest
113.1 34 18.4 1050 1910
Overtopping by 3” 113.1 33 Low effort,
dry Headcut advance due to piping 452 8.5 4.6 1320 2410
Standard effort, optimum water content
Headcut advance due to piping 56.6 68 37 930 1700
CONCLUSIONS
Prediction of canal breach outflow hydrographs requires modeling of both breach development processes and the transient response of the canal. Physical model testing and analytical work has produced methods for estimating breach initiation time, breach development time and breach width. Numerical modeling of canal and breach dynamics has produced relations for predicting breach outflow hydrograph characteristics as a function of breach development time and breach location within a canal pool relative to nearby check structures that regulate the canal flow. These components have been assembled to create an integrated mathematical model that can be used to make appraisal-
0
10
20
30
40
50
60
70
80
0
500
1000
1500
2000
2500
3000
0 0.2 0.4 0.6 0.8 1
DV a
t bre
ach
open
ing,
ft2 /
s
Brea
ch O
utflo
w, c
fs
Time, hours
Estimated breach hydrograph, following completion of breach initiation
Discharge, cfs
DV, ft^2/s
USCID -- April 15-19, 2013 -- Scottsdale, AZ
Tools for Estimating Canal-Breach Flood Hydrographs 295
level estimates of canal breach outflow hydrographs as a function of canal hydraulic properties and embankment material properties. The method has not yet been tested against real-world canal failures.
REFERENCES
ASTM, 2003. Annual Book of ASTM Standards, Section 4: Construction, Vol. 04.08. Philadelphia, Pa.: ASTM.
Dun, R.W.A., 2007. An improved understanding of canal hydraulics and flood risk from breach failures. Water and Environment Journal. 21(1): 9-18.
Engemoen, W. 2012. Reclamation’s processes for evaluating potential internal erosion concerns in embankment dams. 6th International Conference on Scour and Erosion, August 27-31, 2012, Paris, France.
Hanson, G.J., and K.R. Cook, 2004. Apparatus, test procedures, and analytical methods to measure soil erodibility in situ. Applied Engineering in Agriculture, 20(4):455-462.
Hanson, G.J., D.M. Temple, S.L. Hunt, and R.D. Tejral, 2011. Development and characterization of soil material parameters for embankment breach. Applied Engineering in Agriculture, 27(4):587-595.
Temple, D.M., G.J. Hanson, M.L. Neilsen, and K.R. Cook. 2005. Simplified breach analysis for homogeneous embankments: Part 1. Background and model components. In Technologies to Enhance Dam Safety and the Environment, Proceedings of the Annual Meeting of the United States Society on Dams, Denver, Colorado, 151‐161.
Von Thun, J.L., 1996. Understanding piping and seepage failures - the no. 1 dam safety problem in the west. ASDSO West Regional Conference, April 14-16, 1996, Lake Tahoe, NV.
Wahl, T.L. and D.J. Lentz, 2011. Physical hydraulic modeling of canal breaches, Hydraulic Laboratory Report HL-2011-09, U.S. Dept. of the Interior, Bureau of Reclamation, Denver, CO.
Wahl, T.L., 2012. Numerical modeling to predict canal breach outflow hydrographs. 2012 World Environmental and Water Resources Congress, Environmental and Water Resources Institute of the American Society of Civil Engineers, Albuquerque, NM, May 20-24, 2012.
USCID -- April 15-19, 2013 -- Scottsdale, AZ
Related Documents