Welcome message from author
This document is posted to help you gain knowledge. Please leave a comment to let me know what you think about it! Share it to your friends and learn new things together.
Transcript


Microplastics indrinking-water

Microplastics in drinking-water
ISBN 978-92-4-151619-8
© World Health Organization 2019
Some rights reserved. This work is available under the Creative Commons Attribution-NonCommercial-ShareAlike 3.0 IGO licence (CC BY-NC-SA 3.0 IGO; https://creativecommons.org/licenses/by-nc-sa/3.0/igo).
Under the terms of this licence, you may copy, redistribute and adapt the work for non-commercial purposes, provided the work is appropriately cited, as indicated below. In any use of this work, there should be no suggestion that WHO endorses any specific organization, products or services. The use of the WHO logo is not permitted. If you adapt the work, then you must license your work under the same or equivalent Creative Commons licence. If you create a translation of this work, you should add the following disclaimer along with the suggested citation: “This translation was not created by the World Health Organization (WHO). WHO is not responsible for the content or accuracy of this translation. The original English edition shall be the binding and authentic edition”.
Any mediation relating to disputes arising under the licence shall be conducted in accordance with the mediation rules of the World Intellectual Property Organization.
Suggested citation. Microplastics in drinking-water. Geneva: World Health Organization; 2019. Licence: CC BY-NC-SA 3.0 IGO.
Cataloguing-in-Publication (CIP) data. CIP data are available at http://apps.who.int/iris.
Sales, rights and licensing. To purchase WHO publications, see http://apps.who.int/bookorders. To submit requests for commercial use and queries on rights and licensing, see http://www.who.int/about/licensing.
Third-party materials. If you wish to reuse material from this work that is attributed to a third party, such as tables, figures or images, it is your responsibility to determine whether permission is needed for that reuse and to obtain permission from the copyright holder. The risk of claims resulting from infringement of any third-party-owned component in the work rests solely with the user.
General disclaimers. The designations employed and the presentation of the material in this publication do not imply the expression of any opinion whatsoever on the part of WHO concerning the legal status of any country, territory, city or area or of its authorities, or concerning the delimitation of its frontiers or boundaries. Dotted and dashed lines on maps represent approximate border lines for which there may not yet be full agreement. The mention of specific companies or of certain manufacturers’ products does not imply that they are endorsed or recommended by WHO in preference to others of a similar nature that are not mentioned. Errors and omissions excepted, the names of proprietary products are distinguished by initial capital letters.
All reasonable precautions have been taken by WHO to verify the information contained in this publication. However, the published material is being distributed without warranty of any kind, either expressed or implied. The responsibility for the interpretation and use of the material lies with the reader. In no event shall WHO be liable for damages arising from its use.
Design and layout by L’IV Com Sàrl
Printed in Switzerland

ContentsExecutive summary . . . . . . . . . . . . . . . . . . . . . . . . . . . . . . . . . . . . . . . . . . . . vii
Acknowledgements . . . . . . . . . . . . . . . . . . . . . . . . . . . . . . . . . . . . . . . . . . . . xiv
Acronyms and abbreviations . . . . . . . . . . . . . . . . . . . . . . . . . . . . . . . . . . . . xvii
1 Introduction . . . . . . . . . . . . . . . . . . . . . . . . . . . . . . . . . . . . . . . . . . . . . . . 11.1 Purpose of this report . . . . . . . . . . . . . . . . . . . . . . . . . . . . . . . . . . . . . 11.2 Scope of this report . . . . . . . . . . . . . . . . . . . . . . . . . . . . . . . . . . . . . . . 11.3 Background . . . . . . . . . . . . . . . . . . . . . . . . . . . . . . . . . . . . . . . . . . . . . 21.4 Overview of contents . . . . . . . . . . . . . . . . . . . . . . . . . . . . . . . . . . . . . . 6
2 Occurrence of microplastics in fresh water and drinking-water . . . . . . . . 82.1 Introduction . . . . . . . . . . . . . . . . . . . . . . . . . . . . . . . . . . . . . . . . . . . . . 82.2 Sources and transport of microplastics into water . . . . . . . . . . . . . . . . . 82.3 General principles of sampling and analysis . . . . . . . . . . . . . . . . . . . . . . 122.4 Overall reliability of studies . . . . . . . . . . . . . . . . . . . . . . . . . . . . . . . . 142.5 Microplastic concentrations reported in fresh water . . . . . . . . . . . . . . 162.6 Microplastic concentrations reported in drinking-water . . . . . . . . . . . . 172.7 Particle size, shape and polymer type in fresh water
and drinking-water . . . . . . . . . . . . . . . . . . . . . . . . . . . . . . . . . . . . . . . 202.8 Other routes of exposure . . . . . . . . . . . . . . . . . . . . . . . . . . . . . . . . . . 202.9 Conclusions and research needs . . . . . . . . . . . . . . . . . . . . . . . . . . . . . 24
3 Possible human health risks associated with microplastics in drinking-water: particles and chemicals . . . . . . . . . . . . . . . . . . . . . . . . . 263.1 Introduction . . . . . . . . . . . . . . . . . . . . . . . . . . . . . . . . . . . . . . . . . . . . 263.2 Potential hazards associated with particles . . . . . . . . . . . . . . . . . . . . . . 273.3 Potential hazards associated with monomers, additives and sorbed
chemicals . . . . . . . . . . . . . . . . . . . . . . . . . . . . . . . . . . . . . . . . . . . . . . 313.4 Assessing possible risks from microplastics . . . . . . . . . . . . . . . . . . . . . 343.5 Conclusions and research needs . . . . . . . . . . . . . . . . . . . . . . . . . . . . . 42
4 Possible human health risks associated with microplastics in drinking-water: biofilms . . . . . . . . . . . . . . . . . . . . . . . . . . . . . . . . . . . 444.1 Introduction . . . . . . . . . . . . . . . . . . . . . . . . . . . . . . . . . . . . . . . . . . . . 444.2 Characteristicsofplasticsandmicroorganismsthatinfluencebiofilm
formation . . . . . . . . . . . . . . . . . . . . . . . . . . . . . . . . . . . . . . . . . . . . . . 444.3 Potentialconcernsassociatedwithmicroplastic-associatedbiofilms
in water . . . . . . . . . . . . . . . . . . . . . . . . . . . . . . . . . . . . . . . . . . . . . . . 45
Contents iii

4.4 Distributionandriskofmicroplastic-associatedbiofilmsin drinking-water . . . . . . . . . . . . . . . . . . . . . . . . . . . . . . . . . . . . . . . . . . 46
4.5 Conclusions and research needs . . . . . . . . . . . . . . . . . . . . . . . . . . . . . 48
5 Treatment technologies for removing microplastics from water . . . . . . 505.1 Introduction . . . . . . . . . . . . . . . . . . . . . . . . . . . . . . . . . . . . . . . . . . . . 505.2 Wastewater treatment . . . . . . . . . . . . . . . . . . . . . . . . . . . . . . . . . . . . 515.3 Drinking-water treatment . . . . . . . . . . . . . . . . . . . . . . . . . . . . . . . . . . 545.4 Considerations for drinking-water and wastewater treatment sludge . . 585.5 Conclusions and research needs . . . . . . . . . . . . . . . . . . . . . . . . . . . . . 59
6 Managing plastic and microplastic pollution in the environment . . . . . . 616.1 Benefitsofmanagingplasticandmicroplasticpollution . . . . . . . . . . . . . 616.2 Responses to growing concern over plastic pollution . . . . . . . . . . . . . 616.3 Options to curb plastic and microplastic pollution . . . . . . . . . . . . . . . . 62
7 Conclusions, recommendations and knowledge gaps . . . . . . . . . . . . . . . 647.1 Conclusions . . . . . . . . . . . . . . . . . . . . . . . . . . . . . . . . . . . . . . . . . . . . 647.2 Recommendations . . . . . . . . . . . . . . . . . . . . . . . . . . . . . . . . . . . . . . . 687.3 Knowledge gaps and research needs . . . . . . . . . . . . . . . . . . . . . . . . . . 69
References . . . . . . . . . . . . . . . . . . . . . . . . . . . . . . . . . . . . . . . . . . . . . . . . . . . 71
Annex 1: Systematic review and other studies of microplastics in fresh water and drinking-water . . . . . . . . . . . . . . . . . . . . . . . . . . . . . . . . . 88
A.1 Overview of systematic review . . . . . . . . . . . . . . . . . . . . . . . . . . . . . . 88A.2 Systematic review methods . . . . . . . . . . . . . . . . . . . . . . . . . . . . . . . . . 88A.3 Overview of systematic review results . . . . . . . . . . . . . . . . . . . . . . . . . 91A.4 Summary of drinking-water studies . . . . . . . . . . . . . . . . . . . . . . . . . . . 96A.5 References . . . . . . . . . . . . . . . . . . . . . . . . . . . . . . . . . . . . . . . . . . . . 100
Figures1.1 Global plastic production . . . . . . . . . . . . . . . . . . . . . . . . . . . . . . . . . . . . . . 51.2 Totalnon-fibreplasticproductioninEurope . . . . . . . . . . . . . . . . . . . . . . . . 52.1 Examplesofroutesbywhichplasticsandmicroplasticsenter
and move in the freshwater environment and how microplastics may reach drinking-water . . . . . . . . . . . . . . . . . . . . . . . . . . . . . . . . . . . . . 12
Tables2.1 Polymer densities . . . . . . . . . . . . . . . . . . . . . . . . . . . . . . . . . . . . . . . . . . . . 92.2 Summary of reported microplastic particle numbers from freshwater
studies that scored highest for quality . . . . . . . . . . . . . . . . . . . . . . . . . . . . 162.3 Summary of reported microplastic or microplastic-like particle numbers
and particle characteristics from drinking-water studies . . . . . . . . . . . . . . . 18
iv Microplastics in drinking-water

3.1 Exposureassumptionstoassessmicroplasticintakeindrinking-water, along with rationale and associated level of conservatism . . . . . . . . . . . . . . 37
3.2 Additional exposure assumptions to assess chemicals associated with microplastics in drinking-water, along with rationale and associated level of conservatism . . . . . . . . . . . . . . . . . . . . . . . . . . . . . . . . . . . . . . . . . 38
3.3 Upper-bound daily intake estimates of chemicals from microplastics, maximum levels of contaminants associated with microplastics, and correspondingMOE . . . . . . . . . . . . . . . . . . . . . . . . . . . . . . . . . . . . . . . . . 40
5.1 Summary of microplastic removal reported from wastewater treatment studies . . . . . . . . . . . . . . . . . . . . . . . . . . . . . . . . . . . . . . . . . . . 53
7.1 Summary of key hazards associated with microplastics in drinking-water and estimated health risk . . . . . . . . . . . . . . . . . . . . . . . . . . . . . . . . . . . . . . 66
A.1 Overview of individual and accumulated scores from studies reporting microplastic concentrations in drinking-water, fresh water and wastewater . . . . . . . . . . . . . . . . . . . . . . . . . . . . . . . . . . . . . . . . . . . . . . . . 92
Boxes1.1 The risk of microplastics to aquatic ecosystems . . . . . . . . . . . . . . . . . . . . . . 12.1 Lack of sewage treatment: the bigger problem? . . . . . . . . . . . . . . . . . . . . . 102.2 Recommendations to improve sampling and analytical methods . . . . . . . . . 152.3 Interpretation and comparison of occurrence studies . . . . . . . . . . . . . . . . . 173.1 Risk is a function of toxicity and exposure . . . . . . . . . . . . . . . . . . . . . . . . . 265.1 Data limitations . . . . . . . . . . . . . . . . . . . . . . . . . . . . . . . . . . . . . . . . . . . . 50
Contents v

Executive summary vii
Executive summary
Background
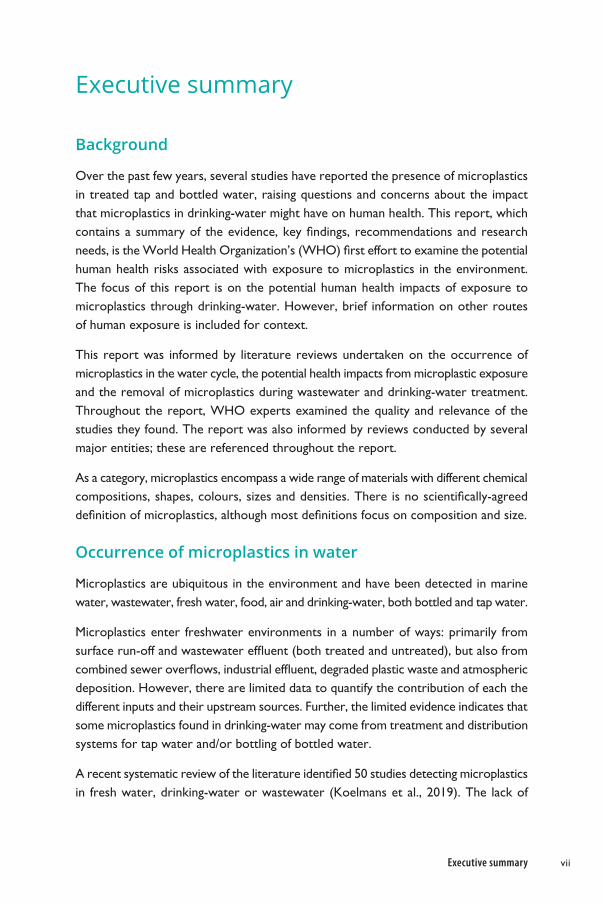
Over the past few years, several studies have reported the presence of microplastics in treated tap and bottled water, raising questions and concerns about the impact that microplastics in drinking-water might have on human health. This report, which containsasummaryof theevidence,keyfindings,recommendationsandresearchneeds,istheWorldHealthOrganization’s(WHO)firstefforttoexaminethepotentialhuman health risks associated with exposure to microplastics in the environment. The focus of this report is on the potential human health impacts of exposure to microplastics through drinking-water. However, brief information on other routes of human exposure is included for context.
This report was informed by literature reviews undertaken on the occurrence of microplastics in the water cycle, the potential health impacts from microplastic exposure and the removal of microplastics during wastewater and drinking-water treatment. Throughout the report, WHO experts examined the quality and relevance of the studies they found. The report was also informed by reviews conducted by several major entities; these are referenced throughout the report.
As a category, microplastics encompass a wide range of materials with different chemical compositions,shapes,colours,sizesanddensities.Thereisnoscientifically-agreeddefinitionofmicroplastics,althoughmostdefinitionsfocusoncompositionandsize.
Occurrence of microplastics in water
Microplastics are ubiquitous in the environment and have been detected in marine water, wastewater, fresh water, food, air and drinking-water, both bottled and tap water.
Microplastics enter freshwater environments in a number of ways: primarily from surfacerun-offandwastewatereffluent(bothtreatedanduntreated),butalsofromcombinedseweroverflows,industrialeffluent,degradedplasticwasteandatmosphericdeposition. However, there are limited data to quantify the contribution of each the different inputs and their upstream sources. Further, the limited evidence indicates that some microplastics found in drinking-water may come from treatment and distribution systems for tap water and/or bottling of bottled water.
Arecentsystematicreviewoftheliteratureidentified50studiesdetectingmicroplasticsin fresh water, drinking-water or wastewater (Koelmans et al., 2019). The lack of
viii Microplastics in drinking-water
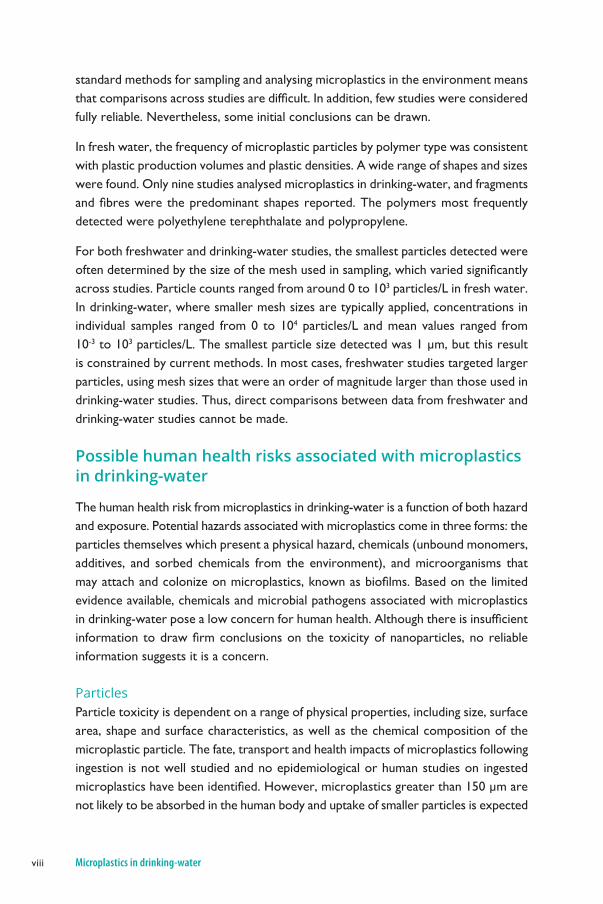
standard methods for sampling and analysing microplastics in the environment means thatcomparisonsacrossstudiesaredifficult.Inaddition,fewstudieswereconsideredfully reliable. Nevertheless, some initial conclusions can be drawn.
In fresh water, the frequency of microplastic particles by polymer type was consistent with plastic production volumes and plastic densities. A wide range of shapes and sizes were found. Only nine studies analysed microplastics in drinking-water, and fragments andfibreswerethepredominantshapesreported.Thepolymersmost frequentlydetected were polyethylene terephthalate and polypropylene.
For both freshwater and drinking-water studies, the smallest particles detected were oftendeterminedbythesizeofthemeshusedinsampling,whichvariedsignificantlyacross studies. Particle counts ranged from around 0 to 103 particles/L in fresh water. In drinking-water, where smaller mesh sizes are typically applied, concentrations in individual samples ranged from 0 to 104 particles/L and mean values ranged from 10-3 to 103 particles/L. The smallest particle size detected was 1 µm, but this result is constrained by current methods. In most cases, freshwater studies targeted larger particles, using mesh sizes that were an order of magnitude larger than those used in drinking-water studies. Thus, direct comparisons between data from freshwater and drinking-water studies cannot be made.
Possible human health risks associated with microplastics in drinking-water
The human health risk from microplastics in drinking-water is a function of both hazard and exposure. Potential hazards associated with microplastics come in three forms: the particles themselves which present a physical hazard, chemicals (unbound monomers, additives, and sorbed chemicals from the environment), and microorganisms that mayattachandcolonizeonmicroplastics,knownasbiofilms.Basedonthelimitedevidence available, chemicals and microbial pathogens associated with microplastics indrinking-waterposealowconcernforhumanhealth.Althoughthereisinsufficientinformation todrawfirmconclusionsonthe toxicityofnanoparticles,noreliableinformation suggests it is a concern.
ParticlesParticle toxicity is dependent on a range of physical properties, including size, surface area, shape and surface characteristics, as well as the chemical composition of the microplastic particle. The fate, transport and health impacts of microplastics following ingestion is not well studied and no epidemiological or human studies on ingested microplasticshavebeenidentified.However,microplasticsgreaterthan150µmarenot likely to be absorbed in the human body and uptake of smaller particles is expected

Executive summary ix
to be limited. Absorption and distribution of very small microplastic particles including nanoplasticsmaybehigher,howeverthedatabaseisextremelylimitedandfindingsdemonstrating uptake in animal studies occurred under extremely high exposures that would not occur in drinking-water. The limited number of toxicology studies in rats and mice on ingested microplastics are of questionable reliability and relevance, with some impacts observed only at very high concentrations that would overwhelm biologicalclearancemechanismsandthatthereforedonotaccuratelyreflectpotentialtoxicities that could occur at lower levels of exposure. Based on this limited body ofevidence,firmconclusionsontheriskassociatedwith ingestionofmicroplasticparticles through drinking-water cannot yet be determined; however at this point, no data suggests overt health concerns associated with exposure to microplastic particles through drinking-water.
Chemicals Polymerization reactions during plastic production do not generally proceed to full completion, resulting in a small proportion of monomers such as 1,3-butadiene, ethylene oxide and vinyl chloride, that can leach into the environment. Residual monomers may also arise as a result of biodegradation and weathering of plastics. However, the extent to which this occurs is uncertain. It is likely that unbound monomers resulting from these scenarios would leach into the environment, resulting in extremely small concentrations in drinking-water sources.
Additives such as phthalate plasticizers and polybrominated diphenyl ether flameretardants are, for the most part, not covalently bound to the polymer and can more easily migrate into the environment. Migration can also be impacted by the molecular weight of additives, with small, low molecular weight molecules generally migrating at a faster rate than larger additives. Aging and weathering are likely to strongly influencemigration,theoverallimpactofwhichisnotwellunderstood.However,relative to other emission routes of additives to the environment, it is anticipated that leaching from microplastic will be relatively small. If microplastics are ingested through drinking-water, the relative potential for the additives to leach from microplastics in the gastrointestinaltractisalsopoorlyunderstood,withconflictinginformationreportedinthe limited number of available studies. It should be noted, however, that following the introduction of regulations limiting the use of many additives-of-concern from plastics, exposure is expected to become lower over time, although these substances can be present in older plastics which may degrade into microplastics in the environment.
The hydrophobic nature of microplastic implies that they have the potential to accumulate hydrophobic persistent organic pollutants (POPs), such as polychlorinated biphenyls, polycyclic aromatic hydrocarbons and organochlorine pesticides. POPs indiscriminately sorb to organic carbon in the environment and therefore, the fraction of POPs sorbed

x Microplastics in drinking-water
to microplastics will be small relative to other environmental media such as sediment, algae and the lipid fraction of aquatic organisms. If microplastics are ingested through drinking-water, the relative potential for POPs to leach from microplastics is not well understood and will depend on a variety of factors, including the relative size of the particle, mass of chemical accumulated, relative level of contamination within the gut, and the gastrointestinal residence time of the particle.
To assess potential health risks associated with exposure to chemicals associated with microplastics, WHO developed a conservative exposure scenario, assuming high exposure to microplastics combined with high exposure to chemicals and applied a marginof exposure (MOE) approach.Chemicals included in the assessmenthavebeen detected in microplastics, are of toxicological concern and have adequate or acceptedtoxicologicalpointofdeparturestoderiveaMOE.MOEswerederivedforeach chemical by comparing the estimated chemical exposure for a very conservative exposure scenario to a level of exposure at which no or limited adverse effects were seen.AjudgementofsafetycouldthenbebasedonthemagnitudeofthisMOE.MOEsderived from the risk assessment were found to be adequately protective, indicating a low health concern for human exposure to chemicals through ingestion of drinking-water, even in extreme exposure circumstances.
Biofilms Biofilmsindrinking-waterareformedwhenmicroorganismsgrowondrinking-waterpipesandothersurfaces.Althoughmostmicroorganismsinbiofilmsarebelievedtobenon-pathogenic,somebiofilmscanincludefree-livingmicroorganismsandpathogenssuch as Pseudomonas aeruginosa, Legionella spp., and Naegleria fowleri.Biofilm-formingmicroorganisms attach faster to hydrophobic nonpolar surfaces, such as plastics, than to hydrophilic surfaces. Environmental conditions can also influence biofilmformation on plastics and microplastics. A limited number of occurrence studies in fresh water indicate the possibility that microplastics could enable the long-distance transport of pathogens and increase the transfer of antimicrobial resistant genes between microorganisms. However, there is no evidence to suggest a human health riskfrommicroplastic-associatedbiofilmsindrinking-water.Theriskisconsideredfarlower than the well-established risk posed by the high concentrations and diversity of pathogens in human and livestock waste in drinking-water sources. Further, the relative concentrationofmicroplasticsinfreshwaterissignificantlylowerthanotherparticlesthat pathogens can adhere to in fresh water. For microplastics that are not removed duringdrinking-watertreatment,therelativesignificanceofmicroplastic-associatedbiofilmsisstilllikelynegligibleduetothemuchlargersurfaceareaofdrinking-waterdistributionsystemsandtheirsubsequentabilitytosupportmorebiofilms,comparedto microplastics.

Executive summary xi
Treatment technologies for removing microplastics from water
Wastewater and drinking-water treatment systems—where they exist—are considered highly effective in removing particles with characteristics similar to those of microplastics. Properties relevant to removal in water treatment include size, density and surface charge. According to available data, wastewater treatment can effectively remove more than 90% of microplastics from wastewater, with the highest removals from tertiarytreatmentsuchasfiltration.Althoughthereareonlylimiteddataavailableontheefficacyofmicroplasticremovalduringdrinking-watertreatment,suchtreatmenthas proven effective in removing far more particles of smaller size and at far higher concentrations than those of microplastics. Conventional treatment, when optimized to produce treated water of low turbidity, can remove particles smaller than a micrometre throughprocessesofcoagulation,flocculation,sedimentation/flotationandfiltration.Advancedtreatmentcanremovesmallerparticles.Forexample,nanofiltrationcanremove particles >0.001 µmwhile ultrafiltration can remove particles >0.01µm.These facts combined with well-understood removal mechanisms point to the rational conclusion that water treatment processes can effectively remove microplastics.
An important consideration is that wastewater and drinking-water treatment is not available nor optimized in many countries. Approximately 67% of the population in low- and middle-income countries lack access to sewage connections and about 20% of household wastewater collected in sewers does not undergo at least secondary treatment(UNICEF/WHO,2019).Intheseplaces,microplasticsmayexistingreaterconcentrations in freshwater sources of drinking-water; however, the health risks associated with exposure to pathogens present in untreated or inadequately treated water will be far greater. By addressing the bigger problem of exposure to untreated water, communities can simultaneously address the smaller concern related to microplastics in surface water and other drinking-water supplies.
Another factor to consider is how treatment waste is handled. Plastics are not usually destroyed, but rather transferred from one phase to another. For this reason, water treatment waste needs to be considered as a potential source of microplastics contamination in the environment. There are currently limited data available on how treatment wastes are handled and the impact they may have on the environment.
Managing plastic and microplastic pollution in the environment
Irrespective of whether there are any risks to human health from ingestion of microplastics in drinking-water, there is a need to improve management of plastics

xii Microplastics in drinking-water
and reduce plastic pollution to protect the environment and human well-being. Poorly managed plastic can contribute to sanitation-related risks and air pollution, and impact tourism and overall quality of life. If plastic emissions into the environment continue at current rates, there may be widespread risks associated with microplastics to aquatic ecosystemswithinacentury(SAPEA,2019),withpotentiallyconcurrentincreasesin human exposure.
In response to concerns about the impact of plastic and microplastic pollution, public engagement and political commitment has increased. More than 60 countries are alreadytaxingorbanningsingle-useplastics,primarilyplasticbags(UNEP,2018).
Strategies to reduce the number of plastics released into the environment are critical to the effort to minimize adverse impacts of discarded plastics. Where simple, low cost actions can be taken to make even a small difference to plastic inputs to the environment, it would be sensible to implement them. Actions could include improving recycling programmes, reducing littering, improving circular solutions, reducing the use of plastics where possible and decreasing waste inputs into the environment by industry. Care must be taken, however, when considering mitigation strategies so that addressing one problem does not simply result in the creation of a new one. This is particularly important in view of the limited data on sources of different sizes and types of microplastics, including the very small particles that are currently not well quantified.Thebenefitsofplasticmustalsobeconsideredbeforeintroducingpoliciesand initiatives. For example, single-use syringes play an important role in preventing infections. Priority management actions should be “no regrets,” in that they confer multiplebenefitsand/orthattheyarecost-effective.
Recommendations
Routine monitoring of microplastics in drinking-water is not recommended at this time, as there is no evidence to indicate a human health concern. Concerns over microplastics in drinking-water should not divert resources of water suppliers and regulatorsfromremovingmicrobialpathogens,whichremainsthemostsignificantrisk to human health from drinking-water along with other chemical priorities. As part of water safety planning, water suppliers should ensure that control measures are effective and should optimize water treatment processes for particle removal and microbial safety, which will incidentally improve the removal of microplastic particles.
However, for researchers, it would be appropriate to undertake targeted, well-designed and quality-controlled investigative studies to better understand the sources andoccurrenceofmicroplastics in freshwateranddrinking-water, theefficacyofdifferent treatmentprocessesandcombinationsofprocesses,andthesignificance

Executive summary xiii
of the potential return of microplastics to the environment from treatment waste streams including the application of sludge biosolids to agricultural land.
Measures should also be taken to better manage plastics and reduce the use of plastics where possible, to minimize plastic and microplastic pollution despite the low human health risk posed by exposure to microplastics in drinking-water, as such actions can conferotherbenefitstotheenvironmentandhumanwell-being.
Research needs
To better assess human health risks and inform management actions, a number of researchgapsneedtobefilled.Withrespecttoexposure,thereisaneedtobetterunderstand microplastics occurrence throughout the water supply chain, using quality-assured methods to determine the numbers, shapes, sizes, composition and sources of microplastics and to better characterize the effectiveness of water treatment. Researchisalsoneededtobetterunderstandthesignificanceoftreatment-relatedwaste streams as contributors of microplastics to the environment.
With respect to potential health effects, quality-assured toxicological data are needed on the most common forms of plastic particles relevant for human health risk assessment. Further, a better understanding on the uptake and fate of microplastics and nanoplastics following ingestion is needed.
Finally, given that humans can be exposed to microplastics through a variety of environmental media, including food and air, a better understanding of overall exposure to microplastics from the broader environment is needed.

xiv Microplastics in drinking-water
Acknowledgements
The World Health Organization (WHO) wishes to express its appreciation to all those who contributed to the preparation and development of this report, including the colleagues named below.
This report is the product of several expert meetings held between 2018 and 2019, beginning with the WHO Guidelines for Drinking-water Quality (GDWQ) chemical working group, which established the need for such a report. Consultations were held in July 2018 in Singapore and April 2019 in Switzerland with the GDWQ chemical workinggroupaswellasmicroplasticsexpertstoreviewkeyfindings.Thereportwasalso informed by a teleconference held in January 2019 to discuss key sections of the report and a writing meeting with a few of the authors, convened in February 2019.
Literature reviews were undertaken for the sections on health effects and treatment. The information on occurrence was based on a systematic review (Koelmans et al., 2019) that WHO commissioned on occurrence of microplastics in drinking-water, fresh water and wastewater and quality of these studies. The report has also been informed by reviews from several major bodies and these are referenced throughout the report.
– Nick Ashbolt, University of Alberta, Canada
– Virunya Bhat, WHO Collaborating Centre, NSF
International, USA
– Richard Brown, WHO, Switzerland
– ClausGerhard Bannick,German Environment
Agency, Germany
– Ruth Bevan, Independent Consultant, UK
– Allen Burton, University of Michigan, USA
– Enrique Calderon, Buenos Aires University,
Argentina
– Richard Carrier, Health Canada, Canada
– Joseph Cotruvo, Joseph Cotruvo & Associates, USA
– Ana Maria de Roda Husman, National Institute of
PublicHealthandtheEnvironment,Netherlands
Expertswhoprovidedinsights,wrotetext,offeredpeerreview,and/orparticipatedin meetings:
– Pete Marsden, Drinking Water Inspectorate, UK
– Bart Koelmans, Wageningen University, Netherlands
– Julie Bourdon-Lacombe, Health Canada, Canada
– Todd Gouin, Independent Consultant, UK
– LesleyD’Anglada,USEnvironmentalProtectionAgency,USA
– David Cunliffe, South Australia Health, Australia
– PeterJarvis,CranfieldUniversity,UK
– JohnFawell,CranfieldUniversity,UK
– Jennifer De France, WHO, Switzerland
Lead authors:
Acknowledgements xv
– AlexanderEckhardt,GermanEnvironmentAgency,
Germany
– Gunnard Gerdts, Alfred Wegener Institute, Germany
– Bruce Gordon, WHO Switzerland
– FrancisHassard,CranfieldUniversity,UK
– Andrew Humpage, Independent Consultant,
Australia
– PaulHunter,UniversityofEastAnglia,UK
– Pranav Joshi, Singapore Food Agency, Singapore
– Christine Lemieux, Health Canada, Canada
– Stéphanie McFadyen, Health Canada, Canada
– Rory McKeown, WHO, Switzerland
– Kate Medlicott, WHO Switzerland
– Gertjan Medema, KWR Water Research Institute
and Delft University of Technology, Netherlands
– Choon Nam Ong, National University of Singapore,
Singapore
– Angella Rinehold, WHO, Switzerland
– William Robertson, Watermicrobe Consultancy,
Canada
The authors of the WHO-commissioned systematic review on occurrence of microplastics in fresh water and drinking-water are also acknowledged. They are Bart Koelmans,NurHazimahMohamedNor,EnyaHermsen,MerelKooi,SvenjaMintenigand Jennifer De France.
The development and production of this document was coordinated and managed by Jennifer De France of WHO. Bruce Gordon and Maria Neira (both WHO) provided strategic direction. Heidi Lasher, USA, edited the report.
WHOalso gratefully acknowledges the financial support provided by the FederalMinistry of Health, Germany; the Ministry of Foreign Affairs, Norway and the Public Utilities Board, the National Water Agency, a statutory board under the Ministry of EnvironmentandWaterResources,Singapore.
– Chelsea Rochman, University of Toronto, Canada
– Lisa Scheuermann, WHO, Switzerland
– Mark Sobsey, University of North Carolina at
Chapel Hill, USA
– Shuhei Tanaka, Kyoto University, Japan
– EmanuelaTestai,IstitutoSuperiorediSanità,Italy
– Richard Thompson, University of Plymouth, UK
– Angelika Tritscher, formerly WHO, Switzerland
– Rhodes Trussell, Trussell Technologies, USA
– Wolfgang Uhl, Norwegian Institute for Water
ResearchandDepartmentofCivilandEnvironmental
Engineering,Norway
– Annemarie van Wezel, University of Amsterdam,
Netherlands
– Stephanie Wright, King’s College, UK
– US Environmental Protection Agency, USA
(Christine Bergeron, William Boyes, Robert
Burgess, Jimmy Chen, Mary Davis, Rick Greene,
KayHo,GregMiller,EdwardOhanian,StigRegli,
Ken Rotert, Jamie Strong, Lili Wang, Rich Weisman,
Richard Zepp)


Acronyms and abbreviations xvii
Acronyms and abbreviations
BMDL lowerconfidencelimitonthebenchmarkdoseBPA bisphenol ABW body weightDEHP di(2-ethylhexyl)phthalateDDT dichlorodiphenyltrichloroethane DWTP drinking-water treatment plantECHA EuropeanChemicalsAgencyEFSA EuropeanFoodSafetyAuthorityFTIR fourier transform infra-red spectroscopyFAO Food and Agriculture Organization of the United NationsGC gas chromatographyGESAMP JointGroupofExpertsontheScientificAspectsofMarineEnvironmental
ProtectionGI gastrointestinalISO International Organization for StandardizationLOAEL lowest-observed-adverse-effect levelLoD limit of detectionLoQ limitofquantificationMOE margin of exposureMS mass spectrometryMt million tonnesNOAEL no-observed-adverse-effect levelPA polyamidesPAHs polycyclic aromatic hydrocarbonsPBDEs polybrominated diphenyl ethers PC polycarbonates PCBs polychlorinated biphenyls PE polyethylenePET polyethylene terephthalatePFAS per-andpolyfluoroalkylsubstancesPOD point of departure POPs persistent organic pollutantsPP polypropylenePS polystyrenePUR polyurethanePVC polyvinyl chlorideSAPEA ScienceAdviceforPolicybyEuropeanAcademiesTAS total accumulated scoreUNEP UnitedNationsEnvironmentProgrammeUV ultravioletWHO World Health OrganizationWWTP wastewater treatment plant


Chapter 1: Introduction 1
1. Introduction
1.1 Purpose of this report
This report focuses on the occurrence of microplastics in drinking-water and the potential risks to human health that may be associated with such exposure. The target audience includes drinking-water regulators, policy makers and water suppliers. The purpose of this report is to increase understanding on the issue of microplastics in drinking-waterandtosummarizehowcurrentknowledgemightinfluencepolicyandmanagement actions as well as research needs. Given the broad interest in plastic and microplastic pollution, this document may also be of interest to researchers, the public and civil society groups concerned with plastic pollution. Additionally, a separateinformationsheethasbeenpreparedthatsummarizesthekeyfindingsandconclusionsinthisreportthatthepublicandotherstakeholdersmayfinduseful.Thisreport,focusedspecificallyonbottledwaterandtapwater,marksthebeginningofWHO's effort to assess the potential human health risks associated with exposure to microplastics in the environment.
1.2 Scope of this report
This document summarizes the latest knowledge on microplastics in drinking-water. It references other routes of human exposure such as food and air to provide a benchmarkfortherelativesignificanceofexposureviadrinking-water.Itdoesnotcover the extensive literature relating to the potential ecological effects of microplastics in the wider environment (see Box 1.1). Nanoplastics are considered in this report, althoughatpresentthereisinsufficientinformationavailableforanin-depthevaluation.
Box 1.1 The risk of microplastics to aquatic ecosystems
There is a growing body of literature on the possible ecological effects of microplastics in freshwater environments and extensive literature on plastics of all sizes in the marine environment. Oceans serve as the ultimate sink for much of the world’s mismanaged plastic and microplastic waste, including from freshwater environments. While the literature has been reviewed elsewhere (GESAMP, 2015, 2016; FAO, 2017; SAPEA, 2019) and is not repeated here, the key conclusions are that although large pieces of plastic are harmful to marine life, the impact of microplastics is less certain. However, there may be widespread risks to aquatic ecosystems within a century if microplastic emission in the environment continues at the current rate (SAPEA, 2019). It is important to make clear though, that risks to the aquatic ecosystem do not necessarily equate to human health risks.

2 Microplastics in drinking-water
Brief background information is provided on plastic production and the value of plastics to society (section 1.3), since policy and management actions (Chapter 6) should also considerthebroaderbenefitsofplastics.
The state of knowledge on microplastics is evolving rapidly, as evidenced by the significantincreaseinthenumberofrecentpublications,includingresearcharticlesthat address the issue. A number of initiatives are being taken up by governments, universities and other stakeholders to better understand the occurrence of microplastics in freshwater environments and drinking-water as well as the effectiveness of water treatmenttechnologies.Thisreportmaythereforebeupdatedonceasignificantbodyof further evidence becomes available. Currently, WHO is focusing efforts on a more in-depth assessment of potential human health risks of microplastics in the environment and intends to publish a complementary report to this document.
1.3 Background
Interest in microplastics in drinking-water was stimulated initially by studies (Kosuth, Mason and Wattenberg, 2018; Mason, Welch and Neratko, 2018) that reported the presence of microplastics in tap water and in bottled water. Since then, several additional studies have been published (Oßmann et al., 2018; Pivokonsky et al., 2018; Schymanski et al., 2018; Strand et al., 2018;Uhl, Eftekhardadkhah and Svendsen,2018; Mintenig et al., 2019) leading to genuine questions and concerns about whether the presence of microplastics in drinking-water poses a risk to human health. Risk, however, is a function of both hazard and exposure, and the presence of microplastics in drinking-water does not necessarily equate to a risk to human health. With scant data available on both hazard and exposure, WHO collated and reviewed existing information on the occurrence of microplastics in drinking-water, consequent human exposure via drinking-water, and the potential effects on human health. Since fresh water provides a vital source of drinking-water, occurrence of microplastics in fresh water was also reviewed, as were data on removal in drinking-water treatment which offers an effective barrier to a wide range of particles.
1.3.1Definitionsofmicroplastics
The definition ofmicroplastics is not completely straightforward. Microplastics represent a diverse range of material types, shapes, colours and sizes (Thompson, 2015). Toaccountforthesecomplexities,researchershaveproposeddefinitionsforplasticdebris (Hartmann et al., 2019) and microplastics (Verschoor, 2015), for example, by describingthemaccordingtospecificcriteria.Becauseofthedifferentmethodsusedtocollectandquantifymicroplastics,itwasnotpossibletoapplyauniformdefinition

Chapter 1: Introduction 3
totheresultsofexistingstudies.However,thelackofauniformdefinitiondoesnotimpact this assessment, nor the conclusions in this report.
Mostdefinitionsintheliteraturefocusoncompositionandsize.Awidelyuseddefinitiondescribes microplastics as plastic particles smaller than 5 mm in length. However, thisisaratherarbitrarydefinitionandisoflimitedvalueinthecontextofdrinking-water since particles at the upper end of the size range are unlikely to be found in treateddrinking-water.Somegroupsdefinealowerboundatabout1µm.Thelowerbound is often simply a function of the sampling and analytical technique used in the study. A subset of microplastics smaller than 1 µm in length are often referred to as nanoplastics, but again with an inconsistent upper bound.
Asforthecompositionofmicroplastics,thereisagainnostandarddefinition.Manystudiesfocus on particles made from synthetic polymers rather than using the International OrganizationforStandardization(ISO)definition,whichexcludeselastomericmaterials(ISO,2013).TheGermanFederalMinistryofEducationandResearchdefinesplasticsasasubgroupofpolymersincludingelastomersandmodifiednaturalpolymers(Braunetal.,2018).TheEuropeanChemicalsAgency(ECHA,2019)usessolidpolymer-containingparticlesbutexcludesnaturalpolymersthathavenotbeenmodified.
Microplastics are sometimes categorized as two types, primary and secondary. Primary microplasticsarespecificallymanufacturedinthemicroplasticsizerange,forexample industrial abrasives used in sandblasting and microbeads used in cosmetics. Secondary microplastics are formed by the fragmentation and weathering of larger plastic items (e.g. bags, bottles, clothing, tyres, etc.) either from wear or from their release into the environment.
1.3.2 Plastic production and types
Plastics are formed by the reaction of small organic molecules called monomers resulting inlongpolymerchains.Somepolymers,suchaspolyethylene(PE),areformedbyadditionpolymerization. Others, such as nylon, are formed by condensation reactions in which small molecules, often water, are eliminated in the process of creating a longer chain.
The polymers used to make a plastic are almost always mixed with additives, including colourants,plasticizers,stabilizers,fillers,andreinforcements.Theseadditivesaffectthe chemical composition, chemical and mechanical properties and cost of the plastic.
There are two general types of plastics: thermoplastics and thermoset plastics. Thermoplastics soften when heated, can be reformed and then harden when cooled. This process can be repeated numerous times, which means thermoplastics canberecycled.Thermoplastics includePE(used intoys,shampoobottles,pipes,

4 Microplastics in drinking-water
etc.), polypropylene (PP—used in food packaging, snack wrappers, auto parts, etc.), polyethyleneterephthalate(PET—oftenusedforwaterandotherbeveragebottles),polystyrene (PS—used in foam food containers, eyeglasses, building insulation, etc.), polyvinylchloride (PVC—used in window frames, pipes, cable insulation, etc.), and others including polycarbonates (PC) and polyamides (PA). Thermoset plastics will not soften upon heating because permanent chemical bonds form between polymer chains (crosslinking). Thermoset plastics include polyurethane (PUR—used in building insulation, pillows and mattresses, insulating foams, etc.), epoxy resins, some acrylic resins and some polyesters.
Inthecontextofdrinking-water,PEandPVCareusedinwaterdistributionmainsandepoxy resins, PUR for relining existing mains, PP for various components and PA as coagulantaidsinwatertreatment.Plasticsarealsousedinmembranefiltersinwatertreatmentsystems.Inthecontextofbottledwater,PETisoftenusedtomakethebottlesandPPandPEtomakebottlecaps.Thesematerialsareoftenregulatedtoensure they do not leach substances (e.g. monomers, plasticizers or other additives) at concentrations of concern into drinking-water.
Biodegradable plastics are plastics that can be decomposed by hydrolysis or ultraviolet (UV) light degradation or the action of microorganisms, usually bacteria. They can be made from either renewable raw materials or from petrochemicals. However, some “biodegradable” plastics require prolonged exposure to temperatures above 50°C to degrade completely. Such conditions exist in industrial composting but are rarely, if ever, met in the environment. Some plastics contain pro-oxidants which promote fragmentation, but there is some controversy as to whether there is any actual biodegradation of these plastics in the environment because they have the potential toformmicroplastics(UNEP,2015).
1.3.3 Estimates of global quantities of plastics produced
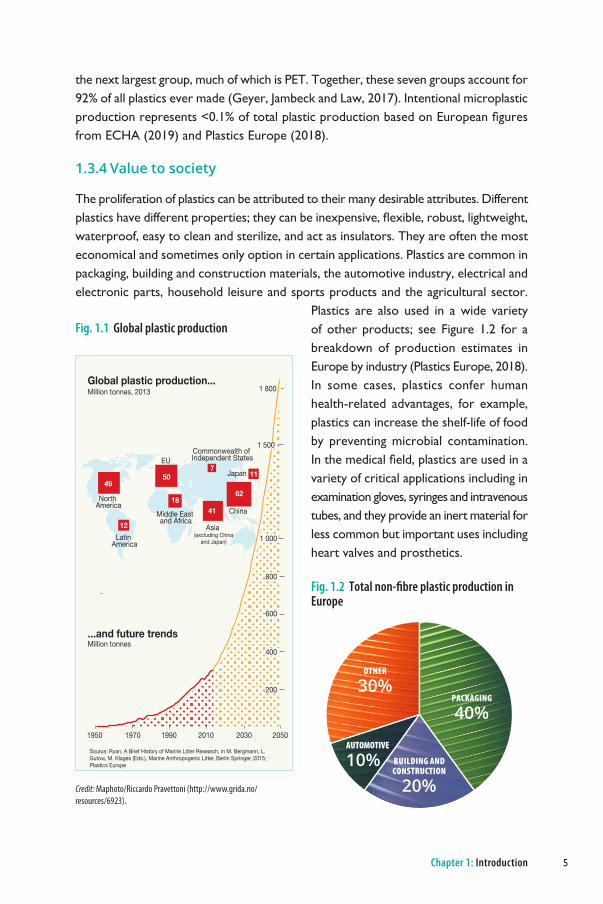
World plastic production has increased roughly exponentially since large-scale production firstbeganinthe1950s(seeFigure1.1).Globalplasticproduction,excludingfibres,increasedfrom322milliontonnes(Mt)in2015(PlasticsEurope,2017)to348Mtin2017(PlasticsEurope,2018).Withfibresincluded,globalproductionwasestimatedto be 381 Mt in 2015 and with additives included, 407 Mt (Geyer, Jambeck and Law, 2017). Considering the estimated worldwide population growth rate and current consumption and waste habits, plastic production is predicted to double by 2025 and more than triple by 2050 (FAO, 2017).
Oftotalnon-fibreplasticproduction,36%isPE,21%isPP,12%isPVC,andlessthan10%eacharePET,PURandPS.TheproductionofpolyesterPAsandacrylicsfibreis
Chapter 1: Introduction 5
thenextlargestgroup,muchofwhichisPET.Together,thesesevengroupsaccountfor92% of all plastics ever made (Geyer, Jambeck and Law, 2017). Intentional microplastic productionrepresents<0.1%oftotalplasticproductionbasedonEuropeanfiguresfromECHA(2019)andPlasticsEurope(2018).
1.3.4 Value to society
The proliferation of plastics can be attributed to their many desirable attributes. Different plasticshavedifferentproperties;theycanbeinexpensive,flexible,robust,lightweight,waterproof, easy to clean and sterilize, and act as insulators. They are often the most economical and sometimes only option in certain applications. Plastics are common in packaging, building and construction materials, the automotive industry, electrical and electronic parts, household leisure and sports products and the agricultural sector.
Plastics are also used in a wide variety of other products; see Figure 1.2 for a breakdown of production estimates in Europebyindustry(PlasticsEurope,2018).In some cases, plastics confer human health-related advantages, for example, plastics can increase the shelf-life of food by preventing microbial contamination. Inthemedicalfield,plasticsareusedinavariety of critical applications including in examination gloves, syringes and intravenous tubes, and they provide an inert material for less common but important uses including heart valves and prosthetics.
...and future trends
Global plastic production...
Million tonnes
Million tonnes, 2013
North America
Latin America
Middle East and Africa
Asia (excluding China
and Japan)
Japan
China
Commonwealth of Independent StatesEU
507
62
11
4118
12
49
1950 1970 1990 2010 2030 2050
1 000
800
600
400
200
1 800
1 500
Source: Ryan, A Brief History of Marine Litter Research, in M. Bergmann, L. Gutow, M. Klages (Eds.), Marine Anthropogenic Litter, Berlin Springer, 2015; Plastics Europe
Fig. 1.1 Global plastic production
Credit: Maphoto/Riccardo Pravettoni (http://www.grida.no/resources/6923).
Fig. 1.2 Total non-fibre plastic production in Europe
OTHER
30%
AUTOMOTIVE
10% BUILDING AND CONSTRUCTION
20%
PACKAGING
40%

6 Microplastics in drinking-water
Economically,theplastic industryprovidesemploymenttomillionsofpeople.TheEuropeanplastic industry, for instance, is estimated to involve60000companiesemploying1.5millionpeople,withaturnoverof355billionEuros.TheEuropeanindustry represents 18.5% of the annual global plastics market of 348 Mt in 2017 (PlasticsEurope,2018).Globally,employmentandturnovermaybefivetimestheEuropeanestimate.
1.4 Overview of contents
Below is a brief description of each chapter to assist the reader in navigating the contents of this report.
Chapter 2: Occurrence of microplastics in fresh water and drinking-waterThis chapter summarizes what is known about the occurrence of microplastics in fresh water and drinking-water and describes the possible sources and transport of microplastics into the freshwater environment. It also includes information on sampling and analytical methods, the quality of the occurrence studies and, for comparative purposes, some information on microplastics in food and air.
Chapter 3: Possible human health risks associated with microplastics in drinking-water: particles and chemicalsThe potential hazards associated with microplastics in drinking-water include particles, chemicalsandbiofilms.Thischapterexaminesmicroplasticparticlesandchemicals,including those that make up plastics: monomers and additives, as well as chemicals from the environment that may sorb to microplastics. The relevant health effects data for microplastic particles are summarized and information is presented on potential human health risks in the context of exposure.
Chapter 4: Possible human health risks associated with microplastics in drinking-water: biofilmsThischapterexaminesthegrowthofmicroorganisms,orbiofilms,onmicroplasticsand the associated possible risks to human health.
Chapter 5: Treatment technologies for removing microplastics from waterDrinking-water treatment has an important role in reducing concentrations of microplastics that have been introduced into source waters. This chapter therefore discusses the effectiveness of drinking-water treatment in removing microplastics. Since wastewatereffluenthasbeenidentifiedasakeysourceofmicroplasticsinsurfacewaters, an overview of the effectiveness of wastewater treatment is also provided.

Chapter 1: Introduction 7
Chapter 6: Managing plastic and microplastic pollution in the environmentThischapterdiscussesthebenefitsofplasticandmicroplasticwastemanagementandoptions to minimize plastic pollution into the environment.
Chapter 7: Conclusions, recommendations and knowledge gapsThis chapter summarizes key conclusions and research needs and recommends actions for drinking-water regulators, policy-makers and water suppliers.
Annex1 supplements the information included in Chapter 2. It includes a summary of a recent WHO-commissioned review of the literature by Koelmans et al. (2019) on occurrence of microplastics in drinking-water, fresh water and wastewater. It also includes a more in-depth summary of the available drinking-water studies.

8 Microplastics in drinking-water
2. Occurrence of microplastics in fresh water and drinking-water
2.1 Introduction
This section summarizes what is known about the occurrence of microplastics in fresh water and drinking-water. The chapter begins with background information on the possible sources and transport of microplastics into the freshwater environment; the variety of methods used for sampling and analysis; the quality of existing occurrence studies; and recommendations on how to improve study methods. It then presents data from occurrence studies along with data on polymer types and particle shapes. For comparative purposes, some data on the presence of microplastics in food and air are included.
2.2 Sources and transport of microplastics into water
Tracing the sources and transport of microplastics in the environment is a complex task. Little is understood about the processes that govern the transport of microplastics throughfreshwaterenvironments.However,keyfactorsinfluencingtheirtransportand distribution will be the inherent properties of the microplastics, i.e. their density, size and shape. Common consumer plastics range in density from 0.85 to 1.41 g/cm3 (Eerkes-Medrano,ThompsonandAldridge,2015).Thisrangestraddlesthedensityof fresh water (1 g/cm3)sosomemicroplasticswillsinkandsomewillfloatinwater.The density of the microplastic, and hence where it sits in the water column, will alsobe influencedby the formationof abiofilmon its surface (Shahet al., 2008;seeChapter4forinformationonbiofilms).Thedensitiesofarangeofplasticsareincluded in Table 2.1.
Given the diverse uses of plastics, the many different shapes and types of microplastics andthemyriadroutestofreshwaterenvironments,itisextremelydifficulttopinpointor quantify all sources of microplastics to freshwater environments. Available information on inputs of microplastics into the aquatic environment is often based onmodelling,andthereareinsufficientdatatoaccuratelyvalidatethesemodelledestimates.Further,thereareinsufficientmethodstotrackthesourcesandtransportofmicroplasticsintheenvironment(SAPEA,2019).Nevertheless,thereisageneraltendency to observe higher concentrations of microplastics in areas near densely populated urban centres (Eriksen et al., 2013; Baldwin,Corsi andMason, 2016).A recent review of the literature (Alimi et al., 2018) estimates loads into different

Chapter 2: Occurrence of microplastics in fresh water and drinking-water 9
environmental compartments. Sources of microplastics into fresh water included: run-offfromland-basedsources,wastewatereffluentsandmishandledplasticwastes.Eachoftheseandotherpotentialsourcesaredescribedbelow.
Table 2.1 Polymer densities
Polymer Density g/cm3
(low range)Density g/cm3
(high range)
Polypropylene 0.9 0.91Polyethylene 0.965 0.971Styrene butadiene rubbera 0.98 0.98Polyamide (nylon) 1.02 1.05Polystyrene 1.04 1.1Acrylic 1.09 1.2Polyvinyl chloride 1.16 1.58Polymethacrylate 1.17 1.2Polyurethane 1.2 1.2Polyester 1.23 2.3Polyethylene terephthalate 1.37 1.45
a Harandi et al., (2017)Source: Reprinted (adapted) with permission from Microplastics in the Marine Environment: A Review of the Methods Used for Identification and Quantification, Hidalgo-Ruz et al., Environ. Sci. Technol., 2012, 46 (6), pp 3060–3075. Copyright (2012) American Chemical Society.
2.2.1Run-offfromland-basedsources
Several studies (Sundt, Schulze and Syversen, 2014; Lassen et al., 2015; Sherrington et al., 2016; Boucher and Friot, 2017) have attempted to characterize the various inputs of microplastics into the aquatic environment from land-based sources, although many of these studies have focused on inputs into the marine environment. Land-based sources of microplastics into the aquatic environment, including fresh water, can originate from a variety of activities, infrastructure and land use practices. For instance, road surface run-off from the breakdown of road-marking paints and tyre wear debris has been suggestedtobeasignificantinput(Verschoor,2016;FWR,2017).Anotherimportantland-basedsourceofmicroplasticsismicroplasticfibresthatarereleasedfromtextilesdue to wear-and-tear and washing (Lassen et al., 2015; Henry, Laitala and Klepp, 2019; Schöpel and Stamminger, 2019). “City dust”, which is used to describe a number of sourcesrelatedtoabrasionofobjects,suchassyntheticsolesoffootwearandartificialturfs,cancollectivelybesignificant(BoucherandFriot,2017).Finally,agriculturalrun-offhasbeenidentifiedasapotentialsourceofmicroplasticsinfreshwaterenvironments,particularly where sewage sludge has been applied to the land or where agricultural plastics, such as those used for mulching, have been used (Horton et al., 2017).

10 Microplastics in drinking-water
2.2.2Wastewatereffluent
Wastewatereffluentisanotherwidelyrecognizedsourceofmicroplasticpollutioninfreshwater(FWR,2017;WE&RF,2017).IncreasesinmicroplasticconcentrationsdownstreamofeffluentdischargecomparedtoupstreamhavebeenreportedintheUK (Kay et al., 2018) and the USA (McCormick et al., 2014). As summarized by the ScienceAdviceforPolicybyEuropeanAcademies(SAPEA,2019),synthetictextilefibresfromclotheswashing,cosmeticmicrobeads1 and disintegrated parts of larger consumerproductsthatareflusheddowntoiletsandsinksaremajordomesticinputsinto sewage systems (see Box 2.1).
Box 2.1 Lack of sewage treatment: the bigger problem?
Although treated wastewater effluent is recognized as an input of microplastics in fresh water, well-equipped sewage treatment can effectively remove most microplastics from the effluent (see section 5.2). Most wastewater in high-income countries is in fact collected in sewers and then treated. However, in low- and middle-income countries, only 33% of the population have sewer connections. Wastewater for the remaining 67% of the population is collected and treated in onsite systems or discharged directly to soil and water bodies (UNICEF/WHO, 2019). Therefore, the lack of wastewater treatment or other appropriate systems for collecting and treating wastewater may be the more significant issue.
Thelargevolumeofeffluentproducedfromwastewatertreatmentmeansthat,evenwith effective removal, high absolute numbers of microplastics can be discharged. One study calculated that 65 million microplastic particles were released each day in theeffluentfromawastewatertreatmentplant(WWTP),equatingtoapproximately100 particles/population-equivalent/day (Murphy et al., 2016). Such estimates are highly variable, for example, Carr, Liu and Tesoro (2016) estimated that for every microplastic particle discharged to the environment from wastewater treatment, 1140 L of water was discharged from a secondary WWTP. Based on 120 L water use/person/day, this is three orders of magnitude below the per-capita estimate quoted above.
2.2.3Combinedseweroverflows
Combinedseweroverflowsdesignedtocopewithstormeventsandheavyrainfallcan also be direct sources of microplastics in fresh waters since the barrier provided by wastewater treatment is temporarily bypassed (FWR, 2017).
1 Inputs of cosmetic microbeads into the aquatic environment, while considered minor compared to other sources (Boucher and Friot, 2017; WE&RF, 2017), have been minimized after voluntary initiatives from the industry and government restrictions on the use of microbeads in wash-off cosmetics in a number of countries (e.g. Defra and Gove, 2018).

Chapter 2: Occurrence of microplastics in fresh water and drinking-water 11
2.2.4Industrialeffluent
Therelativecontributionofindustrialeffluentstomicroplasticsinwastewatershasyettobeinvestigated(vanWezeletal.,2018ascitedinSAPEA,2019).However,industry-related microplastics have been reported in fresh waters. In particular, pre-production pellets have been detected in the Great Lakes, the Danube River and a river in the Los Angelesbasin(Eerkes-Medrano,ThompsonandAldridge,2015).Whilstthesepelletsmay represent a concern to aquatic wildlife, they will not be found in treated drinking-water because of their size. However, if they are degraded to smaller microplastics, theymayposemoreofachallengetodrinking-watertreatmentprocesses.SomePEmanufacturershaveinstalledfine-meshedfiltersontheoutgoingstormandprocesswaterinanefforttosignificantlyreduceemissions(Lassenetal.,2015).
2.2.5 Fragmentation and degradation of macroplastics
Macroplastic debris originating from urban environments can enter freshwater systems (Gasperi et al., 2014; Morritt et al., 2014) and may also represent an important source of microplastic formation by fragmentation. Data are limited on the rates of fragmentation and degradation of macroplastics in the marine or freshwater environment. Nevertheless, the large volumes of macroplastics observed in the marine environment have been suggestedtobeasignificantsourceofmicroplastics,asitisassumedthatthesematerialswill eventually fragment and degrade (Barnes et al., 2009). Once macroplastic debris has reached the aquatic environment, UV radiation and high temperatures can cause chemical changes, making plastics brittle and thus more susceptible to fragmentation and degradation (Andrady, 2007a; Andrady, 2007b). Similar processes are likely to operate in freshwater and marine environments. Zbyszwski and Corcoran (2011) examined degradation patterns of microplastics in fresh waters using a scanning electron microscope and found them similar to those found on marine beaches (Corcoran, Beisinger,andGrifi,2009).Hüfferetal.(2017)notedthatinestimatingtheamountofsecondary microplastics formed, the total production volume may be less relevant than the release processes and subsequent fragmentation in the environment. It is possible that further fragmentation of microplastics to nanoplastics can occur and Alimi et al. (2018) has stated that “although environmental levels of nanoplastics are yet to be quantified,plasticnanolitterisexpectedtobeasubiquitousasitsbulkcounterparts.”
2.2.6 Atmospheric deposition
Atmosphericdepositionhasbeenidentifiedasanadditionalpotentialcontributortomicroplastics in freshwater environments through wet and dry deposition, precipitation and run-off (Wright and Kelly, 2017). Further information on airborne microplastics is included in section 2.8.2.
12 Microplastics in drinking-water
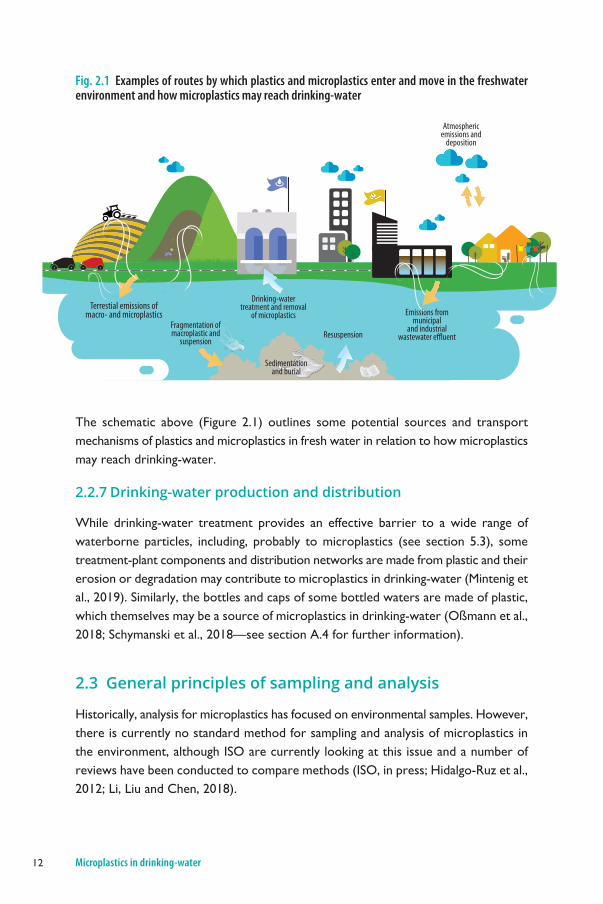
The schematic above (Figure 2.1) outlines some potential sources and transport mechanisms of plastics and microplastics in fresh water in relation to how microplastics may reach drinking-water.
2.2.7 Drinking-water production and distribution
While drinking-water treatment provides an effective barrier to a wide range of waterborne particles, including, probably to microplastics (see section 5.3), some treatment-plant components and distribution networks are made from plastic and their erosion or degradation may contribute to microplastics in drinking-water (Mintenig et al., 2019). Similarly, the bottles and caps of some bottled waters are made of plastic, which themselves may be a source of microplastics in drinking-water (Oßmann et al., 2018; Schymanski et al., 2018—see section A.4 for further information).
2.3 General principles of sampling and analysis
Historically, analysis for microplastics has focused on environmental samples. However, there is currently no standard method for sampling and analysis of microplastics in the environment, although ISO are currently looking at this issue and a number of reviews have been conducted to compare methods (ISO, in press; Hidalgo-Ruz et al., 2012; Li, Liu and Chen, 2018).
Fig. 2.1 Examples of routes by which plastic and microplastics enter and move in the fresh water environment and how microplastics may reach drinking-water
Resuspension
Drinking-water treatment and removal
of microplastics
Atmospheric emissions and
deposition
Terrestial emissions of macro- and microplastics
Fragmentation of macroplastic and
suspension
Sedimentation and burial
Emissions from municipal
and industrial wastewater effluent
Fig. 2.1 Examples of routes by which plastics and microplastics enter and move in the freshwater environment and how microplastics may reach drinking-water

Chapter 2: Occurrence of microplastics in fresh water and drinking-water 13
Sampling and analysis involves three complex steps: (1) sampling; (2) sample extraction andisolation;and(3)identification,characterizationandquantification.Theenvironmentalmedium being examined (e.g., water, sewage sludge oreffluent)determinestheproceduresrequiredforsampling and preparation. Methods for drinking-water are derived from those used in environmental water samples, but few studies have been conducted and, again, there is no agreement on a standard method.
2.3.1 Sampling
Microplastic samples can be acquired using trawl nets (typically 300 µm) drawn across the surface of the water, or through collection of water samples from which theparticlesareextractedlater.Initialsamplepurificationusuallyinvolvesfiltration,followed by some sort of extraction process such as density separation, in which samplesaremixedwithaliquidofdefineddensity,allowingmicroplasticparticlestofloatandheavierparticlestosink(seeTable2.1foralistofplasticsandtheirdensities).Furtherpurificationmayrequirechemicalorenzymaticmethodstoremoveorganicor inorganic contaminants (biofouling). The extent of the preparation is dependent on the nature of the samples: dirtier samples will require more preparation. Since treated drinking-waterandbottledwaterarerelativelycleanmedia,someofthepurificationsteps required for other environmental samples may not be necessary.
2.3.2 Analysis
Microplastics are recovered from the supernatant and filtered or sieved. Theconcentratemaybe visually sortedbeforequantificationbymicroscopic countingwith or without tagging using dyes, but neither of these methods can unambiguously confirmtheparticlesareplastics.
Three different approaches are available to determine the chemical composition and/or size of plastic particles: spectroscopic, thermoanalytical, and chemical. These methods aredescribedbrieflybelow.Forfurtherinformationaboutthesemethods,includingcapabilities and limitations related to detection levels and the ability to detect particle dimensions, see Braun et al. (2018).
Spectroscopicmethodsareusedtoidentifythespecificchemicalstructureofpolymersby comparing their absorption or emission spectra with reference spectra. Fourier transform infrared spectroscopy (FTIR) is a well-established, relatively fast and reliable spectroscopic method that, when coupled with microscopy, can identify particles to about10–20µm.However,biofilms,ifnotremoved,caninterferewiththedetection
There is currently no standard method for sampling and analysis of microplastics in the
environment.

14 Microplastics in drinking-water
of microplastics. FTIR also requires expensive instrumentation not available in many laboratories. Microscopy coupled with Raman spectroscopy can identify particles in the 1–20 µm range. However, it can be subject to interference, may be slow, and also requires expensive instrumentation.
With thermoanalytical methods, the sample is pyrolysed under inert conditions, so thatspecificdecompositionproductsoftheindividualpolymerscanbeanalyzed.Thesemethods tend to require larger particle masses compared to spectroscopic methods. Pyrolysis-gas chromatography/mass spectrometry (GC/MS) can provide information on additives as well as the polymer, and if the sample is large enough, can identify the polymer composition of nanoplastic particles.
Conventional chemical methods such as inductively coupled plasma mass spectrometry canbeusedtodecomposethesamplesanddetectspecificfragmentsofpolymersor elements. Again, these tend to require larger particle masses (Braun et al., 2018).
Software packages are often used in both tagging and spectroscopic studies to recognize and count particles and to characterize particles by comparing them with library spectra.
2.4 Overall reliability of studies
Throughout the sampling and analysis process, careful controls need to be in place to avoid contamination, as microplastics are ubiquitous in the environment. A systematic review of 50 studies on microplastics in fresh water, drinking-water and wastewater commissioned by WHO (Koelmans et al., 2019) concluded that methods for microplastic
sampling and analysis of water samples need to be improved for reproducibility and comparability of results. To determine the reliability of the studies, Koelmans et al. (2019) applied nine quality control criteria adapted from criteria developed for biota samples (Hermsen et al., 2018). Only 4 of 50 studies received positive scores in all criteria. A full 46 studies were not considered reliable on at least one crucial criterion. Areas requiring the most improvement
includedsampletreatment,polymeridentification,laboratorypreparation,cleanairconditions and positive controls. The fact that data or a study may not be fully reliable according to these criteria does not imply that the data are not useful.
Some improvements in quality assurance for sampling and analysis methods may have already occurred since the four studies that received positive scores in all criteria were the more recent ones, published in 2017 and 2018. Average quality scores were
The majority of microplastic occurrence studies are not
considered fully reliable. There is a significant need
to improve the quality assurance of occurrence studies on microplastics.

Chapter 2: Occurrence of microplastics in fresh water and drinking-water 15
highest in the studies assessing bottled water, followed by tap water, water from a drinking-water treatment plant (DWTP), surface water and wastewater. This ranking likelyreflectstherelativeeaseofanalysingthedifferentwatertypes(Koelmansetal.,2019). Further details on the systematic review including the nine key quality control criteria are summarized in the annex and recommendations to improve sampling and analytical methods are included in Box 2.2.
Box 2.2 Recommendations to improve sampling and analytical methods
There is a general need to improve microplastic sampling and analysis in water samples. The following improvements are considered to be particularly important: Studies should provide complete information about the method of sampling so that it can be
reproduced. The sample volumes will depend of the nature of the water being sampled and size of the particles
being analysed, which in turn is determined by the filter or mesh size being used. Sample volumes should be sufficiently large to reliably detect low microplastic concentrations.
Wherever possible, plastic material should be avoided for sampling and analyses. If plastic material must be used, it should be characterised and reported.
Materials should be rinsed with filtered water to avoid contamination. Sampling and sample processing should be carried out by trained professionals or the quality of
samples collected or processed by volunteers should be (quantitatively) validated against results obtained by professionals.
If preservatives are used, their ability to affect polymer mass or particle shapes should be tested, either in the context of the study or via literature support.
Laboratory surfaces should be thoroughly cleaned with filtered water to avoid contamination. All samples should be handled in a laminar-flow hood or in a clean-air laboratory. Blanks should be run, per day or per series, at least in triplicate, to verify and correct for
contamination and results should be corrected against blanks. Positive controls should be used to verify the recovery of particles during digestion, density
separation and filtration steps. Digestion should be applied when necessary. Usually digestion is not necessary for drinking-water
from a treated source. However, for surface water and wastewater samples, where high organic matter concentrations hamper the selection and (visual) identification of particles, a digestion step is required.
Polymer identification is required for a representative subsample of the entire sample. Data should be reported as number of particles/L and mass/L together with their detection limits.
Minimum and maximum particle sizes and when possible, morphologies should be specified. All these characteristics may inform the risk assessment.
Standard methods of sampling and analysis should be developed but may differ for the different media being sampled. For example, sediment methods may differ from seawater methods which will also differ from drinking-water methods. As far as possible the same principles need to be followed.

16 Microplastics in drinking-water
2.5 Microplastic concentrations reported in fresh water
Microplastics are frequently present in the freshwater environment, with studies reporting particle counts ranging from around 0 to 103 particles/L (Koelmans et al., 2019). The relative concentration of microplastics detected is dependent on the location, the sampling technique (mesh size) and method of analysis. Larger sieves will not retain small particles, so total particle numbers will be lower from samples taken with large sieves than from small sieves.
InKoelmansetal.(2019),31studiesofmicroplasticsinfreshwaterwereidentifiedand the six highest-scoring studies in terms of methodological quality (studies with a total accumulated score (TAS), greater than nine or 50% of the maximum value), are summarized in Table 2.2 below. The reported concentrations of microplastics ranged from averages of 4.7 particles/L in the study using a 48 µm sieve down to 0.00026 particles/L in a study using a 333 µm sieve. Not surprisingly, the one groundwater study found low concentrations of microplastics relative to other water types despite using a very small sieve size (3 µm). A priori, low particle counts would be expected in many groundwaters because of the protection afforded by the overlying strata.
Table 2.2 Summary of reported microplastic particle numbers from freshwater studies that scored highest for quality
Location Results reported (particles/L)
Sieve size (µm)
Study Quality score (TAS)a
Groundwater, Germany Average:b 0.7 × 10⁻³
Range:b 0 –7 × 10-33 Mintenig et al., 2019 14
Three Gorges Reservoir, China
Average: 4.7Range: 1.6–12.6
48 Di and Wang, 2018 10
Dongting Lake and Hong Lake, China
Averages: 1.2 and 2.3 Ranges: 0.9–2.8 and 1.3–4.7
50 Wang et al., 2018 15
Wuhan, China Range: 1.6–8.9 50 Wang et al., 2017 10Rhine river, Switzerland, France, Germany, Netherlands
Average: 0.0056 300 Mani et al., 2015 10
Western Lake Superior, USA
Average: 0.00026 333 Hendrickson, Minor, and Schreiner, 2018
11
a TAS = total accumulated score, as reported in Koelmans et al. (2019). The maximum score is 18 and is calculated by adding scores for nine quality criteria, where for each criterion, a score of 0, 1 or 2 is assigned. See the annex for an overview of the nine quality criteria and for each study, the individual scores against each criteria. TAS values are underlined when all underlying scores are non-zero.
b These values include samples of groundwater and drinking-water derived from groundwater subject to further filtration.

Chapter 2: Occurrence of microplastics in fresh water and drinking-water 17
A direct comparison of data between studies of fresh water and drinking-water, described below, cannot be made because in most cases freshwater studies targeted larger particles, using mesh sizes that were an order of magnitude larger than those used in drinking-water studies (see Box 2.3). Consequently, the small particles detected in drinking-water are not detected in most freshwater studies.
Box 2.3 Interpretation and comparison of occurrence studies
Interpretation and comparison of study results reporting microplastic particle numbers should be done with great care, as the studies often use different methods, including filter size and enumeration methods. This means some studies will not detect smaller sized particles at all or will characterize non-plastics as plastics.
2.6 Microplastic concentrations reported in drinking-water
A total of nine studies measured microplastics in drinking-water. Particle concentrations reported in individual samples ranged from 0 to over 104 particles/L and mean values ranged from roughly 10-3 particles/L in a study of drinking-water derived from groundwater to over 103 particles/L. In general, groundwaters are well protected from particulate contamination. Similarly, conventional drinking-water treatment is expected to provide an effective barrier for a wide range of particle sizes (see further information in section 5.3).
Different studies looked at different ranges of particle sizes and had different cut-offs forreportingparticlesizes.Studiestypicallyusedafilterwithameshorporesizeof less than 10 µm and in some cases characterized particles as small as 1 µm. In the context of drinking-water, an arbitrary cut-off of 100 µm in length was suggested to distinguish large particle from small particles (Koelmans et al., 2019). Where studies looked at both large and small particles, small particles tended to be more numerous. Since there were so few studies, each is described in more detail in the annex. They are described in the annex in order of decreasing study quality, as determined by the TAS quantitative assessment, primarily from Koelmans et al. (2019). Some key results of the eight of the nine scored studies are summarized in Table 2.3. There was insufficientdetailtofullyassessthestudyqualityofoneofthestudies,andtherefore,is not summarized in the below table, but a short description is included in the annex for completeness.
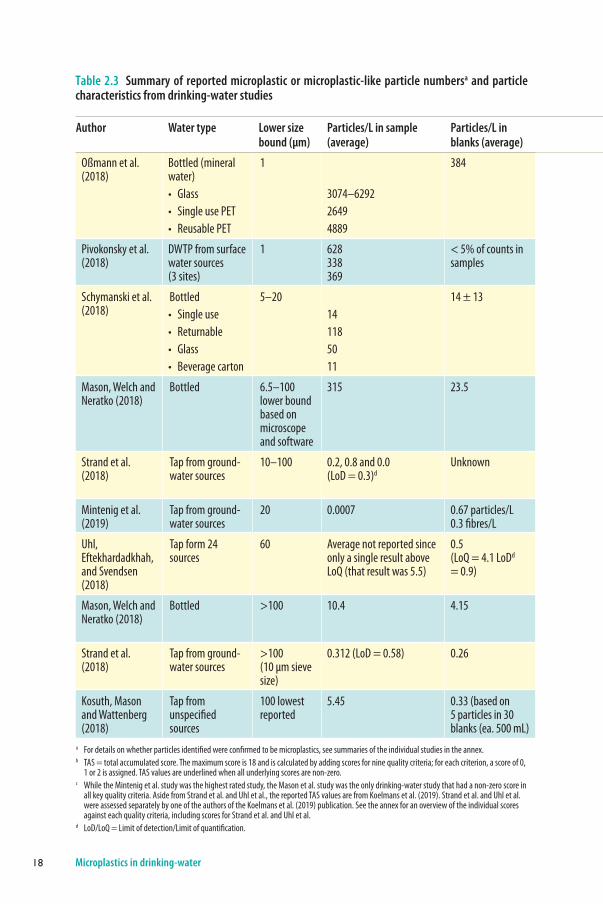
18 Microplastics in drinking-water
Table 2.3 Summary of reported microplastic or microplastic-like particle numbersa and particle characteristics from drinking-water studies
Author Water type Lower size bound (µm)
Particles/L in sample (average)
Particles/L in blanks (average)
Particle size (µm) Predominant particle shape
Predominant polymer type
Quality score (TAS)b, c
Author
Oßmann et al. (2018)
Bottled (mineral water)• Glass • Single use PET • Reusable PET
1
3074–62922649 4889
384 Most particles smaller than 5 (>75% in glass and >95% in plastic bottles)
No discussion of shapes
PET in plastic bottles, PE, and styrene butadiene copolymer in glass
13 Oßmann et al. (2018)
Pivokonsky et al. (2018)
DWTP from surface water sources(3 sites)
1 628338 369
< 5% of counts in samples
Most particles were in 1–10 range (up to 95%)
Fragments closely followed by fibres
PET but also PP, PE, polyacrylamide
11 Pivokonsky et al. (2018)
Schymanski et al. (2018)
Bottled• Single use• Returnable• Glass• Beverage carton
5–2014 118 50 11
14 ± 13 40–50% in 5–10 range; over 80% <20
No discussion on shape; described as fragments
PET but also PP, PE 14 Schymanski et al. (2018)
Mason, Welch and Neratko (2018)
Bottled 6.5–100 lower bound based on microscope and software
315 23.5 Not specified No characterization 14 Mason, Welch and Neratko (2018)
Strand et al. (2018)
Tap from ground-water sources
10–100 0.2, 0.8 and 0.0 (LoD = 0.3)d
Unknown Mainly 20–100 Fragments PET, PP, PS, acrylonitrile butadiene styrene, PUR
14 Strand et al. (2018)
Mintenig et al. (2019)
Tap from ground-water sources
20 0.0007 0.67 particles/L0.3 fibres/L
In the range 50–150
Fragments Polyester, PVC, PE, PA, epoxy resin
15 Mintenig et al. (2019)
Uhl, Eftekhardadkhah, and Svendsen (2018)
Tap form 24 sources
60 Average not reported since only a single result above LoQ (that result was 5.5)
0.5 (LoQ = 4.1 LoDd = 0.9)
Not specified Not specified No characterization 9 Uhl, Eftekhardadkhah, and Svendsen (2018)
Mason, Welch and Neratko (2018)
Bottled >100 10.4 4.15 Not specified Fragments (66%), fibres (13%), films (12%)
PP (54%) 14 Mason, Welch and Neratko (2018)
Strand et al. (2018)
Tap from ground-water sources
>100 (10 µm sieve size)
0.312 (LoD = 0.58) 0.26 Not specified Fibres (82%), fragments (14%), films (4%)
PET, PP, PS 14 Strand et al. (2018)
Kosuth, Mason and Wattenberg (2018)
Tap from unspecified sources
100 lowest reported
5.45 0.33 (based on 5 particles in 30 blanks (ea. 500 mL)
Fibre lengths 100–5000
Mainly fibres (98.3%)
No characterization 8 Kosuth, Mason and Wattenberg (2018)
a For details on whether particles identified were confirmed to be microplastics, see summaries of the individual studies in the annex. b TAS = total accumulated score. The maximum score is 18 and is calculated by adding scores for nine quality criteria; for each criterion, a score of 0,
1 or 2 is assigned. TAS values are underlined when all underlying scores are non-zero.c While the Mintenig et al. study was the highest rated study, the Mason et al. study was the only drinking-water study that had a non-zero score in
all key quality criteria. Aside from Strand et al. and Uhl et al., the reported TAS values are from Koelmans et al. (2019). Strand et al. and Uhl et al. were assessed separately by one of the authors of the Koelmans et al. (2019) publication. See the annex for an overview of the individual scores against each quality criteria, including scores for Strand et al. and Uhl et al.
d LoD/LoQ = Limit of detection/Limit of quantification.

Chapter 2: Occurrence of microplastics in fresh water and drinking-water 19
Author Water type Lower size bound (µm)
Particles/L in sample (average)
Particles/L in blanks (average)
Particle size (µm) Predominant particle shape
Predominant polymer type
Quality score (TAS)b, c
Author
Oßmann et al. (2018)
Bottled (mineral water)• Glass • Single use PET • Reusable PET
1
3074–62922649 4889
384 Most particles smaller than 5 (>75% in glass and >95% in plastic bottles)
No discussion of shapes
PET in plastic bottles, PE, and styrene butadiene copolymer in glass
13 Oßmann et al. (2018)
Pivokonsky et al. (2018)
DWTP from surface water sources(3 sites)
1 628338 369
< 5% of counts in samples
Most particles were in 1–10 range (up to 95%)
Fragments closely followed by fibres
PET but also PP, PE, polyacrylamide
11 Pivokonsky et al. (2018)
Schymanski et al. (2018)
Bottled• Single use• Returnable• Glass• Beverage carton
5–2014 118 50 11
14 ± 13 40–50% in 5–10 range; over 80% <20
No discussion on shape; described as fragments
PET but also PP, PE 14 Schymanski et al. (2018)
Mason, Welch and Neratko (2018)
Bottled 6.5–100 lower bound based on microscope and software
315 23.5 Not specified No characterization 14 Mason, Welch and Neratko (2018)
Strand et al. (2018)
Tap from ground-water sources
10–100 0.2, 0.8 and 0.0 (LoD = 0.3)d
Unknown Mainly 20–100 Fragments PET, PP, PS, acrylonitrile butadiene styrene, PUR
14 Strand et al. (2018)
Mintenig et al. (2019)
Tap from ground-water sources
20 0.0007 0.67 particles/L0.3 fibres/L
In the range 50–150
Fragments Polyester, PVC, PE, PA, epoxy resin
15 Mintenig et al. (2019)
Uhl, Eftekhardadkhah, and Svendsen (2018)
Tap form 24 sources
60 Average not reported since only a single result above LoQ (that result was 5.5)
0.5 (LoQ = 4.1 LoDd = 0.9)
Not specified Not specified No characterization 9 Uhl, Eftekhardadkhah, and Svendsen (2018)
Mason, Welch and Neratko (2018)
Bottled >100 10.4 4.15 Not specified Fragments (66%), fibres (13%), films (12%)
PP (54%) 14 Mason, Welch and Neratko (2018)
Strand et al. (2018)
Tap from ground-water sources
>100 (10 µm sieve size)
0.312 (LoD = 0.58) 0.26 Not specified Fibres (82%), fragments (14%), films (4%)
PET, PP, PS 14 Strand et al. (2018)
Kosuth, Mason and Wattenberg (2018)
Tap from unspecified sources
100 lowest reported
5.45 0.33 (based on 5 particles in 30 blanks (ea. 500 mL)
Fibre lengths 100–5000
Mainly fibres (98.3%)
No characterization 8 Kosuth, Mason and Wattenberg (2018)
a For details on whether particles identified were confirmed to be microplastics, see summaries of the individual studies in the annex. b TAS = total accumulated score. The maximum score is 18 and is calculated by adding scores for nine quality criteria; for each criterion, a score of 0,
1 or 2 is assigned. TAS values are underlined when all underlying scores are non-zero.c While the Mintenig et al. study was the highest rated study, the Mason et al. study was the only drinking-water study that had a non-zero score in
all key quality criteria. Aside from Strand et al. and Uhl et al., the reported TAS values are from Koelmans et al. (2019). Strand et al. and Uhl et al. were assessed separately by one of the authors of the Koelmans et al. (2019) publication. See the annex for an overview of the individual scores against each quality criteria, including scores for Strand et al. and Uhl et al.
d LoD/LoQ = Limit of detection/Limit of quantification.

20 Microplastics in drinking-water
2.7 Particle size, shape and polymer type in fresh water and drinking-water
Size,shapeandpolymertypearecharacteristicsofmicroplasticsthatmayinfluencehowtheyaretransportedinwaterandmayhaveimplicationsfortoxicityandefficacyof drinking-water treatment. Below is a brief summary of the characteristics of microplastic particles found in freshwater and drinking-water samples. For a detailed overview, see Koelmans et al. (2019).
The smallest particle sizes measured in fresh water are determined by the mesh size of the trawl net, which is typically 300 µm, although a few studies have been conducted withfinermeshes.Higherparticlecountstendtobereportedwhensmallerparticlesare measured (Koelmans et al., 2019). Based on current analytical capabilities, particle sizes measured in drinking-water can be as low as 1 µm. This does not imply that particles smaller than 1 µm are not in drinking-water, rather detection is limited by currently available methods.
In freshwater studies, the shapeofparticles variedwidely,with fragments,fibres,film,foamandpelletsbeingtheshapesmostoftenreported(Koelmansetal.,2019).Fragmentsandfibreswerethepredominantparticletypesfoundindrinking-water.However, as stated by the authors, this data on shapes should be interpreted with caution, as they represent only a subset of isolated particles, which may or may not representallparticles.Also,eachstudyfocusedonspecificsizesanddefinedambiguousshapes differently such as nurdle, pellet, pre-production pellet, resin or granule, making itdifficulttocompareacrossstudies.Studiesalsodifferedintheextenttowhichtheirwater samples represented the studied water systems or water type, which varied over space and time.
PP,PE,PS,PVCandPETwere thepolymersdetectedmost frequently, anorderthat agrees roughly with production volumes. As described above, in addition to the production volume, polymer density is a key factor in determining which particles might be detected in studies that sample the upper layer of water. In bottled water, there is some evidence that microplastic occurrence appears to be at least partially attributable to the bottling process and/or packaging.
2.8 Other routes of exposure
Since plastics are so widely used in society, the public will be frequently exposed to plastics and potentially to microplastics. This includes direct exposure, whereby any plastic item placed in the mouth may expose a person to microplastics by abrasion.

Chapter 2: Occurrence of microplastics in fresh water and drinking-water 21
Small children may potentially have increased exposure given the number of plastic toys and cups and cutlery made for children, and given oral exploration is a normal stageofchilddevelopment.Everydayuseofhouseholdobjects(e.g.plasticcutlery,toothbrushes, cutting boards, cups, etc.) may also be sources of exposure. However, given there are no data on such exposures, this section focuses on food and air.
2.8.1 Food
In2016, theEuropeanFoodSafetyAuthority (EFSA)conductedacomprehensivereview of existing data on microplastics in food. Nanoplastics were included within the scopeoftheEFSAreview,butnooccurrencedatawereavailable.Ofthe13studiescited,10measuredmicroplasticconcentrationsinmarinefishandshellfish.Typicalconcentrationsofmicroplasticsweresingle-digitparticlesperfishrangingupto7particlesperfishandupto10particles/gofshellfish.Particlesizesinfishrangedfrom130–5000µm.Particlesizesfoundinshellfishweretypicallyintheranges5–25µmand20–90µm,althoughinsomecases,longerfibresupto4700µmwerereported(FAO,2017). One study looked at microplastic concentrations in honey, reporting 0.166 fibres/g(range40–9000µm)and0.009fragments/g(range10–20µm).Anotherstudyanalysedbeer,reporting0.025fibres/mLand0.033fragments/mL(sizesnotstated).Particlesfoundinhoneyandbeerwerenotspectroscopicallyconfirmed.Anotherstudyexaminedsalt,findingthehighestconcentrationofmicroplasticsinseasalt,at0.550–0.681 particles/g (size 45–4300 µm).
Because mussels contained the highest median value of 4 microplastic particles/g and since they are eaten without removing their digestive tract, mussels represent a conservativemicroplasticexposurescenarioforallfishandotherseafood.Assumingthe microplastic particles were 25 µm diameter with a density of 0.92 g/cm3,EFSAestimated an intake of 7 µg of microplastics based on a 225 g portion of mussels. Based on intake at the highest concentration of sorbed contaminants or additives in theplasticsandcompletereleasefromtheparticlesuponingestion,EFSAestimatedthat this scenario would result in very small increases in intakes of polychlorinated biphenyls (PCBs) (<0.006% increase), polycyclic aromatic hydrocarbons (PAHs) (<0.004% increase) and bisphenol A (BPA) (about 2% increase). The Food and Agriculture Organization of the United Nations (FAO) (2017) reached a similar conclusion for PCBs, PAHs, dichlorodiphenyltrichloroethane (DDT), BPA and polybrominated diphenyl ethers(PBDEs)consideringthehighestconcentrationofcontaminantsoradditivesin microplastics and the same worst-case microplastic intake assumption applied by EFSA.Note that systematicqualityassessments for studies reportingmicroplasticconcentrations in food and air have not yet been conducted, aside from seafood as reported in Hermsen et al., 2018.

22 Microplastics in drinking-water
2.8.2 Air
Limited data are available on levels of microplastics in air. Thus, the sources and transport mechanisms of microplastics in air remain poorly understood. A potentially importantsourceoffinemicroplasticparticulatestotheatmospherecouldbeassociatedwith tyre and road-wear particles. A recent study investigating the contributions of polymeric materials originating from tyre and road-wear particles, however, reported anaveragecontributionofonly0.27%offineparticulatematter(PM2.5)inLondon,Los Angeles and Tokyo (Panko et al., 2019). Sea salt aerosol formation, wind-driven release of wastewater sludge, degradation of plastic sheeting and other construction materials, clothes drying, and wear and tear of textiles are all possible sources of airborne microplastics (Wright and Kelly, 2017). High concentrations of microplastics have been reported in occupational settings (SAPEA, 2019) and some data fromdomestic settings are outlined below.
Dris et al. (2016) monitored microplastics in total atmospheric fallout at two sites in Paris. Fibres accounted for almost all of the material collected, the remainder being a few plastic fragments (<100 µm in size). Atmospheric fallout of between 2 and 355 fibres/m2/day was calculated from experimental data. Total atmospheric fallout during wet weather periods was substantially larger than during dry periods but a statistically significantcorrelationwasnotfound.Thepredominantfibreswere200–600µminlengthand7–15µm indiameter.FTIRofa subsampleconfirmedthat50%of thetotalfibreswerenatural(mainlywoolandcotton)and21%weremanufacturedbytransformation of natural polymers (rayon or acetate from cellulose). The remaining 29%containedatleastsomepurelysyntheticfibres,mainlyPETandsomePA.Thelower size limit of the analysis was 50 µm.
Drisetal.(2017)investigatedthefibrespresentinindoorandoutdoorair,aswellasinindoor settled dust. Three indoor sites and one outdoor site in Paris were monitored. Overall,indoorconcentrationsrangedbetween0.4and59.4fibres/m3 with a median valueof5.4fibres/m3.Outdoorconcentrationsweresignificantlylower,rangingbetween0.3and1.5fibres/m3.Thedepositionrateoffibresintheindoorenvironmentsrangedbetween1586and11130fibres/m2/day.Thenatureofthefibreswassimilartothatobserved in the previous study by the same authors (described above): 67% were madeofnaturalmaterialswhiletheremaining33%offibrescontainedpetrochemicalswith PP being predominant. A similar size distribution was determined for indoor air, outdoor air and dust fall, and the distribution was similar to total atmospheric fallout withfibrelengthbetween50µm(theobservationlowerlimit)and450µm.

Chapter 2: Occurrence of microplastics in fresh water and drinking-water 23
Catarino et al. (2018) compared the relative exposure from ingesting marine mussels with the level of exposure from household deposition during a meal. To estimate microplastic exposure from mussels, measurements in mussels of 3 particles/g (mostly fibres)weremultipliedbyaverageshellfishconsumptionintheUKtoarriveatanexposure level of 123 microplastic particles/year/capita in the UK and up to 4620 particles/year/capita incountrieswithahigher shellfishconsumption.Toestimatemicroplastic concentrations that would accumulate on a dinner plate during a meal, depositionratesofbetween1and5fibresweremeasuredoverasmallsurfacearea(approximately 4 cm2) for 20 or 40 minutes. This yielded deposition rates over an order of magnitude larger than those observed by Dris et al. (2017). A correction was then made for the abundance of microplastics in dust based on Dris et al. (2017). Estimatedexposuretomicroplasticsduringamealviadustfalloutrangedfrom13731to 68 415 particles/year/capita which was much larger than via mussel consumption (4620 particles/year/capita). It should be stressed that these estimates were made by extrapolating a small number of particles falling on a small surface area and so should be treated with some caution.
24 Microplastics in drinking-water
2.9 Conclusions and research needs
Microplastics are ubiquitous in the environment. They have been found in marine water, wastewater, fresh water, food, air and drinking-water, both bottled water and tapwater.Withtheinformationavailableatthistime,itisdifficulttomakearobustquantitative estimate on the relative contribution from difference sources.
Two of the main inputs of microplastics into fresh water are surface run-off and wastewatereffluent,althoughbetterdataarerequiredtoquantifyboththeseandotherinputsandassociatethemwithmorespecificsources.
The quality and quantity of data varies across different water types. Data on the occurrence of microplastics in drinking-water are limited at present, with few reliable studies using different methods and tools to sample and analyse microplastic particles.
Methods of sampling and analysis are not always straightforward. Important factors to consider when conducting sampling and analysis are summarized in Box 2.2. Principal amongst these include the need to avoid or minimize contamination during sampling andanalysisandtousefieldandlaboratoryblanksamplesforqualitycontrol.Anotherimportantfactorisconfirmingthepolymeridentityofthemicroplasticparticles.
A wide range of particle shapes and sizes are found in fresh water, and the smallest particles detected are often determined by the mesh size. Typically, studies using large mesh sizes will report lower particle counts than those using small mesh sizes. The frequency with which different plastic polymer types are found is consistent with production volumes and plastic density. Routine methods are currently not available to detect nanoplastics in environmental samples.
The results of studies need to be interpreted in the context of the methods used and associated quality assurance/quality control mechanisms. However, limited data on drinking-water have provided some initial results.
• Microplasticshavebeenidentifiedindrinking-waterassmallas1µm,basedonthe smallest particle size detected by current methods.
• Large particles occur less frequently than small particles.• Thepredominantparticleshapesarefragmentsandfibres.• ThepredominantplastictypesarePETandPP.• In addition to fresh water being a potential source of microplastics in drinking-water,
there is some evidence from the type of plastics found that some contamination may arise during treatment and distribution of tap water, and/or bottling of bottled water.Moredataareneededtoconfirmthecontaminationsources.

Research needs
The following research would clarify the occurrence of microplastics in drinking-water and freshwater sources:
• More data are needed on the occurrence of microplastics in drinking-water to assess human exposure from drinking-water adequately.
• Studies on occurrence of microplastics must use quality-assured methods to determine numbers, shapes, sizes, and composition of the particles found. They should identify whether the microplastics are coming from the freshwater environment or from the abstraction, treatment, distribution or bottling of drinking-water. Initially, this research should focus on drinking-water thought to be most at risk of particulate contamination.
• Drinking-water studies would be usefully supplemented by better data on fresh waterthatenablethefreshwaterinputstobequantifiedandthemajorsourcesidentified.Thismayrequirethedevelopmentofreliablemethodstotrackoriginsand identify sources.
• A set of standard methods is needed for sampling and analysing microplastics in drinking-water and fresh water.
• Thereisasignificantknowledgegapintheunderstandingofnanoplasticsintheaquaticenvironment.Afirststeptoaddressthisgapistodevelopstandardmethodsfor sampling and analysing nanoplastics.
Chapter 2: Occurrence of microplastics in fresh water and drinking-water 25

26 Microplastics in drinking-water
3. Possible human health risks associated with microplastics in drinking-water: particles and chemicals
3.1 Introduction
Microplastics can present several unique challenges for traditional human health risk assessment approaches. Microplastics are not single chemicals or well-characterized substances but are particles that vary in shape, size and composition. Plastic polymers are generally considered to be of low toxicity. Being insoluble, they are unlikely to be absorbed from the gastrointestinal (GI) tract and generally do not interact with biologicalmatrices, although particle sizemay influence absorption and toxicity(i.e. smaller particles may represent a greater hazard). However, plastics can contain additives and unbound monomers, which may leach out either into the surrounding water environment prior to human consumption or potentially, into the GI tract to become bioavailable under some circumstances. Further, plastic particles can sorb chemicals from the environment, some of which are of toxicological concern. The potential hazards from microplastic particles and chemicals associated with microplastics are explored in this chapter along with an assessment of their potential risk to human health.
The next chapter (Chapter 4) explores the hazards and potential risks associated with plastics in the environment (see Box 3.1), including microplastics that can provide a surface formicroorganisms to attachandcolonize (knownasbiofilms)with somepotentialforpathogenicorganismstobepartofthisbiofilm.
Box 3.1 Risk is a function of toxicity and exposure
The potential hazards associated with microplastics in drinking-water come in three forms: particles presenting a physical hazard; chemicals, including monomers, additives and sorbed substances; and biofilms. Chapters 3 and 4 provide an assessment of these potential hazards along with an assessment of risk, which is a function of both toxicity and exposure. The same substance can have different effects at different doses, which depends on how much of the substance a person is exposed to and may also depend on the route by which the exposure occurs, e.g. ingestion, inhalation or injection. Consequently, the potential toxicity of these substances does not necessarily equate to risk in drinking-water. Similarly, the potential presence of a chemical, or release from plastic, does not in itself imply a risk to human health. Chemical risks are explored more thoroughly than other risks because there are more data available to inform risk scenarios.
Chapter 3: Possible human health risks associated with microplastics in drinking-water: particles and chemicals 27
3.2 Potential hazards associated with particles
Humans routinely ingest many different kinds of particles consisting of a variety of substances. Toxicity posed by particles is dependent on a wide range of physical properties that include size, surface area, morphology (shape), and surface characteristics. Toxicity can also depend on the chemical composition of the particles (discussed in section 3.3). Although toxicity is relatively well studied for inhaled particles, the toxicity of ingested particles is less understood. The fate and transport of particles following ingestion, particularly in the context of physicochemical properties, is not well studied. However, it is likely humans have ingested plastic particles for decades as a result of widespread contact with plastics in household objects including cutting boards, food packaging, and direct contamination in air and food.
When considering potential hazards from exposure to plastic particles, the actual particle component of the substance (i.e. physical hazard) and implications for toxicity and kinetics with oral exposure need to be assessed.
3.2.1 Toxicological data on microplastic particles
To date, most toxicological tests of microplastics have focused on aquatic organisms or ecotoxicology. No epidemiological or human studies on ingested microplastics have beenidentified.Datafromstudiesonlaboratoryanimalsarescantandinadequatetoinform human health risk assessment of microplastics ingestion. The current database of information on plastic particle toxicity (and absorption) is limited to a few studies usingPET,PSorPE,andtherearequestionsregardingthereliabilityofsomeofthesestudies,whicharebrieflydescribedbelow.
InanOECD-compliant90-daydietarystudy,notreatment-relatedadverseeffectsonblood parameters, organ weights or histopathology (including liver, a potential target organ)aswellasmutagenicity,wereseenwhenfinelygroundPETpowderwasmixedinto the diet of 10 Sprague-Dawley rats per sex and dosed at 0, 0.5, 2.5 or 5% (Merksi et al., 2008). Particle sizes and counts were not reported, although particles were likely in the range of 1 to 50 µm (Welle and Franz, 2018). Although the study authors didnotidentifyano-observed-adverse-effectlevel(NOAEL)basedonthereportedresults,theNOAELcanbeconsideredthehighestdose,equivalenttoapproximately2500 mg/kg body weight (bw)/day, assuming a default 5% food factor for rats.
In non-standard studies in mice, liver effects reported by Deng et al. (2017) are considered with caution due to notable limitations in study design, data reporting and biological plausibility of results (Böhmert, Stock and Braeuning, 2019; Braeuning, 2019). Briefly,fivemicepergroupthatwereexposedtohighconcentrationsofPSparticles

28 Microplastics in drinking-water
(mixture of 5 x 10⁶ particles of 5 µm and 1 x 10⁵ particles of 20 µm at 0.5 mg/day for 28daysviagavage)exhibitedhepaticinflammationandlipiddropletsatthishighestdosetested,adoseselectedasbeingfive-foldhigherthanenvironmentalexposures(Deng et al., 2017). However, incidence or severity data were not reported and effects on biochemical or molecular endpoints from this study have unclear functional or biological relevance. Male mice exposed to very high concentrations of PS particles (1.5 x 10¹⁰ particles/L of 0.5 µm at 100 or 1000 µg/L or 1.5 x 10⁴ particles/L of 50 µm at 100 or 1000 µg/L in drinking-water for 5 weeks) had altered lipid metabolism and gut microbiota compared to controls (Lu et al., 2018). Another study in the same laboratory associated the altered gut microbiota, intestinal mucus secretion, and barrier function to the presence of 5 µm PS particles in the gut after these high exposures (1.5 x 10⁶ particles/L at 100 µg/L or 1.5 x 10⁷ particles/L at 1000 µg/L in drinking-water for 6 weeks) (Jin et al., 2019). The relevance of these high exposure scenarios where effects were reported in non-standard studies to human drinking-water exposures, as described in section 2.6, is questionable.
Inthesingleidentifiedstudythatevaluatedoraltoxicityofnanoplasticsinamammaliantest species, no effects on body weight or on a battery of neurobehavioral tests were seen in adult male Wistar rats administered PS nanoplastics (mixture of 25 and 50 nm, average hydrodynamic diameter of 38.92 nm) via gavage at 0, 1, 3, 6, or 10 mg/kg bw/dayfor5weeks(particlecountnotreported)(Rafieeetal.,2018).
Aco-exposurestudywithPEorPSmicroplastics(2000µg/L)andorganophosphorusflameretardantsfor90daysindrinking-water(Dengetal.,2018)wasnotreviewedfurther due to the very high microplastic exposure and the inability to assess the individualcontributionsofPE,PSortheflameretardantstotheobservedeffects.
In vitro assays in human cell lineswere limited to a study inwhich PS and PEmicroplasticsintwohumancelllinesshowedoxidativestressforPSbutnotforPEand only at the highest concentration of 10 mg/L (Schirinzi et al., 2017), a very high concentration of unclear relevance to in vivo exposures. No effects were seen at the lowerconcentrationsof0.05,0.1or1mg/L.Thelimitednumberofidentifiedinvitroand/or non-mammalian studies were not reviewed further due to limited relevance to the present human health effects assessment.
Studies on the release of plastic particles from surgical materials, such as prostheses, are of limited utility to inform possible health effects of microplastics (FAO, 2017; US EPA2017).Thesestudieshavereportedchangesingeneexpression,DNAdamage,oxidativestress,cellularproliferation,tissuenecrosisandinflammationbutrepresentavery different exposure scenario from that of ingested microplastics in drinking-water andtherelevanceofthesefindingsishighlyuncertain.

Chapter 3: Possible human health risks associated with microplastics in drinking-water: particles and chemicals 29
There have been some studies that examined the effects of occupational exposure in the polymer industry and also exposure in non-occupational settings from indoor aircausedbyinhalationofpolymerparticles(WrightandKelly,2017;SAPEA,2019).However, these exposure scenarios have unclear relevance to exposure through drinking-water.
3.2.2 Microplastic and nanoplastic uptake and kinetics
To assess possible risks associated with ingestion of plastic particles, it is important to understand how the particles will behave within the human body, and especially whether there is uptake in the GI tract. Uptake kinetics for microplastics and nanoplastics have beenexaminedbytheFAO(2017)andtheEFSAPanelonContaminantsintheFoodChain(EFSA,2016).Basedonlimiteddataandbiologicalassumptionsdiscussedbelow,theEFSApanelconcludedthatthelargestfractionofingestedmicroplastics(>90%)was not likely to be absorbed and likely to be excreted directly through faeces, that microplastics >150 µm were likely not absorbed and that uptake of smaller microplastics was expected to be limited (i.e. ≤0.3%). Similar conclusions based on similar assumptions were reached by FAO, including unlikely absorption for microplastics >150 µm and limited overall absorption and uptake into organs for particles <20 µm. It is possible that absorptionanddistributionmaybemoresignificantfornanoplasticsthanmicroplastics(up to 0.3% for microplastics <150 µm and up to 7% for nanoplastics <0.1 µm) (FAO, 2017).However,EFSA(2016)andFAO(2017)bothcautionagainstextrapolationsfrom the limited data available on only one type of nanoplastic.
EFSAandFAOconclusionsarebasedonseveralstudiesincludingoneinwhichuptakeof 2 µm latex particles by rodents was reported as 0.04–0.3% (Carr et al., 2012) and another in which uptake of 3 µm polylactide-co-glycolide in mounted human colon tissue was approximately 0.2% for healthy individuals and 0.45% for tissues of patients withinflammatoryboweldisease(Schmidtetal.,2013).Thesizethresholdof<150µmwas selected based on limited data suggesting that particles in this size range possibly translocate from the gut into the lymphatic system (Hussain, Jaitley and Florence, 2001) and based on the translocation of PVC particles up to 110 µm to the portal vein of dogs (Volkheimer, 1975). Furthermore, particles >130 µm cannot cross the epithelium through persorption mechanisms. A recent study reported in the FAO document but notemployedtodrawconclusionsexamineduptakeanddistributionoffluorescentPS microplastics (1.46 x 10⁶ particles/L of 5 µm and 2.27 x 10⁴ particles/L of 20 µm) that were orally administered to mice over 4 weeks. Translocation to the liver and kidney reportedly occurred and particles could be detected 1 week after cessation of exposure (Deng et al., 2017). However, the plausibility of this study has been criticized due to inconsistencies related to analytical and mathematical methods used to estimate

30 Microplastics in drinking-water
target organ burdens (Böhmert, Stock and Braeuning, 2019; Braeuning, 2019). Before any indications of possible absorption or adverse effects can be inferred, the results need to be replicated after the methodological limitations are resolved.
Nanoplastic absorption may be potentially higher than their larger microplastic counterparts; however, the database is even more limited. Uptake of nanoscale (i.e. <0.1 µm) PS ranged from 0.2–7% in in vivo studies in rats (Jani et al., 1990; Walczak et al., 2015a) and 1.5–10% in in vitro studies (des Rieux et al., 2007; Kulkarni and Feng, 2013;Walczaketal.,2015b)(presentedinEFSA,2016);therestwaseliminatedwithfaeces as unabsorbed material.
3.2.3 Information from broader particle toxicology
Potential effects in the gutAs noted above, most microplastics ingested via drinking-water are expected to pass through the Gl tract without being absorbed. However, because the gut is the primary tissuethatwillcomeintocontactwith ingestedparticles, ithasbeen identifiedasthe tissue most likely to show effects. Oral exposure to particles in general, albeit at veryhighlevels,hasbeenassociatedwithmildintestinalirritationandinflammation.There is speculation based on inferences from other particles (e.g. titanium dioxide and aluminosilicates) that plastic particles could accumulate in phagocytes of gut tissue (Wright and Kelly, 2017). While accumulation in phagocytes could potentially interfere with their function and compromise lymphocyte detection of infections and impair local immunity, this interference remains to be established. PS particles (1.5 x 10¹⁰
particles/L of 0.5 µm or 1.5 x 10⁴ particles/L of 50 µm) were also shown to alter the gut microbiome in mice exposed to high doses of 100 and 1000 µg/L through drinking-water for 5 weeks (Lu et al., 2018). Chickens exposed to 50 or 200 nm carboxylated PS nanoparticles at high doses (2 mg/kg bw/day for 2 weeks) showed increased iron uptake, suggesting that exposure to nanoplastics may affect the barrier properties of the gut epithelium (Mahler et al., 2012). Particle counts were 2 x 10¹³ particles/L of 50 nm or 1.25 x 10¹²particles/Lof200nm.Givensignificantinter-speciesvariationsinthemicrobiome,therelevanceofthesefindingstohumansneedstobeinvestigatedfurtherbeforedrawinganyfirmconclusions.
Particle properties and potential toxicity Thesizeandconcentrationofmicroplasticparticlesmayinfluencetheirpotentialfortoxic effects. As noted in section 3.2.2, smaller particles are more likely to cross the gut wall and reach other tissues. Moreover, as particle size decreases, its surface-area-to-volume ratio increases, which may make smaller particles more susceptible to adsorbing biologically-significant proteins andmolecules. Furthermore, in theenvironment, the increased particle surface-area-to-volume ratio theoretically increases

Chapter 3: Possible human health risks associated with microplastics in drinking-water: particles and chemicals 31
the sorption capacity of environmental chemicals relative to particle weight. An increased surface-area-to-volume ratio also means that microplastics degrade faster than larger plastic particles (Gewert, Plassmann and MacLeod, 2015), although it is not clear if conditions in the human GI tract are amenable to plastic degradation. One studyhasshownthatAntarctickrillcanfragmentPEparticlesof31.5µmtopiecessmaller than 1 µm (Dawson et al., 2018), thus suggesting the potential for microplastics to break down into smaller plastic particles within at least some biological systems. Particlecount(concentration)informationisoftennotreportedandmayinfluenceobserved responses at higher concentrations by overwhelming biological mechanisms responsible for particle clearance.
Additional considerations including particle morphology and surface chemistry may play an important role in particle uptake and clearance in the lung (e.g. particularly evasion of clearance mechanisms), but how this relates to ingested plastic particles, whichcanoccurinirregularshapesorasfibres,islesscertain.
Aging plastics have been shown to form oxygen-containing functional groups on their surfaces. Therefore, weathered plastic particles may have different physicochemical properties including reduced hydrophobicity, which could reduce their ability to sorb hydrophobicsubstances(Endo,2005)butincreasepotentialforsorptionofhydrophilicorganic pollutants (Liu et al., 2019). Further, any particle with a diameter of less than 0.1 µm in any dimension, including nanoplastics, may exhibit physicochemical properties different from the bulk material (Khan, Saeed and Khan, 2017).
3.3 Potential hazards associated with monomers, additives and sorbed chemicals
3.3.1 Monomers
Polymerization reactions do not generally proceed to full completion, resulting in a small proportion of monomers that are free to leach from polymerization products. Residual monomer content can range from negligible to up to 4% depending on the type of polymer produced and polymerization technique used (Araújo et al., 2002; Lithner, Larsson and Dave, 2011). Biodegradation of plastics (e.g. by microorganisms on biofilms)andplasticweatheringmayalsodegradeplasticpolymersintomonomersandoligomers; however, the extent to which this occurs is uncertain. Should degradation occur, it should be noted that unbound monomers are likely to leach in the environment, resulting in extremely small concentrations in drinking-water sources and that many are not stable in water. For example, propylene oxide would convert to propylene glycol which has low toxicity (Trent, 2001).

32 Microplastics in drinking-water
Some monomers, such as acrylamide, 1,3-butadiene, ethylene oxide and vinyl chloride are considered more hazardous than others based on a hazard ranking approach for 61 monomers described in Lithner et al. (2011). The risk associated with these monomers variessignificantly,dependingonanumberoffactors,includingthelevelandrouteof exposure. The WHO Guidelines for Drinking-water Quality (2017a) assessed six ofthesemonomersandestablishedguidelinevaluesforfivesubstances(acrylamide,epichlorohydrin, 1,4-dichlorobenzene, styrene, and vinyl chloride) ranging from 0.3 (for vinyl chloride) to 300 µg/L (for 1,4-dichlorobenzene) (WHO, 2003d, e; 2004c, e; 2011a; 2017a). These guideline values generally represent concentrations in drinking-water thatdonotresultinanysignificanthealthriskoveralifetimeofconsumption(WHO,2017a). Of these, only vinyl chloride was assessed as a monomer associated with plastic, as it can be released from unplasticized PVC pipes. Acrylamide and epichlorohydrin were assessed in relation to coagulant aids and styrene, 1,4-dichlorobenzene and formaldehyde as pollutants or by-products of water treatment. Formaldehyde was also assessed but no formal guideline value was established, although a tolerable concentrationwasidentifiedat2.6mg/L(WHO,2005).
3.3.2 Additives
Additivesareincorporatedintoplasticsinvariousquantitiestoconferspecificproperties.In contrast to monomers, additives are not covalently bound to the polymer (with the exception of a few that are co-polymerized) and can thus leach into the surrounding environment (Hahladakis et al., 2018). Following the principles of thermodynamics, chemical additives will leach in a manner that enables them to reach a thermodynamic equilibrium with their surroundings, potentially resulting in chemical additives from microplastics being emitted to air, water and soil.
Themolecularweightofadditivesmayalsoinfluencetheirreleaseintotheenvironment.In general, small, low molecular weight molecules can migrate at a faster rate than larger additives. Substances with a molecular weight higher than 600 g/mol have a low tendency to migrate from plastic (Hansen et al., 2013). Migration may potentially increase as plastics age and weather, although this phenomenon is not well understood (Suhrhoff and Scholz-Böttcher, 2016; Jahnke et al., 2017).
There are no data to quantify the relative importance of microplastics in contributing to chemical additives in the environment, including drinking-water. However, relative to other emission routes of additives to the environment, it is anticipated that leaching from microplastic will be relatively small. Although some plastic additives, such as phthalates,PBDEandleadorcadmium-containingcolorants,areconsideredhazardousatsufficientexposures,health-basedvalues,regardlessofsource,havebeenestablishedfor many of these additives by international agencies.
Chapter 3: Possible human health risks associated with microplastics in drinking-water: particles and chemicals 33
There is limited information to support the possibility that microplastics act as a vector of transport for chemical additives. A study by Tanaka et al. (2015), for instance, reports thepresenceofdecaPBDEinthestomachoilofseabirdsasaresultofplasticingestion.Other studies, such as by Koelmans, Besseling and Foekema (2014), appear to question the relative importance that leaching of nonylphenol and BPA from microplastic plays as a source of contamination to lugworms and cod.
Many efforts have been taken to reduce the use of additives-of-concern from plastics (especiallyforphthalates,PBDEs,cadmium,leadandBPA).However,itispossibleforthese substances to be present in older plastics, which may degrade into micro- or nanoplastics in the environment.
3.3.3 Sorbed chemicals
The hydrophobic nature of microplastics implies that they have the potential to accumulate hydrophobic substances such as persistent organic pollutants (POPs), including PCBs, PAHs, and organochlorine pesticides. Indeed, the capacity of plastic polymers, such asPEandPUR,toaccumulatePOPsfromtheenvironmentisafundamentalprincipleintheirapplicationaspassivesamplersusedforenvironmentalmonitoring(Mülleretal., 2001; Adams et al., 2007; Hale et al., 2010; Lohmann et al., 2012).
Observations reporting the concentration of POPs associated with microplastics have largely focused on the marine environment. Data from the literature spanning four decadeshavebeenreviewedinWangetal.(2018),forinstance,whoreportsignificantlyhigher concentrations of POPs in microplastics near populated urban areas, which is consistent with the relative level of contamination of the surrounding environment for these contaminants. In 2005, the International Pellet Watch was launched as a volunteer-based means of monitoring POPs on unintentionally released plastic particles collected on beaches around the world (Pellet Watch, 2019). Some information on reported concentrations of chemicals detected in microplastics, including some POPs, is included in Table 3.2.
In addition to accumulating in microplastics, it is well understood that POPs will indiscriminately sorb to organic carbon in the environment, such as that found in sediment, algae and the lipid fraction of biological organisms. Given the relative abundance of sediment, algae and aquatic organisms compared to microplastic particles in freshwater environments, the fraction of POPs sorbed to microplastics will be small compared to the other environmental media. Thus, the relative importance of microplastics to act as a vector of transport of POPs is likely to be negligible (Koelmans et al., 2016).
Should microplastics be ingested through drinking-water, the rate at which chemicals are released or taken up from microplastic in the GI tract will depend on interactions
34 Microplastics in drinking-water
between the chemical and the microplastic particle itself, as well as the properties of the surrounding environment (Karapanagioti and Werner, 2018). For instance, chemicaluptakeandreleasecanbeinfluencedbythesizeoftheparticles,wherebydecreasing size increases the rate of uptake or loss (Lassen et al., 2015). In studies using a simulated gut fluid, the release of POPs, such as PCBs, can be observedwherebyarelativelyuncontaminatedgutfluidandlongresidencetimecanresultinsignificantchemicalleaching.Alternatively,whenthegutfluidalreadycontainsthechemical contaminant, the reverse process can be observed, with uptake into the plastic occurring (Mohamed Nor and Koelmans, 2019). Consequently, the relative potential for POPs to leach from microplastics will depend on a variety of factors, including the relative size of the particle, mass of chemical accumulated, relative level of contamination within the gut, and the GI residence time of the particle.
As it is well understood that POPs are associated with a variety of potentially adverse human health effects, health-based values have been established for many of them by international agencies. For example, WHO has developed a drinking-water guideline value for benzo(a)pyrene of 0.7 µg/L; this compound is associated with particles from old coal tar-lined water mains (WHO, 2003c).
3.4 Assessing possible risks from microplastics
In assessing the potential human health risks from exposure to microplastics in drinking-water,afirststepistoconsidertheexposurefromthatsource.
There is currently a paucity of information to quantitatively assess any potential risk associated with exposure to microplastic particles. Considerations related to certain risk aspects of particle exposure are discussed in section 3.4.1.
With respect to chemicals associated with microplastics, due to the limited data available, estimates of exposure are made using an extremely conservative approach described in section 3.4.2. This analysis provides a means for estimating upper-bound contributions of exposure to microplastics from drinking-water and represents the starting point in a tiered risk assessment. If there is no apparent risk in an extreme exposurescenario,thenthereisnoneedtorefinetheassumptionsunderpinningtheexposure assessment unless and until more information becomes available that might contradict these assumptions.
To characterize the risk for chemicals associated with microplastics, the estimated exposure in drinking-water can be compared to conservative levels at which adverse biological effects could be observed (the toxicological point of departure, or POD) todetermineifthereisasufficientlylargemarginofexposure.

Chapter 3: Possible human health risks associated with microplastics in drinking-water: particles and chemicals 35
3.4.1 Assessment of risk related to particle exposure
Thereisinsufficientinformationtodrawfirmconclusionsonpotentialriskassociatedwith exposure to particles at this time. However, the polymers comprising microplastic particles are generally considered to be inert when ingested and the limited evidence on particle kinetics suggests that a large fraction of microplastics pass through the digestive system without uptake. Potential uptake of very small microplastic particles is a topic of emerging research interest. However, the limited studies that have investigated uptake of microplastic particles <50 µm in size lack methodological robustness and present findings only at extremely elevated exposureconcentrations. Elevated levels of exposureto particles are likely to overwhelm biological mechanisms that would allow particle clearance, and therefore, there is no information of suitable quality to draw any conclusions on uptake of small particles at this time. It is unclear if absorption of small plastic particles in the GI tract, like other inert particulate matter to which humans are exposed to on a regular basis, would pose any human health concerns. As noted earlier, it is almost certain that humans have been exposed to microplastics for decades, as well as other particles in the environment for much longer. Overall, there does not seem to be any reliable information at this time that would suggest any overt health concerns associated with microplastic particles. This does not mean that plastic particles are a priori innocuous, as this cannot be determined with any accuracy at present with the limited data on microplastics in drinking-water. Consequently, assessing the potential hazards,exposureandtherebyriskwouldbenefitfromstudiesthatcanidentifythoseproperties of microplastic particles that might represent a hazard and then develop methods aimed at assessing their exposure to enable a robust assessment of risk.
3.4.2 Assessment of risk related to chemical exposure
As described in section 3.3, microplastic particles can contain unreacted monomers and various additives, such as stabilizers and colourants, which may leach out in water or the GI tract. Regulatory systems for plastics in contact with food or water consider the leaching potential of these substances into environmental media as part of the approval process. While regulations do not directly relate to human consumption of plastic particles, they do constrain the additives and residual monomer content that can be included, which is particularly important for plastics in contact with drinking-water that could be a source of particles. However, many plastics not intended for
Although there is insufficient information to draw firm
conclusions on the toxicity related to the physical hazard of plastic particles, particularly
the nano size particles, no reliable information suggests
it is a concern through drinking-water exposure.
36 Microplastics in drinking-water
contact with food or water (which are likely to be a key source of microplastics in freshwater environments) will not have undergone such assessments and may contain unregulated substances and substances at potentially higher concentrations. There is also the potential for some microplastics in the environment to sorb substances that could be a concern at higher concentrations. To estimate potential human health risk, thefirststepinatieredapproachistodeterminewhetherveryhighexposurestothese potential hazards pose a risk to consumers.
3.4.2.1 Conservative Exposure ScenarioA scenario that would result in very high exposure to microplastics is presented below. This scenario is intended to represent an extreme case and in the absence of a more thorough understanding of the factors contributing to exposure, is likely to exaggerate probable exposure. Assumptions are made regarding the size, shape and density of the microplastic particle and the particle numbers in drinking-water. Table 3.1 lists all exposure assumptions and provides an indication of the level of conservativism of each. While it is important to remember that multiplying a series of theoretical extreme assumptions can lead to assumed situations that are well outside the realms of realistic exposure in the environment, or in this case drinking-water, it is a useful screeningtooltoindicatewheretheevaluationmayneedtoberefined.
Considering the above assumptions on particle characteristics and a default consumption of 2 L of drinking-water/day (WHO, 2017a), an intake of 85 µg of microplastics/day can be estimated. This corresponds to an intake of 1.4 µg microplastics/kg bw/day based on a default body weight of 60 kg for an adult, which is considered to be extremely conservative and highly unlikely since it is based on a combination of extreme scenarios.
Applying the same assumptions to actual data on particle numbers and sizes reported by Kosuth, Mason and Wattenberg (2018), Oßmann et al. (2018), Pivokonsky et al. (2018) and Schymanski et al. (2018), more realistic estimated intakes would be around 2µg/dayor0.03µg/kgbw/day.EstimatedintakebasedondatafromMintenigetal.(2019) on particle numbers and sizes is 0.01 µg/day. Welle and Franz (2018) estimated intakesrangingupto8.7µg/day.Forthesakeofcomparison,EFSA(2016)estimatedthat a worst-case intake from seafood alone based on a 225 g portion of mussels would be 7 µg microplastic.
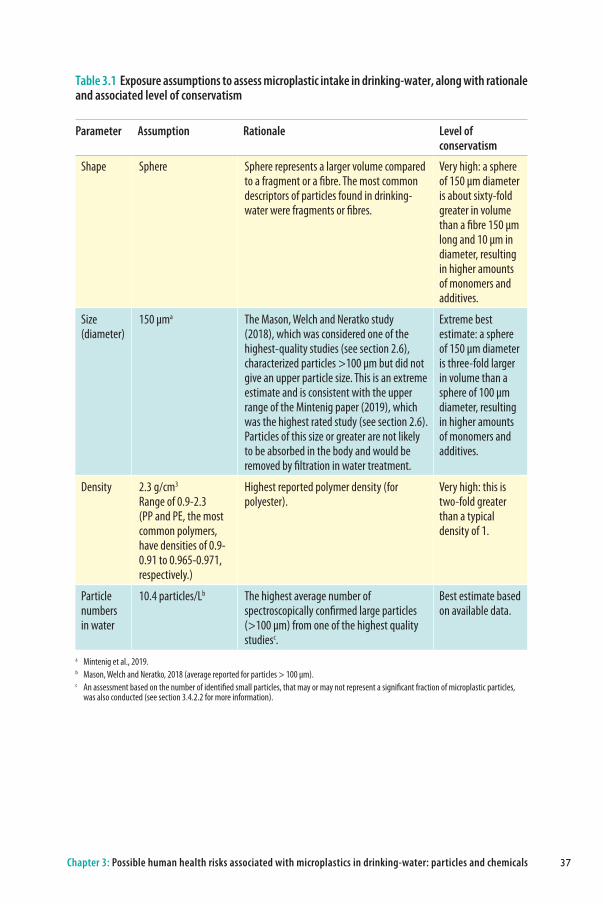
Chapter 3: Possible human health risks associated with microplastics in drinking-water: particles and chemicals 37
Table 3.1 Exposure assumptions to assess microplastic intake in drinking-water, along with rationale and associated level of conservatism
Parameter Assumption Rationale Level of conservatism
Shape Sphere Sphere represents a larger volume compared to a fragment or a fibre. The most common descriptors of particles found in drinking-water were fragments or fibres.
Very high: a sphere of 150 µm diameter is about sixty-fold greater in volume than a fibre 150 µm long and 10 µm in diameter, resulting in higher amounts of monomers and additives.
Size (diameter)
150 µma The Mason, Welch and Neratko study (2018), which was considered one of the highest-quality studies (see section 2.6), characterized particles >100 µm but did not give an upper particle size. This is an extreme estimate and is consistent with the upper range of the Mintenig paper (2019), which was the highest rated study (see section 2.6). Particles of this size or greater are not likely to be absorbed in the body and would be removed by filtration in water treatment.
Extreme best estimate: a sphere of 150 µm diameter is three-fold larger in volume than a sphere of 100 µm diameter, resulting in higher amounts of monomers and additives.
Density 2.3 g/cm3
Range of 0.9-2.3(PP and PE, the most common polymers, have densities of 0.9-0.91 to 0.965-0.971, respectively.)
Highest reported polymer density (for polyester).
Very high: this is two-fold greater than a typical density of 1.
Particle numbers in water
10.4 particles/Lb The highest average number of spectroscopically confirmed large particles (>100 µm) from one of the highest quality studiesc.
Best estimate based on available data.
a Mintenig et al., 2019.b Mason, Welch and Neratko, 2018 (average reported for particles > 100 µm). c An assessment based on the number of identified small particles, that may or may not represent a significant fraction of microplastic particles,
was also conducted (see section 3.4.2.2 for more information).

38 Microplastics in drinking-water
3.4.2.2 Margins of exposure assessmentWhen assessing risk of environmental chemicals, it is common to use a screening level marginofexposure(MOE)approach.Here,atoxicologicalPOD,usuallyaNOAELoralowerconfidencelimitonthebenchmarkdose(BMDL)fromlaboratoryanimalstudies,is divided by the estimated human exposure to characterize potential health risks. MOEsofatleast100whenbasedonanimaldataand10whenbasedonhumandataare an indication for low health concern for effects with an apparent threshold (FAO/WHO, 2009). For genotoxic carcinogens there is low health concern for compounds withanMOEabove10000.Suchdefaultsareconsideredadequatelyprotectiveofawide range of individuals within the population, particularly when combined with the elevated assumptions in the exposure assessment, as carried out here.
To calculate theMOE associatedwithmicroplastics in drinking-water, chemicalswere included if:
• they have been detected in microplastics, • are of toxicological concern, and • haveadequateoracceptedtoxicologicalPODsforderivingaMOE(onthisbasis,leadandper-andpolyfluoroalkylsubstances(PFAS)wereexcludedfromtheMOEapproach).
In calculating the estimated daily intakes of chemicals associated with microplastics, the very conservative exposure assumptions as described in table 3.1 were maintained and additional exposure assumptions were added (see Table 3.2):
Table 3.2 Exposure assumptions to assess microplastic intake in drinking-water, along with rationale and associated level of conservatism
Parameter Assumption Rationale Level of conservatism
Chemical concentrations in microplastic
Highest reporteda
Upper-bound concentrations measured, although data are limited to marine microplastics.
High: concentrations often vary over several orders of magnitude and concentrations of contaminants in marine microplastics may be much higher than in fresh water since they will have longer to equilibrate. For some of the studies there was a three-fold difference in concentration between the highest and second highest value and more when compared with a mean.
Leaching/bioavailability of the chemical contaminant in the body
100% In the absence of information on leaching in the GI tract, complete release is assumed.
Very high: release from plastics is complex; more information on extraction with gut fluid would help refine this assumption.
a Highly variable. Data quality not assessed.
Chapter 3: Possible human health risks associated with microplastics in drinking-water: particles and chemicals 39
AsshowninTable3.3,MOEvaluesderivedinthisriskassessmentwereadequatelyprotective, indicating low health concern for exposure to chemicals in microplastics through ingestion of drinking-water. Margins of exposure were generally much greater than 100, and for the two genotoxic carcinogens (benzo(a)pyrene and hexachlorobenzene), were greater than 10 000.
AlthoughtheMOEvaluesindicatealowhealthconcernforhumanexposuretochemicalsthrough ingestion of drinking-water containing microplastics at the levels detected in theavailablestudies,thereissignificantuncertaintyrelatedtoexposuretosmallerplastic particles. One study by Mason, Welch and Neratko (2018) that investigated microplastics in bottled water measured 315 particles/L, for the size fraction of 6.5 to 100 µm (median particle size = 53.25 µm) that could be plastic. While there is some uncertainty whether these smaller particles are indeed plastic particles, an exposure scenario was also calculated using these assumptions of size and particle number. Changingtheseassumptionsdidnotsignificantlyimpact the outcome of the preliminary risk calculation;MOEswere only 1.4-fold less thancalculated using assumptions of 10.4 particles/L of 150 µm, and remained adequately protective for all chemicals. Applying assumptions with higher particle numbers in smaller size ranges would not change the conclusions.
MOE values derived in this risk assessment were
adequately protective, indicating low health concern
for exposure to chemicals in microplastics through
ingestion of drinking-water. Applying assumptions with higher particle numbers in smaller size ranges would
not change the conclusions.

40 Microplastics in drinking-water
Table 3.3 Upper-bound daily intake estimates of chemicals from microplastics, maximum levels of contaminants associated with microplastics, and corresponding MOE
a Comparison of maximum daily intakes for all substances to their respective WHO health-based drinking-water values also demonstrated a negligible contribution of these chemicals from microplastics in drinking-water. Contributions from benzo(a)pyrene (WHO, 2003c), chlordane (WHO, 2004a), DEHP (WHO, 2003b), DDT (WHO, 2004b), and hexachlorobenzene (WHO, 2004d) were well below 1%. Contribution of cadmium to the WHO guideline value (WHO, 2011b) is less than 5%. Lead was not considered in this risk assessment because WHO concluded that it was not appropriate to set a health-based guideline value for this metal; the provisional guideline value of 0.01 mg/L is based on practical achievability, where lead may be used in plumbing materials in buildings, including fittings, solders and pipes, as well as service connections to buildings (WHO, 2016). Lead stabilizers were used in unplasticized PVC water pipes but this has not been the case for decades. The highly conservative estimated maximum intake from microplastic particles for a child would be 0.025 μg/kg bw so this would equate to an intake of approximately 2% of the provisional guideline value and therefore of low concern.
b Maximum daily intake = maximum concentration in microplastic [µg/g] × mass of plastic particle [g] × particle concentration in water [particles/L] × daily drinking-water intake [L]/default body weight; where an adult is assumed to consume 2 L water/day, and default body weight is 60 kg (WHO, 2017a). The mass of a plastic particle is calculated as 4/3 r3 x density, where the radius is 75 µm, and density is 2.3 g/cm3. As noted in section 3.4.2, the exposure assessment assumptions were highly conservative. Therefore, this estimated maximum daily intake is extremely improbable; actual intakes are likely to be significantly lower.
BPA: Maximum concentration is from marine microplastics (Hirai et al., 2011). POD is human equivalent dose from a lower 95% confidence limit on the benchmark dose for a 10% response (BMDL10) based on kidney weight changes in mice (EFSA, 2015). A more recent draft report of an extensive study by the National Toxicology Program in the USA (2018) concluded that “BPA produced minimal effects that were distinguishable from background in this study, particularly below 25 mg/kg bw/day.” This is greater than 25 times the POD used here. Because it is still in draft, the original value was retained, but it is probably highly conservative in comparison to the most recent data. Cadmium: Maximum concentration is from the southwestern English shore (FAO, 2017; Massos and Turner, 2017). Note that cadmium-based pigments are now rarely used in plastics nor have cadmium compounds been used as stabilizers in plastics in contact with drinking-water. Cadmium is rarely detected in drinking-water above the WHO drinking-water guideline value of 3 µg/L; the MOE for cadmium is calculated using the POD corresponding to the 5th percentile level of calcium intake (as indicated by urinary biomonitoring marker for renal pathology) in an extensive human study in individuals aged 50 years or older (JECFA, 2011). Chlordane: Maximum concentration is from a review of concentrations in marine microplastics (Nerland et al., 2014); POD is NOAEL from a long-term study in rats (WHO, 2004a).DDT: Maximum concentration in marine microplastics is estimated from the sum of DDT congeners (Rios, Moore and Jones, 2007). Based on the information presented in Rios, Moore and Jones (2007), it is estimated that the concentration of DDT is 1.6 µg/g. Note that concentrations of DDT in the environment has decreased over time. POD is NOAEL for DDT based on developmental toxicity in rats (FAO/WHO, 2001). Therefore, the estimated MOE is likely to be conservative.DEHP: Maximum concentration is from the coastal beaches of North China (Zhang et al., 2018). DEHP is primarily used in PVC and can account for 10–40% of PVC; POD is NOAEL based on liver peroxisome proliferation in rats (WHO, 2003b).Hexachlorobenzene: Maximum concentration is from marine microplastics from the coastal beaches of Brazil (Taniguchi et al., 2016). POD is NOAEL from hepatic effects in pigs and rats (IPCS, 1997). Tumorigenic dose associated with a 5% incidence for tumours (TD5) for neoplastic effects is also available, but provides a larger MOE.PAHs: Maximum concentration is the sum of 16 PAHs in marine microplastics in China (Mai et al., 2018). Benzo(a)pyrene, the most thoroughly studied and highly potent PAH has low solubility and has been rarely detected in drinking-water at concentrations above 10 ng/L; POD is BMDL10 for benzo(a)pyrene-induced forestomach and lung tumors in mice (JECFA, 2006b). PBDEs: Maximum concentration is the sum of 20 PBDEs from marine microplastics (Hirai et al., 2011). The limited toxicity data suggested that for the more toxic PBDE congeners, adverse effects would unlikely occur in rodents at doses of less than 100 µg/kg bw/day. POD as cited by the Joint FAO/WHO Expert Committee on Food Additives (JECFA 2006a) is conservative compared to more recent assessments by other agencies.PCBs: Maximum concentration is from marine microplastics in Japan (Endo, 2005). POD is lowest-observed-adverse-effect level (LOAEL) for decreased immune response in monkeys (IPCS, 2003).
Chemicala Upper bound concentration in microplastic (μg/g)
Maximum daily intake (ng/kg bw/day)b
Point of departure (µg/kg bw/day)
Margin of exposure (MOE)
Adequacy of MOE Conclusion Chemical
Bisphenol A 0.7297 0.001 609 5.9 × 10⁸ MOE of at least 100 No safety concern Bisphenol A
Cadmium 3390 5.0 0.8 1.7 × 10² MOE of at least 10c No safety concern Cadmium
Chlordane 0.0144 0.00002 50 2.5 × 10⁹ MOE of at least 100 No safety concern Chlordane
Di(2-ethylhexyl)phthalate 0.0699 0.0001 2500 2.5 × 10¹⁰ MOE of at least 100 No safety concern Di(2-ethylhexyl)phthalate
Dichlorodiphenyltrichloroethane 7.1 0.0001 1000 1.0 × 10⁸ MOE of at least 100 No safety concern Dichlorodiphenyltrichloroethane
Hexachlorobenzene 0.0587 0.00002 50 6.0 × 10⁸ MOE of at least 100 No safety concern Hexachlorobenzene
Polyaromatic hydrocarbons 119 0.06 100 6.0 × 10⁵ MOE of at least 10 000 No safety concern Polyaromatic hydrocarbons
PBDEs 9.9 0.01 100 7.2 × 10⁶ MOE of at least 100 No safety concern PBDEs
PCBs 18.7 0.03 5 1.9 × 10⁵ MOE of at least 1000d No safety concern PCBs

Chapter 3: Possible human health risks associated with microplastics in drinking-water: particles and chemicals 41
c The adequacy of the MOE for cadmium is assessed against a value of 10 as the POD is based on human data and accounted for intra-individual variation in toxicokinetics and toxicodynamics.
d The adequacy of the MOE for PCBs is assessed against a value of 1000 instead of 100 to account for use of a LOEAL instead of a NOAEL as the POD.
Chemicala Upper bound concentration in microplastic (μg/g)
Maximum daily intake (ng/kg bw/day)b
Point of departure (µg/kg bw/day)
Margin of exposure (MOE)
Adequacy of MOE Conclusion Chemical
Bisphenol A 0.7297 0.001 609 5.9 × 10⁸ MOE of at least 100 No safety concern Bisphenol A
Cadmium 3390 5.0 0.8 1.7 × 10² MOE of at least 10c No safety concern Cadmium
Chlordane 0.0144 0.00002 50 2.5 × 10⁹ MOE of at least 100 No safety concern Chlordane
Di(2-ethylhexyl)phthalate 0.0699 0.0001 2500 2.5 × 10¹⁰ MOE of at least 100 No safety concern Di(2-ethylhexyl)phthalate
Dichlorodiphenyltrichloroethane 7.1 0.0001 1000 1.0 × 10⁸ MOE of at least 100 No safety concern Dichlorodiphenyltrichloroethane
Hexachlorobenzene 0.0587 0.00002 50 6.0 × 10⁸ MOE of at least 100 No safety concern Hexachlorobenzene
Polyaromatic hydrocarbons 119 0.06 100 6.0 × 10⁵ MOE of at least 10 000 No safety concern Polyaromatic hydrocarbons
PBDEs 9.9 0.01 100 7.2 × 10⁶ MOE of at least 100 No safety concern PBDEs
PCBs 18.7 0.03 5 1.9 × 10⁵ MOE of at least 1000d No safety concern PCBs

42 Microplastics in drinking-water
3.5 Conclusions and research needs
Investigation of potential risks related to particles indicate that it is possible that some smaller plastic particles may be able to pass through the gut wall and translocate to tissues remote from the mucosa, although this may not necessarily translate to a health risk. Humans have always ingested particles and have ingested plastic particles for decades with no related indication of adverse health effects. In addition, a good deal of evidence suggests that microplastics pass through the GI tract into the faeces. The health effects database of plastic particles is limited to a few studies. Although there are some data of questionable quality to suggest limited uptake of microplastics <50 µm in the GI tract in laboratory animals at high concentrations, the data require confirmationunderrealisticexposurescenarios.Theevidencepresentedbythesestudies does not indicate whether there are risks relating to the physical hazard of plasticparticles.Therefore,itisnotpossibletodrawanyfirmconclusionsontoxicityrelated to microplastic exposure through drinking-water, particularly for the smallest particles, but no reliable information suggests it is a concern.
Withrespecttochemicals,averyconservativeexposurescenarioandMOEassessmentindicates low concern for human health.

Research needs
In order to conduct a more robust human health risk assessment of microplastics, the following data gaps should be addressed:
• There is a need to better understand occurrence of microplastics in drinking-water, as described in Chapter 2, based on high quality and quality-assured detection and enumeration methods. Studies should include nanoplastics when standard methods are available.
• More research is needed to understand the uptake and fate of microplastics in theGItractandtheinfluenceofparticlesize,shapeandchemicalcomposition,particularly in relation to the smallest particles.
• Quality-assured toxicological data from cell models and/or experimental animals are needed for the most common forms of plastic particles that are appropriate for human health risk assessment.
• More knowledge is needed on the characteristics of plastic particles that are most predictive of their toxicity.
• A better understanding of the bioavailability of chemical substances associated withmicroplasticswithintheGItractandotherorganswouldbehelpfultorefinethe exposure assessment.
Chapter 3: Possible human health risks associated with microplastics in drinking-water: particles and chemicals 43
44 Microplastics in drinking-water
4. Possible human health risks associated with microplastics in drinking-water: biofilms
4.1 Introduction
Biofilmsindrinking-wateraretheresultofthegrowthofmicroorganismsondrinking-water pipes and other surfaces (WHO, 2014). In drinking-water distribution systems, biofilmscandetachfromthepipewallsintothewater,representingasourceofthebackground numbers of heterotrophic bacteria that are found in all drinking-water. Althoughmostmicroorganismsfoundinbiofilmsarebelievedtobeprimarilynon-pathogenic,somebiofilmscanincludefree-livingmicroorganismsandopportunisticpathogens such as Pseudomonas aeruginosa, Legionella spp., non-tuberculosis Mycobacterium spp. and Naegleria fowleri. In contrast, obligate enteric pathogens can be harboured withinbiofilmsbutgenerallydonotmultiplyoutsidehostorganisms.
Thecharacterizationofbiofilmsandtheirrelatedhealthrisksfromdistributionsystemsare described in the Guidelines for Drinking-water Quality (WHO, 2017a) and in the Water Safety in Distribution Systems document (WHO, 2014). However, little is knownaboutthepresenceofmicroplastic-associatedbiofilmsindrinking-waterandwhether there are any related possible human health risks. Since the surface area of plastic particles is dwarfed by the surface area of drinking-water distribution and premiseplumbingsystems,thepotentialriskofbiofilmsassociatedwithmicroplasticsisconsideredfarlowerthanforbiofilmsassociatedwithdrinking-waterdistributionsystems. Nevertheless, this chapter discusses the hazards and potential risks associated withbiofilmsthatmayattachtoandcolonizemicroplasticsandfindtheirwayintodrinking-water or drinking-water sources.
4.2 Characteristics of plastics and microorganisms that influencebiofilmformation
Materialsofmanysorts,includingmicroplastics,provideasurfaceforbiofilm-formingorganisms to attach and colonize in aquatic environments. These plastic-associated communities are sometimes referred to as “plastispheres” (Zettler, Mincer and Amaral-Zettler,2013).Severalphysical,chemicalandbiologicalfactorshavebeenidentifiedthatinfluencetheformationofplastispheres,mostlyinmarineenvironments.Surfaceroughnessofsyntheticpolymerspromotesbiofilmformation(Pedersen,1990,Rogerset al., 1994; Nauendorf et al., 2016), while physicochemical properties drive the

Chapter 4: Possible human health risks associated with microplastics in drinking-water: biofilms 45
attachmentprocess.Biofilm-formingorganismsattachfastertohydrophobicnonpolarsurfaces, such as plastics, than to hydrophilic surfaces, such as stainless steel (Rummel et al., 2017). Gene sequencing analysis have shown that bacteria assemble differently on microplastics and have lower taxon richness, diversity and evenness on plastic than onnon-plasticsubstrates(McCormicketal.,2016).Plasticsurfacepropertiesinfluencethecompositionoftheplastispherecommunity,asnotedwithbiofilmsonplasticversusnon-plastic pipes used to convey drinking-water (Buse et al., 2014; van der Kooij et al., 2017). For example, most bacterial and fungal strains found on plastic were those able to degrade plastic polymers such as various species within Pseudomonas, Arcobacter, Erythrobacter, Streptococcus, Staphylococcus, Aspergillus, Penicillium, and Phanerochaete (Bhardwaj, Gupta and Tiwari, 2012; McCormick et al., 2014).
Biologicalcharacteristicsofbiofilm-formingorganismsalsoinfluencetheirattachmenttoplastic surfaces including microplastics. Adaptation strategies, including hydrophobicity ofcellwallsandrepulsive/attractiveinteractionsbetweenthesurfacesofbiofilm-formingorganisms and the surrounding medium, promote attachment (Rummel et al., 2017). Moreover, environmental conditions, including high nutrient concentrations (nitrogen and phosphorus), salinity, temperature, high UV radiation and oxygen content are alsofactorsinfluencingplasticsandmicroplastics-biofilmformation(Harrisonetal.,2018; Oberbeckmann, Kreikemeyer and Labrenz, 2018).
4.3 Potential concerns associated with microplastic-associatedbiofilmsinwater
The possibility that microplastics could act as vectors for the long-distance transport of pathogens and increased transfer of antimicrobial resistance has been raised based on a limited number of occurrence studies in fresh water.
4.3.1 Long-distance transport of pathogens
Although limited, current evidence suggests that microplastics may be able to transport and disperse plastisphere communities over long distances. For example, microplastics released from WWTPs may enable transport of sewage-related microorganisms in theeffluentforlongdistances(McCormicketal.2016;Oberbeckmann,Kreikemeyer,and Labrenz, 2018). Microplastics may also serve as vectors for harmful organisms, includingentericvirusesandprotozoa,astheseorganismscanaccumulateinbiofilms,harbour other pathogens and remain infectious in the plastisphere (Atanasova et al., 2018; Sun et al., 2018). A study conducted in nine rivers in Illinois, USA, found higher presence of Pseudomonas spp., Burkholderiales incertae sedis, and Campylobacteraceae on microplastics than on other suspended matter or in water (McCormick et al., 2016).

46 Microplastics in drinking-water
However, the increased abundance of Campylobacteraceae on microplastics was not significant.Pseudomonas spp. have been associated with degradation of plastic polymers; Burkholderiales incertae sedis are commonly found in wastewater treatment systems; and Campylobacteraceae include pathogenic species that are common in sewage and can cause a range of infections if ingested in contaminated drinking-water (WHO, 2017a). Although sewage-related pathogens can attach to microplastics and may be transported downstream of WWTPs, it is unclear how long they will persist, as obligate pathogens such as Campylobacterwillnotmultiplyinbiofilms.
The issue of plastic-mediated transport of pathogens should not be overestimated as therearesignificantlygreatersourcesofopportunistandobligatepathogensinsurfacewaters used as sources of drinking-water. In addition, drinking-water treatment can remove most of these plastic particles (see section 5.3).
4.3.2 Antimicrobial resistance
A series of laboratory studies using lake water found that antimicrobial-resistant strainsthatattachtobiofilmsonmicroplasticstransferantimicrobial-resistantgenesmorefrequentlyandtoabroaderrangeofspeciesthanfree-livingbacteriaorbiofilmsassociated with natural aggregates (Arias-Andres et al., 2018). The authors of these studies hypothesized that the high density and close physical contact between cells ofbiofilmscouldfacilitatethetransferofplasmidswithantimicrobial-resistantgenes.Similarly,Eckertetal.(2018)showedthatattachmenttomicroplasticcouldfavourbacterial survival from WWTPs, including genes associated with antibiotic resistance. The possibility that pathogens could invade new localities, and natural, non-pathogenic microorganisms could potentially acquire and spread antimicrobial resistance genes are issues of concern that need to be further studied. However, to contextualize the issue,biofilms inWWTPscarryamuchgreaterdensityoforganismscarryingresistancethandobiofilmsonmicroplastics.
4.4 Distribution and risk of microplastic-associated biofilmsindrinking-water
Todate,therearelimiteddataonthedistributionofmicroplastic-associatedbiofilmsin drinking-water. Further, current knowledge on the adverse effects of microplastic-associatedbiofilmsinfreshwateranddrinking-waterislimited(USEPA,2016;Li,Liuand Chen, 2018).
Althoughmicroplastic-associatedbiofilmshavebeendetectedinfreshwater,theirpresence does not necessarily translate to occurrence and risk in drinking-water and there is currently no evidence to suggest a human health risk from microplastic-
Chapter 4: Possible human health risks associated with microplastics in drinking-water: biofilms 47
associatedbiofilmsindrinking-water.Aspartofdrinking-watertreatment,clarificationand membrane processes represent effective methods to remove particles with attachedmicroorganisms(seesection5.3)anddisinfectantsshouldinactivatebiofilms.As discussed in section 2.2.7, there is evidence that small numbers of microplastics can slough from materials within water treatment and distribution systems. The surface area of these particlesandassociatedbiofilmshowever,willrepresent a very small fraction of the surface areaandbiofilmsgeneratedonthesourcematerials.Inaddition,inmanycountries,plastics and other materials used in drinking-water systems are subject to standards, including tests to demonstrate that they do not support microbial growth (WHO, 2014).
There is currently no evidence to suggest a human health risk from microplastic-associated
biofilms in drinking-water.

48 Microplastics in drinking-water
4.5 Conclusions and research needs
There is currently no evidence to suggest a human health risk from microplastic-associatedbiofilmsindrinking-water.
While there are substantial gaps in knowledge, the potential risks from microplastic-associated microorganisms are far lower than the well-established risk posed by the high concentrations and diversity of pathogens present in human and livestock wastes in drinking-water sources. In addition, in terms of providing surfaces for attachment and transport of microorganisms including pathogens, the concentrations of microplastics reported in drinking-water sources are far lower than concentrations of non-plastic particles that contribute to normal turbidity in water.
The diversity of organisms in the plastisphere is constrained by environmental factors and material properties such as surface roughness and hydrophobicity (McCormick et al., 2016; Rummel et al., 2017; Oberbeckmann, Kreikemeyer, and Labrenz, 2018). These constraints are also likely to apply to pathogens. Drinking-water treatment is designedtoremoveparticlesandtheuseofbothclarificationprocessesanddisinfectionwill further reduce the potential for any pathogens to reach drinking-water.
Thepotential risk frompathogens foundonbiofilms associatedwithmicroplasticisalso far lowerthanonbiofilmsassociatedwithwaterdistributionsystems.Thesurface area provided by the low concentrations of microplastics (see Chapter 2) that escape treatment is extremely small compared to the surface area of materials indistributionsystems.Further,biofilmsposealowriskcomparedtootherrisks,including enteric pathogens, particularly in well managed drinking-water distribution systems.However,certainpathogenspresentinbiofilmsindistributionsystems,suchas Legionella spp., could result in a health burden (Cassini et al., 2018) to susceptible populationsexposedtowater inbuilding-specificwatersystemssuchashospitals,where water systems' materials and temperatures could encourage the growth of the pathogen within the distribution system. Regardless of source, routine disinfection ofdistributionsystemscancontrolthegrowthofbiofilmsandminimizeexposuretoopportunistic and obligate pathogens.

Research needs
To better understandmicroplastic-associated biofilms and their significance, thefollowing research could be carried out:
• Furtherstudiescouldbeconductedonthefactorsthatinfluencethecompositionandpotentialspecificityofmicroplastic-associatedbiofilms.
• Studiescouldalsoconsiderthefactorsinfluencingbiofilmformationonplasticsurfaces, including microplastics, and how these factors vary for different plastic materials, and what organisms more commonly bind to plastic surfaces in freshwater systems.
• Research could be carried out to better understand the capacity of microplastics to transport pathogenic bacteria longer distances downstream, the rate of degradation in freshwater systems and the relative abundance and transport capacity of microplastics compared with other particles.
• Research could consider the risk of horizontal transfer of antimicrobial resistance genesinplastispheremicroorganismscomparedtootherbiofilms,suchasthosefound in WWTPs.
Chapter 4: Possible human health risks associated with microplastics in drinking-water: biofilms 49

50 Microplastics in drinking-water
5. Treatment technologies for removing microplastics from water
5.1 Introduction
Most drinking-water—whether from a tap, well, or bottle—comes from surface water or groundwater. Virtually all drinking-water supplies sourced from surface water arefilteredandsomereceivefurthertreatment.Groundwateristypicallyofhigherqualityasitisnaturallyfilteredthroughsoilandrockswhenitpassesintoundergroundaquifers, and hence, it often receives less treatment, if any.
Since microplastics have been found in fresh water, primarily surface waters, understanding the effectiveness of drinking-water treatment in removing microplastics is important in assessing exposure of humans through drinking-water. Understanding the effectiveness of wastewater treatment is also important in the context of drinking-watersincewastewatereffluentisakeysourceofmicroplasticsinsurfacewaters(see section 2.2). This chapter therefore reviews the effectiveness of wastewater and drinking-water treatment processes for removal of microplastics.
Eventhoughlimitedempiricaldataexistontheabilityofdifferenttreatmentsystemsto remove microplastics (see Box 5.1), considerable data do exist on the removal of particles similar to microplastics. One of the key roles of both drinking-water and wastewater treatment is to remove or reduce particles, and treatment processes are therefore expected to be effective in removing microplastics from water (Mason et al., 2016; Murphy et al., 2016; Mintenig et al., 2017; Trussell and Tate, 1979). Microplastics have characteristics similar to many natural particles. Depending on the type of treatment under consideration, properties relevant to removal can include size, density and surface charge (Tobiason et al., 2011). The mechanisms for removing
Box 5.1 Data limitations
As discussed in Chapter 2, accurate and standardized methods for determining microplastic concentrations and compositions in water and wastewater remain a significant challenge, with the majority of occurrence studies conducted in drinking-water and wastewater considered not fully reliable. Further, studies often use different detection methods. This means that some caution is required when interpreting and comparing the results of studies on the removal of microplastics in treatment and the occurrence data in fresh water and drinking-water. However, no study has been discounted at this stage given the paucity of data. Where quality scores are available, these have been included.

Chapter 5: Treatment technologies for removing microplastics from water 51
particlesincludesadsorption,enmeshmentincoagulationflocaggregates,flotation,sedimentation,filtrationandstrainingbysizeexclusion.Particlescanalsoberemovedusingmembraneprocessessuchasmicrofiltration,ultrafiltration,nanofiltrationandreverse osmosis.
5.2 Wastewater treatment
WWTPs are a principal barrier to the direct discharge of waterborne microplastic pollution into the aquatic environment. However, only a limited number of studies have examined microplastic removal through the various treatment processes (Sun et al., 2019). A review of 18 studies on the occurrence of microplastics in wastewater foundthattypicalWWTPeffluenthasalowermedianconcentrationofmicroplasticparticles compared to the influent, although the range in effluent concentrationsvaried significantly (Koelmans et al., 2019). Thismay be an indication that someWWTP facilities have ineffective treatment practices or are not designed for optimal removal of microplastics (Magnusson and Norén, 2014). In these cases, discharges from WWTPs can represent routes for microplastics to enter into fresh waters and then possibly into drinking-water (Kay et al., 2018).
Inmanycountries,significanteffortshavebeenmadetoincreasethequalityofWWTPeffluenttomeethigherqualitytargetsforsurfacewater.Wheresuchreceivingwatersare used as a drinking-water source, the microplastic load originating from the WWTP isexpectedtobesignificantlyreduced.However,inlow-andmiddle-incomecountries,only 33% of the population have sewer connections. Wastewater for the remaining 67% of the population is collected and treated in onsite systems or discharged directly to soil and water bodies. In addition, approximately 20% of household wastewater collectedinsewersdoesnotundergoatleastsecondarytreatment(UNICEF/WHO,2019). In these cases, the contribution of microplastics into the receiving water body is expected to be higher.
5.2.1Studiesassessingtheefficacyofmicroplasticremoval
According to available data, conventional wastewater treatment using primary and secondary treatment processes can effectively remove most microplastics from wastewater. Removals of more than 90% have been reported, with most of the microplastics removed during pre-treatment and primary treatment stages (Talvitie et al., 2017a). A large Italian WWTP (400 million L/day) reportedly removed 84% of microplastics >63 µm (Magni et al., 2019). However, the concentration of microplastics foundintheinfluentwastewaterwasquitelow,withanaverageof2.5particles/Linthe
52 Microplastics in drinking-water
influentand0.4particles/Lintheeffluentfollowingscreening,gritandgreaseremoval,biologicaltreatment,sedimentation,sandfiltrationanddisinfection.DatafromaScottishWWTP recorded average microplastic concentrations of 15.7 particles/L (size 598 ± 0.89µm)inwastewaterinfluent.Treatmentremoved98.4%ofmicroplasticparticles,with much of the removal taking place in the grease removal process (Murphy et al., 2016). In Turkey, assessments of two WWTPs recorded between 12–36 particles/L intheinfluentand2–9particles/Linthesecondaryeffluent,withoverallremovalofbetween54–92%forplasticparticlesclassifiedfrom<100µmto5000µm(Gündogduet al., 2018). In a Finnish WWTP, pre-treatment and primary treatment removed 97% of microplastic particles, with activated sludge removing a further 7–20% for particles captured on sieves between 20–400 µm (Talvitie et al., 2017a).
Somefinalstagewastewatertreatmenttechnologieshavealsobeenveryeffectiveinenhancingmicroplasticremoval fromeffluents.Forexample,between95–99.9%ofmicroplastics (>20 µm) were removed by particle removal technologies such as rapid sandfilters,membranebioreactorsanddissolvedairflotation(Talvitieetal.,2017b;Lares et al., 2018). Another study concluded that secondary and tertiary treatment processeswerehighlyefficient in removingmicroplastics,withgreater than99.9%removal when samples were processed using a range of sieves with mesh sizes between 20–400 µm(Carr,LiuandTesoro,2016).Tertiaryfiltrationof wastewater from a German WWTP completely removed microplastics >500 µm, and removed 93% of microplastics smaller than 500 µm (LoD 20µm)and97.7%ofplasticclassifiedassyntheticfibres(Mintenigetal.,2017).Inanotherexampleofahighlytreatedwastewater,0.28particles/L(>25µm)wereidentifiedaftertertiaryultrafiltrationand0.21particles/L(>25µm)afterreverseosmosis(Ziajahromietal.,2017) (TAS = 12). These concentrations were below the concentrations found in theoreticallyparticle-freeblanksfromthestudybyUhl,Eftekhardadkhah,andSvendsen(2018).Wastewatertreatedusingbiologicallyaeratedfiltersasatertiarytreatmentsaw no microplastic removal across the treatment (Talvitie et al., 2017a). A summary of these studies is included in Table 5.1.
5.2.2Factorsinfluencingmicroplasticremoval
The primary mechanisms for removing microplastics during wastewater treatment is throughagglomerationintobiologicalflocsfollowedbyseparationusingsedimentation,flotationandfiltration(Murphyetal.,2016;Talvitieetal.,2017a).Duringthesesolid-liquid separation processes, microplastics are concentrated and transferred from the
Wastewater treatment can typically remove more than
90% of microplastic particles, with the highest removals
seen after tertiary treatment such as filtration.

Chapter 5: Treatment technologies for removing microplastics from water 53
Table 5.1 Summary of microplastic removal reported from wastewater treatment studies
Author System Removal Remarks Quality score (TAS)a
Ziajahromi et al. (2017)
Secondary, tertiary and reverse osmosis treatment
90% Removal considered relative to microplastics in primary treated effluent
12
Talvitie et al. (2017b)
Tertiary treatment: rapid sand filtration, membrane bioreactors and air flotation
95–99.9% The smallest microplastics (20–100 μm) and fibres were the most common type of particle observed in influent and effluent
10
Murphy et al. (2016)
Removal across whole plants (consisting of pre-, primary and secondary treatment)
98.4% Mean of 15.7 microplastic particles/L in influent (Size: 598 ± 89 μm); most removed with fat and grease removal
9
Lares et al. (2018)
Primary and secondary treatment
98.3% Considered removal of microplastics >20 μm
9
Talvitie et al. (2017a)
Pre-, primary, secondary and tertiary treatment
Pre- and primary: 97%Secondary: 7–20%Tertiary: no removal
Most removal observed across pre and primary treatment processes
6
Carr, Liu and Tesoro (2016)
Secondary and tertiary treatment
99.9% Tertiary treatment was biologically-aerated filter
6
Magni et al. (2019)
Removal across whole plant (consisting of pre-, primary, secondary and tertiary treatment)
84% Solids skimming and settlement processes important for removal
—
Gündoğdu et al. (2018)
Removal across two whole plants (consisting of pre-, primary and secondary treatment)
54–92% Low concentration of microplastics in the influent: 2.0 ± 0.3 particles/L
—
Mintenig et al., 2017
Pre- and post-tertiary filtration
93–97.7% Most plastic particles in influent and effluent composed of polyester
—
a TAS = total accumulated score, as reported in Koelmans et al. (2019). The maximum score is 18 and is calculated by adding scores for nine quality criteria, where for each criterion, a score of 0, 1 or 2 is assigned. See the annex for an overview of the nine quality criteria and for each study, the individual scores against each criteria. TAS values are underlined when all underlying scores are non-zero.
54 Microplastics in drinking-water
water phase into the solid phase. Due to the hydrophobic nature of microplastics, many are expected to be removed with fats, oils and greases in grease traps, sewerage systemsandfloatingdebris.ObservationsofmicroplasticremovalingreasetrapsatamunicipalWWTPwereconsistentwiththisassumption:asignificantproportionofmicroplastics were accumulated in the grease waste (19.67 microplastic particles/2.5 g), including microbeads (Murphy et al., 2016). Also, other studies have shown thatfiltrationandothertertiarytreatmentstagescansignificantlyreducethetotalmicroplasticdischarge.Thisremoval is influencedbythesurfacecharacteristicsofthe microplastic (such as roughness, hydrophobicity and surface charge) as well as thesizeoftheparticlesbeingfiltered.
5.3 Drinking-water treatment
Drinking-water treatment plays an important role in reducing concentrations of microplastics that have been introduced into source waters. Ideally, all drinking-water that comes from surface water sources will undergo treatment prior to distribution. Typically, surface water is treated more substantively than groundwater, as groundwater isgenerallyofhigherqualityduetonaturalfiltrationthatoccursasitpercolatesthroughsoil and rock before reaching underground aquifers.
Limited empirical data exist on the presence of microplastics in drinking-water and their removal across drinking-water treatment processes (Lancet Planetary Health, 2017). Only a few studies report concentrations of microplastics along the whole drinking-water treatment process (Pivokonsky et al., 2018; Uhl, Eftekhardadkhah,andSvendsen2018;Mintenigetal.,2019).Assuch,nofirmconclusionscanbedrawn. However, drinking-water treatment has proven effective in removing far more particles of smaller size and at far higher concentrations than those of microplastics. This fact combined with well-understood removal mechanisms point to rational conclusions on the removal of most microplastic particles in water treatment processes.
5.3.1Studiesassessingmicroplasticremovalefficacy
As noted earlier, empirical evidence for the removal of microplastics across different drinking-water treatment systems is currently limited to a few studies.
Drinking-water treatment has proven effective in removing far
more particles of smaller size and at far higher concentrations
than those of microplastics. This fact combined with
well-understood removal mechanisms point to rational conclusions on the removal of microplastic particles in water
treatment processes.
Chapter 5: Treatment technologies for removing microplastics from water 55
Mintenig et al. (2019) (TAS = 15) monitored microplastics at different stages of the drinking-water treatment and distribution system from a groundwater source. Low numbers of microplastic particles were detected in both the raw water and the treated drinking-water at concentrations between 0 to 0.007 particles/L, with an overall mean of0.0007particles/L.Therewerenosignificantdifferencesbetweenconcentrationsandtypesofmicroplasticsinthesourcewaterandtreatedwater.MicroplasticsidentifiedwerePE,PA,PEST,PVCandepoxyresinandwerebetween50and150µminsize.The authors suggested that the abrasion of plastic equipment used during water treatment or distribution was a likely source of the plastic particles detected in the water samples. Pivokonsky et al. (2018) (TAS = 11) reported microplastic removal efficiency of between 70–82% across threewater treatment processes that usedconventionalcoagulation,clarificationandfiltrationprocesses.However,inter-stagemonitoring was not carried out in this study.
In an assessment of 24 water treatment plants in Norway that applied coagulation and filtrationprocesses,verylowconcentrationsofmicroplasticswerefoundintreatedwater(Uhl,Efteckhardadkhah,andSvendsen,2018)(TAS=9).Theauthorsdemonstratedthatthe concentrations of microplastic particles in treated water were lower than those in therawwater,confirmingthatcoagulationandfiltrationwereeffectiveinmicroplasticremoval. Some contrasting results have been seen in laboratory studies that investigated theapplicationofironandaluminumcoagulantsfortheremovalofPEmicroplastics(Maetal.,2019).Upto40%removalofPEwasobservedwhenusingaluminumcoagulants,higher than that observed using iron coagulants. Removal was enhanced as the plastic particles became smaller. The presence of a coagulant aid (polyacrylamide) had a positive and substantial effect on removal.
5.3.2Factorsinfluencingmicroplasticremoval
Drinking-water treatment processes can effectively eliminate particles and colloids across a wide size range (from dissolved/colloidal materials to particles of a few mm). For example, an optimized treatment process is capable of removing pathogenic bacteria and Cryptosporidium (USEPA,2003,2006),whicharetypically<5µm.Largerparticlesare more easily removed. Although a wide range of microplastic types have been identified,forthepurposeofwatertreatment,thephysicochemicalpropertiesofthematerial will determine the mechanisms of removal. Particle removal processes used in drinking-watertreatmentcantypicallybedividedinto:(1)clarificationprocessesthatusecombinationsofcoagulation,flocculation,sedimentation/flotationandfiltration;and (2) membrane processes.

56 Microplastics in drinking-water
Clarification processesClarificationprocessessuchasthoseinvolvingcoagulationarethemostcommonmethodsof removing particles in drinking-water treatment. During coagulation, small particles and colloids are destabilized with the addition of a coagulant chemical, allowing formation ofaggregatesknownasmicroflocs.Microflocsaretypicallyencouragedtogrowintolargerflocsduringslowmixinginaprocessknownasflocculation.Largeaggregatescanthenbesettledorfloatinthewater(LettermanandYiacoumi,2011).Generally,forcoagulationandflocculation,particlepropertiescan impacttheiragglomerationandentrapmentinflocs,includingsurfacecharge,size,distributionandshapeprofile,concentration and the strength of bonds formed between particles when captured inafloc(LettermanandYiacoumi,2011).Mostoftheresidualparticlesthatremainarethenremovedbygranularmediafiltrationprocesses.Typically,sandgrainswithadiameter around 500 µm are used as the granular media, although media down to 200 µm can be used (Crittenden et al., 2012). Particles between 80–100 µm cannot pass throughthespacesbetweenthefiltermediaandarestrainedfromthewater.Particlessmaller than a micrometre can be removed when they attract to the media grains in thefilter.Theattachmentmechanismsdependonthesize,shapeandchargeoftheparticlesbeingfiltered,aswellasthehydraulicconditionspresentinthefilter.Verylow concentrations of residual suspended solids should be present in water that has beentreatedbyawell-operatedgranularmediafiltrationsystem(Tobiasonetal.,2011).
When separating solids from liquid, water quality and operating conditions can limit the effectiveness of the process. As most plastic particles are hydrophobic, adsorption of organic compounds can occur (Napper et al., 2015). Because of this interaction, plastics are likely to adopt the characteristics of background organic matter, which will influence their removal profile in different solid-liquid separation processes.Humic acids, which can form a large proportion of organic matter, for example, can stabilize particles in water and prevent aggregation (Jarvis et al., 2005). However, since microplastics are relatively large compared to other particles removed in drinking-water treatment, the effect may not be as important as it is for other particles. The presence of organic matter might be more relevant for nanoplastics. Understanding which micro- and nanoplastics behave like other environmental particles is critical for appropriate risk characterization in drinking-water treatment. Hydraulic conditions canalsoinfluencetheeffectiveremovalofparticulates,includingmicroplastics,duringclarificationprocesses.Forexample,flocscanbebrokenbyshearforcesorchangesofpH,formingsmallerparticlesthatmaybemoredifficulttoremoveduringclarification(Jarvis et al., 2005; Slavik et al., 2012).
Membrane processes Membrane processes can be divided into diffusional membranes (reverse osmosis and the lowerendofnanofiltration)andporousmembranes(microfiltration,ultrafiltrationand
Chapter 5: Treatment technologies for removing microplastics from water 57
theupperendofnanofiltration).Fordiffusionalmembranes,onlydissolvedsubstancescan diffuse through the membrane; no particles should pass through the membrane. For porous membranes, the nominal pore size determines the size of particles that can pass through the membrane. Particles above the pore size will be rejected. Typically microfiltrationrejectsparticles>1µm,ultrafiltrationrejectsparticles>0.01µm,andnanofiltration>0.001µm.Forallmembranes,thesecut-offsarefarbelowthesizeof microplastics that have been detected in drinking-water to date. Consequently, no microplastics above these size ranges should pass through membranes unless the membranes are damaged (which is usually monitored by routine integrity testing). This conclusion is consistent with the limited data available for removal of microplastics fromdrinking-waterusingmembranes.Inalaboratorystudy,PEmicroplasticswerecompletelyrejectedbyultrafiltrationmembranes(Maetal.,2019).
5.3.3 Other considerations
To date, no information is available to indicate if and how microplastics are transformed during oxidative processes used in water treatment, such as ozonation, chlorination or advanced oxidation. There is no reason to assume that these processes will not interact and react with microplastics present in the water. However, whether the processes affect the surface of microplastics or cause further breakdown of the particle into smaller particles is poorly understood.
An interesting side note in the consideration of drinking-water and wastewater treatment processes is whether they contribute microplastics into water themselves. For example, many membranes are composed of polymeric materials. Similarly, processes such as ion-exchange used for water softening, de-ionization and removal of nitrate and natural organic matter often use polymeric plastic materials (e.g. PS and polyacrylics). These processes are exposed to abrasion and wear over time which might release low quantities of microplastics into water. In a similar vein, high shear-rate processes used in both drinking-water and wastewater treatment (e.g. in mixing systems) may degrade plastic particles into smaller pieces, in turn making them more challenging to remove. Water pipes composed of plastic materials will also be subject to abrasive processes.Furtherresearchisneededtodeterminehowtheseprocessesinfluencemicroplastic levels in water, if they do at all.
5.3.4 Turbidity as an indicator of microplastic removal
Giventhelowconcentrationsofmicroplasticsindrinking-watersources,itisdifficulttomonitortheefficacyofmicroplasticremovalacrosswatertreatmentprocessessuchasfiltration.Thestandardapproachformonitoringefficacyoffiltrationistomonitorturbidity in treated water (WHO, 2017b). Turbidity describes the cloudiness of water

58 Microplastics in drinking-water
caused by suspended particles of mineral, chemical or biological origin. Microplastics maycontributetotheturbidityofwaterifpresentinsufficientconcentrations.Theadvantages of turbidity measurements are simplicity, relatively low cost and speed of results. However, different turbidity-causing materials can exhibit different relationships between particle concentration and the resultant turbidity signal (Farrell et al., 2018). It is likely that different types of microplastics will also exhibit unique relationships between particle concentration and turbidity. Microplastics may also be associated with othertypesofparticles,forexample,whentheybecomeincorporatedintoflocs.Thismakesitchallengingtoassessremovalofspecifictypesofparticle,suchasmicroplastics,using a bulk water parameter such as turbidity. For these reasons, turbidity should be used as a general indicator of water quality and for general operational monitoring and processefficacyincludingparticleremoval,butshouldnotbeusedtodirectlyinfermicroplastic concentrations. The same considerations should be given to other particle monitoring instruments such as particle counters, which have become a common tool for process and water quality monitoring.
5.4 Considerations for drinking-water and wastewater treatment sludge
An important consideration for both wastewater and drinking-water treatment is that the plastics are usually not destroyed, but rather transferred from one phase to another. Sludge disposal methods must therefore be considered since sludge application to land isaprobablerouteforre-contaminationoftheenvironment.Equally,wheremembranecleaningorback-flushingoffiltersispracticed,wastestreamsmaybereturneddirectlyto the aquatic environment. Although it is clear that use and/or disposal practices for waste products containing microplastics warrants special consideration, there are limited data available on the impact of such practices.

Chapter 5: Treatment technologies for removing microplastics from water 59
5.5 Conclusions and research needs
Limiteddataonwastewatertreatmentconfirmitiseffectiveinremovingmicroplasticsalong with other particles. Wastewater treatment can typically remove more than 90% of microplastic particles, with the highest removals seen after tertiary treatment suchasfiltration.
Onlylimitedquantifieddataareavailabletodemonstratetheefficacyofmicroplasticremoval across drinking-water treatment processes. However, conventional drinking-watertreatment (coagulation,sedimentationandfiltration) isdesignedtoremoveparticulates and is therefore expected to effectively remove microplastics, particularly when optimized to produce treated water of low turbidity. When optimized, conventional treatment can remove particles smaller than a micrometre. Advanced treatment using membranes would be expected to achieve 100% removal of microplastics larger than 0.001to1µm,withremovalcapabilities>0.001µmfornanofiltration,>0.01µmforultrafiltrationand>1µmformicrofiltration.
An important consideration is that wastewater and drinking-water treatment is not available nor optimized in many countries. In these settings, there may be higher levels of microplastics in drinking-water and freshwater sources. However, the health risks associated with exposure to pathogens and other chemicals present in untreated or inadequately treated water will be far greater. By addressing the bigger problem of exposure to untreated or inadequately treated water, communities can simultaneously address the smaller concern related to microplastics in surface water and other drinking-water supplies.
Since microplastics removed through both wastewater and drinking-water treatment will be incorporated into sludge or other waste streams, there is potential for particles to return to the environment depending on the use or disposal practices.

Research needs
Although water treatment can be effective in removing particles, there is limited data specifictomicroplastics.Tosupporthumanhealthriskassessmentandmanagementoptions, the following data gaps related to water treatment need to be addressed:
• More research is needed to understand the fate of microplastics across different wastewateranddrinking-watertreatmentprocesses(suchasclarificationprocessesand oxidation) under different operational circumstances, including optimal and sub-optimal operation and the influence of particle size, shape and chemicalcompositiononremovalefficacy.
• There is a need to better understand particle composition pre- and post-water treatment, including in distribution systems. The role of microplastic breakdown and abrasion in water treatment systems, as well as the microplastic contribution from the processes themselves should be considered.
• More knowledge is needed to understand the presence and removal of nanoplastic particles in water and wastewater treatment processes once standard methods for nanoplastics are available.
• There is a need to better understand the relationships between turbidity (and particle counts) and microplastic concentrations throughout the treatment processes.
• Research is needed to understand the significance of the potential return ofmicroplastics to the environment from sludge and other treatment waste streams.
60 Microplastics in drinking-water
Chapter 6: Managing plastic and microplastic pollution in the environment 61
6. Managing plastic and microplastic pollution in the environment
6.1 Benefitsofmanagingplasticandmicroplasticpollution
Irrespective of any risks to human health from ingestion of microplastics in drinking-water, improved management of plastics and a reduction in plastic pollution holds multiplebenefitsfortheenvironmentandhumanwell-being.
A growing body of evidence confirms that larger plasticwaste andmacroplasticdebris—themselves precursors to microplastic pollution—can harm wildlife and the
environment. Researchers have estimated that as of 2015, only 9% of plastic ever produced has been recycled, and that, without action by 2050, there will be 12 billion tonnes of plastic in landfillsandtheenvironment(Geyer,Jambeck,and Law, 2017). Presently, plastic litter can be found throughout the environment including on streets,fieldsandbeaches,disturbingqualityoflife, and in some cases impacting tourism-related livelihoods. Poorly managed plastic waste streams
can contribute to the obstruction of storm drains and sewers, which prevents proper drainage and increases sanitation-related risks. Incineration of plastic waste, with its resulting air pollution, and the climate change-inducing greenhouse gas associated with plastic production, could impact human health and the environment.
Concerns relate also to microplastics. If plastic emissions into the environment continue at current rates, there may be widespread risks associated with microplastics toaquaticecosystemswithinacentury(SAPEA,2019),withpotentiallyconcurrentincreases in human exposure.
6.2 Responses to growing concern over plastic pollution
In response to concerns about the impact of plastic and microplastic pollution, public awareness and engagement has increased. Activities have ranged from schools adopting educational activities on plastics, to civil society launching campaigns and some industries pledging to reduce plastic use. Political commitment is also growing.
Irrespective of any risks to human health from ingestion of microplastics in drinking-
water, improved management of plastics and a reduction in
plastic pollution holds multiple benefits for the environment
and human well-being.

62 Microplastics in drinking-water
MinistersofEnvironmentfrom157countriescommittedtosignificantlyreducesingle-use plastic products by 2030 at the 4thUNEnvironmentAssembly inMarch2019(UNEP,2019a).ThisfollowedanagreementatthepreviousAssemblytorecognizethe importance of long-term elimination of microplastics from the oceans. In May 2019, governments agreed to amend the Basel Convention to require the consent of importingcountriesformixedandcontaminatedplasticwaste(UNEP,1989,2019b).The aim is to improve regulation of the global trade in plastic waste to support better and safer management.
More than 60 countries are already taxing or banning single-use plastics, primarily plasticbags(UNEP,2018).CountriessuchastheUKandtheUSAhavedevelopedlegislation to eliminate plastic microbeads in personal care products such as scrubs andtoothpastes(USGovernment,2015;UKGovernment,2017)whiletheEuropeanUnioniscurrentlyconsideringsuchlegislation(ECHA,2019).
6.3 Options to curb plastic and microplastic pollution
As outlined in Chapter 2, microplastics can come from a number of sources including from the degradation of larger plastic items found in the environment, frequently as a consequence of the poor management of used and discarded plastic items. With only limited data on the number and composition of microplastic particles in drinking-water, it is not possible to identify the most important sources of microplastics in drinking-water,makingitdifficulttodeterminewhatactionsmightbestbedirectedin the short- to medium-term. However, it is likely that microplastics in fresh water contribute to the presence of microplastics in drinking-water where there is an inadequatefiltrationbarrier.
Strategies to better manage plastics and reduce the use of plastics where feasible, are critical to the effort to minimize adverse impacts of discarded plastic. Strategies tominimizemicroplastic inputs can confer other benefits aswell. For example,installing and optimizing wastewater treatment will not only reduce the direct input of microplastics to the aquatic environment but will also reduce the input of enteric pathogenic microorganisms and a number of chemical micropollutants into drinking-water sources. Similarly, optimizing the performance of processes that remove microplastics from water sources will also reduce concentrations of microbial and chemical hazards in drinking-water.
Where possible, preventing new sources of plastics from entering the environment and/or reducing existing sources would be appropriate. Care must be taken, however, when considering mitigation strategies for existing plastics so that solving one problem
Chapter 6: Managing plastic and microplastic pollution in the environment 63
does not simply create a new one. This is particularly important in view of the limited data on sources of different sizes and types of microplastics, including the very small particlesthatarecurrentlynotwellquantified.Theremovalofparticlesinwastewaterand drinking-water treatment that are then returned to the environment in backwash, sludge biosolids or other waste streams, either through direct discharge or from run-off from receiving land, is an area requiring study before appropriate decisions can be made as to what actions might be required.
Where simple, low cost actions can be taken to make even a small difference to plastic inputs to the environment, it would be sensible to implement them. This is in line with the Rio declaration and the Rio statement of the precautionary principle, which considers cost–effectiveness: “Where there are threats of serious or irreversible damage,lackoffullscientificcertaintyshallnotbeusedasareasonforpostponingcost-effective measures to prevent environmental degradation” (United Nations, 1992).
Thebenefitsofplasticmustalsobeconsideredbeforeintroducingpoliciesandinitiatives.For example, single-use syringes play an important role in preventing infections. Priority managementactionsshouldbe“noregrets”,inthattheyconfermultiplebenefitsand/or that they are cost-effective.
A few broadly categorized preventive measures to reduce the entry of plastics into theenvironmentaredescribedbelow.TheseareoutlinedintheEUPlasticsStrategy(EuropeanCommission,2018),adoptedinJanuary2018,whichcontainsmeasuresinfour broad groups:
1. Improve the economics and quality of plastic recycling2. Curb plastic waste and littering3. Drive innovation and investment towards circular solutions and sustainable
manufacturing practices to decrease waste inputs to the environment4.Engageininternationaleffortstominimizeandeliminateplasticwaste
Other measures proposed to address plastic pollution include bans, fees (e.g. charges ortaxesondisposablebagsandbottles),ExtendedProducerResponsibility,voluntaryagreements and mandatory consideration of non-plastic alternatives, with a recommendation tofocusactionsonplasticwastestreamswithhighvolumes,high-emissionprofilesandhigh-hazardplasticuses(SAPEA,2019).Withrespecttosingle-useplastics,theUnitedNationsEnvironmentProgramme(UNEP,2018)hasproposeda10-steproadmapforpolicymakers to curb waste. The report also recognizes the importance of broader cooperation, from raising awareness among consumers to public-private partnerships.

64 Microplastics in drinking-water
7. Conclusions, recommendations and knowledge gaps
7.1 Conclusions
Microplastics are ubiquitous in the environment, including in the water cycle. They have been detected in marine water, wastewater, fresh water and both tap and bottled water. However, the quality and quantity of data vary across different water types and the data on occurrence in drinking-water are limited.
In drinking-water, the typical characteristics of microplastics (i.e. composition including polymer type, size and shape) and their route into bottled water and tap water is still uncertain, although the frequency of detected polymers is generally consistent with production volumes and plastic density. Important sources of microplastics into fresh wateraresurfacerun-offandwastewatereffluent,butthereareinsufficientdatatoquantifytheseinputsanddeterminemorespecificprimarysources.Further,somecontamination may also occur during treatment, distribution or bottling processes.
Study results should be interpreted in the context of the methods used, for example, smaller mesh sizes are generally used in drinking-water studies compared to freshwater studies, contributing to higher particle counts. In general, there is a need to improve, standardize and harmonize microplastic sampling and analysis in water; most studies conducted to date are not considered fully reliable. Box 2.2 summarizes areas that likely require the most improvement.
There are no studies on the impacts of ingested microplastics on human health and there are only a limited number of animal studies of questionable reliability and relevance. Some data suggest a very limited uptake and impact of microplastics <50 µm in laboratory animals at high concentrations, but the relevance to humans is unknown. Thesestudiesrequireconfirmationunderrealisticexposureconditionsbeforefirmconclusions can be drawn. Despite limited health data, several inferences could be made with respect to human health risks:
• Althoughitisnotpossibletodrawanyfirmconclusionontoxicityrelatedtothephysical hazard of plastic particles, particularly the nano size particles through drinking-water exposure, no reliable information suggests it is a concern. Humans have ingested microplastics and other particles in the environment for decades with no related indication of adverse health effects. In addition, drinking-water treatmentiseffectiveatremovingparticles.Althoughthereisonlylimitedquantifiedevidence on microplastic removal across water treatment processes, conventional

Chapter 7: Conclusions, recommendations and knowledge gaps 65
drinking-watertreatment(coagulation,sedimentationandfiltration)isexpectedto effectively remove microplastics since conventional treatment is designed to remove particulates, particularly when optimized to produce treated water of low turbidity.Advancedtreatment,particularlymembranefiltration,wouldbeexpectedtoachieve100%removalofparticles>0.001µmfornanofiltration,>0.01µmforultrafiltrationand>1µmformicrofiltration.
• The substantial margin between a theoretical conservative exposure to a range of chemical contaminants detected in microplastics through drinking-water and the level at which no or limited adverse effects were seen, indicates there is a low health concern for chemicals associated with microplastics. A summary of theestimatedMOEsandimplicationsforhumanhealthareincludedinTable3.3.Applying assumptions with higher particle numbers in smaller size ranges does not change the conclusions.
• The risks from pathogens in microplastic-associated biofilms is considered far lower than the well-established risk posed by the high concentrations and diversity of pathogens present in human and livestock waste, which often make their way into drinking-water sources with inadequate treatment. Further, the relative surface area for attachment and transport of microorganisms, including pathogens, is far lower for microplastics based on the concentrations reported in drinking-water and drinking-water sources compared to the concentrations of non-plastic particles that contribute to normal turbidity in water. For microplastics that are not removed during drinking-water treatment, these particles also provide anextremelysmallsurfacearea forthedevelopmentofbiofilmscomparedtodrinking-water distribution systems and therefore, the relative significance ofmicroplastics-associatedbiofilmsisstilllikelytobenegligible.Regardlessofsource,drinking-water treatment is largely designed to remove particles and the use of bothclarificationprocessesanddisinfection,includingdisinfectionindistributionsystems, will reduce the potential for any pathogens to be present in drinking-water.
Future research and emerging science to address data gaps will enable more accurate and reliable assessments of exposure and potential impacts to human health.
A summary of the potential hazards and estimated risk is included in Table 7.1.

66 Microplastics in drinking-water
Table 7.1 Summary of key hazards associated with microplastics in drinking-water and estimated health risk
Potential hazard Data available Preliminary risk assessment Considerations for exposure and risk
Particle (physical hazard)
No human studies are available on ingested microplastics.Effects have primarily been observed in a limited number of animal studies at high concentrations that are not applicable to drinking-water. Relevance of these studies to humans is unknown. Limited information is available on the uptake of microplastics, particularly for particles <150 µm.
Insufficient information to draw firm conclusions, although no reliable information suggests health concerns.
Absorption of smaller microplastics may be higher compared to larger microplastics based on limited studies examining exposure at high concentrations. Elevated exposure, however, is likely to overwhelm biological particle clearance mechanisms. Smaller particles may be more susceptible to adsorb biologically-significant proteins and molecules.The influence of shape and surface chemistry impacting toxicity is unknown for ingested microplastics. Conventional drinking-water treatment is effective at removing particles and is capable of removing particles smaller than a micrometre when optimized to produce treated water of low turbidity. Advanced treatment can remove smaller particles (e.g. nanofiltration can remove particles > 0.001 µm).
Monomers (chemical hazards, e.g. 1,3-butadiene, ethylene oxide, vinyl chloride)
Six of the eight most hazardous monomers have WHO drinking-water guideline values. Residual monomer content in microplastics is unknown.
Weathering and biodegradation may degrade polymers into monomers but the extent to which this occurs is unknown. However, unbound monomers are likely to leach into the environment, resulting in extremely small concentrations in drinking-water sources. Many monomers are likely to convert to more stable compounds in water (e.g. propylene oxide would convert to propylene glycol, which has low toxicity). Materials in contact with drinking-water, including plastics, should be approved for such use to ensure they do not leach substances, including monomers, at concentrations of concern.
Additives (chemical hazards, e.g. BPA, DEHP, lead)
Relevant additives are subject to risk assessments, with established toxicological point of departures. For lead, the provisional WHO guideline value is based on practical achievability. No safe limit for lead has been established.Some data are available on concentrations of additives detected in microplastics.
A MOE assessment was conducted for chemicals that have been detected in microplastics, are of toxicological concern and have adequate or accepted PODs for deriving a MOE. The MOE assessment indicates a low health concern since there are several orders of magnitude difference between the estimated exposure (based on a very conservative exposure scenario for microplastic-contaminated drinking-water) and the level at which no or limited adverse effects are known to occur.
Smaller additives with low molecular weight can migrate faster than larger additives. Migration may potentially increase as plastics age and weather. However, relative to other emission routes of additives to the environment, leaching from microplastic will likely be small.Inconclusive and limited evidence is available on the relative importance of microplastics acting as a vector of transport of chemical additives.Efforts have been taken to reduce the use of additives-of-concern from plastics. Materials in contact with drinking-water, including plastics, should be approved for such use to ensure they do not leach substances, including additives, at concentrations of concern.
Sorbed chemicals (chemical hazards, e.g. cadmium, DDT, PAHs, PCBs)
Relevant contaminants are subject to risk assessments, with established toxicological point of departures.Some data are available on concentrations of sorbed pollutants detected in microplastics.
The hydrophobic nature of microplastics implies that they can have the potential to accumulate POPs. Sediment, algae, the lipid fraction of biological organisms and microplastics all have similar capacities to accumulate POPs. Given the larger mass of soil, algae and aquatic organisms, the relative importance of microplastics to act as a vector of transport of POPs is likely negligible in comparison to other exposure routes.
Biofilms (microbial hazards)
There are only a limited number of occurrence studies in fresh water.
Low health concern considering the relative concentration of microplastics compared to other particles that pathogens can adhere to in fresh water and the well-established risk posed by the high concentrations and diversity of pathogens present in human and livestock waste in drinking-water sources.
Based on limited studies, microplastics may enable pathogens to travel longer distances in freshwater environments.Based on limited studies, biofilms on microplastics may contribute to antimicrobial resistance. Drinking-water treatment (clarification and membrane processes) is effective at removing particles, including microorganisms attached to particles. For microplastics that are not removed during treatment, the relative significance of microplastic-associated biofilms is still likely negligible due to the larger mass of drinking-water distribution systems and their subsequent ability to support more biofilms, compared to microplastics. Disinfection, including in distribution systems, can inactivate pathogens and control their growth.

Chapter 7: Conclusions, recommendations and knowledge gaps 67
Potential hazard Data available Preliminary risk assessment Considerations for exposure and risk
Particle (physical hazard)
No human studies are available on ingested microplastics.Effects have primarily been observed in a limited number of animal studies at high concentrations that are not applicable to drinking-water. Relevance of these studies to humans is unknown. Limited information is available on the uptake of microplastics, particularly for particles <150 µm.
Insufficient information to draw firm conclusions, although no reliable information suggests health concerns.
Absorption of smaller microplastics may be higher compared to larger microplastics based on limited studies examining exposure at high concentrations. Elevated exposure, however, is likely to overwhelm biological particle clearance mechanisms. Smaller particles may be more susceptible to adsorb biologically-significant proteins and molecules.The influence of shape and surface chemistry impacting toxicity is unknown for ingested microplastics. Conventional drinking-water treatment is effective at removing particles and is capable of removing particles smaller than a micrometre when optimized to produce treated water of low turbidity. Advanced treatment can remove smaller particles (e.g. nanofiltration can remove particles > 0.001 µm).
Monomers (chemical hazards, e.g. 1,3-butadiene, ethylene oxide, vinyl chloride)
Six of the eight most hazardous monomers have WHO drinking-water guideline values. Residual monomer content in microplastics is unknown.
Weathering and biodegradation may degrade polymers into monomers but the extent to which this occurs is unknown. However, unbound monomers are likely to leach into the environment, resulting in extremely small concentrations in drinking-water sources. Many monomers are likely to convert to more stable compounds in water (e.g. propylene oxide would convert to propylene glycol, which has low toxicity). Materials in contact with drinking-water, including plastics, should be approved for such use to ensure they do not leach substances, including monomers, at concentrations of concern.
Additives (chemical hazards, e.g. BPA, DEHP, lead)
Relevant additives are subject to risk assessments, with established toxicological point of departures. For lead, the provisional WHO guideline value is based on practical achievability. No safe limit for lead has been established.Some data are available on concentrations of additives detected in microplastics.
A MOE assessment was conducted for chemicals that have been detected in microplastics, are of toxicological concern and have adequate or accepted PODs for deriving a MOE. The MOE assessment indicates a low health concern since there are several orders of magnitude difference between the estimated exposure (based on a very conservative exposure scenario for microplastic-contaminated drinking-water) and the level at which no or limited adverse effects are known to occur.
Smaller additives with low molecular weight can migrate faster than larger additives. Migration may potentially increase as plastics age and weather. However, relative to other emission routes of additives to the environment, leaching from microplastic will likely be small.Inconclusive and limited evidence is available on the relative importance of microplastics acting as a vector of transport of chemical additives.Efforts have been taken to reduce the use of additives-of-concern from plastics. Materials in contact with drinking-water, including plastics, should be approved for such use to ensure they do not leach substances, including additives, at concentrations of concern.
Sorbed chemicals (chemical hazards, e.g. cadmium, DDT, PAHs, PCBs)
Relevant contaminants are subject to risk assessments, with established toxicological point of departures.Some data are available on concentrations of sorbed pollutants detected in microplastics.
The hydrophobic nature of microplastics implies that they can have the potential to accumulate POPs. Sediment, algae, the lipid fraction of biological organisms and microplastics all have similar capacities to accumulate POPs. Given the larger mass of soil, algae and aquatic organisms, the relative importance of microplastics to act as a vector of transport of POPs is likely negligible in comparison to other exposure routes.
Biofilms (microbial hazards)
There are only a limited number of occurrence studies in fresh water.
Low health concern considering the relative concentration of microplastics compared to other particles that pathogens can adhere to in fresh water and the well-established risk posed by the high concentrations and diversity of pathogens present in human and livestock waste in drinking-water sources.
Based on limited studies, microplastics may enable pathogens to travel longer distances in freshwater environments.Based on limited studies, biofilms on microplastics may contribute to antimicrobial resistance. Drinking-water treatment (clarification and membrane processes) is effective at removing particles, including microorganisms attached to particles. For microplastics that are not removed during treatment, the relative significance of microplastic-associated biofilms is still likely negligible due to the larger mass of drinking-water distribution systems and their subsequent ability to support more biofilms, compared to microplastics. Disinfection, including in distribution systems, can inactivate pathogens and control their growth.
68 Microplastics in drinking-water
An important consideration is that wastewater and drinking-water treatment is not available nor optimized in many places. In these settings, there may be higher levels of microplastics in drinking-water and freshwater sources. However, the health risks associated with exposure to pathogens present in untreated or inadequately treated water will be far greater. By addressing the bigger problem of exposure to untreated or inadequately treated water, communities can simultaneously address the smaller concern related to microplastics in surface water and other drinking-water supplies.
7.2 Recommendations
Routine monitoring of microplastics in drinking-water is not recommended at this time, as there is no evidence to indicate a human health concern. Concerns over microplastics in drinking-water should not divert resources of water suppliers and regulators from other important issues, including the removal of microbial pathogens, which remains the most significantrisktohumanhealth fromdrinking-water. Water suppliers should establish water safety plans and ensure that control measures, including water treatment processes, are optimized for particle removal, and microbial safety, which will incidentally improve the removal of microplastic particles.
However, more research is needed to better understand the occurrence of microplastics in the environment and in media that may result in human exposure. Although routine monitoring is not recommended, it would be appropriate to undertake targeted, well-designed and quality-controlled investigative studies to better understand the sources andoccurrenceofmicroplastics in freshwateranddrinking-water, theefficacyofdifferent treatmentprocessesandcombinationsofprocesses,andthesignificanceof the potential return of microplastics to the environment from treatment waste streams including the application of sludge biosolids to agricultural land.
To help inform water supply management options, more information is needed on the source of microplastic pollution in fresh water and drinking-water, as well as the mechanismsandefficacyofremovingplasticparticlesinbothwastewateranddrinking-water treatment. However, regardless of the human health risk posed by exposure to microplastics in drinking-water, improving management of plastics and reducing the use of plastics where feasible, to minimize the number of plastics released into theenvironmentisrecommendedbecausetheseactionscanconferotherbenefitsto
Concerns overmicroplastics in drinking-water
should not divert resources from other important issues,
including the removal of microbial pathogens, which remains the most significant risk to human health from
drinking-water.

Chapter 7: Conclusions, recommendations and knowledge gaps 69
the environment and human well-being. Strategies to minimize microplastic inputs can resultinotherbenefitsaswell,forexample,improvementstowatertreatmentcanresult in the removal of a range of contaminants, from microbial pathogens to emerging contaminants including microplastics in both wastewater and drinking-water, providing a more sustainable and comprehensive solution than microplastic removal alone.
7.3 Knowledge gaps and research needs
There are a number of data gaps that preclude a more accurate and reliable assessment of exposure and potential impacts to human health. This section summarizes the highest priority research needs to better assess human health risks and inform management actions.
• Development of standard methods: There is a need to improve microplastic sampling and analysis using quality-assured methods. Standard methods for measuring microplastic particles, including nanoplastics in water should be developed to improve the quality of studies and enable researchers to compare and reproduce results. To date, there are no data on the occurrence of nanoplastics in drinking-water or drinking-water sources.
• More studies on the occurrence and characteristics of microplastics: There is a need to better understand the occurrence of microplastics in the environment and in drinking-water using quality-assured methods to determine numbers, shapes, sizes, composition and sources of microplastics.
• Improved understanding of sources of microplastics into fresh water: Although surface run-off andwastewater effluent are considered themain sources ofmicroplastics into fresh water, better data are required to quantify their contributions relative to other inputs and identify the original sources of contamination through these pathways. This may require establishing reliable methods to track origins and identify major sources of microplastics in fresh water.
• More data on the occurrence and fate of microplastics throughout the water supply chain: In drinking-water, an understanding of the occurrence and fate of microplastics is needed throughout the water supply chain, pre- and post-treatment and in sub-optimal conditions to determine the proportion of and types of microplastic particles coming from the freshwater environment, abstraction, treatment systems, distribution systems and bottling and to better characterize effectiveness of water treatment.
• More data on the return and significance of treatment waste streams: Since plastics are usually not destroyed, but rather transferred from one phase to

70 Microplastics in drinking-water
another,abetterunderstandingonthereturnandsignificanceofmicroplasticstothe environment from drinking-water and wastewater treatment waste streams, including sludge, is needed. There are currently limited data available on this.
• Increased understanding of toxicological effects of microplastics following ingestion: Toxicological testing of microplastics has been limited mostly to aquatic organisms, and there are no toxicological or epidemiological studies that would inform human health risk assessment for microplastic ingestion. Some toxicological endpoints in a limited number of studies have been conducted but there are questions regarding the reliability of these studies, which are generally limited to assessing effects under high exposure scenarios with unclear relevance to human exposureviadrinking-wateratsignificantlylowerconcentrations.Quality-assuredtoxicological data are needed from cell models and/or animals on the most common forms of plastic particles appropriate for human health risk assessment. A better understanding is also needed on the characteristics of microplastics that are most predictive of their toxicity.
• More data on the uptake and fate of microplastics in the GI tract: The current database of information on plastic particle absorption and toxicity is limited toafewstudiesusingPE,PETorPS.Abetterunderstandingisneededontheuptake of microplastic particles, the fate of microplastics in the GI tract and the influenceofparticlesize,shapeandchemicalcomposition,particularlyinrelationto nanoplastics.
• Better understanding of overall microplastic exposures in the environment: The significanceof exposure tomicroplastics in drinking-water alsoneeds toconsiderrelativeexposurefromothersourcessuchasfoodandair.Itisdifficultwith available information to make a robust quantitative estimate on the relative contribution from different sources. A better understanding of occurrence in these environmental compartments, including quality of these studies, will be useful in articulating relative exposure through drinking-water compared to other sources.

References 71
References
Adams RG, et al. (2007). Polyethylene devices: passive samplers for measuring dissolved hydrophobicorganiccompoundsinaquaticenvironments.EnvironmentalScience&Technology, 41(4):1317-1323. doi: 10.1021/es0621593.
AndradyAL(2007a).Biodegradabilityofpolymers.In:MarkJE,ed.Physicalpropertiesofpolymershandbook.NewYork:Springer:939–950.doi:10.1007/978-0-387-69002-5.
AndradyAL (2007b).Ultraviolet radiation and polymers. InMark JE, ed. Physicalpropertiesofpolymershandbook.NewYork:Springer:857–866.doi:10.1007/978-0-387-69002-5.
Alimi OS, et al. (2018). Microplastics and nanoplastics in aquatic environments: aggregation,deposition,andenhancedcontaminanttransport.EnvironmentalScience& Technology, 52(4):1704-1724. doi: 10.1021/acs.est.7b05559.
Araújo PHH, et al. (2002). Technique for reducing residual monomer content in polymers: a review. Polymer Engineering& Science, 42(7):1442–68. doi: 10.1002/pen.11043.
Arias-Andres M, et al. (2018). Microplastic pollution increases gene exchange in aquatic ecosystems.EnvironmentalPollution,237:253–61.doi:10.1016/j.envpol.2018.02.058.
Atanasova N, et al. (2018). Persistence of infectious enterovirus within free-living amoebae. A novel waterborne risk pathway? Water Research, 144:204–214. doi: 10.1016/j.watres.2018.07.023.
Baldwin AK, Corsi SR and Mason SA (2016). Plastic debris in 29 Great Lakes tributaries: relationstowatershedattributesandhydrology.EnvironmentalScience&Technology,50:10377-10385. doi: 10.1021/acs.est.6b02917.
Barnes DK, et al. (2009). Accumulation and fragmentation of plastic debris in global environments. Philosophical Transactions of the Royal Society: B Biological Sciences, 364(1526): 1985-1998. doi: 10.1098/rstb.2008.0205.
Bhardwaj H, Gupta R and Tiwari A (2012). Microbial population associated with plastic degradation.ScientificReports,1:272.doi:10.4172/scientificreports.
Böhmert L, Stock V and Braeuning A (2019). Plausibility of microplastic uptake in apaperbyDengetal.,ScientificReports7:46687,2017.ArchivesofToxicology,93(1):217-218. doi: 10.1007/s00204-018-2383-9.
Boucher J and Friot D (2017). Primary microplastics in the oceans: a global evaluation of sources. Gland (CH): International Union for Conservation of Nature (https://www.iucn.org/content/primary-microplastics-oceans, accessed 1 July 2019). doi: 10.2305/IUCN.CH.2017.01.en.
72 Microplastics in drinking-water
Braeuning A (2019). Uptake of microplastics and related health effects: a critical discussionofDengetal.,Scientificreports7:46687,2017.ArchivesofToxicology,93:219–20. doi: 10.1007/s00204-018-2367-9.
Braun U, et al. (2018). Sampling, preparation and detection methods. Discussion paper, microplastics analytics, eds. Stein U, Schritt H. Berlin: German Federal Ministry ofEducationandResearch (https://bmbf-plastik.de/en/publication/discussion-paper-microplastics-analytics, accessed 26 June 2019).
BuseHY,etal.(2014).Microbialdiversities(16Sand18SrRNAgenepyrosequencing)andenvironmentalpathogenswithindrinkingwaterbiofilmsgrownonthecommonpremiseplumbingmaterialsunplasticizedpolyvinylchlorideandcopper.FEMSMicrobiologyEcology,88(2):280–95.doi:10.1111/1574-6941.12294.
CarrKE,etal.(2012).Morphologicalaspectsofinteractionsbetweenmicroparticlesandmammalian cells: intestinal uptake and onward movement. Progress in Histochemistry Cytochemistry, 46:185–252. doi: 10.1016/j.proghi.2011.11.001.
Carr SA, Liu J and Tesoro AG (2016). Transport and fate of microplastic particles in wastewater treatment plants. Water Research, 91:174–82. doi: 10.1016/j.watres.2016.01.002.
Cassini A, et al. (2018). Impact of infectious diseases on population health using incidence-baseddisability-adjusted life years (DALYs): results from theBurdenofCommunicableDiseasesinEuropestudy,EuropeanUnionandEuropeanEconomicAreacountries,2009to2013.Eurosurveillance,23(16):15-34.doi:10.2807/1560-7917.ES.2018.23.16.17-00454.
Catarino AI, et al. (2018). Low levels of microplastics (MP) in wild mussels indicate that MPingestionbyhumansisminimalcomparedtoexposureviahouseholdfibresfalloutduringameal.EnvironmentalPollution,237:675–84.doi:10.1016/j.envpol.2018.02.069.
CorcoranPL,BeisingerMCandGrifiM(2009).Plasticsandbeaches:adegradingrelationship. Marine Pollution Bulletin, 58(1):80–84. doi: 10.1016/j.marpolbul.2008.08.022.
ColeM(2016).Anovelmethodforpreparingmicroplasticfibers.ScientificReports,6:34519. doi: 10.1038/srep34519.
Crittenden JC, et al. (2012). MWH’s water treatment principles and design, 3rd edition. Hoboken: John C Crittenden, James H Borchardt, Montgomery Watson Harza (Firm) Wiley & Sons Inc. doi: 10.1002/9781118131473.
Dawson AL, et al. (2018). Turning microplastics into nanoplastics through digestive fragmentation by Antarctic krill. Nature Communications, 9:1001-8. doi: 10.1038/s41467-018-03465-9.

References 73
Defra and Gove M (2018). World leading microbeads ban comes into force [press release].London:DepartmentforEnvironment,Food&RuralAffairs(https://www.gov.uk/government/news/world-leading-microbeads-ban-comes-into-force, accessed 30 April 2019).
des Rieux A, et al. (2007). An improved in vitro model of human intestinal follicle-associatedepitheliumtostudynanoparticletransportbyMcells.EuropeanJournalofPharmaceutical Sciences, 30:380–91. doi: 10.1016/j.ejps.2006.12.006.
DengY,etal.(2017).Tissueaccumulationofmicroplasticsinmiceandbiomarkerresponsessuggestwidespreadhealthrisksofexposure.ScientificReports,7:46687.doi:10.1038/srep46687.
DengY,etal.(2018).Evidencethatmicroplasticsaggravatethetoxicityoforganophosphorusflameretardantsinmice.JournalofHazardousMaterial,357:348-354.doi:10.1016/j.jhazmat.2018.06.017.
Di M and Wang J (2018). Microplastics in surface waters and sediments of the Three GorgesReservoir,China.ScienceoftheTotalEnvironment,616–617:1620–7.doi:10.1016/j.scitotenv.2017.10.150.
DrisR,etal.(2016).Syntheticfibersinatmosphericfallout:asourceofmicroplasticsin the environment? Marine Pollution Bulletin, 104(1-2):290–3. doi: 10.1016/j.marpolbul.2016.01.006.
DrisR, et al. (2017).Afirstoverviewof textile fibers, includingmicroplastics, inindoorandoutdoorenvironments.EnvironmentalPollution,221:453–8.doi:10.1016/j.envpol.2016.12.013.
ECHA(2019).Proposalforarestriction:intentionallyaddedmicroplastics.EuropeanChemicals Agency (Annex XV restriction report: Version 1.1; https://echa.europa.eu/documents/10162/12414bc7-6bb2-17e7-c9ec-652a20fa43fc, accessed 1 July 2019).
Eckert EM, et al. (2018).Microplastics increase impact of treatedwastewateronfreshwatermicrobialcommunity.EnvironmentalPollution,234:495–502.doi:10.1016/j.envpol.2017.11.070.
Eerkes-MedranoD, Thompson RC and AldridgeDC (2015). Microplastics infreshwatersystems:areviewof theemerging threats, identificationofknowledgegaps and prioritisation of research needs. Water Research, 75:63–82. doi: 10.1016/j.watres.2015.02.012.
EFSA(2015).Scientificopinionontheriskstopublichealthrelatedtothepresenceof bisphenol A (BPA) in foodstuffs. Parma: PanelonFoodContactMaterials,Enzymes,FlavouringsandProcessingAids(CEF),EuropeanFoodSafetyAuthority.(https://efsa.onlinelibrary.wiley.com/doi/abs/10.2903/j.efsa.2015.3978, accessed 19 June 2019). doi: 10.2903/j.efsa.2015.3978.

74 Microplastics in drinking-water
EFSA(2016).Presenceofmicroplasticsandnanoplasticsinfood,withparticularfocusonseafood.Parma:PanelonContaminantsintheFoodChain,EuropeanFoodSafetyAuthority. (https://efsa.onlinelibrary.wiley.com/doi/epdf/10.2903/j.efsa.2016.4501, accessed 30 April 2019). doi: 10.2903/j.efsa.2016.4501.
EndoS,etal.(2005).Concentrationsofpolychlorinatedbiphenyls(PCBs)inbeachesresin pellets: variability among individual particles and regional differences. Marine Pollution Bulletin, 50:1103–14. doi: 10.1016/j.marpolbul.2005.04.030.
EriksenM,etal.(2013).MicroplasticpollutioninthesurfacewatersoftheLaurentianGreat Lakes. Marine Pollution Bulletin, 77:177–182. doi: 10.1016/j.marpolbul.2013.10.007.
EC(2018).CommunicationfromthecommissiontotheEuropeanParliament,theCouncil,TheEuropeanEconomicandSocialCommitteeandtheCommitteeoftheRegions.AEuropeanstrategyforplasticsinacirculareconomy.Brussels:EuropeanCommission (http://ec.europa.eu/environment/circular-economy/pdf/plastics-strategy.pdf, accessed 18 June 2019).
Farrell C et al. (2018). Turbidity composition and the relationship with microbial attachmentandUVinactivationefficacy.ScienceoftheTotalEnvironment,624:638-647. doi: 10.1016/j.scitotenv.2017.12.173.
FAO(2017).Microplasticsinfisheriesandaquaculture:statusofknowledgeontheiroccurrence and implications for aquatic organisms and food safety. Rome: Food and Agriculture Organization (Technical Paper No. 615; http://www.fao.org/3/a-i7677e.pdf, accessed 30 April 2019).
FAO/WHO (2001). Pesticide residues in food - 2000. Report of the Joint Meeting of the2000FAOPanelofExpertsonPesticideResiduesinFoodandtheEnvironmentand the WHO Core Assessment Group. Food and Agriculture Organization and World Health Organization (FAO Plant Production and Protection Paper 163; http://www.fao.org/fileadmin/templates/agphome/documents/Pests_Pesticides/JMPR/Reports_1991-2006/Report__2000.pdf, accessed 1 July 2019).
FAO/WHO (2009). Principles and methods for the risk assessment of chemicals in food. Geneva: Food and Agriculture Organization and World Health Organization (EnvironmentalHealthCriteria 240;https://www.who.int/foodsafety/publications/chemical-food/en/, accessed 17 June 2019).
FWR (2017). Microplastics in the freshwater environment: a review of current knowledge. Marlow (UK): Foundation for Water Research (http://www.fwr.org/environw/frr0027.pdf, accessed 30 April 2019).
GasperiJ,etal.(2014).AssessmentoffloatingplasticdebrisinsurfacewateralongtheSeineRiver.EnvironmentalPollution,195:163–166.doi:10.1016/j.envpol.2014.09.001.
References 75
GESAMP(2015).Sources,fateandeffectsofmicroplasticsinthemarineenvironment:aglobalassessment.In:KershawPJed.London:IMO/FAO/UNESCO-IOC/UNIDO/WMO/IAEA/UN/UNEP/UNDPJointGroupofExpertsontheScientificAspectsofMarine Environmental Protection (Reports and StudiesNo. 90;http://ec.europa.eu/environment/marine/good-environmental-status/descriptor-10/pdf/GESAMP_microplastics%20full%20study.pdf, accessed 1 July 2019).
GESAMP(2016).Sources,fateandeffectsofmicroplasticsinthemarineenvironment:part two of a global assessment. In: Kershaw PJ and Rochman CM, eds. London: IMO/FAO/UNESCO-IOC/UNIDO/WMO/IAEA/UN/UNEP/UNDPJointGroupofExpertsontheScientificAspectsofMarineEnvironmentalProtection(ReportsandStudiesNo.93;http://www.gesamp.org/site/assets/files/1275/sources-fate-and-effects-of-microplastics-in-the-marine-environment-part-2-of-a-global-assessment-en.pdf, accessed 1 July 2019).
Gewert B, Plassmann MM and MacLeod M (2015). Pathways for degradation of plastic polymersfloating in themarineenvironment.EnvironmentalScience:Processes&Impacts,17:1513-1521.doi:10.1039/c5Em00207a.
Geyer R, Jambeck JR and Law KL (2017). Production, use, and fate of all plastics ever made. Science Advances, 3(7):e1700782. doi: 10.1126/sciadv.1700782.
GündogduS,etal.(2018).MicroplasticsinmunicipalwastewatertreatmentplantsinTurkey:acomparisonoftheinfluentandsecondaryeffluentconcentrations.EnvironmentalMonitoring and Assessment, 190(11):626. doi: 10.1007/s10661-018-7010-y.
Hahladakis JN, et al. (2018). An overview of chemical additives present in plastics: migration, release, fate and environmental impact during their use, disposal and recycling. Journal of Hazardous Material, 344:179-199. doi: 10.1016/j.jhazmat.2017.10.014.
Hale SE, et al. (2010). Partitioning of organochlorine pesticides fromwater topolyethylene passive samplers. Environmental Pollution, 158(7):2511-2517. doi:10.1016/j.envpol.2010.03.010.
HansenE,etal.(2013).Hazardoussubstancesinplasticmaterials.Vejle(DK):COWIand Danish Technological Institute for the Norwegian Climate and Pollution Agency (Klif) (TA 3017/2013).
Harandi MH, et al. (2017). Morphological and mechanical properties of styrene butadiene rubber/nano copper nanocomposites. Results in Physics, 7:338–344. doi: 10.1016/j.rinp.2016.11.022.
HarrisonJP,etal.(2018).Microplastic-associatedbiofilms:acomparisonoffreshwaterand marine environments. In: Wagner M, Lambert S, eds., Freshwater microplastics. TheHandbookofEnvironmentalChemistry,vol.58.Cham(CH):Springer:181–201(https://www.springer.com/de/book/9783319616148, accessed 1 July 2019). doi: 10.1007/978-3-319-61615-5_9.

76 Microplastics in drinking-water
Hartmann NB, et al. (2019). Are we speaking the same language? Recommendations for a definition and categorization framework for plastic debris. EnvironmentalScience & Technology, 53(3):1039-1047. doi: 10.1021/acs.est.8b05297. doi: 10.1021/acs.est.8b05297.
HendricksonE,MinorECandSchreinerK(2018).Microplasticabundanceandcompositionin western Lake Superior as determined via microscopy, Pyr-GC/MS, and FTIR. EnvironmentalScience&Technology,52(4):1787–96.doi:10.1021/acs.est.7b05829.doi: 10.1021/acs.est.7b05829.
HenryB,LaitalaKandKleppIG(2019).Microfibresfromapparelandhometextiles:prospects for including microplastics in environmental sustainability assessment. ScienceoftheTotalEnvironment,652:483-494.doi:10.1016/j.scitotenv.2018.10.166.
HermsenE, et al. (2018).Quality criteria for the analysisofmicroplastic inbiotasamples:acriticalreview.EnvironmentalScience&Technology,52:10230−40.doi:10.1021/acs.est.8b01611.
Hidalgo-Ruz V, et al. (2012). Microplastics in the marine environment: a review of the methodsusedforidentificationandquantification.EnvironmentalScience&Technology,46:3060-75. doi:10.1021/es2031505.
Hirai H, et al. (2011). Organic micropollutants in marine plastics debris from the open ocean and remote and urban beaches. Marine Pollution Bulletin, 62(8):1683–92. doi: 10.1016/j.marpolbul.2011.06.004.
Horton AA, et al. (2017). Microplastics in freshwater and terrestrial environments: evaluating the current understanding to identify the knowledge gaps and future researchpriorities. Scienceof theTotalEnvironment,586:127–41.doi:10.1016/j.scitotenv.2017.01.190.
HüfferT,etal.(2017).Microplasticexposureassessmentinaquaticenvironments:learningfromsimilaritiesanddifferencestoengineerednanoparticles.EnvironmentalScience & Technology, 51:2499-2507. doi: 10.1021/acs.est.6b04054.
Hussain N, Jaitley V and Florence AT (2001). Recent advances in the understanding of uptake of microparticulates across the gastrointestinal lymphatics. Advanced Drug Delivery Reviews, 50:107–42. doi: 10.1016/S0169-409X(01)00152-1.
IPCS (1997). Hexachlorobenzene. Geneva: International Programme on Chemical Safety(EnvironmentalHealthCriteria195;http://www.inchem.org/documents/ehc/ehc/ehc195.htm, accessed 1 July 2019).
IPCS (2003). Polychlorinated Biphenyls: human health aspects. Geneva: International Programme on Chemical Safety (Concise International Chemical Assessment Document 55; https://www.who.int/ipcs/publications/cicad/en/cicad55.pdf?ua=1b, accessed 1 July 2019).

References 77
ISO (2013). Plastics -- vocabulary. International Organization for Standardization (ISO 472:2013; https://www.iso.org/standard/44102.html, accessed 19 June 2019).
ISO (in press). Plastics in the environment -- current state of knowledge and methodologies. International Organization for Standardization (ISO/DTR 21960; https://www.iso.org/standard/72300.html, accessed 26 June 2019).
Jahnke A, et al. (2017) Reducing uncertainty and confronting ignorance about the possible impacts ofweathering plastic in themarine environment. EnvironmentalScience & Technology Letter, 4:85-90. doi: 10.1021/acs.estlett.7b00008.
Jani P, et al. (1990). Nanoparticle uptake by the rat gastrointestinal mucosa: quantitation and particle size dependency. Journal of Pharmaceutical Pharmacology, 42:821–6. doi: 10.1111/j.2042-7158.1990.tb07033.x.
Jarvis P, et al. (2005).A reviewof floc strength and breakage.WaterResearch,39:3121–37. doi: 10.1016/j.watres.2005.05.022.
JECFA(2006a).EvaluationsoftheJointFAO/WHOExpertCommitteeonFoodAdditives:polybrominated diphenyl ethers. Geneva: World Health Organization (Technical Report Series930-JECFA64/44;http://apps.who.int/food-additives-contaminants-jecfa-database/chemical.aspx?chemID=5294, accessed 17 June 2019).
JECFA(2006b).EvaluationsoftheJointFAO/WHOExpertCommitteeonFoodAdditives:Polycyclic aromatic hydrocarbons. Geneva: World Health Organization (Technical ReportSeries930-JECFA64/61;http://apps.who.int/food-additives-contaminants-jecfa-database/PrintPreview.aspx?chemID=4306, accessed 30 April 2019).
JECFA(2011).Evaluationofcertainfoodadditivesandcontaminants.Seventy-thirdreportoftheJointFAO/WHOExpertCommitteeonFoodAdditives.Geneva:WorldHealth Organization (Technical Report Series 960; https://apps.who.int/iris/bitstream/handle/10665/44515/WHO_TRS_960_eng.pdf, accessed 30 April 2019).
JinY,etal.(2019).Impactsofpolystyrenemicroplasticonthegutbarrier,microbiotaandmetabolismofmice.ScienceoftheTotalEnvironment,649:308–17.doi:10.1016/j.scitotenv.2018.08.353.
Karapanagioti H and Werner D (2018). Sorption of hydrophobic organic compounds to plastics in the marine environment: sorption and desorption kinetics. In: Takada H, Karapanagioti H, eds., Hazardous chemicals associated with plastics in the marine environment. TheHandbook of EnvironmentalChemistry, vol. 78.Cham (CH):Springer;205–9.doi:10.1007/698_2016_11.
Kay P, et al. (2018). Wastewater treatment plants as a source of microplastics in river catchments.EnvironmentalScienceandPollutionResearch,25:20264–7.doi:10.1007/s11356-018-2070-7.

78 Microplastics in drinking-water
Khan I, Saeed K, Khan I (2017). Nanoparticles: properties, applications and toxicities. Arabian Journal of Chemistry. doi: 10.1016/j.arabjc.2017.05.011.
KoelmansAA,BesselingEandFoekemaEM(2014).Leachingofplasticadditivestomarineorganisms.EnvironmentalPollution,187:49–54.doi:10.1016/j.envpol.2013.12.013.
Koelmans AA, et al. (2016). Microplastic as a vector for chemicals in the aquatic environment: critical review and model-supported reinterpretation of empirical studies. EnvironmentalScience&Technology,50(7):3315-3326.doi:10.1021/acs.est.5b06069.
Koelmans AA, et al. (2019). Microplastics in freshwaters and drinking water: critical review and assessment of data quality. Water Research, 155:410-422. doi: 10.1016/j.watres.2019.02.054. (https://www.sciencedirect.com/science/article/pii/S0043135419301794, accessed 30 April 2019).
KosuthM,MasonSAandWattenbergEV(2018).Anthropogeniccontaminationoftapwater,beer,andseasalt.PLoSONE,13(4):e0194970.doi:10.1371/journal.pone.0195970.
Kulkarni SA and Feng SS (2013). Effects of particle size and surfacemodificationon cellular uptake and biodistribution of polymeric nanoparticles for drug delivery. Pharmaceutical Research, 30:2512–22. doi: 10.1007/s11095-012-0958-3.
The Lancet Planetary Health (2017). Microplastics and human health-an urgent problem. Editorial,October,1(7):e254.doi:10.1016/S2542-5196(17)30121-3.
LaresM,etal.(2018).Occurrence,identificationandremovalofmicroplasticparticlesandfibersinconventionalactivatedsludgeprocessandadvancedMBRtechnology.Water Research, 133:236–46. doi: 10.1016/j.watres.2018.01.049.
Lassen C, et al. (2015). Microplastics: occurrence, effects and sources of releases to the environmentinDenmark.ReportforMinistryforEnvironmentandFood.Copenhagen:DenmarkEnvironmentalProtectionAgency(EnvironmentalprojectNo.1793).
LettermanRDandYiacoumiS(2011).Coagulationandflocculation.In:EdzwaldJKed., Water quality and treatment: a handbook of drinking water (6th ed), ch. 8. New York:AmericanWaterWorksAssociation/McGrawHill.
Li J, Liu H and Chen P (2018). Microplastics in freshwater systems: a review on occurrence, environmental effects, and methods for microplastics detection. Water Research, 137:362–74. doi: 10.1016/j.watres.2017.12.056.
LithnerD,LarssonAandDaveG(2011).Environmentalandhealthhazardrankingand assessment of plastic polymers based on chemical composition. Science of the TotalEnvironment,409:3309–24.doi:10.1016/j.scitotenv.2011.04.038.
Liu G, et al. (2019). Sorption behaviour and mechanism of hydrophilic organic chemicals tovirginandagedmicroplasticsinfreshwaterandseawater.EnvironmentalPollution,246:26–33. doi: 10.1016/j.envpol.2018.11.100.
References 79
Lohmann R, et al. (2012). Use of passive sampling devices for monitoring and compliance checkingofPOPconcentrationsinwater.EnvironmentalScienceandPollutionResearch,19(6):1885–1895. doi: 10.1007/s11356-012-0748-9.
Lu L, et al. (2018). Polystyrene microplastics induce gut microbiota dysbiosis and hepatic lipidmetabolismdisorderinmice.ScienceoftheTotalEnvironment,631–632:449–58.doi: 10.1016/j.scitotenv.2018.03.051.
Ma B, et al. (2019). Characteristics of microplastic removal via coagulation and ultrafiltration during drinking water treatment. Chemical Engineering Journal,359:159–167. doi: 10.1016/j.cej.2018.11.155.
Magni S, et al. (2019). The fate of microplastics in an Italian wastewater treatment plant. ScienceoftheTotalEnvironment,652:602–10.doi:10.1016/j.scitotenv.2018.10.269.
Magnusson K and Norén F (2014). Screening of microplastic particles in and down-streamawastewatertreatmentplant.Stockholm:IVLSwedishEnvironmentalResearchInstitute (Report No. C 55).
Mahler GJ, et al. (2012). Oral exposure to polystyrene nanoparticles affects iron absorption. Nature Nanotechnoogy, 7:264–71. doi: 10.1038/nnano.2012.3.
MaiL,etal.(2018)PolycyclicaromatichydrocarbonsaffiliatedwithmicroplasticsinsurfacewatersofBohaiandHuanghaiSeas,China.EnvironmentalPollution,241:834-840. doi : 10.1016/j.envpol.2018.06.012.
ManiT,etal.(2015).MicroplasticsprofilealongtheRhineRiver.ScientificReports,5:17988. doi: 10.1038/srep17988.
Mason SA, Welch VG and Neratko J (2018). Synthetic polymer contamination in bottled water. Frontiers in Chemistry, 6:407. doi: 10.3389/fchem.2018.00407.
Mason SA, et al. (2016). Microplastic pollution is widely detected in US municipal wastewater treatment plant effluent. Environmental Pollution, 218:1045–54. doi:10.1016/j.envpol.2016.08.056.
Massos A and Turner A (2017). Cadmium, lead and bromine in beached microplastics. EnvironmentalPollution,227:139–45.doi:10.1016/j.envpol.2017.04.034.
McCormick A, et al. (2014). Microplastic is an abundant and distinct microbial habitat inanurbanriver.EnvironmentalScience&Technology,48:11863–71.doi:10.1021/es503610r.
McCormick AR, et al. (2016). Microplastic in surface waters of urban rivers: concentration, sources,andassociatedbacterialassemblages.Ecosphere,7(11):e01556.doi:10.1002/ecs2.1556.

80 Microplastics in drinking-water
Merski, JA et al. (2008). Oral toxicity and bacterial mutagenicity studies with a spunbond polyethylene and polyethylene terephthalate polymer fabric. International Journal of Toxicology, 27:387-395. doi: 10.1080/10915810802408729.
MintenigSM,etal.(2017).Identificationofmicroplasticineffluentsofwastewatertreatment plants using focal plane array-based micro-Fourier-transform infrared imaging. Water Research, 108:365–72. doi: 10.1016/j.watres.2016.11.015.
Mintenig SM, et al. (2019). Low numbers of microplastics detected in drinking water from groundwater sources. Science of the Total Environment, 648:631–5. doi:10.1016/j.scitotenv.2018.08.178.
Mohamed Nor NH and Koelmans AA (2019). Transfer of PCBs from microplastics undersimulatedgutfluidconditionsisbiphasicandreversible.EnvironmentalScience& Technology, 53(4):1874-1883. doi: 10.1021/acs.est.8b05143.
Morritt D, et al. (2014). Plastic in the Thames: a river runs through it. Marine Pollution Bulletin, 78(1-2):196-200. doi: 10.1016/j.marpolbul.2013.10.035.
Müller JF, et al. (2001). Partitioning of polycyclic aromatic hydrocarbons in thepolyethylene/water system. Fresenius’ Journal of Analytical Chemistry, 371(6):816-822. doi: 10.1007/s002160101025.
Murphy F, et al. (2016). Wastewater treatment works (WwTW) as a source of microplastics in the aquatic environment. Environmental Science&Technology,50(11):5800–8. doi: 10.1021/acs.est.5b05416.
Napper IE, et al. (2015). Characterisation, quantity and sorptive properties ofmicroplastics extracted from cosmetics. Marine Pollution Bulletin, 99:178–85. doi: 10.1016/j.marpolbul.2015.07.029.
Nauendorf A, et al. (2016). Microbial colonization and degradation of polyethylene and biodegradableplasticbagsintemperatefine-grainedorganic-richmarinesediments.MarinePollutionBulletin,103:168−78.doi:10.1016/j.marpolbul.2015.12.024.
Nerland IL, et al. (2014). Microplastics in marine environments: occurrence, distribution and effects. Oslo: Norwegian Institute Water Research (Report no. 6754-2014).
NTP,(2018).DraftNTPresearchreportontheCLARITY-BPACoreStudy:aperinataland chronic extended-dose-range study of bisphenol A in rats. Research Triangle Park (NC): National Toxicology Program (NTP RR 9).
Oberbeckmann S, Kreikemeyer B and LabrenzM (2018). Environmental factorssupporttheformationofspecificbacterialassemblagesonmicroplastics.FrontiersinMicrobiology, 8:2709. doi: 10.3389/fmicb.2017.02709.

References 81
OßmannBE,etal.(2018).Small-sizedmicroplasticsandpigmentedparticlesinbottledmineral. Water Research, 141:307–16. doi: 10.1016/j.watres.2018.05.027.
PankoJ,etal.(2019).Evaluationoftirewearcontributiontopm2.5inurbanenvironments.Atmosphere, 10(2):99. doi: 10.3390/atmos10020099.
PedersenK(1990).BiofilmdevelopmentonstainlesssteelandPVCsurfacesindrinkingwater.WaterResearch,24:239−43.doi:10.1016/0043-1354(90)90109-J.
Pellet Watch (2019). Global monitoring of POPs using beached plastic resin pellets [website]. Tokyo: Laboratory of Organic Geochemistry, Tokyo Univeristy of Agriculture and Technology (www.pelletwatch.org, accessed 26 June 2019).
Pivokonsky M, et al. (2018). Occurrence of microplastics in raw and treated drinking water. ScienceoftheTotalEnvironment,643:1644–51.doi:10.1016/j.scitotenv.2018.08.102.
PlasticsEurope(2017).Plastics–thefacts:ananalysisofEuropeanplasticsproduction,demand and waste data (https://www.plasticseurope.org/application/files/5715/1717/4180/Plastics_the_facts_2017_FINAL_for_website_one_page.pdf, accessed 30 April 2019).
Plastics Europe (2018). Plastics the facts 2017: an analysis of European plasticsproduction demand and waste data (https://www.plasticseurope.org/application/files/5715/1717/4180/Plastics_the_facts_2017_FINAL_for_website_one_page.pdf,accessed 2 July 2019).
RafieeM, et al. (2018).Neurobehavioral assessment of rats exposed to pristinepolystyrene nanoplastics upon oral exposure. Chemosphere, 193:745–753. doi: 10.1016/j.chemosphere.2017.11.076.
Rios LM, Moore C and Jones PR. (2007). Persistent organic pollutants carried by syntheticpolymersintheoceanenvironment.MarinePollutionBulletin,54:1230−237.doi: 10.1016/j.marpolbul.2007.03.022.
Rogers J, et al. (1994). Influence of plumbingmaterials on biofilm formation andgrowthofLegionellapneumophilainpotablewatersystems.AppliedEnvironmentalMicrobiology,60:1842−51.
RummelCD,etal. (2017). Impactsofbiofilm formationonthe fateandpotentialeffectsofmicroplasticintheaquaticenvironment.EnvironmentalScience&TechnologyLetter, 4(7):258–67. doi: 10.1021/acs.estlett.7b00164.
SAPEA,(2019).Ascientificperspectiveonmicroplasticsinnatureandsociety.Berlin:ScientificAdviceforPolicybyEuropeanAcademies(https://www.sapea.info/topics/microplastics/, accessed 1 July 2019). doi: 10.26356/microplastics.
Schirinzi GF, et al. (2017). Cytotoxic effects of commonly used nanomaterials and microplasticsoncerebralandepithelialhumancells.EnvironmentalResearch,159:579–87.doi: 10.1016/j.envres.2017.08.043.

82 Microplastics in drinking-water
SchmidtC,etal.(2013).Nano-andmicroscaledparticlesfordrugtargetingtoinflamedintestinalmucosa:afirstinvivostudyinhumanpatients.JournalofControlledRelease,165:139–45. doi: 10.1016/j.jconrel.2012.10.019.
SchöpelBandStammingerR(2019).Acomprehensiveliteraturestudyonmicrofibresfrom washing machines. Tenside Surfactants Detergents, 56(2): 94-104. doi: 10.3139/113.110610.
Schymanski D, et al. (2018). Analysis of microplastics in water by micro-Raman spectroscopy: release of plastic particles from different packaging into mineral water. Water Research, 129:154–62. doi: 10.1016/j.watres.2017.11.011.
Shah AA, et al. (2008). Biological degradation of plastics: a comprehensive review. BiotechnologyAdvances,26:246−65.doi:10.1016/j.biotechadv.2007.12.005.
Sherrington C, et al. (2016). Study to support the development of measures to combat a rangeofmarinelittersources.ReportfortheEuropeanCommissionDGEnvironment.
SlavikI,etal.(2012).ImpactofshearstressandpHchangesonflocsizeandremovalof dissolved organic matter (DOM). Water Research, 46:6543–6553. doi: 10.1016/j.watres.2012.09.033.
Strand J, et al. (2018). Analysis of microplastic particles in Danish drinking water. Aarhus,AarhusUniversity,DanishCentre forEnvironmentandEnergy. (ScientificReport No. 291).
Suhrhoff TJ and Scholz-Böttcher BM (2016). Qualitative impact of salinity, UV radiation and turbulence on leaching of organic plastic additives from four common plastics – a lab experiment. Marine Pollution Bulletin, 102:84–94. doi: 10.1016/j.marpolbul.2015.11.054.
Sun M, et al. (2018). Changes in tetracycline partitioning and bacteria/phage-comediated ARGs in microplastic-contaminated greenhouse soil facilitated by sophorolipid. Journal of Hazardous Material, 345:131–9. doi: 10.1016/j.jhazmat.2017.11.036.
Sun J, et al. (2019). Microplastics in wastewater treatment plants: detection, occurrence and removal. Water Research, 152:21–37. doi: 10.1016/j.watres.2018.12.050.
SundtP,SchulzePEandSyversenF(2014).Sourcesofmicroplastic-pollutiontothemarineenvironment.ReportpreparedfortheNorwegianEnvironmentAgency.Oslo:NorwegianEnvironmentAgency(Reportno.M-321|2015).
TalvitieJ,etal.(2017a).Howwellismicrolitterpurifiedfromwastewater?–adetailedstudy on the stepwise removal of microlitter in a tertiary level wastewater treatment plant. Water Research, 109:164–172. doi: 10.1016/j.watres.2016.11.046.
Talvitie J, et al. (2017b). Solutions to microplastic pollution – removal of microplastics fromwastewatereffluentwithadvancedwastewatertreatmenttechnologies.WaterResearch, 123:401–7. doi: 10.1016/j.watres.2017.07.005.
References 83
TanakaK,etal.(2015).Facilitatedleachingofadditive-derivedPBDEsfromplasticbyseabirds’stomachoilandaccumulationintissues.EnvironmentalScience&Technology,49(19):11799–807. doi: 10.1021/acs.est.5b01376.
Taniguchi, et al. (2016). Spatial variability in persistent organic pollutants and polycyclic aromatic hydrocarbons found in beach-stranded pellets along the coast of the state of São Paulo, Southeastern Brazil. Marine Pollution Bulletin, 106:87-94. doi: 10.1016/j.marpolbul.2016.03.024.
Thomson RC (2015). Microplastics in the marine environment: sources, consequences and solutions. In: Bergmann M, Gutow L, Klages M, eds., Marine anthropogenic litter, ch.7.Springer,Cham.https://doi.org/10.1007/978-3-319-16510-3_7.
TobiasonJetal.(2011).Granularmediafiltration.In:EdzwaldJK,ed.,Waterqualityandtreatment:ahandbookondrinkingwater(6thed.),ch.10.NewYork:AmericanWater Works Association/McGraw Hill.
Trent DL (2001). Propylene oxide. In: Kirk-Othmer encyclopedia of chemical technology.NewYork:JohnWiley&Sons,Inc.doi:10.1002/0471238961.1618151620180514.a01.pub2.
Trussell RR and Tate CH (1979). Measurement of particle size distributions in water treatment. In: Proceedings Advances in Laboratory Techniques for Water Quality Control. Philadelphia: American Water Works Association (Paper No. 2A-1:19-39).
UhlW,EftekhardadkhahMandSvendsenC(2018).MappingmicroplasticinNorwegiandrinking water. (Norsk Vann Report 241).
UN (1992). Rio declaration on environment and development. Report of the United NationsConferenceonEnvironmentandDevelopment.Geneva:UnitedNations(A/CONF.151/26 (Vol.1); https://www.un.org/documents/ga/conf151/aconf15126-1annex1.htm, accessed 17 June 2019).
UNEP(2015).Biodegradableplasticsandmarinelitter:misconceptions,concernsandimpactsonmarineenvironments.Nairobi:UnitedNationsEnvironmentProgramme.(http://hdl.handle.net/20.500.11822/7468, accessed 30 April 2019).
UNEP(2018).Single-useplastics:aroadmapforsustainability.Nairobi:UnitedNationsEnvironmentProgramme.(https://wedocs.unep.org/bitstream/handle/20.500.11822/25496/singleUsePlastic_sustainability.pdf?isAllowed=y&sequence=1, accessed 18 June 2019).
UNEP(2019a).MinisterialdeclarationoftheUnitedNationsEnvironmentAssemblyatitsfourthsession.Nairobi:UnitedNationsEnvironmentProgramme(UNEP/EA.4/HLS.1.; http://web.unep.org/environmentassembly/ministerial-declaration-resolutions-and-decisions-unea-4, accessed 18 June 2019).

84 Microplastics in drinking-water
UNEP(2019b).DraftdecisionBC-14/[]:amendmentstoannexesII,VIIIandIXtotheBaselConvention.Geneva:UnitedNationsEnvironmentProgramme(CHW.14/CRP.40).
UNEP(1989).TheBaselConventiononthecontroloftransboundarymovementofhazardous wastes and their disposal, 22 March 1989. Amended in 1995, 1998, and 2019.Geneva:UnitedNationsEnvironmentProgramme(1673U.N.T.S.126;http://www.basel.int/TheConvention/Overview/TextoftheConvention/tabid/1275/Default.aspx, accessed on 25 June 2019).
UNICEF/WHO(2019).Progressonhouseholddrinkingwatersanitationandhygiene2000-2017:specialfocusoninequalities.NewYork:UnitedNationsChildren’sFundand World Health Organization. (https://www.who.int/water_sanitation_health/publications/jmp-report-2019/en/, accessed 25 June 2019).
U.S.EPA(2003).LT1ESTWRdisinfectionprofilingandbenchmarkingtechnicalguidancemanual.WashingtonDC:OfficeofWater,UnitedStatesEnvironmentalProtectionAgency.
U.S.EPA(2006).Nationalprimarydrinkingwaterregulations:longterm2enhancedsurfacewatertreatmentrule.Finalrule.WashingtonDC:UnitedStatesEnvironmentalProtection Agency. Fed. Register, 71(3): 653–702.
USEPA(2016).Asummaryofliteratureonthechemicaltoxicityofplasticspollutionto aquatic life and aquatic-dependent wildlife. State of the Science White Paper. WashingtonDC:OfficeofWater,UnitedStatesEnvironmentalProtectionAgency(EPA-822-R-16-009;https://www.epa.gov/sites/production/files/2016-12/documents/plastics-aquatic-life-report.pdf, accessed 30 April 2019).
USEPA(2017).Microplasticsworkshopreport:TrashFreeWatersDialogMeeting,June28–29,2017.WashingtonDC:OfficeofWetlands,OceansandWatersheds,UnitedStatesEnvironmentalProtectionAgency.
US Government (2015). Microbead-Free Waters Act of 2015, House Resolution 1321. (https://www.congress.gov/bill/114th-congress/house-bill/1321/text, accessed 30 April 2019).
UKGovernment (2017). The Environmental Protection (Microbeads) (England)Regulations 2017, No 1312. (http://www.legislation.gov.uk/uksi/2017/1312/pdfs/uksi_20171312_en.pdf, accessed 30 April 2019).
vanderKooijD,etal(2017).BiofilmcompositionandthresholdconcentrationforgrowthofLegionellapneumophilaonsurfacesexposedtoflowingwarmtapwaterwithoutdisinfectant.AppliedandEnvironmentalMicrobiology,83(5):e02737–16.doi:10.1128/aem.02737-16.

References 85
van Wezel AP et al. (2018). Impact of industrial waste water treatment plants on Dutchsurfacewatersanddrinkingwatersources.ScienceoftheTotalEnvironment,640–641:1489–1499. doi:10.1016/j.scitotenv.2018.05.325.
VerschoorAJ(2015).Towardsadefinitionofmicroplastics:considerationsforthespecificationofphysico-chemicalproperties.Bilthoven:RIVM,NationalInstituteforPublicHealthandtheEnvironment(RIVMletterreport2015–0116).
VerschoorA,etal.(2016).Emissionofmicroplasticsandpotentialmitigationmeasures:abrasive cleaning agents, paints and tyre wear. Bilthoven: RIVM, National Institute for PublicHealthandtheEnvironment(RIVMletterreport2015–0116.).
Volkheimer G (1975). Hematogenous dissemination of ingested polyvinyl chloride particles.AnnalsoftheNewYorkAcademyofSciences,246:164–71.doi:10.1111/j.1749-6632.1975.tb51092.x.
Walczak AP, et al. (2015a). Bioavailability and biodistribution of differently charges polystyrene nanoparticles upon oral exposure in rats. Journal of Nanoparticle Research, 17(5):231. doi: 10.1007/s11051-015-3029-y.
Walczak AP, et al. (2015b). Translocation of differently sized and charged polystyrene nanoparticles in in vitro intestinal cell models of increasing complexity. Nanotoxicology, 9:453–61. doi: 10.3109/17435390.2014.944599.
Wang W, et al. (2017). Microplastics pollution in inland freshwaters of China: a case studyinurbansurfacewatersofWuhan,China.ScienceoftheTotalEnvironment,575:1369–74. doi: 10.1016/j.scitotenv.2016.09.213.
Wang F, et al. (2018). Interaction of toxic chemicals with microplastics: a critical review. Water Research, 139:208–19. doi: 10.1016/j.watres.2018.04.003.
WE&RF(2017).Whitepaper–microplasticsinaquaticsystems:anassessmentofrisk.Summaryofcriticalissuesandrecommendedpathforward.TheWaterEnvironment& Reuse Foundation.
Welle F and Franz R (2018). Microplastic in bottled natural mineral water – literature review and considerations on exposure and risk assessment. Food Additives & Contaminants (Part A, 35(12):2482–92). doi: 10.1080/19440049.2018.1543957.
WHO (2003a). 1,4-Dichlorobenzene in drinking-water. Background document for development of WHO Guidelines for drinking-water quality. Geneva: World Health Organization(WHO/SDE/WSH/03.04/28;http://www.who.int/water_sanitation_health/dwq/chemicals/dichlorobenzenes.pdf, accessed 30 April 2019).
WHO (2003b). Di(2-ethylhexyl)phthalate in drinking-water. Background document for development of WHO Guidelines for drinking-water quality. Geneva: World Health

86 Microplastics in drinking-water
Organization(WHO/SDE/WSH/03.04/29;https://www.who.int/water_sanitation_health/dwq/chemicals/di2ethylhexyphthalate.pdf, accessed 30 April 2019).
WHO (2003c). Polynuclear aromatic hydrocarbons in drinking-water. Background document for development of WHO Guidelines for drinking-water quality. Geneva: WorldHealthOrganization(WHO/SDE/WSH/03.04/59;http://www.who.int/water_sanitation_health/dwq/chemicals/polyaromahydrocarbons.pdf, accessed 30 April 2019).
WHO (2003d). Styrene in drinking-water. Background document for development of WHO Guidelines for drinking-water quality. Geneva: World Health Organization (WHO/SDE/WSH/03.04/27; http://www.who.int/water_sanitation_health/dwq/chemicals/styrene.pdf, accessed 30 April 2019).
WHO (2004a). Chlordane in drinking-water. Background document for development of WHO Guidelines for drinking-water quality. Geneva: World Health Organization (WHO/SDE/WSH/03.04/84; https://www.who.int/water_sanitation_health/dwq/chemicals/chlordane.pdf, accessed 30 April 2019).
WHO (2004b). DDT and its derivatives in drinking-water. Background document for development of WHO Guidelines for drinking-water quality. Geneva: World Health Organization(WHO/SDE/WSH/03.04/89;https://www.who.int/water_sanitation_health/water-quality/guidelines/chemicals/ddt.pdf, accessed 30 April 2019).
WHO (2004c). Epichlorohydrin in drinking-water. Background document fordevelopment of WHO Guidelines for drinking-water quality. Geneva: World Health Organization(WHO/SDE/WSH/03.04/94;http://www.who.int/water_sanitation_health/dwq/chemicals/epichlorohydrin.pdf, accessed 30 April 2019).
WHO (2004d). Hexachlorobenzene in drinking-water. Background document for development of WHO Guidelines for drinking-water quality. Geneva: World Health Organization(WHO/SDE/WSH/03.04/100;https://www.who.int/water_sanitation_health/dwq/chemicals/hexachlorobenzene.pdf, accessed 30 April 2019).
WHO (2004e). Vinyl chloride in drinking-water. Background document for development of WHO Guidelines for drinking-water quality. Geneva: World Health Organization (WHO/SDE/WSH/03.04/119; http://www.who.int/water_sanitation_health/dwq/chemicals/vinylchloride.pdf, accessed 30 April 2019).
WHO (2005). Formaldehyde in drinking-water. Background document for development of WHO Guidelines for drinking-water quality. Geneva: World Health Organization (WHO/SDE/WSH/05.08/48; http://www.who.int/water_sanitation_health/dwq/chemicals/formaldehyde130605.pdf, accessed 30 April 2019).
WHO (2011a). Acrylamide in drinking-water. Background document for development of WHO Guidelines for drinking-water quality. Geneva: World Health Organization

References 87
(WHO/SDE/WSH/03.04/71/Rev/1;http://www.who.int/water_sanitation_health/dwq/chemicals/acrylamide.pdf, accessed 30 April 2019).
WHO (2011b). Cadmium in drinking-water. Background document for development of WHO Guidelines for drinking-water quality. Geneva: World Health Organization (WHO/SDE/WSH/03.04/80/Rev/1;https://www.who.int/water_sanitation_health/dwq/chemicals/cadmium.pdf, accessed 30 April 2019).
WHO (2014). Water safety in distribution systems. Geneva: World Health Organization (https://apps.who.int/iris/bitstream/handle/10665/204422/9789241548892_eng.pdf, accessed 30 April 2019).
WHO (2016). Lead in drinking-water. Background document for development of WHO Guidelines for drinking-water quality. Geneva: World Health Organization (WHO/FWC/WSH/16.53; https://www.who.int/water_sanitation_health/water-quality/guidelines/chemicals/lead-background-feb17.pdf, accessed 30 April 2019).
WHO (2017a). Guidelines for drinking-water quality, fourth edition incorporating the firstaddendum.Geneva:WorldHealthOrganization(https://apps.who.int/iris/bitstream/handle/10665/254637/9789241549950-eng.pdf?sequence=1, accessed 30 April 2019).
WHO (2017b). Water quality and health – review of turbidity: information for regulators and water suppliers. Geneva: World Health Organization, WHO/FWC/WSH/17.01. (https://apps.who.int/iris/bitstream/handle/10665/254631/WHO-FWC-WSH-17.01-eng.pdf, accessed 18 June 2019).
WrightSLandKellyFJ(2017).Plasticandhumanhealth:amicroissue?EnvironmentalScience & Technology, 51: 6634–47. doi: 10.1021/acs.est.7b00423.
Zbyszewski M and Corcoran PL (2011). Distribution and degradation of fresh water plastic particles along the beaches of Lake Huron: Canada. Water, Air, & Soil Pollution, 220:365. doi: 10.1007/s11270-011-0760-6.
Zettler ER,Mincer TJ andAmaral-Zettler LA (2013). Life in the “plastisphere”:microbialcommunitiesonplasticmarinedebris.EnvironmentalScience&Technology,47:7137–46. doi: 10.1021/es401288x.
Ziajahromi S, et al. (2017). Wastewater treatment plants as a pathway for microplastics: development of a new approach to sample wastewater-based microplastics. Water Research, 112:93–9. doi: 10.1016/j.watres.2017.01.042.
Zhang H, et al. (2018). Occurrences of organophosphorus esters and phthalates in the microplastics from the coastal beaches in north China. Science of the Total Environment,616-617:1505–12.doi:10.1016/j.scitotenv.2017.10.163.

88 Microplastics in drinking-water
Annex 1: Systematic review and other studies of microplastics in fresh water and drinking-water
This section summarizes a systematic review commissioned by WHO titled, Microplastics in freshwaters and drinking-water: Critical review and assessment of data quality (Koelmans et al., 2019). It also includes a summary of the studies on microplastics in drinking-water.
A.1 Overview of systematic review
As part of the systematic review, Koelmans et al. proposed several best practices for sampling, extracting and detecting microplastics and divided these best practices into nine quality criteria. The authors then assessed available studies on the occurrence of microplastics in drinking-water, surface water, groundwater and wastewater against these nine quality criteria to determine the overall reliability of the studies. They also summarized data on microplastic concentrations, polymer types and particle shapes. A summary of the data on concentrations, polymer types and particle shapes is included in sections 2.5–2.7.
A.2 Systematic review methods
A.2.1 Literature search approach
The authors reviewed 50 studies reporting microplastic concentrations in drinking-water, freshwater sources and wastewater. Because some studies reported data on microplastics in more than one water type, 56 records were reviewed (2 tap water, 3 bottled water, 2 water exiting a DWTP, 1 groundwater, 30 surface water, and 18 wastewater). Most papers were retrieved from the Scopus database using the search strings ‘microplastic AND (bottle OR surface OR tap OR wastewater OR groundwater)’. Three studieswereidentifiedfromthegreyliterature(i.e.notpeer-reviewed)viaGooglesearches, using the same or similar key-word combinations as used for the Scopus database. The systematic search was performed until August 2018. Only those studies that reported original concentration data were reviewed.

Annex 89
A.2.2 Study characteristics
For each study the following characteristics were summarized in tabular form (see Table S1 in Koelmans et al., 2019):
• Reference, country (area)• Source (water type)• Treatment (for wastewater and drinking-water treatment) • Sampling date; size and shape (of microplastics detected)• Polymer types (of microplastics detected)• Chemicals (analysed in water or polymer)• Value (of microplastics detected in water sample)• Quality assurance applied (detection limit, blanks)• Sampling method• Analysis method• Comments
A.2.3 Quantitative quality assessment
The reliability of data in these studies was assessed against nine “crucial” criteria, which are detailed below. These criteria are an adaptation of the methods developed for microplastic biota samples by Hermsen et al. (2018), which has been recognized intherecentreportfromTheJointGroupofExpertsontheScientificAspectsofMarineEnvironmentalProtection(GESAMP)(2019).
For each criterion a value of 2 (reliable), 1 (reliable to limited extent) or 0 (unreliable) was assigned. A TAS was calculated by adding scores for individual criteria for a maximum of 18 points (See Table A.1 below). Assuming all individual criterion are genuinelycrucial,anoverallqualityscorecanbedefinedbymultiplyingtheindividualscores, followed by a 2Log X transformation to obtain a linear scale for a maximum score of nine. Such an approach implies that if even one of the crucial criteria is not met, the overall quality score will be zero and the data reported in the study are not considered fully reliable.
Quality criteria
1. Sampling methods. This criterion assessed whether sampling was described in sufficientdetail,including,forinstance,date,location,andmaterialsused.Specificsub-criteriaweredefinedforwastewater,groundwater,surfacewater,tapwaterand bottled water.

90 Microplastics in drinking-water
2. Sample size. To render a sample representative of the type of water studied, a minimumsamplesizewasdefined,orforbottledwater,aminimumnumberofbottlestobeanalysed.Thesamplesizeneedstobesufficientlylargetoreliablydetect at least one microplastic particle with statistical rigor.
3. Sample processing and storage. When transferring a primary sample (e.g. material in a net) to a sampling bottle or preserving or storing samples before reachingthelaboratory,certaincriterianeedtobemet,suchasconfirmationthatfixativesdonotaffecttheparticles.Tominimizecontamination,plasticmaterialsshould not be used to sample or store samples.
4. Laboratory preparation. Prior to analysing a sample, certain measures need to be taken in the laboratory, including wearing cotton laboratory coats, and pre-rinsing and cleaning materials to minimize airborne contamination.
5. Clean air conditions. Clean air conditions are also needed to minimize contaminationwithairbornemicroplasticparticlesorfibres.Samplesshouldbehandledinalaminar-flowcabinetorclean-airlaboratory.
6. Negative controls.Toconfirmandcorrectforcontaminationortodemonstrateabsence of contamination, replicated procedural blanks should be analysed. Blanks should be reported with particle counts, including standard deviations, and actual sample results should be corrected for the blank values and indicated as such.
7. Positive controls.Toconfirmasufficientlyhighrecoveryofparticlesduringfiltration,digestiontransferandanalysis,representativeandreplicatedpositivecontrols should be performed.
8. Sample treatment. To ensure the quality of visual inspection and subsequent sample analysis, a sample digestion step should be performed for surface water and wastewater samples. Tap water and bottled water do not require a digestion step and thus were automatically assigned 2 points.
9. Polymer identification. To ensure reliable assessment of plastic particles, the identityofthepolymerneedstobeconfirmedbyusingFTIRorRamanspectroscopy,pyrolysis-GC/MS or thermogravimetric analyser-GC/MS techniques. Where subsampling is required, best practices for subsampling and subsequent polymer identificationwilldependonthemicroplasticsizeclassesandtechnologiesapplied.
A detailed description of scoring criteria is provided in Koelmans et al., 2019.
Annex 91
A.3 Overview of systematic review results
Studies differed widely in sampling and analytical methods. Few studies reported a detection limit. Generally, surface water samples employed plankton nets or trawls to collect high-volume samples. Other sampling methods (also used on other water types), included pump and spot sampling. As for analytical methods, most studies sorted the samples through sieving or density-separation and treated the samples chemically to remove organic material that otherwise may interfere with the microplastic identificationprocess.Chemicaltreatmentsdifferedwidelybuthydrogenperoxide,which has been demonstrated to have minimal impacts on the microplastic weights, count and shapes within an exposure of 48 hours, was often used. Several studies, however, treated the samples at higher temperatures, which may impact the polymer. PolymeridentificationmostlyusedFTIRmethodologies.
Qualityassuranceremainedlimited,oftenlackingpositivecontrols,sufficientblankcontrols or measures to reduce airborne contamination of samples. The average scores per criterion across 52 studies were lower than 1 for the criteria sample treatment (0.93), polymer identification (0.89), laboratory preparation (0.77), clean air conditions (0.64), and positive controls (0.21). Key areas to improve sampling and analytical methods are included in Box 2.2.
Average TAS were 13.7 for bottled water, 12.5 for water exiting a DWTP, 11.5 for tap water, 7.9 for surface water and 7.3 for wastewater studies. This ranking likely reflectstherelativeeaseofanalysingthedifferentwatertypes,althoughtherewereonly three studies assessed for bottled water, two for tap water and two for water exiting a DWTP. The overall quality scores were zero, except for four studies: Wang et al. (2018, surface water) received a quality score of 6; Mason et al. (2018, bottled water) scored a 5; Ziajahromi et al. (2017, wastewater) scored 3; and Hendrickson, Minor and Schreiner (2018, wastewater) scored a 2. This means that 46 studies were considered not fully reliable on at least one crucial criteria. However, improvements in quality assurance in assessment and analysis methods may be occurring already, since the four studies that received positive scores in all criteria were published more recently, in 2017 and 2018. See Table A.1 for an overview of individual and total scores from studies reporting microplastics in drinking-water, fresh water and wastewater.
The fact that data or a study may not be fully reliable according to these criteria does not imply that the data are not useful. For instance, data may provide insights collectively on the extent of contamination in the environment and the most important polymer types and shapes, even if the sampling method is not described in a reproducible way. A study may provide data with some systematic error due to sample contamination, which may still be useful for comparisons within that study.

92 Microplastics in drinking-water
Table A.1 Overview of individual and accumulated scores from studies reporting microplastic concentrations in drinking-water, fresh water and wastewater
Author Water type Sampling methods
Sample size Sample processing and storage
Laboratory preparation
Clean air conditions
Negative controls
Positive controls
Sample treatment
Polymer ID Quality score (TAS)a
Author
Mason et al. (2018) Bottle 1 2 2 1 2 2 1 2 1 14 Mason et al. (2018)
Schymanski et al. (2018) Bottle 1 1 2 2 2 2 0 2 2 14 Schymanski et al. (2018)
Oβmann et al. (2018) Bottle 1 1 2 2 2 2 0 2 1 13 Oβmann et al. (2018)
Mintenig et al., 2019 Tap 2 2 2 2 1 2 0 2 2 15 Mintenig et al., 2019
Strand et al., (2018) Tap 2 0 2 1 1 2 2 2 2 14 Strand et al., (2018)
Uhl et al. (2018) Tap 1 0 1 2 1 2 0 2 0 9 Uhl et al. (2018)
Kosuth et al. (2018) Tap 0 0 0 2 2 2 0 2 0 8 Kosuth et al. (2018)
Mintenig et al. 2019 DWTP 2 1 2 2 1 2 0 2 2 14 Mintenig et al. 2019
Pivokonsky et al. (2018) DWTP 1 1 2 1 1 2 0 1 2 11 Pivokonsky et al. (2018)
Mintenig et al. (2019) Ground 2 1 2 2 1 2 0 2 2 14 Mintenig et al. (2019)
Wang et al. (2018) Surface 2 1 1 2 2 2 2 2 1 15 Wang et al. (2018)
Hendrickson et al. (2018) Surface 2 1 2 1 1 1 1 1 1 11 Hendrickson et al. (2018)
Di and Wang (2018) Surface 2 0 2 2 0 0 1 2 1 10 Di and Wang (2018)
Mani et al. (2015) Surface 2 2 1 1 1 1 0 1 1 10 Mani et al. (2015)
Wang et al. (2017) Surface 1 0 1 2 1 2 0 2 1 10 Wang et al. (2017)
Baldwin et al. (2016) Surface 2 1 1 1 1 2 0 1 0 9 Baldwin et al. (2016)
Cable et al. (2017) Surface 2 1 1 1 1 1 0 1 1 9 Cable et al. (2017)
Dris et al. (2018a) Surface 2 2 0 1 1 1 0 1 1 9 Dris et al. (2018a)
Lares et al. (2018) Surface 1 0 1 2 1 2 0 1 1 9 Lares et al. (2018)
Rodrigues et al. (2018) Surface 2 2 1 1 0 1 0 1 1 9 Rodrigues et al. (2018)
Su et al. (2016) Surface 2 1 1 1 1 1 0 1 1 9 Su et al. (2016)
Zhang et al. (2017) Surface 2 1 1 1 2 0 0 0 2 9 Zhang et al. (2017)
Dris et al. (2015) Surface 2 1 2 1 1 1 0 0 0 8 Dris et al. (2015)
Estahbanati and Fahrenfeld (2016) Surface 2 2 1 0 0 1 1 1 0 8 Estahbanati and Fahrenfeld (2016)
Hoellein et al. (2017) Surface 2 1 2 0 0 1 0 1 1 8 Hoellein et al. (2017)
Mason et al. (2016b) Surface 2 1 1 0 0 2 0 1 1 8 Mason et al. (2016b)
Sighicelli et al. (2018) Surface 2 2 1 0 0 0 0 2 1 8 Sighicelli et al. (2018)
Vermaire et al. (2017) Surface 2 1 2 0 0 2 0 1 0 8 Vermaire et al. (2017)
Xiong et al. (2018) Surface 2 1 0 1 1 1 0 1 1 8 Xiong et al. (2018)
Anderson et al. (2017) Surface 2 1 1 0 0 1 0 1 1 7 Anderson et al. (2017)
Faure et al. (2015) Surface 1 2 1 1 0 0 0 1 1 7 Faure et al. (2015)

Annex 93
Author Water type Sampling methods
Sample size Sample processing and storage
Laboratory preparation
Clean air conditions
Negative controls
Positive controls
Sample treatment
Polymer ID Quality score (TAS)a
Author
Mason et al. (2018) Bottle 1 2 2 1 2 2 1 2 1 14 Mason et al. (2018)
Schymanski et al. (2018) Bottle 1 1 2 2 2 2 0 2 2 14 Schymanski et al. (2018)
Oβmann et al. (2018) Bottle 1 1 2 2 2 2 0 2 1 13 Oβmann et al. (2018)
Mintenig et al., 2019 Tap 2 2 2 2 1 2 0 2 2 15 Mintenig et al., 2019
Strand et al., (2018) Tap 2 0 2 1 1 2 2 2 2 14 Strand et al., (2018)
Uhl et al. (2018) Tap 1 0 1 2 1 2 0 2 0 9 Uhl et al. (2018)
Kosuth et al. (2018) Tap 0 0 0 2 2 2 0 2 0 8 Kosuth et al. (2018)
Mintenig et al. 2019 DWTP 2 1 2 2 1 2 0 2 2 14 Mintenig et al. 2019
Pivokonsky et al. (2018) DWTP 1 1 2 1 1 2 0 1 2 11 Pivokonsky et al. (2018)
Mintenig et al. (2019) Ground 2 1 2 2 1 2 0 2 2 14 Mintenig et al. (2019)
Wang et al. (2018) Surface 2 1 1 2 2 2 2 2 1 15 Wang et al. (2018)
Hendrickson et al. (2018) Surface 2 1 2 1 1 1 1 1 1 11 Hendrickson et al. (2018)
Di and Wang (2018) Surface 2 0 2 2 0 0 1 2 1 10 Di and Wang (2018)
Mani et al. (2015) Surface 2 2 1 1 1 1 0 1 1 10 Mani et al. (2015)
Wang et al. (2017) Surface 1 0 1 2 1 2 0 2 1 10 Wang et al. (2017)
Baldwin et al. (2016) Surface 2 1 1 1 1 2 0 1 0 9 Baldwin et al. (2016)
Cable et al. (2017) Surface 2 1 1 1 1 1 0 1 1 9 Cable et al. (2017)
Dris et al. (2018a) Surface 2 2 0 1 1 1 0 1 1 9 Dris et al. (2018a)
Lares et al. (2018) Surface 1 0 1 2 1 2 0 1 1 9 Lares et al. (2018)
Rodrigues et al. (2018) Surface 2 2 1 1 0 1 0 1 1 9 Rodrigues et al. (2018)
Su et al. (2016) Surface 2 1 1 1 1 1 0 1 1 9 Su et al. (2016)
Zhang et al. (2017) Surface 2 1 1 1 2 0 0 0 2 9 Zhang et al. (2017)
Dris et al. (2015) Surface 2 1 2 1 1 1 0 0 0 8 Dris et al. (2015)
Estahbanati and Fahrenfeld (2016) Surface 2 2 1 0 0 1 1 1 0 8 Estahbanati and Fahrenfeld (2016)
Hoellein et al. (2017) Surface 2 1 2 0 0 1 0 1 1 8 Hoellein et al. (2017)
Mason et al. (2016b) Surface 2 1 1 0 0 2 0 1 1 8 Mason et al. (2016b)
Sighicelli et al. (2018) Surface 2 2 1 0 0 0 0 2 1 8 Sighicelli et al. (2018)
Vermaire et al. (2017) Surface 2 1 2 0 0 2 0 1 0 8 Vermaire et al. (2017)
Xiong et al. (2018) Surface 2 1 0 1 1 1 0 1 1 8 Xiong et al. (2018)
Anderson et al. (2017) Surface 2 1 1 0 0 1 0 1 1 7 Anderson et al. (2017)
Faure et al. (2015) Surface 1 2 1 1 0 0 0 1 1 7 Faure et al. (2015)

94 Microplastics in drinking-water
Table A.1 Overview of individual and accumulated scores from studies reporting microplastic concentrations in drinking-water, fresh water and wastewater (continued)
Author Water type Sampling methods
Sample size Sample processing and storage
Laboratory preparation
Clean air conditions
Negative controls
Positive controls
Sample treatment
Polymer ID Quality score (TAS)a
Author
McCormick et al. (2016) Surface 1 1 1 0 0 2 0 1 1 7 McCormick et al. (2016)
Miller et al. (2017) Surface 1 0 1 1 1 2 0 0 1 7 Miller et al. (2017)
McCormick et al. (2014) Surface 1 1 1 0 0 2 0 1 0 6 McCormick et al. (2014)
Fischer et al. (2016) Surface 2 1 1 0 0 0 0 1 0 5 Fischer et al. (2016)
Free et al. (2014) Surface 2 1 1 0 0 0 0 1 0 5 Free et al. (2014)
Lahens et al. (2018) Surface 1 1 1 0 0 0 0 1 1 5 Lahens et al. (2018)
Leslie et al. (2017) Surface 1 0 2 0 1 1 0 0 0 5 Leslie et al. (2017)
Eriksen et al. (2013) Surface 2 1 1 0 0 0 0 0 0 4 Eriksen et al. (2013)
Zhang et al. (2015) Surface 2 1 0 0 0 0 0 0 1 4 Zhang et al. (2015)
Mintenig et al. (2017) WWTP 2 2 2 1 1 2 0 1 2 13 Mintenig et al. (2017)
Ziajahromi et al. (2017) WWTP 2 2 1 1 1 1 1 1 2 12 Ziajahromi et al. (2017)
Simon et al. (2018) WWTP 1 1 0 1 1 2 2 2 1 11 Simon et al. (2018)
Lares et al. (2018) WWTP 2 0 1 2 1 2 0 1 1 10 Lares et al. (2018)
Talvitie et al. (2017a) WWTP 2 1 1 1 1 2 0 0 2 10 Talvitie et al. (2017a)
Murphy et al. (2016) WWTP 1 1 2 2 1 1 0 0 1 9 Murphy et al. (2016)
Mason et al. (2016a) WWTP 2 2 1 0 0 2 0 1 0 8 Mason et al. (2016a)
Vollertsen and Hansen (2017) WWTP 0 2 1 0 0 0 2 1 1 7 Vollertsen and Hansen (2017)
Carr et al. (2016) WWTP 2 2 1 0 0 0 0 0 1 6 Carr et al. (2016)
Magnusson and Norén (2014) WWTP 2 2 1 0 0 0 0 0 1 6 Magnusson and Norén (2014)
Michielssen et al. (2016) WWTP 2 1 2 0 0 1 0 0 0 6 Michielssen et al. (2016)
Talvitie et al. (2017b) WWTP 2 0 1 0 0 2 0 0 1 6 Talvitie et al. (2017b)
Vermaire et al. (2017) WWTP 1 0 2 0 0 2 0 1 0 6 Vermaire et al. (2017)
Dyachenko et al. (2017) WWTP 1 0 1 0 0 0 1 1 1 5 Dyachenko et al. (2017)
Leslie et al. (2017) WWTP 1 0 2 0 1 1 0 0 0 5 Leslie et al. (2017)
Dris et al. (2015) WWTP 1 0 0 1 1 1 0 0 0 4 Dris et al. (2015)
Talvitie et al. (2015) WWTP 2 1 0 0 0 1 0 0 0 4 Talvitie et al. (2015)
Browne et al. (2011) WWTP 0 0 1 0 0 0 0 0 2 3 Browne et al. (2011)
a TAS = total accumulated score. The maximum score is 18 and is calculated by adding scores for nine quality criteria; for each criterion, a score of 0, 1 or 2 is assigned. TAS values are underlined when all underlying scores are non-zero.
Source: Koelmans et al. (2019) with the addition of quality scores for Strand et al. (2018) and Uhl et al. (2018).

Annex 95
Author Water type Sampling methods
Sample size Sample processing and storage
Laboratory preparation
Clean air conditions
Negative controls
Positive controls
Sample treatment
Polymer ID Quality score (TAS)a
Author
McCormick et al. (2016) Surface 1 1 1 0 0 2 0 1 1 7 McCormick et al. (2016)
Miller et al. (2017) Surface 1 0 1 1 1 2 0 0 1 7 Miller et al. (2017)
McCormick et al. (2014) Surface 1 1 1 0 0 2 0 1 0 6 McCormick et al. (2014)
Fischer et al. (2016) Surface 2 1 1 0 0 0 0 1 0 5 Fischer et al. (2016)
Free et al. (2014) Surface 2 1 1 0 0 0 0 1 0 5 Free et al. (2014)
Lahens et al. (2018) Surface 1 1 1 0 0 0 0 1 1 5 Lahens et al. (2018)
Leslie et al. (2017) Surface 1 0 2 0 1 1 0 0 0 5 Leslie et al. (2017)
Eriksen et al. (2013) Surface 2 1 1 0 0 0 0 0 0 4 Eriksen et al. (2013)
Zhang et al. (2015) Surface 2 1 0 0 0 0 0 0 1 4 Zhang et al. (2015)
Mintenig et al. (2017) WWTP 2 2 2 1 1 2 0 1 2 13 Mintenig et al. (2017)
Ziajahromi et al. (2017) WWTP 2 2 1 1 1 1 1 1 2 12 Ziajahromi et al. (2017)
Simon et al. (2018) WWTP 1 1 0 1 1 2 2 2 1 11 Simon et al. (2018)
Lares et al. (2018) WWTP 2 0 1 2 1 2 0 1 1 10 Lares et al. (2018)
Talvitie et al. (2017a) WWTP 2 1 1 1 1 2 0 0 2 10 Talvitie et al. (2017a)
Murphy et al. (2016) WWTP 1 1 2 2 1 1 0 0 1 9 Murphy et al. (2016)
Mason et al. (2016a) WWTP 2 2 1 0 0 2 0 1 0 8 Mason et al. (2016a)
Vollertsen and Hansen (2017) WWTP 0 2 1 0 0 0 2 1 1 7 Vollertsen and Hansen (2017)
Carr et al. (2016) WWTP 2 2 1 0 0 0 0 0 1 6 Carr et al. (2016)
Magnusson and Norén (2014) WWTP 2 2 1 0 0 0 0 0 1 6 Magnusson and Norén (2014)
Michielssen et al. (2016) WWTP 2 1 2 0 0 1 0 0 0 6 Michielssen et al. (2016)
Talvitie et al. (2017b) WWTP 2 0 1 0 0 2 0 0 1 6 Talvitie et al. (2017b)
Vermaire et al. (2017) WWTP 1 0 2 0 0 2 0 1 0 6 Vermaire et al. (2017)
Dyachenko et al. (2017) WWTP 1 0 1 0 0 0 1 1 1 5 Dyachenko et al. (2017)
Leslie et al. (2017) WWTP 1 0 2 0 1 1 0 0 0 5 Leslie et al. (2017)
Dris et al. (2015) WWTP 1 0 0 1 1 1 0 0 0 4 Dris et al. (2015)
Talvitie et al. (2015) WWTP 2 1 0 0 0 1 0 0 0 4 Talvitie et al. (2015)
Browne et al. (2011) WWTP 0 0 1 0 0 0 0 0 2 3 Browne et al. (2011)
a TAS = total accumulated score. The maximum score is 18 and is calculated by adding scores for nine quality criteria; for each criterion, a score of 0, 1 or 2 is assigned. TAS values are underlined when all underlying scores are non-zero.
Source: Koelmans et al. (2019) with the addition of quality scores for Strand et al. (2018) and Uhl et al. (2018).
96 Microplastics in drinking-water
A.4 Summary of drinking-water studies
Since there are a limited number of drinking-water studies, with even less considered reliable, each of the drinking-water studies is described in more detail below. They are described in order of decreasing study quality, as determined by the TAS quantitative assessment, primarily from Koelmans et al. (2019). One additional unscored study identifiedfromthegreyliteraturehadinsufficientdetailtoassessfullythestudyqualitybut a short description is included in this section for completeness.
1. Mintenig et al. (2019) analysed groundwater and drinking-water derived from the groundwater for the presence of microplastics. Samples were taken at different locations within the drinking-water supply chain. Large volume samples were filteredthrougha3µmmeshfilterandparticlesover20µmwerecharacterisedusing FTIR imaging. Four 150 L volume blank samples were found to contain both fibresandparticles(0.67particles/L,0.3fibres/L).Fibrenumbersinblanksamplesexceedthoseinrawandtreatedwatersindicatingthefibreswerenotpresentinthe water but were introduced during sample processing. Particles in blanks were mainlybluePPandSANandwereattributedtocontaminationfromthefilterunitand were excluded from the analysis. Concentrations reported ranged from 0 to 0.007 particles/L in both raw water and drinking-water with an overall mean of 0.0007particles/L.TheseparticleswereidentifiedasPE,PA,PEST,PVCorepoxyresin and were between 50 and 150 µm in size. The authors suggested the abrasion of plastic equipment used during water treatment or transport was a likely source of the plastic particles detected in the water samples.
2. Mason, Welch and Neratko (2018) tested 259 individual bottles from 27 different lots across 11 brands of bottled water purchased from 19 locations in 9 countries. Sampleswere stainedwithNileRed (afluorescentdyeused to stainparticles)andfilteredthrough1.5µmporefilter.Largeparticles>100µmwereremovedandabouthalfwereanalysedbyFTIR.Theremainingsmallerfluorescingparticleswere counted using a software system. Blank samples were subject to the same procedures and were found to contain on average 4.15 particles/L (>100 µm) and 23.5 particles/L (between 6.5–100 µm). Nearly all (93%) of the bottles showed some evidence of microplastic contamination. After correcting for blanks, the average count of particles >100 µm was 10.4 particles/L of bottled water, ranging from 0 to 66particles/L.Fragmentswerethemostcommonshape(66%)followedbyfibres(13%)andfilms(12%).PP,themostcommonplasticusedforbottlecaps,wasthemost common polymer (54%) and 4% of particles showed presence of industrial lubricants. The authors suggested that the contamination was at least partially coming from the packaging and/or the bottling process itself. Smaller particles in

Annex 97
therange6.5–100µmwereidentifiedbyNileRedtaggingwithoutspectroscopicconfirmation,andtheaveragecountreportedwas315particles/Lofbottledwater(range of 0 to over 10 000 particles/L). All the tagged larger particles analysed by FTIR showed some evidence of polymeric content, increasing the authors’ confidenceinthetaggingmethodinthisstudy.Basedonthisandotherstudiesthathad detected small microplastics in bottled water, the authors expected that the smaller particles were plastic or of some other anthropogenic origin, although no confirmatoryspectroscopicanalysiswasconducted.
3. Strand et al. (2018) examined drinking-water from 17 sites around Denmark. All drinking-water in Denmark is derived from groundwater with the exception of one smallislandnotincludedinthestudy(AndreasHerfelt,DanishMinistryofEnvironmentand Food, personal communication, November 2018). A 50 L sample from each sitewasfilteredthrougha10µmstainless-steelfilter.Thefilterswereexaminedby microscopy for microplastic-like particles with sizes >100 µm. The predominant typeofmicroplastic-likeparticlesobservedwerefibres(82%).Onaverage0.312particles/L and a maximum of 0.6 particles/L >100 µm were observed. Five blank 50 L samples were analysed and found to contain on average 13.2 microplastic-like particles (0.26 particles/L). Results were used to generate a limit of detection of 0.58 particles/L. In 16 of the 17 drinking-water samples, the numbers were below thelimitofdetection.Ofthetotalparticlesidentified,124(44%)microplastic-likeparticles were further characterised by FTIR. Of the microplastic-like particles, 3%wereverifiedasmicroplastic,whereasthemajorityconsistedofcellulose-likematerial (76%), with the remainder having poor spectra (10%), unknown (7%) or protein-like material (4%). The types of microplastic particles detected in the tap watersampleswerePET,PPandPS.Somefurtheranalysisofparticlesintherangeof 10 to 100 µm also found low levels of microplastic.
4. Schymanski et al. (2018) used micro-Raman spectroscopy to identify microplastics in bottled water where particle sizes are in the low micrometre range. The authors tested the microplastic content of water from 22 different returnable and single-use plastic bottles, 3 beverage cartons and 9 glass bottles purchased in Germany. Sampleswerefilteredthrougha3µmporesizefilter.Larger(50–500µm)andverysmall (1–50 µm) microplastic fragments were found in every type of water sample. Most (80%) of the microplastic particles found were between 5 and 20 µm in size. The average microplastic content reported was 118 ± 88 particles/L (range 28–241 particles/L ) in returnable bottles, 14 ± 14 particles/L (range 2–44 particles/L) in single-use plastic bottles, 11 ± 8 particles/L (range 5–20 particles/L) in beverage cartons and surprisingly 50 ± 52 particles/L (range 4–156 particles/L) in glass bottles. Onlythereturnablebottlesshowedastatisticallysignificantdifferencefromtheblank

98 Microplastics in drinking-water
value (14 ± 13 particles/L). Most of the particles in water from returnable plastic bottleswereidentifiedasPET(84%)andPP(7%)consistentwiththematerialusedtomanufacturebottles(PET)andthecaps(PP).InotherbottletypesmicroplasticparticlesotherthanPETwerefound, forexamplePEorotherpolyolefins.Theauthors noted that beverage cartons are coated with polyethylene foils and caps aretreatedwithlubricantsandthatthefindingsindicatethatthepackagingitselfmay release microparticles.
5. Oßmann et al. (2018) analysed 32 samples of bottled mineral water purchased in Germany for concentrations of microplastics particles. Using 0.4 µm membrane filtersandmicro-Ramanspectroscopyonfive1mm2areasof thefilter,particlesas small as 1 µm were analysed. Microplastics were found in water samples from all bottle types. The average count of microplastics reported in mineral water was 2649particles/Linsingle-usePETbottles,4889particles/LinreusablePETbottleandbetween 3074 particles/L (excluding an outlier) and 6292 particles/L (all samples) in glass bottles. On average 384 microplastic particles/L (range 0–1175) were found inblanksamples,consistingmainlyofPP,someofPS,PEandPET.Whilstinplasticbottles,thepredominantpolymertypewasPET,inglassbottlesvariouspolymerssuchasPEorstyrene-butadiene-copolymerwerefound.Theauthorsconcludedthatin addition to the packaging itself, other contamination sources have to be considered. Over 95% of the detected microplastics particles found in plastic bottles were smaller than 5 µm and over 75% of those found in glass bottles were smaller than 5 µm.
6. Pivokonsky et al. (2018) investigated microplastic concentrations in fresh water and drinking-water. Researchers studied three DWTPs in the Czech Republic and analysed raw and treated water for microplastics. All waters were derived from surface sources.Analysisinvolvedperoxideoxidation,sequentialfilteringthrough5and0.2µmfilters;sectionsofthefilterswereanalysedbyelectronmicroscopytoquantifyparticlenumbers,shapesandsizes.Numberswerecorrectedbasedonthefindingofthe spectroscopic analysis. Particle characterisation was by FTIR on particles above 10 µm and Raman spectroscopy on particles above 1 µm. Microplastics were found in all water samples in the range 1473 to 3605 particles/L in raw water and 338 to 628 particles/L in treated drinking-water. Background contamination, determined by analysingblankfilters,waslessthan5%oftheabundanceofmicroplasticsdetectedand was considered negligible. Typical removal across drinking-water treatment was reported as 70–80%. Microplastics smaller than 10 µm were the most plentiful in both raw and treated water samples, accounting for up to 95% of the particles found. Fragments clearly prevailed at two of the DWTPs in both the raw and treated watersandfibrestogetherwithfragmentspredominatedattheremainingDWTP.Despite12differentmaterialsformingthemicroplasticsidentified,themajorityofthemicroplastics(70%)werecomprisedofPET,PPandPE.

Annex 99
7.Uhl,Eftekhardadkhah,andSvendsen(2018)studiedrawwater,treatedwateranddrinking-water from the distribution system at 24 water works in Norway. Of those, 20 used surface water and 4 used groundwater. All samples were taken as triplicates of 1 L volume, sampling was done by professional personnel, and special attention wasgiventoavoidcontaminationduringsamplingandanalysis.Sampleswerefilteredthroughcommercialglassfibrefilterpapers.Analysiswasdonemicroscopicallyandinaddition to the 216 bottles, 72 blanks were analysed. In the blanks, 0.5 microplastic particles/L were found on average, showing some contamination from processing samples in the laboratory. A statistical analysis of the results from the triplicates yielded a LoD of 0.9 microplastic particles/L and a LoQ of 4.1 microplastic particles/L, bothwitha67%confidencelevel.Nodifferencesbetweengroundwaterandsurfacewater were found. At 20 of 24 sites, the concentration in raw water was below the LoQ. Four of the raw-water sites showed average concentrations of up to 2.7 particles/L. Concentrations in treated water were, lower than in raw water, with a67%confidencelevel.Exceptfor1ofthe72triplicates,allaverageswerebelowtheLoQ (67%). Only one triplicate of drinking-water taken from the distribution system showed an average concentration above the LoD, i.e. 5.5 microplastic particles/L. However, that could be attributed to environmental contamination due to rough sampling conditions. The study also presented some evidence for contamination of water samples from air when blank bottles were exposed open to air for 24 hours.
8. Kosuth, Mason and Wattenberg (2018) investigated the presence of anthropogenic particles in 159 samples of globally sourced tap water. Samples were collected in 500 mlPEbottles,vacuumfilteredthroughacellulosefilterwithaporesizeof2.5µmandanalysedusingstainingofnaturalorganicmatterwithRoseBengal,(afluorescentdye,)andmicroscopy.Sincenoconfirmatoryspectroscopicanalyses,suchasFTIR,were conducted, the unstained particles were described as anthropogenic particles rather than microplastics. Of the tap water samples analysed, 81% were found to containanthropogenicparticles.Themajorityoftheseparticleswerefibres(98.3%)between 0.1–5 mm in length, with an average of 0.96 mm. The range reported was 0 to 61 particles/L, with an overall mean of 5.45 particles/L. Of the 30 total deionized blanks, 5 were reported with one anthropogenic particle in them and the others were reported with none. For the three brands of bottled water also included in the study, the average reported concentration of anthropogenic particles was 3.57 particles/L. Of the 539 particles found, the most common colour was blue, followed by red/pink, and brown. Water sourced from more developed nations had an average particle count higher than that sourced from less developed nations.
9. Results from an unpublished study (Mahon et al., 2017) reported maximum concentrations of microplastics of 6.5 particles/L in untreated private well-water

100 Microplastics in drinking-water
samples and 1.6 particles/L in a public water supply in Ireland. The report contained insufficientdetailsonthemethodsofanalysistointerpretorcontextualizetheseresults. The public water supply came from a lake and the treatment process involvedfinescreening(5mm),coagulation,settlement,pHcorrection,rapid-gravityfiltration,UVtreatment,disinfectionandfluoridation.Theauthorsconsideredtheabilityoffibrestopassthroughsucharobusttreatmentsystemraisesthequestionofwhethersystemsthatemployfewertreatmentstagesmaynotbeasefficientin capturing microplastics, but without further details of contamination control measures, the results should be treated with caution.
A.5 References
GESAMP(2019).Guidelinesorthemonitoringandassessmentofplasticlitterintheocean.In:KershawPJ,TurraAandGalganiF,eds.(IMO/FAO/UNESCO-IOC/UNIDO/WMO/IAEA/UN/UNEP/UNDP/ISA)JointGroupofExpertsontheScientificAspectsofMarineEnvironmentalProtection(ReportsandStudiesNo.99;http://www.gesamp.org/publications/guidelines-for-the-monitoring-and-assessment-of-plastic-litter-in-the-ocean; accessed 2 July 2019).
Hendrickson E,Minor EC and SchreinerK (2018).Microplastic abundance andcomposition in western Lake Superior as determined via microscopy, Pyr-GC/MS, and FTIR.EnvironmentalScience&Technology,52(4):1787–96.doi:10.1021/acs.est.7b05829.
Hermsen E, et al. (2018).Quality criteria for the analysis ofmicroplastic in biotasamples: acritical review.EnvironmentalScience&Technology,52:10230−40.doi:10.1021/acs.est.8b01611.
Koelmans AA, et al. (2019). Microplastics in freshwaters and drinking water: critical review and assessment of data quality. Water Research, 155:410-422. doi: 10.1016/j.watres.2019.02.054 (https://www.sciencedirect.com/science/article/pii/S0043135419301794, accessed 30 April 2019).
KosuthM,MasonSAandWattenbergEV(2018).Anthropogeniccontaminationoftapwater,beer,andseasalt.PLoSONE,13(4):e0194970.doi:10.1371/journal.pone.0195970.
MahonAM,etal.(2017).Microplasticsinsewagesludge:effectsoftreatment.EnvironmentalScience & Technology, 51:810–18. doi: 10.1021/acs.est.6b04048.
Mason SA, Welch VG and Neratko J (2018). Synthetic polymer contamination in bottled water. Frontiers in Chemistry, 6:407. doi: 10.3389/fchem.2018.00407.
Mintenig SM, et al. (2019). Low numbers of microplastics detected in drinking water

Annex 101
fromgroundwatersources.ScienceoftheTotalEnvironment,648:631–5.doi:10.1016/j.scitotenv.2018.08.178.
OßmannBE,etal.(2018).Small-sizedmicroplasticsandpigmentedparticlesinbottledmineral. Water Research, 141:307–16. doi: 10.1016/j.watres.2018.05.027.
Pivokonsky M, et al. (2018). Occurrence of microplastics in raw and treated drinking water. ScienceoftheTotalEnvironment,643:1644–51.doi:10.1016/j.scitotenv.2018.08.102.
Schymanski D, et al. (2018). Analysis of microplastics in water by micro-Raman spectroscopy: release of plastic particles from different packaging into mineral water. Water Research, 129:154–62. doi: 10.1016/j.watres.2017.11.011.
Strand J, et al. (2018). Analysis of microplastic particles in Danish drinking water. Aarhus:AarhusUniversity,DanishCentre for Environment and Energy. (ScientificReport No. 291).
UhlW,EftekhardadkhahMandSvendsenC(2018).MappingmicroplasticinNorwegiandrinking water. (Norsk Vann Report 241).
Wang F, et al. (2018). Interaction of toxic chemicals with microplastics: a critical review. Water Research, 139:208–19. doi: 10.1016/j.watres.2018.04.003.
Ziajahromi S, et al. (2017). Wastewater treatment plants as a pathway for microplastics: development of a new approach to sample wastewater-based microplastics. Water Research, 112:93–9. doi: 10.1016/j.watres.2017.01.042.


For more information contact:
Water, Sanitation, Hygiene and HealthWorld Health Organization20 Avenue Appia1211 Geneva 27Switzerland
ISBN 978 92 4 151619 8
MIC
RO
PLA
STIC
S IN
DR
INK
ING
-WA
TER
Microplastics in
Related Documents