2004 the medical technology industry at a glance

Welcome message from author
This document is posted to help you gain knowledge. Please leave a comment to let me know what you think about it! Share it to your friends and learn new things together.
Transcript

2004
the medical technology industry at a glance


2004
the medical technology industry at a glance

the medical technology industry at a glance 2004 the state of innovation 1 industry overview
letter from the president
Dear AdvaMed Members and Friends,
The medical technology industry continues to be one of the most vital and dynamic sectors of the U.S. economy and a leading force in the revolution that is transforming America’s health care system. This revolution is improving patient outcomes and speeding recovery time while reducing overall health care spending.
Fueled by record spending on research and development, the U.S. medical technology industry continues to be the world leader in producing innovative lifesaving and life-enhancing products. By all relevant measures of growth – employment trends, production values, exports, global market share, venture capital financing – the medical technology industry sets a standard that is the envy of most business sectors.
The medical technology industry’s impressive economic performance is exceeded only by its contributions to improving the health and well-being of patients worldwide. Breakthrough medical technologies are able to detect diseases earlier and offer new, more effective treatment options for leading causes of disability and mortality such as heart disease, cancer and other illnesses.
More effective treatment options generate economic benefits as well. Over the years, medical technology innovations have led to decreases in the number of disabled Americans, increases in outpatient and minimally invasive surgical procedures, and shorter hospital stays. As a result, patients are able to live longer, healthier, more productive lives for far less than it would have cost just a few years ago.
The future of the medical technology industry looks to be even brighter than the present. Coming breakthroughs in areas such as device miniaturization and nanotechnology, molecular and gene-based diagnostics, information technology, and artificial organs and tissue engineering promise to provide innovative solutions to some of the most persistent and debilitating health care problems. Such innovation bodes well not only for the economic health of the medical technology industry but for the overall health of U.S. patients and the health care system as well.
The information presented in this report, prepared by The Lewin Group, illustrates the robust nature of the U.S. medical technology industry and the positive impact innovations in medical technology are having on patients’ lives and the nation’s health care system.
Pamela G. Bailey
President,Advanced Medical Technology Association
letter from the president

the medical technology industry at a glance 2004 the state of innovation 1 industry overview
SECTION I – THE STATE OF INNOVATION 1
Chapter 1: Industry Overview 3
1.1 U.S. Market Size for the Medical Device and Diagnostics Industry 4
1.2 Distribution of Medical Companies by Size 4
1.3 Distribution of U.S. Firms by North American Industrial Classifications 5
1.4 Mergers and Acquisitions Transaction Volume 6
1.5 Initial Public Offerings of Venture-Backed Medical Device Firms 6
1.6 Venture Capital Financing in the Medical Device Industry 7
Chapter 2: The Global Leader 9
2.1 International Markets for the Medical Device and Diagnostics Industry 10
2.2 Market Sizes, Compound Annual Growth Rates for Selected Regions 10
2.3 Total U.S. Exports of Medical Device and Diagnostics Industry 11
2.4 U.S. Medical Technology Industry Trade Statistics 11
2.5 Estimated Worldwide Market for Selected Cardiovascular Devices 12
Chapter 3: Research & Development 13
3.1 R&D Spending as a Percentage of Sales, U.S. Medical Device Industry 14
3.2 R&D as a Percentage of Sales for U.S. Medical Device Industry and Selected 14Industrial Sectors (U.S.)
i
table of contents

the medical technology industry at a glance 2004 the state of innovation 1 industry overview
3.3 Medical Device Industry R&D Spending as a Percentage of Sales by 15Standard Industrial Classification
3.4 Medical Device Industry R&D Spending as a Percentage of Sales by Company Size 15
3.5 National Institutes of Health Bioengineering Awards 16
3.6 Number of Medical Device Patents 16
3.7 Top Ten Factors Affecting Companies’ Ability to Develop New Medical Technologies 17Over Past Five Years
3.8 Top Ten Factors Influencing Companies’ Product Development Priorities Over 17Past Five Years
Section II – THE VALUE OF INNOVATION 19
Chapter 4: Economic Benefits 21
4.1 Production, Medical Device and Diagnostics Industry 22
4.2 Employment Trends of U.S. Medical Device and Diagnostics Industry 22
4.3 Trend in Selected Industry Producer Indexes 23
4.4 Change in Intercontinental Marketing Services (IMS) Composite Medical-Surgical 24 Price Index
Chapter 5: Regulatory Review 25
5.1 PMAs Approved by FDA 26
5.2 Original PMA Receipt Cohort Performance: FDA Review Days, 90th Percentile 26
5.3 510(k) Receipt Cohort Performance: FDA Review Days, 90th Percentile 27
5.4 FDA Office of Device Evaluation Staffing Levels 27
5.5 FDA Center for Devices and Radiological Health Funding 28
5.6 Reported Changes in Average Elapsed Development Time Over Past Five Years 28
5.7 Faster to Market: Europe or U.S.? 29
ii
table of contents

the medical technology industry at a glance 2004 the state of innovation 1 industry overview
Chapter 6: Coverage & Payment 31
6.1 Reported Impact of Third Party Payer Issues on Innovation 32
6.2 Reported Speed of Coverage and Payment by Third Party Payers 32
6.3 Medicare Approval Process: Drug-Eluting vs. Bare Metal Coronary Stents 33
Chapter 7: Patient Care 35
7.1 Projected vs. Actual Number of Chronically Disabled Americans Age 65+ 36
7.2 Percentage Distribution of Inpatient vs. Outpatient Surgeries 36
7.3 Inpatient Hospital Length of Stay by Age Cohort (U.S.) 37
7.4 Number of Total Hip and Total Knee Replacement Procedures (U.S.) 37
7.5 Total Cataract Procedures (U.S.) 38
7.6 Number of Pacemaker Implant Procedures (U.S.) 38
7.7 Changes in the Treatment of Heart Attacks 39
7.8 Death Rates for Diseases of the Heart (U.S.) 39
7.9 Estimated Number of U.S. Patients with Implantable Cardiover-Defibrillator, 40Pacemaker, or Either Device
7.10 Use of Mammography by Women Age 40+ Years (U.S.); Death Rates 41 for Malignant Neoplasm of Breast for Females (U.S.)
7.11 Cost vs. Cost-Effectiveness of Drug-Eluting Stents 42
Appendix 43
iii
table of contents


SECTION I
the state of innovation

the medical technology industry at a glance 2004 the state of innovation 1 industry overview
Medical technology plays a vital role in delivering safe, effective, and high-quality health care. The industry has developed life-saving and life-enhancing products such as pacemakers, artificial joints, drug-eluting stents, and laparoscopic devices for minimally invasive surgery. Innovations such as microminiature and remote surgery techniques, DNA-based diagnostics, tissue-engineered organs, and advanced information technologies are poised to further enhance quality of care. Medical innovation has great potential to synthesize advances in the sciences, bioengineering, biomaterials, genomics, computing, and telecommunications to develop technologies that will extend our ability to prevent, diagnose, and treat disease. Further advances will address the world’s current health care challenges, including treating and responding to outbreaks of new infectious diseases, biodefense, and meeting health needs in underdeveloped or war-torn areas.
The medical technology industry invests heavily in research and development, driven by constant innovation and short product life cycles. The bulk of R&D spending for medical devices and diagnostics comes from private sources. In 2002, the industry spent 11.4 percent of its sales on R&D, higher than any industry except that for drugs and medicine. Small companies, including many start-ups and highly innovative firms, spent an average of 343 percent of their revenue on R&D.
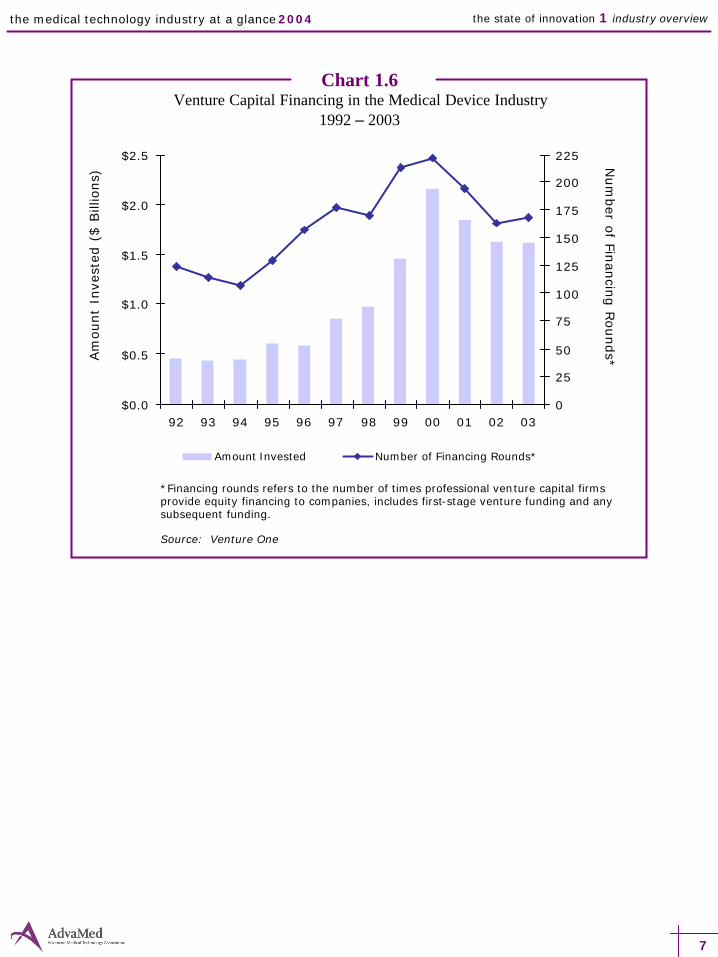
Adequate financing is critical to the successful development and commercialization of medical technology. Start-up companies are particularly dependent on capital financing prior to achieving a viable revenue stream. However, after peaking in 2000, venture capital financing fell sharply in the medical device industry along with many other industries, as did the number of initial public offerings of venture-backed firms.
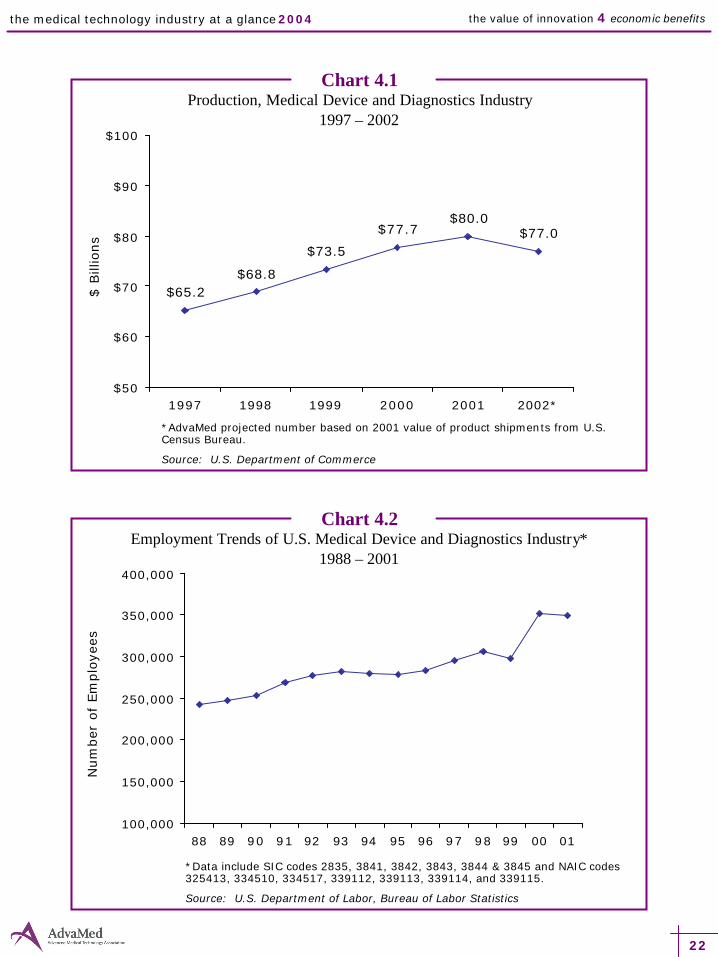
The U.S. remains the global leader in innovation in medical technology. The U.S. medical technology industry is the largest producer of medical devices and diagnostics, with production estimated at $77 billion in 2002. Further, the U.S. is one of the world’s largest exporters of medical technology, selling to other countries an estimated $20.3 billion, or about a quarter of total U.S. production. Although the U.S. share of the growing world market declined during the 1980s due to slowed domestic growth, the U.S. share of the world market is currently about 42 percent.
“America’s health care system has advantages no other nation can match, but also challenges we cannot ignore.”
President George W. Bush
2
SECTION I
the state of innovation

chapter 1
industry overview
the medical technology industry at a glance 2004 the state of innovation 1 industry overview
$75.0$73.7
$71.4
$66.7
$62.2
$57.7
$40
$45
$50
$55
$60
$65
$70
$75
$80
1997 1998 1999 2000 2001 2002*
4
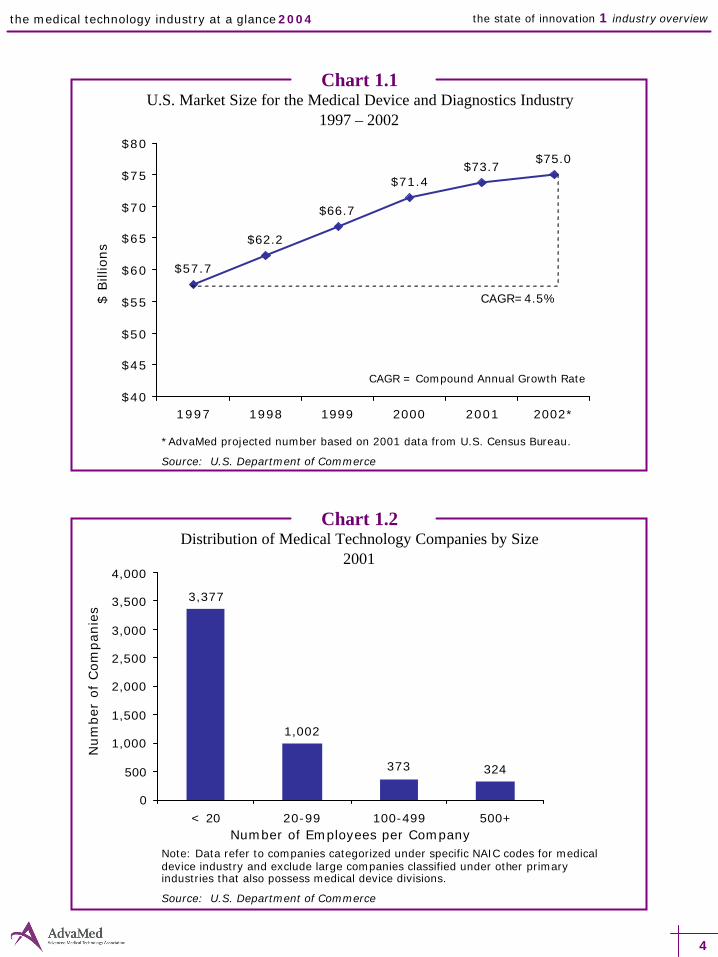
Chart 1.2Distribution of Medical Technology Companies by Size
2001
324373
1,002
3,377
0
500
1,000
1,500
2,000
2,500
3,000
3,500
4,000
< 20 20-99 100-499 500+
Note: Data refer to companies categorized under specific NAIC codes for medical device industry and exclude large companies classified under other primary industries that also possess medical device divisions.
Source: U.S. Department of Commerce
Num
ber
of
Com
panie
sChart 1.1
U.S. Market Size for the Medical Device and Diagnostics Industry1997 – 2002
*AdvaMed projected number based on 2001 data from U.S. Census Bureau.
Source: U.S. Department of Commerce
$ B
illio
ns
CAGR=4.5%
CAGR = Compound Annual Growth Rate
Number of Employees per Company

the medical technology industry at a glance 2004 the state of innovation 1 industry overview
Chart 1.3Distribution of U.S. Firms by North American Industrial Classifications
2001
Note: Data refer to companies categorized under specific NAIC codes for medical device industry and exclude large companies classified under other primary industries that also possess medical device divisions.
Source: U.S. Department of Commerce
Ophthalmic9%
Lab Apparatus7%
IVDs4%
SurgicalAppliances &
Supplies28%
Dental16%
Irradiation3%
Surgical & Medical
Instruments25%
Electromedical8%
5

the medical technology industry at a glance 2004 the state of innovation 1 industry overview
Chart 1.4Mergers & Acquisitions Transaction Volume
1997 – 2003
*Deals refers to merger and/or acquisition activity.
Source: Windhover's Strategic Transaction Database
Tota
l Valu
e ($
Bill
ions)
Chart 1.5Initial Public Offerings of Venture-Backed Medical Device Firms
1996 – 2003
Source: Venture One
Num
ber of D
eals
6
$0
$5
$10
$15
$20
$25
$30
$35
1997 1998 1999 2000 2001 2002 20030
10
20
30
40
50
60
70
80
90
Total Value Number of Deals*
Ave
rage
Am
ount
Rais
ed (
$ M
illio
ns)
Num
ber o
f IPO
s
$0
$20
$40
$60
$80
$100
$120
1996 1997 1998 1999 2000 2001 2002 20030
5
10
15
20
25
30
35
Average Amount Raised Number of IPOs
the medical technology industry at a glance 2004 the state of innovation 1 industry overview
Chart 1.6Venture Capital Financing in the Medical Device Industry
1992 – 2003
*Financing rounds refers to the number of times professional venture capital firms provide equity financing to companies, includes first-stage venture funding and any subsequent funding.
Source: Venture One
Am
ount
Inve
sted
($ B
illio
ns)
Num
ber o
f Financin
g R
ounds*
7
$0.0
$0.5
$1.0
$1.5
$2.0
$2.5
92 93 94 95 96 97 98 99 00 01 02 030
25
50
75
100
125
150
175
200
225
Amount Invested Number of Financing Rounds*


chapter 2
the global leader

10
the medical technology industry at a glance 2004 the state of innovation 2 the global leader
Chart 2.1International Markets for the Medical Device and Diagnostics Industry
2000
Source: AdvaMed
$ B
illio
ns
Chart 2.2Market Sizes, Compound Annual Growth Rates for Selected Regions
1991 – 1999
Source: AdvaMed
10.6%7.3%14.1%Total
12.5%8.6%16.6%Rest of World
8.7%2.6%15.2%Japan
10.4%9.3%11.5%EU
10.8%7.4%14.3%U.S.
1991-19991995-19991991-1995
$72
$35
$25
$13
$0
$10
$20
$30
$40
$50
$60
$70
$80
US EU Japan Rest of World
Total 2000 Global Market = $169 Billion

11
the medical technology industry at a glance 2004 the state of innovation 2 the global leader
Chart 2.4U.S. Medical Technology Industry Trade Statistics
2002 – 2003
Source: U.S. International Trade Commission
Chart 2.3Total U.S. Exports of Medical Device and Diagnostics Industry
1989 – 2003
$0
$5
$10
$15
$20
$25
89 90 91 92 93 94 95 96 97 98 99 00 01 02 03
Source: U.S. International Trade Commission
$ B
illio
ns
-1.40-1.40 Asia (excl. Japan)
1.201.30 Japan
-1.40- 1.04 Mexico
1.301.60 Canada
0.560.74UK
-0.47-0.22Germany
0.530.65France
0.732.00 EU total
0.503.30U.S. Trade Surplus
22.0018.30U.S. Imports
$22.50$20.30 U.S. Exports
2003($ in Billions)
2002($ in Billions)

12
the medical technology industry at a glance 2004 the state of innovation 2 the global leader
Chart 2.5Estimated Worldwide Market for Selected Cardiovascular Devices
2001
Source: PJB Medical Publications, Inc.
114Ventricular Assist Devices
115Brachytherapy Systems
130Atherectomy Catheters
155Ablation Catheters
200Endovascular Stent-Grafts
231Diagnostic Electrophysiology Catheters
255Vascular Sealing Devices
433Other
590Peripheral Stents
832Heart Valves
1,900Implantable Cardioverter Defibrillators
2,000Angioplasty Devices
2,300Coronary Stents
$ 2,874Pacemakers and Accessories
$ 12,199Total
70Embolic Protection Systems
Revenue (in Millions)Category

chapter 3
research & development

14
the medical technology industry at a glance 2004 the state of innovation 3 research & development
Chart 3.1R&D Spending as a Percentage of Sales, U.S. Medical Device Indus try
1990 - 2002
5.4% 5.5%6.0%
6.8%7.2%
8.4%
9.6%
11.1%
12.9%
10.1%10.9%
12.3%11.4%
0%
2%
4%
6%
8%
10%
12%
14%
90 91 92 93 94 95 96 97 98 99 00 01 02
Source: S&P's Compustat. Data from publicly traded companies
Chart 3.2R&D as a Percentage of Sales for U.S. Medical Device Industry and
Selected Industrial Sectors, United States, 2002
3.5%
0.5%
0.8%
1.1%
3.1%
3.9%
4.1%
5.6%
7.5%
11.4%
12.9%
All Companies
Paper/Forest
Metals/Mining
Leisure
Aerospace/Defense
Electrical/Electronics
Auto
Telecom
Office Equipment
Medical Devices
Drugs & Medicine
Source: S&P's Compustat. Data from publicly traded companies

15
the medical technology industry at a glance 2004 the state of innovation 3 research & development
Chart 3.3Medical Device Industry R&D Spending as a Percentage of Sales by
Standard Industrial Classification, 1990, 1998, and 2002
33%
10%
5%
3%
8%
11%
23%
14%
6%
3%
9%
13%
11%
4%
3%
2%
7%
8%
0% 5% 10% 15% 20% 25% 30% 35%
199019982002
Source: S&P's Compustat. Data from publicly traded companies
Chart 3.4Medical Device Industry R&D Spending as a Percentage of Sales by Company
Size, 1990 and 2002
6% 4%
343%
39%24% 14% 5% 9%7%6%15%
47%
0%
50%
100%
150%
200%
250%
300%
350%
400%
< $5 M* $5-20 M $20-100 M $100-500 M $500 M-1 B > $1 B
1990
2002
*Excludes companies with no revenue.
Source: S&P's Compustat. Data from publicly traded companies
Perc
enta
ge o
f Sale
s
Revenue
Electromedical &Electrotherapeutic
Apparatus
X-Ray & RelatedIrradiationApparatus
Dental Equipment & Sales
Orthopedics,Surgical Appliances &
Supplies
Surgical & MedicalInstruments
Diagnostics &Reagents

16
the medical technology industry at a glance 2004 the state of innovation 3 research & development
Chart 3.5National Institutes of Health Bioengineering Awards
1997 – 2002
$0
$100
$200
$300
$400
$500
$600
$700
$800
$900
1997 1998 1999 2000 2001* 2002*0%
1%
2%
3%
4%
5%
6%
7%
Funding Percent
Source: National Institutes of Health
Fundin
g (
$ M
illio
ns)
Percen
t of T
ota
l NIH
Fundin
g
Chart 3.6Number of Medical Device Patents
1989 – 2003
4,1784,500 4,737
5,5546,010
7,943 8,196
9,091
0
1,000
2,000
3,000
4,000
5,000
6,000
7,000
8,000
9,000
10,000
1989 1991 1993 1995 1997 1999 2001 2003
Note: Estimates based on PTO-recommended methodology.
Source: U.S. Patent and Trademark Office
* Estimated Data

17
the medical technology industry at a glance 2004 the state of innovation 3 research & development
Chart 3.7Top Ten Factors Affecting Companies’ Ability to
Develop New Medical Technologies Over Past Five Years, 2003
Source: AdvaMed Survey of Member Companies, 2003
Chart 3.8Top Ten Factors Influencing Companies’ Product
Development Priorities Over Past Five Years, 2003
Source: AdvaMed Survey of Member Companies, 2003
46.3%
53.1%
54.3%
54.3%
56.8%
63.9%
66.7%
71.6%
74.1%
84.0%FDA Regulatory Requirements
Cost of Clinical Research
Medicare Coverage & Reimbursement Requirements
R&D Costs Related to Expansion/ Contraction into New Markets
U.S. Private Payer Coverage & Reimbursement Requirements
International Regulatory Requirements
Litigation Risks & Costs
R&D Costs Related to Acceptance in Existing Markets
Sales, General & Administrative Related to Expansion/Contraction into
New Markets
Availability/Cost of Capital Funding
43.8%
46.9%
51.6%
52.3%
55.4%
58.5%
60.0%
62.5%
78.5%
81.5%FDA Regulatory Requirements
Issues Related to Intellectual Property Protection
Customer Demand for Cost-saving or Cost-effective Technology
Price-sensitivity of Customers
Medicare Coverage & Reimbursement Requirements
Private Payer Coverage & Reimbursement Requirements
Overseas Market Opportunities
Changes in Revenues
Payer Demand for Evidence of Clinical Effectiveness and/or Cost Effectiveness
Availability/Cost of Capital Funding


SECTION II
the value of innovation

20
the medical technology industry at a glance 2004 the value of innovation 4 economic benefits
the value of innovation
Medical technology continues to transform health care in ways that could not have been conceived even ten years ago. Through advances in technology, physicians can detect diseases earlier, provide less invasive treatment options, reduce recovery times, and enable patients to resume active, productive lives more quickly.
• Medical technology has made great contributions to the screening and early detection of malignant breast tumors. When caught early, survival rates are higher and costs of treatment are lower. • A study published in the New England Journal of Medicine found that for patients who had a previous heart attack and reduced pumping capacity, there was a 31 percent reduction in the risk of death for those who received a defibrillator versus those who received conventional therapy.1
• Laparoscopic cholecystectomy (minimally invasive gallbladder removal surgery) decreased inpatient length of stay from about 7.5 days for conventional open surgery to about 2.6 days and has reduced recovery times.2
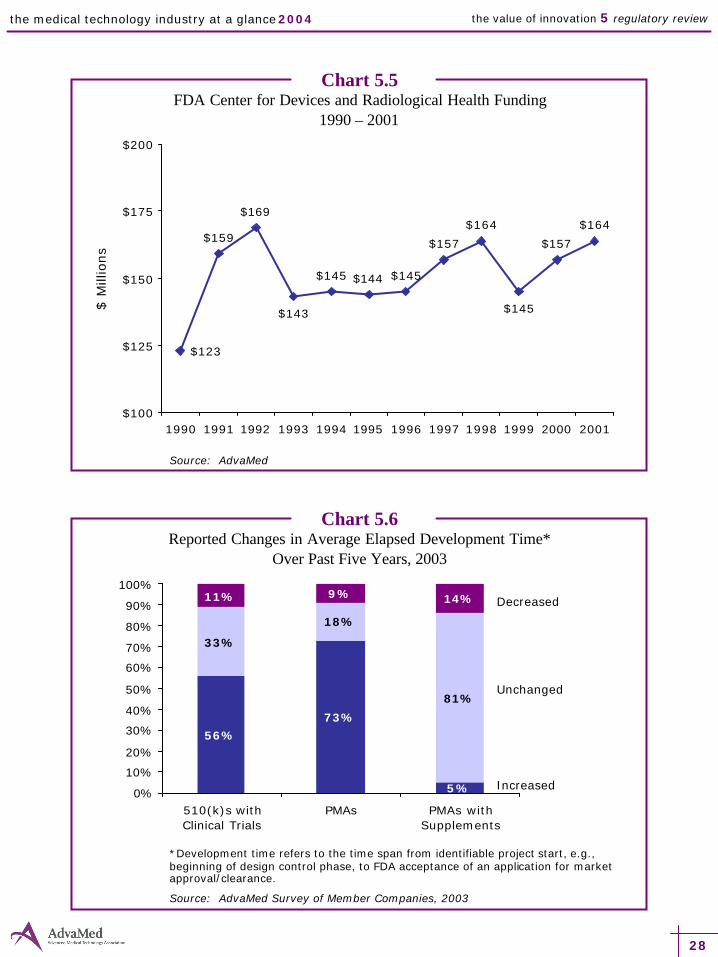
Despite these great advances, significant challenges remain for the medical technology industry. Though average review times for 510(k) applications for “substantially equivalent” devices have fallen to less than 100 days, review times for PMA applications for truly novel devices, including many breakthrough technologies, can be high – more than 250 days, at the 90th percentile. With the passage of the Medical Device User Fee
and Modernization Act (MDUFMA), the implementation of user fees should provide the FDA with the resources it needs to make the latest breakthrough technologies avail-able more quickly to those who need them.
The Medicare coverage and payment process for new technology continues to be a concern. In a recent AdvaMed survey, 44 percent of respondents indicated that the length of time it takes to secure coverage had significantly hindered their ability to bring an innovative new technology to patients, while nearly half of respondents identified inadequate payment levels as the single greatest reimbursement-related hurdle. Medicare has made certain strides in conducting a more open and accountable process for making new technology coverage decisions, including the speed with which it moved to cover the breakthrough drug-eluting stents in 2003. Even so, many beneficial technologies remain uncovered, and the time-consuming and somewhat uncertain requirements of the Medicare process pose a formidable, additional challenge to innovation and patient access to technological advances.
“The benefits from lower infant mortality and better treatment of heart attacks have been sufficiently great that they alone are about equal to the entire cost increase for medical care over time. Thus, recognizing that there are other benefits to medical care, we conclude that medical spending as a whole is clearly worth the cost.”
David M. Cutler, Ph.D., Professor of Economics, Harvard UniversityMark McClellan, M.D., Ph.D., CMS Administrator
1Moss AJ, et al. Prophylactic implantation of a defibrillator in patients with myocardial infarction and reduced ejection fraction. New England Journal of Medicine 2002;346(12):877-83.
2Cohen MM, et al. Has laparoscopic cholecystectomy changed patterns of practice and patient outcomes in Ontario? Canadian Medical Association Journal 1996;154:491-500.
SECTION II

chapter 4
economic benefits
chapter 4
economic benefits
22
the medical technology industry at a glance 2004 the value of innovation 4 economic benefits
100,000
150,000
200,000
250,000
300,000
350,000
400,000
88 89 90 91 92 93 94 95 96 97 98 99 00 01
Chart 4.1Production, Medical Device and Diagnostics Industry
1997 – 2002
*AdvaMed projected number based on 2001 value of product shipments from U.S. Census Bureau.
Source: U.S. Department of Commerce
Chart 4.2Employment Trends of U.S. Medical Device and Diagnostics Industry*
1988 – 2001
*Data include SIC codes 2835, 3841, 3842, 3843, 3844 & 3845 and NAIC codes 325413, 334510, 334517, 339112, 339113, 339114, and 339115.
Source: U.S. Department of Labor, Bureau of Labor Statistics
$65.2$68.8
$73.5
$77.7$80.0
$77.0
$50
$60
$70
$80
$90
$100
1997 1998 1999 2000 2001 2002*
$ B
illio
ns
Num
ber
of
Em
plo
yees

23
the medical technology industry at a glance 2004 the value of innovation 4 economic benefits
Chart 4.3Trend in Selected Industry Producer Price Indexes
2001 – 2002
Producer Price Index (PPI) is a family of indexes that measures the average change over time in selling prices received by domestic producers of goods and services. PPIs measure price change with respect to the base period, 1982, which is set to 100.
Source: U.S. Department of Labor, Bureau of Labor Statistics, Producer Price Index website, Public Data Query
131.1
130.8
127.9
196.2
226.3
0 50 100 150 200 250
PPI-Commodities
Surgical & MedicalInstruments4
Surgical & MedicalHospitals3
In vitro & In vivoDiagnostics2
Drugs1
1SIC 283 - Medicinal chemicals and botanical products, pharmaceutical preparations, in vitro and in vivo diagnostics and biological products.
2SIC 2835 - In vitro diagnostic substances, reagents, standards and controls, blood bank, hematology, coagulation products, microbiology, serology, histology, virology, cytology products, other in vitro diagnostics, including culture media, in vivo diagnostic substances including contrast media and radioactive reagents.
3SIC 8062 - Medicare patients, Medicaid patients and all other patients (various diseases and disorders). Does not include psychiatric or specialty hospitals.
4SIC 3841 - Surgical and medical instruments and apparatus, diagnostic apparatus, syringes and needles and hospital furniture.

24
the medical technology industry at a glance 2004 the value of innovation 4 economic benefits
Chart 4.4Change in Intercontinental Marketing Services (IMS) Composite Medical-
Surgical Price Index2002 – 2003
Note: Percent change in Overall Pharmaceutical Index is 3Q02 – 3Q03; all others Nov ‘02 – Nov ‘03
Source: Hospital Materials Management
CPI (Medical Care Commodities) = 1.9%
8.1%
4.5%
2.8%1.6% 1.5%
0.4% 0.2% 0.2% 0.1%
-0.2%
-2.0%
-4.0%
0.0%
4.0%
8.0%
12.0%Su
ture
nee
dles
,
ENT instru
men
ts
Cath
eter
sPh
arm
aceu
ticals
Surg
ical a
nd
med
ical
instru
men
tsX- r
ay equ
ipm
ent
Bloo
d tran
sfus
ion
& IV
equ
ipm
ent
Diagn
ostic
ap
para
tus
Ortho
pedic
instru
men
tsCl
inica
l lab
orat
ory
instru
men
tsBl
ood
pres
sure
ap
para
tus
Elec
trom
edica
leq
uipm
ent
chapter 5
regulatory review

26
the medical technology industry at a glance 2004 the value of innovation 5 regulatory review
404
341 335
374
200
250
300
350
400
450
1999 2000 2001* 2002*
Chart 5.1PMAs Approved by FDA
1996 – 2001
28
45
26
52
45 45
0
10
20
30
40
50
60
1996 1997 1998 1999 2000 2001
Source: FDA, ODE Annual Reports
Chart 5.2Original PMA Receipt Cohort Performance: FDA Review Days
(Filing to Final Action), 90th Percentile, 1999 – 2002
Source: FDA, ODE Annual Reports
Num
ber
of
Day
sN
um
ber
Appro
ved
*2001 – 12 still under review *2002 – 16 still under review

27
the medical technology industry at a glance 2004 the value of innovation 5 regulatory review
160
153
162 162
148
150
152
154
156
158
160
162
164
1999 2000 2001 2002
Chart 5.4FDA Office of Device Evaluation Staffing Levels
1996 – 2002
Source: FDA, ODE Annual Reports
368
356
340
330
359353 354
300
350
400
1996 1997 1998 1999 2000 2001 2002
Num
ber
of
Sta
ff
Chart 5.3510(k) Receipt Cohort Performance: FDA Review Days(Receipt to Final Action), 90th Percentile, 1999 – 2002
Source: FDA, ODE Annual Reports
Num
ber
of
Day
s
28
the medical technology industry at a glance 2004 the value of innovation 5 regulatory review
Chart 5.5FDA Center for Devices and Radiological Health Funding
1990 – 2001
$159
$169
$145 $144 $145
$157
$164
$157
$164
$145$143
$123
$100
$125
$150
$175
$200
1990 1991 1992 1993 1994 1995 1996 1997 1998 1999 2000 2001
Source: AdvaMed
$ M
illio
ns
Chart 5.6Reported Changes in Average Elapsed Development Time*
Over Past Five Years, 2003
*Development time refers to the time span from identifiable project start, e.g., beginning of design control phase, to FDA acceptance of an application for market approval/clearance.
Source: AdvaMed Survey of Member Companies, 2003
56%
73%
5%
33%
18%
81%
11% 9% 14%
0%
10%
20%
30%
40%
50%
60%
70%
80%
90%
100%
510(k)s withClinical Trials
PMAs PMAs withSupplements
Decreased
Unchanged
Increased

29
the medical technology industry at a glance 2004 the value of innovation 5 regulatory review
Chart 5.7Faster to Market: Europe or U.S.?
2003
Source: AdvaMed Survey of Member Companies, 2003
U.S.5%
Europe76%
No Difference
19%


chapter 6
coverage & payment

32
the medical technology industry at a glance 2004 the value of innovation 6 coverage & payment
Chart 6.1Reported Impact of Third Party Payer Issues on Innovation
2003
Note: “Other third party payment” issues named include coding issues, demonstrating clinical efficacy, demonstrating safety, demonstrating clinical effectiveness, adding data on costs, clinical outcomes, and specific patient populations.Source: AdvaMed Survey of Member Companies, 2003
25% 28% 29%41%
28%28%
44%30%
47% 44%
27% 29%
0%
10%
20%
30%
40%
50%
60%
70%
80%
90%
100%Significantly
Some
Not
Tech assessment
requirements
Slowness in securing coverage
Adequate Medicare payment
Adding dataon clinical outcomes
Chart 6.2Reported Speed of Coverage and Payment by Third Party Payers
2003
Source: AdvaMed Survey of Member Companies, 2003
35%41%
9% 10% 11%
24%22%
9% 10%
26%28%
34%45%
26%
6%6%
28%
23%
26%
9%3%
19%13%
37%
0%
10%
20%
30%
40%
50%
60%
70%
80%
90%
100%
Medicare Medicaid Private PPO Private HMO Private Feefor Service
Fastest
Slowest

33
the medical technology industry at a glance 2004 the value of innovation 6 coverage & payment
Chart 6.3Medicare Approval Process:
Drug-Eluting vs. Bare Metal Coronary Stents
In order to ensure patient access to this technology as rapidly as possible, the Centers for Medicare & Medicaid Services (CMS) took the unprecedented step of assigning two new diagnosis-related groups (DRGs) for drug-eluting stents before the CYPHER™ stent gained FDA approval. Medicare then began covering and paying for this technology upon FDA approval. In contrast, when J&J introduced the first bare metal coronary stent into the U.S. in 1994, it was not until more than three years after FDA approval that Medicare reassigned this technology to a higher-paying DRG. This 3-year time lag is typical for many new technologies.
1986
HospitalPayment3 years
Bare Metal Coronary Stents
J&J Licenses StentTechnology
1990 1993 1994 1995 1997
J&J RequestsICD-9 Code for Coronary Stents
2 Randomized Controlled Trials
(STRESS & BENESTENT)
Presented to FDA
FDA Approval of PALMAZ-SCHATZ® Coronary
Stent
ICD-9Code for Coronary
Stents
Medicare Reassigns Coronary Stents to DRG 116
Hospital Payment
Immediate
Drug-Eluting Coronary Stents
Apr 12003
Sep 2000
Oct2002
Apr 242003
Reviewed SIRIUS Study
Plans with CMS
Sep 2001
Nov2001
Medicare Assigns Drug-eluting
Coronary Stents to new DRGs 526 & 527
FDA Approval of CYPHER™
Coronary Stent
Medicare Assigns Unique
ICD-9 Code
Formal Request for ICD-9 code
Provided Preliminary
SIRIUS Clinical & Cost Data
Apr 2002
Presented 9-mo.
SIRIUS Data
Jun 2002
Presented RAVEL Clinical Data
Source: Timelines adapted from Cordis.


chapter 7
patient care
36
the medical technology industry at a glance 2004 the value of innovation 7 patient care
9.5
7.5
8.3
7.17.17.06.4
5
6
7
8
9
10
1982 1989 1994 1999
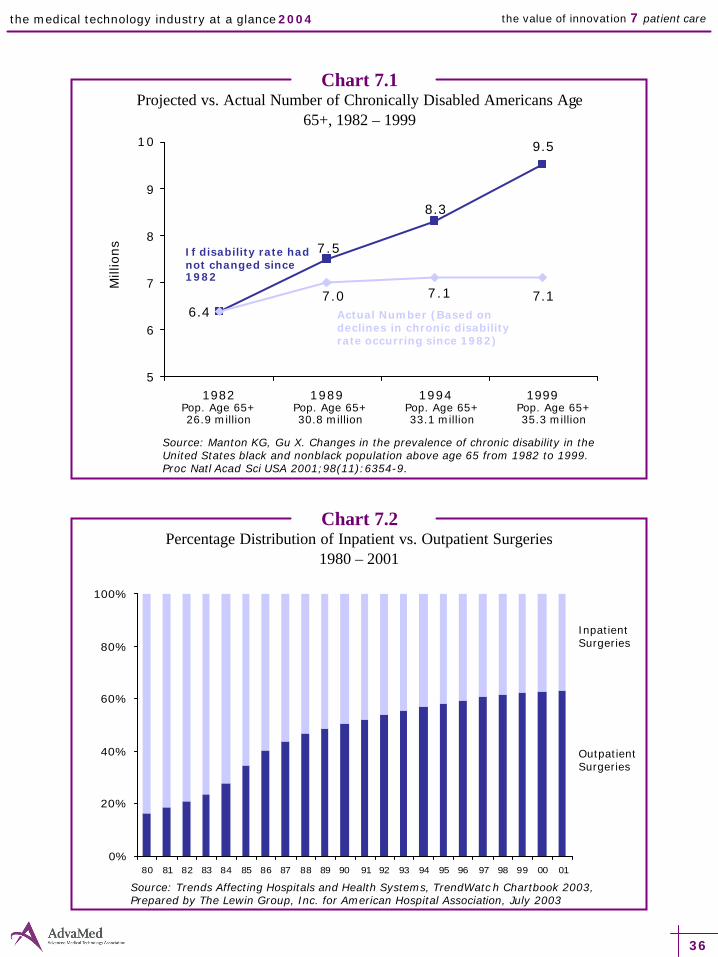
Chart 7.1Projected vs. Actual Number of Chronically Disabled Americans Age
65+, 1982 – 1999
Source: Manton KG, Gu X. Changes in the prevalence of chronic disability in the United States black and nonblack population above age 65 from 1982 to 1999. Proc Natl Acad Sci USA 2001;98(11):6354-9.
Chart 7.2Percentage Distribution of Inpatient vs. Outpatient Surgeries
1980 – 2001
0%
20%
40%
60%
80%
100%
80 81 82 83 84 85 86 87 88 89 90 91 92 93 94 95 96 97 98 99 00 01
Source: Trends Affecting Hospitals and Health Systems, TrendWatch Chartbook 2003, Prepared by The Lewin Group, Inc. for American Hospital Association, July 2003
Mill
ions
If disability rate had not changed since 1982
Actual Number (Based on declines in chronic disability rate occurring since 1982)
Pop. Age 65+26.9 million
Pop. Age 65+30.8 million
Pop. Age 65+33.1 million
Pop. Age 65+35.3 million
Inpatient Surgeries
Outpatient Surgeries
37
the medical technology industry at a glance 2004 the value of innovation 7 patient care
0
50
100
150
200
250
300
350
1990 1991 1992 1993 1994 1995 1996 1997 1998 1999 2000 2001
Total Hip Replacements Total Knee Replacements
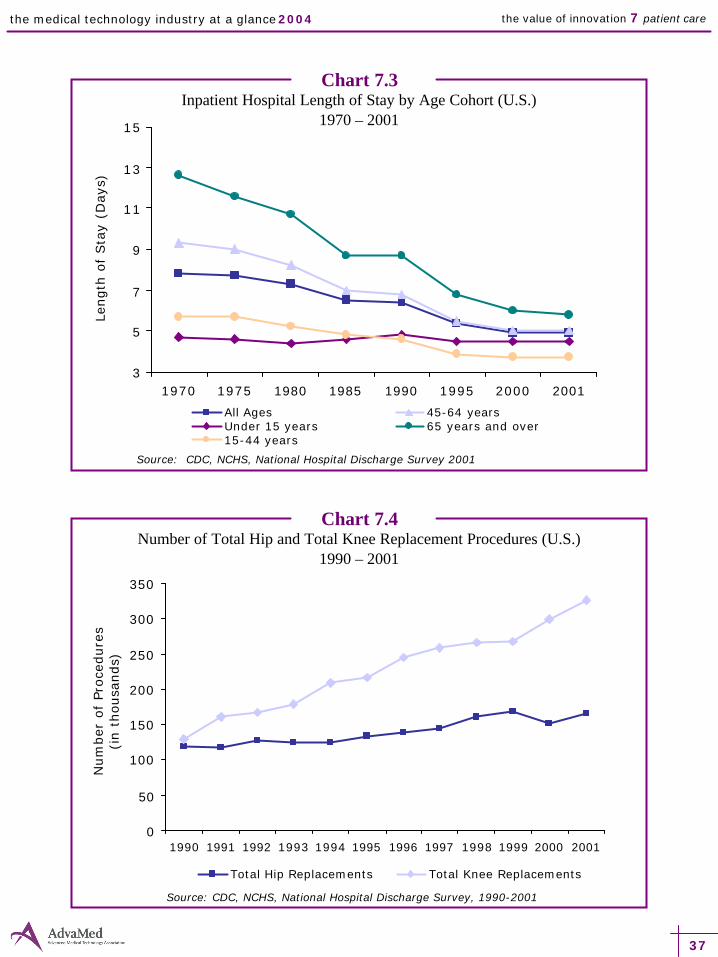
Chart 7.3Inpatient Hospital Length of Stay by Age Cohort (U.S.)
1970 – 2001
Source: CDC, NCHS, National Hospital Discharge Survey 2001
Chart 7.4Number of Total Hip and Total Knee Replacement Procedures (U.S.)
1990 – 2001
Source: CDC, NCHS, National Hospital Discharge Survey, 1990-2001
3
5
7
9
11
13
15
1970 1975 1980 1985 1990 1995 2000 2001
All Ages 45-64 yearsUnder 15 years 65 years and over15-44 years
Length
of
Sta
y (D
ays
)N
um
ber
of
Pro
cedure
s (i
n t
housa
nds)

38
the medical technology industry at a glance 2004 the value of innovation 7 patient care
Chart 7.5Total Cataract Procedures (U.S.)
1999 – 2001
*PMMA = polymethylmethacrylate
Source: Health Products Research, Inc.
0
500
1,000
1,500
2,000
2,500
3,000
1999 2000 2001Silicone IOLs Other Foldable IOLs PMMA IOLs*
Tota
l C
ata
ract
Pro
cedure
s(i
n t
housa
nds)
Chart 7.6Number of Pacemaker Implant Procedures* (U.S.)
1997 – 2001
Source: The Lewin Group analysis of the Health Care Utilization Project (HCUP), Nationwide Inpatient Sample (NIS), 1997 – 2001.
Num
ber
of
Pro
cedure
s
*Pacemaker implant ICD-9-CM codes: 37.80 - Insertion of permanent pacemaker, initial or replacement, type of device not
specified; 37.81 - Initial insertion of single-chamber device, not specified as rate responsive;37.82 - Initial insertion of single-chamber device, rate responsive; and 37.83 - Initial insertion of dual-chamber device.
0
25,000
100,000
125,000
150,000
175,000
200,000
225,000
1997 1998 1999 2000 2001
Total Implants
37.83
37.8237.8137.80

39
the medical technology industry at a glance 2004 the value of innovation 7 patient care
Chart 7.7Changes in the Treatment of Heart Attacks
1984 – 1998
Source: Cutler and McClellan, Health Affairs, Sept/Oct 2001
0%
10%
20%
30%
40%
50%
60%
1984 1986 1988 1990 1992 1994 1996 1998
Catheterization Angioplasty w/o stent
Angioplasty w/stent Bypass Surgery
Perc
ent
of
Case
s
Chart 7.8Death Rates for Diseases of the Heart (U.S.)
1950 – 2001
0
100
200
300
400
500
600
700
1950 1960 1970 1980 1990 1995 2000 2001
Source: CDC, National Center for Health Statistics
Death
s per
100,0
00 r
esi
dent
popula
tion
40
the medical technology industry at a glance 2004 the value of innovation 7 patient care
0
100
200
300
400
500
600
700
800
900
1990 1991 1992 1993 1994 1995 1996 1997 1998 1999 2000
Either Device Pacemaker ICD
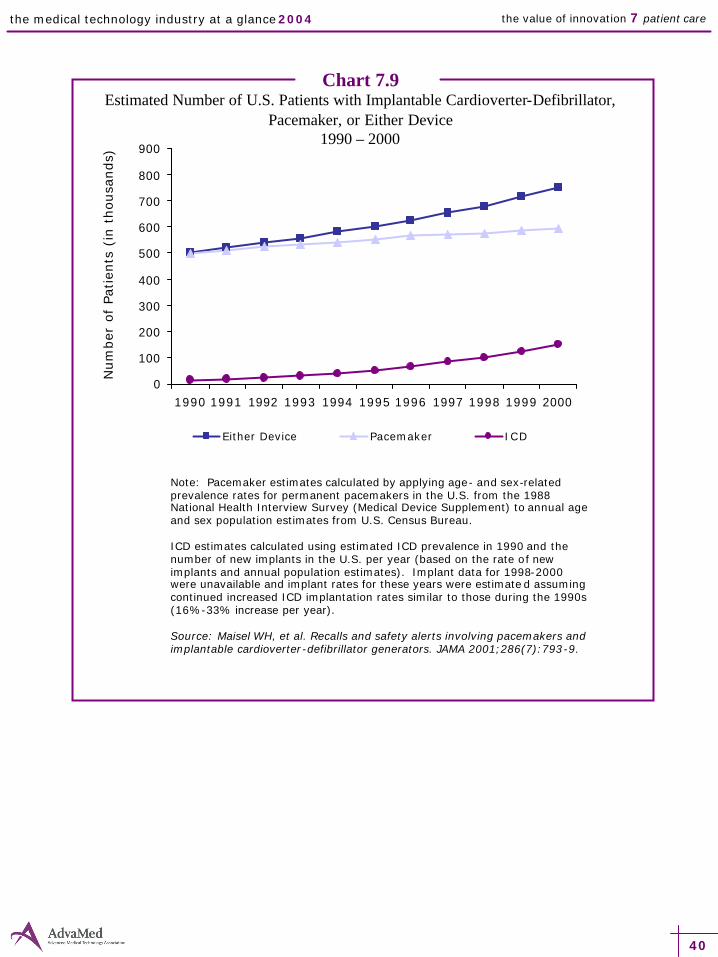
Chart 7.9Estimated Number of U.S. Patients with Implantable Cardioverter-Defibrillator,
Pacemaker, or Either Device1990 – 2000
Note: Pacemaker estimates calculated by applying age- and sex-related prevalence rates for permanent pacemakers in the U.S. from the 1988 National Health Interview Survey (Medical Device Supplement) to annual age and sex population estimates from U.S. Census Bureau.
ICD estimates calculated using estimated ICD prevalence in 1990 and the number of new implants in the U.S. per year (based on the rate of new implants and annual population estimates). Implant data for 1998-2000 were unavailable and implant rates for these years were estimated assuming continued increased ICD implantation rates similar to those during the 1990s (16%-33% increase per year).
Source: Maisel WH, et al. Recalls and safety alerts involving pacemakers and implantable cardioverter-defibrillator generators. JAMA 2001;286(7):793-9.
Num
ber
of
Patien
ts (
in t
housa
nds)
41
the medical technology industry at a glance 2004 the value of innovation 7 patient care
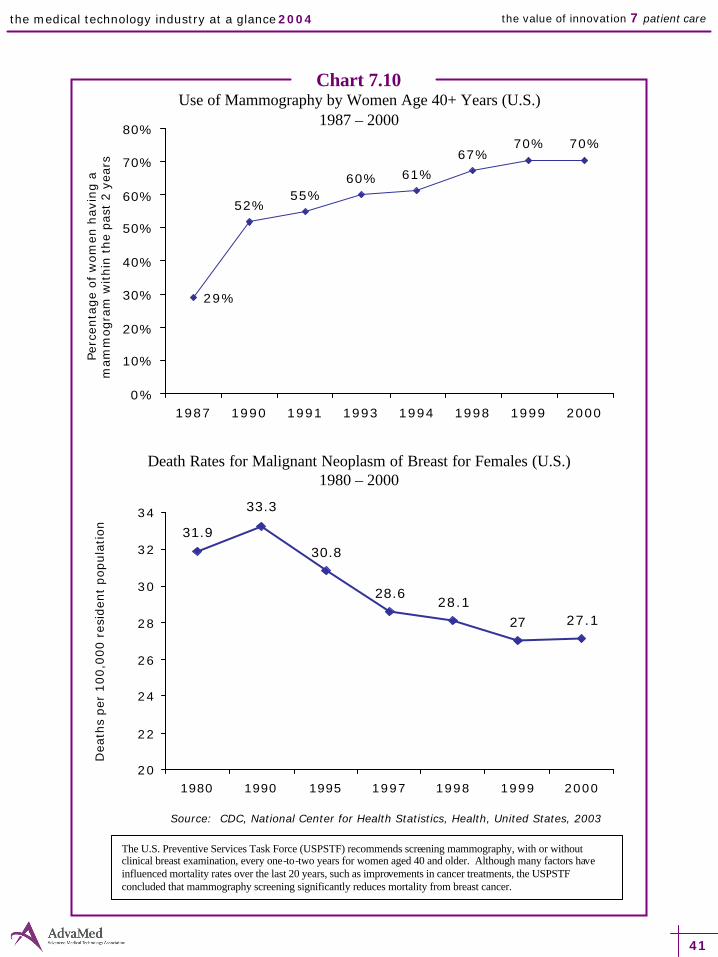
Chart 7.10Use of Mammography by Women Age 40+ Years (U.S.)
1987 – 2000
52%55%
60% 61%
67%70% 70%
29%
0%
10%
20%
30%
40%
50%
60%
70%
80%
1987 1990 1991 1993 1994 1998 1999 2000
Source: CDC, National Center for Health Statistics, Health, United States, 2003
Perc
enta
ge o
f w
om
en h
avi
ng a
m
amm
ogra
m w
ithin
the
pas
t 2 y
ears
Death Rates for Malignant Neoplasm of Breast for Females (U.S.)1980 – 2000
31.9
33.3
30.8
28.628.1
27 27.1
20
22
24
26
28
30
32
34
1980 1990 1995 1997 1998 1999 2000
Dea
ths
per
100,0
00 r
esid
ent
popula
tion
The U.S. Preventive Services Task Force (USPSTF) recommends screening mammography, with or without clinical breast examination, every one-to-two years for women aged 40 and older. Although many factors have influenced mortality rates over the last 20 years, such as improvements in cancer treatments, the USPSTF concluded that mammography screening significantly reduces mortality from breast cancer.

42
the medical technology industry at a glance 2004 the value of innovation 7 patient care
Chart 7.11Cost vs. Cost-Effectiveness of Drug-Eluting Stents
Source: Adapted from presentation by David J. Cohen, MD, Harvard Clinical Research Institute, “Cost-Effectiveness of Sirolimus-Eluting Stents for Treatment of Complex Coronary Stenoses: The SIRIUS Trial”
Drug-Eluting vs. Conventional Stents: Initial Hospital Costs
$7,264$4,398
$2,701
$2,704
$1,379
$1,362
$0
$5,000
$10,000
$15,000
Drug-Eluting Stent Conventional Stent
Procedures Room/Ancillary MD Fees
12-Month Events: Repeat Revascularization
13.3%
6.9%4.9%
28.4%
20.0%22.9%
0%
10%
20%
30%
40%
50%
TLR TVR Any
Perc
ent
of p
atie
nts
Drug-Eluting Stent Conventional Stent
A recent economic analysis suggests that the use of drug-eluting stents is cost-effective given the reduction in long-term costs associated with their use. Previous studies have shown that drug-eluting stents reduce both angiographic and clinical restenosis compared with conventional bare metal stents. This study found that drug-eluting stents reduce the need for repeat treatments and rehospitalizations and their associated costs. While initial in-hospital costs were about $2800 higher with the drug-eluting stent than with the conventional stent, the one-year follow-up medical costs for the drug-eluting stent sample were about $2500 lower per patient than
$11,345$8,464
$5,468$8,040
$0
$5,000
$10,000
$15,000
$20,000
Drug-Eluting Stent ConventionalStent
Initial Hospitalization Follow-up
$16,813 $16,504
Drug-Eluting vs. Conventional Stents: 1-Year Medical Care
Costs
those in the conventional stent sample. Thus, the actual cost difference between drug-eluting stents and traditional stents after one year is about $300. The emergence of longer stents and improved implantation techniques could improve the cost-effectiveness of drug-eluting stents in the future.
Note: TLR= target lesion revascularization rate; TVR = target vessel revascularization rate
$11,345
$8,464
Cost Difference+$2,880 Cost Difference
+$309
Appendix
supplementary data tables


45
the medical technology industry at a glance 2004
Appendix A-1: Industry Overview
Table 1.1 Mergers and Acquisitions Transaction Volume 47(Corresponds to Chart 1.4)
Table 1.2 Initial Public Offerings of Venture-Backed Medical Device Firms 47(Corresponds to Chart 1.5)
Table 1.3 Venture Capital Financing in the Medical Device Industry 48(Corresponds to Chart 1.6)
Appendix A-2: The Global Leader
Table 2.1 Total U.S. Exports of Medical Device and Diagnostics Industry 49(Corresponds to Chart 2.3)
Appendix A-3: Research & Development
Table 3.1 National Institutes of Health Bioengineering Awards 50(Corresponds to Chart 3.5)
Appendix A-4: Economic Benefits
Table 4.1 Employment Trends of U.S. Medical Device and Diagnostics Industry 51(Corresponds to Chart 4.2)
Note: Data displayed in the appendix tables are included only for charts not showing data in corresponding chapters.
list of tables
46
the medical technology industry at a glance 2004
Appendix A-7: Patient Care
Table 7.1 Percentage Distribution of Inpatient vs. Outpatient Surgeries 52 (Corresponds to Chart 7.2)
Table 7.2 Inpatient Hospital Length of Stay by Age Cohort 53 (Corresponds to Chart 7.3)
Table 7.3 Number of Total Hip and Total Knee Replacement Procedures (U.S.) 53 (Corresponds to Chart 7.4)
Table 7.4 Total Cataract Procedures (U.S.) 54(Corresponds to Chart 7.5)
Table 7.5 Number of Pacemaker Implant Procedures (U.S.) 54(Corresponds to Chart 7.6)
Table 7.6 Changes in the Treatment of Heart Attacks 55(Corresponds to Chart 7.7)
Table 7.7 Death Rates for Diseases of the Heart (U.S.) 55(Corresponds to Chart 7.8)
list of tables
47
the medical technology industry at a glance 2004
Year
Average Amount Raised
(in Millions) Number of
IPOs
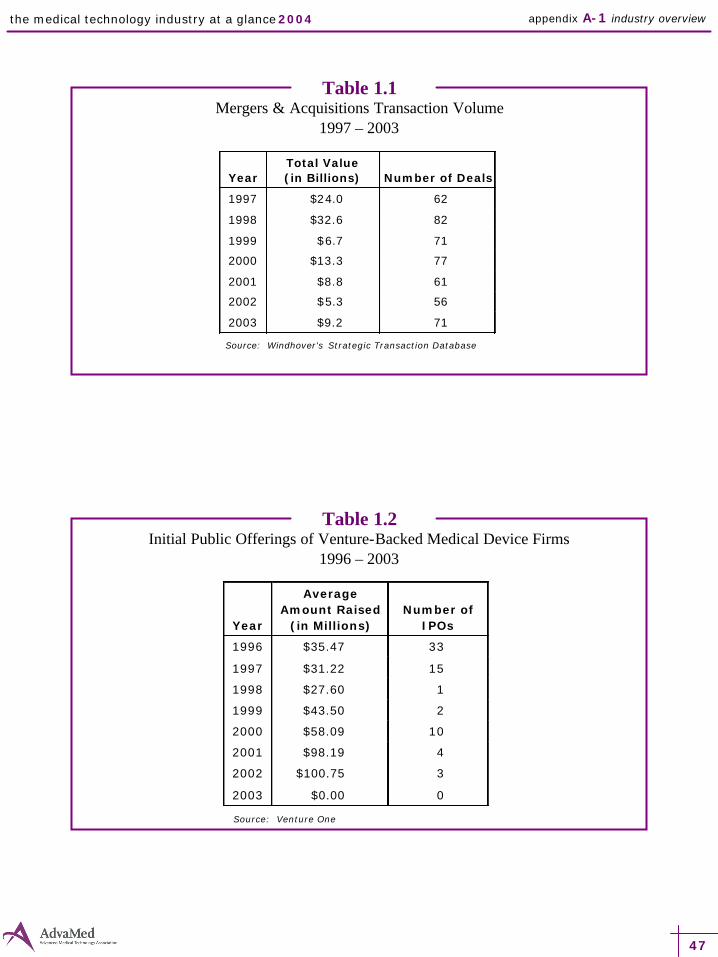
1996 $35.47 33
1997 $31.22 15
1998 $27.60 1
1999 $43.50 2
2000 $58.09 10
2001
2002
2003
$98.19
$100.75
$0.00
4
3
0
Table 1.1Mergers & Acquisitions Transaction Volume
1997 – 2003
Source: Windhover's Strategic Transaction Database
Year
Total Value (in Billions) Number of Deals
1997 $24.0 62
1998 $32.6 82
1999 $6.7 71
2000 $13.3 77
2001 $8.8 61
2002 $5.3 56
2003 $9.2 71
appendix A-1 industry overview
Table 1.2Initial Public Offerings of Venture-Backed Medical Device Firms
1996 – 2003
Source: Venture One

48
the medical technology industry at a glance 2004
Table 1.3Venture Capital Financing in the Medical Device Industry
1992 – 2003
Source: Venture One
appendix A-1 industry overview
Year
Amount Invested
(in Millions)
Number of Financing Rounds
1992 $454.70 124
1993 $432.39 114
1994 $444.09 107
1995 $610.41 129
1996 $592.80 157
1997 $854.85 177
1998 $972.07 170
1999 $1,459.68 213
2000 $2,154.23 222
2001 $1,855.12 194
2002 $1,625.04 163
2003 $1,614.75 168

49
the medical technology industry at a glance 2004
Table 2.1Total U.S. Exports of Medical Device and Diagnostics Industry
1989 – 2003
Source: U.S. International Trade Commission
Year
Total Exports (In Billions)
1989 $5.7
1990 $6.9
1991 $8.2
1992 $9.2
1993 $9.8
1994 $10.7
1995 $12.1
1996 $13.6
1997 $13.7
1998 $14.9
1999 $16.5
2000 $17.4
2001 $19.4
2002 $20.3
2003 $22.5
appendix A-2 the global leader

50
the medical technology industry at a glance 2004
Table 3.1National Institutes of Health Bioengineering Awards
1997 – 2002
appendix A-3 research & development
*Estimated Data
Source: National Institutes of Health
Year
Funding ($ Millions)
Percent of Total NIH Funding
1997 $412.6 4.6%
1998 $501.1 5.1%
1999 $697.5 6.2%
2000 $771.2 5.9%
2001* $692.4 4.6%
2002* $825.9 4.9%

51
the medical technology industry at a glance 2004
Table 4.1Employment Trends of U.S. Medical Device and Diagnostics Industry
1988 – 2001
Source: U.S. Department of Labor, Bureau of Labor Statistics
appendix A-4 economic benefits
Year
Number of Employees
1988 242,802
1989 247,333
1990 253,630
1991 268,457
1992 277,335
1993 282,430
1994 279,569
1995 277,979
1996 283,369
1997 295,360
1998 305,700
1999 297,000
2000 351,722
2001 349,571

52
the medical technology industry at a glance 2004
Table 7.1Percentage Distribution of Inpatient vs. Outpatient Surgeries
1980 – 2001
appendix A-7 patient care
Inpatient Outpatient
Year
Number of Surgeries
(in Thousands) Percentage of Surgeries
Number of Surgeries
(in Thousands) Percentage of Surgeries
1980 15,714 83.7% 3,054 16.3%
1981 15,675 81.5% 3,562 18.5%
1982 15,533 79.3% 4,061 20.7%
1983 15,130 76.2% 4,715 23.8%
1984 14,379 72.2% 5,530 27.8%
1985 13,162 65.4% 6,951 34.6%
1986 12,222 59.7% 8,247 40.3%
1987 11,691 56.2% 9,126 43.8%
1988 11,384 53.2% 10,028 46.8%
1989 10,989 51.5% 10,351 48.5%
1990 10,845 49.5% 11,070 50.5%
1991 10,693 47.7% 11,712 52.3%
1992 10,552 46.2% 12,308 53.8%
1993 10,182 44.6% 12,624 55.4%
1994 9,834 42.8% 13,155 57.2%
1995 9,701 41.9% 13,462 58.1%
1996 9,546 40.5% 14,024 59.5%
1997 9,509 39.3% 14,678 60.7%
1998 9,734 38.4% 15,594 61.6%
1999 9,540 37.6% 15,845 62.4%
2000 9,729 37.3% 16,383 62.7%
2001 9,780 37.0% 16,685 63.0%
Source: American Hospital Association, Trends Affecting Hospitals and Health Systems, 2003

53
the medical technology industry at a glance 2004
Table 7.2Inpatient Hospital Length of Stay by Age Cohort
1970 – 2001
appendix A-7 patient care
Length of Stay (in Days) by Age Cohort
Year All Ages < 15 Yrs 15-44 Yrs 45-64 Yrs > 65 Yrs
1970 7.8 4.7 5.7 9.3 12.6
1975 7.7 4.6 5.7 9.0 11.6
1980 7.3 4.4 5.2 8.2 10.7
1985 6.5 4.6 4.8 7.0 8.7
1990 6.4 4.8 4.6 6.8 8.7
1995 5.4 4.5 3.9 5.5 6.8
2000 4.9 4.5 3.7 5.0 6.0
2001 4.9 4.5 3.7 5.0 5.8
Source: CDC, NCHS, National Hospital Discharge Survey 2001
Table 7.3Number of Total Hip and Total Knee Replacement Procedures (U.S.)
1990 – 2001
Number of Procedures
Year
Total Hip Replacements (in Thousands)
Total Knee Replacements (in Thousands)
1990 119 129
1991 117 160
1992 127 167
1993 125 179
1994 124 209
1995 134 216
1996 138 245
1997 144 259
1998 160 266
1999 168 267
2000 152 299
2001 165 326
Source: CDC, NCHS, National Hospital Discharge Survey, 1990-2001

54
the medical technology industry at a glance 2004
Year
Silicone IOLs (in Thousands)
Other Foldable IOLs
(in Thousands)
PMMA IOLs (in Thousands)
1999 1085 1085 355
2000 1226 1174 208
2001 1057 1400 185
Table 7.4Total Cataract Procedures (U.S.)
1999 – 2001
Source: Health Products Research, Inc.
Table 7.5Number of Pacemaker Implant Procedures
1997 – 2001
Number of Procedures*
Year 37.80 37.81 37.82 37.83 Total
Implants
1997 4,113 19,636 23,012 113,568 160,329
1998 3,011 16,335 22,893 116,100 158,339
1999 3,318 15,460 22,295 126,936 168,009
2000 2,551 15,125 22,027 137,325 177,028 2001 2,272 15,892 22,706 159,952 200,822
Source: The Lewin Group analysis of the Health Care Utilization Project (HCUP), Nationwide Inpatient Sample (NIS), 1997 – 2001.
appendix A-7 patient care
*Pacemaker implant ICD-9-CM codes:37.80 - Insertion of permanent pacemaker, initial or replacement, type of device not
specified;37.81 - Initial insertion of single-chamber device, not specified as rate responsive; 37.82 - Initial insertion of single-chamber device, rate responsive; and37.83 - Initial insertion of dual-chamber device.

55
the medical technology industry at a glance 2004 appendix A-7 patient care
Table 7.6Changes in the Treatment of Heart Attacks
1984 – 1998
Percent of Cases
Year Catheterization
Bypass Surgery
Angioplasty w/o stent
Angioplasty w/stent
1984 11% 5% 2% 1986 20% 7% 3% 1988 28% 9% 7% 1990 35% 11% 10% 1992 43% 14% 14% 1994 48% 16% 18% 0% 1996 52% 16% 12% 5% 1998 53% 15% 6% 15%
Source: Cutler and McClellan, Health Affairs, Sept/Oct 2001
Table 7.7Death Rates for Diseases of the Heart, U.S.,
1950 – 2001
Year
Deaths per 100,000 resident
population
1950 586.8
1960 559.0
1970 492.7
1980 412.1
1990 321.8
1995 293.4
2000 257.6
2001 247.8
Source: CDC, NCHS


58
the medical technology industry at a glance 2004
3130 Fairview Park DriveSuite 800
Falls Church, VA 22042www.lewin.com
Related Documents