DATE -- PERIOD 2'7 Study Guide and lntervention P arent F u nctions and T ransformations Pafent GraphS The parent graph, whicl'r is the g.up\ of the parent_function, is the simplest of the griphs in a family. Each graph in a family of graphs has similar characteristics. ..sffiIdentifythety1reoffunctionrepresentedbyeachgraph. The graph is a diagonal line. The graph The graph is a parabolic curve. The "*pr"runtr an identity function. graph represents a quadratic function. Erercises Identifu the tylre of function repreaented by each graph. 6. o. 4. e oi o ,E o o E o = r ; E o : o c l-- o c o a :: ! s I ; 6 o c .q o I o o -4 \2 lollu 4, 43 _A -2 6) 4x Name Characteristics Parent Function Constant Function Straight horizontal line y = a,whete a is a real number ldentily Function Straight diagonal line Y:x Absolute Value Function Diagonal lines shaped like a V Y=lxl Quadratic Function Curved like a parabola Y:x2 *4 O 2 4t -4 LX Chapter 2 Glencoe Algebra 2

Welcome message from author
This document is posted to help you gain knowledge. Please leave a comment to let me know what you think about it! Share it to your friends and learn new things together.
Transcript

DATE --
PERIOD
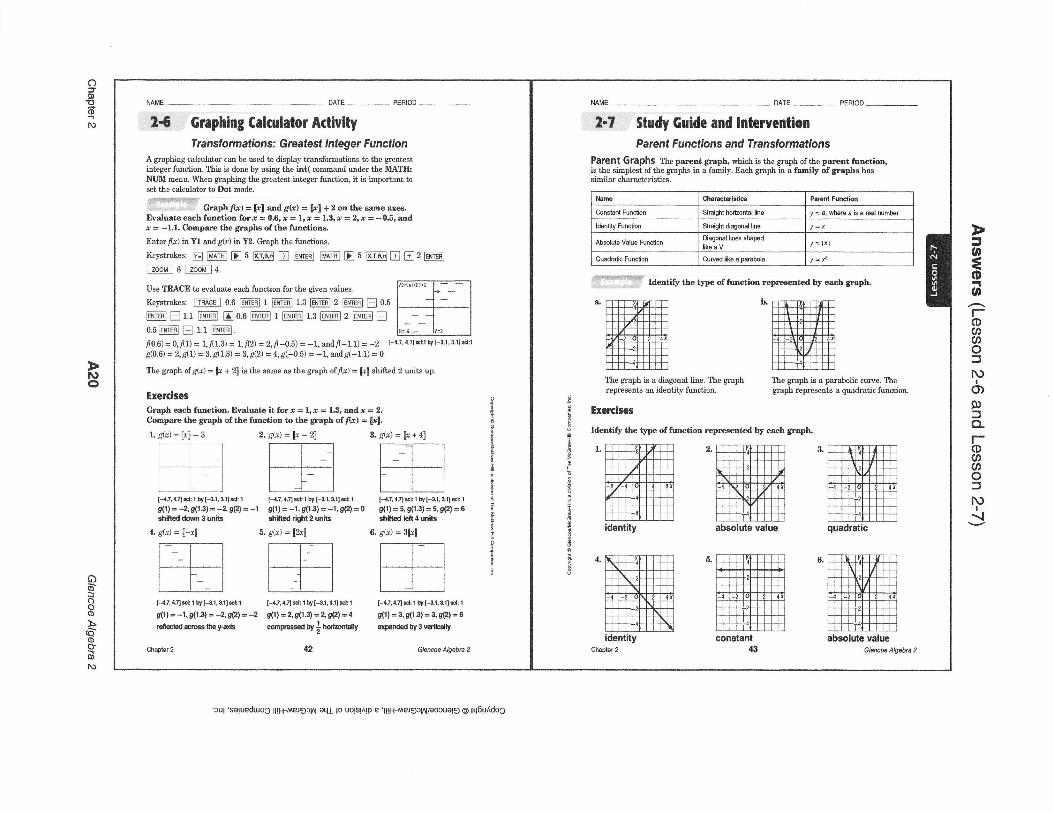
2'7 Study Guide and lnterventionP arent F u nctions and T ransformations
Pafent GraphS The parent graph, whicl'r is the g.up\ of the parent_function,is the simplest of the griphs in a family. Each graph in a family of graphs hassimilar characteristics.
..sffiIdentifythety1reoffunctionrepresentedbyeachgraph.
The graph is a diagonal line. The graph The graph is a parabolic curve. The
"*pr"runtr an identity function. graph represents a quadratic function.
Erercises
Identifu the tylre of function repreaented by each graph.
6.o.4.
eoio,EooEo
=r;Eo:ocl--ocoa::!s
I;6o
c.qoI
oo
-4 \2 lollu 4,
43
_A -2 6) 4x
Name Characteristics Parent Function
Constant Function Straight horizontal line y = a,whete a is a real number
ldentily Function Straight diagonal line Y:x
Absolute Value FunctionDiagonal lines shaped
like a VY=lxl
Quadratic Function Curved like a parabola Y:x2
*4 O 2 4t-4 LX
Chapter 2 Glencoe Algebra 2
DATE
2-T Study Guide and lntervention kontinued.)
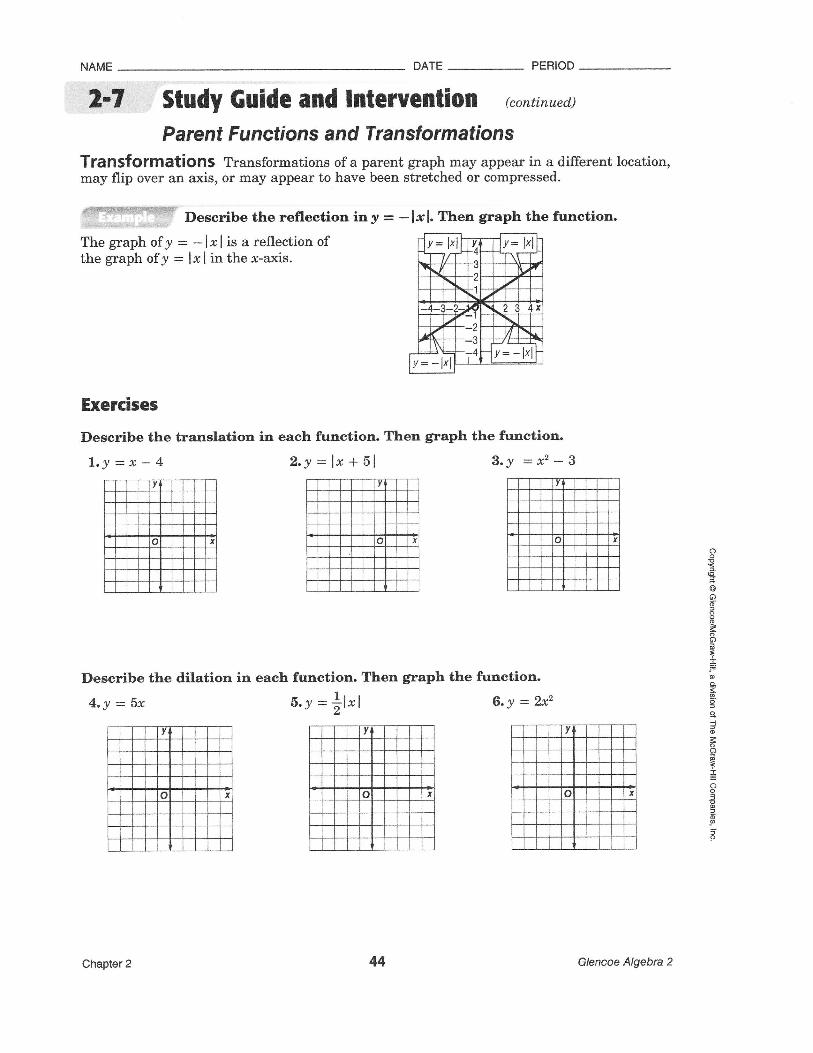
P arent F u nctions and T ransformationsTfanSfofmatiOnS Transformations of a parent graph may appear in a different location,may flip over an axis, or may appear to have been stretched or compressed.
ryDescribethereflectioniny=-|r|.Thengraphthefunction.The graph ofy = *lrlis a reflection ofthe graph ofy - lrlin the r-axis.
1 v = l,lfT'-r-rrr*T' lv= lxl-nr-r2
1
Jlj+y= -l'll
Exercises
Describe the translation in each function. Then graph the function.
2.y: lr + 5l 3.Y =x2-Bl'Y:x-4
Describe the dilation in each function. Then graph the function.
4.y:5x 5. y = lrlxl 6-y : ?*'
oo
16'
oo65ao
odt3Is
Io
oo=Too3e6'lh
Chapter 2 44 Glencoe Algebra 2
NAME DATE
--
PERIOD
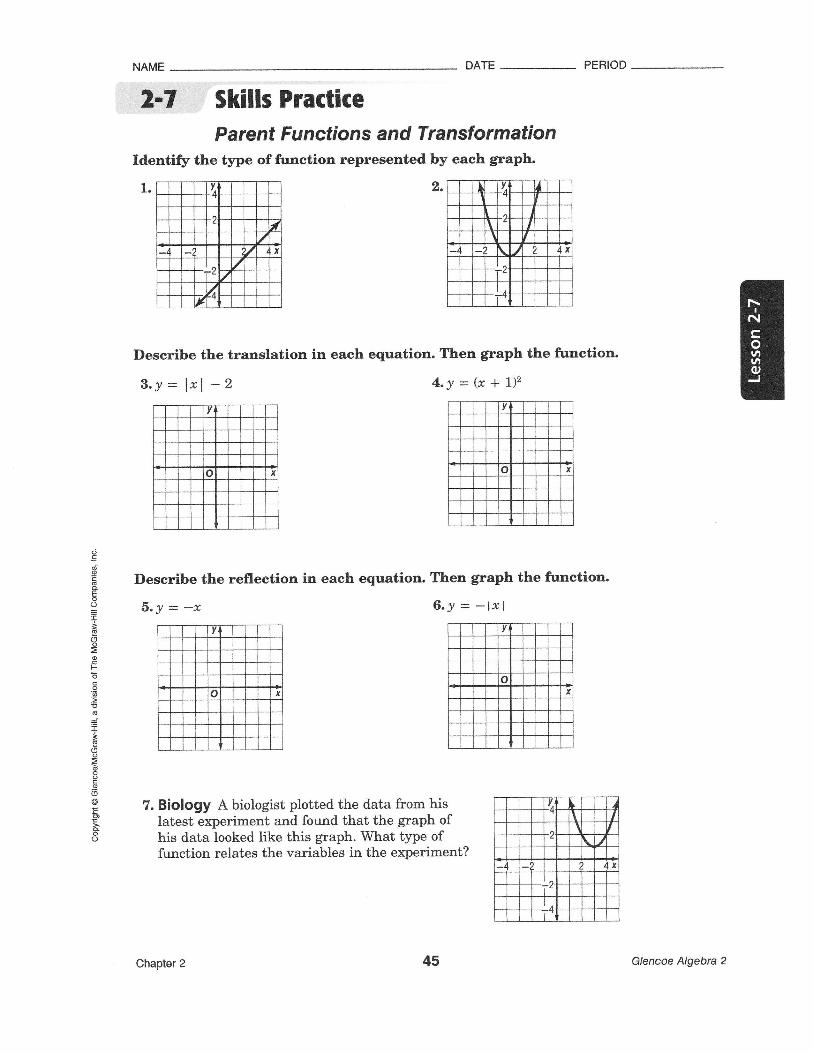
2'7 Skills PracticeP arent F u nctions and T ransformation
Identify the type of function represented by each graph.
-4 -? 2 I 4x
Deseribe the translation in each equation. Then graph the function.
3.y= l*l-2 4.y:(*+1)2
5.Y = -x
7.
5qi.9cdoEoo
;s(5a
ogFoc
'5E6
I*e
bo-o6oo'=oo
Describe the reflection in each equation. Then graph the function.
6.y = -lxl
Biology A biologist plotted the data from hislatest experiment and found that the graph ofhis data looked like this graph.What type offunction relates the variables in the experiment?
Chapter 2 45 Glencoe Algebra 2
NAME DATE
-
PERIOD
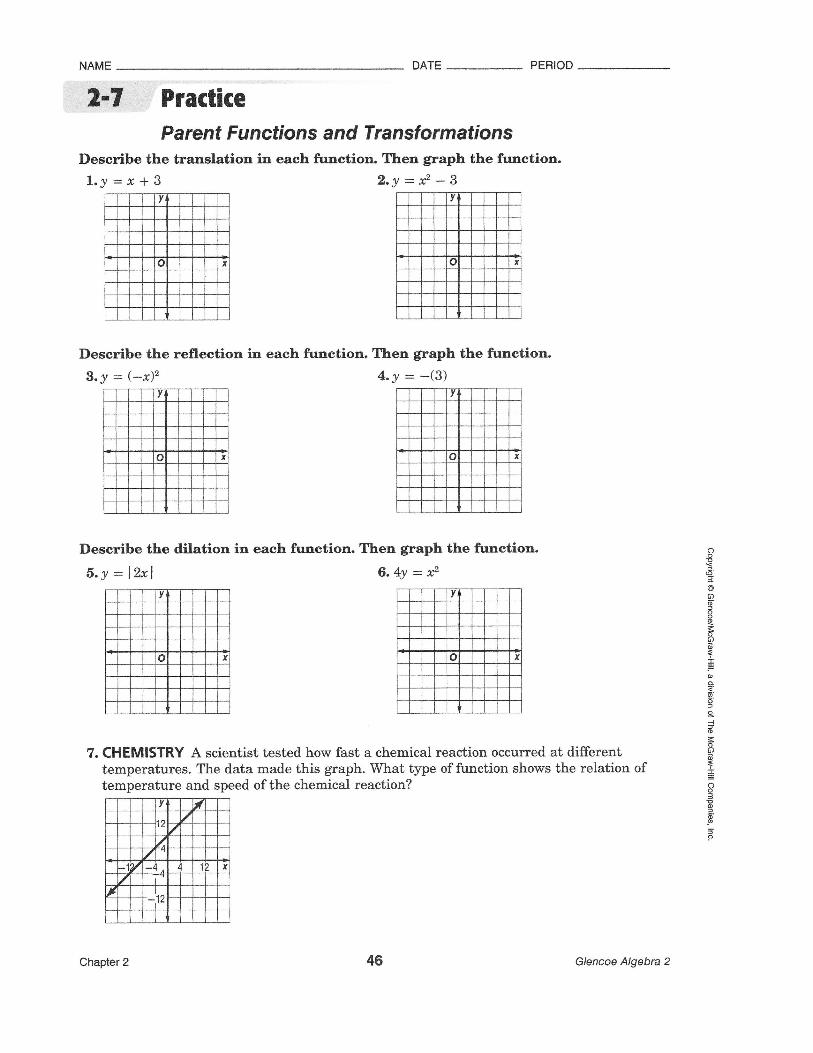
2-T Practice
P arent F u nctions and T ranstormationsDescribe the translation in each funetion. Then graph the function.l.y:r+3 2.y=x2-3
Describe the reflection in each function.Ihen graph the function.3. y : (-x)2 4.y = -(3)
Describe the dilation5. y = lf.xl
in each function. Then graph the function.6.4y : x'
7. CHEMISTRY A scientist tested how fast a chemical reaction occurred at differenttemperatures. The data made this graph. What type of function shows the relation oftemperature and speed of the chemical reaction?
oo
@5@oo-o
6+r;gE:afo-lo
o{I
=ofEP5'p5
-4 4
Chapter 2 46 Glencoe Algebra 2
l-6 Graphing Cakulator AdivityTransformalions.' Greatesl lnteger Function
A graphing calculator cm be used to display transfomations to the greatestinteger function. This is done by using the int( commmd under the MATTI:NUM mmu. ffien graphing the greatest iateger function, it is imporimt toset the calculator to Dot mode.
Graphflr) = [s! andgk) = [rl + 2 on the same areoEvaluate each fuaction forr - 0.0,r = I,x =1,8,r =2,s = -0.6,udr = -1.1. Cmpare the graphs of the function*Enterflr) in Yl mdgk) in Y2. Gmph the functions.
Keystrokes: tr lMATri E 5 Fr$l n mn F,rATHl E 5
ttooii-.] 6l-zoqMl4.
Use TRACD to waiuate each function for the given values.
hrfinEsFNTEnl
Keystrokes: @ 0.6 FER'I 1 lcl'T€n'l 1.3 lFlTER-l 2 Gr\rr€nl E 0.5
llNT€n] E L1 I6TEE B 0.6 linrenl I Fffi-ml 1.9 l*'rrsnl 2 ENTERI E0.SiENrEBl E 1.1 [B{rEn.l.
fl0.6) = 0, fl 1) = t, fl1.3) = I, ffz) = 2,
^-0.5) = -1, md^-1.1) = -2 I
e(0.6) = 2,e(1) = 3,e(7.3) = 3,dzt' = a,e(-0.5) = -1, mde(-1.1) = 0
The graph of 6(r) = [a + 2] is the sme m the graph of flr) = [t] shifted 2 units up.
ErsrclsecGraph each function, Dvalwto it for r = lt r = 1.8, md r = 2.Compm the graph ofthe tunction to the graph offlr) = [rl.1. g(r) = [r] - 3 2. g(r) = [r - 2] 3, g(r) = [r +
DATE
-
PERIOD
-2.7 Study Guide and lntervention
Parent Functions and TranstormatiansPafent GfaphS the pmlt gfapb, which ie the graph of the parent function,is the simplwt of the graphs in a family. Each graph in a fmily of graphs hassimila dlaract€ristics.
'f*4{Twqry ldentify the typ€ of fuaction repruented by each graph,
The graph is a diagonal line. lhe graphrepresents m iilentity fimction.
the graph is a p*abolic we. thegraph represents a quadratic fmction.
ffiEUI++#+#ffiquadratic
ffiffiabsolde value
Glqwe Algcbft
_e
,lL
i
t63
+it
e
Exerisee
Identify the type offuaction
[4r,4.4&+ 1 by[-C1, Ell&t 1 l-L7,4.4rd:1by[{l, $llsl1 [{,7,4.4sdr 1 by [{l, Cll *J:1
stl) = -2,s(l3) = -a s(2) s -1 s(1) = -1, gfl .3) = -1, o(2) = 0 s(l) = s, g(1.3) = s,dz) = 6shifM dom 3 mitt thiied 4lht 2 unlts shitt€d lelt 4 unit3
a. 6(r) = [-r] 6.6(r) = [&] 6. e(e) = 3[sn
t--T-_tIr-tI t_ Il_F I
F_-T--_-ll-tttt-ttl-_tr-F-tI f_-l
lI
I
i
'ffi"m
reprerenfed by each graph.
,. FJilXFFMffiffiabsolute value'mfficonslant
/fil
'mid€ntity'midentity
Chsler 2
t3
;i+II!U'
a
[aZ 4.4!d:1 by[-91,3'lld r 14.7,4,4 *1: t by [4,1, sllld:1
s(0 = -1, g(1.3) = -e s{2) = -2 9(1) = 2, s(t3) * 2, s(2) E 4
Ell€cted dcffi lhe y.db mpcas€d by * hdinidty
t-d7, *4 rd: 1 by l-31, a1l r* t
s(1) = 3, s(1.3) s 3, s(2) = 6
ilpanded by3 wlicdv
Glwa Algebft 2Chaptsr 2
Nme Charel.risli6 Pd6nt FMion
Consbd Fundion Straight horizontal lin€ y = 8, whore a is a rgal nlmbsr
ldenlity Function Straight diagonal line v
Absolul€ Value FunciionDlsgonal lin€s shapgdIike a V
Quad€lic Functon Curydd lik€ a pa€bola
l-1.7, l.7l,cll h t-1.1.3.11 $tl
ont!oN)
=o{o-o
oaao5tut
o)0)Jo-
oaaoJ
NI{
No
o6'ooo!(aoc'ilN
'cut 'salupdtuoC lttH-Mprgctd aql p uolst^lp E '1!H-aaec!\7eocua19 91q61rIdo9

NAME OATE
-_*
PERIOD NAME OATE
-
PEBIOO
-
2-l StudV Guide and lntervention kontinued.)
Parent Functions and Trcnslormations
2-7 Skills Practlce
Parent Functions and Transformation
Transformation9 Tlmfomations of a puent graph may appeu ia a diferent lcation,mav llip wer an uis, or may appeil to bave ben stretched or compremed,
11+::T*T'r' Demribe the reflstim in tThe graph ofy = - lr I is a reflection ofthe graph ofy = lr I in the r-uis.
= -lsl, Then gnph the tunction.
Iinear or identity quadtatic
Desibe the tmalation in emh equation" Then grtph the fuctim.
Erelrlces
Desibe the tf,&nslation in emh function. Then graph the func'tion.
1.y=x-4 2,y=lx+51 3.! =x2-3
translated down 2 units translated left I unit
Desibe the reflection in eeh eqution Then graph the furctim,
translation of thegraphofy=x4 unit6 down
translation ot thegrapholy=;v15 unils left
translation of thegraphofy=t'3 units down
Demibe the dilation in each function. then graph lho ftrnction'
4.Y = 5x a,y =|trt 6'Y =a'
rellected in the x-axis reflected in the x-axis
vertical stretcholY=1
Chapior 2
verlicalcompression vefticalstretcholy=lxl oll=x2
7. Biology A biologist plotteel the tlata from hislatest experiment mil fomd that the graph ofhis data looked like this graph. What Wpe offuction relates the vuiables in the exp€riment?
quadratic
3.r= lrl-2 4.y=(r+lY
6'Y = -x 6,y = -111
Glen@ Abebh 2 Gh'@48€6rc2
Copyright @ Glenco€/Mccraw-Hill, a division ol The McGraw-Hill Companies, lnc.
o=!)roofo
Jo€o.no
ov,aoJ
I\)I{
N
o(D
ooo
(oooilt\)

o50t1toN
N'N
o(D
oo(D
Qoo0r=
N
OATE
-
PERIOD
-
1.7 Pradice
Parent Functions and lransformationsDe*ribe the trmslatioa in ereh function. Tben graph tbe function.
l.y=r+8 2.y=r"-3
2-7 Word Problcm Pndi(eParent Functions and Transformations
1. GAMES Petlro decideil tn measue howclose to a trget he md his frienrls couldthrow a football. They couteal 1 pohtfor each foot away from the tilget thatthe fmtball lmcled.lhe graph of pointsvemu distmm thrown is shown here.What type of finction had Pedrc and hisfriends follwed?
.P'I-TTTTTT_T]" E t-t IlTT-.t l
:ffiH025S75t@
absolute valu€
2,ASTRONOMY 'lhe graph shows thevelocity ofthe space probe Cassini a itpwsed Satum. What typ€ of fuctionbest models Cmsini's velocity?
4. BUSINESS Maria earu m howly wageof $ L0. She drew the followiq graph toshow the relation ofher income m afunction ofthe houm she works. How&d she modi& the idmtity function tocreate her graph?
translated 3 units up translated 3 units down
1S
irmg
I*Ilercribe the refletim in each function. Then graph the function.
a.Y - -(3)flT-fqr-rtrnffitJ -2 lol 2 | IttFI]TTTI]]IH++.H+frreflected in the x axis
0D50rtmrhffiWdld
She stretched it vertically by afactor of 10.
6, HOBBIES Laua lauched a modelrmket into tle air. the heigbt ofherrocket wer time is shown by the graph.
Describe the dilation in each function. Thm graph the ftrnctim6,y =l?al 6,4s =x"
6t 75,w
tB to.uEE ",*I
75
€f";t"-
Gfetched verlically compressed vertically
0 5 10It2025$3t{fim 6csdi)
con$tant
3. GEOMETRY Chen made this graph toshow how the perimeter ofa squaechmges m the lengtl of one side igincerued. lhe original graph showedan identity fuction. Hw hm itben tlilated?
02550?5lOlinc (mn6)
* What type offunstion do6 thegraph show?quadratic
b, In which mis hm tle functionbeen reflected?
x.axis
e, Which directions has the graph beentrmslated? How mmy units?right 25 units andup 8l units
d. What is the equation for the weshown on the graph?
y=-(x-50F+81
7, CHEMISTRY A scientist tegled hw fast a clemical reaction occmed at differenttemperatms. the data made this graph. What type of function shows t&e relation oftemperatue md speecl of the chemical reagtion? l0
Im
identity
Chaplor 2
0l0rI40ti& rc{i$
It has been stretchedvertically by a lactor of 4,
6 Cle@e Algebn 2 elMe Algaba 2
no change
:'a€o.rto
o@ao:JI\)I{
'cul 'saluPdr.rioc ltlH-rr4preq\ aql lo uols!^tp P 'lilH-apr€)cy{/aocuot€l @ lq6!^doc
Related Documents