1 25 th North Sea Flow Measurement Workshop 16-19 October 2007 – Gardermoen, Norway WET GAS PERFORMANCE OF DIFFERENTIAL PRESSURE FLOWMETERS Russell Evans Stephen Ifft Emerson Process Management, Rosemount Division David Hodges TUV NEL Ltd ABSTRACT Wet gas flow measurement is becoming vital to the production of natural gas. New wells with marginal outputs cannot justify gas-liquid separation equipment and must transfer gas which contains some liquid volume. The flow measurement device on each well dictates the allocation earnings and must therefore provide gas flow measurement as accurately as possible. Several types of differential pressure based flowmeters are currently being used in wet gas flow measurement. Differential pressure based flowmeters share many performance characteristics in wet gas applications. However, studies have also found that there can be significant differences in the correlations between meter over-reading and liquid content depending on the type of differential pressure meter being tested. Emerson Process Management conducted a series of wet gas tests on a standard orifice plate, a V-Cone, a Venturi and two Rosemount conditioning orifice plates at TUV NEL Ltd in Scotland. Previously, tests of conditioning orifice plates in wet gas were conducted at the Colorado Engineering Experiment Station, Inc. (CEESI). The work described in this paper is aimed at investigating the similarities and differences in the performance of these meter types in wet gas flows. Comparisons of these data to those from previous studies on the meter types tested are presented. Also, as a result of these studies, a general method for correcting the over-reading of DP-based, wet gas flowmeters using process measurements and the flow computing capabilities of modern multivariable DP transmitters was developed and is presented. NOMENCLATURE A p = pressure coefficient (-) A Vg = gas velocity coefficient (-) A β = beta ratio coefficient (-) g m & = gas mass flow rate (kg/s) l m & = liquid mass flow rate (kg/s) OR = over-reading (-) P = line pressure (bar) U = gas velocity (m/s) X LM = Lockhart Martinelli parameter (-) β = beta ratio (-) ΔP tp = differential pressure of wet gas (bar) ΔP g = differential pressure of dry gas (bar) ρ g = gas density (kg/m 3 ) ρ l = liquid density (kg/m 3 ) WET GAS FLOW For the purposes of this paper, wet gas flow shall be defined as the flow of a two phase mixture of gas and liquid where the Lockhart-Martinelli parameter is less than or equal to 0.3. This follows the de facto standard used in the natural gas industry. The parameter, X LM, is calculated by equation ( 1 ):

Welcome message from author
This document is posted to help you gain knowledge. Please leave a comment to let me know what you think about it! Share it to your friends and learn new things together.
Transcript
1
25th North Sea Flow Measurement Workshop 16-19 October 2007 – Gardermoen, Norway
WET GAS PERFORMANCE OF DIFFERENTIAL PRESSURE FLOWMETERS
Russell Evans Stephen Ifft
Emerson Process Management, Rosemount Division
David Hodges TUV NEL Ltd
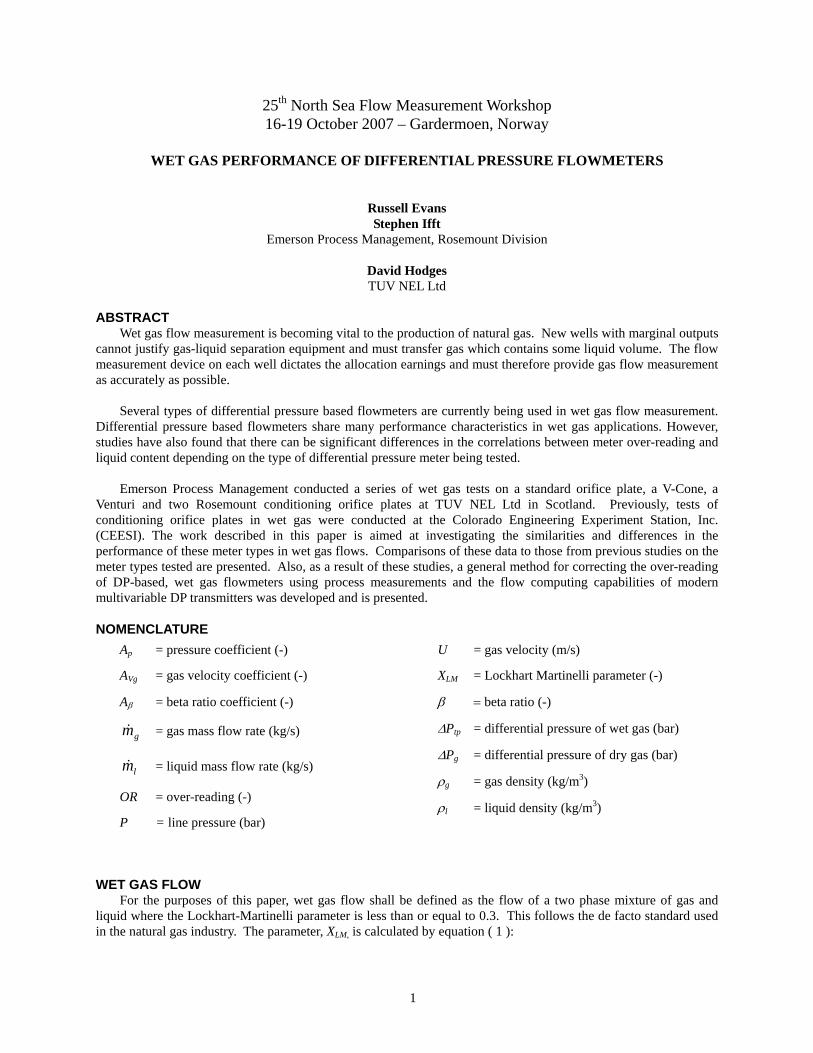
ABSTRACT Wet gas flow measurement is becoming vital to the production of natural gas. New wells with marginal outputs
cannot justify gas-liquid separation equipment and must transfer gas which contains some liquid volume. The flow measurement device on each well dictates the allocation earnings and must therefore provide gas flow measurement as accurately as possible.
Several types of differential pressure based flowmeters are currently being used in wet gas flow measurement.
Differential pressure based flowmeters share many performance characteristics in wet gas applications. However, studies have also found that there can be significant differences in the correlations between meter over-reading and liquid content depending on the type of differential pressure meter being tested.
Emerson Process Management conducted a series of wet gas tests on a standard orifice plate, a V-Cone, a
Venturi and two Rosemount conditioning orifice plates at TUV NEL Ltd in Scotland. Previously, tests of conditioning orifice plates in wet gas were conducted at the Colorado Engineering Experiment Station, Inc. (CEESI). The work described in this paper is aimed at investigating the similarities and differences in the performance of these meter types in wet gas flows. Comparisons of these data to those from previous studies on the meter types tested are presented. Also, as a result of these studies, a general method for correcting the over-reading of DP-based, wet gas flowmeters using process measurements and the flow computing capabilities of modern multivariable DP transmitters was developed and is presented.
NOMENCLATURE Ap = pressure coefficient (-)
AVg = gas velocity coefficient (-)
Aβ = beta ratio coefficient (-)
gm& = gas mass flow rate (kg/s)
lm& = liquid mass flow rate (kg/s)
OR = over-reading (-)
P = line pressure (bar)
U = gas velocity (m/s)
XLM = Lockhart Martinelli parameter (-)
β = beta ratio (-)
ΔPtp = differential pressure of wet gas (bar)
ΔPg = differential pressure of dry gas (bar)
ρg = gas density (kg/m3)
ρl = liquid density (kg/m3)
WET GAS FLOW For the purposes of this paper, wet gas flow shall be defined as the flow of a two phase mixture of gas and
liquid where the Lockhart-Martinelli parameter is less than or equal to 0.3. This follows the de facto standard used in the natural gas industry. The parameter, XLM, is calculated by equation ( 1 ):
2
l
g
g
lLM m
mXρρ
&
&= ( 1 )
All the testing reviewed in this paper was conducted using a single homogeneous liquid. Real world
applications can include a mixture of liquids that make up the liquid phase of wet gas, such as a combination of water, compressor oil, and hydrocarbon liquids. This paper and the conclusions drawn will relate to wet gas flow with a single liquid component.
DIFFERENTIAL PRESSURE FLOWMETERS Single phase differential pressure (DP) flowmeters are the most common type of meters for the measurement of
wet gas. These meters are either stand-alone measurement points or as the primary element of a wet gas/multi-phase flow measurement system. The most common types of DP meters used are the standard orifice plate and Venturi, the McCrometer V-Cone and the Rosemount conditioning orifice plate.
This paper will focus on the use of DP meters as stand alone wet gas flow measurement points. DP meters tested in wet gas flow have shown a characteristic over-reading which is proportional to the Lockhart-Martinelli parameter (or other estimations of liquid loading). As the Lockhart-Martinelli parameter increases, the differential pressure created by the primary element will over-read by as much as 50%.
Each DP meter has a slightly different response to the introduction of liquid during wet gas testing, though all will over read, with the exception of orifice plates at very small values of the Lockhart-Martinelli parameter.
TESTING CRITERIA
CEESI Criteria Initial wet gas testing on four conditioning orifice plates was completed at the Colorado Engineering
Experiment Station, Inc. (CEESI) in Nunn, Colorado during 2004. The purpose of these tests was to confirm the performance of the four hole conditioning orifice plates in wet gas applications. In homogeneous fluid applications, whether liquid or dry gas, the conditioning plates performed in a similar way to traditional orifice plates with the same beta ratio, with respect to their values of discharge coefficient, gas expansion factor, permanent pressure loss and accuracy.
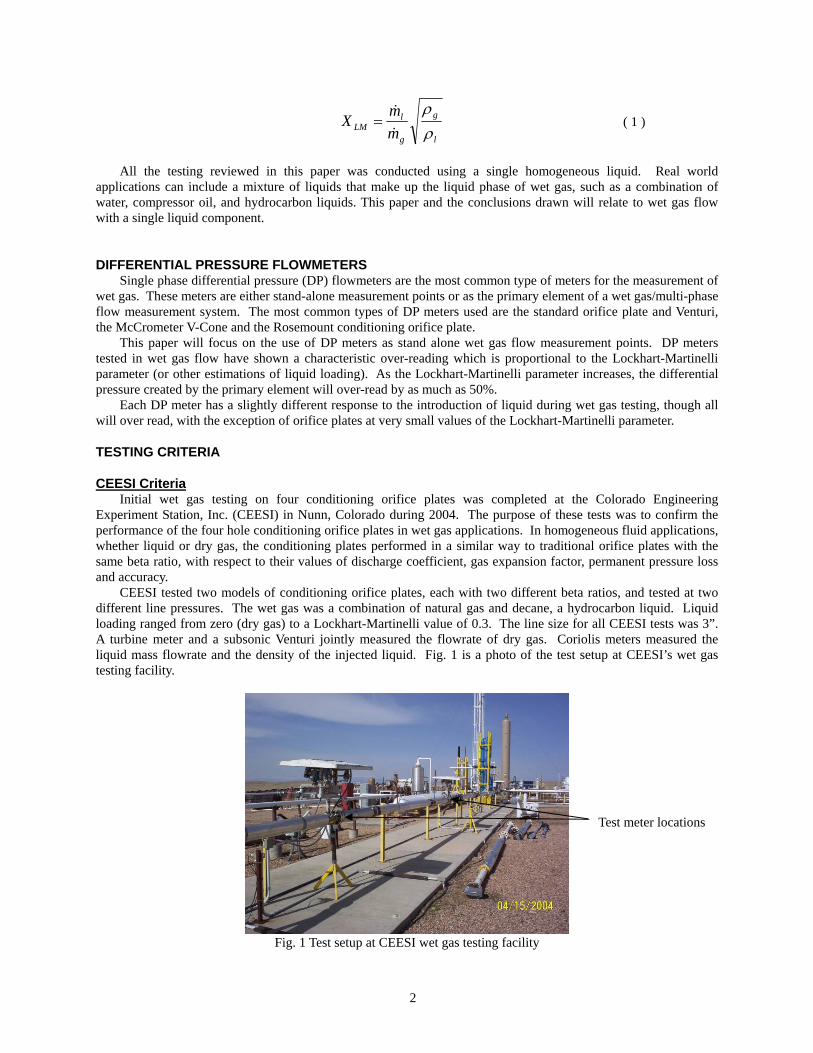
CEESI tested two models of conditioning orifice plates, each with two different beta ratios, and tested at two different line pressures. The wet gas was a combination of natural gas and decane, a hydrocarbon liquid. Liquid loading ranged from zero (dry gas) to a Lockhart-Martinelli value of 0.3. The line size for all CEESI tests was 3”. A turbine meter and a subsonic Venturi jointly measured the flowrate of dry gas. Coriolis meters measured the liquid mass flowrate and the density of the injected liquid. Fig. 1 is a photo of the test setup at CEESI’s wet gas testing facility.
Fig. 1 Test setup at CEESI wet gas testing facility
Test meter locations

3
The Rosemount conditioning orifice plate is a proprietary design of Emerson Process Management. The two
models tested were the Rosemount 1595 and 405C. The 1595 is a paddle-type orifice plate (see Fig. 2). The paddle-style plate requires flanges taps in the mating flanges. The flange taps are located 1 inch (25.4 mm) from both the upstream and downstream faces of the plate.
The 405C is a compact orifice design, see Fig. 3. Compact orifice meters include corner taps in the body of the meter as well as a mounting head with isolation and equalization valves. Orifice corner taps are located at the upstream and downstream faces of the plate. The compact meters can be installed between standard ASME and DIN flanges.
Fig. 2
Fig. 3
Rosemount model 1595 Rosemount model 405C The beta ratios tested were 0.40 and 0.65. Conditioning orifice plates have equivalent beta ratios to standard
orifice plates in terms of open area. Low and high line pressures were 200 and 700 psi (14 and 48 bar) respectively. The use of two line pressures illustrated any performance changes due to changing gas density.
TUV NEL Criteria Testing with wet gas was continued and extended at TUV NEL Ltd in Glasgow, Scotland. This test series was
expanded to include other DP technologies. The following meters were tested at TUV NEL in 2005:
1. 4 inch ISO 5167 orifice plate with 0.65 β, see Fig. 4. 2. 4 inch Rosemount model 405C with 0.65 β, see Fig. 3. 3. 4 inch classical Venturi with 0.75 β, see Fig. 5. 4. 4 inch McCrometer V-Cone with 0.75 β, see Fig. 6.
The Venturi tested was provided by TUV NEL from their laboratory supply of differential pressure primary
elements and was of standard design with a 21º convergent section. The V-Cone is a proprietary device of McCrometer, Inc. The V-Cone creates differential pressure with a cone
located in the center of the pipe. The high pressure measurement is taken upstream of the cone at the pipe wall, while the low pressure measurement is taken through the center of the cone, with the port facing downstream.
Fig. 4
Fig. 5
Fig. 6
ISO 5167 Orifice Plate Classical Venturi
McCrometer V-Cone

4
DP elements are commonly used in wet gas applications, with the above elements the most widely used. This study was intended not only to expand the data available on the wet gas performance of the conditioning orifice plate, but also as a wider study of DP flow elements in wet gas. The goal was to find a common thread among DP devices which would more accurately correlate flow measurement in wet gas conditions.
TUV NEL tested all the above DP elements under similar conditions for direct comparison of results. The test gas was nitrogen. The test liquid was a kerosene substitute, trade name EXXSOL D80. The Lockhart-Martinelli parameter value ranged from 0 to 0.3. Two pressures were tested at 215 and 870 psi (15 and 60 bar). Fig. 7 is a photo of the test setup at TUV NEL’s wet gas test facility.
Fig. 7 Test setup at TUV NEL wet gas testing facility
TEST RESULTS The response of a differential pressure flow element tested in wet gas is typically graphed as the over-reading
vs. the Lockhart-Martinelli parameter value. The over-reading increases as the XLM value increases. The over-reading is calculated by equation ( 2 ).
g
tp
PP
ORΔ
Δ≅ ( 2 )
To correct for this type of offset, the user of a wet gas DP flow element would determine the Lockhart-
Martinelli parameter value, look at the response of the element at that liquid load (i.e. the over-reading), and decrease his flow reading accordingly. Thus the user will obtain an estimate of the actual gas flowrate by correcting for the known quantity of liquid flowing in the pipe.
Test meter location
5
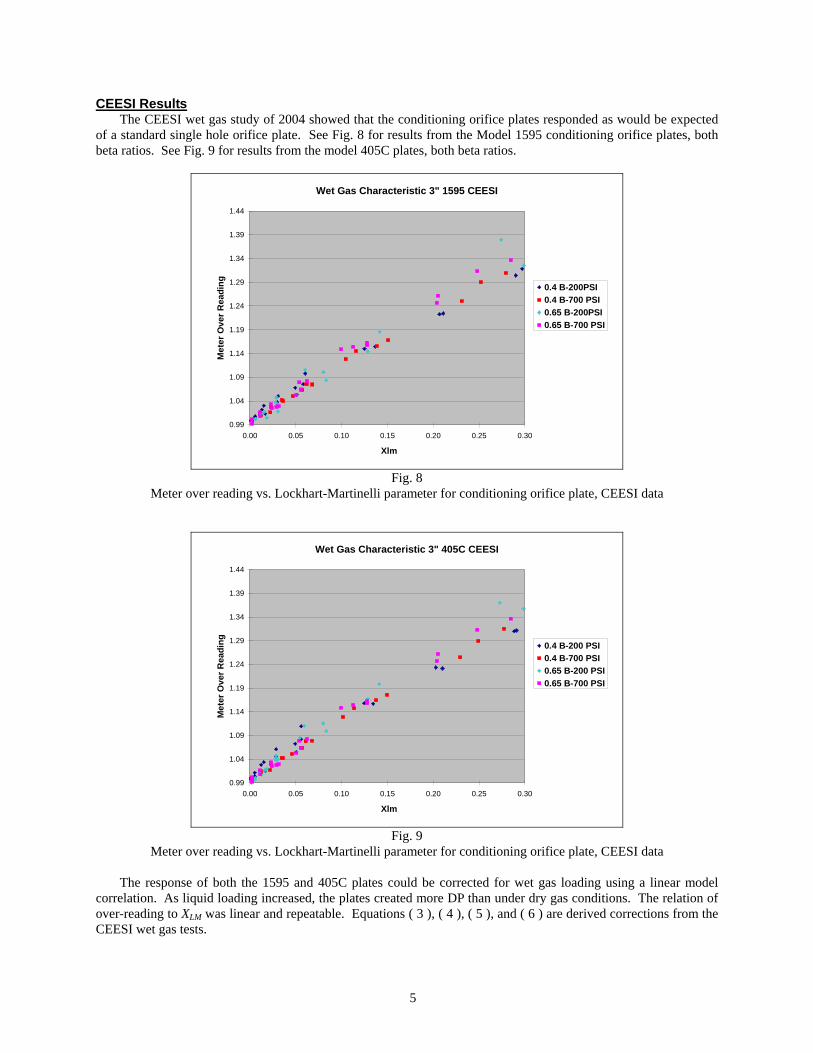
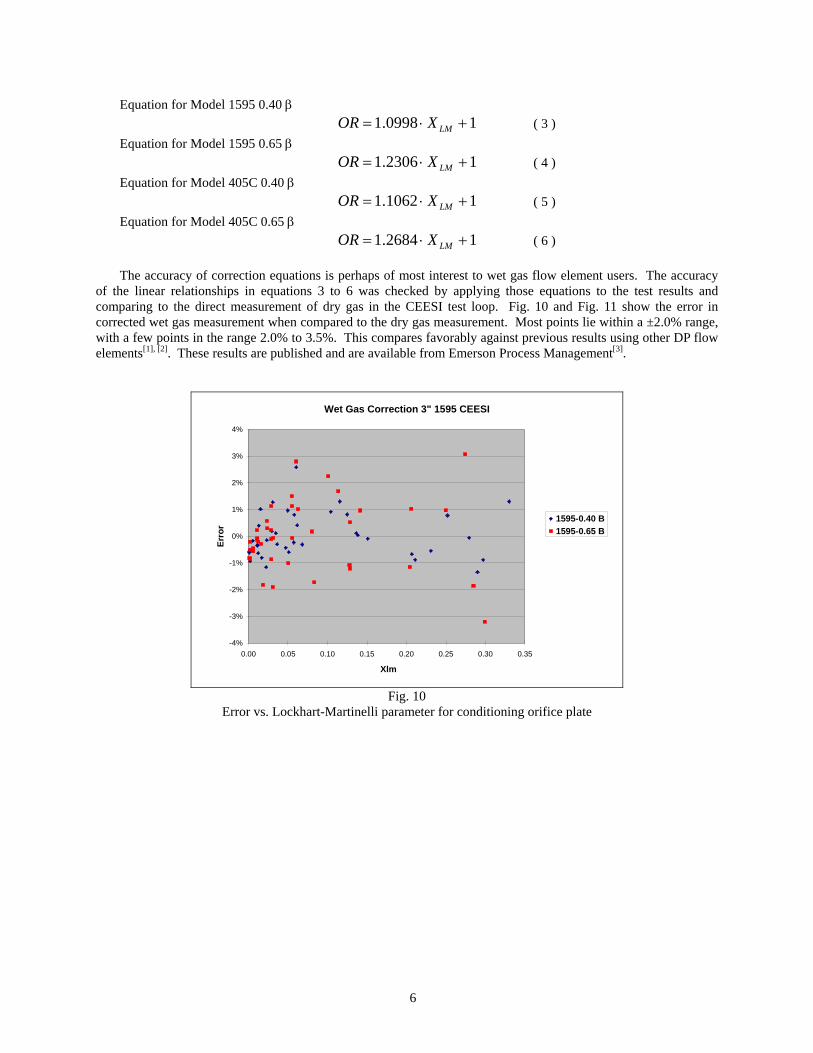
CEESI Results The CEESI wet gas study of 2004 showed that the conditioning orifice plates responded as would be expected
of a standard single hole orifice plate. See Fig. 8 for results from the Model 1595 conditioning orifice plates, both beta ratios. See Fig. 9 for results from the model 405C plates, both beta ratios.
Wet Gas Characteristic 3" 1595 CEESI
0.99
1.04
1.09
1.14
1.19
1.24
1.29
1.34
1.39
1.44
0.00 0.05 0.10 0.15 0.20 0.25 0.30
Xlm
Met
er O
ver R
eadi
ng 0.4 B-200PSI0.4 B-700 PSI0.65 B-200PSI0.65 B-700 PSI
Fig. 8
Meter over reading vs. Lockhart-Martinelli parameter for conditioning orifice plate, CEESI data
Wet Gas Characteristic 3" 405C CEESI
0.99
1.04
1.09
1.14
1.19
1.24
1.29
1.34
1.39
1.44
0.00 0.05 0.10 0.15 0.20 0.25 0.30
Xlm
Met
er O
ver R
eadi
ng 0.4 B-200 PSI0.4 B-700 PSI0.65 B-200 PSI0.65 B-700 PSI
Fig. 9
Meter over reading vs. Lockhart-Martinelli parameter for conditioning orifice plate, CEESI data
The response of both the 1595 and 405C plates could be corrected for wet gas loading using a linear model correlation. As liquid loading increased, the plates created more DP than under dry gas conditions. The relation of over-reading to XLM was linear and repeatable. Equations ( 3 ), ( 4 ), ( 5 ), and ( 6 ) are derived corrections from the CEESI wet gas tests.
6
Equation for Model 1595 0.40 β 10998.1 +⋅= LMXOR ( 3 )
Equation for Model 1595 0.65 β 12306.1 +⋅= LMXOR ( 4 )
Equation for Model 405C 0.40 β 11062.1 +⋅= LMXOR ( 5 )
Equation for Model 405C 0.65 β 12684.1 +⋅= LMXOR ( 6 )
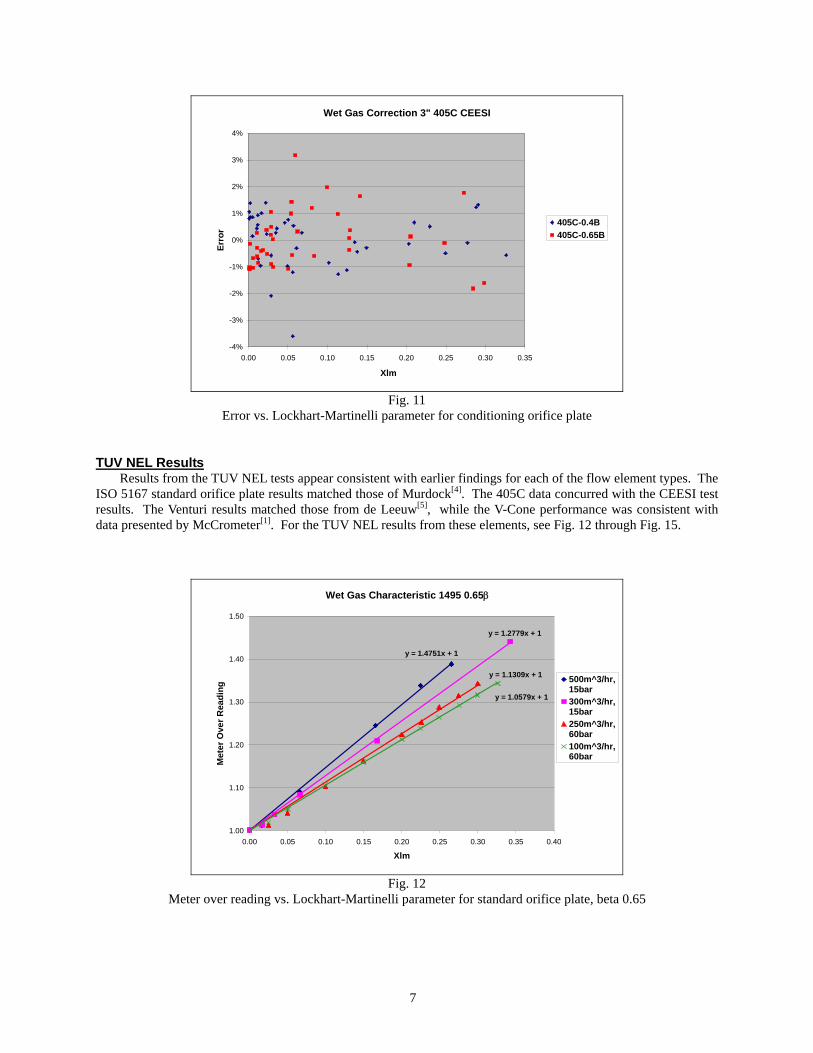
The accuracy of correction equations is perhaps of most interest to wet gas flow element users. The accuracy
of the linear relationships in equations 3 to 6 was checked by applying those equations to the test results and comparing to the direct measurement of dry gas in the CEESI test loop. Fig. 10 and Fig. 11 show the error in corrected wet gas measurement when compared to the dry gas measurement. Most points lie within a ±2.0% range, with a few points in the range 2.0% to 3.5%. This compares favorably against previous results using other DP flow elements[1], [2]. These results are published and are available from Emerson Process Management[3].
Wet Gas Correction 3" 1595 CEESI
-4%
-3%
-2%
-1%
0%
1%
2%
3%
4%
0.00 0.05 0.10 0.15 0.20 0.25 0.30 0.35
Xlm
Erro
r
1595-0.40 B1595-0.65 B
Fig. 10
Error vs. Lockhart-Martinelli parameter for conditioning orifice plate
7
Wet Gas Correction 3" 405C CEESI
-4%
-3%
-2%
-1%
0%
1%
2%
3%
4%
0.00 0.05 0.10 0.15 0.20 0.25 0.30 0.35
Xlm
Erro
r405C-0.4B405C-0.65B
Fig. 11
Error vs. Lockhart-Martinelli parameter for conditioning orifice plate
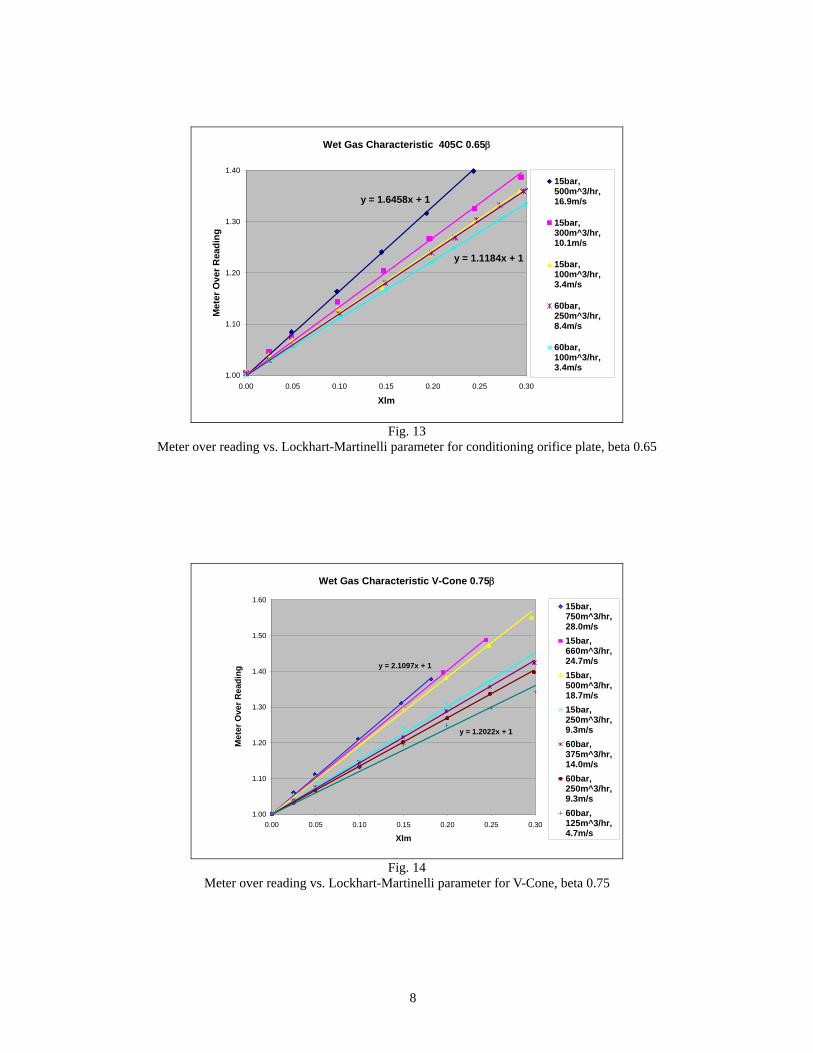
TUV NEL Results Results from the TUV NEL tests appear consistent with earlier findings for each of the flow element types. The
ISO 5167 standard orifice plate results matched those of Murdock[4]. The 405C data concurred with the CEESI test results. The Venturi results matched those from de Leeuw[5], while the V-Cone performance was consistent with data presented by McCrometer[1]. For the TUV NEL results from these elements, see Fig. 12 through Fig. 15.
Wet Gas Characteristic 1495 0.65β
y = 1.4751x + 1
y = 1.2779x + 1
y = 1.1309x + 1
y = 1.0579x + 1
1.00
1.10
1.20
1.30
1.40
1.50
0.00 0.05 0.10 0.15 0.20 0.25 0.30 0.35 0.40
Xlm
Met
er O
ver R
eadi
ng
500m^3/hr,15bar300m^3/hr,15bar250m^3/hr,60bar100m^3/hr,60bar
Fig. 12
Meter over reading vs. Lockhart-Martinelli parameter for standard orifice plate, beta 0.65
8
Wet Gas Characteristic 405C 0.65β
y = 1.6458x + 1
y = 1.1184x + 1
1.00
1.10
1.20
1.30
1.40
0.00 0.05 0.10 0.15 0.20 0.25 0.30
Xlm
Met
er O
ver R
eadi
ng
15bar,500m^3/hr,16.9m/s
15bar,300m^3/hr,10.1m/s
15bar,100m^3/hr,3.4m/s
60bar,250m^3/hr,8.4m/s
60bar,100m^3/hr,3.4m/s
Fig. 13
Meter over reading vs. Lockhart-Martinelli parameter for conditioning orifice plate, beta 0.65
Wet Gas Characteristic V-Cone 0.75β
y = 2.1097x + 1
y = 1.2022x + 1
1.00
1.10
1.20
1.30
1.40
1.50
1.60
0.00 0.05 0.10 0.15 0.20 0.25 0.30
Xlm
Met
er O
ver R
eadi
ng
15bar,750m^3/hr,28.0m/s15bar,660m^3/hr,24.7m/s15bar,500m^3/hr,18.7m/s15bar,250m^3/hr,9.3m/s60bar,375m^3/hr,14.0m/s60bar,250m^3/hr,9.3m/s60bar,125m^3/hr,4.7m/s
Fig. 14
Meter over reading vs. Lockhart-Martinelli parameter for V-Cone, beta 0.75

9
Wet Gas Characteristic Venturi 0.75β
1.00
1.10
1.20
1.30
1.40
1.50
0.00 0.05 0.10 0.15 0.20 0.25 0.30
Xlm
Met
er O
ver R
eadi
ng
60bar,425m^3/hr,14.4m/s
60bar,285m^3/hr,9.6m/s
60bar,143m^3/hr,4.8m/s
60bar,100m^3/hr,3.4m/s
60bar,250m^3/hr,8.4m/s
Fig. 15
Meter over reading vs. Lockhart-Martinelli parameter for venturi, beta 0.75
A closer examination of the data, however, showed characteristics not explored in the earlier study. With flow elements that have a linear over-reading response to XLM, there was a correlation with certain test parameters. For instance, if gas velocity is isolated in the data, there is a relationship between the slope of the OR vs. XLM curve and the gas velocity. In other words, the characteristic wet gas correction curve for DP meters is affected by gas velocity. This relationship is shown in Fig. 16 for tests on the 405C flow element.
Effect of Gas Velocity on OR
1.00
1.10
1.20
1.30
1.40
1.50
1.60
1.70
0 2 4 6 8 10 12 14 16 18
Gas Velocity (m/s)
Slop
e of
OR
vs.
LM
15bar / 0.65beta60bar / 0.65beta60bar / 0.40beta
Fig. 16
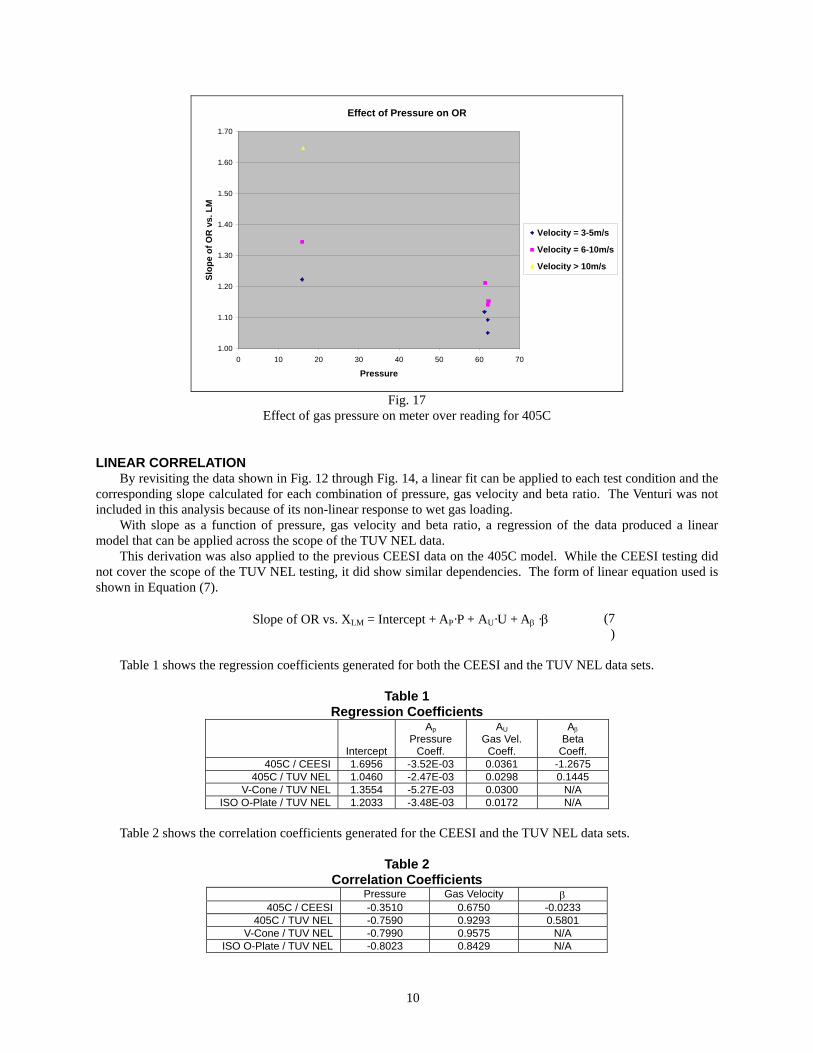
Effect of gas velocity on meter over reading for 405C A similar effect was also found to exist in relation to pressure (i.e. gas density or gas-liquid density ratio). As
shown in Fig. 17, there is an inverse relationship between pressure and the slope of the OR vs. XLM curve.
10
Effect of Pressure on OR
1.00
1.10
1.20
1.30
1.40
1.50
1.60
1.70
0 10 20 30 40 50 60 70
Pressure
Slop
e of
OR
vs.
LM
Velocity = 3-5m/s
Velocity = 6-10m/s
Velocity > 10m/s
Fig. 17
Effect of gas pressure on meter over reading for 405C
LINEAR CORRELATION By revisiting the data shown in Fig. 12 through Fig. 14, a linear fit can be applied to each test condition and the
corresponding slope calculated for each combination of pressure, gas velocity and beta ratio. The Venturi was not included in this analysis because of its non-linear response to wet gas loading.
With slope as a function of pressure, gas velocity and beta ratio, a regression of the data produced a linear model that can be applied across the scope of the TUV NEL data.
This derivation was also applied to the previous CEESI data on the 405C model. While the CEESI testing did not cover the scope of the TUV NEL testing, it did show similar dependencies. The form of linear equation used is shown in Equation (7).
Slope of OR vs. XLM = Intercept + AP·P + AU·U + Aβ ·β (7
) Table 1 shows the regression coefficients generated for both the CEESI and the TUV NEL data sets.
Table 1 Regression Coefficients
Intercept
Ap Pressure
Coeff.
AU Gas Vel.
Coeff.
Aβ Beta
Coeff. 405C / CEESI 1.6956 -3.52E-03 0.0361 -1.2675
405C / TUV NEL 1.0460 -2.47E-03 0.0298 0.1445 V-Cone / TUV NEL 1.3554 -5.27E-03 0.0300 N/A
ISO O-Plate / TUV NEL 1.2033 -3.48E-03 0.0172 N/A
Table 2 shows the correlation coefficients generated for the CEESI and the TUV NEL data sets.
Table 2 Correlation Coefficients
Pressure Gas Velocity β 405C / CEESI -0.3510 0.6750 -0.0233
405C / TUV NEL -0.7590 0.9293 0.5801 V-Cone / TUV NEL -0.7990 0.9575 N/A
ISO O-Plate / TUV NEL -0.8023 0.8429 N/A
11
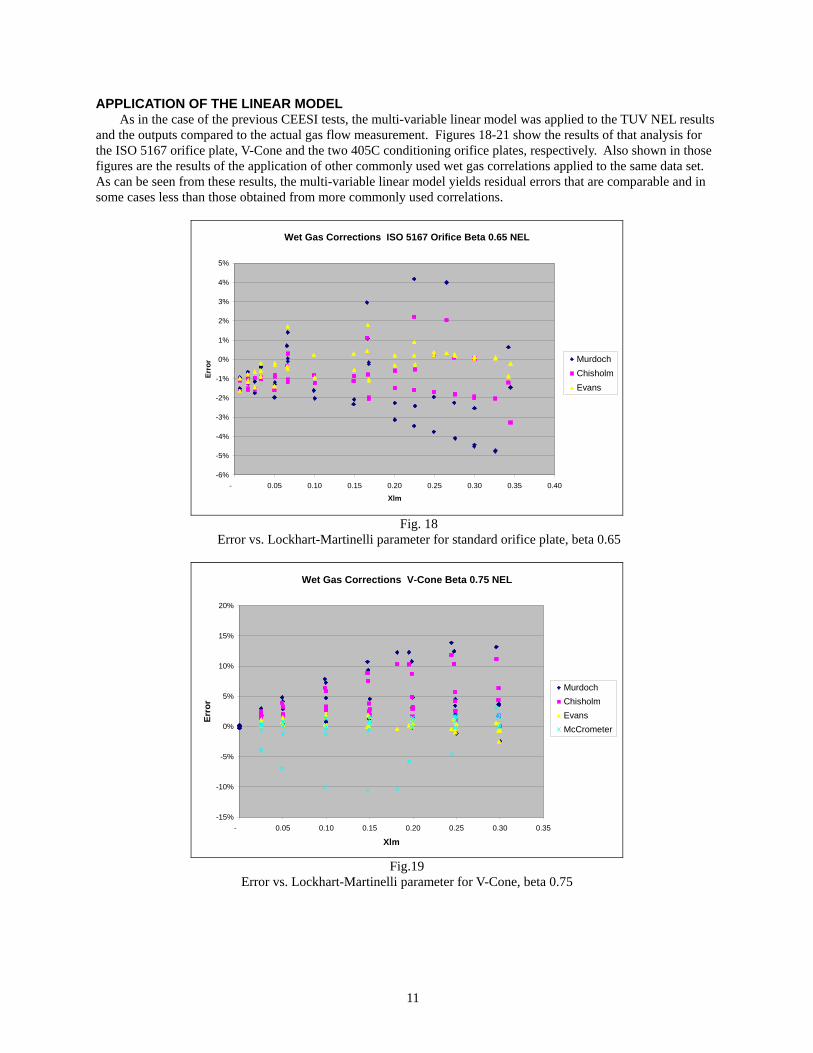
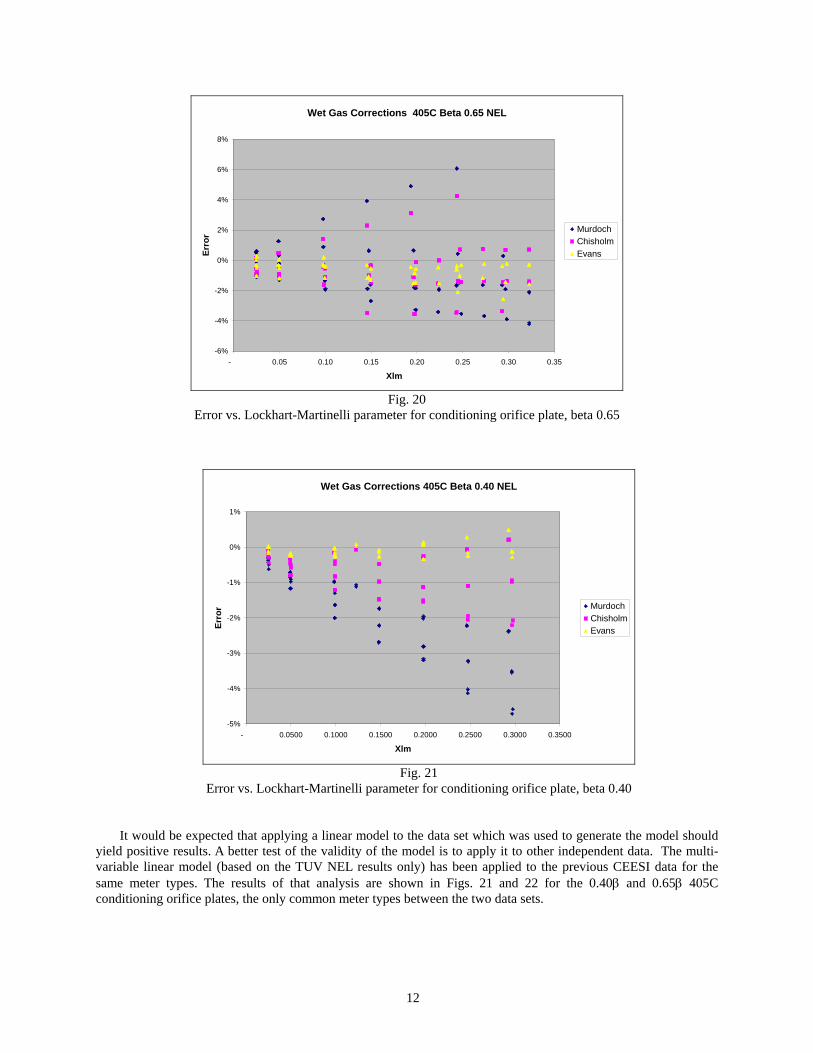
APPLICATION OF THE LINEAR MODEL As in the case of the previous CEESI tests, the multi-variable linear model was applied to the TUV NEL results
and the outputs compared to the actual gas flow measurement. Figures 18-21 show the results of that analysis for the ISO 5167 orifice plate, V-Cone and the two 405C conditioning orifice plates, respectively. Also shown in those figures are the results of the application of other commonly used wet gas correlations applied to the same data set. As can be seen from these results, the multi-variable linear model yields residual errors that are comparable and in some cases less than those obtained from more commonly used correlations.
Wet Gas Corrections ISO 5167 Orifice Beta 0.65 NEL
-6%
-5%
-4%
-3%
-2%
-1%
0%
1%
2%
3%
4%
5%
- 0.05 0.10 0.15 0.20 0.25 0.30 0.35 0.40
Xlm
Erro
r MurdochChisholmEvans
Fig. 18
Error vs. Lockhart-Martinelli parameter for standard orifice plate, beta 0.65
Wet Gas Corrections V-Cone Beta 0.75 NEL
-15%
-10%
-5%
0%
5%
10%
15%
20%
- 0.05 0.10 0.15 0.20 0.25 0.30 0.35
Xlm
Erro
r
MurdochChisholmEvansMcCrometer
Fig.19
Error vs. Lockhart-Martinelli parameter for V-Cone, beta 0.75
12
Wet Gas Corrections 405C Beta 0.65 NEL
-6%
-4%
-2%
0%
2%
4%
6%
8%
- 0.05 0.10 0.15 0.20 0.25 0.30 0.35
Xlm
Erro
r MurdochChisholmEvans
Fig. 20
Error vs. Lockhart-Martinelli parameter for conditioning orifice plate, beta 0.65
Wet Gas Corrections 405C Beta 0.40 NEL
-5%
-4%
-3%
-2%
-1%
0%
1%
- 0.0500 0.1000 0.1500 0.2000 0.2500 0.3000 0.3500
Xlm
Erro
r MurdochChisholmEvans
Fig. 21
Error vs. Lockhart-Martinelli parameter for conditioning orifice plate, beta 0.40
It would be expected that applying a linear model to the data set which was used to generate the model should
yield positive results. A better test of the validity of the model is to apply it to other independent data. The multi-variable linear model (based on the TUV NEL results only) has been applied to the previous CEESI data for the same meter types. The results of that analysis are shown in Figs. 21 and 22 for the 0.40β and 0.65β 405C conditioning orifice plates, the only common meter types between the two data sets.

13
Wet Gas Corrections 405C Beta 0.40 CEESI
-8.0%
-6.0%
-4.0%
-2.0%
0.0%
2.0%
4.0%
6.0%
- 0.0500 0.1000 0.1500 0.2000 0.2500 0.3000 0.3500
Xlm
Erro
r MurdochChisholmEvans
Fig. 22
Error vs. Lockhart-Martinelli parameter for conditioning orifice plate, beta 0.40 This data shows the TUV NEL correction to the previous CEESI data set.
Wet Gas Corrections 405C Beta 0.65 CEESI
-6.0%
-4.0%
-2.0%
0.0%
2.0%
4.0%
6.0%
- 0.0500 0.1000 0.1500 0.2000 0.2500 0.3000 0.3500
Xlm
Erro
r MurdochChisholmEvans
Fig. 23
Error vs. Lockhart-Martinelli parameter for conditioning orifice plate, beta 0.65 This data shows the TUV NEL correction to the previous CEESI data set.
When applied to the independent CEESI data, the multi-variable linear model can be seen to yield corrections that are again comparable to that obtained by more traditional correlations.
RESULTS DISCUSSION and CONCLUSIONS
These results have significant implications when it is considered that the independent variables in the model are values that are already available in modern multi-variable flow transmitters. The process pressure is typically a measured value and the gas velocity is calculated from the standard flow computation in the multi-variable
14
transmitter. Using these values and a compact, simple iterative process, the proper wet gas correction curve can be determined and applied. This presents the possibility that once the correct linear model coefficients for a particular primary element type are determined, the wet gas correction can be made entirely within the field mounted instrument.
Results obtained from the CEESI and the TUV NEL test fluids are comparable when using the multi-variable linear correlation approach. This is a small sample data set but confirms the validity of the correlation method between flow labs and across different test fluids. While the coefficients listed in Table 2 are not intended as definitive for any of the technologies tested, the success of the method on this limited data set is encouraging and suggests that it may be a viable correlation strategy for wet gas measurement. Further work in this area is planned through additional tests and by analysis of the results of other available data sets with this method.
REFERENCES [1] Steven, R., and Peters, R., 2004, “Wet Gas Metering with V-Cone Meters”, 3rd International SE Asia
Hydrocarbon Flow Measurement Workshop. [2] Steven, R., 2006, “Wet Gas Flow Metering with Gas Meter Technologies”, Ciateq 2006. [3] White Paper, “Rosemount Conditioning Orifice Plate in Wet Gas”, www.rosemount.com. [4] Murdock, J.W., “Two-Phase Flow Measurement with Orifices”, Journal of Basic Engineering, 1962, Vol.
84, pp. 419-433. [5] de Leeuw, R., “Liquid Correction of Venturi Meter Readings in Wet Gas Flow”, North Sea Flow
Measurement Workshop, 1997.
Related Documents