1 Paper 231-2012 Solve the SAS ® ODS Data Trap in PROC MEANS Peter Crawford, Crawford Software Consultancy Ltd, London, UK Myra Oltsik, Acorda Therapeutics, Hawthorne, NY, USA ABSTRACT The first version of this solution to the ODS Data Trap in PROC MEANS was delivered at SUGI-31(2006). This update presents a revised version of the macro supporting additional features and eliminating a surprising error. Those who wish a practical solution to this ODS Data Trap will appreciate the enhancements that correct and simplify usage. Policies and impact of the macro are described for the more advanced audience who are interested in adapting the macro and its techniques for their own purposes. INTRODUCTION The basic reporting provided by PROC MEANS “leaves something to be desired” when more than the most basic statistics are requested. With brief and simple syntax the PROC provides quick reporting of five basic statistics. Equally simply, these can be written to a data set with the OUTPUT statement. Both the report and the output provide a table with a row for each variable and a column for each statistic. To extend this for more statistics (even just SUM) requires a surprising additional amount of coding. ODS OUTPUT does not capture the table arrangement reported by the PROC but creates tables in a structure similar to the format created by the /AUTONAME option of the OUTPUT statement with one row, i.e., with all statistics for all variables (per class value). What makes the ODS table different from the /AUTONAME form are: Additional columns name the original analysis variables (handy) The column order is different (less important) Variable labels in the result table do not distinguish between analysis variables so table viewers using variable labels to clarify, only confuse! (not good) This paper introduces a macro which creates a table in the form of the basic report from PROC MEANS, but extending support to any or all statistics the PROC MEANS can create. PAPER OUTLINE 1. Introduce the original (2006) solution approach 2. Explain the shortcomings (errors?) discovered by (post-presentation) reviewer 3. Present the new approach 4. Note other changes introduced to simplify usage and enhance results 5. Show the macro design and implementation policy THE ORIGINAL SOLUTION TO THE DATA TRAP Appendix 1 provides the original macro. The objective of the original macro was to allow the macro user to name the table to analyze and define any collection of statistics and variables to analyze. A result data set would be created named by suffixing the input data set with _MEANS. By default all statistics for all numeric variables would be analyzed. To achieve some flexibility while maintaining a reasonable level of performance PROC MEANS was executed only once, but with a separate OUTPUT statement for each statistic. These were then brought together, and printed by default, optionally with the rows (variables) sorted by name, in alphabetical order. Programming: Beyond the Basics SAS Global Forum 2012

Welcome message from author
This document is posted to help you gain knowledge. Please leave a comment to let me know what you think about it! Share it to your friends and learn new things together.
Transcript

1
Paper 231-2012
Solve the SAS® ODS Data Trap in PROC MEANS Peter Crawford, Crawford Software Consultancy Ltd, London, UK
Myra Oltsik, Acorda Therapeutics, Hawthorne, NY, USA
ABSTRACT
The first version of this solution to the ODS Data Trap in PROC MEANS was delivered at SUGI-31(2006). This update presents a revised version of the macro supporting additional features and eliminating a surprising error. Those who wish a practical solution to this ODS Data Trap will appreciate the enhancements that correct and simplify usage. Policies and impact of the macro are described for the more advanced audience who are interested in adapting the macro and its techniques for their own purposes.
INTRODUCTION
The basic reporting provided by PROC MEANS “leaves something to be desired” when more than the most basic statistics are requested. With brief and simple syntax the PROC provides quick reporting of five basic statistics. Equally simply, these can be written to a data set with the OUTPUT statement. Both the report and the output provide a table with a row for each variable and a column for each statistic. To extend this for more statistics (even just SUM) requires a surprising additional amount of coding.
ODS OUTPUT does not capture the table arrangement reported by the PROC but creates tables in a structure similar to the format created by the /AUTONAME option of the OUTPUT statement with one row, i.e., with all statistics for all variables (per class value). What makes the ODS table different from the /AUTONAME form are:
Additional columns name the original analysis variables (handy)
The column order is different (less important)
Variable labels in the result table do not distinguish between analysis variables so table viewers using variable labels to clarify, only confuse! (not good)
This paper introduces a macro which creates a table in the form of the basic report from PROC MEANS, but extending support to any or all statistics the PROC MEANS can create.
PAPER OUTLINE
1. Introduce the original (2006) solution approach
2. Explain the shortcomings (errors?) discovered by (post-presentation) reviewer
3. Present the new approach
4. Note other changes introduced to simplify usage and enhance results
5. Show the macro design and implementation policy
THE ORIGINAL SOLUTION TO THE DATA TRAP
Appendix 1 provides the original macro.
The objective of the original macro was to allow the macro user to name the table to analyze and define any collection of statistics and variables to analyze. A result data set would be created named by suffixing the input data set with _MEANS. By default all statistics for all numeric variables would be analyzed.
To achieve some flexibility while maintaining a reasonable level of performance PROC MEANS was executed only once, but with a separate OUTPUT statement for each statistic. These were then brought together, and printed by default, optionally with the rows (variables) sorted by name, in alphabetical order.
Programming: Beyond the BasicsSAS Global Forum 2012

Solve the SAS® ODS Data Trap in PROC MEANS, continued
2
SHORTCOMINGS OF ORIGINAL SOLUTION
Apart from the problems of publishing code in that release of PDF writer (solved by placing a paper upgrade in www.sascommunity.org), one material error was demonstrated and other issues arose.
MATERIAL ERROR
Among the statistics that can be created by PROC MEANS are UCLM and LCLM (Upper and Lower Confidence Limits of the Mean). These provide different results when derived together than when either is alone. The original macro design separated them even when both were selected. Selecting UCLM and LCLM together assumes a two-tailed distribution. However, the original solution separates all statistics so results for a one-tailed distribution are always provided. This design flaw is difficult to solve with the original solution approach.
OTHER ISSUES
i. Intermediate results are deliberately deleted as the macro finishes. For testing, and occasional interest, keeping these is useful. [also useful to have these if the macro breaks for any reason]
ii. The names of these intermediate result tables are specific to the macro (prefixed “_better_means_”), but make no attempt to avoid overwriting tables that might exist before the macro executes.
iii. When analyzing formatted numbers (date, time, money and percentages) it is not possible to show statistics like MIN/MEAN/MAX in the formats of the analysis variable because they share the same column. However for a report, the formatted value of a date is very important.
iv. It would be simple and very useful to have the macro monitor and report the duration of the process.
THE NEW APPROACH
As pointed out in the original paper, A Better Means - ODS Data Trap (059-31), using the OUTPUT statement option /AUTONAME appends a statistic name to a column name and might breach the limit to the length of a name.
The new approach overcomes the risk of that “breach”. Simply renaming any analysis variable to “V{VARNUM}” -reliably keeps the names short enough to enable the appending of the statistic name with that /AUTONAME option.
To avoid holding a second copy of the data (which might be large), this renaming is performed in a short DATA STEP VIEW.
***********************************************************************
* now build a view with VAR variables renamed v{varnum}
**********************************************************************;
data &bm_data1 /view= &bm_data1 ;
set &data ;
rename &name2num ;
run ;
***********************************************************************
* now collect all stats for all vars using /autoname for control *
**********************************************************************;
proc means data=&bm_data1 noprint missing &vdef;
var &nums_nm ;
output &sttsE out= _data_ /AUTONAME ;
run;
In the new approach, the OUTPUT statement with /AUTONAME creates statistics of analysis variables in columns named like {analysis_variable}_{statistic_name}. Having analysis variables named like vNNN makes splitting of the two parts straightforward:
An array “mean_set" has been defined which addresses the statistics of all analysis variables. The first of the following statements extracts the variable name for the first statistic of the “n-th” analysis variable:
vname = vname( mean_set( 1, _n_ )) ;
* vname name layout is "v{varnum}_{statisticName}" ;
Vnamev = scan( vname, 1, '_' ) ;
The last of those statement extracts the part of the name which is the analysis variable in PROC MEANS.
Programming: Beyond the BasicsSAS Global Forum 2012
Solve the SAS® ODS Data Trap in PROC MEANS, continued
3
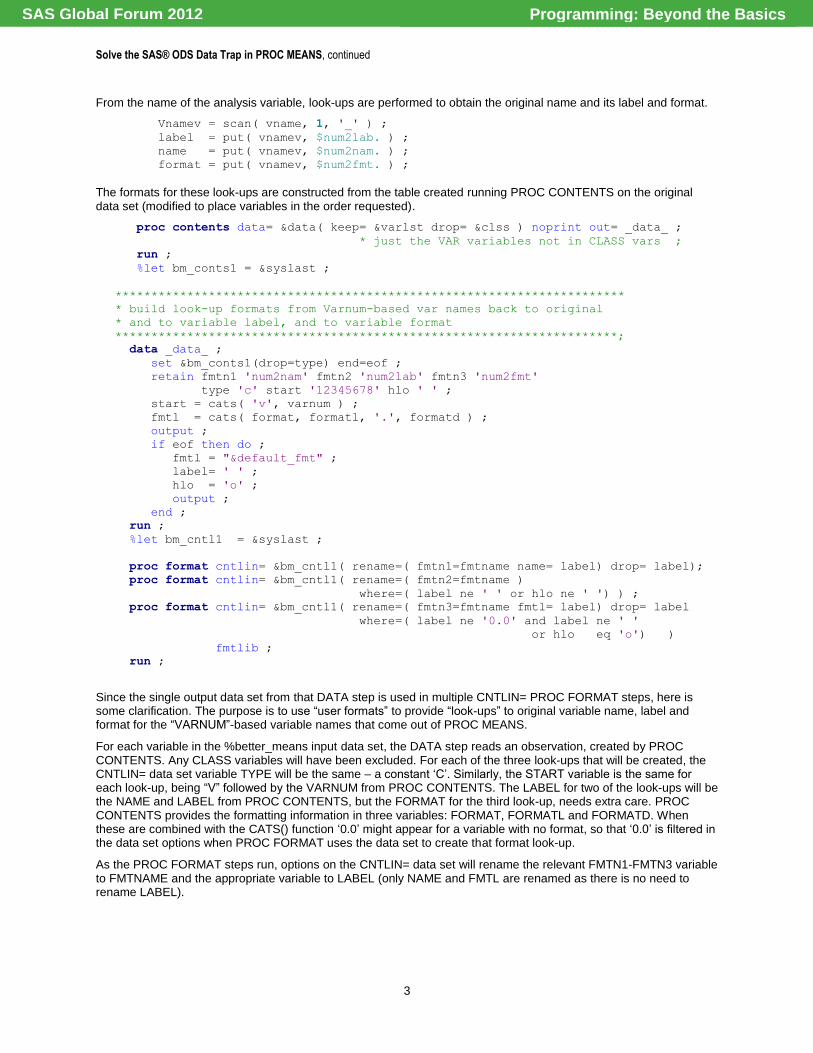
From the name of the analysis variable, look-ups are performed to obtain the original name and its label and format.
Vnamev = scan( vname, 1, '_' ) ;
label = put( vnamev, $num2lab. ) ;
name = put( vnamev, $num2nam. ) ;
format = put( vnamev, $num2fmt. ) ;
The formats for these look-ups are constructed from the table created running PROC CONTENTS on the original data set (modified to place variables in the order requested).
proc contents data= &data( keep= &varlst drop= &clss ) noprint out= _data_ ;
* just the VAR variables not in CLASS vars ;
run ;
%let bm_conts1 = &syslast ;
***********************************************************************
* build look-up formats from Varnum-based var names back to original
* and to variable label, and to variable format
**********************************************************************;
data _data_ ;
set &bm_conts1(drop=type) end=eof ;
retain fmtn1 'num2nam' fmtn2 'num2lab' fmtn3 'num2fmt'
type 'c' start '12345678' hlo ' ' ;
start = cats( 'v', varnum ) ;
fmtl = cats( format, formatl, '.', formatd ) ;
output ;
if eof then do ;
fmtl = "&default_fmt" ;
label= ' ' ;
hlo = 'o' ;
output ;
end ;
run ;
%let bm_cntl1 = &syslast ;
proc format cntlin= &bm_cntl1( rename=( fmtn1=fmtname name= label) drop= label);
proc format cntlin= &bm_cntl1( rename=( fmtn2=fmtname )
where=( label ne ' ' or hlo ne ' ') ) ;
proc format cntlin= &bm_cntl1( rename=( fmtn3=fmtname fmtl= label) drop= label
where=( label ne '0.0' and label ne ' '
or hlo eq 'o') )
fmtlib ;
run ;
Since the single output data set from that DATA step is used in multiple CNTLIN= PROC FORMAT steps, here is some clarification. The purpose is to use “user formats” to provide “look-ups” to original variable name, label and format for the “VARNUM”-based variable names that come out of PROC MEANS.
For each variable in the %better_means input data set, the DATA step reads an observation, created by PROC CONTENTS. Any CLASS variables will have been excluded. For each of the three look-ups that will be created, the CNTLIN= data set variable TYPE will be the same – a constant ‘C’. Similarly, the START variable is the same for each look-up, being “V” followed by the VARNUM from PROC CONTENTS. The LABEL for two of the look-ups will be the NAME and LABEL from PROC CONTENTS, but the FORMAT for the third look-up, needs extra care. PROC CONTENTS provides the formatting information in three variables: FORMAT, FORMATL and FORMATD. When these are combined with the CATS() function ‘0.0’ might appear for a variable with no format, so that ‘0.0’ is filtered in the data set options when PROC FORMAT uses the data set to create that format look-up.
As the PROC FORMAT steps run, options on the CNTLIN= data set will rename the relevant FMTN1-FMTN3 variable to FMTNAME and the appropriate variable to LABEL (only NAME and FMTL are renamed as there is no need to rename LABEL).
Programming: Beyond the BasicsSAS Global Forum 2012

Solve the SAS® ODS Data Trap in PROC MEANS, continued
4
OTHER CHANGES INTRODUCED TO SIMPLIFY USAGE AND ENHANCE RESULTS
ENHANCING RESULTS
For a NAME ordered list of the variables, the process uses the option, new in SAS9.2
SORTSEQ=LINGUISTIC .
This will sort analysis variables without respecting their case.
The default set of statistics has been revised to place the MIN before the P1 and MAX after the P99 column. Also brought together are the pair LCLM and UCLM, and the pair N and NMISS.
When a list of variables to be analysed is specified (rather than defaulting to _ALL_) the order of this selection is preserved when the SORT=VARNUM parameter is specified.
SHOWING STATISTICS IN DIFFERING FORMATS IN THE SAME COLUMN
When analysis variables have formats on the input data, these are inherited in the statistic columns of the OUTPUT OUT= data set (unless you use the NOINHERIT option on the OUTPUT statement). In the structure created by the /AUTONAME option, each statistic/analysis-variable combination can have its own format because they are all in separate columns. However, to improve the layout of our results we wish to have a row for each analysis variable and place all statistics of the same type (SUM, MEAN, STD, and etc.) in the same column – and a column can have only one format. Here is a clip of the effect of analyzing differently formatted variables together.
Figure 1. unformatted statistics
Only the Sales columns and YEAR remain meaningful, because MONTH and QUARTER are unformatted. To support multiple formats within a column of statistics like P1-P99, MEAN and MAX for formatted analysis variables, a parallel set of columns are created with the statistics re-formatted according to the separate format for each analysis variable. In the same result table we can see the formatted values in the following clip
Figure 2. formatted statistics
Now statistics for the MONTH variable are appropriately formatted. The statistic columns have contents in more than one format.
Even though the statistics of the analysis variables are in the differing formats of these analysis variables, when converted to strings they can share the column.
When an analysis variable has no format defined, it is assigned a default format (BEST12. is the default value of this macro parameter).
Two arrays define statistics requested from PROC MEANS and the corresponding set of formatted columns to be output.
array stats( &n_stats ) &out_stats ; * the stat names output from proc means ;
%let f_outs /* list the names of formmatted output stats variables */
= f_%sysfunc( tranwrd( &out_stats, %str( ), %str( f_) )) ;
* TRANWRD replaces each blank in the list with “ f_”
effectively prefixing every variable name with “f_” ;
Programming: Beyond the BasicsSAS Global Forum 2012

Solve the SAS® ODS Data Trap in PROC MEANS, continued
5
array fstat( &n_stats ) $&max_fmt_width &f_outs ;
The PUT() function needs its format parameter to be compiled as a constant and cannot vary at run-time, so that function does not help here. We need to support differing formats in the same function. For this situation there is the PUTN() function. This allows the format parameter to be a variable value which can change its value every time. We need it to change for each analysis variable.
fstat( _stat_ ) = PUTN( stats( _stat_ ), format ) ;
As a result of this flexibility, PUTN() does not perform as quickly as PUT(), but because this function will operate on the data output from PROC MEANS, the reduced volumes should not demand the faster performance of PUT(), and we need that flexibility.
Presenting multiple formats in each column is a feature that is still not supported in the PROC MEANS updates in SAS9.3.
OTHER IMPROVEMENTS – 1 – DO NOT OVERWRITE PRE-EXISTING TABLES
To avoid overwriting data sets that may exist before the macro is invoked; the default behavior of the “DATA statement with no output table name” is adopted. For SAS9.2 its use in a DATA statement is documented at http://support.sas.com/documentation/cdl/en/lrdict/64316/HTML/default/a000188132.htm#a002503650 .
In use, outside of the DATA statement, for example, the OUT= option of PROC SORT, it is referred to as the “Automatic Naming Convention” and documented for SAS9.2 at http://support.sas.com/documentation/cdl/en/lrcon/62955/HTML/default/viewer.htm#a000766820.htm.
When any data set is created this “Automatic Naming Convention” can be forced by specifying the new data set name as _DATA_.
The _DATA_ feature is used in the macro whenever a table is written (except the “final”). The actual output table name is captured from the SYSLAST automatic macro variable. And, to complete a “tidy up” at the end of the macro, these intermediate tables are added to a list, for deletion just before the macro completes.
%let bm_conts2 = &syslast ;
%let drop_list = &drop_list %scan(&syslast,-1,.) ;
To complete a “tidy up” at the end of the macro, these intermediate tables are added to a list, for deletion just before the macro completes.
OTHER IMPROVEMENTS – 2 – REPORT MACRO RUNTIME
The start and finish times are captured, as the macro starts:
%let bmeansstart = %sysfunc(datetime()) ;
as it finishes
%let bmeanstime = %sysevalf( %sysfunc(datetime()) - &bmeansstart ) ;
and these are reported to the SASlog
%put Total BetterMeans Macro Time: %sysfunc( putn( &bmeanstime, time9.)) ;
MACRO DESIGN AND IMPLEMENTATION POLICY
Some features of the macro design have already been described
Use of _DATA_ to protect pre-existing tables
Collect list of temporary tables for deletion
In addition the policies are presumed to help:
1. List all local macro variables in a %LOCAL statement and explaining purpose.
2. Design the macro and its parameters to allow the macro to be called with no parameters, and then all defaults provide “all about the latest data set”.
Programming: Beyond the BasicsSAS Global Forum 2012

Solve the SAS® ODS Data Trap in PROC MEANS, continued
6
3. Keep the original macro interface (parameters) to enable “enhancement with least disturbance”.
4. Keep syntax narrow to support printing for “code review”.
CONCLUSION
A practical enhancement of the old macro provides simpler use and corrects a defect in the original design.
A new macro engine does not need to replace the interface.
To take advantage of the new PROC MEANS option, STACKODSOUTPUT in SAS9.3, would make the macro fail in earlier releases. Next year there may be some merit in creating an alternate and simpler - BETTER_MEANS93.
REFERENCES
Oltsik, Myra and Crawford, Peter. April 2006. “A Better Means - ODS Data Trap (059-31),”SAS Institute Inc.
2006. Proceedings of the Thirty-first Annual SAS® Users Group International Conference. Cary, NC: SAS Institute Inc. Available at http://www2.sas.com/proceedings/sugi31/toc.html.
SAS Institute Inc. 2009. Base SAS® 9.2 Procedures Guide. Cary, NC: SAS Institute Inc. For PROC MEANS see http://support.sas.com/documentation/cdl/en/proc/61895/HTML/default/viewer.htm#a000146728.htm
ACKNOWLEDGMENTS
“Data_null_;” the pseudonym of the SAS Forum poster John King, who pointed out the deficiency of separating the statistics in the basis of the original method!
RECOMMENDED READING
Base SAS® Procedures Guide in particular PROC MEANS
SAS® For Dummies
®
CONTACT INFORMATION
Your comments and questions are valued and encouraged. Contact the authors at:
Name: Myra Oltsik Enterprise: Acorda Therapeutics City, State ZIP: Hawthorne, NY USA Work Phone: 1-914-347-4300 x4045 Name: Peter Crawford Enterprise: Crawford Software Consultancy Limited City, State ZIP: London, UK Work Phone: 0044 7802 732254 E-mail: [email protected]
SAS and all other SAS Institute Inc. product or service names are registered trademarks or trademarks of SAS Institute Inc. in the USA and other countries. ® indicates USA registration.
Other brand and product names are trademarks of their respective companies.
APPENDIX 1
The macro using the earlier engine, can be found at http://www.sascommunity.org/wiki/PROC_MEANS_-_Improve_on_the_default
APPENDIX 2
The macro using the new engine will soon appear in SAS Community.org at
Programming: Beyond the BasicsSAS Global Forum 2012

Solve the SAS® ODS Data Trap in PROC MEANS, continued
7
http://www.sascommunity.org/wiki/Solve_the_SAS%C2%AE_ODS_Data_Trap_in_PROC_MEANS but is appended here
/****************************************************************************************/
/* PROGRAM: better_means */
/* AUTHORS: Myra A. Oltsik and Peter Crawford */
/* ORIGINAL DATE: 04/20/05 */
/* PURPOSE: Create a dataset with PROC MEANS statistics, with each record being */
/* one variable. Can print stats, too. Fixes ODS problems. */
/* */
/* CHANGE HISTORY: */
/* 04Jan2006 PC: use a &testing parm to preserve _better_: data sets */
/* 01Feb2006 xx: clean for production */
/* 07Jul2006 xx: add out= parameter (defaults to use current scheme) */
/* 11/29/07 - MO: Add use of VARDEF. */
/* */
/* 19Oct2011 xx: support two-tailed tests in UCLM and LCLM */
/* always add label and format for each VAR */
/* 30Oct2011 xx: add f_{statistic} columns with formatted results as strings */
/* */
/* NOTE: This macro has special handling for N, SUMWGT, KURT and SKEW. */
/* Also: Q1, MEDIAN, Q3, STD are referred as P25, P50, P75, STD or STDev */
/****************************************************************************************/
/****************************************************************************************/
/* MACRO PARAMETERS: */
/* required: none */
/* optional: print -- whether or not to print results to output */
/* data -- dataset name to be analysed */
/* out -- output dataset (default is &data..means */
/* but source not always update-able */
/* sort -- sort order choice of the file of MEANS, by VARNUM or NAME */
/* stts -- indicate which statistics should included in the output */
/* varlst -- list of variables for means if not all numeric vars in file */
/* vdef -- supports alternate VARDEF for STD/VAR in weighted analyses */
/* clss -- variable(s) for a class statement */
/* wghts -- variable for a weight statement */
/* defaults: */
/* data -- &syslast (most recently created data set) */
/* print -- Y */
/* sort -- VARNUM */
/* stts -- _ALL_ */
/* varlst -- _ALL_ */
/* */
/* Created Macro Variables: */
/* locals -- see inline comments at %local statement */
/* Creates Data Sets */
/* results are written to &data._means */
/* many data sets are created in the work library all prefixed _better_ */
/* but unless the testing option is set, the work data stes are deleted */
/* */
/* SAMPLES: */
/* %better_means(data=test); print all default statistics in a dataset */
/* %better_means(data=sashelp.class,stts=MEAN SUM); print only MEAN and SUM stats */
/* %better_means(data=sashelp.gnp,print=N,sort=NAME,stts=MIN MAX,varlst=INVEST */
/* EXPORTS); suppress list printing, limit output statistics and variables, and */
/* sort on NAME */
/* %better_means(data=sasuser.shoes,clss=PRODUCT); run all stats by PRODUCT field */
/* %better_means(data=sasuser.weighted,wghts=WGT); run all stats weighted on WGT */
/* %better_means(data=d07_algorithm_adjust,stts=Mean Std,wghts=WEIGHT_POP_D2007,
vdef=%quote(VARDEF=WGT)); *need VARDEF for correct Std calculations ;
/****************************************************************************************/
%macro
better_means(
data = &syslast ,
out = ,
print = Y,
sort = VARNUM,
stts = _ALL_,
varlst = _ALL_,
clss = ,
wghts = ,
Vdef = , /* ADDED 11/29/07: Change default for VARDEF= option */
testing= no , /* any other value will preserve the _better_: data sets */
/****************************************************************************************/
/* PROVIDE THE COMPLETE PROC MEANS STATISTIC LIST (FROM ONLINE-DOC) IF NONE STATED. */
/****************************************************************************************/
_stts = N NMISS SUM MEAN mode STD VAR LCLM UCLM
MIN P1 P5 P10 P25 P50 P75 P90 P95 P99 MAX QRANGE RANGE
PROBT STDERR CV CSS SUMWGT KURT SKEW T USS ,
default_fmt = best12. /* format for stats when no format on input data */
);
Programming: Beyond the BasicsSAS Global Forum 2012

Solve the SAS® ODS Data Trap in PROC MEANS, continued
8
%local
BETTER_cntl /* holds name of cntlin DS for VARNUM informat */
BETTER_cols /* holds name of contents DS for &data */
BETTER_means_out /* holds name of results before sorting */
bm2varnum /* holds varnum of first {var}_{stat} PROC MEANS */
bm_cntl1 /* names cntlin for fmts of name label and format*/
bm_conts1 /* holds name of contents DS for adapted &data */
bm_conts2 /* holds name of contents DS for raw PROC MEANS */
bm_data1 /* holds name of VIEW with VAR variables renamed */
bm_stats_1 /* holds name of table OUTPUT from PROC MEANS */
bmeansstart /* macro start time */
bmeanstime /* finish time */
drop_list /* COLLECT NAMES OF TEMPORARY TABLE TO BE DELETED*/
drop_views /* COLLECT NAMES OF VIEWS TO BE DELETED */
dum_varnum /* this dummy holder avoids warning from proc sql*/
f_outs /* list of preformatted stat names */
first_stat /* holds name first {var}_{stat} PROC MEANS */
full /* INDICATOR IN OUTPUT LABEL WHEN ALL STATS USED.*/
last_stat /* holds name last {var}_{stat} PROC MEANS */
max_fmt_width /* maximun width for formatted values */
n_numerics /* counter of analysis vars */
n_stats /* counter of statistics output by PROC MEANS */
name2num /* rename VAR variables to support /AUTONAME */
nums_nm /* provides a list of the renamed vars for VAR */
out_stats /* list statistic names output from PROC MEANS */
_stat_ /* pointer into results statistic arrays */
sttsE /* stats list with = after each statistic */
;
%let bmeansstart = %sysfunc(datetime()) ;
/****************************************************************************************/
/* PUT STATS AND VAR PARAMETER LIST INTO UPPER CASE. */
/****************************************************************************************/
%let varlst = %upcase(&varlst);
%let stts = %upcase(&stts);
/****************************************************************************************/
/* VERIFY INPUT DATA SET EXISTS. */
/****************************************************************************************/
%let data = &data ; /* RESOLVE &syslast, WHEN DEFAULTED */
/* provide default OUT= dataset */
%if NOT %sysfunc( exist( &data )) %then %do ;
%put MACRO.ER%str(ROR).&sysmacroName input data file &data does not exist ;
%abort ;
%end ;
/****************************************************************************************/
/* PREPARE OUTPUT DATA SET. */
/****************************************************************************************/
%if %length(&out) < 1 %then %do;
%let out = &data._means ;
%end ;
data &out ; stop ; run ;
%if &syserr %then %do;
%put &sysmacroName-ER%str(ROR): unable to write output data file &out ;
%abort ;
%end ;
%if &sort eq VARNUM %then %do;
/****************************************************************************************/
/* GET THE NAMES/NUMBERS OF ALL VARIABLES INTO A LOOKUP FORMAT IF SORT ORDER = VARNUM. */
/****************************************************************************************/
proc contents data= &data out= _data_ noprint;
run;
%let BETTER_cols = &syslast ;
%let drop_list = &drop_list %scan(&syslast,-1,.) ;
data _data_ ;
retain
FMTNAME '_bm_VN'
TYPE 'I'
HLO 'U'
;
set &BETTER_cols( keep= NAME VARNUM rename=( VARNUM=LABEL ));
START = upcase( NAME) ;
run;
%let BETTER_cntl = &syslast ;
%let drop_list = &drop_list %scan(&syslast,-1,.) ;
proc format cntlin= &BETTER_cntl;
run;
%end;
/****************************************************************************************/
/* PROCESS STATISTICS CONDITIONS / COMBINATIONS */
Programming: Beyond the BasicsSAS Global Forum 2012

Solve the SAS® ODS Data Trap in PROC MEANS, continued
9
/****************************************************************************************/
%if &stts = _ALL_ or %length(&stts) = 0 %then %do;
%let stts = &_stts ;
%let full = FULL STATS;
%end;
%if %length(&wghts) %then %do;
%* remove KURT and Skew when weights are present;
%let stts = %sysfunc( tranwrd( &stts, KURT, %str( ) ));
%let stts = %sysfunc( tranwrd( &stts, SKEW, %str( ) ));
%let full = STATS ;
%end;
%else %do;
%* remove SUMWGT when no weights present ;
%let stts = %sysfunc( tranwrd( &stts, SUMWGT, %str( ) ));
%let full = STATS ;
%end;
%**********************************************************************
* prepare stats list for OUTPUT statement (like SUM= MEAN= MAX= etc ) *
**********************************************************************;
%let sttsE = %sysfunc( tranwrd( %sysfunc(
compbl( &stts )),%str( ), %str(= )
) )= ;
/****************************************************************************************/
/* TO RUN PROC MEANS ON ALL VARIABLES AND ALL STATS NEEDS /AUTONAME, SO NEED TO PREPARE */
/* WITH A GENERAL RENAME OF THE VAR VARIABLES. VARNUM PROVIDES UNIQUE IDENTITY FOR VARS */
/* LATER THEY WILL BE RENAMED BACK TO NORMAL */
/* NEED TO PREPARE RENAME= AND LOOK-UPS FROM VARNUM TO PROVIDE NAME, LABEL AND FORMAT */
/****************************************************************************************/
*** first prepare model data set, in requested structure
then VARNUM will be in any requested order ;
data _data_ ;
stop ;
retain &clss &varlst ;
keep &clss &varlst ;
set &data ;
run ;
%let bm_conts0 = &syslast ;
%let drop_list = &drop_list %scan(&syslast,-1,.) ;
proc contents data= &bm_conts0( keep= &varlst drop= &clss ) noprint out= _data_ ;
* just the VAR variables not in CLASS vars ;
run ;
%let bm_conts1 = &syslast ;
%let drop_list = &drop_list %scan(&syslast,-1,.) ;
proc sql noprint ;
* prepare renames and name lists ;
select cats( name, '= v', varnum )
, cats( 'v', varnum )
, varnum
into : name2num separated by ' '
, : nums_nm separated by ' '
, : dum_varnum
from &bm_conts1
where type = 1 /* numeric vars only */
order by varnum
;
%let n_numerics = &sqlobs ;
***********************************************************************
* later will be formatting stats together, so need max default width *
**********************************************************************;
select max( max( a.defw, b.formatl ))
into : max_fmt_width separated by ' '
from dictionary.formats a
join &bm_conts1 b
on a.fmtname = b.format
;
*** not forgetting to get length of default formatting width ;
%let def_fmt_width = %sysfunc( compress( &default_fmt, 0123456789, k ) ) ;
*** and just in case default is the only format/width ;
%let max_fmt_width = %sysfunc( max( &max_fmt_width, &def_fmt_width )) ;
quit ;
***********************************************************************
* pointless to proceed if there are no numeric vars to analyse *
**********************************************************************;
%if &n_numerics < 1 %then %do ;
%put &sysmacroname-ER%STR(ROR): NO numeric variables selected for analysis from &data ;
Programming: Beyond the BasicsSAS Global Forum 2012

Solve the SAS® ODS Data Trap in PROC MEANS, continued
10
%abort ;
%end ;
***********************************************************************
* always build look-up formats from Varnum-based var names, back to original
* and to variable label, and to variable format
**********************************************************************;
data _data_ ;
set &bm_conts1(drop=type) end=eof ;
retain fmtn1 'num2nam' fmtn2 'num2lab' fmtn3 'num2fmt'
type 'c' start '12345678' hlo ' ' ;
start = cats( 'v', varnum ) ;
*** when format length is not specified, avoid using the zero from proc contents ! ;
if formatl then fmtl = cats( format, formatl, '.', formatd ) ;
else fmtl = format ;
output ;
if eof then do ;
fmtl = "&default_fmt" ;
label= ' ' ;
hlo = 'o' ;
output ;
end ;
run ;
%let bm_cntl1 = &syslast ;
%let drop_list = &drop_list %scan(&syslast,-1,.) ;
proc format cntlin= &bm_cntl1( rename=( fmtn1=fmtname name= label) drop= label );
proc format cntlin= &bm_cntl1( rename=( fmtn2=fmtname )
where=( label ne ' ' or hlo ne ' ') ) ;
proc format cntlin= &bm_cntl1( rename=( fmtn3=fmtname fmtl= label) drop= label
where=( label ne '0.0' and label ne ' ' or hlo='o') )
%if &testing NE no %then %do ;
fmtlib
%end ;
;
run ;
***********************************************************************
* feature _DATA_ doesnt work with data step views
so just using it to make a name available
**********************************************************************;
data _data_; stop; run ;
%let bm_data1 = &syslast ;
%let drop_list = &drop_list %scan(&syslast,-1,.) ;
%let bm_data1 = &bm_data1.v ;
%let drop_views = &drop_views %scan(&bm_data1,-1,.) ;
***********************************************************************
* now build a view with VAR variables renamed v{varnum}
**********************************************************************;
data &bm_data1 /view= &bm_data1 ;
set &data ;
rename &name2num ;
run ;
***********************************************************************
* now collect all stats for all vars using /autoname for control *
**********************************************************************;
proc means data=&bm_data1 noprint missing &vdef;
var &nums_nm ;
%if %length(&clss) %then %do;
class &clss;
%end;
%if %length(&wghts) %then %do;
weight &wghts;
%end;
output &sttsE out= _data_ /AUTONAME ;
run;
%let bm_stats_1 = &syslast ;
%let drop_list = &drop_list %scan(&syslast,-1,.) ;
***********************************************************************
* now split up each row into stats for variables *
**********************************************************************;
* first, to identify first and last of the var_stat variables output ;
* collect variable names ;
proc contents data= &bm_stats_1( drop= &clss _type_ _freq_ ) noprint
out=_data_ ;
run ;
%let bm_conts2 = &syslast ;
Programming: Beyond the BasicsSAS Global Forum 2012

Solve the SAS® ODS Data Trap in PROC MEANS, continued
11
%let drop_list = &drop_list %scan(&syslast,-1,.) ;
***********************************************************************
* and select min and max VARNUM vars *
these provide the range of variable names in the results
**********************************************************************;
proc sql noprint ;
select name into :first_stat separated by ' '
from &bm_conts2
having varnum = min(varnum )
;
select name into :last_stat separated by ' '
from &bm_conts2
having varnum = max(varnum )
;
* now get list of the statistics created by PROC MEANS ;
select scan( name,-1,'_') , varnum
into :out_stats separated by ' ' , :dum_varnum
from &bm_conts2
where scan(name,1,'_') eq "%scan(&last_stat,1,_)"
order by varnum
; ****** using &last, but any one stat would do! ;
%put NOTE: &sqlobs statistics found ;
quit ;
%let n_stats = &sqlobs ;
%let f_outs /* formmatted output stats */
= f_%sysfunc( tranwrd( &out_stats, %str( ), %str( f_))) ;
data _data_ ;
retain _type_ &clss name label ;
length vname name $32 label $256 ; drop vname ;
format _type_ 3. ;
%if %sysfunc( indexw( &out_stats, N )) %then %do ;
format n comma9. nmiss best7. pct_pop percent7.1 ;
%end ;
if 0 then set &bm_stats_1 ;
array mean_set(&n_stats, &n_numerics ) &first_stat--&last_stat ;
set &bm_stats_1 ;
%if &testing ne no %then %do ;
put mean_set(1,1)= mean_set(2,2)= mean_set(2,1)= ;
%end ;
array stats( &n_stats ) &out_stats ;
array fstat( &n_stats ) $&max_fmt_width /*&bm_max_f_len*/ &f_outs ;
do _n_ = 1 to &n_numerics ;
vname = vname( mean_set( 1, _n_ )) ;
* vname name layout is "v{varnum}_{statisticName}" ;
vnamev= scan( vname, 1, '_' ) ;
label = put( vnamev, $num2lab. ) ;
name = put( vnamev, $num2nam. ) ;
format= put( vnamev, $num2fmt. ) ;
varnum= input( substr( vnamev, 2 ), best8. );
do _stat_ = 1 to &n_stats ;
stats( _stat_ ) = mean_set( _stat_, _n_ ) ;
fstat( _stat_ ) = putn( stats( _stat_ ), format ) ;
end ;
%if %sysfunc( indexw( &out_stats, N )) %then %do ;
pct_pop = n / _freq_ ;
%end ;
_error_ = 0 ;
output ;
end ;
drop &first_stat--&last_stat _stat_ ;
keep _type_ &clss name label &out_stats pct_pop varnum format f_: ;
run ;
%let better_means_out = &syslast ;
%let drop_list = &drop_list %scan(&syslast,-1,.) ;
%macro now( fmt= datetime21.2 ) / des= "Timestamp";
%sysfunc( datetime(), &fmt )
%mend now;
/****************************************************************************************/
/* CREATE FINAL DATASET WITH ALL STATISTICS, SORTED AS REQUESTED ON INVOCATION. */
Programming: Beyond the BasicsSAS Global Forum 2012

Solve the SAS® ODS Data Trap in PROC MEANS, continued
12
/****************************************************************************************/
%if &sort = MEANS %then %do ; *sort=MEANS indicates no sort requested ;
data &out( label= "&FULL FOR &data %sysfunc(datetime(), datetime21.3)"
drop= vnameV
%if %length(&clss) = 0 %then %do;
_TYPE_
%end; ) ;
set &better_means_out ;
run ;
%end ;
%else %do ;
proc sort data= &better_means_out
SORTSEQ=LINGUISTIC /* in SAS9.2 + this provides mixed-case sorting for NAME */
out= &out( label= "&FULL FOR &data %NOW"
drop=
%if %length(&clss) = 0 %then %do;
_TYPE_
%end;
) ;
by _TYPE_ &clss &sort ;
run;
%end ;
/****************************************************************************************/
/* IF PRINTED OUTPUT IS REQUESTED, DO SO HERE. */
/****************************************************************************************/
%if &print = Y %then %do;
proc print data= &out ;
title3 "MEANS FOR &data";
footnote2 .h=1 .j=l "&sysmacroname by &sysuserid at %now(fmt=twmdy) " ;
%if %length(&clss) > 0 %then %do;
by _TYPE_;
%end;
run;
title3 ;
footnote2 ;
%end;
%if &testing = no %then %do;
/****************************************************************************************/
/* CLEAN UP REMAINING TEMPORARY DATASETS. */
/****************************************************************************************/
proc datasets lib= work nolist;
delete &drop_list ;
delete &drop_views / mt=view ;
run; quit;
%end;
%else %do ;
proc sql number flow= 20 70 ;
title3 'current macro vars ' ;
proc sql number ;
select name, scope, offset, value
from sashelp.vmacro
order by scope descending, name, offset ;
quit ;
title3 ;
quit ;
%end ;
%let bmeanstime = %sysevalf ( %sysfunc(datetime()) - &bmeansstart ) ;
%put Total BetterMeans Macro Time: %sysfunc(putn(&bmeanstime,time9.)) ;
%mend BETTER_MEANS ;
SAS and all other SAS Institute Inc. product or service names are registered trademarks or trademarks of SAS Institute Inc. in the USA and other countries. ® indicates USA registration.
Other brand and product names are trademarks of their respective companies.
Programming: Beyond the BasicsSAS Global Forum 2012
Related Documents