23 New Zealand 23.1 Summary of Coal Industry 23.1.1 ROLE OF COAL IN NEW ZEALAND Coal is New Zealand’s most abundant fossil fuel and has been an important energy source since the late nineteenth century. Today, the majority of New Zealand’s coal is used for electricity generation (40 percent) and industrial processes (33 percent), with dairy and non-metallic mineral product manufacturing (cement, lime, and plaster) being the largest industrial consumers of coal (MBIE, 2013). In 2013, New Zealand consumed approximately 2.9 million tonnes (Mmt) of coal, with a significant portion used to generate electricity at Huntly, New Zealand's only coal-fired power station (MBIE, 2013; Coal Association, 2012). Further, exportation of New Zealand’s premium bituminous coal has been a major growth area since about 1990 and is likely to continue being a good prospect for the future as their coal is valued internationally for its low ash, sulfur content, and other characteristics that allow blending with other coals for use in the steel industry (MBIE, 2013). Table 23-1 indicates New Zealand’s recoverable coal reserves to be about 570 Mmt. The resource itself is far more extensive and may offer greater recovery, ultimately. The total known in-ground resource is estimated to exceed 15 billion tonnes, of which more than half is potentially recoverable (MBIE, 2013). Table 23-1. New Zealand’s Coal Reserves and Production Anthracite & Sub- Indicator Bituminous bituminous & Lignite Total Global Rank Estimated Proved Coal Reserves (2011) 33.0 538.0 571.0 31 (0.064%) Annual Coal Production (2012) 4.6 0.33 4.93 33 (0.06%) (million tonnes) (# and %) (million tonnes) (million tonnes) Source: EIA (2014) New Zealand is divided up in to North Island and South Island (Figure 23-1). Coal is found in the Northland, Waikato, and Taranaki Coal Regions of the North Island. On the South Island, coal is found in the Nelson, West Coast, Canterbury, Otago, and Southland Coal Regions (USGS, 2004). At least 6.2 billion tonnes of lignite is technically and economically recoverable in 10 major deposits in the South Island regions of Otago and Southland (P&M, 2014). The North Island in-ground resource is about 2.4 billion tonnes and consists of almost entirely sub-bituminous coal (P&M, 2014). CMM Country Profiles 208

Welcome message from author
This document is posted to help you gain knowledge. Please leave a comment to let me know what you think about it! Share it to your friends and learn new things together.
Transcript

23 New Zealand
23.1 Summary of Coal Industry 23.1.1 ROLE OF COAL IN NEW ZEALAND Coal is New Zealand’s most abundant fossil fuel and has been an important energy source since the late nineteenth century. Today, the majority of New Zealand’s coal is used for electricity generation(40 percent) and industrial processes (33 percent), with dairy and non-metallic mineral productmanufacturing (cement, lime, and plaster) being the largest industrial consumers of coal (MBIE, 2013). In 2013, New Zealand consumed approximately 2.9 million tonnes (Mmt) of coal, with a significant portion used to generate electricity at Huntly, New Zealand's only coal-fired powerstation (MBIE, 2013; Coal Association, 2012). Further, exportation of New Zealand’s premium bituminous coal has been a major growth area since about 1990 and is likely to continue being a good prospect for the future as their coal is valued internationally for its low ash, sulfur content, and other characteristics that allow blending with other coals for use in the steel industry (MBIE,2013).
Table 23-1 indicates New Zealand’s recoverable coal reserves to be about 570 Mmt. The resource itself is far more extensive and may offer greater recovery, ultimately. The total known in-groundresource is estimated to exceed 15 billion tonnes, of which more than half is potentially recoverable (MBIE, 2013).
Table 23-1. New Zealand’s Coal Reserves and Production
Anthracite & Sub-
Indicator Bituminous bituminous & Lignite
Total Global Rank
Estimated Proved Coal Reserves (2011) 33.0 538.0 571.0 31 (0.064%)
Annual Coal Production (2012) 4.6 0.33 4.93 33 (0.06%)
(million tonnes) (# and %) (milliontonnes) (million tonnes)
Source: EIA (2014)
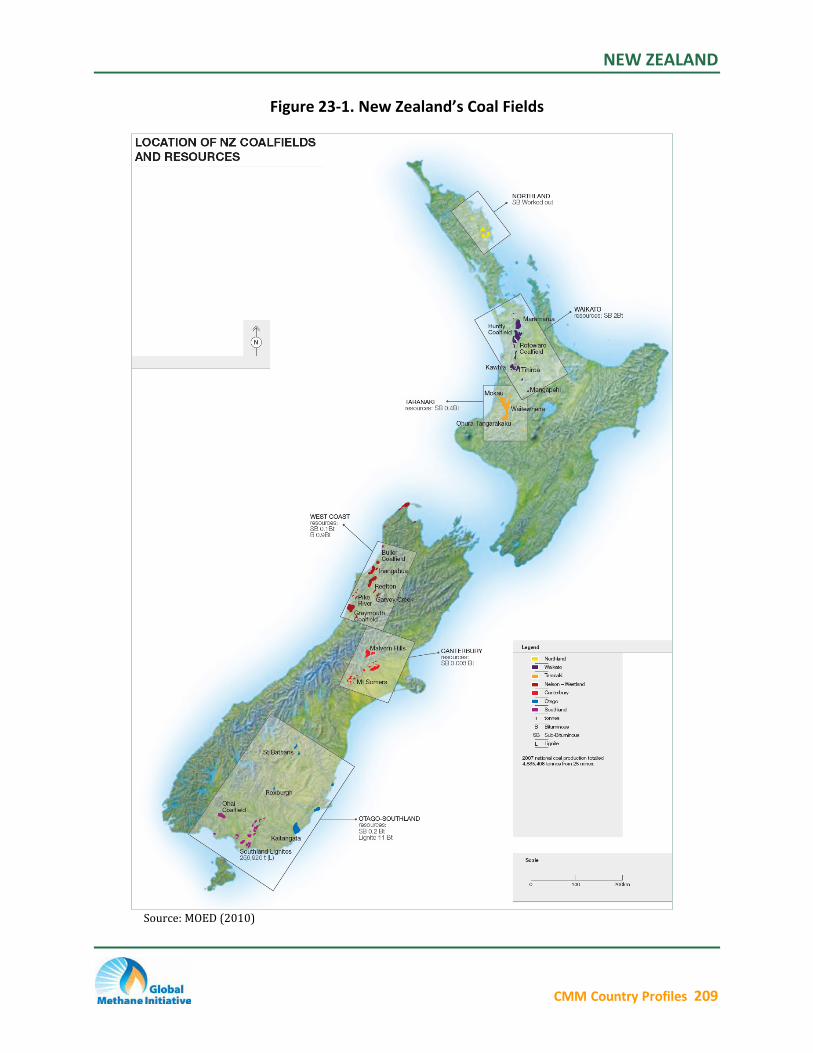
New Zealand is divided up in to North Island and South Island (Figure 23-1). Coal is found in the Northland, Waikato, and Taranaki Coal Regions of the North Island. On the South Island, coal isfound in the Nelson, West Coast, Canterbury, Otago, and Southland Coal Regions (USGS, 2004). Atleast 6.2 billion tonnes of lignite is technically and economically recoverable in 10 major deposits inthe South Island regions of Otago and Southland (P&M, 2014). The North Island in-ground resourceis about 2.4 billion tonnes and consists of almost entirely sub-bituminous coal (P&M, 2014).
CMM Country Profiles 208
NEW ZEALAND
Figure 23-1. New Zealand’s Coal Fields
Source: MOED (2010)
CMM Country Profiles 209

NEW ZEALAND
23.1.2 STAKEHOLDERS Only a handful of companies operate coal mines in New Zealand. Most of New Zealand’s coal is produced by Solid Energy NZ Limited (P&M, 2014).
Key stakeholders involved in New Zealand’s coal and the coal mine methane (CMM) development industries are outlined in Table 23-2.
Table 23-2. Key Stakeholders in New Zealand’s CMM Industry Stakeholder Category Stakeholder Role
Mining Companies
Birchfield Coal Canterbury Coal Cascade Coal
Project hosts
Crusader Coal
Francis Mining Glencoal
Harliwich Carrying Co. Heaphy Mining Kai Point Coal
New Creek Mining O’Reilly’s Opencast Puke Coal
RJ Banks
Rockies Mining Solid Energy Takitimu Coal
Developers See http://www.epa.gov/coalbed/networkcontacts.html
Project opportunityidentification and planning
Universities and Research Centers
Government Groups
Commonwealth Scientific and Industrial Research Organisation (CSIRO) University of Auckland Ministry of Commerce – Energy and Resources Division
Technical assistance
Licensing
Source: P&M (2014)
23.1.3 STATUS OF COAL AND THE COAL MINING INDUSTRY New Zealand’s coal industry is vested in 22 surface and underground mines. Roughly 60 percent ofnational production was from two large opencast operations, located at Rotowaro and Stockton(P&M, 2014). Coal production statistics for 2012 by mine type are presented in Table 23-3. The total number of mines has steadily decreased, and surface mining methods have become more popular.
Table 23-3. New Zealand’s Production and Mine Statistics (million tonnes) Type of Mine 2012 Production Number of Mines
Underground (active) Surface (active) Total
0.60 4.33 4.93
4 18 22
Sources: MBIE (2013); P&M (2014)
CMM Country Profiles 210
NEW ZEALAND
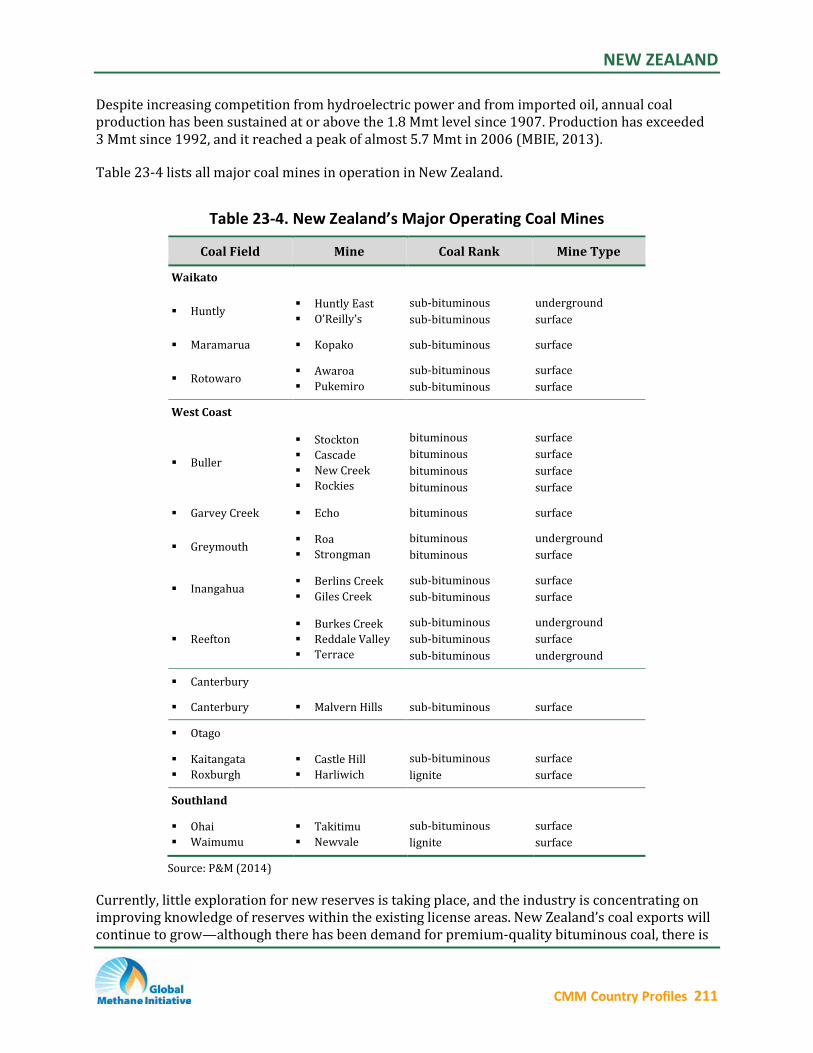
Despite increasing competition from hydroelectric power and from imported oil, annual coalproduction has been sustained at or above the 1.8 Mmt level since 1907. Production has exceeded3 Mmt since 1992, and it reached a peak of almost 5.7 Mmt in 2006 (MBIE, 2013).
Table 23-4 lists all major coal mines in operation in New Zealand.
Table 23-4. New Zealand’s Major Operating Coal Mines
Coal Field Mine Coal Rank Mine Type
Waikato
Huntly East sub-bituminous underground Huntly
O’Reilly’s sub-bituminous surface
Maramarua Kopako sub-bituminous surface
Awaroa sub-bituminous surface Rotowaro
Pukemiro sub-bituminous surface
West Coast
Buller
Garvey Creek
Greymouth
Inangahua
Reefton
Stockton Cascade New Creek Rockies
Echo
Roa Strongman
Berlins Creek Giles Creek
Burkes Creek Reddale Valley Terrace
bituminous bituminous bituminous bituminous
bituminous
bituminous bituminous
sub-bituminous sub-bituminous
sub-bituminous sub-bituminous sub-bituminous
surface surface surface surface
surface
underground surface
surface surface
underground surface underground
Canterbury
Canterbury Malvern Hills sub-bituminous surface
Otago
Kaitangata Castle Hill sub-bituminous surface Roxburgh Harliwich lignite surface
Southland
Ohai Takitimu sub-bituminous surface Waimumu Newvale lignite surface
Source: P&M (2014)
Currently, little exploration for new reserves is taking place, and the industry is concentrating onimproving knowledge of reserves within the existing license areas. New Zealand’s coal exports willcontinue to grow—although there has been demand for premium-quality bituminous coal, there is
CMM Country Profiles 211
NEW ZEALAND
also a growing international market for thermal coals, such as New Zealand’s lower-grade bituminous and sub-bituminous coals (USGS, 2004).
23.2 Overview of CMM Emissions and Development Potential
The Global Methane Initiative (GMI) International CMM Projects Database currently identifies noCMM recovery projects for New Zealand, in operation or under development (GMI, 2014). Updateson future CMM projects in New Zealand can be found at https://www.globalmethane.org/coalmines/cmm/index.aspx.
23.2.1 CMM EMISSIONS FROM OPERATING MINES Most New Zealand coal production is from surface mines producing low rank coals at shallowdepths with low methane concentrations. Methane emissions from these coals are vented. The fewdeep underground mines have high methane concentrations and are generally degasified withventilation and surface gob wells. To date, no current projects have been identified in surface orunderground mines where captured gas is utilized or marketed rather than vented.
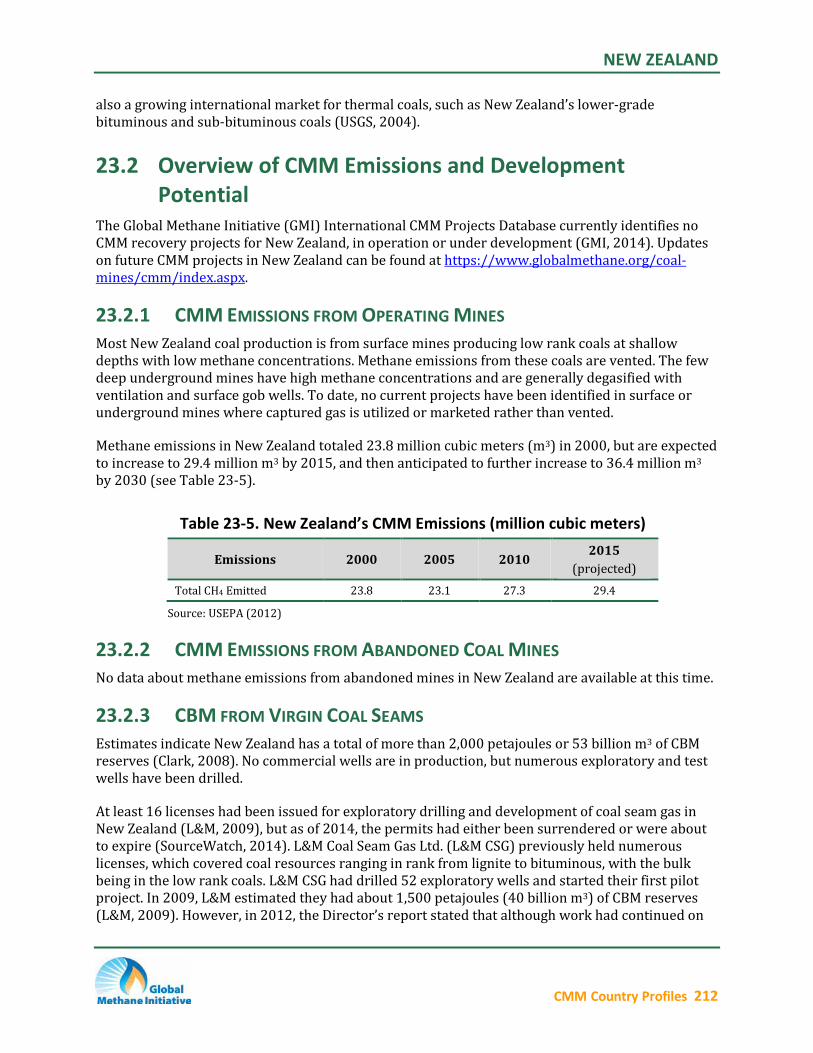
Methane emissions in New Zealand totaled 23.8 million cubic meters (m3) in 2000, but are expected to increase to 29.4 million m3 by 2015, and then anticipated to further increase to 36.4 million m3
by 2030 (see Table 23-5).
Table 23-5. New Zealand’s CMM Emissions (million cubic meters) 2015
Emissions 2000 2005 2010 (projected)
Total CH4 Emitted 23.8 23.1 27.3 29.4
Source: USEPA (2012)
23.2.2 CMM EMISSIONS FROM ABANDONED COAL MINES No data about methane emissions from abandoned mines in New Zealand are available at this time.
23.2.3 CBM FROM VIRGIN COAL SEAMS Estimates indicate New Zealand has a total of more than 2,000 petajoules or 53 billion m3 of CBM reserves (Clark, 2008). No commercial wells are in production, but numerous exploratory and testwells have been drilled.
At least 16 licenses had been issued for exploratory drilling and development of coal seam gas inNew Zealand (L&M, 2009), but as of 2014, the permits had either been surrendered or were aboutto expire (SourceWatch, 2014). L&M Coal Seam Gas Ltd. (L&M CSG) previously held numerouslicenses, which covered coal resources ranging in rank from lignite to bituminous, with the bulkbeing in the low rank coals. L&M CSG had drilled 52 exploratory wells and started their first pilotproject. In 2009, L&M estimated they had about 1,500 petajoules (40 billion m3) of CBM reserves (L&M, 2009). However, in 2012, the Director’s report stated that although work had continued on
CMM Country Profiles 212
NEW ZEALAND
the Ohai CSG pilot project, the results had been “disappointing” and commercial gas flow rates hadnot been achieved (SourceWatch, 2014).
Other CSG explorers/permit holders include Solid Energy (and its U.S. CSG developer partner, Resource Development Technology) and Macdonald-Chartwell, as well as Bridge Petroleum Ltd inpartnership with Transworld Exploration Ltd and Westech Energy, (Clark, 2008: RigZone, 2004).
23.3 Opportunities and Challenges to Greater CMM Recovery and Use
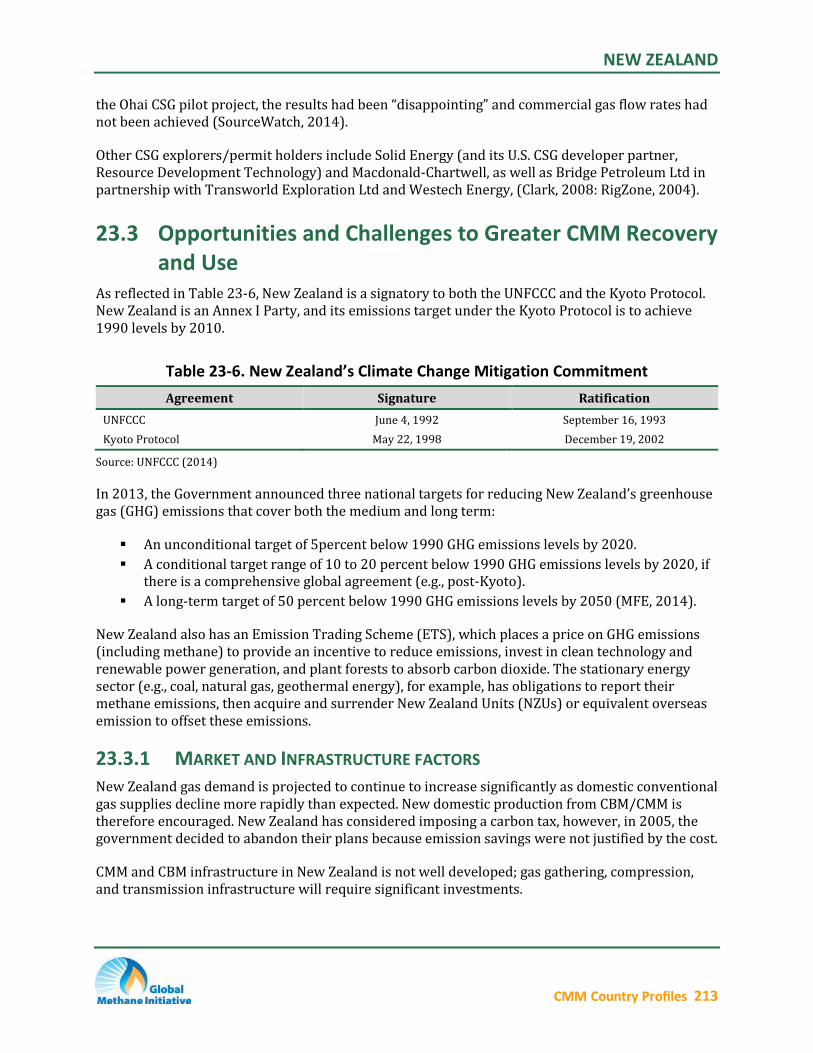
As reflected in Table 23-6, New Zealand is a signatory to both the UNFCCC and the Kyoto Protocol.New Zealand is an Annex I Party, and its emissions target under the Kyoto Protocol is to achieve 1990 levels by 2010.
Table 23-6. New Zealand’s Climate Change Mitigation Commitment Agreement Signature Ratification
UNFCCC June 4, 1992 September 16, 1993 Kyoto Protocol May 22, 1998 December 19, 2002
Source: UNFCCC (2014)
In 2013, the Government announced three national targets for reducing New Zealand’s greenhouse gas (GHG) emissions that cover both the medium and long term:
An unconditional target of 5percent below 1990 GHG emissions levels by 2020. A conditional target range of 10 to 20 percent below 1990 GHG emissions levels by 2020, if
there is a comprehensive global agreement (e.g., post-Kyoto). A long-term target of 50 percent below 1990 GHG emissions levels by 2050 (MFE, 2014).
New Zealand also has an Emission Trading Scheme (ETS), which places a price on GHG emissions (including methane) to provide an incentive to reduce emissions, invest in clean technology andrenewable power generation, and plant forests to absorb carbon dioxide. The stationary energysector (e.g., coal, natural gas, geothermal energy), for example, has obligations to report theirmethane emissions, then acquire and surrender New Zealand Units (NZUs) or equivalent overseasemission to offset these emissions.
23.3.1 MARKET AND INFRASTRUCTURE FACTORS New Zealand gas demand is projected to continue to increase significantly as domestic conventionalgas supplies decline more rapidly than expected. New domestic production from CBM/CMM is therefore encouraged. New Zealand has considered imposing a carbon tax, however, in 2005, the government decided to abandon their plans because emission savings were not justified by the cost.
CMM and CBM infrastructure in New Zealand is not well developed; gas gathering, compression,and transmission infrastructure will require significant investments.
CMM Country Profiles 213
NEW ZEALAND
Any methane recovered in the future could be utilized by the power generation, heating, andtransportation sectors, as well as by the industrial sector for boilers, but it would have to competeagainst gas suppliers and importers. The University of Auckland, the Commonwealth Scientific andIndustrial Research Organization (CSIRO), and other technology organizations are helping toaddress technology issues associated with recovery of CMM and CBM resources.
23.3.2 REGULATORY INFORMATION The New Zealand coal mining industry has undergone major changes over the last 25 years. State-owned coal mines were converted into a government-owned corporation. Natural gas regulationsare governed by the “Gas Act,” which can be found at www.legislation.govt.nz.
23.4 Profiles of Individual Mines See P&M (2014) for links to available mine production data. Updates on future CMM projects inNew Zealand can be found at http://www.globalmethane.org/coal-mines/cmm.index.aspx.
23.5 References Clark (2008): “Gas Riches from our Coal,” Lindsay Clark, Contrafed Publishing, Energy NZ No. 7, Summer
2008. http://www.contrafedpublishing.co.nz/Energy+NZ/Issue+7+Summer+2008/Gas+riches+from+our+coal.html
Coal Association (2012): World Coal Association Country Profile - New Zealand, Coal Association of NewZealand, updated June 2012. http://www.coalassociation.org/profile.htm
EIA (2014): International Energy Statistics. U.S. Energy Information Administration, Washington, DC,accessed July 2014. http://www.eia.gov/cfapps/ipdbproject/IEDIndex3.cfm
GMI (2014): International Coal Mine Methane Projects Database, Global Methane Initiative, accessed July2014. https://www.globalmethane.org/coal-mines/cmm/index.aspx
L&M (2009): L&M Coal Seam Gas Ltd – Presentation, L&M Coal Seam Gas Ltd, October 2009.
MBIE (2013): Coal Summary and Energy in New Zealand: Coal data tables for 2013, Ministry of Business,Innovation & Employment, website accessed September 2014. http://www.med.govt.nz/sectorsindustries/energy/energy-modelling/data/coal
MFE (2014): New Zealand’s greenhouse gas emissions reduction targets, Ministry for the Environment,website accessed November 2014. http://www.mfe.govt.nz/climate-change/reducing-greenhouse-gasemissions/emissions-reduction-targets
MOED (2010): New Zealand Coal Deposits, Ministry of Economic Development, 2010.
P&M (2014): Coal Resources, Petroleum & Minerals (P&M), website accessed September 2014.
RigZone (2004): “Bridge Awarded Three Drilling Permits in New Zealand,” RigZone, 27 July 2004.https://www.rigzone.com/news/oil_gas/a/15086/Bridge_Awarded_Three_Drilling_Permits_in_New_Zealand
SourceWatch (2014): L&M Group, website accessed November 2014.http://www.sourcewatch.org/index.php/L%26M_Group
UNFCCC (2014): Ratification Status – New Zealand , United Nations Framework Convention on Climate Change, website accessed September 2014. http://maindb.unfccc.int/public/country.pl?country=NZ
CMM Country Profiles 214

NEW ZEALAND
USEPA (2012): Global Anthropogenic Non-CO2 Greenhouse Gas Emissions: 1990 - 2030, U.S. EnvironmentalProtection Agency, Office of Atmospheric Programs, Climate Change Division, December 2012.http://www.epa.gov/climatechange/EPAactivities/economics/nonco2projections.html
USGS (2004): New Zealand Coal Resources Fact Sheet, U.S. Geological Survey, September 2004.http://pubs.usgs.gov/fs/2004/3089/fs2004-3089.html
CMM Country Profiles 215
Related Documents