23 March 2022 PHILIPPINE STOCK EXCHANGE, INC. Disclosure Department 6F PSE Tower One Bonifacio High Street 28th Street corner 5th Avenue, Bonifacio Global City Taguig City ATTENTION: MS. JANET A. ENCARNACION Head – Disclosure Department PHILIPPINE DEALING & EXCHANGE CORP. Phlippine Dealing System Holdings Corp. & Subsidiaries 29th Floor, BDO Equitable Tower 8751 Paseo de Roxas, Makati City Telephone Number: 8884 4446 ATTENTION: ATTY. MARIE ROSE M. MAGALLEN-LIRIO Head – Issuer Compliance and Disclosure Department We are pleased to furnish your good office with a copy of our Preliminary SEC 20 Information Statement (pursuant to section 20 of the Securities Regulation Code) filed with the Securities and Exchange Commission (SEC). For your information and guidance. Thank you. Respectfully yours, GERALD O. FLORENTINO Corporate Information Officer 1 1

Welcome message from author
This document is posted to help you gain knowledge. Please leave a comment to let me know what you think about it! Share it to your friends and learn new things together.
Transcript
23 March 2022
PHILIPPINE STOCK EXCHANGE, INC. Disclosure Department 6F PSE Tower One Bonifacio High Street 28th Street corner 5th Avenue, Bonifacio Global City Taguig City
ATTENTION: MS. JANET A. ENCARNACION
Head – Disclosure Department
PHILIPPINE DEALING & EXCHANGE CORP.
Phlippine Dealing System Holdings Corp. & Subsidiaries 29th Floor, BDO Equitable Tower 8751 Paseo de Roxas, Makati City Telephone Number: 8884 4446
ATTENTION: ATTY. MARIE ROSE M. MAGALLEN-LIRIO
Head – Issuer Compliance and Disclosure Department
We are pleased to furnish your good office with a copy of our Preliminary SEC 20 Information Statement (pursuant to section 20 of the Securities Regulation Code) filed with the Securities and Exchange Commission (SEC).
For your information and guidance. Thank you.
Respectfully yours,
GERALD O. FLORENTINO
Corporate Information Officer
11
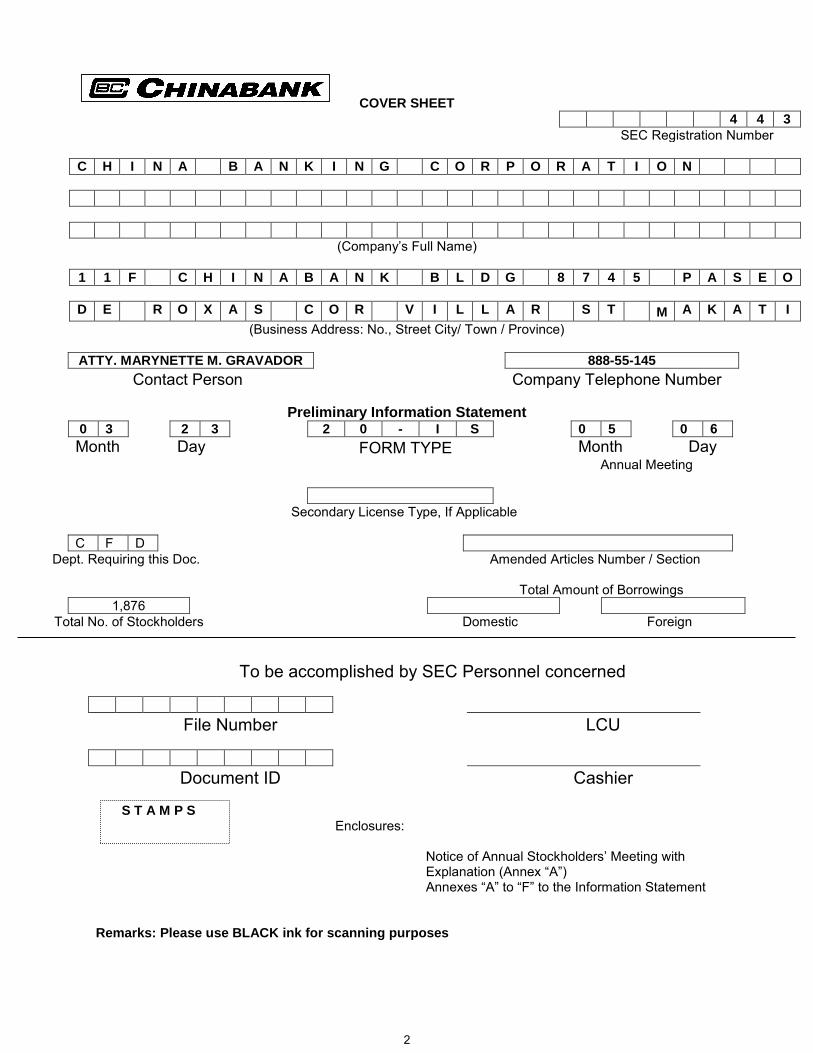
COVER SHEET
4 4 3
SEC Registration Number
C H I N A B A N K I N G C O R P O R A T I O N
(Company’s Full Name)
1 1 F C H I N A B A N K B L D G 8 7 4 5 P A S E O
D E R O X A S C O R V I L L A R S T M A K A T I
(Business Address: No., Street City/ Town / Province)
ATTY. MARYNETTE M. GRAVADOR 888-55-145
Contact Person Company Telephone Number
Preliminary Information Statement 0 3 2 3 2 0 - I S 0 5 0 6Month Day FORM TYPE Month Day
Annual Meeting
Secondary License Type, If Applicable
C F D Dept. Requiring this Doc. Amended Articles Number / Section
Total Amount of Borrowings 1,876
Total No. of Stockholders Domestic Foreign
To be accomplished by SEC Personnel concerned
File Number LCU
Document ID Cashier
S T A M P S Enclosures:
Notice of Annual Stockholders’ Meeting with Explanation (Annex “A”)Annexes “A” to “F” to the Information Statement
Remarks: Please use BLACK ink for scanning purposes
2

33
44
55
P R O X Y
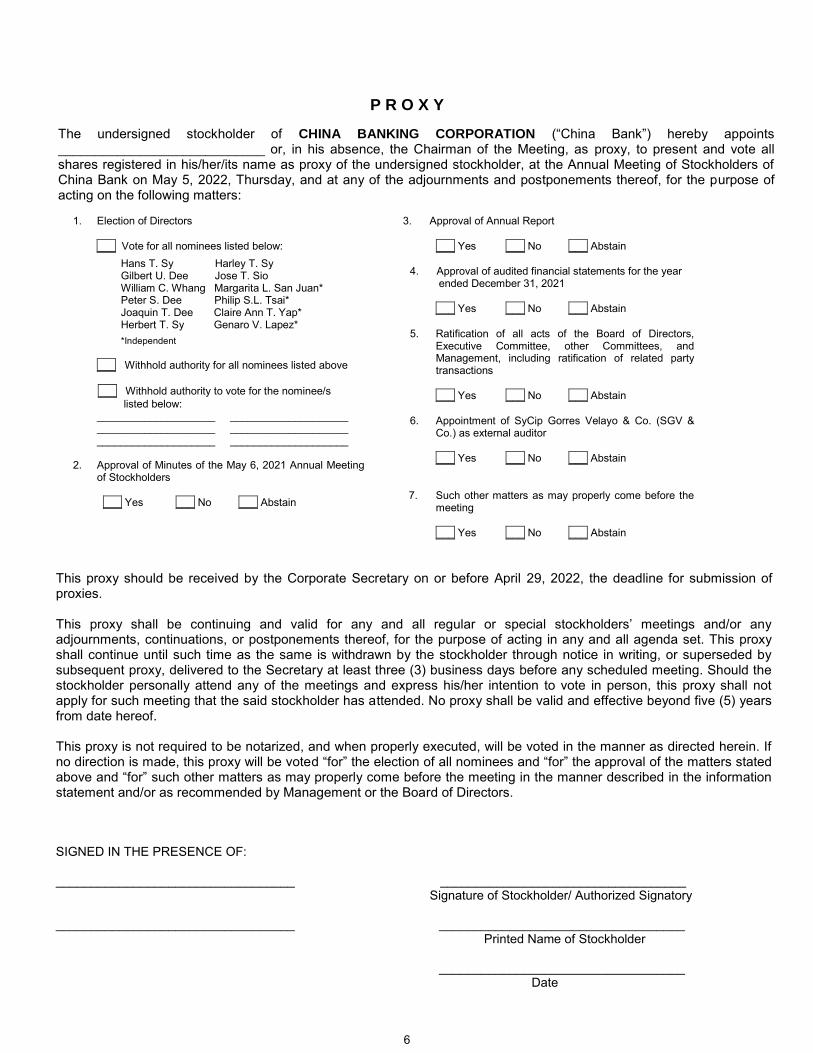
The undersigned stockholder of CHINA BANKING CORPORATION (―China Bank‖) hereby appoints____________________________ or, in his absence, the Chairman of the Meeting, as proxy, to present and vote all shares registered in his/her/its name as proxy of the undersigned stockholder, at the Annual Meeting of Stockholders of China Bank on May 5, 2022, Thursday, and at any of the adjournments and postponements thereof, for the purpose of acting on the following matters:
1. Election of Directors
___ Vote for all nominees listed below: Hans T. Sy Harley T. Sy Gilbert U. Dee Jose T. Sio William C. Whang Margarita L. San Juan* Peter S. Dee Philip S.L. Tsai* Joaquin T. Dee Claire Ann T. Yap* Herbert T. Sy Genaro V. Lapez* *Independent
___ Withhold authority for all nominees listed above
___ Withhold authority to vote for the nominee/slisted below:
____________________ ____________________ ____________________ ____________________ ____________________ ____________________
2. Approval of Minutes of the May 6, 2021 Annual Meeting of Stockholders
___ Yes ___ No ___ Abstain
3. Approval of Annual Report
___ Yes ___ No ___ Abstain
4. Approval of audited financial statements for the yearended December 31, 2021
___ Yes ___ No ___ Abstain
5. Ratification of all acts of the Board of Directors,Executive Committee, other Committees, andManagement, including ratification of related partytransactions
___ Yes ___ No ___ Abstain
6. Appointment of SyCip Gorres Velayo & Co. (SGV &Co.) as external auditor
___ Yes ___ No ___ Abstain
7. Such other matters as may properly come before themeeting
___ Yes ___ No ___ Abstain
This proxy should be received by the Corporate Secretary on or before April 29, 2022, the deadline for submission of proxies.
This proxy shall be continuing and valid for any and all regular or special stockholders‘ meetings and/or any adjournments, continuations, or postponements thereof, for the purpose of acting in any and all agenda set. This proxy shall continue until such time as the same is withdrawn by the stockholder through notice in writing, or superseded by subsequent proxy, delivered to the Secretary at least three (3) business days before any scheduled meeting. Should the stockholder personally attend any of the meetings and express his/her intention to vote in person, this proxy shall not apply for such meeting that the said stockholder has attended. No proxy shall be valid and effective beyond five (5) years from date hereof.
This proxy is not required to be notarized, and when properly executed, will be voted in the manner as directed herein. If no direction is made, this proxy will be voted ―for‖ the election of all nominees and ―for‖ the approval of the matters statedabove and ―for‖ such other matters as may properly come before the meeting in the manner described in the information statement and/or as recommended by Management or the Board of Directors.
SIGNED IN THE PRESENCE OF:
__________________________________ ___________________________________ Signature of Stockholder/ Authorized Signatory
__________________________________ ___________________________________ Printed Name of Stockholder
___________________________________ Date
66

SECURITIES AND EXCHANGE COMMISSION
SEC FORM 20-IS
INFORMATION STATEMENT PURSUANT TO SECTION 20 OF THE SECURITIES REGULATION CODE
1. Check the appropriate box:
[] Preliminary Information Statement [ ] Definitive Information Statement
2. Name of Registrant as specified in its charter: China Banking Corporation
3. Province, country or other jurisdiction of incorporation or organization: Philippines
4. SEC Identification Number: 443
5. BIR Tax Identification Code: 000-444-210-000
6. Address of principal office: China Bank Bldg., 8745 Paseo de Roxas Postal Code: 1226cor. Villar St., Makati City
7. Registrant‘s telephone number, including area code: (632) 888-55555
8. Date, time, and place of the meeting of security holders:
Date: May 5, 2022
Time: 4:00 P.M.
Place: virtually via https://www.chinabank.ph/asm2022
9. Approximate date on which the Information Statement is first to be sent or given to security holders:March 28, 2022 (posted on the Bank‘s website and PSE EDGE)
10. Securities registered pursuant to Sections 8 and 12 of the Code or Sections 4 and 8 of the RSA:
Title of Each Class Number of Shares Outstanding
Common 2,691,288,212
11. Are any or all of registrant‘s securities listed in a Stock Exchange? Yes [] No [ ]
The above common shares are listed in the Philippine Stock Exchange.
77
We are not asking you for a proxy and you are requested not to send us a proxy.
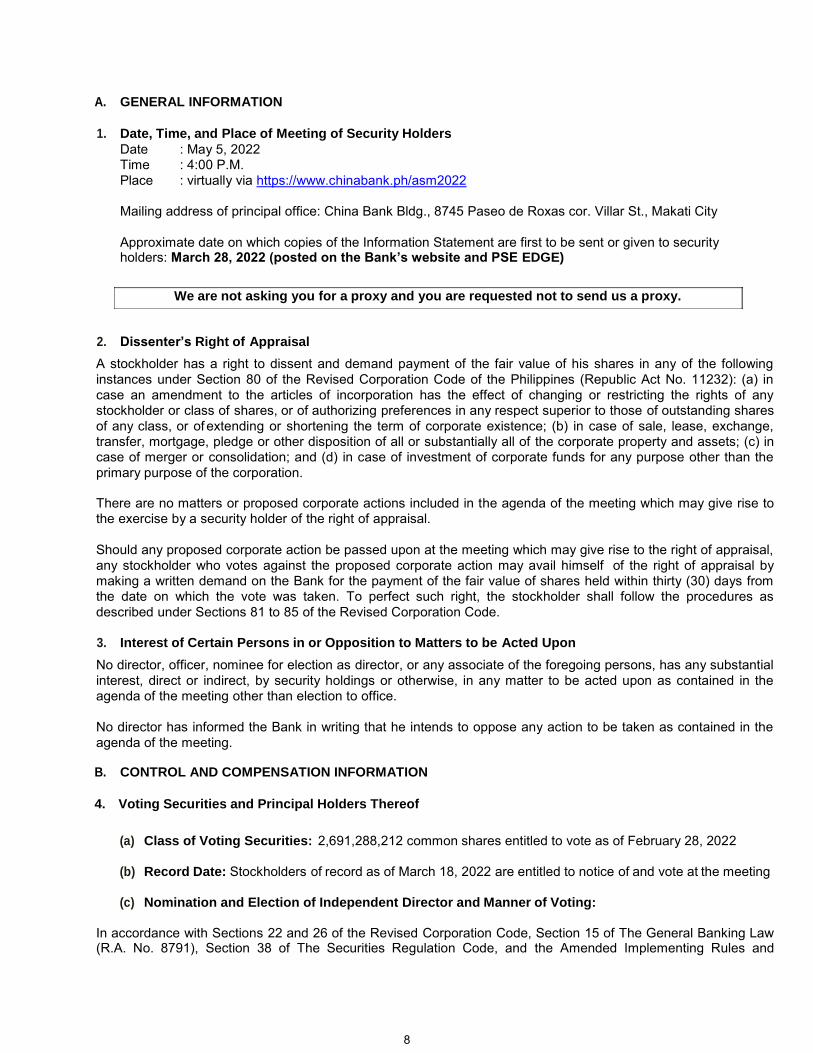
A. GENERAL INFORMATION
1. Date, Time, and Place of Meeting of Security Holders
Date : May 5, 2022 Time : 4:00 P.M. Place : virtually via https://www.chinabank.ph/asm2022
Mailing address of principal office: China Bank Bldg., 8745 Paseo de Roxas cor. Villar St., Makati City
Approximate date on which copies of the Information Statement are first to be sent or given to security holders: March 28, 2022 (posted on the Bank’s website and PSE EDGE)
2. Dissenter’s Right of Appraisal
A stockholder has a right to dissent and demand payment of the fair value of his shares in any of the following instances under Section 80 of the Revised Corporation Code of the Philippines (Republic Act No. 11232): (a) in case an amendment to the articles of incorporation has the effect of changing or restricting the rights of any stockholder or class of shares, or of authorizing preferences in any respect superior to those of outstanding shares of any class, or of extending or shortening the term of corporate existence; (b) in case of sale, lease, exchange, transfer, mortgage, pledge or other disposition of all or substantially all of the corporate property and assets; (c) in case of merger or consolidation; and (d) in case of investment of corporate funds for any purpose other than the primary purpose of the corporation.
There are no matters or proposed corporate actions included in the agenda of the meeting which may give rise to the exercise by a security holder of the right of appraisal.
Should any proposed corporate action be passed upon at the meeting which may give rise to the right of appraisal, any stockholder who votes against the proposed corporate action may avail himself of the right of appraisal by making a written demand on the Bank for the payment of the fair value of shares held within thirty (30) days from the date on which the vote was taken. To perfect such right, the stockholder shall follow the procedures as described under Sections 81 to 85 of the Revised Corporation Code.
3. Interest of Certain Persons in or Opposition to Matters to be Acted Upon
No director, officer, nominee for election as director, or any associate of the foregoing persons, has any substantial interest, direct or indirect, by security holdings or otherwise, in any matter to be acted upon as contained in the agenda of the meeting other than election to office.
No director has informed the Bank in writing that he intends to oppose any action to be taken as contained in the agenda of the meeting.
B. CONTROL AND COMPENSATION INFORMATION
4. Voting Securities and Principal Holders Thereof
(a) Class of Voting Securities: 2,691,288,212 common shares entitled to vote as of February 28, 2022
(b) Record Date: Stockholders of record as of March 18, 2022 are entitled to notice of and vote at the meeting
(c) Nomination and Election of Independent Director and Manner of Voting:
In accordance with Sections 22 and 26 of the Revised Corporation Code, Section 15 of The General Banking Law (R.A. No. 8791), Section 38 of The Securities Regulation Code, and the Amended Implementing Rules and
88
Regulations of the Securities Regulation Code, and Sections 131, 132, and 138 of the Bangko Sentral ng Pilipinas‘ Manual of Regulations for Banks, and relevant circulars or memoranda, the Bank‘s Nominations and Corporate Governance Committees adopted rules governing the nomination and election of independent director. The rules pertinently state that the nomination forms shall be submitted to the Office of the Corporate Secretary on or before March 1, 2022, and thereafter referred to the Committees for evaluation and action. The rules likewise state that the Committees shall pre-screen the qualifications of the nominees and prepare a final list of candidates, indicating the nominees for independent director.
As to the manner of voting, Article III, Section 7 of the Bank‘s By-Laws specifies that any stockholder who is not delinquent in his subscription shall be allowed to vote either in person or by proxy executed in writing by the stockholder or his duly authorized attorney-in-fact in accordance with the requirements of existing rules and regulations. Following Section 23 of the Revised Corporation Code, a stockholder may vote such number of shares for as many persons as there are directors to be elected, or cumulate said shares and give one (1) candidate as many votes as the number of directors to be elected multiplied by the number of the shares owned, or distribute them on the same principle among as many candidates as may be seen fit, provided that the total number of votes cast shall not exceed the number of shares owned by the stockholder as shown in the books of the Bank multiplied by the whole number of directors to be elected.
In accordance with Sections 23 and 57 of the Revised Corporation Code, a stockholder is allowed to vote through remote communication or in absentia. The amendment of the Bank‘s By-laws allowing voting through remote communication or in absentia was approved by the Board of Directors on March 25, 2020, and by the stockholders on June 18, 2020. On March 2, 2022, the Board of Directors approved to allow the conduct of the Annual Stockholders‘ Meeting on May 5, 2022 and participation therein by the stockholders via remote communication or in absentia, in accordance with the Securities and Exchange Commission‘s (SEC) Memorandum Circular No. 6, Series of 2020. Please refer to Schedule ―A‖ of this Information Statement for the Guidelines for the Participation via Remote Communication and Voting in Absentia. Item D.19 of the Information Statement further discusses the voting and tabulation procedures of the Bank.
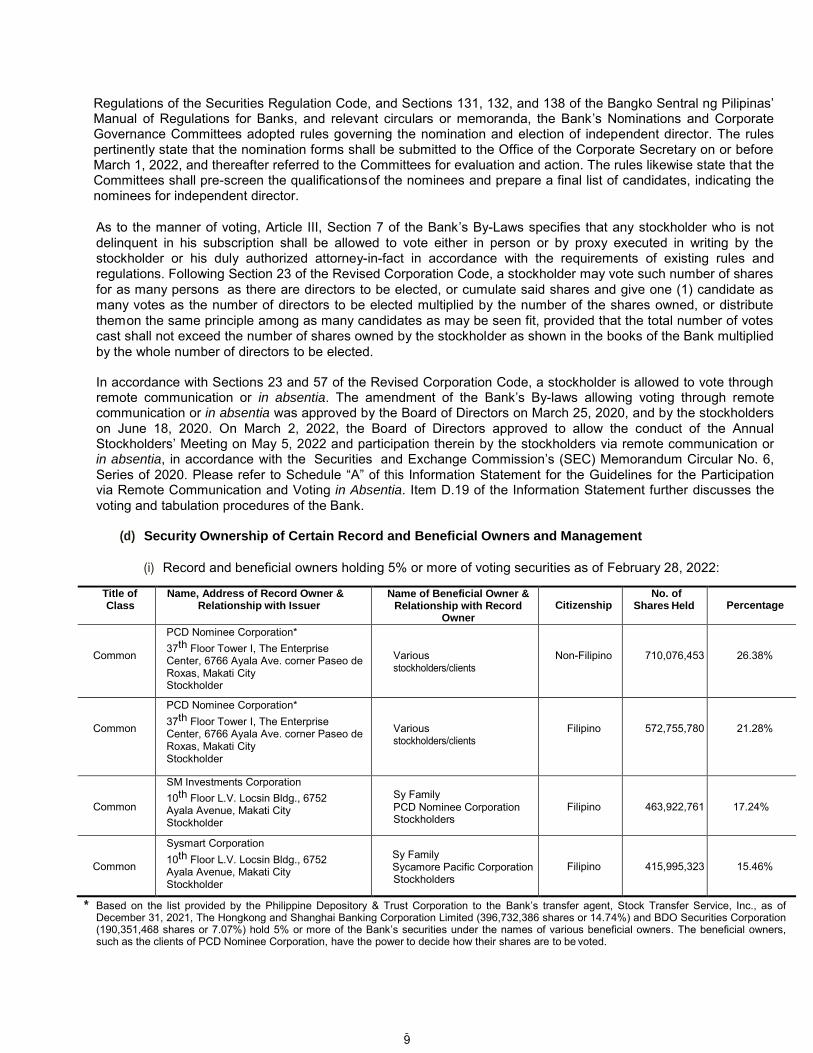
(d) Security Ownership of Certain Record and Beneficial Owners and Management
(i) Record and beneficial owners holding 5% or more of voting securities as of February 28, 2022:
Title of Class
Name, Address of Record Owner & Relationship with Issuer
Name of Beneficial Owner & Relationship with Record
Owner
Citizenship No. of
Shares Held Percentage
Common
PCD Nominee Corporation* 37th Floor Tower I, The EnterpriseCenter, 6766 Ayala Ave. corner Paseo de Roxas, Makati City Stockholder
Various stockholders/clients
Non-Filipino 710,076,453 26.38%
Common
PCD Nominee Corporation* 37th Floor Tower I, The EnterpriseCenter, 6766 Ayala Ave. corner Paseo de Roxas, Makati City Stockholder
Various stockholders/clients
Filipino 572,755,780 21.28%
Common
SM Investments Corporation 10th Floor L.V. Locsin Bldg., 6752Ayala Avenue, Makati City Stockholder
Sy Family PCD Nominee Corporation Stockholders
Filipino 463,922,761 17.24%
Common
Sysmart Corporation 10th Floor L.V. Locsin Bldg., 6752Ayala Avenue, Makati City Stockholder
Sy Family Sycamore Pacific Corporation Stockholders
Filipino 415,995,323 15.46%
* Based on the list provided by the Philippine Depository & Trust Corporation to the Bank‘s transfer agent, Stock Transfer Service, Inc., as ofDecember 31, 2021, The Hongkong and Shanghai Banking Corporation Limited (396,732,386 shares or 14.74%) and BDO Securities Corporation(190,351,468 shares or 7.07%) hold 5% or more of the Bank‘s securities under the names of various beneficial owners. The beneficial owners,such as the clients of PCD Nominee Corporation, have the power to decide how their shares are to be voted.
99
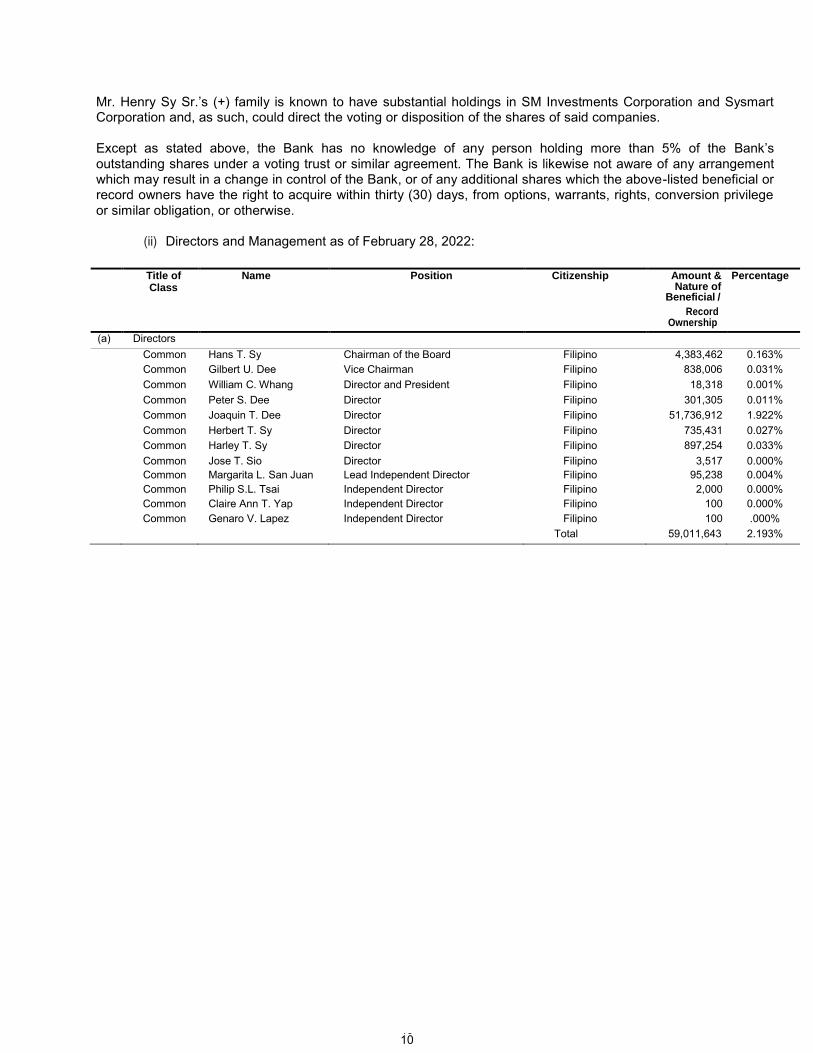
Mr. Henry Sy Sr.‘s (+) family is known to have substantial holdings in SM Investments Corporation and Sysmart Corporation and, as such, could direct the voting or disposition of the shares of said companies.
Except as stated above, the Bank has no knowledge of any person holding more than 5% of the Bank‘s outstanding shares under a voting trust or similar agreement. The Bank is likewise not aware of any arrangement which may result in a change in control of the Bank, or of any additional shares which the above-listed beneficial or record owners have the right to acquire within thirty (30) days, from options, warrants, rights, conversion privilege or similar obligation, or otherwise.
(ii) Directors and Management as of February 28, 2022:
Title of Class
Name Position Citizenship Amount & Nature of
Beneficial /
Percentage
Record Ownership
(a) DirectorsCommon Hans T. Sy Chairman of the Board Filipino 4,383,462 0.163% Common Gilbert U. Dee Vice Chairman Filipino 838,006 0.031% Common William C. Whang Director and President Filipino 18,318 0.001% Common Peter S. Dee Director Filipino 301,305 0.011% Common Joaquin T. Dee Director Filipino 51,736,912 1.922% Common Herbert T. Sy Director Filipino 735,431 0.027% Common Harley T. Sy Director Filipino 897,254 0.033% Common Jose T. Sio Director Filipino 3,517 0.000% Common Margarita L. San Juan Lead Independent Director Filipino 95,238 0.004% Common Philip S.L. Tsai Independent Director Filipino 2,000 0.000% Common Claire Ann T. Yap Independent Director Filipino 100 0.000% Common Genaro V. Lapez Independent Director Filipino 100 .000%
Total 59,011,643 2.193%
1010
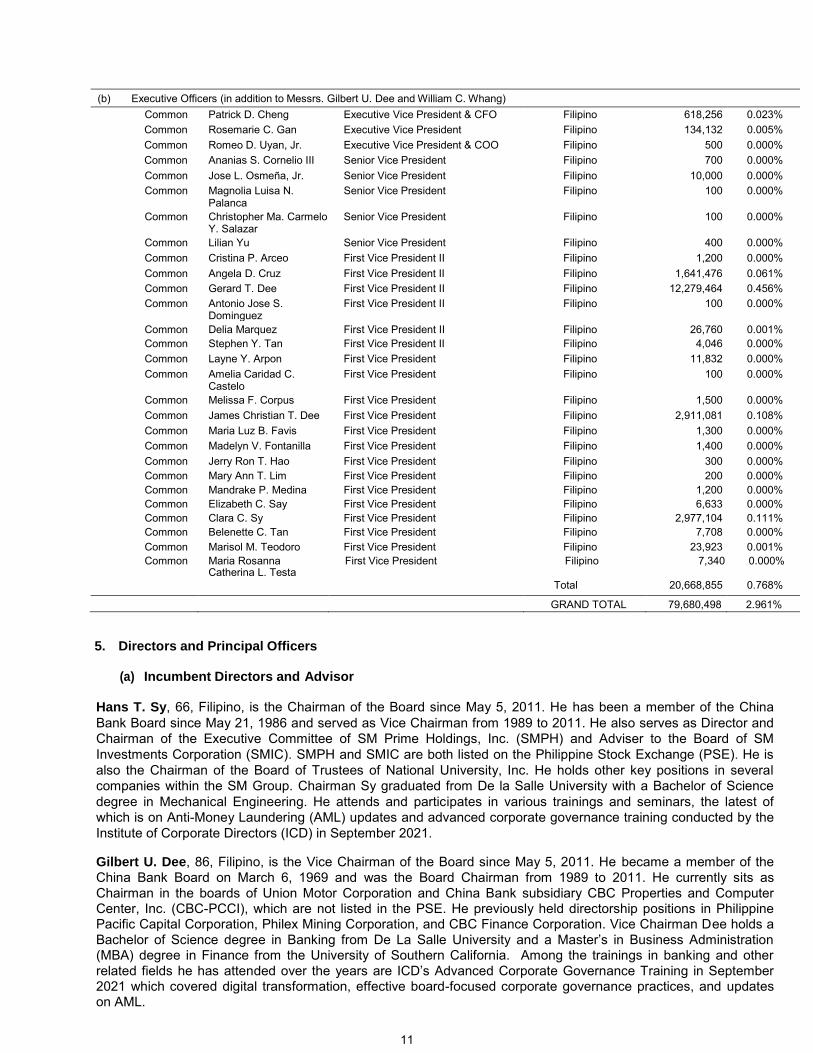
(b) Executive Officers (in addition to Messrs. Gilbert U. Dee and William C. Whang)Common Patrick D. Cheng Executive Vice President & CFO Filipino 618,256 0.023% Common Rosemarie C. Gan Executive Vice President Filipino 134,132 0.005% Common Romeo D. Uyan, Jr. Executive Vice President & COO Filipino 500 0.000% Common Ananias S. Cornelio III Senior Vice President Filipino 700 0.000% Common Jose L. Osmeña, Jr. Senior Vice President Filipino 10,000 0.000% Common Magnolia Luisa N.
Palanca Senior Vice President Filipino 100 0.000%
Common Christopher Ma. Carmelo Y. Salazar
Senior Vice President Filipino 100 0.000%
Common Lilian Yu Senior Vice President Filipino 400 0.000% Common Cristina P. Arceo First Vice President II Filipino 1,200 0.000% Common Angela D. Cruz First Vice President II Filipino 1,641,476 0.061% Common Gerard T. Dee First Vice President II Filipino 12,279,464 0.456% Common Antonio Jose S.
Dominguez First Vice President II Filipino 100 0.000%
Common Delia Marquez First Vice President II Filipino 26,760 0.001% Common Stephen Y. Tan First Vice President II Filipino 4,046 0.000% Common Layne Y. Arpon First Vice President Filipino 11,832 0.000% Common Amelia Caridad C.
Castelo First Vice President Filipino 100 0.000%
Common Melissa F. Corpus First Vice President Filipino 1,500 0.000% Common James Christian T. Dee First Vice President Filipino 2,911,081 0.108% Common Maria Luz B. Favis First Vice President Filipino 1,300 0.000% Common Madelyn V. Fontanilla First Vice President Filipino 1,400 0.000% Common Jerry Ron T. Hao First Vice President Filipino 300 0.000% Common Mary Ann T. Lim First Vice President Filipino 200 0.000% Common Mandrake P. Medina First Vice President Filipino 1,200 0.000% Common Elizabeth C. Say First Vice President Filipino 6,633 0.000% Common Clara C. Sy First Vice President Filipino 2,977,104 0.111% Common Belenette C. Tan First Vice President Filipino 7,708 0.000% Common Marisol M. Teodoro First Vice President Filipino 23,923 0.001% Common Maria Rosanna
Catherina L. Testa First Vice President Filipino 7,340 0.000%
Total 20,668,855 0.768%
GRAND TOTAL 79,680,498 2.961%
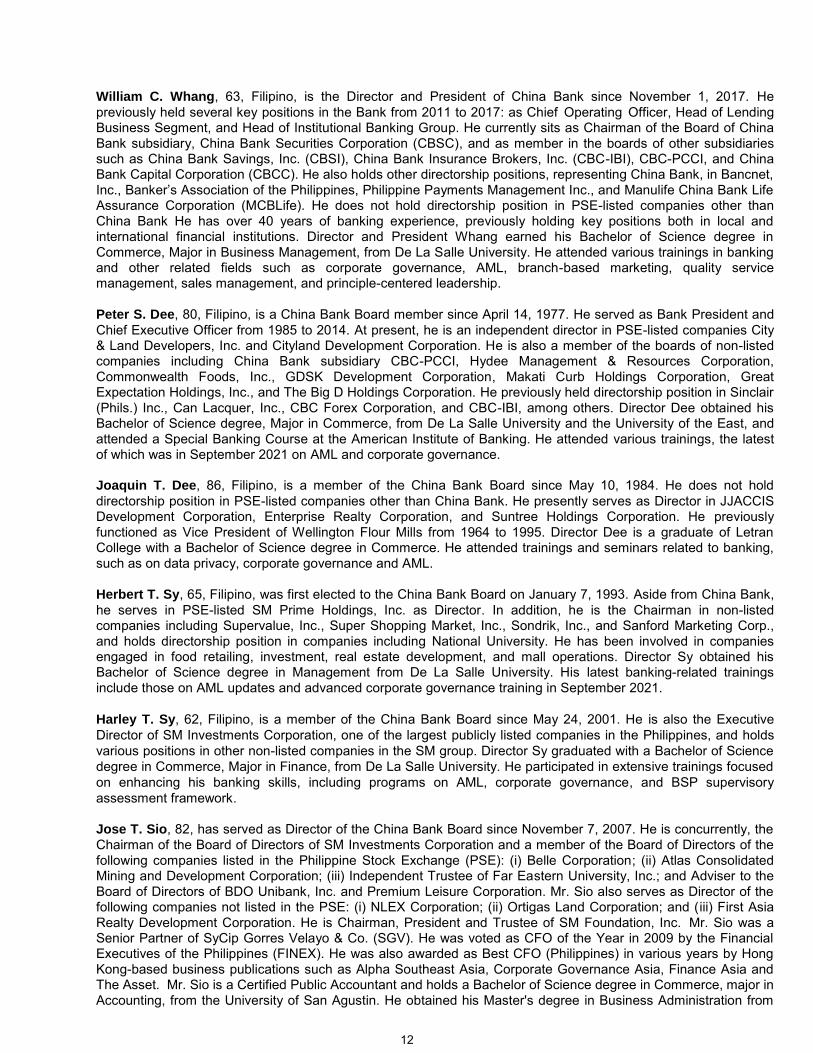
5. Directors and Principal Officers
(a) Incumbent Directors and Advisor
Hans T. Sy, 66, Filipino, is the Chairman of the Board since May 5, 2011. He has been a member of the China Bank Board since May 21, 1986 and served as Vice Chairman from 1989 to 2011. He also serves as Director and Chairman of the Executive Committee of SM Prime Holdings, Inc. (SMPH) and Adviser to the Board of SM Investments Corporation (SMIC). SMPH and SMIC are both listed on the Philippine Stock Exchange (PSE). He is also the Chairman of the Board of Trustees of National University, Inc. He holds other key positions in several companies within the SM Group. Chairman Sy graduated from De la Salle University with a Bachelor of Science degree in Mechanical Engineering. He attends and participates in various trainings and seminars, the latest of which is on Anti-Money Laundering (AML) updates and advanced corporate governance training conducted by the Institute of Corporate Directors (ICD) in September 2021.
Gilbert U. Dee, 86, Filipino, is the Vice Chairman of the Board since May 5, 2011. He became a member of the China Bank Board on March 6, 1969 and was the Board Chairman from 1989 to 2011. He currently sits as Chairman in the boards of Union Motor Corporation and China Bank subsidiary CBC Properties and Computer Center, Inc. (CBC-PCCI), which are not listed in the PSE. He previously held directorship positions in Philippine Pacific Capital Corporation, Philex Mining Corporation, and CBC Finance Corporation. Vice Chairman Dee holds a Bachelor of Science degree in Banking from De La Salle University and a Master‘s in Business Administration (MBA) degree in Finance from the University of Southern California. Among the trainings in banking and other related fields he has attended over the years are ICD‘s Advanced Corporate Governance Training in September2021 which covered digital transformation, effective board-focused corporate governance practices, and updates on AML.
1111
William C. Whang, 63, Filipino, is the Director and President of China Bank since November 1, 2017. He previously held several key positions in the Bank from 2011 to 2017: as Chief Operating Officer, Head of Lending Business Segment, and Head of Institutional Banking Group. He currently sits as Chairman of the Board of China Bank subsidiary, China Bank Securities Corporation (CBSC), and as member in the boards of other subsidiaries such as China Bank Savings, Inc. (CBSI), China Bank Insurance Brokers, Inc. (CBC-IBI), CBC-PCCI, and China Bank Capital Corporation (CBCC). He also holds other directorship positions, representing China Bank, in Bancnet, Inc., Banker‘s Association of the Philippines, Philippine Payments Management Inc., and Manulife China Bank Life Assurance Corporation (MCBLife). He does not hold directorship position in PSE-listed companies other than China Bank He has over 40 years of banking experience, previously holding key positions both in local and international financial institutions. Director and President Whang earned his Bachelor of Science degree in Commerce, Major in Business Management, from De La Salle University. He attended various trainings in banking and other related fields such as corporate governance, AML, branch-based marketing, quality service management, sales management, and principle-centered leadership.
Peter S. Dee, 80, Filipino, is a China Bank Board member since April 14, 1977. He served as Bank President and Chief Executive Officer from 1985 to 2014. At present, he is an independent director in PSE-listed companies City & Land Developers, Inc. and Cityland Development Corporation. He is also a member of the boards of non-listed companies including China Bank subsidiary CBC-PCCI, Hydee Management & Resources Corporation, Commonwealth Foods, Inc., GDSK Development Corporation, Makati Curb Holdings Corporation, Great Expectation Holdings, Inc., and The Big D Holdings Corporation. He previously held directorship position in Sinclair (Phils.) Inc., Can Lacquer, Inc., CBC Forex Corporation, and CBC-IBI, among others. Director Dee obtained his Bachelor of Science degree, Major in Commerce, from De La Salle University and the University of the East, and attended a Special Banking Course at the American Institute of Banking. He attended various trainings, the latest of which was in September 2021 on AML and corporate governance.
Joaquin T. Dee, 86, Filipino, is a member of the China Bank Board since May 10, 1984. He does not hold directorship position in PSE-listed companies other than China Bank. He presently serves as Director in JJACCIS Development Corporation, Enterprise Realty Corporation, and Suntree Holdings Corporation. He previously functioned as Vice President of Wellington Flour Mills from 1964 to 1995. Director Dee is a graduate of Letran College with a Bachelor of Science degree in Commerce. He attended trainings and seminars related to banking, such as on data privacy, corporate governance and AML.
Herbert T. Sy, 65, Filipino, was first elected to the China Bank Board on January 7, 1993. Aside from China Bank, he serves in PSE-listed SM Prime Holdings, Inc. as Director. In addition, he is the Chairman in non-listed companies including Supervalue, Inc., Super Shopping Market, Inc., Sondrik, Inc., and Sanford Marketing Corp., and holds directorship position in companies including National University. He has been involved in companies engaged in food retailing, investment, real estate development, and mall operations. Director Sy obtained his Bachelor of Science degree in Management from De La Salle University. His latest banking-related trainings include those on AML updates and advanced corporate governance training in September 2021.
Harley T. Sy, 62, Filipino, is a member of the China Bank Board since May 24, 2001. He is also the Executive Director of SM Investments Corporation, one of the largest publicly listed companies in the Philippines, and holds various positions in other non-listed companies in the SM group. Director Sy graduated with a Bachelor of Science degree in Commerce, Major in Finance, from De La Salle University. He participated in extensive trainings focused on enhancing his banking skills, including programs on AML, corporate governance, and BSP supervisory assessment framework.
Jose T. Sio, 82, has served as Director of the China Bank Board since November 7, 2007. He is concurrently, the Chairman of the Board of Directors of SM Investments Corporation and a member of the Board of Directors of the following companies listed in the Philippine Stock Exchange (PSE): (i) Belle Corporation; (ii) Atlas Consolidated Mining and Development Corporation; (iii) Independent Trustee of Far Eastern University, Inc.; and Adviser to the Board of Directors of BDO Unibank, Inc. and Premium Leisure Corporation. Mr. Sio also serves as Director of the following companies not listed in the PSE: (i) NLEX Corporation; (ii) Ortigas Land Corporation; and (iii) First Asia Realty Development Corporation. He is Chairman, President and Trustee of SM Foundation, Inc. Mr. Sio was a Senior Partner of SyCip Gorres Velayo & Co. (SGV). He was voted as CFO of the Year in 2009 by the Financial Executives of the Philippines (FINEX). He was also awarded as Best CFO (Philippines) in various years by Hong Kong-based business publications such as Alpha Southeast Asia, Corporate Governance Asia, Finance Asia and The Asset. Mr. Sio is a Certified Public Accountant and holds a Bachelor of Science degree in Commerce, major in Accounting, from the University of San Agustin. He obtained his Master's degree in Business Administration from
1212
New York University, U.S.A. He is actively engaged in continuous trainings, having attended seminars/trainings on investments, loans and financial instruments, structured products, debt and equity financing during the Euromoney Conference in China in 2005, AML updates and advanced corporate governance in 2021.
Margarita L. San Juan, 68, Filipino, is the Lead Independent Director of China Bank. She was first elected to the China Bank Board on May 4, 2017. She is also Independent Director in Bank subsidiaries CBSI, CBCC, CBC-IBI, and CBCC‘s wholly-owned subsidiary Resurgent Capital (FISTC-AMC) Inc. (RCI). She does not hold directorship position in any other PSE-listed company. In the past, she worked with Ayala Investment and Development Corporation, Commercial Bank and Trust Co., and in the Bank‘s Account Management Group as Senior Vice President and Group Head until her retirement in 2012. Director San Juan earned her Bachelor of Science degree in Business Administration, Major in Financial Management, from the University of the Philippines, and completed the Advance Bank Management Program of the Asian Institute of Management (AIM). She participated in various seminars and trainings including development financing, international banking operations, marketing, financial analysis and control, credit, risk management, lending and investment banking, restructuring and corporate rehabilitation, and the latest on AML and corporate governance in September 2021.
Philip S.L. Tsai, 71, Filipino, is an Independent Director of China Bank since November 7, 2018. Aside from the Bank, he does not hold directorship position in other PSE-listed companies. He also serves as Independent Director in the non-listed Bank subsidiaries, namely, CBSI, CBCC, and CBC-IBI. He has about 40 years of banking and financial experience, previously holding key positions in First CBC Capital (Asia) Limited, Midwest Medical Management, Fortune Travel International Inc., Chemical Bank New York, Plastic Container Packaging/Consolidated Can Corp., and in the Bank‘s Retail Banking Business until his retirement in 2015. Director Tsai obtained his Bachelor of Science degree in Business Administration from the University of the Philippines and pursued his master‘s degree in Business Administration from the Roosevelt University in Chicago, Illinois. He participated in several trainings on corporate governance, bank protection, related party transactions, AML, and branch-based marketing, among others. His latest trainings include sustainability in the board room and risk management in the age of COVID-19 in 2020, and effective corporate governance board focus and digital transformation in 2021.
Claire Ann T. Yap, 66, Filipino, is an Independent Director of the Bank since October 1, 2020. She currently does not hold any directorship position in a PSE-listed company other than China Bank, but she serves as Independent Director in the Bank subsidiaries CBSI, CBCC, CBSC, and in CBCC‘s subsidiary RCI, as Board Trustee and Vice Chairperson in Vedruna Foundation, Inc., She has over 30 years of experience in banking and finance in local and multinational organizations. She was the Senior Vice President and Head of Global Service Centre of Global Payments Process Centre, Inc., a Fortune 500 company, and worldwide leader providing payments and financial technology solutions. She has also previously held executive leadership roles at Australia and New Zealand Banking Group Ltd. and Hongkong Shanghai Banking Corporation and served as Chairman of the Credit Card Association of the Philippines from 2009 to 2010 and President from 2007 to 2009. A Certified Public Accountant, Director Yap graduated cum laude from De La Salle University with a Bachelor of Science degree in Accountancy. She has had various trainings on managing customer experience, credit card fraud and security, information security and data privacy, AML, and corporate governance.
Genaro V. Lapez, 64, Filipino, was elected as Independent Director of China Bank on May 6, 2021. He does not hold directorship position in any PSE-listed company other than China Bank. He serves as Independent Director in the Bank subsidiaries CBSI and CBSC. He has more than 10 years of experience in banking and finance in the Philippines, having handled key executive, leadership and advisory positions at Union Bank of the Philippines (UBP), including Head of the Center for Strategic Partnerships and Head of Consumer Finance. He has considerable exposure across various local and global industries spanning fast-moving consumer goods (FMCG), pharmaceuticals, multi-media publishing, banking, and financial services. He has been posted in Hong Kong, Singapore, and Indonesia, and he is conversant in Chinese and Bahasa. Mr. Lapez is a seasoned StracTical (Strategic and Tactical) and GloCal (combining Global Best Practices with Local Realities) thinker. He is also a member of the Management Association of the Philippines (MAP) for more than 10 years. In the past, he held various senior leadership positions in Numico (Netherlands), San Miguel Corporation, Nabisco International, and Time Life Inc. Director Lapez obtained his Bachelor of Science degree in Management Engineering from the Ateneo de Manila University. He participated in numerous trainings and seminars on Retail Banking Leadership (Certificate Program) from The Asian Banker; Retail Banking Future Workshop (Certificate Program) from John Clements Consultants and Harvard Business School; Global Consumer Banking (Certificate Program) from the
1313
European Financial Management Association; and AML updates Corporate Governance, and TechnologyGovernance for Directors from the ICD.
Ricardo R. Chua, 70, Filipino, is Advisor to the Board since November 1, 2017. He previously held several keypositions in the Bank: as Director from 2008 up to October 2017, President and Chief Executive Officer fromSeptember 2014 up to October 2017, and Chief Operating Officer from 2012 to 2014. He is the Advisor of theBank’s Technology Steering Committee and sits in the boards of the following Bank subsidiaries: Chairman ofCBSI and CBCC and Director of CBC-PCCI. A Certified Public Accountant, Mr. Chua graduated with a Bachelor ofScience degree in Business Administration, Major in Accounting, cum laude, from the University of the East, andcompleted his Master’s in Business Management from the AIM. He has had trainings in banking operations andcorporate directorship, and completed AML updates online course and advanced corporate governance training,among others.
Note: Messrs. Gilbert U. Dee and Peter S. Dee are related within the fifth civil degree of consanguinity. Messrs. Hans T. Sy, Herbert T. Sy,and Harley T. Sy are related within the second civil degree of consanguinity.
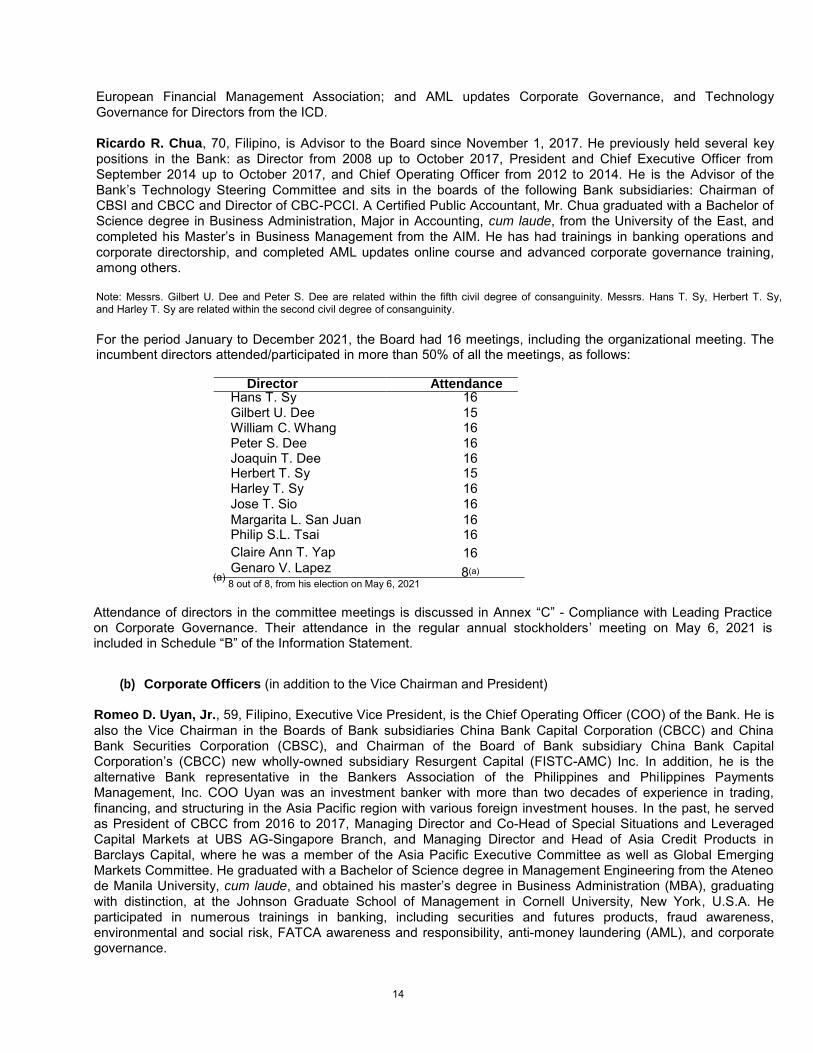
For the period January to December 2021, the Board had 16 meetings, including the organizational meeting. Theincumbent directors attended/participated in more than 50% of all the meetings, as follows:
Director Attendance Hans T. Sy 16 Gilbert U. Dee 15William C. Whang 16Peter S. Dee 16Joaquin T. Dee 16Herbert T. Sy 15 Harley T. Sy 16Jose T. Sio 16Margarita L. San Juan 16Philip S.L. Tsai 16 Claire Ann T. Yap 16Genaro V. Lapez 8(a) (a)8 out of 8, from his election on May 6, 2021
Attendance of directors in the committee meetings is discussed in Annex “C” - Compliance with Leading Practiceon Corporate Governance. Their attendance in the regular annual stockholders’ meeting on May 6, 2021 isincluded in Schedule “B” of the Information Statement.
(b) Corporate Officers (in addition to the Vice Chairman and President)
Romeo D. Uyan, Jr., 59, Filipino, Executive Vice President, is the Chief Operating Officer (COO) of the Bank. He isalso the Vice Chairman in the Boards of Bank subsidiaries China Bank Capital Corporation (CBCC) and ChinaBank Securities Corporation (CBSC), and Chairman of the Board of Bank subsidiary China Bank CapitalCorporation’s (CBCC) new wholly-owned subsidiary Resurgent Capital (FISTC-AMC) Inc. In addition, he is thealternative Bank representative in the Bankers Association of the Philippines and Philippines PaymentsManagement, Inc. COO Uyan was an investment banker with more than two decades of experience in trading,financing, and structuring in the Asia Pacific region with various foreign investment houses. In the past, he servedas President of CBCC from 2016 to 2017, Managing Director and Co-Head of Special Situations and LeveragedCapital Markets at UBS AG-Singapore Branch, and Managing Director and Head of Asia Credit Products inBarclays Capital, where he was a member of the Asia Pacific Executive Committee as well as Global EmergingMarkets Committee. He graduated with a Bachelor of Science degree in Management Engineering from the Ateneode Manila University, cum laude, and obtained his master’s degree in Business Administration (MBA), graduatingwith distinction, at the Johnson Graduate School of Management in Cornell University, New York, U.S.A. Heparticipated in numerous trainings in banking, including securities and futures products, fraud awareness,environmental and social risk, FATCA awareness and responsibility, anti-money laundering (AML), and corporategovernance.
14
Patrick D. Cheng, 59, Filipino, Executive Vice President, is the Chief Finance Officer (CFO) of the Bank. He is alsoin the boards of Bank subsidiaries – China Bank Insurance Brokers, Inc. (CBC-IBI) as Chairman, and China BankSavings, Inc. (CBSI) as Director, and in the Bank’s affiliate - Manulife Chinabank Life Assurance Corporation(MCBLife) as Director. He is also Director of Manila Overseas Commercial Inc. and SR Holdings Corporation. From2008 to 2013, he was the President and Chief Executive Officer of HSBC Savings Bank (Philippines), and from2011 to 2012, he was a two-term President of the Chamber of Thrift Banks. In addition, he previously held variouskey senior executive positions at the Philippine Bank of Communications (PBCom), HSBC Savings Bank(Philippines), HSBC (Philippine Branch), Citibank N.A. (Philippine Branch), and Citicenter Condominium Corp. ACertified Public Accountant (CPA) placing 7th at the CPA Board Examinations, CFO Cheng graduated magna cum laude from the University of the Philippines with a Bachelor of Science degree in Business Administration andAccountancy. He obtained his Master’s in Management degree, with Distinction, from the Hult InternationalBusiness School in Cambridge, Massachusetts, and completed the Trust Operations and Investment Managementcourse, also with Distinction, from the Trust Institute of the Philippines. In 2010, he received the DistinguishedAlumnus Award from the Virata School of Business of the University of the Philippines – Diliman. His extensivetrainings in banking and related fields include corporate governance, AML, asset liability management, operationalrisk, and information security.
Christopher Ma. Carmelo Y. Salazar, 48, Filipino, Senior Vice President effective March 3, 2022, is the Treasurerand Treasury Group Head of the Bank. He has gained more than 25 years of financial markets experience, holdingvarious senior key roles from different institutions including First Metro Investment Corporation, ING Bank-Manila,Standard Chartered – Manila, Thailand, and U.A.E., and Landbank of the Philippines. Mr. Salazar graduated with aBachelor of Science in Management Engineering degree from the Ateneo de Manila University. He took up theTreasury Certification Program of the Ateneo-BAP Institute of Banking, and participated in numerous trainings andseminars in corporate governance, anti-money laundering, operational risk, information security, data privacy, bankmarketing management, risk management, ethical decision making, and leadership.
Leilani B. Elarmo, 45, Filipino, is the new Corporate Secretary of the Bank having been appointed to the postioneffective January 1, 2022. She joined the Bank’s Office of the Corporate Secretary in 2005 where she wasAssistance Corporate Secretary from 2006 and became Deputy Head of the Office of the Corporate Secretary inDecember 2021 after a brief but significant stint at the Legal and Collection Group. She also served as theCorporate Secretary of a Bank subsidiary, CBC Properties and Computer Center, Inc. (CBC-PCCI), from 2007 to2021. Prior to joining the Bank, she was a Court Attorney at the Supreme Court of the Philippines under AssociateJustice Vicente V. Mendoza until his retirement and subsequently under Associate Justice Ma. Alicia Austria-Martinez, and worked as Junior Associate at Cayetano Sebastian Ata Dado and Cruz Law Offices. She earned herBachelor of Laws degree from the University of the Philippines, where she also obtained her Bachelor of Science inBusiness Administration degree, cum laude. To further hone her skills and knowledge, she has attended severaltrainings and seminars on corporate housekeeping, mandatory continuing legal education, corporate governance,and AML.
Aileen Paulette S. De Jesus, 55, Filipino, is the Chief Compliance and Governance Officer of the Bank. A CPA-Lawyer by profession, Atty. De Jesus has over 30 years of extensive experience in audit, corporate taxation, legal,and compliance, having previously handled the positions of audit examiner, financial analyst, tax associate, generalcounsel, corporate secretary, and chief compliance officer in various companies including Sycip Gorres Velayo &Co., Far East Bank & Trust Co., International Exchange Bank, Metrobank Card Corporation, Sterling Bank of Asia,Filinvest Group of Companies, Sumitomo Mitsui Banking Group, and Philippine Veterans Bank. She obtained herBachelor of Science degree in Business Administration, Major in Accounting, from the University of the Philippines,and went on to take up her law degree from the Graduate School of Law of San Sebastian College Recoletos. Atty.De Jesus is an active member of BAIPHIL’s Legal and Regulatory Committee which in 2021, conducted multiple
legal seminars/forum attended by lawyers of various banks. She drives the overall compliance and corporategovernance activities of the Bank and regularly participates in seminars and trainings related to compliance, AML,corporate governance and sustainability.
Ronald R. Marcaida, 48, Filipino, is the Chief Audit Executive (CAE) of the Bank. He is a homegrown talent ofChina Bank, having joined the Bank in 1995 as audit assistant, rising from the ranks and occupying several keyaudit roles over time. At present, he also serves as CAE of Bank subsidiary CBSI. CAE Marcaida is a CertifiedPublic Accountant. He earned his Bachelor of Science degree in Accountancy, cum laude, from the University ofNueva Caceres. He regularly attends trainings and seminars in banking, auditing, and other related fields, includingcorporate governance, AML, continuing profession development training for auditors, information security,
15
compliance, risk management, financial reporting standards, card fraud, trust, data privacy, and supervisory expectations, among others.
(c) Principal Officers
Rosemarie C. Gan, 64, Filipino, Executive Vice President, is the Segment Head of Retail Banking Business (RBB). At present, she also serves as Director in Bank subsidiaries China Bank Savings, Inc. (CBSI) and CBC Properties and Computer Center, Inc. (CBC-PCCI). With more than 40 years of experience with the Bank, her exposure and training in banking include marketing, financial analysis, credit portfolio management, strategic planning, and corporate governance. Ms. Gan obtained her Bachelor of Science degree in Business Administration, Major in Management, from the University of Santo Tomas, where she graduated magna cum laude and received the distinguished Rector‘s Award. She attended the Asian Institute of Management‘s (AIM) Advanced Bank Management Program, BAI Retail Delivery Conference conducted by the Bank Administration Institute, and Corporate Governance and AML workshops/seminars conducted by the Institute of Corporate Directors (ICD) from 2014 to 2021.
Aloysius C. Alday, Jr., 52, Filipino, Senior Vice President, is the Segment Head of Consumer Banking Segment. He previously functioned as Group Head of the Bank‘s Cards Business and Customer Contact Center until his appointment as Consumer Banking Segment Head effective March 1, 2022 in view of the change in the organizational structure with other businesses, such as Credit Card, Customer Contact, Consumer Banking, and Multi-Purpose Loan, being folded into the Consumer Banking Segment. He has more than 25 years of experience in the banking industry, having worked in the past with HSBC, Metrobank Card Corporation and Metropolitan Bank and Trust Co., in the fields of cards and payments, retail banking, consumer and corporate credit risk and bancassurance. Mr. Alday graduated from the University of the Philippines with a Bachelor of Science degree in Business Administration. He has obtained extensive banking exposures in the Philippines, Hong Kong, Singapore, United Kingdom, and Australia. He also attended trainings on AMLA, data privacy and corporate governance.
Ananias S. Cornelio III, 46, Filipino, Senior Vice President, is the Chief Risk Officer (CRO) of the Bank. He has around 25 years of banking experience, handling risk, treasury or audit functions at the Development Bank of the Philippines, Rizal Commercial Banking Corporation, First Metro Investment Corporation, and Solid Bank Corporation. Mr. Cornelio earned his Bachelor of Science degree in Commerce, Major in Management, with academic distinction, from the San Beda College, and a master‘s degree in Public Administration, academic scholar, from the National University of Singapore. He also took up the Bank Management Course in AIM. CRO Cornelio participated in extensive trainings on the Basel Capital Accord, risk management, corporate governance, macro prudential supervision and regulatory change, credit derivatives and structured products, interest rate and currency derivatives, economic forecasting, and ISDA documentation, among others. He has been a panelist/speaker in major events in the region which include The Asian Banker Summit, ASEAN Risk Forum, Risk Minds Asia, and ADB Regional Forum on Financial Asset and Liability, and past resource person/lecturer for the Bankers Institute of the Philippines (BAIPHIL), and the Association of Development Financing Institutions in Asia and the Pacific (ADFIAP). He is presently the Sub-Committee Chairman on Basel Standards Implementation under the Risk Management Committee of the Bankers Association of the Philippines.
Jose L. Osmeña, Jr., 63, Filipino, Senior Vice President, is the Deputy Group Head of RBB. He has been with the Bank for more than 30 years. He previously worked at Insular Bank of Asia and America and Producers Bank of the Philippines prior to joining China Bank. Mr. Osmeña holds a Bachelor of Science degree in Commerce, Major in Accounting, from the University of San Carlos, and he earned his Master of Science degree in Business Administration from the same university. He also completed the AIM‘s Advance Bank Management Program. He participated in several trainings on export financing, loan documentation, money market, service quality management, channels marketing, corporate governance, and AML.
Magnolia Luisa N. Palanca, 52, Filipino, Senior Vice President, is the Head of Financial Markets Segment. She is also currently sits in the board of Bank subsidiary China Bank Capital Corporation (CBCC). She has more than 30 years of banking experience, mainly focused on financial markets, having worked with several financial institutions before joining the Bank, such as J.P. Morgan (S.E.A. Limited) in Singapore and J.P. Morgan Chase Bank, N.A.- Manila Branch; Standard Chartered Bank Manila; ING Bank NV Manila Branch, Solidbank Corporation, and Metropolitan Bank and Trust Company. She obtained her Bachelor of Science degree in Business Economics from the University of the Philippines - Diliman. She is also an SEC Fixed Income Licensed Salesman, Ateneo-BAP Certified Treasury Professional, and was a Registered Representative with the Monetary Authority of Singapore from 2015-2018. Her trainings and seminars attended focused on FX, financial derivatives, capital markets, leadership, and corporate governance.
1616
Manuel C. Tagaza, 59, Filipino, Senior Vice President, is the Head of the Digital Banking Group. He is also currently the General Manager of Bank subsidiary CBC-PCCI. For over 30 years, Mr. Tagaza has handled key positions in companies engaged in banking and technology solutions. Before joining the Bank, he was Senior Vice President at the Bank of the Philippine Islands, Senior Vice President at TIM Corporation, and Vice President at PCI Bank. He is currently a member of the Instapay ACH Steering Committee and the PPMI Technical Working Group. He graduated with a Bachelor of Science degree in Industrial Engineering from the University of Santo Tomas. He attended Harvard Business School Publishing‘s Leadership Management Program, the ASEAN
Banking Council‘s ASEAN Banking Conference in Cambodia, as well as other local and international seminars and banking conferences related to financial services, business leadership, retail payments, and real time payments.
Lilian Yu, 56, Filipino, Senior Vice President, is the Head of the Institutional Banking Segment. She also currently sits as Director in the boards of Bank subsidiaries CBCC and CBCC‘s wholly-owned subsidiary Resurgent Capital (FISTC-AMC) Inc. Her more than 30 years of experience in the financial industry spans the areas of credit, project and structured finance, and debt capital markets. Prior to joining the Bank, she was an International Consultant for the Asian Development Bank. She also worked for international financial institutions abroad such as Barclays Capital, ABN Amro Bank, Deutsche Bank, and the International Finance Corporation (IFC) of the World Bank Group. A Certified Public Accountant (CPA), Ms. Yu holds a Bachelor of Science degree in Business Administration and Accountancy, magna cum laude, from the University of the Philippines. She obtained her MBA degree from the Wharton School of the University of Pennsylvania. She was also conferred the Certified Financial Analyst (CFA) designation by the CFA Institute.
Cristina P. Arceo, 53, Filipino, First Vice President II, is the Head of Treasury Group‘s Investment Management Division. She has more than 30 years of banking and asset management experience, formerly holding officership positions at Philam Asset Management Inc. and Philippine National Bank. Ms. Arceo obtained her Bachelor of Science degree in Economics from the University of the Philippines and earned her MBA degree from De La Salle University. She also successfully passed the SEC‘s Fixed Income Salesman Licensing Exam. She attended trainings on strategic systems thinking, foreign exchange, money and capital markets, interest rate swaps and options, market reading, derivatives documentation, and portfolio management, among others. She received awards for ―Best in Bond Trading‖ from The Asset for seven (7) years. She earned her CFA charter in 2011 and was the former President and Chairman of the Board of Trustees of the CFA Society Philippines (CFAP). She still sits as member of the Board of Trustees of CFAP. She is also affiliated with other finance associations namely, the Fund Managers Association of the Philippines, Inc. (FMAP) where she sits as member of the Board Senior Advisers, and the Money Market Association of the Philippines, Inc. (MART) of which she served as its President in 2021 and currently sits in its Board of Directors.
Angela D. Cruz, 62, Filipino, First Vice President II, is the Head of Wealth Management Group. She also presently serves as Director of Wellington Investment and Manufacturing Corporation and holds key positions in Suntree Holdings Corporation and JJACCIS Development Corporation. Prior to joining the Bank, she held executive positions at Citibank N.A., Far East Bank and Trust Company, and Equitable PCI Bank. Ms. Cruz earned her Bachelor of Science degree in Commerce, Major in Management of Financial Institutions, from De La Salle University. Her professional trainings related to banking operations include Bourse Game, account and performance management, customer service, AML, and corporate governance. She is related within the first civil degree of consanguinity to Bank Director, Mr. Joaquin T. Dee.
Gerard Majella T. Dee, 58, Filipino, First Vice President II, is the Head of Investment Banking Segment‘s
Commercial Banking II. He also currently holds the position of Treasurer in 3700 Gabong Properties, Inc., and December 10 Holdings. Before joining the Bank, he held key positions at Security Bank Corporation, TA Bank of the Philippines, and Banco de Oro. Mr. Dee graduated with a Bachelor of Science degree in Marketing from De La Salle University and an MBA degree from the New Hampshire College. He attended banking-related trainings on core credit, remedial management, and relationship marketing, among others. He is related within the first civil degree of consanguinity to Mr. Gilbert U. Dee, Vice Chairman of the Board.
Antonio Jose S. Dominguez, 54, Filipino, First Vice President II, is the Head of the Multi-Purpose Loans Division. He has more than 30 years of experience in the financial industry, primarily in the key areas of Sales Management and Business Development. Most of his experience was gained in HSBC Philippines, under its two management training programs that led to his holding various senior roles in Consumer Loans, Credit Cards, Retail Banking, Wealth Management, Business Banking, Institutional Banking, and Global Custody. Prior to joining the Bank, he headed the Sales and Marketing Groups of City Savings Bank and Rosehill Memorial Management, Inc. Earlier in his career, he worked in All Asia Capital and Trust Corporation, All Asia Securities Management Corporation, DMT
1717
Securities Inc., and AGJ Securities Corporation. He has had professional trainings on leadership management, sales management, performance management, and digital marketing. He holds a Bachelor of Science degree in Commerce, Major in Management, from the Colegio de San Juan de Letran.
Delia Marquez, 60, Filipino, First Vice President II, is the Head of the Centralized Operations Group. She previously worked as Auditor at SGV & Co. and Transunion Corporation. A Certified Public Accountant, she graduated with a Bachelor of Science degree in Commerce, Major in Accounting, cum laude, from the University of Santo Tomas. She attended various seminars on corporate governance, AML, Internal Capital Adequacy Assessment Process (ICAAP), risk model validation, Internal Credit Risk Rating System (ICRRS), Philippine Financial Reporting Standards (PFRS), The Asian Banker‘s Future of Finance Summit 2017, SAS Management, Inc.‘s Intro to Agile Project Management, GGAPP and PWC Phils.‘ Annual GGAPP Forum on Good Governance, Ethics and Compliance, and ICD‘s Corporate Governance Training Program.
Stephen Y. Tan, 55, Filipino, First Vice President II, is the Head of RBB - Visayas Region. He has more than 30 years of banking experience, having handled various positions at Far East Bank and Trust Company, Equitable PCI Bank, and International Exchange Bank, prior to joining the Bank. A CPA, Mr. Tan earned his Bachelor of Science degree in Commerce, Major in Accounting, from the University of San Carlos. He attended several trainings on account management strategies, AML, managerial skills training, and other trainings in banking and other related fields.
Layne Y. Arpon, 61, Filipino, First Vice President I, is the Head of Institutional Banking Segment‘s Corporate Banking I. In the past, she worked in financial institutions including BDO Unibank, The Manila Banking Corporation, Security Bank Corporation and Land Bank of the Philippines, with exposure in commercial banking, corporate banking, investment banking, credit review and underwriting, project finance and audit. Ms. Arpon took up Bachelor of Science in Commerce, Major in Accounting, from the Far Eastern University, and is a licensed CPA. She attended various trainings on trade finance, core credit, financial analysis, project financing, and credit investigation and property appraisal, among others.
Grace C. Buenavista, 49, Filipino, First Vice President I, is the Head of Institutional Banking Segment‘s
Commercial Banking III. She has over 20 years of banking experience, which she acquired in banks such as Metropolitan Bank and Trust Company, Rizal Commercial Banking Corporation, Equitable PCI Bank, and Solid Bank Corporation. She graduated with a Bachelor of Science degree in Business Administration, Major in Accounting, from the Philippine School of Business Administration. She obtained her Executive Master‘s degree in Business Administration from AIM. She has also obtained relevant training in various topics such as AMLA, cash management, project finance, audit, and corporate governance.
Amelia Caridad C. Castelo, 58, First Vice President I, is the Head of the Bank‘s Enterprise Business Intelligence
Division. She has over 30 years of experience in the use of analytics tools and methodologies, quantitative modelling, and data-driven decision management, and has applied those tools and technologies in various banking roles for Risk, Sales & Marketing, and Finance groups. She previously worked with Standard Chartered Bank (in the Philippines and Hong Kong), HSBC Manila, East West Banking Corporation, and BDO Unibank. Her roles provided extensive experience in risk modelling, advanced analytics, customer segmentation, campaign management and analysis, profit model development, and risk capital modelling, as she has handled roles related to Risk Analytics, Marketing Analytics, Business Intelligence, Credit Policy and MIS. Ms. Castelo graduated with a Bachelor of Science degree in Statistics from the University of the Philippines – Diliman and took post-graduate units in Industrial Engineering from the same university. She recently completed the Executive Program in Data Science and Analytics from the University of California in Berkeley, U.S.A. She has also participated in various trainings on credit risk and operational risk management, Basel standard, risk model development and validation, PFRS, financial consumer protection, and AML.
Melissa F. Corpus, 53, Filipino, First Vice President I, is the Head of Credit Management Group. She has 33 years of experience in banking and finance, having worked with various financial institutions such as Far East Bank and Trust Company, Hongkong and Shanghai Banking Corporation, and Citibank, N.A. – Manila. She has gained a wide span of banking exposure in the areas of credit analysis, credit risk management, relationship management of corporate and financial institutions, loan syndications, project finance, credit policy formulation, and documentation management. She was an academic scholar at the Ateneo de Manila University where she graduated with a Bachelor of Science in Management degree. Apart from having engaged in different trainings on credit, risk management, treasury, derivatives, international trade, property appraisal, and various external regulations, she also finished her comprehensive Executive Training Program at the HSBC Group Management Training College in Bricket Wood, United Kingdom.
1818

Francis Andre Z. De Los Santos, 49, Filipino, First Vice President I, is the Bank‘s Business Solutions Head. He previously worked for SM Retail, Inc. and Metropolitan Bank and Trust Company, gaining significant experience in the retail and banking business. He graduated with a Bachelor of Science degree in Business from De La Salle University. He has had trainings in information systems and business information security, among others.
James Christian T. Dee, 48, Filipino, First Vice President I, is the Director and President of Bank subsidiary, CBSI since 2021. He was first seconded to CBSI in 2012 as its Treasurer. He has nearly 20 years of banking experience, having previously worked in Citibank N.A. Philippines handling treasury portfolio and product development. He also briefly worked as a field engineer in Chevron Philippines. He graduated with a Bachelor of Science degree in Mechanical Engineering from the University of the Philippines – Diliman and obtained his master‘s degree in Business Management from AIM. He has also completed a one-year course on Trust Operations from the Trust Institute Foundation of the Philippines and the Ateneo-BAP Treasury Certification Program. He has had trainings on treasury, strategic asset and liability management, and ICAAP risk models validation. He is related within the first civil degree of consanguinity to Bank Director, Mr. Joaquin T. Dee.
Maria Luz B. Favis, 61, Filipino, First Vice President I, is the Head of Asset Quality and Recovery Management Division. In the past, she held key positions in Philippine Commercial International Bank (PCIBank) and Planters Development Bank with exposure on account management, commercial lending, and credit. Her extensive trainings covered loan evaluation and marketing, financial analysis, and credit risk management, supplemented by seminars on mergers and acquisitions, bank sales and marketing strategies and real estate management. Ms. Favis is a Bachelor of Arts degree holder in Economics from De La Salle University and obtained her master‘s degree in Business Management from AIM.
Gerald O. Florentino, 53, Filipino, First Vice President I, is the Head of Investor and Corporate Relations Group. He is a seasoned banker having obtained 30 years of extensive experience in investor relations, corporate planning, and investment banking. Prior to joining the Bank, he served as the President and Chief Executive Officer of RCBC Securities, Inc., Head of Corporate Planning and Investor Relations for Rizal Commercial Banking Corporation, and worked in several institutions including United Coconut Planters Bank, Deutsche Bank Philippines, and AXA Philippines. He graduated with a Bachelor of Science degree in Business Administration, Major in Finance, from the Loyola University in Chicago, USA. He has also obtained his master‘s degree in Business Administration from AIM.
Madelyn V. Fontanilla, 59, Filipino, First Vice President I, is the Head of RBB‘s Branch Operations Division. She has 37 years of banking experience, with focus on retail banking and branch operations, gained from Equitable PCI Bank and PCI Bank. A CPA, she is a graduate of Bachelor of Science in Business Administration, Major in Accounting, cum laude, from the University of the East. She participated in various trainings on branch automation, leadership, financial planning, operations control enhancement, leadership, and AML, among others.
Jerry Ron T. Hao, 41, Filipino, First Vice President I, is the Bank‘s Chief Dealer. He was Head of FX and Derivatives of the Bank from 2016 to 2021. Prior to joining the Bank, he gained professional experience from ING Bank and International Exchange Bank. He graduated with a Bachelor of Science in Management Engineering degree from the Ateneo de Manila University. He completed the Treasury Certification Program conducted by the Ateneo-BAP Institute of Banking and is an SEC Fixed Income Market Salesman. He is actively involved in attending several trainings such as on credit derivatives and structured products.
Mary Ann T. Lim, 53, Filipino, First Vice President I, is the Bank‘s Trust Officer and the Head of the Trust and
Asset Management Group. She currently serves in the Board of the Trust Officers Association of the Philippines (TOAP) as Treasurer and Finance Director. She has more than 30 years of banking experience, having worked with different financial institutions, including Bank of China Ltd. Manila Branch, The Hongkong & Shanghai Banking Corporation Ltd., and PCI Bank. She earned her Bachelor of Science degree in Commerce, Major in Accounting, cum laude, from the University of San Carlos. She is a Certified Public Accountant. She completed the Trust Operations and Investment Management course from the Trust Institute Foundation of the Philippines. She is also a SEC Certified Fixed Income Market Salesman. She has had various trainings in banking and related fields, including those which focused on trust management, estate planning, corporate governance, anti-money laundering, and operational and reputational risks.
1919
Mandrake P. Medina, 51, Filipino, First Vice President I, is the Head of RBB – South Luzon Region. He has more than 30 years of banking experience, which he has acquired from banks such as Citytrust Banking Corporation, Solid Bank Corporation, United Overseas Bank, and Chinatrust Banking Corporation. He graduated with a Bachelor of Arts degree in Liberal Arts – Commerce (LIACOM), majoring in Political Science and Accounting, from the University of Batangas. His professional trainings include AML, corporate governance, risk management, operations control, and service excellence.
Elizabeth C. Say, 63, Filipino, First Vice President I, is the Head of the Branches Administration Division of RBB. She has been with the Bank for over 30 years. She was an internal auditor at Morrison Forwarding Corporation and a money market trader at State Investment House, Inc. before she joined the Bank. A Certified Public Accountant, Ms. Say is a graduate of Bachelor of Science in Commerce, Major in Accounting, from the University of Santo Tomas. She participated in trainings on corporate governance, integrated risk management, credit risk management, foreign exchange, loan review and classification, AML, and information security, among others.
Clara C. Sy, 62, Filipino, First Vice President I, is the Region Head for Metro Manila East of RBB. She also holds officership positions in New Golden City Builders & Development Corp. and Citigold Resources & Development Corporation. She has been with the Bank for 40 years handling retail banking and branches administration. A CPA, she holds a Bachelor of Science degree in Commerce, Major in Accounting, from the University of Santo Tomas. She attended several trainings on enhancing managerial skills and branch management.
Belenette C. Tan, 57, Filipino, First Vice President I, is the Bank‘s Chief Legal Counsel and Head of Legal and
Collection Group. She is also the concurrent Corporate Secretary of Bank subsidiary China Bank Insurance Brokers, Inc. (CBC-IBI). She has been with the Bank for more than 25 years. She also holds positions in other companies, including Sky Printing Company, Inc. as Chief Financial Officer, and Mirabell Medical Corporation as Director. Atty. Tan previously worked with Yap, Apostol, Gumaru and Balgua Law Offices, prior to joining the Bank. She is a Bachelor of Laws degree holder from the University of Santo Tomas, after taking up Bachelor of Arts in Political Science from the University of the Philippines. She has had several trainings and seminars, including on the mandatory continuing legal education, corporate governance, AML, and various aspects of commercial, criminal, and civil law.
Marisol M. Teodoro, 60, Filipino, First Vice President I, is seconded as the Director, President, and Chief Executive Officer of Bank subsidiary, China Bank Securities Corporation (CBSC) since her secondment in 2017. At that time, she was the Bank‘s Treasury Business Center Head assigned at the Treasury Group. Prior to this, she served as the Division Head of the Business Development and Portfolio Management Division of the Bank‘s Trust
Group. Ms. Teodoro also worked in other financial institutions, namely: Security Bank as Trust Investment Officer and The International Corporate Bank/Union Bank of the Philippines as Credit Evaluation Officer. She holds a Bachelor of Science degree in Business Economics and an MBA degree, both obtained from the University of the Philippines in Diliman, Quezon City. She has participated in various trainings on trust, treasury, investments, financial planning, and corporate governance. She completed the one-year Trust Course from the Trust Institute Foundation of the Philippines, and the registered financial planning course from RFP-Philippines. Ms. Teodoro is also an Ateneo-BAP Certified Treasury Professional.
Maria Rosanna Catherina L. Testa, 62, Filipino, First Vice President I, is the Head of Human Resources Group. She also oversees the HR of Bank subsidiary CBSI. She spent more than 30 years of her career in human resource management. She previously held key positions at Goodyear Phils., Equitable-PCI Bank, Far East Bank and Trust Company, The Manila Banking Corporation, and John Clements Consultants, among others. Ms. Testa is a graduate of Bachelor of Arts, Major in Business Administration, from the Assumption College, and completed her master‘s degree in Business Administration from the Ateneo Business School. She participated in trainings on corporate governance, AML, leadership, and trends and challenges in human resource management.
Note 1: All the foregoing officers have been involved in the banking industry for more than five (5) years. Note 2: None of the above-mentioned directors and officers works with the government.
2020
Independent Director
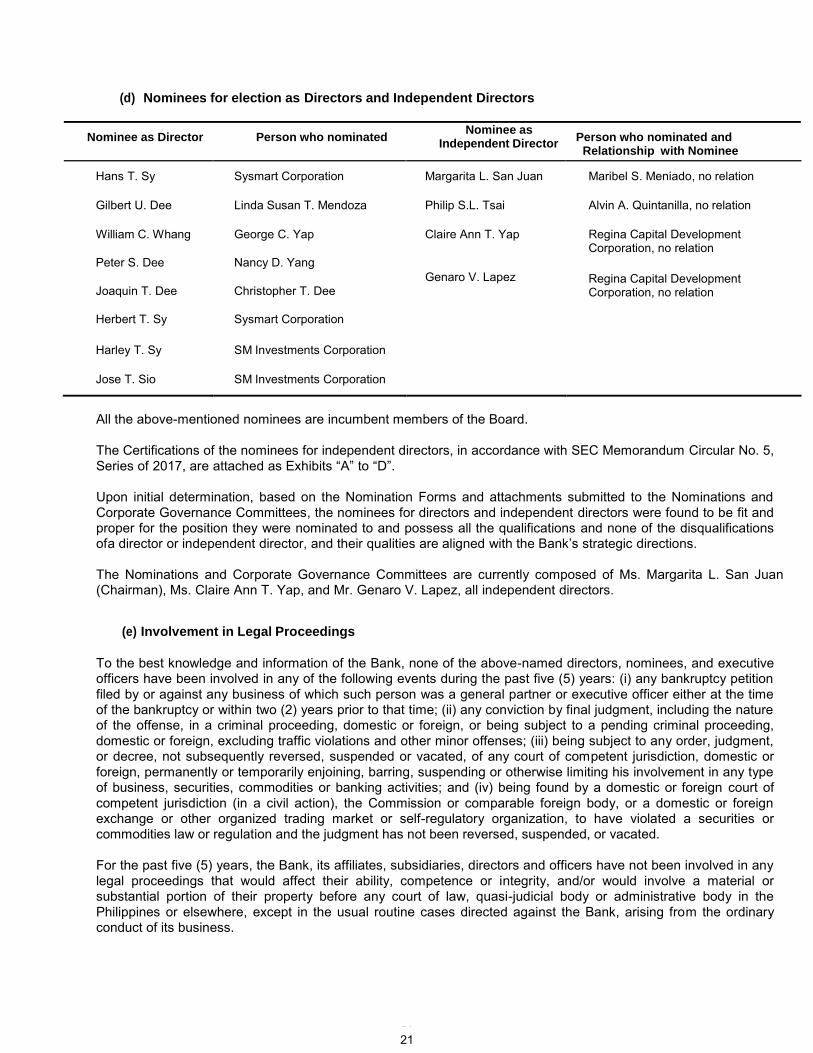
(d) Nominees for election as Directors and Independent Directors
Nominee as Director Person who nominated Nominee as
Person who nominated and Relationship with Nominee
Hans T. Sy Sysmart Corporation Margarita L. San Juan Maribel S. Meniado, no relation
Gilbert U. Dee Linda Susan T. Mendoza Philip S.L. Tsai Alvin A. Quintanilla, no relation
William C. Whang
Peter S. Dee
Joaquin T. Dee
George C. Yap
Nancy D. Yang
Christopher T. Dee
Claire Ann T. Yap
Genaro V. Lapez
Regina Capital Development Corporation, no relation
Regina Capital Development Corporation, no relation
Herbert T. Sy Sysmart Corporation
Harley T. Sy SM Investments Corporation
Jose T. Sio SM Investments Corporation
All the above-mentioned nominees are incumbent members of the Board.
The Certifications of the nominees for independent directors, in accordance with SEC Memorandum Circular No. 5, Series of 2017, are attached as Exhibits ―A‖ to ―D‖.
Upon initial determination, based on the Nomination Forms and attachments submitted to the Nominations and Corporate Governance Committees, the nominees for directors and independent directors were found to be fit and proper for the position they were nominated to and possess all the qualifications and none of the disqualifications of a director or independent director, and their qualities are aligned with the Bank‘s strategic directions.
The Nominations and Corporate Governance Committees are currently composed of Ms. Margarita L. San Juan (Chairman), Ms. Claire Ann T. Yap, and Mr. Genaro V. Lapez, all independent directors.
(e) Involvement in Legal Proceedings
To the best knowledge and information of the Bank, none of the above-named directors, nominees, and executive officers have been involved in any of the following events during the past five (5) years: (i) any bankruptcy petition filed by or against any business of which such person was a general partner or executive officer either at the time of the bankruptcy or within two (2) years prior to that time; (ii) any conviction by final judgment, including the nature of the offense, in a criminal proceeding, domestic or foreign, or being subject to a pending criminal proceeding, domestic or foreign, excluding traffic violations and other minor offenses; (iii) being subject to any order, judgment, or decree, not subsequently reversed, suspended or vacated, of any court of competent jurisdiction, domestic or foreign, permanently or temporarily enjoining, barring, suspending or otherwise limiting his involvement in any type of business, securities, commodities or banking activities; and (iv) being found by a domestic or foreign court of competent jurisdiction (in a civil action), the Commission or comparable foreign body, or a domestic or foreign exchange or other organized trading market or self-regulatory organization, to have violated a securities or commodities law or regulation and the judgment has not been reversed, suspended, or vacated.
For the past five (5) years, the Bank, its affiliates, subsidiaries, directors and officers have not been involved in any legal proceedings that would affect their ability, competence or integrity, and/or would involve a material or substantial portion of their property before any court of law, quasi-judicial body or administrative body in the Philippines or elsewhere, except in the usual routine cases directed against the Bank, arising from the ordinary conduct of its business.
2121

All legal proceedings involving the Bank are efficiently and competently attended to and managed by a group of sixteen (16) in-house lawyers and one (1) consultant who are graduates of reputable law schools in the country. For its external counsels, the Bank retains the services of respected law firms, among which are Medialdea Bello Guevarra & Suarez Law Offices, ACCRA Law Office, Britanico Sarmiento & Ringler Law Offices, Divina Law Office, Tagayuna Panopio & Escober Law Firm, Atty. Omar D. Vigilia, The Law Firm of Hermosisima Hermosisima & Hermosisima, and Catabay-Lauigan Law Office.
(f) Significant Employees
The Bank highly values its human resources. It expects each employee to do his share in achieving the Bank ‘s set goals; in return, the Bank has in place policies and programs for the protection and growth of employees.
(g) Relationships and Related Transactions
In the ordinary course of business, the Bank has loans and other transactions with its directors, officers, stockholders, and related interests (DOSRI), which were made substantially on fair terms or at an arm‘s length basis, that is, terms not less favorable to the Bank than those offered to others. Full disclosures for these transactions were made through reports with the appropriate regulatory agency.
The Bank has the following subsidiaries or affiliates/associates:
i. China Bank Savings, Inc. (CBSI) – formerly known as The Manila Banking Corporation (TMBC), CBSI wasacquired by China Bank in June 2007. It was incorporated on May 23, 1960 and was formed to carry on,engage in the business of, and exercise the general powers of a commercial bank as provided by law. On June23, 1999, the Bangko Sentral ng Pilipinas (BSP) granted TMBC authority to operate as a thrift bank. In 2008,in pursuance of the Bank‘s acquisition of TMBC, the BSP and the Securities and Exchange Commission (SEC)approved the change of name to CBSI. Further, the Monetary Board and SEC gave their approvals onNovember 21, 2013 and January 20, 2014, respectively, to the merger with Unity Bank, A Rural Bank, Inc.(Unity Bank), a Pampanga- based rural bank, with CBSI as the surviving bank. On August 14, 2014, thestockholders owning at least 2/3 of the outstanding capital stock of CBSI approved the Plan of Merger ofPlanters Development Bank and CBSI, with the latter as the surviving bank. BSP approved the merger onNovember 6, 2015 and SEC registered/approved the merger on December 17, 2015. China Bank now owns98.29% of the total outstanding capital stock of CBSI. Sitting as directors and/or officers of CBSI are thefollowing: Mr. Ricardo R. Chua as Chairman, Ms. Nancy D. Yang as Vice Chairman, and the rest of the Boardmembers are Mr. William C. Whang, Mr. James Christian T. Dee (who is also the President), Mr. Patrick D.Cheng, Ms. Rosemarie C. Gan, Mr. Herbert T. Sy, Jr., and four (4) independent directors: Mmes. Margarita L.San Juan and Claire Ann T. Yap, and Messrs. Philip S.L. Tsai and Genaro V. Lapez.
ii. China Bank Capital Corporation (CBCC) – was incorporated on November 27, 2015 as a full-service investmenthouse with broker/dealer of securities functions. CBCC is also licensed to deal with government securities. It is100% owned by the Bank. CBCC's Board of Directors is composed of: Messrs. Ricardo R. Chua (Chairman),Romeo D. Uyan, Jr. (Vice Chairman), Ryan Martin L. Tapia (President), and William C. Whang, Mmes. Lilian Yuand Magnolia Luisa N. Palanca, and three (3) independent directors: Mmes. Margarita L. San Juan and ClaireAnn T. Yap, and Mr. Philip S.L. Tsai. CBCC‘s business is supplemented by its wholly owned subsidiaries: (a)China Bank Securities Corporation (formerly ATC Securities, Inc.), an equity broker-dealer; (b) CBC Assets One(SPC) Inc., a special purpose corporation; and (c) Resurgent Capital (FIST-AMC) Inc., also a special purposecorporation.
iii. Chinabank Insurance Brokers, Inc. (CIBI) - incorporated on November 3, 1998 as a full-service insurance broker,providing insurance advice and solutions for retail and corporate customers, with a wide and comprehensiverange of products for non-life and life insurance requirements. CIBI offers Property, Motor, Marine,Bonds/Surety, Construction All Risk/Engineering Lines, Liability, Financial Lines such as Directors and OfficersLiability, Professional Indemnity, Trade Credit, Cyber Liability, and Travel and Group Personal Accident for theBank clients including non-mortgaged accounts. CIBI is 100% owned by the Bank, with the following BoardMembers: Messrs. Patrick D. Cheng (Chairman), William C. Whang (Director), Frankie G. Panis (President andDirector) and two (2) independent directors: Mr. Philip S.L. Tsai and Ms. Margarita L. San Juan.
2222
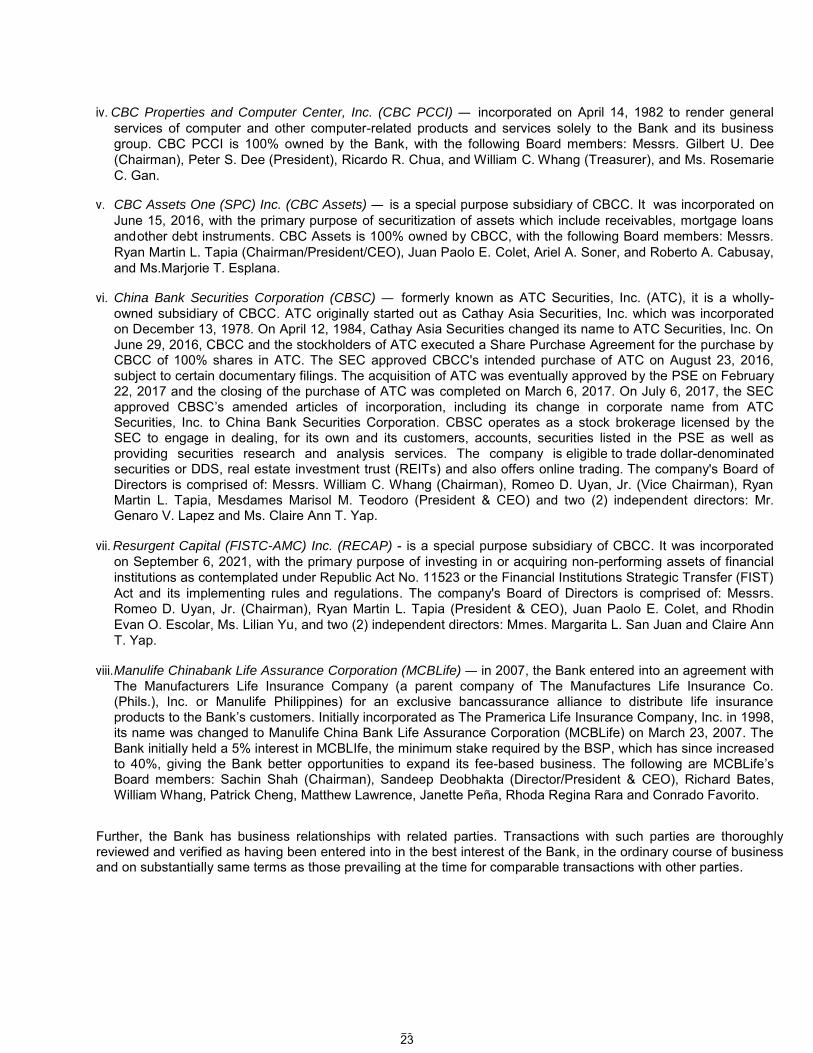
iv. CBC Properties and Computer Center, Inc. (CBC PCCI) – incorporated on April 14, 1982 to render generalservices of computer and other computer-related products and services solely to the Bank and its businessgroup. CBC PCCI is 100% owned by the Bank, with the following Board members: Messrs. Gilbert U. Dee(Chairman), Peter S. Dee (President), Ricardo R. Chua, and William C. Whang (Treasurer), and Ms. RosemarieC. Gan.
v. CBC Assets One (SPC) Inc. (CBC Assets) – is a special purpose subsidiary of CBCC. It was incorporated onJune 15, 2016, with the primary purpose of securitization of assets which include receivables, mortgage loansand other debt instruments. CBC Assets is 100% owned by CBCC, with the following Board members: Messrs.Ryan Martin L. Tapia (Chairman/President/CEO), Juan Paolo E. Colet, Ariel A. Soner, and Roberto A. Cabusay,and Ms. Marjorie T. Esplana.
vi. China Bank Securities Corporation (CBSC) – formerly known as ATC Securities, Inc. (ATC), it is a wholly-owned subsidiary of CBCC. ATC originally started out as Cathay Asia Securities, Inc. which was incorporatedon December 13, 1978. On April 12, 1984, Cathay Asia Securities changed its name to ATC Securities, Inc. OnJune 29, 2016, CBCC and the stockholders of ATC executed a Share Purchase Agreement for the purchase byCBCC of 100% shares in ATC. The SEC approved CBCC's intended purchase of ATC on August 23, 2016,subject to certain documentary filings. The acquisition of ATC was eventually approved by the PSE on February22, 2017 and the closing of the purchase of ATC was completed on March 6, 2017. On July 6, 2017, the SECapproved CBSC‘s amended articles of incorporation, including its change in corporate name from ATCSecurities, Inc. to China Bank Securities Corporation. CBSC operates as a stock brokerage licensed by theSEC to engage in dealing, for its own and its customers, accounts, securities listed in the PSE as well asproviding securities research and analysis services. The company is eligible to trade dollar-denominatedsecurities or DDS, real estate investment trust (REITs) and also offers online trading. The company's Board ofDirectors is comprised of: Messrs. William C. Whang (Chairman), Romeo D. Uyan, Jr. (Vice Chairman), RyanMartin L. Tapia, Mesdames Marisol M. Teodoro (President & CEO) and two (2) independent directors: Mr.Genaro V. Lapez and Ms. Claire Ann T. Yap.
vii. Resurgent Capital (FISTC-AMC) Inc. (RECAP) - is a special purpose subsidiary of CBCC. It was incorporatedon September 6, 2021, with the primary purpose of investing in or acquiring non-performing assets of financialinstitutions as contemplated under Republic Act No. 11523 or the Financial Institutions Strategic Transfer (FIST)Act and its implementing rules and regulations. The company's Board of Directors is comprised of: Messrs.Romeo D. Uyan, Jr. (Chairman), Ryan Martin L. Tapia (President & CEO), Juan Paolo E. Colet, and RhodinEvan O. Escolar, Ms. Lilian Yu, and two (2) independent directors: Mmes. Margarita L. San Juan and Claire AnnT. Yap.
viii. Manulife Chinabank Life Assurance Corporation (MCBLife) – in 2007, the Bank entered into an agreement withThe Manufacturers Life Insurance Company (a parent company of The Manufactures Life Insurance Co.(Phils.), Inc. or Manulife Philippines) for an exclusive bancassurance alliance to distribute life insuranceproducts to the Bank‘s customers. Initially incorporated as The Pramerica Life Insurance Company, Inc. in 1998,its name was changed to Manulife China Bank Life Assurance Corporation (MCBLife) on March 23, 2007. TheBank initially held a 5% interest in MCBLIfe, the minimum stake required by the BSP, which has since increasedto 40%, giving the Bank better opportunities to expand its fee-based business. The following are MCBLife‘sBoard members: Sachin Shah (Chairman), Sandeep Deobhakta (Director/President & CEO), Richard Bates,William Whang, Patrick Cheng, Matthew Lawrence, Janette Peña, Rhoda Regina Rara and Conrado Favorito.
Further, the Bank has business relationships with related parties. Transactions with such parties are thoroughly reviewed and verified as having been entered into in the best interest of the Bank, in the ordinary course of business and on substantially same terms as those prevailing at the time for comparable transactions with other parties.
2323

The table below shows the Bank‘s material related party transactions and outstanding balances for the year 2021:
Related Party Total Amount /1
Total Outstanding Balance /2
CBC Group ₱ 4.3 B$ 6.1 M
-
SM Group ₱ 106.7 B $ 653.0 M
₱ 10.4 B
$ 174.6 M Other Related Parties ₱ 71.2 B
$ 8.5 M ₱ 2.2 B
1/ Covers all transactions 2/ For loan transactions approved in 2021
Related party transactions of directors are passed upon by the Related Party Transaction (RPT) Committee of the Bank and endorsed to the Board of Directors for approval/confirmation. The RPT Committee evaluates the terms and conditions of the facilities/transactions to ensure that they are fair, negotiated on an arm‘s length basis, or upon terms not less favorable to the Bank than those offered to others, that no business resources of the Bank are misappropriated or misapplied, no potential reputational risk issues may arise because of or in connection with the transactions, and that the same are in compliance with the existing rules. Appropriate disclosures and reports are submitted as well to the Bangko Sentral ng Pilipinas (BSP).
Related party transactions are also discussed in Notes 30 and 38 of the Audited Financial Statements as presented in Annex ―E‖.
6. Compensation of Directors and Executive Officers
Name Year Salary Bonuses &
Other Compensation
TOTAL
Total for the 5 most highly compensated executive 2022 (estimates) 64,337,657.00 61,660,632.00 125,998,289.00 officers: 2021 (actual) 59,808,878.16 57,874,732.22 117,683,610.38 Gilbert U. Dee 2020 (actual) 56,072,606.16 49,666,179.72 105,738,785.88 William C. Whang Romeo D. Uyan, Jr. Patrick D. Cheng Rosemarie C. Gan
Total for all officers and Directors
2022 (estimates) 2,180,372,135.00 1,151,335,634.00 3,331,707,769.00 2021 (actual) 1,948,580,099.00 1,074,414,930.00 3,022,995,029.00 2020 (actual) 1,761,460,480.00 1,034,838,586.00 2,796,299,066.00
Total for all Directors 2022(estimates) 2021 (actual) 2020 (actual)
78,000,000 72,280,000 71,917,708
Other than those relating to the foregoing figures, there are no actions to be taken as regards any bonus, profit sharing, pension, or retirement plan, granting or extension of any option warrant or right to purchase any securities between the Bank and its directors and officers. The officers receive compensation based on their performance, banking experience, employment status, position, and rank in the Bank. On the other hand, the directors are entitled to a per diem of P500.00 for attendance at each meeting of the Board or of any committee and to 4% of the Bank‘s net earnings, in accordance with Article IV, Section 11, and Article VIII, Section 1 (a) of the Bank‘s Amended By- Laws. The amount of per diem was increased to up to P10,000, as approved by the stockholders on June 18, 2020. The proposed Amended By-Laws containing the increase in per diem was, among other amendments, was approved by the BSP on February 24, 2022, now enabling the Bank to register the amendments with the SEC. The directors and officers have no other compensatory arrangement with the Bank.
2424
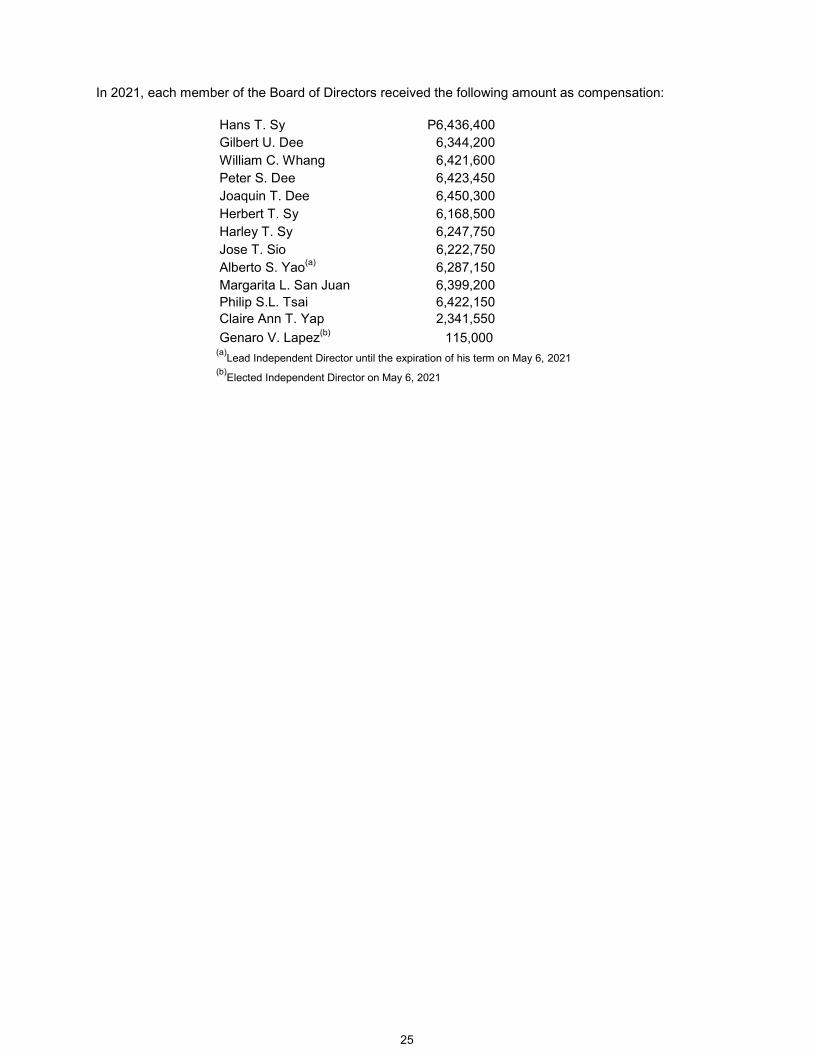
In 2021, each member of the Board of Directors received the following amount as compensation:
Hans T. Sy P6,436,400 Gilbert U. Dee 6,344,200 William C. Whang 6,421,600 Peter S. Dee 6,423,450 Joaquin T. Dee 6,450,300 Herbert T. Sy 6,168,500 Harley T. Sy 6,247,750 Jose T. Sio 6,222,750 Alberto S. Yao(a) 6,287,150 Margarita L. San Juan 6,399,200 Philip S.L. Tsai 6,422,150 Claire Ann T. Yap 2,341,550 Genaro V. Lapez(b) 115,000
(a)Lead Independent Director until the expiration of his term on May 6, 2021 (b)Elected Independent Director on May 6, 2021
2525
7. Independent Public Accountants
SyCip Gorres Velayo & Co. (SGV & Co.) was the Bank‘s independent auditor for the year 2021 and has been the
Bank's independent auditor for more than 20 years. SGV & Co. is again recommended for appointment at the scheduled annual stockholders' meeting. In compliance with SEC Memorandum Circular No. 8, Series of 2003, and Amendments to SRC Rule 68, the signing partners of a firm are rotated every after five (5) years of engagement which was increased to seven (7) years effective August 2019 per Professional Regulatory Board of Accountancy Resolution No. 53, Series of 2019. Ms. Janet A. Paraiso was the assigned signing partner for the year 2021.
None of the Bank's external auditors have resigned during the two (2) most recent fiscal years (2021 and 2020) or any interim period.
Representatives of SGV & Co. are expected to be present at the stockholders‘ meeting to respond to any matter that may be pertinently raised during the meeting. Their representative will be given the opportunity to make a statement if they so desire.
Fiscal Year Audit and Audit-Related Fees All Other Fees
2021 P11,415,712 P3,616,173 2020 10,554,544 1,900,326
Audit and Audit-Related Fees cover services rendered for the performance of the audit or review of the Bank's financial statements including the combined financial statements of Trust Group, and the issuance of comfort letters relative to the Bank‘s bond issuances amounting to P20 billion in 2021 and P15 billion in 2020. The 2021 and 2020 audit fees were taken up and approved by the Audit Committee.
Tax fees related to the audit of tax accounting and compliance are already incorporated in the year-end audit fees under Audit and Audit-Related Fees category as this is part of the audit process conducted by the external auditors.
The Board/Audit Committee likewise discussed, approved, and authorized to engage the services of SGV & Co in non-audit work for review and advisory services and independent validation of votes in the annual stockholders‘ meeting in both 2021 and 2020. Payment for these services is included under All Other Fees.
SGV & Co. also confirmed that they did not have any disagreement with Management that could be significant to the Bank‘s financial statements or their auditor‘s report. Further, there are no matters that in their professional judgment may reasonably be thought to bear on their independence or that they gave significant consideration to in reaching the conclusion that independence has not been impaired.
8. Compensation Plans
In 2020, in celebration of the Bank‘s 100th anniversary, the Board of Directors approved on August 5, 2020 and September 2, 2020 a Centennial Stock Grant Plan to issue common shares to eligible grantees. The Bank issued new shares from its authorized but unissued shares for the stock grant. The Board also approved to delegate to the President, Chief Operating Officer and Chief Finance Officer (―Designated Officers‖) the authority to prepare and approve the comprehensive plan consistent with the Board approval, apply for and comply with the requirements of the regulatory agencies, and perform other actions necessary in connection with the approval.
The Centennial Stock Grant Plan was approved and ratified by the stockholders in their special meeting on October 1, 2020, and approved by the relevant regulatory agencies.
2626

C. ISSUANCE AND EXCHANGE OF SECURITIES
9. Authorization or Issuance of Securities Other than for Exchange
Dividend
The Bank is allowed to declare dividends out of its unrestricted retained earnings at such times and in such percentages based on the recommendation of the Board of Directors. Such recommendation will take into consideration factors such as debt service requirements, the implementation of business plans, operating expenses, budgets, funding for new investments, appropriate reserves and working capital, among other things.
The Bank‘s Board of Directors is authorized to declare dividends. A cash dividend declaration does not require any further approval from the shareholders. A stock dividend declaration requires the further approval of shareholders holding or representing not less than two-thirds of the Bank‘s outstanding capital stock. The Revised Corporation Code defines the term ―outstanding capital stock‖ to mean the ―total shares of stock issued under binding subscription contracts to subscribers or stockholders, whether fully or partially paid, except treasury shares‖. Such shareholders‘ approval may be given at a general or special meeting duly called for such purpose. The Dividend Policy of the Bank is discussed further under Annex ―C‖ - Compliance with Leading Practice on Corporate Governance.
Voting
Each Common Share entitles the holder to one vote. At each meeting of the shareholders, every stockholder entitled to vote on a particular question or matter involved shall be entitled to one vote for each share of stock standing in his name in the books of the Bank at the time of the closing of the transfer books for such meeting,
In accordance with Section 23 of the Revised Corporation Code, at each election of directors, every stockholder entitled to vote at such election shall have the right to vote, in person or by proxy, the number of shares owned by him as of the relevant record date for as many persons as there are directors to be elected and for whose election he has right to vote, or to cumulate his votes by giving one candidate the number of votes equal to the number of directors to be elected multiplied by the number his shares shall equal or by distributing such votes on the same principle among any number of candidates as the stockholder shall see fit.
Material information on the current stockholders and related matters is shown in Annex ―B‖ – Market Information and Related Matters. The list of stockholders of the Bank is regularly submitted to the Bangko Sentral ng Pilipinas and Philippine Stock Exchange, and can be accessed through the Bank‘s website https://www.chinabank.ph.
Pre-emptive Rights
The Revised Corporation Code confers pre-emptive rights on shareholders of a Philippine corporation, which entitle them to subscribe to all issues or other disposition of shares of any class by the corporation in proportion to their respective shareholdings, subject to certain exceptions. A Philippine corporation may provide for the exclusion of these pre-emptive rights in its articles of incorporation. The Board has proposed and the stockholders of the Bank approved on May 8, 2014 to amend the Articles of Incorporation to include a waiver of such pre-emptive rights. The Articles of Incorporation of the Bank provides that stockholders shall have no pre-emptive rights to subscribe to any or all issues or dispositions of any class of shares.
10. Modification or Exchange of Securities – Not applicable
11. Financial and Other Information
(a) Brief Description of the general nature and scope of the business of the Bank, attached as Annex ―A‖
(b) Market Information, Dividends, and Top 20 Stockholders, attached as Annex ―B‖
(c) Discussion of Compliance with Leading Practice on Corporate Governance, attached as Annex ―C‖
(d) Management‘s Discussion and Analysis or Plan of Operation, attached as Annex ―D‖
(e) Statement of Management Responsibility for Financial Statements and 2021 Audited FinancialStatements, attached as Annex ―E‖
2727
12. Mergers, Consolidations, Acquisitions and Similar Matters – Not applicable
13. Acquisition or Disposition of Property – Not applicable
14. Restatement of Accounts – Not applicable
D. OTHER MATTERS
15. Action with Respect to Reports
The following are to be submitted for approval during the stockholders' meeting:
a. Minutes of the Annual Stockholders' Meeting held on May 6, 2021, appended to this InformationStatement as Schedule ―B‖, which discussed and acted on the various matters, including the following:
(i) annual report to stockholders;(ii) approval of the audited financial statements for the year ended December 31, 2020;(iii) ratification of all acts of the Board of Directors, including the establishment of a USD 2 billion Euro
Medium Term Note Programme, and the related party transactions discussed in the DefinitiveInformation Statement and Audited Financial Statements; and all the acts of the ExecutiveCommittee and of the various committees of the Bank and Management, during the fiscal year 2020and immediately preceding this stockholders‘ meeting;
(iv) election of the Board of Directors;(v) re-appointment of SGV & Co. as external auditor;(vi) amendment of by-laws, to update and clarify the processes and practices of the business and to
comply with the requirements under the Revised Corporation Code and the Bangko Sentral ngPilipinas;
(vii) delegation to the Board of Directors of power to amend By-Laws;(viii) announcement of the Board‘s approval of a cash dividend in the total peso amount of P2.7 billion,
similar to the previous year, representing One Peso (P1.00) per share, and other discussions on theBank‘s performance, effect of the continuing pandemic on the Bank‘s operations, and digitalizationplans.
The minutes also provided for the following: (a) voting results of each agenda item, including the presence of SGV& Co. which was engaged as independent party tasked to count and validate the votes and the meeting; (b) opportunity given to stockholders to ask questions together with the questions asked and answers given; and, (c) list of directors and officers who attended the meeting and a description of stockholders who participated in the meeting, as validated by SGV & Co.
The voting results of each agenda item were made available on China Bank‘s website within twenty-four (24) hours from adjournment of the annual meeting, and the minutes was posted on China Bank‘s websitewithin five (5) banking days from adjournment of the meeting. The office of the Corporate Secretary has inits custody the full list and names of the stockholders who participated in the May 6, 2021 annual meetingheld via remote communication.
b. Annual Report to Stockholders – to provide information about the Bank‘s activities, business andfinancial performance, and other relevant data for the preceding year;
c. Approval of the Audited Financial Statements for the year ended December 31, 2021 – to provideinformation about the financial position, performance, and changes in financial position of the Bank;
d. Ratification of all acts of the Board of Directors, Executive Committee, other Committees, andManagement, including the ratification of related party transactions, to further bind the Bank of theactions made for the covered period;
e. Election of Directors who will serve as such for the ensuing year;
2828
f. Appointment of external auditor – for the stockholders to ratify the Audit Committee‘sand Board‘s selection of auditors;
g. All matters as contained in the agenda of the meeting, and other businesses as mayproperly come before the stockholders.
16. Matters Not Required to be Submitted
There is no action to be taken with respect to any matter which is not required to be submitted to a vote of thestockholders.
17. Amendment of Charter, By-laws, or Other Documents
On March 25, 2020, the Board approved to amend several provisions in the By-laws of the Bank in order toupdate and clarify processes and practices of the business and comply with the requirements of the RevisedCorporation Code and the Bangko Sentral ng Pilipinas‘ (BSP) Manual of Regulations for Banks (MORB). SuchBoard approval was ratified by the stockholders in their meeting on June 18, 2020.
On March 3 and 10, 2021, the Board approved further amendments to the By-Laws of the Bank to address thecomments of the BSP to the 2020 filing, conform to the BSP's MORB, conform to the Revised CorporationCode of the Philippines, and enhance corporate governance. The stockholders of the Bank, in their regularannual meeting held on May 6, 2021, approved the said further amendments to the By-Laws.
During its regular meeting held on February 2, 2022, by virtue of the delegation to the Board of Directors of thepower to amend By-Laws as approved by the stockholders on May 6, 2021, in order to address furthercomments of the BSP and comply with the requirements of the Revised Corporation Code of the Philippines,the Board took up and approved further amendment to the By-Laws.
In a letter dated March 14, 2022, the BSP informed the Bank of its approval on February 24, 2022 of theforegoing amendments to the By-Laws and of the issuance of a Certificate of Authority dated February 24,2022 certifying that the amendments are in accordance with law and enabling the Bank to register theamendment with the Securities and Exchange Commission.
18. Other Proposed Action
There are no other actions proposed to be taken at the annual meeting other than the agenda mattersindicated in the Notice included in this Information Statement.
19. Voting Procedures
In accordance with Article III, Section 6 of the Bank's Amended By-Laws, no meeting of stockholders shall becompetent to transact business unless a majority of the outstanding capital stock is represented. Unless theRevised Corporation Code requires otherwise, a majority vote of the shares present or represented at thestockholders„ meeting, provided there is a quorum, shall be required to carry a stockholders‘ action on anymatter taken up during the meeting.
Stockholders as of record date of March 18, 2022 shall be entitled to vote at the annual stockholders‘ meeting.Stockholders intending to participate by remote communication and exercise the right to vote in absentiashould register through the Bank‘s online registration system on or before April 29, 2022. After verification andvalidation by the Corporate Secretary of the information submitted, an e-mail containing their log-in details forthe online voting system shall be sent to the stockholders. Please refer to Schedule ―A‖ of the InformationStatement for the Guidelines for Participation via Remote Communication and Voting in Absentia.
2929
Each common share of stock entitles its holder as of record date to one vote. However, with respect to the election of the members of the Board of Directors, Article III, Section 7 of the Bank's Amended By-Laws specifies that any stockholder who is not delinquent in his subscription shall be allowed to vote either in person or by proxy executed in writing by the stockholder or his duly authorized attorney-in-fact in accordance with the requirements under existing rules and regulations. Following Section 23 of the Revised Corporation Code, a stockholder may vote such number of shares for as many persons as there are directors to be elected or he may cumulate said shares and give one (1) candidate as many votes as the number of directors to be elected multiplied by the number of the shares owned, or distribute them on the same principle among as many candidates as may be seen fit, provided that the total number of votes cast shall not exceed the number of shares owned by the stockholders as shown in the books of the Bank multiplied by the whole number of directors to be elected. The twelve (12) nominees receiving the highest number of votes shall be declared elected.
All votes will be counted and tabulated by the Office of the Corporate Secretary, to be assisted by the transfer agent, Stock Transfer Service, Inc., and the results are set to be validated by the external auditor, SGV & Co.
3030
3131

3232

3333
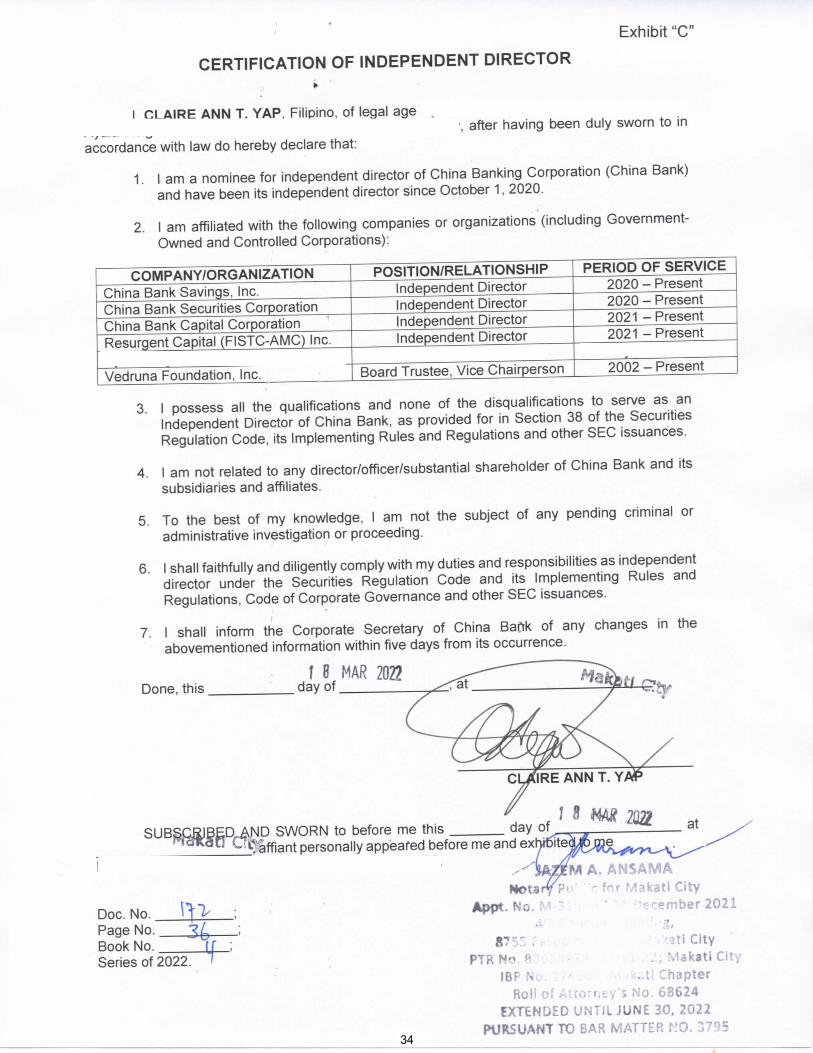
3434
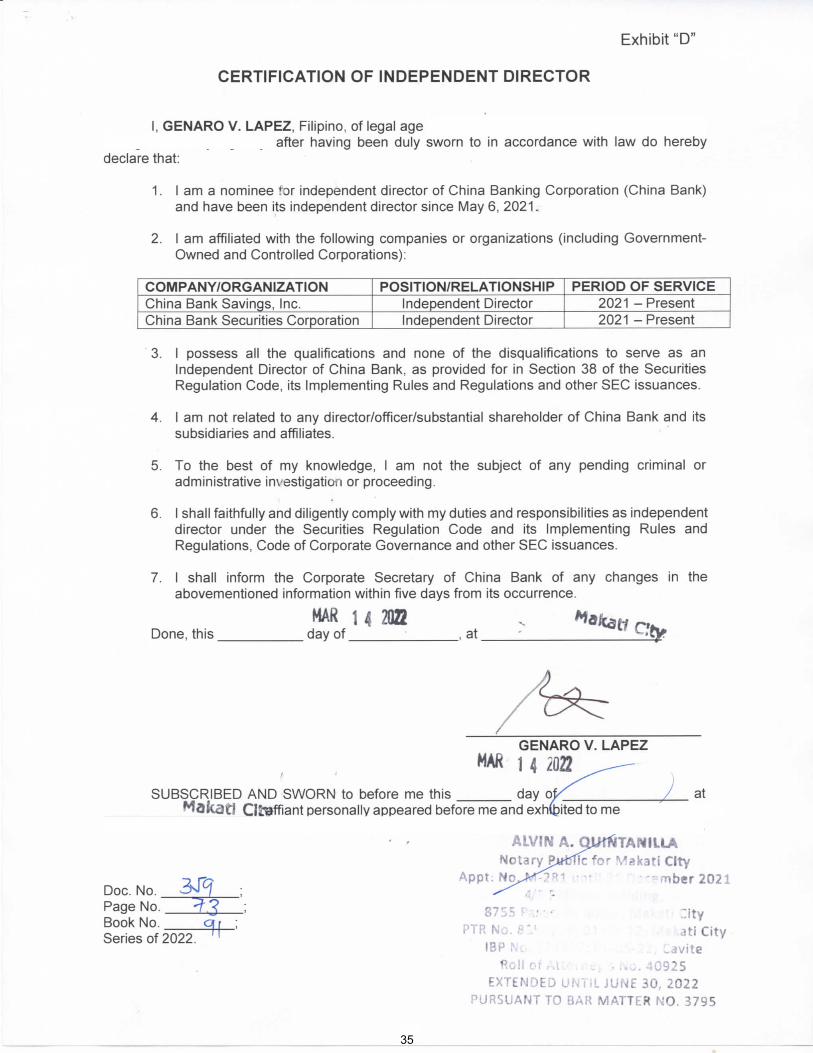
3535
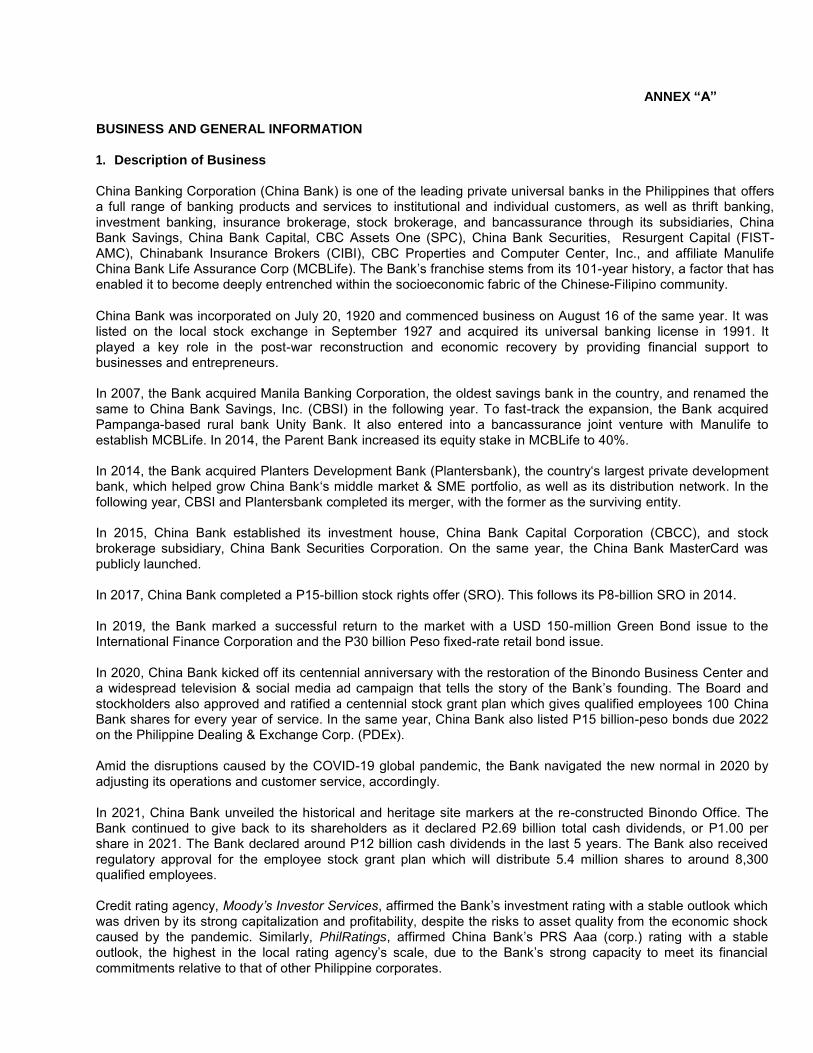
ANNEX “A”
BUSINESS AND GENERAL INFORMATION
1. Description of Business
China Banking Corporation (China Bank) is one of the leading private universal banks in the Philippines that offers a full range of banking products and services to institutional and individual customers, as well as thrift banking, investment banking, insurance brokerage, stock brokerage, and bancassurance through its subsidiaries, China Bank Savings, China Bank Capital, CBC Assets One (SPC), China Bank Securities, Resurgent Capital (FIST-AMC), Chinabank Insurance Brokers (CIBI), CBC Properties and Computer Center, Inc., and affiliate Manulife China Bank Life Assurance Corp (MCBLife). The Bank’s franchise stems from its 101-year history, a factor that has enabled it to become deeply entrenched within the socioeconomic fabric of the Chinese-Filipino community.
China Bank was incorporated on July 20, 1920 and commenced business on August 16 of the same year. It was listed on the local stock exchange in September 1927 and acquired its universal banking license in 1991. It played a key role in the post-war reconstruction and economic recovery by providing financial support to businesses and entrepreneurs.
In 2007, the Bank acquired Manila Banking Corporation, the oldest savings bank in the country, and renamed the same to China Bank Savings, Inc. (CBSI) in the following year. To fast-track the expansion, the Bank acquired Pampanga-based rural bank Unity Bank. It also entered into a bancassurance joint venture with Manulife to establish MCBLife. In 2014, the Parent Bank increased its equity stake in MCBLife to 40%.
In 2014, the Bank acquired Planters Development Bank (Plantersbank), the country‘s largest private development bank, which helped grow China Bank‘s middle market & SME portfolio, as well as its distribution network. In the following year, CBSI and Plantersbank completed its merger, with the former as the surviving entity.
In 2015, China Bank established its investment house, China Bank Capital Corporation (CBCC), and stock brokerage subsidiary, China Bank Securities Corporation. On the same year, the China Bank MasterCard was publicly launched.
In 2017, China Bank completed a P15-billion stock rights offer (SRO). This follows its P8-billion SRO in 2014. In 2019, the Bank marked a successful return to the market with a USD 150-million Green Bond issue to the International Finance Corporation and the P30 billion Peso fixed-rate retail bond issue.
In 2020, China Bank kicked off its centennial anniversary with the restoration of the Binondo Business Center and a widespread television & social media ad campaign that tells the story of the Bank’s founding. The Board and stockholders also approved and ratified a centennial stock grant plan which gives qualified employees 100 China Bank shares for every year of service. In the same year, China Bank also listed P15 billion-peso bonds due 2022 on the Philippine Dealing & Exchange Corp. (PDEx). Amid the disruptions caused by the COVID-19 global pandemic, the Bank navigated the new normal in 2020 by adjusting its operations and customer service, accordingly. In 2021, China Bank unveiled the historical and heritage site markers at the re-constructed Binondo Office. The Bank continued to give back to its shareholders as it declared P2.69 billion total cash dividends, or P1.00 per share in 2021. The Bank declared around P12 billion cash dividends in the last 5 years. The Bank also received regulatory approval for the employee stock grant plan which will distribute 5.4 million shares to around 8,300 qualified employees. Credit rating agency, Moody’s Investor Services, affirmed the Bank’s investment rating with a stable outlook which
was driven by its strong capitalization and profitability, despite the risks to asset quality from the economic shock caused by the pandemic. Similarly, PhilRatings, affirmed China Bank’s PRS Aaa (corp.) rating with a stable outlook, the highest in the local rating agency’s scale, due to the Bank’s strong capacity to meet its financial
commitments relative to that of other Philippine corporates.
36
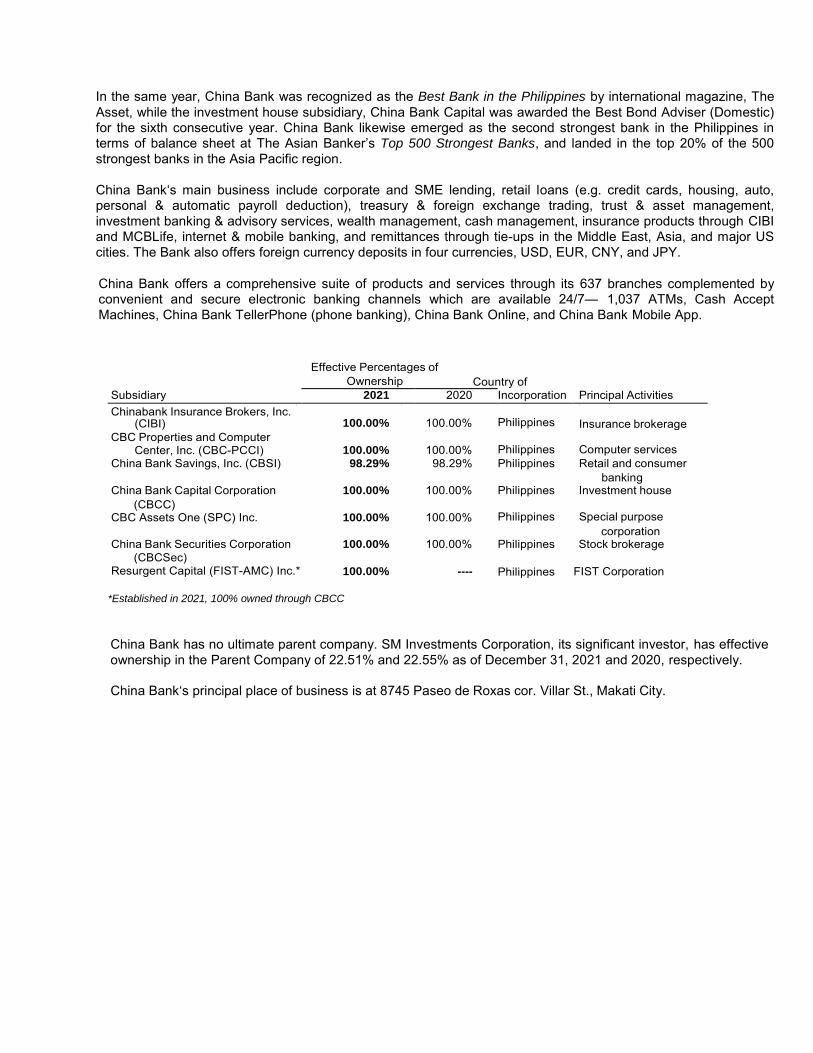
In the same year, China Bank was recognized as the Best Bank in the Philippines by international magazine, The Asset, while the investment house subsidiary, China Bank Capital was awarded the Best Bond Adviser (Domestic) for the sixth consecutive year. China Bank likewise emerged as the second strongest bank in the Philippines in terms of balance sheet at The Asian Banker‘s Top 500 Strongest Banks, and landed in the top 20% of the 500 strongest banks in the Asia Pacific region. China Bank‗s main business include corporate and SME lending, retail loans (e.g. credit cards, housing, auto, personal & automatic payroll deduction), treasury & foreign exchange trading, trust & asset management, investment banking & advisory services, wealth management, cash management, insurance products through CIBI and MCBLife, internet & mobile banking, and remittances through tie-ups in the Middle East, Asia, and major US cities. The Bank also offers foreign currency deposits in four currencies, USD, EUR, CNY, and JPY.
China Bank offers a comprehensive suite of products and services through its 637 branches complemented by convenient and secure electronic banking channels which are available 24/7— 1,037 ATMs, Cash Accept Machines, China Bank TellerPhone (phone banking), China Bank Online, and China Bank Mobile App.
Effective Percentages of
Ownership Country of Subsidiary 2021 2020 Incorporation Principal Activities Chinabank Insurance Brokers, Inc.
(CIBI)
100.00%
100.00% Philippines
Insurance brokerage
CBC Properties and Computer Center, Inc. (CBC-PCCI)
100.00%
100.00%
Philippines
Computer services
China Bank Savings, Inc. (CBSI) 98.29% 98.29% Philippines Retail and consumer China Bank Capital Corporation
100.00%
100.00%
Philippines
banking Investment house
(CBCC) CBC Assets One (SPC) Inc.
100.00%
100.00%
Philippines
Special purpose
China Bank Securities Corporation
100.00%
100.00%
Philippines
corporation Stock brokerage
(CBCSec) Resurgent Capital (FIST-AMC) Inc.* 100.00% ---- Philippines FIST Corporation
*Established in 2021, 100% owned through CBCC
China Bank has no ultimate parent company. SM Investments Corporation, its significant investor, has effective ownership in the Parent Company of 22.51% and 22.55% as of December 31, 2021 and 2020, respectively.
China Bank‗s principal place of business is at 8745 Paseo de Roxas cor. Villar St., Makati City.
3737
2. Business of Issuer
(a) Principal Products and Services
China Bank‘s main businesses include deposit-taking, corporate and middle market lending, consumer lending which includes retail estate loans, vehicle loans, credit cards, personal loans and automatic payroll deduction; treasury and foreign exchange trading, trust and investment management, wealth management, cash management, online and mobile banking services, inward remittances through tie-ups with banks and money services businesses in the Middle East, Asia and the Pacific, Europe and the Americas; and investment banking, securities brokerage, bancassurance and insurance brokerage through its subsidiaries and affiliate. The income from these products and services maybe divided into two categories, namely (1) net interest income from the Bank‗s deposit-taking, lending and investment activities which accounts for 79% of operating income and (2) other income (includes service charges, fees & commissions, trading & securities gain, gain on disposal of investment securities at amortized cost, foreign exchange gain, trust fees, income from sale of acquired assets and other miscellaneous income) which accounts for 21% of operating income.
Percentage of sales or revenues and net income contribution from foreign sales (broken down into major markets such as Western Europe, Southeast Asia, etc.) for each of the last three years. Not applicable.
DEPOSITS & RELATED SERVICES Peso Deposits: Checking - ChinaCheck Plus, Savings - Passbook Savings, ATM Savings, MoneyPlus Savings, Young Savers; Time - Regular Time Deposit,Diamond Savings, Money Lift Plus; Foreign Currency Deposits –Savings - (USD, Euro, RMB and JPY), Time – Foreign Currency Time Deposit Account, Premium Savings Account; Deposit-Related Services - Cash Card, Payroll Account, SSS Pensioner’s Account, Manager’s Check, Gift Check, Demand Draft, Safety Deposit Box, Night Depository Services, Cash Deliveryand Deposit Pick-up Services
LOANS & CREDIT FACILITIES Corporate & Commercial Loans: Omnibus Line, Loan Line, Term Loan, Trade Finance Products, Factoring Receivable Consumer Loans: HomePlus Real Estate Loan, AutoPlus Vehicle Loan, Contract to Sell Facility; SalaryPlus Salary Loan Credit Cards: China Bank Prime Mastercard; China Bank Freedom Mastercard; China Bank Cash Rewards Mastercard; China Bank Platinum Mastercard; China Bank World Mastercard; China Bank Wealth Mastercard, China Bank Virtual Card -- card for internet use only; supplemental feature of a regular credit card.
INTERNATIONAL BANKING PRODUCTS & SERVICES Letters of Credit, Standby Letters of Credit, Shipping Guarantee, Documents against Payment, Documents against Acceptance, Advance Payment, Open Account, Trust Receipt Loans, Exports Bill Purchase, Export Collections, Customs and Duties Tax Payments; Advising of Letters of Credit and Standby Letters of Credit; Purchase and Sale of Foreign Exchange; Inward and Outward Remittances - Domestic and International, Foreign Currency Loans
INVESTMENT BANKING SERVICES
Bonds, Syndicated Loans, Corporate Notes, Structured Loan, Project Finance, Long-term Negotiable Certificate of Deposit (LTNCD), Enrolled Notes (Short Dated Notes/QB Notes, Initial Public Offering, Follow On Offering, Preferred Shares, Convertible Shares, Exchangeable Shares, Mergers & Acquisition Advisory, Corporate Structuring, Valuation, Securitization
OVERSEAS KABABAYAN SERVICES China Bank Remittance; Overseas Kababayan Savings (OKS) Account (PHP and USD); Pay to Cash – Real-Time Cash Pick-Up Anywhere service and Same Day Cash Delivery (within NCR only)
TRUST SERVICES
Unit Investment Trust Fund (UITF) - China Bank Money Market Fund, China Bank Cash Fund, China Bank Short- Term Fund, China Bank Intermediate Fixed Income Fund, China Bank Fixed-Income Fund, China Bank Balanced Fund, China Bank Equity Fund, China Bank High Dividend Equity Fund, China Bank Dollar Fund, China Bank Dollar Money Market Fund; Wealth Management - Investment Management Arrangement, Personal Management Trust; Corporate Trust Services - Escrow Services Arrangement, Employee Benefit Fund Management, Corporate Fund Management, Facility Agency Arrangement, Security Trusteeship Arrangement, Collecting and Paying Agency Arrangement
TREASURY SERVICES
Investments-Local currency denominated Government and Corporate Bond Issues and Perpetual Notes, Foreign currency denominated Government and Corporate Bond Issues and Perpetual Notes, China Bank Bond; Deposit and Deposit Substitutes- Long-Term Negotiable Certificate of Deposit (LTNCD), Treasury Certificate of Deposit (TCD), Promissory Note; Foreign Exchange & Derivatives- FX Spot, FX Forward and FX Swaps, Interest Rate Swaps and Cross Currency Swaps
3838
INSURANCE PRODUCTS Bancassurance: Platinum Invest Elite; Enrich Max; MCBL Affluence Income; MCBL Affluence Max Elite; MCBL Enrich; MCBL Invest; Base Protect Plus; Assure Max, Legacy Secure, HealthFlex; Group Yearly Renewable Term (GYRT), Group Credit Life (GCL); Group Personal Accident (GPA); Group Riders (Accidental Death, Dismemberment & Disablement, Total and Permanent Disability, Accidental Medical Reimbursement, Hospital Income Benefit , 60 Critical Illness Benefit, Family Assistance Benefit, Terminal Illness Benefit ); Health Protect, Secure Pinoy Group Life Care, Secure Pinoy Student Life Care
Non-Life Insurance: Fire and Allied Perils; Motor Car Insurance; Personal Accident and Travel; Travel Accident Insurance; Medical Insurance / Employee Benefit; Comprehensive General Liability Insurance; Electronic Equipment Insurance; Money, Securities and Payroll Insurance; Fidelity Guarantee Insurance; Property Floater; Contractors’ Insurance All Risks (CARI); Erectors’ Insurance All Risks (EARI); Marine Cargo; Marine Hull; Surety Bonds Non-Traditional and Highly Specialized insurance products such as Directors & Officers Liability, Cyber Liability, Trade Credit, and Parametric Solutions
PAYMENT & SETTLEMENT SERVICES
Electronic Banking Channels: China Bank Automated Teller Machine (ATM); China Bank Cash Accept Machine (CAM); China Bank TellerPhone; China Bank Online; China Bank Mobile Banking App; Point-of-Sale (POS)
CASH MANAGEMENT SOLUTIONS Account Management via China Bank Online Corporate: Basic Services - Balance Inquiry and Transaction Reporting, Intra-bank transfer of funds to own &/or third-Party account(s), Inter-bank Fund Transfer via Bancnet, Instapay and Pesonet Buy &/or sell foreign currency, Sure Sweep, Collection Arrangement Report; Self-Service Functionalities - Request for Bank Certificate, Checkbook Reorder, Stop Payment Order Liquidity Management via China Bank Online Corporate: Multi-Bank SOA Concentration, Sure Sweep – Funds Consolidation, Funds Distribution; Corporate Inter-Bank Fund Transfer Receivables Management - Automatic Debit Arrangement (ADA), Check Depot, Bills Pay Plus, Referenced Deposit Solution, Smart Cash Safe Solution Payables Management – Direct Debit Arrangement; Auto Credit Arrangement (ACA); Check Writing Services – Check Write Plus Software; Check Write Plus Outsourcing-, Check Write Plus Self-Service; Payroll Services – Payroll Crediting, China Pay Software, Payroll Processing POS Solutions - ChinaBank Debit POS; ChinaBank POS Cash Out Trade and Settlement Solutions – Settle stock transactions with the Securities Corporation of the Philippines (SCCP) Broker’s Solution; Electronic Invoicing & Payment Solution Government Payments and Collections – Easy Tax Filing and Payment Solution, Tax Payment Solution (eFPS); eGov Payments, SSS Sickness, Maternity, and Employee Compensation (SSS SMEC)
CHINA BANK SECURITIES Stock Brokerage – Online Stock Trading, Traditional Trading (Peso-denominated stocks, Dollar-Denominated Securities or DDS, Real estate Investment Trusts or REITs), Research Services
(b) Distribution Methods of Products and Services:
China Bank‗s products and services are made available across multiple distribution and delivery channels: 637 branch network (of which 477 are China Bank branches, 160 are China Bank Savings branches; 1,037 ATM network (643 in-branch and 394 off-site ATMs nationwide; founding member of the BancNet consortium, access to more than 21,000 ATMs nationwide of BancNet networks; online banking (through the Bank‘s e-portal www.chinabank.ph); TellerPhone (phone banking) and Mobile Banking. Its head office is located at 8745 Paseo de Roxas corner Villar Streets, Makati City.
China Bank Parent Metro Manila Branches
1. MAKATI MAIN BRANCH (Head Office) - CBC Bldg., 8745 Paseo de Roxas cor. Villar Sts., Makati City*** 2. BINONDO BUSINESS CENTER - CBC Bldg., Dasmariñas cor. Juan Luna St., Brgy. 287, Zone 27, District III, Binondo, Manila* 3. 999 MALL BRANCH - Unit 3D-5 & 3D-7 999 Shopping Mall, Bldg. 2, Recto - Soler Sts., Binondo, Manila* 4. A. BONIFACIO - MAUBAN BRANCH - G/F Urban Oasis Residences, 423-431 A. Bonifacio Ave., Brgy. San Jose, Quezon City* 5. ALABANG HILLS BRANCH - G/F RBC-MDC Corporate Center, Don Jesus Blvd., Alabang Hills Village, Brgy. Cupang, Muntinlupa City* 6. ALVARADO BRANCH - HS Commercial Tower, 854 Alvarado St. Binondo, Manila 7. ANONAS BRANCH - Anonas corner Marang Streets, Brgy. Quirino, Project 2, Quezon City* 8. ANTIPOLO CITY BRANCH - G/F Budget Lane Arcade, No. 6, Provincial Road, Brgy. San Jose, Antipolo City, Rizal* 9. ANTIPOLO - SUMULONG HIGHWAY BRANCH - No. 219 Sumulong Highway, Bgry. Mambugan, Antipolo City, Rizal* 10. ANTIPOLO CITY-TAKTAK BRANCH - Sumulong Highway corner Taktak Road, Brgy. Dela Paz, Antipolo City, Rizal* 11. ARANETA AVE. BRANCH - Philippine Whithasco Bldg., 420 Araneta Ave., cor. Bayani St., Doña Imelda, Quezon City* 12. ARNAIZ AVE. BRANCH - United Life Assurance Building, A. Arnaiz Ave. (Pasay Road), Makati City*
3939
13. ARRANQUE BRANCH - Don Felipe Bldg., 675 Tomas Mapua St., Brgy. 301 Sta. Cruz, Manila* 14. ASUNCION BRANCH - Units G6 & G7 Chinatown Steel Towers, 531 Asuncion St., San Nicolas, Manila* 15. AURORA BLVD. - NEW MANILA BRANCH - Aurora Blvd., Brgy. Valencia, Quezon City* 16. AYALA - ALABANG BRANCH - G/F CBC Bldg., Acacia Ave., Madrigal Business Park, Ayala Alabang, Muntinlupa City* 17. AYALA AVE. - AMORSOLO BRANCH - G/F Teleperformance Bldg., Ayala Ave., Legazpi Village, Makati City* 18. AYALA - COLUMNS BRANCH - G/F The Columns Tower 3, Ayala Ave cor. Sen. Gil Puyat Ave., Brgy. Bel-Air., Makati City* 19. AYALA MALLS - MANILA BAY BRANCH - Level 2 Ayala Malls Manila Bay, D. Macapagal Ave., Parañaque City* 20. BACLARAN - FB HARRISON BRANCH - BAGPI Main Bldg., 2935 Ortigas St. near cor. F.B. Harrison St., PasayCity* 21. BALINTAWAK - BONIFACIO BRANCH - 657 A. Bonifacio Ave., Balintawak, Quezon City* 22. BALUT BRANCH - North Bay Shopping Center, Honorio Lopez Boulevard, Balut, Tondo, Manila* 23. BANAWE BRANCH - CBC Bldg., 680 Banawe Ave., Sta.Mesa Heights, District I, Quezon City* 24. BANAWE - CALAMBA BRANCH - G/F One Banawe Complex Bldg., #119 Banawe St. cor Calamba St., Brgy. Sto. Domingo, Quezon City* 25. BEL - AIR BRANCH - 2/F Saville Bldg., 8728 Paseo de Roxas, Makati City* 26. BEL - AIR - JUPITER BRANCH - Buendia Car Exchange, Jupiter Street, Makati City* 27. BETTER LIVING SUBD. BRANCH - 128 Doña Soledad Ave., Better Living, Brgy. Don Bosco, Parañaque City* 28. BF HOMES BRANCH - Aguirre cor. El Grande Aves., United BF Homes, Parañaque City* 29. BF HOMES - AGUIRRE BRANCH - Margarita Centre, Aguirre Ave. cor. Elsie Gaches St., BF Homes, Parañaque City* 30. BF RESORT VILLAGE BRANCH - BF Resort Drive cor. Gloria Diaz St., BF Resort Village, Talon Dos, Las Piñas City* 31. BGC - ICON PLAZA BRANCH - G/F Icon Plaza Bldg., 25th cor 5th Sts. Bonifacio South, Fort Bonifacio Global City, Taguig City* 32. BGC - ONE WORLD PLACE BRANCH - G/F One World Place, 32nd Avenue, Fort Bonifacio Global City, Taguig City*
33. BGC - WORLD PLAZA BRANCH - Unit 5 G/F World Plaza Bldg., L4B5 E-Square Information Technology Park, Crescent Park West, 5th Avenue, Bonifacio Global City, Taguig City *
34. BGC - W TOWER - G/F W Tower, 39th St., North Bonifacio Triangle, Fort Bonifacio Global City, Taguig City, 1634* 35. BINANGONAN BRANCH - National Road, Bo. Tagpos, Binangonan, Rizal* 36. BLUMENTRITT BRANCH - 1777-1781 Cavite St. cor. Leonor Rivera St., Blumentritt, Sta. Cruz, Manila* 37. BO. KAPITOLYO BRANCH - G/F P&E Bldg., 12 United cor. First Sts., Bo. Kapitolyo, Pasig City* 38. BONNY SERRANO BRANCH - G/F Greenhills Garden Square, 297 Col. Bonny Serrano Ave., Bagong Lipunan ng Crame, Quezon City* 39. CAINTA BRANCH - CBC Bldg., F.P. Felix Ave., Brgy. San Isidro, Cainta, Rizal* 40. CAINTA - POBLACION BRANCH - A. Bonifacio Ave., Poblacion, Brgy. Sto. Domingo, Cainta, Rizal* 41. CAPITOL HILLS BRANCH - G/F Design Pro Bldg., Capitol Hills, Old Balara, Quezon City* 42. CENTURY CITY - KNIGHTS BRIDGE BRANCH - Unit 17 & 18 Knightsbridge Residences, Century City, Kalayaan Ave., Makati City* 43. CIRCUIT MAKATI BRANCH - Level 3, Ayala Mall, Circuit Makati, Hippodromo St., Brgy. Carmona, Makati City* 44. COMMONWEALTH AVE. BRANCH - LGF Ever Gotesco Mall, Commonwealth Ave. cor. Don Antonio Road, Quezon City* 45. COMMONWEALTH AVE. EXTENSION - CASA MILAN BRANCH - ALX Center Building, Commonwealth Ave. Ext., Brgy. North Fairview, Quezon City* 46. CONGRESSIONAL AVENUE BRANCH - G/F Unit C, The Arete Square, Congressional Ave., Project 8, Quezon City*
47. CONGRESSIONAL AVE. EXTENSION - MIRA NILA BRANCH - CBC Building, #71 Lot 28 Blk 2 Mira Nila Homes, Congressional Ave. Ext., Quezon City* 48. CONGRESSIONAL AVE. - PROJECT 8 BRANCH - 159 Congressional Ave., Brgy. Bahay Toro, Project 8, Quezon City* 49. CORINTHIAN HILLS BRANCH - G/F The Clubhouse, Corinthian Hills, Temple Drive, Brgy. Ugong Norte, Quezon City* 50. CUBAO - ARANETA BRANCH - Level 2, Ali Mall, Araneta Center, Cubao, Quezon City*
51. CUBAO - AURORA BRANCH - 911 Aurora Boulevard Extension cor. Miami St., Cubao, Quezon City
52. CUBAO - P. TUAZON BRANCH - No. 287 P. Tuazon Ave. near corner 18th Avenue, Brgy. San Roque, Cubao, Quezon City* 53. CULIAT- TANDANG SORA BRANCH - G/F Royal Midway Plaza, No. 419, Tandang Sora Ave. Brgy. Culiat, Quezon City* 54. D. TUAZON BRANCH - 148 D. Tuazon St., Brgy. Lourdes, Sta. Mesa Heights, Quezon City* 55. DAMAR VILLAGE BRANCH - The Clubhouse, Damar Loop, Damar Village, Quezon City* 56. DASMARIÑAS VILLAGE BRANCH - G/F Manila Memorial Park Building, 2283 Pasong Tamo Ext. cor. Lumbang St., Makati City* 57. DEL MONTE AVENUE BRANCH - G/F FRS Bldg., No. 497 Del Monte Ave., Brgy. Manresa, Quezon City* 58. DEL MONTE - MATUTUM BRANCH - No. 202 Del Monte Ave. near cor. Matutum St., Brgy. St. Peter, Quezon City* 59. DILIMAN - MATALINO BRANCH - J&L Building, #23 Matalino Street, Brgy. Central, Diliman, Quezon City* 60. DIVISORIA - STA. ELENA BRANCH - Unit G22 New Divisoria Condominium Center., 632 Sta. Elena St., Binondo, Manila
61. DON ANTONIO BRANCH - G/F Royale Place, Don Antonio Ave., Old Balara, Quezon City* 62. EASTWOOD CITY BRANCH - Unit D, Techno Plaza One, Eastwood City Cyberpark, E. Rodriguez Jr. Ave., Bagumbayan, Quezon City* 63. EASTWOOD CITY FELINA CORPORATE PLAZA BRANCH - G/F Felina Corporate Plaza, #5 Eastwood Ave., Eastwood City, Quezon City* 64. EDSA - KALOOKAN BRANCH - G/F HGL Building, 554 EDSA, Kalookan City* 65. EDSA - PHILAM BRANCH - 917 EDSA, Brgy. Philam, Quezon City* 66. EDSA - TIMOG AVE. BRANCH - G/F Richwell Corporate Center, 102 Timog Ave., Brgy. Sacred Heart, Quezon City* 67. ELCANO BRANCH - G/F Elcano Tower, Elcano St., Binondo, Manila 68. E. RODRIGUEZ - ACROPOLIS BRANCH - G/F Suncrest Building, 82 E. Rodriguez Jr. Ave., Bagumbayan, Quezon City*
69. E. RODRIGUEZ - CORDILLERA BRANCH - 291 E. Rodriguez Sr. Blvd., Brgy. Doña Josefa, Quezon City* 70. E. RODRIGUEZ - HILLCREST BRANCH - No. 402 RCR Bldg., E. Rodriguez Sr. Blvd., Brgy. Immaculate Concepcion, Cubao, Quezon City* 71. E. RODRIGUEZ SR. BLVD. BRANCH - CBC Bldg., #286 E. Rodriguez Sr. Blvd., Brgy. Damayang Lagi, Quezon City*
4040
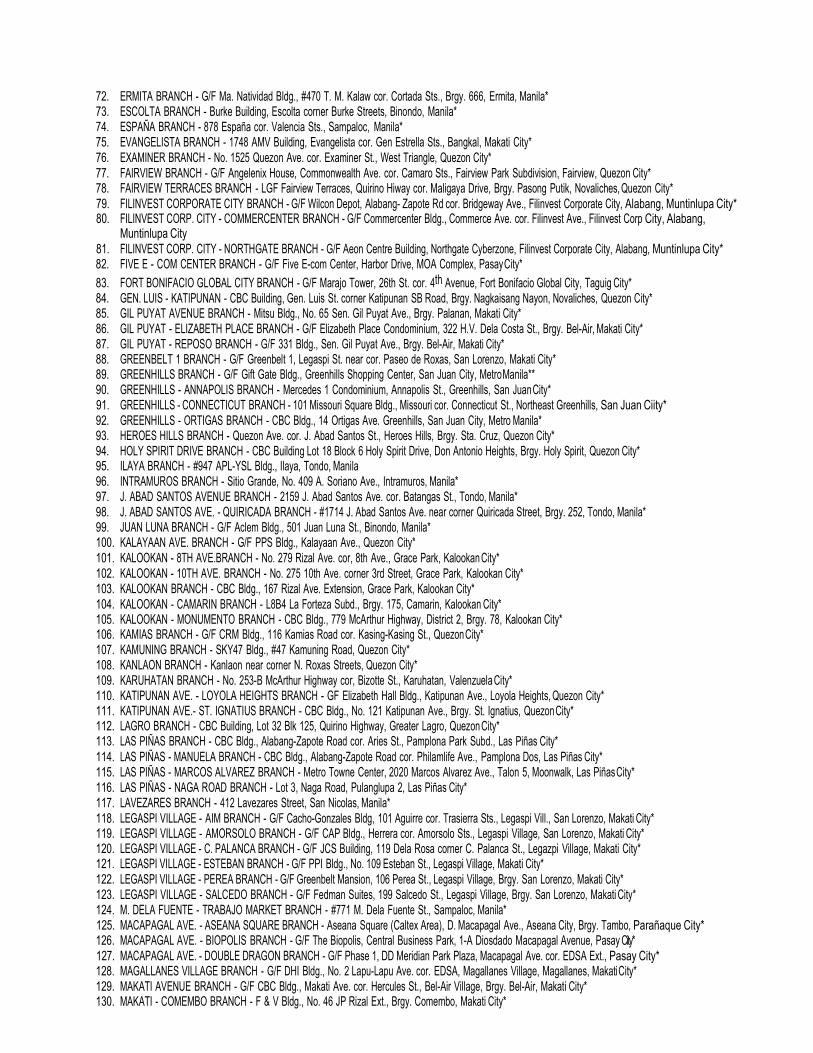
72. ERMITA BRANCH - G/F Ma. Natividad Bldg., #470 T. M. Kalaw cor. Cortada Sts., Brgy. 666, Ermita, Manila* 73. ESCOLTA BRANCH - Burke Building, Escolta corner Burke Streets, Binondo, Manila* 74. ESPAÑA BRANCH - 878 España cor. Valencia Sts., Sampaloc, Manila* 75. EVANGELISTA BRANCH - 1748 AMV Building, Evangelista cor. Gen Estrella Sts., Bangkal, Makati City* 76. EXAMINER BRANCH - No. 1525 Quezon Ave. cor. Examiner St., West Triangle, Quezon City* 77. FAIRVIEW BRANCH - G/F Angelenix House, Commonwealth Ave. cor. Camaro Sts., Fairview Park Subdivision, Fairview, Quezon City* 78. FAIRVIEW TERRACES BRANCH - LGF Fairview Terraces, Quirino Hiway cor. Maligaya Drive, Brgy. Pasong Putik, Novaliches, Quezon City* 79. FILINVEST CORPORATE CITY BRANCH - G/F Wilcon Depot, Alabang- Zapote Rd cor. Bridgeway Ave., Filinvest Corporate City, Alabang, Muntinlupa City* 80. FILINVEST CORP. CITY - COMMERCENTER BRANCH - G/F Commercenter Bldg., Commerce Ave. cor. Filinvest Ave., Filinvest Corp City, Alabang,
Muntinlupa City 81. FILINVEST CORP. CITY - NORTHGATE BRANCH - G/F Aeon Centre Building, Northgate Cyberzone, Filinvest Corporate City, Alabang, Muntinlupa City* 82. FIVE E - COM CENTER BRANCH - G/F Five E-com Center, Harbor Drive, MOA Complex, Pasay City*
83. FORT BONIFACIO GLOBAL CITY BRANCH - G/F Marajo Tower, 26th St. cor. 4th Avenue, Fort Bonifacio Global City, Taguig City* 84. GEN. LUIS - KATIPUNAN - CBC Building, Gen. Luis St. corner Katipunan SB Road, Brgy. Nagkaisang Nayon, Novaliches, Quezon City* 85. GIL PUYAT AVENUE BRANCH - Mitsu Bldg., No. 65 Sen. Gil Puyat Ave., Brgy. Palanan, Makati City* 86. GIL PUYAT - ELIZABETH PLACE BRANCH - G/F Elizabeth Place Condominium, 322 H.V. Dela Costa St., Brgy. Bel-Air, Makati City* 87. GIL PUYAT - REPOSO BRANCH - G/F 331 Bldg., Sen. Gil Puyat Ave., Brgy. Bel-Air, Makati City* 88. GREENBELT 1 BRANCH - G/F Greenbelt 1, Legaspi St. near cor. Paseo de Roxas, San Lorenzo, Makati City* 89. GREENHILLS BRANCH - G/F Gift Gate Bldg., Greenhills Shopping Center, San Juan City, Metro Manila** 90. GREENHILLS - ANNAPOLIS BRANCH - Mercedes 1 Condominium, Annapolis St., Greenhills, San Juan City* 91. GREENHILLS - CONNECTICUT BRANCH - 101 Missouri Square Bldg., Missouri cor. Connecticut St., Northeast Greenhills, San Juan Ciity* 92. GREENHILLS - ORTIGAS BRANCH - CBC Bldg., 14 Ortigas Ave. Greenhills, San Juan City, Metro Manila* 93. HEROES HILLS BRANCH - Quezon Ave. cor. J. Abad Santos St., Heroes Hills, Brgy. Sta. Cruz, Quezon City* 94. HOLY SPIRIT DRIVE BRANCH - CBC Building Lot 18 Block 6 Holy Spirit Drive, Don Antonio Heights, Brgy. Holy Spirit, Quezon City* 95. ILAYA BRANCH - #947 APL-YSL Bldg., Ilaya, Tondo, Manila 96. INTRAMUROS BRANCH - Sitio Grande, No. 409 A. Soriano Ave., Intramuros, Manila* 97. J. ABAD SANTOS AVENUE BRANCH - 2159 J. Abad Santos Ave. cor. Batangas St., Tondo, Manila* 98. J. ABAD SANTOS AVE. - QUIRICADA BRANCH - #1714 J. Abad Santos Ave. near corner Quiricada Street, Brgy. 252, Tondo, Manila* 99. JUAN LUNA BRANCH - G/F Aclem Bldg., 501 Juan Luna St., Binondo, Manila* 100. KALAYAAN AVE. BRANCH - G/F PPS Bldg., Kalayaan Ave., Quezon City* 101. KALOOKAN - 8TH AVE.BRANCH - No. 279 Rizal Ave. cor, 8th Ave., Grace Park, Kalookan City* 102. KALOOKAN - 10TH AVE. BRANCH - No. 275 10th Ave. corner 3rd Street, Grace Park, Kalookan City* 103. KALOOKAN BRANCH - CBC Bldg., 167 Rizal Ave. Extension, Grace Park, Kalookan City* 104. KALOOKAN - CAMARIN BRANCH - L8B4 La Forteza Subd., Brgy. 175, Camarin, Kalookan City* 105. KALOOKAN - MONUMENTO BRANCH - CBC Bldg., 779 McArthur Highway, District 2, Brgy. 78, Kalookan City* 106. KAMIAS BRANCH - G/F CRM Bldg., 116 Kamias Road cor. Kasing-Kasing St., Quezon City* 107. KAMUNING BRANCH - SKY47 Bldg., #47 Kamuning Road, Quezon City* 108. KANLAON BRANCH - Kanlaon near corner N. Roxas Streets, Quezon City* 109. KARUHATAN BRANCH - No. 253-B McArthur Highway cor, Bizotte St., Karuhatan, Valenzuela City* 110. KATIPUNAN AVE. - LOYOLA HEIGHTS BRANCH - GF Elizabeth Hall Bldg., Katipunan Ave., Loyola Heights, Quezon City* 111. KATIPUNAN AVE.- ST. IGNATIUS BRANCH - CBC Bldg., No. 121 Katipunan Ave., Brgy. St. Ignatius, Quezon City* 112. LAGRO BRANCH - CBC Building, Lot 32 Blk 125, Quirino Highway, Greater Lagro, Quezon City* 113. LAS PIÑAS BRANCH - CBC Bldg., Alabang-Zapote Road cor. Aries St., Pamplona Park Subd., Las Piñas City*
114. LAS PIÑAS - MANUELA BRANCH - CBC Bldg., Alabang-Zapote Road cor. Philamlife Ave., Pamplona Dos, Las Piñas City* 115. LAS PIÑAS - MARCOS ALVAREZ BRANCH - Metro Towne Center, 2020 Marcos Alvarez Ave., Talon 5, Moonwalk, Las Piñas City* 116. LAS PIÑAS - NAGA ROAD BRANCH - Lot 3, Naga Road, Pulanglupa 2, Las Piñas City* 117. LAVEZARES BRANCH - 412 Lavezares Street, San Nicolas, Manila* 118. LEGASPI VILLAGE - AIM BRANCH - G/F Cacho-Gonzales Bldg, 101 Aguirre cor. Trasierra Sts., Legaspi Vill., San Lorenzo, Makati City* 119. LEGASPI VILLAGE - AMORSOLO BRANCH - G/F CAP Bldg., Herrera cor. Amorsolo Sts., Legaspi Village, San Lorenzo, Makati City* 120. LEGASPI VILLAGE - C. PALANCA BRANCH - G/F JCS Building, 119 Dela Rosa corner C. Palanca St., Legazpi Village, Makati City* 121. LEGASPI VILLAGE - ESTEBAN BRANCH - G/F PPI Bldg., No. 109 Esteban St., Legaspi Village, Makati City* 122. LEGASPI VILLAGE - PEREA BRANCH - G/F Greenbelt Mansion, 106 Perea St., Legaspi Village, Brgy. San Lorenzo, Makati City* 123. LEGASPI VILLAGE - SALCEDO BRANCH - G/F Fedman Suites, 199 Salcedo St., Legaspi Village, Brgy. San Lorenzo, Makati City* 124. M. DELA FUENTE - TRABAJO MARKET BRANCH - #771 M. Dela Fuente St., Sampaloc, Manila* 125. MACAPAGAL AVE. - ASEANA SQUARE BRANCH - Aseana Square (Caltex Area), D. Macapagal Ave., Aseana City, Brgy. Tambo, Parañaque City* 126. MACAPAGAL AVE. - BIOPOLIS BRANCH - G/F The Biopolis, Central Business Park, 1-A Diosdado Macapagal Avenue, Pasay City* 127. MACAPAGAL AVE. - DOUBLE DRAGON BRANCH - G/F Phase 1, DD Meridian Park Plaza, Macapagal Ave. cor. EDSA Ext., Pasay City* 128. MAGALLANES VILLAGE BRANCH - G/F DHI Bldg., No. 2 Lapu-Lapu Ave. cor. EDSA, Magallanes Village, Magallanes, Makati City* 129. MAKATI AVENUE BRANCH - G/F CBC Bldg., Makati Ave. cor. Hercules St., Bel-Air Village, Brgy. Bel-Air, Makati City* 130. MAKATI - COMEMBO BRANCH - F & V Bldg., No. 46 JP Rizal Ext., Brgy. Comembo, Makati City*
4141
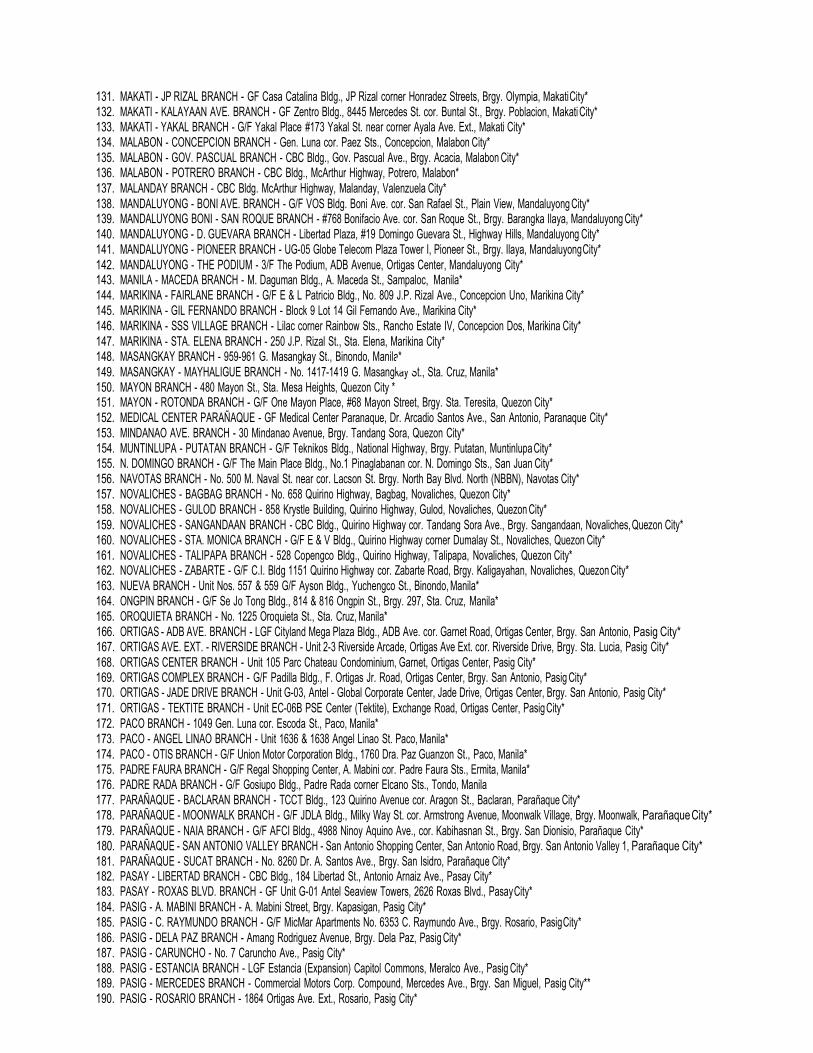
131. MAKATI - JP RIZAL BRANCH - GF Casa Catalina Bldg., JP Rizal corner Honradez Streets, Brgy. Olympia, Makati City* 132. MAKATI - KALAYAAN AVE. BRANCH - GF Zentro Bldg., 8445 Mercedes St. cor. Buntal St., Brgy. Poblacion, Makati City* 133. MAKATI - YAKAL BRANCH - G/F Yakal Place #173 Yakal St. near corner Ayala Ave. Ext., Makati City* 134. MALABON - CONCEPCION BRANCH - Gen. Luna cor. Paez Sts., Concepcion, Malabon City* 135. MALABON - GOV. PASCUAL BRANCH - CBC Bldg., Gov. Pascual Ave., Brgy. Acacia, Malabon City* 136. MALABON - POTRERO BRANCH - CBC Bldg., McArthur Highway, Potrero, Malabon* 137. MALANDAY BRANCH - CBC Bldg. McArthur Highway, Malanday, Valenzuela City* 138. MANDALUYONG - BONI AVE. BRANCH - G/F VOS Bldg. Boni Ave. cor. San Rafael St., Plain View, Mandaluyong City* 139. MANDALUYONG BONI - SAN ROQUE BRANCH - #768 Bonifacio Ave. cor. San Roque St., Brgy. Barangka Ilaya, Mandaluyong City* 140. MANDALUYONG - D. GUEVARA BRANCH - Libertad Plaza, #19 Domingo Guevara St., Highway Hills, Mandaluyong City* 141. MANDALUYONG - PIONEER BRANCH - UG-05 Globe Telecom Plaza Tower I, Pioneer St., Brgy. Ilaya, Mandaluyong City* 142. MANDALUYONG - THE PODIUM - 3/F The Podium, ADB Avenue, Ortigas Center, Mandaluyong City* 143. MANILA - MACEDA BRANCH - M. Daguman Bldg., A. Maceda St., Sampaloc, Manila* 144. MARIKINA - FAIRLANE BRANCH - G/F E & L Patricio Bldg., No. 809 J.P. Rizal Ave., Concepcion Uno, Marikina City* 145. MARIKINA - GIL FERNANDO BRANCH - Block 9 Lot 14 Gil Fernando Ave., Marikina City* 146. MARIKINA - SSS VILLAGE BRANCH - Lilac corner Rainbow Sts., Rancho Estate IV, Concepcion Dos, Marikina City* 147. MARIKINA - STA. ELENA BRANCH - 250 J.P. Rizal St., Sta. Elena, Marikina City* 148. MASANGKAY BRANCH - 959-961 G. Masangkay St., Binondo, Manila* 149. MASANGKAY - MAYHALIGUE BRANCH - No. 1417-1419 G. Masangkay St., Sta. Cruz, Manila* 150. MAYON BRANCH - 480 Mayon St., Sta. Mesa Heights, Quezon City * 151. MAYON - ROTONDA BRANCH - G/F One Mayon Place, #68 Mayon Street, Brgy. Sta. Teresita, Quezon City* 152. MEDICAL CENTER PARAÑAQUE - GF Medical Center Paranaque, Dr. Arcadio Santos Ave., San Antonio, Paranaque City* 153. MINDANAO AVE. BRANCH - 30 Mindanao Avenue, Brgy. Tandang Sora, Quezon City* 154. MUNTINLUPA - PUTATAN BRANCH - G/F Teknikos Bldg., National Highway, Brgy. Putatan, Muntinlupa City* 155. N. DOMINGO BRANCH - G/F The Main Place Bldg., No.1 Pinaglabanan cor. N. Domingo Sts., San Juan City* 156. NAVOTAS BRANCH - No. 500 M. Naval St. near cor. Lacson St. Brgy. North Bay Blvd. North (NBBN), Navotas City* 157. NOVALICHES - BAGBAG BRANCH - No. 658 Quirino Highway, Bagbag, Novaliches, Quezon City* 158. NOVALICHES - GULOD BRANCH - 858 Krystle Building, Quirino Highway, Gulod, Novaliches, Quezon City* 159. NOVALICHES - SANGANDAAN BRANCH - CBC Bldg., Quirino Highway cor. Tandang Sora Ave., Brgy. Sangandaan, Novaliches, Quezon City* 160. NOVALICHES - STA. MONICA BRANCH - G/F E & V Bldg., Quirino Highway corner Dumalay St., Novaliches, Quezon City* 161. NOVALICHES - TALIPAPA BRANCH - 528 Copengco Bldg., Quirino Highway, Talipapa, Novaliches, Quezon City* 162. NOVALICHES - ZABARTE - G/F C.I. Bldg 1151 Quirino Highway cor. Zabarte Road, Brgy. Kaligayahan, Novaliches, Quezon City* 163. NUEVA BRANCH - Unit Nos. 557 & 559 G/F Ayson Bldg., Yuchengco St., Binondo, Manila* 164. ONGPIN BRANCH - G/F Se Jo Tong Bldg., 814 & 816 Ongpin St., Brgy. 297, Sta. Cruz, Manila* 165. OROQUIETA BRANCH - No. 1225 Oroquieta St., Sta. Cruz, Manila* 166. ORTIGAS - ADB AVE. BRANCH - LGF Cityland Mega Plaza Bldg., ADB Ave. cor. Garnet Road, Ortigas Center, Brgy. San Antonio, Pasig City* 167. ORTIGAS AVE. EXT. - RIVERSIDE BRANCH - Unit 2-3 Riverside Arcade, Ortigas Ave Ext. cor. Riverside Drive, Brgy. Sta. Lucia, Pasig City* 168. ORTIGAS CENTER BRANCH - Unit 105 Parc Chateau Condominium, Garnet, Ortigas Center, Pasig City* 169. ORTIGAS COMPLEX BRANCH - G/F Padilla Bldg., F. Ortigas Jr. Road, Ortigas Center, Brgy. San Antonio, Pasig City* 170. ORTIGAS - JADE DRIVE BRANCH - Unit G-03, Antel - Global Corporate Center, Jade Drive, Ortigas Center, Brgy. San Antonio, Pasig City* 171. ORTIGAS - TEKTITE BRANCH - Unit EC-06B PSE Center (Tektite), Exchange Road, Ortigas Center, Pasig City* 172. PACO BRANCH - 1049 Gen. Luna cor. Escoda St., Paco, Manila* 173. PACO - ANGEL LINAO BRANCH - Unit 1636 & 1638 Angel Linao St. Paco, Manila* 174. PACO - OTIS BRANCH - G/F Union Motor Corporation Bldg., 1760 Dra. Paz Guanzon St., Paco, Manila* 175. PADRE FAURA BRANCH - G/F Regal Shopping Center, A. Mabini cor. Padre Faura Sts., Ermita, Manila* 176. PADRE RADA BRANCH - G/F Gosiupo Bldg., Padre Rada corner Elcano Sts., Tondo, Manila 177. PARAÑAQUE - BACLARAN BRANCH - TCCT Bldg., 123 Quirino Avenue cor. Aragon St., Baclaran, Parañaque City* 178. PARAÑAQUE - MOONWALK BRANCH - G/F JDLA Bldg., Milky Way St. cor. Armstrong Avenue, Moonwalk Village, Brgy. Moonwalk, Parañaque City*
179. PARAÑAQUE - NAIA BRANCH - G/F AFCI Bldg., 4988 Ninoy Aquino Ave., cor. Kabihasnan St., Brgy. San Dionisio, Parañaque City* 180. PARAÑAQUE - SAN ANTONIO VALLEY BRANCH - San Antonio Shopping Center, San Antonio Road, Brgy. San Antonio Valley 1, Parañaque City* 181. PARAÑAQUE - SUCAT BRANCH - No. 8260 Dr. A. Santos Ave., Brgy. San Isidro, Parañaque City* 182. PASAY - LIBERTAD BRANCH - CBC Bldg., 184 Libertad St., Antonio Arnaiz Ave., Pasay City* 183. PASAY - ROXAS BLVD. BRANCH - GF Unit G-01 Antel Seaview Towers, 2626 Roxas Blvd., Pasay City* 184. PASIG - A. MABINI BRANCH - A. Mabini Street, Brgy. Kapasigan, Pasig City* 185. PASIG - C. RAYMUNDO BRANCH - G/F MicMar Apartments No. 6353 C. Raymundo Ave., Brgy. Rosario, Pasig City* 186. PASIG - DELA PAZ BRANCH - Amang Rodriguez Avenue, Brgy. Dela Paz, Pasig City* 187. PASIG - CARUNCHO - No. 7 Caruncho Ave., Pasig City* 188. PASIG - ESTANCIA BRANCH - LGF Estancia (Expansion) Capitol Commons, Meralco Ave., Pasig City* 189. PASIG - MERCEDES BRANCH - Commercial Motors Corp. Compound, Mercedes Ave., Brgy. San Miguel, Pasig City** 190. PASIG - ROSARIO BRANCH - 1864 Ortigas Ave. Ext., Rosario, Pasig City*
4242

191. PASIG - SAN JOAQUIN BRANCH - No. 43 M. Concepcion Ave., San Joaquin, Pasig City* 192. PASIG - SANTOLAN BRANCH - G/F Felmarc Business Center, Amang Rodriguez Ave., Santolan, Pasig City* 193. PASIG - SM SUPERCENTER BRANCH - G/F SM Supercenter Pasig, Frontera Drive, C-5, Brgy. Ugong, Pasig City* 194. PASIG - VALLE VERDE BRANCH - G/F Reliance IT Center, E. Rodriguez Jr. Ave., Ugong, Pasig City* 195. PASO DE BLAS BRANCH - #63 Paso de Blas, Valenzuela City* 196. PASONG TAMO - BAGTIKAN BRANCH - G/F Trans-Phil House, 1177 Chino Roces Ave. cor. Bagtikan St., Makati City* 197. PASONG TAMO - CITYLAND BRANCH - Units UG29-UG32 Cityland Pasong Tamo Tower, 2210 Pasong Tamo St., Makati City* 198. PASONG TAMO - LA FUERZA – Unit 14 & 15 La Fuerza Plaza 1, 2241 Chino Roces Ave., Makati City* 199. PATEROS BRANCH - G/F Adela Bldg., M. Almeda St., Brgy. San Roque, Pateros* 200. PHILAM BRANCH - #8 East Lawin Drive, Philam Homes, Quezon City* 201. PROJECT 8 - SHORTHORN - CBC Bldg., 43 Shorthorn Street, Bahay Toro, Project 8, Quezon City* 202. PUREZA BRANCH - G/F Solicarel Building, Ramon Magsaysay Blvd. near corner Pureza St., Sta. Mesa, Manila* 203. QUEZON AVE. BRANCH - No. 18, G/F G&D Bldg., Quezon Ave. cor. D. Tuazon St., Brgy. Doña Josefa, Quezon City* 204. QUIAPO BRANCH - 216-220 Villalobos St., Quiapo, Manila 205. REGALADO AVE. - CBC Building, #34 Regalado Ave., North Fairview, Quezon City* 206. REGALADO AVE. - WEST FAIRVIEW – CBC Building, Regalado Ave. corner Bulova St., Quezon City* 207. RIZAL - ANGONO - Lot 3 Blk. 4 M.L Quezon Ave., Richmond Subd., Angono, Rizal* 208. RIZAL - SAN MATEO BRANCH - #63 Gen. Luna corner Simon St., Banaba, San Mateo, Rizal* 209. ROCKWELL - ORTIGAS BRANCH - G/F Tower 1, Rockwell Business Center, Ortigas Avenue, Pasig City 210. ROOSEVELT AVE. BRANCH - CBC Bldg., #293 Roosevelt Ave., San Francisco Del Monte, Quezon City* 211. ROOSEVELT AVE. - FRISCO BRANCH - G/F Norita Bldg., #51 H. Francisco St. corner Roosevelt Ave., Brgy. Paraiso, Quezon City* 212. SALCEDO VILLAGE - LP LEVISTE BRANCH - Unit 1-B G/F The Athenaeum, #160 LP Leviste St., Salcedo Village, Brgy. Bel-Air, Makati City* 213. SALCEDO VILLAGE - TORDESILLAS BRANCH - G/F Prince Tower Condominium, 14 Tordesillas St., Salcedo Village, Makati City* 214. SALCEDO VILLAGE - VALERO BRANCH - G/F Valero Tower, 122 Valero St., Salcedo Village, Makati City* 215. SALES - RAON BRANCH - 611 Sales St., Quiapo, Manila* 216. SAN ANTONIO VILLAGE - KAMAGONG BRANCH - Kamagong near corner St. Paul Streets, San Antonio Vill., Makati City* 217. SAN ANTONIO VILLAGE - P. OCAMPO BRANCH - JM Macalino Auto Center, 1405 P. Ocampo Street cor. Dungon St., San Antonio Village, Makati* 218. SAN JUAN - J. ABAD SANTOS BRANCH - Unit 3 Citiplace Bldg., 8001 Jose Abad Santos St., Little Baguio, San Juan City* 219. SAN JUAN BRANCH - No. 17 F. Blumentritt St., San Juan, Metro Manila* 220. SCT. BORROMEO BRANCH - G/F The Forum Building, 71- A Sct. Borromeo St., Diliman, Quezon City* 221. SCT. CHUATOCO BRANCH -Estuar Building, No.880 Quezon Ave., Brgy. Paligsahan, Quezon City* 222. SHAW - GOMEZVILLE BRANCH - Gomezville Street cor. Shaw Blvd., Mandaluyong City*
223. SHAW - HAIG BRANCH - G/F First of Shaw Bldg, Shaw Blvd, cor. Haig St, Mandaluyong City*
224. SHAW - PASIG BRANCH - G/F RCC Center, No. 104 Shaw Boulevard, Pasig City* 225. SHAW - SUMMIT ONE BRANCH - Unit 102 Summit One Office Tower, 530 Shaw Boulevard, Mandaluyong City* 226. SM AURA PREMIER BRANCH - LGF SM Aura Premier, McKinley Parkway, Fort Bonifacio Global City, Taguig City* 227. SM CITY BF PARAÑAQUE BRANCH - G/F SM City BF Parañaque, Dr. A. Santos Ave. cor. President’s Ave., BF Homes, Parañaque City* 228. SM CITY BICUTAN BRANCH - LGF Bldg. B, SM City Bicutan Doña Soledad Ave. cor. West Service Road, Parañaque City** 229. SM CITY FAIRVIEW BRANCH - LGF SM City Fairview, Quirino Ave. cor. Regalado Ave. Fairview, Greater Lagro, QuezonCity* 230. SM CITY GRAND CENTRAL BRANCH – LGF SM City Grand Central, Rizal Ave. Extension corner Bustamante Street, Kalookan City* 231. SM CITY MARIKINA BRANCH - G/F SM City Marikina, Marcos Highway, Brgy. Calumpang, Marikina City* 232. SM CITY MASINAG BRANCH - LGF SM City Masinag, Marcos Highway, Brgy. Mayamot Antipolo City, Rizal* 233. SM CITY SAN LAZARO BRANCH - UGF (Units 164-166) SM City San Lazaro, Felix Huertas St. cor. A.H. Lacson Ext., Sta. Cruz, Manila* 234. SM CITY TAYTAY BRANCH - Unit 147 Bldg. B, SM City Taytay, Manila East Road, Brgy. Dolores, Taytay, Rizal* 235. SM MALL OF ASIA BRANCH - G/F Main Mall Arcade, SM Mall of Asia, Bay Blvd., Pasay City** 236. SM MEGAMALL BRANCH - LGF Bldg. A, SM Megamall, EDSA cor. Julia Vargas St., Mandaluyong City* 237. SM NORTH EDSA BRANCH - GF Cyberzone Carpark Bldg., SM City North Ave cor. EDSA, Brgy. Sto. Cristo, Bago Bantay, Quezon City* 238. SM NORTH TOWERS BRANCH - SM City North EDSA North Towers, SM City North EDSA Complex, Quezon City* 239. SM SOUTHMALL BRANCH - UGF SM Southmall, Alabang-Zapote Road, Almanza Uno, Las Piñas City * 240. SOLEMARE BRANCH - G-11 Solemare Parksuites, 5A Bradco Avenue, Aseana Business Park, Parañaque City* 241. SOLER - ARRANQUE BRANCH - #715 T. Alonzo St. near corner CM Recto Avenue, Sta. Cruz, Manila* 242. SOLER - 168 BRANCH - G/F R&S Bldg., Soler St., Binondo, Manila* 243. SOUTH TRIANGLE BRANCH - G/F Sunshine Blvd. Plaza, Quezon Ave. cor. Sct. Santiago and Panay Ave., Bgry. South Triangle, Quezon City* 244. STA. MESA BRANCH - 1-B G. Araneta Avenue, Brgy. Doña Imelda, Quezon City* 245. STO. CRISTO BRANCH - E-Square Bldg., 622 Sto. Cristo St. Binondo, Manila 246. STO. CRISTO - CM RECTO BRANCH - 858 Sto. Cristo Street, San Nicolas, Manila 247. STO. DOMINGO AVE. BRANCH - GF JRich Holdings Bldg., Sto. Domingo Ave., Brgy. Sto. Domingo, Quezon City* 248. T. ALONZO BRANCH - Anttan Residences, 908 T. Alonzo cor. Espeleta Sts., Brgy. 298, Sta. Cruz, Manila* 249. TAFT AVE. - NAKPIL BRANCH - G Square Taft Ave. corner Nakpil St., Malate, Manila* 250. TAFT AVE. - QUIRINO BRANCH - The Gregorian Bldg., 2178 Taft Ave. near cor. Quirino Ave., Malate, Manila*
4343
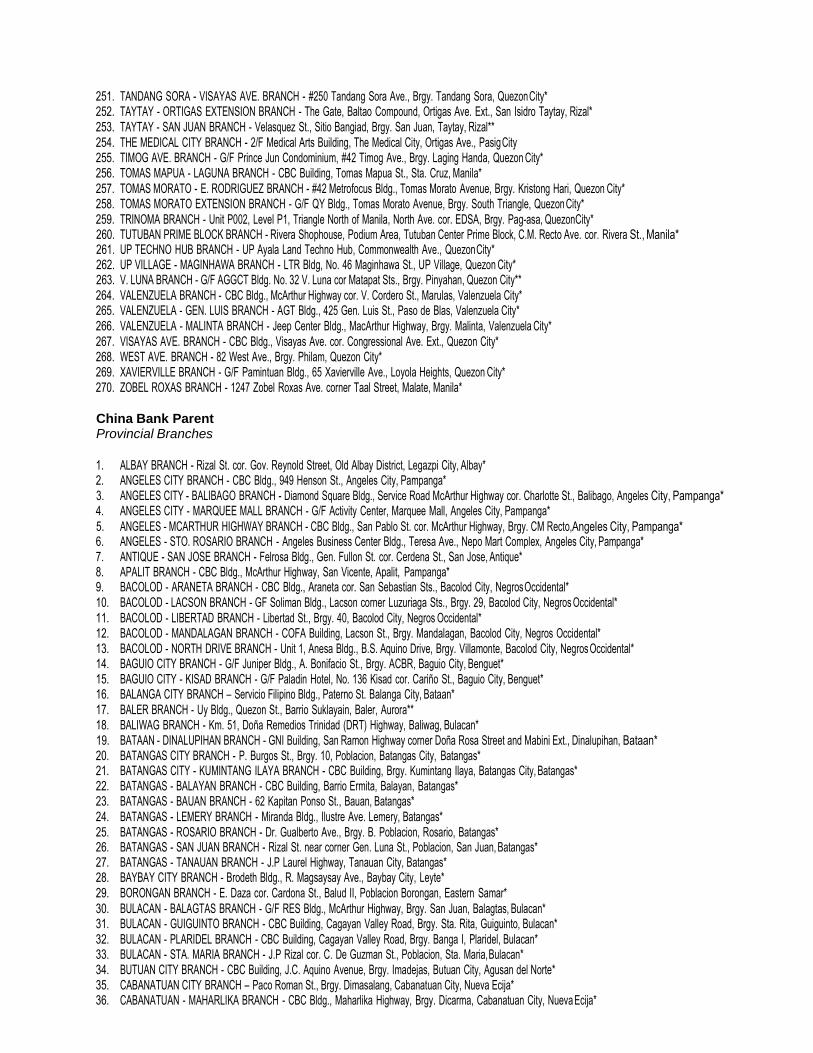
251. TANDANG SORA - VISAYAS AVE. BRANCH - #250 Tandang Sora Ave., Brgy. Tandang Sora, Quezon City* 252. TAYTAY - ORTIGAS EXTENSION BRANCH - The Gate, Baltao Compound, Ortigas Ave. Ext., San Isidro Taytay, Rizal* 253. TAYTAY - SAN JUAN BRANCH - Velasquez St., Sitio Bangiad, Brgy. San Juan, Taytay, Rizal** 254. THE MEDICAL CITY BRANCH - 2/F Medical Arts Building, The Medical City, Ortigas Ave., Pasig City 255. TIMOG AVE. BRANCH - G/F Prince Jun Condominium, #42 Timog Ave., Brgy. Laging Handa, Quezon City* 256. TOMAS MAPUA - LAGUNA BRANCH - CBC Building, Tomas Mapua St., Sta. Cruz, Manila* 257. TOMAS MORATO - E. RODRIGUEZ BRANCH - #42 Metrofocus Bldg., Tomas Morato Avenue, Brgy. Kristong Hari, Quezon City* 258. TOMAS MORATO EXTENSION BRANCH - G/F QY Bldg., Tomas Morato Avenue, Brgy. South Triangle, Quezon City* 259. TRINOMA BRANCH - Unit P002, Level P1, Triangle North of Manila, North Ave. cor. EDSA, Brgy. Pag-asa, QuezonCity* 260. TUTUBAN PRIME BLOCK BRANCH - Rivera Shophouse, Podium Area, Tutuban Center Prime Block, C.M. Recto Ave. cor. Rivera St., Manila* 261. UP TECHNO HUB BRANCH - UP Ayala Land Techno Hub, Commonwealth Ave., Quezon City* 262. UP VILLAGE - MAGINHAWA BRANCH - LTR Bldg, No. 46 Maginhawa St., UP Village, Quezon City* 263. V. LUNA BRANCH - G/F AGGCT Bldg. No. 32 V. Luna cor Matapat Sts., Brgy. Pinyahan, Quezon City** 264. VALENZUELA BRANCH - CBC Bldg., McArthur Highway cor. V. Cordero St., Marulas, Valenzuela City* 265. VALENZUELA - GEN. LUIS BRANCH - AGT Bldg., 425 Gen. Luis St., Paso de Blas, Valenzuela City* 266. VALENZUELA - MALINTA BRANCH - Jeep Center Bldg., MacArthur Highway, Brgy. Malinta, Valenzuela City* 267. VISAYAS AVE. BRANCH - CBC Bldg., Visayas Ave. cor. Congressional Ave. Ext., Quezon City* 268. WEST AVE. BRANCH - 82 West Ave., Brgy. Philam, Quezon City* 269. XAVIERVILLE BRANCH - G/F Pamintuan Bldg., 65 Xavierville Ave., Loyola Heights, Quezon City* 270. ZOBEL ROXAS BRANCH - 1247 Zobel Roxas Ave. corner Taal Street, Malate, Manila*
China Bank Parent Provincial Branches
1. ALBAY BRANCH - Rizal St. cor. Gov. Reynold Street, Old Albay District, Legazpi City, Albay* 2. ANGELES CITY BRANCH - CBC Bldg., 949 Henson St., Angeles City, Pampanga* 3. ANGELES CITY - BALIBAGO BRANCH - Diamond Square Bldg., Service Road McArthur Highway cor. Charlotte St., Balibago, Angeles City, Pampanga* 4. ANGELES CITY - MARQUEE MALL BRANCH - G/F Activity Center, Marquee Mall, Angeles City, Pampanga*
5. ANGELES - MCARTHUR HIGHWAY BRANCH - CBC Bldg., San Pablo St. cor. McArthur Highway, Brgy. CM Recto, Angeles City, Pampanga* 6. ANGELES - STO. ROSARIO BRANCH - Angeles Business Center Bldg., Teresa Ave., Nepo Mart Complex, Angeles City, Pampanga* 7. ANTIQUE - SAN JOSE BRANCH - Felrosa Bldg., Gen. Fullon St. cor. Cerdena St., San Jose, Antique* 8. APALIT BRANCH - CBC Bldg., McArthur Highway, San Vicente, Apalit, Pampanga* 9. BACOLOD - ARANETA BRANCH - CBC Bldg., Araneta cor. San Sebastian Sts., Bacolod City, Negros Occidental* 10. BACOLOD - LACSON BRANCH - GF Soliman Bldg., Lacson corner Luzuriaga Sts., Brgy. 29, Bacolod City, Negros Occidental* 11. BACOLOD - LIBERTAD BRANCH - Libertad St., Brgy. 40, Bacolod City, Negros Occidental* 12. BACOLOD - MANDALAGAN BRANCH - COFA Building, Lacson St., Brgy. Mandalagan, Bacolod City, Negros Occidental* 13. BACOLOD - NORTH DRIVE BRANCH - Unit 1, Anesa Bldg., B.S. Aquino Drive, Brgy. Villamonte, Bacolod City, Negros Occidental* 14. BAGUIO CITY BRANCH - G/F Juniper Bldg., A. Bonifacio St., Brgy. ACBR, Baguio City, Benguet* 15. BAGUIO CITY - KISAD BRANCH - G/F Paladin Hotel, No. 136 Kisad cor. Cariño St., Baguio City, Benguet* 16. BALANGA CITY BRANCH – Servicio Filipino Bldg., Paterno St. Balanga City, Bataan* 17. BALER BRANCH - Uy Bldg., Quezon St., Barrio Suklayain, Baler, Aurora** 18. BALIWAG BRANCH - Km. 51, Doña Remedios Trinidad (DRT) Highway, Baliwag, Bulacan* 19. BATAAN - DINALUPIHAN BRANCH - GNI Building, San Ramon Highway corner Doña Rosa Street and Mabini Ext., Dinalupihan, Bataan* 20. BATANGAS CITY BRANCH - P. Burgos St., Brgy. 10, Poblacion, Batangas City, Batangas* 21. BATANGAS CITY - KUMINTANG ILAYA BRANCH - CBC Building, Brgy. Kumintang Ilaya, Batangas City, Batangas* 22. BATANGAS - BALAYAN BRANCH - CBC Building, Barrio Ermita, Balayan, Batangas* 23. BATANGAS - BAUAN BRANCH - 62 Kapitan Ponso St., Bauan, Batangas* 24. BATANGAS - LEMERY BRANCH - Miranda Bldg., Ilustre Ave. Lemery, Batangas* 25. BATANGAS - ROSARIO BRANCH - Dr. Gualberto Ave., Brgy. B. Poblacion, Rosario, Batangas* 26. BATANGAS - SAN JUAN BRANCH - Rizal St. near corner Gen. Luna St., Poblacion, San Juan, Batangas* 27. BATANGAS - TANAUAN BRANCH - J.P Laurel Highway, Tanauan City, Batangas* 28. BAYBAY CITY BRANCH - Brodeth Bldg., R. Magsaysay Ave., Baybay City, Leyte* 29. BORONGAN BRANCH - E. Daza cor. Cardona St., Balud II, Poblacion Borongan, Eastern Samar*
30. BULACAN - BALAGTAS BRANCH - G/F RES Bldg., McArthur Highway, Brgy. San Juan, Balagtas, Bulacan* 31. BULACAN - GUIGUINTO BRANCH - CBC Building, Cagayan Valley Road, Brgy. Sta. Rita, Guiguinto, Bulacan* 32. BULACAN - PLARIDEL BRANCH - CBC Building, Cagayan Valley Road, Brgy. Banga I, Plaridel, Bulacan* 33. BULACAN - STA. MARIA BRANCH - J.P Rizal cor. C. De Guzman St., Poblacion, Sta. Maria, Bulacan* 34. BUTUAN CITY BRANCH - CBC Building, J.C. Aquino Avenue, Brgy. Imadejas, Butuan City, Agusan del Norte* 35. CABANATUAN CITY BRANCH – Paco Roman St., Brgy. Dimasalang, Cabanatuan City, Nueva Ecija* 36. CABANATUAN - MAHARLIKA BRANCH - CBC Bldg., Maharlika Highway, Brgy. Dicarma, Cabanatuan City, Nueva Ecija*
4444
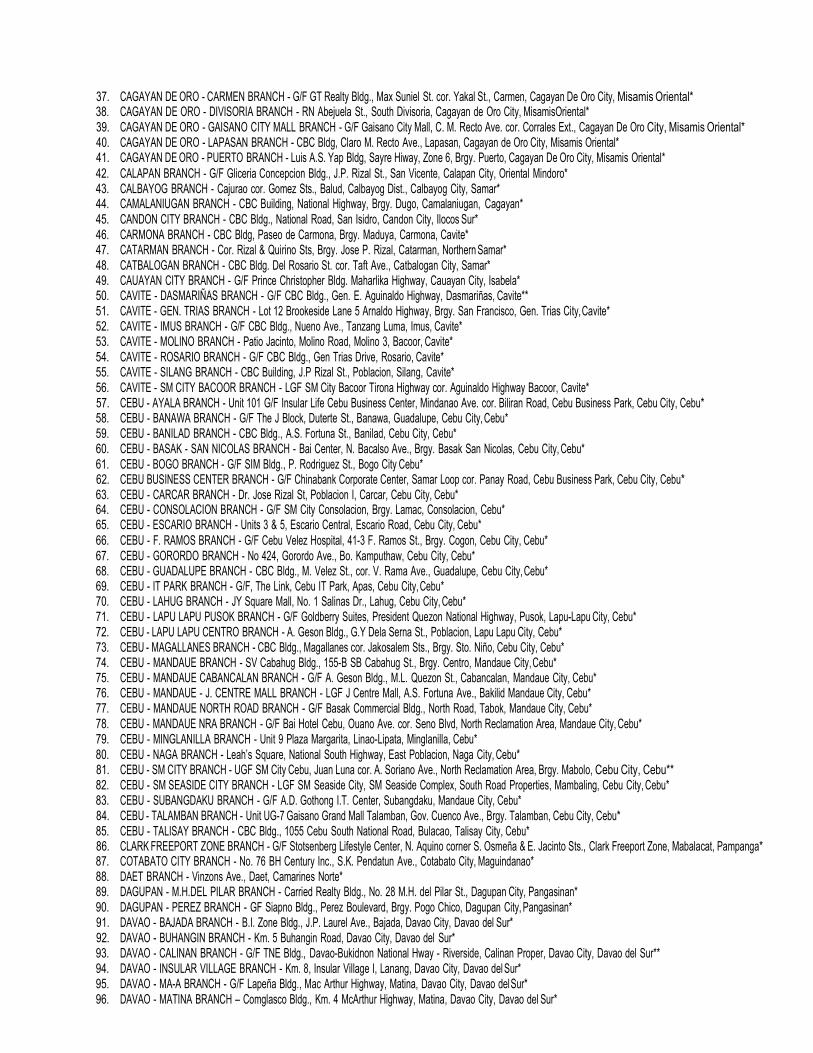
37. CAGAYAN DE ORO - CARMEN BRANCH - G/F GT Realty Bldg., Max Suniel St. cor. Yakal St., Carmen, Cagayan De Oro City, Misamis Oriental* 38. CAGAYAN DE ORO - DIVISORIA BRANCH - RN Abejuela St., South Divisoria, Cagayan de Oro City, MisamisOriental* 39. CAGAYAN DE ORO - GAISANO CITY MALL BRANCH - G/F Gaisano City Mall, C. M. Recto Ave. cor. Corrales Ext., Cagayan De Oro City, Misamis Oriental* 40. CAGAYAN DE ORO - LAPASAN BRANCH - CBC Bldg, Claro M. Recto Ave., Lapasan, Cagayan de Oro City, Misamis Oriental* 41. CAGAYAN DE ORO - PUERTO BRANCH - Luis A.S. Yap Bldg, Sayre Hiway, Zone 6, Brgy. Puerto, Cagayan De Oro City, Misamis Oriental*
42. CALAPAN BRANCH - G/F Gliceria Concepcion Bldg., J.P. Rizal St., San Vicente, Calapan City, Oriental Mindoro* 43. CALBAYOG BRANCH - Cajurao cor. Gomez Sts., Balud, Calbayog Dist., Calbayog City, Samar* 44. CAMALANIUGAN BRANCH - CBC Building, National Highway, Brgy. Dugo, Camalaniugan, Cagayan* 45. CANDON CITY BRANCH - CBC Bldg., National Road, San Isidro, Candon City, Ilocos Sur* 46. CARMONA BRANCH - CBC Bldg, Paseo de Carmona, Brgy. Maduya, Carmona, Cavite* 47. CATARMAN BRANCH - Cor. Rizal & Quirino Sts, Brgy. Jose P. Rizal, Catarman, Northern Samar* 48. CATBALOGAN BRANCH - CBC Bldg. Del Rosario St. cor. Taft Ave., Catbalogan City, Samar* 49. CAUAYAN CITY BRANCH - G/F Prince Christopher Bldg. Maharlika Highway, Cauayan City, Isabela* 50. CAVITE - DASMARIÑAS BRANCH - G/F CBC Bldg., Gen. E. Aguinaldo Highway, Dasmariñas, Cavite** 51. CAVITE - GEN. TRIAS BRANCH - Lot 12 Brookeside Lane 5 Arnaldo Highway, Brgy. San Francisco, Gen. Trias City, Cavite* 52. CAVITE - IMUS BRANCH - G/F CBC Bldg., Nueno Ave., Tanzang Luma, Imus, Cavite* 53. CAVITE - MOLINO BRANCH - Patio Jacinto, Molino Road, Molino 3, Bacoor, Cavite* 54. CAVITE - ROSARIO BRANCH - G/F CBC Bldg., Gen Trias Drive, Rosario, Cavite* 55. CAVITE - SILANG BRANCH - CBC Building, J.P Rizal St., Poblacion, Silang, Cavite* 56. CAVITE - SM CITY BACOOR BRANCH - LGF SM City Bacoor Tirona Highway cor. Aguinaldo Highway Bacoor, Cavite* 57. CEBU - AYALA BRANCH - Unit 101 G/F Insular Life Cebu Business Center, Mindanao Ave. cor. Biliran Road, Cebu Business Park, Cebu City, Cebu* 58. CEBU - BANAWA BRANCH - G/F The J Block, Duterte St., Banawa, Guadalupe, Cebu City, Cebu* 59. CEBU - BANILAD BRANCH - CBC Bldg., A.S. Fortuna St., Banilad, Cebu City, Cebu* 60. CEBU - BASAK - SAN NICOLAS BRANCH - Bai Center, N. Bacalso Ave., Brgy. Basak San Nicolas, Cebu City, Cebu* 61. CEBU - BOGO BRANCH - G/F SIM Bldg., P. Rodriguez St., Bogo City Cebu* 62. CEBU BUSINESS CENTER BRANCH - G/F Chinabank Corporate Center, Samar Loop cor. Panay Road, Cebu Business Park, Cebu City, Cebu* 63. CEBU - CARCAR BRANCH - Dr. Jose Rizal St, Poblacion I, Carcar, Cebu City, Cebu* 64. CEBU - CONSOLACION BRANCH - G/F SM City Consolacion, Brgy. Lamac, Consolacion, Cebu* 65. CEBU - ESCARIO BRANCH - Units 3 & 5, Escario Central, Escario Road, Cebu City, Cebu*
66. CEBU - F. RAMOS BRANCH - G/F Cebu Velez Hospital, 41-3 F. Ramos St., Brgy. Cogon, Cebu City, Cebu* 67. CEBU - GORORDO BRANCH - No 424, Gorordo Ave., Bo. Kamputhaw, Cebu City, Cebu* 68. CEBU - GUADALUPE BRANCH - CBC Bldg., M. Velez St., cor. V. Rama Ave., Guadalupe, Cebu City, Cebu* 69. CEBU - IT PARK BRANCH - G/F, The Link, Cebu IT Park, Apas, Cebu City, Cebu* 70. CEBU - LAHUG BRANCH - JY Square Mall, No. 1 Salinas Dr., Lahug, Cebu City, Cebu* 71. CEBU - LAPU LAPU PUSOK BRANCH - G/F Goldberry Suites, President Quezon National Highway, Pusok, Lapu-Lapu City, Cebu* 72. CEBU - LAPU LAPU CENTRO BRANCH - A. Geson Bldg., G.Y Dela Serna St., Poblacion, Lapu Lapu City, Cebu* 73. CEBU - MAGALLANES BRANCH - CBC Bldg., Magallanes cor. Jakosalem Sts., Brgy. Sto. Niño, Cebu City, Cebu* 74. CEBU - MANDAUE BRANCH - SV Cabahug Bldg., 155-B SB Cabahug St., Brgy. Centro, Mandaue City, Cebu* 75. CEBU - MANDAUE CABANCALAN BRANCH - G/F A. Geson Bldg., M.L. Quezon St., Cabancalan, Mandaue City, Cebu* 76. CEBU - MANDAUE - J. CENTRE MALL BRANCH - LGF J Centre Mall, A.S. Fortuna Ave., Bakilid Mandaue City, Cebu* 77. CEBU - MANDAUE NORTH ROAD BRANCH - G/F Basak Commercial Bldg., North Road, Tabok, Mandaue City, Cebu* 78. CEBU - MANDAUE NRA BRANCH - G/F Bai Hotel Cebu, Ouano Ave. cor. Seno Blvd, North Reclamation Area, Mandaue City, Cebu* 79. CEBU - MINGLANILLA BRANCH - Unit 9 Plaza Margarita, Linao-Lipata, Minglanilla, Cebu* 80. CEBU - NAGA BRANCH - Leah’s Square, National South Highway, East Poblacion, Naga City, Cebu* 81. CEBU - SM CITY BRANCH - UGF SM City Cebu, Juan Luna cor. A. Soriano Ave., North Reclamation Area, Brgy. Mabolo, Cebu City, Cebu** 82. CEBU - SM SEASIDE CITY BRANCH - LGF SM Seaside City, SM Seaside Complex, South Road Properties, Mambaling, Cebu City, Cebu* 83. CEBU - SUBANGDAKU BRANCH - G/F A.D. Gothong I.T. Center, Subangdaku, Mandaue City, Cebu* 84. CEBU - TALAMBAN BRANCH - Unit UG-7 Gaisano Grand Mall Talamban, Gov. Cuenco Ave., Brgy. Talamban, Cebu City, Cebu* 85. CEBU - TALISAY BRANCH - CBC Bldg., 1055 Cebu South National Road, Bulacao, Talisay City, Cebu* 86. CLARK FREEPORT ZONE BRANCH - G/F Stotsenberg Lifestyle Center, N. Aquino corner S. Osmeña & E. Jacinto Sts., Clark Freeport Zone, Mabalacat, Pampanga* 87. COTABATO CITY BRANCH - No. 76 BH Century Inc., S.K. Pendatun Ave., Cotabato City, Maguindanao* 88. DAET BRANCH - Vinzons Ave., Daet, Camarines Norte* 89. DAGUPAN - M.H.DEL PILAR BRANCH - Carried Realty Bldg., No. 28 M.H. del Pilar St., Dagupan City, Pangasinan* 90. DAGUPAN - PEREZ BRANCH - GF Siapno Bldg., Perez Boulevard, Brgy. Pogo Chico, Dagupan City, Pangasinan* 91. DAVAO - BAJADA BRANCH - B.I. Zone Bldg., J.P. Laurel Ave., Bajada, Davao City, Davao del Sur* 92. DAVAO - BUHANGIN BRANCH - Km. 5 Buhangin Road, Davao City, Davao del Sur* 93. DAVAO - CALINAN BRANCH - G/F TNE Bldg., Davao-Bukidnon National Hway - Riverside, Calinan Proper, Davao City, Davao del Sur** 94. DAVAO - INSULAR VILLAGE BRANCH - Km. 8, Insular Village I, Lanang, Davao City, Davao del Sur* 95. DAVAO - MA-A BRANCH - G/F Lapeña Bldg., Mac Arthur Highway, Matina, Davao City, Davao del Sur* 96. DAVAO - MATINA BRANCH – Comglasco Bldg., Km. 4 McArthur Highway, Matina, Davao City, Davao del Sur*
4545
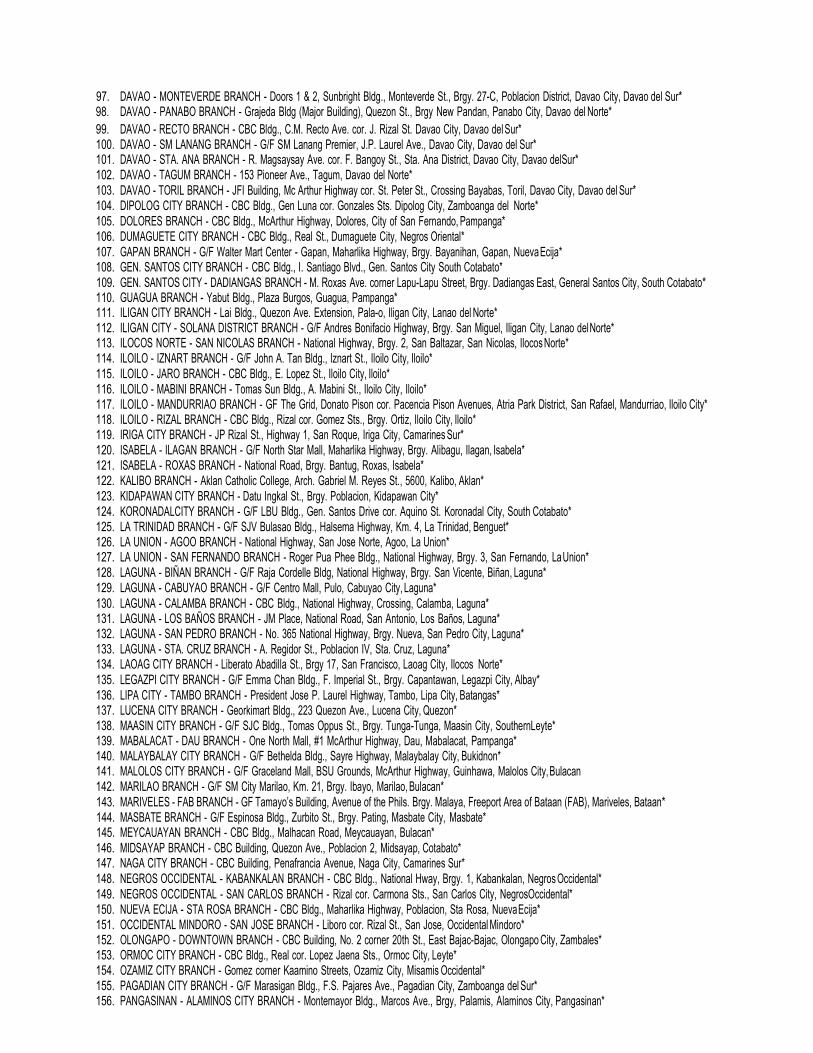
97. DAVAO - MONTEVERDE BRANCH - Doors 1 & 2, Sunbright Bldg., Monteverde St., Brgy. 27-C, Poblacion District, Davao City, Davao del Sur* 98. DAVAO - PANABO BRANCH - Grajeda Bldg (Major Building), Quezon St., Brgy New Pandan, Panabo City, Davao del Norte*
99. DAVAO - RECTO BRANCH - CBC Bldg., C.M. Recto Ave. cor. J. Rizal St. Davao City, Davao del Sur* 100. DAVAO - SM LANANG BRANCH - G/F SM Lanang Premier, J.P. Laurel Ave., Davao City, Davao del Sur* 101. DAVAO - STA. ANA BRANCH - R. Magsaysay Ave. cor. F. Bangoy St., Sta. Ana District, Davao City, Davao delSur* 102. DAVAO - TAGUM BRANCH - 153 Pioneer Ave., Tagum, Davao del Norte* 103. DAVAO - TORIL BRANCH - JFI Building, Mc Arthur Highway cor. St. Peter St., Crossing Bayabas, Toril, Davao City, Davao del Sur* 104. DIPOLOG CITY BRANCH - CBC Bldg., Gen Luna cor. Gonzales Sts. Dipolog City, Zamboanga del Norte* 105. DOLORES BRANCH - CBC Bldg., McArthur Highway, Dolores, City of San Fernando, Pampanga* 106. DUMAGUETE CITY BRANCH - CBC Bldg., Real St., Dumaguete City, Negros Oriental* 107. GAPAN BRANCH - G/F Walter Mart Center - Gapan, Maharlika Highway, Brgy. Bayanihan, Gapan, Nueva Ecija* 108. GEN. SANTOS CITY BRANCH - CBC Bldg., I. Santiago Blvd., Gen. Santos City South Cotabato* 109. GEN. SANTOS CITY - DADIANGAS BRANCH - M. Roxas Ave. corner Lapu-Lapu Street, Brgy. Dadiangas East, General Santos City, South Cotabato* 110. GUAGUA BRANCH - Yabut Bldg., Plaza Burgos, Guagua, Pampanga* 111. ILIGAN CITY BRANCH - Lai Bldg., Quezon Ave. Extension, Pala-o, Iligan City, Lanao del Norte* 112. ILIGAN CITY - SOLANA DISTRICT BRANCH - G/F Andres Bonifacio Highway, Brgy. San Miguel, Iligan City, Lanao del Norte* 113. ILOCOS NORTE - SAN NICOLAS BRANCH - National Highway, Brgy. 2, San Baltazar, San Nicolas, Ilocos Norte* 114. ILOILO - IZNART BRANCH - G/F John A. Tan Bldg., Iznart St., Iloilo City, Iloilo* 115. ILOILO - JARO BRANCH - CBC Bldg., E. Lopez St., Iloilo City, Iloilo* 116. ILOILO - MABINI BRANCH - Tomas Sun Bldg., A. Mabini St., Iloilo City, Iloilo* 117. ILOILO - MANDURRIAO BRANCH - GF The Grid, Donato Pison cor. Pacencia Pison Avenues, Atria Park District, San Rafael, Mandurriao, Iloilo City* 118. ILOILO - RIZAL BRANCH - CBC Bldg., Rizal cor. Gomez Sts., Brgy. Ortiz, Iloilo City, Iloilo* 119. IRIGA CITY BRANCH - JP Rizal St., Highway 1, San Roque, Iriga City, Camarines Sur* 120. ISABELA - ILAGAN BRANCH - G/F North Star Mall, Maharlika Highway, Brgy. Alibagu, Ilagan, Isabela* 121. ISABELA - ROXAS BRANCH - National Road, Brgy. Bantug, Roxas, Isabela* 122. KALIBO BRANCH - Aklan Catholic College, Arch. Gabriel M. Reyes St., 5600, Kalibo, Aklan* 123. KIDAPAWAN CITY BRANCH - Datu Ingkal St., Brgy. Poblacion, Kidapawan City* 124. KORONADALCITY BRANCH - G/F LBU Bldg., Gen. Santos Drive cor. Aquino St. Koronadal City, South Cotabato* 125. LA TRINIDAD BRANCH - G/F SJV Bulasao Bldg., Halsema Highway, Km. 4, La Trinidad, Benguet* 126. LA UNION - AGOO BRANCH - National Highway, San Jose Norte, Agoo, La Union* 127. LA UNION - SAN FERNANDO BRANCH - Roger Pua Phee Bldg., National Highway, Brgy. 3, San Fernando, La Union* 128. LAGUNA - BIÑAN BRANCH - G/F Raja Cordelle Bldg, National Highway, Brgy. San Vicente, Biñan, Laguna* 129. LAGUNA - CABUYAO BRANCH - G/F Centro Mall, Pulo, Cabuyao City, Laguna*
130. LAGUNA - CALAMBA BRANCH - CBC Bldg., National Highway, Crossing, Calamba, Laguna* 131. LAGUNA - LOS BAÑOS BRANCH - JM Place, National Road, San Antonio, Los Baños, Laguna* 132. LAGUNA - SAN PEDRO BRANCH - No. 365 National Highway, Brgy. Nueva, San Pedro City, Laguna* 133. LAGUNA - STA. CRUZ BRANCH - A. Regidor St., Poblacion IV, Sta. Cruz, Laguna* 134. LAOAG CITY BRANCH - Liberato Abadilla St., Brgy 17, San Francisco, Laoag City, Ilocos Norte* 135. LEGAZPI CITY BRANCH - G/F Emma Chan Bldg., F. Imperial St., Brgy. Capantawan, Legazpi City, Albay* 136. LIPA CITY - TAMBO BRANCH - President Jose P. Laurel Highway, Tambo, Lipa City, Batangas* 137. LUCENA CITY BRANCH - Georkimart Bldg., 223 Quezon Ave., Lucena City, Quezon* 138. MAASIN CITY BRANCH - G/F SJC Bldg., Tomas Oppus St., Brgy. Tunga-Tunga, Maasin City, SouthernLeyte* 139. MABALACAT - DAU BRANCH - One North Mall, #1 McArthur Highway, Dau, Mabalacat, Pampanga* 140. MALAYBALAY CITY BRANCH - G/F Bethelda Bldg., Sayre Highway, Malaybalay City, Bukidnon* 141. MALOLOS CITY BRANCH - G/F Graceland Mall, BSU Grounds, McArthur Highway, Guinhawa, Malolos City, Bulacan 142. MARILAO BRANCH - G/F SM City Marilao, Km. 21, Brgy. Ibayo, Marilao, Bulacan* 143. MARIVELES - FAB BRANCH - GF Tamayo’s Building, Avenue of the Phils. Brgy. Malaya, Freeport Area of Bataan (FAB), Mariveles, Bataan* 144. MASBATE BRANCH - G/F Espinosa Bldg., Zurbito St., Brgy. Pating, Masbate City, Masbate* 145. MEYCAUAYAN BRANCH - CBC Bldg., Malhacan Road, Meycauayan, Bulacan* 146. MIDSAYAP BRANCH - CBC Building, Quezon Ave., Poblacion 2, Midsayap, Cotabato* 147. NAGA CITY BRANCH - CBC Building, Penafrancia Avenue, Naga City, Camarines Sur* 148. NEGROS OCCIDENTAL - KABANKALAN BRANCH - CBC Bldg., National Hway, Brgy. 1, Kabankalan, Negros Occidental* 149. NEGROS OCCIDENTAL - SAN CARLOS BRANCH - Rizal cor. Carmona Sts., San Carlos City, NegrosOccidental* 150. NUEVA ECIJA - STA ROSA BRANCH - CBC Bldg., Maharlika Highway, Poblacion, Sta Rosa, Nueva Ecija* 151. OCCIDENTAL MINDORO - SAN JOSE BRANCH - Liboro cor. Rizal St., San Jose, Occidental Mindoro* 152. OLONGAPO - DOWNTOWN BRANCH - CBC Building, No. 2 corner 20th St., East Bajac-Bajac, Olongapo City, Zambales* 153. ORMOC CITY BRANCH - CBC Bldg., Real cor. Lopez Jaena Sts., Ormoc City, Leyte* 154. OZAMIZ CITY BRANCH - Gomez corner Kaamino Streets, Ozamiz City, Misamis Occidental* 155. PAGADIAN CITY BRANCH - G/F Marasigan Bldg., F.S. Pajares Ave., Pagadian City, Zamboanga del Sur* 156. PANGASINAN - ALAMINOS CITY BRANCH - Montemayor Bldg., Marcos Ave., Brgy, Palamis, Alaminos City, Pangasinan*
4646

157. PANGASINAN - BAYAMBANG BRANCH - CBC Bldg., Poblacion Sur, Bayambang, Pangasinan* 158. PANGASINAN - ROSALES BRANCH - CBC Building, Calle Dewey, Rosales, Pangasinan* 159. PANGASINAN - URDANETA BRANCH - EF Square Bldg., Poblacion St., MacArthur Highway, Urdaneta City, Pangasinan* 160. PASEO DE STA. ROSA BRANCH - Unit 3, Paseo 5, Paseo de Sta. Rosa, Sta. Rosa City, Laguna*
161. PUERTO PRINCESA CITY BRANCH - Bobby L. Castro Bldg., Malvar St. near cor. Valencia St., Puerto Princesa City, Palawan* 162. QUEZON - CANDELARIA BRANCH - Pan Philippine Highway Cor. Del Valle Street, Poblacion, Candelaria, Quezon* 163. ROXAS CITY BRANCH - 1063 Roxas Ave. cor. Bayot Drive, Sumulong Highway, Brgy. Mambugan, Roxas City, Capiz* 164. SAN FERNANDO BRANCH - CBC Bldg., V. Tiomico St., Brgy. Sto. Rosario, City of San Fernando, Pampanga* 165. SAN FERNANDO - SINDALAN BRANCH - Stall 123 G/F Jumbo Jenra Sindalan, Brgy. Sindalan, San Fernando City, Pampanga* 166. SAN JOSE CITY BRANCH - G/F Violago Bldg., Maharlika Highway, Brgy. Malasin, San Jose City, Nueva Ecija* 167. SAN PABLO CITY BRANCH - Unit 1, M. Paulino St., San Pablo City, Laguna* 168. SANTIAGO CITY BRANCH - Navarro Bldg., Maharlika Highway near cor. Bayaua St., Santiago City, Isabela* 169. SILAY CITY BRANCH - Margarita Bldg., Rizal St., Silay City, Negros Occidental* 170. SM CITY CABANATUAN - UGF SM City Cabanatuan, Maharlika Highway, Brgy. H. Concepcion, Cabanatuan City, Nueva Ecija* 171. SM CDO DOWNTOWN PREMIER BRANCH - G/F SM CDO Downtown Premier, Claro M. Recto St., Lapasan, Cagayan de Oro City, Misamis Oriental* 172. SM CITY CLARK BRANCH - G/F (Unit 172-173) SM City Clark, M. Roxas St., CSEZ, Angeles City, Pampanga** 173. SM CITY DASMARIÑAS BRANCH - LGF SM City Dasmariñas, Gov Drive, Pala-Pala, City of Dasmariñas, Cavite* 174. SM CITY LIPA BRANCH - G/F (Units 1111-1113) SM City Lipa, J.P. Laurel Highway, Brgy. Maraouy, Lipa City, Batangas* 175. SM CITY NAGA BRANCH - SM City Naga, CBD II, Brgy. Triangulo, Naga City, Camarines Sur* 176. SM CITY OLONGAPO CENTRAL BRANCH - G/F SM City Olongapo Central, East Tapinac, Olongapo City, Zambales* 177. SM CITY PAMPANGA BRANCH - Unit AX3 102, Bldg. 4, SM City Pampanga, Mexico, Pampanga* 178. SM CITY SAN JOSE DEL MONTE BRANCH - UGF SM City San Jose Del Monte, Quirino Highway, Brgy. Tungkong Mangga, San Jose Del Monte City, Bulacan* 179. SM CITY SAN PABLO BRANCH - G/F SM City San Pablo, National Highway, Brgy. San Rafael, San Pablo City, Laguna* 180. SM CITY STA. ROSA BRANCH - G/F SM City Sta. Rosa, Bo. Tagapo, Sta. Rosa, Laguna* 181. SM CITY TELABASTAGAN BRANCH - G/F SM City Telabastagan, San Fernando City, Pampanga* 182. SOLANO BRANCH - National Highway, Brgy. Quirino, Solano, Nueva Vizcaya* 183. SORSOGON BRANCH - CBC Bldg., Ramon Magsaysay Ave., Brgy. Sirangan, Sorsogon City, Sorsogon* 184. SUBIC BAY FREEPORT ZONE BRANCH - CBC Bldg, Rizal Highway, Subic Bay Gateway Park, Subic Bay Freeport Zone, Zambales* 185. SURIGAO CITY BRANCH - CBC Bldg., Amat St., Barrio Washington, Surigao City, Surigao Del Norte* 186. TABACO CITY BRANCH - G/F ANG Bldg., Ziga Ave. cor. Berces St., Tabaco City, Albay*
187. TACLOBAN CITY BRANCH - Uytingkoc Bldg., Avenida Veteranos, Tacloban City, Leyte* 188. TAGAYTAY CITY BRANCH - Foggy Heights Subdivision, E. Aguinaldo Highway, Tagaytay City, Cavite* 189. TAGBILARAN CITY BRANCH - G/F Melrose Bldg., Carlos P. Garcia Ave., Tagbilaran City, Bohol* 190. TALAVERA BRANCH - CBC Bldg., Maharlika Highway, Marcos District, Talavera, Nueva Ecija* 191. TARLAC - BAMBAN BRANCH - National Road, Bgry. Anupul, Bamban, Tarlac* 192. TARLAC - CAMILING BRANCH - Savewise Bldg., Romulo St., Poblacion, Camiling Tarlac* 193. TARLAC - CONCEPCION BRANCH - G/F Descanzo Bldg., F. Timbol St., San Nicolas, Poblacion, Concepcion, Tarlac* 194. TARLAC - PANIQUI BRANCH - G/F Cedasco Bldg., M. H del Pilar St., Poblacion, Paniqui, Tarlac* 195. TARLAC BRANCH - CBC Bldg., Panganiban near cor. F. Tañedo St., Brgy. San Nicolas, Tarlac City, Tarlac* 196. TARLAC - SAN RAFAEL BRANCH - CBC Building, MacArthur Highway, San Rafael, Tarlac City, Tarlac* 197. THE DISTRICT IMUS BRANCH - G/F The District Imus, Emilio Aguinaldo Highway, Anabu II, Imus, Cavite* 198. TRECE MARTIRES BRANCH - G/F Walter Mart, Governor’s Drive cor. City Hall Road, Brgy. San Agustin, Trece Martires City, Cavite* 199. TUGUEGARAO - BALZAIN BRANCH - Editha Bldg., Balzain Highway, Tuguegarao City, Cagayan* 200. TUGUEGARAO CITY BRANCH - A. Bonifacio St., Brgy. Centro 6, Tuguegarao, Cagayan* 201. VALENCIA BRANCH - Tamay Lang Bldg., A. Mabini St., Brgy. Poblacion, Valencia, Bukidnon* 202. VIGAN CITY BRANCH - Burgos St. near cor. Rizal St., Vigan City, Ilocos Sur* 203. VIRAC BRANCH - Quezon Avenue, Brgy. Salvacion, Virac, Catanduanes* 204. ZAMBALES - BOTOLAN BRANCH - National Highway, Brgy. Batonlapoc, Botolan, Zambales* 205. ZAMBOANGA CITY BRANCH - CBC Bldg., Gov. Lim Ave. cor. Nuñez St., Zone III, Zamboanga City, Zamboanga del Sur* 206. ZAMBOANGA - GUIWAN BRANCH - G/F Yang’s Tower, Ma. Clara Lorenzo Lobregat National Highway, Guiwan, Zamboanga City, Zamboanga del Sur* 207. ZAMBOANGA - SAN JOSE GUSU BRANCH - Yubenco Star Mall, San Jose Gusu, Zamboanga City, Zamboanga del Sur**
* One (1) ATM ** Two (2) ATMs *** Four (4) ATMs
4747

China Bank Savings Metro Manila Branches
1. ACACIA ESTATES -SAVEMORE BRANCH - Acacia Town Center, Acacia Estates, Ususan, Taguig City* 2. AYALA BRANCH - 6772 Ayala Ave., Makati City** 3. ALABANG- GF / Common Goal Bldg., Finance cor. Industry Sts., Madrigal Business Park, Ayala Alabang, MuntinlupaCity* 4. AMANG RODRIGUEZ- SAVEMORE BRANCH – G/F GBU Bldg. Amang Rodriguez Ave cor. Evangelista St. Santolan, Pasig City* 5. AMORANTO AVENUE – Unit 101 R. Place Building, 255 N.S Amoranto Sr. Avenue, Quezon City* 6. ANONAS - SAVEMORE BRANCH - V. Luna St. corner Anonas Extension, Sikatuna Village, QuezonCity*
7. ARANETA CENTER COD - SAVEMORE BRANCH - Gen. Romulo St., Araneta Center, Cubao, Quezon City* 8. BACLARAN – 3751 Quirino Avenue cor. Sta. Rita St., Baclaran, Parañaque City* 9. BANAWE- Nos. 247-249 Banawe St., Sta. Mesa Heights, Brgy. Lourdes, Quezon City* 10. BANGKAL- GF / Amara Bldg., 1661 Evangelista St., Bangkal, Makati City* 11. BLUMENTRITT - Blumentritt St. near Oroquieta St. Sta. Cruz, Manila* 12. BINONDO – JUAN LUNA – 694-696 Juan Luna St., Binondo, Manila 13. BONI AVENUE – Raymond Tower Boni, 615 Boni Avenue, Plainview, Mandaluyong City* 14. BUENDIA- Main Branch, 314 Sen. Gil J. Puyat Ave., Makati City** 15. COMMONWEALTH AVENUE - JocFer Building, Commonwealth Avenue, Brgy. Holy Spirit, Quezon City * 16. CUBAO- Fernandina 88 Suites, 222 P. Tuazon Boulevard, Cubao, Quezon City* 17. DEL MONTE- 392 Del Monte Ave., Brgy. Sienna, Quezon City* 18. DIVISORIA – 3/F Dragon 8 Shopping Center, C.M Recto Avenue cor. Dagupan St., Divisoria Manila* 19. E. RODRIGUEZ SR. - HEMADY - E. Rodriguez, Sr. cor Hemady St., Quezon City * 20. ESPAÑA - SUNMALL, Espana Boulevard corner Mayon St., Manila * 21. FELIX HUERTAS - JT Centrale Mall, 1686 V. Fugoso St. corner Felix Huertas St., Sta. Cruz, Manila * 22. FILINVEST CORPORATE CITY BR - BC Group Bldg., East Asia Drive near cor. Comm. Ave., Filinvest Corp City, Alabang, Muntinlupa City* 23. FTI-TAGUIG -SM HYPERMARKET BRANCH - DBP Avenue, Food Terminal Inc., Western Bicutan, Taguig* 24. G. ARANETA AVENUE – 195 G. Araneta Avenue, Quezon City*
25. GIL PUYAT-BAUTISTA – Lot 25 Blk 74 Bautista St. cor. Buendia Avenue, Makati City* 26. GREENHILLS-ORTIGAS AVENUE - VAG Bldg., Ortigas Ave., Greenhills, San Juan, Metro Manila* 27. GREENHILLS-WILSON BRANCH - 219 Wilson St., Greenhills, San Juan* 28. GUIGUINTO-RIS - RIS-5 Industrial Complex, 68 Mercado St., Tabe, Guiguinto, Bulacan 29. KALOOKAN BRANCH - Augusto Bldg., Rizal Ave., Grace Park, Kalookan City* 30. KALOOKAN-A. MABINI- AJ Bldg., 353 A. Mabini St., Kalookan City* 31. KATIPUNAN – One Burgundy Condominium, Katipunan Avenue, Quezon City* 32. LAGRO- Bonanza Bldg., Quirino Highway, Greater Lagro, Novaliches, Quezon City* 33. LAS PIÑAS – ALMANZA UNO BRANCH - Alabang Zapote Road, Almanza Uno, Las Piñas City* 34. MAKATI-CHINO ROCES BRANCH - 2176 Chino Roces Ave., Makati City* 35. MAKATI-J.P. RIZAL BRANCH - 882 J.P. Rizal St., Makati City* 36. MALABON -SAVEMORE - Francis Market, Governor Pascual corner M.H. Del Pilar Sts., Malabon* 37. MANDALUYONG- Paterno’s Bldg., 572 New Panaderos St., Brgy. Pag-asa, Mandaluyong City* 38. MANDALUYONG-SHAW BOULEVARD BRANCH – 500 Shaw Tower, 500 Shaw Boulevard, Mandaluyong City* 39. MANILA - STA.ANA - SAVEMORE BRANCH - Savemore, Pedro Gil St., Sta. Ana, Manila * 40. MARIKINA BRANCH - 33 Bayan-Bayanan Ave., Brgy. Concepcion 1, Marikina City* 41. MARIKINA-GIL FERNANDO AVENUE - CTP Bldg., Gil Fernando Ave., Brgy. San Roque, Marikina City* 42. MUÑOZ – JACKMAN BRANCH - Jackman Plaza, Lower Ground Floor, EDSA-Munoz, Quezon City* 43. NEPA-Q-MART -SAVEMORE BRANCH - Rose Bldg., 770 St. EDSA and K-G St., West Kamias, Quezon City* 44. NINOY AQUINO AVENUE- Ground Floor Skyfreight Bldg., Ninoy Aquino Ave. cor. Pascor Drive, Parañaque City* 45. ORTIGAS BRANCH - Ground Floor, Hanston Square, San Miguel Ave., Ortigas Center, Pasig City* 46. PARAÑAQUE - BETTER LIVING - 90 Dona Soledad Avenue, Better Living Subdivision, Parañaque* 47. PARAÑAQUE - BF HOMES BRANCH - 284 Aguirre Ave., B.F. Homes, Paranaque* 48. PARAÑAQUE-JAKA - Jaka Plaza Center, Dr. A. Santos Ave. (Sucat Road), Brgy. San Isidro, ParañaqueCity* 49. PARAÑAQUE - LA HUERTA – 1070 Quirino Ave., La Huerta, Paranaque City* 50. PARAÑAQUE – MOONWALK – Kassel Residence Building, E. Rodriguez Avenue, Moonwalk ParañaqueCity* 51. PASAY-LIBERTAD – 533 Cementina St. Libertad, Pasay City* 52. PASIG CANIOGAN - KSN Building, C. Raymundo Avenue, Caniogan, Pasig City * 53. PASIG-MUTYA – Richcrest Building, Caruncho corner Market Avenue, San Nicolas, Pasig City* 54. PASIG – PADRE BURGOS BRANCH - 114 Padre Burgos St., Kapasigan, Pasig City* 55. PASO DE BLAS- Andok’s Bldg., 629 General Luis St., Malinta Interchange-NLEX, Paso de Blas, Valenzuela City* 56. PATEROS BRANCH – Unit CC1, GF East Mansion Townhomes, Sto. Rosario, Pateros*
57. PATEROS-ALMEDA - 120 Almeda St., Pateros, Metro Manila*
4848

58. PEDRO GIL - LKE Bldg. Pedro Gil corner Pasaje, Rosario st. Paco, Manila 59. PLAZA STA. CRUZ BRANCH – MBI Building, Unit 103, Plaza Sta. Cruz, Sta. Cruz, Manila* 60. QUEZON AVENUE BRANCH - G/F GJ Bldg., 385 Quezon Ave., Quezon City* 61. QUEZON AVENUE-PALIGSAHAN - 1184-A Ben-Lor Bldg., Quezon Ave., Brgy. Paligsahan, Quezon City* 62. QUIAPO – ECHAGUE - Palanca corner P. Gomez streets, Echague, Quiapo, City of Manila 63. QUIAPO – QUEZON BLVD. – 416 Quezon Boulevard, Quiapo Manila* 64. RADA- LEGASPI - HRC Center, 104 Rada St., Legaspi Village, Makati City* 65. ROOSEVELT – 342 Roosevelt Avenue, Quezon City* 66. SAN JUAN - Madison Square, 264 N. Domingo St., Barangay Pasadena, San Juan* 67. SM HYPERMARKET - ADRIATICO– Adriatico St., Malate, Manila* 68. SOUTH TRIANGLE - Ground Floor, SUNNYMEDE IT CENTER, Brgy. South Triangle, Quezon Ave., QC 69. STA. MESA - 4128 Ramon Magsaysay Blvd., Sta. Mesa Manila* 70. TANDANG SORA – Cecileville Bldg. III, 670 Tandang Sora Ave. corner General Ave., Tandang Sora, Quezon City* 71. TAYUMAN – 1925-1929 Rizal Avenue near corner Tayuman St., Sta. Cruz, Manila* 72. TIMOG- Jenkinsen Towers, 80 Timog Ave., Brgy. Sacred Heart, Quezon City* 73. TWO E-COM – Two E-Com Center Tower B, Ocean Drive near cor. Bayshore Ave., Mall of Asia Complex, Pasay City* 74. UN AVENUE- 552 U.N. Ave., Ermita, Manila* 75. VALENZUELA-MARULAS- Ong-Juanco Bldg., 92 - J McArthur Highway, Marulas, Valenzuela City* 76. VISAYAS AVENUE- Wilcon City Center Mall, Visayas Ave., Quezon City* 77. ANTIPOLO- EMS Bldg., M.L. Quezon St. cor. F. Dimanlig St., Antipolo City, Rizal* 78. ANGONO- Manila East Road cor. Don Benito St., Brgy. San Roque, Angono, Rizal* 79. TAYTAY BRANCH - C. Gonzaga Bldg. II, Manila East Road, Taytay, Rizal*
China Bank Savings Provincial Branches
1. ANGELES-RIZAL AVENUE - 639 Rizal St., Angeles City* 2. ARAYAT BRANCH - Cacutud, Arayat, Pampanga** 3. BACOLOD BRANCH - Fordland Building I Annex, 12th Lacson Street, Bacolod City * 4. BACOOR - TALABA - Coastal Road cor. Aguinaldo Highway, Brgy. Talaba VII, Bacoor City, Cavite* 5. BAGUIO - SESSION - B108 Lopez Bldg., Session Road, Baguio City* 6. BALAGTAS- McArthur Highway, Wawa, Balagtas, Bulacan* 7. BALANGA - DM BANZON - D.M. Banzon St., BalangaCity* 8. BALIBAGO- JEV Bldg., McArthur Highway, Balibago, Angeles City* 9. BALIUAG- Plaza Naning, Poblacion, Baliuag, Bulacan* 10. BATANGAS - P. BURGOS - No. 3 P. Burgos St., Batangas City* 11. BIÑAN- Nepa Highway, San Vicente, Biñan, Laguna* 12. BUTUAN - JMC Building, J.C. Aquino Avenue, Brgy. Lapu Lapu, Butuan City, Agusan del Norte* 13. CABANATUAN-BAYAN - Burgos Ave., Cabanatuan City, Nueva Ecija* 14. CAGAYAN DE ORO BRANCH - Sergio Osmeña St., Cogon District, Cagayan de Oro City* 15. CALAMBA BRANCH - HK Bldg II, National Highway, Brgy. Halang, Calamba, Laguna* 16. CAVITE CITY - 485 P. Burgos St., Brgy. 34, Caridad, Cavite City* 17. CEBU – MANDAUE BRANCH - A. Del Rosario Ave., Mantuyong, Mandaue City, Cebu* 18. CEBU – MANGO AVENUE, JSP Mango Plaza, Gen. Maxilom Ave. cor. Echavez St., Cebu City* 19. CEBU-LAHUG BRANCH - G/F Skyrise IT Bldg., Brgy. Apas, Lahug, Cebu City* 20. CEBU-MANDAUE BASAK - Co Tiao King Bldg., Cebu North Road Basak, Mandaue City* 21. DAGUPAN BRANCH - G/F Lyceum-Northwestern University, Tapuac District, Dagupan City* 22. DARAGA BRANCH - Rizal St., Brgy. San Roque, Daraga, Albay, Bicol* 23. DASMARIÑAS- Veluz Plaza Bldg., Zone I, Aguinaldo Highway, Dasmariñas City, Cavite* 24. DAU BRANCH - MacArthur Highway, Dau, Mabalacat, Pampanga* 25. DAVAO – RECTO- C. M Ville Abrille Bldg., C. M. Recto St. Davao City* 26. DAVAO BRANCH - G/F 8990 Corporate Center, Quirino Ave., Davao City* 27. DOLORES- STCI Bldg., McArthur Highway, San Agustin, City of San Fernando, Pampanga* 28. GENERAL SANTOS- I. Santiago Boulevard General, Santos City* 29. GUAGUA BRANCH - Plaza Burgos, Guagua, Pampanga* 30. ILOILO – JARO BRANCH - Lopez Jaena cor. EL 98 Sts., Jaro, Iloilo* 31. ILOILO – IZNART - Golden Commercial Center Bldg, Iznart St. Iloilo City* 32. IMUS- TANZANG LUMA - Tanzang Luma, Aguinaldo Highway, Imus City, Cavite* 33. KALIBO-CITYMALL – F. Quimpo St. connecting Mabini and Toting Reyes Streets, Kalibo, Aklan*
34. LA UNION- AG Zambrano Bldg., Quezon Ave., San Fernando City, La Union*
4949

35. LAGUNA-STA. CRUZ - E & E Building, Pedro Guevarra St., Sta. Cruz, Laguna. * 36. LAOAG - J.P Rizal St. corner Balintawak St. Laoag City, Ilocos Norte* 37. LEGAZPI CITY - F. Imperial Street, Barangay Bitano, Legazpi City* 38. LINGAYEN - Unit 5-6, The Hub - Lingayen Building, National Road, Poblacion, Lingayen, Pangasinan 39. LIPA - CM RECTO - C.M. Recto Ave., Lipa City* 40. LOS BAÑOS-CROSSING- Lopez Ave., Batong Malaki, Los Baños, Laguna* 41. LUCENA- Merchan cor., Evangelista St., Lucena City* 42. MACABEBE BRANCH - Poblacion, Macabebe, Pampanga* 43. MALOLOS BRANCH - Canlapan St., Sto. Rosario, Malolos City, Bulacan* 44. MALOLOS-CATMON - Paseo del Congreso, Catmon, City of Malolos, Bulacan* 45. MEYCAUAYAN- Mancon Bldg., McArthur Highway, Calvario, Meycauayan, Bulacan* 46. MOLINO-BACOOR - 817 Molino Road Molino III, Bacoor, Cavite* 47. MOUNT CARMEL- AMB Bldg., Km. 78 McArthur Highway, Brgy. Saguin, City of San Fernando, Pampanga* 48. NAGA BRANCH - RL Bldg., Panganiban St., Lerma, Naga City* 49. OLONGAPO BRANCH - Ground Floor, City View Hotel, 25 Magsaysay Drive, New Asinan, OlongapoCity* 50. ORANI BRANCH - Brgy. Balut, Orani, Bataan** 51. PLARIDEL- 0226 Cagayan Valley Road, Banga 1st, Plaridel, Bulacan* 52. PORAC BRANCH - Cangatba, Porac, Pampanga** 53. ROXAS AVE.-CAPIZ CITYMALL - Roxas Ave, brgy VI, Roxas City, Capiz 54. SAN FERNANDO BRANCH - KHY Trading Bldg., San Fernando-Gapan Rd., San Fernando City, Pampanga* 55. SAN FERNANDO – BAYAN BRANCH - JSL Building, Consunji St., San Fernando, Pampanga* 56. SAN ILDEFONSO-SAVEMORE BRANCH - Savemore San Ildefonso, Poblacion, San Ildefonso, Bulacan* 57. SAN JOSE DEL MONTE BRANCH - Ground Floor, Giron Bldg., Gov. Halili Ave., Tungkong Mangga, City of San Jose Del Monte, Bulacan* 58. SAN MIGUEL- Norberto St., San Jose, San Miguel, Bulacan* 59. SAN NARCISO BRANCH - Brgy. Libertad, San Narciso, Zambales*
60. SAN PABLO-RIZAL AVE. BRANCH – Rizal Avenue cor. Lopez Jaena St. San Pablo City, Laguna* 61. SAN PEDRO BRANCH - Gen - Ber Bldg. National Highway Landayan, San Pedro Laguna* 62. SAN RAFAEL BRANCH - Cagayan Valley cor. Cruz na Daan Roads, San Rafael, Bulacan* 63. SANTIAGO - VICTORY NORTE - JECO Bldg., Maharlika Highway cor. Quezon St., Victory Norte, Santiago City* 64. SORSOGON - God is Good Commercial Bldg, Rizal St., Purok 5, Piot, West District, Sorsogon City, Sorsogon* 65. STA. ANA BRANCH - Poblacion, Sta. Ana, Pampanga* 66. STA. MARIA- JC De Jesus cor. M. De Leon, Poblacion, Sta. Maria, Bulacan* 67. STA. RITA BRANCH - San Vicente, Sta. Rita, Pampanga* 68. STA. ROSA BRANCH - Sta. Rosa-Tagaytay Highway, Sta. Rosa, Laguna* 69. STA. ROSA-BALIBAGO - National Highway cor. Lazaga St. Balibago, Sta. Rosa, Laguna* 70. STO. TOMAS- MAHARLIKA - Agojo Bldg., Maharlika Highway, Sto. Tomas, Batangas* 71. SUBIC BRANCH - Baraca, Subic, Zambales* 72. TACLOBAN CITY – GF, YVI Center, Bldg A, Fatima Village, Tacloban City, Leyte* 73. TAGAYTAY-MENDEZ-SAVEMORE - Mendez Crossing West, Tagaytay-Nasugbu Highway corner Mendez-Tagaytay Rd, Tagaytay City* 74. TAGUM-CITYMALL – Maharlika Highway cor. Lapu-Lapu Extension, Brgy. Magugpo Tagum City* 75. TALISAY-NEGROS-SAVEMORE BRANCH – Talisay, Mabini St., Zone 12 Paseo Mabini Talisay City NegrosOccidental* 76. TANAUAN CITY - Jose P. Laurel National Highway, Darasa, Tanauan City, Batangas 77. TARLAC - MAC ARTHUR - McArthur Highway, San Nicolas, Tarlac City* 78. TUGUEGARAO- Metropolitan Cathedral Parish, Rectory Complex, Rizal St., Tuguegarao City* 79. URDANETA- MacArthur Highway, Nancayasan, Urdaneta City, Pangasinan* 80. VIGAN- Plaza Maestro Convention Center, Florentino St., and Burgos St. Vigan City, Ilocos Sur* 81. ZAMBOANGA-CITYMALL BRANCH – CityMall, Don Alfaro St., Tetuan, Zamboanga*
5050
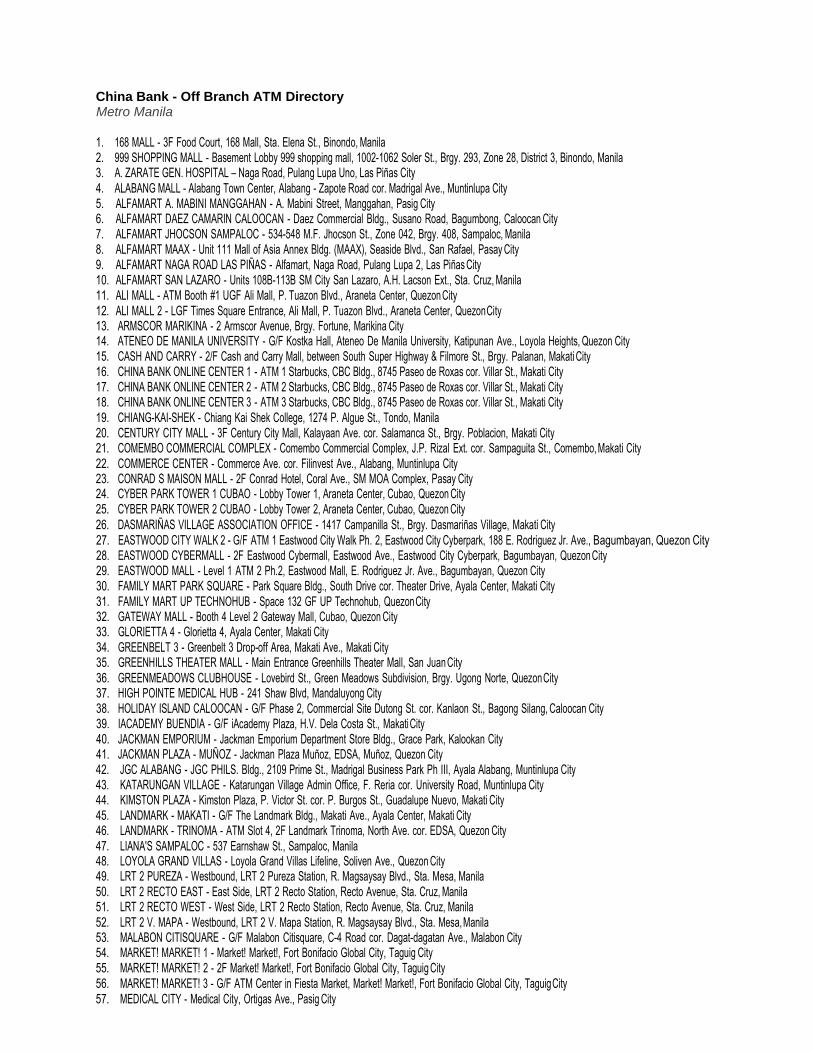
China Bank - Off Branch ATM Directory Metro Manila
1. 168 MALL - 3F Food Court, 168 Mall, Sta. Elena St., Binondo, Manila 2. 999 SHOPPING MALL - Basement Lobby 999 shopping mall, 1002-1062 Soler St., Brgy. 293, Zone 28, District 3, Binondo, Manila 3. A. ZARATE GEN. HOSPITAL – Naga Road, Pulang Lupa Uno, Las Piñas City 4. ALABANG MALL - Alabang Town Center, Alabang - Zapote Road cor. Madrigal Ave., Muntinlupa City 5. ALFAMART A. MABINI MANGGAHAN - A. Mabini Street, Manggahan, Pasig City 6. ALFAMART DAEZ CAMARIN CALOOCAN - Daez Commercial Bldg., Susano Road, Bagumbong, Caloocan City 7. ALFAMART JHOCSON SAMPALOC - 534-548 M.F. Jhocson St., Zone 042, Brgy. 408, Sampaloc, Manila 8. ALFAMART MAAX - Unit 111 Mall of Asia Annex Bldg. (MAAX), Seaside Blvd., San Rafael, Pasay City 9. ALFAMART NAGA ROAD LAS PIÑAS - Alfamart, Naga Road, Pulang Lupa 2, Las Piñas City 10. ALFAMART SAN LAZARO - Units 108B-113B SM City San Lazaro, A.H. Lacson Ext., Sta. Cruz, Manila 11. ALI MALL - ATM Booth #1 UGF Ali Mall, P. Tuazon Blvd., Araneta Center, Quezon City 12. ALI MALL 2 - LGF Times Square Entrance, Ali Mall, P. Tuazon Blvd., Araneta Center, Quezon City 13. ARMSCOR MARIKINA - 2 Armscor Avenue, Brgy. Fortune, Marikina City 14. ATENEO DE MANILA UNIVERSITY - G/F Kostka Hall, Ateneo De Manila University, Katipunan Ave., Loyola Heights, Quezon City 15. CASH AND CARRY - 2/F Cash and Carry Mall, between South Super Highway & Filmore St., Brgy. Palanan, Makati City 16. CHINA BANK ONLINE CENTER 1 - ATM 1 Starbucks, CBC Bldg., 8745 Paseo de Roxas cor. Villar St., Makati City 17. CHINA BANK ONLINE CENTER 2 - ATM 2 Starbucks, CBC Bldg., 8745 Paseo de Roxas cor. Villar St., Makati City 18. CHINA BANK ONLINE CENTER 3 - ATM 3 Starbucks, CBC Bldg., 8745 Paseo de Roxas cor. Villar St., Makati City 19. CHIANG-KAI-SHEK - Chiang Kai Shek College, 1274 P. Algue St., Tondo, Manila 20. CENTURY CITY MALL - 3F Century City Mall, Kalayaan Ave. cor. Salamanca St., Brgy. Poblacion, Makati City 21. COMEMBO COMMERCIAL COMPLEX - Comembo Commercial Complex, J.P. Rizal Ext. cor. Sampaguita St., Comembo, Makati City 22. COMMERCE CENTER - Commerce Ave. cor. Filinvest Ave., Alabang, Muntinlupa City 23. CONRAD S MAISON MALL - 2F Conrad Hotel, Coral Ave., SM MOA Complex, Pasay City 24. CYBER PARK TOWER 1 CUBAO - Lobby Tower 1, Araneta Center, Cubao, Quezon City 25. CYBER PARK TOWER 2 CUBAO - Lobby Tower 2, Araneta Center, Cubao, Quezon City
26. DASMARIÑAS VILLAGE ASSOCIATION OFFICE - 1417 Campanilla St., Brgy. Dasmariñas Village, Makati City 27. EASTWOOD CITY WALK 2 - G/F ATM 1 Eastwood City Walk Ph. 2, Eastwood City Cyberpark, 188 E. Rodriguez Jr. Ave., Bagumbayan, Quezon City 28. EASTWOOD CYBERMALL - 2F Eastwood Cybermall, Eastwood Ave., Eastwood City Cyberpark, Bagumbayan, Quezon City 29. EASTWOOD MALL - Level 1 ATM 2 Ph.2, Eastwood Mall, E. Rodriguez Jr. Ave., Bagumbayan, Quezon City 30. FAMILY MART PARK SQUARE - Park Square Bldg., South Drive cor. Theater Drive, Ayala Center, Makati City 31. FAMILY MART UP TECHNOHUB - Space 132 GF UP Technohub, Quezon City 32. GATEWAY MALL - Booth 4 Level 2 Gateway Mall, Cubao, Quezon City 33. GLORIETTA 4 - Glorietta 4, Ayala Center, Makati City 34. GREENBELT 3 - Greenbelt 3 Drop-off Area, Makati Ave., Makati City 35. GREENHILLS THEATER MALL - Main Entrance Greenhills Theater Mall, San Juan City 36. GREENMEADOWS CLUBHOUSE - Lovebird St., Green Meadows Subdivision, Brgy. Ugong Norte, Quezon City 37. HIGH POINTE MEDICAL HUB - 241 Shaw Blvd, Mandaluyong City 38. HOLIDAY ISLAND CALOOCAN - G/F Phase 2, Commercial Site Dutong St. cor. Kanlaon St., Bagong Silang, Caloocan City 39. IACADEMY BUENDIA - G/F iAcademy Plaza, H.V. Dela Costa St., Makati City 40. JACKMAN EMPORIUM - Jackman Emporium Department Store Bldg., Grace Park, Kalookan City 41. JACKMAN PLAZA - MUÑOZ - Jackman Plaza Muñoz, EDSA, Muñoz, Quezon City 42. JGC ALABANG - JGC PHILS. Bldg., 2109 Prime St., Madrigal Business Park Ph III, Ayala Alabang, Muntinlupa City 43. KATARUNGAN VILLAGE - Katarungan Village Admin Office, F. Reria cor. University Road, Muntinlupa City 44. KIMSTON PLAZA - Kimston Plaza, P. Victor St. cor. P. Burgos St., Guadalupe Nuevo, Makati City 45. LANDMARK - MAKATI - G/F The Landmark Bldg., Makati Ave., Ayala Center, Makati City 46. LANDMARK - TRINOMA - ATM Slot 4, 2F Landmark Trinoma, North Ave. cor. EDSA, Quezon City 47. LIANA'S SAMPALOC - 537 Earnshaw St., Sampaloc, Manila 48. LOYOLA GRAND VILLAS - Loyola Grand Villas Lifeline, Soliven Ave., Quezon City 49. LRT 2 PUREZA - Westbound, LRT 2 Pureza Station, R. Magsaysay Blvd., Sta. Mesa, Manila 50. LRT 2 RECTO EAST - East Side, LRT 2 Recto Station, Recto Avenue, Sta. Cruz, Manila 51. LRT 2 RECTO WEST - West Side, LRT 2 Recto Station, Recto Avenue, Sta. Cruz, Manila 52. LRT 2 V. MAPA - Westbound, LRT 2 V. Mapa Station, R. Magsaysay Blvd., Sta. Mesa, Manila 53. MALABON CITISQUARE - G/F Malabon Citisquare, C-4 Road cor. Dagat-dagatan Ave., Malabon City 54. MARKET! MARKET! 1 - Market! Market!, Fort Bonifacio Global City, Taguig City 55. MARKET! MARKET! 2 - 2F Market! Market!, Fort Bonifacio Global City, Taguig City 56. MARKET! MARKET! 3 - G/F ATM Center in Fiesta Market, Market! Market!, Fort Bonifacio Global City, Taguig City 57. MEDICAL CITY - Medical City, Ortigas Ave., Pasig City
5151
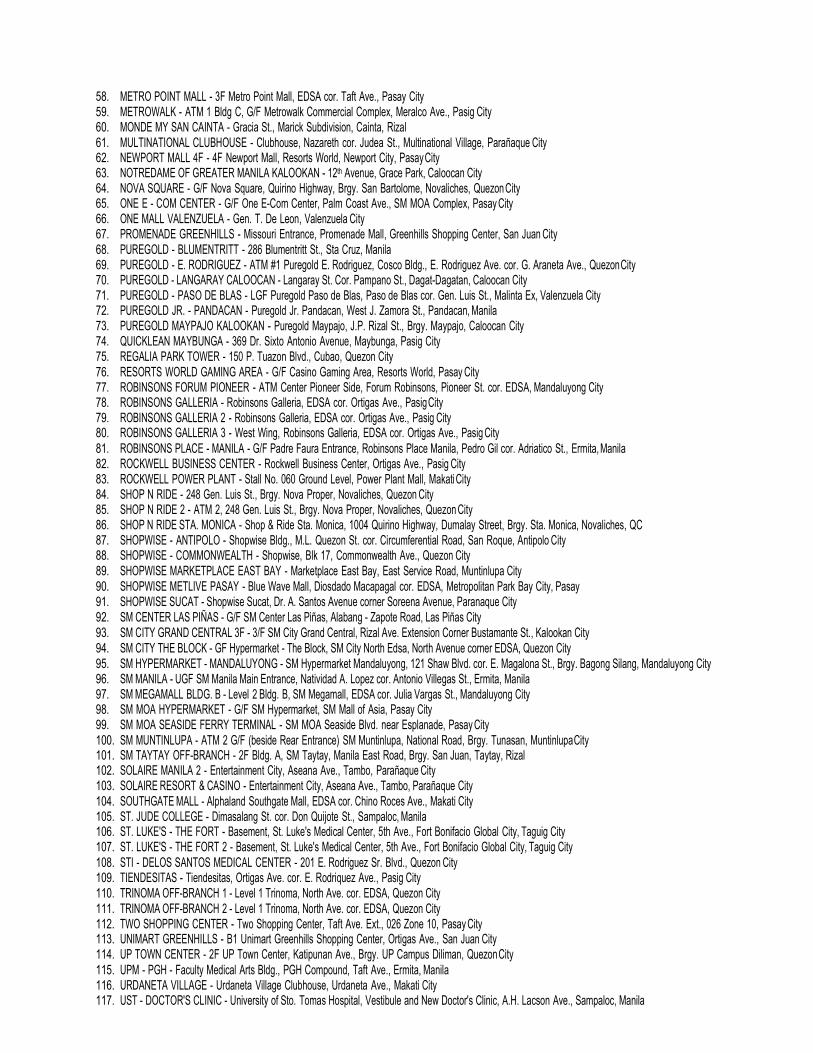
58. METRO POINT MALL - 3F Metro Point Mall, EDSA cor. Taft Ave., Pasay City 59. METROWALK - ATM 1 Bldg C, G/F Metrowalk Commercial Complex, Meralco Ave., Pasig City 60. MONDE MY SAN CAINTA - Gracia St., Marick Subdivision, Cainta, Rizal 61. MULTINATIONAL CLUBHOUSE - Clubhouse, Nazareth cor. Judea St., Multinational Village, Parañaque City 62. NEWPORT MALL 4F - 4F Newport Mall, Resorts World, Newport City, Pasay City 63. NOTREDAME OF GREATER MANILA KALOOKAN - 12th Avenue, Grace Park, Caloocan City 64. NOVA SQUARE - G/F Nova Square, Quirino Highway, Brgy. San Bartolome, Novaliches, Quezon City 65. ONE E - COM CENTER - G/F One E-Com Center, Palm Coast Ave., SM MOA Complex, Pasay City 66. ONE MALL VALENZUELA - Gen. T. De Leon, Valenzuela City 67. PROMENADE GREENHILLS - Missouri Entrance, Promenade Mall, Greenhills Shopping Center, San Juan City 68. PUREGOLD - BLUMENTRITT - 286 Blumentritt St., Sta Cruz, Manila 69. PUREGOLD - E. RODRIGUEZ - ATM #1 Puregold E. Rodriguez, Cosco Bldg., E. Rodriguez Ave. cor. G. Araneta Ave., Quezon City 70. PUREGOLD - LANGARAY CALOOCAN - Langaray St. Cor. Pampano St., Dagat-Dagatan, Caloocan City 71. PUREGOLD - PASO DE BLAS - LGF Puregold Paso de Blas, Paso de Blas cor. Gen. Luis St., Malinta Ex, Valenzuela City 72. PUREGOLD JR. - PANDACAN - Puregold Jr. Pandacan, West J. Zamora St., Pandacan, Manila 73. PUREGOLD MAYPAJO KALOOKAN - Puregold Maypajo, J.P. Rizal St., Brgy. Maypajo, Caloocan City 74. QUICKLEAN MAYBUNGA - 369 Dr. Sixto Antonio Avenue, Maybunga, Pasig City 75. REGALIA PARK TOWER - 150 P. Tuazon Blvd., Cubao, Quezon City 76. RESORTS WORLD GAMING AREA - G/F Casino Gaming Area, Resorts World, Pasay City 77. ROBINSONS FORUM PIONEER - ATM Center Pioneer Side, Forum Robinsons, Pioneer St. cor. EDSA, Mandaluyong City 78. ROBINSONS GALLERIA - Robinsons Galleria, EDSA cor. Ortigas Ave., Pasig City 79. ROBINSONS GALLERIA 2 - Robinsons Galleria, EDSA cor. Ortigas Ave., Pasig City 80. ROBINSONS GALLERIA 3 - West Wing, Robinsons Galleria, EDSA cor. Ortigas Ave., Pasig City
81. ROBINSONS PLACE - MANILA - G/F Padre Faura Entrance, Robinsons Place Manila, Pedro Gil cor. Adriatico St., Ermita, Manila 82. ROCKWELL BUSINESS CENTER - Rockwell Business Center, Ortigas Ave., Pasig City 83. ROCKWELL POWER PLANT - Stall No. 060 Ground Level, Power Plant Mall, Makati City 84. SHOP N RIDE - 248 Gen. Luis St., Brgy. Nova Proper, Novaliches, Quezon City 85. SHOP N RIDE 2 - ATM 2, 248 Gen. Luis St., Brgy. Nova Proper, Novaliches, Quezon City 86. SHOP N RIDE STA. MONICA - Shop & Ride Sta. Monica, 1004 Quirino Highway, Dumalay Street, Brgy. Sta. Monica, Novaliches, QC 87. SHOPWISE - ANTIPOLO - Shopwise Bldg., M.L. Quezon St. cor. Circumferential Road, San Roque, Antipolo City 88. SHOPWISE - COMMONWEALTH - Shopwise, Blk 17, Commonwealth Ave., Quezon City 89. SHOPWISE MARKETPLACE EAST BAY - Marketplace East Bay, East Service Road, Muntinlupa City 90. SHOPWISE METLIVE PASAY - Blue Wave Mall, Diosdado Macapagal cor. EDSA, Metropolitan Park Bay City, Pasay 91. SHOPWISE SUCAT - Shopwise Sucat, Dr. A. Santos Avenue corner Soreena Avenue, Paranaque City 92. SM CENTER LAS PIÑAS - G/F SM Center Las Piñas, Alabang - Zapote Road, Las Piñas City 93. SM CITY GRAND CENTRAL 3F - 3/F SM City Grand Central, Rizal Ave. Extension Corner Bustamante St., Kalookan City 94. SM CITY THE BLOCK - GF Hypermarket - The Block, SM City North Edsa, North Avenue corner EDSA, Quezon City 95. SM HYPERMARKET - MANDALUYONG - SM Hypermarket Mandaluyong, 121 Shaw Blvd. cor. E. Magalona St., Brgy. Bagong Silang, Mandaluyong City 96. SM MANILA - UGF SM Manila Main Entrance, Natividad A. Lopez cor. Antonio Villegas St., Ermita, Manila 97. SM MEGAMALL BLDG. B - Level 2 Bldg. B, SM Megamall, EDSA cor. Julia Vargas St., Mandaluyong City 98. SM MOA HYPERMARKET - G/F SM Hypermarket, SM Mall of Asia, Pasay City 99. SM MOA SEASIDE FERRY TERMINAL - SM MOA Seaside Blvd. near Esplanade, Pasay City 100. SM MUNTINLUPA - ATM 2 G/F (beside Rear Entrance) SM Muntinlupa, National Road, Brgy. Tunasan, Muntinlupa City 101. SM TAYTAY OFF-BRANCH - 2F Bldg. A, SM Taytay, Manila East Road, Brgy. San Juan, Taytay, Rizal 102. SOLAIRE MANILA 2 - Entertainment City, Aseana Ave., Tambo, Parañaque City 103. SOLAIRE RESORT & CASINO - Entertainment City, Aseana Ave., Tambo, Parañaque City 104. SOUTHGATE MALL - Alphaland Southgate Mall, EDSA cor. Chino Roces Ave., Makati City 105. ST. JUDE COLLEGE - Dimasalang St. cor. Don Quijote St., Sampaloc, Manila 106. ST. LUKE'S - THE FORT - Basement, St. Luke's Medical Center, 5th Ave., Fort Bonifacio Global City, Taguig City 107. ST. LUKE'S - THE FORT 2 - Basement, St. Luke's Medical Center, 5th Ave., Fort Bonifacio Global City, Taguig City
108. STI - DELOS SANTOS MEDICAL CENTER - 201 E. Rodriguez Sr. Blvd., Quezon City 109. TIENDESITAS - Tiendesitas, Ortigas Ave. cor. E. Rodriquez Ave., Pasig City 110. TRINOMA OFF-BRANCH 1 - Level 1 Trinoma, North Ave. cor. EDSA, Quezon City 111. TRINOMA OFF-BRANCH 2 - Level 1 Trinoma, North Ave. cor. EDSA, Quezon City 112. TWO SHOPPING CENTER - Two Shopping Center, Taft Ave. Ext., 026 Zone 10, Pasay City 113. UNIMART GREENHILLS - B1 Unimart Greenhills Shopping Center, Ortigas Ave., San Juan City 114. UP TOWN CENTER - 2F UP Town Center, Katipunan Ave., Brgy. UP Campus Diliman, Quezon City
115. UPM - PGH - Faculty Medical Arts Bldg., PGH Compound, Taft Ave., Ermita, Manila 116. URDANETA VILLAGE - Urdaneta Village Clubhouse, Urdaneta Ave., Makati City 117. UST - DOCTOR'S CLINIC - University of Sto. Tomas Hospital, Vestibule and New Doctor's Clinic, A.H. Lacson Ave., Sampaloc, Manila
5252
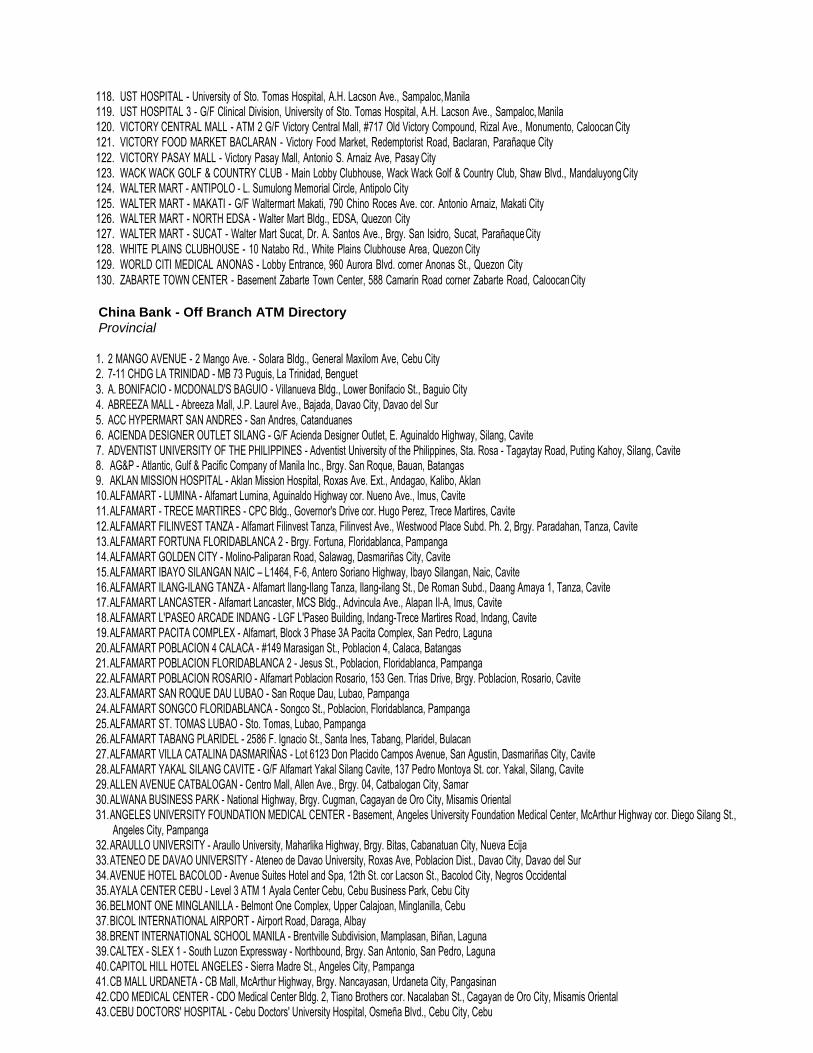
118. UST HOSPITAL - University of Sto. Tomas Hospital, A.H. Lacson Ave., Sampaloc, Manila 119. UST HOSPITAL 3 - G/F Clinical Division, University of Sto. Tomas Hospital, A.H. Lacson Ave., Sampaloc, Manila 120. VICTORY CENTRAL MALL - ATM 2 G/F Victory Central Mall, #717 Old Victory Compound, Rizal Ave., Monumento, Caloocan City 121. VICTORY FOOD MARKET BACLARAN - Victory Food Market, Redemptorist Road, Baclaran, Parañaque City
122. VICTORY PASAY MALL - Victory Pasay Mall, Antonio S. Arnaiz Ave, Pasay City 123. WACK WACK GOLF & COUNTRY CLUB - Main Lobby Clubhouse, Wack Wack Golf & Country Club, Shaw Blvd., Mandaluyong City 124. WALTER MART - ANTIPOLO - L. Sumulong Memorial Circle, Antipolo City 125. WALTER MART - MAKATI - G/F Waltermart Makati, 790 Chino Roces Ave. cor. Antonio Arnaiz, Makati City 126. WALTER MART - NORTH EDSA - Walter Mart Bldg., EDSA, Quezon City 127. WALTER MART - SUCAT - Walter Mart Sucat, Dr. A. Santos Ave., Brgy. San Isidro, Sucat, Parañaque City 128. WHITE PLAINS CLUBHOUSE - 10 Natabo Rd., White Plains Clubhouse Area, Quezon City 129. WORLD CITI MEDICAL ANONAS - Lobby Entrance, 960 Aurora Blvd. corner Anonas St., Quezon City 130. ZABARTE TOWN CENTER - Basement Zabarte Town Center, 588 Camarin Road corner Zabarte Road, Caloocan City
China Bank - Off Branch ATM Directory
Provincial
1. 2 MANGO AVENUE - 2 Mango Ave. - Solara Bldg., General Maxilom Ave, Cebu City 2. 7-11 CHDG LA TRINIDAD - MB 73 Puguis, La Trinidad, Benguet 3. A. BONIFACIO - MCDONALD'S BAGUIO - Villanueva Bldg., Lower Bonifacio St., Baguio City 4. ABREEZA MALL - Abreeza Mall, J.P. Laurel Ave., Bajada, Davao City, Davao del Sur 5. ACC HYPERMART SAN ANDRES - San Andres, Catanduanes 6. ACIENDA DESIGNER OUTLET SILANG - G/F Acienda Designer Outlet, E. Aguinaldo Highway, Silang, Cavite 7. ADVENTIST UNIVERSITY OF THE PHILIPPINES - Adventist University of the Philippines, Sta. Rosa - Tagaytay Road, Puting Kahoy, Silang, Cavite 8. AG&P - Atlantic, Gulf & Pacific Company of Manila Inc., Brgy. San Roque, Bauan, Batangas 9. AKLAN MISSION HOSPITAL - Aklan Mission Hospital, Roxas Ave. Ext., Andagao, Kalibo, Aklan 10. ALFAMART - LUMINA - Alfamart Lumina, Aguinaldo Highway cor. Nueno Ave., Imus, Cavite 11. ALFAMART - TRECE MARTIRES - CPC Bldg., Governor's Drive cor. Hugo Perez, Trece Martires, Cavite 12. ALFAMART FILINVEST TANZA - Alfamart Filinvest Tanza, Filinvest Ave., Westwood Place Subd. Ph. 2, Brgy. Paradahan, Tanza, Cavite 13. ALFAMART FORTUNA FLORIDABLANCA 2 - Brgy. Fortuna, Floridablanca, Pampanga 14. ALFAMART GOLDEN CITY - Molino-Paliparan Road, Salawag, Dasmariñas City, Cavite 15. ALFAMART IBAYO SILANGAN NAIC – L1464, F-6, Antero Soriano Highway, Ibayo Silangan, Naic, Cavite 16. ALFAMART ILANG-ILANG TANZA - Alfamart Ilang-Ilang Tanza, Ilang-ilang St., De Roman Subd., Daang Amaya 1, Tanza, Cavite 17. ALFAMART LANCASTER - Alfamart Lancaster, MCS Bldg., Advincula Ave., Alapan II-A, Imus, Cavite 18. ALFAMART L'PASEO ARCADE INDANG - LGF L'Paseo Building, Indang-Trece Martires Road, Indang, Cavite 19. ALFAMART PACITA COMPLEX - Alfamart, Block 3 Phase 3A Pacita Complex, San Pedro, Laguna 20. ALFAMART POBLACION 4 CALACA - #149 Marasigan St., Poblacion 4, Calaca, Batangas 21. ALFAMART POBLACION FLORIDABLANCA 2 - Jesus St., Poblacion, Floridablanca, Pampanga 22. ALFAMART POBLACION ROSARIO - Alfamart Poblacion Rosario, 153 Gen. Trias Drive, Brgy. Poblacion, Rosario, Cavite 23. ALFAMART SAN ROQUE DAU LUBAO - San Roque Dau, Lubao, Pampanga 24. ALFAMART SONGCO FLORIDABLANCA - Songco St., Poblacion, Floridablanca, Pampanga 25. ALFAMART ST. TOMAS LUBAO - Sto. Tomas, Lubao, Pampanga 26. ALFAMART TABANG PLARIDEL - 2586 F. Ignacio St., Santa Ines, Tabang, Plaridel, Bulacan 27. ALFAMART VILLA CATALINA DASMARIÑAS - Lot 6123 Don Placido Campos Avenue, San Agustin, Dasmariñas City, Cavite 28. ALFAMART YAKAL SILANG CAVITE - G/F Alfamart Yakal Silang Cavite, 137 Pedro Montoya St. cor. Yakal, Silang, Cavite 29. ALLEN AVENUE CATBALOGAN - Centro Mall, Allen Ave., Brgy. 04, Catbalogan City, Samar 30. ALWANA BUSINESS PARK - National Highway, Brgy. Cugman, Cagayan de Oro City, Misamis Oriental 31. ANGELES UNIVERSITY FOUNDATION MEDICAL CENTER - Basement, Angeles University Foundation Medical Center, McArthur Highway cor. Diego Silang St.,
Angeles City, Pampanga 32. ARAULLO UNIVERSITY - Araullo University, Maharlika Highway, Brgy. Bitas, Cabanatuan City, Nueva Ecija 33. ATENEO DE DAVAO UNIVERSITY - Ateneo de Davao University, Roxas Ave, Poblacion Dist., Davao City, Davao del Sur 34. AVENUE HOTEL BACOLOD - Avenue Suites Hotel and Spa, 12th St. cor Lacson St., Bacolod City, Negros Occidental 35. AYALA CENTER CEBU - Level 3 ATM 1 Ayala Center Cebu, Cebu Business Park, Cebu City 36. BELMONT ONE MINGLANILLA - Belmont One Complex, Upper Calajoan, Minglanilla, Cebu 37. BICOL INTERNATIONAL AIRPORT - Airport Road, Daraga, Albay 38. BRENT INTERNATIONAL SCHOOL MANILA - Brentville Subdivision, Mamplasan, Biñan, Laguna 39. CALTEX - SLEX 1 - South Luzon Expressway - Northbound, Brgy. San Antonio, San Pedro, Laguna 40. CAPITOL HILL HOTEL ANGELES - Sierra Madre St., Angeles City, Pampanga 41. CB MALL URDANETA - CB Mall, McArthur Highway, Brgy. Nancayasan, Urdaneta City, Pangasinan 42. CDO MEDICAL CENTER - CDO Medical Center Bldg. 2, Tiano Brothers cor. Nacalaban St., Cagayan de Oro City, Misamis Oriental 43. CEBU DOCTORS' HOSPITAL - Cebu Doctors' University Hospital, Osmeña Blvd., Cebu City, Cebu
5353
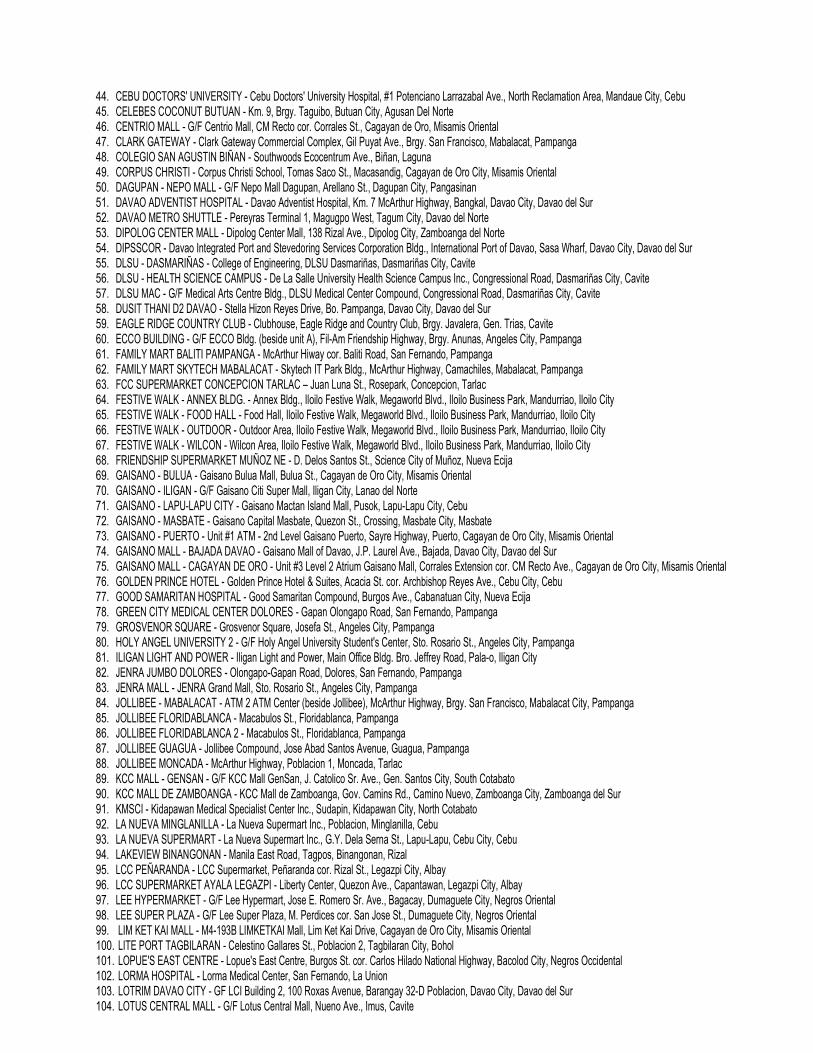
44. CEBU DOCTORS' UNIVERSITY - Cebu Doctors' University Hospital, #1 Potenciano Larrazabal Ave., North Reclamation Area, Mandaue City, Cebu 45. CELEBES COCONUT BUTUAN - Km. 9, Brgy. Taguibo, Butuan City, Agusan Del Norte 46. CENTRIO MALL - G/F Centrio Mall, CM Recto cor. Corrales St., Cagayan de Oro, Misamis Oriental 47. CLARK GATEWAY - Clark Gateway Commercial Complex, Gil Puyat Ave., Brgy. San Francisco, Mabalacat, Pampanga 48. COLEGIO SAN AGUSTIN BIÑAN - Southwoods Ecocentrum Ave., Biñan, Laguna 49. CORPUS CHRISTI - Corpus Christi School, Tomas Saco St., Macasandig, Cagayan de Oro City, Misamis Oriental 50. DAGUPAN - NEPO MALL - G/F Nepo Mall Dagupan, Arellano St., Dagupan City, Pangasinan 51. DAVAO ADVENTIST HOSPITAL - Davao Adventist Hospital, Km. 7 McArthur Highway, Bangkal, Davao City, Davao del Sur 52. DAVAO METRO SHUTTLE - Pereyras Terminal 1, Magugpo West, Tagum City, Davao del Norte 53. DIPOLOG CENTER MALL - Dipolog Center Mall, 138 Rizal Ave., Dipolog City, Zamboanga del Norte 54. DIPSSCOR - Davao Integrated Port and Stevedoring Services Corporation Bldg., International Port of Davao, Sasa Wharf, Davao City, Davao del Sur 55. DLSU - DASMARIÑAS - College of Engineering, DLSU Dasmariñas, Dasmariñas City, Cavite 56. DLSU - HEALTH SCIENCE CAMPUS - De La Salle University Health Science Campus Inc., Congressional Road, Dasmariñas City, Cavite 57. DLSU MAC - G/F Medical Arts Centre Bldg., DLSU Medical Center Compound, Congressional Road, Dasmariñas City, Cavite 58. DUSIT THANI D2 DAVAO - Stella Hizon Reyes Drive, Bo. Pampanga, Davao City, Davao del Sur 59. EAGLE RIDGE COUNTRY CLUB - Clubhouse, Eagle Ridge and Country Club, Brgy. Javalera, Gen. Trias, Cavite 60. ECCO BUILDING - G/F ECCO Bldg. (beside unit A), Fil-Am Friendship Highway, Brgy. Anunas, Angeles City, Pampanga 61. FAMILY MART BALITI PAMPANGA - McArthur Hiway cor. Baliti Road, San Fernando, Pampanga 62. FAMILY MART SKYTECH MABALACAT - Skytech IT Park Bldg., McArthur Highway, Camachiles, Mabalacat, Pampanga 63. FCC SUPERMARKET CONCEPCION TARLAC – Juan Luna St., Rosepark, Concepcion, Tarlac 64. FESTIVE WALK - ANNEX BLDG. - Annex Bldg., Iloilo Festive Walk, Megaworld Blvd., Iloilo Business Park, Mandurriao, Iloilo City 65. FESTIVE WALK - FOOD HALL - Food Hall, Iloilo Festive Walk, Megaworld Blvd., Iloilo Business Park, Mandurriao, Iloilo City 66. FESTIVE WALK - OUTDOOR - Outdoor Area, Iloilo Festive Walk, Megaworld Blvd., Iloilo Business Park, Mandurriao, Iloilo City 67. FESTIVE WALK - WILCON - Wilcon Area, Iloilo Festive Walk, Megaworld Blvd., Iloilo Business Park, Mandurriao, Iloilo City 68. FRIENDSHIP SUPERMARKET MUÑOZ NE - D. Delos Santos St., Science City of Muñoz, Nueva Ecija 69. GAISANO - BULUA - Gaisano Bulua Mall, Bulua St., Cagayan de Oro City, Misamis Oriental 70. GAISANO - ILIGAN - G/F Gaisano Citi Super Mall, Iligan City, Lanao del Norte 71. GAISANO - LAPU-LAPU CITY - Gaisano Mactan Island Mall, Pusok, Lapu-Lapu City, Cebu 72. GAISANO - MASBATE - Gaisano Capital Masbate, Quezon St., Crossing, Masbate City, Masbate 73. GAISANO - PUERTO - Unit #1 ATM - 2nd Level Gaisano Puerto, Sayre Highway, Puerto, Cagayan de Oro City, Misamis Oriental 74. GAISANO MALL - BAJADA DAVAO - Gaisano Mall of Davao, J.P. Laurel Ave., Bajada, Davao City, Davao del Sur 75. GAISANO MALL - CAGAYAN DE ORO - Unit #3 Level 2 Atrium Gaisano Mall, Corrales Extension cor. CM Recto Ave., Cagayan de Oro City, Misamis Oriental 76. GOLDEN PRINCE HOTEL - Golden Prince Hotel & Suites, Acacia St. cor. Archbishop Reyes Ave., Cebu City, Cebu 77. GOOD SAMARITAN HOSPITAL - Good Samaritan Compound, Burgos Ave., Cabanatuan City, Nueva Ecija 78. GREEN CITY MEDICAL CENTER DOLORES - Gapan Olongapo Road, San Fernando, Pampanga 79. GROSVENOR SQUARE - Grosvenor Square, Josefa St., Angeles City, Pampanga 80. HOLY ANGEL UNIVERSITY 2 - G/F Holy Angel University Student's Center, Sto. Rosario St., Angeles City, Pampanga 81. ILIGAN LIGHT AND POWER - Iligan Light and Power, Main Office Bldg. Bro. Jeffrey Road, Pala-o, Iligan City 82. JENRA JUMBO DOLORES - Olongapo-Gapan Road, Dolores, San Fernando, Pampanga 83. JENRA MALL - JENRA Grand Mall, Sto. Rosario St., Angeles City, Pampanga 84. JOLLIBEE - MABALACAT - ATM 2 ATM Center (beside Jollibee), McArthur Highway, Brgy. San Francisco, Mabalacat City, Pampanga 85. JOLLIBEE FLORIDABLANCA - Macabulos St., Floridablanca, Pampanga 86. JOLLIBEE FLORIDABLANCA 2 - Macabulos St., Floridablanca, Pampanga 87. JOLLIBEE GUAGUA - Jollibee Compound, Jose Abad Santos Avenue, Guagua, Pampanga 88. JOLLIBEE MONCADA - McArthur Highway, Poblacion 1, Moncada, Tarlac 89. KCC MALL - GENSAN - G/F KCC Mall GenSan, J. Catolico Sr. Ave., Gen. Santos City, South Cotabato 90. KCC MALL DE ZAMBOANGA - KCC Mall de Zamboanga, Gov. Camins Rd., Camino Nuevo, Zamboanga City, Zamboanga del Sur 91. KMSCI - Kidapawan Medical Specialist Center Inc., Sudapin, Kidapawan City, North Cotabato 92. LA NUEVA MINGLANILLA - La Nueva Supermart Inc., Poblacion, Minglanilla, Cebu 93. LA NUEVA SUPERMART - La Nueva Supermart Inc., G.Y. Dela Serna St., Lapu-Lapu, Cebu City, Cebu 94. LAKEVIEW BINANGONAN - Manila East Road, Tagpos, Binangonan, Rizal 95. LCC PEÑARANDA - LCC Supermarket, Peñaranda cor. Rizal St., Legazpi City, Albay 96. LCC SUPERMARKET AYALA LEGAZPI - Liberty Center, Quezon Ave., Capantawan, Legazpi City, Albay 97. LEE HYPERMARKET - G/F Lee Hypermart, Jose E. Romero Sr. Ave., Bagacay, Dumaguete City, Negros Oriental 98. LEE SUPER PLAZA - G/F Lee Super Plaza, M. Perdices cor. San Jose St., Dumaguete City, Negros Oriental 99. LIM KET KAI MALL - M4-193B LIMKETKAI Mall, Lim Ket Kai Drive, Cagayan de Oro City, Misamis Oriental 100. LITE PORT TAGBILARAN - Celestino Gallares St., Poblacion 2, Tagbilaran City, Bohol 101. LOPUE'S EAST CENTRE - Lopue's East Centre, Burgos St. cor. Carlos Hilado National Highway, Bacolod City, Negros Occidental 102. LORMA HOSPITAL - Lorma Medical Center, San Fernando, La Union 103. LOTRIM DAVAO CITY - GF LCI Building 2, 100 Roxas Avenue, Barangay 32-D Poblacion, Davao City, Davao del Sur 104. LOTUS CENTRAL MALL - G/F Lotus Central Mall, Nueno Ave., Imus, Cavite
5454

105. LVGH VALENCIA - La Viña General Hospital, ML Quezon St., Poblacion, Valencia City, Bukidnon 106. MAAP - Maritime Academy of Asia and the Pacific, Kamaya Point Road, Mariveles, Bataan 107. MACTAN ISLA RESORT - Agus Road, Ibabao, Marigondon, Lapu Lapu City, Cebu 108. MACTAN MARINA MALL - G/F Mactan Marina Mall, MEPZ 1, Lapu-Lapu City, Cebu 109. MAGIC MALL - G/F Magic Mall, Alexander St., Poblacion, Urdaneta City, Pangasinan 110. MAGIC STARMALL - UGF Magic Star Mall, Romulo Blvd., Brgy. Cut-Cut 1, Tarlac City, Tarlac 111. MALOLOS OFF-BRANCH - G/F Graceland Mall, Bulacan State University Grounds, McArthur Highway, Guinhawa, Malolos City, Bulacan 112. MALTA HOSPITAL TORIL - Malta Hospital Toril, McArthur Highway, Toril, Davao City, Davao del Sur 113. MARIA AURORA MUNICIPAL - G/F Maria Aurora Municipal Hall, Aurora 114. MARIA REYNA HOSPITAL - Beside Hospital Entrance/Exit, Maria Reyna Hospital, T.J. Hayes St., Cagayan De Oro City, Misamis Oriental 115. MARITON GROCERY DON DOMINGO - Mariton Grocery, Don Domingo, Tuguegarao City, Cagayan 116. MARKET CITY - Market City Bldg., Bus Terminal, Agora, Cagayan De Oro, Misamis Oriental 117. MARQUEE MALL 1 - G/F Activity Center, Marquee Mall, Aniceto Gueco St., Angeles City, Pampanga 118. MCIA - DOMESTIC CHECK-IN AREA - Mactan Cebu International Airport, Lapu-Lapu Airport Road, Lapu-Lapu City, Cebu 119. MCIA - DOMESTIC DEPARTURE HALL - Mactan Cebu International Airport, Lapu-Lapu Airport Road, Lapu-Lapu City, Cebu 120. MCIA DEPARTURE CHECK-IN SOUTHWING - Mactan Cebu International Airport, Lapu-Lapu Airport Road, Lapu Lapu City, Cebu 121. MERCY HOSPITAL ILIGAN - Sister of Mercy Road, Iligan City, Lanao del Norte 122. MHAM CEBU - Entrance Matias H. Aznar, Memorial College, R. Duterte St., Cebu City, Cebu 123. MINDANAO SANITARIUM AND HOSPITAL - Mindanao Sanitarium and Hospital, Tibanga Highway, Iligan City, Lanao del Norte 124. MJS HOSPITAL - Manuel J. Santos Hospital, 554 Montilla Blvd., Butuan City, Agusan del Norte 125. MONDE MY SAN CALAMBA - Carmelray II, Ridge Ave., Calamba, Laguna 126. MOTHER TERESA HOSPITAL - Mother Teresa of Calcutta Medical Center, McArthur Highway, Brgy. Maimpis, City of San Fernando, Pampanga 127. MUZON UPTOWN - G/F Muzon Uptown, Brgy. Muzon, San Jose Del Monte, Bulacan 128. NAGA PAROCHIAL SCHOOL - Corner Bagumabayan Sur and Ateneo Avenue, Naga City, Camarines Sur 129. NAGALAND E-MALL - P. Diaz cor. Elias Angeles St., San Francisco, Naga City, Cebu 130. NAKASHIN DAVAO INTERNATIONAL - Malagamot Road, Kilometer 14, Panacan, Davao City 131. NDMC MIDSAYAP – Notre Dame of Midsayap College, Quezon Ave., Pob. 5, Midsayap, Cotabato 132. NEPO MALL - ANGELES - Nepo Mall Angeles, Doña Teresa Ave. cor. St. Joseph St., Nepo Mart Complex, Angeles, Pampanga 133. NEWPOINT ANGELES - GF ATM Center Newpoint Mall, Plaridel St., Sto. Rosario, Angeles City, Pampanga 134. NORTHSIDE DOCTORS HOSPITAL - Northside Doctors Hospital, Guimod, Bantay, Vigan City, Ilocos Sur 135. NOTRE DAME DE CHARTRES HOSPITAL - Notre Dame De Chartres Hospital, #25 Gen. Luna Road, Baguio City, Benguet 136. NUEVA ECIJA DOCTORS HOSPITAL - Nueva Ecija Doctors Hospital, Maharlika Highway, Cabanatuan City, Nueva Ecija 137. NUVALI SOLENAD 2 - G/F Solenad 2 Nuvali, Sta. Rosa-Tagaytay Road, Don Jose, Sta. Rosa, Laguna 138. NUVALI SOLENAD 3 BLDG. B - G/F Bldg. B Solenad 3 Nuvali, Sta. Rosa-Tagaytay Road, Don Jose, Sta. Rosa, Laguna 139. NUVALI SOLENAD HAWKERS MARKET - Hawkers Market, Solenad 3 Nuvali, Sta. Rosa-Tagaytay Road, Don Jose, Sta. Rosa, Laguna 140. ORCHARD GOLF AND COUNTRY CLUB – Club House Near Golf Accessories Store, The Orchard Golf and Country Club Inc., Dasmariñas, Cavite 141. OSPA - FARMERS' MEDICAL CENTER - Ormoc Sugarcane Planters Association - Farmers Medical Center, Carlota Hills, Brgy. Can-Adieng, Ormoc City, Leyte 142. OUR LADY OF THE PILLAR - G/F Our Lady of the Pillar Medical Center (near Emergency Room), Tamsui Ave., Bayan Luma II, Imus, Cavite 143. PANGASINAN MEDICAL CENTER - Pangasinan Medical Center, Nable St., Dagupan City, Pangasinan 144. PAVILION MALL - G/F Bldg. A, Pavilion Mall, KM. 35 Brgy. San Antonio, Biñan, Laguna 145. PELCO 1 MEXICO - Jose Abad Santos Ave., Mexico, Pampanga 146. PELCO III APALIT - PELCO III, Mc Arthur Highway, Sampaloc, Apalit, Pampanga 147. PLAZA FINA MAGALANG - Plaza Fina, Don Andres Luciano St., Magalang, Pampanga 148. PLG ECOZONE HERMOSA BATAAN - PLG Prime Global, FTI Group Bldg., GF Ecozone, Hermosa, Bataan 149. PORTA VAGA MALL - Porta Vaga Mall, Along Session Road, Baguio City, Benguet 150. PPL MCDONALD'S ORMOC - G/F IAL Building, Burgos St. cor. Rizal St., Ormoc City, Leyte 151. Primeway Plaza Cebu - F. Ramos St., Sta. Cruz, Cebu City, Cebu 152. PRINCE HYPERMART BAGO - Poblacion, Bago City, Negros Occidental 153. PRINCE HYPERMART DAANBANTAYAN - Prince Hypermart, Poblacion, Daanbantayan, Cebu 154. PRINCE HYPERMART HIMAMAYLAN - Brgy. Poblacion, Himamaylan City, Negros Occidental 155. PRINCE HYPERMART MANOLO FORTICH - Prince Hypermart, Sayre Highway, Manolo Fortich, Bukidnon 156. PRINCE HYPERMART TALISAY - Poblacion, Talisay City, Negros Occidental 157. PRINCE MALL OF BAYBAY - Prince Town Baybay, Andres Bonifacio & Manuel L. Quezon St., Baybay, Leyte 158. PUREGOLD - DAU - Lot 9 Blk 19 Cosco Building, McArthur Highway, Dau, Mabalacat, Pampanga 159. PUREGOLD OBANDO - Puregold Obando, P. Sevilla St., Brgy. Catanghalan, Obando, Bulacan 160. PUREMART BAUTISTA DASMARIÑAS – Blk. 23 L 46-49, Phase 1, Brgy. Bautista, Bagong Bayan, Dasmariñas, Cavite 161. PUREMART MARAGONDON - Poblacion 1-A, Maragondon, Cavite 162. PUREMART MARY CRIS GEN. TRIAS – Phase 2, Blk. 11 L4-6, Marycris Complex, Brgy. Pasong Camachile 2, Gen. Trisa, Cavite 163. QUICKMART DARAGA - Quickmart Bldg., Rizal St., Daraga, Albay 164. RIVERA HOSPITAL PANABO - Rivera Medical Center, National Highway, 7302 Brgy. San Francisco, Panabo City, Davao Del Norte 165. ROBINSONS CALASIAO - Robinsons Place Pangasinan, Brgy. San Miguel, Calasiao, Pangasinan
5555
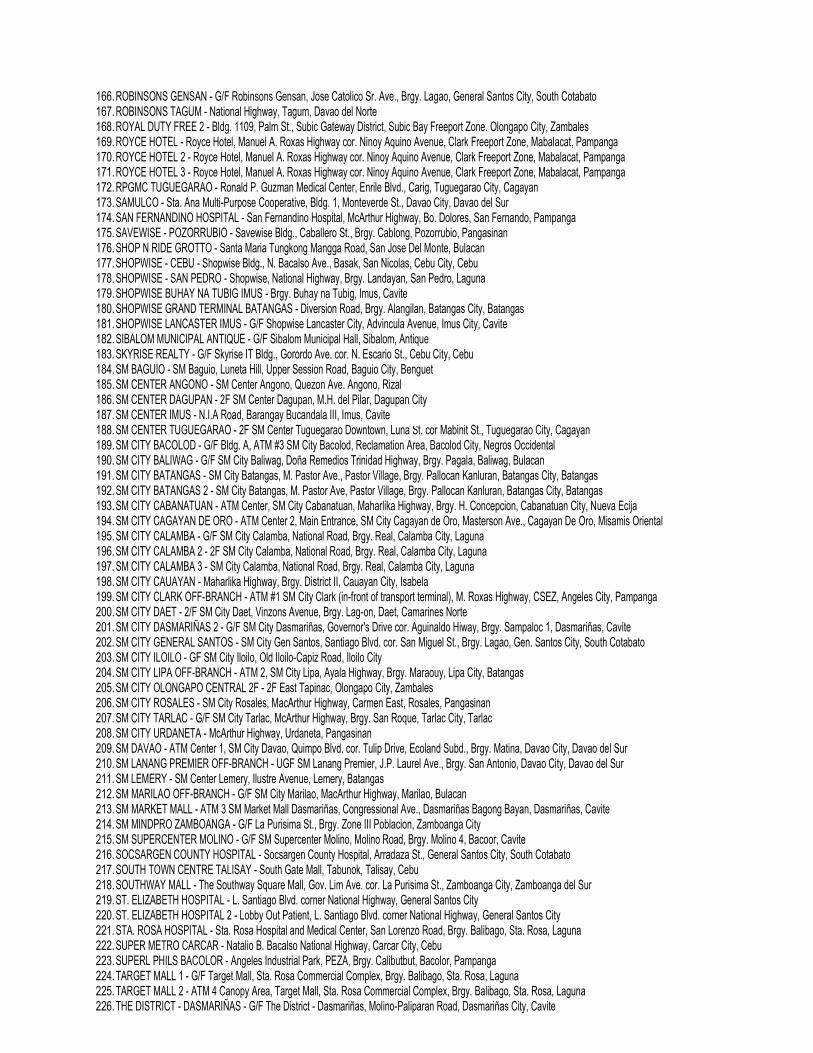
166. ROBINSONS GENSAN - G/F Robinsons Gensan, Jose Catolico Sr. Ave., Brgy. Lagao, General Santos City, South Cotabato 167. ROBINSONS TAGUM - National Highway, Tagum, Davao del Norte 168. ROYAL DUTY FREE 2 - Bldg. 1109, Palm St., Subic Gateway District, Subic Bay Freeport Zone. Olongapo City, Zambales 169. ROYCE HOTEL - Royce Hotel, Manuel A. Roxas Highway cor. Ninoy Aquino Avenue, Clark Freeport Zone, Mabalacat, Pampanga 170. ROYCE HOTEL 2 - Royce Hotel, Manuel A. Roxas Highway cor. Ninoy Aquino Avenue, Clark Freeport Zone, Mabalacat, Pampanga 171. ROYCE HOTEL 3 - Royce Hotel, Manuel A. Roxas Highway cor. Ninoy Aquino Avenue, Clark Freeport Zone, Mabalacat, Pampanga 172. RPGMC TUGUEGARAO - Ronald P. Guzman Medical Center, Enrile Blvd., Carig, Tuguegarao City, Cagayan 173. SAMULCO - Sta. Ana Multi-Purpose Cooperative, Bldg. 1, Monteverde St., Davao City, Davao del Sur 174. SAN FERNANDINO HOSPITAL - San Fernandino Hospital, McArthur Highway, Bo. Dolores, San Fernando, Pampanga 175. SAVEWISE - POZORRUBIO - Savewise Bldg., Caballero St., Brgy. Cablong, Pozorrubio, Pangasinan 176. SHOP N RIDE GROTTO - Santa Maria Tungkong Mangga Road, San Jose Del Monte, Bulacan 177. SHOPWISE - CEBU - Shopwise Bldg., N. Bacalso Ave., Basak, San Nicolas, Cebu City, Cebu 178. SHOPWISE - SAN PEDRO - Shopwise, National Highway, Brgy. Landayan, San Pedro, Laguna 179. SHOPWISE BUHAY NA TUBIG IMUS - Brgy. Buhay na Tubig, Imus, Cavite 180. SHOPWISE GRAND TERMINAL BATANGAS - Diversion Road, Brgy. Alangilan, Batangas City, Batangas 181. SHOPWISE LANCASTER IMUS - G/F Shopwise Lancaster City, Advincula Avenue, Imus City, Cavite 182. SIBALOM MUNICIPAL ANTIQUE - G/F Sibalom Municipal Hall, Sibalom, Antique 183. SKYRISE REALTY - G/F Skyrise IT Bldg., Gorordo Ave. cor. N. Escario St., Cebu City, Cebu 184. SM BAGUIO - SM Baguio, Luneta Hill, Upper Session Road, Baguio City, Benguet 185. SM CENTER ANGONO - SM Center Angono, Quezon Ave. Angono, Rizal 186. SM CENTER DAGUPAN - 2F SM Center Dagupan, M.H. del Pilar, Dagupan City 187. SM CENTER IMUS - N.I.A Road, Barangay Bucandala III, Imus, Cavite 188. SM CENTER TUGUEGARAO - 2F SM Center Tuguegarao Downtown, Luna St. cor Mabinit St., Tuguegarao City, Cagayan 189. SM CITY BACOLOD - G/F Bldg. A, ATM #3 SM City Bacolod, Reclamation Area, Bacolod City, Negros Occidental 190. SM CITY BALIWAG - G/F SM City Baliwag, Doña Remedios Trinidad Highway, Brgy. Pagala, Baliwag, Bulacan 191. SM CITY BATANGAS - SM City Batangas, M. Pastor Ave., Pastor Village, Brgy. Pallocan Kanluran, Batangas City, Batangas 192. SM CITY BATANGAS 2 - SM City Batangas, M. Pastor Ave, Pastor Village, Brgy. Pallocan Kanluran, Batangas City, Batangas 193. SM CITY CABANATUAN - ATM Center, SM City Cabanatuan, Maharlika Highway, Brgy. H. Concepcion, Cabanatuan City, Nueva Ecija 194. SM CITY CAGAYAN DE ORO - ATM Center 2, Main Entrance, SM City Cagayan de Oro, Masterson Ave., Cagayan De Oro, Misamis Oriental 195. SM CITY CALAMBA - G/F SM City Calamba, National Road, Brgy. Real, Calamba City, Laguna 196. SM CITY CALAMBA 2 - 2F SM City Calamba, National Road, Brgy. Real, Calamba City, Laguna 197. SM CITY CALAMBA 3 - SM City Calamba, National Road, Brgy. Real, Calamba City, Laguna 198. SM CITY CAUAYAN - Maharlika Highway, Brgy. District II, Cauayan City, Isabela 199. SM CITY CLARK OFF-BRANCH - ATM #1 SM City Clark (in-front of transport terminal), M. Roxas Highway, CSEZ, Angeles City, Pampanga 200. SM CITY DAET - 2/F SM City Daet, Vinzons Avenue, Brgy. Lag-on, Daet, Camarines Norte 201. SM CITY DASMARIÑAS 2 - G/F SM City Dasmariñas, Governor's Drive cor. Aguinaldo Hiway, Brgy. Sampaloc 1, Dasmariñas, Cavite 202. SM CITY GENERAL SANTOS - SM City Gen Santos, Santiago Blvd. cor. San Miguel St., Brgy. Lagao, Gen. Santos City, South Cotabato 203. SM CITY ILOILO - GF SM City Iloilo, Old Iloilo-Capiz Road, Iloilo City 204. SM CITY LIPA OFF-BRANCH - ATM 2, SM City Lipa, Ayala Highway, Brgy. Maraouy, Lipa City, Batangas 205. SM CITY OLONGAPO CENTRAL 2F - 2F East Tapinac, Olongapo City, Zambales 206. SM CITY ROSALES - SM City Rosales, MacArthur Highway, Carmen East, Rosales, Pangasinan 207. SM CITY TARLAC - G/F SM City Tarlac, McArthur Highway, Brgy. San Roque, Tarlac City, Tarlac 208. SM CITY URDANETA - McArthur Highway, Urdaneta, Pangasinan 209. SM DAVAO - ATM Center 1, SM City Davao, Quimpo Blvd. cor. Tulip Drive, Ecoland Subd., Brgy. Matina, Davao City, Davao del Sur 210. SM LANANG PREMIER OFF-BRANCH - UGF SM Lanang Premier, J.P. Laurel Ave., Brgy. San Antonio, Davao City, Davao del Sur 211. SM LEMERY - SM Center Lemery, Ilustre Avenue, Lemery, Batangas 212. SM MARILAO OFF-BRANCH - G/F SM City Marilao, MacArthur Highway, Marilao, Bulacan 213. SM MARKET MALL - ATM 3 SM Market Mall Dasmariñas, Congressional Ave., Dasmariñas Bagong Bayan, Dasmariñas, Cavite 214. SM MINDPRO ZAMBOANGA - G/F La Purisima St., Brgy. Zone III Poblacion, Zamboanga City 215. SM SUPERCENTER MOLINO - G/F SM Supercenter Molino, Molino Road, Brgy. Molino 4, Bacoor, Cavite 216. SOCSARGEN COUNTY HOSPITAL - Socsargen County Hospital, Arradaza St., General Santos City, South Cotabato 217. SOUTH TOWN CENTRE TALISAY - South Gate Mall, Tabunok, Talisay, Cebu 218. SOUTHWAY MALL - The Southway Square Mall, Gov. Lim Ave. cor. La Purisima St., Zamboanga City, Zamboanga del Sur 219. ST. ELIZABETH HOSPITAL - L. Santiago Blvd. corner National Highway, General Santos City 220. ST. ELIZABETH HOSPITAL 2 - Lobby Out Patient, L. Santiago Blvd. corner National Highway, General Santos City 221. STA. ROSA HOSPITAL - Sta. Rosa Hospital and Medical Center, San Lorenzo Road, Brgy. Balibago, Sta. Rosa, Laguna 222. SUPER METRO CARCAR - Natalio B. Bacalso National Highway, Carcar City, Cebu 223. SUPERL PHILS BACOLOR - Angeles Industrial Park, PEZA, Brgy. Calibutbut, Bacolor, Pampanga 224. TARGET MALL 1 - G/F Target Mall, Sta. Rosa Commercial Complex, Brgy. Balibago, Sta. Rosa, Laguna 225. TARGET MALL 2 - ATM 4 Canopy Area, Target Mall, Sta. Rosa Commercial Complex, Brgy. Balibago, Sta. Rosa, Laguna 226. THE DISTRICT - DASMARIÑAS - G/F The District - Dasmariñas, Molino-Paliparan Road, Dasmariñas City, Cavite
5656
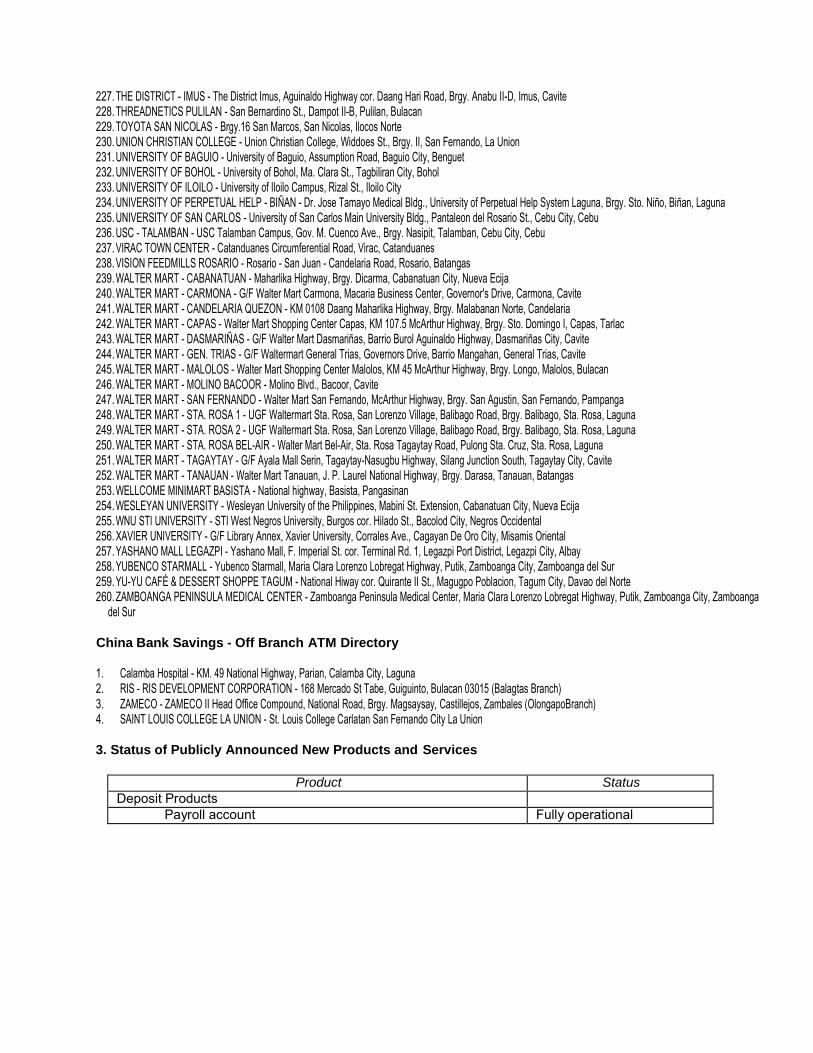
227. THE DISTRICT - IMUS - The District Imus, Aguinaldo Highway cor. Daang Hari Road, Brgy. Anabu II-D, Imus, Cavite 228. THREADNETICS PULILAN - San Bernardino St., Dampot II-B, Pulilan, Bulacan 229. TOYOTA SAN NICOLAS - Brgy.16 San Marcos, San Nicolas, Ilocos Norte 230. UNION CHRISTIAN COLLEGE - Union Christian College, Widdoes St., Brgy. II, San Fernando, La Union 231. UNIVERSITY OF BAGUIO - University of Baguio, Assumption Road, Baguio City, Benguet 232. UNIVERSITY OF BOHOL - University of Bohol, Ma. Clara St., Tagbiliran City, Bohol 233. UNIVERSITY OF ILOILO - University of Iloilo Campus, Rizal St., Iloilo City 234. UNIVERSITY OF PERPETUAL HELP - BIÑAN - Dr. Jose Tamayo Medical Bldg., University of Perpetual Help System Laguna, Brgy. Sto. Niño, Biñan, Laguna 235. UNIVERSITY OF SAN CARLOS - University of San Carlos Main University Bldg., Pantaleon del Rosario St., Cebu City, Cebu 236. USC - TALAMBAN - USC Talamban Campus, Gov. M. Cuenco Ave., Brgy. Nasipit, Talamban, Cebu City, Cebu 237. VIRAC TOWN CENTER - Catanduanes Circumferential Road, Virac, Catanduanes 238. VISION FEEDMILLS ROSARIO - Rosario - San Juan - Candelaria Road, Rosario, Batangas 239. WALTER MART - CABANATUAN - Maharlika Highway, Brgy. Dicarma, Cabanatuan City, Nueva Ecija 240. WALTER MART - CARMONA - G/F Walter Mart Carmona, Macaria Business Center, Governor's Drive, Carmona, Cavite 241. WALTER MART - CANDELARIA QUEZON - KM 0108 Daang Maharlika Highway, Brgy. Malabanan Norte, Candelaria 242. WALTER MART - CAPAS - Walter Mart Shopping Center Capas, KM 107.5 McArthur Highway, Brgy. Sto. Domingo I, Capas, Tarlac 243. WALTER MART - DASMARIÑAS - G/F Walter Mart Dasmariñas, Barrio Burol Aguinaldo Highway, Dasmariñas City, Cavite 244. WALTER MART - GEN. TRIAS - G/F Waltermart General Trias, Governors Drive, Barrio Mangahan, General Trias, Cavite 245. WALTER MART - MALOLOS - Walter Mart Shopping Center Malolos, KM 45 McArthur Highway, Brgy. Longo, Malolos, Bulacan 246. WALTER MART - MOLINO BACOOR - Molino Blvd., Bacoor, Cavite 247. WALTER MART - SAN FERNANDO - Walter Mart San Fernando, McArthur Highway, Brgy. San Agustin, San Fernando, Pampanga 248. WALTER MART - STA. ROSA 1 - UGF Waltermart Sta. Rosa, San Lorenzo Village, Balibago Road, Brgy. Balibago, Sta. Rosa, Laguna 249. WALTER MART - STA. ROSA 2 - UGF Waltermart Sta. Rosa, San Lorenzo Village, Balibago Road, Brgy. Balibago, Sta. Rosa, Laguna 250. WALTER MART - STA. ROSA BEL-AIR - Walter Mart Bel-Air, Sta. Rosa Tagaytay Road, Pulong Sta. Cruz, Sta. Rosa, Laguna 251. WALTER MART - TAGAYTAY - G/F Ayala Mall Serin, Tagaytay-Nasugbu Highway, Silang Junction South, Tagaytay City, Cavite 252. WALTER MART - TANAUAN - Walter Mart Tanauan, J. P. Laurel National Highway, Brgy. Darasa, Tanauan, Batangas 253. WELLCOME MINIMART BASISTA - National highway, Basista, Pangasinan 254. WESLEYAN UNIVERSITY - Wesleyan University of the Philippines, Mabini St. Extension, Cabanatuan City, Nueva Ecija 255. WNU STI UNIVERSITY - STI West Negros University, Burgos cor. Hilado St., Bacolod City, Negros Occidental 256. XAVIER UNIVERSITY - G/F Library Annex, Xavier University, Corrales Ave., Cagayan De Oro City, Misamis Oriental 257. YASHANO MALL LEGAZPI - Yashano Mall, F. Imperial St. cor. Terminal Rd. 1, Legazpi Port District, Legazpi City, Albay 258. YUBENCO STARMALL - Yubenco Starmall, Maria Clara Lorenzo Lobregat Highway, Putik, Zamboanga City, Zamboanga del Sur 259. YU-YU CAFÉ & DESSERT SHOPPE TAGUM - National Hiway cor. Quirante II St., Magugpo Poblacion, Tagum City, Davao del Norte 260. ZAMBOANGA PENINSULA MEDICAL CENTER - Zamboanga Peninsula Medical Center, Maria Clara Lorenzo Lobregat Highway, Putik, Zamboanga City, Zamboanga
del Sur
China Bank Savings - Off Branch ATM Directory
1. Calamba Hospital - KM. 49 National Highway, Parian, Calamba City, Laguna 2. RIS - RIS DEVELOPMENT CORPORATION - 168 Mercado St Tabe, Guiguinto, Bulacan 03015 (Balagtas Branch) 3. ZAMECO - ZAMECO II Head Office Compound, National Road, Brgy. Magsaysay, Castillejos, Zambales (OlongapoBranch) 4. SAINT LOUIS COLLEGE LA UNION - St. Louis College Carlatan San Fernando City La Union
3. Status of Publicly Announced New Products and Services
Product Status
Deposit Products Payroll account Fully operational
5757
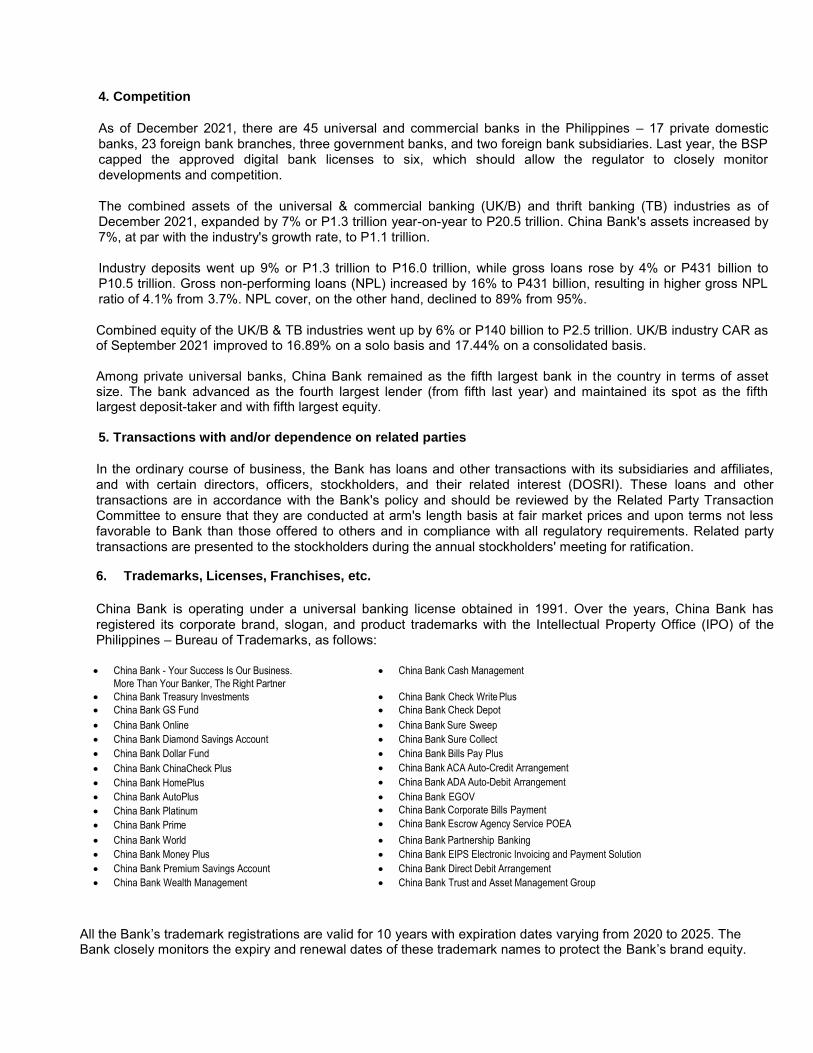
4. Competition
As of December 2021, there are 45 universal and commercial banks in the Philippines – 17 private domestic banks, 23 foreign bank branches, three government banks, and two foreign bank subsidiaries. Last year, the BSP capped the approved digital bank licenses to six, which should allow the regulator to closely monitor developments and competition. The combined assets of the universal & commercial banking (UK/B) and thrift banking (TB) industries as of December 2021, expanded by 7% or P1.3 trillion year-on-year to P20.5 trillion. China Bank's assets increased by 7%, at par with the industry's growth rate, to P1.1 trillion.
Industry deposits went up 9% or P1.3 trillion to P16.0 trillion, while gross loans rose by 4% or P431 billion to P10.5 trillion. Gross non-performing loans (NPL) increased by 16% to P431 billion, resulting in higher gross NPL ratio of 4.1% from 3.7%. NPL cover, on the other hand, declined to 89% from 95%.
Combined equity of the UK/B & TB industries went up by 6% or P140 billion to P2.5 trillion. UK/B industry CAR as of September 2021 improved to 16.89% on a solo basis and 17.44% on a consolidated basis. Among private universal banks, China Bank remained as the fifth largest bank in the country in terms of asset size. The bank advanced as the fourth largest lender (from fifth last year) and maintained its spot as the fifth largest deposit-taker and with fifth largest equity. 5. Transactions with and/or dependence on related parties
In the ordinary course of business, the Bank has loans and other transactions with its subsidiaries and affiliates, and with certain directors, officers, stockholders, and their related interest (DOSRI). These loans and other transactions are in accordance with the Bank's policy and should be reviewed by the Related Party Transaction Committee to ensure that they are conducted at arm's length basis at fair market prices and upon terms not less favorable to Bank than those offered to others and in compliance with all regulatory requirements. Related party transactions are presented to the stockholders during the annual stockholders' meeting for ratification.
6. Trademarks, Licenses, Franchises, etc.
China Bank is operating under a universal banking license obtained in 1991. Over the years, China Bank has registered its corporate brand, slogan, and product trademarks with the Intellectual Property Office (IPO) of the Philippines – Bureau of Trademarks, as follows:
All the Bank‘s trademark registrations are valid for 10 years with expiration dates varying from 2020 to 2025. The Bank closely monitors the expiry and renewal dates of these trademark names to protect the Bank‘s brand equity.
China Bank - Your Success Is Our Business.
More Than Your Banker, The Right Partner
China Bank Cash Management
China Bank Treasury Investments China Bank Check Write Plus
China Bank GS Fund China Bank Check Depot
China Bank Online China Bank Sure Sweep
China Bank Diamond Savings Account China Bank Sure Collect
China Bank Dollar Fund China Bank Bills Pay Plus
China Bank ChinaCheck Plus China Bank ACA Auto-Credit Arrangement
China Bank HomePlus China Bank ADA Auto-Debit Arrangement
China Bank AutoPlus China Bank EGOV
China Bank Platinum China Bank Corporate Bills Payment
China Bank Prime China Bank Escrow Agency Service POEA
China Bank World China Bank Partnership Banking
China Bank Money Plus China Bank EIPS Electronic Invoicing and Payment Solution
China Bank Premium Savings Account China Bank Direct Debit Arrangement
China Bank Wealth Management China Bank Trust and Asset Management Group
5858
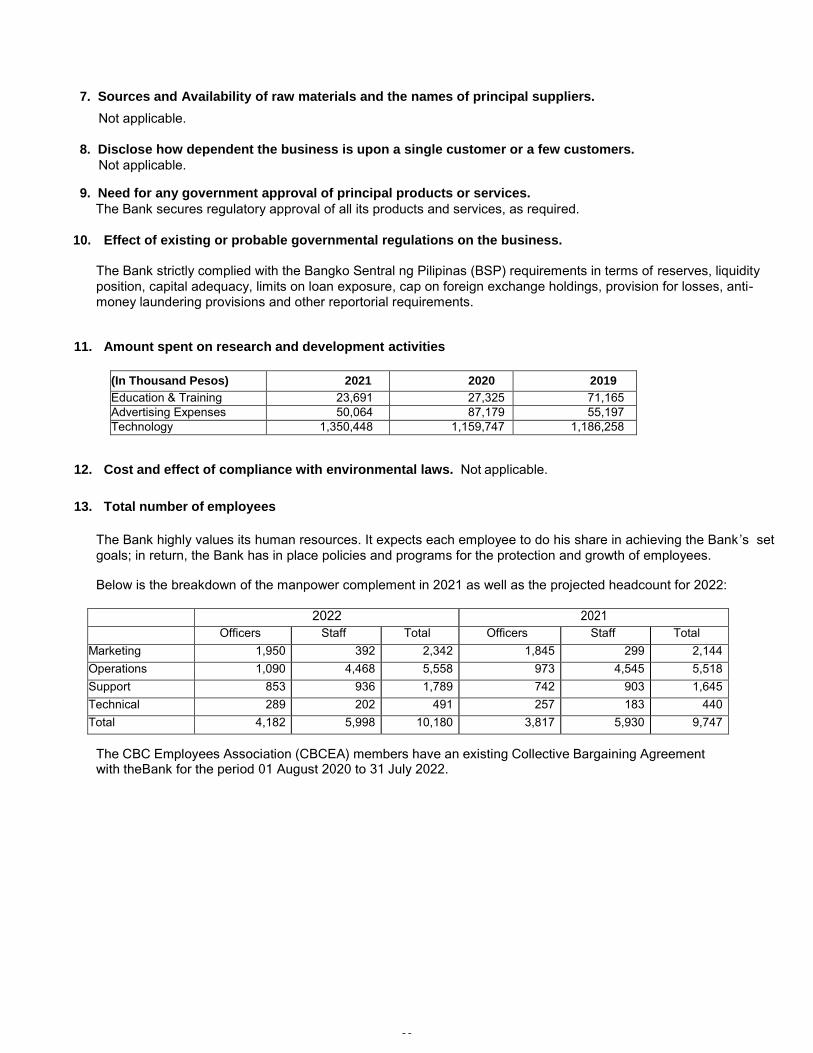
7. Sources and Availability of raw materials and the names of principal suppliers.
Not applicable.
8. Disclose how dependent the business is upon a single customer or a few customers.
Not applicable.
9. Need for any government approval of principal products or services.
The Bank secures regulatory approval of all its products and services, as required.
10. Effect of existing or probable governmental regulations on the business.
The Bank strictly complied with the Bangko Sentral ng Pilipinas (BSP) requirements in terms of reserves, liquidity position, capital adequacy, limits on loan exposure, cap on foreign exchange holdings, provision for losses, anti- money laundering provisions and other reportorial requirements.
11. Amount spent on research and development activities
(In Thousand Pesos) 2021 2020 2019
Education & Training 23,691 27,325 71,165 Advertising Expenses 50,064 87,179 55,197 Technology 1,350,448 1,159,747 1,186,258
12. Cost and effect of compliance with environmental laws. Not applicable.
13. Total number of employees
The Bank highly values its human resources. It expects each employee to do his share in achieving the Bank ‘s set goals; in return, the Bank has in place policies and programs for the protection and growth of employees.
Below is the breakdown of the manpower complement in 2021 as well as the projected headcount for 2022:
2022 2021 Officers Staff Total Officers Staff Total Marketing 1,950 392 2,342 1,845 299 2,144 Operations 1,090 4,468 5,558 973 4,545 5,518 Support 853 936 1,789 742 903 1,645 Technical 289 202 491 257 183 440 Total 4,182 5,998 10,180 3,817 5,930 9,747
The CBC Employees Association (CBCEA) members have an existing Collective Bargaining Agreement with the Bank for the period 01 August 2020 to 31 July 2022.
5959
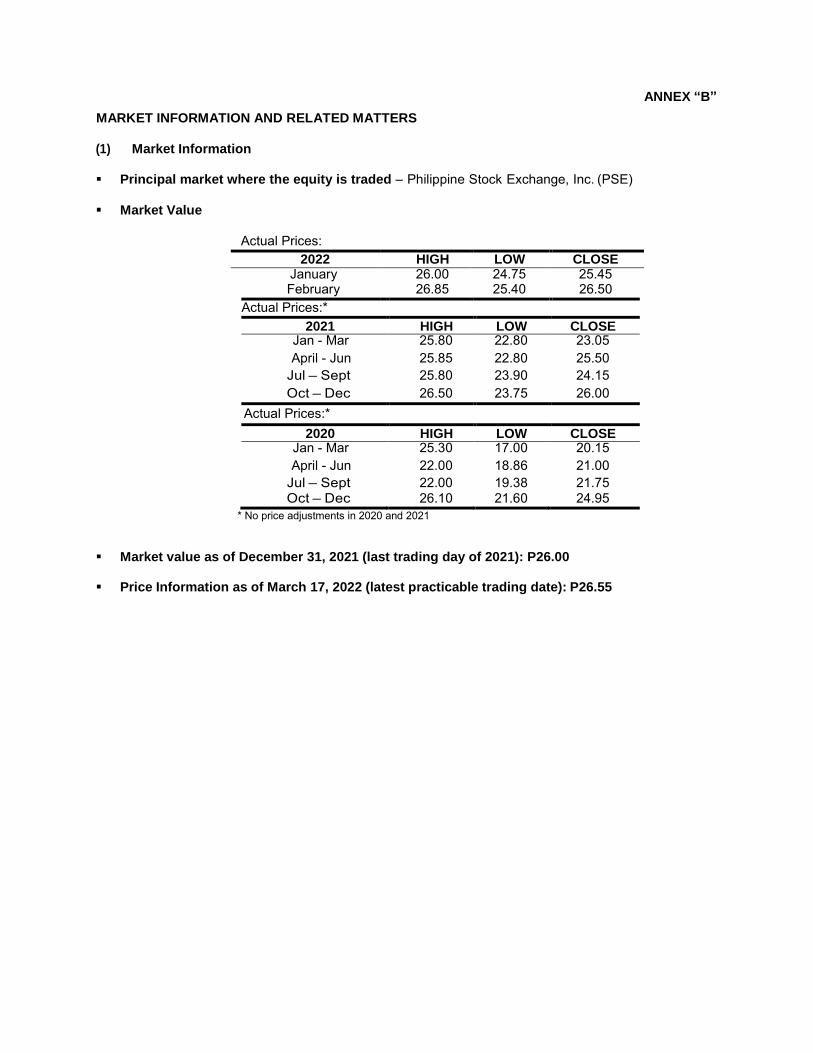
ANNEX “B”
MARKET INFORMATION AND RELATED MATTERS
(1) Market Information
Principal market where the equity is traded – Philippine Stock Exchange, Inc. (PSE)
Market Value
Actual Prices: 2022 HIGH LOW CLOSE January 26.00 24.75 25.45 February 26.85 25.40 26.50
Actual Prices:*
2021 HIGH LOW CLOSE Jan - Mar 25.80 22.80 23.05 April - Jun 25.85 22.80 25.50
Jul – Sept 25.80 23.90 24.15 Oct – Dec 26.50 23.75 26.00
Actual Prices:*
2020 HIGH LOW CLOSE Jan - Mar 25.30 17.00 20.15 April - Jun 22.00 18.86 21.00
Jul – Sept 22.00 19.38 21.75 Oct – Dec 26.10 21.60 24.95
* No price adjustments in 2020 and 2021
Market value as of December 31, 2021 (last trading day of 2021): P26.00
Price Information as of March 17, 2022 (latest practicable trading date): P26.55
6060
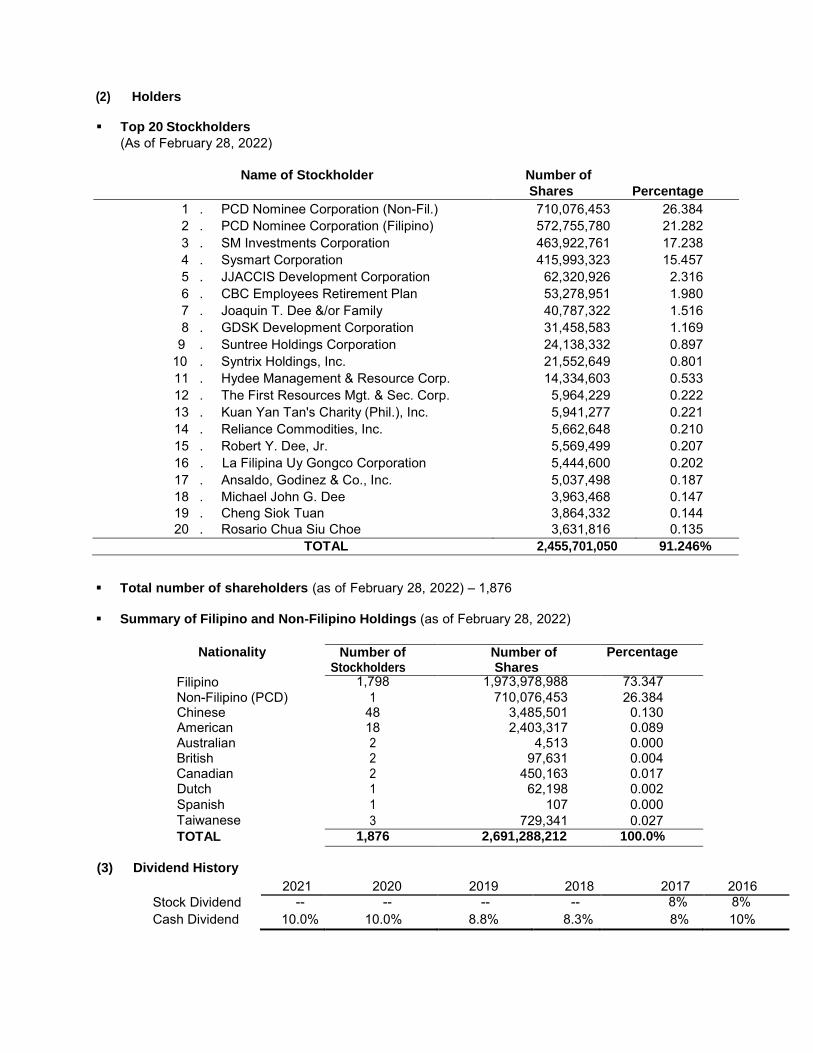
(2) Holders
Top 20 Stockholders
(As of February 28, 2022)
Name of Stockholder Number of
Shares Percentage
1 . PCD Nominee Corporation (Non-Fil.) 710,076,453 26.384 2 . PCD Nominee Corporation (Filipino) 572,755,780 21.282 3 . SM Investments Corporation 463,922,761 17.238 4 . Sysmart Corporation 415,993,323 15.457 5 . JJACCIS Development Corporation 62,320,926 2.316 6 . CBC Employees Retirement Plan 53,278,951 1.980 7 . Joaquin T. Dee &/or Family 40,787,322 1.516 8 . GDSK Development Corporation 31,458,583 1.169
9 . Suntree Holdings Corporation 24,138,332 0.897 10 . Syntrix Holdings, Inc. 21,552,649 0.801 11 . Hydee Management & Resource Corp. 14,334,603 0.533 12 . The First Resources Mgt. & Sec. Corp. 5,964,229 0.222 13 . Kuan Yan Tan's Charity (Phil.), Inc. 5,941,277 0.221 14 . Reliance Commodities, Inc. 5,662,648 0.210 15 . Robert Y. Dee, Jr. 5,569,499 0.207 16 . La Filipina Uy Gongco Corporation 5,444,600 0.202 17 . Ansaldo, Godinez & Co., Inc. 5,037,498 0.187 18 . Michael John G. Dee 3,963,468 0.147 19 . Cheng Siok Tuan 3,864,332 0.144 20 . Rosario Chua Siu Choe 3,631,816 0.135
TOTAL 2,455,701,050 91.246%
Total number of shareholders (as of February 28, 2022) – 1,876
Summary of Filipino and Non-Filipino Holdings (as of February 28, 2022)
Nationality Number of Stockholders
Number of Shares
Percentage
Filipino 1,798 1,973,978,988 73.347 Non-Filipino (PCD) 1 710,076,453 26.384 Chinese 48 3,485,501 0.130 American 18 2,403,317 0.089 Australian 2 4,513 0.000 British 2 97,631 0.004 Canadian 2 450,163 0.017 Dutch 1 62,198 0.002 Spanish 1 107 0.000 Taiwanese 3 729,341 0.027 TOTAL 1,876 2,691,288,212 100.0%
(3)
Dividend History
2021 2020 2019 2018 2017 2016 Stock Dividend -- -- -- -- 8% 8% Cash Dividend 10.0% 10.0% 8.8% 8.3% 8% 10%
61

Authorized and Issued Capital
Authorized Capital - P33.0 Billion divided into 3.3 Billion shares with a par value of P10.00 per share Issued Shares - 2,691,288,212 common shares
There is no restriction that limits the ability of the Bank to pay dividends other than what is required under the Revised Corporation Code and pertinent Bangko Sentral ng Pilipinas (BSP) regulations that prescribe minimum levels and ratios of capital adequacy. However, any dividends declared by the Bank are subject to notice to/approval by the BSP, Philippine Stock Exchange (PSE), and/or Securities and Exchange Commission (SEC). The Dividend Policy of the Bank is discussed under Annex ―C‖ of the Information Statement.
(4) Unregistered Securities
There were no unregistered securities sold by the Bank for the past three (3) years.
(5) Free Float Level
Based on the Public Ownership Report of the Bank as of December 31, 2021, 57.096% of the total outstanding shares are owned by the public.
6262
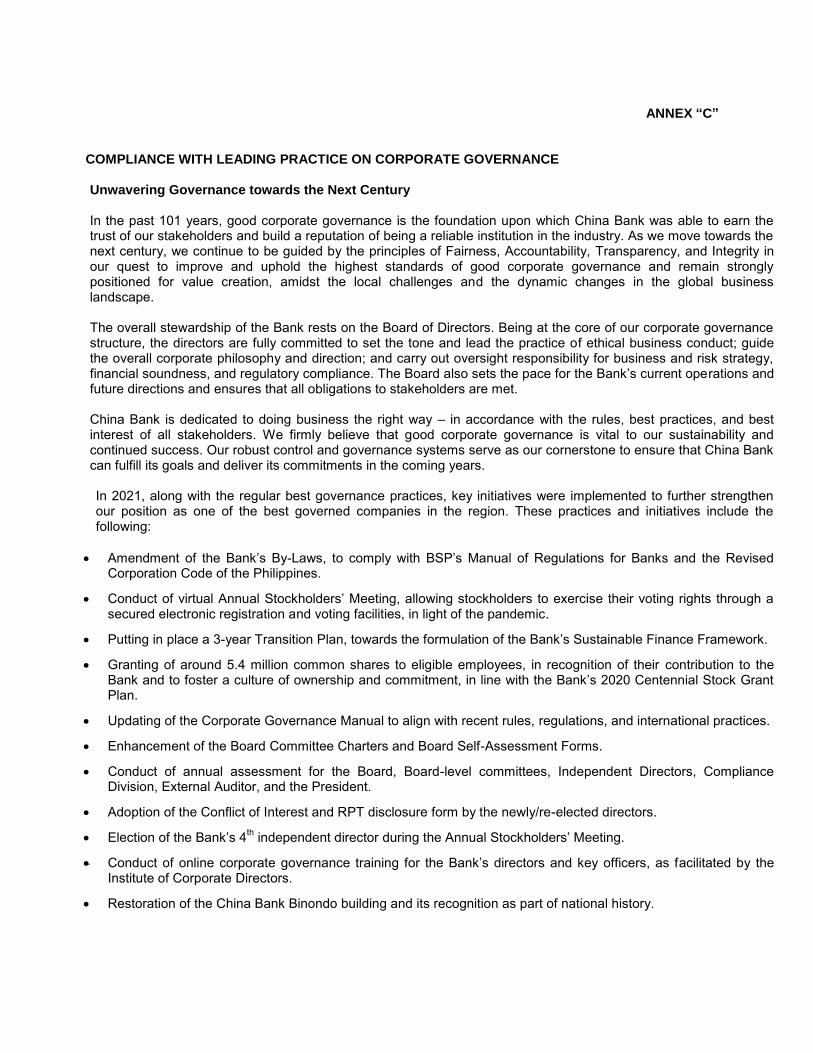
ANNEX “C” COMPLIANCE WITH LEADING PRACTICE ON CORPORATE GOVERNANCE Unwavering Governance towards the Next Century
In the past 101 years, good corporate governance is the foundation upon which China Bank was able to earn the trust of our stakeholders and build a reputation of being a reliable institution in the industry. As we move towards the next century, we continue to be guided by the principles of Fairness, Accountability, Transparency, and Integrity in our quest to improve and uphold the highest standards of good corporate governance and remain strongly positioned for value creation, amidst the local challenges and the dynamic changes in the global business landscape.
The overall stewardship of the Bank rests on the Board of Directors. Being at the core of our corporate governance structure, the directors are fully committed to set the tone and lead the practice of ethical business conduct; guide the overall corporate philosophy and direction; and carry out oversight responsibility for business and risk strategy, financial soundness, and regulatory compliance. The Board also sets the pace for the Bank‘s current operations and future directions and ensures that all obligations to stakeholders are met.
China Bank is dedicated to doing business the right way – in accordance with the rules, best practices, and best interest of all stakeholders. We firmly believe that good corporate governance is vital to our sustainability and continued success. Our robust control and governance systems serve as our cornerstone to ensure that China Bank can fulfill its goals and deliver its commitments in the coming years. In 2021, along with the regular best governance practices, key initiatives were implemented to further strengthen our position as one of the best governed companies in the region. These practices and initiatives include the following:
Amendment of the Bank‘s By-Laws, to comply with BSP‘s Manual of Regulations for Banks and the Revised
Corporation Code of the Philippines.
Conduct of virtual Annual Stockholders‘ Meeting, allowing stockholders to exercise their voting rights through a secured electronic registration and voting facilities, in light of the pandemic.
Putting in place a 3-year Transition Plan, towards the formulation of the Bank‘s Sustainable Finance Framework.
Granting of around 5.4 million common shares to eligible employees, in recognition of their contribution to the Bank and to foster a culture of ownership and commitment, in line with the Bank‘s 2020 Centennial Stock Grant Plan.
Updating of the Corporate Governance Manual to align with recent rules, regulations, and international practices.
Enhancement of the Board Committee Charters and Board Self-Assessment Forms.
Conduct of annual assessment for the Board, Board-level committees, Independent Directors, Compliance Division, External Auditor, and the President.
Adoption of the Conflict of Interest and RPT disclosure form by the newly/re-elected directors.
Election of the Bank‘s 4th independent director during the Annual Stockholders‘ Meeting.
Conduct of online corporate governance training for the Bank‘s directors and key officers, as facilitated by the Institute of Corporate Directors.
Restoration of the China Bank Binondo building and its recognition as part of national history.
6363
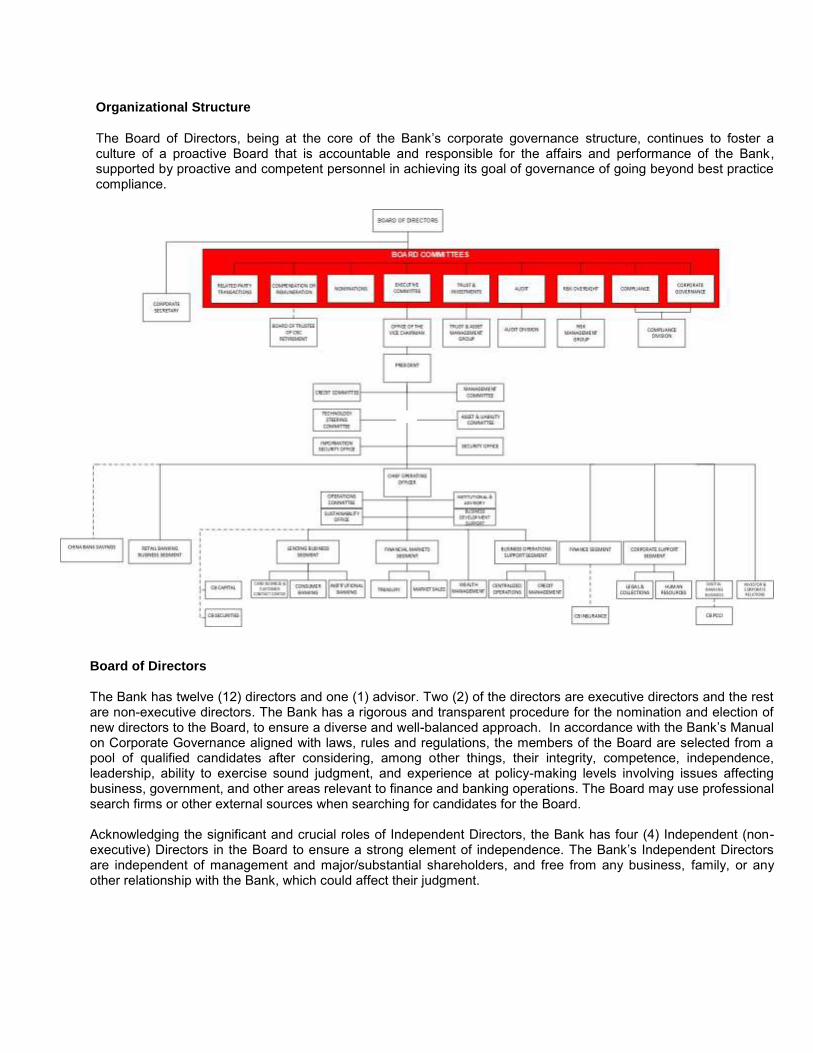
Organizational Structure The Board of Directors, being at the core of the Bank‘s corporate governance structure, continues to foster a culture of a proactive Board that is accountable and responsible for the affairs and performance of the Bank, supported by proactive and competent personnel in achieving its goal of governance of going beyond best practice compliance.
Board of Directors The Bank has twelve (12) directors and one (1) advisor. Two (2) of the directors are executive directors and the rest are non-executive directors. The Bank has a rigorous and transparent procedure for the nomination and election of new directors to the Board, to ensure a diverse and well-balanced approach. In accordance with the Bank‘s Manual on Corporate Governance aligned with laws, rules and regulations, the members of the Board are selected from a pool of qualified candidates after considering, among other things, their integrity, competence, independence, leadership, ability to exercise sound judgment, and experience at policy-making levels involving issues affecting business, government, and other areas relevant to finance and banking operations. The Board may use professional search firms or other external sources when searching for candidates for the Board. Acknowledging the significant and crucial roles of Independent Directors, the Bank has four (4) Independent (non-executive) Directors in the Board to ensure a strong element of independence. The Bank‘s Independent Directors are independent of management and major/substantial shareholders, and free from any business, family, or any other relationship with the Bank, which could affect their judgment.
6464

The members of the Board are given a copy of their general and specific duties and responsibilities as prescribed bythe Manual of Regulations for Banks (MORB). The directors acknowledge that they have received and certify thatthey read and fully understood the same. Moreover, the Directors also individually submit a Sworn Certification thatthey possess all the qualifications as enumerated in the MORB. These certifications are submitted to BSP after theirelection. Additional certifications are executed by Independent Directors to comply with Securities Regulation Codeand BSP rules which are then submitted to the SEC.
Board Committees
To effectively carry out its mandate of good corporate governance through compliance with laws, rules, regulationsand best practices, the Bank’s Board is supported by various committees, as follows:
Executive Committee has the powers of the Board, when the latter is not in session, in the managementof the business and affairs of the Bank to the fullest extent permitted under its By-Laws and Philippinelaws. The Executive Committee had 43 meetings in 2021, including two joint meetings with the RiskOversight Committee.
Name of Director AttendanceHans T. Sy (Chairman) 43Gilbert U. Dee 39Peter S. Dee 43Joaquin T. Dee 43William C. Whang 43* 2 joint meetings with the Risk Oversight Committee
Corporate Governance Committee is responsible for ensuring that the Bank’s Corporate Governance
framework is regularly reviewed, updated, and always implemented accordingly. It provides assistance tothe Board in fulfilling its responsibilities by ensuring compliance with, and proper observance ofgovernance laws, rules, principles, and best practices, including the continuing education program for thedirectors and conduct of the Board assessment, among others. The Corporate Governance Committeehad 31 meetings including 12 joint meetings with the Compliance Committee and 18 joint meetings withthe Nominations Committee.
Name of Director AttendanceMargarita L. San Juan (Chairman) 31Claire Ann T. Yap 31Genaro V. Lapez (a) 19Philip S.L. Tsai (b) 12Alberto S. Yao (c) 12
*12 joint meetings with the Compliance Committee18 joint meetings with the Nominations Committee
(a) Member from May 6, 2021; attended 19 out of 19 meetings of Nominations/Complianceand Corporate Governance Committees
(b) Member up to May 5, 2021; attended 11 out of 11 meetings of Nominations/Complianceand Corporate Governance Committees
(c) Member up to May 5, 2021; attended 11 out of 11 meetings of Nominations/Complianceand Corporate Governance Committees
Audit Committee primarily oversees all matters pertaining to audit – mainly the evaluation of theadequacy and effectiveness of the Bank’s internal control system, as well as the integrity of its financialstatements. It appoints, reviews, and concurs in the appointment or replacement of the Chief AuditExecutive (CAE), and is responsible for ensuring that the CAE and internal audit function are free frominterference by outside parties. It also ensures that an annual review is performed about the effectivenessof the internal audit mechanism, including compliance with the Institute of Internal Auditors’ International
Standards for the Professional Practice of Internal Auditing and Code of Ethics. It provides oversight overManagement’s activities in maintaining an adequate internal control framework, managing credit, market,liquidity, operational, legal, and other risks of the Bank, including regular receipts from management of
65
information on risk exposures and risk management activities. It likewise ensures that internal and external auditors remain independent and are given unrestricted access to records, properties, and personnel, to enable them to perform their respective audit functions. It is also responsible for the recommendation on the appointment and removal of the external auditor. It has the explicit authority to investigate any matter within its terms of reference, to ensure the effectiveness and efficiency of the Bank‘s internal controls. There were 14 Committee meetings conducted in 2021.
Name of Director Attendance Claire Ann T. Yap (a) (Chairman) 9 Joaquin T. Dee 14 Philip S.L. Tsai (b) 9 Margarita L. San Juan (c) 5 Alberto S. Yao (d) 5
(a) Chairman from May 6, 2021; attended 9 out of 9 meetings of Audit Committee(b) Member from May 6, 2021; attended 9 out of 9 meetings of Audit Committee(c) Member up to May 5, 2021; attended 5 out of 5 meetings of Audit Committee(d) Member up to May 5, 2021; attended 5 out of 5 meetings of Audit Committee
Compliance Committee is tasked to monitor compliance with established bank laws, rules, andregulations specifically in creating a dynamic and responsive compliance risk management system foridentifying and mitigating risks that may erode the franchise value of the Bank and ensuring thatmanagement is doing business in accordance with the said prescribed laws, rules and regulationsincluding policies, procedures, guidelines, and best practices.The Compliance Committee had 12 jointmeetings with the Corporate Governance Committee.
Name of Director Attendance Margarita L. San Juan (a) (Chairman) 8 Joaquin T. Dee 12 Harley T. Sy (b) 8 Hans T. Sy (c) 4 Alberto S. Yao (d) 4
*12 joint meetings with the Corporate Governance Committee(a) Chairman from May 6, 2021; attended 8 out of 8 meetings of Compliance and Corporate
Governance Committees(b) Member from May 6, 2021; attended 8 out of 8 meetings of Compliance and Corporate
Governance Committees(c) Member up to May 5, 2021; attended 4 out of 4 meetings of Compliance and Corporate
Governance Committees(d) Member up to May 5, 2021; attended 4 out of 4 meetings of Compliance and Corporate
Governance Committees
Risk Oversight Committee is responsible for the development and oversight of the Bank‘s risk
management functions, including the evaluation of the effectiveness of the enterprise risk managementframework and ensuring that corrective actions are in place to address concerns in a timely manner. Itoversees the risk-taking activities of the Bank and warrants the continued relevance, comprehensiveness,and overall value of the institutional risk management plan. The Committee met 14 times in 2021, withtwo meetings jointly held with the Executive Committee.
6666

Name of Director Attendance Philip S.L. Tsai (Chairman) 14 Margarita L. San Juan (a) 10 Claire Ann T. Yap (b) 10 Hans T. Sy (c) 4 Alberto S. Yao (d) 4
*2 joint meetings with the Executive Committee(a) Member from May 6, 2021; attended 10 out of 10 meetings of Risk Oversight Committee,
and Joint Risk Oversight and Executive Committees(b) Member from May 6, 2021; attended 10 out of 10 meetings of Risk Oversight Committee,
and Joint Risk Oversight and Executive Committees(c) Member up to May 5, 2021; attended 4 out of 4 meetings of Risk Oversight Committee(d) Member up to May 5, 2021; attended 4 out of 4 meetings of Risk Oversight Committee
Nominations Committee is responsible for reviewing and evaluating the qualifications of all personsnominated to the Board. Jointly with the Corporate Governance Committee, it oversees the nominationprocess for, and evaluates the qualifications of all persons nominated to Department and Division Headpositions, as well as all promotions to any Bank Officer position. It also undertakes the process ofreviewing the qualifications of the Board candidates, to ensure that their qualities and/or skills are alignedwith the Bank‘s strategic directions, appropriate for leading and assisting the Bank in achieving its visionand corporate goals. The Committee, which is composed entirely of Independent Directors, held 18 jointmeetings with the Corporate Governance Committee in 2021.
Name of Director Attendance Margarita L. San Juan (a) (Chairman) 18 Claire Ann T. Yap (b) 18 Genaro V. Lapez (c) 11 Philip S.L. Tsai (d) 7 Alberto S. Yao (e) 7
*18 joint meetings with the Corporate Governance Committee(a) Member up to May 5, 2021; Chairman from May 6, 2021(b) Chairman up to May 5, 2021; Member from May 6, 2021(c) Member from May 6, 2021; attended 11 out of 11 meetings of Nominations and Corporate
Governance Committees(d) Member up to May 5, 2021; attended 7 out of 7 meetings of Nominations and Corporate
Governance Committees(e) Member up to May 5, 2021; attended 7 out of 7 meetings of Nominations and Corporate
Governance Committees
Remuneration Committee provides oversight over the remuneration of senior management and otherkey personnel, ensuring that compensation is consistent with the interest of all stakeholders and theBank‘s culture, strategy, and control environment. The Committee met once in 2021.
Name of Director Attendance Genaro V. Lapez (Chairman) 1 Herbert T. Sy 1 Philip S.L. Tsai 1
Related Party Transactions Committee is responsible for reviewing all material related partytransactions (RPTs) to ensure that they are conducted at an arm's length. Composed entirely ofIndependent Directors, the committee oversees the proper implementation of the RPT Policy and ensuresthat corresponding transactions are duly identified, measured, monitored, controlled, and reported. TheCommittee had 12 meetings in 2021.
6767
Name of Director Attendance Genaro V. Lapez (a) (Chairman) 7 Margarita L. San Juan (b) 12 Philip S.L. Tsai 12 Claire Ann T. Yap (c) 5 Alberto S. Yao (d) 5
(a) Chairman from May 6, 2021; attended 7 out of 7 meetings(b) Chairman from January 1 to May 5, 2021; Member from May 6, 2021(c) Member up to May 5, 2021; attended 5 out of 5 meetings(d) Member up to May 5, 2021; attended 5 out of 5 meetings
Trust Investment Committee provides oversight functions, overall strategic business development andfinancial policy directions to the Trust and Asset Management Group. It oversees the trust, investmentmanagement and fiduciary activities of the Bank, and ensures that they are conducted in accordance withapplicable rules and regulations, and judicious practices. Moreover, it ensures that prudent operatingstandards and internal controls are in place and that the Board‗s objectives are clearly understood andduly implemented by the concerned units and personnel. The Committee had 11 meetings in 2021.
Name of Director Attendance Peter S. Dee (Chairman) 11 Harley T. Sy 11 Jose T. Sio 11 William C. Whang 11 Mary Ann T. Lim * 11 * First Vice President I, Trust Officer and Head of Trust and Asset Management Group
Additional details on the Committees and their charters can be accessed through the Bank‗s website at
www.chinabank.ph.
Corporate Secretary
Assisting the Board of Directors in the effective and efficient discharge of their duties, is the Corporate Secretary, who reports operationally to the Chairman and is accountable to the Board. Atty. Corazon I. Morando was our Corporate Secretary until her retirement on December 31, 2021. She was replaced by Atty. Leilani B. Elarmo effective January 1, 2022. The duties and responsibilities of the Corporate Secretary are clearly stated in the Bank‘sCorporate Governance Manual.
The Corporate Secretary is a senior, strategic-level corporate officer who has the vital role of official record keeper responsible for the administrative side of Board and committee meetings; corporate governance gatekeeper responsible for overseeing sound board practices; and Board liaison who works and deals fairly and objectively with the Board, Management, stockholders, and other stakeholders.
Board Training and Orientation Program
In compliance with existing rules and regulations and as part of the continuing education program, the Board undergoes an annual training. Last September 1, 2021, the directors and members of the Management Committee, together with key officers of the Bank and subsidiaries have attended the Bank‘s online exclusive advanced Corporate Governance training as facilitated by the Institute of Corporate Directors (ICD). The said training focused on Digital Transformation; Corporate Governance in a Nutshell: What Effective Boards Focus on Before Everything Else; and Anti-Money Laundering Updates.
Moreover, a new member of the Board is briefed on his duties and responsibilities and given an orientation kit, containing: (1) Specific Duties and Responsibilities of Directors, (2) Corporate Governance Manual, and (3) applicable Board Committee Charters. He is also required to attend an orientation program from accredited training providers.
6868

Performance Evaluation for the Board, Individual Directors, Board Committees and President
The Bank has an annual performance assessment to determine the Board, individual Directors, Independent Directors, all Board-level Committees, and the President‘s level of compliance with leading practices and principleson good governance and to identify areas for improvement. The evaluation seeks to assess the effectiveness and collective performance of the Board through a self-assessment. The Compliance Division summarizes the results of the evaluation and reports it to the Board through the Corporate Governance Committee.
A five-point scale rating system is used for the self-assessment, where the lowest is 0, equivalent to ―Poor‖ and thehighest is 5, equivalent to ―Excellent‖.
The Board reviews the results and evaluates the enhancements needed to improve the performance of the Board collectively, the individual directors, and the various committees. The assessment shall be validated by an external facilitator every three (3) years.
In 2021, there are no significant deviations and in general, the Bank has fully complied with the provisions and requirements of the Corporate Governance Manual.
Compliance System
The Compliance Division plays a crucial role in fostering a culture of compliance not just in all facets of the Bank, but across the Group, that seeks to assist the Board in the discharge of its governance function to protect the Bank‘sreputation and its stakeholders‘ interests. In place is a compliance risk management system that is designed to identify and mitigate risks and ensure the Bank‘s safety and soundness. Moreover, the division ensures thatemployees at all levels are aware of and comply with all applicable laws, rules, and regulations, by cascading the compliance plan to them and disseminating all latest issuances, advisories, notices, and other regulatory matters.
Compliance Division is headed by the Chief Compliance and Governance Officer (CCGO), Atty. Aileen Paulette S. De Jesus, who reports functionally to the Compliance and the Corporate Governance committees and administratively to the Bank‘s President. The Compliance function is supported by a duly approved Compliance Charter that defines the duties and responsibilities, mandate, independence, and manner on which compliance is implemented. At the helm of this function is the Regulatory Compliance Department, which ensures that the compliance system is updated and implemented accordingly. The Corporate Governance Department carries out and manages the implementation of the corporate governance mandates, which includes managing compliance with the Code of Corporate Governance, BSP and SEC rules on governance and international best practices. The AMLDepartment manages the Bank‘s compliance with Anti-Money Laundering laws and regulations, and implementation of Money Laundering and Terrorist Financing Prevention Program (MTPP). On the other hand, the IT ComplianceDepartment provides the necessary IT support to the AML Compliance Department in the administration of the Bank‘s AML system, the Base60. The Subsidiaries Compliance Department ensures group-wide compliance to relevant rules, laws, and regulations by providing direction and support to the Bank‘s subsidiaries. The AssociatedPerson is responsible for the Bank‘s compliance with the Securities Regulations Code, including relevant laws and issuances related thereon. All units in the Bank have Compliance Coordinators to ensure that all risks associated to the operations and business of the individual units are identified, monitored, and mitigated.
Rating Description
0 Poor – Leading practice or principle is not adopted in the company‘s Manual of Corporate Governance
1 Needs Improvement – Leading practice or principle is adopted in the Manual, but compliance has not yet been made
2-3 Fair – Leading practice or principle is adopted in the Manual and compliance has been made but with major deviation(s) or incompleteness
4 Good – Leading practice or principle is adopted in the Manual and compliance has been made but with minor deviation(s) or incompleteness
5 Excellent – Leading practice or principle is adopted in the Manual and full compliance with the same has been made
6969
To enhance regulatory, compliance and good governance awareness and continuously strengthen the implementation of our compliance culture within the Bank, the Compliance Division:
1. Cascades all recent laws, rules, and regulations to all concerned;
2. Acts as liaison for the Board and Management on regulatory compliance matters, with the regulatory agencies;
3. Provides advisory services, including reviewing proposed Bank products and services;
4. Reviews and updates the Compliance Manual, MTPP and Corporate Governance Manual annually or asnecessary, to align with recent regulatory requirements;
5. Continuously educates Bank employees about compliance, anti-money laundering, good governance and itsbenefits, consumer protection and related party transactions, among others, to ensure that everyone in theinstitution is in the same direction towards good governance and to develop a culture of trust and integrity and toenable the employees of the Bank to embrace the principles set forth by the Board;
6. Conducts briefings and training for Compliance Coordinators in the branches and Head Office to raise the levelof awareness and understanding of the principles, concepts, and elements of good corporate governance andcompliance. The Compliance Coordinators are required to cascade their learnings to their respective areas; and
7. Conducts lectures to all new employees of the Bank for the basic orientation on Compliance System, AML,Whistleblowing, and Corporate Governance giving them an overview of the Bank‘s Compliance RiskManagement System. Compliance Division also conducts lectures during the Junior Executive Development(JED) and Supervisory Development Program (SDP), among others.
Governance Policies
Corporate Governance Manual
In place, is an extensive Corporate Governance Manual that contains the Bank‘s corporate governance policies, structure, principles, as well as the general and specific duties and responsibilities of the Board and the individual directors. The Manual is kept updated to ensure that it is aligned with latest regulatory issuances. To enjoin Bank-wide compliance and for easy access, a copy of the Manual is posted on the Bank‘s website and is available in the Bank‘s SharePoint site, under Corporate Governance Department. The CCGO is primarily tasked to monitor compliance with the Manual and is always available to respond to inquiries from Bank officials and personnel regarding good corporate governance policies and practices.
In 2021, the Bank has fully complied with the provisions of the Corporate Governance Manual.
Board Remuneration
The amendment to the Bank‘s By-Laws included the increase in the per diem of the directors to up to ten thousand pesos (P10,000.00) for attendance at each meeting of the Board of Directors or of any Committee [amendment approved by the BSP on February 24, 2022, now enabling the Bank to register the same with the SEC] or as may be determined from time to time by stockholders owning or representing a majority of the subscribed capital stock, at any regular or special meeting. In accordance with Article VIII of the Bank‘s By-Laws, a portion of the net earnings shall be given to the members of the Board.
Beginning 2021, the Bank disclosed the compensation of the directors (for the preceding year) on an individual basis, in compliance with the Revised Corporation Code.
7070

Dividend Policy
The Bank, as a matter of policy, shall declare cash dividends at a payout ratio of approximately thirty percent (30%) of the net income of the prior year, subject to the conditions and limitations set forth in this policy statement. The Bank‘sDividend Policy is an integral component of its Capital Management Policy and Process. Its fundamental and overriding philosophy is sustainability.
Dividend payouts are reviewed annually. These are referenced against the Bank‘s Capital Management Process.Based on this process, dividend payouts are calibrated based on the prior year‘s earnings while taking into consideration dividend yields, future earnings streams, and future business opportunities.
In declaring dividend payouts, the Bank uses a combination of cash or stock dividends as follows:
1. The dividend is increased in response to the Bank‘s achieving a higher level of sustainable earnings.
2. Dividends may be increased for a specific year to plow back to shareholders a commensurate share of unusuallyhigh earnings for a given year.
The Bank‘s capital management philosophy and process, and consequently its Dividend Policy which comprises an integral component of this undertaking, are driven by the following primary objectives:
1. Ensuring compliance with externally imposed regulatory capital requirements.2. Maintaining strong credit ratings.3. Maintaining healthy capital ratios to support its business and maximize shareholder value.
Moreover, the Bank manages its capital structure and makes adjustments to it in the light of:
1. Changes in economic conditions.2. The risk characteristics of its activities.3. The assessment of prospective business requirements or directions.
Whistleblowing
Without fear of any retaliation, China Bank employees, customers, shareholders, and any third-party may report questionable or illegal activity, unethical conduct, fraud or any other malpractice by mail, phone, or e-mail. The identity of the whistleblower is kept confidential, and all reports are evaluated based on their merits and sufficiency in substance before they are endorsed for investigation.
The CCGO is the primary driver in the implementation of the Whistleblowing Policy. All disclosures are directed to the CCGO or to the duly designated Compliance Officer, who is responsible for determining the sufficiency and validity of the report. The policy also allows reporting of any disclosure to the Chief Audit Executive, Chief Risk Officer, and the Human Resources Group Head.
Code of Ethics
The Bank is committed to conduct its business in an honest and ethical manner, well guided by its core values, namely: integrity, high performance standards, commitment to quality, customer service focus, concern for people, efficiency and resourcefulness, and initiative in carrying out its functions and in dealing with its clients. These core values are also the foundation of the Bank‘s Code of Ethics.
Setting the tone from the top, our Board of Directors is fully committed to principled conduct of business. Just as it expects full compliance to the Code of Ethics from all Bank employees, the body believes that its members should also uphold the principles of integrity, fairness, accountability, and transparency at all times.
The Code of Ethics for Directors articulates the acceptable practices in relation to both internal and external dealings (i.e., investors, creditors, customers, depositors, contractors, suppliers, regulators, and the general public) of the members of the Board. It also provides the guiding principles on the performance of their duties in accordance with the fit and proper rules; and establishes standards for professional and ethical conduct. All new directors are given a copy of the Code, which they acknowledge receipt thereof.
7171
To ensure that business is carried out in compliance with relevant laws and in the protection of the interest of the Bank‘s customers, shareholders and other stakeholders, the Bank‘s HRG has disseminated the Bank‘s Code of Ethics to all employees, including new hires. Employees are required to sign an acknowledgement receipt that they have received a copy of the Code of Ethics.
Copies of the Code are also made available in the Bank‘s intranet to be readily accessible to all employees and are also available on the Bank‘s website. A comprehensive discussion on the Code of Ethics is conducted with newemployees of the Bank to foster a culture of awareness on the Bank‘s core values. Such discussion also highlights the behavioral standards, business conduct, and corresponding sanctions for violations of the Code of Ethics.
Policy on Conflict of Interest
In accordance with the Bank‘s Code of Ethics, conflict of interest between the Bank and its directors, officers and employees should be always avoided. However, should a conflict arise, the interest of the Bank must prevail. Employees are not permitted to have or be involved in any financial interests that are in conflict or appear to conflict with their duties and responsibilities to the Bank. They are likewise barred from engaging in work outside of the Bank unless with duly approved permission, as well as work that lies in direct competition with the Bank.
To further strengthen our governance practices in the prevention of conflict of interest, in 2020, the Corporate Governance Committee approved the use of Disclosure Form on Conflict of Interest and Related Party Transactions by the Directors, making mandatory the disclosure of any possible conflict of interest, as set forth in the relevant regulations and internal policies.
Disclosure and Transparency
The Bank is committed to a high standard of disclosure and transparency to facilitate an understanding of the Bank‘s financial condition, operations, and corporate governance systems. The Bank believes all material information about its financial condition and operations is disclosed in accordance with applicable rules and regulations. In addition to compliance with reporting requirements, such as the publication of quarterly financial statements in national newspapers and publication of a comprehensive annual report for the Bank‘s annual stockholders meeting, the Bank promptly discloses major and market-sensitive information, including but not limited to dividend declarations, joint ventures and acquisitions, sale and disposition of significant assets, and financial and non-financial information that may affect or influence an investor‘s investment decision. The Bank also electronically files its disclosures through Electronic Disclosure Generation Technology (EDGE) which are then made available publicly on the PSE‘s website.The Bank‘s corporate website is likewise regularly updated to include the latest news and information about the Bank.
The Bank aims to ensure that information about its products and services are clear, accurate, and accessible. The Bank provides all necessary and relevant information to its customers so that they can make informed decisions when transacting with it. The Bank communicates such information to its customers and other stakeholders using wide range of media, including via print materials, advertisements in bank branches and electronic and digital advertisements on TV, radio, the internet, and social media channels such as Twitter and Facebook; and through its Customer Contact Center. The Bank believes it displays all consumer information required by the BSP at its branches. Further, the Bank‘s branch personnel are trained to handle customer inquiries in a professional manner and to adequately explain risks relating to the Bank‘s products and services and to provide advice on financial matters as appropriate.
7272
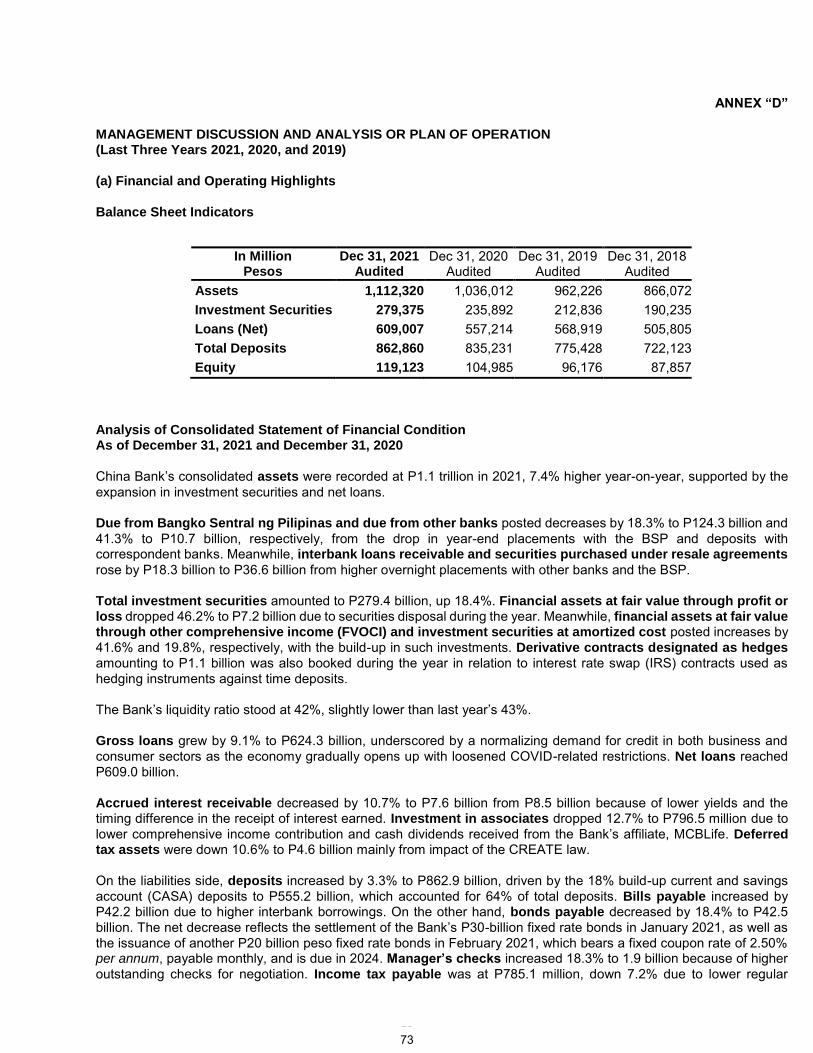
ANNEX “D”
MANAGEMENT DISCUSSION AND ANALYSIS OR PLAN OF OPERATION (Last Three Years 2021, 2020, and 2019)
(a) Financial and Operating Highlights
Balance Sheet Indicators
Analysis of Consolidated Statement of Financial Condition As of December 31, 2021 and December 31, 2020
China Bank’s consolidated assets were recorded at P1.1 trillion in 2021, 7.4% higher year-on-year, supported by the expansion in investment securities and net loans.
Due from Bangko Sentral ng Pilipinas and due from other banks posted decreases by 18.3% to P124.3 billion and 41.3% to P10.7 billion, respectively, from the drop in year-end placements with the BSP and deposits with correspondent banks. Meanwhile, interbank loans receivable and securities purchased under resale agreements
rose by P18.3 billion to P36.6 billion from higher overnight placements with other banks and the BSP.
Total investment securities amounted to P279.4 billion, up 18.4%. Financial assets at fair value through profit orloss dropped 46.2% to P7.2 billion due to securities disposal during the year. Meanwhile, financial assets at fair valuethrough other comprehensive income (FVOCI) and investment securities at amortized cost posted increases by 41.6% and 19.8%, respectively, with the build-up in such investments. Derivative contracts designated as hedges
amounting to P1.1 billion was also booked during the year in relation to interest rate swap (IRS) contracts used as hedging instruments against time deposits.
The Bank’s liquidity ratio stood at 42%, slightly lower than last year’s 43%.
Gross loans grew by 9.1% to P624.3 billion, underscored by a normalizing demand for credit in both business and consumer sectors as the economy gradually opens up with loosened COVID-related restrictions. Net loans reached P609.0 billion.
Accrued interest receivable decreased by 10.7% to P7.6 billion from P8.5 billion because of lower yields and the timing difference in the receipt of interest earned. Investment in associates dropped 12.7% to P796.5 million due to lower comprehensive income contribution and cash dividends received from the Bank’s affiliate, MCBLife. Deferredtax assets were down 10.6% to P4.6 billion mainly from impact of the CREATE law.
On the liabilities side, deposits increased by 3.3% to P862.9 billion, driven by the 18% build-up current and savings account (CASA) deposits to P555.2 billion, which accounted for 64% of total deposits. Bills payable increased by P42.2 billion due to higher interbank borrowings. On the other hand, bonds payable decreased by 18.4% to P42.5 billion. The net decrease reflects the settlement of the Bank’s P30-billion fixed rate bonds in January 2021, as well as the issuance of another P20 billion peso fixed rate bonds in February 2021, which bears a fixed coupon rate of 2.50% per annum, payable monthly, and is due in 2024. Manager’s checks increased 18.3% to 1.9 billion because of higher outstanding checks for negotiation. Income tax payable was at P785.1 million, down 7.2% due to lower regular
In Million Pesos
Dec 31, 2021 Audited
Dec 31, 2020 Audited
Dec 31, 2019 Audited
Dec 31, 2018 Audited
Assets 1,112,320 1,036,012 962,226 866,072 Investment Securities 279,375 235,892 212,836 190,235 Loans (Net) 609,007 557,214 568,919 505,805 Total Deposits 862,860 835,231 775,428 722,123 Equity 119,123 104,985 96,176 87,857
7373
corporate income tax payable for the period. Accrued interest and other expenses increased 21.5% to P4.7 billion, with the setup of higher employee benefits and other expense accruals. Change in the mark-to-market rates resulted in the decrease in derivative liabilities and derivative contracts designated as hedges by P218.1 million and P358.8 million, respectively. The 28.5% drop in deferred tax liabilities was attributable to the savings bank subsidiary. Other
liabilities increased by P1.8 billion to P12.7 billion mainly from higher accounts payable, acceptances payable, and expected credit losses on off-balance sheet exposures.
Total equity reached P119.1 billion, 13.5% higher than last year’s P105.0 billion, mainly from 19.7% increase in surplus. Surplus reserves rose 29.8% to P3.7 billion due to the appropriation of retained earnings. Net unrealized
gain on financial assets at FVOCI amounted to P81.2 million, down from P294.1 million last year because of mark-to-market revaluation of the Bank’s FVOCI securities. Remeasurement loss on defined benefit asset was lower at (P30.5) million due to changes in actuarial assumptions. Furthermore, remeasurement loss on life insurance reserveof associate was lower at (P14.0) million from (P45.9) million due to the revaluation of legal policy reserves of the Bank’s affiliate, MCBLife. Meanwhile, cumulative translation adjustment increased by P12.1 million to P17.6 million due to exchange rate difference arising from the translation of income and expenses to its presentation currency. Cashflow hedge reserve improved to P976.8 million due to the designation of new hedges and favorable mark-to-market rates.
The Bank’s Common Equity Tier 1 (CET 1/ Tier 1) ratio was at 14.92% while total Capital Adequacy Ratio (CAR)
was computed at 15.75%. Both are above the regulatory minimum requirement.
Analysis of Consolidated Statement of Financial Condition
As of December 31, 2020 and December 31, 2019
The Bank hit a P1.0 trillion mark in total assets, 7.7% higher compared to the P962.2 billion last year.
Cash and other cash items dropped 5.1% to P16.0 billion due to the leveling-off of cash-in-vault from its 2019-end build-up. Due from BSP and due from other banks posted increases by P52.0 billion and P8.3 billion, respectively arising from the increases in year-end placements with the BSP and deposits with correspondent banks. Similarly, interbank loans receivable and securities purchased under resale agreements rose by 7.4% to P18.3 billion from higher overnight placements with the BSP.
Total investment securities amounted to P235.9 billion, up 10.8%. Investment securities at amortized costincreased by 20.2% to P202.2 billion with the growth in fixed income assets. Meanwhile, financial assets at fair value
through profit or loss (FVPL) and financial assets at fair value through other comprehensive income (FVOCI)
posted decreases by P5.1 billion or 27.5% and P5.9 billion or 22.5%, respectively resulting from the Bank’s securities
disposal during the year.
The Bank’s liquidity ratio stood at 43% higher than last year’s 37%.
Gross loans were at P572.3 billion, slightly down versus last year’s P577.8 billion. Net loans reached P557.2 billion.
Accrued interest receivable increased by 19.2% to P8.5 billion from P7.2 billion from higher volume of earning assets. Investment in associates increased 29.6% to P912.6 million from additional contribution from the Bank’s affiliate MCBLife. Bank premises, furniture, fixture, and equipment decreased by P732.5 million or 8.0% to P8.4 billion due to depreciation. Investment properties dropped 8.1% to P4.0 billion due to the sale and disposal of foreclosed properties and write-offs. Deferred tax assets were up 53.4% to P5.2 billion, with the booking of additional provision for impairment and credit losses. Other assets declined by 5.6% to P6.5 billion from lower year-end balance of accounts receivables among others.
On the liabilities side, the Bank sustained the growth of deposits by 7.7% to P835.2 billion, of which demand and savings deposits totaled P468.9 billion. Bills payable decreased by 29.1% to P23.7 billion from lower interbank borrowings and trade finance. On the other hand, bonds payable increased by 39.2% with the Peso fixed rate bond issuance of another P15 billion in October 2020. Manager’s checks dropped 21.5% to 1.6 billion because of lower outstanding checks for negotiation. Income tax payable was at P846.1 million, 56.5% higher due to increase in regular corporate income tax payable for the period. Accrued interest and other expenses were 5.2% lower at P3.9 billion
7474
with lower interest payable accruals. Change in the mark-to-market rates resulted in increased in derivative liabilitiesand derivative contracts designated as hedges by P180.7 million and P469.3 million, respectively.
Total equity reached P105.0 billion, 9.2% higher than last year’s P96.2 billion, mainly from 20.8% increase in retained
earnings booked under surplus. Surplus reserves declined 20.1% to due to the reversal of excess appropriation in the allowance for credit losses. Net unrealized gain on financial assets at FVOCI amounted to P294.1 million from P417.6 million arising from the mark-to-market revaluation of the Bank’s FVOCI securities. Remeasurement loss ondefined benefit asset recorded a higher loss of P58.5 million to (P427.0) million due to higher retirement payouts from subsidiaries. Furthermore, remeasurement gain/ (loss) on life insurance reserve of associate saw a P66.6 million drop to (P45.9) million from the revaluation of legal policy reserves of the Bank’s affiliate, MCBLife. Cumulativetranslation adjustment and cash flow hedge reserve was down P1.3 million and P469.3 million due to exchange rate difference arising from the conversion of income and expenses related to foreign currency-denominated positions to base currency.
The Bank’s Common Equity Tier 1 (CET 1/ Tier 1) ratio and total CAR were computed at 13.82% and 14.73%, respectively.
Analysis of Consolidated Statement of Financial Condition As of December 31, 2019 and December 31, 2018
Assets grew by 11.1% to P962.2 billion from P866.1 billion mainly from the build-up in loans and liquid assets.
Cash and other cash items increased by 7.7% to P16.8 billion from P15.6 billion due to the higher cash requirements from the branch network expansion. Interbank loans receivable and securities purchased under resale
agreements rose 42.0% to P17.0 billion from higher overnight placements with the BSP.
Total investment securities amounted to P212.8 billion, up 11.9%. The build-up in securities volume raised the portfolio of financial assets at fair value through profit or loss (FVPL) by P10.9 billion to P18.5 billion and financialassets at fair value other comprehensive income (FVOCI) by P16.0 billion to P26.1 billion. The Bank’s securities
portfolio remained at 22.0% level of consolidated resources.
The Bank’s liquidity ratio stood at 37%, slightly lower than last year’s 38%.
Gross loan portfolio was at P577.8 billion, 12.7% higher year-on-year, while net loans stood at P568.9 billion, up P63.1 billion or 12.5% as the demand across market segments steadily increased.
Accrued interest receivable amounted to P7.2 billion, up P1.5 billion from P5.7 billion because of the increase in earning assets. Investment in associates saw a P369.1 million increase to P704.2 million because of additional capital infused to the Bank’s affiliate, MCBLife, as well as its higher income contribution. Bank premises, furniture, fixture,
and equipment and right-of-use assets grew by P2.7 billion or 41.9% to P9.2 billion from PFRS-16 related adjustments. Investment properties dropped 9.4% to P4.4 billion due to the sale and disposal of foreclosed properties. The booking of additional allowance for credit losses raised deferred tax assets by P856.1 million to P3.4 billion. Otherassets grew by 10.7% to P6.9 billion from higher miscellaneous items such as creditable withholding taxes and returned checks and other cash items (RCOCI).
On the liabilities side, total deposits increased by 7.4% to P775.4 billion from P722.1 billion, of which CASA (demand and savings deposits) totaled P411.8 billion. Bills payable dropped P6.5 billion or 16.2% to P33.3 billion from lower interbank borrowings and BSP rediscounted loans. The Bank booked P37.4 billion in bonds payable comprised of the P30-billion Peso fixed-rate retail bond and USD 150-million Green bond issuance to the International Finance Corporation (IFC).
Manager’s checks dropped by 22.5% to P2.0 billion from P2.6 billion because of lower customer demand. Income taxpayable amounted to P540.7 million, up P63.1 million or 13.2% due to additional regular corporate income taxes payable for the year. Accrued interest and other expenses were up by 7.3% to P4.1 billion because of the booking of accruals and payroll expenses. Derivative liabilities increased to P1.0 billion from P455.1 million from higher volume of currency swaps during the period. The 12.0% drop in deferred tax liabilities was attributable to the savings bank
7575

subsidiary. Other liabilities increased P3.3 billion to P11.0 billion mainly from lease-related liabilities from PFRS-16 related adjustments.
Total equity reached P96.2 billion, 9.5% higher than last year’s P87.9 billion mainly from the 19.9% increase in surplus
and the P1.1 billion improvement of net unrealized gain on financial assets on FVOCI. Remeasurement gain ondefined benefit asset recorded a P485.6 million decline resulting from actuarial changes arising from changes in demographic assumptions. Cumulative translation adjustment totaled P6.8 million, up from (P91.7) million arising from the conversion of income and expenses related to foreign currency-denominated positions to base currency.
The Bank’s Common Equity Tier 1 (CET 1 / Tier 1) ratio and total CAR were computed at 12.76% and 13.67%, respectively, well above the minimum regulatory requirement.
Income Statement Indicators
In Million Pesos
2021 Audited
2020 Audited
2019 Audited
2018 Audited
Interest Income 45,726 47,138 47,685 35,213 Interest Expense 7,411 13,295 21,634 12,286 Net Interest Income 38,314 33,843 26,051 22,926 Non-Interest Income 10,361 10,011 8,431 5,658 Provision for Impairment & Credit Losses
8,877 8,869 2,570 141
Operating Expenses 22,335 21,522 20,324 18,056 Net Income 15,106 12,071 10,075 8,116
Analysis of Consolidated Statements of Income For the period ended December 31, 2021 and December 31, 2020
China Bank posted a 25.1% increase in net income to P15.1 billion in 2021 on the back of sustained core business growth and effective cost management. The higher net profit translated to an improved return on equity of 13.58% and a return on assets of 1.45%.
Total interest income slid 3.0% year-on-year to P45.7 billion. Interest income from investment securities atamortized cost and at fair value through other comprehensive income decreased by 8.3% to P9.2 billion mainly from the effects of a low-yield environment. Interest income from due from BSP and other banks and securitiespurchased under resale agreements recorded a 46.6% increase to P1.9 billion with the higher volume of placements with the BSP and other banks.
Total interest expense amounted to P7.4 billion, P5.9 billion or 44.3% lower than last year as interest expenses on
deposit liabilities decreased 47.0% to P5.1 billion driven by the growth in CASA deposits, coupled with the decrease in time deposits and funding costs. Interest expense on bonds payable, bills payable, and other borrowings decreased by P1.3 billion to P2.1 billion due to the year-on-year drop in interbank borrowings and funding costs. Interest expenses on lease payable was also down 16.0% due to lower balance of outstanding lease liability.
With the significant reduction in interest expense, the Bank’s net interest income rose 13.2% to P38.3 billion, and led to an improved net interest margin of 4.20% from 3.92% last year.
The Bank recognized provision for impairment and credit losses amounting to P8.9 billion in 2021 which was steady versus the 2020 amount.
Total non-interest income grew by 3.5% to P10.4 billion, underpinned by a 38.6% increase in core fee-based income and the P4.0 billion net gain on trading and disposal of investment securities at amortized cost. Service charges,
7676
fees, and commissions rose by 29.2% to P3.5 billion due to higher investment banking commissions and loans- & deposits-related revenues. Trust fee income saw a 10.0% jump to P451.0 million following the sustained build-up in trust department accounts. Foreign exchange gain rose by 3.2x to P686.9 million because of favorable forex trading activities. The upturn in sales of foreclosed assets resulted in the doubling of gain on sale of investment properties to P388.3 million and a P110.2 million swing in gain on asset foreclosure & dacion transactions to P87.5 million. Lower earnings from the bancassurance joint venture, MCBLife, accounted for the (P1.6) million under share in net
loss of an associate. Miscellaneous income totaled P1.3 billion, up 32.6% from P952.2 million driven by higher bancassurance fees and other transaction-based revenues.
The Bank controlled the movement in operating expenses (excluding provision for impairment and credit losses) at P22.3 billion. Taxes and licenses were down 12.7% to P3.5 billion mainly from lower volume-related taxes.Depreciation and amortization was down 5.7% due to the depreciation expenses on bank premises, furniture, fixtures, equipment, right-of-use assets, and investment properties. Occupancy costs were up 18.9% to P2.1 billion due to higher expenses related to rent, utility, and security services. Professional fees, marketing, and other related
services, transportation and traveling, and entertainment, amusement, and recreation likewise rose 17.4% to P632.9 million, 30.7% to P594.1 million, and 16.6% to P490.3 million with the ramp-up in business development and marketing initiatives. The Bank has managed to cut stationery, supplies, and postage by 13.5% to P218.2 million. Repairs and maintenance increased by 29.6% to P173.8 million because of higher repairs and construction-related expenses during the year. Miscellaneous expenses increased by 30.1% to P3.3 billion mainly from pandemic-related costs and technology upgrade.
Consolidated cost-to-income ratio significantly improved to 46% from 49%.
Analysis of Consolidated Statements of Income
For the period ended December 31, 2020 and December 31, 2019
China Bank continued its strong performance in 2020, posting a net income of P12.1 billion which brought the earnings higher by 19.8%. This translated to a return on equity of 12.09% and return on assets of 1.21%.
Total interest income ended flat year-on-year. Nevertheless, interest income from due from BSP and other banksand SPURA recorded a 14.2% increase to P1.3 billion from the higher volume of placements with the BSP and other banks.
Total interest expense amounted to P13.3 billion, P8.3 billion or 38.5% lower than last year as interest expenses on
deposit liabilities decreased 48.1% to P9.6 billion driven mainly by the decline in funding cost. Interest expenses onbills payable and other borrowings was 22.2% higher at P3.4 billion due to the increase in alternative funding sources, including the Peso fixed-rate bonds issued in October 2020. Lease payable was down 12.0% due to lower interest charged on outstanding lease liability.
As a result, net interest income jumped 29.9% to P33.8 billion and led to a higher net interest margin of 3.92% from 3.39% last year.
The Bank hiked its provision for impairment and credit losses to P8.9 billion which was 3.5x larger from the P2.6 billion posted last year to cushion against the potential impact of COVID-19 pandemic and community quarantine measures on our loan portfolio.
Total non-interest income rose 18.7% to P10.0 billion mainly attributable to the 3.7x increase in trading andsecurities gain (net) to P3.2 billion and the 58.3% uptick in gain on disposal of investment securities at amortized
cost to P2.2 billion. Service charges, fees, and commissions decreased 18.1% to P2.7 billion from lower transaction volume and waiver of some fees during the community quarantine. Also, the decline in sales of foreclosed properties reduced the gain on sale of investment properties by 78.3% to P187.2 million and resulted in a loss on assetforeclosure and dacion transactions amounting to (P22.8) million. Trust fee income managed to increase by P52.8 million or 14.8% with the steady growth in trust assets under management. Share in net income of an associate
dropped P32.2 million to P152.4 million as the profitability of the bancassurance joint venture, MCBLife was impacted by community lockdowns. Miscellaneous income totaled P952.3 million down 20.2% from P1.2 billion due to lower bancassurance fees and other transaction-related revenues.
7777
Operating expenses increased 5.9% to P21.5 billion. Compensation and fringe benefits increased 13.7% to P7.5 billion from the increase in human resource complement and payroll adjustments arising from the 2020 – 2022 collective bargaining agreement between management and the CBC Employees’ Association. Insurance increased 6.6% to P2.0 billion with the higher PDIC premium payments arising from deposit build-up. Repairs and maintenance
dropped by 16.1% to P134.2 million because of lower repairs and construction-related expenses during the community lockdown. Entertainment, amusement and recreation decreased 12.0% to P420.6 million from the drop in marketing- and selling-related expenses, while professional fees, marketing, and other related services increased 30.8% to P539.0 million due to the booking of non-recurring expenses related to the Bank’s centennial celebration in 2020.Miscellaneous expenses increased by 7.6% to P2.5 billion mainly from pandemic-related costs and technology upgrade
Consolidated cost-to-income ratio significantly improved to 49% from 59%.
Analysis of Consolidated Statements of Income
For the period ended December 31, 2019 and December 31, 2018
For 2019, the Bank recorded a net income of P10.1 billion, 24.1% higher than P8.1 billion in 2018 due to higher operating income, resulting in a return on equity of 11.04% and return on assets of 1.10%.
Total interest income climbed 35.4% to P47.7 billion from P35.2 billion with the growth in earning assets. Interestincome from loans and receivables was up 27.9% to P36.1 billion from P28.2 billion on the back of robust year-on- year loan portfolio expansion. Interest income from investment securities at amortized cost and at FVOCI andfinancial assets at FVPL recorded increases at 67.3% and 67.5%, respectively, from the build-up in securities holdings. Furthermore, interest income from due from BSP and other banks and SPURA registered a 53.1% increase to P1.1 billion from P727.3 million with the growth in placements with BSP and other banks.
Total interest expense amounted to P21.6 billion, P9.3 billion or 76.1% higher than last year due to fund build-up. Interest expense on deposit liabilities increased 59.8% to P18.6 billion arising from the deposit expansion. Interest
expense on bonds payable, bills payable and other borrowings was P2.1 billion higher due to volume- related growth including the Bank’s P30-billion Peso retail bond and USD 150-million Green bond. There was a P264.2 million lease payable that the Bank incurred from PFRS-16 related adjustments.
Net Interest income rose 13.6% or P3.1 billion to P26.1 billion. The Bank reported consolidated net interest margin
of 3.39% from last year’s 3.56%.
Provision for impairment and credit losses grew by P2.4 billion to P2.6 billion because of the growth in loan portfolio and of the changes affecting the inputs to the Bank’s expected credit loss calculation models.
Total non-interest income surged 49.0% to P8.4 billion mainly driven by improvements in service charges, fees and commissions, as well as trading and securities gains. Service charges, fees, and commissions increased by 18.7% to P3.3 billion from the upswing in commissions and transactional fee income. Trading opportunities boosted the Bank’sprofitability as trading and securities gain and Gain on disposal of investment securities at amortized cost
jumped to P884.5 million and P1.4 billion, respectively. Lower sales of foreclosed assets resulted in a 14.9% drop in gain on sale of investment properties to P864.4 million and 81.2% decrease in gain on asset foreclosure anddacion transactions to P47.5 million. Trust fee income increased by P51.3 million or 16.8% to reach P357.1 million with the steady growth in trust assets under management. Share in net income of an associate recorded an P83.7 million increase to P184.7 million from P101.0 million because of the improved profitability of the bancassurance joint venture, MCBLife. Miscellaneous income decreased by 5.4% to P1.2 billion with the booking of one-off gains last year.
Meanwhile, the ongoing upgrading of systems, processes, infrastructure, and manpower resulted in the 12.6% increase in operating expenses to P20.3 billion. Nevertheless, the significant year-on-year increase in operating income improved cost-to-income ratio to 59% from last year’s 63%. Compensation and fringe benefits increased 7.9% to P6.6 billion from the growth in manpower complement. Taxes and licenses increased by 32.8% to P3.9 billion from higher documentary stamp, gross receipts, and business volume related taxes. Occupancy costs fell by 22.9% to P1.8
7878
billion due to PFRS-16 related adjustments. Insurance, which includes PDIC premium payments, grew 12.4% to P1.9 billion with the expansion in deposits. Depreciation and amortization recorded an increase of 49.7% due to the capitalization of depreciable Right-of-use Assets upon the implementation of PFRS 16. Repairs and maintenance
increased by 21.8% due to the continued investments in our distribution channel and technology upgrades. Professional fees, marketing, and other related services; entertainment, amusement and recreation; and transportation and traveling likewise rose by 17.0%, 25.7%, 16.9% respectively, with the ramp-up in business development and marketing efforts. Miscellaneous expenses rose by 13.1% to P2.3 billion mainly from increases in information technology-related expenses, litigation and provision for year-end expenses.
Total Comprehensive Income
For the period ended December 31, 2021, 2020, 2019, and 2018
The Bank recorded total comprehensive income of P16.8 billion for 2021, a 48.2% increase from the P11.4 billion recorded last year mainly from the significant net income increase and the booking of gain on cash flow hedge.
Total comprehensive income for 2020, 2019, and 2018 stood at P11.4 billion, P10.7 billion and P7.4 billion respectively, mainly from higher net income and movement in the fair value of financial assets on FVOCI.
7979
(b) Key Performance Indicators
Definition of Ratios
Profitability Ratios:
Return on Assets - Net Income after Income TaxAverage Total Assets
Return on Equity - Net Income after Income TaxAverage Total Equity
Net Interest Margin - Net Interest IncomeAverage Interest Earning Assets
Cost-to-Income Ratio - Operating Expenses excl Provision for Impairment & Credit LossesTotal Operating Income
Liquidity Ratios:
Liquid Assets to Total Assets - Total Liquid Assets Total Assets
Loans to Deposit Ratio - Loans (Net)Deposit Liabilities
Asset Quality Ratios:
Gross Non-Performing Loans - Gross Non-Performing Loans (NPL) Ratio Gross Loans
Gross NPL Cover - Total Allowance for Impairment & Credit Losses on Receivables fromCustomers plus Retained Earnings Appropriated for Gen. Loan Loss Provision.Gross Non-Performing Loans
Solvency Ratios:
Debt to Equity Ratio - Total LiabilitiesTotal Equity
Asset to Equity Ratio - Total AssetsTotal Equity
Interest Coverage Ratio - Net Income before Tax and Interest ExpenseInterest Expense
Capital Adequacy Ratio: BSP prescribed formula:
CET 1/Tier 1 CAR - CET 1 / Tier 1 CapitalTotal Risk Weighted Assets
Total CAR - Total Qualifying CapitalTotal Risk Weighted Assets
8080

Profitability
December 31, 2021 and December 31, 2020
China Bank posted a net income of P15.1 billion, up 25.1% year-on-year, resulting in an improved ROE of 13.58% and ROA of 1.45%. Cost-to-income ratio improved to 46% from 49%. Net interest margin rose to 4.20% from 3.92% mainly from lower cost of funds.
December 31, 2020, 2019 and 2018
Net income of P12.1 billion translated in an ROE of 12.09% and a ROA of 1.21%. Cost-to-income ratio improved to 49% from the 59% in 2019, and 63% in 2018 even as the Bank continued to invest heavily in the needed improvements to provide the best service to customers. Net interest margin was higher at 3.92% from 3.39% in 2019 and 3.56% in 2018.
Liquidity
December 31, 2021 and December 31, 2020
The Bank’s liquidity position was steady at 42%, slightly lower than last year’s 43%.
December 31, 2020, 2019 and 2018
The Bank’s liquidity ratio remained strong at 43%, higher than 37% and 38% recorded in 2019 and 2018, respectively.
2021 2020 2019 2018
PROFITABILITY (in %) Return on Assets 1.45 1.21 1.10 1.04 Return on Equity 13.58 12.09 11.04 9.54 Net Interest Margin 4.20 3.92 3.39 3.56 Cost-to-Income Ratio 46 49 59 63
LIQUIDITY (in %) Liquid Assets to Total Assets 42 43 37 38 Loans to Deposit Ratio 71 67 73 70
ASSET QUALITY (in %) Gross Non-Performing Loans Ratio 2.5 2.3 1.5 1.2 Non-performing Loan (NPL) Cover 116 128 129 167
SOLVENCY RATIOS (in x) Debt-to-Equity Ratio 8.3 8.9 9.0 8.9 Asset-to-Equity Ratio 9.3 9.9 10.0 9.9 Interest Rate Coverage Ratio 3.4 2.0 1.5 1.8
CAPITAL ADEQUACY (in %) CET 1 / Tier 1 14.92 13.82 12.76 12.16 Total CAR 15.75 14.73 13.67 13.09
8181
Asset Quality
December 31, 2021 and December 31, 2020
China Bank recorded a NPL ratio to 2.5%, slightly up from previous year’s 2.3%. Consolidated NPL cover remained
sufficient at 116%, with the Parent’s ratio at 137%.
December 31, 2020, 2019 and 2018
With the expected impact of pandemic and lockdown measures on asset quality, Gross NPL ratio increased to 2.3% from 1.5% in 2019 and 1.2% in 2018. NPL cover was at 128% in December 2020, 129% in 2019, and 167% in 2018.
Solvency Ratios
December 31, 2021 and December 31, 2020
Debt-to-equity and asset-to-equity ratios for the year were recorded at 8.3 and 9.3, respectively. Interest coverage ratio for the period rose to 3.4 as against 2.0 in 2020.
December 31, 2020, 2019 and 2018
Debt-to-equity and asset-to-equity ratios in 2021 was recorded at 8.9 and 9.9, respectively, slightly lower versus 9.0 and 10.0 in 2019 but remained unchanged versus 2018. Interest coverage ratio for the period stood at 2.0, as against 1.5 for 2019, and 1.8 in 2018.
Capitalization
December 31, 2021 and December 31, 2020
China Bank’s CET 1 / Tier 1 Ratio and total CAR ratios were computed at 14.92% and 15.75%, respectively. The Bank’s capital is largely comprised of CET 1 / Tier 1 (core) capital.
December 31, 2020, 2019 and 2018
China Bank’s CET 1 / Tier 1 CAR and total CAR ratios ended at 13.82% and 14.73%, respectively, in 2020; 12.76% and 13.67% in 2019; and 12.16% and 13.09% in 2018, all well above the minimum regulatory requirements.
8282
(c) Past Financial Conditions and Results of Operations
US GDP expanded 5.7% in 2021, its fastest growth rate in nearly four decades, which reflected increases in all major components: personal consumption, investments and exports, as well as the progress in vaccinations, economic reopening and robust policy support. In March 2021, President Biden signed into law a US$1.9-trillion pandemic stimulus which provided, among others, direct cash payments to the American public. This may have triggered the pickup in inflation which ended at 5.8% in December 2021, above the Fed’s 2% target. On the other hand,
unemployment rate improved to 3.9% by year-end vs December 2020’s 6.7%. Federal funds rate target range wasmaintained at 0 to 0.25%, while US Fed’s monthly asset purchases of US$120 billion were tapered in November 2021 in response to a strengthening economy and rising inflation.
The Philippine economy mirrored the developments in the US, also recording an expanded GDP, higher inflation and lower unemployment rate. Domestic economic output rebounded by 5.6% in 2021 driven by higher capital formation spending and increased household consumption resulting from loosened mobility restrictions. To support economic recovery, the government rolled out relief measures, such as the extension of the availability of the 2020 National Budget and funds appropriated through Bayanihan 2, the Corporate Recovery and Tax Incentives for Enterprises (CREATE) Act, the Financial Institutions Strategic Transfer (FIST) Act, Amendments to the Foreign Investments Act and the Retail Trade Liberalization Act. Meanwhile, the BSP kept the policy rate unchanged at 2% considering a manageable inflation environment and emerging market uncertainties.
China Bank finished 2021 stronger than ever before on the back of sustained core business growth and effective cost management. The Bank posted a 25% increase in net income to P15.1 billion, which translated to an improved return on equity and return on assets of 13.6% and 1.5%, respectively. Net interest income was up 13% to P38.3 billion mainly due to prudently managed interest expense which went down 44%. Fee-based income grew 3% to P10.4 billion, underpinned by a 39% increase in core fee-based income such as foreign exchange gain, trust revenues, investment banking commissions, bancassurance fees, and other transaction-based service charges. Growth in operating expenses was controlled at 4% to P22.3 billion, while credit provisioning was steady at P8.9 billion.
Total assets went up 7% to P1.1 trillion, supported by an 18% expansion in investment securities to P279 billion and a 9% expansion in net loans to P609 billion. Gross non-performing loans ratio was lower-than-industry at 2.5%, while NPL cover continues to be adequate at 116%. Deposits increased 3% to P863 billion, which was driven by an 18% build-up in checking and savings accounts (CASA) deposits. In February, the Bank issued P20 billion peso fixed rate bonds, which bears a fixed coupon rate of 2.50% per annum, payable monthly, and is due in 2024. Total equity increased 13% to P119 billion, with a common equity tier 1 (CET1) ratio of 14.9% and total capital adequacy ratio (CAR) of 15.7%, well above the regulatory minimum requirement.
At end-2021, the Bank’s distribution network comprised of 637 branches, 1,037 ATMs, and a suite of alternative banking channels, including phone, internet, and mobile banking. We continued to make the health and wellbeing of our employees and customers the top priority. About 97% of total employees have been fully vaccinated in 2021. Alongside the vaccination program, health and safety measures continue to be strictly implemented in all China Bank branches and offices nationwide.
8383
(d) Future Prospects
Philippine economic activity is expected to further rebound in 2022, supported by the continued momentum in consumption spending, tighter labor market conditions, election-related spending and recovery in the pandemic-hit services sector. Public spending is seen to normalize in efforts to reduce the government’s budget deficit and debt levels which increased during the pandemic. Meanwhile, the conduct and results of the upcoming national elections can either make or break investor confidence in the near term.
Inflation is expected to settle within the BSP’s 2% to 4% target and may face upward pressures from the geopolitical tension between Russia and Ukraine. Although the Philippines has minimal direct links with these two countries, the indirect impact may be felt in two ways: 1) potential higher prices of commodities (e.g. oil, metals, agricultural products) and shipping costs due to closure of airspace; and 2) downside risk to global recovery prospects due to the possible slowdown in countries with heavy economic links with Russia & Ukraine.
We see asynchronous adjustments in monetary policies across central banks. The BSP, on the other hand, is seen to start its monetary policy tightening in the second half of 2022. As a result, the Philippine peso may depreciate against the greenback if other central banks impose bigger and faster increases in policy rates. A wider current account deficit due to higher imports may also contribute to peso depreciation.
Coming out of the last couple of unprecedented years caused by the pandemic and into the next normal, China Bank will continue to pursue business expansion in terms of its core businesses, while future-proofing our growth, especially in the areas of asset quality, digital banking, and environmental, social, and governance (ESG) principles.
The Bank’s growth plans will be supported by the build-up in deposits, as branches ramp up the penetration of corporate and business accounts. The Bank will prioritize the rapid shift into digital, with the goal of extending our digital footprint to as many China Bank products and services as possible in the medium term.
In terms of loans expansion, China Bank will continue to tap opportunities in thriving sectors, while managing exposure to identified vulnerable sectors. Increase in the consumer segment will be deliberate yet focused, even as the economy gradually opens to higher mobility and more consumption activities. Operations-wise, the Bank will further streamline documentation processes and loan application turnaround times, in tandem with the ongoing digitization initiatives. The Savings bank will further strengthen competitiveness in the automatic payroll deduction loans space by establishing multi-channel touchpoints and personalized marketing tools for a broader market capture.
The Bank will make more headways in its digital banking transformation journey in 2022, especially in terms of the growth in digital enrollments, number of active users, and the volume & value of digital transactions. A key breakthrough expected this year is a purely digital onboarding experience which will enable prospective China Bank clients to open an account without having to visit the branch. Another is the integration of our online and mobile banking platforms into a single omni-channel envisioned to deliver a seamless customer experience—from onboarding, to servicing, up to the resolution of client concerns / issues.
We continue to balance our financial growth with a sustainability mindset, progressively adopting sustainable business practices to direct our own corporate performance towards creating value for the environment and our stakeholders. The Bank will pursue the financing of eligible projects under its Sustainable Finance Transition Plan which was institutionalized in 2021, together with the Environmental and Social (E&S) risks framework. On top of this, management will broaden its sustainability awareness trainings on basic ESG principles for employees.
8484

(e) Material Changes
1) Events that will trigger direct or contingent financial obligation that is material to the company, including anydefault or acceleration of an obligation.
There were no events that will trigger direct or contingent financial obligation that is material to the Bank, includingany default or acceleration of an obligation.
2) All material off-balance sheet transactions, arrangements, obligations (including contingent obligations), andother relationships of the company with unconsolidated entities or other persons created during the reportingperiod.
In the normal course of the Bank’s operations, there are various outstanding commitments and contingent liabilitieswhich are not reflected in the accompanying financial statements. Management does not anticipate any materiallosses as a result of these transactions.
The following is a summary of contingencies and commitments of the Bank with the equivalent peso contractualamounts:
Consolidated Parent Company
2021 2020 2021 2020 Trust department accounts P223,398,641 210,776,272 P223,398,641 210,776,272 Committed credit lines 12,765,975 9,551,472 12,765,975 9,551,472 Unused commercial letters of credit 12,971,604 14,445,630 12,877,643 14,338,580 Foreign exchange bought 35,113,101 17,338,436 35,113,101 17,338,436 Foreign exchange sold 22,898,059 15,385,289 22,898,059 15,385,289 Credit card lines 14,320,597 12,492,933 14,320,597 12,492,933 IRS receivable 83,669,379 25,351,615 83,669,379 25,351,615 Outstanding guarantees issued 1,274,727 1,187,256 743,643 899,090 Inward bills for collection 1,229,608 1,862,824 1,229,608 1,862,824 Standby credit commitment 3,565,978 1,652,526 3,565,978 1,652,526 Spot exchange sold 1,653,448 2,113,123 1,653,448 2,113,123 Spot exchange bought 1,347,052 1,920,935 1,347,052 1,920,935 Deficiency claims receivable 281,780 283,842 281,780 283,842 Late deposits/payments received 46,125 342,103 37,805 319,833 Outward bills for collection 18,336 150,073 16,469 148,316 Others 105,768 1,110,325 105,664 1,110,163
3) Any Material Commitments for Capital Expenditure and Expected Funds
Technology upgrades will account for the bulk of the Bank’s capital expenditures for 2022. Capital expenditures willbe funded from internal sources.
8585

UNDERTAKING
The Bank undertakes to furnish printed copies of its Information Statement (SEC Form 20-IS) and Annual Report (SEC Form 17-A) for the year ended December 31, 2021, without charge, upon the written request of the stockholder entitled to notice and vote at the meeting. Any such written request should be addressed to the Office of the Corporate Secretary of China Banking Corporation, 11th Floor China Bank Building, 8745 Paseo de Roxas cor. Villar St., Makati City.
8686
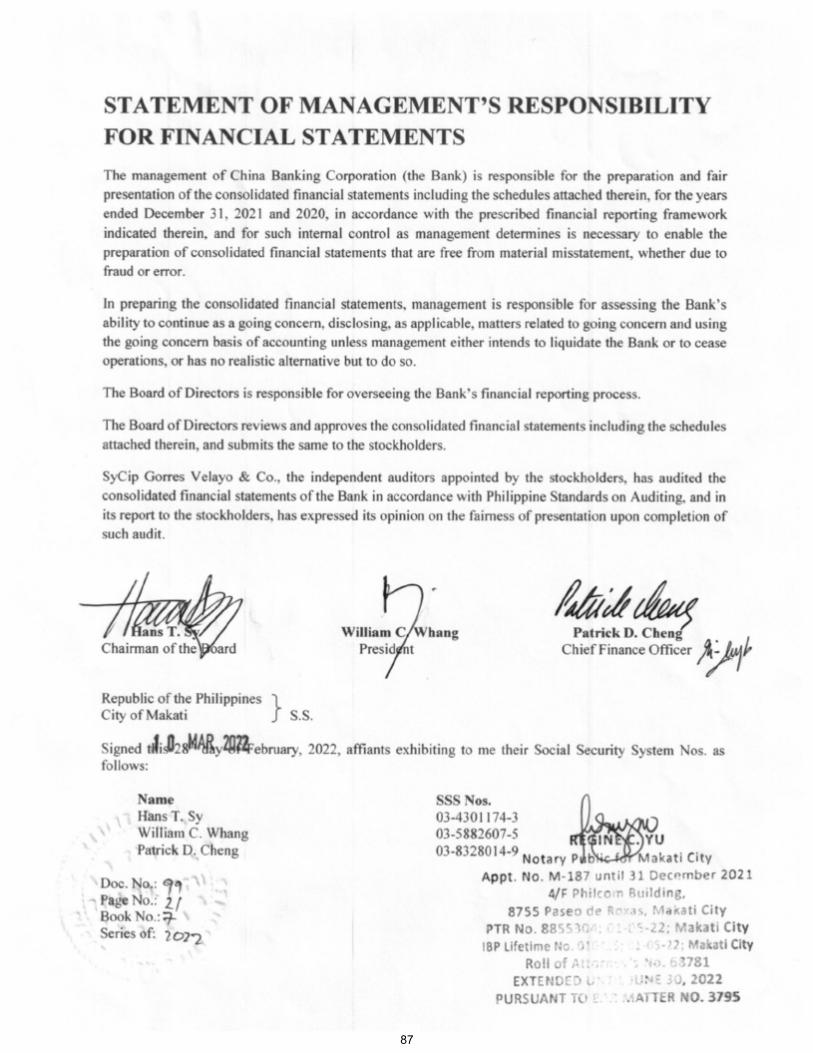
8787

*SGVFS162381*
C O V E R S H E E Tfor
AUDITED FINANCIAL STATEMENTS
SEC Registration Number
4 4 3
C O M P A N Y N A M E
C H I N A B A N K I N G C O R P O R A T I O N A N D
S U B S I D I A R I E S
PRINCIPAL OFFICE ( No. / Street / Barangay / City / Town / Province )
8 7 4 5 P a s e o d e R o x a s c o r . V i l l a
r S t . , M a k a t i C i t y
Form Type Department requiring the reportSecondary License Type, If
Applicable
A A F S S E C N / A
C O M P A N Y I N F O R M A T I O N
Company’s Email Address Company’s Telephone Number Mobile Number
https://www.chinabank.ph 8885-5555 N.A
No. of Stockholders Annual Meeting (Month / Day) Fiscal Year (Month / Day)
1,881 05/05 12/31
CONTACT PERSON INFORMATION
The designated contact person MUST be an Officer of the Corporation
Name of Contact Person Email Address Telephone Number/s Mobile Number
Patrick D. Cheng [email protected] 8885-5022
CONTACT PERSON’s ADDRESS
8745 Paseo de Roxas cor. Villar St., Makati City
NOTE 1 : In case of death, resignation or cessation of office of the officer designated as contact person, such incident shall be reported to the Commission withinthirty (30) calendar days from the occurrence thereof with information and complete contact details of the new contact person designated.
2 : All Boxes must be properly and completely filled-up. Failure to do so shall cause the delay in updating the corporation’s records with the Commissionand/or non-receipt of Notice of Deficiencies. Further, non-receipt of Notice of Deficiencies shall not excuse the corporation from liability for its deficiencies.
88
*SGVFS162381*
INDEPENDENT AUDITOR’S REPORT
The Board of Directors and StockholdersChina Banking Corporation8745 Paseo de Roxas cor. Villar St.Makati City
Report on the Consolidated and Parent Company Financial Statements
Opinion
We have audited the consolidated financial statements of China Banking Corporation and its subsidiaries(the Group) and the parent company financial statements of China Banking Corporation, which comprisethe consolidated and parent company balance sheets as at December 31, 2021 and 2020, and theconsolidated and parent company statements of income, consolidated and parent company statements ofcomprehensive income, consolidated and parent company statements of changes in equity andconsolidated and parent company statements of cash flows for each of the three years in the period endedDecember 31, 2021, and notes to the consolidated and parent company financial statements, including asummary of significant accounting policies.
In our opinion, the accompanying consolidated and parent company financial statements present fairly, inall material respects, the financial position of the Group and the Parent Company as atDecember 31, 2021 and 2020, and their financial performance and their cash flows for each of the threeyears in the period ended December 31, 2021 in accordance with Philippine Financial ReportingStandards (PFRSs).
Basis for Opinion
We conducted our audits in accordance with Philippine Standards on Auditing (PSAs). Ourresponsibilities under those standards are further described in the Auditor’s Responsibilities for the Auditof the Consolidated and Parent Company Financial Statements section of our report. We are independentof the Group and the Parent Company in accordance with the Code of Ethics for ProfessionalAccountants in the Philippines (Code of Ethics) together with the ethical requirements that are relevant toour audit of the consolidated and parent company financial statements in the Philippines, and we havefulfilled our other ethical responsibilities in accordance with these requirements and the Code of Ethics.We believe that the audit evidence we have obtained is sufficient and appropriate to provide a basis forour opinion.
Key Audit Matters
Key audit matters are those matters that, in our professional judgment, were of most significance in ouraudit of the consolidated and parent company financial statements of the current period. These matterswere addressed in the context of our audit of the consolidated and parent company financial statements asa whole, and in forming our opinion thereon, and we do not provide a separate opinion on these matters.For each matter below, our description of how our audit addressed the matter is provided in that context.
SyCip Gorres Velayo & Co.6760 Ayala Avenue1226 Makati CityPhilippines
Tel: (632) 8891 0307Fax: (632) 8819 0872ey.com/ph
A member firm of Ernst & Young Global Limited
89
*SGVFS162381*
- 2 -
We have fulfilled the responsibilities described in the Auditor’s Responsibilities for the Audit of theConsolidated and Parent Company Financial Statements section of our report, including in relation tothese matters. Accordingly, our audit included the performance of procedures designed to respond to ourassessment of the risks of material misstatement of the consolidated and parent company financialstatements. The results of our audit procedures, including the procedures performed to address thematters below, provide the basis for our audit opinion on the accompanying consolidated and parentcompany financial statements.
Applicable to the audit of the Consolidated and Parent Company Financial Statements
Adequacy of allowance for credit losses
The Group’s and the Parent Company’s application of the expected credit loss (ECL) model in calculatingthe allowance for credit losses on loans and receivables is significant to our audit as it involves theexercise of significant management judgment. Key areas of judgment include: segmenting the Group’sand the Parent Company’s credit risk exposures; determining the method to estimate ECL; definingdefault; identifying exposures with significant deterioration in credit quality, taking into accountextension of payment terms and payment holidays provided as a result of the coronavirus pandemic;determining assumptions to be used in the ECL model such as the counterparty credit risk rating, theexpected life of the financial asset, expected recoveries from defaulted accounts, and impact of anyfinancial support and credit enhancements extended by any party; and incorporating forward-lookinginformation, including the impact of the coronavirus pandemic, in calculating ECL.
Allowance for credit losses for loans and receivables as of December 31, 2021 for the Group and theParent Company amounted to P=15.06 billion and P=12.49 billion, respectively. Provision for credit lossesof the Group and the Parent Company in 2021 amounted to P=8.88 billion and P=7.68 billion, respectively.
Refer to Notes 3 and 16 of the financial statements for the disclosure on the details of the allowance forcredit losses using the ECL model.
Audit Response
We obtained an understanding of the board approved methodologies and models used for the Group’s andthe Parent Company’s different credit exposures and assessed whether these considered the requirementsof PFRS 9, Financial Instruments to reflect an unbiased and probability-weighted outcome, and toconsider time value of money and the best available forward-looking information.
We (a) assessed the Group’s and the Parent Company’s segmentation of its credit risk exposures based onhomogeneity of credit risk characteristics; (b) tested the definition of default and significant increase incredit risk criteria against historical analysis of accounts, credit risk management policies and practices inplace, and management’s assessment of the impact of the coronavirus pandemic on the counterparties;(c) tested the Group’s and the Parent Company’s application of internal credit risk rating system,including the impact of the coronavirus pandemic on the borrowers, by reviewing the ratings of samplecredit exposures; (d) assessed whether expected life is different from the contractual life by testing thematurity dates reflected in the Group’s and the Parent Company’s records and considering management’sassumptions regarding future collections, advances, extensions, renewals and modifications; (e) testedloss given default by inspecting historical recoveries and related costs, write-offs and collateralvaluations, and the effects of any financial support and credit enhancements provided by any party; (f)tested exposure at default considering outstanding commitments and repayment scheme; (g) evaluated the
A member firm of Ernst & Young Global Limited
90
*SGVFS162381*
- 3 -
forward-looking information used for overlay through corroboration of publicly available information andour understanding of the Group’s and the Parent Company’s lending portfolios and broader industryknowledge, including the impact of the coronavirus pandemic; and (h) tested the effective interest rateused in discounting the expected loss.
Further, we compared the data used in the ECL models from source system reports to the data warehouseand from the data warehouse to the loss allowance analysis/models and financial reporting systems. Tothe extent that the loss allowance analysis is based on credit exposures that have been disaggregated intosubsets of debt financial assets with similar risk characteristics, we traced or re-performed thedisaggregation from source systems to the loss allowance analysis. We also assessed the assumptionsused where there are missing or insufficient data.
We involved our internal specialist in the performance of the above procedures. We recalculatedimpairment provisions on a sample basis.
Accounting for disposals of investment securities under a hold-to-collect business model
In 2021, the Parent Company disposed investment securities managed under the hold-to-collect (HTC)business model with aggregate carrying amount of P=55.77 billion. The disposals resulted in a gain ofP=4.06 billion. Investment securities held under a hold-to-collect business model, which are classified as‘Investment securities at amortized cost’, are managed to realize cash flows by collecting contractualpayments over the life of the instrument.
The accounting for the disposals is significant to our audit because the amounts involved are material(23.01% and 23.60% of the total investment securities at amortized cost of the Group and the ParentCompany, respectively). Moreover, it involves the exercise of significant judgment by management inassessing whether the disposals are consistent with the HTC business model and that it would not impactthe measurement of the remaining securities in the affected portfolios.
The disclosures related to the disposals of investment securities are included in Notes 3 and 9 to thefinancial statements.
Audit response
We obtained an understanding of the Parent Company’s objectives for disposals of investment securitiesat amortized cost through inquiries with management and review of approved internal documentations,including governance over the disposals. We evaluated management’s assessment of the impact of thedisposals in reference to the Parent Company’s business models and the provisions of the relevantaccounting standards and regulatory issuances. We recalculated the gains on the disposals and themeasurement of the remaining securities in the affected portfolios.
We reviewed the disclosures related to the disposals based on the requirements of PFRS 7, FinancialInstruments: Disclosures, PFRS 9 and Philippine Accounting Standard (PAS 1), Presentation ofFinancial Statements.
A member firm of Ernst & Young Global Limited
91
*SGVFS162381*
- 4 -
Impairment testing of goodwill and branch licenses with indefinite useful life
Under PFRS, the Group and the Parent Company are required to perform annual impairment test ofgoodwill and branch licenses with indefinite useful life. As of December 31, 2021, the goodwillrecognized in the consolidated and parent company financial statements amounting to P=222.84 million isattributed to the Parent Company’s Retail Banking Business (RBB) segment, while goodwill ofP=616.91 million in the consolidated financial statements is attributed to the subsidiary bank, China BankSavings, Inc. (CBSI). In addition, the respective branches are identified as the cash-generating units(CGUs) for purposes of impairment testing of branch licenses. The Group and the Parent Companyperformed the impairment testing using the CGUs’ value-in-use.
Management’s assessment process requires significant judgment and is based on assumptions which aresubject to higher level of estimation uncertainty due to the current economic conditions which have beenimpacted by the coronavirus pandemic, specifically loan and deposit growth rates, discount rate and thelong-term growth rate. Hence, the annual impairment test is significant to our audit.
The Group’s disclosures about goodwill and branch licenses are included in Notes 3 and 14 to thefinancial statements.
Audit Response
We evaluated the methodologies used and the management’s assumptions by comparing the keyassumptions used, such as loan and deposit growth and long-term growth rates against the historicalperformance of the branches, RBB and CBSI, industry/market outlook and other relevant external data,taking into consideration the impact associated with the coronavirus pandemic. We tested the parametersused in the determination of the discount rate against market data. We also reviewed the Group’sdisclosures about those assumptions to which the outcome of the impairment test is most sensitive;specifically those that have the most significant effect on the determination of the recoverable amount ofgoodwill and branch licenses.
Recoverability of deferred tax assets
As of December 31, 2021, the deferred tax assets of the Group and the Parent Company amounted toP=4.62 billion and P=3.41 billion. The recognition of deferred tax assets is significant to our audit becauseit requires significant judgment and is based on assumptions such as availability of future taxable incomeand the timing of the reversal of the temporary differences that are affected by expected future market oreconomic conditions and the expected performance of the Group. The estimation uncertainty on theGroup’s and the Parent Company’s expected performance has increased as a result of the uncertaintiesbrought about by the coronavirus pandemic.
The disclosures in relation to deferred income taxes are included in Notes 3 and 28 to the financialstatements.
A member firm of Ernst & Young Global Limited
92
*SGVFS162381*
- 5 -
Audit Response
We involved our internal specialist in interpreting the tax regulations, testing the temporary differencesidentified by the Group and the Parent Company, and the applicable tax rate. We also re-performed thecalculation of the deferred tax assets. We evaluated the management’s assessment on the availability offuture taxable income in reference to financial forecast and tax strategies. We evaluated management’sforecast by comparing the loan portfolio and deposit growth rates to the historical performance of theGroup and the industry, including future market circumstances and taking into consideration the impactassociated with the coronavirus pandemic. We also assessed the timing of the reversal of future taxableand deductible temporary differences.
Other Information
Management is responsible for the other information. The other information comprises the informationincluded in the SEC Form 20-IS (Definitive Information Statement), SEC Form 17-A and Annual Reportfor the year ended December 31, 2021, but does not include the consolidated and parent companyfinancial statements and our auditor’s report thereon. The SEC Form 20-IS (Definitive InformationStatement), SEC Form 17-A and Annual Report for the year ended December 31, 2021 are expected to bemade available to us after the date of this auditor’s report.
Our opinion on the consolidated and parent company financial statements does not cover the otherinformation and we will not express any form of assurance conclusion thereon.
In connection with our audits of the consolidated and parent company financial statements, ourresponsibility is to read the other information identified above when it becomes available and, in doingso, consider whether the other information is materially inconsistent with the consolidated and parentcompany financial statements or our knowledge obtained in the audits, or otherwise appears to bematerially misstated.
Responsibilities of Management and Those Charged with Governance for the Consolidated andParent Company Financial Statements
Management is responsible for the preparation and fair presentation of the consolidated and parentcompany financial statements in accordance with PFRSs, and for such internal control as managementdetermines is necessary to enable the preparation of consolidated and parent company financialstatements that are free from material misstatement, whether due to fraud or error.
In preparing the consolidated and parent company financial statements, management is responsible forassessing the Group’s and Parent Company’s ability to continue as a going concern, disclosing, asapplicable, matters related to going concern and using the going concern basis of accounting unlessmanagement either intends to liquidate the Group and the Parent Company or to cease operations, or hasno realistic alternative but to do so.
Those charged with governance are responsible for overseeing the Group’s and Parent Company’sfinancial reporting process.
A member firm of Ernst & Young Global Limited
93
*SGVFS162381*
- 6 -
Auditor’s Responsibilities for the Audit of the Consolidated and Parent Company FinancialStatements
Our objectives are to obtain reasonable assurance about whether the consolidated and parent companyfinancial statements as a whole are free from material misstatement, whether due to fraud or error, and toissue an auditor’s report that includes our opinion. Reasonable assurance is a high level of assurance, butis not a guarantee that an audit conducted in accordance with PSAs will always detect a materialmisstatement when it exists. Misstatements can arise from fraud or error and are considered material if,individually or in the aggregate, they could reasonably be expected to influence the economic decisions ofusers taken on the basis of these consolidated and parent company financial statements.
As part of an audit in accordance with PSAs, we exercise professional judgment and maintainprofessional skepticism throughout the audit. We also:
Identify and assess the risks of material misstatement of the consolidated and parent companyfinancial statements, whether due to fraud or error, design and perform audit procedures responsive tothose risks, and obtain audit evidence that is sufficient and appropriate to provide a basis for ouropinion. The risk of not detecting a material misstatement resulting from fraud is higher than for oneresulting from error, as fraud may involve collusion, forgery, intentional omissions,misrepresentations, or the override of internal control.
Obtain an understanding of internal control relevant to the audit in order to design audit proceduresthat are appropriate in the circumstances, but not for the purpose of expressing an opinion on theeffectiveness of the Group’s and Parent Company’s internal control.
Evaluate the appropriateness of accounting policies used and the reasonableness of accountingestimates and related disclosures made by management.
Conclude on the appropriateness of management’s use of the going concern basis of accounting and,based on the audit evidence obtained, whether a material uncertainty exists related to events orconditions that may cast significant doubt on the Group’s and Parent Company’s ability to continueas a going concern. If we conclude that a material uncertainty exists, we are required to drawattention in our auditor’s report to the related disclosures in the consolidated and parent companyfinancial statements or, if such disclosures are inadequate, to modify our opinion. Our conclusionsare based on the audit evidence obtained up to the date of our auditor’s report. However, futureevents or conditions may cause the Group and the Parent Company to cease to continue as a goingconcern.
Evaluate the overall presentation, structure and content of the consolidated and parent companyfinancial statements, including the disclosures, and whether the consolidated and parent companyfinancial statements represent the underlying transactions and events in a manner that achieves fairpresentation.
Obtain sufficient appropriate audit evidence regarding the financial information of the entities orbusiness activities within the Group to express an opinion on the consolidated financial statements.We are responsible for the direction, supervision and performance of the audit. We remain solelyresponsible for our audit opinion.
We communicate with those charged with governance regarding, among other matters, the planned scopeand timing of the audit and significant audit findings, including any significant deficiencies in internalcontrol that we identify during our audit.
A member firm of Ernst & Young Global Limited
94
*SGVFS162381*
- 7 -
We also provide those charged with governance with a statement that we have complied with relevantethical requirements regarding independence, and to communicate with them all relationships and othermatters that may reasonably be thought to bear on our independence, and where applicable, relatedsafeguards.
From the matters communicated with those charged with governance, we determine those matters thatwere of most significance in the audit of the consolidated and parent company financial statements of thecurrent period and are therefore the key audit matters. We describe these matters in our auditor’s reportunless law or regulation precludes public disclosure about the matter or when, in extremely rarecircumstances, we determine that a matter should not be communicated in our report because the adverseconsequences of doing so would reasonably be expected to outweigh the public interest benefits of suchcommunication.
Report on the Supplementary Information Required Under Bangko Sentral ng Pilipinas (BSP)Circular No. 1074 and Revenue Regulations 15-2010
Our audits were conducted for the purpose of forming an opinion on the basic financial statements takenas a whole. The supplementary information required under BSP Circular No. 1074 in Note 38 andRevenue Regulations 15-2010 in Note 39 to the financial statements is presented for purposes of filingwith the BSP and Bureau of Internal Revenue, respectively, and is not a required part of the basicfinancial statements. Such information is the responsibility of the management of China BankingCorporation. The information has been subjected to the auditing procedures applied in our audit of thebasic financial statements. In our opinion, the information is fairly stated, in all material respects, inrelation to the basic financial statements taken as a whole.
The engagement partner on the audit resulting in this independent auditor’s report is Janet A. Paraiso.
SYCIP GORRES VELAYO & CO.
Janet A. ParaisoPartnerCPA Certificate No. 92305Tax Identification No. 193-975-241BOA/PRC Reg. No. 0001, August 25, 2021, valid until April 15, 2024SEC Partner Accreditation No. 92305-SEC (Group A)
Valid to cover audit of 2021 to 2025 financial statements of SEC covered institutionsSEC Firm Accreditation No. 0001-SEC (Group A)
Valid to cover audit of 2021 to 2025 financial statements of SEC covered institutionsBIR Accreditation No. 08-001998-062-2020, December 3, 2020, valid until December 2, 2023PTR No. 8853462, January 3, 2022, Makati City
February 28, 2022
A member firm of Ernst & Young Global Limited
95
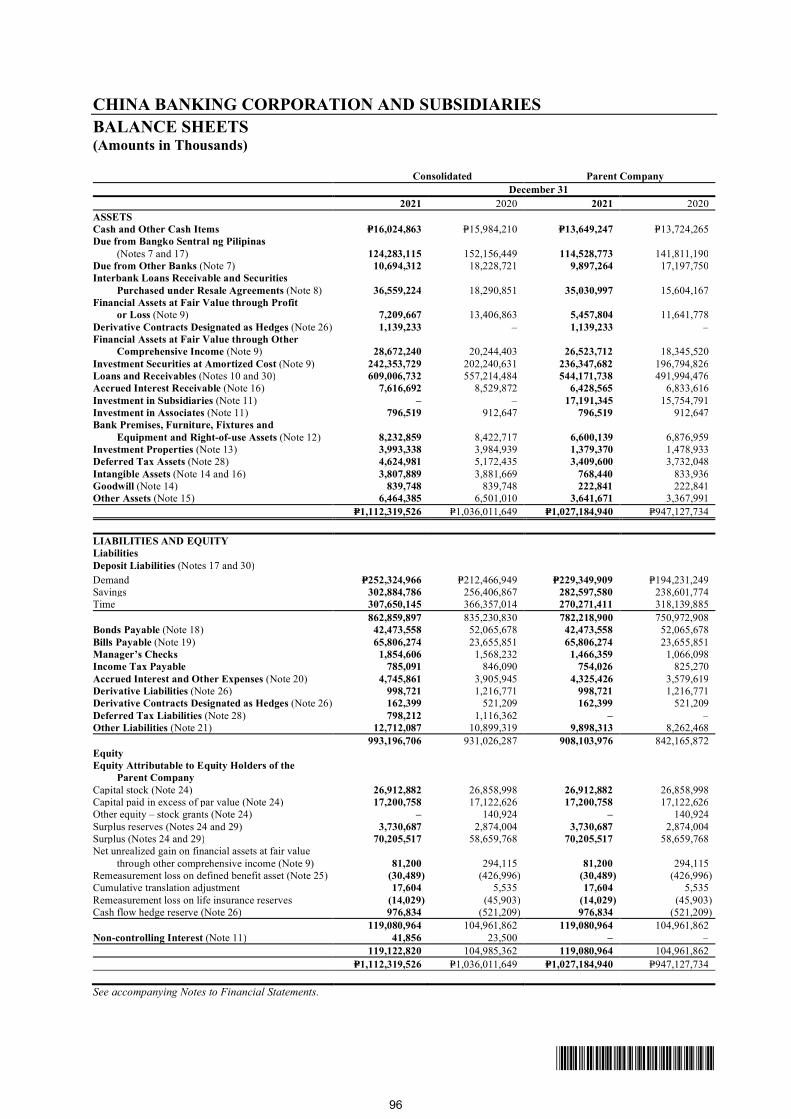
*SGVFS162381*
CHINA BANKING CORPORATION AND SUBSIDIARIESBALANCE SHEETS(Amounts in Thousands)
Consolidated Parent CompanyDecember 31
2021 2020 2021 2020ASSETSCash and Other Cash Items P=16,024,863 P=15,984,210 P=13,649,247 P=13,724,265Due from Bangko Sentral ng Pilipinas
(Notes 7 and 17) 124,283,115 152,156,449 114,528,773 141,811,190Due from Other Banks (Note 7) 10,694,312 18,228,721 9,897,264 17,197,750Interbank Loans Receivable and Securities
Purchased under Resale Agreements (Note 8) 36,559,224 18,290,851 35,030,997 15,604,167Financial Assets at Fair Value through Profit
or Loss (Note 9) 7,209,667 13,406,863 5,457,804 11,641,778Derivative Contracts Designated as Hedges (Note 26) 1,139,233 – 1,139,233 –Financial Assets at Fair Value through Other
Comprehensive Income (Note 9) 28,672,240 20,244,403 26,523,712 18,345,520Investment Securities at Amortized Cost (Note 9) 242,353,729 202,240,631 236,347,682 196,794,826Loans and Receivables (Notes 10 and 30) 609,006,732 557,214,484 544,171,738 491,994,476Accrued Interest Receivable (Note 16) 7,616,692 8,529,872 6,428,565 6,833,616Investment in Subsidiaries (Note 11) – – 17,191,345 15,754,791Investment in Associates (Note 11) 796,519 912,647 796,519 912,647Bank Premises, Furniture, Fixtures and
Equipment and Right-of-use Assets (Note 12) 8,232,859 8,422,717 6,600,139 6,876,959Investment Properties (Note 13) 3,993,338 3,984,939 1,379,370 1,478,933Deferred Tax Assets (Note 28) 4,624,981 5,172,435 3,409,600 3,732,048Intangible Assets (Note 14 and 16) 3,807,889 3,881,669 768,440 833,936Goodwill (Note 14) 839,748 839,748 222,841 222,841Other Assets (Note 15) 6,464,385 6,501,010 3,641,671 3,367,991
P=1,112,319,526 P=1,036,011,649 P=1,027,184,940 P=947,127,734
LIABILITIES AND EQUITYLiabilitiesDeposit Liabilities (Notes 17 and 30)Demand P=252,324,966 P=212,466,949 P=229,349,909 P=194,231,249Savings 302,884,786 256,406,867 282,597,580 238,601,774Time 307,650,145 366,357,014 270,271,411 318,139,885
862,859,897 835,230,830 782,218,900 750,972,908Bonds Payable (Note 18) 42,473,558 52,065,678 42,473,558 52,065,678Bills Payable (Note 19) 65,806,274 23,655,851 65,806,274 23,655,851Manager’s Checks 1,854,606 1,568,232 1,466,359 1,066,098Income Tax Payable 785,091 846,090 754,026 825,270Accrued Interest and Other Expenses (Note 20) 4,745,861 3,905,945 4,325,426 3,579,619Derivative Liabilities (Note 26) 998,721 1,216,771 998,721 1,216,771Derivative Contracts Designated as Hedges (Note 26) 162,399 521,209 162,399 521,209Deferred Tax Liabilities (Note 28) 798,212 1,116,362 – –Other Liabilities (Note 21) 12,712,087 10,899,319 9,898,313 8,262,468
993,196,706 931,026,287 908,103,976 842,165,872EquityEquity Attributable to Equity Holders of the
Parent CompanyCapital stock (Note 24) 26,912,882 26,858,998 26,912,882 26,858,998Capital paid in excess of par value (Note 24) 17,200,758 17,122,626 17,200,758 17,122,626Other equity – stock grants (Note 24) – 140,924 – 140,924Surplus reserves (Notes 24 and 29) 3,730,687 2,874,004 3,730,687 2,874,004Surplus (Notes 24 and 29) 70,205,517 58,659,768 70,205,517 58,659,768Net unrealized gain on financial assets at fair value
through other comprehensive income (Note 9) 81,200 294,115 81,200 294,115Remeasurement loss on defined benefit asset (Note 25) (30,489) (426,996) (30,489) (426,996)Cumulative translation adjustment 17,604 5,535 17,604 5,535Remeasurement loss on life insurance reserves (14,029) (45,903) (14,029) (45,903)Cash flow hedge reserve (Note 26) 976,834 (521,209) 976,834 (521,209)
119,080,964 104,961,862 119,080,964 104,961,862Non-controlling Interest (Note 11) 41,856 23,500 – –
119,122,820 104,985,362 119,080,964 104,961,862P=1,112,319,526 P=1,036,011,649 P=1,027,184,940 P=947,127,734
See accompanying Notes to Financial Statements.
96
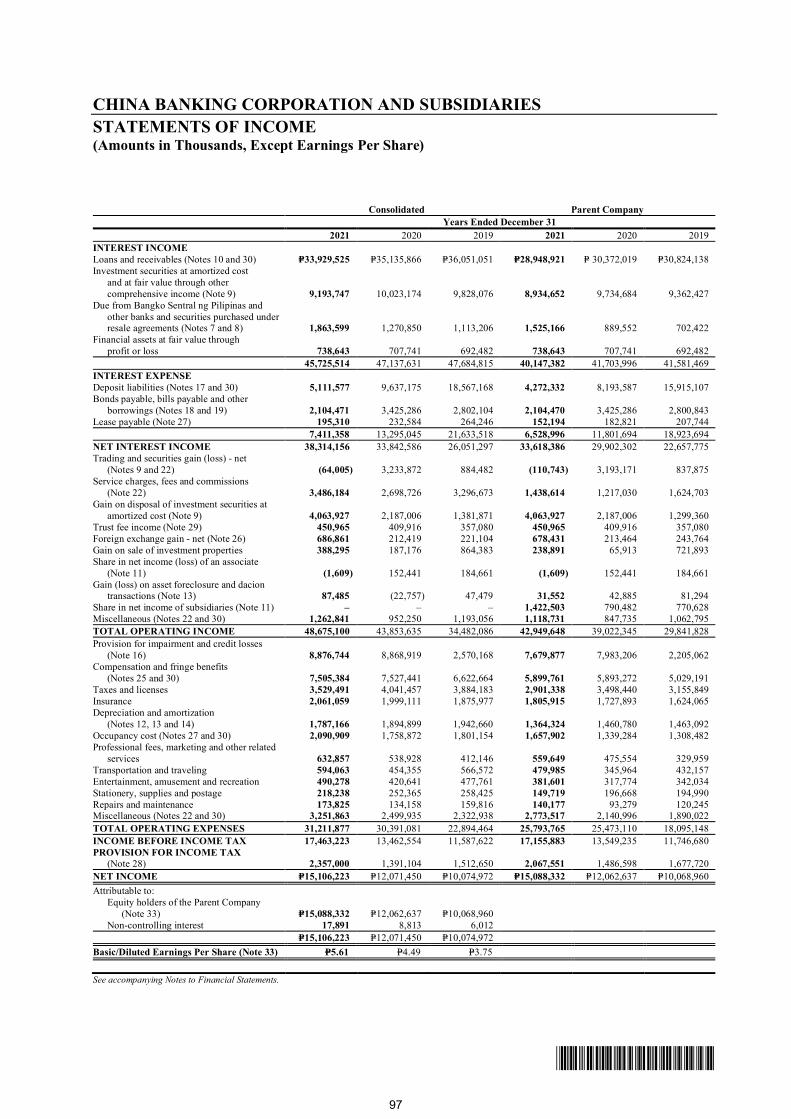
*SGVFS162381*
CHINA BANKING CORPORATION AND SUBSIDIARIESSTATEMENTS OF INCOME(Amounts in Thousands, Except Earnings Per Share)
Consolidated Parent CompanyYears Ended December 31
2021 2020 2019 2021 2020 2019INTEREST INCOMELoans and receivables (Notes 10 and 30) P=33,929,525 P=35,135,866 P=36,051,051 P=28,948,921 P= 30,372,019 P=30,824,138Investment securities at amortized cost
and at fair value through othercomprehensive income (Note 9) 9,193,747 10,023,174 9,828,076 8,934,652 9,734,684 9,362,427
Due from Bangko Sentral ng Pilipinas andother banks and securities purchased underresale agreements (Notes 7 and 8) 1,863,599 1,270,850 1,113,206 1,525,166 889,552 702,422
Financial assets at fair value throughprofit or loss 738,643 707,741 692,482 738,643 707,741 692,482
45,725,514 47,137,631 47,684,815 40,147,382 41,703,996 41,581,469INTEREST EXPENSEDeposit liabilities (Notes 17 and 30) 5,111,577 9,637,175 18,567,168 4,272,332 8,193,587 15,915,107Bonds payable, bills payable and other
borrowings (Notes 18 and 19) 2,104,471 3,425,286 2,802,104 2,104,470 3,425,286 2,800,843Lease payable (Note 27) 195,310 232,584 264,246 152,194 182,821 207,744
7,411,358 13,295,045 21,633,518 6,528,996 11,801,694 18,923,694NET INTEREST INCOME 38,314,156 33,842,586 26,051,297 33,618,386 29,902,302 22,657,775Trading and securities gain (loss) - net
(Notes 9 and 22) (64,005) 3,233,872 884,482 (110,743) 3,193,171 837,875Service charges, fees and commissions
(Note 22) 3,486,184 2,698,726 3,296,673 1,438,614 1,217,030 1,624,703Gain on disposal of investment securities at
amortized cost (Note 9) 4,063,927 2,187,006 1,381,871 4,063,927 2,187,006 1,299,360Trust fee income (Note 29) 450,965 409,916 357,080 450,965 409,916 357,080Foreign exchange gain - net (Note 26) 686,861 212,419 221,104 678,431 213,464 243,764Gain on sale of investment properties 388,295 187,176 864,383 238,891 65,913 721,893Share in net income (loss) of an associate
(Note 11) (1,609) 152,441 184,661 (1,609) 152,441 184,661Gain (loss) on asset foreclosure and dacion
transactions (Note 13) 87,485 (22,757) 47,479 31,552 42,885 81,294Share in net income of subsidiaries (Note 11) – – – 1,422,503 790,482 770,628Miscellaneous (Notes 22 and 30) 1,262,841 952,250 1,193,056 1,118,731 847,735 1,062,795TOTAL OPERATING INCOME 48,675,100 43,853,635 34,482,086 42,949,648 39,022,345 29,841,828Provision for impairment and credit losses
(Note 16) 8,876,744 8,868,919 2,570,168 7,679,877 7,983,206 2,205,062Compensation and fringe benefits
(Notes 25 and 30) 7,505,384 7,527,441 6,622,664 5,899,761 5,893,272 5,029,191Taxes and licenses 3,529,491 4,041,457 3,884,183 2,901,338 3,498,440 3,155,849Insurance 2,061,059 1,999,111 1,875,977 1,805,915 1,727,893 1,624,065Depreciation and amortization
(Notes 12, 13 and 14) 1,787,166 1,894,899 1,942,660 1,364,324 1,460,780 1,463,092Occupancy cost (Notes 27 and 30) 2,090,909 1,758,872 1,801,154 1,657,902 1,339,284 1,308,482Professional fees, marketing and other related
services 632,857 538,928 412,146 559,649 475,554 329,959Transportation and traveling 594,063 454,355 566,572 479,985 345,964 432,157Entertainment, amusement and recreation 490,278 420,641 477,761 381,601 317,774 342,034Stationery, supplies and postage 218,238 252,365 258,425 149,719 196,668 194,990Repairs and maintenance 173,825 134,158 159,816 140,177 93,279 120,245Miscellaneous (Notes 22 and 30) 3,251,863 2,499,935 2,322,938 2,773,517 2,140,996 1,890,022TOTAL OPERATING EXPENSES 31,211,877 30,391,081 22,894,464 25,793,765 25,473,110 18,095,148INCOME BEFORE INCOME TAX 17,463,223 13,462,554 11,587,622 17,155,883 13,549,235 11,746,680PROVISION FOR INCOME TAX
(Note 28) 2,357,000 1,391,104 1,512,650 2,067,551 1,486,598 1,677,720NET INCOME P=15,106,223 P=12,071,450 P=10,074,972 P=15,088,332 P=12,062,637 P=10,068,960Attributable to:
Equity holders of the Parent Company(Note 33) P=15,088,332 P=12,062,637 P=10,068,960
Non-controlling interest 17,891 8,813 6,012P=15,106,223 P=12,071,450 P=10,074,972
Basic/Diluted Earnings Per Share (Note 33) P=5.61 P=4.49 P=3.75
See accompanying Notes to Financial Statements.
97
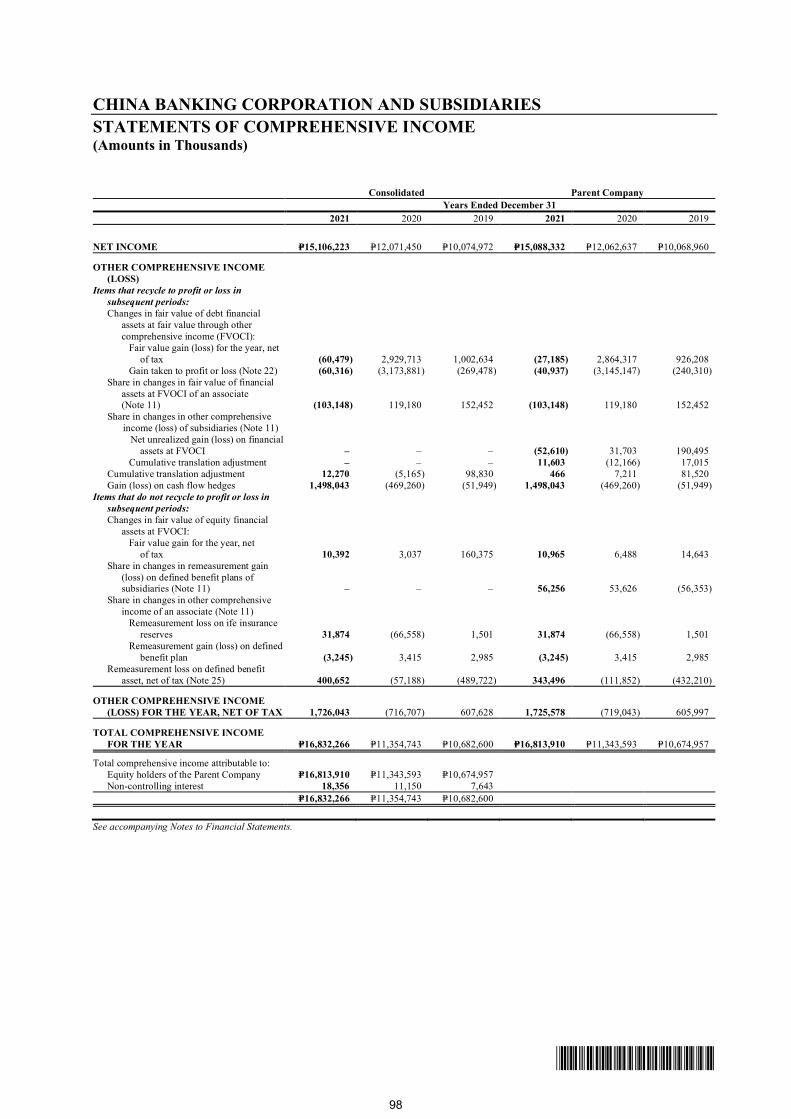
*SGVFS162381*
CHINA BANKING CORPORATION AND SUBSIDIARIESSTATEMENTS OF COMPREHENSIVE INCOME(Amounts in Thousands)
Consolidated Parent CompanyYears Ended December 31
2021 2020 2019 2021 2020 2019
NET INCOME P=15,106,223 P=12,071,450 P=10,074,972 P=15,088,332 P=12,062,637 P=10,068,960
OTHER COMPREHENSIVE INCOME(LOSS)
Items that recycle to profit or loss insubsequent periods:Changes in fair value of debt financial
assets at fair value through othercomprehensive income (FVOCI):
Fair value gain (loss) for the year, netof tax (60,479) 2,929,713 1,002,634 (27,185) 2,864,317 926,208
Gain taken to profit or loss (Note 22) (60,316) (3,173,881) (269,478) (40,937) (3,145,147) (240,310)Share in changes in fair value of financial
assets at FVOCI of an associate(Note 11) (103,148) 119,180 152,452 (103,148) 119,180 152,452
Share in changes in other comprehensiveincome (loss) of subsidiaries (Note 11)
Net unrealized gain (loss) on financial assets at FVOCI – – – (52,610) 31,703 190,495Cumulative translation adjustment – – – 11,603 (12,166) 17,015
Cumulative translation adjustment 12,270 (5,165) 98,830 466 7,211 81,520 Gain (loss) on cash flow hedges 1,498,043 (469,260) (51,949) 1,498,043 (469,260) (51,949)Items that do not recycle to profit or loss in
subsequent periods:Changes in fair value of equity financial
assets at FVOCI:Fair value gain for the year, net of tax 10,392 3,037 160,375 10,965 6,488 14,643
Share in changes in remeasurement gain(loss) on defined benefit plans ofsubsidiaries (Note 11) – – – 56,256 53,626 (56,353)
Share in changes in other comprehensiveincome of an associate (Note 11)
Remeasurement loss on ife insurancereserves 31,874 (66,558) 1,501 31,874 (66,558) 1,501
Remeasurement gain (loss) on defined benefit plan (3,245) 3,415 2,985 (3,245) 3,415 2,985
Remeasurement loss on defined benefitasset, net of tax (Note 25) 400,652 (57,188) (489,722) 343,496 (111,852) (432,210)
OTHER COMPREHENSIVE INCOME(LOSS) FOR THE YEAR, NET OF TAX 1,726,043 (716,707) 607,628 1,725,578 (719,043) 605,997
TOTAL COMPREHENSIVE INCOMEFOR THE YEAR P=16,832,266 P=11,354,743 P=10,682,600 P=16,813,910 P=11,343,593 P=10,674,957
Total comprehensive income attributable to:Equity holders of the Parent Company P=16,813,910 P=11,343,593 P=10,674,957Non-controlling interest 18,356 11,150 7,643
P=16,832,266 P=11,354,743 P=10,682,600
See accompanying Notes to Financial Statements.
98
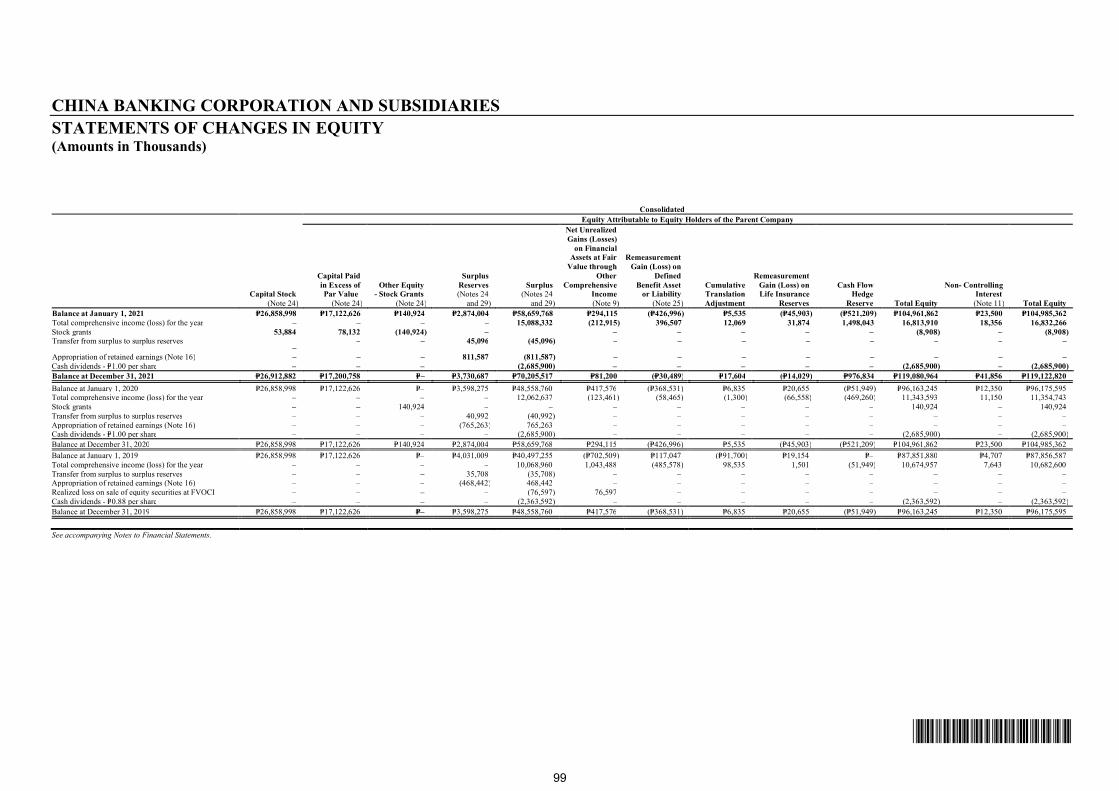
*SGVFS162381*
CHINA BANKING CORPORATION AND SUBSIDIARIESSTATEMENTS OF CHANGES IN EQUITY(Amounts in Thousands)
ConsolidatedEquity Attributable to Equity Holders of the Parent Company
Capital Stock(Note 24)
Capital Paidin Excess ofPar Value
(Note 24)
Other Equity- Stock Grants
(Note 24)
SurplusReserves(Notes 24
and 29)
Surplus(Notes 24
and 29)
Net Unrealized Gains (Losses)
on FinancialAssets at Fair
Value throughOther
ComprehensiveIncome(Note 9)
RemeasurementGain (Loss) on
DefinedBenefit Asset or Liability
(Note 25)
CumulativeTranslationAdjustment
RemeasurementGain (Loss) on Life Insurance
Reserves
Cash FlowHedge
Reserve Total Equity
Non- ControllingInterest(Note 11) Total Equity
Balance at January 1, 2021 P=26,858,998 P=17,122,626 P=140,924 P=2,874,004 P=58,659,768 P=294,115 (P=426,996) P=5,535 (P=45,903) (P=521,209) P=104,961,862 P=23,500 P=104,985,362Total comprehensive income (loss) for the year – – – – 15,088,332 (212,915) 396,507 12,069 31,874 1,498,043 16,813,910 18,356 16,832,266Stock grants 53,884 78,132 (140,924) – – – – – – (8,908) – (8,908)Transfer from surplus to surplus reserves
–– – 45,096 (45,096) – – – – – – – –
Appropriation of retained earnings (Note 16) – – – 811,587 (811,587) – – – – – – – –Cash dividends - P=1.00 per share – – – (2,685,900) – – – – – (2,685,900) – (2,685,900)Balance at December 31, 2021 P=26,912,882 P=17,200,758 P=– P=3,730,687 P=70,205,517 P=81,200 (P=30,489) P=17,604 (P=14,029) P=976,834 P=119,080,964 P=41,856 P=119,122,820Balance at January 1, 2020 P=26,858,998 P=17,122,626 P=– P=3,598,275 P=48,558,760 P=417,576 (P=368,531) P=6,835 P=20,655 (P=51,949) P=96,163,245 P=12,350 P=96,175,595Total comprehensive income (loss) for the year – – – – 12,062,637 (123,461) (58,465) (1,300) (66,558) (469,260) 11,343,593 11,150 11,354,743Stock grants – – 140,924 – – – – – – – 140,924 – 140,924Transfer from surplus to surplus reserves – – – 40,992 (40,992) – – – – – – – –Appropriation of retained earnings (Note 16) – – – (765,263) 765,263 – – – – – – – –Cash dividends - P=1.00 per share – – – – (2,685,900) – – – – – (2,685,900) – (2,685,900)Balance at December 31, 2020 P=26,858,998 P=17,122,626 P=140,924 P=2,874,004 P=58,659,768 P=294,115 (P=426,996) P=5,535 (P=45,903) (P=521,209) P=104,961,862 P=23,500 P=104,985,362Balance at January 1, 2019 P=26,858,998 P=17,122,626 P=– P=4,031,009 P=40,497,255 (P=702,509) P=117,047 (P=91,700) P=19,154 P=– P=87,851,880 P=4,707 P=87,856,587Total comprehensive income (loss) for the year – – – – 10,068,960 1,043,488 (485,578) 98,535 1,501 (51,949) 10,674,957 7,643 10,682,600Transfer from surplus to surplus reserves – – – 35,708 (35,708) – – – – – – – –Appropriation of retained earnings (Note 16) – – – (468,442) 468,442 – – – – – – – –Realized loss on sale of equity securities at FVOCI – – – – (76,597) 76,597 – – – – – – –Cash dividends - P=0.88 per share – – – – (2,363,592) – – – – – (2,363,592) – (2,363,592)Balance at December 31, 2019 P=26,858,998 P=17,122,626 P=– P=3,598,275 P=48,558,760 P=417,576 (P=368,531) P=6,835 P=20,655 (P=51,949) P=96,163,245 P=12,350 P=96,175,595
See accompanying Notes to Financial Statements.
99

*SGVFS162381*
- 2 -
Parent Company
Capital Stock(Note 24)
Capital Paidin Excess ofPar Value
(Note 24)Other Equity - Stock
Grants (Note 24)
SurplusReserves(Notes 24
and 29)
Surplus(Notes 24
and 29)
Net Unrealized Gains (Losses)
on FinancialAssets at Fair
Value throughOther
ComprehensiveIncome(Note 9)
RemeasurementGain (Loss) on
DefinedBenefit Asset or Liability
(Note 25)
Cumulative Translation Adjustment
RemeasurementGain (Loss) on Life Insurance
ReservesCash Flow Hedge
Reserve Total EquityBalance at January 1, 2021 P=26,858,998 P=17,122,626 P=140,924 P=2,874,004 P=58,659,768 P=294,115 (P=426,996) P=5,535 (P=45,903) (P=521,209) P=104,961,862Total comprehensive income (loss) for the year – – – – 15,088,332 (212,915) 396,507 12,069 31,874 1,498,043 16,813,910Stock grants 53,884 78,132 (140,924) – – – – – – – (8,908)Transfer from surplus to surplus reserves – – – 45,096 (45,096) – – – – – –Appropriation of retained earnings (Note 16) – – – 811,587 (811,587) – – – – – –Cash dividends - P=1.00 per share – – – – (2,685,900) – – – – – (2,685,900)Balance at December 31, 2021 P=26,912,882 P=17,200,758 P=– P=3,730,687 P=70,205,517 P=81,200 (P=30,489) P=17,604 (P=14,029) P=976,834 P=119,080,964Balance at January 1, 2020 P=26,858,998 P=17,122,626 P=– P=3,598,275 P=48,558,760 P=417,576 (P=368,531) P=6,835 P=20,655 (P=51,949) P=96,163,245Total comprehensive income (loss) for the year – – – – 12,062,637 (123,461) (58,465) (1,300) (66,558) (469,260) 11,343,593Stock grants – – 140,924 – – – – – – – 140,924Transfer from surplus to surplus reserves – – – 40,992 (40,992) – – – – – –Appropriation of retained earnings (Note 16) – – – (765,263) 765,263 – – – – – –Cash dividends - P=1.00 per share – – – – (2,685,900) – – – – – (2,685,900)Balance at December 31, 2020 P=26,858,998 P=17,122,626 P=140,924 P=2,874,004 P=58,659,768 P=294,115 (P=426,996) P=5,535 (P=45,903) (P=521,209) P=104,961,862Balance at January 1, 2019 P=26,858,998 P=17,122,626 P=– P=4,031,009 P=40,497,255 (P=702,509) P=117,047 (P=91,700) P=19,154 P=– P=87,851,880Total comprehensive income (loss) for the year – – – – 10,068,960 1,043,488 (485,578) 98,535 1,501 (51,949) 10,674,957Transfer from surplus to surplus reserves – – – 35,708 (35,708) – – – – – –Appropriation of retained earnings (Note 16) – – – (468,442) 468,442 – – – – – –Realized loss on sale of equity securities at FVOCI – – – – (76,597) 76,597 – – – – –Cash dividends - P=0.88 per share – – – – (2,363,592) – – – – – (2,363,592)Balance at December 31, 2019 P=26,858,998 P=17,122,626 P=– P=3,598,275 P=48,558,760 P=417,576 (P=368,531) P=6,835 P=20,655 (P=51,949) P=96,163,245
See accompanying Notes to Financial Statements.
100
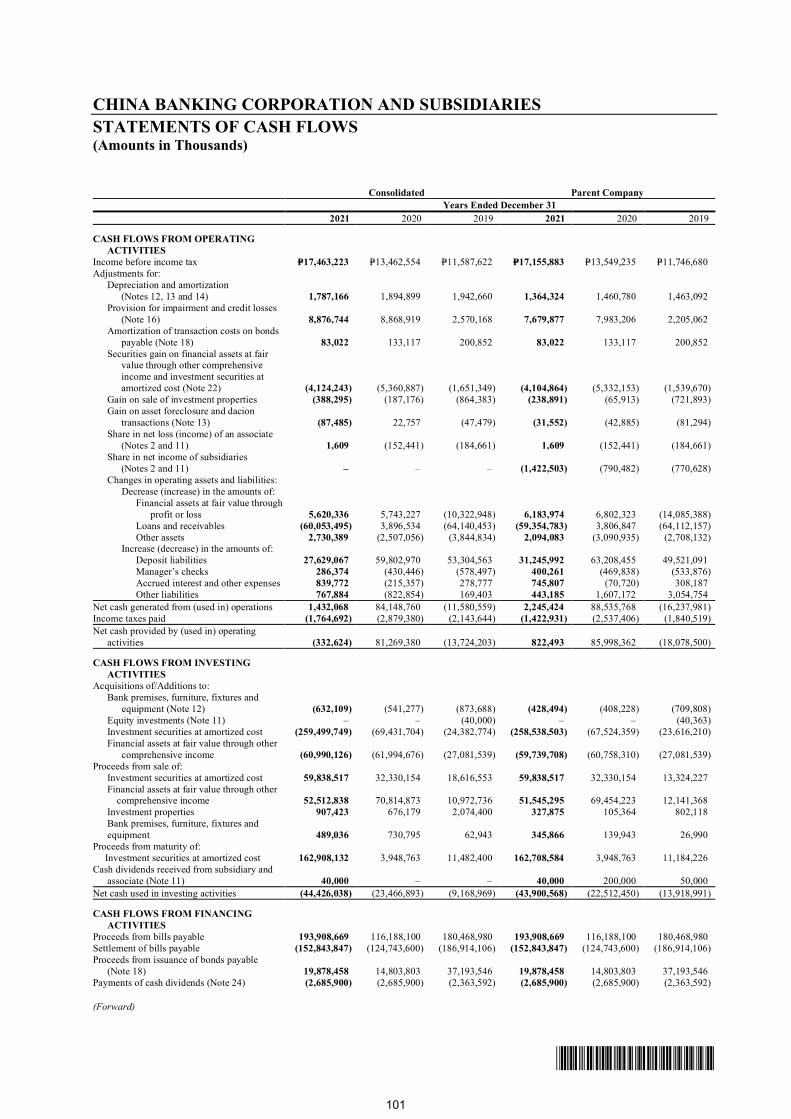
*SGVFS162381*
CHINA BANKING CORPORATION AND SUBSIDIARIESSTATEMENTS OF CASH FLOWS(Amounts in Thousands)
Consolidated Parent CompanyYears Ended December 31
2021 2020 2019 2021 2020 2019
CASH FLOWS FROM OPERATINGACTIVITIES
Income before income tax P=17,463,223 P=13,462,554 P=11,587,622 P=17,155,883 P=13,549,235 P=11,746,680Adjustments for:
Depreciation and amortization(Notes 12, 13 and 14) 1,787,166 1,894,899 1,942,660 1,364,324 1,460,780 1,463,092
Provision for impairment and credit losses (Note 16) 8,876,744 8,868,919 2,570,168 7,679,877 7,983,206 2,205,062Amortization of transaction costs on bonds
payable (Note 18) 83,022 133,117 200,852 83,022 133,117 200,852Securities gain on financial assets at fair
value through other comprehensiveincome and investment securities atamortized cost (Note 22) (4,124,243) (5,360,887) (1,651,349) (4,104,864) (5,332,153) (1,539,670)
Gain on sale of investment properties (388,295) (187,176) (864,383) (238,891) (65,913) (721,893)Gain on asset foreclosure and dacion
transactions (Note 13) (87,485) 22,757 (47,479) (31,552) (42,885) (81,294)Share in net loss (income) of an associate (Notes 2 and 11) 1,609 (152,441) (184,661) 1,609 (152,441) (184,661)Share in net income of subsidiaries
(Notes 2 and 11) – – – (1,422,503) (790,482) (770,628)Changes in operating assets and liabilities:
Decrease (increase) in the amounts of:Financial assets at fair value through
profit or loss 5,620,336 5,743,227 (10,322,948) 6,183,974 6,802,323 (14,085,388)Loans and receivables (60,053,495) 3,896,534 (64,140,453) (59,354,783) 3,806,847 (64,112,157)
Other assets 2,730,389 (2,507,056) (3,844,834) 2,094,083 (3,090,935) (2,708,132)Increase (decrease) in the amounts of:
Deposit liabilities 27,629,067 59,802,970 53,304,563 31,245,992 63,208,455 49,521,091Manager’s checks 286,374 (430,446) (578,497) 400,261 (469,838) (533,876)Accrued interest and other expenses 839,772 (215,357) 278,777 745,807 (70,720) 308,187Other liabilities 767,884 (822,854) 169,403 443,185 1,607,172 3,054,754
Net cash generated from (used in) operations 1,432,068 84,148,760 (11,580,559) 2,245,424 88,535,768 (16,237,981)Income taxes paid (1,764,692) (2,879,380) (2,143,644) (1,422,931) (2,537,406) (1,840,519)Net cash provided by (used in) operating
activities (332,624) 81,269,380 (13,724,203) 822,493 85,998,362 (18,078,500)
CASH FLOWS FROM INVESTINGACTIVITIES
Acquisitions of/Additions to:Bank premises, furniture, fixtures and
equipment (Note 12) (632,109) (541,277) (873,688) (428,494) (408,228) (709,808)Equity investments (Note 11) – – (40,000) – – (40,363)Investment securities at amortized cost (259,499,749) (69,431,704) (24,382,774) (258,538,503) (67,524,359) (23,616,210)Financial assets at fair value through other
comprehensive income (60,990,126) (61,994,676) (27,081,539) (59,739,708) (60,758,310) (27,081,539)Proceeds from sale of:
Investment securities at amortized cost 59,838,517 32,330,154 18,616,553 59,838,517 32,330,154 13,324,227Financial assets at fair value through other
comprehensive income 52,512,838 70,814,873 10,972,736 51,545,295 69,454,223 12,141,368 Investment properties 907,423 676,179 2,074,400 327,875 105,364 802,118 Bank premises, furniture, fixtures andequipment 489,036 730,795 62,943 345,866 139,943 26,990
Proceeds from maturity of:Investment securities at amortized cost 162,908,132 3,948,763 11,482,400 162,708,584 3,948,763 11,184,226
Cash dividends received from subsidiary andassociate (Note 11) 40,000 – – 40,000 200,000 50,000
Net cash used in investing activities (44,426,038) (23,466,893) (9,168,969) (43,900,568) (22,512,450) (13,918,991)
CASH FLOWS FROM FINANCINGACTIVITIES
Proceeds from bills payable 193,908,669 116,188,100 180,468,980 193,908,669 116,188,100 180,468,980Settlement of bills payable (152,843,847) (124,743,600) (186,914,106) (152,843,847) (124,743,600) (186,914,106)Proceeds from issuance of bonds payable
(Note 18) 19,878,458 14,803,803 37,193,546 19,878,458 14,803,803 37,193,546Payments of cash dividends (Note 24) (2,685,900) (2,685,900) (2,363,592) (2,685,900) (2,685,900) (2,363,592)
(Forward)
101
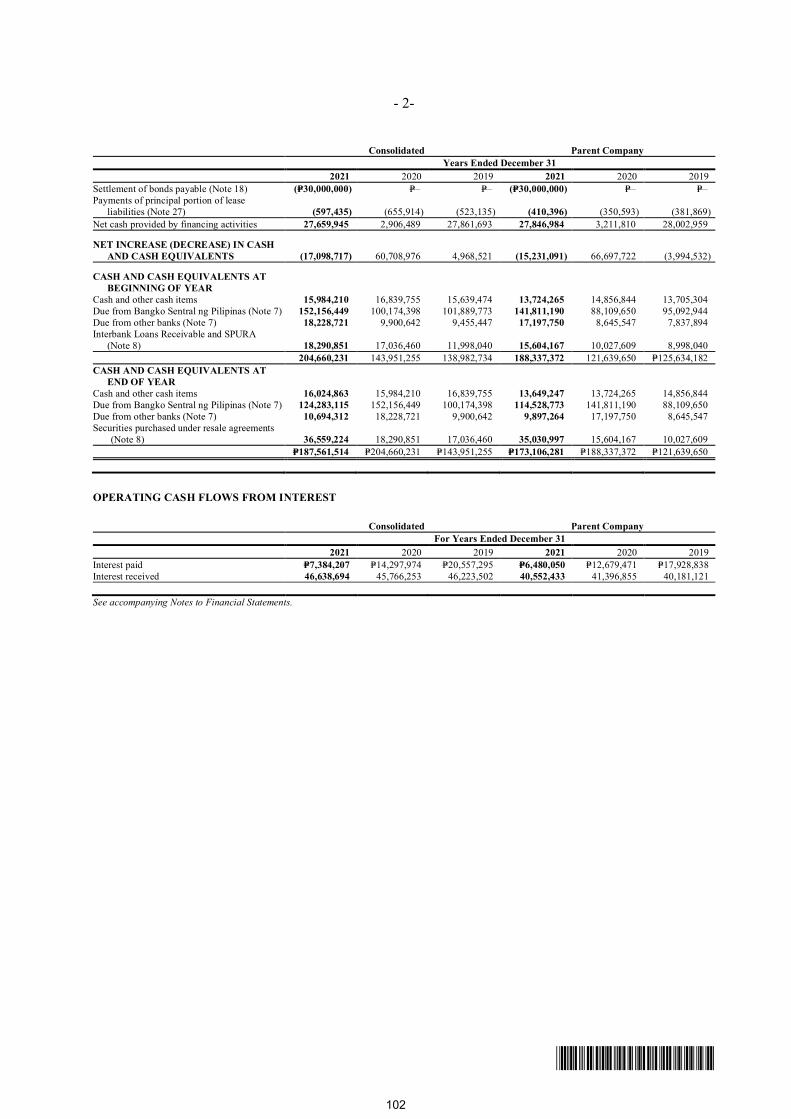
*SGVFS162381*
- 2-
Consolidated Parent CompanyYears Ended December 31
2021 2020 2019 2021 2020 2019Settlement of bonds payable (Note 18) (P=30,000,000) P=– P=– (P=30,000,000) P=– P=–Payments of principal portion of lease
liabilities (Note 27) (597,435) (655,914) (523,135) (410,396) (350,593) (381,869)Net cash provided by financing activities 27,659,945 2,906,489 27,861,693 27,846,984 3,211,810 28,002,959
NET INCREASE (DECREASE) IN CASHAND CASH EQUIVALENTS (17,098,717) 60,708,976 4,968,521 (15,231,091) 66,697,722 (3,994,532)
CASH AND CASH EQUIVALENTS ATBEGINNING OF YEAR
Cash and other cash items 15,984,210 16,839,755 15,639,474 13,724,265 14,856,844 13,705,304Due from Bangko Sentral ng Pilipinas (Note 7) 152,156,449 100,174,398 101,889,773 141,811,190 88,109,650 95,092,944Due from other banks (Note 7) 18,228,721 9,900,642 9,455,447 17,197,750 8,645,547 7,837,894Interbank Loans Receivable and SPURA
(Note 8) 18,290,851 17,036,460 11,998,040 15,604,167 10,027,609 8,998,040204,660,231 143,951,255 138,982,734 188,337,372 121,639,650 P=125,634,182
CASH AND CASH EQUIVALENTS ATEND OF YEAR
Cash and other cash items 16,024,863 15,984,210 16,839,755 13,649,247 13,724,265 14,856,844Due from Bangko Sentral ng Pilipinas (Note 7) 124,283,115 152,156,449 100,174,398 114,528,773 141,811,190 88,109,650Due from other banks (Note 7) 10,694,312 18,228,721 9,900,642 9,897,264 17,197,750 8,645,547Securities purchased under resale agreements
(Note 8) 36,559,224 18,290,851 17,036,460 35,030,997 15,604,167 10,027,609P=187,561,514 P=204,660,231 P=143,951,255 P=173,106,281 P=188,337,372 P=121,639,650
OPERATING CASH FLOWS FROM INTEREST
Consolidated Parent CompanyFor Years Ended December 31
2021 2020 2019 2021 2020 2019Interest paid P=7,384,207 P=14,297,974 P=20,557,295 P=6,480,050 P=12,679,471 P=17,928,838Interest received 46,638,694 45,766,253 46,223,502 40,552,433 41,396,855 40,181,121
See accompanying Notes to Financial Statements.
102
*SGVFS162381*
CHINA BANKING CORPORATION AND SUBSIDIARIESNOTES TO FINANCIAL STATEMENTS
1. Corporate Information
China Banking Corporation (the Parent Company) is a publicly listed universal bank incorporated inthe Philippines. The Parent Company acquired its universal banking license in 1991. It providesexpanded commercial banking products and services such as deposit products, loans and tradefinance, domestic and foreign fund transfers, treasury products, trust products, foreign exchange,corporate finance and other investment banking services through a network of 477 and 476 localbranches as of December 31, 2021 and 2020, respectively.
The Parent Company acquired its original Certification of Incorporation issued by the Securities andExchange Commission (SEC) on July 20, 1920. On December 4, 1963, the Board of Directors(BOD) of the Parent Company approved the Amended Articles of Incorporation to extend thecorporate term of the Parent Company for another 50 years or until July 20, 2020, which wasconfirmed by the stockholders on December 23, 1963, and approved by the SEC on October 5, 1964.On March 2, 2016, the BOD approved the amendment of the Third Article of the Parent Company'sArticles of Incorporation, to further extend the corporate term for another 50 years from and after July20, 2020, the expiry date of its extended term. The approval was ratified by the stockholders duringtheir scheduled annual meeting on May 5, 2016. On November 7, 2016, the SEC issued theCertificate of Filing of Amended Articles of Incorporation, amending the Third Article thereof toextend the term of corporate existence of the Parent Company. By virtue of Section 11 of RepublicAct No. 11232 also known as the “Revised Corporation Code of the Philippines,” which took effecton February 23, 2019, the Parent Company now has a perpetual existence.
The Parent Company has the following subsidiaries:
Subsidiary
Effective Percentages ofOwnership
Country ofIncorporationand Place ofBusiness Principal Activities
2021 2020
Chinabank Insurance Brokers, Inc.(CIBI) 100.00% 100.00% Philippines Insurance brokerage
CBC Properties and Computer Center,Inc. (CBC-PCCI) 100.00% 100.00% Philippines Computer services
China Bank Savings, Inc. (CBSI) 98.29% 98.29% Philippines Retail and consumerbanking
China Bank Capital Corporation(CBCC)
100.00% 100.00% Philippines Investment house
CBC Assets One (SPC) Inc. 100.00% 100.00% Philippines Special purposecorporation
China Bank Securities Corporation(CBCSec)
100.00% 100.00% Philippines Stock brokerage
Resurgent Capital (FIST-AMC) Inc,* 100.00% – Philippines FIST Corporation
*Established in 2021, 100% owned through CBCC
The Parent Company has no ultimate parent company. SM Investments Corporation, its significantinvestor, has effective ownership in the Parent Company of 22.51% and 22.55% as ofDecember 31, 2021 and 2020, respectively.
The Parent Company’s principal place of business is at 8745 Paseo de Roxas cor. Villar St., MakatiCity.
103
- 2 -
*SGVFS162381*
2. Summary of Significant Accounting Policies
Basis of PreparationThe accompanying consolidated financial statements include the financial statements of the ParentCompany and its subsidiaries (collectively referred to as “the Group”).
The accompanying financial statements have been prepared on a historical cost basis except forfinancial instruments at fair value through profit or loss (FVTPL), derivative contracts designated ashedges and financial assets at fair value through other comprehensive income (FVOCI). Thefinancial statements are presented in Philippine peso, and all values are rounded to the nearestthousand except when otherwise indicated.
The financial statements of the Parent Company reflect the accounts maintained in the RegularBanking Unit (RBU) and Foreign Currency Deposit Unit (FCDU). The financial statements of theseunits are combined after eliminating inter-unit accounts.
Each entity in the Group determines its own functional currency and items included in the financialstatements of each entity are measured using that functional currency. The functional currency ofeach of the Parent Company’s subsidiaries is the Philippine peso, except for the FCDU of CBSIwhose functional currency is USD.
Statement of ComplianceThe financial statements of the Group and the Parent Company have been prepared in compliancewith Philippine Financial Reporting Standards (PFRS).
Presentation of Financial StatementsThe balance sheets of the Group and of the Parent Company are presented in order of liquidity. Ananalysis regarding recovery of assets or settlement of liabilities within 12 months after the reportingdate (current) and more than 12 months after the reporting date (non-current) is presented in Note 23.
Financial assets and financial liabilities are offset and the net amount reported in the balance sheetsonly when there is a legally enforceable right to offset the recognized amounts and there is anintention to settle on a net basis, or to realize the asset and settle the liability simultaneously. TheGroup and the Parent Company assess that they have currently enforceable right of offset if the rightis not contingent on a future event, and is legally enforceable in the normal course of business, eventof default, and event of insolvency or bankruptcy of the Group, the Parent Company and all of thecounterparties.
Income and expenses are not offset in the statement of income unless required or permitted by anyaccounting standard or interpretation, and as specifically disclosed in the accounting policies of theGroup and the Parent Company.
Basis of Consolidation and Investments in SubsidiariesThe consolidated financial statements of the Group are prepared for the same reporting year as theParent Company, using consistent accounting policies. All significant intra-group balances,transactions and income and expenses resulting from intra-group transactions are eliminated in full.
104
- 3 -
*SGVFS162381*
Subsidiaries are consolidated from the date on which control is obtained by the Parent Company.The Group controls an investee if and only if the Group has:
power over the investee (i.e., existing rights that give it the current ability to direct the relevantactivities of the investee);
exposure, or rights, to variable returns from its involvement with the investee, and the ability to use its power over the investee to affect its returns.
When the Group has less than a majority of the voting or similar rights of an investee, the Groupconsiders all relevant facts and circumstances in assessing whether it has power over an investee,including:
the contractual arrangement with the other vote holders of the investee rights arising from other contractual arrangements the Group’s voting rights and potential voting rights.
The Group re-assesses whether or not it controls an investee if facts and circumstances indicate thatthere are changes to one or more of the three elements of control. Consolidation of a subsidiarybegins when the Group obtains control over the subsidiary and ceases when the Group loses controlof the subsidiary. Assets, liabilities, income and expenses of a subsidiary acquired or disposed ofduring the year are included in the consolidated financial statements from the date the Group gainscontrol until the date the Group ceases to control the subsidiary. Profit or loss and each component ofother comprehensive income (OCI) are attributed to the equity holders of the Group and to the non-controlling interests. When necessary, adjustments are made to the financial statements of thesubsidiary to bring its accounting policies into line with the Group’s accounting policies. All intra-group assets and liabilities, equity, income, expenses and cash flows relating to transactions betweenmembers of the Group are eliminated in full on consolidation.
A change in the ownership interest of a subsidiary, without a loss of control, is accounted for as anequity transaction. If the Group loses control over a subsidiary, it:
Derecognizes the assets (including goodwill) and liabilities of the subsidiary Derecognizes the carrying amount of any non-controlling interest Derecognizes the related OCI recorded in equity and recycle the same to profit or loss or surplus Recognizes the fair value of the consideration received Recognizes the fair value of any investment retained Recognizes the remaining difference in profit or loss Reclassifies the parent’s share of components previously recognized in OCI to profit or loss or
retained earnings, as appropriate, as would be recognized if the Group had directly disposed ofthe related assets or liabilities
Non-Controlling InterestNon-controlling interest represents the portion of profit or loss and net assets not owned, directly orindirectly, by the Parent Company.
Non-controlling interest is presented separately in the consolidated statement of income, consolidatedstatement of comprehensive income, and within equity in the consolidated balance sheet, separatelyfrom parent shareholders' equity. Any losses applicable to the non-controlling interest are allocatedagainst the interests of the non-controlling interest even if this results in the non-controlling interesthaving a deficit balance.
105
- 4 -
*SGVFS162381*
Changes in Accounting Policies and Disclosures
The accounting policies adopted are consistent with those of the previous financial year except for thefollowing amendments to PFRS which became effective as of January 1, 2021. Except as otherwiseindicated, these changes in the accounting policies did not have any significant impact on thefinancial position or performance of the Group:
Amendments to PFRS 9, PFRS 7, PFRS 4 and PFRS 16, Interest Rate Benchmark Reform –Phase 2
The amendments provide the following temporary reliefs which address the financial reportingeffects when an interbank offered rate (IBOR) is replaced with an alternative nearly risk-freeinterest rate (RFR):
o Practical expedient for changes in the basis for determining the contractual cash flows as aresult of IBOR reform
o Relief from discontinuing hedging relationshipso Relief from the separately identifiable requirement when an RFR instrument is designated as
a hedge of a risk component
The Group shall also disclose information about:
o The about the nature and extent of risks to which the entity is exposed arising from financialinstruments subject to IBOR reform, and how the entity manages those risks; and
o Their progress in completing the transition to alternative benchmark rates, and howthe entity is managing that transition
The Group has certain cash flow hedges whose interest rate benchmark is linked to United States(US) London Interbank Offered Rate (LIBOR). This Phase 2 of the IBOR reform providestemporary reliefs that allow the Group’s hedging relationships to continue upon the replacementof an existing interest rate benchmark with an RFR. The reliefs require the Group to amendhedge designations and hedge documentation. This includes redefining the hedged risk toreference an RFR, redefining the description of the hedging instrument and/or the hedged item toreference the RFR and amending the method for assessing hedge effectiveness. Updates to thehedging documentation must be made by the end of the reporting period in which a replacementtakes place.
Amendment to PFRS 16, COVID-19-related Rent Concessions beyond 30 June 2021
The amendment provides relief to lessees from applying the PFRS 16 requirement on leasemodifications to rent concessions arising as a direct consequence of the COVID-19 pandemic. Alessee may elect not to assess whether a rent concession from a lessor is a lease modification if itmeets all of the following criteria:
o The rent concession is a direct consequence of COVID-19;o The change in lease payments results in a revised lease consideration that is substantially the
same as, or less than, the lease consideration immediately preceding the change;o Any reduction in lease payments affects only payments originally due on or before
June 30, 2022; ando There is no substantive change to other terms and conditions of the lease.
106
- 5 -
*SGVFS162381*
A lessee that applies this practical expedient will account for any change in lease paymentsresulting from the COVID-19 related rent concession in the same way it would account for achange that is not a lease modification, i.e., as a variable lease payment.
The amendment is effective for annual reporting periods beginning on or after April 1, 2021.Early adoption is permitted.
The Group adopted the amendment beginning April 1, 2021.
Significant Accounting Policies
Foreign Currency TranslationThe consolidated financial statements are presented in Philippine peso.
Transactions and balancesThe books of accounts of the RBU are maintained in Philippine peso, the RBU’s functional currency,while those of the FCDU are maintained in United States (US) dollars (USD), the FCDU’s functionalcurrency.
RBUFor financial reporting purposes, the foreign currency-denominated monetary assets and liabilities inthe RBU are translated in Philippine peso based on the Bankers Association of the Philippines (BAP)closing rate at end of the year, and foreign currency-denominated income and expenses, at theexchange rates on transaction dates. Foreign exchange differences arising from restatements offoreign currency-denominated assets and liabilities are credited to or charged against operations in theperiod in which the rates change. Non-monetary items that are measured in terms of historical cost ina foreign currency are translated using the exchange rates as at the dates of the initial transactions.Non-monetary items measured at fair value in a foreign currency are translated using the exchangerates at the date when the fair value was determined.
FCDUAs at the reporting date, the assets and liabilities of the FCDU are translated into the ParentCompany’s presentation currency (the Philippine Peso) at the BAP closing rate at the reporting date,and its income and expenses are translated at the BAP weighted average rate for the year. Exchangedifferences arising on translation are taken directly to the statement of comprehensive income under‘Cumulative translation adjustment’. Upon actual remittance or transfer of the FCDU income toRBU, the related exchange difference arising from translation lodged under 'Cumulative translationadjustment' is recognized in the statement of income of the RBU books.
Fair Value MeasurementThe Group measures financial instruments, such as financial instruments at FVTPL, derivativecontracts designated as hedges and financial assets at FVOCI at fair value at each reporting date.Also, fair values of financial instruments measured at amortized cost are disclosed in Note 5.
Fair value is the price that would be received to sell an asset or paid to transfer a liability in an orderlytransaction between market participants at the measurement date. The fair value measurement isbased on the presumption that the transaction to sell the asset or transfer the liability takes placeeither:
in the principal market for the asset or liability, or in the absence of a principal market, in the most advantageous market for the asset or liability.
107
- 6 -
*SGVFS162381*
The principal or the most advantageous market must be accessible by the Group. The fair value of anasset or a liability is measured using the assumptions that market participants would use when pricingthe asset or liability, assuming that market participants act in their economic best interest.
If an asset or a liability measured at fair value has a bid price and an ask price, the price within thebid-ask spread that is most representative of fair value in the circumstances shall be used to measurefair value regardless of where the input is categorized within the fair value hierarchy.
A fair value measurement of a non-financial asset takes into account a market participant's ability togenerate economic benefits by using the asset in its highest and best use or by selling it to anothermarket participant that would use the asset in its highest and best use.
The Group uses valuation techniques that are appropriate in the circumstances and for whichsufficient data are available to measure fair value, maximizing the use of relevant observable inputsand minimizing the use of unobservable inputs.
All assets and liabilities for which fair value is measured or disclosed in the financial statements arecategorized within the fair value hierarchy, described as follows, based on the lowest level input thatis significant to the fair value measurement as a whole:
Level 1 - Quoted (unadjusted) market prices in active markets for identical assets or liabilities Level 2 - Valuation techniques for which the lowest level input that is significant to the fair value
measurement is directly or indirectly observable Level 3 - Valuation techniques for which the lowest level input that is significant to the fair value
measurement is unobservable
For assets and liabilities that are recognized in the financial statements on a recurring basis, the Groupdetermines whether transfers have occurred between Levels in the hierarchy by re-assessingcategorization (based on the lowest level input that is significant to the fair value measurement as awhole) at the end of each reporting period.
Cash and Cash EquivalentsFor purposes of reporting cash flows, cash and cash equivalents include cash and other cash items,due from BSP and other banks, interbank loans receivables and securities purchased under resaleagreements (SPURA) that are convertible to known amounts of cash which have original maturitiesof three months or less from dates of placements and that are subject to an insignificant risk ofchanges in value. Due from BSP includes the statutory reserves required by the BSP which theGroup considers as cash equivalents wherein withdrawals can be made to meet the Group’s cashrequirements as allowed by the BSP.
SPURASecurities purchased under agreements to resell at a specified future date (‘reverse repos’) are notrecognized in the balance sheet. An asset corresponding to the cash paid, including accrued interest,is recognized in the balance sheet as SPURA. The difference between the purchase price and theresale price is treated as interest income and is accrued over the life of the agreement using the EIRmethod.
Financial Instruments - Initial Recognition
Date of recognitionPurchases or sales of financial assets, except for derivative instruments, that require delivery of assetswithin the time frame established by regulation or convention in the marketplace are recognized on
108
- 7 -
*SGVFS162381*
the settlement date. Settlement date accounting refers to (a) the recognition of an asset on the day it isreceived by the Group, and (b) the derecognition of an asset and recognition of any gain or loss ondisposal on the day that such asset is delivered by the Group. Any change in fair value of a financialasset is recognized in the statement of income for assets classified as financial assets at FVTPL, andin equity for assets classified as financial assets at FVOCI. Derivatives are recognized on a trade datebasis. Deposits, amounts due to banks, and customers loans and receivables are recognized whencash is received by the Group or advanced to the borrowers.
Initial recognition of financial instrumentsAll financial instruments are initially recognized at fair value. Except for financial assets andfinancial liabilities at FVTPL, the initial measurement of financial instruments includes transactioncosts.
‘Day 1’ differenceWhere the transaction price in a non-active market is different with the fair value from otherobservable current market transactions in the same instrument or based on a valuation techniquewhose variables include only data from observable market, the Group recognizes the differencebetween the transaction price and fair value (a ‘Day 1’ difference) in the statement of income. Incases where the transaction price used is made of data which is not observable, the difference betweenthe transaction price and model value is only recognized in the statement of income when the inputsbecome observable or when the instrument is derecognized. For each transaction, the Groupdetermines the appropriate method of recognizing the ‘Day 1’ difference amount.
Classification and MeasurementUnder PFRS 9, the classification and measurement of financial assets is driven by the contractualcash flow characteristics of the financial assets and the entity’s business model for managing thefinancial assets.
As part of its classification process, the Group assesses the contractual terms of financial assets toidentify whether they meet the ‘solely payments of principal and interest’ (SPPI) test. ‘Principal’ forthe purpose of this test is defined as the fair value of the financial asset at initial recognition and maychange over the life of the financial asset (e.g., if there are repayments of principal or amortization ofthe premium or discount).
The most significant elements of interest within a lending arrangement are typically the considerationfor the time value of money and credit risk. To make the SPPI assessment, the Group appliesjudgment and considers relevant factors such as the currency in which the financial asset isdenominated and the period for which the interest rate is set. In contrast, contractual terms thatintroduce a more than de minimis exposure to risks or volatility in the contractual cash flows that areunrelated to a basic lending arrangement do not give rise to contractual cash flows that are solelypayments of principal and interest on the amount outstanding. In such cases, the financial asset isrequired to be measured at FVTPL.
The Group determines its business model at the level that best reflects how it manages groups offinancial assets to achieve its business objective.
The Group's business model is not assessed on an instrument-by-instrument basis, but at a higherlevel of aggregated portfolios and is based on observable factors such as:
how the performance of the business model and the financial assets held within that businessmodel are evaluated and reported to the entity's key management personnel;
109
- 8 -
*SGVFS162381*
the risks that affect the performance of the business model (and the financial assets held withinthat business model) and, in particular, the way those risks are managed;
how managers of the business are compensated (for example, whether the compensation is basedon the fair value of the assets managed or on the contractual cash flows collected); and
the expected frequency, value, and timing of sales are also important aspects of the Group’sassessment.
The business model assessment is based on reasonably expected scenarios without taking 'worst case'or 'stress case’ scenarios into account. If cash flows after initial recognition are realized in a way thatis different from the Group's original expectations, the Group does not change the classification of theremaining financial assets held in that business model, but incorporates such information whenassessing newly originated or newly purchased financial assets going forward; unless a change inbusiness model has taken place, in which case, reclassification is necessary.
The Group’s measurement categories are described below:
Financial assets at Amortized CostFinancial assets are measured at amortized cost if both of the following conditions are met: the asset is held within the Group’s business model whose objective is to hold financial assets in
order to collect contractual cash flows; and the contractual terms of the instrument give rise, on specified dates, to cash flows that are SPPI on
the principal amount outstanding.
Financial assets meeting these criteria are measured initially at fair value plus transaction costs. Theyare subsequently measured at amortized cost using the effective interest method less any impairmentin value. The amortization is included in ‘Interest income’ in the statement of income. Gains orlosses are recognized in the statement of income when these investments are derecognized orimpaired, as well as through the amortization process. The expected credit losses (ECL) arerecognized in the statement of income under ‘Provision for impairment and credit losses’. The effectsof revaluation of foreign currency-denominated investments are recognized in the statement ofincome. Gains or losses arising from disposals of these instruments are included in ‘Gains (losses) ondisposal of investment securities at amortized cost’ in the statement of income.
The Group’s financial assets at amortized cost are presented in the statement of financial position asDue from BSP, Due from other banks, Interbank loans receivable and SPURA, Investment securitiesat amortized cost, Loans and receivables, Accrued interest receivables and certain financial assetsunder Other assets.
The Group may irrevocably elect at initial recognition to classify a financial asset that meets theamortized cost criteria above as at FVTPL if that designation eliminates or significantly reduces anaccounting mismatch had the financial asset been measured at amortized cost.
Financial Assets at FVTPLDebt instruments that neither meet the amortized cost nor the FVOCI criteria, or that meet the criteriabut the Group has chosen to designate as at FVTPL at initial recognition, are classified as financialassets at FVTPL. Equity investments are classified as financial assets at FVTPL, unless the Groupirrevocably designates an equity investment that is not held for trading as at FVOCI at initialrecognition. The Group’s financial assets at FVTPL include government securities, corporate bonds,derivatives, and equity securities which are held for trading purposes.
110
- 9 -
*SGVFS162381*
A financial asset is considered as held for trading if:
it has been acquired principally for the purpose of selling it in the near term; on initial recognition, it is part of a portfolio of identified financial instruments that the Group
manages together and has evidence of a recent actual pattern of short-term profit-taking; or it is a derivative that is not designated and effective as a hedging instrument or financial
guarantee.
Gains and losses arising from changes in the fair value (mark-to-market) of the financial assets atFVTPL are included in ‘Trading and securities gain (loss) - net’ account in the statement of income.
Interest recognized based on the contractual interest rate of these investments is reported in thestatement of income under ‘Interest income’ account while dividend income is reported in thestatement of income under ‘Miscellaneous income’ account when the right of payment has beenestablished.
Derivative instrumentsThe Parent Company is a party to derivative instruments, particularly, forward exchange contracts,interest rate swaps (IRS), futures, and warrants. These contracts are entered into as a service tocustomers, as a means of reducing and managing the Parent Company’s foreign exchange risk andinterest rate risk, as well as for trading purposes. Such derivative financial instruments, which are notdesignated as accounting hedges, are carried at fair value through profit or loss.
Any gains or losses arising from changes in fair value of derivative instruments that are notdesignated as accounting hedges are taken directly to the statement of income under 'Foreignexchange gain (loss) - net’ for forward exchange contracts and ‘Trading and securities gain (loss) -net’ for IRS, futures and warrants.
An embedded derivative is a component of a hybrid instrument that also includes a non-derivativehost contract with the effect that some of the cash flows of the combined instrument vary in a waysimilar to a stand-alone derivative. An embedded derivative causes some or all of the cash flows thatotherwise would be required by the contract to be modified according to a specified interest rate,financial instrument price, commodity price, foreign exchange rate, index of prices or rates, creditrating or credit index, or other variable, provided that, in the case of a non-financial variable, it is notspecific to a party to the contract. A derivative that is attached to a financial instrument, but iscontractually transferable independently of that instrument, or has a different counterparty from thatinstrument, is not an embedded derivative, but a separate financial instrument.
Derivatives embedded in financial liability or a non-financial host are separated from the host andaccounted for as separate derivatives if: the economic characteristics and risks are not closely relatedto the host; a separate instrument with the same terms as the embedded derivative would meet thedefinition of a derivative; and the hybrid contract is not measured at fair value through profit or loss.Embedded derivatives are measured at fair value with changes in fair value recognized in profit orloss. Reassessment only occurs if there is either a change in the terms of the contract thatsignificantly modifies the cash flows that would otherwise be required or a reclassification of afinancial asset out of the fair value through profit or loss category.
Financial Assets at FVOCI - Equity InvestmentsAt initial recognition, the Group can make an irrevocable election (on an instrument-by-instrumentbasis) to designate equity investments as at FVOCI. However, such designation is not permitted if theequity investment is held by the Group for trading. The Group has designated certain equityinstruments as at FVOCI.
111
- 10 -
*SGVFS162381*
Financial assets at FVOCI are initially measured at fair value plus transaction costs. Subsequently,they are measured at fair value, with no deduction for any disposal costs. Gains and losses arisingfrom changes in fair value are recognized in other comprehensive income and accumulated in ‘Netunrealized gain (loss) on financial assets at FVOCI’ in the balance sheet. When the asset is disposedof, the cumulative gain or loss previously recognized in the ‘Net unrealized gain (loss) on financialassets at FVOCI’ account is not reclassified to profit or loss, but is reclassified directly to Surplusaccount. Any dividends earned on holding these equity instruments are recognized in profit or lossunder ‘Miscellaneous income’ account.
Financial Assets at FVOCI - Debt InvestmentsThe Group applies the category of debt instruments measured at FVOCI when both of the followingconditions are met:
the instrument is held within a business model, the objective of which is achieved by bothcollecting contractual cash flows and selling financial assets; and
the contractual terms of the financial asset meet the SPPI test.
FVOCI debt instruments are subsequently measured at fair value with gains and losses arising due tochanges in fair value being recognized in OCI. Interest income and foreign exchange gains and lossesare recognized in profit or loss. Provision for credit and impairment losses is recognized in profit orloss with the corresponding allowance for ECL recognized in OCI.
On derecognition, cumulative gains or losses previously recognized in OCI are reclassified from OCIto profit or loss.
ReclassificationThe Group can only reclassify financial assets if the objective of its business model for managingthose financial assets changes. Accordingly, the Group is required to reclassify financial assets:
i. from amortized cost to fair value, if the objective of the business model changes so that theamortized cost criteria are no longer met; and
ii. from fair value to amortized cost, if the objective of the business model changes so that theamortized cost criteria start to be met and the characteristic of the instrument’s contractualcash flows meet the amortized cost criteria.
A change in business model occurs when the Group either begins or ceases to perform an activity thatis significant to its operations. A change in the objective of the Group’s business model will beeffected only at the beginning of the next reporting period following the change in the businessmodel.
Impairment of Financial assetsECL represents credit losses that reflect an unbiased and probability-weighted measure of expectedcash shortfalls, discounted at the EIR, which is determined by evaluating a range of possibleoutcomes, the time value of money, and reasonable and supportable information about past events,current conditions, and forecasts of future economic conditions. A cash shortfall is the differencebetween the cash flows that are due to an entity in accordance with the contract and the cash flowsthat the entity expects to receive. ECL allowances are measured at amounts equal to either (i) 12-month ECL or (ii) lifetime ECL for those financial instruments which have experienced a significantincrease in credit risk (SICR) since initial recognition (General Approach). The 12-month ECL is theportion of lifetime ECL that results from default events on a financial instrument that are possiblewithin the 12 months after the reporting date. Lifetime ECL pertains to credit losses that result fromall possible default events over the expected life of a financial instrument.
112
- 11 -
*SGVFS162381*
For non-credit-impaired financial instruments:
Stage 1 consists of all non-impaired financial instruments which have not experienced a SICRsince initial recognition. The Group and the Parent Company recognize a 12-month ECL forStage 1 financial instruments.
Stage 2 consists of all non-impaired financial instruments which have experienced a SICR sinceinitial recognition. The Group and the Parent Company recognize a lifetime ECL for Stage 2financial instruments.
For credit-impaired financial instruments:
Financial instruments are classified as Stage 3 when there is objective evidence of impairment asa result of one or more loss events that have occurred after initial recognition with a negativeimpact on the estimated future cash flows of a financial asset or a portfolio of financial assets.The ECL model requires that lifetime ECL be recognized for impaired financial instruments.
The Group uses internal credit assessment and approvals at various levels to determine the credit riskof exposures at initial recognition. Assessment can be quantitative or qualitative and depends on themateriality of the facility or the complexity of the portfolio to be assessed.
ECL is a function of the probability of default (PD), exposure at default (EAD), and loss given default(LGD), with the timing of the loss also considered, and is estimated by incorporating forward-lookingeconomic information and through the use of experienced credit judgment.
The PD represents the likelihood that a credit exposure will not be repaid and will go into default ineither a 12-month horizon for Stage 1 or lifetime horizon for Stage 2. EAD represents an estimate ofthe outstanding amount of credit exposure at the time a default may occur. For off-balance sheetexposures and undrawn amounts, EAD includes an estimate of any further amounts to be drawnwithin the contractual availability period of the irrevocable commitments. LGD is the amount thatmay not be recovered in the event of default. LGD takes into consideration the amount and quality ofany collateral held. Please refer to Note 6 for other information related to the Bank’s models for PD,EAD, and LGD.
The calculation of ECL, including the estimation of PD, EAD, LGD, and discount rate, is made on anindividual basis for most of the Group’s financial assets, and on a collective basis for retail productssuch as credit card receivables. The collective assessments are made separately for portfolios offacilities with similar credit risk characteristics.
In certain circumstances, the Group modifies the original terms and conditions of a credit exposure toform a new loan agreement or payment schedule. The modifications can be given depending on theborrower’s or counterparty’s current or expected financial difficulty. The modifications may include,but are not limited to, change in interest rate and terms, principal amount, maturity date, date andamount of periodic payments, and accrual of interest and charges. Distressed restructuring withindications of unlikeliness to pay are categorized as impaired accounts and are moved to Stage 3.
Restructured loansWhere possible, the Group seeks to restructure loans rather than to take possession of the collateral.This may involve extending the payment arrangements and the agreement of new loan conditions.Once the terms have been renegotiated, the loan is no longer considered past due. Managementcontinuously reviews restructured loans to ensure that all criteria are met and that future payments arelikely to occur. The loans continue to be subject to an individual or collective impairmentassessment, calculated using the loan’s original EIR. The difference between the recorded value of
113
- 12 -
*SGVFS162381*
the original loan and the present value of the restructured cash flows, discounted at the original EIR,is recognized in ‘Miscellaneous income’ or ‘Miscellaneous expense’ in the statement of income, asapplicable.
When the loan has been restructured but not derecognized, the Group also reassesses whether therehas been a SICR and considers whether the assets should be classified as Stage 3. If the restructuringterms are substantially different, the loan is derecognized and a new ‘asset’ is recognized at fair valueusing the revised EIR.
Hedge AccountingFor the purpose of hedge accounting, hedges are classified as:
Fair value hedges when the risk being hedged is the exposure to changes in the fair value of arecognized asset or liability or an unrecognized firm commitment;
Cash flow hedges when the risk being hedged is the exposure to variability in cash flows that iseither attributable to a particular risk associated with a recognized asset or liability or a highlyprobable forecast transaction or the foreign currency risk in an unrecognized firm commitment;and
Hedges of a net investment in a foreign operation.
At the inception of a hedge relationship, the Parent Company formally designates and documents thehedge relationship to which it wishes to apply hedge accounting and the risk management objectiveand strategy for undertaking the hedge.
The documentation includes identification of the hedging instrument, the hedged item, the nature ofthe risk being hedged and how the Parent Company will assess whether the hedging relationshipmeets the hedge effectiveness requirements (including the analysis of sources of hedgeineffectiveness and how the hedge ratio is determined).
A hedging relationship qualifies for hedge accounting if it meets all of the following effectivenessrequirements:
There is an economic relationship between the hedged item and the hedging instrument. The effect of credit risk does not dominate the value changes that result from that economic
relationship. The hedge ratio of the hedging relationship is the same as that resulting from the quantity of the
hedged item that the Parent Company actually hedges and the quantity of the hedging instrumentthat the Parent Company actually uses to hedge that quantity of hedged item.
An economic relationship exists when the hedging instrument and the hedged item have values thatgenerally move in opposite directions in response to movements in the same risk (hedged risk). TheParent Company assesses economic relationship by performing prospective qualitative orquantitative hedge effectiveness assessment at each reporting date. In addition, the Parent Companymeasures ineffectiveness by comparing the cumulative change in the fair value of the hedginginstrument with the cumulative change in the fair value of the hedged item.
Cash flow hedgesThe effective portion of the gain or loss on the hedging instrument is recognized in OCI in the cashflow hedge reserve, while any ineffective portion is recognized immediately in the statement ofincome. The cash flow hedge reserve is adjusted to the lower of the cumulative gain or loss on thehedging instrument and the cumulative change in fair value of the hedged item.
114

- 13 -
*SGVFS162381*
As of December 31, 2021 and 2020, the Parent Company has interest rate swaps that have beendesignated as hedging instruments in cash flow hedges (Note 26).
Financial LiabilitiesFinancial liabilities which include deposit liabilities, bills payable, bonds payable, and other liabilities(except tax-related payables, pre-need reserves and post-employment defined benefit obligation) arerecognized when the Group becomes a party to the contractual terms of the instrument.
Financial liabilities are recognized initially at their fair value and subsequently measured at amortizedcost using the effective interest method. All interest-related charges incurred on financial liabilitiesare recognized as an expense in the statements of income under the caption ‘Interest expense’.
Deposit liabilities are stated at amounts in which they are to be paid. Interest is accrued periodicallyand recognized in a separate liability account before recognizing as part of deposit liabilities.
‘Bills payable’ and ‘Bonds payable’ are recognized initially at fair value, which is the issue proceeds(fair value of consideration received) less any issuance costs. These are subsequently measured atamortized cost, any difference between the proceeds net of transaction costs and the redemption valueis recognized in the statement of income over the period of the borrowings using the effective interestmethod.
Derivative liabilities are recognized initially and subsequently measured at fair value with changes infair value recognized in the statement of income, unless designated as an accounting hedge.
Other liabilities, apart from derivative liabilities, are recognized initially at their fair value andsubsequently measured at amortized cost, using effective interest method.
Derecognition of Financial Assets and Liabilities
Financial assetsA financial asset (or, where applicable, a part of a financial asset or part of a group of financial assets)is derecognized when:
the rights to receive cash flows from the asset have expired; or the Group retains the right to receive cash flows from the asset, but has assumed an obligation to
pay them in full without material delay to a third party under a “pass-through” arrangement; or the Group has transferred its rights to receive cash flows from the asset and either (a) has
transferred substantially all the risks and rewards of the asset, or (b) has neither transferred norretained the risks and rewards of the asset but has transferred control of the asset.
Where the Group has transferred its rights to receive cash flows from an asset or has entered into apass-through arrangement, and has neither transferred nor retained substantially all the risks andrewards of the asset nor transferred control of the asset, the asset is recognized to the extent of theGroup’s continuing involvement in the asset. Continuing involvement that takes the form of aguarantee over the transferred asset is measured at the lower of the original carrying amount of theasset and the maximum amount of consideration that the Group could be required to repay.
Modification of financial assetsThe Group derecognizes a financial asset when the terms and conditions have been renegotiated tothe extent that, substantially, it becomes a new asset, with the difference between its carrying amountand the fair value of the new asset recognized as a derecognition gain or loss in profit or loss, to theextent that an impairment loss has not already been recorded.
115
- 14 -
*SGVFS162381*
The Group considers both qualitative and quantitative factors in assessing whether a modification offinancial asset is substantial or not. When assessing whether a modification is substantial, the Groupconsiders the following factors, among others:
Change in currency; Introduction of an equity feature; Change in counterparty; and If the modification results in the asset no longer considered SPPI.
The Group also performs a quantitative assessment similar to that being performed for modificationof financial liabilities. In performing the quantitative assessment, the Group considers the new termsof a financial asset to be substantially different if the present value of the cash flows under the newterms, including any fees paid net of any fees received and discounted using the original effectiveinterest rate, is at least 10% different from the present value of the remaining cash flows of theoriginal financial asset.
When the contractual cash flows of a financial asset are renegotiated or otherwise modified and therenegotiation or modification does not result in the derecognition of that financial asset, the Grouprecalculates the gross carrying amount of the financial asset as the present value of the renegotiated ormodified contractual cash flows discounted at the original EIR (or credit-adjusted EIR for purchasedor originated credit-impaired financial assets) and recognizes a modification gain or loss in thestatement of income.
When the modification of a financial asset results in the derecognition of the existing financial assetand the subsequent recognition of a new financial asset, the modified asset is considered a 'new'financial asset. Accordingly, the date of the modification shall be treated as the date of initialrecognition of that financial asset when applying the impairment requirements to the modifiedfinancial asset. The newly recognized financial asset is classified as Stage 1 for ECL measurementpurposes, unless the new financial asset is deemed to be purchased or originated as credit impaired(POCI).
Financial liabilitiesA financial liability is derecognized when the obligation under the liability is discharged, cancelled,or has expired. Where an existing financial liability is replaced by another from the same lender onsubstantially different terms, or the terms of an existing liability are substantially modified, such anexchange or modification is treated as a derecognition of the original liability and the recognition of anew liability, and the difference in the respective carrying amounts is recognized in the statement ofincome.
Exchange or modification of financial liabilitiesThe Group considers both qualitative and quantitative factors in assessing whether a modification offinancial liabilities is substantial or not. The terms are considered substantially different if the presentvalue of the cash flows under the new terms, including any fees paid net of any fees received anddiscounted using the original effective interest rate, is at least 10% different from the present value ofthe remaining cash flows of the original financial liability. However, under certain circumstances,modification or exchange of a financial liability may still be considered substantial, even where thepresent value of the cash flows under the new terms is less than 10% different from the present valueof the remaining cash flows of the original financial liability. There may be situations where themodification of the financial liability is so fundamental that immediate derecognition of the originalfinancial liability is appropriate (e.g., restructuring a financial liability to include an embedded equitycomponent).
116
- 15 -
*SGVFS162381*
When an existing financial liability is replaced by another from the same lender on substantiallydifferent terms, or the terms of an existing liability are substantially modified, such an exchange ormodification is treated as a derecognition of the original liability and the recognition of a newliability. The difference between the carrying value of the original financial liability and the fairvalue of the new liability is recognized in profit or loss.
When the exchange or modification of the existing financial liability is not considered as substantial,the Group recalculates the gross carrying amount of the financial liability as the present value of therenegotiated or modified contractual cash flows discounted at the original EIR and recognizes amodification gain or loss in profit or loss.
If modification of terms is accounted for as an extinguishment, any costs or fees incurred arerecognized as part of the gain or loss on the extinguishment. If the modification is not accounted foras an extinguishment, any costs or fees incurred adjust the carrying amount of the financialinstrument and are amortized over the remaining term of the modified financial instrument.
Financial Guarantees and Undrawn Loan CommitmentsThe Group issues financial guarantees and loan commitments. Financial guarantees are those issuedby the Group to creditors as allowed under existing rules and regulations whereby it guarantees thirdparty obligations by signing as guarantor in the contract/agreement. Undrawn loan commitments andletters of credit are commitments under which the Group is required, over the duration of thecommitment, to provide a loan with pre-specified terms to the customer. The nominal contractualvalue of financial guarantees and undrawn loan commitments, where the loan agreed to be provided ison market terms, are not recorded in the statement of financial position. These contracts are in thescope of the ECL requirements where the Group estimates the expected portion of the undrawn loancommitments that will be drawn over their expected life. The ECL related to loan commitments isrecognized in ‘Other liabilities’.
Write-offsFinancial assets are written off either partially or in their entirety when the Group no longer expectscollections or recoveries within a foreseeable future. If the amount to be written off is greater thanthe accumulated loss allowance, the difference is first treated as an addition to the allowance that isthen applied against the gross carrying amount. Any subsequent recoveries are credited to the‘Miscellaneous income’ account.
Investment in AssociatesAssociates pertain to all entities over which the Group has significant influence, but not control,generally accompanying a shareholding of between 20.00% and 50.00% of the voting rights. In theconsolidated and parent company financial statements, investments in associates are accounted forunder the equity method of accounting.
Under the equity method, an investment in an associate is carried in the balance sheet at cost pluspost-acquisition changes in the Group’s share of the net assets of the associates. Goodwill, if any,relating to an associate is included in the carrying value of the investment and is not amortized. Thestatement of income reflects the share of the results of operations of the associate. Where there hasbeen a change recognized directly in the equity of the associate, the Group recognizes its share of anychanges and discloses this, when applicable, in the statement of changes in equity.
When the Group’s share of losses in an associate equals or exceeds its interest in the associate,including any other unsecured receivables, the Group does not recognize further losses, unless it hasincurred obligations or made payments on behalf of the associate. Profits or losses resulting from
117

- 16 -
*SGVFS162381*
transactions between the Group and an associate are eliminated to the extent of the interest in theassociate.
Dividends earned on this investment are recognized as a reduction from the carrying value of theinvestment.
The financial statements of the associate are prepared for the same reporting period as the ParentCompany. Where necessary, adjustments are made to bring the accounting policies in line with thoseof the Group.
Upon loss of significant influence over the associate, the Group measures and recognizes any retainedinvestment at its fair value. Any difference between the carrying amount of the associate upon loss ofsignificant influence and the fair value of the retained investment and proceeds from disposal isrecognized in profit or loss.
Investment in SubsidiariesIn the parent company financial statements, investment in subsidiaries is accounted for under theequity method of accounting similar to the investment in associates.
Business Combinations and GoodwillBusiness combinations are accounted for using the acquisition method. The cost of an acquisition ismeasured as the aggregate of the consideration transferred, measured at acquisition date fair value,and the amount of any non-controlling interest in the acquiree. For each business combination, theacquirer measures the non-controlling interest in the acquiree either at fair value or at theproportionate share of the acquiree’s identifiable net assets. Acquisition costs incurred are charged toprofit or loss.
When the Group acquires a business, it assesses the financial assets and liabilities assumed forappropriate classification and designation in accordance with the contractual terms, economiccircumstances, and pertinent conditions as at the acquisition date. This includes the separation ofembedded derivatives in host contracts by the acquiree.
If the business combination is achieved in stages, the acquisition date fair value of the acquirer’spreviously held equity interest in the acquiree is remeasured to fair value at the acquisition datethrough profit or loss.
Any contingent consideration to be transferred by the acquirer will be recognized at fair value at theacquisition date. Subsequent changes to the fair value of the contingent consideration which isdeemed to be an asset or liability, will be recognized in accordance with PFRS 9, either in profit orloss or as a charge to OCI. If the contingent consideration is classified as equity, it should not beremeasured until it is finally settled within equity.
Goodwill is initially measured at cost, being the excess of the aggregate of fair value of theconsideration transferred and the amount recognized for non-controlling interest over the netidentifiable assets acquired and liabilities assumed. If this consideration is lower than the fair valueof the net assets of the subsidiary acquired, the difference is recognized in profit or loss as gain onbargain purchase under ‘Miscellaneous income’.
118
- 17 -
*SGVFS162381*
After initial recognition, goodwill is measured at cost less any accumulated impairment losses.
Goodwill is tested for impairment annually or more frequently if events or changes in circumstancesindicate the carrying value may be impaired. For the purpose of impairment testing, goodwillacquired in a business combination is, from the date of acquisition, allocated to each of the Group’sCGUs, or groups of CGUs, that are expected to benefit from the synergies of the combination,irrespective of whether other assets or liabilities of the acquiree are assigned to those units or group ofunits. Each unit or group of units to which the goodwill is allocated:
represents the lowest level within the Group at which the goodwill is monitored for internalmanagement purposes; and
is not larger than an operating segment identified for segment reporting purposes.
Where goodwill forms part of a CGU (or group of CGUs) and part of the operation within that unit isdisposed of, the goodwill associated with the operation disposed of is included in the carrying amountof the operation when determining the gain or loss on disposal of the operation. Goodwill disposed ofin this circumstance is measured based on the relative values of the operation disposed of and theportion of the CGU retained.
Cash Dividend and Non-cash Distribution to Equity Holders of the Parent CompanyThe Group recognizes a liability to make cash or non-cash distributions to equity holders of theParent Company when the distribution is authorized and the distribution is no longer at the discretionof the Group. A corresponding amount is recognized directly in equity.
Non-cash distributions are measured at the fair value of the assets to be distributed, with fair valueremeasurement recognized directly in equity.
Upon distribution of non-cash assets, any difference between the carrying amount of the liabilityand the carrying amount of the assets distributed is recognized in the statement of income.
Bank Premises, Furniture, Fixtures and EquipmentLand is stated at cost less any impairment in value while depreciable properties such as buildings,leasehold improvements, and furniture, fixtures and equipment are stated at cost less accumulateddepreciation and amortization, and any impairment in value. Such cost includes the cost of replacingpart of the bank premises, furniture, fixtures and equipment when that cost is incurred and if therecognition criteria are met, but excluding repairs and maintenance costs.
Construction-in-progress is stated at cost less any impairment in value. The initial cost comprises itsconstruction cost and any directly attributable costs of bringing the asset to its working condition andlocation for its intended use, including borrowing costs. Construction-in-progress is not depreciateduntil such time that the relevant assets are completed and put into operational use.
Depreciation and amortization is calculated using the straight-line method over the estimated usefullife (EUL) of the depreciable assets as follows:
EULBuildings 50 yearsFurniture, fixtures and equipment 3 to 5 yearsLeasehold improvements Shorter of 6 years or the
related lease terms
119
- 18 -
*SGVFS162381*
The depreciation and amortization method and useful life are reviewed periodically to ensure that themethod and period of depreciation and amortization are consistent with the expected pattern ofeconomic benefits from items of bank premises, furniture, fixtures and equipment and leaseholdimprovements.
An item of bank premises, furniture, fixtures and equipment is derecognized upon disposal or whenno future economic benefits are expected from its use or disposal. Any gain or loss arising onderecognition of the asset (calculated as the difference between the net disposal proceeds and thecarrying amount of the asset) is included in the statement of income in the year the asset isderecognized.
Investment PropertiesInvestment properties include real properties acquired in settlement of loans and receivables whichare measured initially at cost, including certain transaction costs. Investment properties acquiredthrough a nonmonetary asset exchange is measured initially at fair value unless (a) the exchange lackscommercial substance or (b) the fair value of neither the asset received nor the asset given up isreliably measurable. The difference between the fair value of the investment property uponforeclosure and the carrying value of the loan is recognized under ‘Gain on asset foreclosure anddacion transactions’ in the statement of income. Subsequent to initial recognition, depreciableinvestment properties are stated at cost less accumulated depreciation and any accumulatedimpairment in value except for land which is stated at cost less impairment in value.
Expenditures incurred after the investment properties have been put into operation, such as repairsand maintenance costs, are normally charged against income in the period in which the costs areincurred.
Depreciation is calculated on a straight-line basis using the remaining EUL of the building andimprovement components of investment properties which ranged from 10 to 33 years from the time ofacquisition of the investment properties.
Investment properties are derecognized when they have either been disposed of or when theinvestment properties are permanently withdrawn from use and no future benefit is expected fromtheir disposal. Any gains or losses on the derecognition of an investment property are recognized as‘Gain on sale of investment properties’ in the statement of income in the year of derecognition.
Transfers are made to investment properties when, and only when, there is a change in use evidencedby ending of owner occupation, commencement of an operating lease to another party or ending ofconstruction or development. Transfers are made from investment properties when, and only when,there is a change in use evidenced by commencement of owner occupation or commencement ofdevelopment with a view to sale.
Intangible AssetsIntangible assets include software cost and branch licenses resulting from the Parent Company’sacquisition of CBSI, Unity Bank and PDB (Notes 11 and 14).
Software costsCosts related to software purchased by the Group for use in operations are amortized on a straight-line basis over 3 to 10 years. The amortization method and useful life are reviewed periodically toensure that the method and period of amortization are consistent with the expected pattern ofeconomic benefits embodied in the asset.
120

- 19 -
*SGVFS162381*
Branch licensesThe branch licenses are initially measured at cost as of the date of acquisition (at fair value if part ofassets acquired in a business combination) and are deemed to have an indefinite useful life as there isno foreseeable limit to the period over which they are expected to generate net cash inflows for theGroup.
Such intangible assets are not amortized, instead they are tested for impairment annually eitherindividually or at the CGU level. Impairment is determined by assessing the recoverable amount ofeach CGU (or group of CGUs) to which the intangible asset relates. Recoverable amount representsthe CGU’s value in use. Where the recoverable amount of the CGU is less than its carrying amount,an impairment loss is recognized.
Gains and losses arising from derecognition of an intangible asset are measured as the differencebetween the net disposal proceeds and the carrying amount of the asset and are recognized in earningswhen the asset is derecognized.
Exchange Trading RightExchange trading right is a result of the Philippine Stock Exchange (PSE) conversion plan, asdiscussed in Note 14, to preserve access of CBCSec to the trading facilities and continue transactingbusiness in the PSE. Exchange trading right is carried at original cost less any allowance forimpairment loss. CBCSec does not intend to sell the exchange trading right in the near future.
The exchange trading right is an intangible asset that is regarded as having an indefinite useful life asthere is no foreseeable limit to the period over which this asset is expected to generate net cashinflows for the Group but is tested annually for any impairment in realizable value.
Impairment of Non-financial AssetsAt each reporting date, the Group assesses whether there is any indication that its non-financial assets(e.g., investment in associates, investment properties, bank premises, furniture, fixtures andequipment, goodwill and intangible assets) may be impaired. When an indicator of impairment existsor when an annual impairment testing for an asset is required, the Group makes a formal estimate ofrecoverable amount.
Recoverable amount is the higher of an asset’s (or CGU’s) fair value less costs to sell and its value inuse and is determined for an individual asset, unless the asset does not generate cash inflows that arelargely independent of those from other assets or groups of assets, in which case the recoverableamount is assessed as part of the CGU to which it belongs. Where the carrying amount of an asset (orCGU) exceeds its recoverable amount, the asset (or CGU) is considered impaired and is written downto its recoverable amount. In assessing value in use, the estimated future cash flows are discounted totheir present value using a pre-tax discount rate that reflects current market assessments of the timevalue of money and the risks specific to the asset (or CGU).
An impairment loss is charged to operations in the year in which it arises.
For non-financial assets, excluding goodwill and branch licenses, an assessment is made at eachreporting date as to whether there is any indication that previously recognized impairment losses mayno longer exist or may have decreased. If such indication exists, the recoverable amount is estimated.A previously recognized impairment loss is reversed, except for goodwill, only if there has been achange in the estimates used to determine the asset’s recoverable amount since the last impairmentloss was recognized. If that is the case, the carrying amount of the asset is increased to its recoverableamount. That increased amount cannot exceed the carrying amount that would have been determined,net of depreciation, had no impairment loss been recognized for the asset in prior years. Such
121

- 20 -
*SGVFS162381*
reversal is recognized in the statement of income. After such a reversal, the depreciation expense isadjusted in future years to allocate the asset’s revised carrying amount, less any residual value, on asystematic basis over its remaining life.
Accounting Policy on LeasesThe Group assesses at contract inception whether a contract is, or contains, a lease. That is, if thecontract conveys the right to control the use of an identified asset for a period of time in exchange forconsideration.
Group as a lesseeThe Group applies a single recognition and measurement approach for all leases, except for short-term leases and leases of low-value assets. The Group recognizes lease liabilities to make leasepayments and right-of-use assets representing the right to use the underlying assets.
i) Right-of-use assetsThe Group recognizes right-of-use assets at the commencement date of the lease (i.e., the date theunderlying asset is available for use). Right-of-use assets are measured at cost, less any accumulateddepreciation and impairment losses, and adjusted for any remeasurement of lease liabilities. The costof right-of-use assets includes the amount of lease liabilities recognized adjusted by lease paymentsmade at or before the commencement date and lease incentives received. Right-of-use assets aredepreciated on a straight-line basis over the shorter of the lease term and the estimated useful lives ofthe depreciable assets. The depreciation expense is presented under ‘Depreciation and Amortization’in the statement of income.
If ownership of the leased asset transfers to the Group at the end of the lease term or the cost reflectsthe exercise of a purchase option, depreciation is calculated using the estimated useful life of theasset.
The right-of-use assets are also subject to impairment. Refer to the accounting policies onImpairment of Non-financial Assets.
ii) Lease liabilitiesAt the commencement date of the lease, the Group recognizes lease liabilities measured at the presentvalue of lease payments to be made over the lease term. The lease payments include fixed payments(including in-substance fixed payments) less any lease incentives receivable, variable lease paymentsthat depend on an index or a rate, and amounts expected to be paid under residual value guarantees.The lease payments also include the exercise price of a purchase option reasonably certain to beexercised by the Group and payments of penalties for terminating the lease, if the lease term reflectsthe Group exercising the option to terminate. Variable lease payments that do not depend on an indexor a rate are recognized as expenses in the period in which the event or condition that triggers thepayment occurs. In calculating the present value of lease payments, the Group uses its incrementalborrowing rate at the lease commencement date because the interest rate implicit in the lease is notreadily determinable. After the commencement date, the amount of lease liabilities is increased toreflect the accretion of interest and reduced for the lease payments made. In addition, the carryingamount of lease liabilities is remeasured if there is a modification, a change in the lease term, achange in the lease payments (e.g., changes to future payments resulting from a change in an index orrate used to determine such lease payments), or a change in the assessment of an option to purchasethe underlying asset.
iii) Short-term leases and leases of low-value assetsThe Group applies the short-term lease recognition exemption to its short-term leases of ATM sites(i.e., those leases that have a lease term of 12 months or less from the commencement date and do not
122
- 21 -
*SGVFS162381*
contain a purchase option). It also applies the lease of low-value assets recognition exemption toleases of ATM sites that are considered to be low value. Lease payments on short-term leases andleases of low value assets are recognized as expense on a straight-line basis over the lease term.
Group as a lessorLeases in which the Group does not transfer substantially all the risks and rewards incidental toownership of an asset are classified as operating leases. Rental income arising from leased propertiesis accounted for on a straight-line basis over the lease terms and is included in revenue in thestatement of income due to its operating nature. Initial direct costs incurred in negotiating andarranging an operating lease are added to the carrying amount of the leased asset and recognized overthe lease term on the same basis as rental income. Contingent rents are recognized as revenue in theperiod in which they are earned.
Capital StockCapital stocks are recorded at par. Proceeds in excess of par value are recognized under equity as‘Capital paid in excess of par value’ in the balance sheet. Incremental costs incurred which aredirectly attributable to the issuance of new shares are shown in equity as a deduction from proceeds,net of tax.
Revenue Recognition
Revenues within the scope of PFRS 15, Revenue from Contracts with CustomersRevenue from contract with customers is recognized upon transfer of promised goods or services tocustomers at an amount that reflects the consideration to which an entity expects to be entitled inexchange for transferring goods or services to a customer. The Group and the Parent Companyexercise judgment, taking into consideration all of the relevant facts and circumstances, when applyingeach step of the five-step model to contracts with customers.
The following specific recognition criteria must be met before revenue is recognized for contractswithin the scope of PFRS 15:
Fee and commission incomeThe Group earns fee and commission income from a diverse range of services it provides to itscustomers. Fee income can be divided into the following two categories:
a. Fee income earned from services that are provided over a certain period of timeFees earned for the provision of services over a period of time are accrued over that period. Thesefees include investment fund fees, custodian fees, fiduciary fees, credit-related fees, assetmanagement fees, portfolio and other management fees, and advisory fees.
b. Fee income from providing transactions servicesFees arising from negotiating or participating in the negotiation of a transaction for a third party -such as commission income, underwriting fees, corporate finance fees, and brokerage fees for thearrangement of the acquisition of shares or other securities or the purchase or sale of businesses -are recognized on completion of the underlying transaction. Fees or components of fees that arelinked to a certain performance are recognized after fulfilling the corresponding criteria.
Loan syndication fees are recognized in the statement of income when the syndication has beencompleted and the Group retains no part of the loans for itself or retains part at the same EIR as forthe other participants.
123
- 22 -
*SGVFS162381*
Service charges and penaltiesService charges and penalties are recognized only upon collection or accrued where there is areasonable degree of certainty as to their collectability.
Other incomeIncome from sale of service is recognized upon rendition of the service. Income from sale ofproperties is recognized when control has been transferred to the counterparty and when thecollectability of the sales price is reasonably assured.
Revenues outside the scope of PFRS 15
Interest incomeFor all interest-bearing financial assets, interest income is recorded either (i) at EIR, which is the ratethat exactly discounts estimated future cash payments or receipts through the expected life of thefinancial instrument or a shorter period, where appropriate, to the net carrying amount of the financialasset or financial liability, or (ii) at rate stated in the contract. The calculation takes into account allcontractual terms of the financial instrument (for example, prepayment options), includes any fees orincremental costs that are directly attributable to the instrument and are an integral part of the EIR, asapplicable, but not future credit losses. The adjusted carrying amount is calculated based on theoriginal EIR. The change in carrying amount is recorded as ‘Interest income’. Loan commitmentfees for loans that are likely to be drawn down are deferred (together with any incremental costs) andrecognized as an adjustment to the EIR on the loan. If the commitment expires without the Groupmaking the loan, the commitment fees are recognized as other income on expiry.
Once the recorded value of a financial asset or group of similar financial assets has been reduced dueto an impairment loss, interest income continues to be recognized using the original EIR applied tothe new carrying amount.
Dividend incomeDividend income is recognized when the Group’s right to receive payment is established.
Trading and securities gain (loss) - netThis represents results arising from trading activities and sale of FVOCI debt financial assets.
Gain on disposal of investment securities at amortized costThis represents results arising from sale of investment securities measured at amortized cost.
Expense RecognitionExpense is recognized when it is probable that a decrease in future economic benefits related to adecrease in an asset or an increase in liability has occurred and the decrease in economic benefits canbe measured reliably. Revenues and expenses that relate to the same transaction or other event arerecognized simultaneously.
Interest expenseInterest expense for all interest-bearing financial liabilities are recognized in ‘Interest expense’ in thestatement of income using the EIR of the financial liabilities to which they relate.
Operating expensesOperating expenses constitute costs which arise in the normal business operation and are recognizedwhen incurred.
124

- 23 -
*SGVFS162381*
Taxes and licensesThis includes all other taxes, local and national, including gross receipts taxes (GRT), documentarystamp taxes, real estate taxes, licenses and permit fees and are recognized when incurred.
Retirement Benefits
Defined benefit planThe net defined benefit liability or asset is the aggregate of the present value of the defined benefitobligation at the end of the reporting period reduced by the fair value of plan assets and adjusted forany effect of limiting a net defined benefit asset to the asset ceiling. The defined benefit obligation iscalculated annually by an independent actuary. The present value of the defined benefit obligation isdetermined by discounting the estimated future cash outflows using interest rates on governmentbonds that have terms to maturity approximating the terms of the related retirement liability. Theasset ceiling is the present value of any economic benefits available in the form of refunds from theplan or reductions in future contributions to the plan.
The cost of providing benefits under the defined benefit plans is actuarially determined using theprojected unit credit method.
Defined benefit costs and remeasurements comprise the following:
(a) service cost;(b) net interest on the net defined benefit liability or asset; and(c) remeasurements of net defined benefit liability or asset.
Service costs which include current service costs, past service costs, and gains or losses on non-routine settlements are recognized as expense in profit or loss. Past service costs are recognizedwhen plan amendment or curtailment occurs.
Net interest on the net defined benefit liability or asset is the change during the period in the netdefined benefit liability or asset that arises from the passage of time which is determined by applyingthe discount rate based on Philippine government bonds to the net defined benefit liability or asset.Net interest on the net defined benefit liability or asset is recognized as expense or income in profit orloss.
Remeasurements comprising actuarial gains and losses, return on plan assets and any change in theeffect of the asset ceiling (excluding net interest on defined benefit liability) are recognizedimmediately in OCI in the period in which they arise. Remeasurements are not reclassified to profitor loss in subsequent periods.
Plan assets are assets that are held by a long-term employee benefit fund. Plan assets are notavailable to the creditors of the Group, nor can they be paid directly to the Group. The fair value ofplan assets is based on market price information. When no market price is available, the fair value ofplan assets is estimated by discounting expected future cash flows using a discount rate that reflectsboth the risk associated with the plan assets and the maturity or expected disposal date of those assets(or, if they have no maturity, the expected period until the settlement of the related obligations).
The Group’s right to be reimbursed of some or all of the expenditure required to settle a definedbenefit obligation is recognized as a separate asset at fair value when, and only when, reimbursementis virtually certain. If the fair value of the plan assets is higher than the present value of the definedbenefit obligation, the measurement of the resulting defined benefit asset is limited to the present
125

- 24 -
*SGVFS162381*
value of economic benefits available in the form of refunds from the plan or reductions in futurecontributions to the plan.
Employee leave entitlementEmployee entitlements to annual leave are recognized as a liability when they are accrued to theemployees. The undiscounted liability for leave expected to be settled after the end of the annualreporting period is recognized for services rendered by employees up to the end of the reportingperiod.
Share-based Payments (Stock Grants)Employees (including senior executives) of the Group receive remuneration in the form of share-based payments (stock grants), whereby employees render services as consideration for equityinstruments (equity-settled transactions).
Equity-settled transactionsThe cost of equity-settled transactions is determined by the fair value at the date when the grant ismade using an appropriate valuation model. That cost is recognized in employee benefits expense,together with a corresponding increase in equity (other capital reserves), over the period in which theservice and, where applicable, the performance conditions are fulfilled (the vesting period). Thecumulative expense recognized for equity-settled transactions at each reporting date until the vestingdate reflects the extent to which the vesting period has expired and the Group’s best estimate of thenumber of equity instruments that will ultimately vest. The expense or credit in the statement ofincome for a period represents the movement in cumulative expense recognized as at the beginningand end of that period.
Service and non-market performance conditions are not taken into account when determining thegrant date fair value of awards, but the likelihood of the conditions being met is assessed as part ofthe Group’s best estimate of the number of equity instruments that will ultimately vest. Marketperformance conditions are reflected within the grant date fair value. Any other conditions attachedto an award, but without an associated service requirement, are considered to be non-vestingconditions. Non-vesting conditions are reflected in the fair value of an award and lead to animmediate expensing of an award unless there are also service and/or performance conditions. Noexpense is recognized for awards that do not ultimately vest because non-market performance and/orservice conditions have not been met. Where awards include a market or non-vesting condition, thetransactions are treated as vested irrespective of whether the market or non-vesting condition issatisfied, provided that all other performance and/or service conditions are satisfied. When the termsof an equity-settled award are modified, the minimum expense recognized is the grant date fair valueof the unmodified award, provided the original vesting terms of the award are met. An additionalexpense, measured as at the date of modification, is recognized for any modification that increases thetotal fair value of the share-based payment transaction, or is otherwise beneficial to the employee.Where an award is cancelled by the Group or by the counterparty, any remaining element of the fairvalue of the award is expensed immediately through profit or loss.
When the equity-settled transactions vest immediately but the grant date is not yet determined as ofreporting date, the Group recognizes the expense and the corresponding increase in equity using theestimated grant date fair value as of reporting date. Subsequently, once the grant date is determined,the Group revises the estimate based on the actual grant date fair value.
Provisions and ContingenciesProvisions are recognized when the Group has a present obligation (legal or constructive) as a resultof a past event and it is probable that an outflow of resources embodying economic benefits will berequired to settle the obligation and a reliable estimate can be made of the amount of the obligation.
126
- 25 -
*SGVFS162381*
Where the Group expects some or all of a provision to be reimbursed, for example, under aninsurance contract, the reimbursement is recognized as a separate asset but only when thereimbursement is virtually certain. The expense relating to any provision is presented in thestatement of income, net of any reimbursement. If the effect of the time value of money is material,provisions are determined by discounting the expected future cash flows at a pre-tax rate that reflectscurrent market assessments of the time value of money and, where appropriate, the risks specific tothe liability. Where discounting is used, the increase in the provision due to the passage of time isrecognized as an interest expense.
Contingent liabilities are not recognized in the financial statements but are disclosed, unless thepossibility of an outflow of resources embodying economic benefits is remote. Contingent assets arenot recognized but are disclosed in the financial statements when an inflow of economic benefits isprobable.
Income Taxes
Current taxCurrent tax assets and liabilities for the current and prior periods are measured at the amount expectedto be recovered from or paid to the taxation authorities. The tax rates and tax laws used to computethe amount are those that are enacted or substantively enacted as of the reporting date. EffectiveJanuary 1, 2019, management periodically evaluates positions taken in the tax return with respect tosituations in which applicable tax regulations are subject to interpretations and establishes provisionswhere appropriate.
Deferred taxDeferred tax is provided, using the balance sheet liability method, on all temporary differences at thereporting date between the tax bases of assets and liabilities and their carrying amounts for financialreporting purposes.
Deferred tax liabilities are recognized for all taxable temporary differences. Deferred tax assets arerecognized for all deductible temporary differences, carry forward of unused tax credits from theexcess of minimum corporate income tax (MCIT) over the regular corporate income tax (RCIT), andunused net operating loss carryover (NOLCO), to the extent that it is probable that sufficient taxableprofit will be available against which the deductible temporary differences and carry forward ofunused tax credits from MCIT and unused NOLCO can be utilized. Deferred tax, however, is notrecognized on temporary differences that arise from the initial recognition of an asset or liability in atransaction that is not a business combination and, at the time of the transaction, affects neither theaccounting income nor taxable income.
Deferred tax liabilities are not provided on non-taxable temporary differences associated withinvestments in domestic subsidiaries and associates.
The carrying amount of deferred tax assets is reviewed at each reporting date and reduced to theextent that it is no longer probable that sufficient taxable profit will be available to allow all or part ofthe deferred tax asset to be utilized. Unrecognized deferred tax assets are reassessed at each reportingdate and are recognized to the extent that it has become probable that future taxable profit will allowthe deferred tax asset to be recovered.
127

- 26 -
*SGVFS162381*
Deferred tax assets and liabilities are measured at the tax rates that are applicable to the period whenthe asset is realized or the liability is settled, based on tax rates (and tax laws) that have been enactedor substantively enacted at the reporting date.
Current tax and deferred tax relating to items recognized directly in equity is also recognized inequity and not in the statement of income.
Deferred tax assets and deferred tax liabilities are offset if a legally enforceable right exists to set offcurrent tax assets against current tax liabilities and deferred taxes relate to the same taxable entity andthe same taxation authority.
Earnings per ShareBasic earnings per share (EPS) is computed by dividing net income for the year by the weightedaverage number of common shares outstanding during the year after giving retroactive effect to stocksplits, stock dividends declared and stock rights exercised during the year, if any.
The Parent Company computes diluted EPS when there are outstanding dilutive potential commonshares. Diluted EPS is computed by adjusting both the net income for the year and the weightedaverage number of common shares outstanding during the year with the impact of the dilutivepotential common stock issuance transaction.
Dividends on Common SharesDividends on common shares are recognized as a liability and deducted from equity when approvedby the respective shareholders of the Parent Company and its subsidiaries. Dividends declared duringthe year that are approved after the reporting date are dealt with as an event after the reporting date.
Segment ReportingThe Group’s operating businesses are organized and managed separately according to the nature ofthe products and services provided, with each segment representing a strategic business unit thatoffers different products and serves different markets. Financial information on business segments ispresented in Note 32. The Group’s revenue-producing assets are located in the Philippines (i.e., onegeographical location). Therefore, geographical segment information is no longer presented.
Fiduciary ActivitiesAssets and income arising from fiduciary activities together with related undertakings to return suchassets to customers are excluded from the financial statements where the Parent Company acts in afiduciary capacity such as nominee, trustee, or agent.
Events after the Reporting PeriodAny post year-end events that provide additional information about the Group’s position at thereporting date (adjusting event) are reflected in the Group’s financial statements. Post year-endevents that are not adjusting events, if any, are disclosed when material to the financial statements.
Standards Issued but Not Yet EffectiveThere are new PFRSs, amendments, interpretation and annual improvements, to existing standardswhich are effective for annual periods subsequent to 2021. Management will adopt the followingrelevant pronouncements in accordance with their transitional provisions; and, unless otherwisestated, none of these are expected to have significant impact on the Group’s financial statements:
128
- 27 -
*SGVFS162381*
Effective beginning on or after January 1, 2022 Amendments to PFRS 3, Reference to the Conceptual Framework
The amendments are intended to replace a reference to the Framework for the Preparation andPresentation of Financial Statements, issued in 1989, with a reference to the ConceptualFramework for Financial Reporting issued in March 2018 without significantly changing itsrequirements. The amendments added an exception to the recognition principle of PFRS 3,Business Combinations to avoid the issue of potential ‘day 2’gains or losses arising for liabilitiesand contingent liabilities that would be within the scope of PAS 37, Provisions, ContingentLiabilities and Contingent Assets or Philippine-IFRIC 21, Levies, if incurred separately.
At the same time, the amendments add a new paragraph to PFRS 3 to clarify that contingentassets do not qualify for recognition at the acquisition date.
The amendments are effective for annual reporting periods beginning on or after January 1, 2022and apply prospectively.
Amendments to PAS 16, Plant and Equipment: Proceeds before Intended Use
The amendments prohibit entities deducting from the cost of an item of property, plant andequipment, any proceeds from selling items produced while bringing that asset to the location andcondition necessary for it to be capable of operating in the manner intended by management.Instead, an entity recognizes the proceeds from selling such items, and the costs of producingthose items, in profit or loss.
The amendment is effective for annual reporting periods beginning on or after January 1, 2022and must be applied retrospectively to items of property, plant and equipment made available foruse on or after the beginning of the earliest period presented when the entity first applies theamendment.
Amendments to PAS 37, Onerous Contracts – Costs of Fulfilling a Contract
The amendments specify which costs an entity needs to include when assessing whether acontract is onerous or loss-making. The amendments apply a “directly related cost approach”.The costs that relate directly to a contract to provide goods or services include both incrementalcosts and an allocation of costs directly related to contract activities. General and administrativecosts do not relate directly to a contract and are excluded unless they are explicitly chargeable tothe counterparty under the contract.
The amendments are effective for annual reporting periods beginning on or after January 1, 2022.The Group will apply these amendments to contracts for which it has not yet fulfilled all itsobligations at the beginning of the annual reporting period in which it first applies theamendments.
Annual Improvements to PFRSs 2018-2020 Cycle
Amendments to PFRS 1, First-time Adoption of Philippines Financial Reporting Standards,Subsidiary as a first-time adopter
129
- 28 -
*SGVFS162381*
The amendment permits a subsidiary that elects to apply paragraph D16(a) of PFRS 1 tomeasure cumulative translation differences using the amounts reported by the parent, basedon the parent’s date of transition to PFRS. This amendment is also applied to an associate orjoint venture that elects to apply paragraph D16(a) of PFRS 1.
The amendment is effective for annual reporting periods beginning on or afterJanuary 1, 2022 with earlier adoption permitted.
Amendments to PFRS 9, Financial Instruments, Fees in the ’10 per cent’ test forderecognition of financial liabilitiesThe amendment clarifies the fees that an entity includes when assessing whether the terms ofa new or modified financial liability are substantially different from the terms of the originalfinancial liability. These fees include only those paid or received between the borrower andthe lender, including fees paid or received by either the borrower or lender on the other’sbehalf. An entity applies the amendment to financial liabilities that are modified orexchanged on or after the beginning of the annual reporting period in which the entity firstapplies the amendment.
The amendment is effective for annual reporting periods beginning on or afterJanuary 1, 2022 with earlier adoption permitted. The Group will apply the amendments tofinancial liabilities that are modified or exchanged on or after the beginning of the annualreporting period in which the entity first applies the amendment.
Amendments to PAS 41, Agriculture, Taxation in fair value measurements
The amendment removes the requirement in paragraph 22 of PAS 41 that entities excludecash flows for taxation when measuring the fair value of assets within the scope ofPAS 41.
An entity applies the amendment prospectively to fair value measurements on or after thebeginning of the first annual reporting period beginning on or after January 1, 2022 withearlier adoption permitted.
Effective beginning on or after January 1, 2023 Amendments to PAS 12, Deferred Tax related to Assets and Liabilities arising from a Single
Transaction
The amendments narrow the scope of the initial recognition exception under PAS 12, so that it nolonger applies to transactions that give rise to equal taxable and deductible temporary differences.
The amendments also clarify that where payments that settle a liability are deductible for taxpurposes, it is a matter of judgement (having considered the applicable tax law) whether suchdeductions are attributable for tax purposes to the liability recognized in the financial statements(and interest expense) or to the related asset component (and interest expense).
An entity applies the amendments to transactions that occur on or after the beginning of theearliest comparative period presented for annual reporting periods on or afterJanuary 1, 2023.
130
- 29 -
*SGVFS162381*
Amendments to PAS 8, Definition of Accounting Estimates
The amendments introduce a new definition of accounting estimates and clarify the distinctionbetween changes in accounting estimates and changes in accounting policies and the correction oferrors. Also, the amendments clarify that the effects on an accounting estimate of a change in aninput or a change in a measurement technique are changes in accounting estimates if they do notresult from the correction of prior period errors.
An entity applies the amendments to changes in accounting policies and changes in accountingestimates that occur on or after January 1, 2023 with earlier adoption permitted. The amendmentsare not expected to have a material impact on the Group.
Amendments to PAS 1 and PFRS Practice Statement 2, Disclosure of Accounting Policies
The amendments provide guidance and examples to help entities apply materiality judgements toaccounting policy disclosures. The amendments aim to help entities provide accounting policydisclosures that are more useful by:
o Replacing the requirement for entities to disclose their ‘significant’ accounting policies with arequirement to disclose their ‘material’ accounting policies, and
o Adding guidance on how entities apply the concept of materiality in making decisions aboutaccounting policy disclosures
The amendments to the Practice Statement provide non-mandatory guidance. Meanwhile, theamendments to PAS 1 are effective for annual periods beginning on or after January 1, 2023.Early application is permitted as long as this fact is disclosed. The amendments are not expectedto have a material impact on the Group.
Effective beginning on or after January 1, 2024 Amendments to PAS 1, Classification of Liabilities as Current or Non-current
The amendments clarify paragraphs 69 to 76 of PAS 1, Presentation of Financial Statements, tospecify the requirements for classifying liabilities as current or non-current. The amendmentsclarify:
What is meant by a right to defer settlement; That a right to defer must exist at the end of the reporting period; That classification is unaffected by the likelihood that an entity will exercise its deferral right;
and That only if an embedded derivative in a convertible liability is itself an equity instrument
would the terms of a liability not impact its classification.
The amendments are effective for annual reporting periods beginning on or after January 1, 2023and must be applied retrospectively. However, in November 2021, the International AccountingStandards Board (IASB) tentatively decided to defer the effective date to no earlier thanJanuary 1, 2024.
Effective beginning on or after January 1, 2025 PFRS 17, Insurance Contracts
PFRS 17 is a comprehensive new accounting standard for insurance contracts coveringrecognition and measurement, presentation and disclosure. Once effective, PFRS 17 will replace
131

- 30 -
*SGVFS162381*
PFRS 4, Insurance Contracts. This new standard on insurance contracts applies to all types ofinsurance contracts (i.e., life, non-life, direct insurance and re-insurance), regardless of the type ofentities that issue them, as well as to certain guarantees and financial instruments withdiscretionary participation features. A few scope exceptions will apply.
The overall objective of PFRS 17 is to provide an accounting model for insurance contracts thatis more useful and consistent for insurers. In contrast to the requirements in PFRS 4, which arelargely based on grandfathering previous local accounting policies, PFRS 17 provides acomprehensive model for insurance contracts, covering all relevant accounting aspects. The coreof PFRS 17 is the general model, supplemented by:
A specific adaptation for contracts with direct participation features (the variable feeapproach)
A simplified approach (the premium allocation approach) mainly for short-duration contracts
On December 15, 2021, the FRSC amended the mandatory effective date of PFRS 17 fromJanuary 1, 2023 to January 1, 2025. This is consistent with Circular Letter No. 2020-62 issued bythe Insurance Commission which deferred the implementation of PFRS 17 by two (2) years afterits effective date as decided by the IASB.
PFRS 17 is effective for reporting periods beginning on or after January 1, 2025, withcomparative figures required. Early application is permitted.
3. Significant Accounting Judgments and Estimates
The preparation of the financial statements in accordance with PFRS requires the Group to makejudgments and estimates that affect the reported amounts of assets, liabilities, income, and expensesand disclosure of contingent assets and contingent liabilities at reporting date. Future events mayoccur which will cause the judgments and assumptions used in arriving at the estimates to change.The effects of any change in judgments and estimates are reflected in the financial statements as theybecome reasonably determinable.
Judgments and estimates are continually evaluated and are based on historical experience and otherfactors, including expectations of future events that are believed to be reasonable under thecircumstances.
Judgmentsa. Financial instruments
Where the fair values of financial assets and financial liabilities recorded on the balance sheet ordisclosed in the notes cannot be derived from active markets, they are determined usingdiscounted cash flow model, incorporating inputs such as current market rates of comparableinstruments. The carrying values and corresponding fair values of financial instruments, as wellas the manner in which fair values were determined, are discussed in more detail in Note 5.
b. ContingenciesThe Group is currently involved in various legal proceedings. The estimate of the probable costsfor the resolution of these claims has been developed in consultation with outside counselhandling the Group’s defense in these matters and is based upon an analysis of potential results.The Group currently does not believe that these proceedings will have a material adverse effecton the financial statements (Note 31).
132
- 31 -
*SGVFS162381*
c. Evaluation of business model in managing financial assetsThe Group manages its financial assets based on business models that maintain an adequate levelof financial assets to match its expected cash outflows, largely arising from customers’withdrawals and continuing loan disbursements to borrowers, while maintaining a strategicportfolio of financial assets for investment and trading activities consistent with its risk appetite.
The Group developed business models which reflect how it manages its portfolio of financialinstruments. The Group’s business models need not be assessed at the entity level or as a wholebut applied at the level of a portfolio of financial instruments (i.e., group of financial instrumentsthat are managed together by the Group) and not on an instrument-by-instrument basis (i.e., notbased on intention or specific characteristics of individual financial instrument).
In determining the classification of a financial instrument under PFRS 9, the Group evaluates inwhich business model a financial asset or a portfolio of financial assets belong to, taking intoconsideration the objectives of each business model established by the Group, various risks andkey performance indicators being reviewed and monitored by responsible officers, as well as themanner of compensation for them. The Group also considers the frequency, value, reasons, andtiming of past sales and expectation of future sales activity in this evaluation.
In addition, PFRS 9 emphasizes that if more than an infrequent and more than an insignificantsale is made out of a portfolio of financial assets carried at amortized cost, an entity should assesswhether and how such sales are consistent with the objective of collecting contractual cash flows.In making this judgment, the Group considers certain circumstances to assess that an increase inthe frequency or value of sales of financial instruments in a particular period is not necessarilyinconsistent with a held-to-collect business model if the Group can explain the reasons for thosesales and why those sales do not reflect a change in the Group’s objective for the business model.
The business model assessment is based on reasonably expected scenarios without taking worstcase or stress case scenarios into account. If cash flows, after initial recognition, are realized in away that is different from the Group’s and the Parent Company’s original expectations, the Groupand the Parent Company does not change the classification of the remaining financial assets heldin that business model but incorporates such information when assessing newly originated ornewly purchased financial assets going forward; unless a change in business model has takenplace, in such case, reclassification is necessary.
In 2021 and 2020, the Parent Company sold investment securities at amortized cost whosecarrying values prior to the sale amounted P=55.77 billion and P=30.14 billion at a net gain ofP=4.06 billion and P=2.19 billion, respectively. In 2019, the Group and the Parent Company soldinvestment securities at amortized cost whose carrying values prior to the sale amounted toP=18.62 billion at a net gain of P=1.38 billion and P=13.33 billion at a net gain of P=1.30 billion,respectively. The reasons for the disposals are disclosed in Note 9.
The above disposals in 2021, 2020, and 2019 were assessed by the Group and Parent Company asnot inconsistent with the portfolios’ business models considering the conditions and reasons forwhich the disposals were made. Further, these disposals did not result in a change in businessmodel and the remaining securities in the affected portfolios continue to be accounted for atamortized cost (see Note 9).
133
- 32 -
*SGVFS162381*
d. Testing the cash flow characteristics of financial assetsIn determining the classification of financial assets under PFRS 9, the Group assesses whether thecontractual terms of the financial assets give rise on specified dates to cash flows that are SPPI onthe principal amount outstanding, with interest representing time value of money and credit riskassociated with the principal amount outstanding. The assessment as to whether the cash flowsmeet the test is made in the currency in which the financial asset is denominated. Any othercontractual term that changes the timing or amount of cash flows (unless it is a variable interestrate that represents time value of money and credit risk), i.e., cash flows that are non-SPPI, doesnot meet the amortized cost criteria. In cases where the relationship between the passage of timeand the interest rate of the financial instrument may be imperfect, known as modified time valueof money, the Group assesses the modified time value of money feature to determine whether thefinancial instrument still meets the SPPI criterion. The objective of the assessment is todetermine how different the undiscounted contractual cash flows could be from the undiscountedcash flows that would arise if the time value of money element was not modified (the benchmarkcash flows). If the resulting difference is significant, the SPPI criterion is not met. In view ofthis, the Group considers the effect of the modified time value of money element in eachreporting period and cumulatively over the life of the financial instrument.
e. Hedge accountingIn 2019, the Parent Company designated the hedge relationship between its floating rate bondpayable (see Note 18) and an interest rate swap as a cash flow hedge. In addition, in 2021, theParent Company designated the hedge relationships between (i) the interest rate risk componentof its Treasury time deposits and Retail Banking Business Segment (RBB) time deposits and (ii)interest rate swaps as cash flow hedges.
The Parent Company’s hedge accounting policies include an element of judgment and estimation,in particular, in respect of the existence of highly probable cash flows for inclusion within thecash flow hedge. Estimates of future interest rates and the general economic environment willinfluence the availability and timing of suitable hedged items, with an impact on the effectivenessof the hedge relationships. Details of the Parent Company’s hedging transactions are described inNote 26.
The Parent Company applies the temporary reliefs provided by the IBOR reform Phase 1amendments, which enable its hedge accounting to continue during the period of uncertainty,before the replacement of an existing interest rate benchmark with an alternative nearly RFR. Forthe purpose of determining whether a forecast transaction is highly probable, the reliefs require itto be assumed that the IBOR on which the hedged cash flows are based is not altered as a resultof the IBOR reform. The reliefs end when the Parent Company judges that the uncertainty arisingfrom IBOR reform is no longer present for the hedging relationships referenced to IBORs. Thisapplies when the hedged item has already transitioned from IBOR to an RFR and also toexposures that will transition via fallback to an RFR when one-week and two-month LIBORscease on January 1, 2022. The cessation of these LIBORs does not have an impact on the ParentCompany’s existing hedge relationships.
The IBOR reform Phase 2 amendments provide temporary reliefs to enable the Parent Company’shedge accounting to continue upon the replacement of an IBOR with an RFR.
134
- 33 -
*SGVFS162381*
Estimatesa. Expected credit losses on financial assets and commitments
The Group reviews its debt financial assets and commitments at each reporting date to determinethe amount of ECL to be recognized in the balance sheet and any changes thereto in the statementof income. Additional considerations were made in estimating the ECL in response to thechanging credit environment brought about by the coronavirus (COVID-19) pandemic. Inparticular, judgments and estimates by management are required in determining:
whether a financial asset has had a significant increase in credit risk since initial recognition.Note 6 discusses how the Group considered the impact of COVID-19 pandemic in its creditrisk management and allowance provisioning;
whether a default has taken place and what comprises a default; macro-economic factors that are relevant in measuring a financial asset’s probability of
default as well as the Group’s forecast of these macro-economic factors; probability weights applied over a range of possible outcomes such as slow or early recovery
from the impact of COVID-19 pandemic; sufficiency and appropriateness of data used and relationships assumed in building the
components of the Group’s expected credit loss models; and the measurement of the exposure at default for unused commitments on which an expected
credit loss should be recognized and the applicable loss rate.
The related allowance for credit losses of financial assets and commitments of the Group and theParent Company are disclosed in Notes 16 and 21.
b. Impairment of goodwill and branch licensesThe Group performs impairment review of goodwill and branch licenses with indefinite usefullife annually or more frequently if events or changes in circumstances indicate that the carryingvalue may be impaired. Impairment is determined for goodwill and branch licenses by assessingthe recoverable amount of the cash generating unit (CGU) to which the goodwill and branchlicenses are attributed. The recoverable amount of the CGU is determined based on a value in use(VIU) calculation using cash flow projections from financial budgets approved by seniormanagement covering a five-year period. For VIU, the Group estimates the discount rate used forthe computation of the net present value by reference to the weighted cost of capital ofcomparable banks. The impairment assessment process requires significant judgment and isbased on assumptions, specifically loan and deposit growth rates, discount rate, and the long-termgrowth rates.
Where the recoverable amount is less than the carrying amount of the CGU to which goodwilland branch licenses have been allocated, an impairment loss is recognized immediately in thestatement of income. Impairment losses relating to goodwill cannot be reversed for subsequentincreases in its recoverable amount in future periods. The carrying values of the Group’sgoodwill and branch licenses are disclosed in Note 14.
135
- 34 -
*SGVFS162381*
c. Present value of defined benefit obligaton and retirement expenseThe determination of the Group’s net present value of defined benefit obligation and annualretirement expense is determined using actuarial valuations. An actuarial valuation involvesmaking assumptions that may differ from actual developments in the future. These assumptionsinclude, among others, discount rates and salary rates.
The assumed discount rates were determined using the market yields on Philippine governmentbonds with terms consistent with the expected employee benefit payout as of the reporting date.The salary increase rates were based on the Group’s expectations of future salary increases,which take into account the inflation, seniority and promotion
The present value of the defined benefit obligation, including the details of the assumptions usedin the calculation, are disclosed in Note 25.
d. Recognition of deferred income taxesDeferred tax assets are recognized for deductible temporary differences to the extent that it isprobable that taxable profit will be available against which the losses can be utilized.Management discretion is required to determine the amount of deferred tax assets that can berecognized, based on the forecasted level of future taxable profits and the related future taxplanning strategies. Key assumptions used in forecast of future taxable income include loanportfolio and deposit growth rates.
The Group believes it will be able to generate sufficient taxable income in the future to utilize itsrecorded deferred tax assets. Taxable income is sourced mainly from interest income fromlending activities and earnings from service charge, fees, commissions, and trust activities.
The recognized and unrecognized deferred tax assets are disclosed in Note 28.
e. Impairment on non-financial assetsThe Group assesses impairment on its non-financial assets (e.g., investment properties and bankpremises, furniture, fixtures and equipment) and considers the following impairment indicators:
significant underperformance relative to expected historical or projected future operatingresults;
significant changes in the manner of use of the acquired assets or the strategy for overallbusiness; and
significant negative industry or economic trends.
An impairment loss is recognized whenever the carrying amount of an asset exceeds itsrecoverable amount. Except for investment properties where recoverable amount is determinedbased on fair value less cost to sell, the recoverable amount of all other non-financial assets isdetermined based on the asset’s value in use computation which considers the present value ofestimated future cash flows expected to be generated from the continued use of the asset. TheGroup is required to make estimates and assumptions that can materially affect the carryingamount of the asset being assessed.
136
- 35 -
*SGVFS162381*
The carrying values of the Group’s non-financial assets are disclosed in Notes 12 and 13.
4. Financial Instrument Categories
The following table presents the total carrying amount of the Group’s and the Parent Company’sfinancial instruments per category:
Consolidated Parent Company2021 2020 2021 2020
Financial assetsCash and other cash items P=16,024,863 P=15,984,210 P=13,649,247 P=13,724,265Financial assets at FVTPL 7,209,667 13,406,863 5,457,804 11,641,778Derivative contracts designated as hedge 1,139,233 – 1,139,233 –Financial assets at FVOCI 28,672,240 20,244,403 26,523,712 18,345,520Financial assets at amortized cost
Due from BSP 124,283,115 152,156,449 114,528,773 141,811,190Due from other banks 10,694,312 18,228,721 9,897,264 17,197,750Interbank loans receivables and SPURA 36,559,224 18,290,851 35,030,997 15,604,167Investment securities at amortized cost 242,353,729 202,240,631 236,347,682 196,794,826Loans and receivables 609,006,732 557,214,484 544,171,738 491,994,476Accrued interest receivable 7,616,692 8,529,872 6,428,565 6,833,616Other assets (Note 15) 3,366,335 3,102,345 1,728,412 1,299,393
1,033,880,139 959,763,353 948,133,431 871,535,418Total financial assets P=1,086,926,142 P=1,009,398,829 P=994,903,427 P=915,246,981
Consolidated Parent Company2021 2020 2021 2020
Financial liabilitiesOther financial liabilities:Deposit liabilities P=862,859,897 P=835,230,830 P=782,218,900 P=750,972,908Bonds payable 42,473,558 52,065,678 42,473,558 52,065,678Bills payable 65,806,274 23,655,851 65,806,274 23,655,851Accrued interest and other expenses* 4,478,140 3,672,757 4,175,537 3,412,474Manager’s check 1,854,606 1,568,232 1,466,359 1,066,098Other liabilities (Note 21) 12,530,441 10,658,982 9,748,858 8,058,580
990,002,916 926,852,330 905,889,486 839,231,589Financial liabilities at FVTPL:
Derivative liabilities 998,721 1,216,771 998,721 1,216,771Derivative contracts designated as hedge 162,399 521,209 162,399 521,209
Total financial liabilities P=991,164,036 P=928,590,310 P=907,050,606 P=840,969,569*Accrued interest and other expenses excludes accrued taxes and other licenses. (Note 20).
5. Fair Value Measurement
The Group has assets and liabilities in the Group and Parent Company balance sheets that aremeasured at fair value on a recurring and non-recurring basis after initial recognition. Recurring fairvalue measurements are those that another PFRS requires or permits to be recognized in the balancesheet at the end of each financial reporting period. These include financial assets and liabilities atFVTPL and financial assets at FVOCI.
137
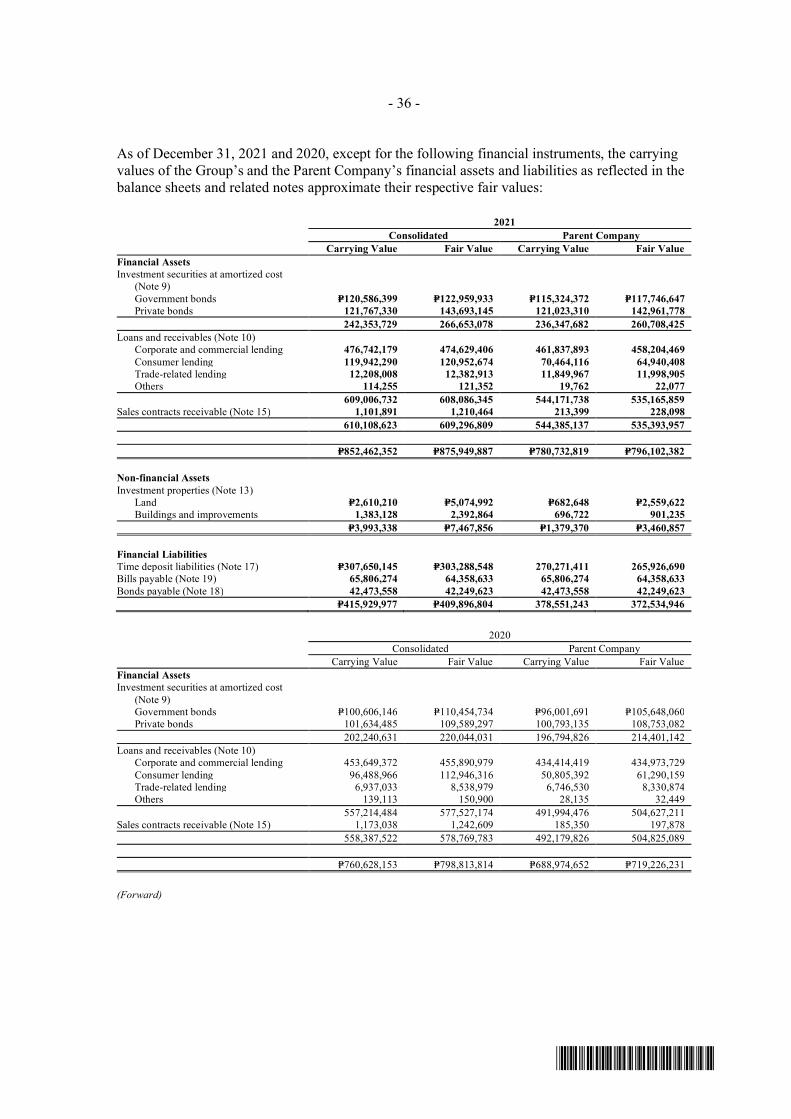
- 36 -
*SGVFS162381*
As of December 31, 2021 and 2020, except for the following financial instruments, the carryingvalues of the Group’s and the Parent Company’s financial assets and liabilities as reflected in thebalance sheets and related notes approximate their respective fair values:
2021Consolidated Parent Company
Carrying Value Fair Value Carrying Value Fair ValueFinancial AssetsInvestment securities at amortized cost
(Note 9)Government bonds P=120,586,399 P=122,959,933 P=115,324,372 P=117,746,647Private bonds 121,767,330 143,693,145 121,023,310 142,961,778
242,353,729 266,653,078 236,347,682 260,708,425Loans and receivables (Note 10)
Corporate and commercial lending 476,742,179 474,629,406 461,837,893 458,204,469Consumer lending 119,942,290 120,952,674 70,464,116 64,940,408Trade-related lending 12,208,008 12,382,913 11,849,967 11,998,905Others 114,255 121,352 19,762 22,077
609,006,732 608,086,345 544,171,738 535,165,859Sales contracts receivable (Note 15) 1,101,891 1,210,464 213,399 228,098
610,108,623 609,296,809 544,385,137 535,393,957
P=852,462,352 P=875,949,887 P=780,732,819 P=796,102,382
Non-financial AssetsInvestment properties (Note 13)
Land P=2,610,210 P=5,074,992 P=682,648 P=2,559,622 Buildings and improvements 1,383,128 2,392,864 696,722 901,235
P=3,993,338 P=7,467,856 P=1,379,370 P=3,460,857
Financial LiabilitiesTime deposit liabilities (Note 17) P=307,650,145 P=303,288,548 270,271,411 265,926,690Bills payable (Note 19) 65,806,274 64,358,633 65,806,274 64,358,633Bonds payable (Note 18) 42,473,558 42,249,623 42,473,558 42,249,623
P=415,929,977 P=409,896,804 378,551,243 372,534,946
2020Consolidated Parent Company
Carrying Value Fair Value Carrying Value Fair ValueFinancial AssetsInvestment securities at amortized cost
(Note 9)Government bonds P=100,606,146 P=110,454,734 P=96,001,691 P=105,648,060Private bonds 101,634,485 109,589,297 100,793,135 108,753,082
202,240,631 220,044,031 196,794,826 214,401,142Loans and receivables (Note 10)
Corporate and commercial lending 453,649,372 455,890,979 434,414,419 434,973,729Consumer lending 96,488,966 112,946,316 50,805,392 61,290,159Trade-related lending 6,937,033 8,538,979 6,746,530 8,330,874Others 139,113 150,900 28,135 32,449
557,214,484 577,527,174 491,994,476 504,627,211Sales contracts receivable (Note 15) 1,173,038 1,242,609 185,350 197,878
558,387,522 578,769,783 492,179,826 504,825,089
P=760,628,153 P=798,813,814 P=688,974,652 P=719,226,231
(Forward)
138
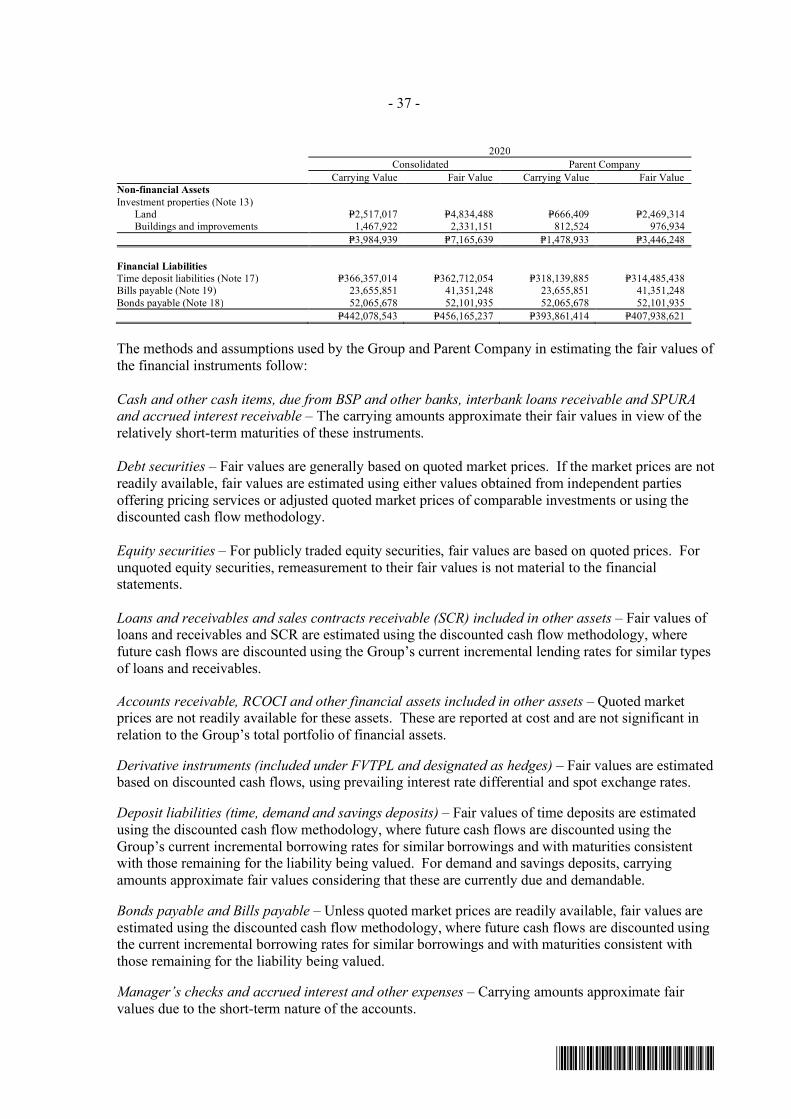
- 37 -
*SGVFS162381*
2020Consolidated Parent Company
Carrying Value Fair Value Carrying Value Fair ValueNon-financial AssetsInvestment properties (Note 13)
Land P=2,517,017 P=4,834,488 P=666,409 P=2,469,314 Buildings and improvements 1,467,922 2,331,151 812,524 976,934
P=3,984,939 P=7,165,639 P=1,478,933 P=3,446,248
Financial LiabilitiesTime deposit liabilities (Note 17) P=366,357,014 P=362,712,054 P=318,139,885 P=314,485,438Bills payable (Note 19) 23,655,851 41,351,248 23,655,851 41,351,248Bonds payable (Note 18) 52,065,678 52,101,935 52,065,678 52,101,935
P=442,078,543 P=456,165,237 P=393,861,414 P=407,938,621
The methods and assumptions used by the Group and Parent Company in estimating the fair values ofthe financial instruments follow:
Cash and other cash items, due from BSP and other banks, interbank loans receivable and SPURAand accrued interest receivable – The carrying amounts approximate their fair values in view of therelatively short-term maturities of these instruments.
Debt securities – Fair values are generally based on quoted market prices. If the market prices are notreadily available, fair values are estimated using either values obtained from independent partiesoffering pricing services or adjusted quoted market prices of comparable investments or using thediscounted cash flow methodology.
Equity securities – For publicly traded equity securities, fair values are based on quoted prices. Forunquoted equity securities, remeasurement to their fair values is not material to the financialstatements.
Loans and receivables and sales contracts receivable (SCR) included in other assets – Fair values ofloans and receivables and SCR are estimated using the discounted cash flow methodology, wherefuture cash flows are discounted using the Group’s current incremental lending rates for similar typesof loans and receivables.
Accounts receivable, RCOCI and other financial assets included in other assets – Quoted marketprices are not readily available for these assets. These are reported at cost and are not significant inrelation to the Group’s total portfolio of financial assets.
Derivative instruments (included under FVTPL and designated as hedges) – Fair values are estimatedbased on discounted cash flows, using prevailing interest rate differential and spot exchange rates.
Deposit liabilities (time, demand and savings deposits) – Fair values of time deposits are estimatedusing the discounted cash flow methodology, where future cash flows are discounted using theGroup’s current incremental borrowing rates for similar borrowings and with maturities consistentwith those remaining for the liability being valued. For demand and savings deposits, carryingamounts approximate fair values considering that these are currently due and demandable.
Bonds payable and Bills payable – Unless quoted market prices are readily available, fair values areestimated using the discounted cash flow methodology, where future cash flows are discounted usingthe current incremental borrowing rates for similar borrowings and with maturities consistent withthose remaining for the liability being valued.
Manager’s checks and accrued interest and other expenses – Carrying amounts approximate fairvalues due to the short-term nature of the accounts.
139
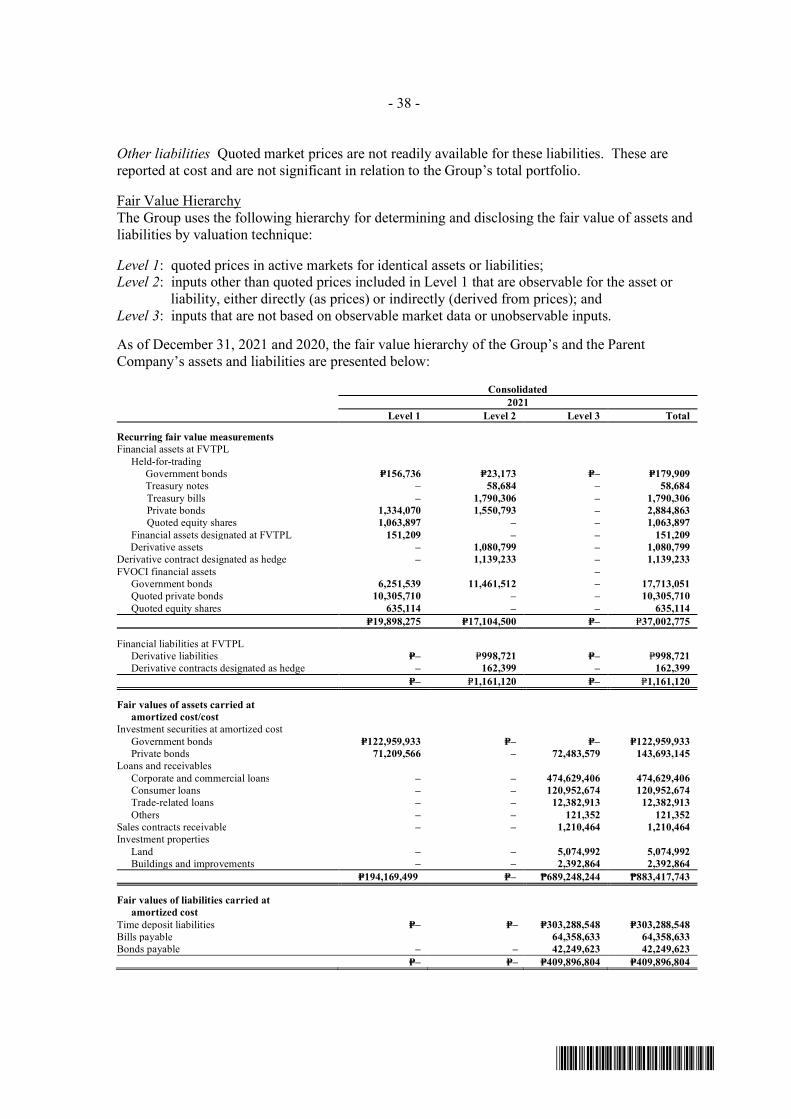
- 38 -
*SGVFS162381*
Other liabilities Quoted market prices are not readily available for these liabilities. These arereported at cost and are not significant in relation to the Group’s total portfolio.
Fair Value HierarchyThe Group uses the following hierarchy for determining and disclosing the fair value of assets andliabilities by valuation technique:
Level 1: quoted prices in active markets for identical assets or liabilities;Level 2: inputs other than quoted prices included in Level 1 that are observable for the asset or
liability, either directly (as prices) or indirectly (derived from prices); andLevel 3: inputs that are not based on observable market data or unobservable inputs.
As of December 31, 2021 and 2020, the fair value hierarchy of the Group’s and the ParentCompany’s assets and liabilities are presented below:
Consolidated2021
Level 1 Level 2 Level 3 Total
Recurring fair value measurementsFinancial assets at FVTPL
Held-for-tradingGovernment bonds P=156,736 P=23,173 P=– P=179,909
Treasury notes – 58,684 – 58,684Treasury bills – 1,790,306 – 1,790,306Private bonds 1,334,070 1,550,793 – 2,884,863Quoted equity shares 1,063,897 – – 1,063,897
Financial assets designated at FVTPL 151,209 – – 151,209Derivative assets – 1,080,799 – 1,080,799
Derivative contract designated as hedge – 1,139,233 – 1,139,233FVOCI financial assets –
Government bonds 6,251,539 11,461,512 – 17,713,051 Quoted private bonds 10,305,710 – – 10,305,710
Quoted equity shares 635,114 – – 635,114P=19,898,275 P=17,104,500 P=– P=37,002,775
Financial liabilities at FVTPLDerivative liabilities P=– P=998,721 P=– P=998,721
Derivative contracts designated as hedge – 162,399 – 162,399P=– P=1,161,120 P=– P=1,161,120
Fair values of assets carried at amortized cost/costInvestment securities at amortized cost
Government bonds P=122,959,933 P=– P=– P=122,959,933Private bonds 71,209,566 – 72,483,579 143,693,145
Loans and receivablesCorporate and commercial loans – – 474,629,406 474,629,406Consumer loans – – 120,952,674 120,952,674
Trade-related loans – – 12,382,913 12,382,913Others – – 121,352 121,352
Sales contracts receivable – – 1,210,464 1,210,464Investment properties
Land – – 5,074,992 5,074,992Buildings and improvements – – 2,392,864 2,392,864
P=194,169,499 P=– ₱689,248,244 ₱883,417,743
Fair values of liabilities carried at amortized costTime deposit liabilities P=– P=– P=303,288,548 P=303,288,548Bills payable 64,358,633 64,358,633Bonds payable – – 42,249,623 42,249,623
P=– P=– P=409,896,804 P=409,896,804
140

- 39 -
*SGVFS162381*
Consolidated2020
Level 1 Level 2 Level 3 Total
Recurring fair value measurementsFinancial assets at FVTPL
Held-for-tradingGovernment bonds P=1,970,624 P=1,560,897 P=– P=3,531,521Treasury notes – 2,126,819 – 2,126,819Treasury bills – 1,892,770 – 1,892,770Private bonds 3,358,210 – – 3,358,210Quoted equity shares 1,210,665 – – 1,210,665
Financial assets designated at FVTPL 150,000 – – 150,000Derivative assets – 1,136,878 – 1,136,878
FVOCI financial assetsGovernment bonds 2,654,823 10,349,673 – 13,004,496Quoted private bonds 6,596,820 – – 6,596,820Quoted equity shares 624,722 – – 624,722
P=16,565,864 P=17,067,037 P=– P=33,632,901
Financial liabilities at FVTPLDerivative liabilities P=– P=1,216,771 P=– P=1,216,771Derivative contracts designated as hedge – 521,209 – 521,209
P=– P=1,737,980 P=– P=1,737,980
Fair values of assets carried at amortized cost/costInvestment securities at amortized cost
Government bonds P=110,454,734 P=– P=– P=110,454,734Private bonds 53,290,698 – 56,298,599 109,589,297
Loans and receivablesCorporate and commercial loans – – 455,890,979 455,890,979Consumer loans – – 112,946,316 112,946,316Trade-related loans – – 8,538,979 8,538,979Others – – 150,900 150,900
Sales contracts receivable – – 1,242,609 1,242,609Investment properties
Land – – 4,834,488 4,834,488Buildings and improvements – – 2,331,151 2,331,151
P=163,745,432 P=– P=642,234,021 P=805,979,453
Fair values of liabilities carried at amortized costTime deposit liabilities P=– P=– P=362,712,054 P=362,712,054Bills payable 41,351,248 41,351,248Bonds payable – – 52,101,935 52,101,935
P=– P=– P=456,165,237 P=456,165,237
Parent Company2021
Level 1 Level 2 Level 3 Total
Recurring fair value measurementsFinancial assets at FVTPL
Held-for-tradingGovernment bonds P=156,736 P=23,173 P=– P=179,909Treasury notes – 58,684 – 58,684Treasury bills – 1,790,306 – 1,790,306Private bonds 1,334,070 – – 1,334,070Quoted equity shares 1,014,037 – – 1,014,037
Derivative assets – 1,080,798 – 1,080,798Derivative contract designated as hedge – 1,139,233 – 1,139,233FVOCI financial assets
Government bonds 4,192,999 11,461,512 – 15,654,511Quoted private bonds 10,245,868 – – 10,245,868Quoted equity shares 604,968 – – 604,968
P=17,548,678 P=15,553,706 P=– P=33,102,384
(Forward)
141
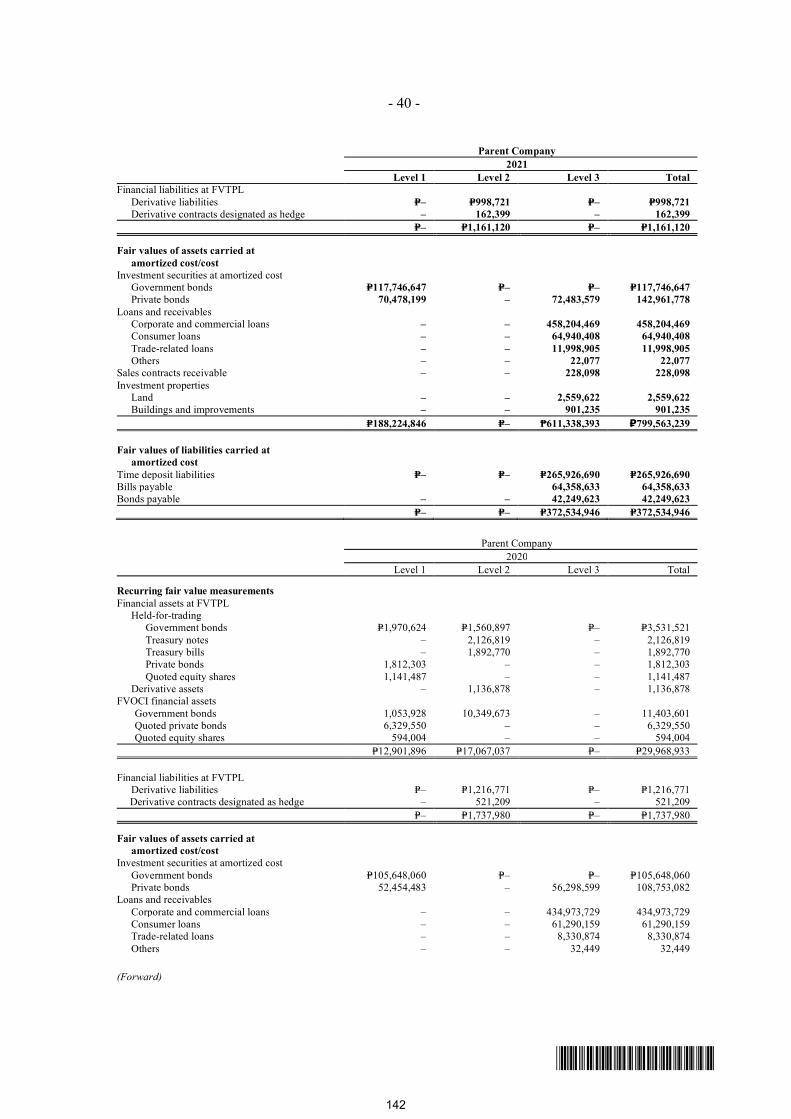
- 40 -
*SGVFS162381*
Parent Company2021
Level 1 Level 2 Level 3 TotalFinancial liabilities at FVTPL
Derivative liabilities P=– P=998,721 P=– P=998,721Derivative contracts designated as hedge – 162,399 – 162,399
P=– P=1,161,120 P=– P=1,161,120
Fair values of assets carried at amortized cost/costInvestment securities at amortized cost
Government bonds P=117,746,647 P=– P=– P=117,746,647 Private bonds 70,478,199 – 72,483,579 142,961,778Loans and receivables
Corporate and commercial loans – – 458,204,469 458,204,469Consumer loans – – 64,940,408 64,940,408Trade-related loans – – 11,998,905 11,998,905Others – – 22,077 22,077
Sales contracts receivable – – 228,098 228,098Investment properties
Land – – 2,559,622 2,559,622Buildings and improvements – – 901,235 901,235
P=188,224,846 P=– ₱611,338,393 ₽799,563,239
Fair values of liabilities carried at amortized costTime deposit liabilities P=– P=– P=265,926,690 P=265,926,690Bills payable 64,358,633 64,358,633Bonds payable – – 42,249,623 42,249,623
P=– P=– P=372,534,946 P=372,534,946
Parent Company2020
Level 1 Level 2 Level 3 Total
Recurring fair value measurementsFinancial assets at FVTPL
Held-for-tradingGovernment bonds P=1,970,624 P=1,560,897 P=– P=3,531,521Treasury notes – 2,126,819 – 2,126,819Treasury bills – 1,892,770 – 1,892,770Private bondsQuoted equity shares
1,812,303 ––
– 1,812,3031,141,487 – 1,141,487
Derivative assets – 1,136,878 – 1,136,878FVOCI financial assets
Government bonds 1,053,928 10,349,673 – 11,403,601Quoted private bonds 6,329,550 – – 6,329,550Quoted equity shares 594,004 – – 594,004
P=12,901,896 P=17,067,037 P=– P=29,968,933
Financial liabilities at FVTPLDerivative liabilities P=– P=1,216,771 P=– P=1,216,771
Derivative contracts designated as hedge – 521,209 – 521,209P=– P=1,737,980 P=– P=1,737,980
Fair values of assets carried at amortized cost/costInvestment securities at amortized cost
Government bonds P=105,648,060 P=– P=– P=105,648,060Private bonds 52,454,483 – 56,298,599 108,753,082
Loans and receivablesCorporate and commercial loans – – 434,973,729 434,973,729Consumer loans – – 61,290,159 61,290,159Trade-related loans – – 8,330,874 8,330,874Others – – 32,449 32,449
(Forward)
142

- 41 -
*SGVFS162381*
Parent Company2020
Level 1 Level 2 Level 3 TotalSales contracts receivable P=– P=– P=197,878 P=197,878Investment properties
Land – – 2,469,314 2,469,314Buildings and improvements – – 976,934 976,934
P=158,102,543 P=– P=564,569,936 P=722,672,479
Fair values of liabilities carried at amortized costTime deposit liabilities P=– P=– P=314,485,438 P=314,485,438Bills payable 41,351,248 41,351,248Bonds payable – – 52,101,935 52,101,935
P=– P=– P=407,938,621 P=407,938,621
There were no transfers between Level 1 and Level 2 fair value measurements and no transfers intoand out of Level 3 fair value measurements in 2021 and 2020.
The inputs used in the fair value measurement based on Level 2 are as follows:
Government securities – interpolated rates based on market rates of benchmark securities as ofreporting date.
Derivative assets and liabilities – fair values are calculated by reference to the prevailing interestdifferential and spot exchange rate as of the reporting date, taking into account the remaining term tomaturity of the derivative assets and liabilities.
Inputs used in estimating fair values of financial instruments carried at amortized cost and categorizedunder Level 3 include risk-free rates and applicable risk premium.
The fair values of the Group’s and Parent Company’s investment properties have been determined bythe appraisal method by independent external and in-house appraisers based on highest and best useof the property being appraised. Valuations were derived on the basis of recent sales of similarproperties in the same areas as the investment properties and taking into account the economicconditions prevailing at the time the valuations were made and comparability of similar propertiessold with the property being valued.
The table below summarizes the valuation techniques used and the significant unobservable inputsused in the valuation for each type of investment properties held by the Group and the ParentCompany:
Valuation Techniques Significant Unobservable InputsLand Market Data Approach Price per square meter, size, location,
shape, time element and cornerinfluence
Land and Building Market Data Approach and CostApproach
Reproduction Cost New
Descriptions of the valuation techniques and significant unobservable inputs used in the valuation ofthe Group and the Parent Company’s investment properties are as follows:
Valuation TechniquesMarket Data Approach A process of comparing the subject property being appraised to similar
comparable properties recently sold or being offered for sale.
143
- 42 -
*SGVFS162381*
Valuation TechniquesCost Approach It is an estimate of the investment required to duplicate the property in its
present condition. It is reached by estimating the value of the building “as ifnew” and then deducting the depreciated cost. Fundamental to the CostApproach is the estimate of Reproduction Cost New of the improvements.
Significant unobservable inputsReproduction Cost New The cost to create a virtual replica of the existing structure, employing the same
design and similar building materials.
Size Size of lot in terms of area. Evaluate if the lot size of property or comparableconforms to the average cut of the lots in the area and estimate the impact of lot sizedifferences on land value.
Shape Particular form or configuration of the lot. A highly irregular shape limits the usablearea whereas an ideal lot configuration maximizes the usable area of the lot whichis associated in designing an improvement which conforms with the highest andbest use of the property.
Location Location of comparative properties whether on a Main Road, or secondary road.Road width could also be a consideration if data is available. As a rule, propertieslocated along a Main Road are superior to properties located along a secondaryroad.
Time Element “An adjustment for market conditions is made if general property values haveappreciated or depreciated since the transaction dates due to inflation or deflation ora change in investors’ perceptions of the market over time”. In which case, thecurrent data is superior to historic data.
Discount Generally, asking prices in ads posted for sale are negotiable. Discount is theamount the seller or developer is willing to deduct from the posted selling price ifthe transaction will be in cash or equivalent.
Corner influence Bounded by two (2) roads.
6. Financial Risk Management Objectives and Policies
The Group’s activities are principally related to the profitable use of financial instruments. Risks areinherent in these activities but are managed by the Group through a rigorous, comprehensive, andcontinuous process of identification, measurement, monitoring and mitigation of these risks, partlythrough the effective use of risk and authority limits and thresholds, process controls and monitoring,and independent controls. As reflected in its corporate actions and organizational improvements, theGroup has placed due importance on expanding and strengthening its risk management process andconsiders it as a vital component to the Group’s continuing profitability and financial stability.Central to the Group’s risk management process is its adoption of a risk management programintended to avoid unnecessary risks, manage and mitigate inherent risks, and maximize returns fromtaking acceptable risks necessary to sustain its business viability and good financial position in themarket.
The key financial risks that the Group faces are: credit risk, market risk and liquidity risk. TheGroup’s risk management objective is primarily focused on controlling and mitigating these risks.The Parent Company and its subsidiaries manage their respective financial risks separately. Thesubsidiaries, particularly CBSI, have their own risk management processes but are structured similar
144
- 43 -
*SGVFS162381*
to that of the Parent Company. To a large extent, the respective risk management programs andobjectives are the same across the Group. The severity of risk, materiality, and regulations areprimary considerations in determining the scope and extent of the risk management processes put inplace for the subsidiaries.
Risk Management StructureThe BOD of the Parent Company is ultimately responsible for the oversight of the Parent Company’srisk management processes. On the other hand, the risk management processes of the subsidiaries arethe separate responsibilities of their respective BODs. The BOD of the Parent Company created aseparate board-level independent committee with explicit authority and responsibility for managingand monitoring risks.
The BOD has delegated to the Risk Oversight Committee (ROC) the formulation and supervision ofthe risk management process which includes, among others, determining the appropriate riskmitigating strategies and operating principles, adoption of industry standards, development of riskmetrics, monitoring of key risk indicators, and the imposition of risk parameters. The ROC iscomposed of three members of the BOD, all of whom are independent directors.
The Risk Management Group (RMG) is the operating unit of the ROC primarily responsible for theimplementation of the risk management strategies approved by the Board of Directors. Theimplementation cuts across all departments of the Parent Company and involves all of the ParentCompany’s financial instruments, whether “on-books” or “off-books.” The RMG is likewiseresponsible for monitoring the implementation of specific risk control procedures and enforcingcompliance thereto. The RMG is also directly involved in the day-to-day monitoring of material risksensuring that the Parent Company, in its transactions and dealings, engages only in risk-takingactivities duly approved by the ROC. The RMG also ensures that relevant information is accuratelyand completely captured on a timely basis in the management reporting system of the ParentCompany. The RMG is headed by the Chief Risk Officer (CRO) who reports the results of riskmeasurements to the ROC.
Apart from RMG, each business unit has created and put in place various process controls whichensure that all the external and internal transactions and dealings of the unit are in compliance withthe unit’s risk management objectives.
The Internal Audit Division also plays a crucial role in risk management primarily because it isindependent of the business units and reports exclusively to the Audit Committee which, in turn, iscomprised of independent directors. The Internal Audit Division focuses on ensuring that adequatecontrols are in place and on monitoring compliance to controls. The regular audit covers allprocesses and controls, including those under the risk management framework handled by the RMG.The audit of these processes and controls is undertaken at least annually. The audit results andexceptions, including recommendations for their resolution or improvement, are discussed initiallywith the business units concerned before these are presented to the Audit Committee.
Risk Management ReportingThe CRO reports to the ROC and is a resource of the Management Committee (ManCom), CreditCommittee (CreCom), Asset-Liability Committee (ALCO), Operations Committee (OpsCom) andTechnology Steering Committee (TSC). The CRO reports on key risk indicators and specific riskmanagement issues that would need resolution from top management. This is undertaken after therisk issues and key risk indicators have been discussed with the business units concerned. TheRMG’s function, particularly, that of the CRO, as well as the Board’s risk oversight responsibilitiesare articulated under BSP Circular No. 971, Guidelines on Risk Governance.
145
- 44 -
*SGVFS162381*
The key risk indicators were formulated on the basis of the financial risks faced by the ParentCompany. These indicators contain information from all business units that provide measurementson the level of the risks taken by the Parent Company in its products, transactions, and financialstructure. Among others, the report on key risk indicators includes information on the ParentCompany’s aggregate credit exposure, credit metric forecasts, hold limit exceptions, Value-at-Risk(VaR), Maximum Cumulative Outflow (MCO) and Earnings-at-Risk (EAR) analysis, utilization ofmarket and credit limits and thresholds, liquidity risk limits and ratios, overall loan loss provisioningand risk profile changes. Loan loss provisioning and credit limit utilization are, however, discussedin more detail in the Credit Committee. On a monthly basis, detailed reporting of industry, customerand geographic risks is included in the discussion with the ROC. A comprehensive risk report ispresented to the BOD on a periodic basis for an overall assessment of the level of risks taken by theParent Company. On the other hand, the Chief Audit Executive reports to the Audit Committee on amonthly basis on the results of branch or business unit audits and for the resolution of pending butimportant internal audit issues.
Risk MitigationThe Parent Company uses derivatives to manage exposures to financial instruments resulting fromchanges in interest rates and foreign currencies exposures. However, the nature and extent of use ofthese financial instruments to mitigate risks are limited to those allowed by the BSP for the ParentCompany and its subsidiaries.
To further mitigate risks throughout its different business units, the Parent Company formulates riskmanagement policies and continues to improve its existing policies. These policies further serve asthe framework and set of guidelines in the creation or revisions of operating policies and manuals foreach business unit. In the process design and implementation, preventive controls are preferred overdetection controls. Clear delineation of responsibilities and separation of incompatible duties amongofficers and staff, as well as, among business units are reiterated in these policies. To the extentpossible, reporting and accounting responsibilities are segregated from units directly involved inoperations and frontline activities (i.e., players must not be scorers). This is to improve the credibilityand accuracy of management information. Any inconsistencies in the operating policies and manualswith the risk framework created by the RMG are taken up and resolved in the ROC and ManCom.
The Operational Risk Assessment Program and IT Risk Frameworks require the Parent Company toundergo periodic operational risk assessment and for all business units & allied businesses to conductrisk and control self-assessments. These enable determination of priority risk areas, assessment ofmitigating controls in place, and institutionalization of additional measures to ensure both a controlledoperating environment and proper handling of IT risk exposures. RMG maintains and updates theParent Company’s Centralized Loss Database wherein all reported incidents of losses shall beencoded to enable assessment of weaknesses in the processes and come up with viable improvementsto avoid recurrence.
Monitoring and controlling risks are primarily performed based on various limits and thresholdsestablished by the top management covering the Group’s transactions and dealings. These limits andthresholds reflect the Group’s business strategies and market environment, as well as the levels ofrisks that the Group is willing to tolerate, with additional emphasis on selected industries. Inaddition, the Group monitors and measures the overall risk-bearing capacity in relation to theaggregate risk exposure across all risk types and activities.
Liquidity and interest rate risk exposures are measured and monitored through the MaximumCumulative Outflow and Earnings-at-Risk reports from the Asset and Liability Management (ALM)system. It was implemented in 2013 and was upgraded in 2018 to a new version which includesmodules for calculating Liquidity Coverage Ratio (LCR) and Net Stable Funding Ratio (NSFR). The
146

- 45 -
*SGVFS162381*
system also has a Funds Transfer Pricing module used by the Treasury Group and Corporate PlanningGroup.
For the measurement of market risk exposures, the Parent Company uses Historical Simulation VaRapproach for all treasury traded instruments, including fixed income bonds, foreign exchange swapsand forwards, IRS and equity securities. Market risk exposures are measured and monitored throughreports from the Market Risk Management System which has been implemented in 2018 to enhancerisk measurement and automate daily reporting.
BSP issued Circular No. 639 dated January 15, 2009 which mandated the use of the Internal CapitalAdequacy Assessment Process (ICAAP) by all universal and commercials banks to determine theirminimum required capital relative to their business risk exposures. In this regard, the Board approvedthe engagement of the services of a consultant to assist in the bank-wide implementation andembedding of the ICAAP, as provided for under Pillar 2 of Basel II and BSP Circular No. 639.
On June 2, 2021, the BOD approved the 2021 ICAAP document for submission to the BSP. Therewere no changes made in the Priority Risk Areas of the Parent Company and the approved triggerevents for the review of Capital Ratios MAT and Priority Risks. Pertinent activities emphasizing theBank’s response to the COVID19 pandemic, however, were included in this submission.
The Parent Company submitted its annually-updated ICAAP document, in compliance with BSPrequirements on June 28, 2021. The document disclosed that the Parent Company has an appropriatelevel of internal capital relative to the Group’s risk profile.
For this submission, the Parent Company retained the Pillar 1 Plus approach using the Pillar 1 capitalas the baseline. The process of allocating capital for all types of risks above the Pillar 1 capital levelsincludes quantification of capital buffer for Pillar 2 risks under normal business cycle/condition, inaddition to the quantification based on the results of the Integrated Stress Test (IST). The adoption ofthe IST allows the Parent Company to quantify its overall vulnerability to market shocks andoperational losses in a collective manner driven by events rather than in silo. The capital assessmentin the document discloses that the Group and the Parent Company has appropriate and sufficient levelof internal capital.
Group’s Response to the COVID-19 PandemicThe COVID-19 pandemic has impacted all types of businesses and the banking sector is among theseverely hit, at least operationally. As the National Government imposed stringent quarantinemeasures and mobility becomes limited, being part of the sector essential to the economy, the needfor the Group to quickly adapt to the rapidly changing business climate becomes apparent. In spite ofthe exceedingly challenging situation, the Group continued to open its doors to serve the public whilelooking after the health, safety, and well-being of the workers including service personnel andcustomers.
The Group developed “The New Normal Work Force and Work Management Plan for the COVID-19Pandemic”. The plan is designed to provide general direction and guidance in sustaining theoperations of the Group while we manage and exert effort to reduce exposure to COVID-19. In placeare team rotation work schedules, work from home arrangements, mandatory health and safetymeasures, and case management protocols which are all included in the Group’s Work ManagementPlan. In addition, the buddy branch system was implemented in the branches and split officeoperations were established for the head office units to ensure uninterrupted services even with theextension of community quarantine particularly in the NCR.
147
- 46 -
*SGVFS162381*
The Group continued to implement all its market limits and triggers without changes even with thereduced trading hours in the market and shorter working hours of the Group during the EnhancedCommunity Quarantine. The Financial Markets Segment also issued guidance on work-from-homesetup during this period for its trading personnel. Under this setup, for control purposes, Deal limitsof Sales Traders were reduced to zero in the Treasury system to automatically require supervisorauthorization of any transaction facilitated offsite.
In view of the heightened credit risk arising from the COVID 19- pandemic, the Group responded byissuing several credit bulletins in 2020 on the changes in credit granting and lending other credit riskmanagement policies. This includes, among others, the implementation of guidelines to comply withthe provisions of the Bayanihan to Heal as One Act, the Bayanihan to Recover as One Act, and thetightening of credit approval requirements for new loans and new credit facilities both to new andexisting clients. Special Approving Authority was also delegated by the Board to selected seniorofficers with regards to further extension of credit line expiry. In addition, there were also guidelineson post-ECQ collection, policies for managing loans affected by the Covid-19 crisis, and proceduresfor the availment of the regulatory relief measure stated in BSP memoranda No. M-2020-008(Regulatory Relief for BSFIs Affected by the Corona Virus Disease 2019) and M-2020-032(Amendments to M-2020-008).
In 2021, as the economy slowly recovered from the pandemic, the approval requirements for grant ofnew loans/new facilities were gradually relaxed. A new process was temporarily adopted forconsumer loans to address the slowdown in the processing of mortgage registration by the Registry ofDeeds as a result of the lockdowns. In addition, guidelines were issued regarding the booking ofmodified loans to comply with the provisions under BSP Memo M-2020-061 (SupervisoryExpectations on the Measurement of Expected Credit Losses and the Treatment of Regulatory ReliefMeasures Granted Amid the Novel Coronavirus Disease 2019 (COVID-19) Pandemic). Recognizingthe possible benefits of the FIST Act, guidelines for the transfer or disposal of non-performing assetsunder its IRR and according to the issuances of the BSP for its implementation were alsodisseminated.
RMG also continued to run approximations of the increase in NPL under Base, Moderate, and Severescenarios and presented the results to the Risk Oversight Committee. The assumptions were modifiedto take into account the improving economic condition and the fact that the borrowers severelyaffected by the pandemic have already been identified and booked as non-performing. The conditionof accounts that were restructured or with terms modification continued to be monitored and thosewith high risk rating were considered in the NPL approximations.
Credit RiskCredit risk is the risk of financial loss on account of a counterparty to a financial product failing tohonor its obligation. The Group faces potential credit risks every time it extends funds to borrowers,commits funds to counterparties, guarantees the paying performance of its clients, invests funds toissuers (i.e., investment securities issued by either sovereign or corporate entities) or enters into eithermarket-traded or over-the-counter derivatives, through implied or actual contractual agreements (i.e.,on or off-balance sheet exposures). The Group manages its credit risk at various levels (i.e., strategiclevel, portfolio level down to individual credit or transaction).
RMG also continued to run approximations of the increase in NPL under Base, Moderate, and Severescenarios and presented the results to the Risk Oversight Committee. The assumptions were modifiedto take into account the improving economic condition and the fact that the borrowers severelyaffected by the pandemic have already been identified and booked as non-performing. The conditionof accounts that were restructured or with terms modification continued to be monitored and thosewith high risk rating were considered in the NPL approximations.
148
- 47 -
*SGVFS162381*
The Group established risk limits and thresholds for purposes of monitoring and managing credit riskfrom individual counterparties and/or groups of counterparties, major industries, as well as countries.It also conducts periodical assessment of the creditworthiness of its counterparties. In addition, theGroup obtains collateral where appropriate, enters into master netting agreements and collateralarrangements with counterparties, and limits the duration of exposures.
Credit Risk Rating and Scoring ModelsThe Parent Company has four credit risk rating models in place: for corporate borrowers, for retailsmall and medium entities and individual accounts (non-consumer), for financial institutions, and forsovereign / country exposures. In addition, it also has two scoring models for auto and housing loanapplicants.
In compliance with BSP requirements, the Parent Company established an Internal Credit Risk RatingSystem (ICRRS) for the purpose of measuring credit risk for corporate borrowers in a consistentmanner, as accurately as possible, and thereafter uses the risk information for business and financialdecision making. The ICRRS covers corporate borrowers with total assets, total facilities, or totalcredit exposures amounting to P=15 million and above.
Further, the ICRRS was designed within the technical requirements defined under BSP CircularNo. 439. It has two components, namely: a) Borrower Risk Rating which provides an assessment ofthe creditworthiness of the borrower, without considering the proposed facility and securityarrangements, and b) Loan Exposure Rating which provides an assessment of the proposed facilitiesas mitigated or enhanced by security arrangements.
On February 6, 2019, the Board of Directors approved the recalibrated ICRRS model. Among thechanges made was in the rating scale which was expanded from ten to fourteen rating grades, ten ofwhich fall under unclassified accounts, with the remaining four falling under classified accounts inaccordance with regulatory provisioning guidelines. In 2021, RMG reviewed the methodology indetermining the security points and presented the proposed changes to the Risk Oversight Committee(ROC) on October 20, 2021. The revised methodology was approved by the Board onNovember 3, 2021. Changes that were made include simplifying the computation by alreadyconsidering the loan value in the proposed security points and aligning the security points with theestimated recovery value associated with the collateral/guarantee.
The Parent Company launched in 2011 the Borrower Credit Score (BCS), a credit scoring systemdesigned for retail small and medium entities and individual loan accounts. In 2018, RMG completedthe statistical validation of the BCS using the same methodology applied to the validation of thecorporate risk rating model. The validation process was conducted with the assistance of Teradatawhich provided the analytics platform, tools and technical guidance for both credit modelperformance assessment and recalibration.
The CAMELOT rating system was approved by the BOD in 2006 to specifically assess Philippineuniversal, commercial and thrift banks. In 2009, the Parent Company implemented the rating systemfor rural and cooperative banks as well as the rating system for foreign financial institutions.
149
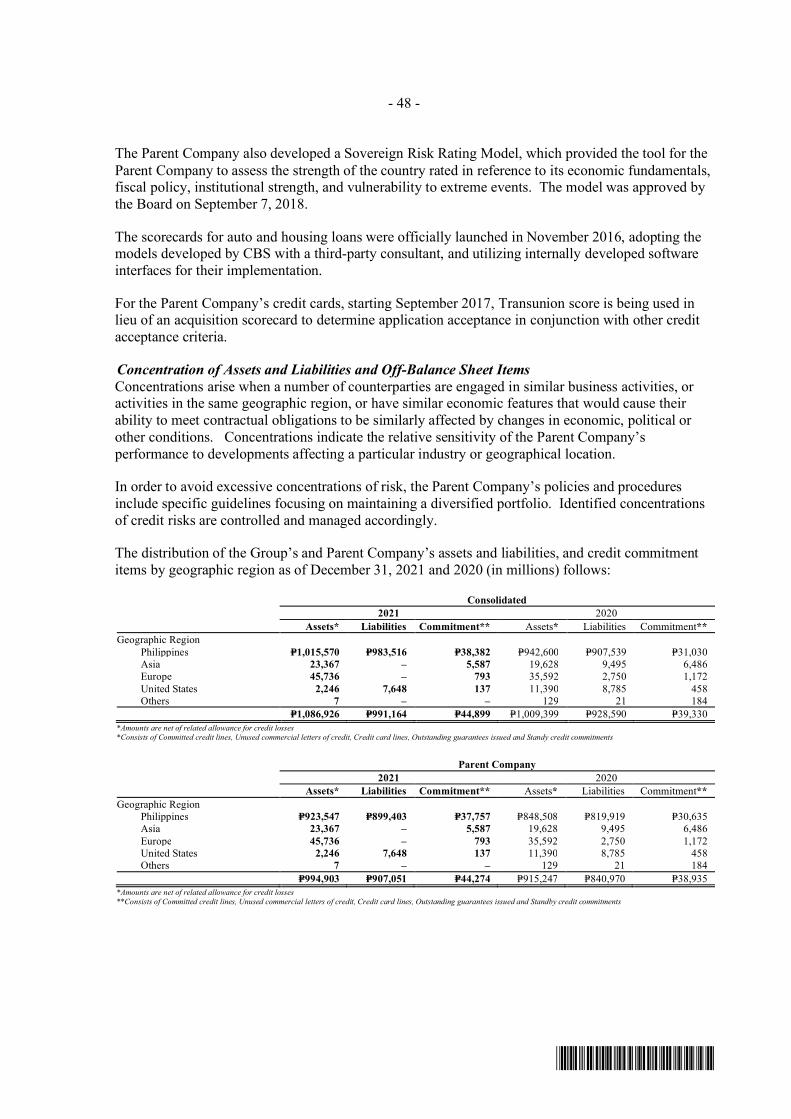
- 48 -
*SGVFS162381*
The Parent Company also developed a Sovereign Risk Rating Model, which provided the tool for theParent Company to assess the strength of the country rated in reference to its economic fundamentals,fiscal policy, institutional strength, and vulnerability to extreme events. The model was approved bythe Board on September 7, 2018.
The scorecards for auto and housing loans were officially launched in November 2016, adopting themodels developed by CBS with a third-party consultant, and utilizing internally developed softwareinterfaces for their implementation.
For the Parent Company’s credit cards, starting September 2017, Transunion score is being used inlieu of an acquisition scorecard to determine application acceptance in conjunction with other creditacceptance criteria.
Concentration of Assets and Liabilities and Off-Balance Sheet ItemsConcentrations arise when a number of counterparties are engaged in similar business activities, oractivities in the same geographic region, or have similar economic features that would cause theirability to meet contractual obligations to be similarly affected by changes in economic, political orother conditions. Concentrations indicate the relative sensitivity of the Parent Company’sperformance to developments affecting a particular industry or geographical location.
In order to avoid excessive concentrations of risk, the Parent Company’s policies and proceduresinclude specific guidelines focusing on maintaining a diversified portfolio. Identified concentrationsof credit risks are controlled and managed accordingly.
The distribution of the Group’s and Parent Company’s assets and liabilities, and credit commitmentitems by geographic region as of December 31, 2021 and 2020 (in millions) follows:
Consolidated2021 2020
Assets* Liabilities Commitment** Assets* Liabilities Commitment**Geographic Region
Philippines P=1,015,570 P=983,516 P=38,382 P=942,600 P=907,539 P=31,030Asia 23,367 – 5,587 19,628 9,495 6,486Europe 45,736 – 793 35,592 2,750 1,172United States 2,246 7,648 137 11,390 8,785 458Others 7 – – 129 21 184
P=1,086,926 P=991,164 P=44,899 P=1,009,399 P=928,590 P=39,330*Amounts are net of related allowance for credit losses*Consists of Committed credit lines, Unused commercial letters of credit, Credit card lines, Outstanding guarantees issued and Standy credit commitments
Parent Company2021 2020
Assets* Liabilities Commitment** Assets* Liabilities Commitment**Geographic Region
Philippines P=923,547 P=899,403 P=37,757 P=848,508 P=819,919 P=30,635Asia 23,367 – 5,587 19,628 9,495 6,486Europe 45,736 – 793 35,592 2,750 1,172United States 2,246 7,648 137 11,390 8,785 458Others 7 – – 129 21 184
P=994,903 P=907,051 P=44,274 P=915,247 P=840,970 P=38,935*Amounts are net of related allowance for credit losses**Consists of Committed credit lines, Unused commercial letters of credit, Credit card lines, Outstanding guarantees issued and Standby credit commitments
150
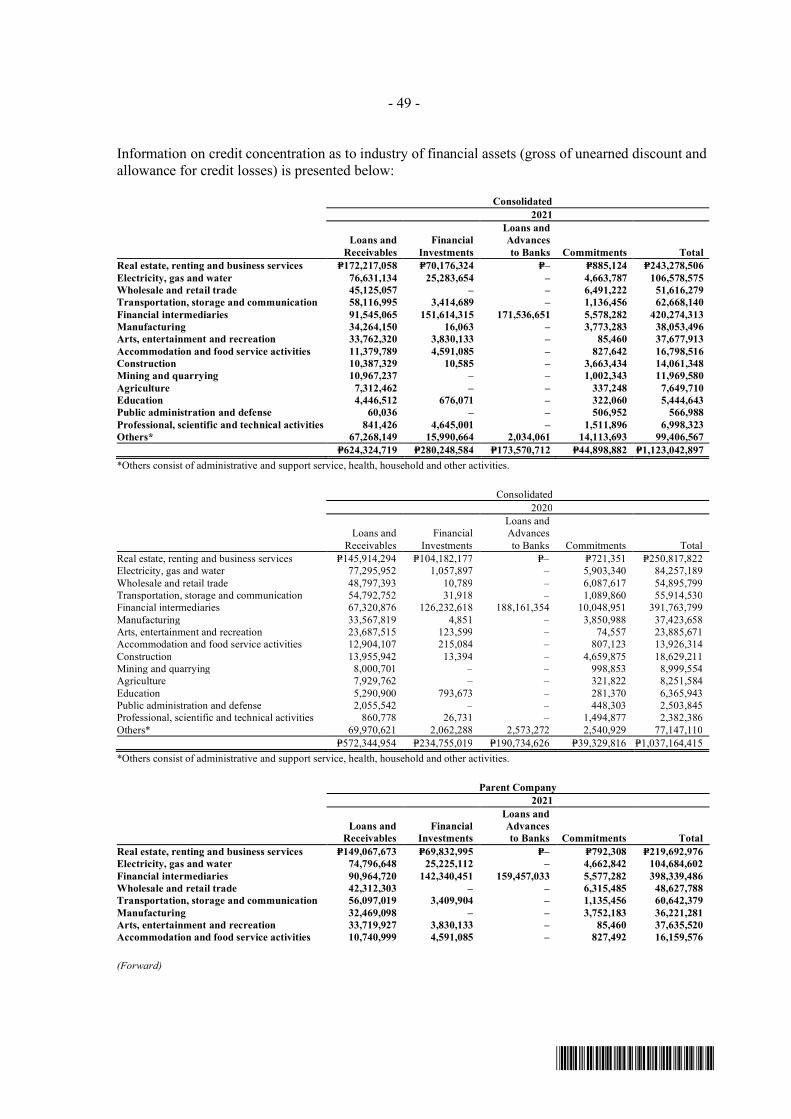
- 49 -
*SGVFS162381*
Information on credit concentration as to industry of financial assets (gross of unearned discount andallowance for credit losses) is presented below:
Consolidated2021
Loans andReceivables
FinancialInvestments
Loans andAdvancesto Banks Commitments Total
Real estate, renting and business services P=172,217,058 P=70,176,324 P=– P=885,124 P=243,278,506Electricity, gas and water 76,631,134 25,283,654 – 4,663,787 106,578,575Wholesale and retail trade 45,125,057 – – 6,491,222 51,616,279Transportation, storage and communication 58,116,995 3,414,689 – 1,136,456 62,668,140Financial intermediaries 91,545,065 151,614,315 171,536,651 5,578,282 420,274,313Manufacturing 34,264,150 16,063 – 3,773,283 38,053,496Arts, entertainment and recreation 33,762,320 3,830,133 – 85,460 37,677,913Accommodation and food service activities 11,379,789 4,591,085 – 827,642 16,798,516Construction 10,387,329 10,585 – 3,663,434 14,061,348Mining and quarrying 10,967,237 – – 1,002,343 11,969,580Agriculture 7,312,462 – – 337,248 7,649,710Education 4,446,512 676,071 – 322,060 5,444,643Public administration and defense 60,036 – – 506,952 566,988Professional, scientific and technical activities 841,426 4,645,001 – 1,511,896 6,998,323Others* 67,268,149 15,990,664 2,034,061 14,113,693 99,406,567
P=624,324,719 P=280,248,584 P=173,570,712 P=44,898,882 P=1,123,042,897*Others consist of administrative and support service, health, household and other activities.
Consolidated2020
Loans andReceivables
FinancialInvestments
Loans andAdvancesto Banks Commitments Total
Real estate, renting and business services P=145,914,294 P=104,182,177 P=– P=721,351 P=250,817,822Electricity, gas and water 77,295,952 1,057,897 – 5,903,340 84,257,189Wholesale and retail trade 48,797,393 10,789 – 6,087,617 54,895,799Transportation, storage and communication 54,792,752 31,918 – 1,089,860 55,914,530Financial intermediaries 67,320,876 126,232,618 188,161,354 10,048,951 391,763,799Manufacturing 33,567,819 4,851 – 3,850,988 37,423,658Arts, entertainment and recreation 23,687,515 123,599 – 74,557 23,885,671Accommodation and food service activities 12,904,107 215,084 – 807,123 13,926,314Construction 13,955,942 13,394 – 4,659,875 18,629,211Mining and quarrying 8,000,701 – – 998,853 8,999,554Agriculture 7,929,762 – – 321,822 8,251,584Education 5,290,900 793,673 – 281,370 6,365,943Public administration and defense 2,055,542 – – 448,303 2,503,845Professional, scientific and technical activities 860,778 26,731 – 1,494,877 2,382,386Others* 69,970,621 2,062,288 2,573,272 2,540,929 77,147,110
P=572,344,954 P=234,755,019 P=190,734,626 P=39,329,816 P=1,037,164,415*Others consist of administrative and support service, health, household and other activities.
Parent Company2021
Loans andReceivables
FinancialInvestments
Loans andAdvancesto Banks Commitments Total
Real estate, renting and business services P=149,067,673 P=69,832,995 P=– P=792,308 P=219,692,976Electricity, gas and water 74,796,648 25,225,112 – 4,662,842 104,684,602Financial intermediaries 90,964,720 142,340,451 159,457,033 5,577,282 398,339,486Wholesale and retail trade 42,312,303 – – 6,315,485 48,627,788Transportation, storage and communication 56,097,019 3,409,904 – 1,135,456 60,642,379Manufacturing 32,469,098 – – 3,752,183 36,221,281Arts, entertainment and recreation 33,719,927 3,830,133 – 85,460 37,635,520Accommodation and food service activities 10,740,999 4,591,085 – 827,492 16,159,576
(Forward)
151
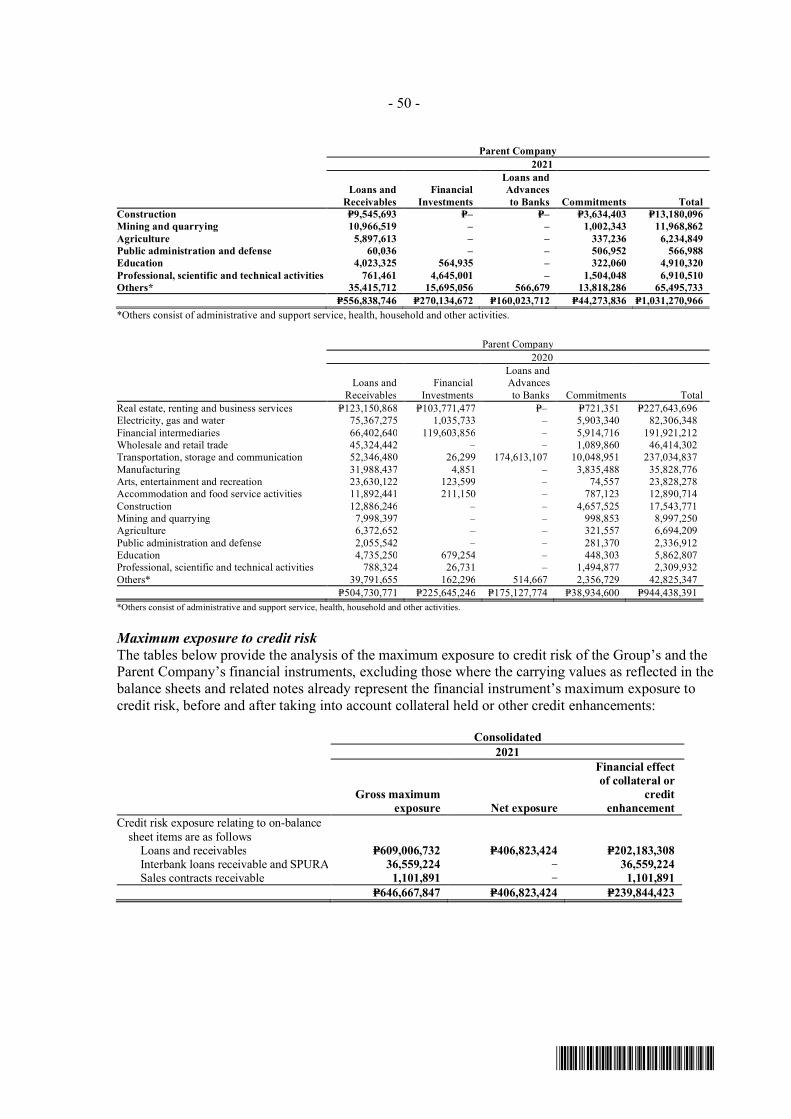
- 50 -
*SGVFS162381*
Parent Company2021
Loans andReceivables
FinancialInvestments
Loans andAdvancesto Banks Commitments Total
Construction P=9,545,693 P=– P=– P=3,634,403 P=13,180,096Mining and quarrying 10,966,519 – – 1,002,343 11,968,862Agriculture 5,897,613 – – 337,236 6,234,849Public administration and defense 60,036 – – 506,952 566,988Education 4,023,325 564,935 – 322,060 4,910,320Professional, scientific and technical activities 761,461 4,645,001 – 1,504,048 6,910,510Others* 35,415,712 15,695,056 566,679 13,818,286 65,495,733
P=556,838,746 P=270,134,672 P=160,023,712 P=44,273,836 P=1,031,270,966*Others consist of administrative and support service, health, household and other activities.
Parent Company2020
Loans andReceivables
FinancialInvestments
Loans andAdvancesto Banks Commitments Total
Real estate, renting and business services P=123,150,868 P=103,771,477 P=– P=721,351 P=227,643,696Electricity, gas and water 75,367,275 1,035,733 – 5,903,340 82,306,348Financial intermediaries 66,402,640 119,603,856 – 5,914,716 191,921,212Wholesale and retail trade 45,324,442 – – 1,089,860 46,414,302Transportation, storage and communication 52,346,480 26,299 174,613,107 10,048,951 237,034,837Manufacturing 31,988,437 4,851 – 3,835,488 35,828,776Arts, entertainment and recreation 23,630,122 123,599 – 74,557 23,828,278Accommodation and food service activities 11,892,441 211,150 – 787,123 12,890,714Construction 12,886,246 – – 4,657,525 17,543,771Mining and quarrying 7,998,397 – – 998,853 8,997,250Agriculture 6,372,652 – – 321,557 6,694,209Public administration and defense 2,055,542 – – 281,370 2,336,912Education 4,735,250 679,254 – 448,303 5,862,807Professional, scientific and technical activities 788,324 26,731 – 1,494,877 2,309,932Others* 39,791,655 162,296 514,667 2,356,729 42,825,347
P=504,730,771 P=225,645,246 P=175,127,774 P=38,934,600 P=944,438,391*Others consist of administrative and support service, health, household and other activities.
Maximum exposure to credit riskThe tables below provide the analysis of the maximum exposure to credit risk of the Group’s and theParent Company’s financial instruments, excluding those where the carrying values as reflected in thebalance sheets and related notes already represent the financial instrument’s maximum exposure tocredit risk, before and after taking into account collateral held or other credit enhancements:
Consolidated2021
Gross maximumexposure Net exposure
Financial effectof collateral or
creditenhancement
Credit risk exposure relating to on-balancesheet items are as follows
Loans and receivables P=609,006,732 P=406,823,424 P=202,183,308Interbank loans receivable and SPURA 36,559,224 – 36,559,224Sales contracts receivable 1,101,891 – 1,101,891
P=646,667,847 P=406,823,424 P=239,844,423
152
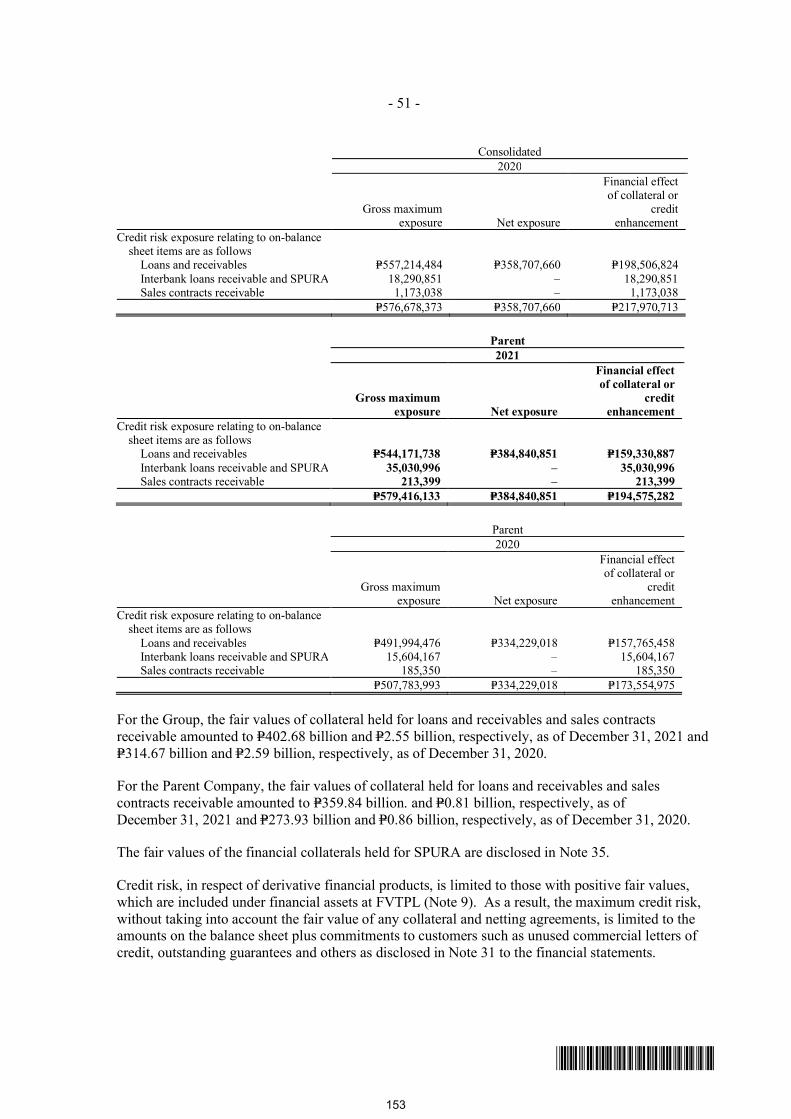
- 51 -
*SGVFS162381*
Consolidated2020
Gross maximumexposure Net exposure
Financial effectof collateral or
creditenhancement
Credit risk exposure relating to on-balancesheet items are as follows
Loans and receivables P=557,214,484 P=358,707,660 P=198,506,824Interbank loans receivable and SPURA 18,290,851 – 18,290,851Sales contracts receivable 1,173,038 – 1,173,038
P=576,678,373 P=358,707,660 P=217,970,713
Parent2021
Gross maximumexposure Net exposure
Financial effectof collateral or
creditenhancement
Credit risk exposure relating to on-balancesheet items are as follows
Loans and receivables P=544,171,738 P=384,840,851 P=159,330,887Interbank loans receivable and SPURA 35,030,996 – 35,030,996Sales contracts receivable 213,399 – 213,399
P=579,416,133 P=384,840,851 P=194,575,282
Parent2020
Gross maximumexposure Net exposure
Financial effectof collateral or
creditenhancement
Credit risk exposure relating to on-balancesheet items are as follows
Loans and receivables P=491,994,476 P=334,229,018 P=157,765,458Interbank loans receivable and SPURA 15,604,167 – 15,604,167Sales contracts receivable 185,350 – 185,350
P=507,783,993 P=334,229,018 P=173,554,975
For the Group, the fair values of collateral held for loans and receivables and sales contractsreceivable amounted to P=402.68 billion and P=2.55 billion, respectively, as of December 31, 2021 andP=314.67 billion and P=2.59 billion, respectively, as of December 31, 2020.
For the Parent Company, the fair values of collateral held for loans and receivables and salescontracts receivable amounted to P=359.84 billion. and P=0.81 billion, respectively, as ofDecember 31, 2021 and P=273.93 billion and P=0.86 billion, respectively, as of December 31, 2020.
The fair values of the financial collaterals held for SPURA are disclosed in Note 35.
Credit risk, in respect of derivative financial products, is limited to those with positive fair values,which are included under financial assets at FVTPL (Note 9). As a result, the maximum credit risk,without taking into account the fair value of any collateral and netting agreements, is limited to theamounts on the balance sheet plus commitments to customers such as unused commercial letters ofcredit, outstanding guarantees and others as disclosed in Note 31 to the financial statements.
153
- 52 -
*SGVFS162381*
Collateral and other credit enhancementsThe amount and type of collateral required depends on an assessment of the credit risk of thecounterparty. Guidelines are implemented with regards to the acceptability of types of collateral andvaluation parameters.
The main types of collateral obtained are as follows:
For securities lending and reverse repurchase transactions – cash or securities For consumer lending – real estate and chattel over vehicle For corporate lending and commercial lending- real estate, chattel over properties, assignment of
deposits, shares of stocks, bonds, and guarantees
Management requests additional collateral in accordance with the underlying agreement and takesinto consideration the market value of collateral during its review of the adequacy of allowance forcredit losses.
It is the Group’s policy to dispose of repossessed properties in an orderly fashion. The proceeds areused to reduce or repay the outstanding claim. In most cases, the Parent Company does not occupyrepossessed properties for business use.
Collateral valuationTo mitigate its credit risks on financial assets, the Group seeks to use collateral, where possible. Thecollateral comes in various forms, such as cash, securities, letters of credit/guarantees, real estate,receivables, inventories, other non-financial assets and credit enhancements such as nettingagreements. Collateral, unless repossessed, is not recorded on the Group’s balance sheet. However,the fair value of collateral affects the calculation of loss allowances. It is generally assessed, at aminimum, at inception and re-assessed on an annual basis. To the extent possible, the Group usesactive market data for valuing financial assets held as collateral. Other financial assets which do nothave readily determinable market values are valued using models. Non-financial collateral, such asreal estate, is valued based on data provided by internal or external appraisers.
Credit quality per class of financial assets
Loans and ReceivablesThe credit quality of financial assets is managed by the Group using an internal credit rating systemfor the purpose of measuring credit risk in a consistent manner as accurately as possible. The modelon risk ratings is assessed regularly because the Group uses this information as a tool for business andfinancial decision making. Aside from the periodic review by the Parent Company’s Internal AuditGroup, the Parent Company likewise engaged the services of third-party consultants in 2014, 2015,and 2017 for purposes of conducting an independent validation of the credit risk rating model.
It is the Parent Company’s policy to maintain accurate and consistent risk ratings across the creditportfolio. This facilitates focused management of the applicable risks and the comparison of creditexposures across all lines of business, geographic regions and products. The rating system issupported by a variety of financial analytics, combined with processed market information to providethe main inputs for the measurement of counterparty risk. All internal risk ratings are tailored to thevarious categories and are derived in accordance with the Parent Company’s rating policy. Theattributable risk ratings are assessed and monitored regularly.
154
- 53 -
*SGVFS162381*
The rating categories are further described below.
High Grade
This includes all borrowers whose ratings are considered as Low Risk and/or those where theexposures are covered by Government Guarantee. Thus, these borrowers have a very low probabilityof going into default in the coming year.
In terms of borrower credit ratings, these include the following:
A. ICRRS-Covered Borrower Risk Rating (BRR) 1 (Exceptional) BRR 2 (Excellent) BRR 3 (Strong) BRR 4 (Good)
B. BCS-Covered Strong
Generally, a Low Risk (High Grade) rating is indicative of a high capacity to fulfill its obligationssupported by robust financials (i.e., profitable, with returns considerably higher than the industry,elevated capacities to service its liabilities), gainful positioning in growing industries (i.e.,participation in industries where conditions are very favorable and in which they are able to get agood share of the market), and very strong leadership providing clear strategic direction and/orexcellent training and development programs.
Standard Grade
This includes all borrowers whose ratings are considered as Moderate Risk and are seen to withstandtypical swings in the economic cycle without going into default. However, any prolongedunfavorable economic period would create deterioration that may already be beyond acceptablelevels.
In terms of borrower credit ratings, these include the following:
A. ICRRS-Covered BRR 5 (Satisfactory) BRR 6 (Acceptable) BRR 7 (Fair)
B. BCS-Covered Satisfactory Acceptable
Generally, a Moderate Risk (Standard Grade) rating signifies a borrower whose financialperformance is sufficient to service obligations and is at par with competitors in the industry. In termsof management, it is run by executives with adequate personal and professional qualifications andsufficient experience in similar companies. In terms of growth potential, it is engaged in an industrywith stable outlook, supportive of continuing operations.
155
- 54 -
*SGVFS162381*
Sub-Standard Grade
In terms of borrower credit ratings, this includes the following:
UnclassifiedA. ICRRS-Covered
BRR 8 (Watchlist) BRR 9 (Speculative) BRR 10 (Highly Speculative)
B. BCS-Covered Watchlist
Adversely ClassifiedA. ICRRS and BCS-Covered
BRR 11 (Especially Mentioned) BRR 12 (Substandard) BRR 13 (Doubtful) BRR 14 (Loss)
For accounts that are Unclassified, a High Risk (Sub-Standard Grade) rating is indicative ofborrowers where there are unfavorable industry or company-specific factors. This may be financial innature (i.e., marginal operating performance, returns that are lower than those of the industry, and/ordiminished capacity to pay off obligations that are due), related to management quality (includingnegative information regarding the company or specific executives) and/or unfavorable industryconditions. The borrower might find it very hard to cope with any significant economic downturn anda default in such a case is more than a possibility. These accounts require a closer monitoring for anysigns of further deterioration, warranting adverse classification.
Adversely Classified accounts are automatically considered as high-risk and generally includes pastdue accounts. However, in some cases, even accounts that are neither past due nor impaired, qualifiesfor adverse classification. Reasons for this include among others the following: consecutive netlosses, emerging weaknesses in terms of cash flow, negative equity, and/or breach in the covenantsper term loan agreement.
For consumer loans that are covered by application scorecards which provide either a pass/fail score,the basis for credit quality rating is the BSP classification for those that are booked as Current (i.e.,Standard Grade if Unclassified and Sub Standard Grade if Classified) and impairment status for thosethat are booked as Past Due / Items in Litigation. The Parent Company has applied this policyconsistently for its consumer loans as of December 31, 2021 and 2020. BeginningDecember 31, 2021, the Group has applied this policy for CBS in determining the credit quality ratingfor consumer loans. This resulted in the “Standard grade” classification for the consumer loans ofCBS amounting to P=46.61 billion as of December 31, 2021. Had this been applied as ofDecember 31, 2020, there would have been a decrease amounting to P=41.27 billion under “Highgrade” and a corresponding increase for the same amount under “Standard grade” to account forCBS’ consumer loans in the Group’s credit exposures.
The financial assets are also grouped according to stage whose description is explained as follows:
Stage 1 – those that are considered current and up to 30 days past due, and based on change in rating,delinquencies and payment history, do not demonstrate significant increase in credit risk.
156
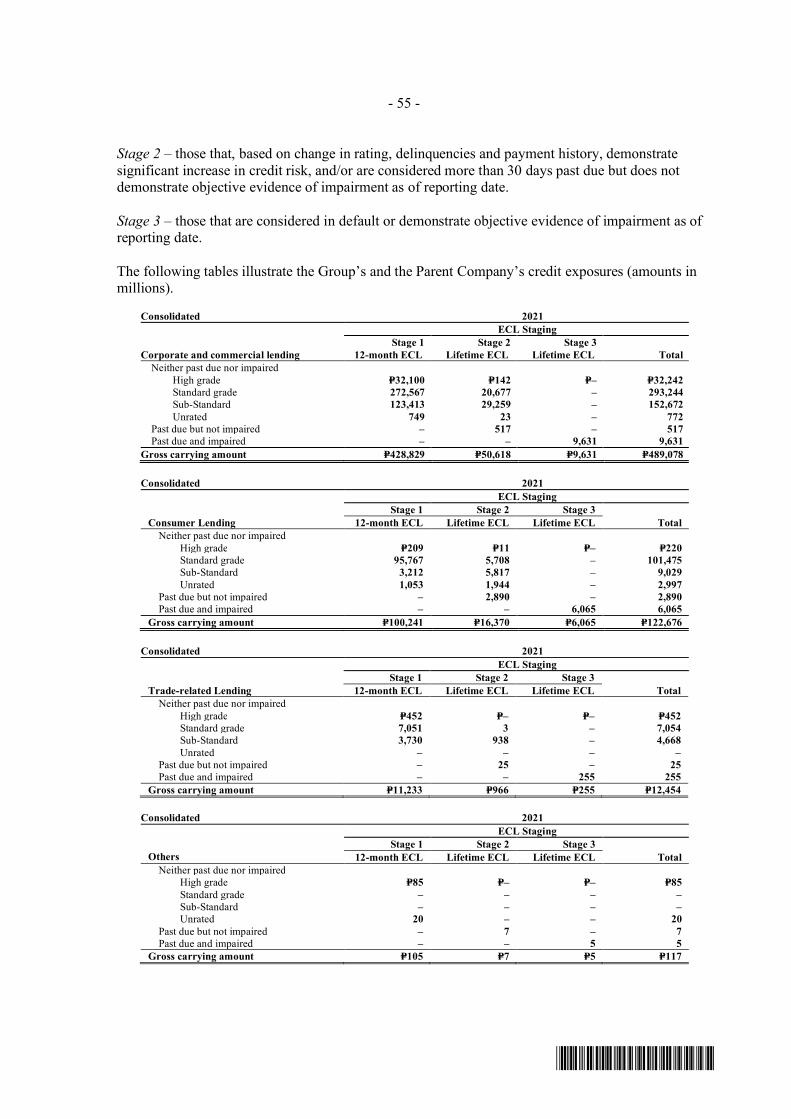
- 55 -
*SGVFS162381*
Stage 2 – those that, based on change in rating, delinquencies and payment history, demonstratesignificant increase in credit risk, and/or are considered more than 30 days past due but does notdemonstrate objective evidence of impairment as of reporting date.
Stage 3 – those that are considered in default or demonstrate objective evidence of impairment as ofreporting date.
The following tables illustrate the Group’s and the Parent Company’s credit exposures (amounts inmillions).
Consolidated 2021ECL Staging
Corporate and commercial lending Stage 1 Stage 2 Stage 3
12-month ECL Lifetime ECL Lifetime ECL TotalNeither past due nor impaired
High grade P=32,100 P=142 P=– P=32,242Standard grade 272,567 20,677 – 293,244Sub-Standard 123,413 29,259 – 152,672Unrated 749 23 – 772
Past due but not impaired – 517 – 517Past due and impaired – – 9,631 9,631
Gross carrying amount P=428,829 P=50,618 P=9,631 P=489,078
Consolidated 2021ECL Staging
Consumer Lending Stage 1 Stage 2 Stage 3
12-month ECL Lifetime ECL Lifetime ECL TotalNeither past due nor impaired
High grade P=209 P=11 P=– P=220Standard grade 95,767 5,708 – 101,475Sub-Standard 3,212 5,817 – 9,029Unrated 1,053 1,944 – 2,997
Past due but not impaired – 2,890 – 2,890Past due and impaired – – 6,065 6,065
Gross carrying amount P=100,241 P=16,370 P=6,065 P=122,676
Consolidated 2021ECL Staging
Trade-related Lending Stage 1 Stage 2 Stage 3
12-month ECL Lifetime ECL Lifetime ECL TotalNeither past due nor impaired
High grade P=452 P=– P=– P=452Standard grade 7,051 3 – 7,054Sub-Standard 3,730 938 – 4,668Unrated – – – –
Past due but not impaired – 25 – 25Past due and impaired – – 255 255
Gross carrying amount P=11,233 P=966 P=255 P=12,454
Consolidated 2021ECL Staging
Others Stage 1 Stage 2 Stage 3
12-month ECL Lifetime ECL Lifetime ECL TotalNeither past due nor impaired
High grade P=85 P=– P=– P=85Standard grade – – – –Sub-Standard – – – –Unrated 20 – – 20
Past due but not impaired – 7 – 7Past due and impaired – – 5 5
Gross carrying amount P=105 P=7 P=5 P=117
157
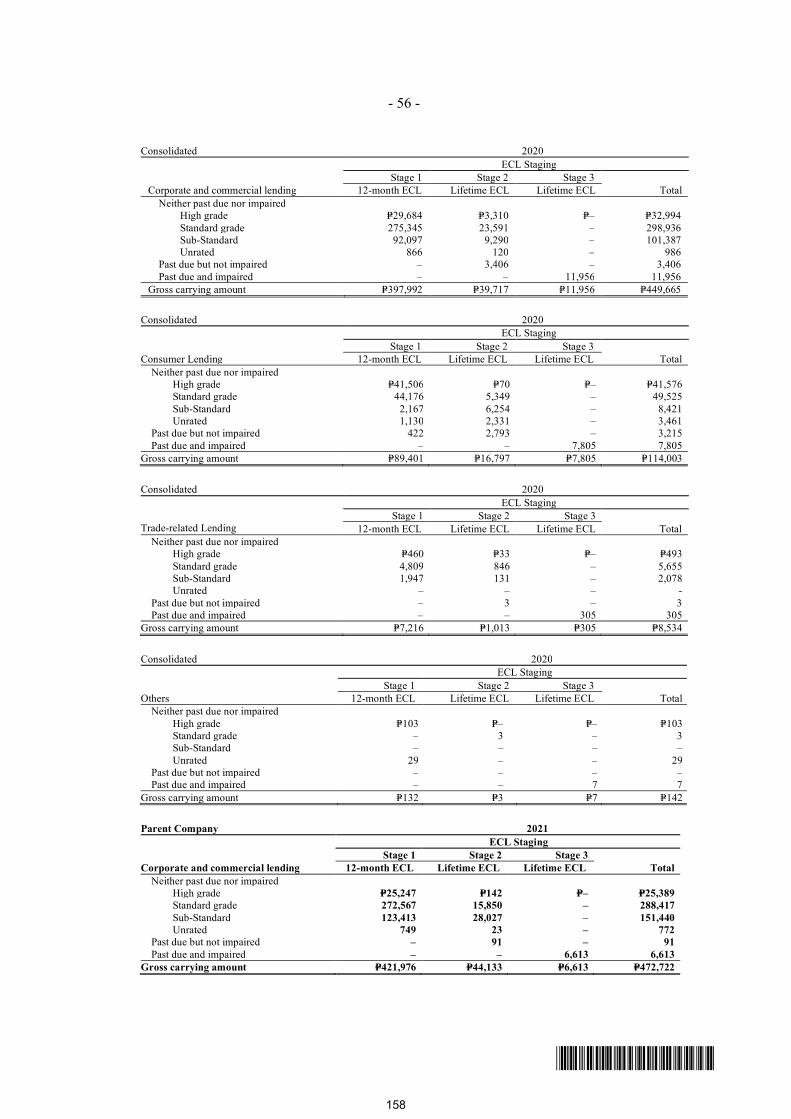
- 56 -
*SGVFS162381*
Consolidated 2020ECL Staging
Corporate and commercial lendingStage 1 Stage 2 Stage 3
12-month ECL Lifetime ECL Lifetime ECL TotalNeither past due nor impaired
High grade P=29,684 P=3,310 P=– P=32,994Standard grade 275,345 23,591 – 298,936Sub-Standard 92,097 9,290 – 101,387Unrated 866 120 – 986
Past due but not impaired – 3,406 – 3,406Past due and impaired – – 11,956 11,956
Gross carrying amount P=397,992 P=39,717 P=11,956 P=449,665
Consolidated 2020ECL Staging
Consumer LendingStage 1 Stage 2 Stage 3
12-month ECL Lifetime ECL Lifetime ECL TotalNeither past due nor impaired
High grade P=41,506 P=70 P=– P=41,576Standard grade 44,176 5,349 – 49,525Sub-Standard 2,167 6,254 – 8,421Unrated 1,130 2,331 – 3,461
Past due but not impaired 422 2,793 – 3,215Past due and impaired – – 7,805 7,805
Gross carrying amount P=89,401 P=16,797 P=7,805 P=114,003
Consolidated 2020ECL Staging
Trade-related LendingStage 1 Stage 2 Stage 3
12-month ECL Lifetime ECL Lifetime ECL TotalNeither past due nor impaired
High grade P=460 P=33 P=– P=493Standard grade 4,809 846 – 5,655Sub-Standard 1,947 131 – 2,078Unrated – – – -
Past due but not impaired – 3 – 3Past due and impaired – – 305 305
Gross carrying amount P=7,216 P=1,013 P=305 P=8,534
Consolidated 2020ECL Staging
OthersStage 1 Stage 2 Stage 3
12-month ECL Lifetime ECL Lifetime ECL TotalNeither past due nor impaired
High grade P=103 P=– P=– P=103Standard grade – 3 – 3Sub-Standard – – – –Unrated 29 – – 29
Past due but not impaired – – – –Past due and impaired – – 7 7
Gross carrying amount P=132 P=3 P=7 P=142
Parent Company 2021ECL Staging
Corporate and commercial lendingStage 1 Stage 2 Stage 3
12-month ECL Lifetime ECL Lifetime ECL TotalNeither past due nor impaired
High grade P=25,247 P=142 P=– P=25,389Standard grade 272,567 15,850 – 288,417Sub-Standard 123,413 28,027 – 151,440Unrated 749 23 – 772
Past due but not impaired – 91 – 91Past due and impaired – – 6,613 6,613
Gross carrying amount P=421,976 P=44,133 P=6,613 P=472,722
158
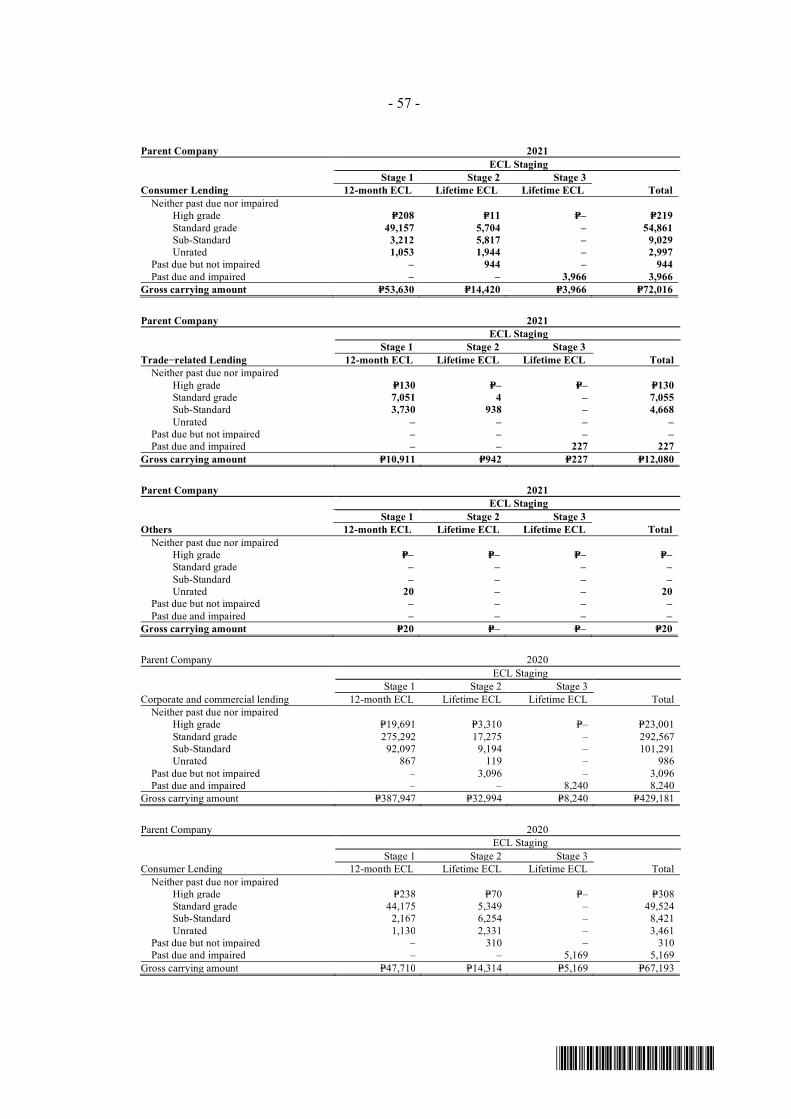
- 57 -
*SGVFS162381*
Parent Company 2021ECL Staging
Consumer LendingStage 1 Stage 2 Stage 3
12-month ECL Lifetime ECL Lifetime ECL TotalNeither past due nor impaired
High grade P=208 P=11 P=– P=219Standard grade 49,157 5,704 – 54,861Sub-Standard 3,212 5,817 – 9,029Unrated 1,053 1,944 – 2,997
Past due but not impaired – 944 – 944Past due and impaired – – 3,966 3,966
Gross carrying amount P=53,630 P=14,420 P=3,966 P=72,016
Parent Company 2021ECL Staging
Trade−related LendingStage 1 Stage 2 Stage 3
12-month ECL Lifetime ECL Lifetime ECL TotalNeither past due nor impaired
High grade P=130 P=– P=– P=130Standard grade 7,051 4 – 7,055Sub-Standard 3,730 938 – 4,668Unrated – – – –
Past due but not impaired – – – –Past due and impaired – – 227 227
Gross carrying amount P=10,911 P=942 P=227 P=12,080
Parent Company 2021ECL Staging
Others Stage 1 Stage 2 Stage 3
12-month ECL Lifetime ECL Lifetime ECL TotalNeither past due nor impaired
High grade P=– P=– P=– P=–Standard grade – – – –Sub-Standard – – – –Unrated 20 – – 20
Past due but not impaired – – – –Past due and impaired – – – –
Gross carrying amount P=20 P=– P=– P=20
Parent Company 2020ECL Staging
Corporate and commercial lendingStage 1 Stage 2 Stage 3
12-month ECL Lifetime ECL Lifetime ECL TotalNeither past due nor impaired
High grade P=19,691 P=3,310 P=– P=23,001Standard grade 275,292 17,275 – 292,567Sub-Standard 92,097 9,194 – 101,291Unrated 867 119 – 986
Past due but not impaired – 3,096 – 3,096Past due and impaired – – 8,240 8,240
Gross carrying amount P=387,947 P=32,994 P=8,240 P=429,181
Parent Company 2020ECL Staging
Consumer LendingStage 1 Stage 2 Stage 3
12-month ECL Lifetime ECL Lifetime ECL TotalNeither past due nor impaired
High grade P=238 P=70 P=– P=308Standard grade 44,175 5,349 – 49,524Sub-Standard 2,167 6,254 – 8,421Unrated 1,130 2,331 – 3,461
Past due but not impaired – 310 – 310Past due and impaired – – 5,169 5,169
Gross carrying amount P=47,710 P=14,314 P=5,169 P=67,193
159
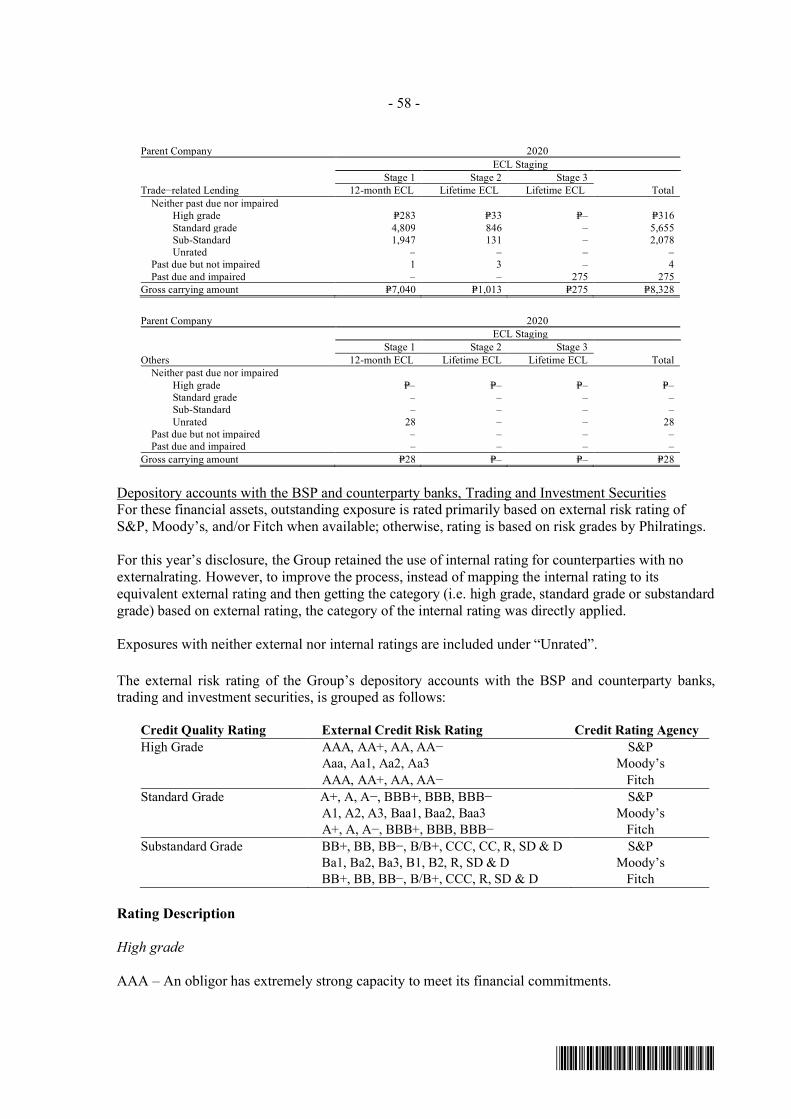
- 58 -
*SGVFS162381*
Parent Company 2020ECL Staging
Trade−related LendingStage 1 Stage 2 Stage 3
12-month ECL Lifetime ECL Lifetime ECL TotalNeither past due nor impaired
High grade P=283 P=33 P=– P=316Standard grade 4,809 846 – 5,655Sub-Standard 1,947 131 – 2,078Unrated – – – –
Past due but not impaired 1 3 – 4Past due and impaired – – 275 275
Gross carrying amount P=7,040 P=1,013 P=275 P=8,328
Parent Company 2020ECL Staging
Others Stage 1 Stage 2 Stage 3
12-month ECL Lifetime ECL Lifetime ECL TotalNeither past due nor impaired
High grade P=– P=– P=– P=–Standard grade – – – –Sub-Standard – – – –Unrated 28 – – 28
Past due but not impaired – – – –Past due and impaired – – – –
Gross carrying amount P=28 P=– P=– P=28
Depository accounts with the BSP and counterparty banks, Trading and Investment SecuritiesFor these financial assets, outstanding exposure is rated primarily based on external risk rating ofS&P, Moody’s, and/or Fitch when available; otherwise, rating is based on risk grades by Philratings.
For this year’s disclosure, the Group retained the use of internal rating for counterparties with noexternalrating. However, to improve the process, instead of mapping the internal rating to itsequivalent external rating and then getting the category (i.e. high grade, standard grade or substandardgrade) based on external rating, the category of the internal rating was directly applied.
Exposures with neither external nor internal ratings are included under “Unrated”.
The external risk rating of the Group’s depository accounts with the BSP and counterparty banks,trading and investment securities, is grouped as follows:
Credit Quality Rating External Credit Risk Rating Credit Rating AgencyHigh Grade AAA, AA+, AA, AA− S&P
Aaa, Aa1, Aa2, Aa3 Moody’s AAA, AA+, AA, AA− Fitch
Standard Grade A+, A, A−, BBB+, BBB, BBB− S&P A1, A2, A3, Baa1, Baa2, Baa3 Moody’s A+, A, A−, BBB+, BBB, BBB− Fitch
Substandard Grade BB+, BB, BB−, B/B+, CCC, CC, R, SD & D S&P Ba1, Ba2, Ba3, B1, B2, R, SD & D Moody’s BB+, BB, BB−, B/B+, CCC, R, SD & D Fitch
Rating Description
High grade
AAA – An obligor has extremely strong capacity to meet its financial commitments.
160
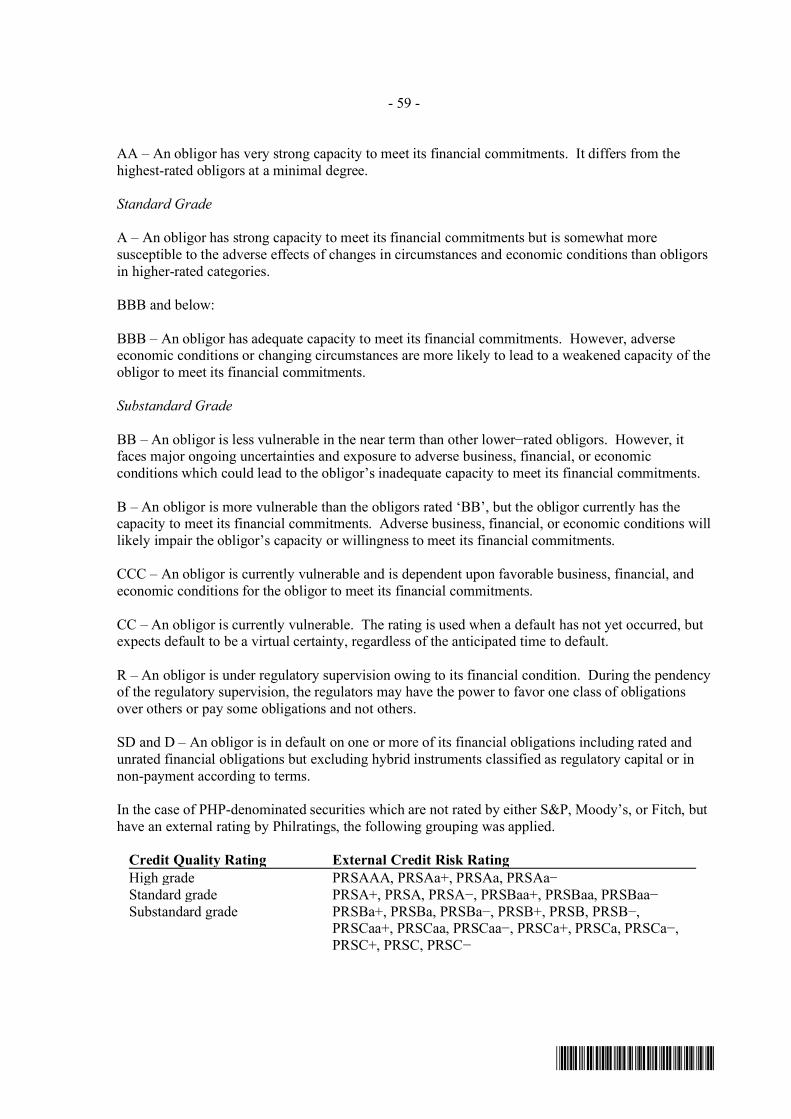
- 59 -
*SGVFS162381*
AA – An obligor has very strong capacity to meet its financial commitments. It differs from thehighest-rated obligors at a minimal degree.
Standard Grade
A – An obligor has strong capacity to meet its financial commitments but is somewhat moresusceptible to the adverse effects of changes in circumstances and economic conditions than obligorsin higher-rated categories.
BBB and below:
BBB – An obligor has adequate capacity to meet its financial commitments. However, adverseeconomic conditions or changing circumstances are more likely to lead to a weakened capacity of theobligor to meet its financial commitments.
Substandard Grade
BB – An obligor is less vulnerable in the near term than other lower−rated obligors. However, itfaces major ongoing uncertainties and exposure to adverse business, financial, or economicconditions which could lead to the obligor’s inadequate capacity to meet its financial commitments.
B – An obligor is more vulnerable than the obligors rated ‘BB’, but the obligor currently has thecapacity to meet its financial commitments. Adverse business, financial, or economic conditions willlikely impair the obligor’s capacity or willingness to meet its financial commitments.
CCC – An obligor is currently vulnerable and is dependent upon favorable business, financial, andeconomic conditions for the obligor to meet its financial commitments.
CC – An obligor is currently vulnerable. The rating is used when a default has not yet occurred, butexpects default to be a virtual certainty, regardless of the anticipated time to default.
R – An obligor is under regulatory supervision owing to its financial condition. During the pendencyof the regulatory supervision, the regulators may have the power to favor one class of obligationsover others or pay some obligations and not others.
SD and D – An obligor is in default on one or more of its financial obligations including rated andunrated financial obligations but excluding hybrid instruments classified as regulatory capital or innon-payment according to terms.
In the case of PHP-denominated securities which are not rated by either S&P, Moody’s, or Fitch, buthave an external rating by Philratings, the following grouping was applied.
Credit Quality Rating External Credit Risk RatingHigh grade PRSAAA, PRSAa+, PRSAa, PRSAa−Standard grade PRSA+, PRSA, PRSA−, PRSBaa+, PRSBaa, PRSBaa−Substandard grade PRSBa+, PRSBa, PRSBa−, PRSB+, PRSB, PRSB−,
PRSCaa+, PRSCaa, PRSCaa−, PRSCa+, PRSCa, PRSCa−,PRSC+, PRSC, PRSC−
161
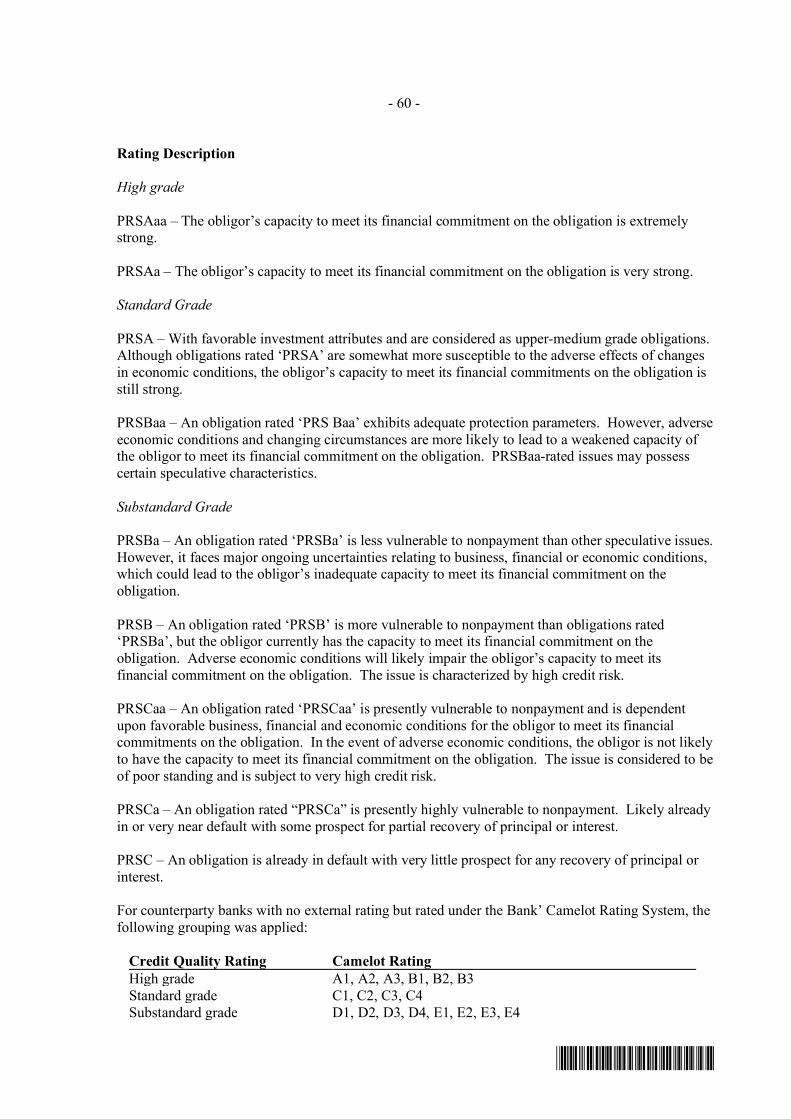
- 60 -
*SGVFS162381*
Rating Description
High grade
PRSAaa – The obligor’s capacity to meet its financial commitment on the obligation is extremelystrong.
PRSAa – The obligor’s capacity to meet its financial commitment on the obligation is very strong.
Standard Grade
PRSA – With favorable investment attributes and are considered as upper-medium grade obligations.Although obligations rated ‘PRSA’ are somewhat more susceptible to the adverse effects of changesin economic conditions, the obligor’s capacity to meet its financial commitments on the obligation isstill strong.
PRSBaa – An obligation rated ‘PRS Baa’ exhibits adequate protection parameters. However, adverseeconomic conditions and changing circumstances are more likely to lead to a weakened capacity ofthe obligor to meet its financial commitment on the obligation. PRSBaa-rated issues may possesscertain speculative characteristics.
Substandard Grade
PRSBa – An obligation rated ‘PRSBa’ is less vulnerable to nonpayment than other speculative issues.However, it faces major ongoing uncertainties relating to business, financial or economic conditions,which could lead to the obligor’s inadequate capacity to meet its financial commitment on theobligation.
PRSB – An obligation rated ‘PRSB’ is more vulnerable to nonpayment than obligations rated‘PRSBa’, but the obligor currently has the capacity to meet its financial commitment on theobligation. Adverse economic conditions will likely impair the obligor’s capacity to meet itsfinancial commitment on the obligation. The issue is characterized by high credit risk.
PRSCaa – An obligation rated ‘PRSCaa’ is presently vulnerable to nonpayment and is dependentupon favorable business, financial and economic conditions for the obligor to meet its financialcommitments on the obligation. In the event of adverse economic conditions, the obligor is not likelyto have the capacity to meet its financial commitment on the obligation. The issue is considered to beof poor standing and is subject to very high credit risk.
PRSCa – An obligation rated “PRSCa” is presently highly vulnerable to nonpayment. Likely alreadyin or very near default with some prospect for partial recovery of principal or interest.
PRSC – An obligation is already in default with very little prospect for any recovery of principal orinterest.
For counterparty banks with no external rating but rated under the Bank’ Camelot Rating System, thefollowing grouping was applied:
Credit Quality Rating Camelot RatingHigh grade A1, A2, A3, B1, B2, B3Standard grade C1, C2, C3, C4Substandard grade D1, D2, D3, D4, E1, E2, E3, E4
162
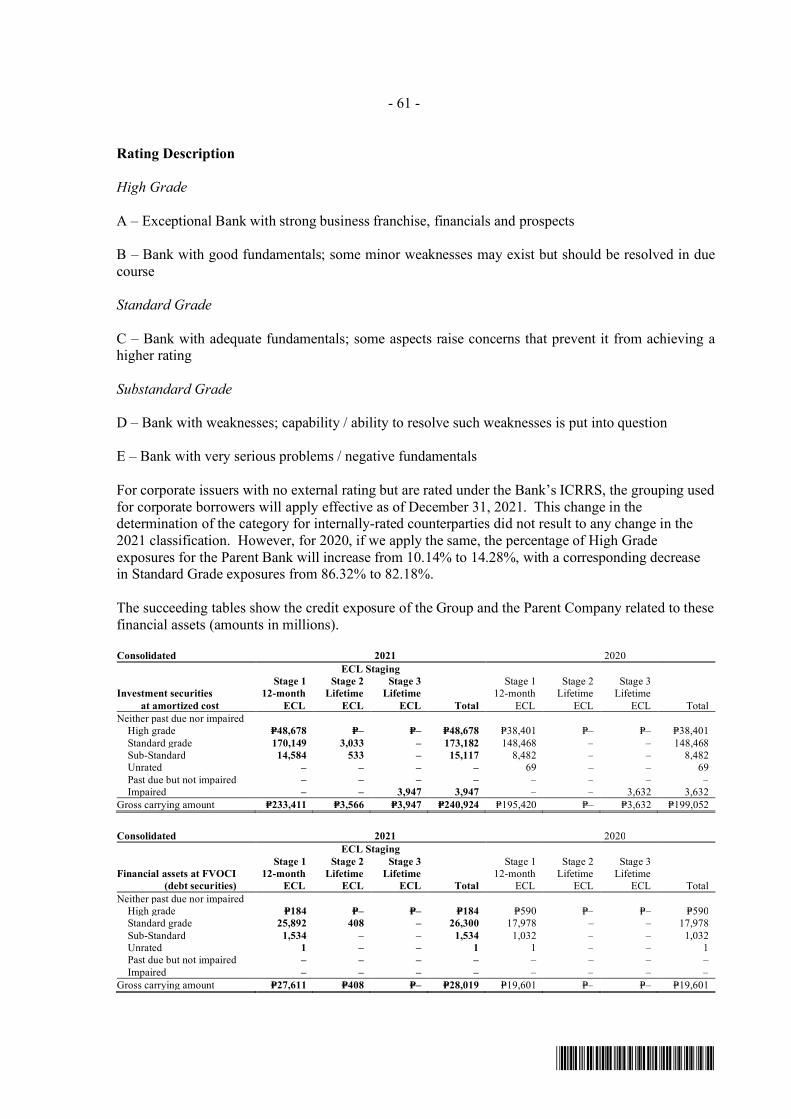
- 61 -
*SGVFS162381*
Rating Description
High Grade
A – Exceptional Bank with strong business franchise, financials and prospects
B – Bank with good fundamentals; some minor weaknesses may exist but should be resolved in duecourse
Standard Grade
C – Bank with adequate fundamentals; some aspects raise concerns that prevent it from achieving ahigher rating
Substandard Grade
D – Bank with weaknesses; capability / ability to resolve such weaknesses is put into question
E – Bank with very serious problems / negative fundamentals
For corporate issuers with no external rating but are rated under the Bank’s ICRRS, the grouping usedfor corporate borrowers will apply effective as of December 31, 2021. This change in thedetermination of the category for internally-rated counterparties did not result to any change in the2021 classification. However, for 2020, if we apply the same, the percentage of High Gradeexposures for the Parent Bank will increase from 10.14% to 14.28%, with a corresponding decreasein Standard Grade exposures from 86.32% to 82.18%.
The succeeding tables show the credit exposure of the Group and the Parent Company related to thesefinancial assets (amounts in millions).
Consolidated 2021 2020ECL Staging
Investment securitiesat amortized cost
Stage 1 Stage 2 Stage 3 Stage 1 Stage 2 Stage 3 12-month
ECL Lifetime
ECL Lifetime
ECL Total 12-month
ECL Lifetime
ECL Lifetime
ECL TotalNeither past due nor impaired
High grade P=48,678 P=– P=– P=48,678 P=38,401 P=– P=– P=38,401Standard grade 170,149 3,033 – 173,182 148,468 – – 148,468Sub-Standard 14,584 533 – 15,117 8,482 – – 8,482Unrated – – – – 69 – – 69Past due but not impaired – – – – – – – –Impaired – – 3,947 3,947 – – 3,632 3,632
Gross carrying amount P=233,411 P=3,566 P=3,947 P=240,924 P=195,420 P=– P=3,632 P=199,052
Consolidated 2021 2020ECL Staging
Financial assets at FVOCI(debt securities)
Stage 1 Stage 2 Stage 3 Stage 1 Stage 2 Stage 3 12-month
ECL Lifetime
ECL Lifetime
ECL Total 12-month
ECL Lifetime
ECL Lifetime
ECL TotalNeither past due nor impaired
High grade P=184 P=– P=– P=184 P=590 P=– P=– P=590Standard grade 25,892 408 – 26,300 17,978 – – 17,978Sub-Standard 1,534 – – 1,534 1,032 – – 1,032Unrated 1 – – 1 1 – – 1Past due but not impaired – – – – – – – –Impaired – – – – – – – –
Gross carrying amount P=27,611 P=408 P=– P=28,019 P=19,601 P=– P=– P=19,601
163
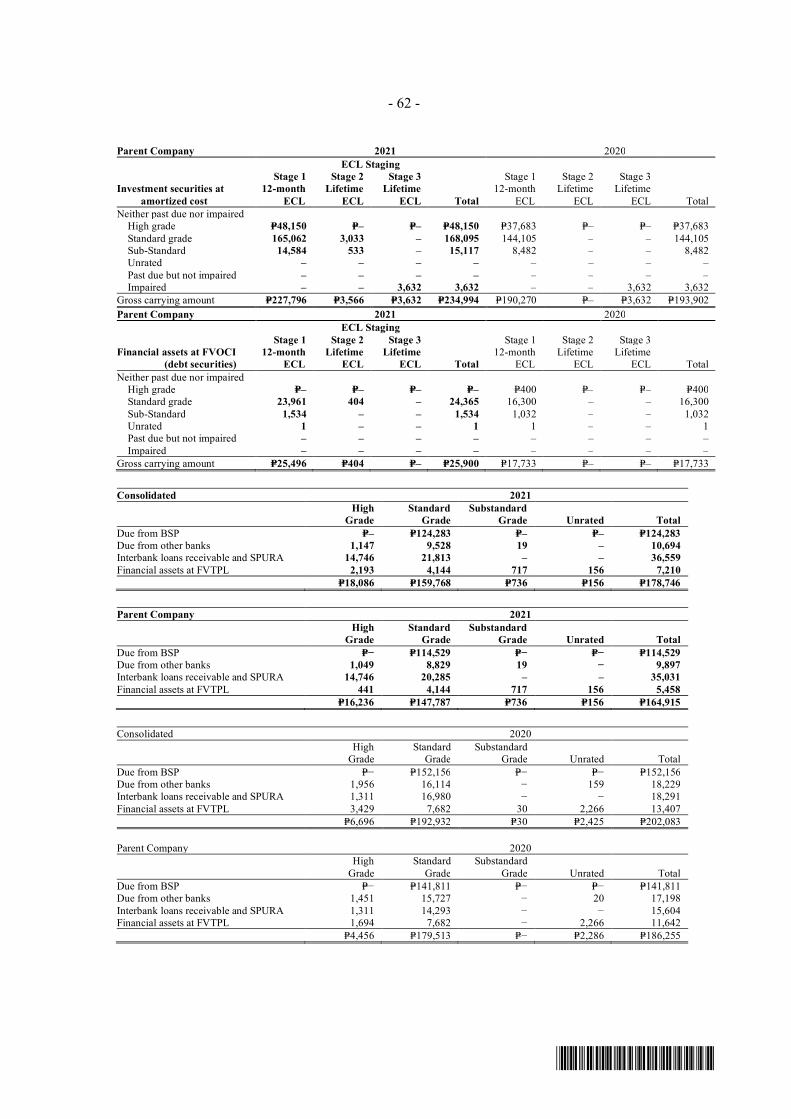
- 62 -
*SGVFS162381*
Parent Company 2021 2020ECL Staging
Investment securities atamortized cost
Stage 1 Stage 2 Stage 3 Stage 1 Stage 2 Stage 3 12-month
ECL Lifetime
ECL Lifetime
ECL Total 12-month
ECL Lifetime
ECL Lifetime
ECL TotalNeither past due nor impaired
High grade P=48,150 P=– P=– P=48,150 P=37,683 P=– P=– P=37,683Standard grade 165,062 3,033 – 168,095 144,105 – – 144,105Sub-Standard 14,584 533 – 15,117 8,482 – – 8,482Unrated – – – – – – – –Past due but not impaired – – – – – – – –Impaired – – 3,632 3,632 – – 3,632 3,632
Gross carrying amount P=227,796 P=3,566 P=3,632 P=234,994 P=190,270 P=– P=3,632 P=193,902Parent Company 2021 2020
ECL Staging
Financial assets at FVOCI(debt securities)
Stage 1 Stage 2 Stage 3 Stage 1 Stage 2 Stage 3 12-month
ECL Lifetime
ECL Lifetime
ECL Total 12-month
ECL Lifetime
ECL Lifetime
ECL TotalNeither past due nor impaired
High grade P=– P=– P=– P=– P=400 P=– P=– P=400Standard grade 23,961 404 – 24,365 16,300 – – 16,300Sub-Standard 1,534 – – 1,534 1,032 – – 1,032Unrated 1 – – 1 1 – – 1Past due but not impaired – – – – – – – –Impaired – – – – – – – –
Gross carrying amount P=25,496 P=404 P=– P=25,900 P=17,733 P=– P=– P=17,733
Consolidated 2021High
GradeStandard
GradeSubstandard
Grade Unrated TotalDue from BSP P=– P=124,283 P=– P=– P=124,283Due from other banks 1,147 9,528 19 – 10,694Interbank loans receivable and SPURA 14,746 21,813 – – 36,559Financial assets at FVTPL 2,193 4,144 717 156 7,210
P=18,086 P=159,768 P=736 P=156 P=178,746
Parent Company 2021High
GradeStandard
GradeSubstandard
Grade Unrated TotalDue from BSP P=− P=114,529 P=− P=− P=114,529Due from other banks 1,049 8,829 19 − 9,897Interbank loans receivable and SPURA 14,746 20,285 – – 35,031Financial assets at FVTPL 441 4,144 717 156 5,458
P=16,236 P=147,787 P=736 P=156 P=164,915
Consolidated 2020High
GradeStandard
GradeSubstandard
Grade Unrated TotalDue from BSP P=− P=152,156 P=− P=− P=152,156Due from other banks 1,956 16,114 − 159 18,229Interbank loans receivable and SPURA 1,311 16,980 − − 18,291Financial assets at FVTPL 3,429 7,682 30 2,266 13,407
P=6,696 P=192,932 P=30 P=2,425 P=202,083
Parent Company 2020High
GradeStandard
GradeSubstandard
Grade Unrated TotalDue from BSP P=− P=141,811 P=− P=− P=141,811Due from other banks 1,451 15,727 − 20 17,198Interbank loans receivable and SPURA 1,311 14,293 − − 15,604Financial assets at FVTPL 1,694 7,682 − 2,266 11,642
P=4,456 P=179,513 P=− P=2,286 P=186,255
164
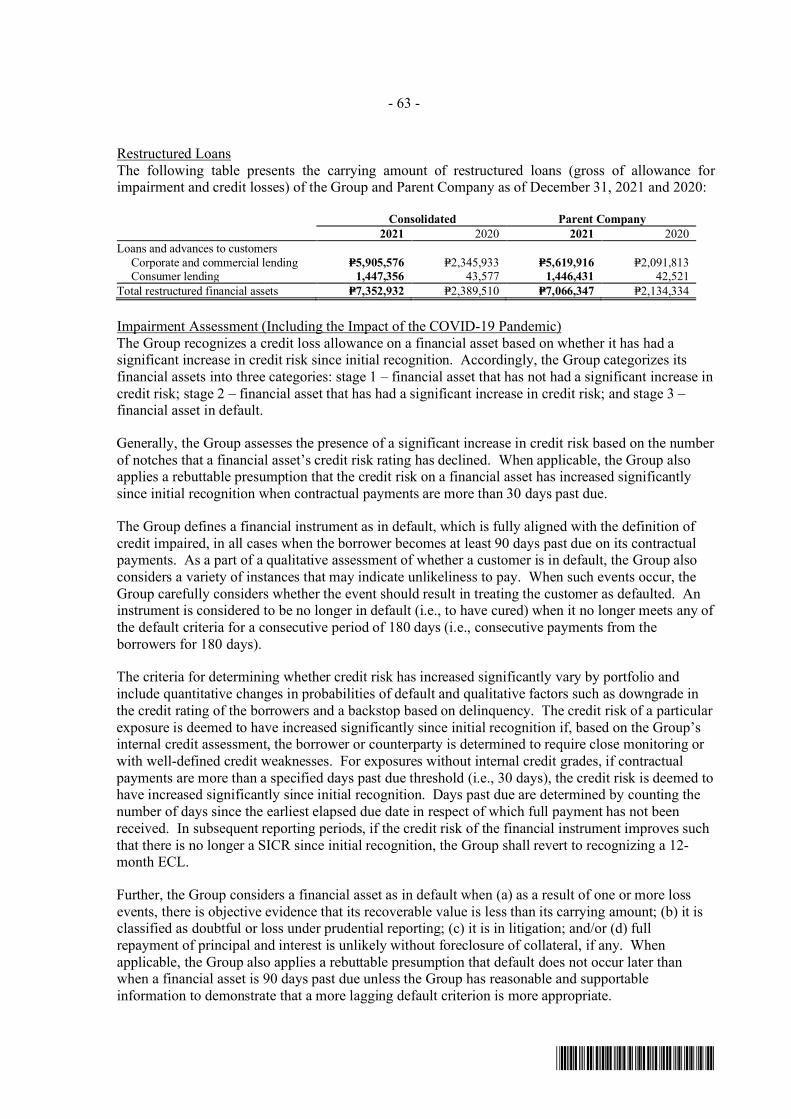
- 63 -
*SGVFS162381*
Restructured LoansThe following table presents the carrying amount of restructured loans (gross of allowance forimpairment and credit losses) of the Group and Parent Company as of December 31, 2021 and 2020:
Consolidated Parent Company2021 2020 2021 2020
Loans and advances to customersCorporate and commercial lending P=5,905,576 P=2,345,933 P=5,619,916 P=2,091,813Consumer lending 1,447,356 43,577 1,446,431 42,521
Total restructured financial assets P=7,352,932 P=2,389,510 P=7,066,347 P=2,134,334
Impairment Assessment (Including the Impact of the COVID-19 Pandemic)The Group recognizes a credit loss allowance on a financial asset based on whether it has had asignificant increase in credit risk since initial recognition. Accordingly, the Group categorizes itsfinancial assets into three categories: stage 1 – financial asset that has not had a significant increase incredit risk; stage 2 – financial asset that has had a significant increase in credit risk; and stage 3 –financial asset in default.
Generally, the Group assesses the presence of a significant increase in credit risk based on the numberof notches that a financial asset’s credit risk rating has declined. When applicable, the Group alsoapplies a rebuttable presumption that the credit risk on a financial asset has increased significantlysince initial recognition when contractual payments are more than 30 days past due.
The Group defines a financial instrument as in default, which is fully aligned with the definition ofcredit impaired, in all cases when the borrower becomes at least 90 days past due on its contractualpayments. As a part of a qualitative assessment of whether a customer is in default, the Group alsoconsiders a variety of instances that may indicate unlikeliness to pay. When such events occur, theGroup carefully considers whether the event should result in treating the customer as defaulted. Aninstrument is considered to be no longer in default (i.e., to have cured) when it no longer meets any ofthe default criteria for a consecutive period of 180 days (i.e., consecutive payments from theborrowers for 180 days).
The criteria for determining whether credit risk has increased significantly vary by portfolio andinclude quantitative changes in probabilities of default and qualitative factors such as downgrade inthe credit rating of the borrowers and a backstop based on delinquency. The credit risk of a particularexposure is deemed to have increased significantly since initial recognition if, based on the Group’sinternal credit assessment, the borrower or counterparty is determined to require close monitoring orwith well-defined credit weaknesses. For exposures without internal credit grades, if contractualpayments are more than a specified days past due threshold (i.e., 30 days), the credit risk is deemed tohave increased significantly since initial recognition. Days past due are determined by counting thenumber of days since the earliest elapsed due date in respect of which full payment has not beenreceived. In subsequent reporting periods, if the credit risk of the financial instrument improves suchthat there is no longer a SICR since initial recognition, the Group shall revert to recognizing a 12-month ECL.
Further, the Group considers a financial asset as in default when (a) as a result of one or more lossevents, there is objective evidence that its recoverable value is less than its carrying amount; (b) it isclassified as doubtful or loss under prudential reporting; (c) it is in litigation; and/or (d) fullrepayment of principal and interest is unlikely without foreclosure of collateral, if any. Whenapplicable, the Group also applies a rebuttable presumption that default does not occur later thanwhen a financial asset is 90 days past due unless the Group has reasonable and supportableinformation to demonstrate that a more lagging default criterion is more appropriate.
165
- 64 -
*SGVFS162381*
In view of the government moratorium on loan payments (see Note 10), the Group considered howthe availment of the borrowers and counterparties will affect the stage classification of the financialassets. In particular, the Group assessed how the availment of the mandatory grace period, togetherwith other relevant information about the borrower (e.g., impact of the pandemic to its industry andoperations, potential cash flow pressures affecting the borrower’s capacity to pay amounts becomingdue), will affect SICR and default assessments. Based on these assessments, in the absence ofindicators of impairment or SICR since initial recognition, exposures to borrowers and counterpartieswho availed of the mandatory grace period as provided for by law are classified as stage 1.
The Group then measures the credit loss allowance on a financial instrument at an amount equal to12-month expected credit losses for items categorized as stage 1 and lifetime credit losses to itemscategorized as stage 2 and stage 3.
The Group modeled the following inputs to the expected credit loss formula separately. The formulais applied to each financial asset, with certain exceptions wherein a collective or other generalapproach is applied:
Exposure at Default (EAD)The Group defines EAD as the principal and interests that would not be collected assuming theborrower defaults during a future point in time. The Group computes for a financial asset’s EADusing the expected contractual cash flows during the contractual life of the financial instrument. Afinancial asset’s EAD is defined as the sum of EAD from principal and EAD from interest.
In relation to the modification of loans and receivables (see Note 10), the Group utilized the revisedor modified cash flows of financial assets as EAD in calculating allowance for credit losses.
Probability of default (PD)The Group uses forward-looking PD estimates that are unbiased and probability-weighted using arange of possible outcomes. The PD for each individual instrument is modelled based on historicaldata and is estimated based on current market conditions and reasonable and supportable informationabout future economic conditions. The Group segmented its credit exposures based on homogenousrisk characteristics and developed a corresponding PD methodology for each portfolio. The PDmethodology for each relevant portfolio is determined based on the underlying nature orcharacteristic of the portfolio, behavior of the accounts, and materiality of the segment as comparedto the total portfolio. The Group’s PDs are mainly categorized into three: (a) corporate; (b)sovereign; and (c) retail.
The PDs used in calculating allowance for credit losses have been updated with information afterconsidering the impact of the pandemic to current market conditions as well as expectations aboutfuture economic conditions (i.e., forward-looking information).
Loss given default (LGD)The Group’s LGD model considers certain factors such as the historical cash flow recovery andreasonable and supportable information about future economic conditions, where appropriate.Generally, the model utilizes the Group’s existing loan exposure rating system which is designed tocapture these factors as well as the characteristics of collaterals related to an exposure. In caseswherein this does not apply, the Group looks into the standard characteristics of collaterals (e.g., autoand housing loans) in order to estimate an LGD factor. In the case of exposures without collaterals(e.g., securities), the Group uses internationally-accepted standard LGD factors. As of December 31,2021, the Group has updated all available collateral information in order to incorporate the impact ofthe pandemic, to the extent possible, in measuring LGD.
166
- 65 -
*SGVFS162381*
The Group will continue to assess the current market conditions and forecasts of future economicconditions, and its impact to the aforementioned items, in order to update the ECL on a timely basisin the upcoming reporting periods, as the country continues to deal with this public health crisis.
Credit ReviewIn accordance with BSP Circular 855, credit reviews are conducted on loan accounts to evaluatewhether loans are granted in accordance with the Parent Company’s policies and to assess loanquality and appropriateness of classification.
Results of credit reviews are promptly reported to management to apprise them of any significantfindings for proper corrective actions.
Market RiskMarket risk is the risk of loss that may result from changes in the value of a financial product. TheParent Company’s market risk originates from its holdings of domestic and foreign-denominated debtsecurities, foreign exchange instruments, equities, foreign exchange derivatives, and interest ratederivatives.
The RMG of the Parent Company is responsible for assisting the ROC with its responsibility foridentifying, measuring, managing, and controlling market risk. Market risk management measuresthe Parent Company market risk exposures through the use of VaR. VaR is a statistical measure thatestimates the maximum potential loss from a portfolio over a holding period, within a givenconfidence level.
VaR assumptionsThe Parent Company calculates the VaR in trading activities. The Parent Company uses theHistorical Simulation Full Valuation approach to measure VaR for all treasury traded instruments,using a 99.00% confidence level and a 1−day holding period.
The use of a 99.00% confidence level means that, within a one day horizon, losses exceeding the VaRfigure should occur, on average, not more than once every hundred days. The validity of the VaRmodel is verified through back testing, which examines how frequently actual and hypothetical dailylosses exceeds daily VaR. The Parent Company measures and monitors the VaR and profit and losson a daily basis.
Since VaR is an integral part of the Parent Company’s market risk management, VaR limits havebeen established for all trading positions and exposures are reviewed daily against the limits bymanagement. Further, stress testing is performed for monitoring extreme events.
Limitations of the VaR MethodologyThe VaR models are designed to measure market risk in a normal market environment using equallyweighted historical data. The use of VaR has limitations because it is based on historical correlationsand volatilities in market prices and assumes that future price movements will follow the samedistribution. Due to the fact that VaR relies heavily on historical data to provide information and maynot clearly predict the future changes and modifications of the risk factors, the probability of largemarket moves may be underestimated if changes in risk factors fail to align with the assumptions.VaR may also be under- or over-estimated due to the assumptions placed on risk factors and therelationship between such factors for specific instruments. Even though positions may changethroughout the day, the VaR only represents the risk of the portfolios at the close of each businessday, and it does not account for any losses that may occur beyond the 99.00% confidence level.
167
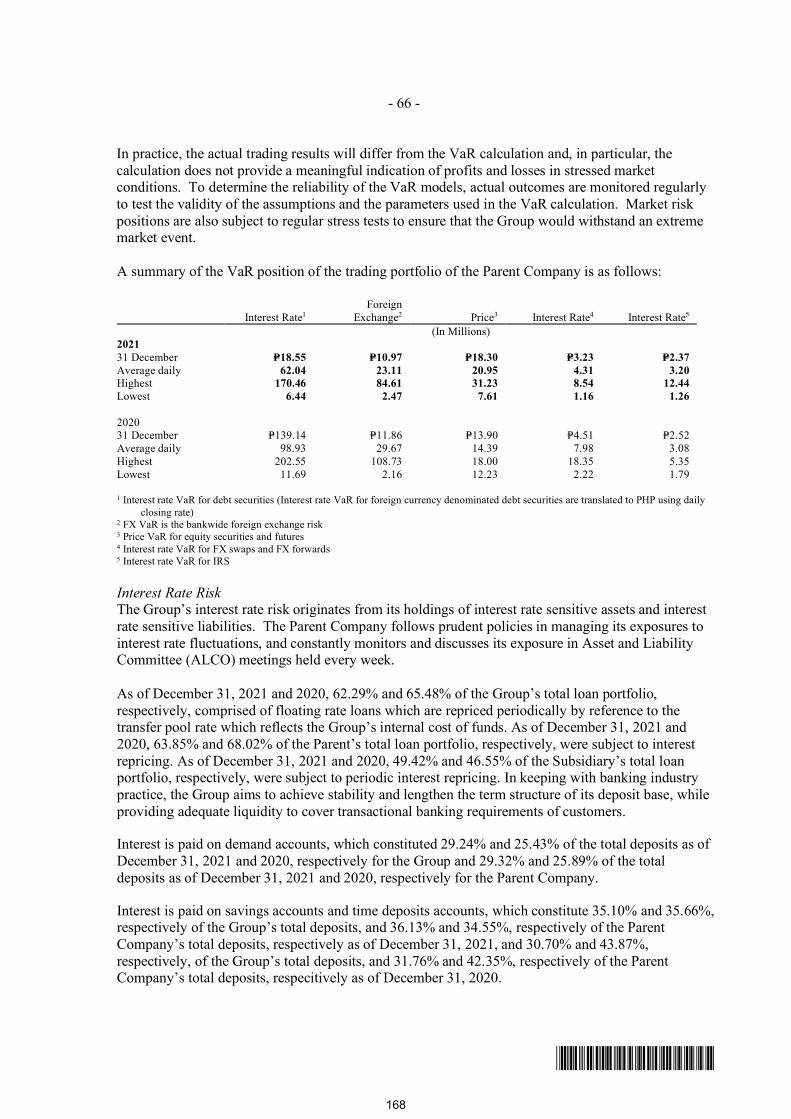
- 66 -
*SGVFS162381*
In practice, the actual trading results will differ from the VaR calculation and, in particular, thecalculation does not provide a meaningful indication of profits and losses in stressed marketconditions. To determine the reliability of the VaR models, actual outcomes are monitored regularlyto test the validity of the assumptions and the parameters used in the VaR calculation. Market riskpositions are also subject to regular stress tests to ensure that the Group would withstand an extrememarket event.
A summary of the VaR position of the trading portfolio of the Parent Company is as follows:
Interest Rate1Foreign
Exchange2 Price3 Interest Rate4 Interest Rate5
(In Millions)202131 December P=18.55 P=10.97 P=18.30 P=3.23 P=2.37Average daily 62.04 23.11 20.95 4.31 3.20Highest 170.46 84.61 31.23 8.54 12.44Lowest 6.44 2.47 7.61 1.16 1.26
202031 December P=139.14 P=11.86 P=13.90 P=4.51 P=2.52Average daily 98.93 29.67 14.39 7.98 3.08Highest 202.55 108.73 18.00 18.35 5.35Lowest 11.69 2.16 12.23 2.22 1.79
1 Interest rate VaR for debt securities (Interest rate VaR for foreign currency denominated debt securities are translated to PHP using dailyclosing rate)
2 FX VaR is the bankwide foreign exchange risk3 Price VaR for equity securities and futures4 Interest rate VaR for FX swaps and FX forwards5 Interest rate VaR for IRS
Interest Rate RiskThe Group’s interest rate risk originates from its holdings of interest rate sensitive assets and interestrate sensitive liabilities. The Parent Company follows prudent policies in managing its exposures tointerest rate fluctuations, and constantly monitors and discusses its exposure in Asset and LiabilityCommittee (ALCO) meetings held every week.
As of December 31, 2021 and 2020, 62.29% and 65.48% of the Group’s total loan portfolio,respectively, comprised of floating rate loans which are repriced periodically by reference to thetransfer pool rate which reflects the Group’s internal cost of funds. As of December 31, 2021 and2020, 63.85% and 68.02% of the Parent’s total loan portfolio, respectively, were subject to interestrepricing. As of December 31, 2021 and 2020, 49.42% and 46.55% of the Subsidiary’s total loanportfolio, respectively, were subject to periodic interest repricing. In keeping with banking industrypractice, the Group aims to achieve stability and lengthen the term structure of its deposit base, whileproviding adequate liquidity to cover transactional banking requirements of customers.
Interest is paid on demand accounts, which constituted 29.24% and 25.43% of the total deposits as ofDecember 31, 2021 and 2020, respectively for the Group and 29.32% and 25.89% of the totaldeposits as of December 31, 2021 and 2020, respectively for the Parent Company.
Interest is paid on savings accounts and time deposits accounts, which constitute 35.10% and 35.66%,respectively of the Group’s total deposits, and 36.13% and 34.55%, respectively of the ParentCompany’s total deposits, respectively as of December 31, 2021, and 30.70% and 43.87%,respectively, of the Group’s total deposits, and 31.76% and 42.35%, respectively of the ParentCompany’s total deposits, respecitively as of December 31, 2020.
168
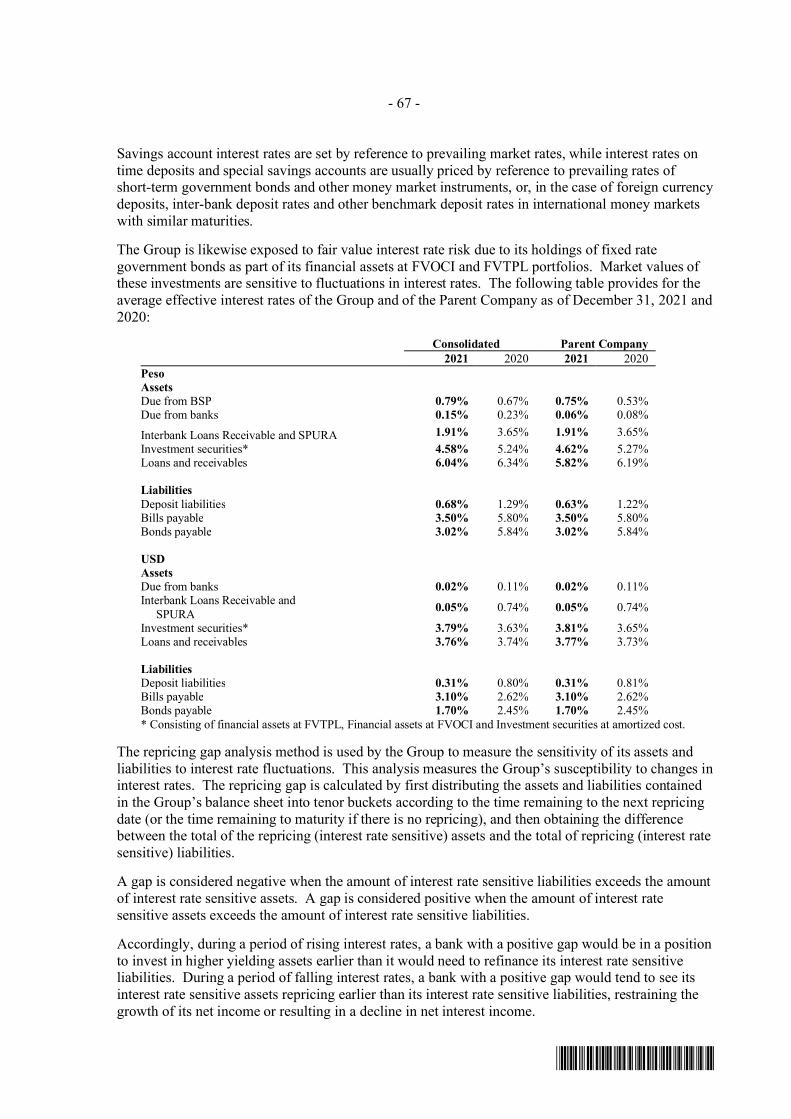
- 67 -
*SGVFS162381*
Savings account interest rates are set by reference to prevailing market rates, while interest rates ontime deposits and special savings accounts are usually priced by reference to prevailing rates ofshort-term government bonds and other money market instruments, or, in the case of foreign currencydeposits, inter-bank deposit rates and other benchmark deposit rates in international money marketswith similar maturities.
The Group is likewise exposed to fair value interest rate risk due to its holdings of fixed rategovernment bonds as part of its financial assets at FVOCI and FVTPL portfolios. Market values ofthese investments are sensitive to fluctuations in interest rates. The following table provides for theaverage effective interest rates of the Group and of the Parent Company as of December 31, 2021 and2020:
Consolidated Parent Company2021 2020 2021 2020
PesoAssetsDue from BSP 0.79% 0.67% 0.75% 0.53%Due from banks 0.15% 0.23% 0.06% 0.08%
Interbank Loans Receivable and SPURA 1.91% 3.65% 1.91% 3.65%Investment securities* 4.58% 5.24% 4.62% 5.27%Loans and receivables 6.04% 6.34% 5.82% 6.19%
LiabilitiesDeposit liabilities 0.68% 1.29% 0.63% 1.22%Bills payable 3.50% 5.80% 3.50% 5.80%Bonds payable 3.02% 5.84% 3.02% 5.84%
USDAssetsDue from banks 0.02% 0.11% 0.02% 0.11%Interbank Loans Receivable and
SPURA 0.05% 0.74% 0.05% 0.74%
Investment securities* 3.79% 3.63% 3.81% 3.65%Loans and receivables 3.76% 3.74% 3.77% 3.73%
LiabilitiesDeposit liabilities 0.31% 0.80% 0.31% 0.81%Bills payable 3.10% 2.62% 3.10% 2.62%Bonds payable 1.70% 2.45% 1.70% 2.45%* Consisting of financial assets at FVTPL, Financial assets at FVOCI and Investment securities at amortized cost.
The repricing gap analysis method is used by the Group to measure the sensitivity of its assets andliabilities to interest rate fluctuations. This analysis measures the Group’s susceptibility to changes ininterest rates. The repricing gap is calculated by first distributing the assets and liabilities containedin the Group’s balance sheet into tenor buckets according to the time remaining to the next repricingdate (or the time remaining to maturity if there is no repricing), and then obtaining the differencebetween the total of the repricing (interest rate sensitive) assets and the total of repricing (interest ratesensitive) liabilities.
A gap is considered negative when the amount of interest rate sensitive liabilities exceeds the amountof interest rate sensitive assets. A gap is considered positive when the amount of interest ratesensitive assets exceeds the amount of interest rate sensitive liabilities.
Accordingly, during a period of rising interest rates, a bank with a positive gap would be in a positionto invest in higher yielding assets earlier than it would need to refinance its interest rate sensitiveliabilities. During a period of falling interest rates, a bank with a positive gap would tend to see itsinterest rate sensitive assets repricing earlier than its interest rate sensitive liabilities, restraining thegrowth of its net income or resulting in a decline in net interest income.
169
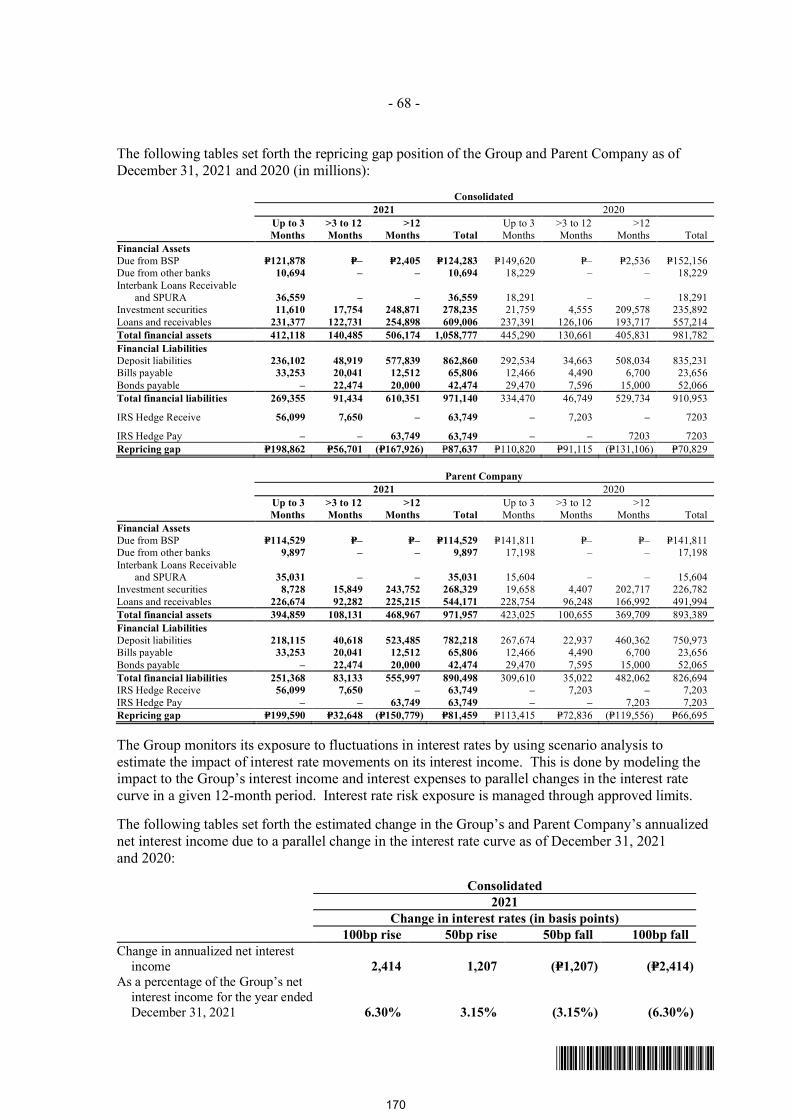
- 68 -
*SGVFS162381*
The following tables set forth the repricing gap position of the Group and Parent Company as ofDecember 31, 2021 and 2020 (in millions):
Consolidated2021 2020
Up to 3Months
>3 to 12Months
>12Months Total
Up to 3Months
>3 to 12Months
>12Months Total
Financial AssetsDue from BSP P=121,878 P=– P=2,405 P=124,283 P=149,620 P=– P=2,536 P=152,156Due from other banks 10,694 – – 10,694 18,229 – – 18,229Interbank Loans Receivable
and SPURA 36,559 – – 36,559 18,291 – – 18,291Investment securities 11,610 17,754 248,871 278,235 21,759 4,555 209,578 235,892Loans and receivables 231,377 122,731 254,898 609,006 237,391 126,106 193,717 557,214Total financial assets 412,118 140,485 506,174 1,058,777 445,290 130,661 405,831 981,782Financial LiabilitiesDeposit liabilities 236,102 48,919 577,839 862,860 292,534 34,663 508,034 835,231Bills payable 33,253 20,041 12,512 65,806 12,466 4,490 6,700 23,656Bonds payable – 22,474 20,000 42,474 29,470 7,596 15,000 52,066Total financial liabilities 269,355 91,434 610,351 971,140 334,470 46,749 529,734 910,953
IRS Hedge Receive 56,099 7,650 – 63,749 – 7,203 – 7203
IRS Hedge Pay – – 63,749 63,749 – – 7203 7203Repricing gap P=198,862 P=56,701 (P=167,926) P=87,637 P=110,820 P=91,115 (P=131,106) P=70,829
Parent Company2021 2020
Up to 3Months
>3 to 12Months
>12Months Total
Up to 3Months
>3 to 12Months
>12Months Total
Financial AssetsDue from BSP P=114,529 P=– P=– P=114,529 P=141,811 P=– P=– P=141,811Due from other banks 9,897 – – 9,897 17,198 – – 17,198Interbank Loans Receivable
and SPURA 35,031 – – 35,031 15,604 – – 15,604Investment securities 8,728 15,849 243,752 268,329 19,658 4,407 202,717 226,782Loans and receivables 226,674 92,282 225,215 544,171 228,754 96,248 166,992 491,994Total financial assets 394,859 108,131 468,967 971,957 423,025 100,655 369,709 893,389Financial LiabilitiesDeposit liabilities 218,115 40,618 523,485 782,218 267,674 22,937 460,362 750,973Bills payable 33,253 20,041 12,512 65,806 12,466 4,490 6,700 23,656Bonds payable – 22,474 20,000 42,474 29,470 7,595 15,000 52,065Total financial liabilities 251,368 83,133 555,997 890,498 309,610 35,022 482,062 826,694IRS Hedge Receive 56,099 7,650 – 63,749 – 7,203 – 7,203IRS Hedge Pay – – 63,749 63,749 – – 7,203 7,203Repricing gap P=199,590 P=32,648 (P=150,779) P=81,459 P=113,415 P=72,836 (P=119,556) P=66,695
The Group monitors its exposure to fluctuations in interest rates by using scenario analysis toestimate the impact of interest rate movements on its interest income. This is done by modeling theimpact to the Group’s interest income and interest expenses to parallel changes in the interest ratecurve in a given 12-month period. Interest rate risk exposure is managed through approved limits.
The following tables set forth the estimated change in the Group’s and Parent Company’s annualizednet interest income due to a parallel change in the interest rate curve as of December 31, 2021and 2020:
Consolidated2021
Change in interest rates (in basis points)100bp rise 50bp rise 50bp fall 100bp fall
Change in annualized net interestincome 2,414 1,207 (P=1,207) (P=2,414)
As a percentage of the Group’s netinterest income for the year endedDecember 31, 2021 6.30% 3.15% (3.15%) (6.30%)
170
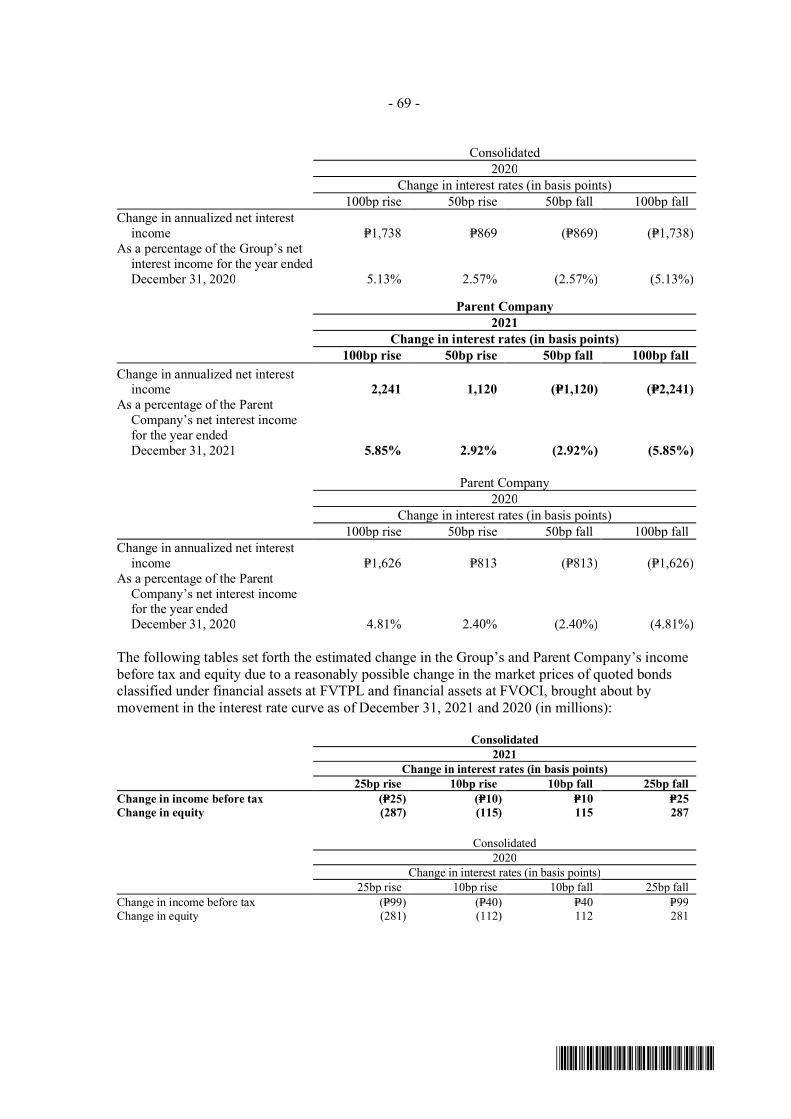
- 69 -
*SGVFS162381*
Consolidated2020
Change in interest rates (in basis points)100bp rise 50bp rise 50bp fall 100bp fall
Change in annualized net interestincome P=1,738 P=869 (P=869) (P=1,738)
As a percentage of the Group’s netinterest income for the year endedDecember 31, 2020 5.13% 2.57% (2.57%) (5.13%)
Parent Company2021
Change in interest rates (in basis points)100bp rise 50bp rise 50bp fall 100bp fall
Change in annualized net interestincome 2,241 1,120 (P=1,120) (P=2,241)
As a percentage of the ParentCompany’s net interest incomefor the year endedDecember 31, 2021 5.85% 2.92% (2.92%) (5.85%)
Parent Company2020
Change in interest rates (in basis points)100bp rise 50bp rise 50bp fall 100bp fall
Change in annualized net interestincome P=1,626 P=813 (P=813) (P=1,626)
As a percentage of the ParentCompany’s net interest incomefor the year endedDecember 31, 2020 4.81% 2.40% (2.40%) (4.81%)
The following tables set forth the estimated change in the Group’s and Parent Company’s incomebefore tax and equity due to a reasonably possible change in the market prices of quoted bondsclassified under financial assets at FVTPL and financial assets at FVOCI, brought about bymovement in the interest rate curve as of December 31, 2021 and 2020 (in millions):
Consolidated2021
Change in interest rates (in basis points)25bp rise 10bp rise 10bp fall 25bp fall
Change in income before tax (P=25) (P=10) P=10 P=25Change in equity (287) (115) 115 287
Consolidated2020
Change in interest rates (in basis points)25bp rise 10bp rise 10bp fall 25bp fall
Change in income before tax (P=99) (P=40) P=40 P=99Change in equity (281) (112) 112 281
171
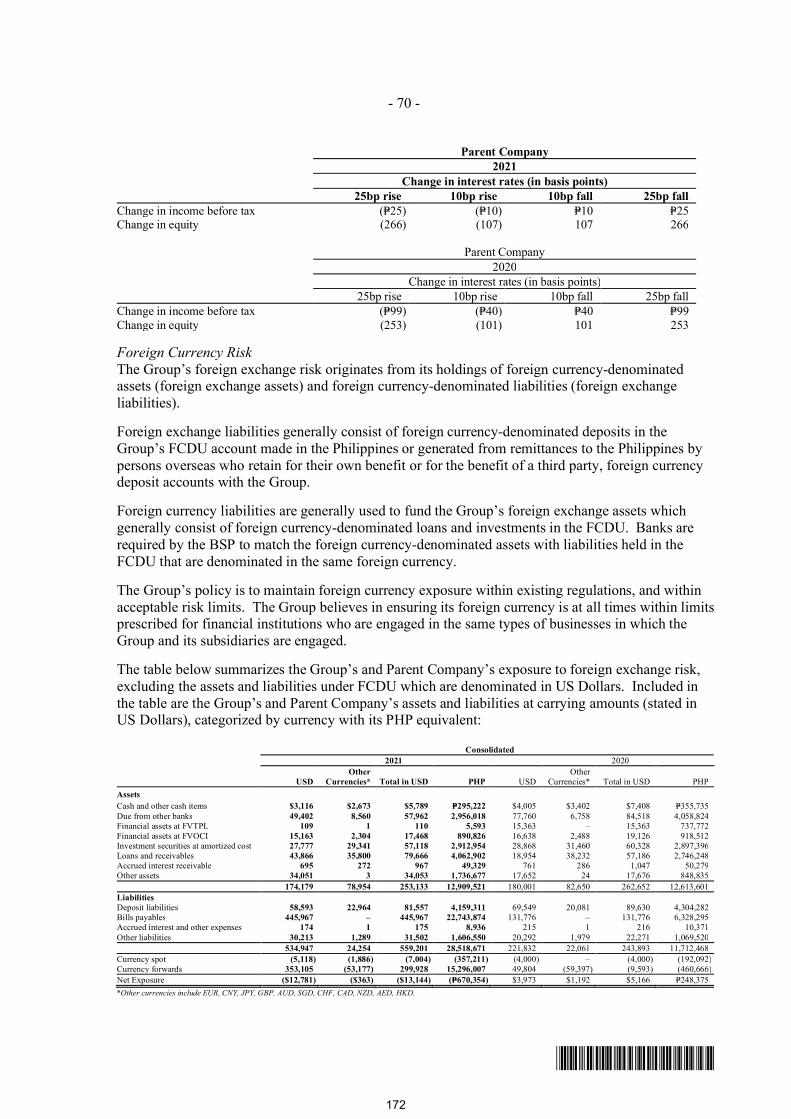
- 70 -
*SGVFS162381*
Parent Company2021
Change in interest rates (in basis points)25bp rise 10bp rise 10bp fall 25bp fall
Change in income before tax (P=25) (P=10) P=10 P=25Change in equity (266) (107) 107 266
Parent Company2020
Change in interest rates (in basis points)25bp rise 10bp rise 10bp fall 25bp fall
Change in income before tax (P=99) (P=40) P=40 P=99Change in equity (253) (101) 101 253
Foreign Currency RiskThe Group’s foreign exchange risk originates from its holdings of foreign currency-denominatedassets (foreign exchange assets) and foreign currency-denominated liabilities (foreign exchangeliabilities).
Foreign exchange liabilities generally consist of foreign currency-denominated deposits in theGroup’s FCDU account made in the Philippines or generated from remittances to the Philippines bypersons overseas who retain for their own benefit or for the benefit of a third party, foreign currencydeposit accounts with the Group.
Foreign currency liabilities are generally used to fund the Group’s foreign exchange assets whichgenerally consist of foreign currency-denominated loans and investments in the FCDU. Banks arerequired by the BSP to match the foreign currency-denominated assets with liabilities held in theFCDU that are denominated in the same foreign currency.
The Group’s policy is to maintain foreign currency exposure within existing regulations, and withinacceptable risk limits. The Group believes in ensuring its foreign currency is at all times within limitsprescribed for financial institutions who are engaged in the same types of businesses in which theGroup and its subsidiaries are engaged.
The table below summarizes the Group’s and Parent Company’s exposure to foreign exchange risk,excluding the assets and liabilities under FCDU which are denominated in US Dollars. Included inthe table are the Group’s and Parent Company’s assets and liabilities at carrying amounts (stated inUS Dollars), categorized by currency with its PHP equivalent:
Consolidated2021 2020
USDOther
Currencies* Total in USD PHP USDOther
Currencies* Total in USD PHPAssetsCash and other cash items $3,116 $2,673 $5,789 P=295,222 $4,005 $3,402 $7,408 P=355,735Due from other banks 49,402 8,560 57,962 2,956,018 77,760 6,758 84,518 4,058,824Financial assets at FVTPL 109 1 110 5,593 15,363 – 15,363 737,772Financial assets at FVOCI 15,163 2,304 17,468 890,826 16,638 2,488 19,126 918,512Investment securities at amortized cost 27,777 29,341 57,118 2,912,954 28,868 31,460 60,328 2,897,396Loans and receivables 43,866 35,800 79,666 4,062,902 18,954 38,232 57,186 2,746,248Accrued interest receivable 695 272 967 49,329 761 286 1,047 50,279Other assets 34,051 3 34,053 1,736,677 17,652 24 17,676 848,835
174,179 78,954 253,133 12,909,521 180,001 82,650 262,652 12,613,601LiabilitiesDeposit liabilities 58,593 22,964 81,557 4,159,311 69,549 20,081 89,630 4,304,282Bills payables 445,967 – 445,967 22,743,874 131,776 – 131,776 6,328,295Accrued interest and other expenses 174 1 175 8,936 215 1 216 10,371Other liabilities 30,213 1,289 31,502 1,606,550 20,292 1,979 22,271 1,069,520
534,947 24,254 559,201 28,518,671 221,832 22,061 243,893 11,712,468Currency spot (5,118) (1,886) (7,004) (357,211) (4,000) – (4,000) (192,092)Currency forwards 353,105 (53,177) 299,928 15,296,007 49,804 (59,397) (9,593) (460,666)Net Exposure ($12,781) ($363) ($13,144) (P=670,354) $3,973 $1,192 $5,166 P=248,375*Other currencies include EUR, CNY, JPY, GBP, AUD, SGD, CHF, CAD, NZD, AED, HKD.
172
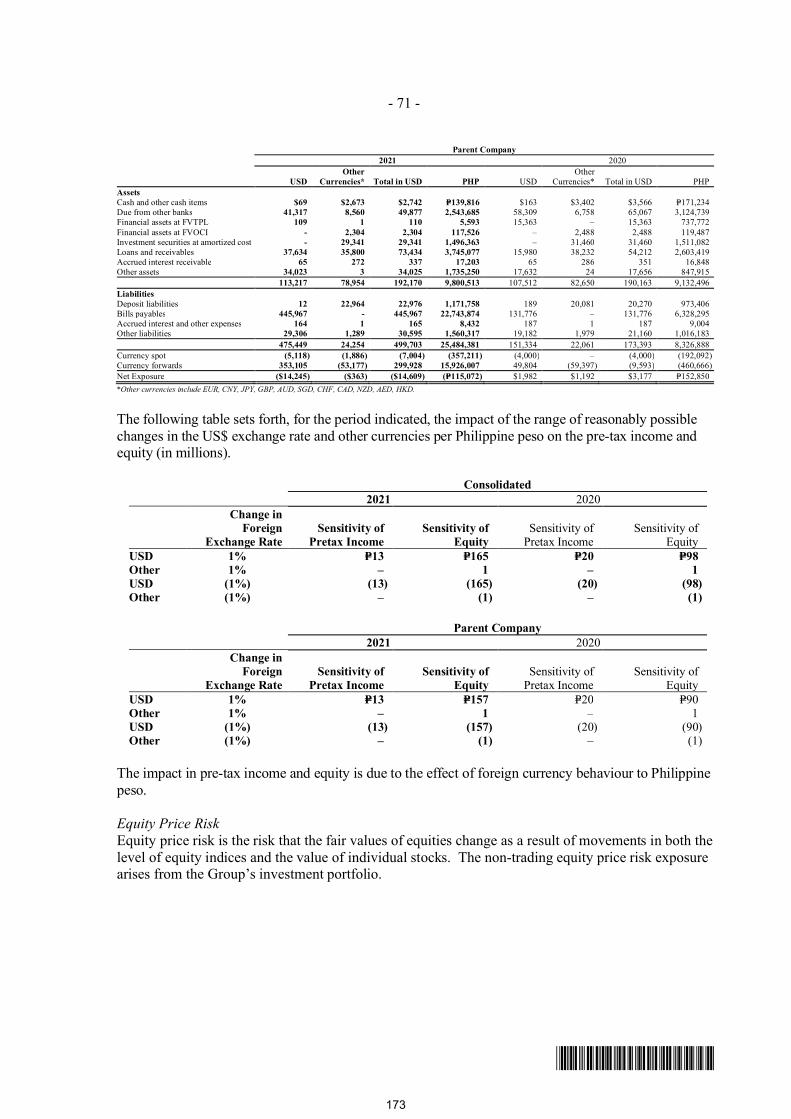
- 71 -
*SGVFS162381*
Parent Company2021 2020
USDOther
Currencies* Total in USD PHP USDOther
Currencies* Total in USD PHPAssetsCash and other cash items $69 $2,673 $2,742 P=139,816 $163 $3,402 $3,566 P=171,234Due from other banks 41,317 8,560 49,877 2,543,685 58,309 6,758 65,067 3,124,739Financial assets at FVTPL 109 1 110 5,593 15,363 – 15,363 737,772Financial assets at FVOCI - 2,304 2,304 117,526 – 2,488 2,488 119,487Investment securities at amortized cost - 29,341 29,341 1,496,363 – 31,460 31,460 1,511,082Loans and receivables 37,634 35,800 73,434 3,745,077 15,980 38,232 54,212 2,603,419Accrued interest receivable 65 272 337 17,203 65 286 351 16,848Other assets 34,023 3 34,025 1,735,250 17,632 24 17,656 847,915
113,217 78,954 192,170 9,800,513 107,512 82,650 190,163 9,132,496LiabilitiesDeposit liabilities 12 22,964 22,976 1,171,758 189 20,081 20,270 973,406Bills payables 445,967 - 445,967 22,743,874 131,776 – 131,776 6,328,295Accrued interest and other expenses 164 1 165 8,432 187 1 187 9,004Other liabilities 29,306 1,289 30,595 1,560,317 19,182 1,979 21,160 1,016,183
475,449 24,254 499,703 25,484,381 151,334 22,061 173,393 8,326,888Currency spot (5,118) (1,886) (7,004) (357,211) (4,000) – (4,000) (192,092)Currency forwards 353,105 (53,177) 299,928 15,926,007 49,804 (59,397) (9,593) (460,666)Net Exposure ($14,245) ($363) ($14,609) (P=115,072) $1,982 $1,192 $3,177 P=152,850*Other currencies include EUR, CNY, JPY, GBP, AUD, SGD, CHF, CAD, NZD, AED, HKD.
The following table sets forth, for the period indicated, the impact of the range of reasonably possiblechanges in the US$ exchange rate and other currencies per Philippine peso on the pre-tax income andequity (in millions).
Consolidated2021 2020
Change inForeign
Exchange RateSensitivity of
Pretax IncomeSensitivity of
EquitySensitivity of
Pretax IncomeSensitivity of
EquityUSD 1% P=13 P=165 P=20 P=98Other 1% – 1 – 1USD (1%) (13) (165) (20) (98)Other (1%) – (1) – (1)
Parent Company2021 2020
Change inForeign
Exchange RateSensitivity of
Pretax IncomeSensitivity of
EquitySensitivity of
Pretax IncomeSensitivity of
EquityUSD 1% P=13 P=157 P=20 P=90Other 1% – 1 – 1USD (1%) (13) (157) (20) (90)Other (1%) – (1) – (1)
The impact in pre-tax income and equity is due to the effect of foreign currency behaviour to Philippinepeso.
Equity Price RiskEquity price risk is the risk that the fair values of equities change as a result of movements in both thelevel of equity indices and the value of individual stocks. The non-trading equity price risk exposurearises from the Group’s investment portfolio.
173
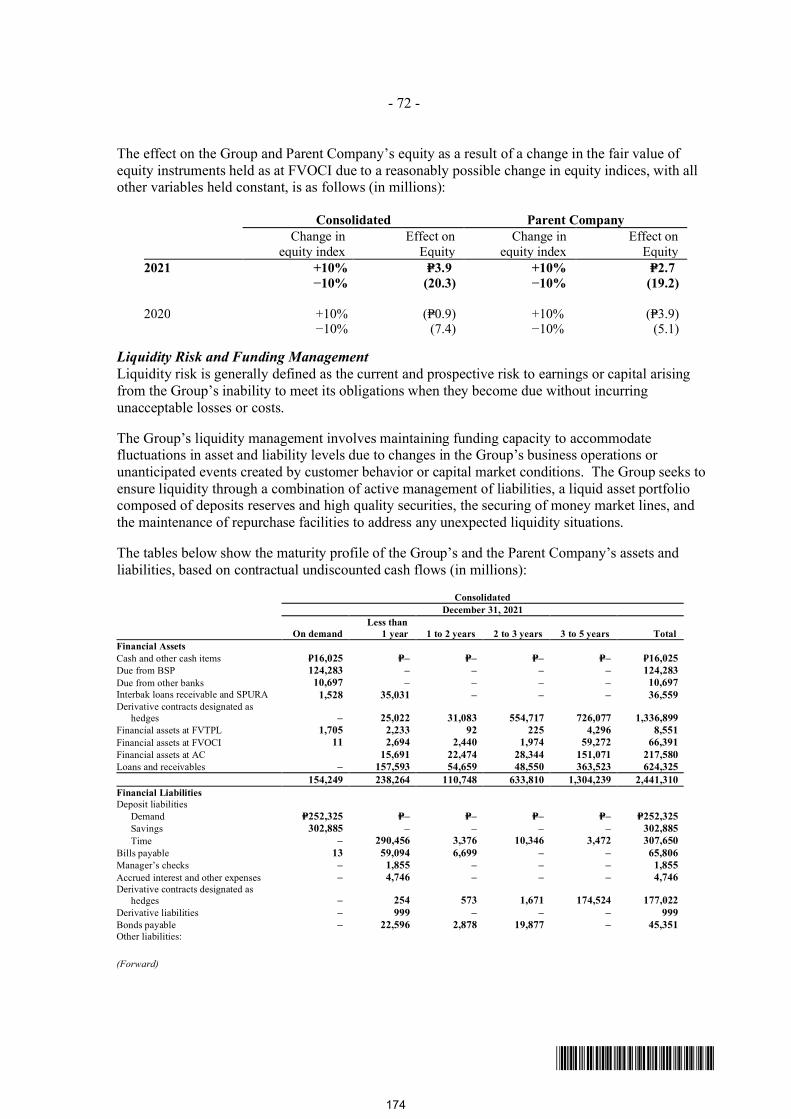
- 72 -
*SGVFS162381*
The effect on the Group and Parent Company’s equity as a result of a change in the fair value ofequity instruments held as at FVOCI due to a reasonably possible change in equity indices, with allother variables held constant, is as follows (in millions):
Consolidated Parent CompanyChange in
equity indexEffect on
EquityChange in
equity indexEffect on
Equity2021 +10% P=3.9 +10% P=2.7
−10% (20.3) −10% (19.2)
2020 +10% (P=0.9) +10% (P=3.9)−10% (7.4) −10% (5.1)
Liquidity Risk and Funding ManagementLiquidity risk is generally defined as the current and prospective risk to earnings or capital arisingfrom the Group’s inability to meet its obligations when they become due without incurringunacceptable losses or costs.
The Group’s liquidity management involves maintaining funding capacity to accommodatefluctuations in asset and liability levels due to changes in the Group’s business operations orunanticipated events created by customer behavior or capital market conditions. The Group seeks toensure liquidity through a combination of active management of liabilities, a liquid asset portfoliocomposed of deposits reserves and high quality securities, the securing of money market lines, andthe maintenance of repurchase facilities to address any unexpected liquidity situations.
The tables below show the maturity profile of the Group’s and the Parent Company’s assets andliabilities, based on contractual undiscounted cash flows (in millions):
ConsolidatedDecember 31, 2021
On demandLess than
1 year 1 to 2 years 2 to 3 years 3 to 5 years TotalFinancial AssetsCash and other cash items ₽16,025 P=– P=– P=– P=– ₽16,025Due from BSP 124,283 – – – – 124,283Due from other banks 10,697 – – – – 10,697Interbak loans receivable and SPURA 1,528 35,031 – – – 36,559Derivative contracts designated as
hedges – 25,022 31,083 554,717 726,077 1,336,899Financial assets at FVTPL 1,705 2,233 92 225 4,296 8,551Financial assets at FVOCI 11 2,694 2,440 1,974 59,272 66,391Financial assets at AC 15,691 22,474 28,344 151,071 217,580Loans and receivables – 157,593 54,659 48,550 363,523 624,325
154,249 238,264 110,748 633,810 1,304,239 2,441,310Financial LiabilitiesDeposit liabilities
Demand P=252,325 P=– P=– P=– P=– P=252,325Savings 302,885 – – – – 302,885Time – 290,456 3,376 10,346 3,472 307,650
Bills payable 13 59,094 6,699 – – 65,806Manager’s checks – 1,855 – – – 1,855Accrued interest and other expenses – 4,746 – – – 4,746Derivative contracts designated as
hedges – 254 573 1,671 174,524 177,022Derivative liabilities – 999 – – – 999Bonds payable – 22,596 2,878 19,877 – 45,351Other liabilities:
(Forward)
174
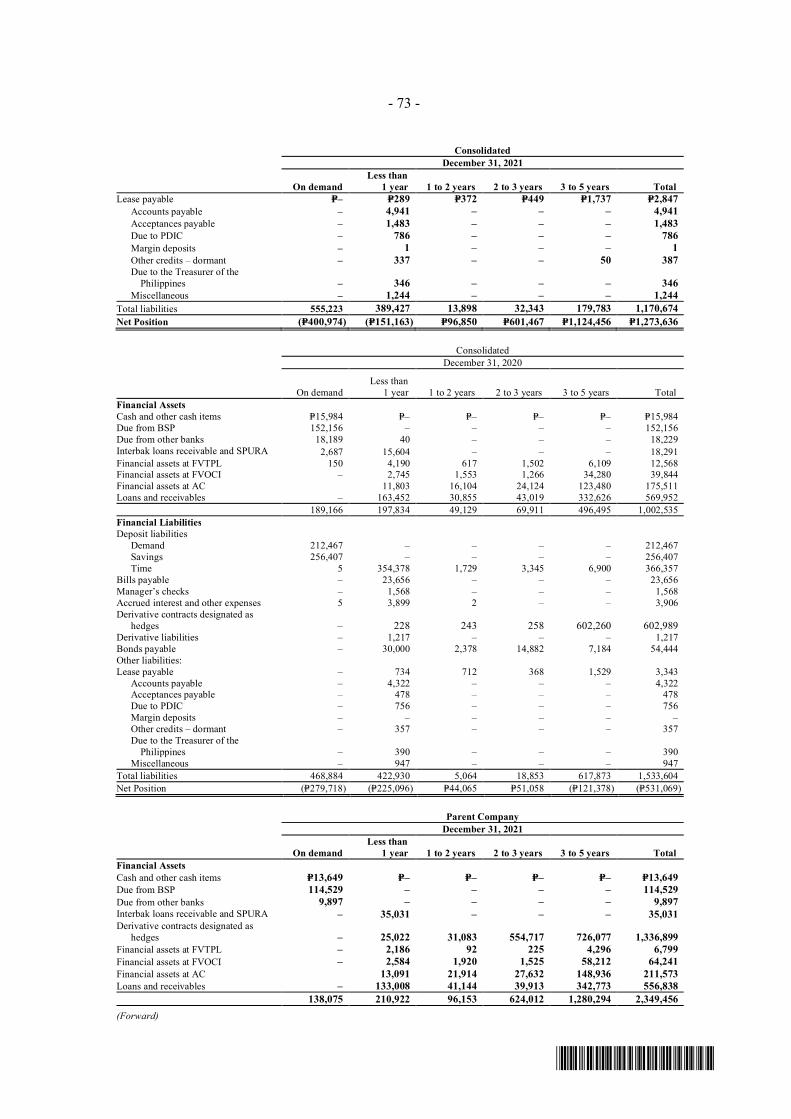
- 73 -
*SGVFS162381*
ConsolidatedDecember 31, 2021
On demandLess than
1 year 1 to 2 years 2 to 3 years 3 to 5 years TotalLease payable P=– P=289 P=372 P=449 P=1,737 P=2,847 Accounts payable – 4,941 – – – 4,941 Acceptances payable – 1,483 – – – 1,483 Due to PDIC – 786 – – – 786 Margin deposits – 1 – – – 1 Other credits – dormant – 337 – – 50 387 Due to the Treasurer of the
Philippines – 346 – – – 346 Miscellaneous – 1,244 – – – 1,244Total liabilities 555,223 389,427 13,898 32,343 179,783 1,170,674Net Position (P=400,974) (P=151,163) P=96,850 P=601,467 P=1,124,456 P=1,273,636
ConsolidatedDecember 31, 2020
On demandLess than
1 year 1 to 2 years 2 to 3 years 3 to 5 years TotalFinancial AssetsCash and other cash items P=15,984 P=– P=– P=– P=– P=15,984Due from BSP 152,156 – – – – 152,156Due from other banks 18,189 40 – – – 18,229Interbak loans receivable and SPURA 2,687 15,604 – – – 18,291Financial assets at FVTPL 150 4,190 617 1,502 6,109 12,568Financial assets at FVOCI – 2,745 1,553 1,266 34,280 39,844Financial assets at AC 11,803 16,104 24,124 123,480 175,511Loans and receivables – 163,452 30,855 43,019 332,626 569,952
189,166 197,834 49,129 69,911 496,495 1,002,535Financial LiabilitiesDeposit liabilities Demand 212,467 – – – – 212,467 Savings 256,407 – – – – 256,407 Time 5 354,378 1,729 3,345 6,900 366,357Bills payable – 23,656 – – – 23,656Manager’s checks – 1,568 – – – 1,568Accrued interest and other expenses 5 3,899 2 – – 3,906Derivative contracts designated as
hedges – 228 243 258 602,260 602,989Derivative liabilities – 1,217 – – – 1,217Bonds payable – 30,000 2,378 14,882 7,184 54,444Other liabilities:Lease payable – 734 712 368 1,529 3,343 Accounts payable – 4,322 – – – 4,322 Acceptances payable – 478 – – – 478 Due to PDIC – 756 – – – 756 Margin deposits – – – – – – Other credits – dormant – 357 – – – 357 Due to the Treasurer of the
Philippines – 390 – – – 390 Miscellaneous – 947 – – – 947Total liabilities 468,884 422,930 5,064 18,853 617,873 1,533,604Net Position (P=279,718) (P=225,096) P=44,065 P=51,058 (P=121,378) (P=531,069)
Parent CompanyDecember 31, 2021
On demandLess than
1 year 1 to 2 years 2 to 3 years 3 to 5 years TotalFinancial AssetsCash and other cash items P=13,649 P=– P=– P=– P=– P=13,649Due from BSP 114,529 – – – – 114,529Due from other banks 9,897 – – – – 9,897Interbak loans receivable and SPURA – 35,031 – – – 35,031Derivative contracts designated as
hedges – 25,022 31,083 554,717 726,077 1,336,899Financial assets at FVTPL – 2,186 92 225 4,296 6,799Financial assets at FVOCI – 2,584 1,920 1,525 58,212 64,241Financial assets at AC 13,091 21,914 27,632 148,936 211,573Loans and receivables – 133,008 41,144 39,913 342,773 556,838
138,075 210,922 96,153 624,012 1,280,294 2,349,456(Forward)
175
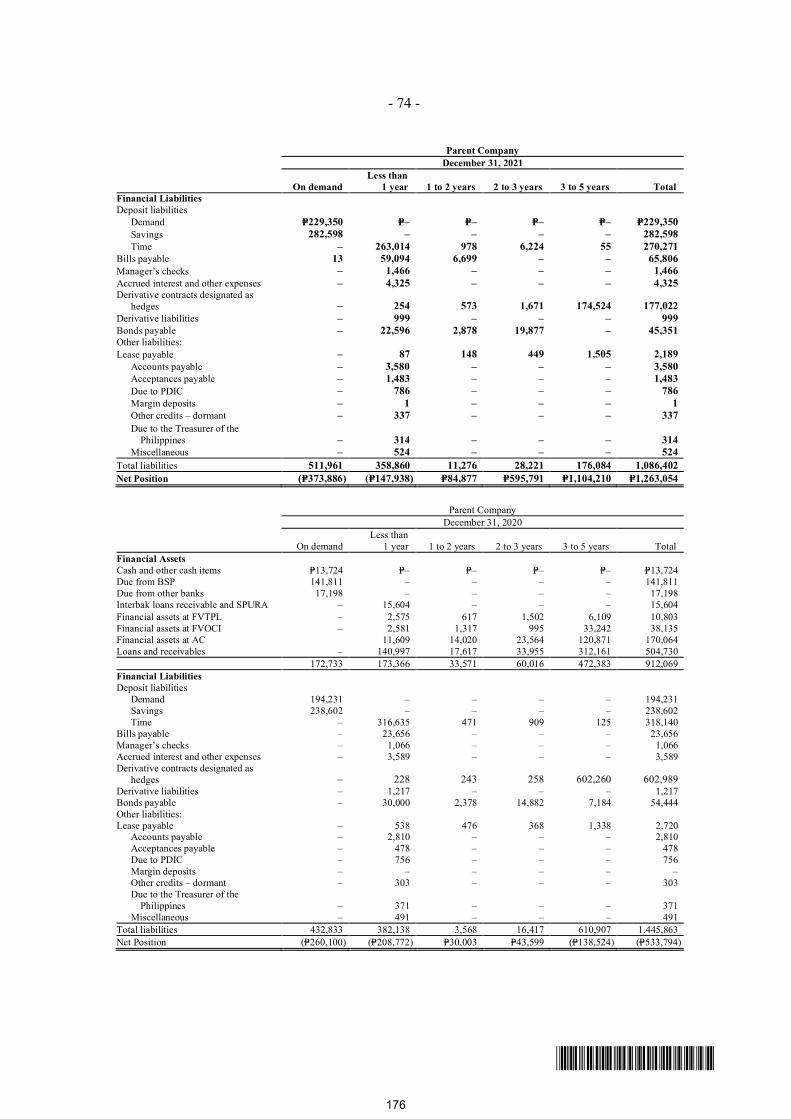
- 74 -
*SGVFS162381*
Parent CompanyDecember 31, 2021
On demandLess than
1 year 1 to 2 years 2 to 3 years 3 to 5 years TotalFinancial LiabilitiesDeposit liabilities
Demand P=229,350 P=– P=– P=– P=– P=229,350Savings 282,598 – – – – 282,598Time – 263,014 978 6,224 55 270,271
Bills payable 13 59,094 6,699 – – 65,806Manager’s checks – 1,466 – – – 1,466Accrued interest and other expenses – 4,325 – – – 4,325Derivative contracts designated as
hedges – 254 573 1,671 174,524 177,022Derivative liabilities – 999 – – – 999Bonds payable – 22,596 2,878 19,877 – 45,351Other liabilities:Lease payable – 87 148 449 1,505 2,189
Accounts payable – 3,580 – – – 3,580Acceptances payable – 1,483 – – – 1,483Due to PDIC – 786 – – – 786Margin deposits – 1 – – – 1Other credits – dormant – 337 – – – 337Due to the Treasurer of the
Philippines – 314 – – – 314Miscellaneous – 524 – – – 524
Total liabilities 511,961 358,860 11,276 28,221 176,084 1,086,402Net Position (P=373,886) (P=147,938) P=84,877 P=595,791 P=1,104,210 P=1,263,054
Parent CompanyDecember 31, 2020
On demandLess than
1 year 1 to 2 years 2 to 3 years 3 to 5 years TotalFinancial AssetsCash and other cash items P=13,724 P=– P=– P=– P=– P=13,724Due from BSP 141,811 – – – – 141,811Due from other banks 17,198 – – – – 17,198Interbak loans receivable and SPURA – 15,604 – – – 15,604Financial assets at FVTPL – 2,575 617 1,502 6,109 10,803Financial assets at FVOCI – 2,581 1,317 995 33,242 38,135Financial assets at AC 11,609 14,020 23,564 120,871 170,064Loans and receivables – 140,997 17,617 33,955 312,161 504,730
172,733 173,366 33,571 60,016 472,383 912,069Financial LiabilitiesDeposit liabilities
Demand 194,231 – – – – 194,231Savings 238,602 – – – – 238,602Time – 316,635 471 909 125 318,140
Bills payable – 23,656 – – – 23,656Manager’s checks – 1,066 – – – 1,066Accrued interest and other expenses – 3,589 – – – 3,589Derivative contracts designated as
hedges – 228 243 258 602,260 602,989Derivative liabilities – 1,217 – – – 1,217Bonds payable – 30,000 2,378 14,882 7,184 54,444Other liabilities:Lease payable – 538 476 368 1,338 2,720
Accounts payable – 2,810 – – – 2,810Acceptances payable – 478 – – – 478Due to PDIC – 756 – – – 756Margin deposits – – – – – –Other credits – dormant – 303 – – – 303Due to the Treasurer of the
Philippines – 371 – – – 371Miscellaneous – 491 – – – 491
Total liabilities 432,833 382,138 3,568 16,417 610,907 1,445,863Net Position (P=260,100) (P=208,772) P=30,003 P=43,599 (P=138,524) (P=533,794)
176
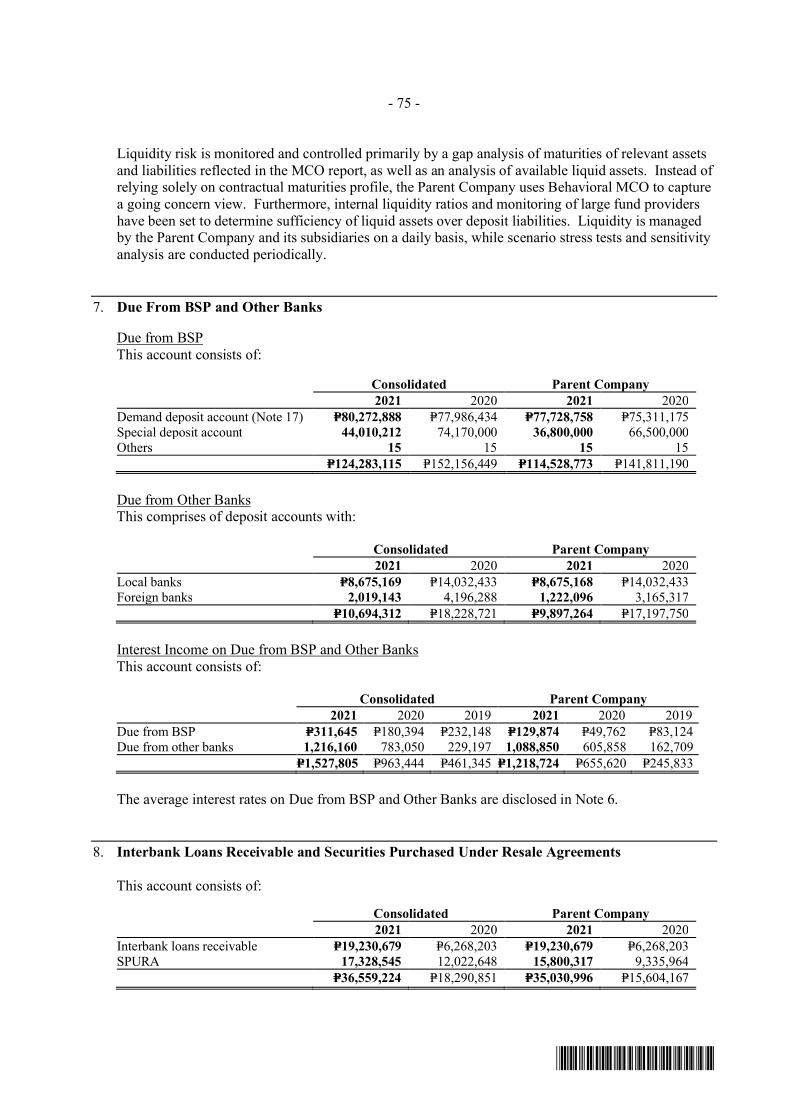
- 75 -
*SGVFS162381*
Liquidity risk is monitored and controlled primarily by a gap analysis of maturities of relevant assetsand liabilities reflected in the MCO report, as well as an analysis of available liquid assets. Instead ofrelying solely on contractual maturities profile, the Parent Company uses Behavioral MCO to capturea going concern view. Furthermore, internal liquidity ratios and monitoring of large fund providershave been set to determine sufficiency of liquid assets over deposit liabilities. Liquidity is managedby the Parent Company and its subsidiaries on a daily basis, while scenario stress tests and sensitivityanalysis are conducted periodically.
7. Due From BSP and Other Banks
Due from BSPThis account consists of:
Consolidated Parent Company2021 2020 2021 2020
Demand deposit account (Note 17) P=80,272,888 P=77,986,434 P=77,728,758 P=75,311,175Special deposit account 44,010,212 74,170,000 36,800,000 66,500,000Others 15 15 15 15
P=124,283,115 P=152,156,449 P=114,528,773 P=141,811,190
Due from Other BanksThis comprises of deposit accounts with:
Consolidated Parent Company2021 2020 2021 2020
Local banks P=8,675,169 P=14,032,433 P=8,675,168 P=14,032,433Foreign banks 2,019,143 4,196,288 1,222,096 3,165,317
P=10,694,312 P=18,228,721 P=9,897,264 P=17,197,750
Interest Income on Due from BSP and Other BanksThis account consists of:
Consolidated Parent Company2021 2020 2019 2021 2020 2019
Due from BSP P=311,645 P=180,394 P=232,148 P=129,874 P=49,762 P=83,124Due from other banks 1,216,160 783,050 229,197 1,088,850 605,858 162,709
P=1,527,805 P=963,444 P=461,345 P=1,218,724 P=655,620 P=245,833
The average interest rates on Due from BSP and Other Banks are disclosed in Note 6.
8. Interbank Loans Receivable and Securities Purchased Under Resale Agreements
This account consists of:
Consolidated Parent Company2021 2020 2021 2020
Interbank loans receivable P=19,230,679 P=6,268,203 P=19,230,679 P=6,268,203SPURA 17,328,545 12,022,648 15,800,317 9,335,964
P=36,559,224 P=18,290,851 P=35,030,996 P=15,604,167
177
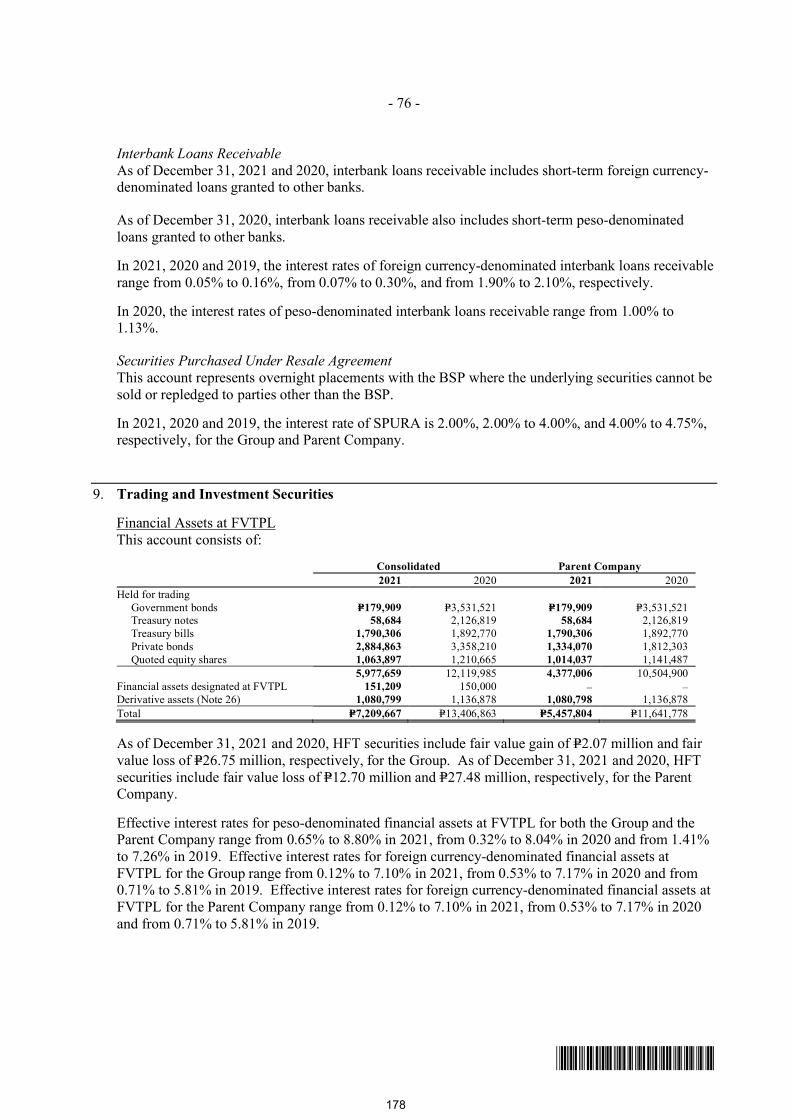
- 76 -
*SGVFS162381*
Interbank Loans ReceivableAs of December 31, 2021 and 2020, interbank loans receivable includes short-term foreign currency-denominated loans granted to other banks.
As of December 31, 2020, interbank loans receivable also includes short-term peso-denominatedloans granted to other banks.
In 2021, 2020 and 2019, the interest rates of foreign currency-denominated interbank loans receivablerange from 0.05% to 0.16%, from 0.07% to 0.30%, and from 1.90% to 2.10%, respectively.
In 2020, the interest rates of peso-denominated interbank loans receivable range from 1.00% to1.13%.
Securities Purchased Under Resale AgreementThis account represents overnight placements with the BSP where the underlying securities cannot besold or repledged to parties other than the BSP.
In 2021, 2020 and 2019, the interest rate of SPURA is 2.00%, 2.00% to 4.00%, and 4.00% to 4.75%,respectively, for the Group and Parent Company.
9. Trading and Investment Securities
Financial Assets at FVTPLThis account consists of:
Consolidated Parent Company2021 2020 2021 2020
Held for tradingGovernment bonds P=179,909 P=3,531,521 P=179,909 P=3,531,521Treasury notes 58,684 2,126,819 58,684 2,126,819Treasury bills 1,790,306 1,892,770 1,790,306 1,892,770Private bonds 2,884,863 3,358,210 1,334,070 1,812,303Quoted equity shares 1,063,897 1,210,665 1,014,037 1,141,487
5,977,659 12,119,985 4,377,006 10,504,900Financial assets designated at FVTPL 151,209 150,000 – –Derivative assets (Note 26) 1,080,799 1,136,878 1,080,798 1,136,878Total P=7,209,667 P=13,406,863 P=5,457,804 P=11,641,778
As of December 31, 2021 and 2020, HFT securities include fair value gain of P=2.07 million and fairvalue loss of P=26.75 million, respectively, for the Group. As of December 31, 2021 and 2020, HFTsecurities include fair value loss of P=12.70 million and P=27.48 million, respectively, for the ParentCompany.
Effective interest rates for peso-denominated financial assets at FVTPL for both the Group and theParent Company range from 0.65% to 8.80% in 2021, from 0.32% to 8.04% in 2020 and from 1.41%to 7.26% in 2019. Effective interest rates for foreign currency-denominated financial assets atFVTPL for the Group range from 0.12% to 7.10% in 2021, from 0.53% to 7.17% in 2020 and from0.71% to 5.81% in 2019. Effective interest rates for foreign currency-denominated financial assets atFVTPL for the Parent Company range from 0.12% to 7.10% in 2021, from 0.53% to 7.17% in 2020and from 0.71% to 5.81% in 2019.
178
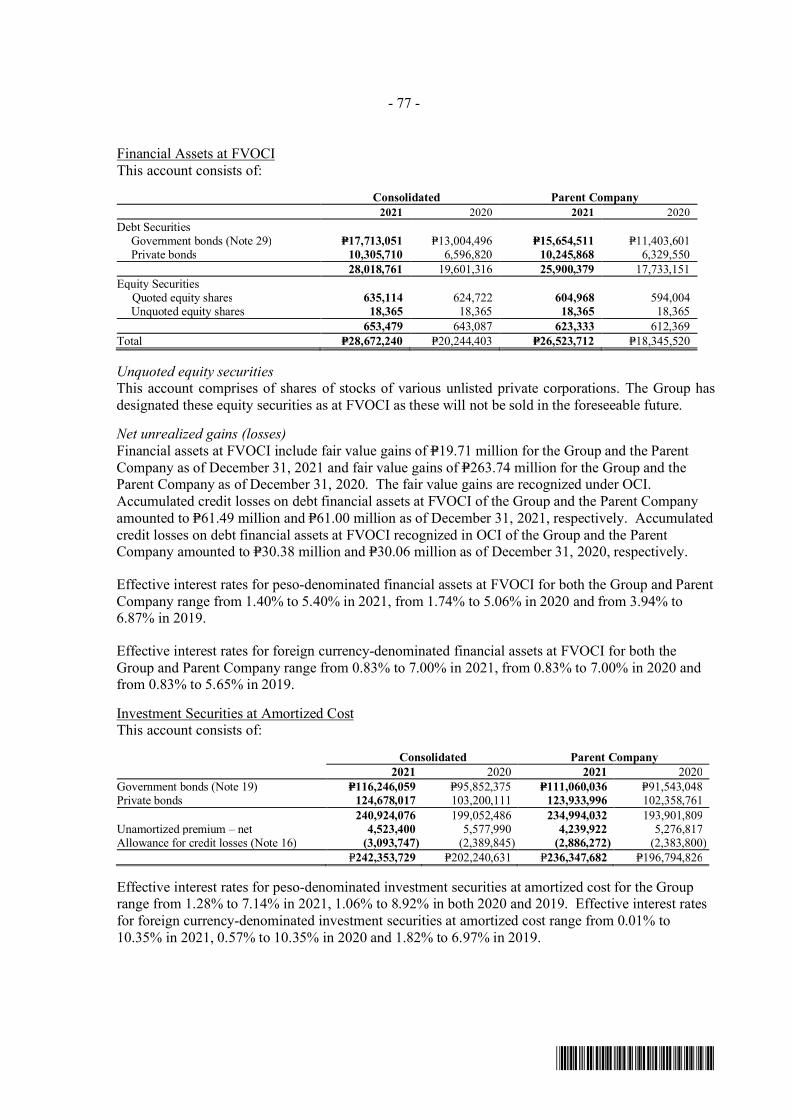
- 77 -
*SGVFS162381*
Financial Assets at FVOCIThis account consists of:
Consolidated Parent Company2021 2020 2021 2020
Debt SecuritiesGovernment bonds (Note 29) P=17,713,051 P=13,004,496 P=15,654,511 P=11,403,601Private bonds 10,305,710 6,596,820 10,245,868 6,329,550
28,018,761 19,601,316 25,900,379 17,733,151Equity Securities
Quoted equity shares 635,114 624,722 604,968 594,004 Unquoted equity shares 18,365 18,365 18,365 18,365
653,479 643,087 623,333 612,369Total P=28,672,240 P=20,244,403 P=26,523,712 P=18,345,520
Unquoted equity securitiesThis account comprises of shares of stocks of various unlisted private corporations. The Group hasdesignated these equity securities as at FVOCI as these will not be sold in the foreseeable future.
Net unrealized gains (losses)Financial assets at FVOCI include fair value gains of P=19.71 million for the Group and the ParentCompany as of December 31, 2021 and fair value gains of P=263.74 million for the Group and theParent Company as of December 31, 2020. The fair value gains are recognized under OCI.Accumulated credit losses on debt financial assets at FVOCI of the Group and the Parent Companyamounted to P=61.49 million and P=61.00 million as of December 31, 2021, respectively. Accumulatedcredit losses on debt financial assets at FVOCI recognized in OCI of the Group and the ParentCompany amounted to P=30.38 million and P=30.06 million as of December 31, 2020, respectively.
Effective interest rates for peso-denominated financial assets at FVOCI for both the Group and ParentCompany range from 1.40% to 5.40% in 2021, from 1.74% to 5.06% in 2020 and from 3.94% to6.87% in 2019.
Effective interest rates for foreign currency-denominated financial assets at FVOCI for both theGroup and Parent Company range from 0.83% to 7.00% in 2021, from 0.83% to 7.00% in 2020 andfrom 0.83% to 5.65% in 2019.
Investment Securities at Amortized CostThis account consists of:
Consolidated Parent Company2021 2020 2021 2020
Government bonds (Note 19) P=116,246,059 P=95,852,375 P=111,060,036 P=91,543,048Private bonds 124,678,017 103,200,111 123,933,996 102,358,761
240,924,076 199,052,486 234,994,032 193,901,809Unamortized premium – net 4,523,400 5,577,990 4,239,922 5,276,817Allowance for credit losses (Note 16) (3,093,747) (2,389,845) (2,886,272) (2,383,800)
P=242,353,729 P=202,240,631 P=236,347,682 P=196,794,826
Effective interest rates for peso-denominated investment securities at amortized cost for the Grouprange from 1.28% to 7.14% in 2021, 1.06% to 8.92% in both 2020 and 2019. Effective interest ratesfor foreign currency-denominated investment securities at amortized cost range from 0.01% to10.35% in 2021, 0.57% to 10.35% in 2020 and 1.82% to 6.97% in 2019.
179
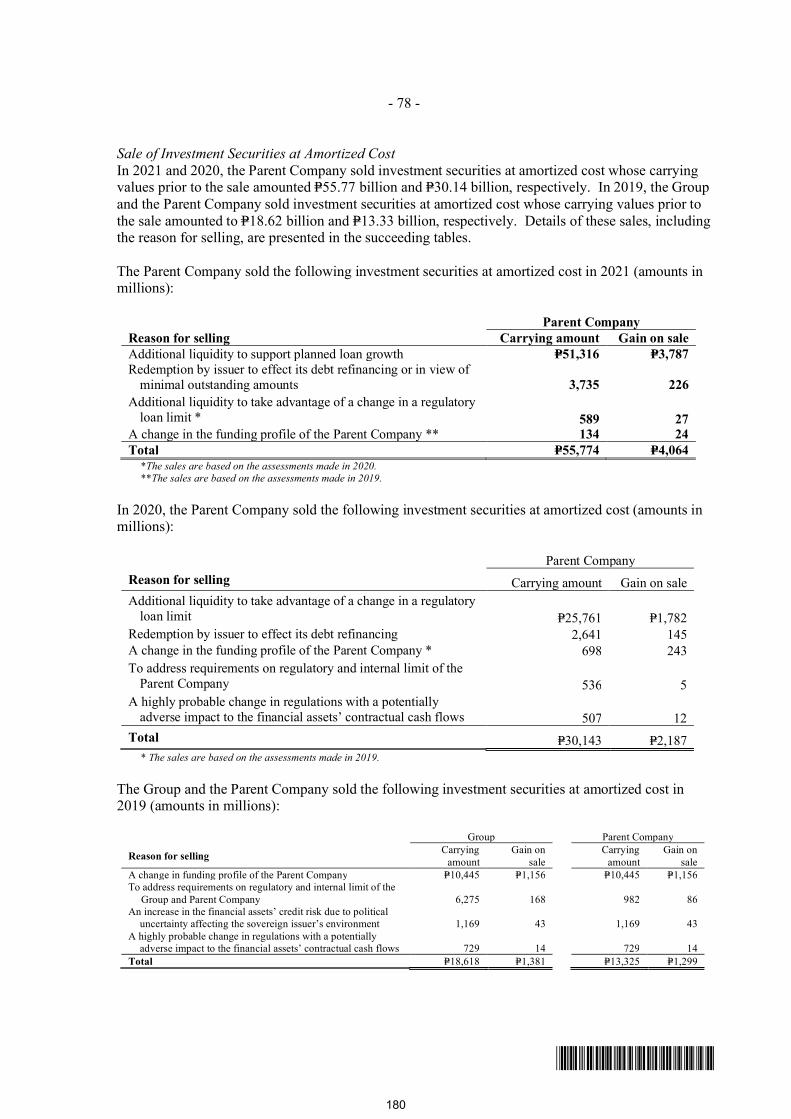
- 78 -
*SGVFS162381*
Sale of Investment Securities at Amortized CostIn 2021 and 2020, the Parent Company sold investment securities at amortized cost whose carryingvalues prior to the sale amounted P=55.77 billion and P=30.14 billion, respectively. In 2019, the Groupand the Parent Company sold investment securities at amortized cost whose carrying values prior tothe sale amounted to P=18.62 billion and P=13.33 billion, respectively. Details of these sales, includingthe reason for selling, are presented in the succeeding tables.
The Parent Company sold the following investment securities at amortized cost in 2021 (amounts inmillions):
Parent CompanyReason for selling Carrying amount Gain on saleAdditional liquidity to support planned loan growth P=51,316 P=3,787Redemption by issuer to effect its debt refinancing or in view of
minimal outstanding amounts 3,735 226Additional liquidity to take advantage of a change in a regulatory
loan limit * 589 27A change in the funding profile of the Parent Company ** 134 24Total P=55,774 P=4,064
*The sales are based on the assessments made in 2020.**The sales are based on the assessments made in 2019.
In 2020, the Parent Company sold the following investment securities at amortized cost (amounts inmillions):
Parent CompanyReason for selling Carrying amount Gain on saleAdditional liquidity to take advantage of a change in a regulatory
loan limit P=25,761 P=1,782Redemption by issuer to effect its debt refinancing 2,641 145A change in the funding profile of the Parent Company * 698 243To address requirements on regulatory and internal limit of the
Parent Company 536 5A highly probable change in regulations with a potentially
adverse impact to the financial assets’ contractual cash flows 507 12Total P=30,143 P=2,187
* The sales are based on the assessments made in 2019.
The Group and the Parent Company sold the following investment securities at amortized cost in2019 (amounts in millions):
Group Parent Company
Reason for selling Carryingamount
Gain onsale
Carryingamount
Gain onsale
A change in funding profile of the Parent Company P=10,445 P=1,156 P=10,445 P=1,156To address requirements on regulatory and internal limit of the
Group and Parent Company 6,275 168 982 86An increase in the financial assets’ credit risk due to political
uncertainty affecting the sovereign issuer’s environment 1,169 43 1,169 43A highly probable change in regulations with a potentially
adverse impact to the financial assets’ contractual cash flows 729 14 729 14Total P=18,618 P=1,381 P=13,325 P=1,299
180

- 79 -
*SGVFS162381*
These disposals of investment securities at amortized cost were assessed by the Group as notinconsistent with the portfolios’ business models considering the conditions and reasons for which thedisposals were made (see Note 3).
Interest Income on Investment Securities at Amortized Cost and at FVOCIThis account consists of:
Consolidated Parent Company2021 2020 2019 2021 2020 2019
Financial assets at FVOCI P=900,827 P=3,595,277 P=665,379 P=847,216 P=3,531,285 P=600,160Investment securities at
amortized cost 8,292,920 6,427,897 9,162,697 8,087,436 6,203,399 8,762,267P=9,193,747 P=10,023,174 P=9,828,076 P=8,934,652 P=9,734,684 P=9,362,427
10. Loans and Receivables
This account consists of:
Consolidated Parent Company2021 2020 2021 2020
Loans and discountsCorporate and commercial lending P=489,078,422 P=449,665,226 P=472,722,122 P=429,181,294Consumer lending 122,675,849 114,003,342 72,016,473 67,192,608Trade−related lending 12,453,552 8,534,049 12,079,859 8,328,448Others* 116,896 142,337 20,292 28,421
624,324,719 572,344,954 556,838,746 504,730,771Unearned discounts (260,378) (390,552) (177,124) (208,638)
624,064,341 571,954,402 556,661,622 504,522,133Allowance for impairment and credit losses (Note 16) (15,057,609) (14,739,918) (12,489,884) (12,527,657)
P=609,006,732 P=557,214,484 P=544,171,738 P=491,994,476*Others include employee loans and foreign bills purchased.
As of December 31, 2021 and 2020, loans of the Parent Company amounting to nil and P=5.75 billion,respectively, are rediscounted with the BSP (Note 19).
Information on the amounts of secured and unsecured loans and receivables (gross of unearneddiscounts and allowance for impairment and credit losses) of the Group and Parent Company are asfollows:
Consolidated Parent Company2021 2020 2021 2020
Amounts % Amounts % Amounts % Amounts %Loans secured by
Real estate P=85,021,052 13.62 P=77,049,605 13.46 P=58,622,700 10.53 P=51,972,071 10.30Chattel mortgage 22,096,827 3.54 23,902,079 4.18 7,459,462 1.34 8,334,760 1.65Guarantee by the
Republic of the Philippines 3,315 0.00 2,274,070 0.40 3,315 0.00 2,274,070 0.45Deposit hold out 2,506,588 0.40 3,018,427 0.53 2,214,506 0.40 2,539,755 0.50Shares of stock of
other banks 8,350,6001.34 2,354,950 0.41 8,350,600 1.50 2,354,950 0.47
Others 82,803,122 13.26 90,569,698 15.82 82,680,304 14.85 90,289,852 17.89200,781,504 32.16 199,168,829 34.80 159,330,887 28.62 157,765,458 31.26
Unsecured loans 423,543,215 67.84 373,176,125 65.20 397,507,859 71.38 346,965,313 68.74P=624,324,719 100.00 P=572,344,954 100.00 P=556,838,746 100.00 P=504,730,771 100.00
Modification of Loans and ReceivablesOn March 25, 2020, Republic Act No. 11469, otherwise known as the Bayanihan to Heal as One Act(“Bayanihan 1 Act”) was enacted. Bayanihan 1 Act provides that all covered institutions shallimplement a 30-day grace period for all loans with principal and/or interest and lease amortization
181
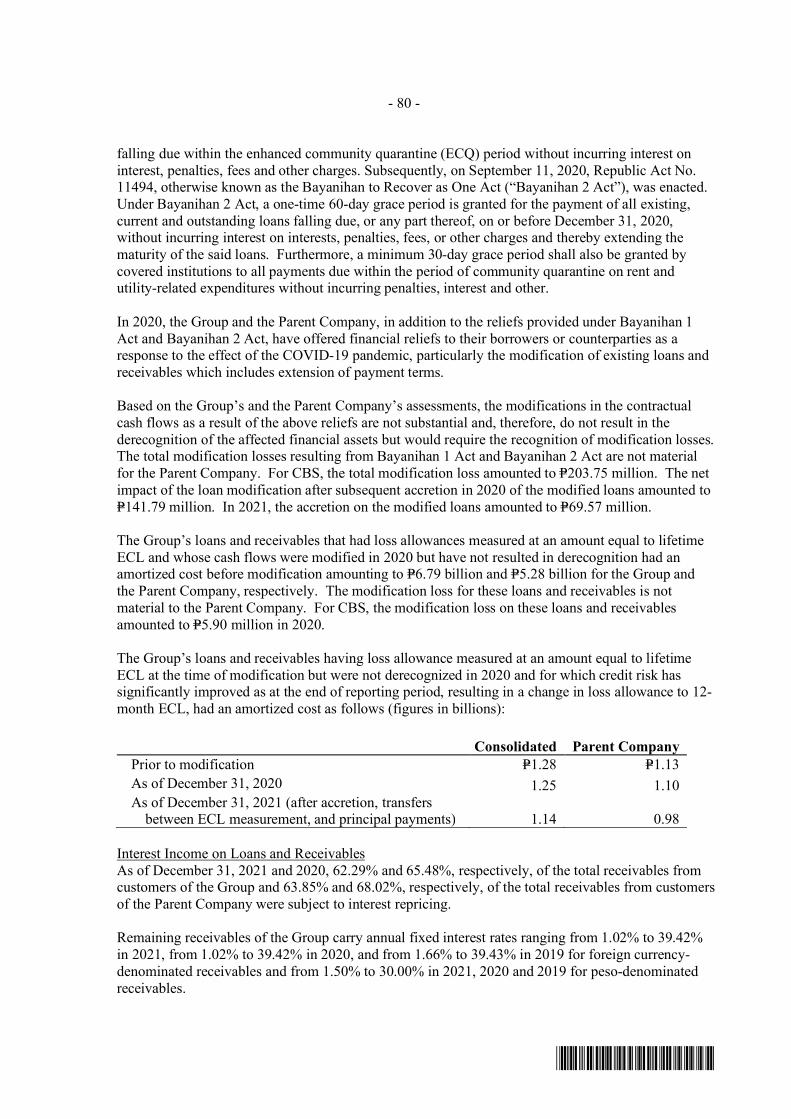
- 80 -
*SGVFS162381*
falling due within the enhanced community quarantine (ECQ) period without incurring interest oninterest, penalties, fees and other charges. Subsequently, on September 11, 2020, Republic Act No.11494, otherwise known as the Bayanihan to Recover as One Act (“Bayanihan 2 Act”), was enacted.Under Bayanihan 2 Act, a one-time 60-day grace period is granted for the payment of all existing,current and outstanding loans falling due, or any part thereof, on or before December 31, 2020,without incurring interest on interests, penalties, fees, or other charges and thereby extending thematurity of the said loans. Furthermore, a minimum 30-day grace period shall also be granted bycovered institutions to all payments due within the period of community quarantine on rent andutility-related expenditures without incurring penalties, interest and other.
In 2020, the Group and the Parent Company, in addition to the reliefs provided under Bayanihan 1Act and Bayanihan 2 Act, have offered financial reliefs to their borrowers or counterparties as aresponse to the effect of the COVID-19 pandemic, particularly the modification of existing loans andreceivables which includes extension of payment terms.
Based on the Group’s and the Parent Company’s assessments, the modifications in the contractualcash flows as a result of the above reliefs are not substantial and, therefore, do not result in thederecognition of the affected financial assets but would require the recognition of modification losses.The total modification losses resulting from Bayanihan 1 Act and Bayanihan 2 Act are not materialfor the Parent Company. For CBS, the total modification loss amounted to P=203.75 million. The netimpact of the loan modification after subsequent accretion in 2020 of the modified loans amounted toP=141.79 million. In 2021, the accretion on the modified loans amounted to P=69.57 million.
The Group’s loans and receivables that had loss allowances measured at an amount equal to lifetimeECL and whose cash flows were modified in 2020 but have not resulted in derecognition had anamortized cost before modification amounting to P=6.79 billion and P=5.28 billion for the Group andthe Parent Company, respectively. The modification loss for these loans and receivables is notmaterial to the Parent Company. For CBS, the modification loss on these loans and receivablesamounted to P=5.90 million in 2020.
The Group’s loans and receivables having loss allowance measured at an amount equal to lifetimeECL at the time of modification but were not derecognized in 2020 and for which credit risk hassignificantly improved as at the end of reporting period, resulting in a change in loss allowance to 12-month ECL, had an amortized cost as follows (figures in billions):
Consolidated Parent CompanyPrior to modification P=1.28 P=1.13
As of December 31, 2020 1.25 1.10 As of December 31, 2021 (after accretion, transfers
between ECL measurement, and principal payments) 1.14 0.98
Interest Income on Loans and ReceivablesAs of December 31, 2021 and 2020, 62.29% and 65.48%, respectively, of the total receivables fromcustomers of the Group and 63.85% and 68.02%, respectively, of the total receivables from customersof the Parent Company were subject to interest repricing.
Remaining receivables of the Group carry annual fixed interest rates ranging from 1.02% to 39.42%in 2021, from 1.02% to 39.42% in 2020, and from 1.66% to 39.43% in 2019 for foreign currency-denominated receivables and from 1.50% to 30.00% in 2021, 2020 and 2019 for peso-denominatedreceivables.
182
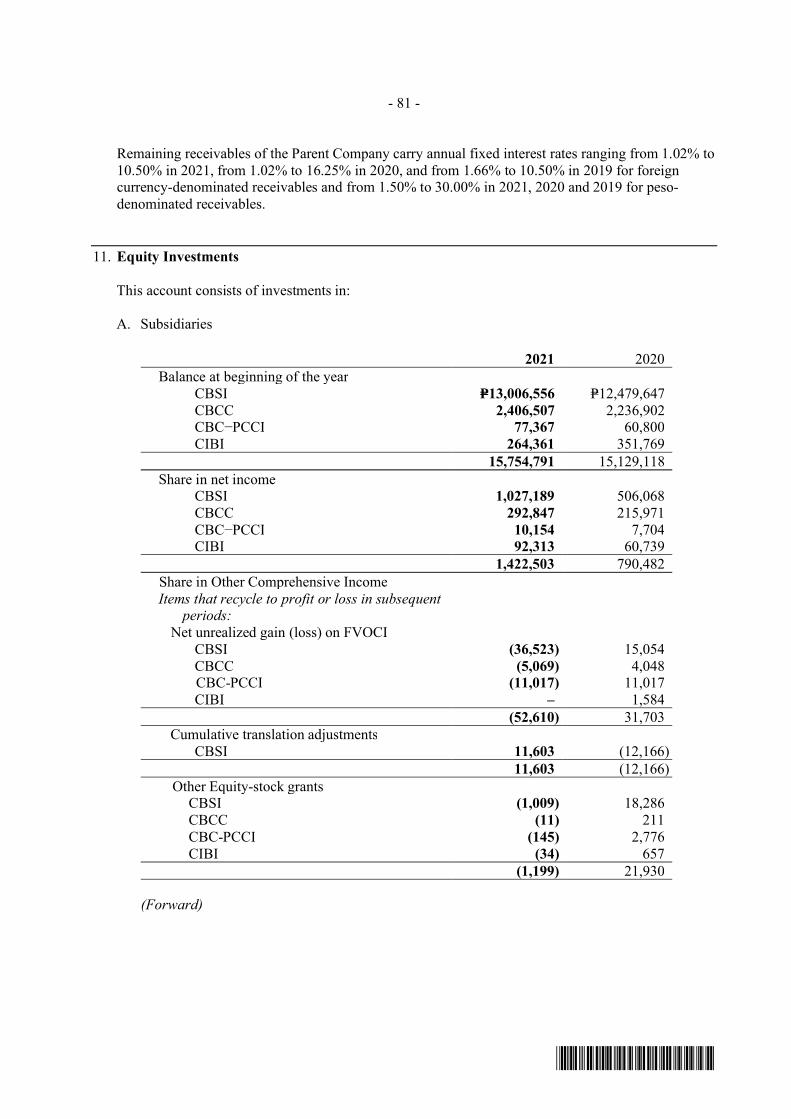
- 81 -
*SGVFS162381*
Remaining receivables of the Parent Company carry annual fixed interest rates ranging from 1.02% to10.50% in 2021, from 1.02% to 16.25% in 2020, and from 1.66% to 10.50% in 2019 for foreigncurrency-denominated receivables and from 1.50% to 30.00% in 2021, 2020 and 2019 for peso-denominated receivables.
11. Equity Investments
This account consists of investments in:
A. Subsidiaries
2021 2020Balance at beginning of the year
CBSI P=13,006,556 P=12,479,647CBCC 2,406,507 2,236,902CBC−PCCI 77,367 60,800CIBI 264,361 351,769
15,754,791 15,129,118Share in net income
CBSI 1,027,189 506,068CBCC 292,847 215,971CBC−PCCI 10,154 7,704CIBI 92,313 60,739
1,422,503 790,482Share in Other Comprehensive IncomeItems that recycle to profit or loss in subsequent
periods:Net unrealized gain (loss) on FVOCI
CBSI (36,523) 15,054CBCC (5,069) 4,048CBC-PCCI (11,017) 11,017CIBI – 1,584
(52,610) 31,703Cumulative translation adjustments
CBSI 11,603 (12,166)11,603 (12,166)
Other Equity-stock grantsCBSI (1,009) 18,286CBCC (11) 211CBC-PCCI (145) 2,776CIBI (34) 657
(1,199) 21,930
(Forward)
183
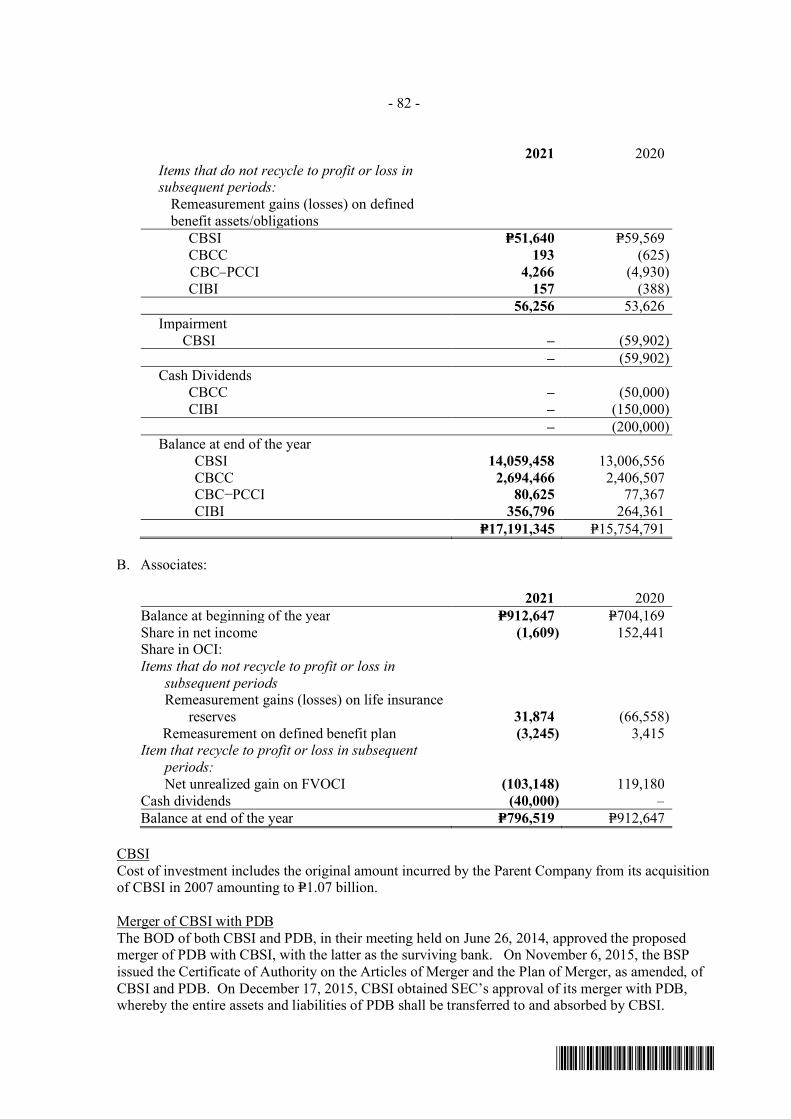
- 82 -
*SGVFS162381*
2021 2020Items that do not recycle to profit or loss insubsequent periods:
Remeasurement gains (losses) on definedbenefit assets/obligations
CBSI P=51,640 P=59,569CBCC 193 (625)CBC–PCCI 4,266 (4,930)CIBI 157 (388)
56,256 53,626Impairment
CBSI – (59,902)– (59,902)
Cash DividendsCBCC – (50,000)CIBI – (150,000)
– (200,000)Balance at end of the year
CBSI 14,059,458 13,006,556CBCC 2,694,466 2,406,507CBC−PCCI 80,625 77,367CIBI 356,796 264,361
P=17,191,345 P=15,754,791
B. Associates:
2021 2020Balance at beginning of the year P=912,647 P=704,169Share in net income (1,609) 152,441Share in OCI:Items that do not recycle to profit or loss in
subsequent periods Remeasurement gains (losses) on life insurance
reserves 31,874 (66,558)Remeasurement on defined benefit plan (3,245) 3,415
Item that recycle to profit or loss in subsequentperiods:Net unrealized gain on FVOCI (103,148) 119,180
Cash dividends (40,000) –Balance at end of the year P=796,519 P=912,647
CBSICost of investment includes the original amount incurred by the Parent Company from its acquisitionof CBSI in 2007 amounting to P=1.07 billion.
Merger of CBSI with PDBThe BOD of both CBSI and PDB, in their meeting held on June 26, 2014, approved the proposedmerger of PDB with CBSI, with the latter as the surviving bank. On November 6, 2015, the BSPissued the Certificate of Authority on the Articles of Merger and the Plan of Merger, as amended, ofCBSI and PDB. On December 17, 2015, CBSI obtained SEC’s approval of its merger with PDB,whereby the entire assets and liabilities of PDB shall be transferred to and absorbed by CBSI.
184
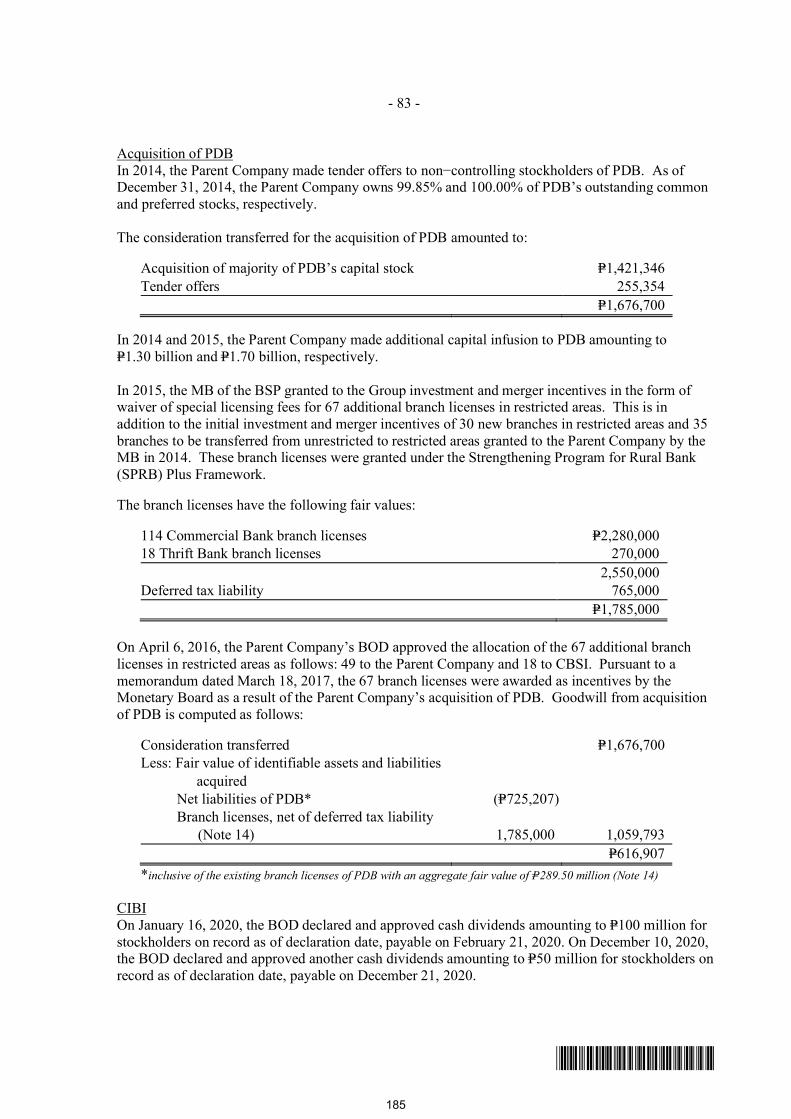
- 83 -
*SGVFS162381*
Acquisition of PDBIn 2014, the Parent Company made tender offers to non−controlling stockholders of PDB. As ofDecember 31, 2014, the Parent Company owns 99.85% and 100.00% of PDB’s outstanding commonand preferred stocks, respectively.
The consideration transferred for the acquisition of PDB amounted to:
Acquisition of majority of PDB’s capital stock P=1,421,346Tender offers 255,354
P=1,676,700
In 2014 and 2015, the Parent Company made additional capital infusion to PDB amounting toP=1.30 billion and P=1.70 billion, respectively.
In 2015, the MB of the BSP granted to the Group investment and merger incentives in the form ofwaiver of special licensing fees for 67 additional branch licenses in restricted areas. This is inaddition to the initial investment and merger incentives of 30 new branches in restricted areas and 35branches to be transferred from unrestricted to restricted areas granted to the Parent Company by theMB in 2014. These branch licenses were granted under the Strengthening Program for Rural Bank(SPRB) Plus Framework.
The branch licenses have the following fair values:
114 Commercial Bank branch licenses P=2,280,00018 Thrift Bank branch licenses 270,000
2,550,000Deferred tax liability 765,000
P=1,785,000
On April 6, 2016, the Parent Company’s BOD approved the allocation of the 67 additional branchlicenses in restricted areas as follows: 49 to the Parent Company and 18 to CBSI. Pursuant to amemorandum dated March 18, 2017, the 67 branch licenses were awarded as incentives by theMonetary Board as a result of the Parent Company’s acquisition of PDB. Goodwill from acquisitionof PDB is computed as follows:
Consideration transferred P=1,676,700Less: Fair value of identifiable assets and liabilities
acquiredNet liabilities of PDB* (P=725,207)Branch licenses, net of deferred tax liability
(Note 14) 1,785,000 1,059,793P=616,907
*inclusive of the existing branch licenses of PDB with an aggregate fair value of P=289.50 million (Note 14)
CIBIOn January 16, 2020, the BOD declared and approved cash dividends amounting to P=100 million forstockholders on record as of declaration date, payable on February 21, 2020. On December 10, 2020,the BOD declared and approved another cash dividends amounting to P=50 million for stockholders onrecord as of declaration date, payable on December 21, 2020.
185
- 84 -
*SGVFS162381*
CBCCOn June 11, 2020, the BOD declared and approved cash dividends of P=50 million for stockholders onrecord as of declaration date, payable on June 30, 2020.
On April 1, 2015, the BOD approved the investment of the Parent Company in an investment housesubsidiary, CBCC, up to the amount of P=500.00 million. On April 30, 2015, the BSP approved theParent Company’s investment of up to 100% or up to P=500.00 million common shares in CBCC. OnNovember 27, 2015, the SEC approved the Articles of Incorporation and By−Laws of CBCC andgranted CBCC the license to operate as an investment house.
CBCC acquisition of CBCSec (formerly ATC Securities, Inc.)On May 19, 2016, the BOD of CBCC approved the acquisition of ATC Securities, Inc. (ATC).
On June 29, 2016, CBCC and the shareholders of ATC (the Original Shareholders) entered into anAgreement for the Purchase of Shares (Agreement), whereby CBCC agreed to buy, and the OriginalShareholders agreed to sell, 3,800,000 shares representing 100% of the issued and outstanding sharesof ATC.
On July 6, 2017, the SEC approved the change of name from ATC Securities, Inc. to China BankSecurities Corporation.
CBC Assets One (SPC) Inc.CBC Assets One (SPC) Inc. was incorporated on June 15, 2016 as a wholly-owned special purposecompany of CBCC for asset-backed securitization. It has not yet commenced commercial operations.
Resurgent Capital (FIST-AMC) Inc.Resurgent Capital (FIST-AMC) Inc. was incorporated on September 6, 2021 as a wholly-owned FISTCorporation of CBCC. The primary purpose is to invest in, or acquire, Non-Performing Assets(“NPAs)” of any financial institution. It has not yet commenced commercial operations.
Investment in AssociatesInvestment in associates in the consolidated and the parent company financial statements pertain toinvestment in MCB Life and CBC-PCCI’s investment in Urban Shelters (accounted for byCBC−PCCI in its financial statements as an investment in an associate). Investment in Urban Sheltersis carried at nil amount as of December 31, 2021 and 2020.
MCB LifeIn 2006, the Parent Company and Manufacturers Life Insurance Company (Manulife) entered into ajoint project where the Parent Company will invest in a life insurance company owned by Manulife,and such company will be offering innovative insurance and financial products for health, wealth andeducation through the Parent Company’s branches nationwide. The Parent Company acquired 5.00%interest in Manulife China Bank Life Assurance Corporation (MCB Life) on August 8, 2007. Thisinvestment is accounted for as an investment in an associate by virtue of the Bancassurance AllianceAgreement which provides the Parent Company the right to be represented in MCB Life’s BOD and,thus, exercise significant influence over the latter.
The BSP requires the Parent Company to maintain a minimum of 5.00% ownership over MCB Life inorder for MCB Life to be allowed to continue distributing its insurance products through the ParentCompany’s branches.
186

- 85 -
*SGVFS162381*
On September 12, 2014, the BSP approved the request of the Parent Company to raise its capitalinvestment in MCB Life from 5.00% to 40.00% of its authorized capital through purchase of1.75 million common shares.
On December 5, 2018, the Parent Company’s BOD approved the additional capital infusion in theamount of P=40.00 million in MCB Life. This represents 40% of the P=100.00 million total capitalinfusion in MCB Life with the balance of P=60.00 million to be provided by Manulife Philippines. Ontop of complying with the higher capital requirements for insurance companies, the additional capitalwill improve MCB Life’s capacity to underwrite more business and enhance its competitive position.On February 22, 2019, the BSP approved the Bank’s capital infusion of P=40.0 million to MCB Life tocomply with the capitalization requirement of the Insurance Commission for insurance companies,which was paid on March 21, 2019.
On January 11, 2021, the Parent Company received P=40 million cash dividends from MCB Life.Thefollowing tables show the summarized financial information of MCB Life:
2021 2020Total assets P=55,544,393 P=43,089,159Total liabilities 53,602,517 40,856,962Equity 1,941,876 2,232,197
2021 2020Revenues P=16,502,813 P=9,402,315Benefits, claims and operating expenses 16,535,119 8,932,982Income before income tax (32,306) 469,333Net income (4,023) 381,102
Commission income earned by the Group from its bancassurance agreement amounting toP=432.08 million, P=282.00 million, P=303.45 million in 2021, 2020 and 2019, respectively, is includedunder ‘Miscellaneous income’ in the statements of income (Note 22).
12. Bank Premises, Furniture, Fixtures and Equipment and Right-of-use Assets
The composition of and movements in this account follow:
Consolidated2021
Land(Note 24)
Furniture,Fixtures and
Equipment BuildingsLeasehold
ImprovementsConstruction−
in−ProgressRight-of-useAssets Land
Right-of-useAssets
Building TotalCostBalance at beginning of year P=3,288,630 P=7,202,584 P=2,074,105 P=2,358,640 P=81,461 P=173,372 P=3,639,500 P=18,818,292Additions – 462,932 52,661 23,614 92,902 – 447,449 1,079,558Disposals/transfers (Note 14)* – (73,767) 8,817 (50,053) (10,314) – (3,451) (128,768)Balance at end of year 3,288,630 7,591,749 2,135,583 2,332,201 164,049 173,732 4,083,498 19,769,082
(Forward)Accumulated Depreciation
and AmortizationBalance at beginning of year P=– P=6,201,653 P=1,223,048 P=1,631,012 P=– P=70,343 P=1,269,519 P=10,395,575Depreciation and amortization – 543,245 67,242 216,712 – 15,235 628,346 1,470,780Disposals/transfers (Note 14)* – (242,090) (4,355) (55,711) – – (27,976) (330,132)Balance at end of year – 6,502,808 1,285,935 1,792,013 – 85,578 1,869,889 11,536,223Net Book Value at End of Year P=3,288,630 P=1,088,941 P=849,648 P=540,188 P=164,049 P=87,794 P=2,213,609 P=8,232,859*Includes transfers from investment properties amounting to P=14.46 million.
187

- 86 -
*SGVFS162381*
Consolidated2020
Land(Note 24)
Furniture,Fixtures and
Equipment BuildingsLeasehold
ImprovementsConstruction−
in−ProgressRight-of-useAssets Land
Right-of-useAssets
Building TotalCostBalance at beginning of year P=3,236,995 P=6,982,242 P=1,961,818 P=2,326,571 P=59,439 P=181,451 P=3,506,393 P=18,254,909Additions 51,635 273,890 105,272 65,800 44,680 – 167,762 709,039Disposals/transfers (Note 14)* – (53,548) 7,015 (33,731) (22,658) (8,079) (34,655) (145,656)Balance at end of year 3,288,630 7,202,584 2,074,105 2,358,640 81,461 173,372 3,639,500 18,818,292Accumulated Depreciation
and AmortizationBalance at beginning of year – 5,802,599 1,157,640 1,467,601 – 13,556 658,280 9,099,676Depreciation and amortization – 564,984 69,561 238,980 – 56,787 642,024 1,572,336Disposals/transfers (Note 14)* – (165,930) (4,153) (75,569) – – (30,785) (276,437)Balance at end of year – 6,201,653 1,223,048 1,631,012 – 70,343 1,269,519 10,395,575Net Book Value at End of Year P=3,288,630 P=1,000,931 P=851,057 P=727,628 P=81,461 P=103,029 P=2,369,981 P=8,422,717*Includes transfers from investment properties amounting to P= 28.90 million.
Parent Company
Land(Note 24)
Furniture,Fixtures and
Equipment BuildingsLeasehold
ImprovementsConstruction−
in−ProgressRight-of-useAssets Land
Right-of-useAssets Bldg.
2021Total
CostBalance at beginning of year P=2,890,661 P=5,890,301 P=1,350,906 P=1,670,745 P=14,498 P=181,451 P=2,786,874 P=14,785,436Additions – 353,223 51,533 20,329 3,409 – 205,402 633,896Disposals/transfers (Note 14)* – 31,421 8,818 (50,053) (10,314) – 53,994 33,866Balance at end of year 2,890,661 6,274,945 1,411,257 1,641,021 7,593 181,451 3,046,270 15,453,198Accumulated Depreciation
and AmortizationBalance at beginning of year – 5,089,267 702,039 1,096,037 – 70,343 950,791 7,908,477Depreciation and amortization – 432,652 67,255 164,702 – 15,235 428,850 1,108,694Disposals/transfers (Note 14)* – (141,427) (4,123) (55,711) – – 37,149 (164,112)Balance at end of year – 5,380,492 765,171 1,205,026 – 85,578 1,416,790 8,853,059Net Book Value at End of Year P=2,890,661 P=894,453 P=646,086 P=435,993 P=7,593 P=95,873 P=1,629,480 P=6,600,139*Includes transfers from investment properties amounting to P=14.46 million.
Parent Company
Land(Note 24)
Furniture,Fixtures and
Equipment BuildingsLeasehold
ImprovementsConstruction−
in−ProgressRight-of-useAssets Land
Right-of-useAssets Bldg.
2020Total
CostBalance at beginning of year P=2,889,705 P=5,665,067 P=1,235,690 P=1,642,879 P=19,370 P=181,451 P=2,730,534 P=14,364,696Additions 956 223,555 104,259 61,672 17,786 – 56,340 464,568Disposals/transfers (Note 14)* – 1,679 10,957 (33,806) (22,658) – – (43,828)Balance at end of year 2,890,661 5,890,301 1,350,906 1,670,745 14,498 181,451 2,786,874 14,785,436Accumulated Depreciation
and AmortizationBalance at beginning of year – 4,749,235 645,600 995,684 – 13,556 491,975 6,896,050Depreciation and amortization – 453,352 56,352 175,989 – 56,787 458,816 1,201,296Disposals/transfers (Note 14)* – (113,320) 87 (75,636) – – – (188,869)Balance at end of year – 5,089,267 702,039 1,096,037 – 70,343 950,791 7,908,477Net Book Value at End of Year P=2,890,661 P=801,034 P=648,867 P=574,708 P=14,498 P=111,108 P=1,836,083 P=6,876,959*Includes transfers from investment properties amounting to P=28.90 million
The Group adopted the deemed cost model as of January 1, 2004 and considered the carrying value ofthe land determined under its previous accounting method (revaluation method) as the deemed cost ofthe asset as of January 1, 2005. Accordingly, revaluation increment amounting to P=1.28 billion wasclosed to surplus (Note 24) in 2011.
As of December 31, 2021 and 2020, the gross carrying amount of fully depreciated furniture, fixturesand equipment still in use amounted to P=3.29 billion and P=2.90 billion, respectively, for the Groupand P=2.44 billion and P=2.09 billion, respectively, for the Parent Company.
188
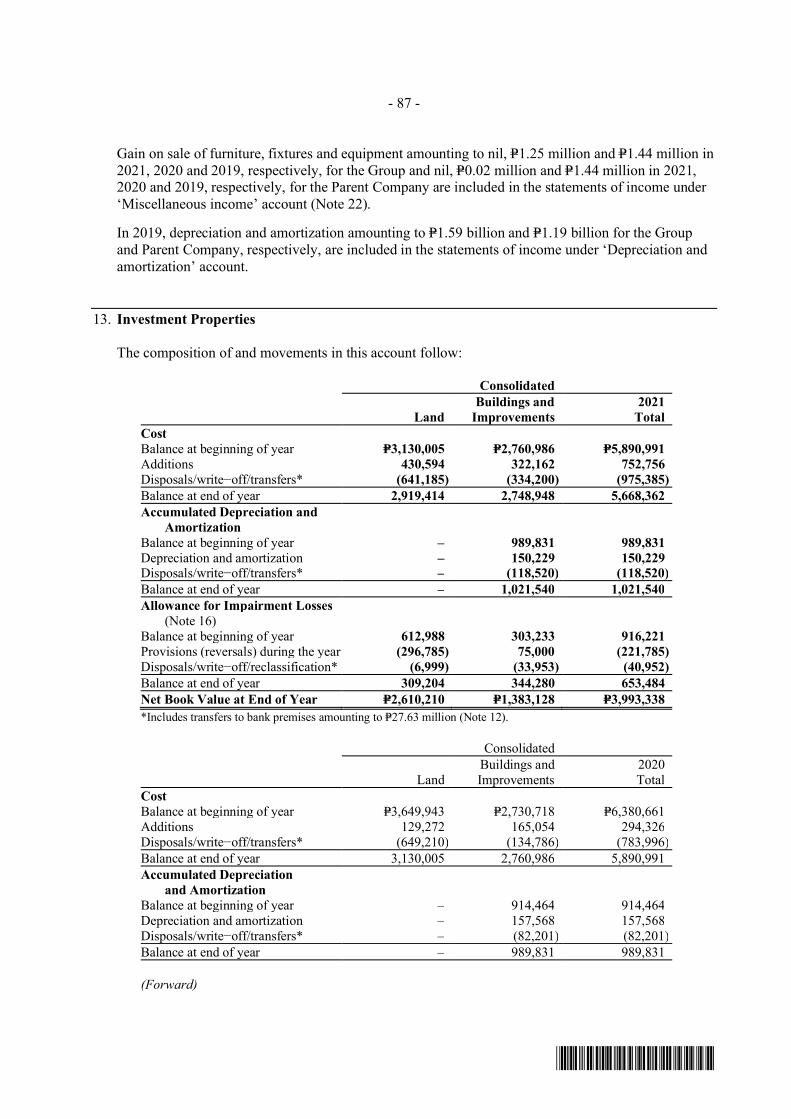
- 87 -
*SGVFS162381*
Gain on sale of furniture, fixtures and equipment amounting to nil, P=1.25 million and P=1.44 million in2021, 2020 and 2019, respectively, for the Group and nil, P=0.02 million and P=1.44 million in 2021,2020 and 2019, respectively, for the Parent Company are included in the statements of income under‘Miscellaneous income’ account (Note 22).
In 2019, depreciation and amortization amounting to P=1.59 billion and P=1.19 billion for the Groupand Parent Company, respectively, are included in the statements of income under ‘Depreciation andamortization’ account.
13. Investment Properties
The composition of and movements in this account follow:
Consolidated
LandBuildings and
Improvements2021
TotalCostBalance at beginning of year P=3,130,005 P=2,760,986 P=5,890,991Additions 430,594 322,162 752,756Disposals/write−off/transfers* (641,185) (334,200) (975,385)Balance at end of year 2,919,414 2,748,948 5,668,362Accumulated Depreciation and
AmortizationBalance at beginning of year – 989,831 989,831Depreciation and amortization – 150,229 150,229Disposals/write−off/transfers* – (118,520) (118,520)Balance at end of year – 1,021,540 1,021,540Allowance for Impairment Losses
(Note 16)Balance at beginning of year 612,988 303,233 916,221Provisions (reversals) during the year (296,785) 75,000 (221,785)Disposals/write−off/reclassification* (6,999) (33,953) (40,952)Balance at end of year 309,204 344,280 653,484Net Book Value at End of Year P=2,610,210 P=1,383,128 P=3,993,338*Includes transfers to bank premises amounting to P=27.63 million (Note 12).
Consolidated
LandBuildings andImprovements
2020Total
CostBalance at beginning of year P=3,649,943 P=2,730,718 P=6,380,661Additions 129,272 165,054 294,326Disposals/write−off/transfers* (649,210) (134,786) (783,996)Balance at end of year 3,130,005 2,760,986 5,890,991Accumulated Depreciation
and AmortizationBalance at beginning of year – 914,464 914,464Depreciation and amortization – 157,568 157,568Disposals/write−off/transfers* – (82,201) (82,201)Balance at end of year – 989,831 989,831
(Forward)
189
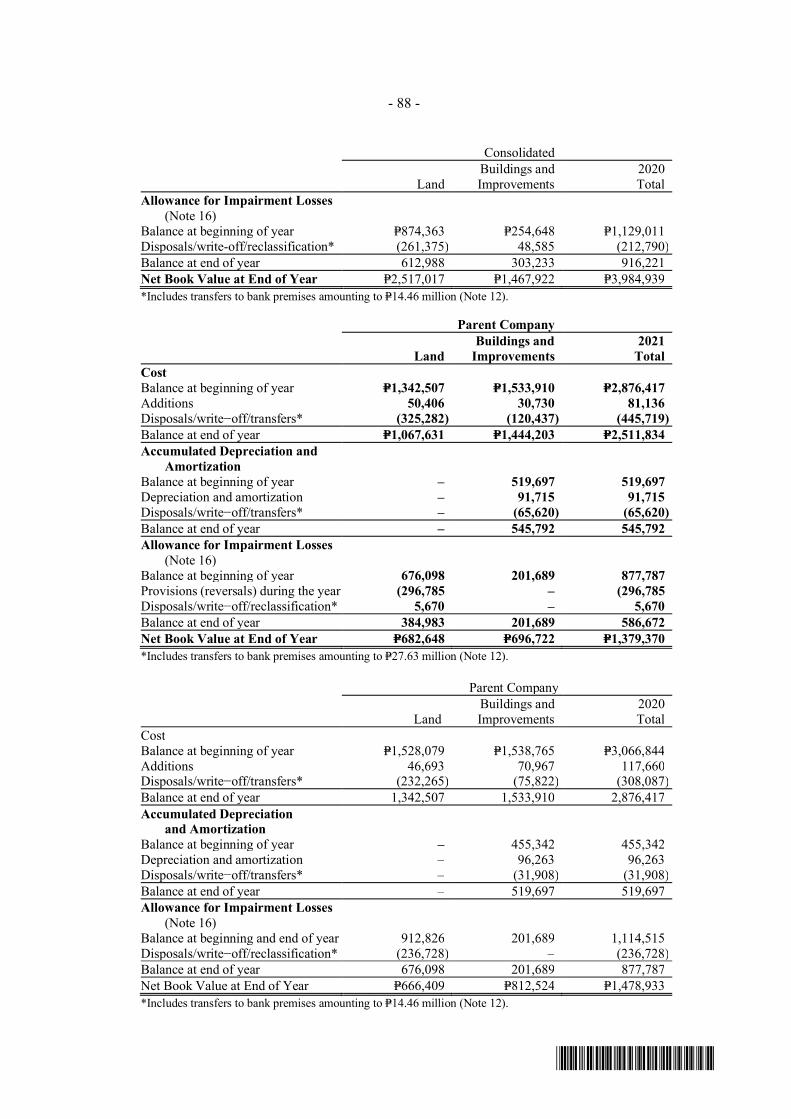
- 88 -
*SGVFS162381*
Consolidated
LandBuildings andImprovements
2020Total
Allowance for Impairment Losses(Note 16)
Balance at beginning of year P=874,363 P=254,648 P=1,129,011Disposals/write-off/reclassification* (261,375) 48,585 (212,790)Balance at end of year 612,988 303,233 916,221Net Book Value at End of Year P=2,517,017 P=1,467,922 P=3,984,939*Includes transfers to bank premises amounting to P=14.46 million (Note 12).
Parent Company
LandBuildings and
Improvements2021
TotalCostBalance at beginning of year P=1,342,507 P=1,533,910 P=2,876,417Additions 50,406 30,730 81,136Disposals/write−off/transfers* (325,282) (120,437) (445,719)Balance at end of year P=1,067,631 P=1,444,203 P=2,511,834Accumulated Depreciation and
AmortizationBalance at beginning of year – 519,697 519,697Depreciation and amortization – 91,715 91,715Disposals/write−off/transfers* – (65,620) (65,620)Balance at end of year – 545,792 545,792Allowance for Impairment Losses
(Note 16)Balance at beginning of year 676,098 201,689 877,787Provisions (reversals) during the year (296,785 – (296,785Disposals/write−off/reclassification* 5,670 – 5,670Balance at end of year 384,983 201,689 586,672Net Book Value at End of Year P=682,648 P=696,722 P=1,379,370*Includes transfers to bank premises amounting to P=27.63 million (Note 12).
Parent Company
LandBuildings andImprovements
2020Total
CostBalance at beginning of year P=1,528,079 P=1,538,765 P=3,066,844Additions 46,693 70,967 117,660Disposals/write−off/transfers* (232,265) (75,822) (308,087)Balance at end of year 1,342,507 1,533,910 2,876,417Accumulated Depreciation
and AmortizationBalance at beginning of year – 455,342 455,342Depreciation and amortization – 96,263 96,263Disposals/write−off/transfers* – (31,908) (31,908)Balance at end of year – 519,697 519,697Allowance for Impairment Losses
(Note 16)Balance at beginning and end of year 912,826 201,689 1,114,515Disposals/write−off/reclassification* (236,728) – (236,728)Balance at end of year 676,098 201,689 877,787Net Book Value at End of Year P=666,409 P=812,524 P=1,478,933*Includes transfers to bank premises amounting to P=14.46 million (Note 12).
190
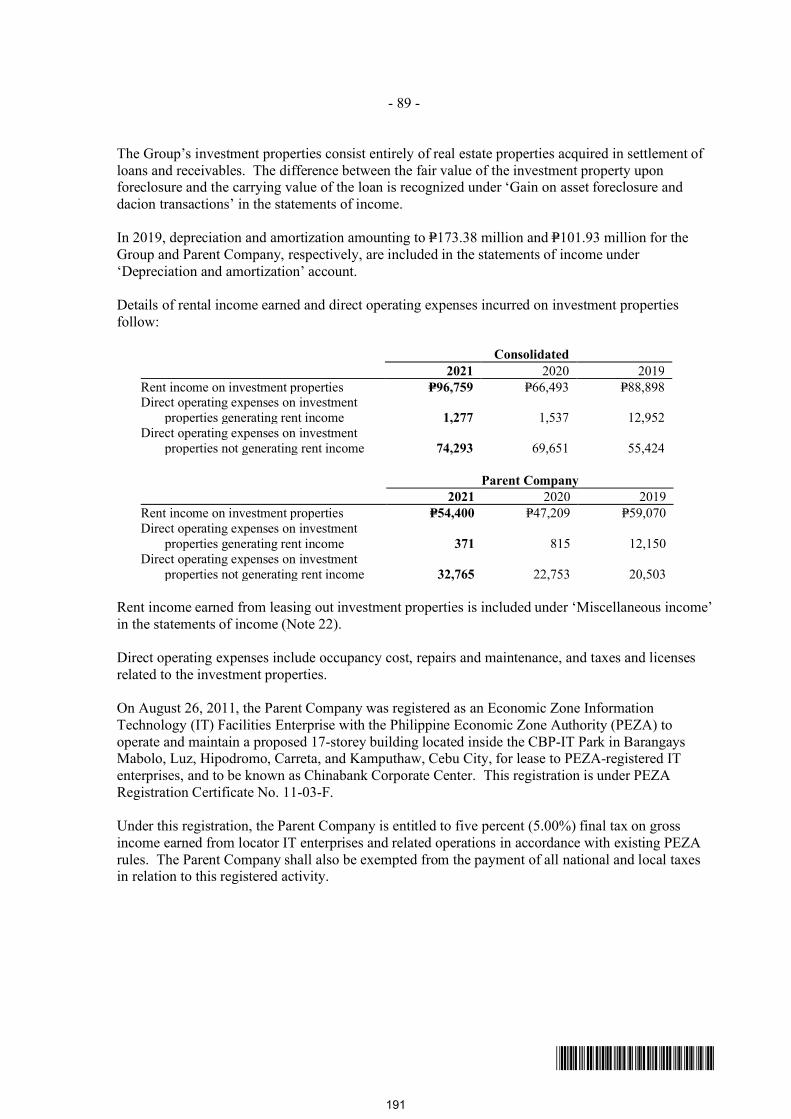
- 89 -
*SGVFS162381*
The Group’s investment properties consist entirely of real estate properties acquired in settlement ofloans and receivables. The difference between the fair value of the investment property uponforeclosure and the carrying value of the loan is recognized under ‘Gain on asset foreclosure anddacion transactions’ in the statements of income.
In 2019, depreciation and amortization amounting to P=173.38 million and P=101.93 million for theGroup and Parent Company, respectively, are included in the statements of income under‘Depreciation and amortization’ account.
Details of rental income earned and direct operating expenses incurred on investment propertiesfollow:
Consolidated2021 2020 2019
Rent income on investment properties P=96,759 P=66,493 P=88,898Direct operating expenses on investment
properties generating rent income 1,277 1,537 12,952Direct operating expenses on investment
properties not generating rent income 74,293 69,651 55,424
Parent Company2021 2020 2019
Rent income on investment properties P=54,400 P=47,209 P=59,070Direct operating expenses on investment
properties generating rent income 371 815 12,150Direct operating expenses on investment
properties not generating rent income 32,765 22,753 20,503
Rent income earned from leasing out investment properties is included under ‘Miscellaneous income’in the statements of income (Note 22).
Direct operating expenses include occupancy cost, repairs and maintenance, and taxes and licensesrelated to the investment properties.
On August 26, 2011, the Parent Company was registered as an Economic Zone InformationTechnology (IT) Facilities Enterprise with the Philippine Economic Zone Authority (PEZA) tooperate and maintain a proposed 17-storey building located inside the CBP-IT Park in BarangaysMabolo, Luz, Hipodromo, Carreta, and Kamputhaw, Cebu City, for lease to PEZA-registered ITenterprises, and to be known as Chinabank Corporate Center. This registration is under PEZARegistration Certificate No. 11-03-F.
Under this registration, the Parent Company is entitled to five percent (5.00%) final tax on grossincome earned from locator IT enterprises and related operations in accordance with existing PEZArules. The Parent Company shall also be exempted from the payment of all national and local taxesin relation to this registered activity.
191
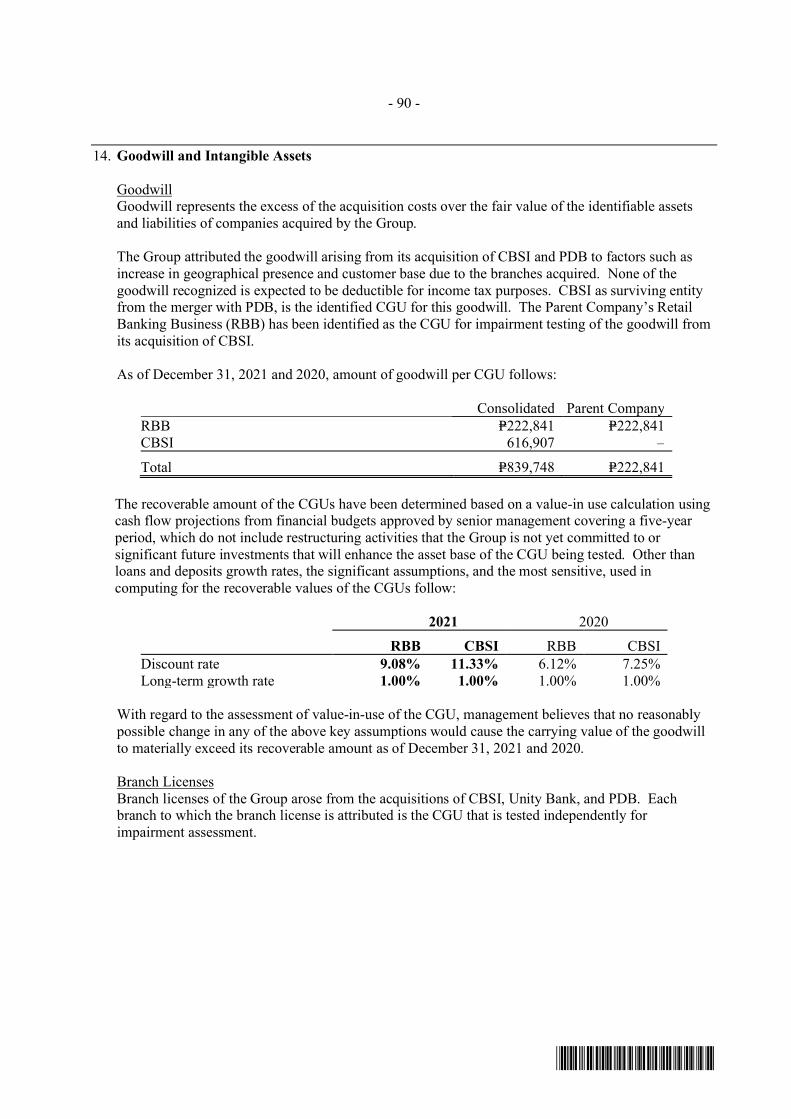
- 90 -
*SGVFS162381*
14. Goodwill and Intangible Assets
GoodwillGoodwill represents the excess of the acquisition costs over the fair value of the identifiable assetsand liabilities of companies acquired by the Group.
The Group attributed the goodwill arising from its acquisition of CBSI and PDB to factors such asincrease in geographical presence and customer base due to the branches acquired. None of thegoodwill recognized is expected to be deductible for income tax purposes. CBSI as surviving entityfrom the merger with PDB, is the identified CGU for this goodwill. The Parent Company’s RetailBanking Business (RBB) has been identified as the CGU for impairment testing of the goodwill fromits acquisition of CBSI.
As of December 31, 2021 and 2020, amount of goodwill per CGU follows:
Consolidated Parent CompanyRBB P=222,841 P=222,841CBSI 616,907 –
Total P=839,748 P=222,841
The recoverable amount of the CGUs have been determined based on a value-in use calculation usingcash flow projections from financial budgets approved by senior management covering a five-yearperiod, which do not include restructuring activities that the Group is not yet committed to orsignificant future investments that will enhance the asset base of the CGU being tested. Other thanloans and deposits growth rates, the significant assumptions, and the most sensitive, used incomputing for the recoverable values of the CGUs follow:
2021 2020RBB CBSI RBB CBSI
Discount rate 9.08% 11.33% 6.12% 7.25%Long-term growth rate 1.00% 1.00% 1.00% 1.00%
With regard to the assessment of value-in-use of the CGU, management believes that no reasonablypossible change in any of the above key assumptions would cause the carrying value of the goodwillto materially exceed its recoverable amount as of December 31, 2021 and 2020.
Branch LicensesBranch licenses of the Group arose from the acquisitions of CBSI, Unity Bank, and PDB. Eachbranch to which the branch license is attributed is the CGU that is tested independently forimpairment assessment.
192
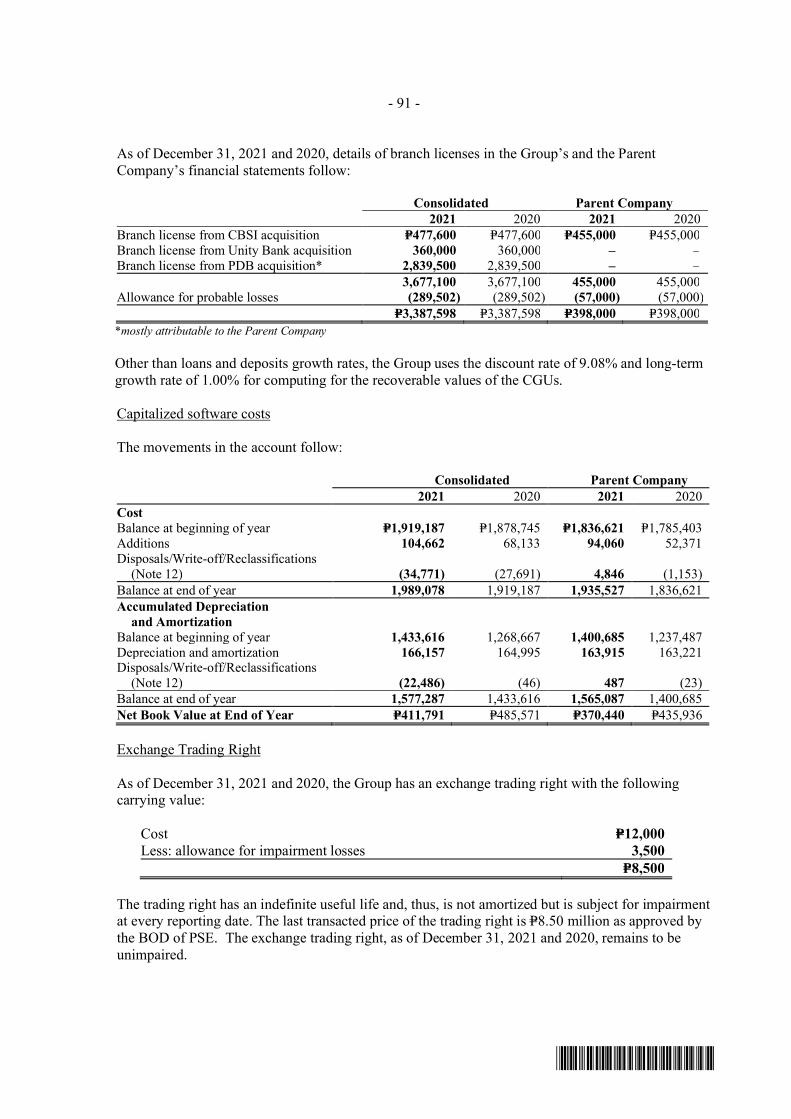
- 91 -
*SGVFS162381*
As of December 31, 2021 and 2020, details of branch licenses in the Group’s and the ParentCompany’s financial statements follow:
Consolidated Parent Company2021 2020 2021 2020
Branch license from CBSI acquisition P=477,600 P=477,600 P=455,000 P=455,000Branch license from Unity Bank acquisition 360,000 360,000 – –Branch license from PDB acquisition* 2,839,500 2,839,500 – –
3,677,100 3,677,100 455,000 455,000Allowance for probable losses (289,502) (289,502) (57,000) (57,000)
P=3,387,598 P=3,387,598 P=398,000 P=398,000*mostly attributable to the Parent Company
Other than loans and deposits growth rates, the Group uses the discount rate of 9.08% and long-termgrowth rate of 1.00% for computing for the recoverable values of the CGUs.
Capitalized software costs
The movements in the account follow:
Consolidated Parent Company2021 2020 2021 2020
CostBalance at beginning of year P=1,919,187 P=1,878,745 P=1,836,621 P=1,785,403Additions 104,662 68,133 94,060 52,371Disposals/Write-off/Reclassifications
(Note 12) (34,771) (27,691) 4,846 (1,153)Balance at end of year 1,989,078 1,919,187 1,935,527 1,836,621Accumulated Depreciation
and AmortizationBalance at beginning of year 1,433,616 1,268,667 1,400,685 1,237,487Depreciation and amortization 166,157 164,995 163,915 163,221Disposals/Write-off/Reclassifications
(Note 12) (22,486) (46) 487 (23)Balance at end of year 1,577,287 1,433,616 1,565,087 1,400,685Net Book Value at End of Year P=411,791 P=485,571 P=370,440 P=435,936
Exchange Trading Right
As of December 31, 2021 and 2020, the Group has an exchange trading right with the followingcarrying value:
Cost P=12,000Less: allowance for impairment losses 3,500
P=8,500
The trading right has an indefinite useful life and, thus, is not amortized but is subject for impairmentat every reporting date. The last transacted price of the trading right is P=8.50 million as approved bythe BOD of PSE. The exchange trading right, as of December 31, 2021 and 2020, remains to beunimpaired.
193
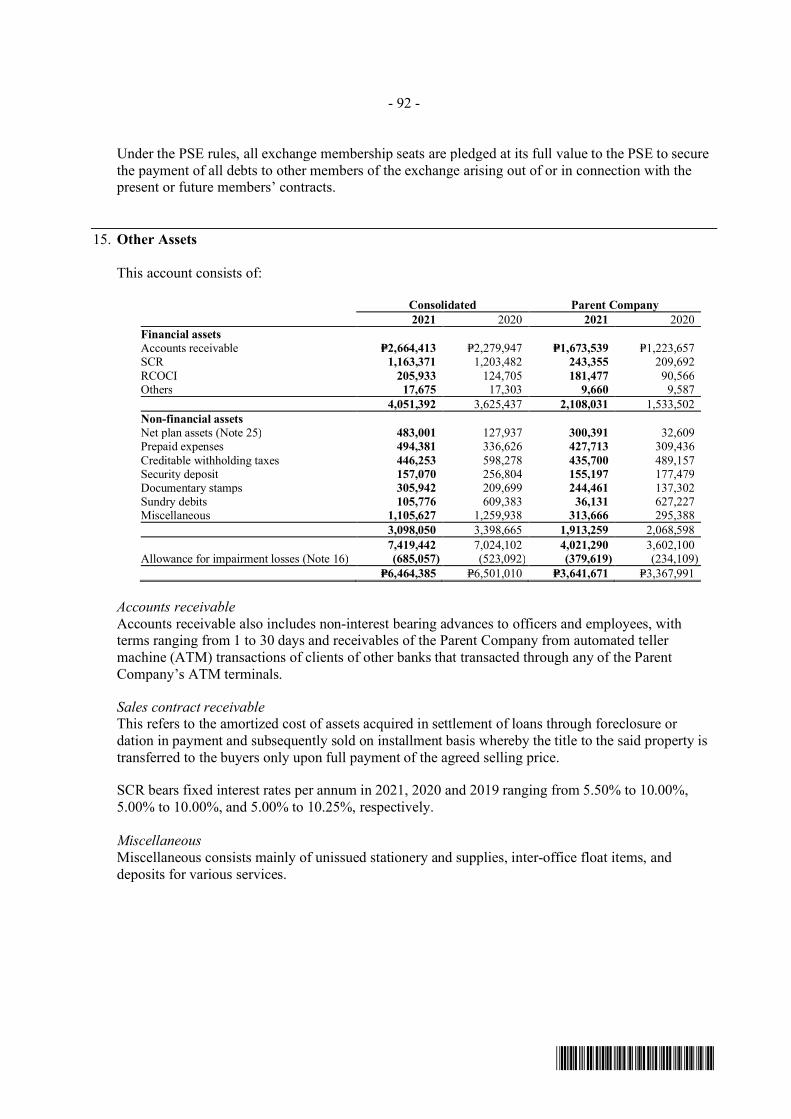
- 92 -
*SGVFS162381*
Under the PSE rules, all exchange membership seats are pledged at its full value to the PSE to securethe payment of all debts to other members of the exchange arising out of or in connection with thepresent or future members’ contracts.
15. Other Assets
This account consists of:
Consolidated Parent Company2021 2020 2021 2020
Financial assetsAccounts receivable P=2,664,413 P=2,279,947 P=1,673,539 P=1,223,657SCR 1,163,371 1,203,482 243,355 209,692RCOCI 205,933 124,705 181,477 90,566Others 17,675 17,303 9,660 9,587
4,051,392 3,625,437 2,108,031 1,533,502Non-financial assetsNet plan assets (Note 25) 483,001 127,937 300,391 32,609Prepaid expenses 494,381 336,626 427,713 309,436Creditable withholding taxes 446,253 598,278 435,700 489,157Security deposit 157,070 256,804 155,197 177,479Documentary stamps 305,942 209,699 244,461 137,302Sundry debits 105,776 609,383 36,131 627,227Miscellaneous 1,105,627 1,259,938 313,666 295,388
3,098,050 3,398,665 1,913,259 2,068,5987,419,442 7,024,102 4,021,290 3,602,100
Allowance for impairment losses (Note 16) (685,057) (523,092) (379,619) (234,109)P=6,464,385 P=6,501,010 P=3,641,671 P=3,367,991
Accounts receivableAccounts receivable also includes non-interest bearing advances to officers and employees, withterms ranging from 1 to 30 days and receivables of the Parent Company from automated tellermachine (ATM) transactions of clients of other banks that transacted through any of the ParentCompany’s ATM terminals.
Sales contract receivableThis refers to the amortized cost of assets acquired in settlement of loans through foreclosure ordation in payment and subsequently sold on installment basis whereby the title to the said property istransferred to the buyers only upon full payment of the agreed selling price.
SCR bears fixed interest rates per annum in 2021, 2020 and 2019 ranging from 5.50% to 10.00%,5.00% to 10.00%, and 5.00% to 10.25%, respectively.
MiscellaneousMiscellaneous consists mainly of unissued stationery and supplies, inter-office float items, anddeposits for various services.
194

- 93 -
*SGVFS162381*
16. Allowance for Impairment and Credit Losses
Changes in the allowance for impairment and credit losses are as follows:
Consolidated Parent Company2021 2020 2021 2020
Balances at beginning of yearLoans and receivables P=14,739,918 P=8,559,976 P=12,527,657 P=6,938,785Investment securities at amortized cost 2,389,845 1,087,983 2,383,800 1,082,690Financial assets at FVOCI * 30,384 18,521 30,056 18,471Investment properties 916,219 1,129,012 877,787 1,114,515Accrued interest receivable 337,785 275,888 36,609 39,261Intangible assets 293,002 233,100 57,000 57,000Investment in subsidiaries – – 59,902 –Other assets 523,092 565,319 234,109 294,913Off-balance sheet exposures * 467,117 1,239,967 457,099 1,229,949
19,697,362 13,109,766 16,664,019 10,775,584Provisions charged to operations 8,876,744 8,868,919 7,679,877 7,983,206Accounts charged off and others (7,510,021) (2,281,323) (6,910,315) (2,094,771)
1,366,723 6,587,596 769,562 5,888,435Balances at end of year
Loans and receivables (Note 10) 15,057,609 14,739,918 12,489,884 12,527,657Investment securities at amortized cost (Note 9) 3,093,747 2,389,845 2,886,272 2,383,800Financial assets at FVOCI * (Note 9) 61,495 30,384 60,998 30,056Investment properties (Note 13) 653,484 916,219 586,672 877,787Accrued interest receivable 478,814 337,785 182,375 36,609Intangible assets 293,002 293,002 57,000 57,000Investment in subsidiaries – – 59,902 59,902Other assets (Note 15) 685,057 523,092 379,619 234,109Off-balance sheet exposures * 740,877 467,117 730,859 457,099
P=21,064,085 P=19,697,362 P=17,433,581 P=16,664,019* The allowance for credit and impairment losses in the above table are presented as contra-asset in determining the carrying amount of the
related asset accounts, except for the expected credit losses on “Financial assets at FVOCI” and “Off-balance sheet exposures” which arepresented under “Other Comprehensive Income” (Equity) and “Other Liabilities” (Liabilitiy), respectively.
At the current level of allowance for impairment and credit losses, management believes that theGroup has sufficient allowance to cover any losses that may be incurred from the non-collection ornon-realization of its loans and receivables and other risk assets.
The separate valuation allowance of acquired loans and receivables from PDB amounting toP=1.59 billion was not recognized by the Group on the effectivity date of acquisition as thesereceivables were measured at fair value at acquisition date. Any uncertainties about future cash flowsof these receivables were included in their fair value measurement (Note 11). Also, the separatevaluation allowance of acquired investment properties from PDB amounting to P=199.15 million wasnot recognized by the Group on the effectivity date of acquisition as these properties were measuredat fair value on acquisition date.
195

- 94 -
*SGVFS162381*
Below is the breakdown of provision for credit losses in 2021, 2020 and 2019.
Consolidated Parent Company2021 2020 2019 2021 2020 2019
Corporate and commercial lending P=5,887,208 P=6,620,171 P=1,714,041 P=6,228,681 P=6,300,097 P=1,369,339Consumer lending 1,803,215 1,626,588 (44,227) 533,013 1,076,445 79,969Trade-related lending 21,737 (34,744) 235,962 25,858 (43,355) 240,718Others 855 2,889 1,873 328 – –Investment securities at amortized cost 394,228 1,337,700 732,874 369,383 1,336,947 887,745Financial assets at FVOCI (debt securities) 13,226 21,208 10,337 13,057 20,930 10,287
8,120,469 9,573,812 2,650,860 7,170,320 8,691,064 2,588,058Impact to profit or loss of movements in
ECL for off-books exposures 271,578 (772,850) (389,182) 271,578 (772,850) (389,182)Other assets 484,697 67,957 308,490 237,979 64,992 6,186
P=8,876,744 P=8,868,919 P=2,570,168 P=7,679,877 P=7,983,206 P= 2,205,062
The tables below illustrate the movements of the allowance for impairment and credit losses during2021 (effect of movements in ECL due to transfers between stages are shown in the total column):
ConsolidatedECL Staging
Stage 1 Stage 2 Stage 3Corporate and commercial lending 12-month ECL Lifetime ECL Lifetime ECL TotalLoss allowance at January 1, 2021 P=4,536,289 P=3,213,081 P=4,628,126 P=12,377,496Movements with P&L impact
Transfers:Transfer from Stage 1 to Stage 2 (265,804) 405,942 – 140,138Transfer from Stage 1 to Stage 3 (19,149) – 976,835 957,686Transfer from Stage 2 to Stage 1 26,858 (109,652) – (82,794)Transfer from Stage 2 to Stage 3 – (2,461,394) 2,668,435 207,041Transfer from Stage 3 to Stage 1 45 – (4,278) (4,233)Transfer from Stage 3 to Stage 2 – 152,158 (284,566) (132,408)
New financial assets originated * 1,316,932 1,923,910 578,704 3,819,546Changes in PDs / LGDs / EADs (831,490) 273,731 4,325,035 3,767,276Financial assets derecognized during the period (1,748,505) (192,902) (783,973) (2,725,380)Fx and other movements (48,112) (11,112) (440) (59,664)
Total net P&L charge during the period (1,569,225) (19,319) 7,475,752 5,887,208Other movements without P&L impact
Write-offs, foreclosures, and other movements 48,112 11,112 (6,289,638) (6,230,414)Total movements without P&L impact 48,112 11,112 (6,289,638) (6,230,414)
Loss allowance at December 31, 2021 P=3,015,176 P=3,204,874 P=5,814,240 P=12,034,290 * Stage classification of new financial assets originated pertains to the stage as of end of year
ConsolidatedECL Staging
Stage 1 Stage 2 Stage 3Consumer lending 12-month ECL Lifetime ECL Lifetime ECL TotalLoss allowance at January 1, 2021 P=332,094 P=155,749 P=1,593,086 P=2,080,929Movements with P&L impact
Transfers:Transfer from Stage 1 to Stage 2 (21,355) 67,308 – 45,953Transfer from Stage 1 to Stage 3 (4,530) – 195,646 191,116Transfer from Stage 2 to Stage 1 19,388 (42,397) – (23,009)Transfer from Stage 2 to Stage 3 – (20,763) 301,488 280,725Transfer from Stage 3 to Stage 1 3,084 – (70,099) (67,015)Transfer from Stage 3 to Stage 2 – 31,980 (361,359) (329,379)
New financial assets originated * 169,078 39,175 213,930 422,183Changes in PDs / LGDs / EADs 123,269 (22,668) 1,488,672 1,589,273Financial assets derecognized during the period (50,712) (33,273) (222,647) (306,632)Fx and other movements – – – –
Total net P&L charge during the period 238,222 19,362 1,545,631 1,803,215Other movements without P&L impact
Write-offs, foreclosures, and other movements – – (1,095,033) (1,095,033)Total movements without P&L impact – – (1,095,033) (1,095,033)
Loss allowance at December 31, 2021 P=570,316 P=175,111 P=2,043,684 P=2,789,111* Stage classification of new financial assets originated pertains to the stage as of end of year
196
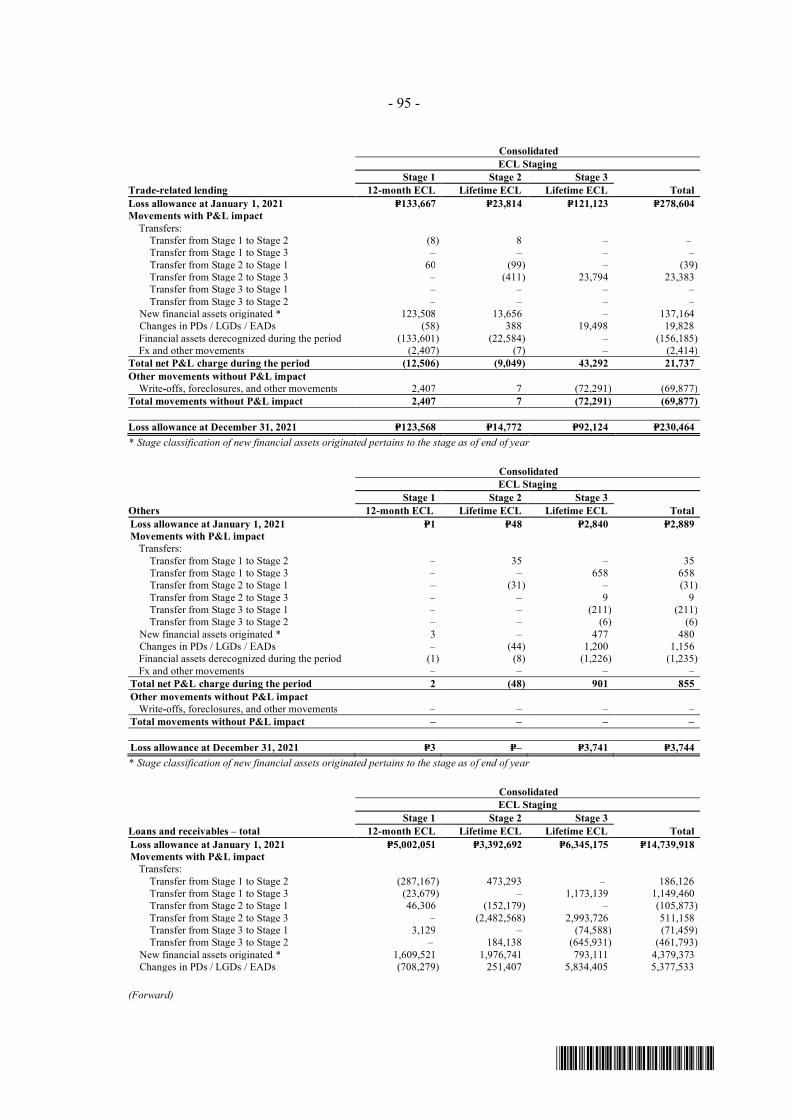
- 95 -
*SGVFS162381*
ConsolidatedECL Staging
Stage 1 Stage 2 Stage 3Trade-related lending 12-month ECL Lifetime ECL Lifetime ECL TotalLoss allowance at January 1, 2021 P=133,667 P=23,814 P=121,123 P=278,604Movements with P&L impact
Transfers:Transfer from Stage 1 to Stage 2 (8) 8 – –Transfer from Stage 1 to Stage 3 – – – –Transfer from Stage 2 to Stage 1 60 (99) – (39)Transfer from Stage 2 to Stage 3 – (411) 23,794 23,383Transfer from Stage 3 to Stage 1 – – – –Transfer from Stage 3 to Stage 2 – – – –
New financial assets originated * 123,508 13,656 – 137,164Changes in PDs / LGDs / EADs (58) 388 19,498 19,828Financial assets derecognized during the period (133,601) (22,584) – (156,185)Fx and other movements (2,407) (7) – (2,414)
Total net P&L charge during the period (12,506) (9,049) 43,292 21,737Other movements without P&L impact
Write-offs, foreclosures, and other movements 2,407 7 (72,291) (69,877)Total movements without P&L impact 2,407 7 (72,291) (69,877)
Loss allowance at December 31, 2021 P=123,568 P=14,772 P=92,124 P=230,464* Stage classification of new financial assets originated pertains to the stage as of end of year
ConsolidatedECL Staging
Stage 1 Stage 2 Stage 3Others 12-month ECL Lifetime ECL Lifetime ECL TotalLoss allowance at January 1, 2021 P=1 P=48 P=2,840 P=2,889Movements with P&L impact
Transfers:Transfer from Stage 1 to Stage 2 – 35 – 35Transfer from Stage 1 to Stage 3 – – 658 658Transfer from Stage 2 to Stage 1 – (31) – (31)Transfer from Stage 2 to Stage 3 – – 9 9Transfer from Stage 3 to Stage 1 – – (211) (211)Transfer from Stage 3 to Stage 2 – – (6) (6)
New financial assets originated * 3 – 477 480Changes in PDs / LGDs / EADs – (44) 1,200 1,156Financial assets derecognized during the period (1) (8) (1,226) (1,235)Fx and other movements – – – –
Total net P&L charge during the period 2 (48) 901 855Other movements without P&L impact
Write-offs, foreclosures, and other movements – – – –Total movements without P&L impact – – – –
Loss allowance at December 31, 2021 P=3 P=– P=3,741 P=3,744* Stage classification of new financial assets originated pertains to the stage as of end of year
ConsolidatedECL Staging
Stage 1 Stage 2 Stage 3Loans and receivables – total 12-month ECL Lifetime ECL Lifetime ECL TotalLoss allowance at January 1, 2021 P=5,002,051 P=3,392,692 P=6,345,175 P=14,739,918Movements with P&L impact
Transfers:Transfer from Stage 1 to Stage 2 (287,167) 473,293 – 186,126Transfer from Stage 1 to Stage 3 (23,679) – 1,173,139 1,149,460Transfer from Stage 2 to Stage 1 46,306 (152,179) – (105,873)Transfer from Stage 2 to Stage 3 – (2,482,568) 2,993,726 511,158Transfer from Stage 3 to Stage 1 3,129 – (74,588) (71,459)Transfer from Stage 3 to Stage 2 – 184,138 (645,931) (461,793)
New financial assets originated * 1,609,521 1,976,741 793,111 4,379,373Changes in PDs / LGDs / EADs (708,279) 251,407 5,834,405 5,377,533
(Forward)
197
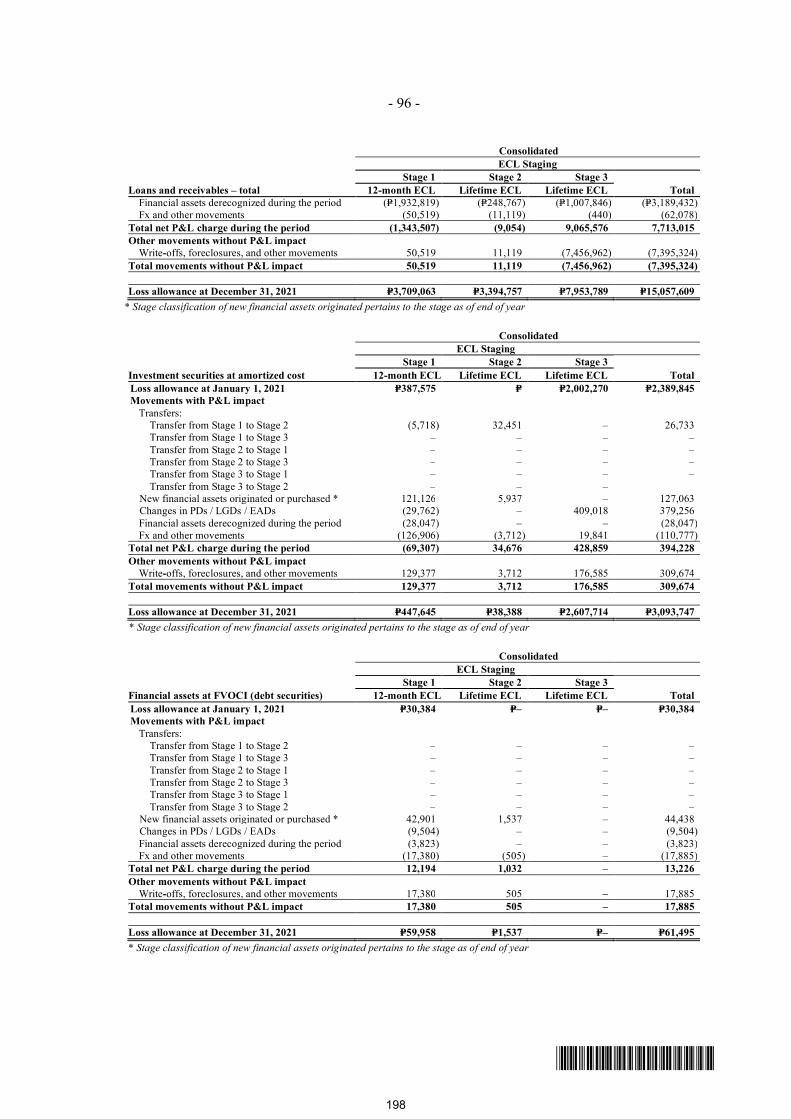
- 96 -
*SGVFS162381*
ConsolidatedECL Staging
Stage 1 Stage 2 Stage 3Loans and receivables – total 12-month ECL Lifetime ECL Lifetime ECL Total
Financial assets derecognized during the period (P=1,932,819) (P=248,767) (P=1,007,846) (P=3,189,432)Fx and other movements (50,519) (11,119) (440) (62,078)
Total net P&L charge during the period (1,343,507) (9,054) 9,065,576 7,713,015Other movements without P&L impact
Write-offs, foreclosures, and other movements 50,519 11,119 (7,456,962) (7,395,324)Total movements without P&L impact 50,519 11,119 (7,456,962) (7,395,324)
Loss allowance at December 31, 2021 P=3,709,063 P=3,394,757 P=7,953,789 P=15,057,609* Stage classification of new financial assets originated pertains to the stage as of end of year
Consolidated ECL Staging
Stage 1 Stage 2 Stage 3Investment securities at amortized cost 12-month ECL Lifetime ECL Lifetime ECL TotalLoss allowance at January 1, 2021 P=387,575 P= P=2,002,270 P=2,389,845Movements with P&L impact
Transfers:Transfer from Stage 1 to Stage 2 (5,718) 32,451 – 26,733Transfer from Stage 1 to Stage 3 – – – –Transfer from Stage 2 to Stage 1 – – – –Transfer from Stage 2 to Stage 3 – – – –Transfer from Stage 3 to Stage 1 – – – –Transfer from Stage 3 to Stage 2 – – –
New financial assets originated or purchased * 121,126 5,937 – 127,063Changes in PDs / LGDs / EADs (29,762) – 409,018 379,256Financial assets derecognized during the period (28,047) – – (28,047)Fx and other movements (126,906) (3,712) 19,841 (110,777)
Total net P&L charge during the period (69,307) 34,676 428,859 394,228Other movements without P&L impact
Write-offs, foreclosures, and other movements 129,377 3,712 176,585 309,674Total movements without P&L impact 129,377 3,712 176,585 309,674
Loss allowance at December 31, 2021 P=447,645 P=38,388 P=2,607,714 P=3,093,747* Stage classification of new financial assets originated pertains to the stage as of end of year
Consolidated ECL Staging
Stage 1 Stage 2 Stage 3Financial assets at FVOCI (debt securities) 12-month ECL Lifetime ECL Lifetime ECL TotalLoss allowance at January 1, 2021 P=30,384 P=– P=– P=30,384Movements with P&L impact
Transfers:Transfer from Stage 1 to Stage 2 – – – –Transfer from Stage 1 to Stage 3 – – – –Transfer from Stage 2 to Stage 1 – – – –Transfer from Stage 2 to Stage 3 – – – –Transfer from Stage 3 to Stage 1 – – – –Transfer from Stage 3 to Stage 2 – – – –
New financial assets originated or purchased * 42,901 1,537 – 44,438Changes in PDs / LGDs / EADs (9,504) – – (9,504)Financial assets derecognized during the period (3,823) – – (3,823)Fx and other movements (17,380) (505) – (17,885)
Total net P&L charge during the period 12,194 1,032 – 13,226Other movements without P&L impact
Write-offs, foreclosures, and other movements 17,380 505 – 17,885Total movements without P&L impact 17,380 505 – 17,885
Loss allowance at December 31, 2021 P=59,958 P=1,537 P=– P=61,495* Stage classification of new financial assets originated pertains to the stage as of end of year
198
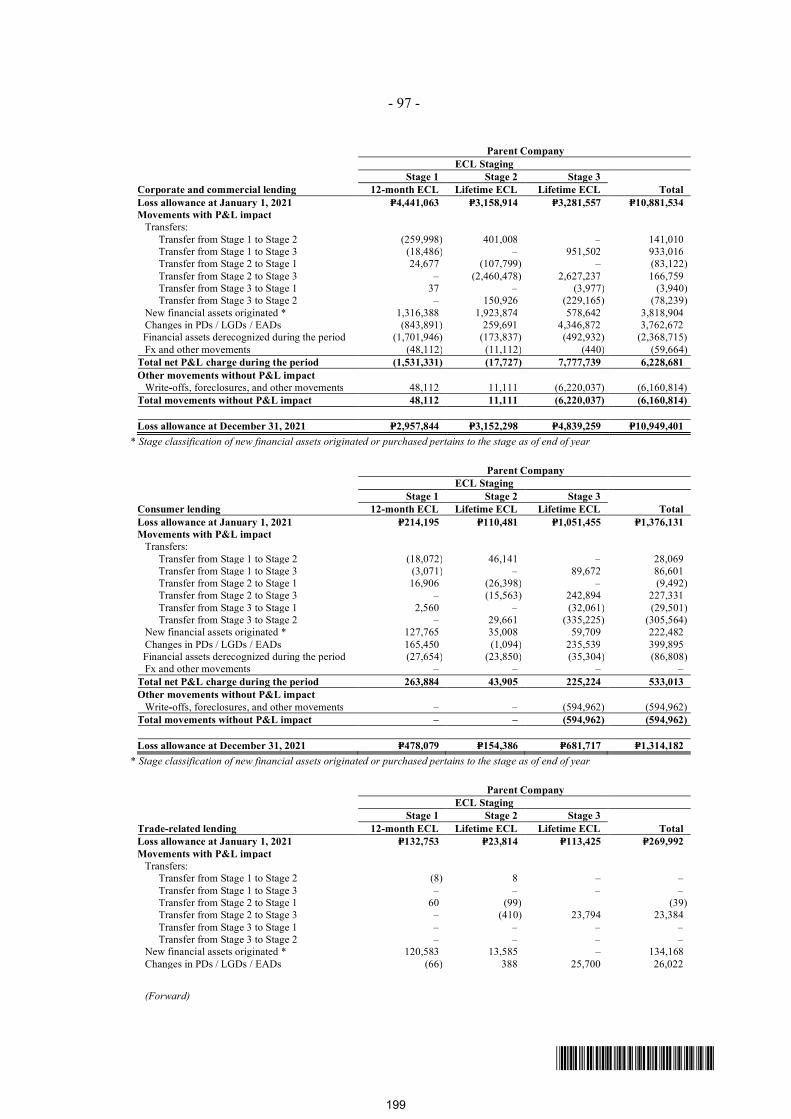
- 97 -
*SGVFS162381*
Parent Company ECL Staging
Stage 1 Stage 2 Stage 3Corporate and commercial lending 12-month ECL Lifetime ECL Lifetime ECL TotalLoss allowance at January 1, 2021 P=4,441,063 P=3,158,914 P=3,281,557 P=10,881,534Movements with P&L impact
Transfers:Transfer from Stage 1 to Stage 2 (259,998) 401,008 – 141,010Transfer from Stage 1 to Stage 3 (18,486) – 951,502 933,016Transfer from Stage 2 to Stage 1 24,677 (107,799) – (83,122)Transfer from Stage 2 to Stage 3 – (2,460,478) 2,627,237 166,759Transfer from Stage 3 to Stage 1 37 – (3,977) (3,940)Transfer from Stage 3 to Stage 2 – 150,926 (229,165) (78,239)
New financial assets originated * 1,316,388 1,923,874 578,642 3,818,904Changes in PDs / LGDs / EADs (843,891) 259,691 4,346,872 3,762,672Financial assets derecognized during the period (1,701,946) (173,837) (492,932) (2,368,715)Fx and other movements (48,112) (11,112) (440) (59,664)
Total net P&L charge during the period (1,531,331) (17,727) 7,777,739 6,228,681Other movements without P&L impact
Write-offs, foreclosures, and other movements 48,112 11,111 (6,220,037) (6,160,814)Total movements without P&L impact 48,112 11,111 (6,220,037) (6,160,814)
Loss allowance at December 31, 2021 P=2,957,844 P=3,152,298 P=4,839,259 P=10,949,401* Stage classification of new financial assets originated or purchased pertains to the stage as of end of year
Parent Company ECL Staging
Stage 1 Stage 2 Stage 3Consumer lending 12-month ECL Lifetime ECL Lifetime ECL TotalLoss allowance at January 1, 2021 P=214,195 P=110,481 P=1,051,455 P=1,376,131Movements with P&L impact
Transfers:Transfer from Stage 1 to Stage 2 (18,072) 46,141 – 28,069Transfer from Stage 1 to Stage 3 (3,071) – 89,672 86,601Transfer from Stage 2 to Stage 1 16,906 (26,398) – (9,492)Transfer from Stage 2 to Stage 3 – (15,563) 242,894 227,331Transfer from Stage 3 to Stage 1 2,560 – (32,061) (29,501)Transfer from Stage 3 to Stage 2 – 29,661 (335,225) (305,564)
New financial assets originated * 127,765 35,008 59,709 222,482Changes in PDs / LGDs / EADs 165,450 (1,094) 235,539 399,895Financial assets derecognized during the period (27,654) (23,850) (35,304) (86,808)Fx and other movements – – – –
Total net P&L charge during the period 263,884 43,905 225,224 533,013Other movements without P&L impact
Write-offs, foreclosures, and other movements – – (594,962) (594,962)Total movements without P&L impact – – (594,962) (594,962)
Loss allowance at December 31, 2021 P=478,079 P=154,386 P=681,717 P=1,314,182* Stage classification of new financial assets originated or purchased pertains to the stage as of end of year
Parent Company ECL Staging
Stage 1 Stage 2 Stage 3Trade-related lending 12-month ECL Lifetime ECL Lifetime ECL TotalLoss allowance at January 1, 2021 P=132,753 P=23,814 P=113,425 P=269,992Movements with P&L impact
Transfers:Transfer from Stage 1 to Stage 2 (8) 8 – –Transfer from Stage 1 to Stage 3 – – – –Transfer from Stage 2 to Stage 1 60 (99) (39)Transfer from Stage 2 to Stage 3 – (410) 23,794 23,384Transfer from Stage 3 to Stage 1 – – – –Transfer from Stage 3 to Stage 2 – – – –
New financial assets originated * 120,583 13,585 – 134,168Changes in PDs / LGDs / EADs (66) 388 25,700 26,022
(Forward)
199
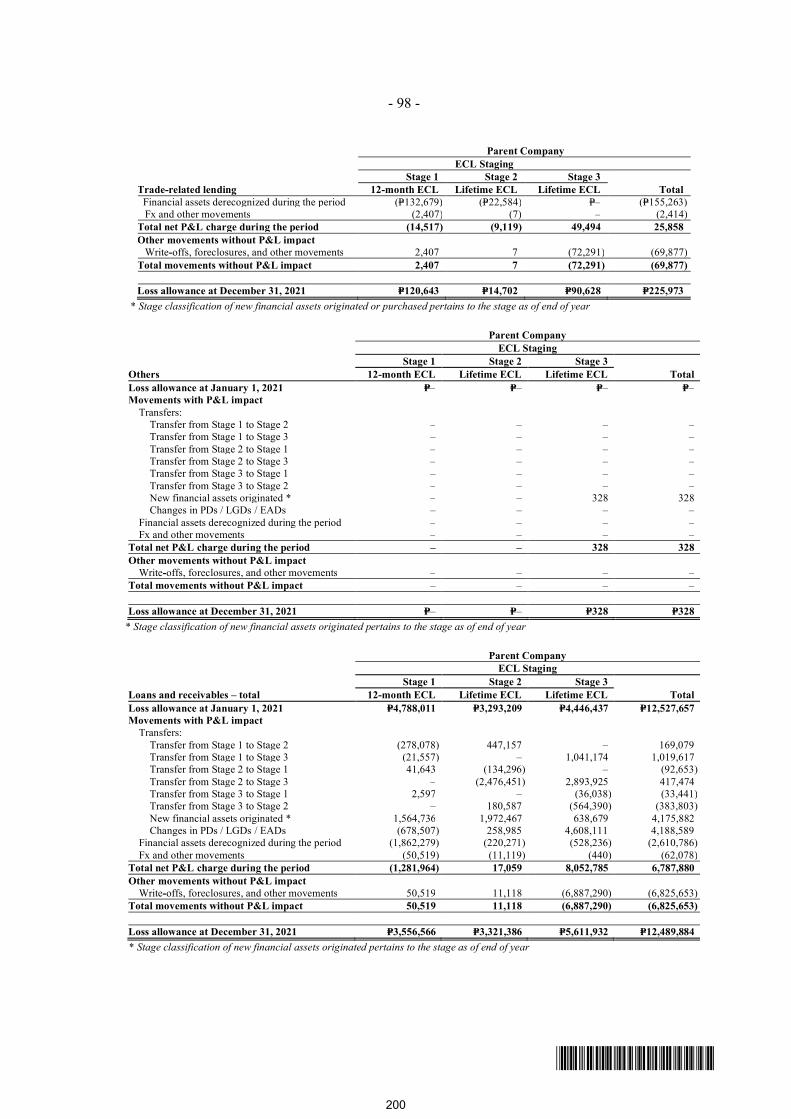
- 98 -
*SGVFS162381*
Parent Company ECL Staging
Stage 1 Stage 2 Stage 3Trade-related lending 12-month ECL Lifetime ECL Lifetime ECL Total
Financial assets derecognized during the period (P=132,679) (P=22,584) P=– (P=155,263)Fx and other movements (2,407) (7) – (2,414)
Total net P&L charge during the period (14,517) (9,119) 49,494 25,858Other movements without P&L impact
Write-offs, foreclosures, and other movements 2,407 7 (72,291) (69,877)Total movements without P&L impact 2,407 7 (72,291) (69,877)
Loss allowance at December 31, 2021 P=120,643 P=14,702 P=90,628 P=225,973* Stage classification of new financial assets originated or purchased pertains to the stage as of end of year
Parent CompanyECL Staging
Stage 1 Stage 2 Stage 3Others 12-month ECL Lifetime ECL Lifetime ECL TotalLoss allowance at January 1, 2021 P=– P=– P=– P=–Movements with P&L impact
Transfers:Transfer from Stage 1 to Stage 2 – – – –Transfer from Stage 1 to Stage 3 – – – –Transfer from Stage 2 to Stage 1 – – – –Transfer from Stage 2 to Stage 3 – – – –Transfer from Stage 3 to Stage 1 – – – –Transfer from Stage 3 to Stage 2 – – – –New financial assets originated * – – 328 328Changes in PDs / LGDs / EADs – – – –
Financial assets derecognized during the period – – – –Fx and other movements – – – –
Total net P&L charge during the period – – 328 328Other movements without P&L impact
Write-offs, foreclosures, and other movements – – – –Total movements without P&L impact – – – –
Loss allowance at December 31, 2021 P=– P=– P=328 P=328* Stage classification of new financial assets originated pertains to the stage as of end of year
Parent CompanyECL Staging
Stage 1 Stage 2 Stage 3Loans and receivables – total 12-month ECL Lifetime ECL Lifetime ECL TotalLoss allowance at January 1, 2021 P=4,788,011 P=3,293,209 P=4,446,437 P=12,527,657Movements with P&L impact
Transfers:Transfer from Stage 1 to Stage 2 (278,078) 447,157 – 169,079Transfer from Stage 1 to Stage 3 (21,557) – 1,041,174 1,019,617Transfer from Stage 2 to Stage 1 41,643 (134,296) – (92,653)Transfer from Stage 2 to Stage 3 – (2,476,451) 2,893,925 417,474Transfer from Stage 3 to Stage 1 2,597 – (36,038) (33,441)Transfer from Stage 3 to Stage 2 – 180,587 (564,390) (383,803)New financial assets originated * 1,564,736 1,972,467 638,679 4,175,882Changes in PDs / LGDs / EADs (678,507) 258,985 4,608,111 4,188,589
Financial assets derecognized during the period (1,862,279) (220,271) (528,236) (2,610,786)Fx and other movements (50,519) (11,119) (440) (62,078)
Total net P&L charge during the period (1,281,964) 17,059 8,052,785 6,787,880Other movements without P&L impact
Write-offs, foreclosures, and other movements 50,519 11,118 (6,887,290) (6,825,653)Total movements without P&L impact 50,519 11,118 (6,887,290) (6,825,653)
Loss allowance at December 31, 2021 P=3,556,566 P=3,321,386 P=5,611,932 P=12,489,884* Stage classification of new financial assets originated pertains to the stage as of end of year
200
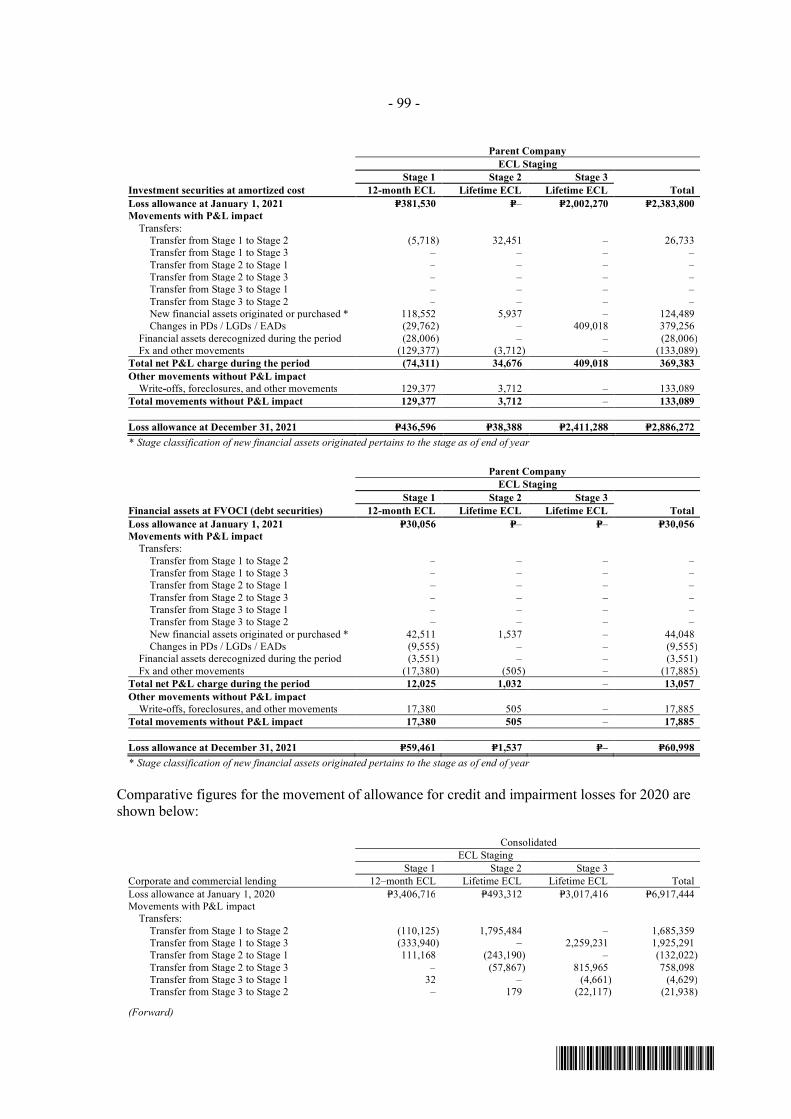
- 99 -
*SGVFS162381*
Parent CompanyECL Staging
Stage 1 Stage 2 Stage 3Investment securities at amortized cost 12-month ECL Lifetime ECL Lifetime ECL TotalLoss allowance at January 1, 2021 P=381,530 P=– P=2,002,270 P=2,383,800Movements with P&L impact
Transfers:Transfer from Stage 1 to Stage 2 (5,718) 32,451 – 26,733Transfer from Stage 1 to Stage 3 – – – –Transfer from Stage 2 to Stage 1 – – – –Transfer from Stage 2 to Stage 3 – – – –Transfer from Stage 3 to Stage 1 – – – –Transfer from Stage 3 to Stage 2 – – – –New financial assets originated or purchased * 118,552 5,937 – 124,489Changes in PDs / LGDs / EADs (29,762) – 409,018 379,256
Financial assets derecognized during the period (28,006) – – (28,006)Fx and other movements (129,377) (3,712) – (133,089)
Total net P&L charge during the period (74,311) 34,676 409,018 369,383Other movements without P&L impact
Write-offs, foreclosures, and other movements 129,377 3,712 – 133,089Total movements without P&L impact 129,377 3,712 – 133,089
Loss allowance at December 31, 2021 P=436,596 P=38,388 P=2,411,288 P=2,886,272* Stage classification of new financial assets originated pertains to the stage as of end of year
Parent CompanyECL Staging
Stage 1 Stage 2 Stage 3Financial assets at FVOCI (debt securities) 12-month ECL Lifetime ECL Lifetime ECL TotalLoss allowance at January 1, 2021 P=30,056 P=– P=– P=30,056Movements with P&L impact
Transfers:Transfer from Stage 1 to Stage 2 – – – –Transfer from Stage 1 to Stage 3 – – – –Transfer from Stage 2 to Stage 1 – – – –Transfer from Stage 2 to Stage 3 – – – –Transfer from Stage 3 to Stage 1 – – – –Transfer from Stage 3 to Stage 2 – – – –New financial assets originated or purchased * 42,511 1,537 – 44,048Changes in PDs / LGDs / EADs (9,555) – – (9,555)
Financial assets derecognized during the period (3,551) – – (3,551)Fx and other movements (17,380) (505) – (17,885)
Total net P&L charge during the period 12,025 1,032 – 13,057Other movements without P&L impact
Write-offs, foreclosures, and other movements 17,380 505 – 17,885Total movements without P&L impact 17,380 505 – 17,885
Loss allowance at December 31, 2021 P=59,461 P=1,537 P=– P=60,998* Stage classification of new financial assets originated pertains to the stage as of end of year
Comparative figures for the movement of allowance for credit and impairment losses for 2020 areshown below:
Consolidated ECL Staging
Stage 1 Stage 2 Stage 3Corporate and commercial lending 12–month ECL Lifetime ECL Lifetime ECL TotalLoss allowance at January 1, 2020 P=3,406,716 P=493,312 P=3,017,416 P=6,917,444Movements with P&L impact
Transfers:Transfer from Stage 1 to Stage 2 (110,125) 1,795,484 – 1,685,359Transfer from Stage 1 to Stage 3 (333,940) – 2,259,231 1,925,291Transfer from Stage 2 to Stage 1 111,168 (243,190) – (132,022)Transfer from Stage 2 to Stage 3 – (57,867) 815,965 758,098Transfer from Stage 3 to Stage 1 32 – (4,661) (4,629)Transfer from Stage 3 to Stage 2 – 179 (22,117) (21,938)
(Forward)
201
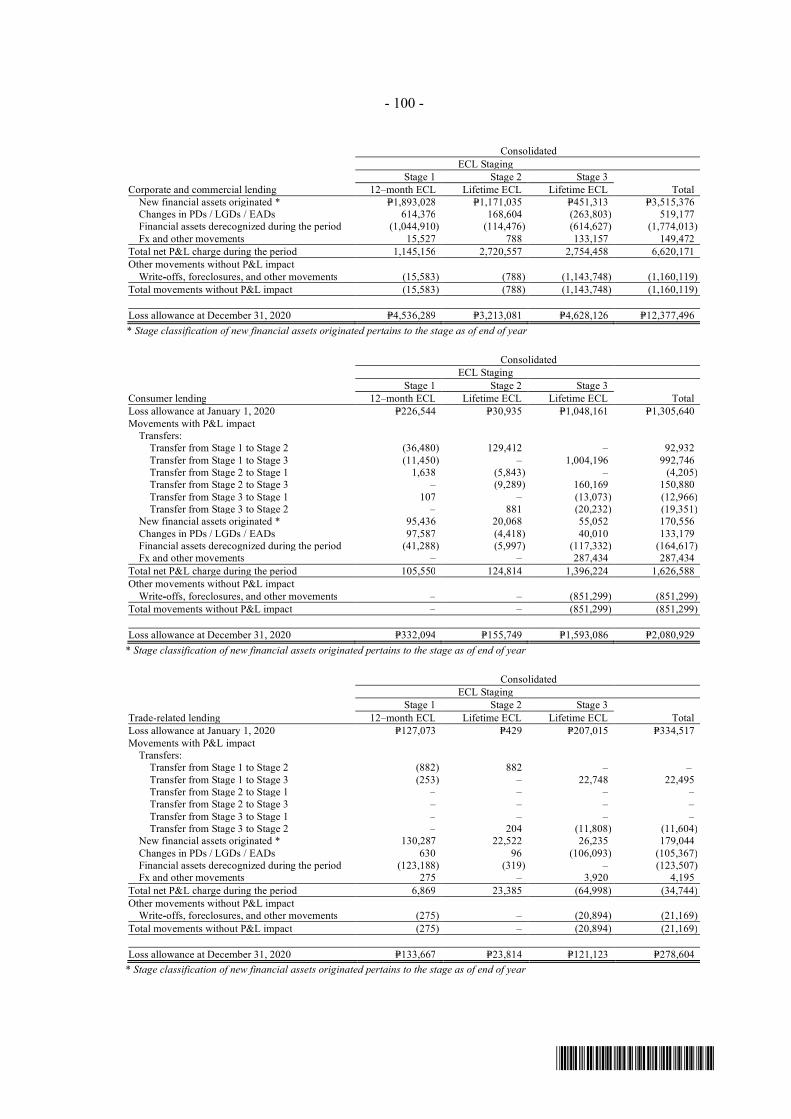
- 100 -
*SGVFS162381*
ConsolidatedECL Staging
Stage 1 Stage 2 Stage 3Corporate and commercial lending 12–month ECL Lifetime ECL Lifetime ECL Total
New financial assets originated * P=1,893,028 P=1,171,035 P=451,313 P=3,515,376Changes in PDs / LGDs / EADs 614,376 168,604 (263,803) 519,177Financial assets derecognized during the period (1,044,910) (114,476) (614,627) (1,774,013)Fx and other movements 15,527 788 133,157 149,472
Total net P&L charge during the period 1,145,156 2,720,557 2,754,458 6,620,171Other movements without P&L impact
Write-offs, foreclosures, and other movements (15,583) (788) (1,143,748) (1,160,119)Total movements without P&L impact (15,583) (788) (1,143,748) (1,160,119)
Loss allowance at December 31, 2020 P=4,536,289 P=3,213,081 P=4,628,126 P=12,377,496* Stage classification of new financial assets originated pertains to the stage as of end of year
Consolidated ECL Staging
Stage 1 Stage 2 Stage 3Consumer lending 12–month ECL Lifetime ECL Lifetime ECL TotalLoss allowance at January 1, 2020 P=226,544 P=30,935 P=1,048,161 P=1,305,640Movements with P&L impact
Transfers:Transfer from Stage 1 to Stage 2 (36,480) 129,412 – 92,932Transfer from Stage 1 to Stage 3 (11,450) – 1,004,196 992,746Transfer from Stage 2 to Stage 1 1,638 (5,843) – (4,205)Transfer from Stage 2 to Stage 3 – (9,289) 160,169 150,880Transfer from Stage 3 to Stage 1 107 – (13,073) (12,966)Transfer from Stage 3 to Stage 2 – 881 (20,232) (19,351)
New financial assets originated * 95,436 20,068 55,052 170,556Changes in PDs / LGDs / EADs 97,587 (4,418) 40,010 133,179Financial assets derecognized during the period (41,288) (5,997) (117,332) (164,617)Fx and other movements – – 287,434 287,434
Total net P&L charge during the period 105,550 124,814 1,396,224 1,626,588Other movements without P&L impact
Write-offs, foreclosures, and other movements – – (851,299) (851,299)Total movements without P&L impact – – (851,299) (851,299)
Loss allowance at December 31, 2020 P=332,094 P=155,749 P=1,593,086 P=2,080,929 * Stage classification of new financial assets originated pertains to the stage as of end of year
ConsolidatedECL Staging
Stage 1 Stage 2 Stage 3Trade-related lending 12–month ECL Lifetime ECL Lifetime ECL TotalLoss allowance at January 1, 2020 P=127,073 P=429 P=207,015 P=334,517Movements with P&L impact
Transfers:Transfer from Stage 1 to Stage 2 (882) 882 – –Transfer from Stage 1 to Stage 3 (253) – 22,748 22,495Transfer from Stage 2 to Stage 1 – – – –Transfer from Stage 2 to Stage 3 – – – –Transfer from Stage 3 to Stage 1 – – – –Transfer from Stage 3 to Stage 2 – 204 (11,808) (11,604)
New financial assets originated * 130,287 22,522 26,235 179,044Changes in PDs / LGDs / EADs 630 96 (106,093) (105,367)Financial assets derecognized during the period (123,188) (319) – (123,507)Fx and other movements 275 – 3,920 4,195
Total net P&L charge during the period 6,869 23,385 (64,998) (34,744)Other movements without P&L impact
Write-offs, foreclosures, and other movements (275) – (20,894) (21,169)Total movements without P&L impact (275) – (20,894) (21,169)
Loss allowance at December 31, 2020 P=133,667 P=23,814 P=121,123 P=278,604 * Stage classification of new financial assets originated pertains to the stage as of end of year
202
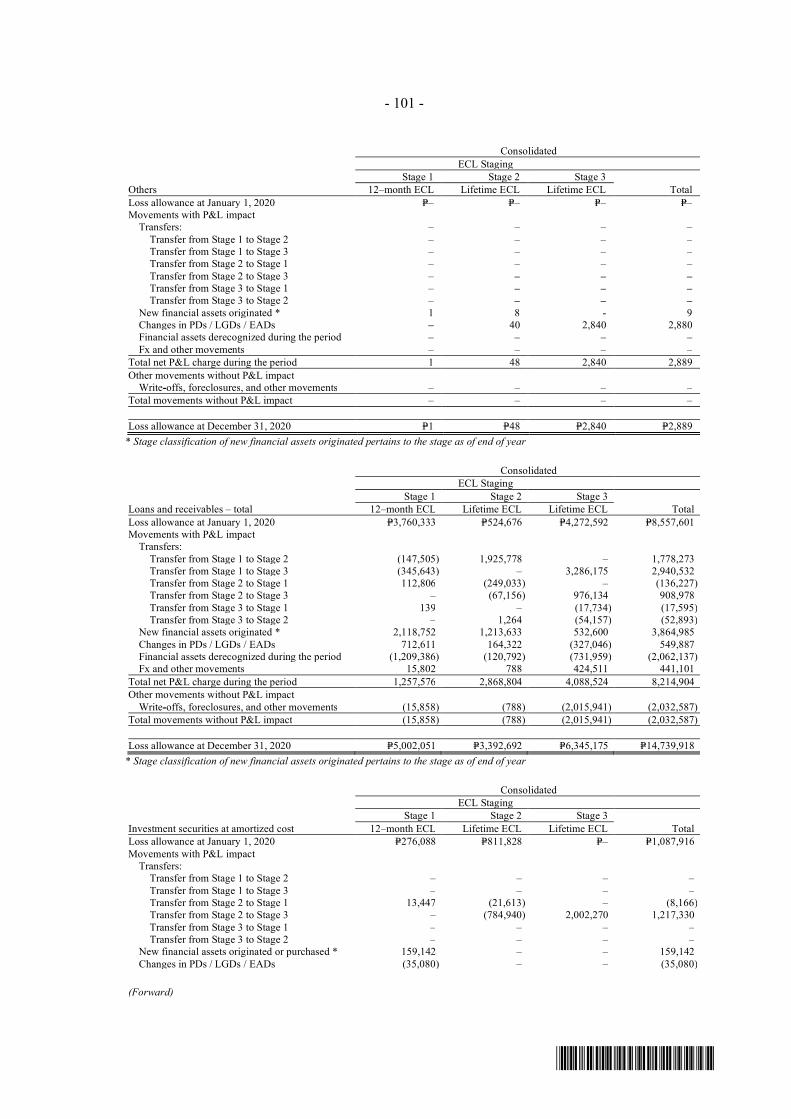
- 101 -
*SGVFS162381*
ConsolidatedECL Staging
Stage 1 Stage 2 Stage 3Others 12–month ECL Lifetime ECL Lifetime ECL TotalLoss allowance at January 1, 2020 P=– P=– P=– P=–Movements with P&L impact
Transfers: – – – –Transfer from Stage 1 to Stage 2 – – – –Transfer from Stage 1 to Stage 3 – – – –Transfer from Stage 2 to Stage 1 – – – –Transfer from Stage 2 to Stage 3 – – – –Transfer from Stage 3 to Stage 1 – – – –Transfer from Stage 3 to Stage 2 – – – –
New financial assets originated * 1 8 - 9Changes in PDs / LGDs / EADs – 40 2,840 2,880Financial assets derecognized during the period – – – –Fx and other movements – – – –
Total net P&L charge during the period 1 48 2,840 2,889Other movements without P&L impact
Write-offs, foreclosures, and other movements – – – –Total movements without P&L impact – – – –
Loss allowance at December 31, 2020 P=1 P=48 P=2,840 P=2,889 * Stage classification of new financial assets originated pertains to the stage as of end of year
Consolidated ECL Staging
Stage 1 Stage 2 Stage 3Loans and receivables – total 12–month ECL Lifetime ECL Lifetime ECL TotalLoss allowance at January 1, 2020 P=3,760,333 P=524,676 P=4,272,592 P=8,557,601Movements with P&L impact
Transfers:Transfer from Stage 1 to Stage 2 (147,505) 1,925,778 – 1,778,273Transfer from Stage 1 to Stage 3 (345,643) – 3,286,175 2,940,532Transfer from Stage 2 to Stage 1 112,806 (249,033) – (136,227)Transfer from Stage 2 to Stage 3 – (67,156) 976,134 908,978Transfer from Stage 3 to Stage 1 139 – (17,734) (17,595)Transfer from Stage 3 to Stage 2 – 1,264 (54,157) (52,893)
New financial assets originated * 2,118,752 1,213,633 532,600 3,864,985Changes in PDs / LGDs / EADs 712,611 164,322 (327,046) 549,887Financial assets derecognized during the period (1,209,386) (120,792) (731,959) (2,062,137)Fx and other movements 15,802 788 424,511 441,101
Total net P&L charge during the period 1,257,576 2,868,804 4,088,524 8,214,904Other movements without P&L impact
Write-offs, foreclosures, and other movements (15,858) (788) (2,015,941) (2,032,587)Total movements without P&L impact (15,858) (788) (2,015,941) (2,032,587)
Loss allowance at December 31, 2020 P=5,002,051 P=3,392,692 P=6,345,175 P=14,739,918 * Stage classification of new financial assets originated pertains to the stage as of end of year
ConsolidatedECL Staging
Stage 1 Stage 2 Stage 3Investment securities at amortized cost 12–month ECL Lifetime ECL Lifetime ECL TotalLoss allowance at January 1, 2020 P=276,088 P=811,828 P=– P=1,087,916Movements with P&L impact
Transfers:Transfer from Stage 1 to Stage 2 – – – –Transfer from Stage 1 to Stage 3 – – – –Transfer from Stage 2 to Stage 1 13,447 (21,613) – (8,166)Transfer from Stage 2 to Stage 3 – (784,940) 2,002,270 1,217,330Transfer from Stage 3 to Stage 1 – – – –Transfer from Stage 3 to Stage 2 – – – –
New financial assets originated or purchased * 159,142 – – 159,142Changes in PDs / LGDs / EADs (35,080) – – (35,080)
(Forward)
203
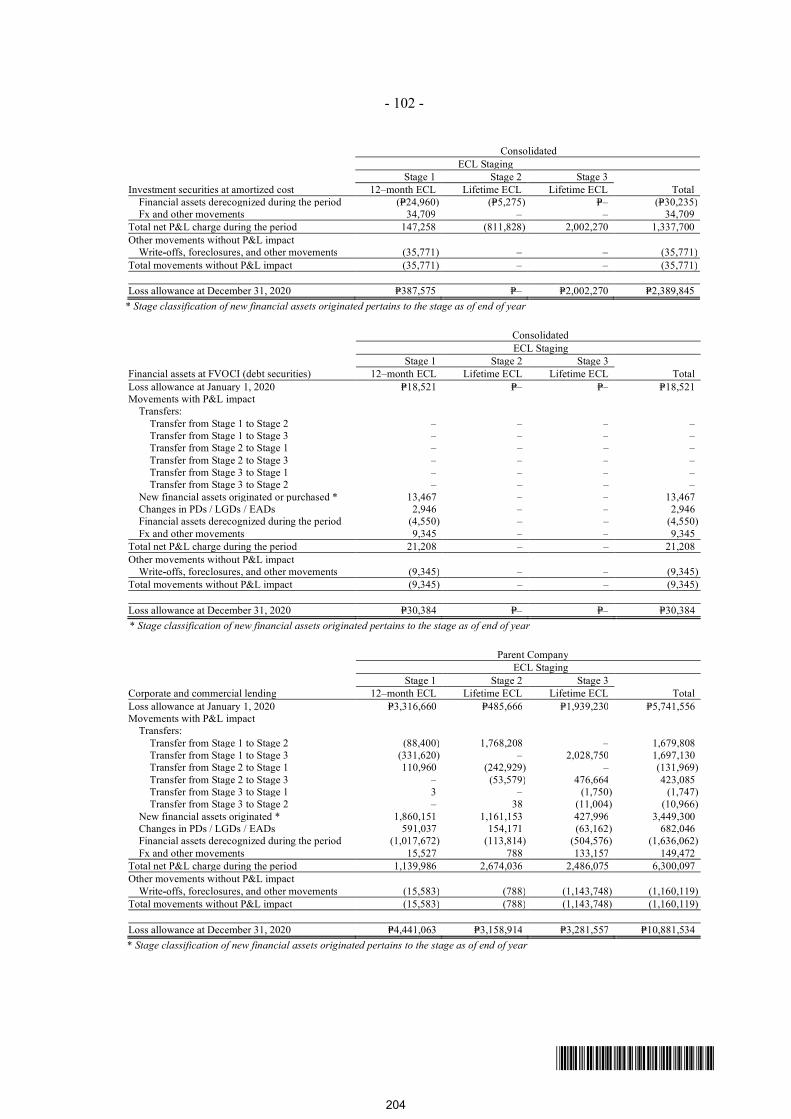
- 102 -
*SGVFS162381*
ConsolidatedECL Staging
Stage 1 Stage 2 Stage 3Investment securities at amortized cost 12–month ECL Lifetime ECL Lifetime ECL Total
Financial assets derecognized during the period (P=24,960) (P=5,275) P=– (P=30,235)Fx and other movements 34,709 – – 34,709
Total net P&L charge during the period 147,258 (811,828) 2,002,270 1,337,700Other movements without P&L impact
Write-offs, foreclosures, and other movements (35,771) – – (35,771)Total movements without P&L impact (35,771) – – (35,771)
Loss allowance at December 31, 2020 P=387,575 P=– P=2,002,270 P=2,389,845* Stage classification of new financial assets originated pertains to the stage as of end of year
ConsolidatedECL Staging
Stage 1 Stage 2 Stage 3Financial assets at FVOCI (debt securities) 12–month ECL Lifetime ECL Lifetime ECL TotalLoss allowance at January 1, 2020 P=18,521 P=– P=– P=18,521Movements with P&L impact
Transfers:Transfer from Stage 1 to Stage 2 – – – –Transfer from Stage 1 to Stage 3 – – – –Transfer from Stage 2 to Stage 1 – – – –Transfer from Stage 2 to Stage 3 – – – –Transfer from Stage 3 to Stage 1 – – – –Transfer from Stage 3 to Stage 2 – – – –
New financial assets originated or purchased * 13,467 – – 13,467Changes in PDs / LGDs / EADs 2,946 – – 2,946Financial assets derecognized during the period (4,550) – – (4,550)Fx and other movements 9,345 – – 9,345
Total net P&L charge during the period 21,208 – – 21,208Other movements without P&L impact
Write-offs, foreclosures, and other movements (9,345) – – (9,345)Total movements without P&L impact (9,345) – – (9,345)
Loss allowance at December 31, 2020 P=30,384 P=– P=– P=30,384* Stage classification of new financial assets originated pertains to the stage as of end of year
Parent CompanyECL Staging
Stage 1 Stage 2 Stage 3Corporate and commercial lending 12–month ECL Lifetime ECL Lifetime ECL TotalLoss allowance at January 1, 2020 P=3,316,660 P=485,666 P=1,939,230 P=5,741,556Movements with P&L impact
Transfers:Transfer from Stage 1 to Stage 2 (88,400) 1,768,208 – 1,679,808Transfer from Stage 1 to Stage 3 (331,620) – 2,028,750 1,697,130Transfer from Stage 2 to Stage 1 110,960 (242,929) – (131,969)Transfer from Stage 2 to Stage 3 – (53,579) 476,664 423,085Transfer from Stage 3 to Stage 1 3 – (1,750) (1,747)Transfer from Stage 3 to Stage 2 – 38 (11,004) (10,966)
New financial assets originated * 1,860,151 1,161,153 427,996 3,449,300Changes in PDs / LGDs / EADs 591,037 154,171 (63,162) 682,046Financial assets derecognized during the period (1,017,672) (113,814) (504,576) (1,636,062)Fx and other movements 15,527 788 133,157 149,472
Total net P&L charge during the period 1,139,986 2,674,036 2,486,075 6,300,097Other movements without P&L impact
Write-offs, foreclosures, and other movements (15,583) (788) (1,143,748) (1,160,119)Total movements without P&L impact (15,583) (788) (1,143,748) (1,160,119)
Loss allowance at December 31, 2020 P=4,441,063 P=3,158,914 P=3,281,557 P=10,881,534* Stage classification of new financial assets originated pertains to the stage as of end of year
204
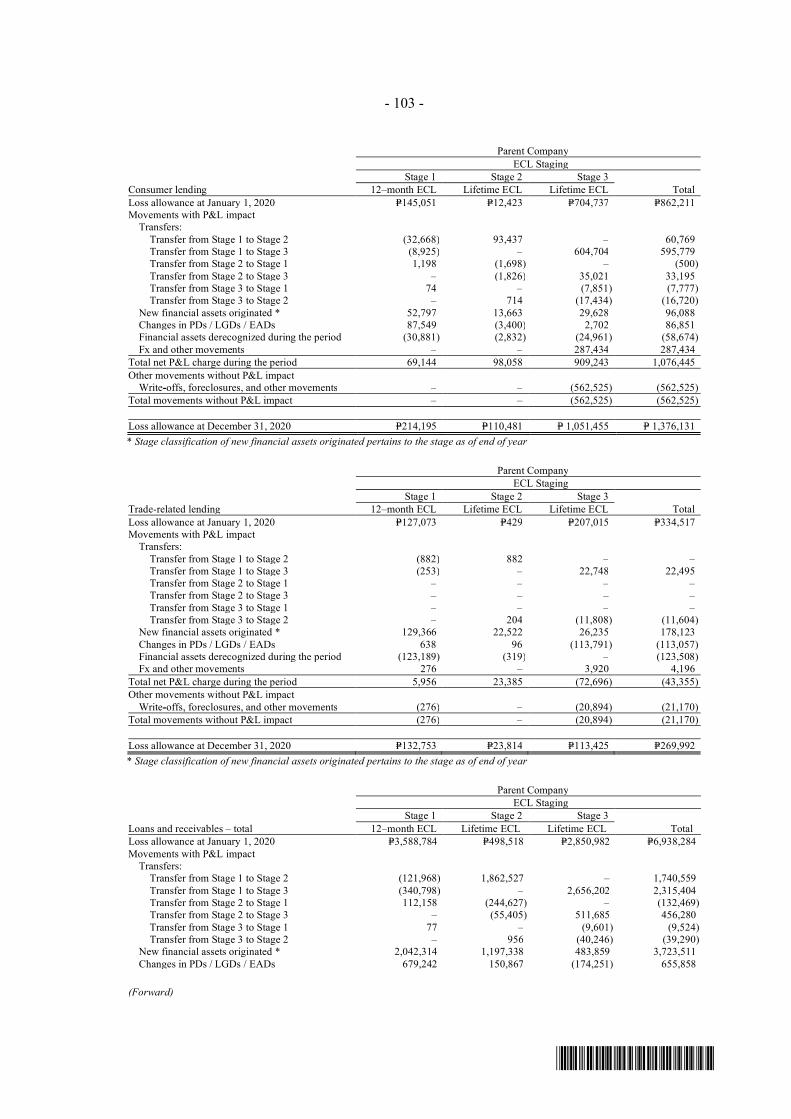
- 103 -
*SGVFS162381*
Parent CompanyECL Staging
Stage 1 Stage 2 Stage 3Consumer lending 12–month ECL Lifetime ECL Lifetime ECL TotalLoss allowance at January 1, 2020 P=145,051 P=12,423 P=704,737 P=862,211Movements with P&L impact
Transfers:Transfer from Stage 1 to Stage 2 (32,668) 93,437 – 60,769Transfer from Stage 1 to Stage 3 (8,925) – 604,704 595,779Transfer from Stage 2 to Stage 1 1,198 (1,698) – (500)Transfer from Stage 2 to Stage 3 – (1,826) 35,021 33,195Transfer from Stage 3 to Stage 1 74 – (7,851) (7,777)Transfer from Stage 3 to Stage 2 – 714 (17,434) (16,720)
New financial assets originated * 52,797 13,663 29,628 96,088Changes in PDs / LGDs / EADs 87,549 (3,400) 2,702 86,851Financial assets derecognized during the period (30,881) (2,832) (24,961) (58,674)Fx and other movements – – 287,434 287,434
Total net P&L charge during the period 69,144 98,058 909,243 1,076,445Other movements without P&L impact
Write-offs, foreclosures, and other movements – – (562,525) (562,525)Total movements without P&L impact – – (562,525) (562,525)
Loss allowance at December 31, 2020 P=214,195 P=110,481 P= 1,051,455 P= 1,376,131* Stage classification of new financial assets originated pertains to the stage as of end of year
Parent CompanyECL Staging
Stage 1 Stage 2 Stage 3Trade-related lending 12–month ECL Lifetime ECL Lifetime ECL TotalLoss allowance at January 1, 2020 P=127,073 P=429 P=207,015 P=334,517Movements with P&L impact
Transfers:Transfer from Stage 1 to Stage 2 (882) 882 – –Transfer from Stage 1 to Stage 3 (253) – 22,748 22,495Transfer from Stage 2 to Stage 1 – – – –Transfer from Stage 2 to Stage 3 – – – –Transfer from Stage 3 to Stage 1 – – – –Transfer from Stage 3 to Stage 2 – 204 (11,808) (11,604)
New financial assets originated * 129,366 22,522 26,235 178,123Changes in PDs / LGDs / EADs 638 96 (113,791) (113,057)Financial assets derecognized during the period (123,189) (319) – (123,508)Fx and other movements 276 – 3,920 4,196
Total net P&L charge during the period 5,956 23,385 (72,696) (43,355)Other movements without P&L impact
Write-offs, foreclosures, and other movements (276) – (20,894) (21,170)Total movements without P&L impact (276) – (20,894) (21,170)
Loss allowance at December 31, 2020 P=132,753 P=23,814 P=113,425 P=269,992* Stage classification of new financial assets originated pertains to the stage as of end of year
Parent CompanyECL Staging
Stage 1 Stage 2 Stage 3Loans and receivables – total 12–month ECL Lifetime ECL Lifetime ECL TotalLoss allowance at January 1, 2020 P=3,588,784 P=498,518 P=2,850,982 P=6,938,284Movements with P&L impact
Transfers:Transfer from Stage 1 to Stage 2 (121,968) 1,862,527 – 1,740,559Transfer from Stage 1 to Stage 3 (340,798) – 2,656,202 2,315,404Transfer from Stage 2 to Stage 1 112,158 (244,627) – (132,469)Transfer from Stage 2 to Stage 3 – (55,405) 511,685 456,280Transfer from Stage 3 to Stage 1 77 – (9,601) (9,524)Transfer from Stage 3 to Stage 2 – 956 (40,246) (39,290)
New financial assets originated * 2,042,314 1,197,338 483,859 3,723,511Changes in PDs / LGDs / EADs 679,242 150,867 (174,251) 655,858
(Forward)
205
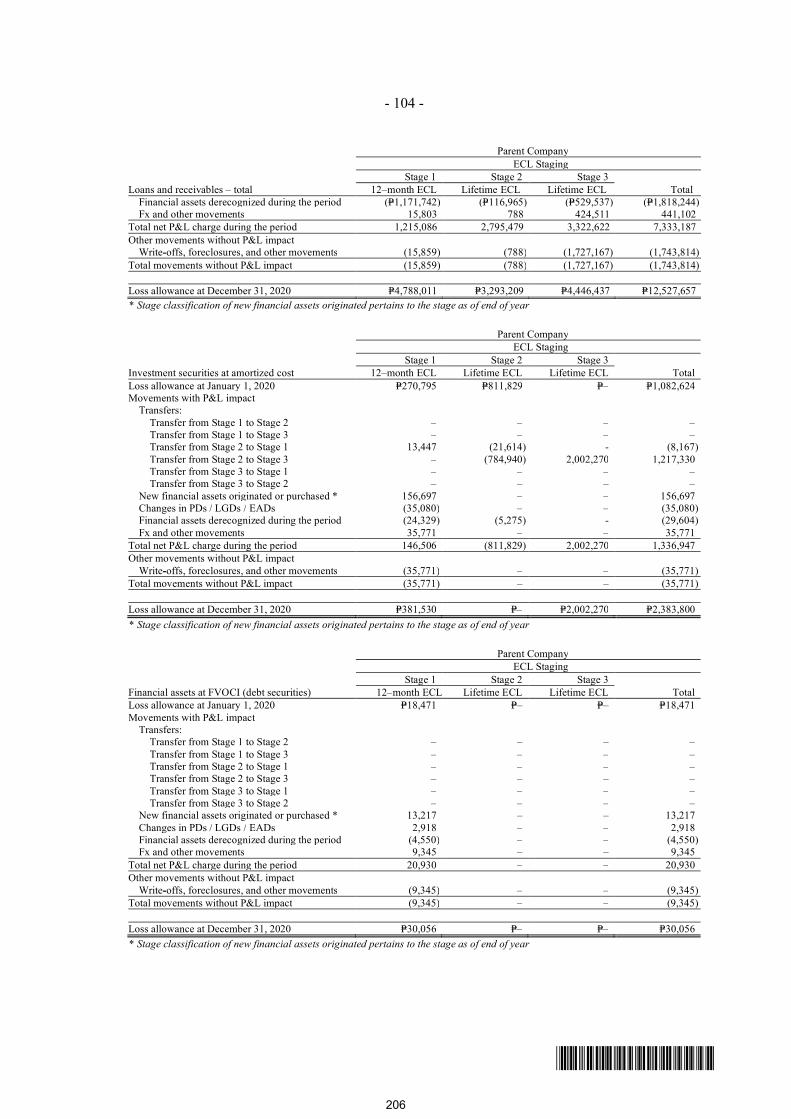
- 104 -
*SGVFS162381*
Parent CompanyECL Staging
Stage 1 Stage 2 Stage 3Loans and receivables – total 12–month ECL Lifetime ECL Lifetime ECL Total
Financial assets derecognized during the period (P=1,171,742) (P=116,965) (P=529,537) (P=1,818,244)Fx and other movements 15,803 788 424,511 441,102
Total net P&L charge during the period 1,215,086 2,795,479 3,322,622 7,333,187Other movements without P&L impact
Write-offs, foreclosures, and other movements (15,859) (788) (1,727,167) (1,743,814)Total movements without P&L impact (15,859) (788) (1,727,167) (1,743,814)
Loss allowance at December 31, 2020 P=4,788,011 P=3,293,209 P=4,446,437 P=12,527,657* Stage classification of new financial assets originated pertains to the stage as of end of year
Parent CompanyECL Staging
Stage 1 Stage 2 Stage 3Investment securities at amortized cost 12–month ECL Lifetime ECL Lifetime ECL TotalLoss allowance at January 1, 2020 P=270,795 P=811,829 P=– P=1,082,624Movements with P&L impact
Transfers:Transfer from Stage 1 to Stage 2 – – – –Transfer from Stage 1 to Stage 3 – – – –Transfer from Stage 2 to Stage 1 13,447 (21,614) - (8,167)Transfer from Stage 2 to Stage 3 – (784,940) 2,002,270 1,217,330Transfer from Stage 3 to Stage 1 – – – –Transfer from Stage 3 to Stage 2 – – – –
New financial assets originated or purchased * 156,697 – – 156,697Changes in PDs / LGDs / EADs (35,080) – – (35,080)Financial assets derecognized during the period (24,329) (5,275) - (29,604)Fx and other movements 35,771 – – 35,771
Total net P&L charge during the period 146,506 (811,829) 2,002,270 1,336,947Other movements without P&L impact
Write-offs, foreclosures, and other movements (35,771) – – (35,771)Total movements without P&L impact (35,771) – – (35,771)
Loss allowance at December 31, 2020 P=381,530 P=– P=2,002,270 P=2,383,800* Stage classification of new financial assets originated pertains to the stage as of end of year
Parent CompanyECL Staging
Stage 1 Stage 2 Stage 3Financial assets at FVOCI (debt securities) 12–month ECL Lifetime ECL Lifetime ECL TotalLoss allowance at January 1, 2020 P=18,471 P=– P=– P=18,471Movements with P&L impact
Transfers:Transfer from Stage 1 to Stage 2 – – – –Transfer from Stage 1 to Stage 3 – – – –Transfer from Stage 2 to Stage 1 – – – –Transfer from Stage 2 to Stage 3 – – – –Transfer from Stage 3 to Stage 1 – – – –Transfer from Stage 3 to Stage 2 – – – –
New financial assets originated or purchased * 13,217 – – 13,217Changes in PDs / LGDs / EADs 2,918 – – 2,918Financial assets derecognized during the period (4,550) – – (4,550)Fx and other movements 9,345 – – 9,345
Total net P&L charge during the period 20,930 – – 20,930Other movements without P&L impact
Write-offs, foreclosures, and other movements (9,345) – – (9,345)Total movements without P&L impact (9,345) – – (9,345)
Loss allowance at December 31, 2020 P=30,056 P=– P=– P=30,056* Stage classification of new financial assets originated pertains to the stage as of end of year
206
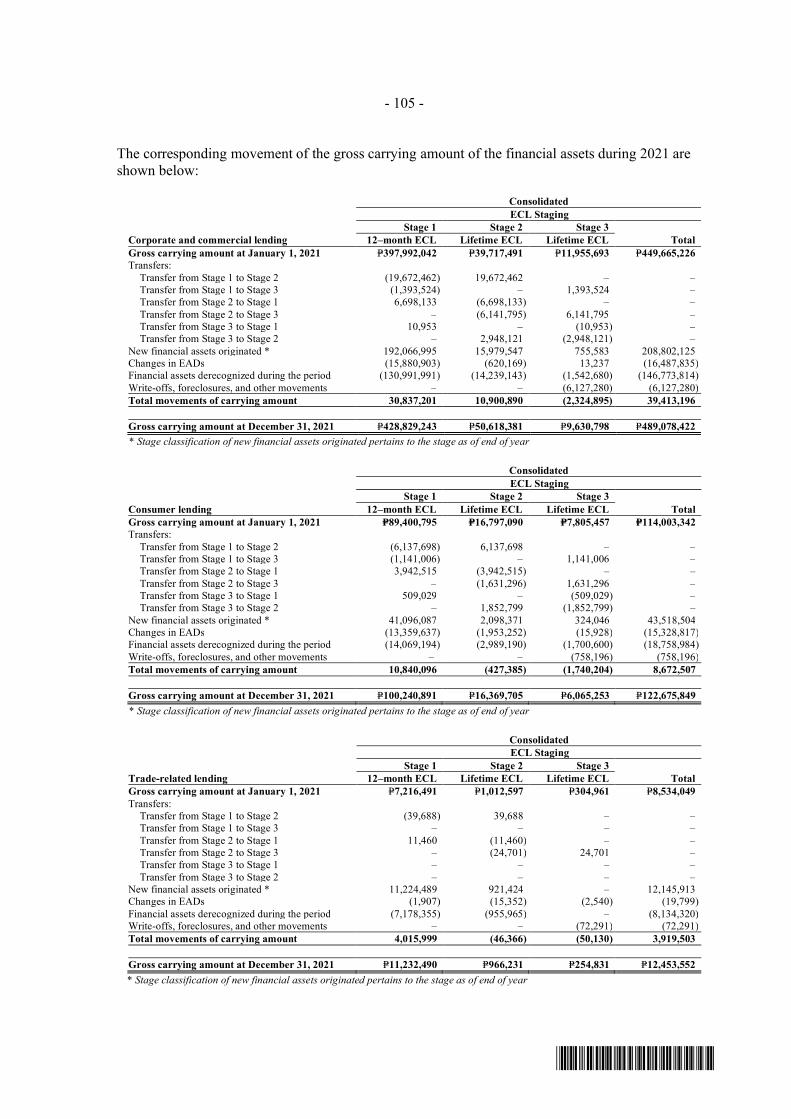
- 105 -
*SGVFS162381*
The corresponding movement of the gross carrying amount of the financial assets during 2021 areshown below:
ConsolidatedECL Staging
Stage 1 Stage 2 Stage 3Corporate and commercial lending 12–month ECL Lifetime ECL Lifetime ECL TotalGross carrying amount at January 1, 2021 P=397,992,042 P=39,717,491 P=11,955,693 P=449,665,226Transfers:
Transfer from Stage 1 to Stage 2 (19,672,462) 19,672,462 – –Transfer from Stage 1 to Stage 3 (1,393,524) – 1,393,524 –Transfer from Stage 2 to Stage 1 6,698,133 (6,698,133) – –Transfer from Stage 2 to Stage 3 – (6,141,795) 6,141,795 –Transfer from Stage 3 to Stage 1 10,953 – (10,953) –Transfer from Stage 3 to Stage 2 – 2,948,121 (2,948,121) –
New financial assets originated * 192,066,995 15,979,547 755,583 208,802,125Changes in EADs (15,880,903) (620,169) 13,237 (16,487,835)Financial assets derecognized during the period (130,991,991) (14,239,143) (1,542,680) (146,773,814)Write-offs, foreclosures, and other movements – – (6,127,280) (6,127,280)Total movements of carrying amount 30,837,201 10,900,890 (2,324,895) 39,413,196
Gross carrying amount at December 31, 2021 P=428,829,243 P=50,618,381 P=9,630,798 P=489,078,422* Stage classification of new financial assets originated pertains to the stage as of end of year
ConsolidatedECL Staging
Stage 1 Stage 2 Stage 3Consumer lending 12–month ECL Lifetime ECL Lifetime ECL TotalGross carrying amount at January 1, 2021 P=89,400,795 P=16,797,090 P=7,805,457 P=114,003,342Transfers:
Transfer from Stage 1 to Stage 2 (6,137,698) 6,137,698 – –Transfer from Stage 1 to Stage 3 (1,141,006) – 1,141,006 –Transfer from Stage 2 to Stage 1 3,942,515 (3,942,515) – –Transfer from Stage 2 to Stage 3 – (1,631,296) 1,631,296 –Transfer from Stage 3 to Stage 1 509,029 – (509,029) –Transfer from Stage 3 to Stage 2 – 1,852,799 (1,852,799) –
New financial assets originated * 41,096,087 2,098,371 324,046 43,518,504Changes in EADs (13,359,637) (1,953,252) (15,928) (15,328,817)Financial assets derecognized during the period (14,069,194) (2,989,190) (1,700,600) (18,758,984)Write-offs, foreclosures, and other movements – – (758,196) (758,196)Total movements of carrying amount 10,840,096 (427,385) (1,740,204) 8,672,507
Gross carrying amount at December 31, 2021 P=100,240,891 P=16,369,705 P=6,065,253 P=122,675,849* Stage classification of new financial assets originated pertains to the stage as of end of year
ConsolidatedECL Staging
Stage 1 Stage 2 Stage 3Trade-related lending 12–month ECL Lifetime ECL Lifetime ECL TotalGross carrying amount at January 1, 2021 P=7,216,491 P=1,012,597 P=304,961 P=8,534,049Transfers:
Transfer from Stage 1 to Stage 2 (39,688) 39,688 – –Transfer from Stage 1 to Stage 3 – – – –Transfer from Stage 2 to Stage 1 11,460 (11,460) – –Transfer from Stage 2 to Stage 3 – (24,701) 24,701 –Transfer from Stage 3 to Stage 1 – – – –Transfer from Stage 3 to Stage 2 – – – –
New financial assets originated * 11,224,489 921,424 – 12,145,913Changes in EADs (1,907) (15,352) (2,540) (19,799)Financial assets derecognized during the period (7,178,355) (955,965) – (8,134,320)Write-offs, foreclosures, and other movements – – (72,291) (72,291)Total movements of carrying amount 4,015,999 (46,366) (50,130) 3,919,503
Gross carrying amount at December 31, 2021 P=11,232,490 P=966,231 P=254,831 P=12,453,552* Stage classification of new financial assets originated pertains to the stage as of end of year
207
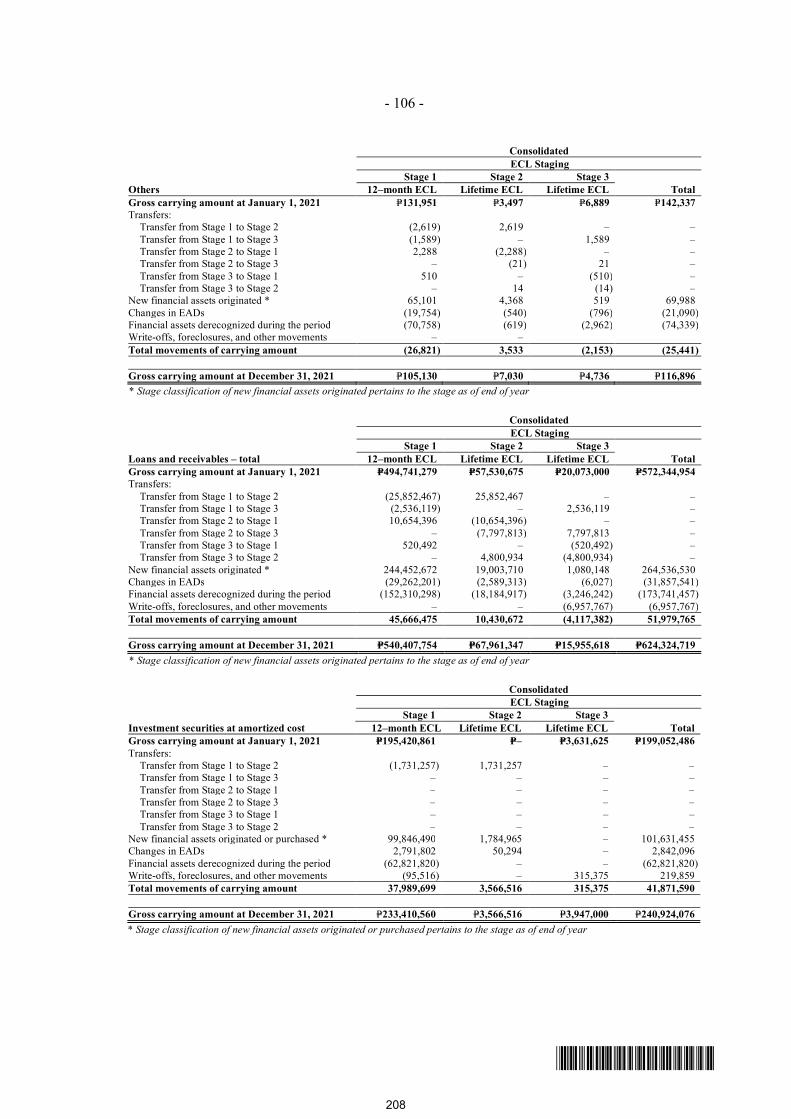
- 106 -
*SGVFS162381*
ConsolidatedECL Staging
Stage 1 Stage 2 Stage 3Others 12–month ECL Lifetime ECL Lifetime ECL TotalGross carrying amount at January 1, 2021 P=131,951 P=3,497 P=6,889 P=142,337Transfers:
Transfer from Stage 1 to Stage 2 (2,619) 2,619 – –Transfer from Stage 1 to Stage 3 (1,589) – 1,589 –Transfer from Stage 2 to Stage 1 2,288 (2,288) – –Transfer from Stage 2 to Stage 3 – (21) 21 –Transfer from Stage 3 to Stage 1 510 – (510) –Transfer from Stage 3 to Stage 2 – 14 (14) –
New financial assets originated * 65,101 4,368 519 69,988Changes in EADs (19,754) (540) (796) (21,090)Financial assets derecognized during the period (70,758) (619) (2,962) (74,339)Write-offs, foreclosures, and other movements – –Total movements of carrying amount (26,821) 3,533 (2,153) (25,441)
Gross carrying amount at December 31, 2021 P=105,130 P=7,030 P=4,736 P=116,896* Stage classification of new financial assets originated pertains to the stage as of end of year
ConsolidatedECL Staging
Stage 1 Stage 2 Stage 3Loans and receivables – total 12–month ECL Lifetime ECL Lifetime ECL TotalGross carrying amount at January 1, 2021 P=494,741,279 P=57,530,675 P=20,073,000 P=572,344,954Transfers:
Transfer from Stage 1 to Stage 2 (25,852,467) 25,852,467 – –Transfer from Stage 1 to Stage 3 (2,536,119) – 2,536,119 –Transfer from Stage 2 to Stage 1 10,654,396 (10,654,396) – –Transfer from Stage 2 to Stage 3 – (7,797,813) 7,797,813 –Transfer from Stage 3 to Stage 1 520,492 – (520,492) –Transfer from Stage 3 to Stage 2 – 4,800,934 (4,800,934) –
New financial assets originated * 244,452,672 19,003,710 1,080,148 264,536,530Changes in EADs (29,262,201) (2,589,313) (6,027) (31,857,541)Financial assets derecognized during the period (152,310,298) (18,184,917) (3,246,242) (173,741,457)Write-offs, foreclosures, and other movements – – (6,957,767) (6,957,767)Total movements of carrying amount 45,666,475 10,430,672 (4,117,382) 51,979,765
Gross carrying amount at December 31, 2021 P=540,407,754 P=67,961,347 P=15,955,618 P=624,324,719* Stage classification of new financial assets originated pertains to the stage as of end of year
ConsolidatedECL Staging
Stage 1 Stage 2 Stage 3Investment securities at amortized cost 12–month ECL Lifetime ECL Lifetime ECL TotalGross carrying amount at January 1, 2021 P=195,420,861 P=– P=3,631,625 P=199,052,486Transfers:
Transfer from Stage 1 to Stage 2 (1,731,257) 1,731,257 – –Transfer from Stage 1 to Stage 3 – – – –Transfer from Stage 2 to Stage 1 – – – –Transfer from Stage 2 to Stage 3 – – – –Transfer from Stage 3 to Stage 1 – – – –Transfer from Stage 3 to Stage 2 – – – –
New financial assets originated or purchased * 99,846,490 1,784,965 – 101,631,455Changes in EADs 2,791,802 50,294 – 2,842,096Financial assets derecognized during the period (62,821,820) – – (62,821,820)Write-offs, foreclosures, and other movements (95,516) – 315,375 219,859Total movements of carrying amount 37,989,699 3,566,516 315,375 41,871,590
Gross carrying amount at December 31, 2021 P=233,410,560 P=3,566,516 P=3,947,000 P=240,924,076* Stage classification of new financial assets originated or purchased pertains to the stage as of end of year
208
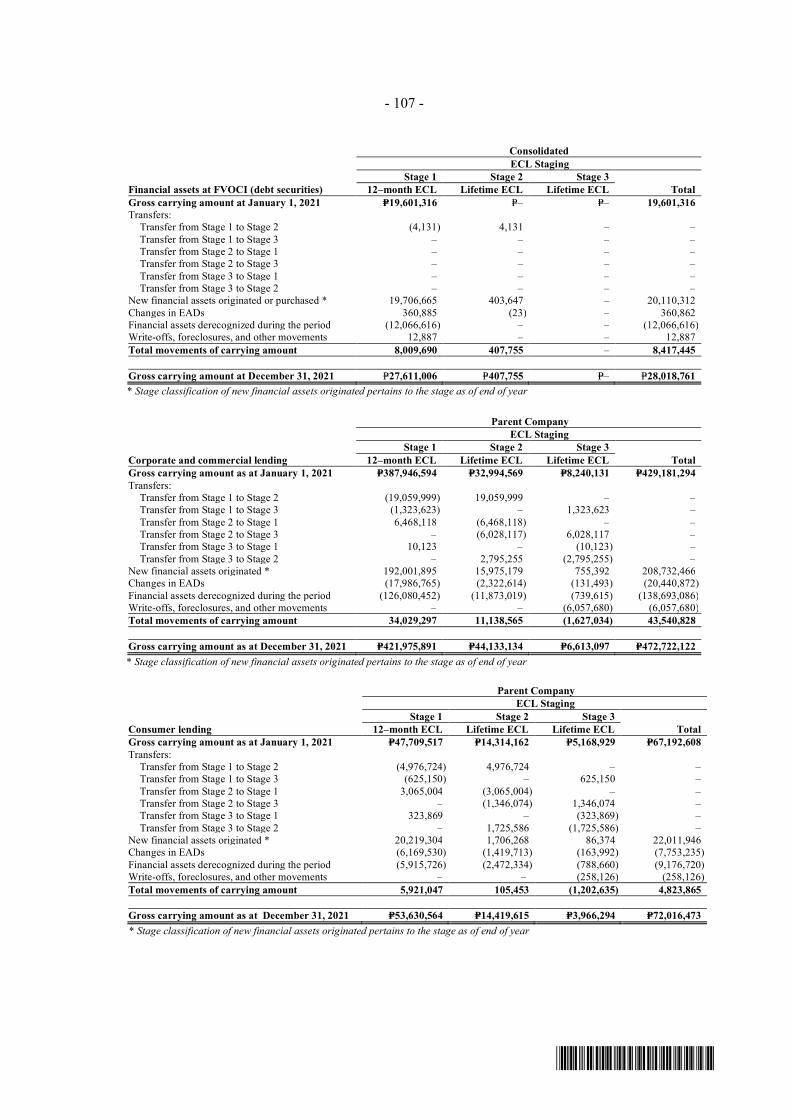
- 107 -
*SGVFS162381*
ConsolidatedECL Staging
Stage 1 Stage 2 Stage 3Financial assets at FVOCI (debt securities) 12–month ECL Lifetime ECL Lifetime ECL TotalGross carrying amount at January 1, 2021 P=19,601,316 P=– P=– 19,601,316Transfers:
Transfer from Stage 1 to Stage 2 (4,131) 4,131 – –Transfer from Stage 1 to Stage 3 – – – –Transfer from Stage 2 to Stage 1 – – – –Transfer from Stage 2 to Stage 3 – – – –Transfer from Stage 3 to Stage 1 – – – –Transfer from Stage 3 to Stage 2 – – – –
New financial assets originated or purchased * 19,706,665 403,647 – 20,110,312Changes in EADs 360,885 (23) – 360,862Financial assets derecognized during the period (12,066,616) – – (12,066,616)Write-offs, foreclosures, and other movements 12,887 – – 12,887Total movements of carrying amount 8,009,690 407,755 – 8,417,445
Gross carrying amount at December 31, 2021 P=27,611,006 P=407,755 P=– P=28,018,761* Stage classification of new financial assets originated pertains to the stage as of end of year
Parent CompanyECL Staging
Stage 1 Stage 2 Stage 3Corporate and commercial lending 12–month ECL Lifetime ECL Lifetime ECL TotalGross carrying amount as at January 1, 2021 P=387,946,594 P=32,994,569 P=8,240,131 P=429,181,294Transfers:
Transfer from Stage 1 to Stage 2 (19,059,999) 19,059,999 – –Transfer from Stage 1 to Stage 3 (1,323,623) – 1,323,623 –Transfer from Stage 2 to Stage 1 6,468,118 (6,468,118) – –Transfer from Stage 2 to Stage 3 – (6,028,117) 6,028,117 –Transfer from Stage 3 to Stage 1 10,123 – (10,123) –Transfer from Stage 3 to Stage 2 – 2,795,255 (2,795,255) –
New financial assets originated * 192,001,895 15,975,179 755,392 208,732,466Changes in EADs (17,986,765) (2,322,614) (131,493) (20,440,872)Financial assets derecognized during the period (126,080,452) (11,873,019) (739,615) (138,693,086)Write-offs, foreclosures, and other movements – – (6,057,680) (6,057,680)Total movements of carrying amount 34,029,297 11,138,565 (1,627,034) 43,540,828
Gross carrying amount as at December 31, 2021 P=421,975,891 P=44,133,134 P=6,613,097 P=472,722,122* Stage classification of new financial assets originated pertains to the stage as of end of year
Parent CompanyECL Staging
Stage 1 Stage 2 Stage 3Consumer lending 12–month ECL Lifetime ECL Lifetime ECL TotalGross carrying amount as at January 1, 2021 P=47,709,517 P=14,314,162 P=5,168,929 P=67,192,608Transfers:
Transfer from Stage 1 to Stage 2 (4,976,724) 4,976,724 – –Transfer from Stage 1 to Stage 3 (625,150) – 625,150 –Transfer from Stage 2 to Stage 1 3,065,004 (3,065,004) – –Transfer from Stage 2 to Stage 3 – (1,346,074) 1,346,074 –Transfer from Stage 3 to Stage 1 323,869 – (323,869) –Transfer from Stage 3 to Stage 2 – 1,725,586 (1,725,586) –
New financial assets originated * 20,219,304 1,706,268 86,374 22,011,946Changes in EADs (6,169,530) (1,419,713) (163,992) (7,753,235)Financial assets derecognized during the period (5,915,726) (2,472,334) (788,660) (9,176,720)Write-offs, foreclosures, and other movements – – (258,126) (258,126)Total movements of carrying amount 5,921,047 105,453 (1,202,635) 4,823,865
Gross carrying amount as at December 31, 2021 P=53,630,564 P=14,419,615 P=3,966,294 P=72,016,473* Stage classification of new financial assets originated pertains to the stage as of end of year
209
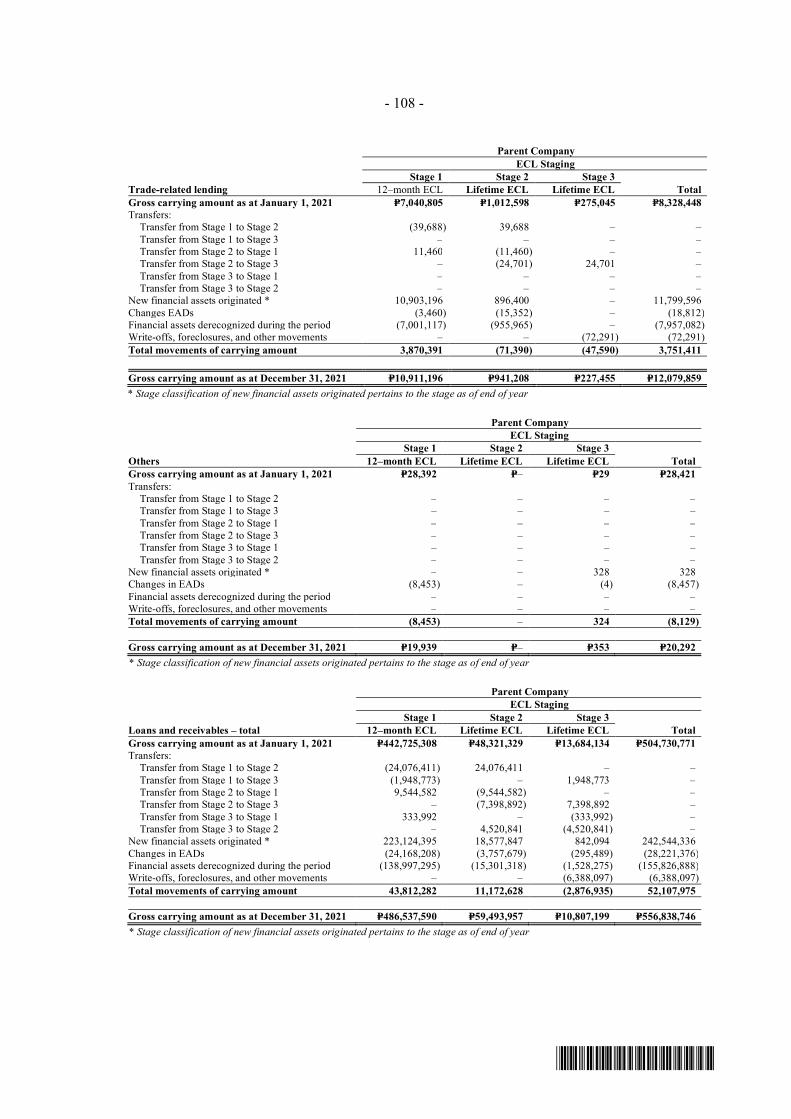
- 108 -
*SGVFS162381*
Parent CompanyECL Staging
Stage 1 Stage 2 Stage 3Trade-related lending 12–month ECL Lifetime ECL Lifetime ECL TotalGross carrying amount as at January 1, 2021 P=7,040,805 P=1,012,598 P=275,045 P=8,328,448Transfers:
Transfer from Stage 1 to Stage 2 (39,688) 39,688 – –Transfer from Stage 1 to Stage 3 – – – –Transfer from Stage 2 to Stage 1 11,460 (11,460) – –Transfer from Stage 2 to Stage 3 – (24,701) 24,701 –Transfer from Stage 3 to Stage 1 – – – –Transfer from Stage 3 to Stage 2 – – – –
New financial assets originated * 10,903,196 896,400 – 11,799,596Changes EADs (3,460) (15,352) – (18,812)Financial assets derecognized during the period (7,001,117) (955,965) – (7,957,082)Write-offs, foreclosures, and other movements – – (72,291) (72,291)Total movements of carrying amount 3,870,391 (71,390) (47,590) 3,751,411
Gross carrying amount as at December 31, 2021 P=10,911,196 P=941,208 P=227,455 P=12,079,859* Stage classification of new financial assets originated pertains to the stage as of end of year
Parent CompanyECL Staging
Stage 1 Stage 2 Stage 3Others 12–month ECL Lifetime ECL Lifetime ECL TotalGross carrying amount as at January 1, 2021 P=28,392 P=– P=29 P=28,421Transfers:
Transfer from Stage 1 to Stage 2 – – – –Transfer from Stage 1 to Stage 3 – – – –Transfer from Stage 2 to Stage 1 – – – –Transfer from Stage 2 to Stage 3 – – – –Transfer from Stage 3 to Stage 1 – – – –Transfer from Stage 3 to Stage 2 – – – –
New financial assets originated * – – 328 328Changes in EADs (8,453) – (4) (8,457)Financial assets derecognized during the period – – – –Write-offs, foreclosures, and other movements – – – –Total movements of carrying amount (8,453) – 324 (8,129)
Gross carrying amount as at December 31, 2021 P=19,939 P=– P=353 P=20,292* Stage classification of new financial assets originated pertains to the stage as of end of year
Parent CompanyECL Staging
Stage 1 Stage 2 Stage 3Loans and receivables – total 12–month ECL Lifetime ECL Lifetime ECL TotalGross carrying amount as at January 1, 2021 P=442,725,308 P=48,321,329 P=13,684,134 P=504,730,771Transfers:
Transfer from Stage 1 to Stage 2 (24,076,411) 24,076,411 – –Transfer from Stage 1 to Stage 3 (1,948,773) – 1,948,773 –Transfer from Stage 2 to Stage 1 9,544,582 (9,544,582) – –Transfer from Stage 2 to Stage 3 – (7,398,892) 7,398,892 –Transfer from Stage 3 to Stage 1 333,992 – (333,992) –Transfer from Stage 3 to Stage 2 – 4,520,841 (4,520,841) –
New financial assets originated * 223,124,395 18,577,847 842,094 242,544,336Changes in EADs (24,168,208) (3,757,679) (295,489) (28,221,376)Financial assets derecognized during the period (138,997,295) (15,301,318) (1,528,275) (155,826,888)Write-offs, foreclosures, and other movements – – (6,388,097) (6,388,097)Total movements of carrying amount 43,812,282 11,172,628 (2,876,935) 52,107,975
Gross carrying amount as at December 31, 2021 P=486,537,590 P=59,493,957 P=10,807,199 P=556,838,746* Stage classification of new financial assets originated pertains to the stage as of end of year
210
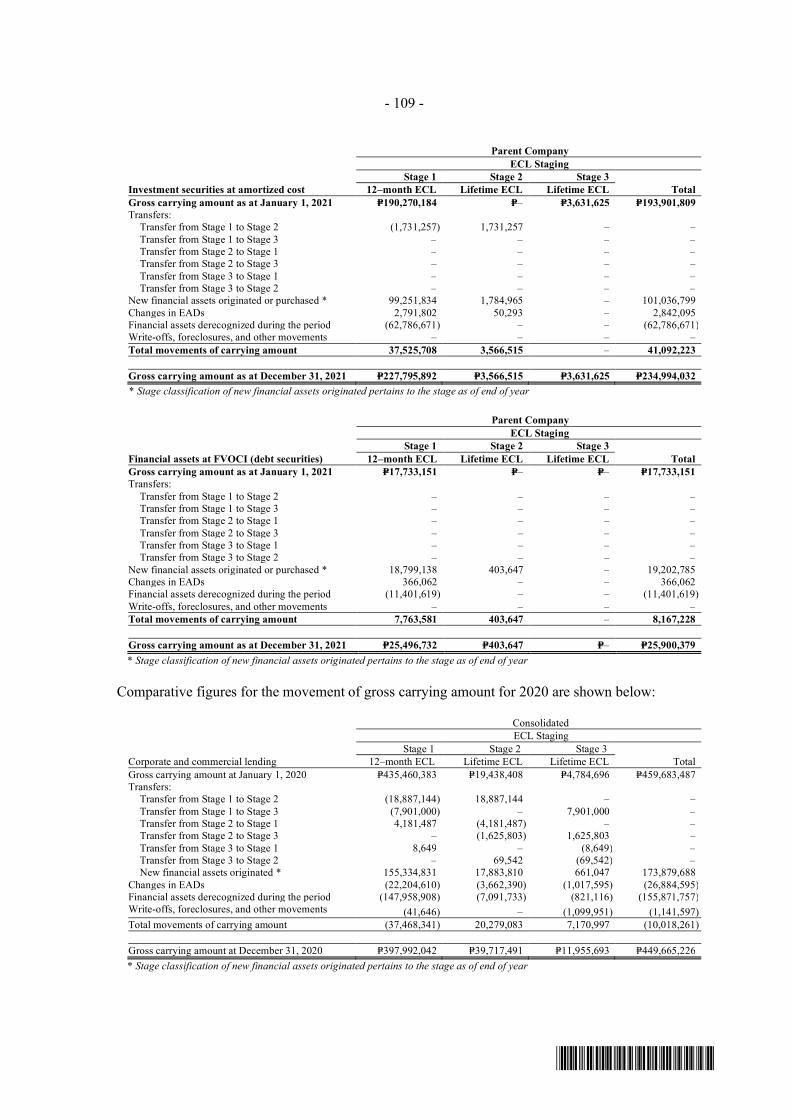
- 109 -
*SGVFS162381*
Parent CompanyECL Staging
Stage 1 Stage 2 Stage 3Investment securities at amortized cost 12–month ECL Lifetime ECL Lifetime ECL TotalGross carrying amount as at January 1, 2021 P=190,270,184 P=– P=3,631,625 P=193,901,809Transfers:
Transfer from Stage 1 to Stage 2 (1,731,257) 1,731,257 – –Transfer from Stage 1 to Stage 3 – – – –Transfer from Stage 2 to Stage 1 – – – –Transfer from Stage 2 to Stage 3 – – – –Transfer from Stage 3 to Stage 1 – – – –Transfer from Stage 3 to Stage 2 – – – –
New financial assets originated or purchased * 99,251,834 1,784,965 – 101,036,799Changes in EADs 2,791,802 50,293 – 2,842,095Financial assets derecognized during the period (62,786,671) – – (62,786,671)Write-offs, foreclosures, and other movements – – – –Total movements of carrying amount 37,525,708 3,566,515 – 41,092,223
Gross carrying amount as at December 31, 2021 P=227,795,892 P=3,566,515 P=3,631,625 P=234,994,032* Stage classification of new financial assets originated pertains to the stage as of end of year
Parent CompanyECL Staging
Stage 1 Stage 2 Stage 3Financial assets at FVOCI (debt securities) 12–month ECL Lifetime ECL Lifetime ECL TotalGross carrying amount as at January 1, 2021 P=17,733,151 P=– P=– P=17,733,151Transfers:
Transfer from Stage 1 to Stage 2 – – – –Transfer from Stage 1 to Stage 3 – – – –Transfer from Stage 2 to Stage 1 – – – –Transfer from Stage 2 to Stage 3 – – – –Transfer from Stage 3 to Stage 1 – – – –Transfer from Stage 3 to Stage 2 – – – –
New financial assets originated or purchased * 18,799,138 403,647 – 19,202,785Changes in EADs 366,062 – – 366,062Financial assets derecognized during the period (11,401,619) – – (11,401,619)Write-offs, foreclosures, and other movements – – – –Total movements of carrying amount 7,763,581 403,647 – 8,167,228
Gross carrying amount as at December 31, 2021 P=25,496,732 P=403,647 P=– P=25,900,379* Stage classification of new financial assets originated pertains to the stage as of end of year
Comparative figures for the movement of gross carrying amount for 2020 are shown below:
ConsolidatedECL Staging
Stage 1 Stage 2 Stage 3Corporate and commercial lending 12–month ECL Lifetime ECL Lifetime ECL TotalGross carrying amount at January 1, 2020 P=435,460,383 P=19,438,408 P=4,784,696 P=459,683,487Transfers:
Transfer from Stage 1 to Stage 2 (18,887,144) 18,887,144 – –Transfer from Stage 1 to Stage 3 (7,901,000) – 7,901,000 –Transfer from Stage 2 to Stage 1 4,181,487 (4,181,487) – –Transfer from Stage 2 to Stage 3 – (1,625,803) 1,625,803 –Transfer from Stage 3 to Stage 1 8,649 – (8,649) –Transfer from Stage 3 to Stage 2 – 69,542 (69,542) –New financial assets originated * 155,334,831 17,883,810 661,047 173,879,688
Changes in EADs (22,204,610) (3,662,390) (1,017,595) (26,884,595)Financial assets derecognized during the period (147,958,908) (7,091,733) (821,116) (155,871,757)Write-offs, foreclosures, and other movements (41,646) – (1,099,951) (1,141,597)Total movements of carrying amount (37,468,341) 20,279,083 7,170,997 (10,018,261)
Gross carrying amount at December 31, 2020 P=397,992,042 P=39,717,491 P=11,955,693 P=449,665,226* Stage classification of new financial assets originated pertains to the stage as of end of year
211

- 110 -
*SGVFS162381*
ConsolidatedECL Staging
Stage 1 Stage 2 Stage 3Consumer lending 12–month ECL Lifetime ECL Lifetime ECL TotalGross carrying amount at January 1, 2020 P=98,802,692 P=4,603,066 P=3,496,043 P=106,901,801Movements with P&L impactTransfers:
Transfer from Stage 1 to Stage 2 (13,429,858) 13,429,858 – –Transfer from Stage 1 to Stage 3 (4,447,940) – 4,447,940 –Transfer from Stage 2 to Stage 1 650,492 (650,492) – –Transfer from Stage 2 to Stage 3 – (931,969) 931,969 –Transfer from Stage 3 to Stage 1 50,795 – (50,795) –Transfer from Stage 3 to Stage 2 – 156,508 (156,508) –
New financial assets originated * 30,288,112 1,980,655 249,762 32,518,529Changes in EADs (11,163,581) (993,341) 230,266 (11,926,656)Financial assets derecognized during the period (11,349,917) (797,195) (448,534) (12,595,646)Write-offs, foreclosures, and other movements – – (894,686) (894,686)Total movements of carrying amount (9,401,897) 12,194,024 4,309,414 7,101,541
Gross carrying amount at December 31, 2020 P=89,400,795 P=16,797,090 P=7,805,457 P=114,003,342* Stage classification of new financial assets originated pertains to the stage as of end of year
ConsolidatedECL Staging
Stage 1 Stage 2 Stage 3Trade-related lending 12–month ECL Lifetime ECL Lifetime ECL TotalGross carrying amount at January 1, 2020 P=10,886,516 P=74,497 P=235,906 P=11,196,919Transfers:
Transfer from Stage 1 to Stage 2 (45,350) 45,350 – –Transfer from Stage 1 to Stage 3 (70,425) – 70,425 –Transfer from Stage 2 to Stage 1 – – – –Transfer from Stage 2 to Stage 3 – – – –Transfer from Stage 3 to Stage 1 – – – –Transfer from Stage 3 to Stage 2 – 12,258 (12,258) –
New financial assets originated * 6,977,551 954,429 38,718 7,970,698Changes in EADs 36,827 (11,883) (6,936) 18,008Financial assets derecognized during the period (10,568,628) (62,054) – (10,630,682)Write-offs, foreclosures, and other movements – – (20,894) (20,894)Total movements of carrying amount (3,670,025) 938,100 69,055 (2,662,870)
Gross carrying amount at December 31, 2020 P=7,216,491 P=1,012,597 P=304,961 P=8,534,049* Stage classification of new financial assets originated pertains to the stage as of end of year
ConsolidatedECL Staging
Stage 1 Stage 2 Stage 3Others 12–month ECL Lifetime ECL Lifetime ECL TotalGross carrying amount at January 1, 2020 P=41,987 P=– P=4,843 P=46,830Transfers:
Transfer from Stage 1 to Stage 2 (2,887) 2,887 – –Transfer from Stage 1 to Stage 3 (2,224) – 2,224 –Transfer from Stage 2 to Stage 1 – – – –Transfer from Stage 2 to Stage 3 – (6) 6 –Transfer from Stage 3 to Stage 1 – – – –Transfer from Stage 3 to Stage 2 – – – –
New financial assets originated * 81,129 610 – 81,739Changes in EADs 651,455 6 (140) 651,321Financial assets derecognized during the period (637,509) – (44) (637,553)Write-offs, foreclosures, and other movements – – – –Total movements of carrying amount 89,964 3,497 2,046 95,507
Gross carrying amount at December 31, 2020 P=131,951 P=3,497 P=6,889 P=142,337* Stage classification of new financial assets originated pertains to the stage as of end of year
212
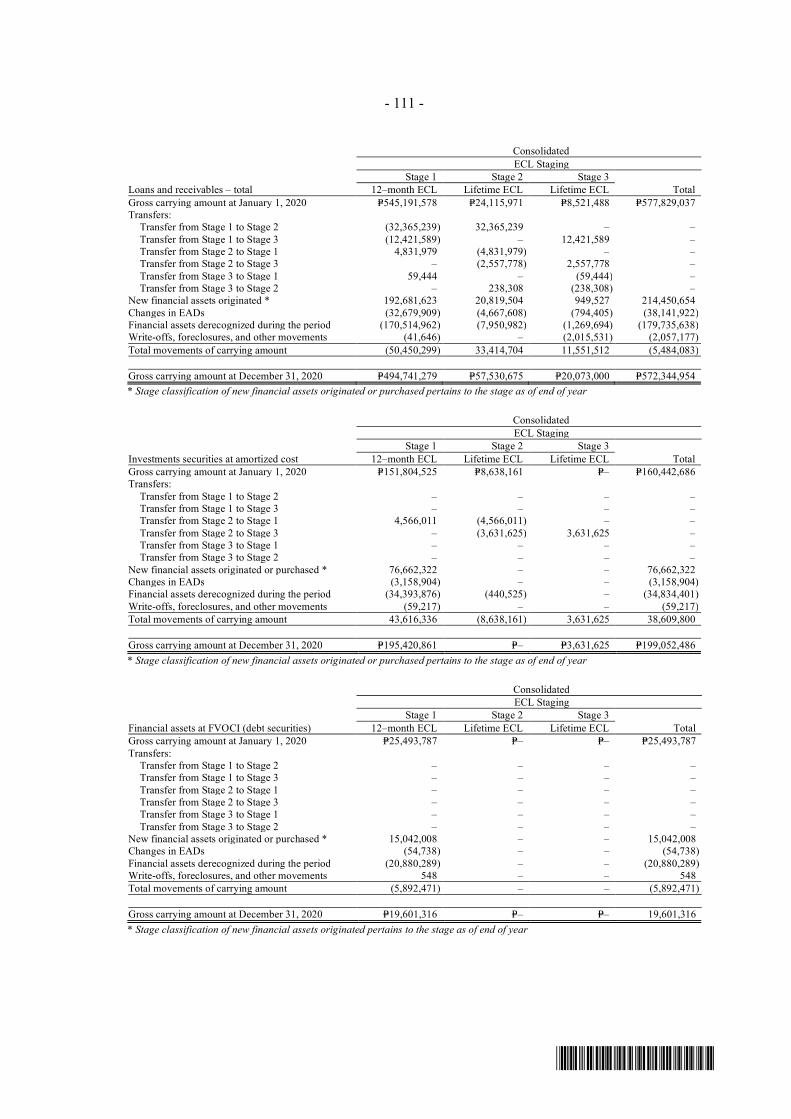
- 111 -
*SGVFS162381*
ConsolidatedECL Staging
Stage 1 Stage 2 Stage 3Loans and receivables – total 12–month ECL Lifetime ECL Lifetime ECL TotalGross carrying amount at January 1, 2020 P=545,191,578 P=24,115,971 P=8,521,488 P=577,829,037Transfers:
Transfer from Stage 1 to Stage 2 (32,365,239) 32,365,239 – –Transfer from Stage 1 to Stage 3 (12,421,589) – 12,421,589 –Transfer from Stage 2 to Stage 1 4,831,979 (4,831,979) – –Transfer from Stage 2 to Stage 3 – (2,557,778) 2,557,778 –Transfer from Stage 3 to Stage 1 59,444 – (59,444) –Transfer from Stage 3 to Stage 2 – 238,308 (238,308) –
New financial assets originated * 192,681,623 20,819,504 949,527 214,450,654Changes in EADs (32,679,909) (4,667,608) (794,405) (38,141,922)Financial assets derecognized during the period (170,514,962) (7,950,982) (1,269,694) (179,735,638)Write-offs, foreclosures, and other movements (41,646) – (2,015,531) (2,057,177)Total movements of carrying amount (50,450,299) 33,414,704 11,551,512 (5,484,083)
Gross carrying amount at December 31, 2020 P=494,741,279 P=57,530,675 P=20,073,000 P=572,344,954* Stage classification of new financial assets originated or purchased pertains to the stage as of end of year
ConsolidatedECL Staging
Stage 1 Stage 2 Stage 3Investments securities at amortized cost 12–month ECL Lifetime ECL Lifetime ECL TotalGross carrying amount at January 1, 2020 P=151,804,525 P=8,638,161 P=– P=160,442,686Transfers:
Transfer from Stage 1 to Stage 2 – – – –Transfer from Stage 1 to Stage 3 – – – –Transfer from Stage 2 to Stage 1 4,566,011 (4,566,011) – –Transfer from Stage 2 to Stage 3 – (3,631,625) 3,631,625 –Transfer from Stage 3 to Stage 1 – – – –Transfer from Stage 3 to Stage 2 – – – –
New financial assets originated or purchased * 76,662,322 – – 76,662,322Changes in EADs (3,158,904) – – (3,158,904)Financial assets derecognized during the period (34,393,876) (440,525) – (34,834,401)Write-offs, foreclosures, and other movements (59,217) – – (59,217)Total movements of carrying amount 43,616,336 (8,638,161) 3,631,625 38,609,800
Gross carrying amount at December 31, 2020 P=195,420,861 P=– P=3,631,625 P=199,052,486* Stage classification of new financial assets originated or purchased pertains to the stage as of end of year
ConsolidatedECL Staging
Stage 1 Stage 2 Stage 3Financial assets at FVOCI (debt securities) 12–month ECL Lifetime ECL Lifetime ECL TotalGross carrying amount at January 1, 2020 P=25,493,787 P=– P=– P=25,493,787Transfers:
Transfer from Stage 1 to Stage 2 – – – –Transfer from Stage 1 to Stage 3 – – – –Transfer from Stage 2 to Stage 1 – – – –Transfer from Stage 2 to Stage 3 – – – –Transfer from Stage 3 to Stage 1 – – – –Transfer from Stage 3 to Stage 2 – – – –
New financial assets originated or purchased * 15,042,008 – – 15,042,008Changes in EADs (54,738) – – (54,738)Financial assets derecognized during the period (20,880,289) – – (20,880,289)Write-offs, foreclosures, and other movements 548 – – 548Total movements of carrying amount (5,892,471) – – (5,892,471)
Gross carrying amount at December 31, 2020 P=19,601,316 P=– P=– 19,601,316* Stage classification of new financial assets originated pertains to the stage as of end of year
213
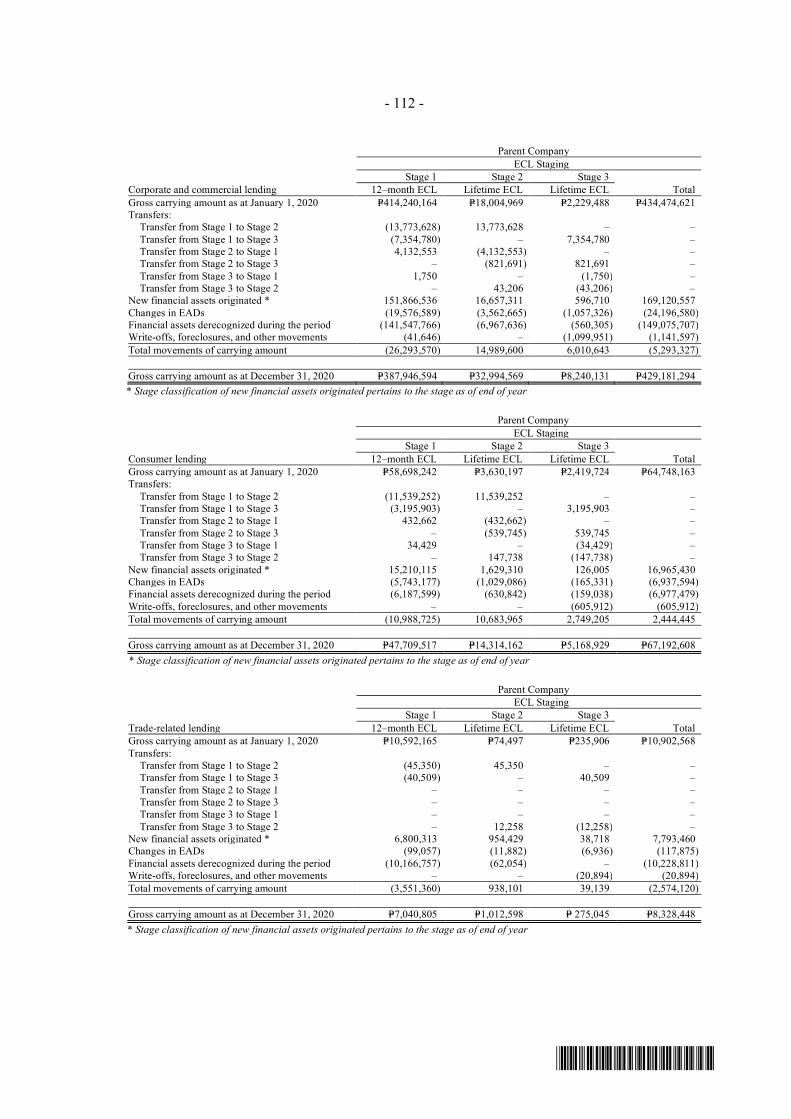
- 112 -
*SGVFS162381*
Parent CompanyECL Staging
Stage 1 Stage 2 Stage 3Corporate and commercial lending 12–month ECL Lifetime ECL Lifetime ECL TotalGross carrying amount as at January 1, 2020 P=414,240,164 P=18,004,969 P=2,229,488 P=434,474,621Transfers:
Transfer from Stage 1 to Stage 2 (13,773,628) 13,773,628 – –Transfer from Stage 1 to Stage 3 (7,354,780) – 7,354,780 –Transfer from Stage 2 to Stage 1 4,132,553 (4,132,553) – –Transfer from Stage 2 to Stage 3 – (821,691) 821,691 –Transfer from Stage 3 to Stage 1 1,750 – (1,750) –Transfer from Stage 3 to Stage 2 – 43,206 (43,206) –
New financial assets originated * 151,866,536 16,657,311 596,710 169,120,557Changes in EADs (19,576,589) (3,562,665) (1,057,326) (24,196,580)Financial assets derecognized during the period (141,547,766) (6,967,636) (560,305) (149,075,707)Write-offs, foreclosures, and other movements (41,646) – (1,099,951) (1,141,597)Total movements of carrying amount (26,293,570) 14,989,600 6,010,643 (5,293,327)
Gross carrying amount as at December 31, 2020 P=387,946,594 P=32,994,569 P=8,240,131 P=429,181,294* Stage classification of new financial assets originated pertains to the stage as of end of year
Parent CompanyECL Staging
Stage 1 Stage 2 Stage 3Consumer lending 12–month ECL Lifetime ECL Lifetime ECL TotalGross carrying amount as at January 1, 2020 P=58,698,242 P=3,630,197 P=2,419,724 P=64,748,163Transfers:
Transfer from Stage 1 to Stage 2 (11,539,252) 11,539,252 – –Transfer from Stage 1 to Stage 3 (3,195,903) – 3,195,903 –Transfer from Stage 2 to Stage 1 432,662 (432,662) – –Transfer from Stage 2 to Stage 3 – (539,745) 539,745 –Transfer from Stage 3 to Stage 1 34,429 – (34,429) –Transfer from Stage 3 to Stage 2 – 147,738 (147,738) –
New financial assets originated * 15,210,115 1,629,310 126,005 16,965,430Changes in EADs (5,743,177) (1,029,086) (165,331) (6,937,594)Financial assets derecognized during the period (6,187,599) (630,842) (159,038) (6,977,479)Write-offs, foreclosures, and other movements – – (605,912) (605,912)Total movements of carrying amount (10,988,725) 10,683,965 2,749,205 2,444,445
Gross carrying amount as at December 31, 2020 P=47,709,517 P=14,314,162 P=5,168,929 P=67,192,608* Stage classification of new financial assets originated pertains to the stage as of end of year
Parent CompanyECL Staging
Stage 1 Stage 2 Stage 3Trade-related lending 12–month ECL Lifetime ECL Lifetime ECL TotalGross carrying amount as at January 1, 2020 P=10,592,165 P=74,497 P=235,906 P=10,902,568Transfers:
Transfer from Stage 1 to Stage 2 (45,350) 45,350 – –Transfer from Stage 1 to Stage 3 (40,509) – 40,509 –Transfer from Stage 2 to Stage 1 – – – –Transfer from Stage 2 to Stage 3 – – – –Transfer from Stage 3 to Stage 1 – – – –Transfer from Stage 3 to Stage 2 – 12,258 (12,258) –
New financial assets originated * 6,800,313 954,429 38,718 7,793,460Changes in EADs (99,057) (11,882) (6,936) (117,875)Financial assets derecognized during the period (10,166,757) (62,054) – (10,228,811)Write-offs, foreclosures, and other movements – – (20,894) (20,894)Total movements of carrying amount (3,551,360) 938,101 39,139 (2,574,120)
Gross carrying amount as at December 31, 2020 P=7,040,805 P=1,012,598 P= 275,045 P=8,328,448* Stage classification of new financial assets originated pertains to the stage as of end of year
214
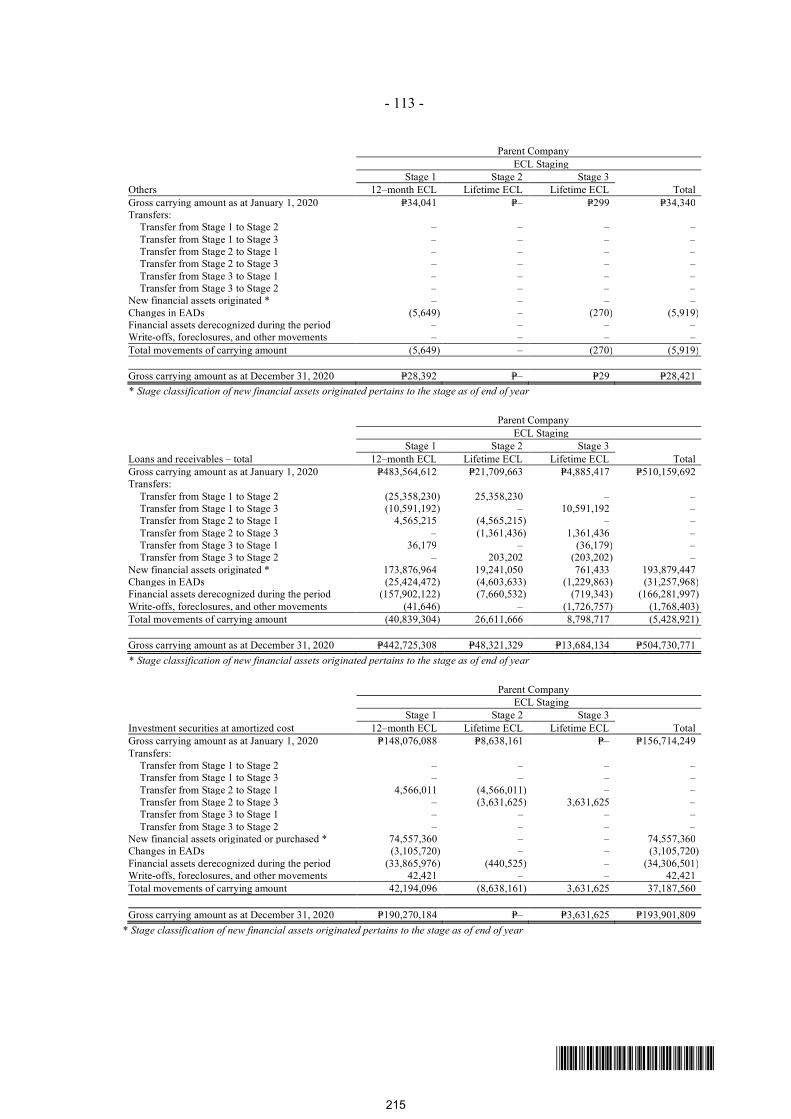
- 113 -
*SGVFS162381*
Parent CompanyECL Staging
Stage 1 Stage 2 Stage 3Others 12–month ECL Lifetime ECL Lifetime ECL TotalGross carrying amount as at January 1, 2020 P=34,041 P=– P=299 P=34,340Transfers:
Transfer from Stage 1 to Stage 2 – – – –Transfer from Stage 1 to Stage 3 – – – –Transfer from Stage 2 to Stage 1 – – – –Transfer from Stage 2 to Stage 3 – – – –Transfer from Stage 3 to Stage 1 – – – –Transfer from Stage 3 to Stage 2 – – – –
New financial assets originated * – – – –Changes in EADs (5,649) – (270) (5,919)Financial assets derecognized during the period – – – –Write-offs, foreclosures, and other movements – – – –Total movements of carrying amount (5,649) – (270) (5,919)
Gross carrying amount as at December 31, 2020 P=28,392 P=– P=29 P=28,421* Stage classification of new financial assets originated pertains to the stage as of end of year
Parent CompanyECL Staging
Stage 1 Stage 2 Stage 3Loans and receivables – total 12–month ECL Lifetime ECL Lifetime ECL TotalGross carrying amount as at January 1, 2020 P=483,564,612 P=21,709,663 P=4,885,417 P=510,159,692Transfers:
Transfer from Stage 1 to Stage 2 (25,358,230) 25,358,230 – –Transfer from Stage 1 to Stage 3 (10,591,192) – 10,591,192 –Transfer from Stage 2 to Stage 1 4,565,215 (4,565,215) – –Transfer from Stage 2 to Stage 3 – (1,361,436) 1,361,436 –Transfer from Stage 3 to Stage 1 36,179 – (36,179) –Transfer from Stage 3 to Stage 2 – 203,202 (203,202) –
New financial assets originated * 173,876,964 19,241,050 761,433 193,879,447Changes in EADs (25,424,472) (4,603,633) (1,229,863) (31,257,968)Financial assets derecognized during the period (157,902,122) (7,660,532) (719,343) (166,281,997)Write-offs, foreclosures, and other movements (41,646) – (1,726,757) (1,768,403)Total movements of carrying amount (40,839,304) 26,611,666 8,798,717 (5,428,921)
Gross carrying amount as at December 31, 2020 P=442,725,308 P=48,321,329 P=13,684,134 P=504,730,771* Stage classification of new financial assets originated pertains to the stage as of end of year
Parent CompanyECL Staging
Stage 1 Stage 2 Stage 3Investment securities at amortized cost 12–month ECL Lifetime ECL Lifetime ECL TotalGross carrying amount as at January 1, 2020 P=148,076,088 P=8,638,161 P=– P=156,714,249Transfers:
Transfer from Stage 1 to Stage 2 – – – –Transfer from Stage 1 to Stage 3 – – – –Transfer from Stage 2 to Stage 1 4,566,011 (4,566,011) – –Transfer from Stage 2 to Stage 3 – (3,631,625) 3,631,625 –Transfer from Stage 3 to Stage 1 – – – –Transfer from Stage 3 to Stage 2 – – – –
New financial assets originated or purchased * 74,557,360 – – 74,557,360Changes in EADs (3,105,720) – – (3,105,720)Financial assets derecognized during the period (33,865,976) (440,525) – (34,306,501)Write-offs, foreclosures, and other movements 42,421 – – 42,421Total movements of carrying amount 42,194,096 (8,638,161) 3,631,625 37,187,560
Gross carrying amount as at December 31, 2020 P=190,270,184 P=– P=3,631,625 P=193,901,809* Stage classification of new financial assets originated pertains to the stage as of end of year
215
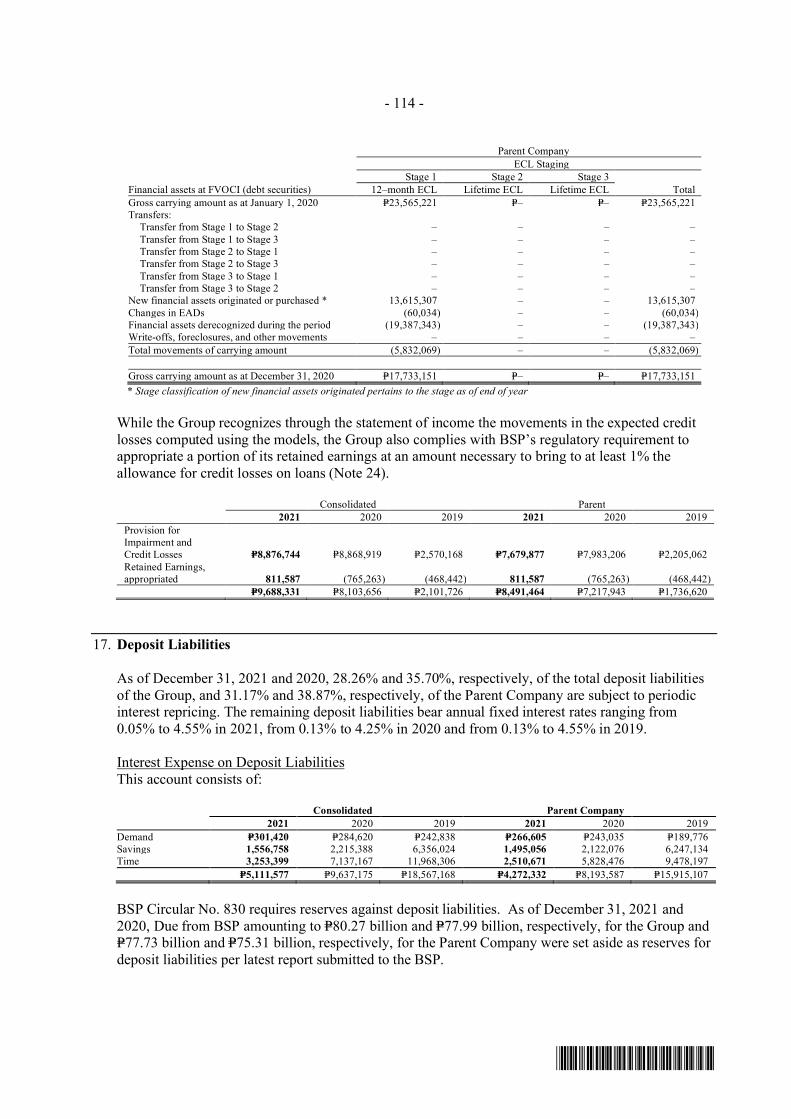
- 114 -
*SGVFS162381*
Parent CompanyECL Staging
Stage 1 Stage 2 Stage 3Financial assets at FVOCI (debt securities) 12–month ECL Lifetime ECL Lifetime ECL TotalGross carrying amount as at January 1, 2020 P=23,565,221 P=– P=– P=23,565,221Transfers:
Transfer from Stage 1 to Stage 2 – – – –Transfer from Stage 1 to Stage 3 – – – –Transfer from Stage 2 to Stage 1 – – – –Transfer from Stage 2 to Stage 3 – – – –Transfer from Stage 3 to Stage 1 – – – –Transfer from Stage 3 to Stage 2 – – – –
New financial assets originated or purchased * 13,615,307 – – 13,615,307Changes in EADs (60,034) – – (60,034)Financial assets derecognized during the period (19,387,343) – – (19,387,343)Write-offs, foreclosures, and other movements – – – –Total movements of carrying amount (5,832,069) – – (5,832,069)
Gross carrying amount as at December 31, 2020 P=17,733,151 P=– P=– P=17,733,151* Stage classification of new financial assets originated pertains to the stage as of end of year
While the Group recognizes through the statement of income the movements in the expected creditlosses computed using the models, the Group also complies with BSP’s regulatory requirement toappropriate a portion of its retained earnings at an amount necessary to bring to at least 1% theallowance for credit losses on loans (Note 24).
Consolidated Parent2021 2020 2019 2021 2020 2019
Provision forImpairment andCredit Losses P=8,876,744 P=8,868,919 P=2,570,168 P=7,679,877 P=7,983,206 P=2,205,062Retained Earnings,appropriated 811,587 (765,263) (468,442) 811,587 (765,263) (468,442)
P=9,688,331 P=8,103,656 P=2,101,726 P=8,491,464 P=7,217,943 P=1,736,620
17. Deposit Liabilities
As of December 31, 2021 and 2020, 28.26% and 35.70%, respectively, of the total deposit liabilitiesof the Group, and 31.17% and 38.87%, respectively, of the Parent Company are subject to periodicinterest repricing. The remaining deposit liabilities bear annual fixed interest rates ranging from0.05% to 4.55% in 2021, from 0.13% to 4.25% in 2020 and from 0.13% to 4.55% in 2019.
Interest Expense on Deposit LiabilitiesThis account consists of:
Consolidated Parent Company2021 2020 2019 2021 2020 2019
Demand P=301,420 P=284,620 P=242,838 P=266,605 P=243,035 P=189,776Savings 1,556,758 2,215,388 6,356,024 1,495,056 2,122,076 6,247,134Time 3,253,399 7,137,167 11,968,306 2,510,671 5,828,476 9,478,197
P=5,111,577 P=9,637,175 P=18,567,168 P=4,272,332 P=8,193,587 P=15,915,107
BSP Circular No. 830 requires reserves against deposit liabilities. As of December 31, 2021 and2020, Due from BSP amounting to P=80.27 billion and P=77.99 billion, respectively, for the Group andP=77.73 billion and P=75.31 billion, respectively, for the Parent Company were set aside as reserves fordeposit liabilities per latest report submitted to the BSP.
216
- 115 -
*SGVFS162381*
On May 27, 2020, BSP issued Circular No. 1087 Alternative Compliance with the ReserveRequirements of Banks and Non-Bank Financial Institutions with Quasi-Banking Functions (NBQBs),which provides the following allowable modes of alternative compliance with the required reservesagainst deposit and deposit liabilities, provided that the following loans were granted, renewed orrestructured after March 15, 2020:
a. Peso-denominated loans that are granted to micro-, small- and medium enterprises (MSMEs)b. Peso-denominated loans that are granted to large enterprises, excluding banks and NBQBs;
provided that large enterprises are directly and adversely impacted by the Covid-19 outbreak
Subsequently on October 8, 2020, BSP issued Circular No. 1100 Amendment to the AlternativeCompliance with the Reserve Requirements of Banks and Non-Bank Financial Institutions withQuasi-Banking Functions (NBQBs, which states that a bank/NBQB may continue to utilize past dueor non-performing MSME and large enterprise loan as alternative compliance with the reserverequirements for an additional thirty (30) calendar days from the date the loan becomes past due ornon-performing, whichever comes earlier.
The use of MSME loans as allowable alternative compliance with the reserve requirement shall beavailable to banks/NBQBs from April 24, 2020 to December 29, 2022 while the use of loans to alarge enterprise as allowable alternative compliance with the reserve requirements shall be availableto banks/NBQBs from May 29, 2020 to December 29, 2022.
As of December 31, 2021 and 2020, the Group is in compliance with the reserve requirement.
Long Term Negotiable Certificates of Deposits (LTNCD)On August 3, 2016, the BOD of the Parent Company approved the issuance of Long Term NegotiableCertificates of Deposits (LTNCD) of up to P=20.00 billion in tranches of P=5.00 billion to P=10.00billion each and with tenors ranging from 5 to 7 years to support the Group’s strategic initiatives andbusiness growth. On October 27, 2016, the Monetary Board of the BSP approved the LTNCDissuances. On November 18, 2016, the Parent Company issued the first tranche at par with aggregateprincipal amount of P=9.58 billion due May 18, 2022. The LTNCDs bear a fixed coupon rate of3.65% per annum, payable quarterly in arrears. Subject to BSP rules, the Group has the option topre−terminate the LTNCDs as a whole but not in part, prior to maturity and on any interest paymentdate at face value plus accrued interest covering the accrued and unpaid interest.
On June 2, 2017, the Parent Company issued at par LTNCDs with aggregate principal amount ofP=6.35 billion due December 22, 2022, representing the second tranche of the P=20.00 billion.
On March 7, 2018, the Board of Directors approved the Bank’s Peso funding program of up toP=50 billion via a combination of Long-Term Negotiable Certificate of Time Deposit and/or RetailBonds and/or Commercial Papers.
On July 12, 2018, the Parent Company issued at par LTNCDs with aggregate principal amount ofP=10.25 billion due January 12, 2024, representing the first tranche of the P=20 billion LTNCDapproved by BSP on June 14, 2018. The LTNCDs bear a fixed coupon rate of 4.55% per annum,payable quarterly in arrears. The P=20.00 billion LTNCD program is part of the Group’s fundingprogram amounting to P=50 billion.
The LTNCDs are included under the ‘Time deposit liabilities’ account.
217
- 116 -
*SGVFS162381*
18. Bonds Payable
The Parent Company’s bonds payable consists of:
P=15.00 Billion Peso Fixed Rate Bonds due in 2022On October 22, 2020, the Parent Company issued P=15.00 billion peso fixed rate bonds, which bears afixed coupon rate of 2.75% per annum, payable quarterly, and is due on October 22, 2022.
P=30.00 Billion Peso Fixed Rate Bonds due in 2021On July 10, 2019, the Parent Company issued P=30.00 billion peso fixed rate bonds, which bears afixed coupon rate of 5.70% per annum, payable monthly, and is due on January 10, 2021. This wassettled in 2021 as scheduled.
BSP Circular No. 830 requires reserves against peso-denominated bonds. As of December 31, 2021and 2020, the Group is in compliance with such regulation.
P=20.00 Billion Peso Fixed Rate Bonds due in 2024On February 18, 2021, the Parent Company issued P=20.00 billion peso fixed rate bonds, which bearsa fixed coupon rate of 2.50% per annum, payable monthly, and is due on February 18, 2024.
This issuance is the second drawdown under the P=45 billion bond and commercial paper programestablished in September 2020.
$150.00 Million Bonds Payable to IFCOn June 18, 2019, the Parent Company issued a $150 million, seven-year bond to InternationalFinance Corporation. The bond reprices semi-annually and carries an interest margin of 120 basispoints over 6-month LIBOR.
Shortly thereafter, the Parent Company entered into a seven-year pay-fixed, receive-floating IRS (seeNote 26) with the same principal terms to hedge the exposure to variable cash flow payments on thefloating-rate bonds payable attributable to interest rate risk (Note 6).
The Bond Subscription Agreement contains certain financial covenants with which the ParentCompany should comply during the term of the Bond, including the following:
Risk Weighted Capital Adequacy Ratio of not less than ten per cent (10%); Equity to Assets Ratio of not less than five per cent (5%); Aggregate Large Exposures Ratio of not more than four hundred per cent (400%); Open Credit Exposures Ratio of not more than twenty five per cent (25%); Fixed Assets Plus Equity Participations Ratio of not more than thirty five per cent (35%); Aggregate Foreign Exchange Risk Ratio of not more than twenty five per cent (25%); Single Currency Foreign Exchange Risk Ratio of not more than ten per cent (10%); Interest Rate Risk Ratio of not less than negative twenty five per cent (-25%) and not more than
twenty five per cent (25%); Aggregate Interest Rate Risk Ratio of not less than negative fifty per cent (-50%) and not more
than twenty per cent (20%); Open FX Position of 25% of Qualifying Capital and USD 150 million, whichever is lower.
218
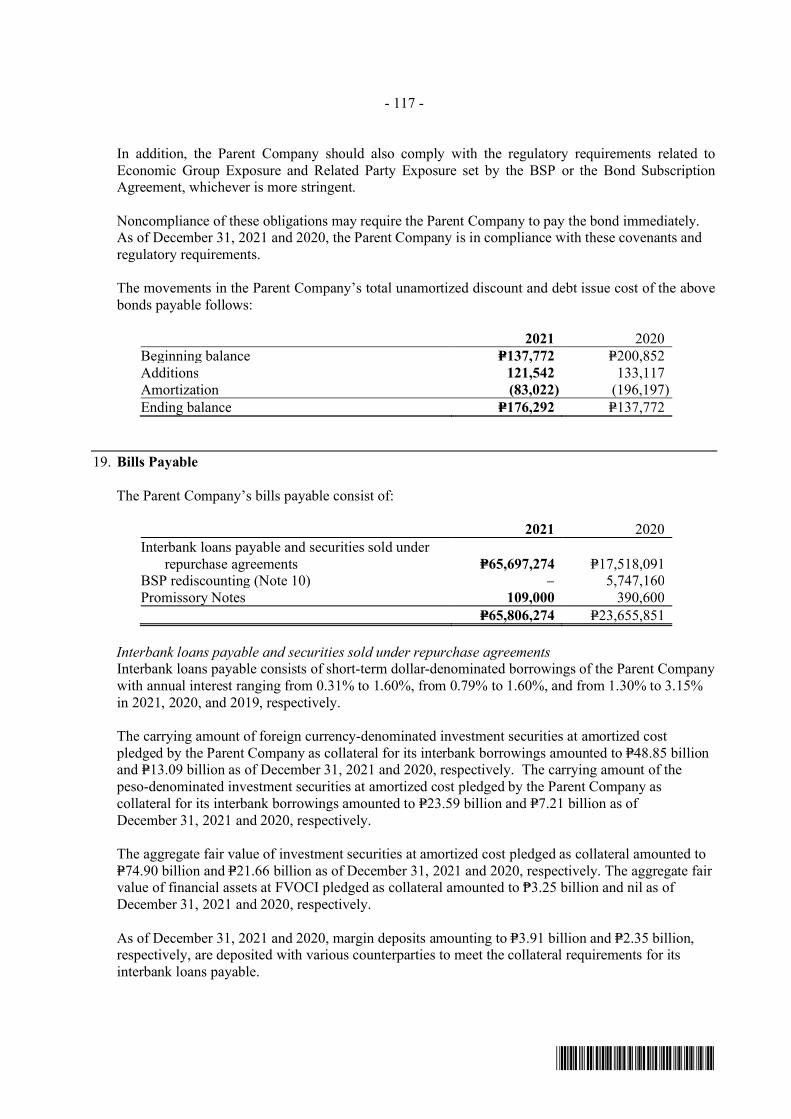
- 117 -
*SGVFS162381*
In addition, the Parent Company should also comply with the regulatory requirements related toEconomic Group Exposure and Related Party Exposure set by the BSP or the Bond SubscriptionAgreement, whichever is more stringent.
Noncompliance of these obligations may require the Parent Company to pay the bond immediately.As of December 31, 2021 and 2020, the Parent Company is in compliance with these covenants andregulatory requirements.
The movements in the Parent Company’s total unamortized discount and debt issue cost of the abovebonds payable follows:
2021 2020Beginning balance P=137,772 P=200,852Additions 121,542 133,117Amortization (83,022) (196,197)Ending balance P=176,292 P=137,772
19. Bills Payable
The Parent Company’s bills payable consist of:
2021 2020Interbank loans payable and securities sold under
repurchase agreements P=65,697,274 P=17,518,091BSP rediscounting (Note 10) – 5,747,160Promissory Notes 109,000 390,600
P=65,806,274 P=23,655,851
Interbank loans payable and securities sold under repurchase agreementsInterbank loans payable consists of short-term dollar-denominated borrowings of the Parent Companywith annual interest ranging from 0.31% to 1.60%, from 0.79% to 1.60%, and from 1.30% to 3.15%in 2021, 2020, and 2019, respectively.
The carrying amount of foreign currency-denominated investment securities at amortized costpledged by the Parent Company as collateral for its interbank borrowings amounted to P=48.85 billionand P=13.09 billion as of December 31, 2021 and 2020, respectively. The carrying amount of thepeso-denominated investment securities at amortized cost pledged by the Parent Company ascollateral for its interbank borrowings amounted to P=23.59 billion and P=7.21 billion as ofDecember 31, 2021 and 2020, respectively.
The aggregate fair value of investment securities at amortized cost pledged as collateral amounted toP=74.90 billion and P=21.66 billion as of December 31, 2021 and 2020, respectively. The aggregate fairvalue of financial assets at FVOCI pledged as collateral amounted to ₱3.25 billion and nil as ofDecember 31, 2021 and 2020, respectively.
As of December 31, 2021 and 2020, margin deposits amounting to P=3.91 billion and P=2.35 billion,respectively, are deposited with various counterparties to meet the collateral requirements for itsinterbank loans payable.
219
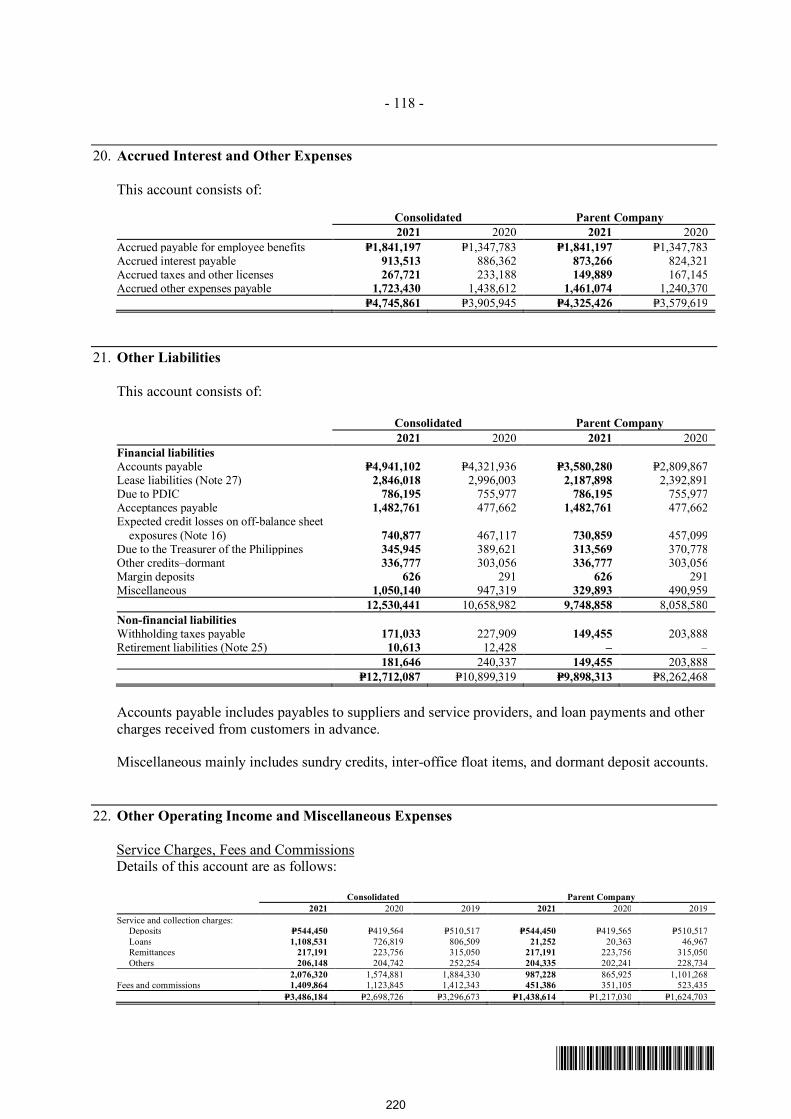
- 118 -
*SGVFS162381*
20. Accrued Interest and Other Expenses
This account consists of:
Consolidated Parent Company2021 2020 2021 2020
Accrued payable for employee benefits P=1,841,197 P=1,347,783 P=1,841,197 P=1,347,783Accrued interest payable 913,513 886,362 873,266 824,321Accrued taxes and other licenses 267,721 233,188 149,889 167,145Accrued other expenses payable 1,723,430 1,438,612 1,461,074 1,240,370
P=4,745,861 P=3,905,945 P=4,325,426 P=3,579,619
21. Other Liabilities
This account consists of:
Consolidated Parent Company2021 2020 2021 2020
Financial liabilitiesAccounts payable P=4,941,102 P=4,321,936 P=3,580,280 P=2,809,867Lease liabilities (Note 27) 2,846,018 2,996,003 2,187,898 2,392,891Due to PDIC 786,195 755,977 786,195 755,977Acceptances payable 1,482,761 477,662 1,482,761 477,662Expected credit losses on off-balance sheet
exposures (Note 16) 740,877 467,117 730,859 457,099Due to the Treasurer of the Philippines 345,945 389,621 313,569 370,778Other credits–dormant 336,777 303,056 336,777 303,056Margin deposits 626 291 626 291Miscellaneous 1,050,140 947,319 329,893 490,959
12,530,441 10,658,982 9,748,858 8,058,580Non-financial liabilitiesWithholding taxes payable 171,033 227,909 149,455 203,888Retirement liabilities (Note 25) 10,613 12,428 – –
181,646 240,337 149,455 203,888P=12,712,087 P=10,899,319 P=9,898,313 P=8,262,468
Accounts payable includes payables to suppliers and service providers, and loan payments and othercharges received from customers in advance.
Miscellaneous mainly includes sundry credits, inter-office float items, and dormant deposit accounts.
22. Other Operating Income and Miscellaneous Expenses
Service Charges, Fees and CommissionsDetails of this account are as follows:
Consolidated Parent Company2021 2020 2019 2021 2020 2019
Service and collection charges:Deposits P=544,450 P=419,564 P=510,517 P=544,450 P=419,565 P=510,517Loans 1,108,531 726,819 806,509 21,252 20,363 46,967Remittances 217,191 223,756 315,050 217,191 223,756 315,050Others 206,148 204,742 252,254 204,335 202,241 228,734
2,076,320 1,574,881 1,884,330 987,228 865,925 1,101,268Fees and commissions 1,409,864 1,123,845 1,412,343 451,386 351,105 523,435
P=3,486,184 P=2,698,726 P=3,296,673 P=1,438,614 P=1,217,030 P=1,624,703
220
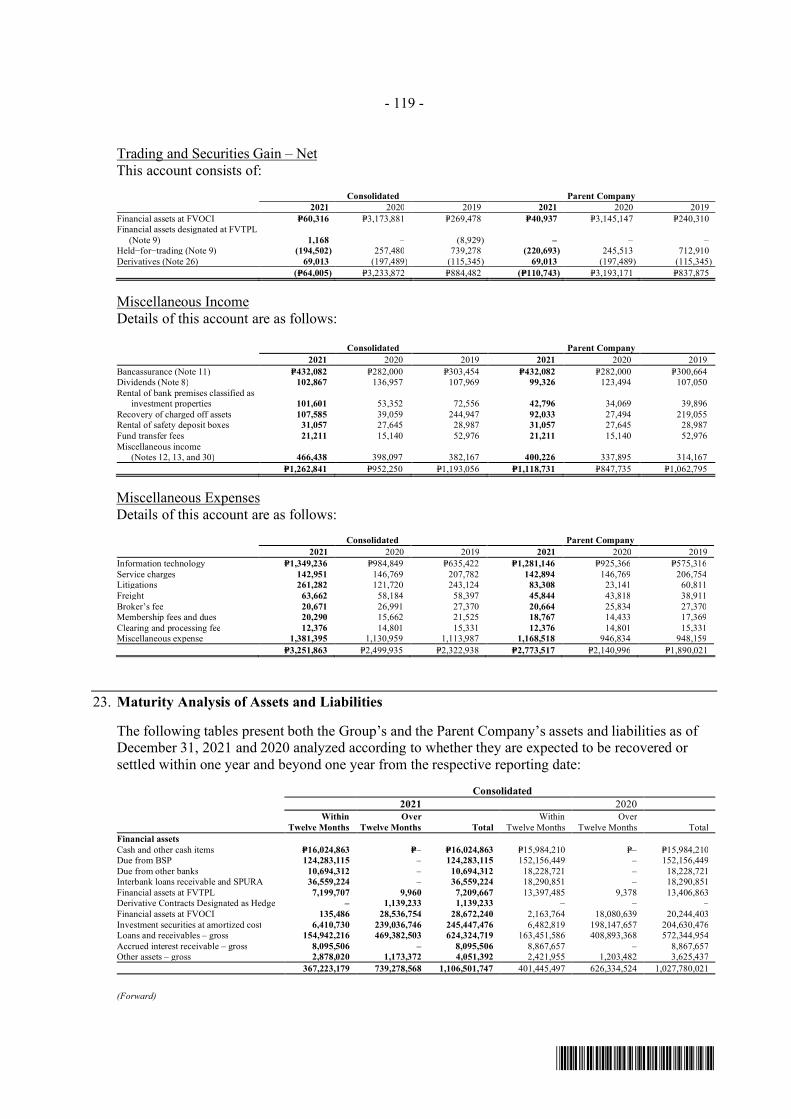
- 119 -
*SGVFS162381*
Trading and Securities Gain – NetThis account consists of:
Consolidated Parent Company2021 2020 2019 2021 2020 2019
Financial assets at FVOCI P=60,316 P=3,173,881 P=269,478 P=40,937 P=3,145,147 P=240,310Financial assets designated at FVTPL
(Note 9) 1,168 – (8,929) – – –Held−for−trading (Note 9) (194,502) 257,480 739,278 (220,693) 245,513 712,910Derivatives (Note 26) 69,013 (197,489) (115,345) 69,013 (197,489) (115,345)
(P=64,005) P=3,233,872 P=884,482 (P=110,743) P=3,193,171 P=837,875
Miscellaneous IncomeDetails of this account are as follows:
Consolidated Parent Company2021 2020 2019 2021 2020 2019
Bancassurance (Note 11) P=432,082 P=282,000 P=303,454 P=432,082 P=282,000 P=300,664Dividends (Note 8) 102,867 136,957 107,969 99,326 123,494 107,050Rental of bank premises classified as
investment properties 101,601 53,352 72,556 42,796 34,069 39,896Recovery of charged off assets 107,585 39,059 244,947 92,033 27,494 219,055Rental of safety deposit boxes 31,057 27,645 28,987 31,057 27,645 28,987Fund transfer fees 21,211 15,140 52,976 21,211 15,140 52,976Miscellaneous income
(Notes 12, 13, and 30) 466,438 398,097 382,167 400,226 337,895 314,167P=1,262,841 P=952,250 P=1,193,056 P=1,118,731 P=847,735 P=1,062,795
Miscellaneous ExpensesDetails of this account are as follows:
Consolidated Parent Company2021 2020 2019 2021 2020 2019
Information technology P=1,349,236 P=984,849 P=635,422 P=1,281,146 P=925,366 P=575,316Service charges 142,951 146,769 207,782 142,894 146,769 206,754Litigations 261,282 121,720 243,124 83,308 23,141 60,811Freight 63,662 58,184 58,397 45,844 43,818 38,911Broker’s fee 20,671 26,991 27,370 20,664 25,834 27,370Membership fees and dues 20,290 15,662 21,525 18,767 14,433 17,369Clearing and processing fee 12,376 14,801 15,331 12,376 14,801 15,331Miscellaneous expense 1,381,395 1,130,959 1,113,987 1,168,518 946,834 948,159
P=3,251,863 P=2,499,935 P=2,322,938 P=2,773,517 P=2,140,996 P=1,890,021
23. Maturity Analysis of Assets and Liabilities
The following tables present both the Group’s and the Parent Company’s assets and liabilities as ofDecember 31, 2021 and 2020 analyzed according to whether they are expected to be recovered orsettled within one year and beyond one year from the respective reporting date:
Consolidated2021 2020
WithinTwelve Months
OverTwelve Months Total
WithinTwelve Months
OverTwelve Months Total
Financial assetsCash and other cash items P=16,024,863 P=– P=16,024,863 P=15,984,210 P=– P=15,984,210Due from BSP 124,283,115 – 124,283,115 152,156,449 – 152,156,449Due from other banks 10,694,312 – 10,694,312 18,228,721 – 18,228,721Interbank loans receivable and SPURA 36,559,224 – 36,559,224 18,290,851 – 18,290,851Financial assets at FVTPL 7,199,707 9,960 7,209,667 13,397,485 9,378 13,406,863Derivative Contracts Designated as Hedge – 1,139,233 1,139,233 – – –Financial assets at FVOCI 135,486 28,536,754 28,672,240 2,163,764 18,080,639 20,244,403Investment securities at amortized cost 6,410,730 239,036,746 245,447,476 6,482,819 198,147,657 204,630,476Loans and receivables – gross 154,942,216 469,382,503 624,324,719 163,451,586 408,893,368 572,344,954Accrued interest receivable – gross 8,095,506 – 8,095,506 8,867,657 – 8,867,657Other assets – gross 2,878,020 1,173,372 4,051,392 2,421,955 1,203,482 3,625,437
367,223,179 739,278,568 1,106,501,747 401,445,497 626,334,524 1,027,780,021
(Forward)
221
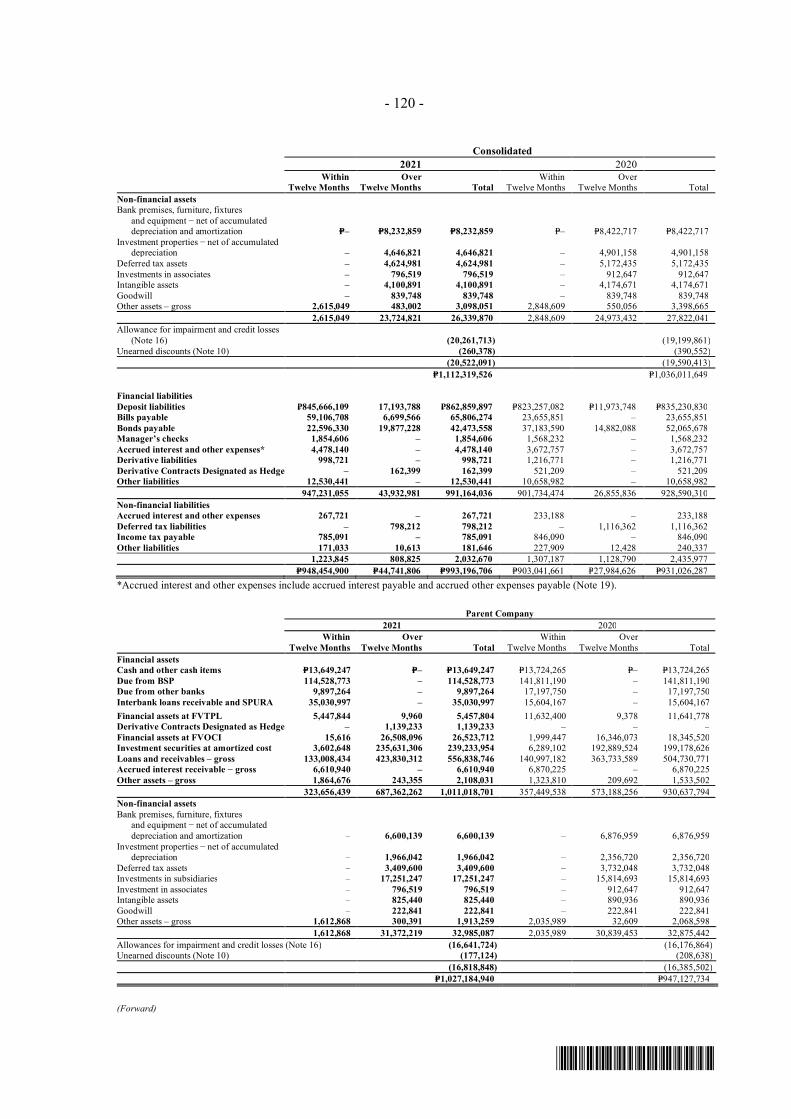
- 120 -
*SGVFS162381*
Consolidated2021 2020
WithinTwelve Months
OverTwelve Months Total
WithinTwelve Months
OverTwelve Months Total
Non-financial assetsBank premises, furniture, fixtures
and equipment − net of accumulateddepreciation and amortization P=– P=8,232,859 P=8,232,859 P=– P=8,422,717 P=8,422,717
Investment properties − net of accumulateddepreciation – 4,646,821 4,646,821 – 4,901,158 4,901,158
Deferred tax assets – 4,624,981 4,624,981 – 5,172,435 5,172,435Investments in associates – 796,519 796,519 – 912,647 912,647Intangible assets – 4,100,891 4,100,891 – 4,174,671 4,174,671Goodwill – 839,748 839,748 – 839,748 839,748Other assets – gross 2,615,049 483,002 3,098,051 2,848,609 550,056 3,398,665
2,615,049 23,724,821 26,339,870 2,848,609 24,973,432 27,822,041Allowance for impairment and credit losses
(Note 16) (20,261,713) (19,199,861)Unearned discounts (Note 10) (260,378) (390,552)
(20,522,091) (19,590,413)P=1,112,319,526 P=1,036,011,649
Financial liabilitiesDeposit liabilities ₽845,666,109 17,193,788 ₽862,859,897 P=823,257,082 P=11,973,748 P=835,230,830Bills payable 59,106,708 6,699,566 65,806,274 23,655,851 – 23,655,851Bonds payable 22,596,330 19,877,228 42,473,558 37,183,590 14,882,088 52,065,678Manager’s checks 1,854,606 – 1,854,606 1,568,232 – 1,568,232Accrued interest and other expenses* 4,478,140 – 4,478,140 3,672,757 – 3,672,757Derivative liabilities 998,721 – 998,721 1,216,771 – 1,216,771Derivative Contracts Designated as Hedge – 162,399 162,399 521,209 – 521,209Other liabilities 12,530,441 – 12,530,441 10,658,982 – 10,658,982
947,231,055 43,932,981 991,164,036 901,734,474 26,855,836 928,590,310Non-financial liabilitiesAccrued interest and other expenses 267,721 – 267,721 233,188 – 233,188Deferred tax liabilities – 798,212 798,212 – 1,116,362 1,116,362Income tax payable 785,091 – 785,091 846,090 – 846,090Other liabilities 171,033 10,613 181,646 227,909 12,428 240,337
1,223,845 808,825 2,032,670 1,307,187 1,128,790 2,435,977P=948,454,900 P=44,741,806 P=993,196,706 P=903,041,661 P=27,984,626 P=931,026,287
*Accrued interest and other expenses include accrued interest payable and accrued other expenses payable (Note 19).
Parent Company2021 2020
WithinTwelve Months
OverTwelve Months Total
WithinTwelve Months
OverTwelve Months Total
Financial assetsCash and other cash items P=13,649,247 P=– P=13,649,247 P=13,724,265 P=– P=13,724,265Due from BSP 114,528,773 – 114,528,773 141,811,190 – 141,811,190Due from other banks 9,897,264 – 9,897,264 17,197,750 – 17,197,750Interbank loans receivable and SPURA 35,030,997 – 35,030,997 15,604,167 – 15,604,167Financial assets at FVTPL 5,447,844 9,960 5,457,804 11,632,400 9,378 11,641,778Derivative Contracts Designated as Hedge – 1,139,233 1,139,233 – – –Financial assets at FVOCI 15,616 26,508,096 26,523,712 1,999,447 16,346,073 18,345,520Investment securities at amortized cost 3,602,648 235,631,306 239,233,954 6,289,102 192,889,524 199,178,626Loans and receivables – gross 133,008,434 423,830,312 556,838,746 140,997,182 363,733,589 504,730,771Accrued interest receivable − gross 6,610,940 – 6,610,940 6,870,225 – 6,870,225Other assets – gross 1,864,676 243,355 2,108,031 1,323,810 209,692 1,533,502
323,656,439 687,362,262 1,011,018,701 357,449,538 573,188,256 930,637,794Non-financial assetsBank premises, furniture, fixtures
and equipment − net of accumulateddepreciation and amortization – 6,600,139 6,600,139 – 6,876,959 6,876,959
Investment properties − net of accumulateddepreciation – 1,966,042 1,966,042 – 2,356,720 2,356,720
Deferred tax assets – 3,409,600 3,409,600 – 3,732,048 3,732,048Investments in subsidiaries – 17,251,247 17,251,247 – 15,814,693 15,814,693Investment in associates – 796,519 796,519 – 912,647 912,647Intangible assets – 825,440 825,440 – 890,936 890,936Goodwill – 222,841 222,841 – 222,841 222,841Other assets – gross 1,612,868 300,391 1,913,259 2,035,989 32,609 2,068,598
1,612,868 31,372,219 32,985,087 2,035,989 30,839,453 32,875,442Allowances for impairment and credit losses (Note 16) (16,641,724) (16,176,864)Unearned discounts (Note 10) (177,124) (208,638)
(16,818,848) (16,385,502) P=1,027,184,940 P=947,127,734
(Forward)
222
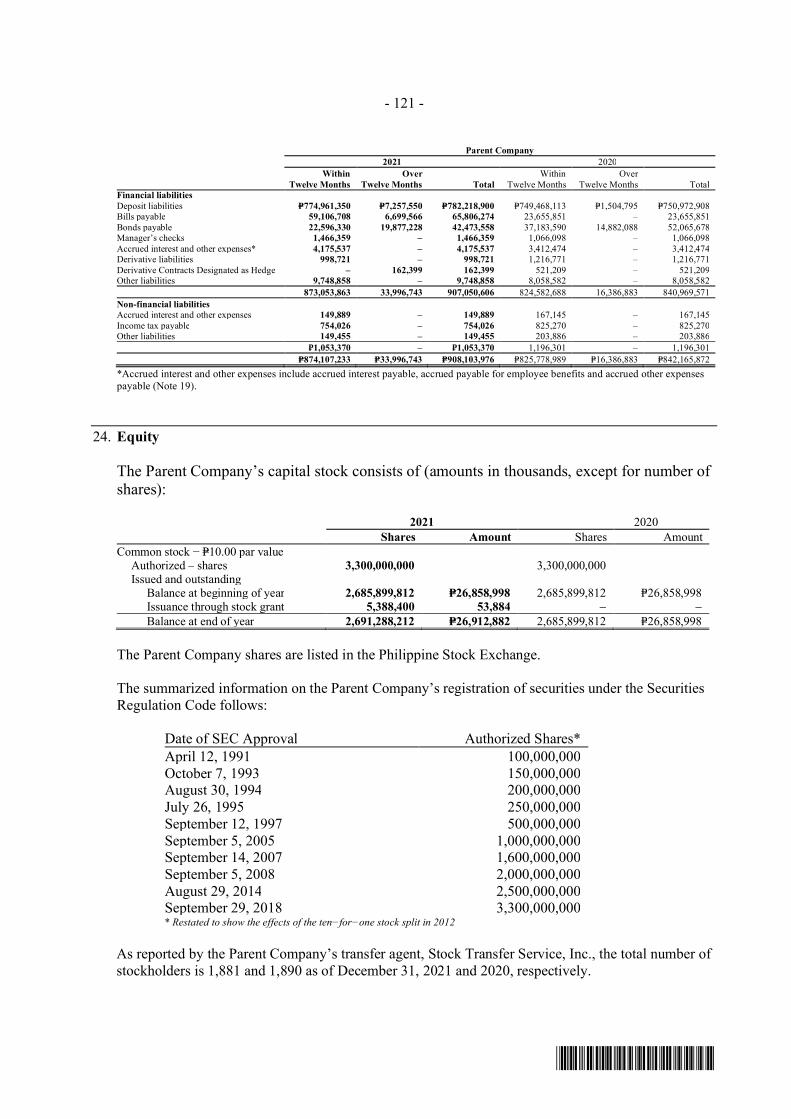
- 121 -
*SGVFS162381*
Parent Company2021 2020
WithinTwelve Months
OverTwelve Months Total
WithinTwelve Months
OverTwelve Months Total
Financial liabilitiesDeposit liabilities P=774,961,350 P=7,257,550 P=782,218,900 P=749,468,113 P=1,504,795 P=750,972,908Bills payable 59,106,708 6,699,566 65,806,274 23,655,851 – 23,655,851Bonds payable 22,596,330 19,877,228 42,473,558 37,183,590 14,882,088 52,065,678Manager’s checks 1,466,359 – 1,466,359 1,066,098 – 1,066,098Accrued interest and other expenses* 4,175,537 – 4,175,537 3,412,474 – 3,412,474Derivative liabilities 998,721 – 998,721 1,216,771 – 1,216,771Derivative Contracts Designated as Hedge – 162,399 162,399 521,209 – 521,209Other liabilities 9,748,858 – 9,748,858 8,058,582 – 8,058,582
873,053,863 33,996,743 907,050,606 824,582,688 16,386,883 840,969,571Non-financial liabilitiesAccrued interest and other expenses 149,889 – 149,889 167,145 – 167,145Income tax payable 754,026 – 754,026 825,270 – 825,270Other liabilities 149,455 – 149,455 203,886 – 203,886
₽1,053,370 – ₽1,053,370 1,196,301 – 1,196,301P=874,107,233 P=33,996,743 P=908,103,976 P=825,778,989 P=16,386,883 P=842,165,872
*Accrued interest and other expenses include accrued interest payable, accrued payable for employee benefits and accrued other expensespayable (Note 19).
24. Equity
The Parent Company’s capital stock consists of (amounts in thousands, except for number ofshares):
2021 2020Shares Amount Shares Amount
Common stock − P=10.00 par valueAuthorized – shares 3,300,000,000 3,300,000,000Issued and outstanding
Balance at beginning of year 2,685,899,812 P=26,858,998 2,685,899,812 P=26,858,998Issuance through stock grant 5,388,400 53,884 – –Balance at end of year 2,691,288,212 P=26,912,882 2,685,899,812 P=26,858,998
The Parent Company shares are listed in the Philippine Stock Exchange.
The summarized information on the Parent Company’s registration of securities under the SecuritiesRegulation Code follows:
Date of SEC Approval Authorized Shares*April 12, 1991 100,000,000October 7, 1993 150,000,000August 30, 1994 200,000,000July 26, 1995 250,000,000September 12, 1997 500,000,000September 5, 2005 1,000,000,000September 14, 2007 1,600,000,000September 5, 2008 2,000,000,000August 29, 2014 2,500,000,000September 29, 2018 3,300,000,000* Restated to show the effects of the ten−for−one stock split in 2012
As reported by the Parent Company’s transfer agent, Stock Transfer Service, Inc., the total number ofstockholders is 1,881 and 1,890 as of December 31, 2021 and 2020, respectively.
223

- 122 -
*SGVFS162381*
Centennial Stock GrantIn light of the Parent Company’s 100th anniversary, the Board of Directors approved onAugust 5, 2020 a Centennial Stock Grant Plan to issue common shares to eligible grantees.
The Centennial Stock Grant Plan was approved and ratified by the stockholders on October 1, 2020and the approvals of the relevant regulatory agencies were completed in 2021. New shares wereissued from the Parent Company’s authorized but unissued shares in favor of the Group’s regularemployees and certain other officers and contractual employees as of August 16, 2020, numberingaround 8,400.
On August 9, 2021, the Philippine Stock Exchange (PSE) approved the Parent Company’s applicationto list 5,451,600 common shares, with a par value of P=10.00 per share, to cover the Group’sCentennial Stock Grant Plan. The Parent Company issued a total of 5.39 million shares onSeptember 1, 2021. This resulted in an increase in the Parent Company’s ‘Capital stock’ and ‘Capitalpaid in excess of par value’ totaling P=132.02 million as of the grant date. The difference in the fairvalue of the stock grants upon issuance of shares is recognized in the profit or loss.
DividendsDetails of the Parent Company’s cash dividend payments follow:
Cash Dividends
Date of Date of Date of Cash DividendDeclaration Record Payment Per ShareMay 6, 2021 May 21, 2021 June 4, 2021 1.00June 18, 2020 July 03, 2020 July 17, 2020 1.00May 02, 2019 May 17, 2019 May 31, 2019 0.88May 03, 2018 May 17, 2018 June 01, 2018 0.83May 04, 2017 May 18, 2017 June 02, 2017 0.80May 05, 2016 May 23, 2016 June 03, 2016 1.00May 07, 2015 August 12, 2015 September 09, 2015 1.00May 08, 2014 September 19, 2014 October 15, 2014 1.00May 02, 2013 July 19, 2013 August 14, 2013 1.20
Stock Dividends
Date of Date of Date of Stock DividendDeclaration Record Payment Per ShareMarch 15, 2017 October 20, 2017 November 03, 2017 8%May 05, 2016 May 23, 2016 June 03, 2016 8%May 07, 2015 August 12, 2015 September 09, 2015 8%May 08, 2014 September 19, 2014 October 15, 2014 8%May 02, 2013 July 19, 2013 August 14, 2013 10%
SurplusThe computation of surplus available for dividend declaration in accordance with SEC MemorandumCircular No. 11 issued in December 2008 differs to a certain extent from the computation followingBSP guidelines.
As of December 31, 2021 and 2020, surplus includes the amount of P=1.37 billion and P=1.28 billion,net of deferred tax effect of P=456.17 million and P=547.41 million, respectively, representing transferof revaluation increment on land which was carried at deemed cost when the Group transitioned toPFRS in 2005 (Note 12). This amount will be available to be declared as dividends upon sale of theunderlying land.
224
- 123 -
*SGVFS162381*
In the consolidated financial statements, a portion of the Group’s surplus corresponding to the netearnings of the subsidiaries and associates amounting to P=5.10 billion and P=3.68 billion as ofDecember 31, 2021 and 2020, respectively, is not available for dividend declaration. Theaccumulated equity in net earnings becomes available for dividends upon declaration and receipt ofcash dividends from the investees.
ReservesIn compliance with BSP regulations, 10.00% of the Parent Company’s profit from trust business isappropriated to surplus reserve. This annual appropriation is required until the surplus reserves fortrust business equals 20.00% of the Parent Company’s authorized capital stock.
Upon adoption of PFRS 9, BSP requires appropriation of a portion of the Group’s Surplus at anamount necessary to bring to at least 1% the allowance for credit losses on loans (Note 16).
Capital ManagementThe primary objectives of the Group’s capital management are to ensure that it complies withexternally imposed capital requirements and that it maintains strong credit ratings and healthy capitalratios in order to support its business and to maximize shareholders’ value.
The Group manages its capital structure and makes adjustments to it in light of changes in economicconditions and the risk characteristics of its activities. In order to maintain or adjust the capitalstructure, the Group may adjust the amount of dividend payment to shareholders, return capital toshareholders or issue capital securities. No changes were made in the objectives, policies andprocesses as of December 31, 2021 and 2020.
Regulatory Qualifying CapitalUnder existing BSP regulations, the determination of the Parent Company’s compliance withregulatory requirements and ratios is based on the amount of the Parent Company’s unimpairedcapital (regulatory capital) as reported to the BSP. This is determined on the basis of regulatoryaccounting policies which differ from PFRS in some respects.
In addition, the risk−based capital ratio of a bank, expressed as a percentage of qualifying capital torisk−weighted assets (RWA), should not be less than 10.00% for both solo basis (head office andbranches) and consolidated basis (Parent Company and subsidiaries engaged in financial alliedundertakings but excluding insurance companies). Qualifying capital and RWA are computed basedon BSP regulations. RWA consists of total assets less cash on hand, due from BSP, loans covered byhold−out on or assignment of deposits, loans or acceptances under letters of credit to the extentcovered by margin deposits and other non−risk items determined by the Monetary Board of the BSP.
On August 4, 2006, the BSP, under BSP Circular No. 538, issued the prescribed guidelinesimplementing the revised risk−based capital adequacy framework for the Philippine banking systemto conform to Basel II capital adequacy framework. The BSP guidelines took effect on July 1, 2007.Thereafter, banks were required to compute their CAR using these guidelines.
Standardized credit risk weights were used in the credit assessment of asset exposures. Third partycredit assessments were based on ratings by international credit assessment agencies Standard &Poor's, Moody's and Fitch, and BSP-recognized domestic credit assessment agencies such asPhilRatings. Per BSP guidelines, domestic debt issuances may be rated by Bangko Sentral-recognizeddomestic credit assessment agencies or by international credit assessment agencies which havedeveloped a national rating system acceptable to the Bangko Sentral. Internationally-issued debtobligations shall be rated by Bangko Sentral-recognized international credit assessment agenciesonly.
225
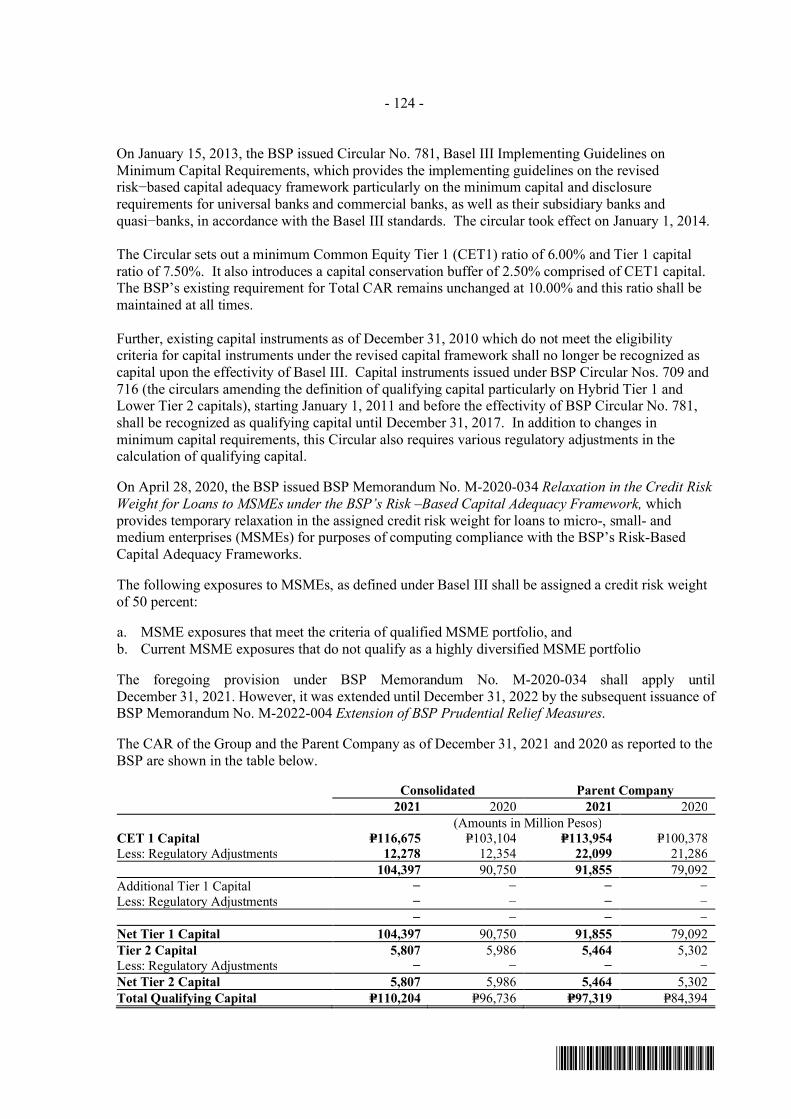
- 124 -
*SGVFS162381*
On January 15, 2013, the BSP issued Circular No. 781, Basel III Implementing Guidelines onMinimum Capital Requirements, which provides the implementing guidelines on the revisedrisk−based capital adequacy framework particularly on the minimum capital and disclosurerequirements for universal banks and commercial banks, as well as their subsidiary banks andquasi−banks, in accordance with the Basel III standards. The circular took effect on January 1, 2014.
The Circular sets out a minimum Common Equity Tier 1 (CET1) ratio of 6.00% and Tier 1 capitalratio of 7.50%. It also introduces a capital conservation buffer of 2.50% comprised of CET1 capital.The BSP’s existing requirement for Total CAR remains unchanged at 10.00% and this ratio shall bemaintained at all times.
Further, existing capital instruments as of December 31, 2010 which do not meet the eligibilitycriteria for capital instruments under the revised capital framework shall no longer be recognized ascapital upon the effectivity of Basel III. Capital instruments issued under BSP Circular Nos. 709 and716 (the circulars amending the definition of qualifying capital particularly on Hybrid Tier 1 andLower Tier 2 capitals), starting January 1, 2011 and before the effectivity of BSP Circular No. 781,shall be recognized as qualifying capital until December 31, 2017. In addition to changes inminimum capital requirements, this Circular also requires various regulatory adjustments in thecalculation of qualifying capital.
On April 28, 2020, the BSP issued BSP Memorandum No. M-2020-034 Relaxation in the Credit RiskWeight for Loans to MSMEs under the BSP’s Risk –Based Capital Adequacy Framework, whichprovides temporary relaxation in the assigned credit risk weight for loans to micro-, small- andmedium enterprises (MSMEs) for purposes of computing compliance with the BSP’s Risk-BasedCapital Adequacy Frameworks.
The following exposures to MSMEs, as defined under Basel III shall be assigned a credit risk weightof 50 percent:
a. MSME exposures that meet the criteria of qualified MSME portfolio, andb. Current MSME exposures that do not qualify as a highly diversified MSME portfolio
The foregoing provision under BSP Memorandum No. M-2020-034 shall apply untilDecember 31, 2021. However, it was extended until December 31, 2022 by the subsequent issuance ofBSP Memorandum No. M-2022-004 Extension of BSP Prudential Relief Measures.
The CAR of the Group and the Parent Company as of December 31, 2021 and 2020 as reported to theBSP are shown in the table below.
Consolidated Parent Company2021 2020 2021 2020
(Amounts in Million Pesos)CET 1 Capital P=116,675 P=103,104 P=113,954 P=100,378Less: Regulatory Adjustments 12,278 12,354 22,099 21,286
104,397 90,750 91,855 79,092Additional Tier 1 Capital − − − −Less: Regulatory Adjustments − − − −
− − − −Net Tier 1 Capital 104,397 90,750 91,855 79,092Tier 2 Capital 5,807 5,986 5,464 5,302Less: Regulatory Adjustments − − − −Net Tier 2 Capital 5,807 5,986 5,464 5,302Total Qualifying Capital P=110,204 P=96,736 P=97,319 P=84,394
226
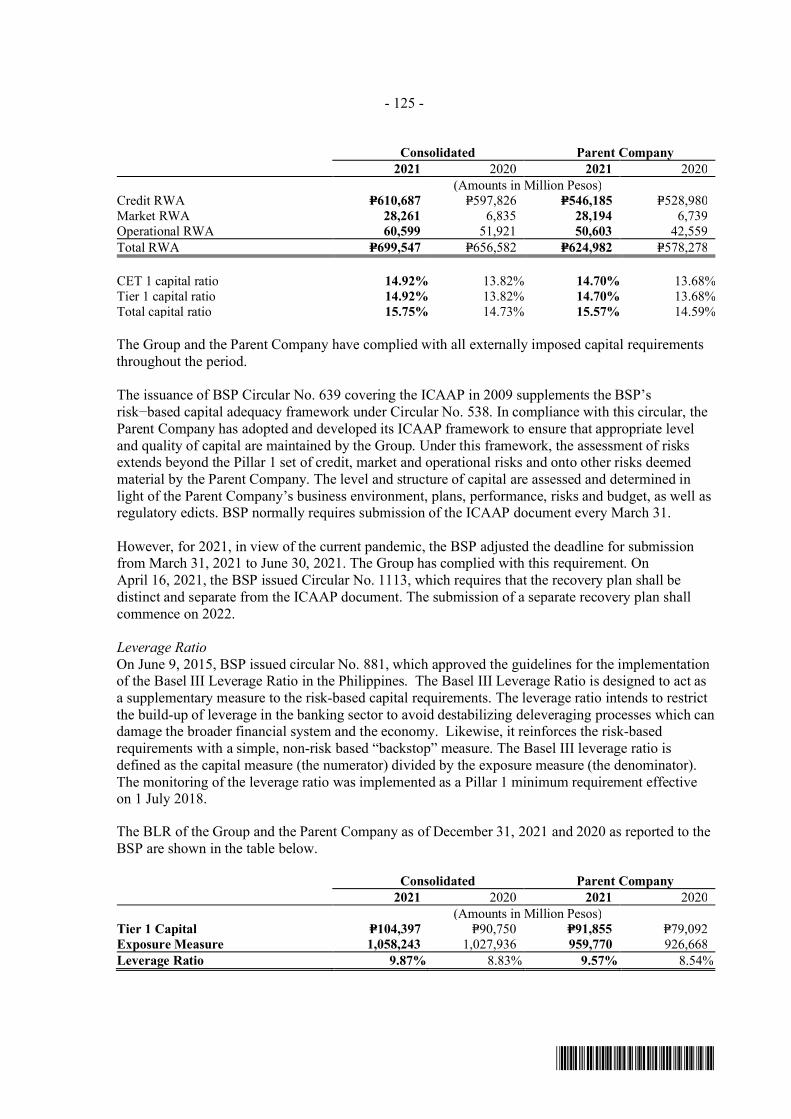
- 125 -
*SGVFS162381*
Consolidated Parent Company2021 2020 2021 2020
(Amounts in Million Pesos)Credit RWA P=610,687 P=597,826 P=546,185 P=528,980Market RWA 28,261 6,835 28,194 6,739Operational RWA 60,599 51,921 50,603 42,559Total RWA P=699,547 P=656,582 P=624,982 P=578,278
CET 1 capital ratio 14.92% 13.82% 14.70% 13.68%Tier 1 capital ratio 14.92% 13.82% 14.70% 13.68%Total capital ratio 15.75% 14.73% 15.57% 14.59%
The Group and the Parent Company have complied with all externally imposed capital requirementsthroughout the period.
The issuance of BSP Circular No. 639 covering the ICAAP in 2009 supplements the BSP’srisk−based capital adequacy framework under Circular No. 538. In compliance with this circular, theParent Company has adopted and developed its ICAAP framework to ensure that appropriate leveland quality of capital are maintained by the Group. Under this framework, the assessment of risksextends beyond the Pillar 1 set of credit, market and operational risks and onto other risks deemedmaterial by the Parent Company. The level and structure of capital are assessed and determined inlight of the Parent Company’s business environment, plans, performance, risks and budget, as well asregulatory edicts. BSP normally requires submission of the ICAAP document every March 31.
However, for 2021, in view of the current pandemic, the BSP adjusted the deadline for submissionfrom March 31, 2021 to June 30, 2021. The Group has complied with this requirement. OnApril 16, 2021, the BSP issued Circular No. 1113, which requires that the recovery plan shall bedistinct and separate from the ICAAP document. The submission of a separate recovery plan shallcommence on 2022.
Leverage RatioOn June 9, 2015, BSP issued circular No. 881, which approved the guidelines for the implementationof the Basel III Leverage Ratio in the Philippines. The Basel III Leverage Ratio is designed to act asa supplementary measure to the risk-based capital requirements. The leverage ratio intends to restrictthe build-up of leverage in the banking sector to avoid destabilizing deleveraging processes which candamage the broader financial system and the economy. Likewise, it reinforces the risk-basedrequirements with a simple, non-risk based “backstop” measure. The Basel III leverage ratio isdefined as the capital measure (the numerator) divided by the exposure measure (the denominator).The monitoring of the leverage ratio was implemented as a Pillar 1 minimum requirement effectiveon 1 July 2018.
The BLR of the Group and the Parent Company as of December 31, 2021 and 2020 as reported to theBSP are shown in the table below.
Consolidated Parent Company2021 2020 2021 2020
(Amounts in Million Pesos)Tier 1 Capital P=104,397 P=90,750 P=91,855 P=79,092Exposure Measure 1,058,243 1,027,936 959,770 926,668Leverage Ratio 9.87% 8.83% 9.57% 8.54%
227
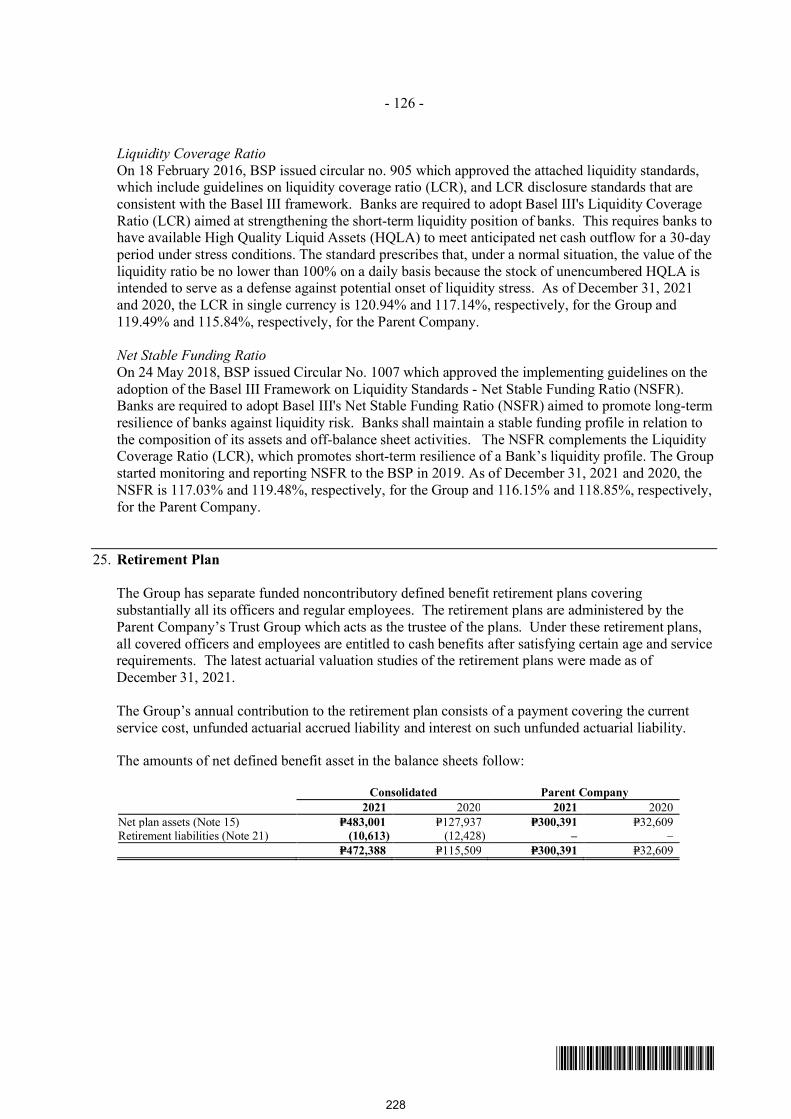
- 126 -
*SGVFS162381*
Liquidity Coverage RatioOn 18 February 2016, BSP issued circular no. 905 which approved the attached liquidity standards,which include guidelines on liquidity coverage ratio (LCR), and LCR disclosure standards that areconsistent with the Basel III framework. Banks are required to adopt Basel III's Liquidity CoverageRatio (LCR) aimed at strengthening the short-term liquidity position of banks. This requires banks tohave available High Quality Liquid Assets (HQLA) to meet anticipated net cash outflow for a 30-dayperiod under stress conditions. The standard prescribes that, under a normal situation, the value of theliquidity ratio be no lower than 100% on a daily basis because the stock of unencumbered HQLA isintended to serve as a defense against potential onset of liquidity stress. As of December 31, 2021and 2020, the LCR in single currency is 120.94% and 117.14%, respectively, for the Group and119.49% and 115.84%, respectively, for the Parent Company.
Net Stable Funding RatioOn 24 May 2018, BSP issued Circular No. 1007 which approved the implementing guidelines on theadoption of the Basel III Framework on Liquidity Standards - Net Stable Funding Ratio (NSFR).Banks are required to adopt Basel III's Net Stable Funding Ratio (NSFR) aimed to promote long-termresilience of banks against liquidity risk. Banks shall maintain a stable funding profile in relation tothe composition of its assets and off-balance sheet activities. The NSFR complements the LiquidityCoverage Ratio (LCR), which promotes short-term resilience of a Bank’s liquidity profile. The Groupstarted monitoring and reporting NSFR to the BSP in 2019. As of December 31, 2021 and 2020, theNSFR is 117.03% and 119.48%, respectively, for the Group and 116.15% and 118.85%, respectively,for the Parent Company.
25. Retirement Plan
The Group has separate funded noncontributory defined benefit retirement plans coveringsubstantially all its officers and regular employees. The retirement plans are administered by theParent Company’s Trust Group which acts as the trustee of the plans. Under these retirement plans,all covered officers and employees are entitled to cash benefits after satisfying certain age and servicerequirements. The latest actuarial valuation studies of the retirement plans were made as ofDecember 31, 2021.
The Group’s annual contribution to the retirement plan consists of a payment covering the currentservice cost, unfunded actuarial accrued liability and interest on such unfunded actuarial liability.
The amounts of net defined benefit asset in the balance sheets follow:
Consolidated Parent Company2021 2020 2021 2020
Net plan assets (Note 15) P=483,001 P=127,937 P=300,391 P=32,609Retirement liabilities (Note 21) (10,613) (12,428) – –
P=472,388 P=115,509 P=300,391 P=32,609
228
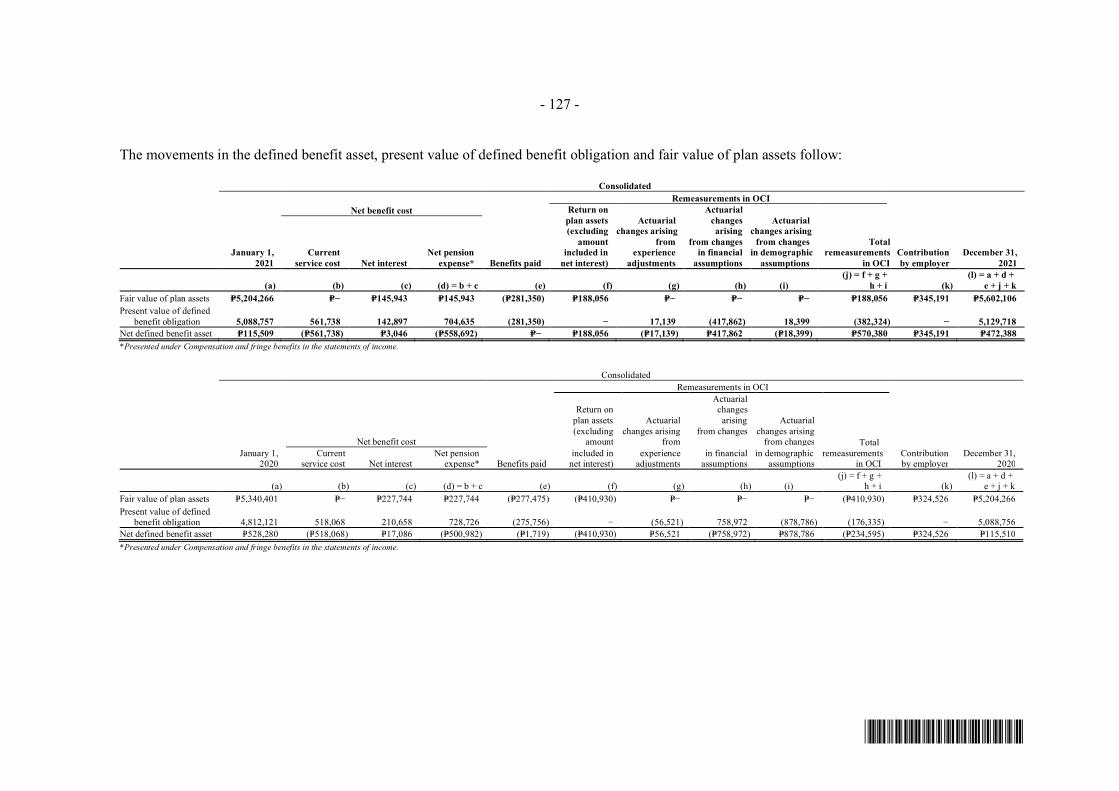
- 127 -
*SGVFS162381*
The movements in the defined benefit asset, present value of defined benefit obligation and fair value of plan assets follow:
ConsolidatedRemeasurements in OCI
Net benefit cost Return onplan assets(excluding
amountincluded in
net interest)
Actuarialchanges arising
fromexperience
adjustments
Actuarialchanges arising
from changesin financial
assumptions
Actuarialchanges arising
from changesin demographic
assumptions
Totalremeasurements
in OCIContributionby employer
December 31,2021
January 1,2021
Currentservice cost Net interest
Net pensionexpense* Benefits paid
(a) (b) (c) (d) = b + c (e) (f) (g) (h) (i)(j) = f + g +
h + i (k)(l) = a + d +
e + j + kFair value of plan assets P=5,204,266 P=− P=145,943 P=145,943 (P=281,350) P=188,056 P=− P=− P=− P=188,056 P=345,191 P=5,602,106Present value of defined
benefit obligation 5,088,757 561,738 142,897 704,635 (281,350) − 17,139 (417,862) 18,399 (382,324) − 5,129,718Net defined benefit asset P=115,509 (P=561,738) P=3,046 (P=558,692) P=− P=188,056 (P=17,139) P=417,862 (P=18,399) P=570,380 P=345,191 P=472,388*Presented under Compensation and fringe benefits in the statements of income.
ConsolidatedRemeasurements in OCI
Net benefit cost
Return onplan assets(excluding
amount
Actuarialchanges arising
from
Actuarialchanges arising
from changesActuarial
changes arisingfrom changes Total
remeasurementsin OCI
January 1,2020
Currentservice cost Net interest
Net pensionexpense* Benefits paid
included innet interest)
experienceadjustments
in financialassumptions
in demographicassumptions
Contributionby employer
December 31,2020
(a) (b) (c) (d) = b + c (e) (f) (g) (h) (i)(j) = f + g +
h + i (k)(l) = a + d +
e + j + kFair value of plan assets P=5,340,401 P=− P=227,744 P=227,744 (P=277,475) (P=410,930) P=− P=− P=− (P=410,930) P=324,526 P=5,204,266Present value of defined
benefit obligation 4,812,121 518,068 210,658 728,726 (275,756) − (56,521) 758,972 (878,786) (176,335) − 5,088,756Net defined benefit asset P=528,280 (P=518,068) P=17,086 (P=500,982) (P=1,719) (P=410,930) P=56,521 (P=758,972) P=878,786 (P=234,595) P=324,526 P=115,510*Presented under Compensation and fringe benefits in the statements of income.
229
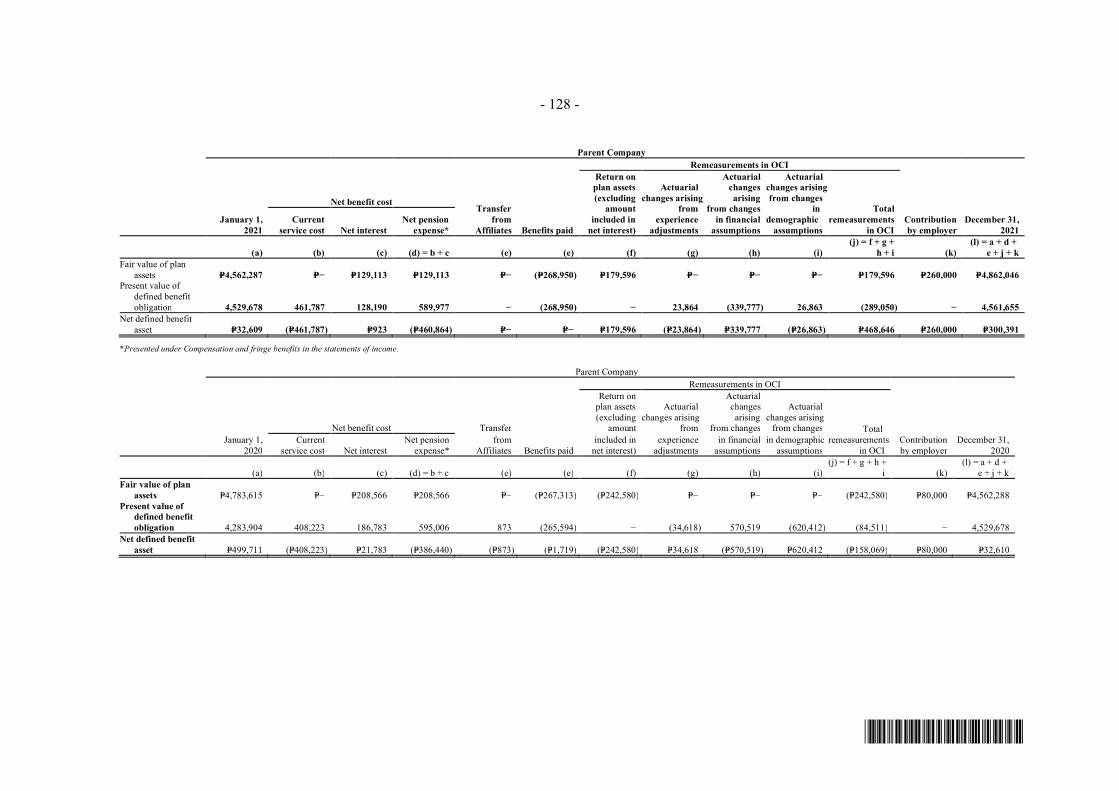
- 128 -
*SGVFS162381*
Parent CompanyRemeasurements in OCI
Transferfrom
Affiliates
Return onplan assets(excluding
amountincluded in
net interest)
Actuarialchanges arising
fromexperience
adjustments
Actuarialchanges arising
from changesin financial
assumptions
Actuarialchanges arisingfrom changes
indemographic
assumptions
Totalremeasurements
in OCI
Net benefit cost
January 1,2021
Currentservice cost Net interest
Net pensionexpense* Benefits paid
Contributionby employer
December 31,2021
(a) (b) (c) (d) = b + c (e) (e) (f) (g) (h) (i)(j) = f + g +
h + i (k)(l) = a + d +
e + j + kFair value of plan
assets P=4,562,287 P=− P=129,113 P=129,113 P=− (P=268,950) P=179,596 P=− P=− P=− P=179,596 P=260,000 P=4,862,046Present value of
defined benefitobligation 4,529,678 461,787 128,190 589,977 − (268,950) − 23,864 (339,777) 26,863 (289,050) − 4,561,655
Net defined benefitasset P=32,609 (P=461,787) P=923 (P=460,864) P=− P=− P=179,596 (P=23,864) P=339,777 (P=26,863) P=468,646 P=260,000 P=300,391
*Presented under Compensation and fringe benefits in the statements of income.
Parent CompanyRemeasurements in OCI
Net benefit cost Transfer
Return onplan assets(excluding
amount
Actuarialchanges arising
from
Actuarialchanges arising
from changes
Actuarialchanges arising
from changes Totalremeasurements
in OCIJanuary 1,
2020Current
service cost Net interestNet pension
expense*from
Affiliates Benefits paidincluded in
net interest)experience
adjustmentsin financial
assumptionsin demographic
assumptionsContributionby employer
December 31,2020
(a) (b) (c) (d) = b + c (e) (e) (f) (g) (h) (i)(j) = f + g + h +
i (k)(l) = a + d +
e + j + kFair value of plan
assets P=4,783,615 P=− P=208,566 P=208,566 P=− (P=267,313) (P=242,580) P=− P=− P=− (P=242,580) P=80,000 P=4,562,288Present value of
defined benefitobligation 4,283,904 408,223 186,783 595,006 873 (265,594) − (34,618) 570,519 (620,412) (84,511) − 4,529,678
Net defined benefitasset P=499,711 (P=408,223) P=21,783 (P=386,440) (P=873) (P=1,719) (P=242,580) P=34,618 (P=570,519) P=620,412 (P=158,069) P=80,000 P=32,610
230
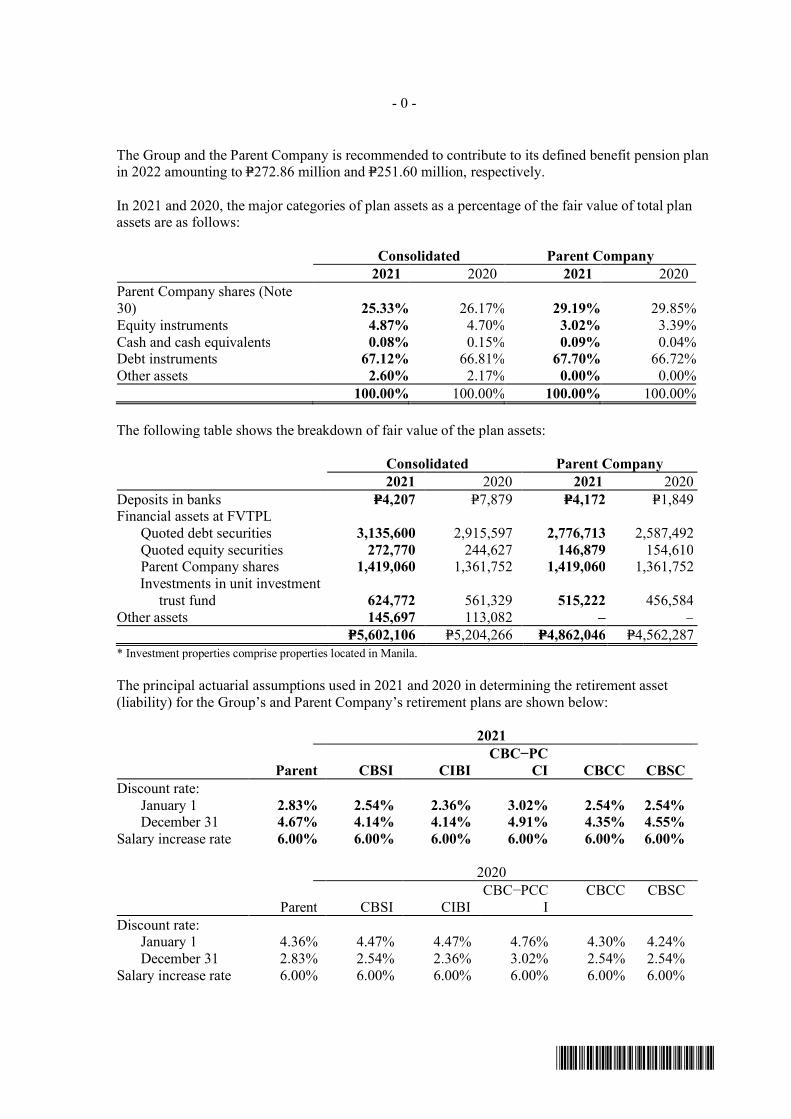
- 0 -
*SGVFS162381*
The Group and the Parent Company is recommended to contribute to its defined benefit pension planin 2022 amounting to P=272.86 million and P=251.60 million, respectively.
In 2021 and 2020, the major categories of plan assets as a percentage of the fair value of total planassets are as follows:
Consolidated Parent Company2021 2020 2021 2020
Parent Company shares (Note30) 25.33% 26.17% 29.19% 29.85%Equity instruments 4.87% 4.70% 3.02% 3.39%Cash and cash equivalents 0.08% 0.15% 0.09% 0.04%Debt instruments 67.12% 66.81% 67.70% 66.72%Other assets 2.60% 2.17% 0.00% 0.00%
100.00% 100.00% 100.00% 100.00%
The following table shows the breakdown of fair value of the plan assets:
Consolidated Parent Company2021 2020 2021 2020
Deposits in banks P=4,207 P=7,879 P=4,172 P=1,849Financial assets at FVTPL
Quoted debt securities 3,135,600 2,915,597 2,776,713 2,587,492Quoted equity securities 272,770 244,627 146,879 154,610Parent Company shares 1,419,060 1,361,752 1,419,060 1,361,752Investments in unit investment
trust fund 624,772 561,329 515,222 456,584Other assets 145,697 113,082 – –
P=5,602,106 P=5,204,266 P=4,862,046 P=4,562,287* Investment properties comprise properties located in Manila.
The principal actuarial assumptions used in 2021 and 2020 in determining the retirement asset(liability) for the Group’s and Parent Company’s retirement plans are shown below:
2021
Parent CBSI CIBICBC−PC
CI CBCC CBSCDiscount rate:
January 1 2.83% 2.54% 2.36% 3.02% 2.54% 2.54%December 31 4.67% 4.14% 4.14% 4.91% 4.35% 4.55%
Salary increase rate 6.00% 6.00% 6.00% 6.00% 6.00% 6.00%
2020
Parent CBSI CIBICBC−PCC
ICBCC CBSC
Discount rate:January 1 4.36% 4.47% 4.47% 4.76% 4.30% 4.24%December 31 2.83% 2.54% 2.36% 3.02% 2.54% 2.54%
Salary increase rate 6.00% 6.00% 6.00% 6.00% 6.00% 6.00%
231
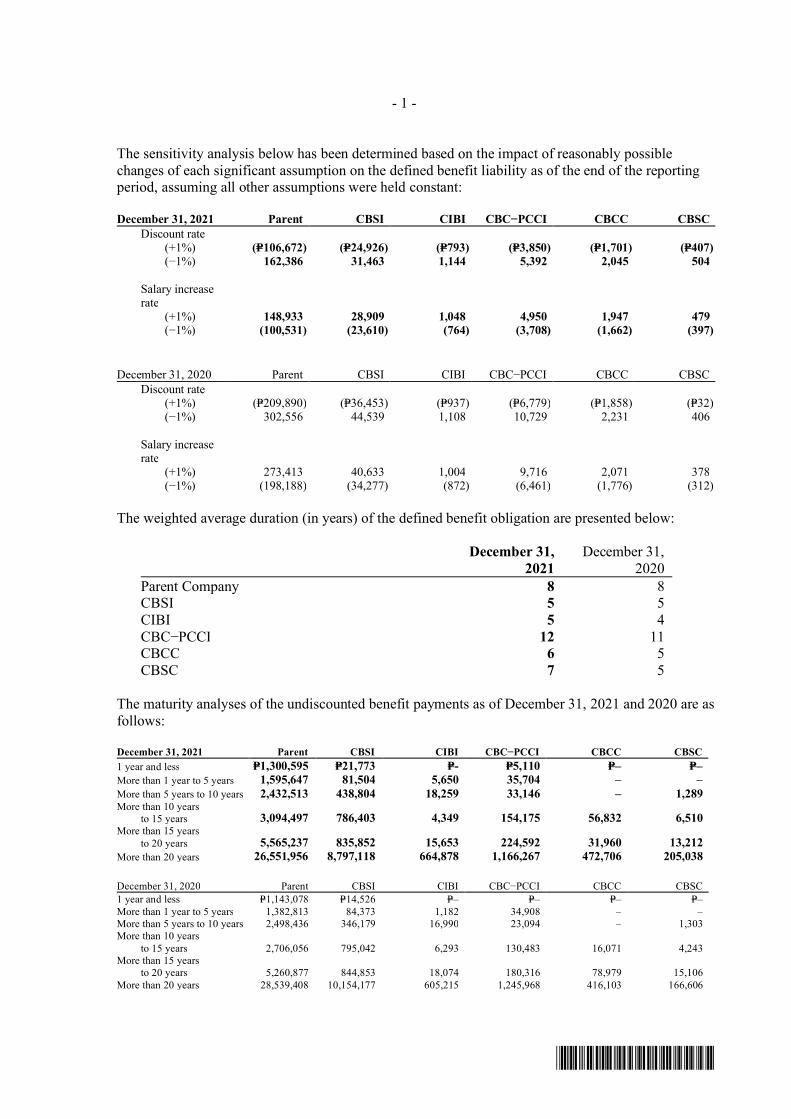
- 1 -
*SGVFS162381*
The sensitivity analysis below has been determined based on the impact of reasonably possiblechanges of each significant assumption on the defined benefit liability as of the end of the reportingperiod, assuming all other assumptions were held constant:
December 31, 2021 Parent CBSI CIBI CBC−PCCI CBCC CBSCDiscount rate
(+1%) (P=106,672) (P=24,926) (P=793) (P=3,850) (P=1,701) (P=407) (−1%) 162,386 31,463 1,144 5,392 2,045 504
Salary increaserate
(+1%) 148,933 28,909 1,048 4,950 1,947 479(−1%) (100,531) (23,610) (764) (3,708) (1,662) (397)
December 31, 2020 Parent CBSI CIBI CBC−PCCI CBCC CBSCDiscount rate
(+1%) (P=209,890) (P=36,453) (P=937) (P=6,779) (P=1,858) (P=32) (−1%) 302,556 44,539 1,108 10,729 2,231 406
Salary increaserate
(+1%) 273,413 40,633 1,004 9,716 2,071 378(−1%) (198,188) (34,277) (872) (6,461) (1,776) (312)
The weighted average duration (in years) of the defined benefit obligation are presented below:
December 31,2021
December 31,2020
Parent Company 8 8CBSI 5 5CIBI 5 4CBC−PCCI 12 11CBCC 6 5CBSC 7 5
The maturity analyses of the undiscounted benefit payments as of December 31, 2021 and 2020 are asfollows:
December 31, 2021 Parent CBSI CIBI CBC−PCCI CBCC CBSC1 year and less P=1,300,595 P=21,773 P=- P=5,110 P=– P=–More than 1 year to 5 years 1,595,647 81,504 5,650 35,704 – –More than 5 years to 10 years 2,432,513 438,804 18,259 33,146 – 1,289More than 10 years
to 15 years 3,094,497 786,403 4,349 154,175 56,832 6,510More than 15 years
to 20 years 5,565,237 835,852 15,653 224,592 31,960 13,212More than 20 years 26,551,956 8,797,118 664,878 1,166,267 472,706 205,038
December 31, 2020 Parent CBSI CIBI CBC−PCCI CBCC CBSC1 year and less P=1,143,078 P=14,526 P=– P=– P=– P=–More than 1 year to 5 years 1,382,813 84,373 1,182 34,908 – –More than 5 years to 10 years 2,498,436 346,179 16,990 23,094 – 1,303More than 10 years
to 15 years 2,706,056 795,042 6,293 130,483 16,071 4,243More than 15 years
to 20 years 5,260,877 844,853 18,074 180,316 78,979 15,106More than 20 years 28,539,408 10,154,177 605,215 1,245,968 416,103 166,606
232

- 2 -
*SGVFS162381*
The defined benefit plan exposes the Group and the Parent Company to actuarial risks such aslongevity risk, investment risk, market risk and salary risk.
26. Derivative Financial Instruments
Occasionally, the Parent Company enters into forward exchange contracts as an accommodation toits clients. These derivatives are not designated as accounting hedges. As of December 31, 2021 and2020, the fair values of these derivatives follow:
2021 2020Derivative
AssetDerivative
LiabilityDerivative
AssetDerivative
LiabilityCurrency forwards P=395,201 P=264,783 P=107,900 P=124,137Interest rate swaps (IRS) 675,638 706,112 1,019,600 1,092,634Futures – 27,826 – –Warrants 9,960 – 9,378 –
P=1,080,799 P=998,721 P=1,136,878 P=1,216,771
As of December 31, 2021 and 2020, the aggregate notional amount of outstanding forwards and itsweighted average rate are as follows:
2021 2020
NotionalAmount
WeightedAverage
Rate NotionalAmount
WeightedAverage Rate
US DollarBuy $687,896 P=50.52 $358,209 P=48.40Sell $291,629 P=50.31 $253,506 P=48.49
EuroBuy – – – –Sell €9,128 P=58.03 €44,900 P=58.72
Singapore DollarSell – – SGD 1,007 P=36.14
New Zealand DollarBuy NZD 10,628 P=34.77 – –
Canadian DollarBuy CAD 695 P=40.37 – –
Australian Dollar Sell AUD 10,750 P=36.99 – –
The aggregate notional amounts of the outstanding futures as of December 31, 2021 amounted toUS$100.5 million.
The aggregate notional amounts of the outstanding IRS as of December 31, 2021 and 2020 are asfollows:
2021 2020 NotionalAmount
DerivativeAsset
DerivativeLiability
NotionalAmount
DerivativeAsset
DerivativeLiability
Peso-denominated
Fixed Receiver P=500,000 P=1,572 1,511 P=500,000 P=5,202 P=575Fixed Payer P=500,000 – 28,581 P=600,000 – 53,147
US dollardenominated
Fixed Receiver $184,000 666,807 – $180,000 1,014,059 –Fixed Payer $187,000 7,259 676,019 $175,000 339 1,038,908
P=675,638 P=706,111 P=1,019,600 P=1,092,634
233
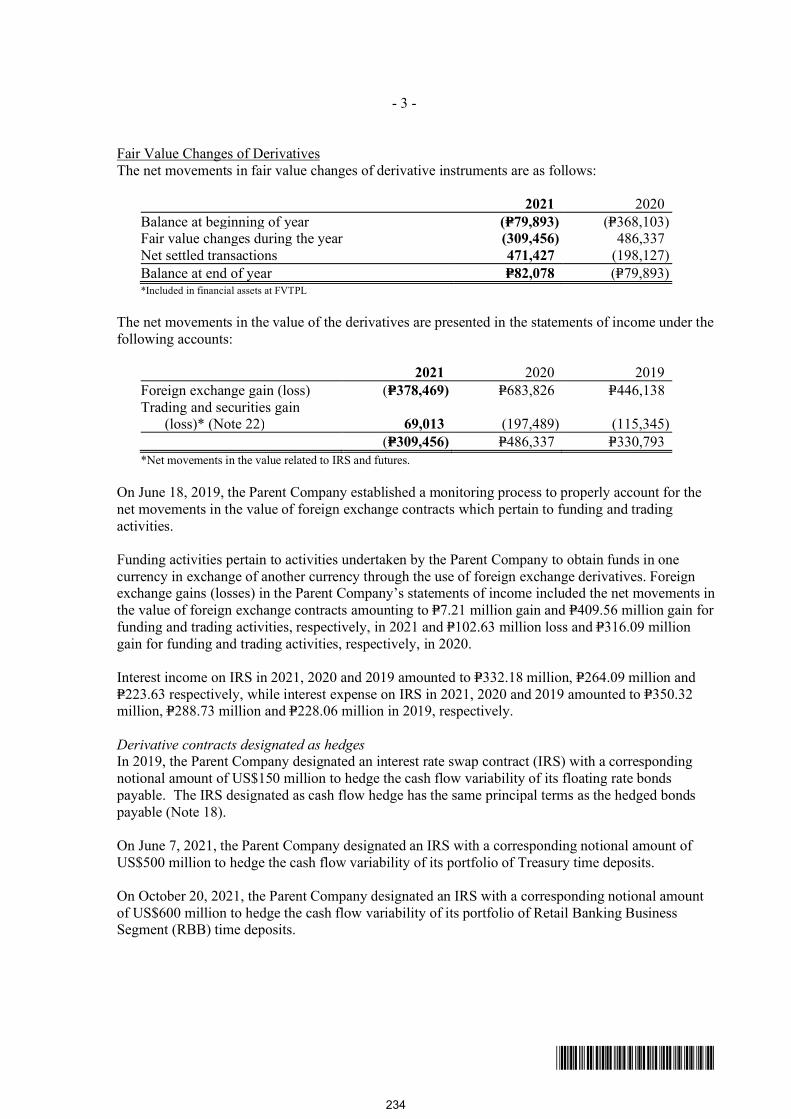
- 3 -
*SGVFS162381*
Fair Value Changes of DerivativesThe net movements in fair value changes of derivative instruments are as follows:
2021 2020Balance at beginning of year (P=79,893) (P=368,103)Fair value changes during the year (309,456) 486,337Net settled transactions 471,427 (198,127)Balance at end of year P=82,078 (P=79,893)*Included in financial assets at FVTPL
The net movements in the value of the derivatives are presented in the statements of income under thefollowing accounts:
2021 2020 2019Foreign exchange gain (loss) (P=378,469) P=683,826 P=446,138Trading and securities gain
(loss)* (Note 22) 69,013 (197,489) (115,345)(P=309,456) P=486,337 P=330,793
*Net movements in the value related to IRS and futures.
On June 18, 2019, the Parent Company established a monitoring process to properly account for thenet movements in the value of foreign exchange contracts which pertain to funding and tradingactivities.
Funding activities pertain to activities undertaken by the Parent Company to obtain funds in onecurrency in exchange of another currency through the use of foreign exchange derivatives. Foreignexchange gains (losses) in the Parent Company’s statements of income included the net movements inthe value of foreign exchange contracts amounting to P=7.21 million gain and P=409.56 million gain forfunding and trading activities, respectively, in 2021 and P=102.63 million loss and P=316.09 milliongain for funding and trading activities, respectively, in 2020.
Interest income on IRS in 2021, 2020 and 2019 amounted to P=332.18 million, P=264.09 million andP=223.63 respectively, while interest expense on IRS in 2021, 2020 and 2019 amounted to P=350.32million, P=288.73 million and P=228.06 million in 2019, respectively.
Derivative contracts designated as hedgesIn 2019, the Parent Company designated an interest rate swap contract (IRS) with a correspondingnotional amount of US$150 million to hedge the cash flow variability of its floating rate bondspayable. The IRS designated as cash flow hedge has the same principal terms as the hedged bondspayable (Note 18).
On June 7, 2021, the Parent Company designated an IRS with a corresponding notional amount ofUS$500 million to hedge the cash flow variability of its portfolio of Treasury time deposits.
On October 20, 2021, the Parent Company designated an IRS with a corresponding notional amountof US$600 million to hedge the cash flow variability of its portfolio of Retail Banking BusinessSegment (RBB) time deposits.
234
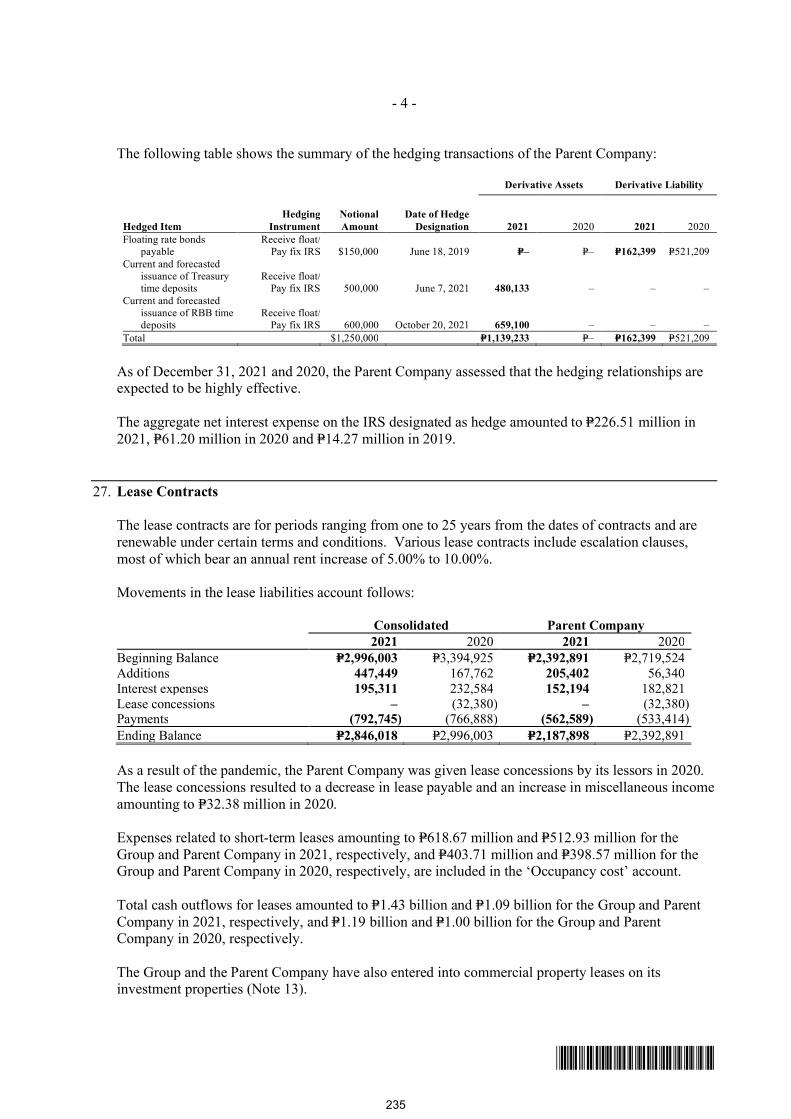
- 4 -
*SGVFS162381*
The following table shows the summary of the hedging transactions of the Parent Company:
Hedged ItemHedging
InstrumentNotionalAmount
Date of HedgeDesignation
Derivative Assets Derivative Liability
2021 2020 2021 2020Floating rate bonds
payableReceive float/
Pay fix IRS $150,000 June 18, 2019 P=– P=– P=162,399 P=521,209Current and forecasted
issuance of Treasurytime deposits
Receive float/Pay fix IRS 500,000 June 7, 2021 480,133 – – –
Current and forecastedissuance of RBB timedeposits
Receive float/Pay fix IRS 600,000 October 20, 2021 659,100 – – –
Total $1,250,000 P=1,139,233 P=– P=162,399 P=521,209
As of December 31, 2021 and 2020, the Parent Company assessed that the hedging relationships areexpected to be highly effective.
The aggregate net interest expense on the IRS designated as hedge amounted to P=226.51 million in2021, P=61.20 million in 2020 and P=14.27 million in 2019.
27. Lease Contracts
The lease contracts are for periods ranging from one to 25 years from the dates of contracts and arerenewable under certain terms and conditions. Various lease contracts include escalation clauses,most of which bear an annual rent increase of 5.00% to 10.00%.
Movements in the lease liabilities account follows:
Consolidated Parent Company2021 2020 2021 2020
Beginning Balance P=2,996,003 P=3,394,925 P=2,392,891 P=2,719,524Additions 447,449 167,762 205,402 56,340Interest expenses 195,311 232,584 152,194 182,821Lease concessions – (32,380) – (32,380)Payments (792,745) (766,888) (562,589) (533,414)Ending Balance P=2,846,018 P=2,996,003 P=2,187,898 P=2,392,891
As a result of the pandemic, the Parent Company was given lease concessions by its lessors in 2020.The lease concessions resulted to a decrease in lease payable and an increase in miscellaneous incomeamounting to P=32.38 million in 2020.
Expenses related to short-term leases amounting to P=618.67 million and P=512.93 million for theGroup and Parent Company in 2021, respectively, and P=403.71 million and P=398.57 million for theGroup and Parent Company in 2020, respectively, are included in the ‘Occupancy cost’ account.
Total cash outflows for leases amounted to P=1.43 billion and P=1.09 billion for the Group and ParentCompany in 2021, respectively, and P=1.19 billion and P=1.00 billion for the Group and ParentCompany in 2020, respectively.
The Group and the Parent Company have also entered into commercial property leases on itsinvestment properties (Note 13).
235
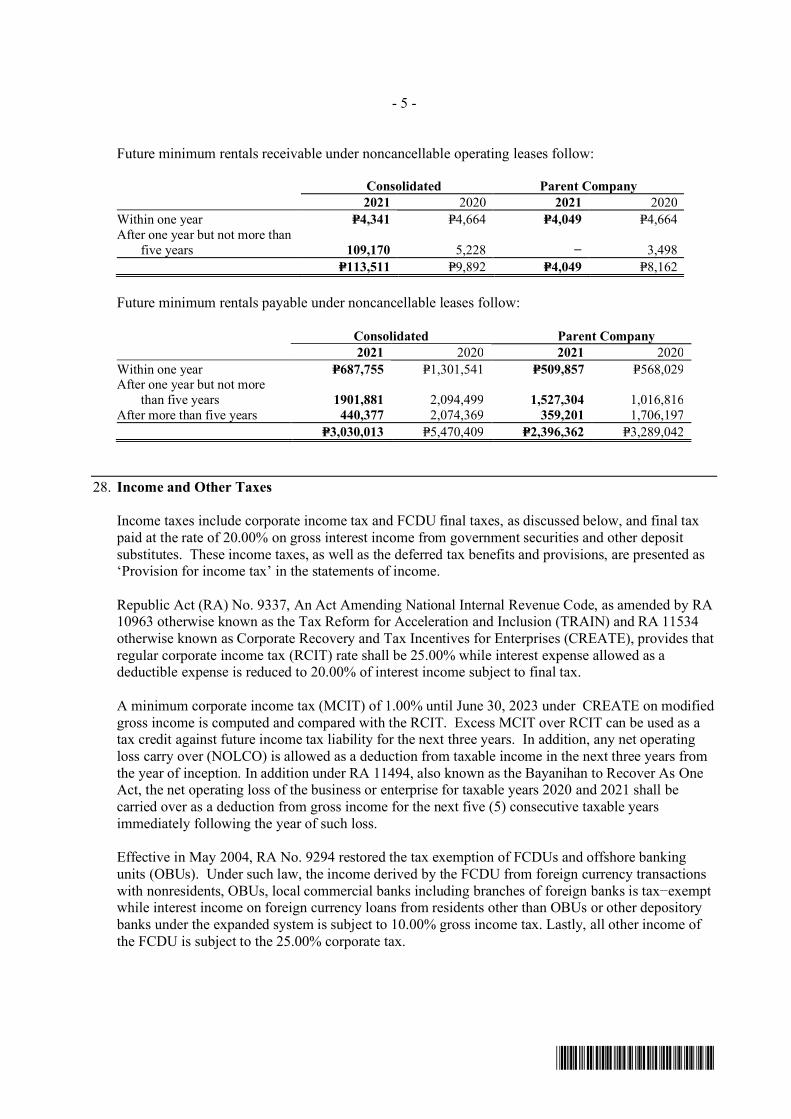
- 5 -
*SGVFS162381*
Future minimum rentals receivable under noncancellable operating leases follow:
Consolidated Parent Company2021 2020 2021 2020
Within one year P=4,341 P=4,664 P=4,049 P=4,664After one year but not more than
five years 109,170 5,228 − 3,498P=113,511 P=9,892 P=4,049 P=8,162
Future minimum rentals payable under noncancellable leases follow:
Consolidated Parent Company2021 2020 2021 2020
Within one year P=687,755 P=1,301,541 P=509,857 P=568,029After one year but not more
than five years 1901,881 2,094,499 1,527,304 1,016,816After more than five years 440,377 2,074,369 359,201 1,706,197
P=3,030,013 P=5,470,409 P=2,396,362 P=3,289,042
28. Income and Other Taxes
Income taxes include corporate income tax and FCDU final taxes, as discussed below, and final taxpaid at the rate of 20.00% on gross interest income from government securities and other depositsubstitutes. These income taxes, as well as the deferred tax benefits and provisions, are presented as‘Provision for income tax’ in the statements of income.
Republic Act (RA) No. 9337, An Act Amending National Internal Revenue Code, as amended by RA10963 otherwise known as the Tax Reform for Acceleration and Inclusion (TRAIN) and RA 11534otherwise known as Corporate Recovery and Tax Incentives for Enterprises (CREATE), provides thatregular corporate income tax (RCIT) rate shall be 25.00% while interest expense allowed as adeductible expense is reduced to 20.00% of interest income subject to final tax.
A minimum corporate income tax (MCIT) of 1.00% until June 30, 2023 under CREATE on modifiedgross income is computed and compared with the RCIT. Excess MCIT over RCIT can be used as atax credit against future income tax liability for the next three years. In addition, any net operatingloss carry over (NOLCO) is allowed as a deduction from taxable income in the next three years fromthe year of inception. In addition under RA 11494, also known as the Bayanihan to Recover As OneAct, the net operating loss of the business or enterprise for taxable years 2020 and 2021 shall becarried over as a deduction from gross income for the next five (5) consecutive taxable yearsimmediately following the year of such loss.
Effective in May 2004, RA No. 9294 restored the tax exemption of FCDUs and offshore bankingunits (OBUs). Under such law, the income derived by the FCDU from foreign currency transactionswith nonresidents, OBUs, local commercial banks including branches of foreign banks is tax−exemptwhile interest income on foreign currency loans from residents other than OBUs or other depositorybanks under the expanded system is subject to 10.00% gross income tax. Lastly, all other income ofthe FCDU is subject to the 25.00% corporate tax.
236
- 6 -
*SGVFS162381*
Relevant Tax Updates
TRAIN LawRA No. 10963, the Tax Reform for Acceleration and Inclusion (TRAIN), is the first package of thecomprehensive tax reform program of the government. The bill was signed into law onDecember 19, 2018 and took effect on January 1, 2018, amending some provisions of the oldPhilippine tax system.
Except for resident foreign corporations, which is still subject to the existing rate of 7.5%, tax oninterest income of foreign currency deposit was increased to 15% under TRAIN. Documentary stamptax on bank checks, drafts, certificate of deposit not bearing interest, all debt instruments, bills ofexchange, letters of credit, mortgages, deeds and others are now subjected to a higher rate.
CREATE LawRA 11534 otherwise known as Corporate Recovery and Tax Incentives for Enterprises (CREATE)was signed into law by President Rodrigo Duterte last March 26, 2021. The law became effective onApril 11, 2021, fifteen (15) days after its publication in a newspaper of general circulation onMarch 27, 2021.
The key changes to the Philippine tax law pursuant to the CREATE Act which have an impact on theBank are the following:
Effective July 1, 2020, regular corporate income tax (RCIT) rate is reduced from 30% to 25% fordomestic and resident foreign corporations.
Minimum corporate income tax (MCIT) rate reduced from 2% to 1% of gross income effectiveJuly 1, 2020 to June 30, 2023.
Interest income of foreign currency remittance transaction deposit received by resident foreigncorporations are now subject to 15% final tax.
The Group applied the provisions of the CREATE Act on its income tax payable, deferred tax assetsand deferred tax liabilities as of December 31, 2020 in 2021.
Impact of CREATE LawApplying the provisions of the CREATE Law, the Group and the Parent Company is subjected tolower regular corporate income tax rate of 25% effective July 1, 2020. The following are the impactof CREATE in the 2021 financial statements of the Group and the Parent Company:
Based on the provisions of Revenue Regulations (RR) No. 5-2021 dated April 8, 2021 issued bythe BIR, the transitory RCIT and MCIT rates applicable to the Group and the Parent Company forthe taxable year 2020 is 27.5% and 1.50%, respectively. This resulted in reduction in the currentincome tax due for the taxable year 2020 amounting to P=256.89 million and P=236.85 million forthe Group and the Parent Company, respectively. The reduced amounts were reflected in the2020 Annual Income Tax Returns filed in 2021. For financial reporting purposes, suchreductions in the 2020 current income taxes were recognized in the 2021 financial statements asreduction to 2021 income tax expense.
The deferred tax assets as of December 31, 2021 were also remeasured using the lower RCIT rateof 25.00%. The net decrease in the deferred tax balances amounting to P=601.56 million andP=622.02 million for the Group and the Parent Company, respectively, reduced the benefit fromdeferred tax assets credited to profit or loss by P=593.42 million and P=614.02 million for theGroup and the Parent Company, respectively, and other comprehensive income by P=8.14 millionand P=8.0 million for the Group and the Parent Company, respectively
237
- 7 -
*SGVFS162381*
There were no tax-related contingent liabilities and contingent assets arising from the changes in thetax rates due to CREATE Act.
RR 4-2011On March 15, 2011, the Bureau of Internal Revenue (BIR) issued Revenue Regulations (RR) No.4−2011 which prescribed the attribution and allocation of expenses between FCDUs/EFCDUs orOBU and RBU and within RBU.
On April 6, 2015, the Bank and other member banks of the Bankers Association of the Philippines(BAP), filed a Petition for Declaratory Relief with Application for Temporary Restraining Order(TRO) and/or Writ of Preliminary Injunction with the Regional Trial Court of Makati (Makati TrialCourt). Further, in Civil Case No. 15-287, the Bank and other BAP member banks assailed thevalidity of RR 4-2011 on the ground, among others, that (a) the RR violates the petitioner-bankssubstantive due process rights; (b) it is not only illegal but also unfair; (c) that it serves as a deterrentto banks to invest in capital market transactions to the prejudice of the economy; (d) it sets adangerous precedent for the disallowance of full deductions due to the prescribes method ofallocation; and (e) it violates the equal protection clause of the Constitution.
On April 8, 2015, the Makati Trial Court issued a TRO enjoining the BIR from enforcing RR 4-2011.Also, on April 25, 2015, the Makati Trial Court issued a Writ of Preliminary Injunction enjoining theBIR from enforcing, carrying out, or implementing in any way or manner RR 4-2011 against theBank and other BAP member banks, including issuing Preliminary Assessment Notice or FinalAssessment Notice against them during the pendency of the litigation, unless sooner dissolved.
On June 10, 2015, the Makati Trial Court issued a Confirmatory Order stating that the TRO and Writof Preliminary Injunction also prohibits the BIR from ruling or deciding on any administrative matterpending before it in relation to the subject revenue regulations and insofar as the Bank and other BAPmember banks are concerned.
On May 25, 2019, the Makati Trial Court issued a decision annulling RR 4-2011 and making the Writof Preliminary Injunction permanent.
Current tax regulations also provide for the ceiling on the amount of entertainment, amusement andrecreation (EAR) expense that can be claimed as a deduction against taxable income. Under theregulations, EAR expense allowed as a deductible expense is limited to the actual EAR paid orincurred but not to exceed 1.00% of the Parent Company’s net revenue.
The provision for income tax consists of:
Consolidated Parent Company2021 2020 2019 2021 2020 2019
CurrentFinal tax P=927,631 P=1,425,341 P=1,420,644 P=917,411 P=1,415,116 P=1,402,657RCIT 1,359,129 1,759,466 962,712 952,844 1,467,636 680,187
2,286,760 3,184,807 2,383,356 1,870,255 2,882,752 2,082,844Deferred 70,240 (1,793,703) (870,706) 197,296 (1,396,154) (405,124)
P=2,357,000 P=1,391,104 P=1,512,650 P=2,067,551 P=1,486,598 P=1,677,720
238
- 8 -
*SGVFS162381*
The details of net deferred tax assets follow:
Consolidated Parent Company2021 2020 2021 2020
Net deferred tax assets on:Allowance for impairment and
credit losses P=4,955,236 P=5,407,554 P=3,803,881 P=4,183,930Revaluation increment on land
(Notes 12 and 24) (456,171) (547,405) (456,171) (547,405)Fair value adjustments on asset
foreclosure and daciontransactions - net of depreciatedportion 38,370 272,994 (20,973) 34,054
Net defined benefit asset (123,121) (27,086) (75,098) (11,551)Others 210,667 66,378 157,961 73,020
P=4,624,981 P=5,172,435 P=3,409,600 P=3,732,048
The details of net deferred tax liabilities follow:
Consolidated Parent Company2021 2020 2021 2020
Net deferred tax liabilities on:Fair value adjustments on asset
foreclosure and daciontransactions – net of depreciatedportion (P=69,753) P=145,781 P=– P=–
Fair value adjustments on net assets(liabilities) of PDB and UnityBank 107,372 128,846 – –
Others 760,594 841,735 – –P=798,212 P=1,116,362 – –
Others pertains primarily to the deferred tax liabilities on branch licenses arising from the acquisitionof PDB.
In 2021 and 2020, deferred tax debited to OCI (excluding CREATE impact) amounted toP=144.49 million and P=29.76 million respectively, for the Group and P=117.16 million andP=47.94 million, respectively, for the Parent Company.
The Group did not set up deferred tax assets on the following temporary differences as it believes thatit is highly probable that these temporary differences will not be realized in the near foreseeablefuture:
Consolidated Parent Company2021 2020 2021 2020
Allowance for impairment and creditlosses P=628,002 P=937,610 P=– P=–
Others 21,085 25,580 – –P=649,086 P=963,190 P=– P=–
239
- 9 -
*SGVFS162381*
The reconciliation of the statutory income tax to the provision for income tax follows:
Consolidated Parent Company2021 2020 2019 2021 2020 2019
Statutory income tax P=4,365,806 P=4,038,766 P=3,476,287 P=4,288,971 P=4,064,771 P=3,524,004Tax effects of
FCDU income (408,410) (558,048) (730,776) (402,305) (553,550) (714,703)Non−taxable income (1,650,965) (445,898) (690,059) (1,560,515) (2,227,782) (1,458,268)Interest income
subjected to final tax (257,644) (2,375,355) (1,609,292) (179,194) (642,318) (622,878)Nondeductible expenses 685,021 1,476,130 1,439,020 631,661 1,062,266 1,244,697Others (713,337) (744,491) (372,530) (1,088,232) (216,789) (295,132)CREATE adjustment -
deferred tax 593,418 – – 614,018 – –CREATE adjustment –
current tax (256,889) – – (236,853) – –Provision for income tax P=2,357,000 P=1,391,104 P=1,512,650 P=2,067,551 P=1,486,598 P=1,677,720
29. Trust Operations
Securities and other properties (other than deposits) held by the Parent Company in fiduciary oragency capacities for clients and beneficiaries are not included in the accompanying balance sheetssince these are not assets of the Parent Company (Note 31).
In compliance with the requirements of current banking regulations relative to the Parent Company’strust functions : (a) government bonds included under financial assets at FVOCI with total face valueof P=2.26 billion and P=2.32 billion as of December 31, 2021 and 2020, respectively, are deposited withthe BSP as security for the Parent Company’s faithful compliance with its fiduciary obligations(Note 9); and (b) a certain percentage of the Parent Company’s trust fee income is transferred tosurplus reserve. This yearly transfer is required until the surplus reserve for trust function equals20.00% of the Parent Company’s authorized capital stock.
30. Related Party Transactions
Parties are considered to be related if one party has the ability, directly or indirectly, to control theother party or exercise significant influence over the other party in making financial and operatingdecisions. The Group’s related parties include:
key management personnel, close family members of key management personnel and entitieswhich are controlled, significantly influenced by or for which significant voting power is held bykey management personnel or their close family members,
significant investors subsidiaries, joint ventures and associates and their respective subsidiaries, and post-employment benefit plans for the benefit of the Group’s employees.
The Group has several business relationships with related parties. Transactions with such parties arenormally made in the ordinary course of business and based on the terms and conditions discussedbelow. Transactions with related parties are settled in cash, unless otherwise indicated.
Transactions with Retirement PlansUnder PFRS, certain post−employment benefit plans are considered as related parties. The ParentCompany has business relationships with a number of its retirement plans pursuant to which it
240
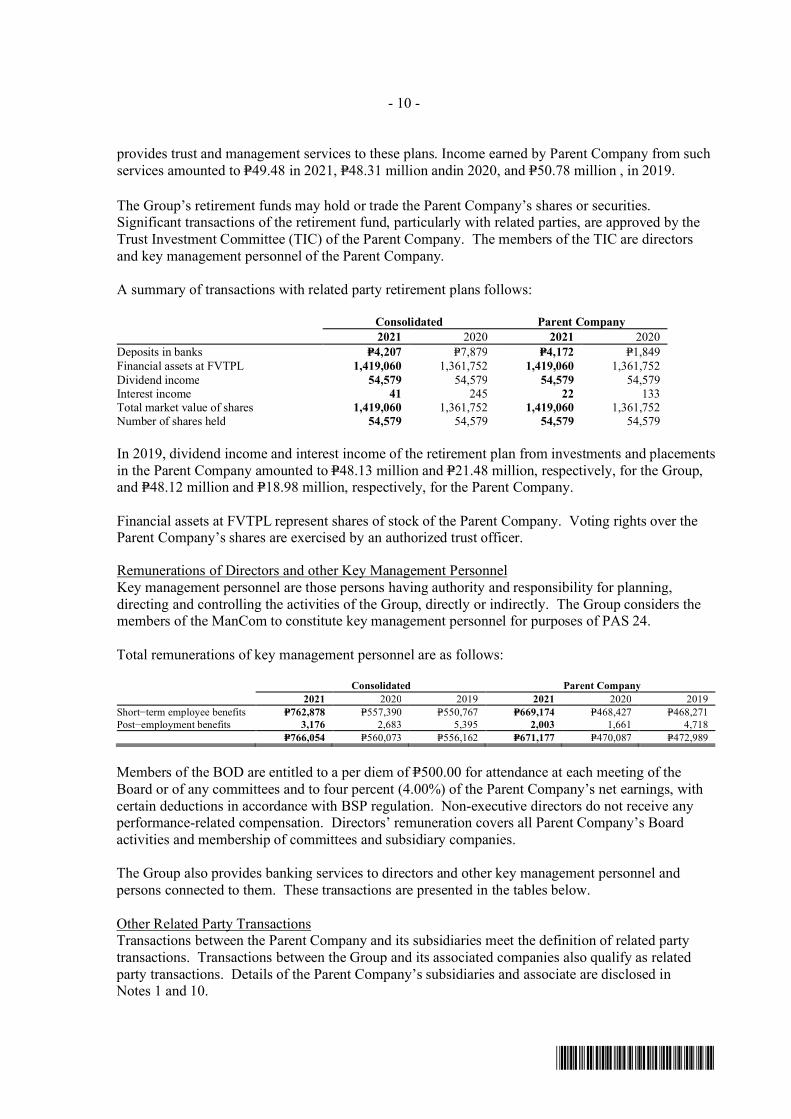
- 10 -
*SGVFS162381*
provides trust and management services to these plans. Income earned by Parent Company from suchservices amounted to P=49.48 in 2021, P=48.31 million andin 2020, and P=50.78 million , in 2019.
The Group’s retirement funds may hold or trade the Parent Company’s shares or securities.Significant transactions of the retirement fund, particularly with related parties, are approved by theTrust Investment Committee (TIC) of the Parent Company. The members of the TIC are directorsand key management personnel of the Parent Company.
A summary of transactions with related party retirement plans follows:
Consolidated Parent Company2021 2020 2021 2020
Deposits in banks P=4,207 P=7,879 P=4,172 P=1,849Financial assets at FVTPL 1,419,060 1,361,752 1,419,060 1,361,752Dividend income 54,579 54,579 54,579 54,579Interest income 41 245 22 133Total market value of shares 1,419,060 1,361,752 1,419,060 1,361,752Number of shares held 54,579 54,579 54,579 54,579
In 2019, dividend income and interest income of the retirement plan from investments and placementsin the Parent Company amounted to P=48.13 million and P=21.48 million, respectively, for the Group,and P=48.12 million and P=18.98 million, respectively, for the Parent Company.
Financial assets at FVTPL represent shares of stock of the Parent Company. Voting rights over theParent Company’s shares are exercised by an authorized trust officer.
Remunerations of Directors and other Key Management PersonnelKey management personnel are those persons having authority and responsibility for planning,directing and controlling the activities of the Group, directly or indirectly. The Group considers themembers of the ManCom to constitute key management personnel for purposes of PAS 24.
Total remunerations of key management personnel are as follows:
Consolidated Parent Company2021 2020 2019 2021 2020 2019
Short−term employee benefits P=762,878 P=557,390 P=550,767 P=669,174 P=468,427 P=468,271Post−employment benefits 3,176 2,683 5,395 2,003 1,661 4,718
P=766,054 P=560,073 P=556,162 P=671,177 P=470,087 P=472,989
Members of the BOD are entitled to a per diem of P=500.00 for attendance at each meeting of theBoard or of any committees and to four percent (4.00%) of the Parent Company’s net earnings, withcertain deductions in accordance with BSP regulation. Non-executive directors do not receive anyperformance-related compensation. Directors’ remuneration covers all Parent Company’s Boardactivities and membership of committees and subsidiary companies.
The Group also provides banking services to directors and other key management personnel andpersons connected to them. These transactions are presented in the tables below.
Other Related Party TransactionsTransactions between the Parent Company and its subsidiaries meet the definition of related partytransactions. Transactions between the Group and its associated companies also qualify as relatedparty transactions. Details of the Parent Company’s subsidiaries and associate are disclosed inNotes 1 and 10.
241
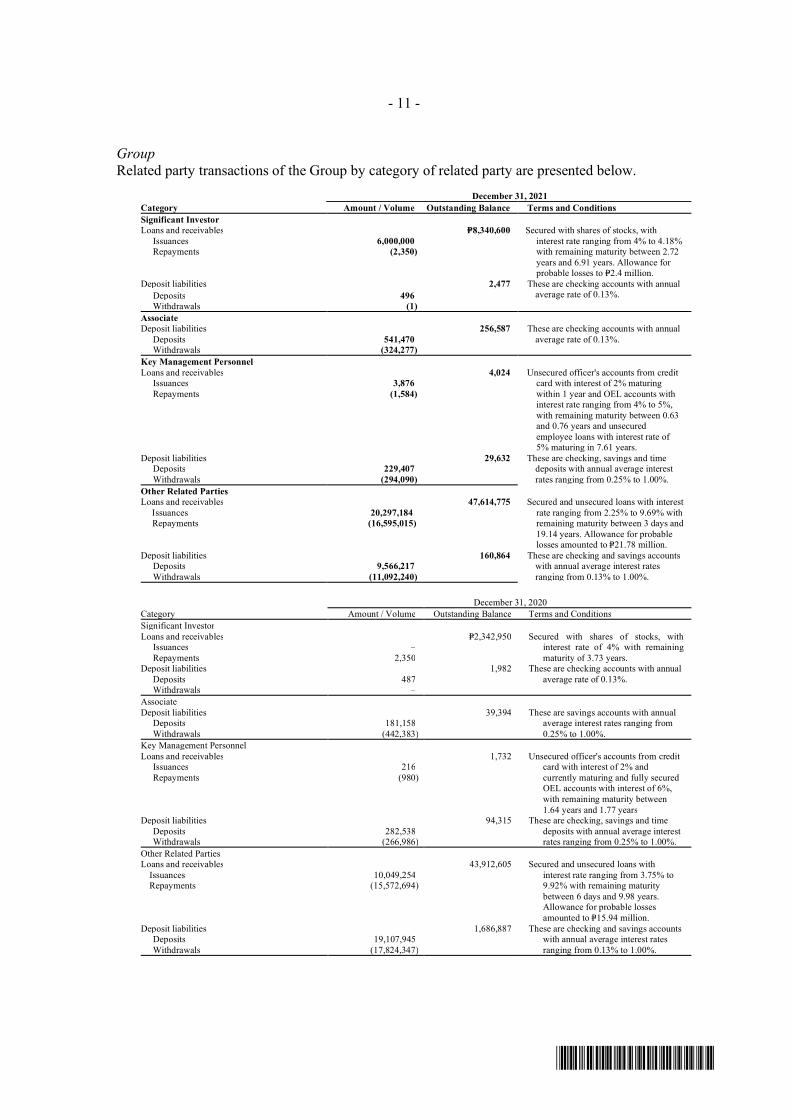
- 11 -
*SGVFS162381*
GroupRelated party transactions of the Group by category of related party are presented below.
December 31, 2021Category Amount / Volume Outstanding Balance Terms and ConditionsSignificant InvestorLoans and receivables P=8,340,600 Secured with shares of stocks, with
interest rate ranging from 4% to 4.18%with remaining maturity between 2.72years and 6.91 years. Allowance forprobable losses to P=2.4 million.
Issuances 6,000,000Repayments (2,350)
Deposit liabilities 2,477 These are checking accounts with annualaverage rate of 0.13%.Deposits 496
Withdrawals (1)AssociateDeposit liabilities 256,587 These are checking accounts with annual
average rate of 0.13%.Deposits 541,470Withdrawals (324,277)
Key Management PersonnelLoans and receivables 4,024 Unsecured officer's accounts from credit
card with interest of 2% maturingwithin 1 year and OEL accounts withinterest rate ranging from 4% to 5%,with remaining maturity between 0.63and 0.76 years and unsecuredemployee loans with interest rate of5% maturing in 7.61 years.
Issuances 3,876Repayments (1,584)
Deposit liabilities 29,632 These are checking, savings and timedeposits with annual average interestrates ranging from 0.25% to 1.00%.
Deposits 229,407Withdrawals (294,090)
Other Related PartiesLoans and receivables 47,614,775 Secured and unsecured loans with interest
rate ranging from 2.25% to 9.69% withremaining maturity between 3 days and19.14 years. Allowance for probablelosses amounted to P=21.78 million.
Issuances 20,297,184 Repayments (16,595,015)
Deposit liabilities 160,864 These are checking and savings accountswith annual average interest ratesranging from 0.13% to 1.00%.
Deposits 9,566,217Withdrawals (11,092,240)
December 31, 2020Category Amount / Volume Outstanding Balance Terms and ConditionsSignificant InvestorLoans and receivables P=2,342,950 Secured with shares of stocks, with
interest rate of 4% with remainingmaturity of 3.73 years.
Issuances –Repayments 2,350
Deposit liabilities 1,982 These are checking accounts with annualaverage rate of 0.13%.Deposits 487
Withdrawals –AssociateDeposit liabilities 39,394 These are savings accounts with annual
average interest rates ranging from0.25% to 1.00%.
Deposits 181,158Withdrawals (442,383)
Key Management PersonnelLoans and receivables 1,732 Unsecured officer's accounts from credit
card with interest of 2% andcurrently maturing and fully securedOEL accounts with interest of 6%,with remaining maturity between1.64 years and 1.77 years
Issuances 216Repayments (980)
Deposit liabilities 94,315 These are checking, savings and timedeposits with annual average interestrates ranging from 0.25% to 1.00%.
Deposits 282,538Withdrawals (266,986)
Other Related PartiesLoans and receivables 43,912,605 Secured and unsecured loans with
interest rate ranging from 3.75% to9.92% with remaining maturitybetween 6 days and 9.98 years.Allowance for probable lossesamounted to P=15.94 million.
Issuances 10,049,254Repayments (15,572,694)
Deposit liabilities 1,686,887 These are checking and savings accountswith annual average interest ratesranging from 0.13% to 1.00%.
Deposits 19,107,945Withdrawals (17,824,347)
242

- 12 -
*SGVFS162381*
Interest income earned and interest expense incurred from the above loans and deposit liabilities in2021, 2020, and 2019 follow:
Significant Investor Associate2021 2020 2019 2021 2020 2019
Interest income P=155,890 P=93,718 P=123,128 P=– P=– P=–Interest expense 3 2 2 2,896 500 655
Key Management Personnel Other Related Parties2021 2020 2019 2021 2020 2019
Interest income P=101 P=87 P=10 P=1,809,292 P=2,158,577 P=1,861,042Interest expense 1,383 1,459 1,952 689 1,467 2,376
Related party transactions of the Group with significant investor, associate and other related partiespertain to transactions of the Parent Company with these related parties.
Parent CompanyRelated party transactions of the Parent Company by category of related party are presented below.
December 31, 2021Category Amount / Volume Outstanding Balance Nature, Terms and ConditionsSignificant InvestorLoans and receivables P=8,340,600 Secured with shares of stocks, with interest rate ranging
from 4% to 4.18% with remaining maturity between2.72 years and 6.91 years. Allowance for probablelosses to 2.4 million.
Issuances 6,000,000Repayments (2,350)
Deposit liabilities 1,982 These are checking accounts with annual average rate of0.13%.Deposits 487
Withdrawals –SubsidiariesDeposit liabilities 504,336 These are checking and savings accounts with annual
average interest rates ranging from 0.13% to 1.00%.Deposits 5,949,780Withdrawals (5,949,780)
AssociateDeposit liabilities 39,312 These are checking accounts with annual average rate of
0.13%.Deposits 181,157Withdrawals (181,239)
Key Management PersonnelLoans and receivables 1,117 Unsecured officer's accounts from credit card with interest
of 2% maturing within 1 year and OEL accounts withinterest rate ranging from 4% to 5%, secured andcurrently maturing.
Issuances 258Repayments (873)
Deposit liabilities 30,039 These are checking, savings and time deposit account withannual average interest rates ranging from 0.25% to1.00%.
Deposits 249,524Withdrawals (313,800)
Other Related PartiesLoans and receivables 47,614,775 Secured and unsecured loans with interest rate ranging from
2.25% to 9.69% with remaining maturity between 3 daysand 19.14 years. Allowance for probable losses amountedto P=21.78 million.
Issuances 20,297,184Repayments (16,595,015)
Deposit liabilities 1,352,718 These are checking and savings accounts with annual averageinterest rates ranging from 0.13% to 1.00%.Deposits 18,996,452
Withdrawals (19,330,621)
December 31, 2020Category
Amount / Volume Outstanding BalanceNature, Terms and Conditions
Significant InvestorLoans and receivables P=2,342,950 Secured with shares of stocks, with interest rate of 4% with
remaining maturity of 3.73 years.IssuancesRepayments
Deposit liabilities 1,982 These are checking accounts with annual average rate of0.13%.Deposits 487
WithdrawalsSubsidiariesDeposit liabilities 504,336 These are checking and savings accounts with annual
average interest rates ranging from 0.13% to 1.00%.Deposits 5,949,780Withdrawals (5,926,690)
AssociateDeposit liabilities 39,394 These are savings accounts with annual average interest rates
ranging from 0.25% to 1.00%.Deposits 181,158Withdrawals (442,383)
(Forward)
243
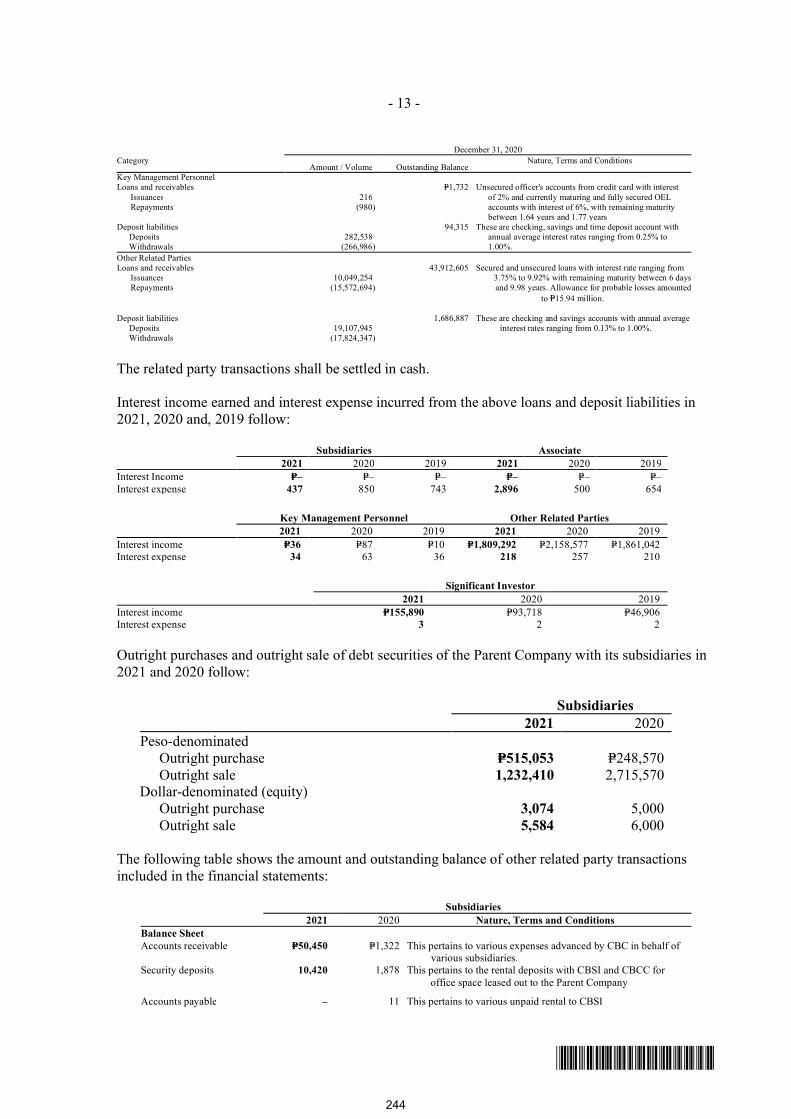
- 13 -
*SGVFS162381*
December 31, 2020Category
Amount / Volume Outstanding BalanceNature, Terms and Conditions
Key Management PersonnelLoans and receivables P=1,732 Unsecured officer's accounts from credit card with interest
of 2% and currently maturing and fully secured OELaccounts with interest of 6%, with remaining maturitybetween 1.64 years and 1.77 years
Issuances 216Repayments (980)
Deposit liabilities 94,315 These are checking, savings and time deposit account withannual average interest rates ranging from 0.25% to1.00%.
Deposits 282,538Withdrawals (266,986)
Other Related PartiesLoans and receivables 43,912,605 Secured and unsecured loans with interest rate ranging from
3.75% to 9.92% with remaining maturity between 6 daysand 9.98 years. Allowance for probable losses amounted
to P=15.94 million.
Issuances 10,049,254Repayments (15,572,694)
Deposit liabilities 1,686,887 These are checking and savings accounts with annual averageinterest rates ranging from 0.13% to 1.00%.Deposits 19,107,945
Withdrawals (17,824,347)
The related party transactions shall be settled in cash.
Interest income earned and interest expense incurred from the above loans and deposit liabilities in2021, 2020 and, 2019 follow:
Subsidiaries Associate2021 2020 2019 2021 2020 2019
Interest Income P=– P=– P=– P=– P=– P=–Interest expense 437 850 743 2,896 500 654
Key Management Personnel Other Related Parties2021 2020 2019 2021 2020 2019
Interest income P=36 P=87 P=10 P=1,809,292 P=2,158,577 P=1,861,042Interest expense 34 63 36 218 257 210
Significant Investor2021 2020 2019
Interest income P=155,890 P=93,718 P=46,906Interest expense 3 2 2
Outright purchases and outright sale of debt securities of the Parent Company with its subsidiaries in2021 and 2020 follow:
Subsidiaries2021 2020
Peso-denominatedOutright purchase P=515,053 P=248,570Outright sale 1,232,410 2,715,570
Dollar-denominated (equity)Outright purchase 3,074 5,000Outright sale 5,584 6,000
The following table shows the amount and outstanding balance of other related party transactionsincluded in the financial statements:
Subsidiaries2021 2020 Nature, Terms and Conditions
Balance SheetAccounts receivable P=50,450 P=1,322 This pertains to various expenses advanced by CBC in behalf of
various subsidiaries.Security deposits 10,420 1,878 This pertains to the rental deposits with CBSI and CBCC for
office space leased out to the Parent Company
Accounts payable – 11 This pertains to various unpaid rental to CBSI
244
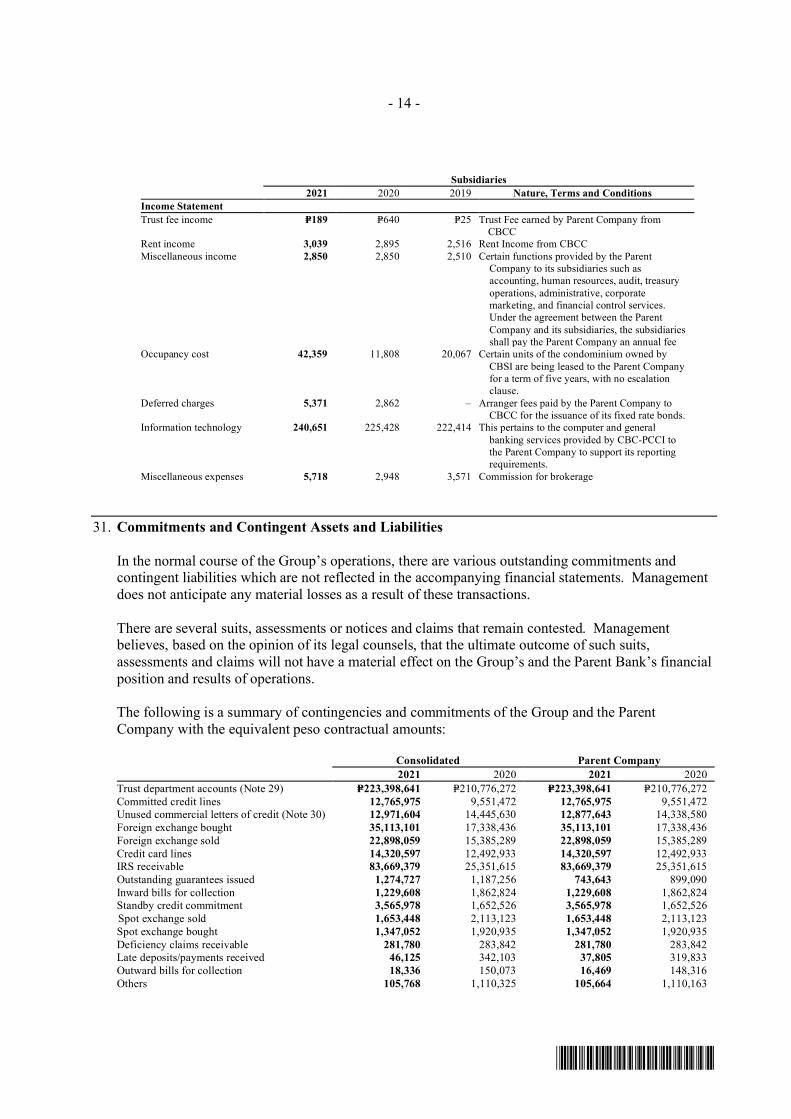
- 14 -
*SGVFS162381*
Subsidiaries2021 2020 2019 Nature, Terms and Conditions
Income StatementTrust fee income P=189 P=640 P=25 Trust Fee earned by Parent Company from
CBCCRent income 3,039 2,895 2,516 Rent Income from CBCCMiscellaneous income 2,850 2,850 2,510 Certain functions provided by the Parent
Company to its subsidiaries such asaccounting, human resources, audit, treasuryoperations, administrative, corporatemarketing, and financial control services.Under the agreement between the ParentCompany and its subsidiaries, the subsidiariesshall pay the Parent Company an annual fee
Occupancy cost 42,359 11,808 20,067 Certain units of the condominium owned byCBSI are being leased to the Parent Companyfor a term of five years, with no escalationclause.
Deferred charges 5,371 2,862 – Arranger fees paid by the Parent Company toCBCC for the issuance of its fixed rate bonds.
Information technology 240,651 225,428 222,414 This pertains to the computer and generalbanking services provided by CBC-PCCI tothe Parent Company to support its reportingrequirements.
Miscellaneous expenses 5,718 2,948 3,571 Commission for brokerage
31. Commitments and Contingent Assets and Liabilities
In the normal course of the Group’s operations, there are various outstanding commitments andcontingent liabilities which are not reflected in the accompanying financial statements. Managementdoes not anticipate any material losses as a result of these transactions.
There are several suits, assessments or notices and claims that remain contested. Managementbelieves, based on the opinion of its legal counsels, that the ultimate outcome of such suits,assessments and claims will not have a material effect on the Group’s and the Parent Bank’s financialposition and results of operations.
The following is a summary of contingencies and commitments of the Group and the ParentCompany with the equivalent peso contractual amounts:
Consolidated Parent Company2021 2020 2021 2020
Trust department accounts (Note 29) P=223,398,641 P=210,776,272 P=223,398,641 P=210,776,272Committed credit lines 12,765,975 9,551,472 12,765,975 9,551,472Unused commercial letters of credit (Note 30) 12,971,604 14,445,630 12,877,643 14,338,580Foreign exchange bought 35,113,101 17,338,436 35,113,101 17,338,436Foreign exchange sold 22,898,059 15,385,289 22,898,059 15,385,289Credit card lines 14,320,597 12,492,933 14,320,597 12,492,933IRS receivable 83,669,379 25,351,615 83,669,379 25,351,615Outstanding guarantees issued 1,274,727 1,187,256 743,643 899,090Inward bills for collection 1,229,608 1,862,824 1,229,608 1,862,824Standby credit commitment 3,565,978 1,652,526 3,565,978 1,652,526Spot exchange sold 1,653,448 2,113,123 1,653,448 2,113,123Spot exchange bought 1,347,052 1,920,935 1,347,052 1,920,935Deficiency claims receivable 281,780 283,842 281,780 283,842Late deposits/payments received 46,125 342,103 37,805 319,833Outward bills for collection 18,336 150,073 16,469 148,316Others 105,768 1,110,325 105,664 1,110,163
245
- 15 -
*SGVFS162381*
32. Segment Information
The Group’s operating businesses are recognized and managed separately according to the nature ofservices provided and the markets served, with each segment representing a strategic business unit.
The Group’s business segments are as follows:
a. Lending Business – principally handles all the lending, trade finance and corollary bankingproducts and services offered to corporate and institutional customers as well as selected middlemarket clients. It also handles home loans, contract-to-sell receivables, auto loans and credit cardsfor individual and/or corporate customers. Aside from the lending business, it also provides cashmanagement services;
b. Retail Banking Business – principally handles retail and commercial loans, individual andcorporate deposits, overdrafts and funds transfer facilities, trade facilities and all other servicesfor retail customers;
c. Financial Markets – principally provides money market, trading and treasury services, managesthe Group's funding operations by the use of government securities, placements and acceptanceswith other banks as well as offers advisory and capital-raising services to corporate clients andremittance transactions; and
d. Others – handles other services including but not limited to trust and investment managementservices, wealth management services to high net-worth customers, asset management, insurancebrokerage, credit management, thrift banking business, operations and financial control, and othersupport services.
The Group’s businesses are organized to cater to the banking needs of market segments, facilitatecustomer engagement, ensure timely delivery of products and services as well as achieve costefficiency and economies of scale. Accordingly, the corresponding segment information for allperiods presented herein are restated to reflect such change.
The Group reports its primary segment information to the Chief Operating Decision Maker (CODM)on the basis of the above-mentioned segments. The CODM of the Group is the President.
Segment assets are those operating assets that are employed by a segment in its operating activitiesthat are either directly attributable to the segment or can be allocated to the segment on a reasonablebasis.
Segment liabilities are those operating liabilities that result from the operating activities of a segmentand that either are directly attributable to the segment or can be allocated to the segment on areasonable basis.
Interest income is reported net as management primarily relies on the net interest income asperformance measure, not the gross income and expense.
The segment results include internal transfer pricing adjustments across business units as deemedappropriate by management. Transactions between segments are conducted at estimated market rateson an arm’s length basis. Interest is charged/credited to the business units based on its assets’ andliabilities’ repricing or maturity date using market-based yield curve approved by the Asset LiabilityCommittee (ALCO).
246

- 16 -
*SGVFS162381*
Other operating income mainly consists of trading and securities gain (loss) − net, service charges,fees and commissions, trust fee income and foreign exchange gain − net. Other operating expensemainly consists of compensation and fringe benefits, provision for impairment and credit losses, taxesand licenses, occupancy, depreciation and amortization, stationery, supplies and postage andinsurance. Other operating income and expense are allocated between segments based on equitablesharing arrangements.
The Group has no significant customers which contributes 10.00% or more of the consolidatedrevenues.
The Group’s asset producing revenues are located in the Philippines (i.e., one geographical location);therefore, geographical segment information is no longer presented.
The following tables present relevant financial information regarding business segments measured inaccordance with PFRS as of and for the years ended December 31, 2021, 2020 and 2019:
Lending Business Retail Banking Business2021 2020 2019 2021 2020 2019
Results of OperationsNet interest income Third party P=27,868,124 P=26,243,948 P=24,613,498 P=2,246,145 (P=537,797) (P=5,338,849) Intersegment (16,451,310) (17,367,936) (18,388,536) 16,743,174 18,378,843 18,020,023
11,416,814 8,876,012 6,224,962 18,989,319 17,841,046 12,681,174Other operating income 949,677 1,014,330 2,281,689 2,371,764 1,924,001 2,209,567Total revenue 12,366,491 9,890,342 8,506,651 21,361,083 19,765,047 14,890,741Other operating expense (3,672,205) (3,603,526) (3,771,960) (11,253,327) (11,276,218) (9,785,604)Income before provisions and
taxes 8,694,286 6,286,816 4,734,691 10,107,756 8,488,829 5,105,137Provision for impairment and
credit losses (6,898,860) (6,987,211) (1,836,780) (719,487) (888,952) (443,621)Income before income tax 1,795,426 (700,395) 2,897,911 9,388,269 7,599,877 4,661,516Provision for income tax (1,481) 271,102 (45,149) (1,545,289) (244,334) (419,750)Net income P= 1,793,945 (P=429,293) P=2,852,762 P= 7,842,980 P=7,355,543 P=4,241,766Total assets P=505,883,838 P=447,944,431 P=438,731,372 P=628,223,856 P=587,770,303 P=516,900,229Total liabilities P=1,998,355 P=8,177,263 5,042,977 P=658,061,048 P=631,763,776 569,897,912Depreciation and amortization P=50,765 P=126,699 54,477 P=803,283 P=1,004,571 1,185,539Capital expenditures P=335,084 P=263,493 P=351,529 P=416,119 P=345,742 P=414,161
Financial Markets Other Business and Support Units2021 2020 2019 2021 2020 2019
Results of OperationsNet interest income Third party P=3,511,779 P=4,200,824 P=3,462,384 P=4,688,108 P=3,935,611 P=3,314,264 Intersegment (373,322) (817,457) 1,041,115 81,458 (193,450) (672,602)
3,138,457 3,383,367 4,503,499 4,769,566 3,742,161 2,641,662Other operating income 4,919,675 5,564,672 1,994,224 2,119,828 1,508,046 1,945,309Total revenue 8,058,132 8,948,039 6,497,723 6,889,394 5,250,207 4,586,971Other operating expense (2,309,853) (2,040,542) (1,760,735) (5,099,748) (4,601,876) (5,005,997)Income before provisions and
taxes5,748,279 6,907,497 4,736,988 1,789,646 648,331 (419,026)
Provision for impairment andcredit losses
(61,124) (103,465) (92,689) (1,197,273) (889,291) (197,078)
Income before income tax 5,687,155 6,804,032 4,644,299 592,373 (240,960) (616,104)Provision for income tax (728,056) (1,514,395) (1,240,335) (82,174) 96,523 192,584Net income P=4,959,099 P=5,289,637 P=3,403,964 P=510,199 (P=144,437) (P=423,520)Total assets P=313,935,966 P=291,325,133 P=230,368,926 (P=335,724,134) (P=291,028,218) (P=223,774,546)Total liabilities P=184,942,985 P=141,939,942 P=118,786,174 P=148,194,318 P=149,145,306 P=172,323,323Depreciation and amortization P=34,554 P=329,510 P=52,328 P=898,564 P=434,119 P=650,316Capital expenditures P=207,943 P=171,365 P=184,581 (P=222,375) P= -171,190 P= -179,297
247

- 17 -
*SGVFS162381*
Total2021 2020 2019
Results of OperationsNet interest income
Third party P=38,314,156 P=33,842,586 P=26,051,297Intersegment – – −
38,314,156 33,842,586 26,051,297Other operating income 10,360,944 10,011,049 8,430,789Total revenue 48,675,100 43,853,635 34,482,086Other operating expense (22,335,133) (21,522,162) (20,324,296)Income before provisions and taxes 26,339,967 22,331,473 14,157,790Provision for impairment and credit
losses (8,876,744) (8,868,919) (2,570,168)Income before income tax 17,463,223 13,462,554 11,587,622Provision for income tax (2,357,000) (1,391,104) (1,512,650)Net income P=15,106,223 P=12,071,450 P=10,074,972Total assets P=1,112,319,526 P=1,036,011,649 P=962,225,981Total liabilities P=993,196,706 P=931,026,287 P=866,050,386Depreciation and amortization P=1,787,166 P=1,894,899 P=1,942,660Capital expenditures P=487,005 P=276,881 P=425,124
The Group’s share in net income (loss) of an associate included in other operating income amountingto (P=1.60 million), P=152.44 million and P=184.66 million in 2021, 2020 and 2019, respectively arereported under ‘Other Business and Support Units’.
33. Earnings Per Share
Basic EPS amounts are calculated by dividing the net income for the year by the weighted averagenumber of common shares outstanding during the year (adjusted for stock dividends).
The following reflects the income and share data used in the basic earnings per share computations:
2021 2020 2019a. Net income attributable to equity
holders of the parent P=15,088,332 P=12,062,637 P=10,068,960b. Weighted average number of common
shares outstanding – basic (Note 24) 2,687,696 2,685,900 2,685,900c. Weighted average number of common
shares outstanding – diluted (Note 24) – 2,687,247 –d. Basic (a/b) and diluted (a/c) earnings per
share* P=5.61 P=4.49 P=3.75*For the year ended December 31, 2021, the basic and diluted EPS are the same after rounding-off.
Prior to September 1, 2021, the Group’s centennial stock grants are potential common shares thathave dilutive effect to the EPS. Accordingly, after adjusting the dilutive potential common sharesarising from the centennial stock grants to the weighted average number of common shares, thediluted EPS amounted to P=5.61. As of December 31, 2021, there were no outstanding dilutivepotential common shares.
248

- 18 -
*SGVFS162381*
34. Supplementary Information for Cash Flow Analysis
The following is a summary of certain non−cash investing activities that relate to the analysis of thestatements of cash flows:
Consolidated2021 2020 2019
Addition to investment propertiesfrom settlement of loans P=752,756 P=294,326 P=832,290
Fair value gain on FVOCI financialassets (50,087) 2,932,752 1,163,009
Cumulative translation adjustment 12,270 (5,165) 98,830Addition to chattel mortgage from
settlement of loans 596,009 32,568 618,298
Parent Company2021 2020 2019
Addition to investment propertiesfrom settlement of loans P=81,136 P=117,660 P=471,020
Fair value gain (loss) in FVOCIfinancial assets (16,220) 2,870,805 940,851
Cumulative translation adjustment 465 7,210 81,518Addition to chattel mortgage from
settlement of loans 15,830 2,006 10,332
The following table shows the reconciliation analysis of bonds payable, bills payable and leaseliability under financing activities for both the Group and Parent Company the years endedDecember 31, 2021 and 2020:
Consolidated2021
Bills Payable Bonds Payable Lease Liability TotalBalance at beginning of year P=23,655,851 P=52,065,678 P=2,996,003 P=78,717,532Cash flows during the year
Proceeds 193,908,669 19,878,458 – 213,787,127 Settlement/payment (152,843,847) (30,000,000) (792,745) (183,636,592)Non-cash changes
Additions – – 447,449 447,449Amortization – 83,022 195,311 278,333Foreign exchange movement 1,085,601 446,400 – 1,532,001
Balance at end of year P=65,806,274 P=42,473,558 P=2,846,018 P=111,125,850
Consolidated2020
Bills Payable Bonds Payable Lease Liability TotalBalance at beginning of year P=33,381,406 P=37,394,398 P=3,394,925 P=74,170,729Cash flows during the year
Proceeds 116,188,100 14,803,803 – 130,991,903 Settlement/payment (124,743,600) – (766,888) (125,510,488)Non-cash changes
Additions – – 167,762 167,762Lease concessions – – (32,380) (32,380)Amortization – 133,117 232,584 365,701Foreign exchange movement (1,170,055) (265,640) – (1,435,695)
Balance at end of year P=23,655,851 P=52,065,678 P=2,996,003 P=78,717,532
249
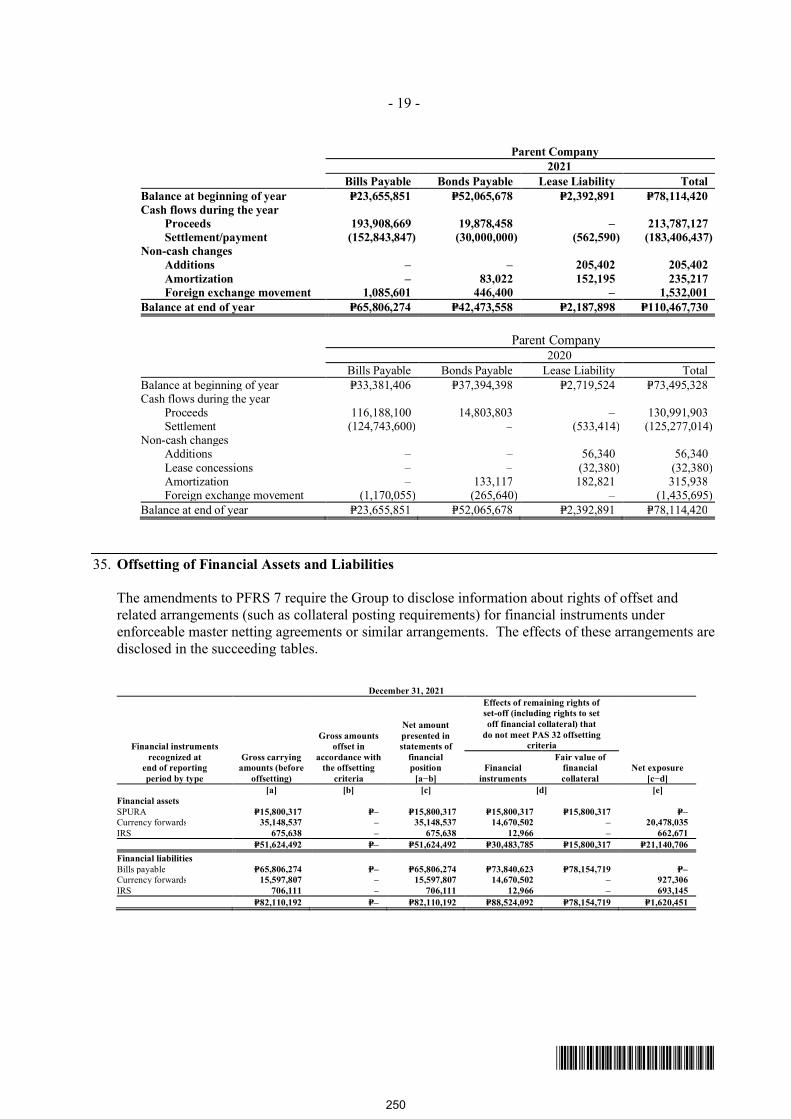
- 19 -
*SGVFS162381*
Parent Company2021
Bills Payable Bonds Payable Lease Liability TotalBalance at beginning of year P=23,655,851 P=52,065,678 P=2,392,891 P=78,114,420Cash flows during the year
Proceeds 193,908,669 19,878,458 – 213,787,127 Settlement/payment (152,843,847) (30,000,000) (562,590) (183,406,437)Non-cash changes
Additions – – 205,402 205,402Amortization – 83,022 152,195 235,217Foreign exchange movement 1,085,601 446,400 – 1,532,001
Balance at end of year P=65,806,274 P=42,473,558 P=2,187,898 P=110,467,730
Parent Company2020
Bills Payable Bonds Payable Lease Liability TotalBalance at beginning of year P=33,381,406 P=37,394,398 P=2,719,524 P=73,495,328Cash flows during the year
Proceeds 116,188,100 14,803,803 – 130,991,903Settlement (124,743,600) – (533,414) (125,277,014)
Non-cash changesAdditions – – 56,340 56,340Lease concessions – – (32,380) (32,380)Amortization – 133,117 182,821 315,938Foreign exchange movement (1,170,055) (265,640) – (1,435,695)
Balance at end of year P=23,655,851 P=52,065,678 P=2,392,891 P=78,114,420
35. Offsetting of Financial Assets and Liabilities
The amendments to PFRS 7 require the Group to disclose information about rights of offset andrelated arrangements (such as collateral posting requirements) for financial instruments underenforceable master netting agreements or similar arrangements. The effects of these arrangements aredisclosed in the succeeding tables.
December 31, 2021
Financial instrumentsrecognized at
end of reportingperiod by type
Gross carryingamounts (before
offsetting)
Gross amountsoffset in
accordance withthe offsetting
criteria
Net amountpresented instatements of
financialposition
[a−b]
Effects of remaining rights ofset-off (including rights to setoff financial collateral) that
do not meet PAS 32 offsettingcriteria
Net exposure[c−d]
Financialinstruments
Fair value offinancialcollateral
[a] [b] [c] [d] [e]Financial assetsSPURA P=15,800,317 P=– P=15,800,317 P=15,800,317 P=15,800,317 P=–Currency forwards 35,148,537 – 35,148,537 14,670,502 – 20,478,035IRS 675,638 – 675,638 12,966 – 662,671
P=51,624,492 P=– P=51,624,492 P=30,483,785 P=15,800,317 P=21,140,706Financial liabilitiesBills payable P=65,806,274 P=– P=65,806,274 P=73,840,623 P=78,154,719 P=–Currency forwards 15,597,807 – 15,597,807 14,670,502 – 927,306IRS 706,111 – 706,111 12,966 – 693,145
P=82,110,192 P=– P=82,110,192 P=88,524,092 P=78,154,719 P=1,620,451
250
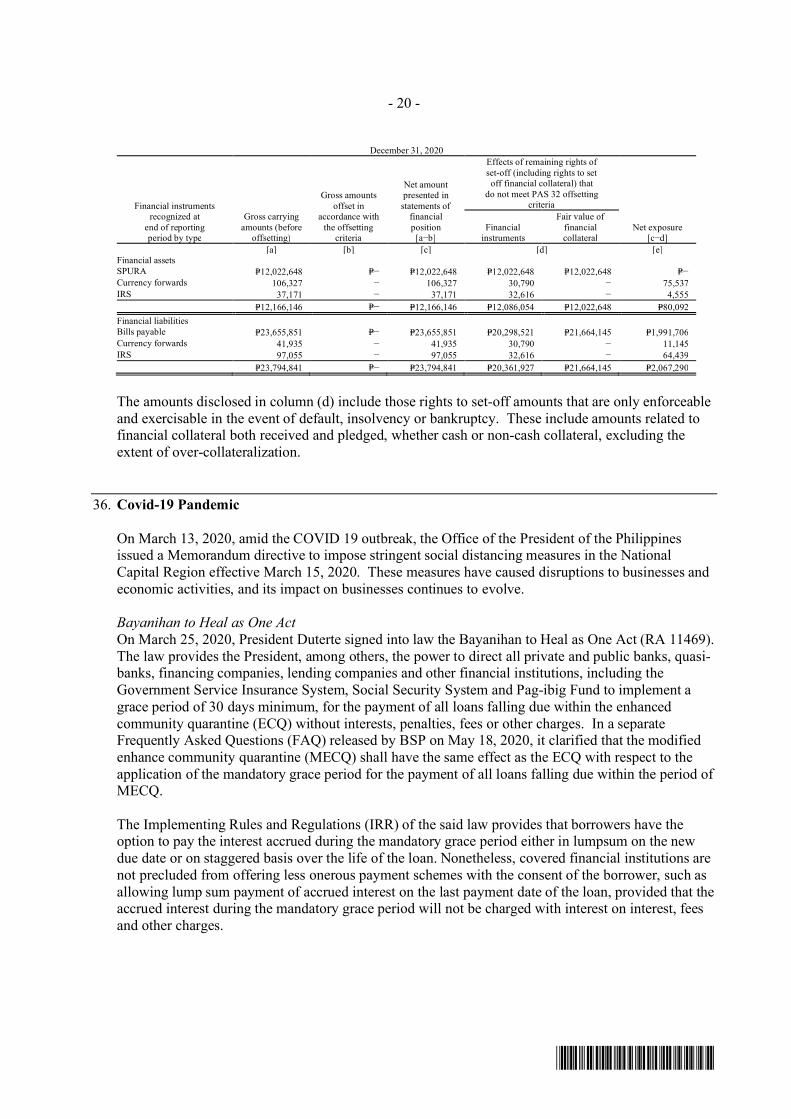
- 20 -
*SGVFS162381*
December 31, 2020
Financial instrumentsrecognized at
end of reportingperiod by type
Gross carryingamounts (before
offsetting)
Gross amountsoffset in
accordance withthe offsetting
criteria
Net amountpresented instatements of
financialposition
[a−b]
Effects of remaining rights ofset-off (including rights to setoff financial collateral) that
do not meet PAS 32 offsettingcriteria
Net exposure[c−d]
Financialinstruments
Fair value offinancialcollateral
[a] [b] [c] [d] [e]Financial assetsSPURA P=12,022,648 P=− P=12,022,648 P=12,022,648 P=12,022,648 P=−Currency forwards 106,327 − 106,327 30,790 − 75,537IRS 37,171 − 37,171 32,616 − 4,555
P=12,166,146 P=− P=12,166,146 P=12,086,054 P=12,022,648 P=80,092Financial liabilitiesBills payable P=23,655,851 P=− P=23,655,851 P=20,298,521 P=21,664,145 P=1,991,706Currency forwards 41,935 − 41,935 30,790 − 11,145IRS 97,055 − 97,055 32,616 − 64,439
P=23,794,841 P=− P=23,794,841 P=20,361,927 P=21,664,145 P=2,067,290
The amounts disclosed in column (d) include those rights to set-off amounts that are only enforceableand exercisable in the event of default, insolvency or bankruptcy. These include amounts related tofinancial collateral both received and pledged, whether cash or non-cash collateral, excluding theextent of over-collateralization.
36. Covid-19 Pandemic
On March 13, 2020, amid the COVID 19 outbreak, the Office of the President of the Philippinesissued a Memorandum directive to impose stringent social distancing measures in the NationalCapital Region effective March 15, 2020. These measures have caused disruptions to businesses andeconomic activities, and its impact on businesses continues to evolve.
Bayanihan to Heal as One ActOn March 25, 2020, President Duterte signed into law the Bayanihan to Heal as One Act (RA 11469).The law provides the President, among others, the power to direct all private and public banks, quasi-banks, financing companies, lending companies and other financial institutions, including theGovernment Service Insurance System, Social Security System and Pag-ibig Fund to implement agrace period of 30 days minimum, for the payment of all loans falling due within the enhancedcommunity quarantine (ECQ) without interests, penalties, fees or other charges. In a separateFrequently Asked Questions (FAQ) released by BSP on May 18, 2020, it clarified that the modifiedenhance community quarantine (MECQ) shall have the same effect as the ECQ with respect to theapplication of the mandatory grace period for the payment of all loans falling due within the period ofMECQ.
The Implementing Rules and Regulations (IRR) of the said law provides that borrowers have theoption to pay the interest accrued during the mandatory grace period either in lumpsum on the newdue date or on staggered basis over the life of the loan. Nonetheless, covered financial institutions arenot precluded from offering less onerous payment schemes with the consent of the borrower, such asallowing lump sum payment of accrued interest on the last payment date of the loan, provided that theaccrued interest during the mandatory grace period will not be charged with interest on interest, feesand other charges.
251
- 21 -
*SGVFS162381*
On March 14, 2020, the BSP issued BSP Memorandum No. M-2020-008 Regulatory Relief for BSFIsAffected by the Corona Virus Disease 2019 (COVID-19). The said memorandum provides for certaintemporary regulatory and rediscounting relief measures for financial institutions supervised by theBSP. Accordingly, the Parent Company informed the BSP of its intention to avail the following:
Provide financial assistance to officers affected by the present health emergency subject tosubmission by the Parent Company of a request for BSP approval within 30 calendar days fromthe approval thereof of the Parent Company’s Board of Directors;
Exclude from the computation of past due ratio, loans by borrowers in affected areas, subject tothe following: (i) such loans shall be reported to the BSP; (ii) extension shall be for a period ofone year from 08 March 2020; and (iii) BSP documentary requirements for restructuring of loansmay be waived provided that the Bank will adopt appropriate and prudent operational controlmeasures;
Non-imposition of monetary penalties for delays incurred in the submission of all supervisoryreports to BSP due to be submitted from 08 March 2020 up to six months thereafter;
Allow staggered booking of allowance for credit losses computed under Section 143 of theManual of Regulation for Banks (MORB) over a maximum period of five years for all types ofcredits extended to individuals and businesses directly affected by COVID-19 as of 08 March2020, subject to prior approval of the BSP;
Non-imposition of penalties on legal reserve deficiencies computed under Section 255 of theMORB starting from reserve week following 08 March 2020 up to six months thereafter, subjectto prior approval of the BSP;
Rediscounting relief as follows:
a. Grant of a 60-day grace period, upon application with BSP, to settle outstandingrediscounting obligations as of 08 March 2020, provided that interest shall be charged but nopenalty shall be imposed;
b. Allowing the Parent Company to restructure with BSP, the outstanding rediscounted loans asof 08 March 2020 of its end-user borrowers affected by the COVID-19, subject to the termsand conditions stated in Appendix 133 of the MORB; and
c. relaxation of eligibility requirements by excluding the criteria on reserve requirement for therenewal of rediscounting line and for the availment of rediscounting loans from 08 March2020 up to six months thereafter.
As of December 31, 2021 and 2020, there was no actual availment of the foregoing regulatoryreliefs.
37. Approval of the Financial Statements
The accompanying consolidated and parent company financial statements were authorized for issueby the Parent Company’s BOD on February 28, 2022.
252
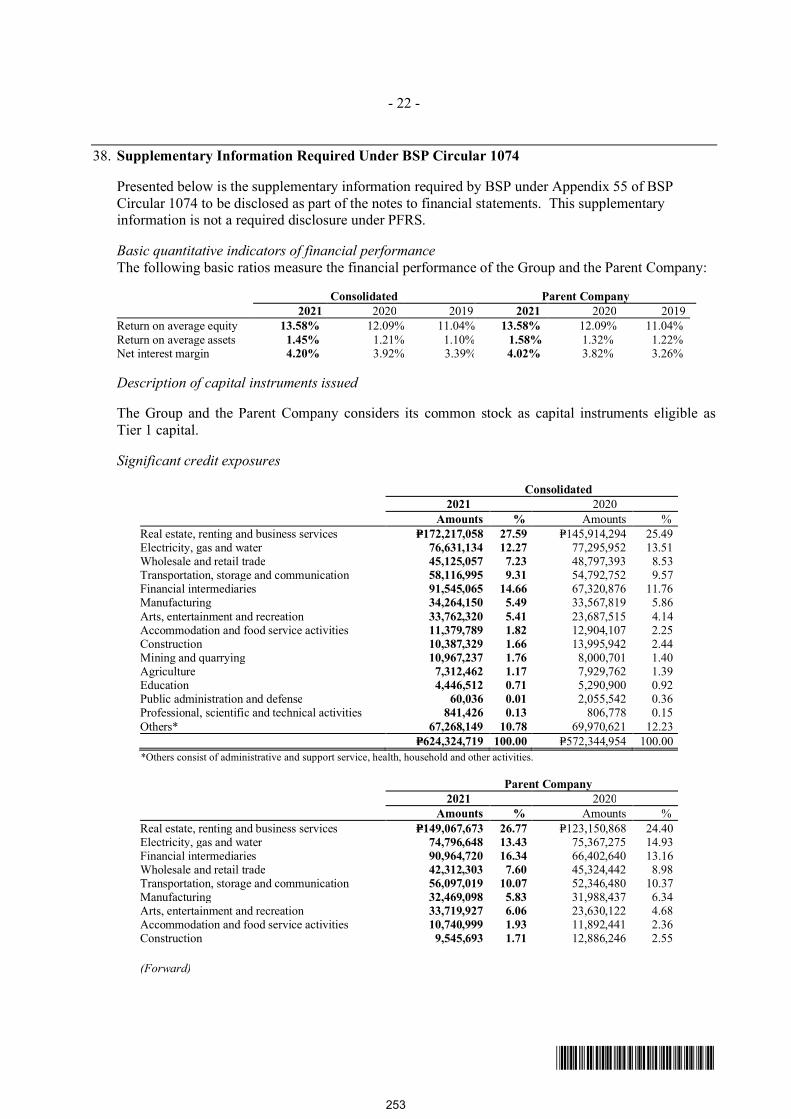
- 22 -
*SGVFS162381*
38. Supplementary Information Required Under BSP Circular 1074
Presented below is the supplementary information required by BSP under Appendix 55 of BSPCircular 1074 to be disclosed as part of the notes to financial statements. This supplementaryinformation is not a required disclosure under PFRS.
Basic quantitative indicators of financial performanceThe following basic ratios measure the financial performance of the Group and the Parent Company:
Consolidated Parent Company2021 2020 2019 2021 2020 2019
Return on average equity 13.58% 12.09% 11.04% 13.58% 12.09% 11.04%Return on average assets 1.45% 1.21% 1.10% 1.58% 1.32% 1.22%Net interest margin 4.20% 3.92% 3.39% 4.02% 3.82% 3.26%
Description of capital instruments issued
The Group and the Parent Company considers its common stock as capital instruments eligible asTier 1 capital.
Significant credit exposures
Consolidated2021 2020
Amounts % Amounts %Real estate, renting and business services P=172,217,058 27.59 P=145,914,294 25.49Electricity, gas and water 76,631,134 12.27 77,295,952 13.51Wholesale and retail trade 45,125,057 7.23 48,797,393 8.53Transportation, storage and communication 58,116,995 9.31 54,792,752 9.57Financial intermediaries 91,545,065 14.66 67,320,876 11.76Manufacturing 34,264,150 5.49 33,567,819 5.86Arts, entertainment and recreation 33,762,320 5.41 23,687,515 4.14Accommodation and food service activities 11,379,789 1.82 12,904,107 2.25Construction 10,387,329 1.66 13,995,942 2.44Mining and quarrying 10,967,237 1.76 8,000,701 1.40Agriculture 7,312,462 1.17 7,929,762 1.39Education 4,446,512 0.71 5,290,900 0.92Public administration and defense 60,036 0.01 2,055,542 0.36Professional, scientific and technical activities 841,426 0.13 806,778 0.15Others* 67,268,149 10.78 69,970,621 12.23
P=624,324,719 100.00 P=572,344,954 100.00*Others consist of administrative and support service, health, household and other activities.
Parent Company2021 2020
Amounts % Amounts %Real estate, renting and business services P=149,067,673 26.77 P=123,150,868 24.40Electricity, gas and water 74,796,648 13.43 75,367,275 14.93Financial intermediaries 90,964,720 16.34 66,402,640 13.16Wholesale and retail trade 42,312,303 7.60 45,324,442 8.98Transportation, storage and communication 56,097,019 10.07 52,346,480 10.37Manufacturing 32,469,098 5.83 31,988,437 6.34Arts, entertainment and recreation 33,719,927 6.06 23,630,122 4.68Accommodation and food service activities 10,740,999 1.93 11,892,441 2.36Construction 9,545,693 1.71 12,886,246 2.55
(Forward)
253
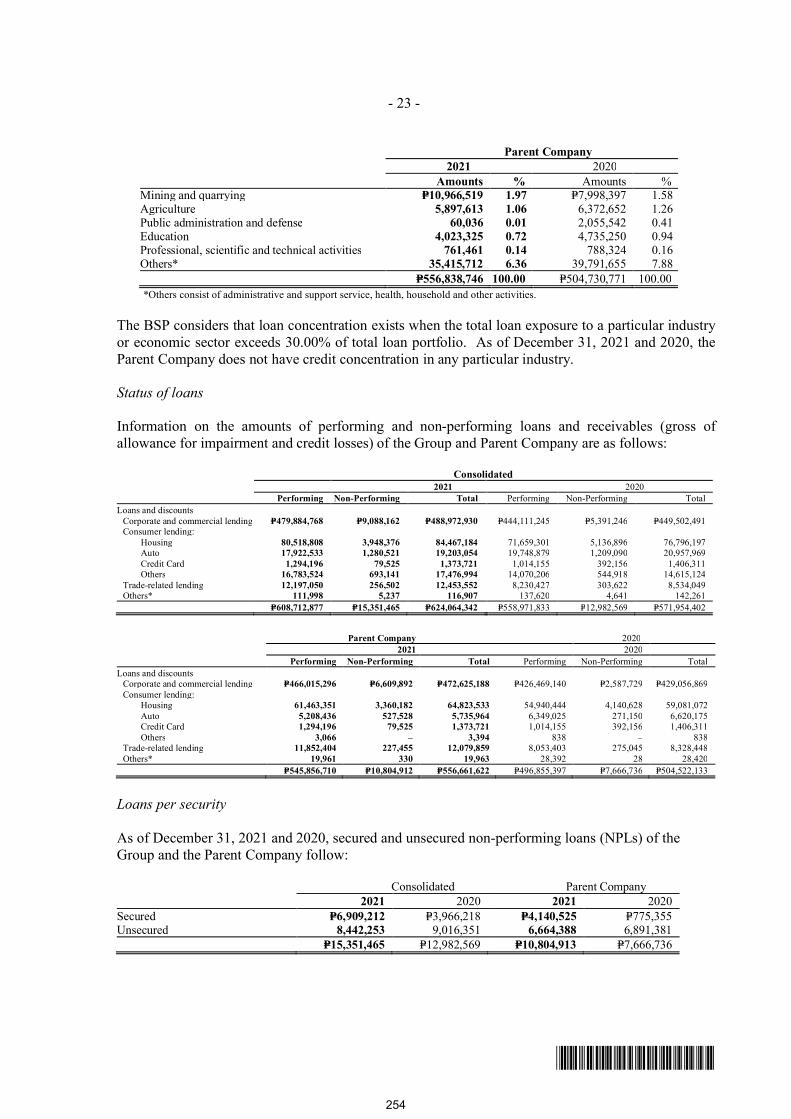
- 23 -
*SGVFS162381*
Parent Company2021 2020
Amounts % Amounts %Mining and quarrying P=10,966,519 1.97 P=7,998,397 1.58Agriculture 5,897,613 1.06 6,372,652 1.26Public administration and defense 60,036 0.01 2,055,542 0.41Education 4,023,325 0.72 4,735,250 0.94Professional, scientific and technical activities 761,461 0.14 788,324 0.16Others* 35,415,712 6.36 39,791,655 7.88
P=556,838,746 100.00 P=504,730,771 100.00 *Others consist of administrative and support service, health, household and other activities.
The BSP considers that loan concentration exists when the total loan exposure to a particular industryor economic sector exceeds 30.00% of total loan portfolio. As of December 31, 2021 and 2020, theParent Company does not have credit concentration in any particular industry.
Status of loans
Information on the amounts of performing and non-performing loans and receivables (gross ofallowance for impairment and credit losses) of the Group and Parent Company are as follows:
Consolidated2021 2020
Performing Non-Performing Total Performing Non-Performing TotalLoans and discounts
Corporate and commercial lending P=479,884,768 P=9,088,162 P=488,972,930 P=444,111,245 P=5,391,246 P=449,502,491Consumer lending:
Housing 80,518,808 3,948,376 84,467,184 71,659,301 5,136,896 76,796,197Auto 17,922,533 1,280,521 19,203,054 19,748,879 1,209,090 20,957,969Credit Card 1,294,196 79,525 1,373,721 1,014,155 392,156 1,406,311Others 16,783,524 693,141 17,476,994 14,070,206 544,918 14,615,124
Trade-related lending 12,197,050 256,502 12,453,552 8,230,427 303,622 8,534,049Others* 111,998 5,237 116,907 137,620 4,641 142,261
P=608,712,877 P=15,351,465 P=624,064,342 P=558,971,833 P=12,982,569 P=571,954,402
Parent Company 20202021 2020
Performing Non-Performing Total Performing Non-Performing TotalLoans and discounts
Corporate and commercial lending P=466,015,296 P=6,609,892 P=472,625,188 P=426,469,140 P=2,587,729 P=429,056,869Consumer lending:
Housing 61,463,351 3,360,182 64,823,533 54,940,444 4,140,628 59,081,072Auto 5,208,436 527,528 5,735,964 6,349,025 271,150 6,620,175Credit Card 1,294,196 79,525 1,373,721 1,014,155 392,156 1,406,311Others 3,066 – 3,394 838 – 838
Trade-related lending 11,852,404 227,455 12,079,859 8,053,403 275,045 8,328,448Others* 19,961 330 19,963 28,392 28 28,420
P=545,856,710 P=10,804,912 P=556,661,622 P=496,855,397 P=7,666,736 P=504,522,133
Loans per security
As of December 31, 2021 and 2020, secured and unsecured non-performing loans (NPLs) of theGroup and the Parent Company follow:
Consolidated Parent Company2021 2020 2021 2020
Secured P=6,909,212 P=3,966,218 P=4,140,525 P=775,355Unsecured 8,442,253 9,016,351 6,664,388 6,891,381
P=15,351,465 P=12,982,569 P=10,804,913 P=7,666,736
254
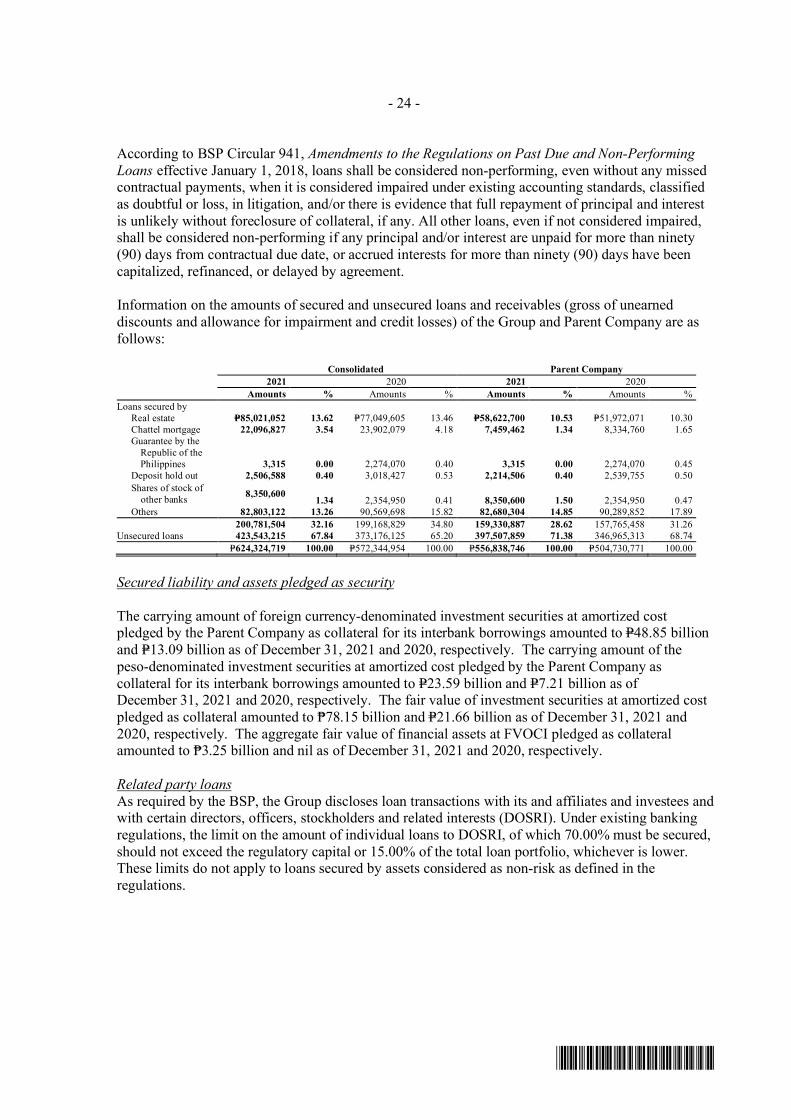
- 24 -
*SGVFS162381*
According to BSP Circular 941, Amendments to the Regulations on Past Due and Non-PerformingLoans effective January 1, 2018, loans shall be considered non-performing, even without any missedcontractual payments, when it is considered impaired under existing accounting standards, classifiedas doubtful or loss, in litigation, and/or there is evidence that full repayment of principal and interestis unlikely without foreclosure of collateral, if any. All other loans, even if not considered impaired,shall be considered non-performing if any principal and/or interest are unpaid for more than ninety(90) days from contractual due date, or accrued interests for more than ninety (90) days have beencapitalized, refinanced, or delayed by agreement.
Information on the amounts of secured and unsecured loans and receivables (gross of unearneddiscounts and allowance for impairment and credit losses) of the Group and Parent Company are asfollows:
Consolidated Parent Company2021 2020 2021 2020
Amounts % Amounts % Amounts % Amounts %Loans secured by Real estate P=85,021,052 13.62 P=77,049,605 13.46 P=58,622,700 10.53 P=51,972,071 10.30 Chattel mortgage 22,096,827 3.54 23,902,079 4.18 7,459,462 1.34 8,334,760 1.65 Guarantee by the
Republic of the Philippines 3,315 0.00 2,274,070 0.40 3,315 0.00 2,274,070 0.45
Deposit hold out 2,506,588 0.40 3,018,427 0.53 2,214,506 0.40 2,539,755 0.50 Shares of stock of
other banks 8,350,6001.34 2,354,950 0.41 8,350,600 1.50 2,354,950 0.47
Others 82,803,122 13.26 90,569,698 15.82 82,680,304 14.85 90,289,852 17.89200,781,504 32.16 199,168,829 34.80 159,330,887 28.62 157,765,458 31.26
Unsecured loans 423,543,215 67.84 373,176,125 65.20 397,507,859 71.38 346,965,313 68.74P=624,324,719 100.00 P=572,344,954 100.00 P=556,838,746 100.00 P=504,730,771 100.00
Secured liability and assets pledged as security
The carrying amount of foreign currency-denominated investment securities at amortized costpledged by the Parent Company as collateral for its interbank borrowings amounted to P=48.85 billionand P=13.09 billion as of December 31, 2021 and 2020, respectively. The carrying amount of thepeso-denominated investment securities at amortized cost pledged by the Parent Company ascollateral for its interbank borrowings amounted to P=23.59 billion and P=7.21 billion as ofDecember 31, 2021 and 2020, respectively. The fair value of investment securities at amortized costpledged as collateral amounted to ₱78.15 billion and P=21.66 billion as of December 31, 2021 and2020, respectively. The aggregate fair value of financial assets at FVOCI pledged as collateralamounted to ₱3.25 billion and nil as of December 31, 2021 and 2020, respectively.
Related party loansAs required by the BSP, the Group discloses loan transactions with its and affiliates and investees andwith certain directors, officers, stockholders and related interests (DOSRI). Under existing bankingregulations, the limit on the amount of individual loans to DOSRI, of which 70.00% must be secured,should not exceed the regulatory capital or 15.00% of the total loan portfolio, whichever is lower.These limits do not apply to loans secured by assets considered as non-risk as defined in theregulations.
255
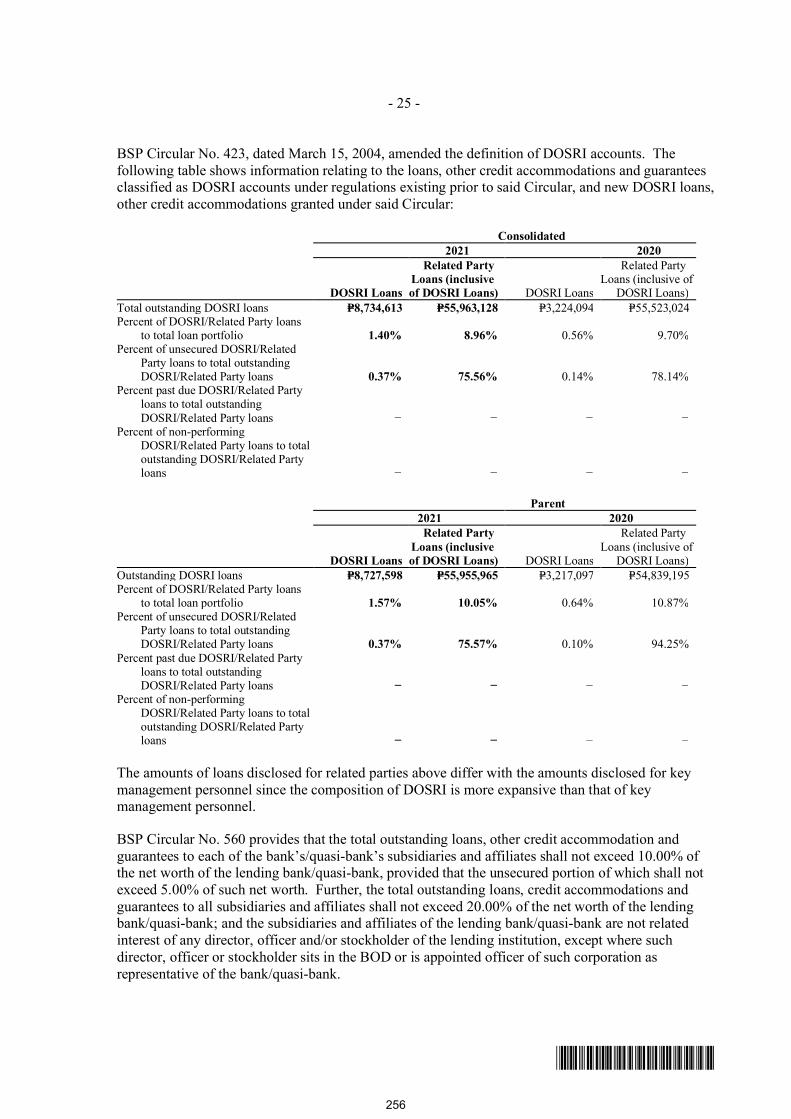
- 25 -
*SGVFS162381*
BSP Circular No. 423, dated March 15, 2004, amended the definition of DOSRI accounts. Thefollowing table shows information relating to the loans, other credit accommodations and guaranteesclassified as DOSRI accounts under regulations existing prior to said Circular, and new DOSRI loans,other credit accommodations granted under said Circular:
Consolidated2021 2020
DOSRI Loans
Related PartyLoans (inclusiveof DOSRI Loans) DOSRI Loans
Related PartyLoans (inclusive of
DOSRI Loans)Total outstanding DOSRI loans P=8,734,613 P=55,963,128 P=3,224,094 P=55,523,024Percent of DOSRI/Related Party loans
to total loan portfolio 1.40% 8.96% 0.56% 9.70%Percent of unsecured DOSRI/Related
Party loans to total outstandingDOSRI/Related Party loans 0.37% 75.56% 0.14% 78.14%
Percent past due DOSRI/Related Partyloans to total outstandingDOSRI/Related Party loans − − − −
Percent of non-performingDOSRI/Related Party loans to totaloutstanding DOSRI/Related Partyloans − − − −
Parent2021 2020
DOSRI Loans
Related PartyLoans (inclusiveof DOSRI Loans) DOSRI Loans
Related PartyLoans (inclusive of
DOSRI Loans)Outstanding DOSRI loans P=8,727,598 P=55,955,965 P=3,217,097 P=54,839,195Percent of DOSRI/Related Party loans
to total loan portfolio 1.57% 10.05% 0.64% 10.87%Percent of unsecured DOSRI/Related
Party loans to total outstandingDOSRI/Related Party loans 0.37% 75.57% 0.10% 94.25%
Percent past due DOSRI/Related Partyloans to total outstandingDOSRI/Related Party loans − − − −
Percent of non-performingDOSRI/Related Party loans to totaloutstanding DOSRI/Related Partyloans − − − −
The amounts of loans disclosed for related parties above differ with the amounts disclosed for keymanagement personnel since the composition of DOSRI is more expansive than that of keymanagement personnel.
BSP Circular No. 560 provides that the total outstanding loans, other credit accommodation andguarantees to each of the bank’s/quasi-bank’s subsidiaries and affiliates shall not exceed 10.00% ofthe net worth of the lending bank/quasi-bank, provided that the unsecured portion of which shall notexceed 5.00% of such net worth. Further, the total outstanding loans, credit accommodations andguarantees to all subsidiaries and affiliates shall not exceed 20.00% of the net worth of the lendingbank/quasi-bank; and the subsidiaries and affiliates of the lending bank/quasi-bank are not relatedinterest of any director, officer and/or stockholder of the lending institution, except where suchdirector, officer or stockholder sits in the BOD or is appointed officer of such corporation asrepresentative of the bank/quasi-bank.
256
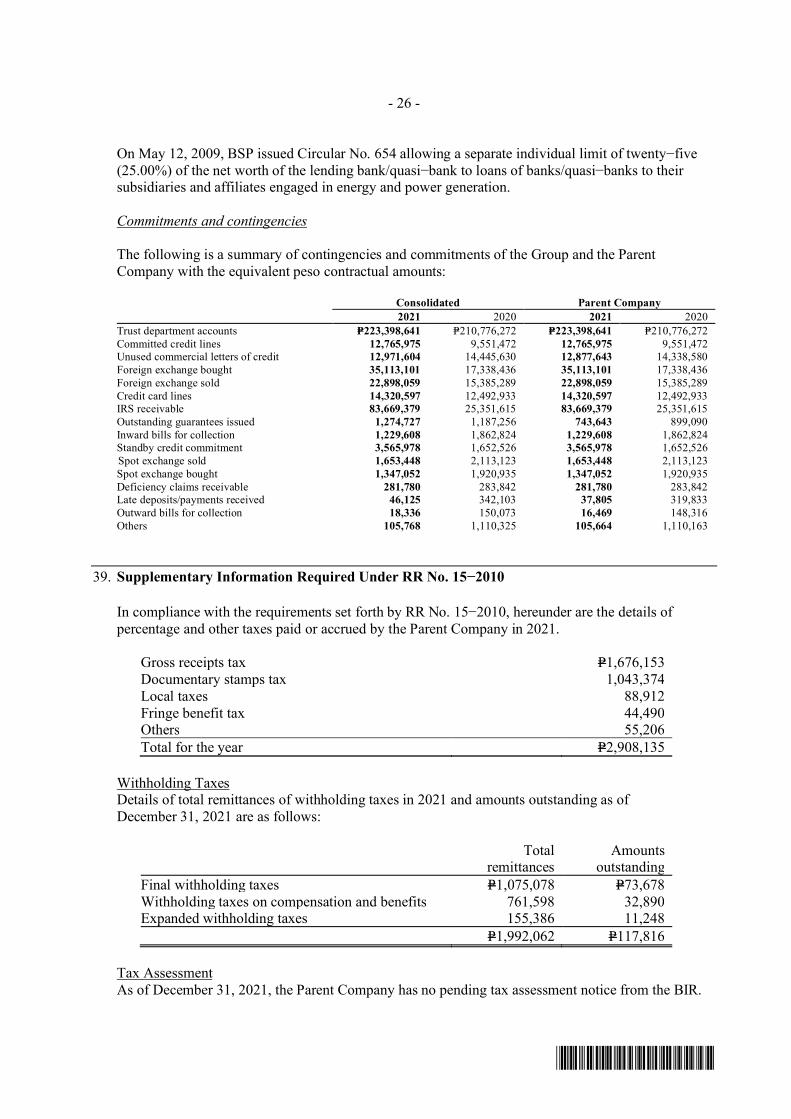
- 26 -
*SGVFS162381*
On May 12, 2009, BSP issued Circular No. 654 allowing a separate individual limit of twenty−five(25.00%) of the net worth of the lending bank/quasi−bank to loans of banks/quasi−banks to theirsubsidiaries and affiliates engaged in energy and power generation.
Commitments and contingencies
The following is a summary of contingencies and commitments of the Group and the ParentCompany with the equivalent peso contractual amounts:
Consolidated Parent Company2021 2020 2021 2020
Trust department accounts P=223,398,641 P=210,776,272 P=223,398,641 P=210,776,272Committed credit lines 12,765,975 9,551,472 12,765,975 9,551,472Unused commercial letters of credit 12,971,604 14,445,630 12,877,643 14,338,580Foreign exchange bought 35,113,101 17,338,436 35,113,101 17,338,436Foreign exchange sold 22,898,059 15,385,289 22,898,059 15,385,289Credit card lines 14,320,597 12,492,933 14,320,597 12,492,933IRS receivable 83,669,379 25,351,615 83,669,379 25,351,615Outstanding guarantees issued 1,274,727 1,187,256 743,643 899,090Inward bills for collection 1,229,608 1,862,824 1,229,608 1,862,824Standby credit commitment 3,565,978 1,652,526 3,565,978 1,652,526Spot exchange sold 1,653,448 2,113,123 1,653,448 2,113,123Spot exchange bought 1,347,052 1,920,935 1,347,052 1,920,935Deficiency claims receivable 281,780 283,842 281,780 283,842Late deposits/payments received 46,125 342,103 37,805 319,833Outward bills for collection 18,336 150,073 16,469 148,316Others 105,768 1,110,325 105,664 1,110,163
39. Supplementary Information Required Under RR No. 15−2010
In compliance with the requirements set forth by RR No. 15−2010, hereunder are the details ofpercentage and other taxes paid or accrued by the Parent Company in 2021.
Gross receipts tax P=1,676,153Documentary stamps tax 1,043,374Local taxes 88,912Fringe benefit tax 44,490Others 55,206Total for the year P=2,908,135
Withholding TaxesDetails of total remittances of withholding taxes in 2021 and amounts outstanding as ofDecember 31, 2021 are as follows:
Totalremittances
Amountsoutstanding
Final withholding taxes P=1,075,078 P=73,678Withholding taxes on compensation and benefits 761,598 32,890Expanded withholding taxes 155,386 11,248
P=1,992,062 P=117,816
Tax AssessmentAs of December 31, 2021, the Parent Company has no pending tax assessment notice from the BIR.
257
*SGVFS162381*
INDEPENDENT AUDITOR’S REPORTON SUPPLEMENTARY SCHEDULES
The Stockholders and the Board of DirectorsChina Banking Corporation8745 Paseo de Roxas cor. Villar St.Makati City
We have audited in accordance with Philippine Standards on Auditing, the consolidated financialstatements of China Banking Corporation and Subsidiaries (the Group) as at December 31, 2021 and2020 and for each of the three years ended December 31, 2021, included in this Form 17-A, and haveissued our report thereon dated February 28, 2022. Our audits were made for the purpose of forming anopinion on the basic consolidated financial statements taken as a whole. The schedules listed in the Indexto the Financial Statements and Supplementary Schedules are the responsibility of the Group’smanagement. These schedules are presented for purposes of complying with the Revised SecuritiesRegulation Code Rule 68, and are not part of the basic financial statements. These schedules have beensubjected to the auditing procedures applied in the audit of the basic consolidated financial statementsand, in our opinion, fairly state, in all material respects, the information required to be set forth therein inrelation to the basic consolidated financial statements taken as a whole.
SYCIP GORRES VELAYO & CO.
Janet A. ParaisoPartnerCPA Certificate No. 92305Tax Identification No. 193-975-241BOA/PRC Reg. No. 0001, August 25, 2021, valid until April 15, 2024SEC Partner Accreditation No. 92305-SEC (Group A)
Valid to cover audit of 2021 to 2025 financial statements of SEC covered institutionsSEC Firm Accreditation No. 0001-SEC (Group A)
Valid to cover audit of 2021 to 2025 financial statements of SEC covered institutionsBIR Accreditation No. 08-001998-062-2020, December 3, 2020, valid until December 2, 2023PTR No. 8853462, January 3, 2022, Makati City
February 28, 2022
SyCip Gorres Velayo & Co.6760 Ayala Avenue1226 Makati CityPhilippines
Tel: (632) 8891 0307Fax: (632) 8819 0872ey.com/ph
A member firm of Ernst & Young Global Limited
258
*SGVFS162381*
INDEPENDENT AUDITOR’S REPORT ONCOMPONENTS OF FINANCIAL SOUNDNESS INDICATORS
The Stockholders and the Board of DirectorsChina Banking Corporation8745 Paseo de Roxas cor. Villar St.Makati City
We have audited in accordance with Philippine Standards on Auditing, the consolidated financialstatements of China Banking Corporation and Subsidiaries (the Group) as at December 31, 2021 and2020 and for each of the three years in the period ended December 31, 2021 and have issued our reportthereon dated February 28, 2022. Our audits were made for the purpose of forming an opinion on thebasic consolidated financial statements taken as a whole. The Supplementary Schedule on FinancialSoundness Indicators, including their definitions, formulas, calculation, and their appropriateness orusefulness to the intended users, are the responsibility of the Group’s management. These financialsoundness indicators are not measures of operating performance defined by Philippine FinancialReporting Standards (PFRSs) and may not be comparable to similarly titled measures presented by othercompanies. This schedule is presented for the purpose of complying with the Revised SecuritiesRegulation Code Rule 68 issued by the Securities and Exchange Commission, and is not a required partof the basic consolidated financial statements prepared in accordance with PFRSs. The components ofthese financial soundness indicators have been traced to the Group’s consolidated financial statements asat December 31, 2021 and for each of the three years in the period ended December 31, 2021 and nomaterial exceptions were noted.
SYCIP GORRES VELAYO & CO.
Janet A. ParaisoPartnerCPA Certificate No. 92305Tax Identification No. 193-975-241BOA/PRC Reg. No. 0001, August 25, 2021, valid until April 15, 2024SEC Partner Accreditation No. 92305-SEC (Group A)
Valid to cover audit of 2021 to 2025 financial statements of SEC covered institutionsSEC Firm Accreditation No. 0001-SEC (Group A)
Valid to cover audit of 2021 to 2025 financial statements of SEC covered institutionsBIR Accreditation No. 08-001998-062-2020, December 3, 2020, valid until December 2, 2023PTR No. 8853462, January 3, 2022, Makati City
February 28, 2022
SyCip Gorres Velayo & Co.6760 Ayala Avenue1226 Makati CityPhilippines
Tel: (632) 8891 0307Fax: (632) 8819 0872ey.com/ph
A member firm of Ernst & Young Global Limited
259
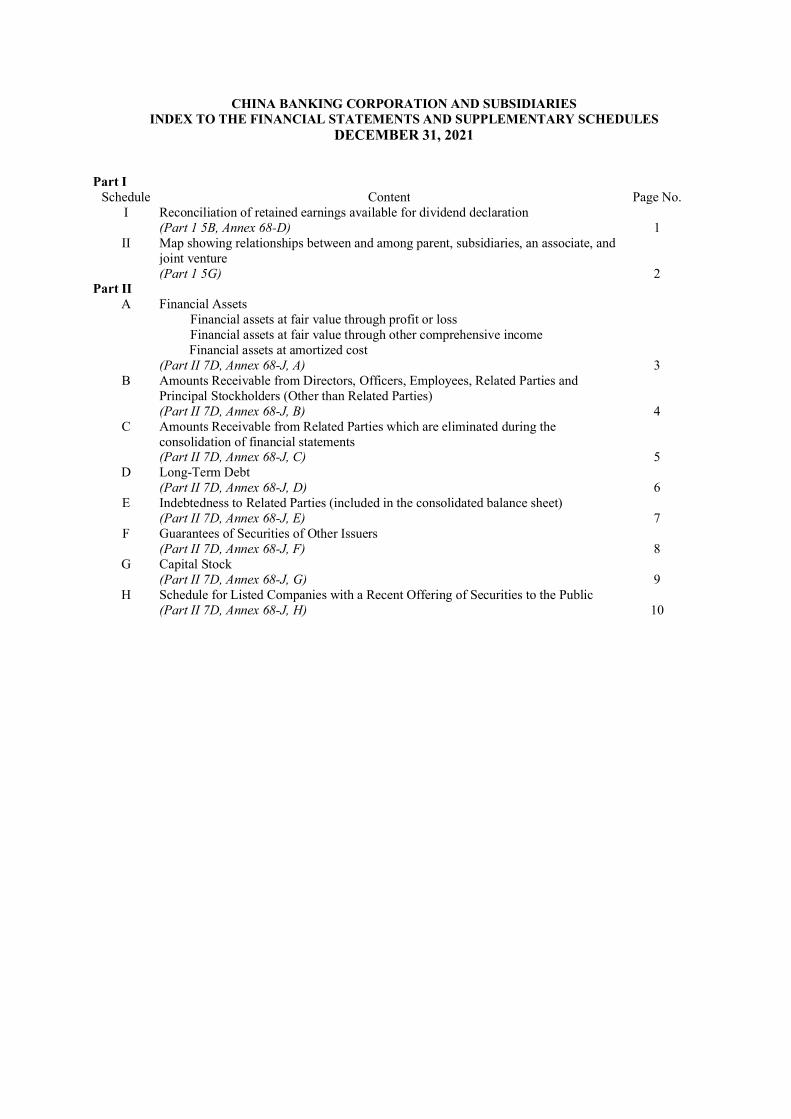
CHINA BANKING CORPORATION AND SUBSIDIARIESINDEX TO THE FINANCIAL STATEMENTS AND SUPPLEMENTARY SCHEDULES
DECEMBER 31, 2021
Part ISchedule Content Page No.
I Reconciliation of retained earnings available for dividend declaration(Part 1 5B, Annex 68-D) 1
II Map showing relationships between and among parent, subsidiaries, an associate, andjoint venture(Part 1 5G) 2
Part IIA Financial Assets
Financial assets at fair value through profit or lossFinancial assets at fair value through other comprehensive incomeFinancial assets at amortized cost
(Part II 7D, Annex 68-J, A) 3B Amounts Receivable from Directors, Officers, Employees, Related Parties and
Principal Stockholders (Other than Related Parties)(Part II 7D, Annex 68-J, B) 4
C Amounts Receivable from Related Parties which are eliminated during theconsolidation of financial statements(Part II 7D, Annex 68-J, C) 5
D Long-Term Debt(Part II 7D, Annex 68-J, D) 6
E Indebtedness to Related Parties (included in the consolidated balance sheet)(Part II 7D, Annex 68-J, E) 7
F Guarantees of Securities of Other Issuers(Part II 7D, Annex 68-J, F) 8
G Capital Stock(Part II 7D, Annex 68-J, G) 9
H Schedule for Listed Companies with a Recent Offering of Securities to the Public(Part II 7D, Annex 68-J, H) 10
260

CHINA BANKING CORPORATION AND SUBSIDIARIES8745 Paseo de Roxas corner Villar Street Makati City
SCHEDULE IRECONCILIATION OF RETAINED EARNINGSAVAILABLE FOR DIVIDEND DECLARATION
AS OF DECEMBER 31, 2021(Amounts in Thousands)
Unappropriated Retained Earnings, Beginning P=58,659,768
Adjustments:Prior years non-actual/unrealized income net of tax (2007-2020) (6,145,788)Transfer of revaluation increment to surplus (1,277,277)
Prior years’ net earnings of subsidiaries and associates not available fordividends (3,679,403)
(11,102,468)
Unappropriated Retained Earnings, as adjusted to available for dividenddistribution, beginning
47,557,300
Add: Net income during the period 15,088,332
Less: Non-actual/unrealized income net of taxFair value adjustments (mark-to-market gains) 40,181Net earnings of subsidiaries not available for dividends 1,422,503Fair value adjustments of investment property resulting to gain 54,554Sub-total 1,517,238
Add: Non-actual lossesReversal of net fair value gains upon disposal of investment properties 117,703
117,703
Net income actually earned/ realized during the period 13,688,797
Less: Cash dividend declared during the period 2,685,900Appropriation of Retained Earnings during the period 811,587Transfer from Surplus to Surplus Reserves 45,096
(3,542,583)
Unappropriated Retained Earnings, Ending, Available for Dividend Declaration P=57,703,514
261
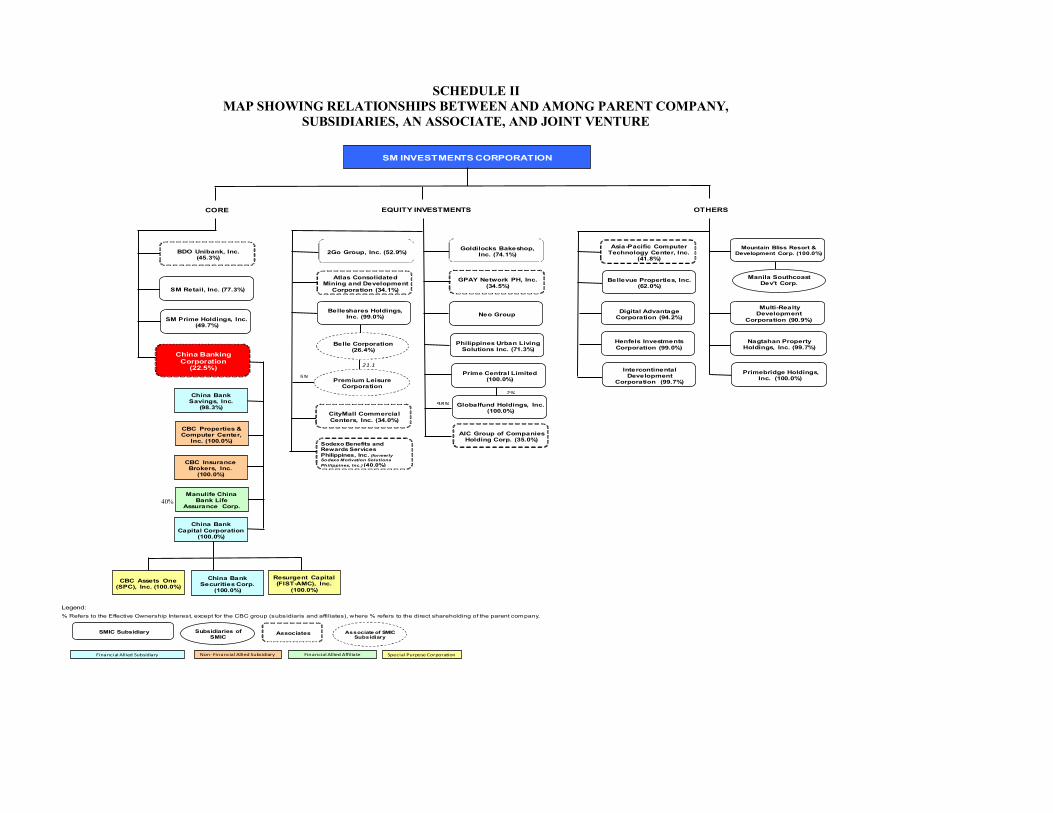
SCHEDULE IIMAP SHOWING RELATIONSHIPS BETWEEN AND AMONG PARENT COMPANY,
SUBSIDIARIES, AN ASSOCIATE, AND JOINT VENTURE
Legend:
Legend:% Refers to the Effective Ownership Interest, except for the CBC group (subsidiaris and affiliates), where % refers to the direct shareholding of the parent company.
SM Retail, Inc. (77.3%)
BDO Unibank, Inc.(45.3%)
SM INVESTMENTS CORPORATION
SMIC Subsidiary Associates
Financial Allied Subsidiary Non- Financial Allied Subsidiary Financial Allied Affiliate Special Purpose Corporation
CORE
China BankingCorporation
(22.5%)
China BankSavings, Inc.
(98.3%)
China BankCapital Corporation
(100.0%)
CBC Properties &Computer Center,
Inc. (100.0%)
CBC InsuranceBrokers, Inc.
(100.0%)
Manulife ChinaBank Life
Assurance Corp.
CBC Assets One(SPC), Inc. (100.0%)
China BankSecurities Corp.
(100.0%)
SM Prime Holdings, Inc.(49.7%)
EQUITY INVESTMENTS
Belle Corporation(26.4%)
Manila SouthcoastDev't Corp.
2Go Group, Inc. (52.9%)
Atlas ConsolidatedMining and Development
Corporation (34.1%)
Belleshares Holdings,Inc. (99.0%)
Premium LeisureCorporation
CityMall CommercialCenters, Inc. (34.0%)
Goldilocks Bakeshop,Inc. (74.1%)
GPAY Network PH, Inc.(34.5%)
Neo Group
Philippines Urban LivingSolutions Inc. (71.3%)
OTHERS
Asia-Pacific ComputerTechnology Center, Inc.
(41.8%)
Nagtahan PropertyHoldings, Inc. (99.7%)
Bellevue Properties, Inc.(62.0%)
Henfels InvestmentsCorporation (99.0%)
Mountain Bliss Resort &Development Corp. (100.0%)
Multi-RealtyDevelopment
Corporation (90.9%)
Primebridge Holdings,Inc. (100.0%)
Subsidiaries ofSMIC
Associate of SMICSubsidiary
21.1
5%
Sodexo Benefits andRewards ServicesPhilippines, Inc. (formerlySodexo Motivation SolutionsPhilippines, Inc.) (40.0%)
Prime Central Limited(100.0%)
AIC Group of CompaniesHolding Corp. (35.0%)
Digital AdvantageCorporation (94.2%)
IntercontinentalDevelopment
Corporation (99.7%)
Resurgent Capital(FIST-AMC), Inc.
(100.0%)
Globalfund Holdings, Inc.(100.0%)
98%
2%
40%
262
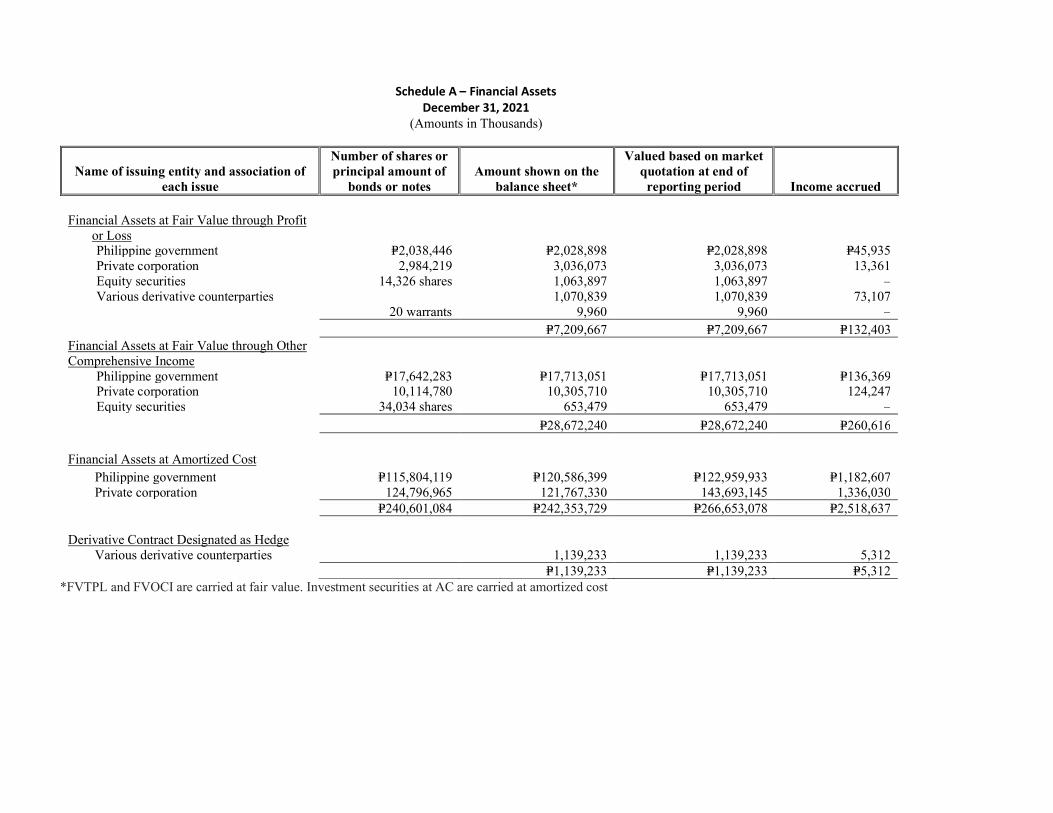
Schedule A – Financial AssetsDecember 31, 2021
(Amounts in Thousands)
Name of issuing entity and association ofeach issue
Number of shares orprincipal amount of
bonds or notesAmount shown on the
balance sheet*
Valued based on marketquotation at end of
reporting period Income accrued
Financial Assets at Fair Value through Profitor LossPhilippine government P=2,038,446 P=2,028,898 P=2,028,898 P=45,935Private corporation 2,984,219 3,036,073 3,036,073 13,361Equity securities 14,326 shares 1,063,897 1,063,897 –Various derivative counterparties 1,070,839 1,070,839 73,107
20 warrants 9,960 9,960 –P=7,209,667 P=7,209,667 P=132,403
Financial Assets at Fair Value through OtherComprehensive Income
Philippine government P=17,642,283 P=17,713,051 P=17,713,051 P=136,369Private corporation 10,114,780 10,305,710 10,305,710 124,247Equity securities 34,034 shares 653,479 653,479 –
P=28,672,240 P=28,672,240 P=260,616
Financial Assets at Amortized CostPhilippine government P=115,804,119 P=120,586,399 P=122,959,933 P=1,182,607Private corporation 124,796,965 121,767,330 143,693,145 1,336,030
P=240,601,084 P=242,353,729 P=266,653,078 P=2,518,637
Derivative Contract Designated as HedgeVarious derivative counterparties 1,139,233 1,139,233 5,312
P=1,139,233 P=1,139,233 P=5,312*FVTPL and FVOCI are carried at fair value. Investment securities at AC are carried at amortized cost
263
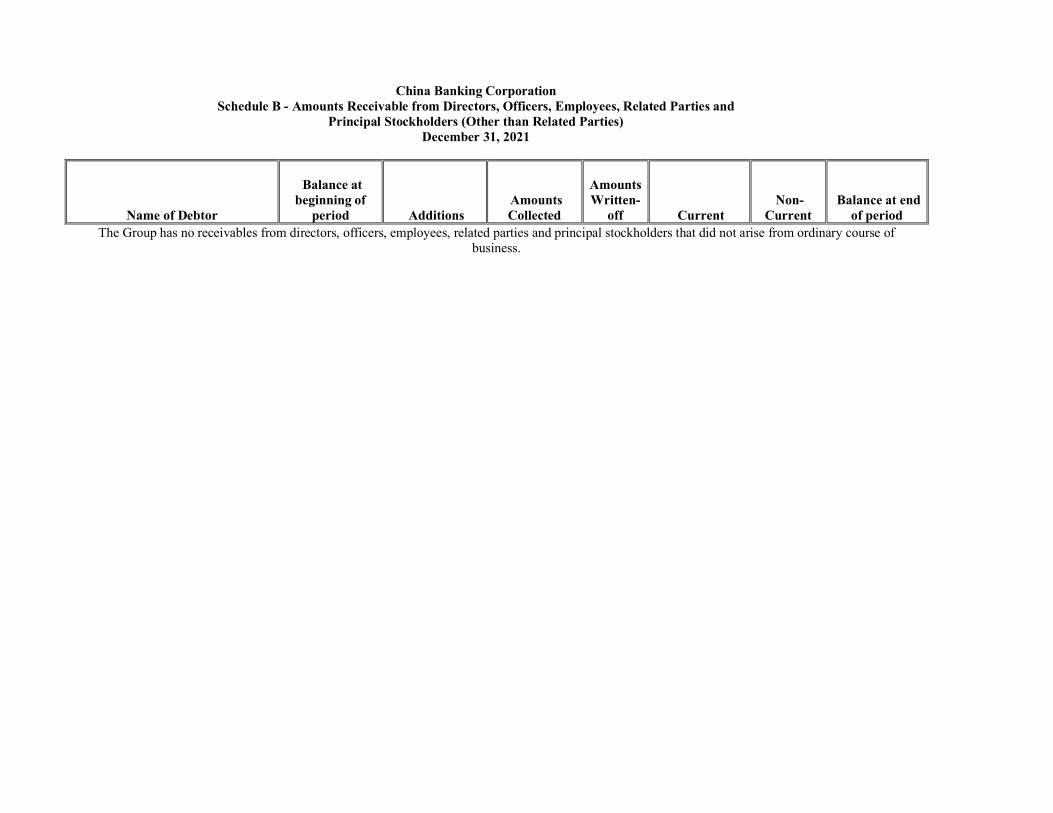
China Banking CorporationSchedule B - Amounts Receivable from Directors, Officers, Employees, Related Parties and
Principal Stockholders (Other than Related Parties)December 31, 2021
Name of Debtor
Balance atbeginning of
period Additions AmountsCollected
AmountsWritten-
off Current Non-
Current Balance at end
of periodThe Group has no receivables from directors, officers, employees, related parties and principal stockholders that did not arise from ordinary course of
business.
264
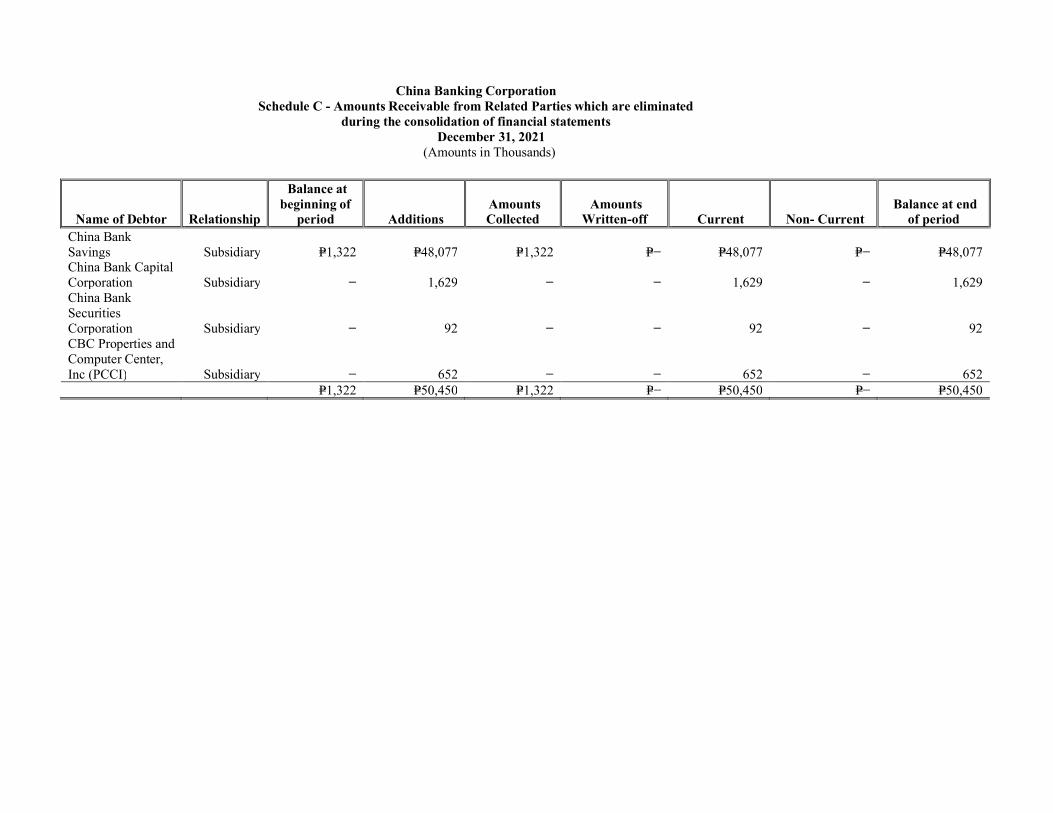
China Banking CorporationSchedule C - Amounts Receivable from Related Parties which are eliminated
during the consolidation of financial statementsDecember 31, 2021
(Amounts in Thousands)
Name of Debtor Relationship
Balance atbeginning of
period Additions AmountsCollected
AmountsWritten-off Current Non- Current
Balance at endof period
China BankSavings Subsidiary P=1,322 P=48,077 P=1,322 P=− P=48,077 P=− P=48,077China Bank CapitalCorporation Subsidiary − 1,629 − − 1,629 − 1,629China BankSecuritiesCorporation Subsidiary − 92 − − 92 − 92CBC Properties andComputer Center,Inc (PCCI) Subsidiary − 652 − − 652 − 652
P=1,322 P=50,450 P=1,322 P=− P=50,450 P=− P=50,450
265
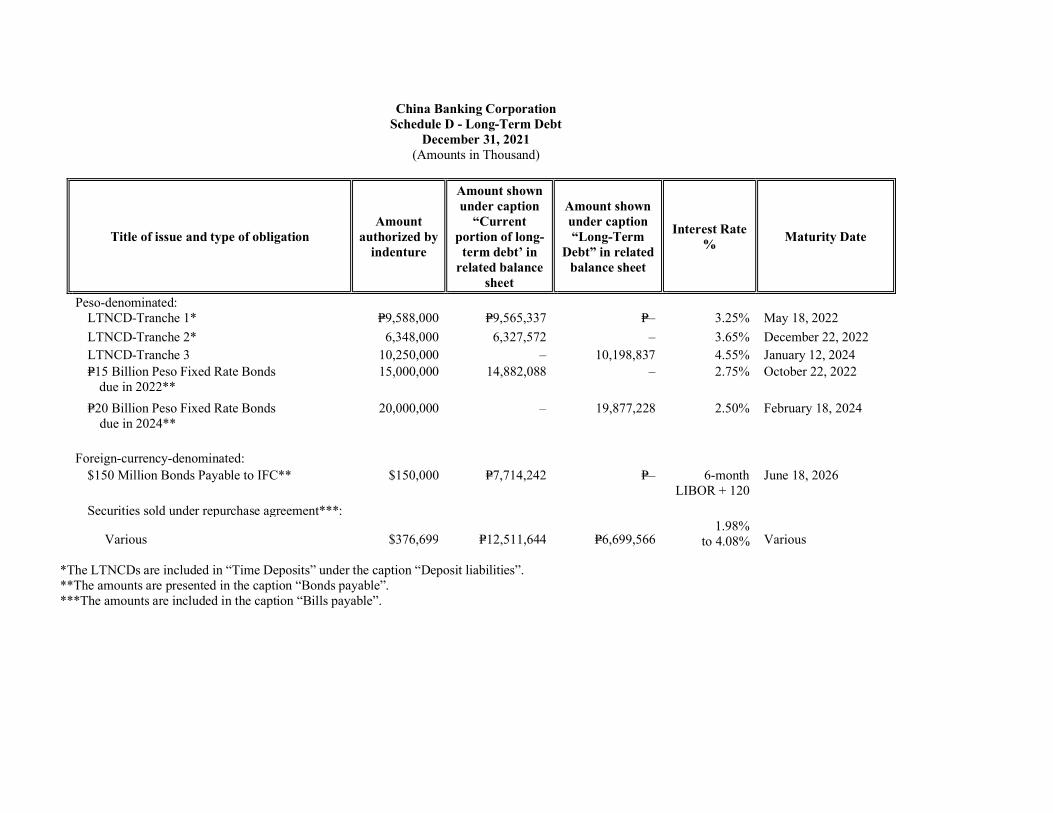
China Banking CorporationSchedule D - Long-Term Debt
December 31, 2021(Amounts in Thousand)
Title of issue and type of obligationAmount
authorized byindenture
Amount shownunder caption
“Currentportion of long-
term debt’ inrelated balance
sheet
Amount shownunder caption“Long-Term
Debt” in relatedbalance sheet
Interest Rate% Maturity Date
Peso-denominated:LTNCD-Tranche 1* P=9,588,000 P=9,565,337 P=– 3.25% May 18, 2022LTNCD-Tranche 2* 6,348,000 6,327,572 – 3.65% December 22, 2022LTNCD-Tranche 3 10,250,000 – 10,198,837 4.55% January 12, 2024P=15 Billion Peso Fixed Rate Bonds due in 2022**
15,000,000 14,882,088 – 2.75% October 22, 2022
P=20 Billion Peso Fixed Rate Bonds due in 2024**
20,000,000 – 19,877,228 2.50% February 18, 2024
Foreign-currency-denominated:$150 Million Bonds Payable to IFC** $150,000 P=7,714,242 P=– 6-month
LIBOR + 120bps
June 18, 2026
Securities sold under repurchase agreement***:
Various $376,699 P=12,511,644 P=6,699,5661.98%
to 4.08% Various
*The LTNCDs are included in “Time Deposits” under the caption “Deposit liabilities”.**The amounts are presented in the caption “Bonds payable”.***The amounts are included in the caption “Bills payable”.
266
China Banking CorporationSchedule E - Indebtedness to Related Parties(Long-term Loans from Related Companies)
December 31, 2021
Name of Related Parties (i) Balance at beginning of period Balance at end of period (ii)
None to Report
(i) The related parties named shall be grouped as in Schedule D. The information called shall be stated for any persons whose investments shownseparately in such related schedule.
(ii) For each affiliate named in the first column, explain in a note hereto the nature and purpose of any material increase during the period that is in excess of10 percent of the related balance at either the beginning or end of the period.
267
China Banking CorporationSchedule F - Guarantees of Securities of Other Issuers
December 31, 2021
Name of issuing entity ofsecurities guaranteed by
the company for which thisstatement is filed
Title of issue of each classof securities guaranteed
Total amount ofguaranteed andoutstanding (i)
Amount owned by personof which statement is filed Nature of guarantee (ii)
None to Report
(i) Indicate in a note any significant changes since the date of the last balance sheet file. If this schedule is filed in support of consolidated financialstatements, there shall be set forth guarantees by any person included in the consolidation except such guarantees of securities which are included in theconsolidated balance sheet.
(ii) There must be a brief statement of the nature of the guarantee, such as “Guarantee of principal and interest”, “Guarantee of Interest”, or “Guarantee ofDividends”. If the guarantee is of interest, dividends, or both, state the annual aggregate amount of interest or dividends so guaranteed.
268
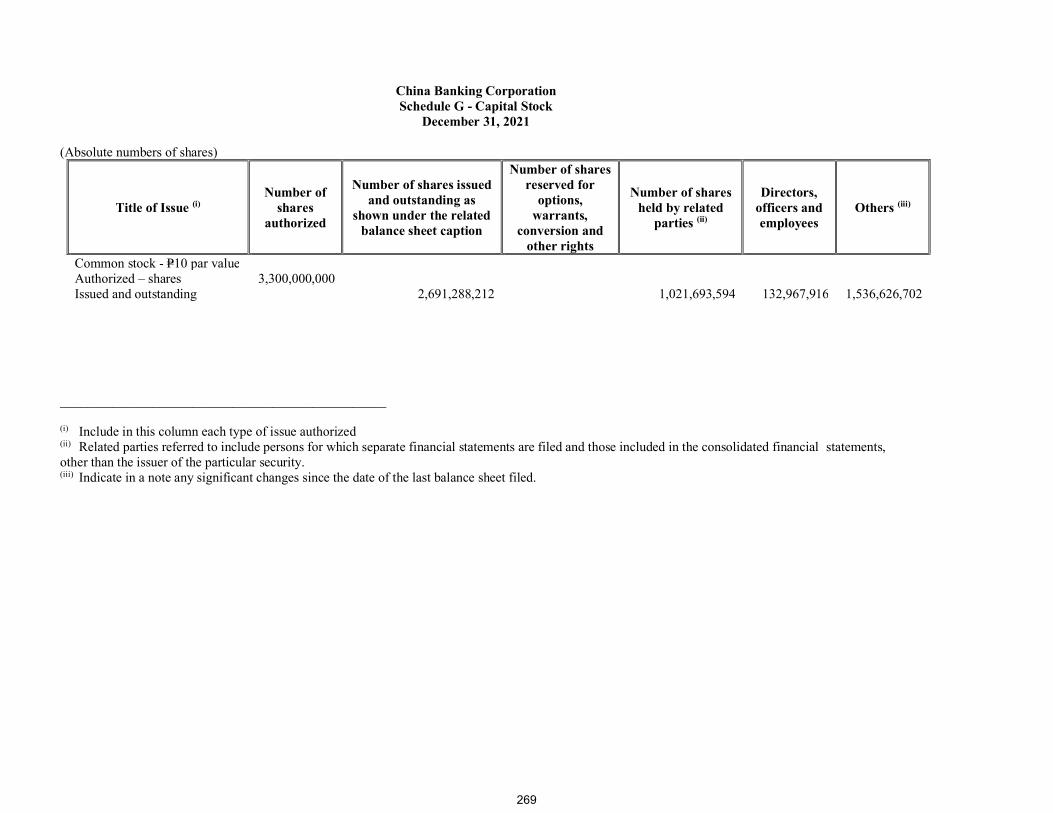
China Banking CorporationSchedule G - Capital Stock
December 31, 2021
(Absolute numbers of shares)
Title of Issue (i)Number of
sharesauthorized
Number of shares issuedand outstanding as
shown under the relatedbalance sheet caption
Number of sharesreserved for
options,warrants,
conversion andother rights
Number of sharesheld by related
parties (ii)
Directors,officers andemployees
Others (iii)
Common stock - P=10 par valueAuthorized – shares 3,300,000,000Issued and outstanding 2,691,288,212 1,021,693,594 132,967,916 1,536,626,702
_________________________________________________
(i) Include in this column each type of issue authorized(ii) Related parties referred to include persons for which separate financial statements are filed and those included in the consolidated financial statements,other than the issuer of the particular security.(iii) Indicate in a note any significant changes since the date of the last balance sheet filed.
269

China Banking CorporationSchedule H – Schedule for Listed Companies with a Recent Offering of Securities to the Public
December 31, 2021(Amounts in Thousand)
Gross Proceeds asdisclosed in the Final
ProspectusExpenditure Items
Net Proceeds asdisclosed in the
Final Prospectus (i)
Actual GrossProceeds
Actual NetProceeds
Balance of theproceeds as of thereporting period
P=20 Billion Peso FixedRate Bonds
P=20,000,000 P=20,000,000 P=19,832,512 P=20,000,000 P=19,832,512 P=−
_________________________________________________
(i) The net proceeds from the securities were used to support the Bank’s initiatives and expansion programs.
270
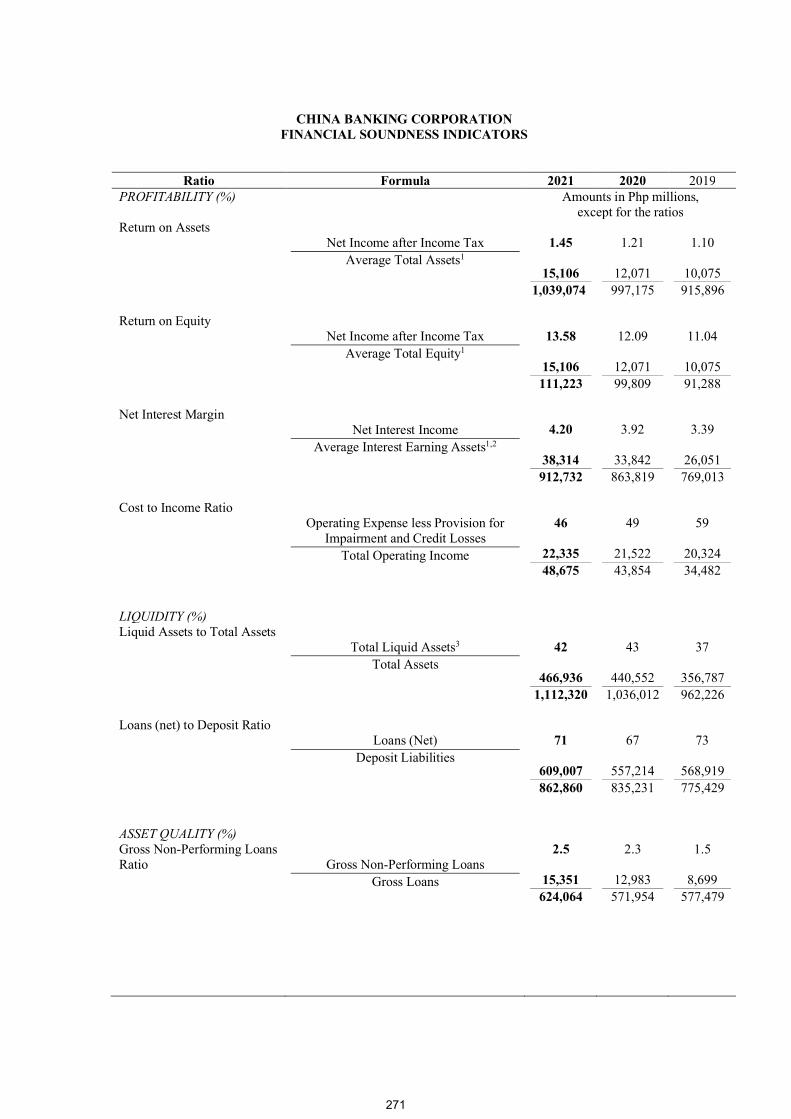
CHINA BANKING CORPORATIONFINANCIAL SOUNDNESS INDICATORS
Ratio Formula 2021 2020 2019PROFITABILITY (%) Amounts in Php millions,
except for the ratiosReturn on Assets
Net Income after Income TaxAverage Total Assets1
1.45
15,1061,039,074
1.21
12,071997,175
1.10
10,075915,896
Return on EquityNet Income after Income Tax
Average Total Equity113.58
15,106111,223
12.09
12,07199,809
11.04
10,07591,288
Net Interest MarginNet Interest Income
Average Interest Earning Assets1,24.20
38,314912,732
3.92
33,842863,819
3.39
26,051769,013
Cost to Income RatioOperating Expense less Provision for
Impairment and Credit LossesTotal Operating Income
46
22,33548,675
49
21,52243,854
59
20,32434,482
LIQUIDITY (%)Liquid Assets to Total Assets
Total Liquid Assets3
Total Assets42
466,9361,112,320
43
440,5521,036,012
37
356,787962,226
Loans (net) to Deposit RatioLoans (Net)
Deposit Liabilities71
609,007862,860
67
557,214835,231
73
568,919775,429
ASSET QUALITY (%)Gross Non-Performing LoansRatio Gross Non-Performing Loans
Gross Loans
2.5
15,351624,064
2.3
12,983571,954
1.5
8,699577,479
271
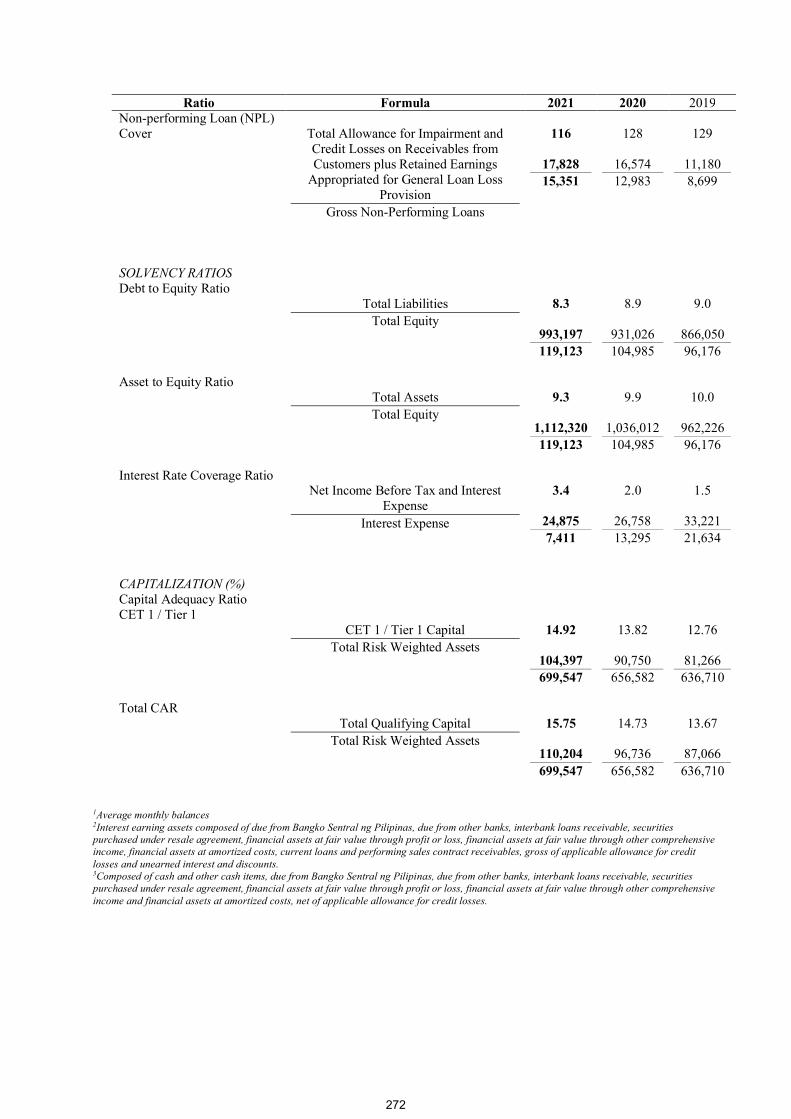
Ratio Formula 2021 2020 2019Non-performing Loan (NPL)Cover Total Allowance for Impairment and
Credit Losses on Receivables fromCustomers plus Retained Earnings
Appropriated for General Loan LossProvision
Gross Non-Performing Loans
116
17,82815,351
128
16,57412,983
129
11,1808,699
SOLVENCY RATIOSDebt to Equity Ratio
Total LiabilitiesTotal Equity
8.3
993,197119,123
8.9
931,026104,985
9.0
866,05096,176
Asset to Equity RatioTotal AssetsTotal Equity
9.3
1,112,320119,123
9.9
1,036,012104,985
10.0
962,22696,176
Interest Rate Coverage RatioNet Income Before Tax and Interest
ExpenseInterest Expense
3.4
24,8757,411
2.0
26,75813,295
1.5
33,22121,634
CAPITALIZATION (%)Capital Adequacy RatioCET 1 / Tier 1
CET 1 / Tier 1 CapitalTotal Risk Weighted Assets
14.92
104,397699,547
13.82
90,750656,582
12.76
81,266636,710
Total CARTotal Qualifying Capital
Total Risk Weighted Assets15.75
110,204699,547
14.73
96,736656,582
13.67
87,066636,710
1Average monthly balances2Interest earning assets composed of due from Bangko Sentral ng Pilipinas, due from other banks, interbank loans receivable, securitiespurchased under resale agreement, financial assets at fair value through profit or loss, financial assets at fair value through other comprehensiveincome, financial assets at amortized costs, current loans and performing sales contract receivables, gross of applicable allowance for creditlosses and unearned interest and discounts.3Composed of cash and other cash items, due from Bangko Sentral ng Pilipinas, due from other banks, interbank loans receivable, securitiespurchased under resale agreement, financial assets at fair value through profit or loss, financial assets at fair value through other comprehensiveincome and financial assets at amortized costs, net of applicable allowance for credit losses.
272
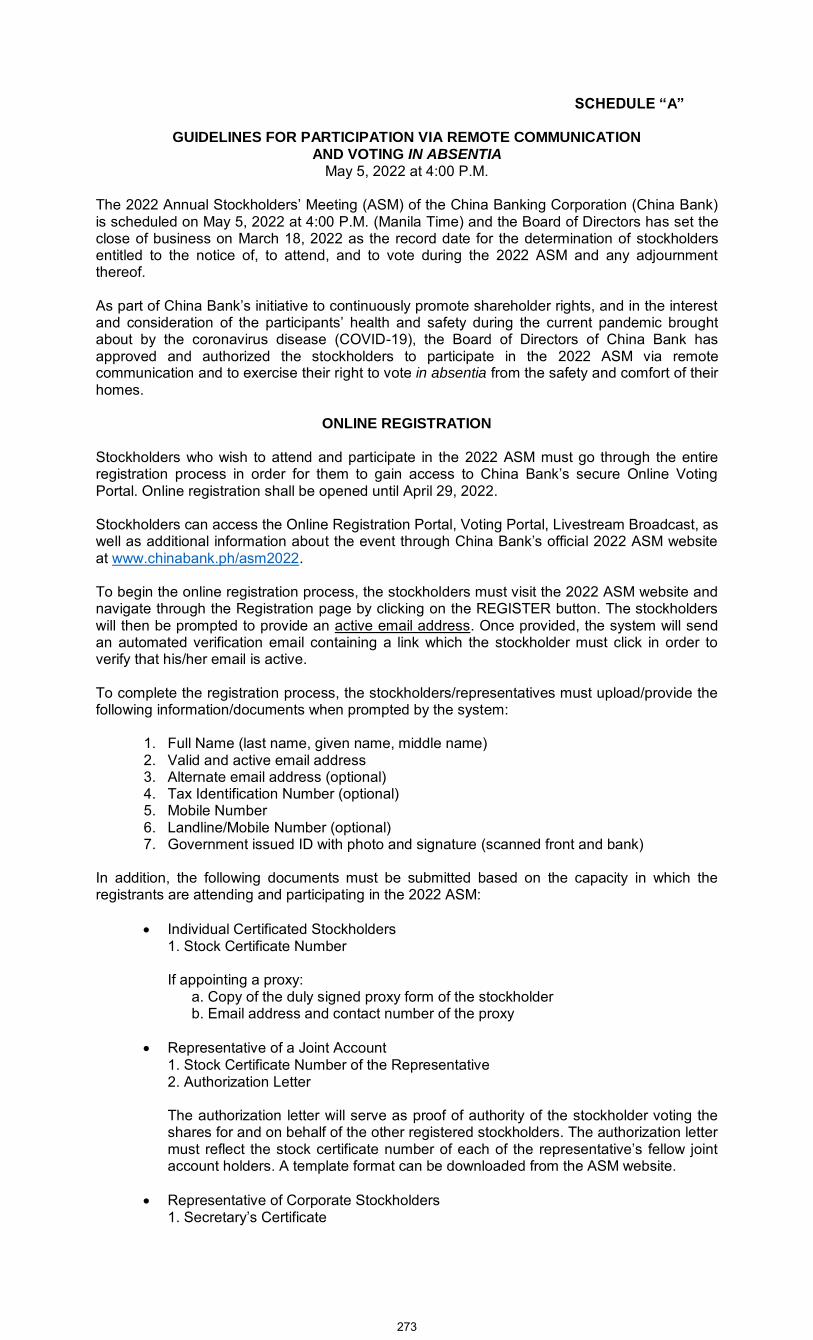
SCHEDULE “A”
GUIDELINES FOR PARTICIPATION VIA REMOTE COMMUNICATION AND VOTING IN ABSENTIA
May 5, 2022 at 4:00 P.M.
The 2022 Annual Stockholders’ Meeting (ASM) of the China Banking Corporation (China Bank)is scheduled on May 5, 2022 at 4:00 P.M. (Manila Time) and the Board of Directors has set the close of business on March 18, 2022 as the record date for the determination of stockholders entitled to the notice of, to attend, and to vote during the 2022 ASM and any adjournment thereof.
As part of China Bank’s initiative to continuously promote shareholder rights, and in the interest and consideration of the participants’ health and safety during the current pandemic brought about by the coronavirus disease (COVID-19), the Board of Directors of China Bank has approved and authorized the stockholders to participate in the 2022 ASM via remote communication and to exercise their right to vote in absentia from the safety and comfort of their homes.
ONLINE REGISTRATION
Stockholders who wish to attend and participate in the 2022 ASM must go through the entire registration process in order for them to gain access to China Bank’s secure Online Voting Portal. Online registration shall be opened until April 29, 2022.
Stockholders can access the Online Registration Portal, Voting Portal, Livestream Broadcast, as well as additional information about the event through China Bank’s official 2022 ASM websiteat www.chinabank.ph/asm2022.
To begin the online registration process, the stockholders must visit the 2022 ASM website and navigate through the Registration page by clicking on the REGISTER button. The stockholders will then be prompted to provide an active email address. Once provided, the system will send an automated verification email containing a link which the stockholder must click in order to verify that his/her email is active.
To complete the registration process, the stockholders/representatives must upload/provide the following information/documents when prompted by the system:
1. Full Name (last name, given name, middle name)2. Valid and active email address3. Alternate email address (optional)4. Tax Identification Number (optional)5. Mobile Number6. Landline/Mobile Number (optional)7. Government issued ID with photo and signature (scanned front and bank)
In addition, the following documents must be submitted based on the capacity in which the registrants are attending and participating in the 2022 ASM:
Individual Certificated Stockholders1. Stock Certificate Number
If appointing a proxy: a. Copy of the duly signed proxy form of the stockholderb. Email address and contact number of the proxy
Representative of a Joint Account1. Stock Certificate Number of the Representative2. Authorization Letter
The authorization letter will serve as proof of authority of the stockholder voting the shares for and on behalf of the other registered stockholders. The authorization letter must reflect the stock certificate number of each of the representative’s fellow joint account holders. A template format can be downloaded from the ASM website.
Representative of Corporate Stockholders1. Secretary’s Certificate
273
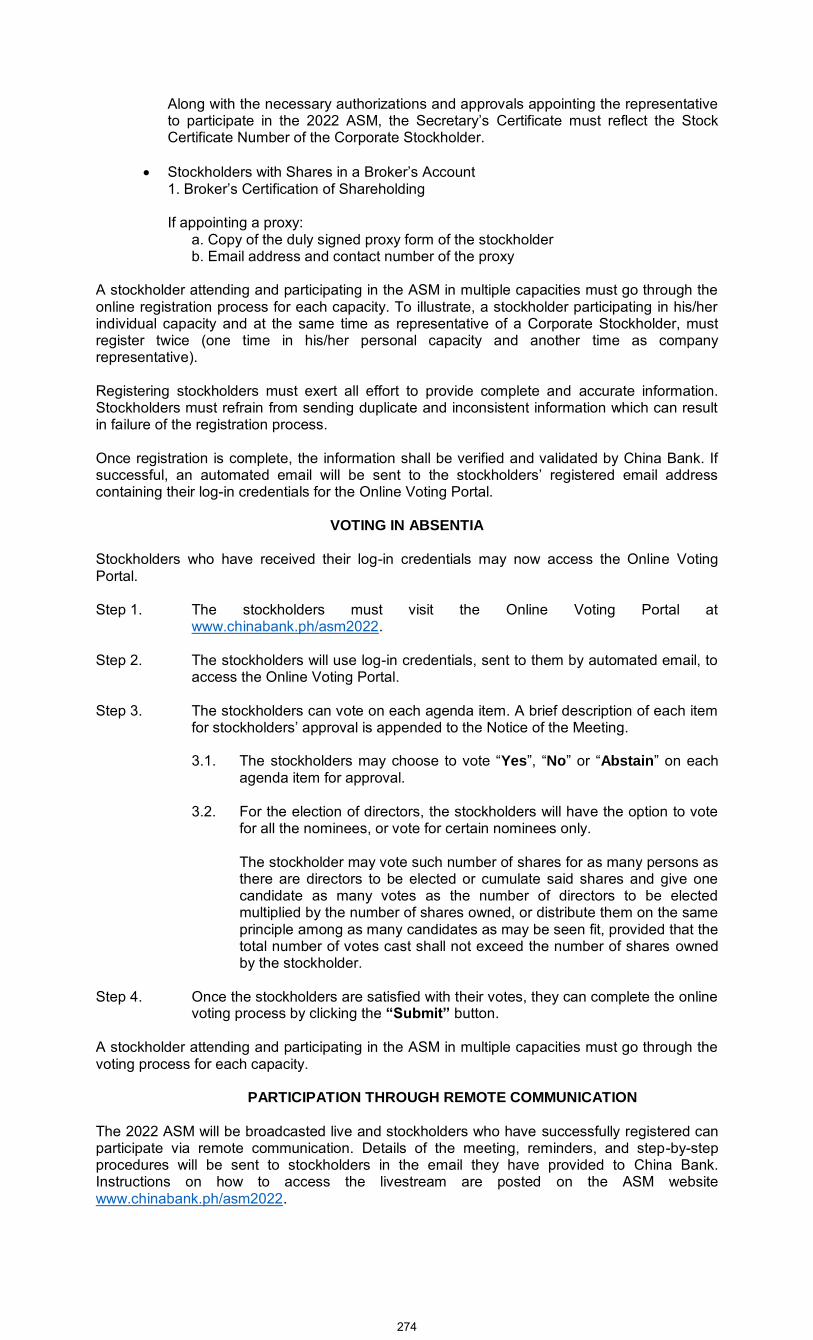
Along with the necessary authorizations and approvals appointing the representative to participate in the 2022 ASM, the Secretary’s Certificate must reflect the Stock Certificate Number of the Corporate Stockholder.
Stockholders with Shares in a Broker’s Account1. Broker’s Certification of Shareholding
If appointing a proxy: a. Copy of the duly signed proxy form of the stockholderb. Email address and contact number of the proxy
A stockholder attending and participating in the ASM in multiple capacities must go through the online registration process for each capacity. To illustrate, a stockholder participating in his/her individual capacity and at the same time as representative of a Corporate Stockholder, must register twice (one time in his/her personal capacity and another time as company representative).
Registering stockholders must exert all effort to provide complete and accurate information. Stockholders must refrain from sending duplicate and inconsistent information which can result in failure of the registration process.
Once registration is complete, the information shall be verified and validated by China Bank. If successful, an automated email will be sent to the stockholders’ registered email addresscontaining their log-in credentials for the Online Voting Portal.
VOTING IN ABSENTIA
Stockholders who have received their log-in credentials may now access the Online Voting Portal.
Step 1. The stockholders must visit the Online Voting Portal at www.chinabank.ph/asm2022.
Step 2. The stockholders will use log-in credentials, sent to them by automated email, to access the Online Voting Portal.
Step 3. The stockholders can vote on each agenda item. A brief description of each item for stockholders’ approval is appended to the Notice of the Meeting.
3.1. The stockholders may choose to vote “Yes”, “No” or “Abstain” on each agenda item for approval.
3.2. For the election of directors, the stockholders will have the option to vote for all the nominees, or vote for certain nominees only.
The stockholder may vote such number of shares for as many persons as there are directors to be elected or cumulate said shares and give one candidate as many votes as the number of directors to be elected multiplied by the number of shares owned, or distribute them on the same principle among as many candidates as may be seen fit, provided that the total number of votes cast shall not exceed the number of shares owned by the stockholder.
Step 4. Once the stockholders are satisfied with their votes, they can complete the online voting process by clicking the “Submit” button.
A stockholder attending and participating in the ASM in multiple capacities must go through the voting process for each capacity.
PARTICIPATION THROUGH REMOTE COMMUNICATION
The 2022 ASM will be broadcasted live and stockholders who have successfully registered can participate via remote communication. Details of the meeting, reminders, and step-by-step procedures will be sent to stockholders in the email they have provided to China Bank. Instructions on how to access the livestream are posted on the ASM website www.chinabank.ph/asm2022.
274

Audio and video recordings of the ASM will be adequately maintained by China Bank and will be made available in the website.
QUESTIONS AND ANSWERS
Stockholders may submit questions and comments, preferably on or before 5:00 P.M. on May 4, 2022, which will be read ad answered during the livestream broadcast. Any questions or comments submitted and received but not addressed during the livestream shall be answered directly by email to the stockholder concerned. Additional questions or comments may be sent to [email protected].
For any concerns, please contact China Bank’s Office of the Corporate Secretary at (+632) 8885-5135 or [email protected], or Investor and Corporate Relations Group at (+632) 8885-5609 or [email protected].
For complete information on China Bank’s 2022 ASM, please visit www.chinabank.ph/asm2022.
275
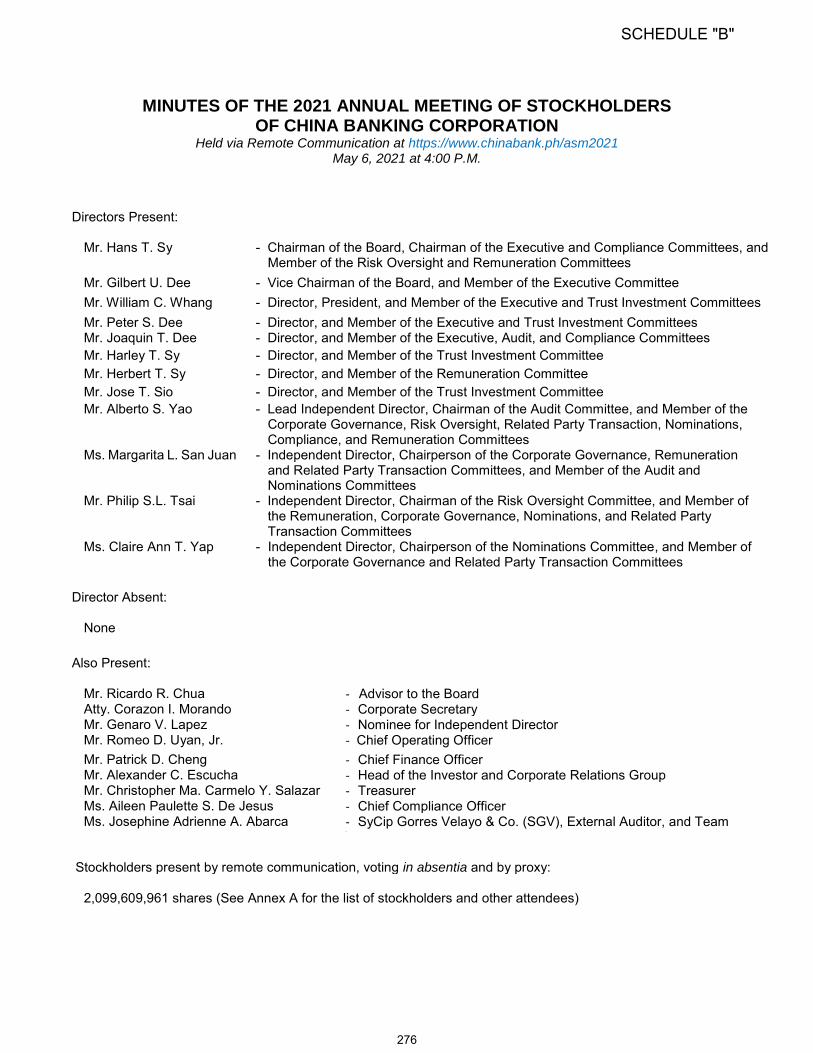
MINUTES OF THE 2021 ANNUAL MEETING OF STOCKHOLDERS OF CHINA BANKING CORPORATION
Held via Remote Communication at https://www.chinabank.ph/asm2021 May 6, 2021 at 4:00 P.M.
Directors Present:
Mr. Hans T. Sy - Chairman of the Board, Chairman of the Executive and Compliance Committees, and Member of the Risk Oversight and Remuneration Committees
Mr. Gilbert U. Dee - Vice Chairman of the Board, and Member of the Executive CommitteeMr. William C. Whang - Director, President, and Member of the Executive and Trust Investment CommitteesMr. Peter S. Dee - Director, and Member of the Executive and Trust Investment CommitteesMr. Joaquin T. Dee - Director, and Member of the Executive, Audit, and Compliance CommitteesMr. Harley T. Sy - Director, and Member of the Trust Investment CommitteeMr. Herbert T. Sy - Director, and Member of the Remuneration CommitteeMr. Jose T. Sio - Director, and Member of the Trust Investment CommitteeMr. Alberto S. Yao - Lead Independent Director, Chairman of the Audit Committee, and Member of the
Corporate Governance, Risk Oversight, Related Party Transaction, Nominations,Compliance, and Remuneration Committees
Ms. Margarita L. San Juan - Independent Director, Chairperson of the Corporate Governance, Remunerationand Related Party Transaction Committees, and Member of the Audit and Nominations Committees
Mr. Philip S.L. Tsai - Independent Director, Chairman of the Risk Oversight Committee, and Member ofthe Remuneration, Corporate Governance, Nominations, and Related PartyTransaction Committees
Ms. Claire Ann T. Yap - Independent Director, Chairperson of the Nominations Committee, and Member ofthe Corporate Governance and Related Party Transaction Committees
Director Absent:
None
Also Present:
Mr. Ricardo R. Chua - Advisor to the BoardAtty. Corazon I. Morando - Corporate SecretaryMr. Genaro V. Lapez - Nominee for Independent DirectorMr. Romeo D. Uyan, Jr. - Chief Operating OfficerMr. Patrick D. Cheng - Chief Finance OfficerMr. Alexander C. Escucha - Head of the Investor and Corporate Relations GroupMr. Christopher Ma. Carmelo Y. Salazar - TreasurerMs. Aileen Paulette S. De Jesus - Chief Compliance OfficerMs. Josephine Adrienne A. Abarca - SyCip Gorres Velayo & Co. (SGV), External Auditor, and Team
-
Stockholders present by remote communication, voting in absentia and by proxy:
2,099,609,961 shares (See Annex A for the list of stockholders and other attendees)
SCHEDULE "B"
276

- 2 -
I. CALL TO ORDER
After the video presentations of the Centennial Year ad campaign “Times Change, but Values Remain”, a Salute to Frontliners, and China Bank jingle were shown, and the Philippine National Anthem was played, Investor and Corporate Relations Group (ICRG) Head Alexander C. Escucha introduced the current members of the Board of Directors and Advisor to the BoardRicardo R. Chua. Then, he gave the floor to the Chairman.
Mr. Hans T. Sy, Chairman of the Board, welcomed the stockholders and guests to the Bank’s 2021 annual stockholders’ meeting, which was an online-only event because of the current circumstances, similar to last year’s annual and special meetings. He called the meeting to order and presided over the same. Atty. Corazon I. Morando, Corporate Secretary, took the minutes of the proceedings.
The list of the stockholders present by remote communication, voting in absentia and by proxy, with their respective number of shares is hereto attached as Annex “A”.
II. PROOF OF NOTICE OF MEETING
Chairman Hans Sy inquired from the Corporate Secretary about the sending of the requirednotice of meeting to the stockholders.
Atty. Morando reported that the stockholders were notified about the meeting in accordance with the Securities and Exchange Commission’s (SEC) Memorandum Circular No. 6, Series of 2020, Section 49 of the Revised Corporation Code, and the SEC Notice dated March 16, 2021 on the alternative modes of distributing documents in relation with the holding of annual stockholders’ meeting for 2021.
Further, the Notice of Meeting was published in The Philippine Star and Philippine Daily Inquirer, in print and online formats, on March 30 and 31, 2021. Finally, electronic copies of the Notice of Meeting with Explanation of Agenda Items and the Information Statement (SEC Form 20-IS) and Management Report, were made available in the Bank website and the PhilippineStock Exchange’s (PSE) EDGE Submission System.
The Corporate Secretary certified that the required notice of meeting via remote communication was sent in compliance with the Bank’s By-Laws and the law and rules and regulations of the Bangko Sentral ng Pilipinas (BSP), SEC and PSE.
III. CERTIFICATION OF QUORUM
The Chairman asked the Corporate Secretary about the presence of quorum.
The Corporate Secretary announced that out of 2,685,899,812 total subscribed andoutstanding shares of the Bank, the holders of 2,099,609,961 shares representing 78.172% or more than two-thirds (2/3) of the outstanding capital stock of the Bank are present through remote communication, by proxy, or in absentia. The Corporate Secretary certified and declared the existence of a quorum competent to transact business.
The Guidelines for participation via remote communication and voting in absentia was included as Schedule “B” of the Bank’s Information Statement.
277
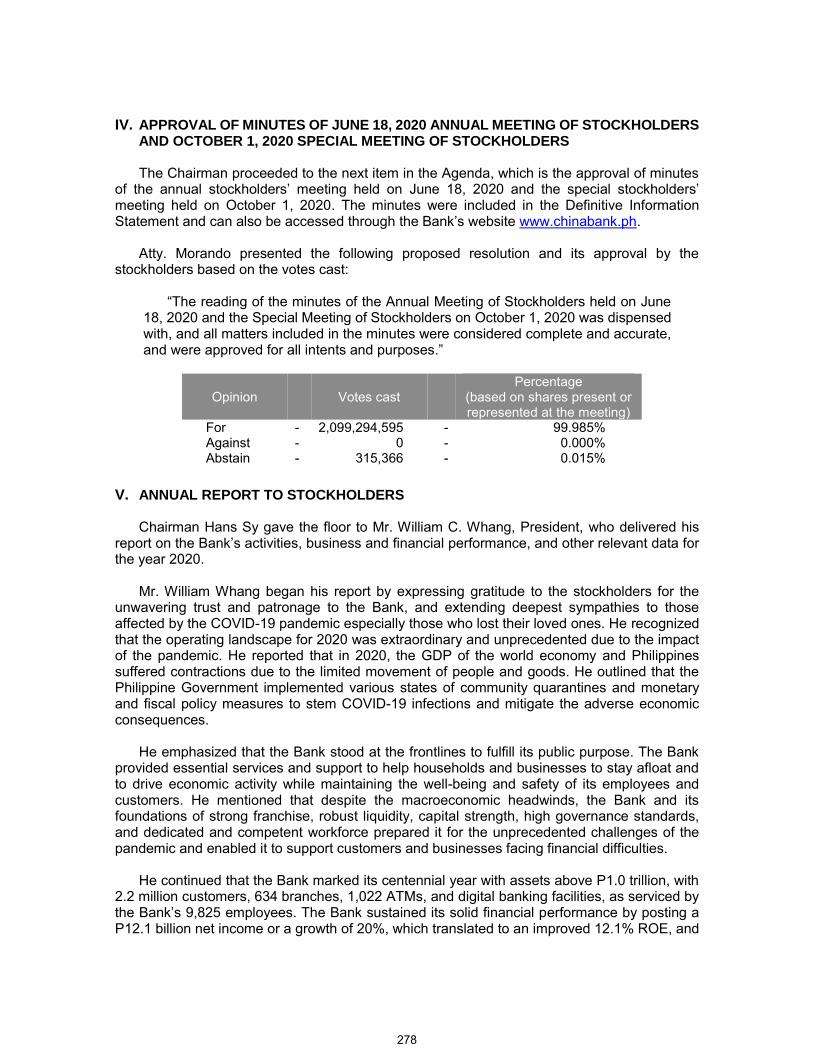
- 3 -
IV. APPROVAL OF MINUTES OF JUNE 18, 2020 ANNUAL MEETING OF STOCKHOLDERSAND OCTOBER 1, 2020 SPECIAL MEETING OF STOCKHOLDERS
The Chairman proceeded to the next item in the Agenda, which is the approval of minutesof the annual stockholders’ meeting held on June 18, 2020 and the special stockholders’meeting held on October 1, 2020. The minutes were included in the Definitive Information Statement and can also be accessed through the Bank’s website www.chinabank.ph.
Atty. Morando presented the following proposed resolution and its approval by the stockholders based on the votes cast:
“The reading of the minutes of the Annual Meeting of Stockholders held on June 18, 2020 and the Special Meeting of Stockholders on October 1, 2020 was dispensed with, and all matters included in the minutes were considered complete and accurate, and were approved for all intents and purposes.”
Opinion Votes cast Percentage
(based on shares present or represented at the meeting)
For - 2,099,294,595 - 99.985%Against - 0 - 0.000% Abstain - 315,366 - 0.015%
V. ANNUAL REPORT TO STOCKHOLDERS
Chairman Hans Sy gave the floor to Mr. William C. Whang, President, who delivered hisreport on the Bank’s activities, business and financial performance, and other relevant data for the year 2020.
Mr. William Whang began his report by expressing gratitude to the stockholders for the unwavering trust and patronage to the Bank, and extending deepest sympathies to those affected by the COVID-19 pandemic especially those who lost their loved ones. He recognized that the operating landscape for 2020 was extraordinary and unprecedented due to the impact of the pandemic. He reported that in 2020, the GDP of the world economy and Philippines suffered contractions due to the limited movement of people and goods. He outlined that the Philippine Government implemented various states of community quarantines and monetary and fiscal policy measures to stem COVID-19 infections and mitigate the adverse economic consequences.
He emphasized that the Bank stood at the frontlines to fulfill its public purpose. The Bank provided essential services and support to help households and businesses to stay afloat and to drive economic activity while maintaining the well-being and safety of its employees and customers. He mentioned that despite the macroeconomic headwinds, the Bank and its foundations of strong franchise, robust liquidity, capital strength, high governance standards, and dedicated and competent workforce prepared it for the unprecedented challenges of the pandemic and enabled it to support customers and businesses facing financial difficulties.
He continued that the Bank marked its centennial year with assets above P1.0 trillion, with 2.2 million customers, 634 branches, 1,022 ATMs, and digital banking facilities, as serviced by the Bank’s 9,825 employees. The Bank sustained its solid financial performance by posting a P12.1 billion net income or a growth of 20%, which translated to an improved 12.1% ROE, and
278

- 4 -
1.2% ROA. Net interest income surged by 30% to P33.8 billion due to a 39% drop in interest expense. Fee-based income grew by 19% to P10.0 billion driven by higher trading gains. Operating expenses were controlled at P21.5 billion, up 6%, even as the Bank provided for substantial COVID-19-related expenses. This led to a substantial improvement in cost-to-income ratio of 49% from 59%.
Deposits increased by 8% to P835 billion, driven by a 14% increase in CASA. Aside from sustained CASA growth, the Bank continued to diversify funding base through successful bond offerings of P15 billion in October 2020 and P20 billion in February 2021. Even as economic activities drastically went down due to the lockdowns, the Bank supported its customers through gross loans totaling P572 billion. In addition to loans, the Bank also assisted its corporate borrowers to raise funds via the bond markets in which the Bank subsidiary, China Bank Capital Corporation (China Bank Capital), played a leading role. In 2020, China Bank Capital maintained its position as the country’s No. 1 debt capital markets bookrunner with 29.19% market share.
The Bank’s additional provisioning improved NPL cover to 128%, with a 2.3% NPL ratio, better than industry average. The increase in the Bank’s bottom line led to a 9% improvementin capitalization to P105 billion, with 13.82% CET 1/Tier 1 ratio, and a total CAR of 14.73%.
Amid tumultuous changes, Mr. Whang stated that the Bank continues to serve and support its stakeholders with excellence, efficiency, and compassion. He detailed that the Bank had provided payment extensions to 173,415 customers under Bayanihan Act 1, and 125,751 customers under Bayanihan Act 2. It also ensured 99.9% system availability of its digital banking facilities. The Bank had also developed new mobile app features, waived fund transfer fees until June 30, 2021, and strengthened overall cybersecurity. Mr. Whang then discussed the constant and proactive communication of the Bank with its customers to reassure them that China Bank cares.
Mr. Whang continued with the measures adopted by the Bank to ensure the welfare of its employees. The Bank implemented work-from-home (WFH) arrangements, provided logistical support, and signed the 2020-2022 Collective Bargaining Agreement (CBA) with the employees union. The Bank had also implemented case management protocols, HMO coverage for COVID-related treatment, established a dedicated COVID testing facility, and initiated the China Bank Group Vaccination Program.
Mr. Whang narrated that the Bank had to forego some of the slated several events, activities and projects for its Centennial Year, with the theme Celebrating the Past, Embracing the Future. For its employees, the Bank is building a culture of ownership under the Centennial Stock Grant Plan – the brainchild of Chairman Hans Sy, wherein its employees are entitled to 100 shares for every year of service. For its customers, the Bank launched a year-long deposit promo and produced commemorative items. For today’s generation and the next, the Bank worked on the restoration of the Bank’s original head office in Binondo, Manila.
Mr. Whang next discussed the awards received by the Bank. The Bank received a Gold Anvil for its 100-year anniversary program from the Public Relations Society of the Philippines for the success of its centennial events, despite the scaled-back celebration due to the pandemic. For its corporate governance practices, the Bank sustained its track record as a practitioner of the highest governance standard in the last 10 years. At the virtual awarding in 2021 for the ASEAN Corporate Governance Scorecard (ACGS) 2019 assessment year, the Bank was recognized by the ASEAN Capital Markets Forum as one of the best publicly-listed companies in the country and in the region in corporate governance. Mr. Whang also mentioned that the Bank is among the top three publicly-listed companies in the Philippines, and among
279

- 5 -
the top 20 in ASEAN, and was recognized as an ASEAN Asset Class awardee. Based on the ACGS, the Institute of Corporate Directors conferred the Bank with a 4 Golden Arrow Award.
Mr. Whang then summarized the Bank’s plan of action in a post-pandemic era, where it would continuously improve and innovate, embrace broader sustainability goals, support the Government’s financial inclusion initiatives, and accelerate its digital transformation.
President Whang also mentioned that the Bank was deeply saddened by the passing of Independent Director Angeline H. Hwang. This year, the Bank expresses deep appreciation to its outgoing Lead Independent Director Alberto Yao for his unparalleled years of service and contributions to the Bank. He expressed gratitude to Mr. Yao for the latter’s 17 years of service,wise counsel, experience and expertise. Mr. Yao also served as director for China Bank Savings, China Bank Capital, and China Bank Securities. Mr. Whang concluded by wishing Mr. Yao all the best for his future endeavors.
As regards the Bank’s Q1 2021 financial performance, its net income surged 61% to P3.6 billion. Mr. Whang also mentioned that the balance sheet of the Bank remains to be healthy, with a robust financial performances which will serve as a buffer to absorb any future financial shocks. Mr. Whang concluded his report by thanking all of the Bank’s stakeholders, employees, partners, shareholders and customers for their continued trust and support.
After the presentation, the Chairman thanked the President and asked the Corporate Secretary for the proposed resolution and voting results.
Atty. Morando presented the following proposed resolution and its approval by the stockholders based on the votes cast:
“The Annual Report, as presented by Bank President William C. Whang, was approved.”
Opinion Votes cast Percentage
(based on shares present or represented at the meeting)
For - 2,098,326,221 - 99.939%Against - 0 - 0.000% Abstain - 1,283,740 - 0.061%
VI. AUDITED FINANCIAL STATEMENTS FOR THE YEAR ENDED DECEMBER 31, 2020
For this item in the agenda, Chairman Hans Sy stated that the President, in his annual reportearlier, presented the financial performance and changes in the financial position of the Bank for the year 2020. He then asked the Corporate Secretary for the proposed resolution and voting results.
Atty. Morando presented the following proposed resolution and its approval by the stockholders based on the votes cast:
“The audited financial statements for the year ended December 31, 2020, attached as Annex E of the Definitive Information Statement, posted in the Bank’s website and PSE’s EDGE Submission System, and covered in part by the presentation of the Bank President William C. Whang, was approved.”
280

- 6 -
Opinion Votes cast Percentage
(based on shares present or represented at the meeting)
For - 2,098,326,221 - 99.939% Against - 0 - 0.000% Abstain - 1,283,740 - 0.061%
VII. RATIFICATION OF ALL ACTS OF THE BOARD OF DIRECTORS, EXECUTIVECOMMITTEE, OTHER COMMITTEES, AND MANAGEMENT
After being asked by the Chairman, Atty. Morando presented the following proposedresolution and its approval by the stockholders based on the votes cast:
“All the acts of the Board of Directors, which include the establishment of a USD 2 Billion Euro Medium Term Note Programme, and the related party transactions discussed in the Definitive Information Statement and Audited Financial Statements; and all the acts of the Executive Committee and of the various committees of the Bank and Management, during the fiscal year 2020 and immediately preceding this stockholders’ meeting, were approved, confirmed and ratified for all intents and purposes:
Related Party Total Amount /1 Total Outstanding Balance /2 CBC Group ₱ 16.8 B
$ 354,832 ₱ 55.6 M
SM Group ₱ 141.3 B $ 212.6 M
₱ 3.7 B $ 130 M
Other Related Parties ₱ 50.3 B $ 2.2 M
₱ 15.6 B
1/ Covers all transactions 2/ For loan transactions approved in 2020”
Opinion Votes cast Percentage
(based on shares present or represented at the meeting)
For - 2,098,326,621 - 99.939% Against - 0 - 0.000% Abstain - 1,283,340 - 0.061%
VIII. ELECTION OF THE BOARD OF DIRECTORS
On the next item in the agenda, which is the election of the members of the Board ofDirectors for the ensuing year, the Chairman called on Independent Director and Chairperson of the Corporate Governance Committee, Ms. Margarita L. San Juan, to announce the nominees for election.
According to Ms. San Juan, based on the determination by the Nominations and Corporate Governance Committees, and as confirmed by the Board of Directors, the following nominees for directors and independent directors were found to possess all the qualifications and none of the disqualifications of a director or independent director, and their capabilities are aligned with the Bank’s strategic directions: (a) nominees for director – Mr. Hans T. Sy, Mr. Gilbert U. Dee,
281
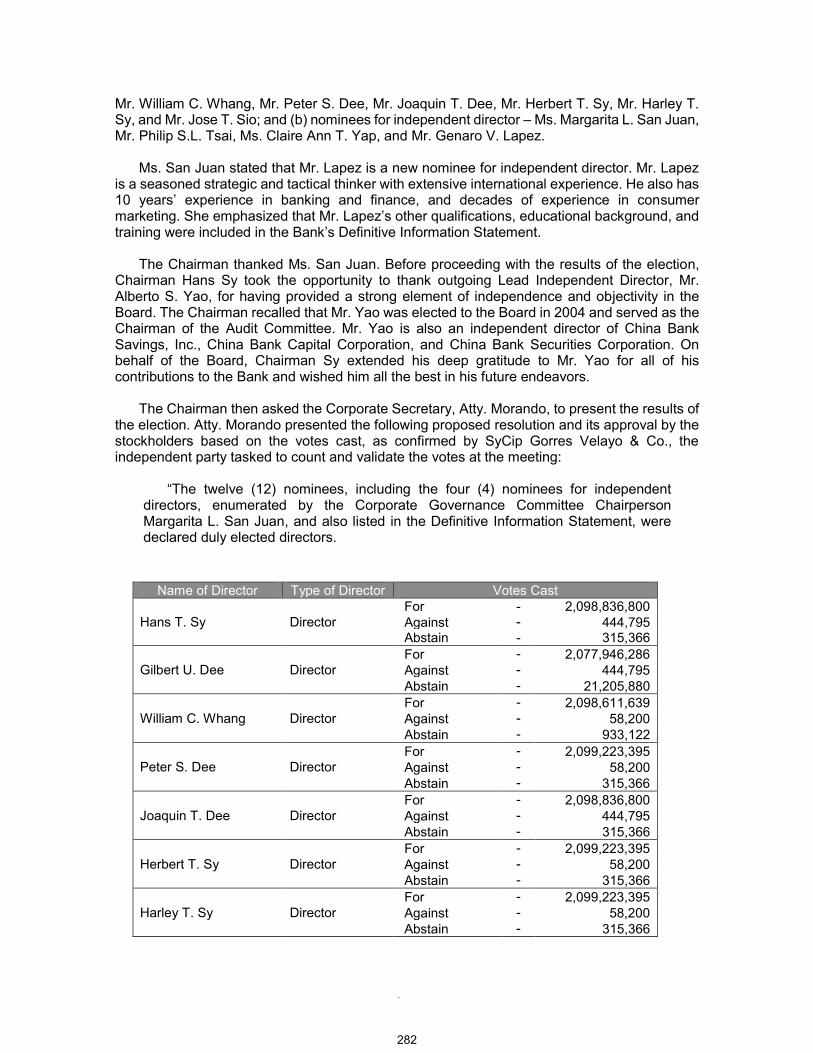
- 7 -
Mr. William C. Whang, Mr. Peter S. Dee, Mr. Joaquin T. Dee, Mr. Herbert T. Sy, Mr. Harley T. Sy, and Mr. Jose T. Sio; and (b) nominees for independent director – Ms. Margarita L. San Juan, Mr. Philip S.L. Tsai, Ms. Claire Ann T. Yap, and Mr. Genaro V. Lapez.
Ms. San Juan stated that Mr. Lapez is a new nominee for independent director. Mr. Lapez is a seasoned strategic and tactical thinker with extensive international experience. He also has 10 years’ experience in banking and finance, and decades of experience in consumer marketing. She emphasized that Mr. Lapez’s other qualifications, educational background, and training were included in the Bank’s Definitive Information Statement.
The Chairman thanked Ms. San Juan. Before proceeding with the results of the election, Chairman Hans Sy took the opportunity to thank outgoing Lead Independent Director, Mr. Alberto S. Yao, for having provided a strong element of independence and objectivity in the Board. The Chairman recalled that Mr. Yao was elected to the Board in 2004 and served as the Chairman of the Audit Committee. Mr. Yao is also an independent director of China Bank Savings, Inc., China Bank Capital Corporation, and China Bank Securities Corporation. On behalf of the Board, Chairman Sy extended his deep gratitude to Mr. Yao for all of his contributions to the Bank and wished him all the best in his future endeavors.
The Chairman then asked the Corporate Secretary, Atty. Morando, to present the results of the election. Atty. Morando presented the following proposed resolution and its approval by the stockholders based on the votes cast, as confirmed by SyCip Gorres Velayo & Co., the independent party tasked to count and validate the votes at the meeting:
“The twelve (12) nominees, including the four (4) nominees for independent directors, enumerated by the Corporate Governance Committee Chairperson Margarita L. San Juan, and also listed in the Definitive Information Statement, were declared duly elected directors.
Name of Director Type of Director Votes Cast
Hans T. Sy Director For - 2,098,836,800 Against - 444,795 Abstain - 315,366
Gilbert U. Dee Director For - 2,077,946,286 Against - 444,795 Abstain - 21,205,880
William C. Whang Director For - 2,098,611,639 Against - 58,200 Abstain - 933,122
Peter S. Dee Director For - 2,099,223,395 Against - 58,200 Abstain - 315,366
Joaquin T. Dee Director For - 2,098,836,800 Against - 444,795 Abstain - 315,366
Herbert T. Sy Director For - 2,099,223,395 Against - 58,200 Abstain - 315,366
Harley T. Sy Director For - 2,099,223,395 Against - 58,200 Abstain - 315,366
282
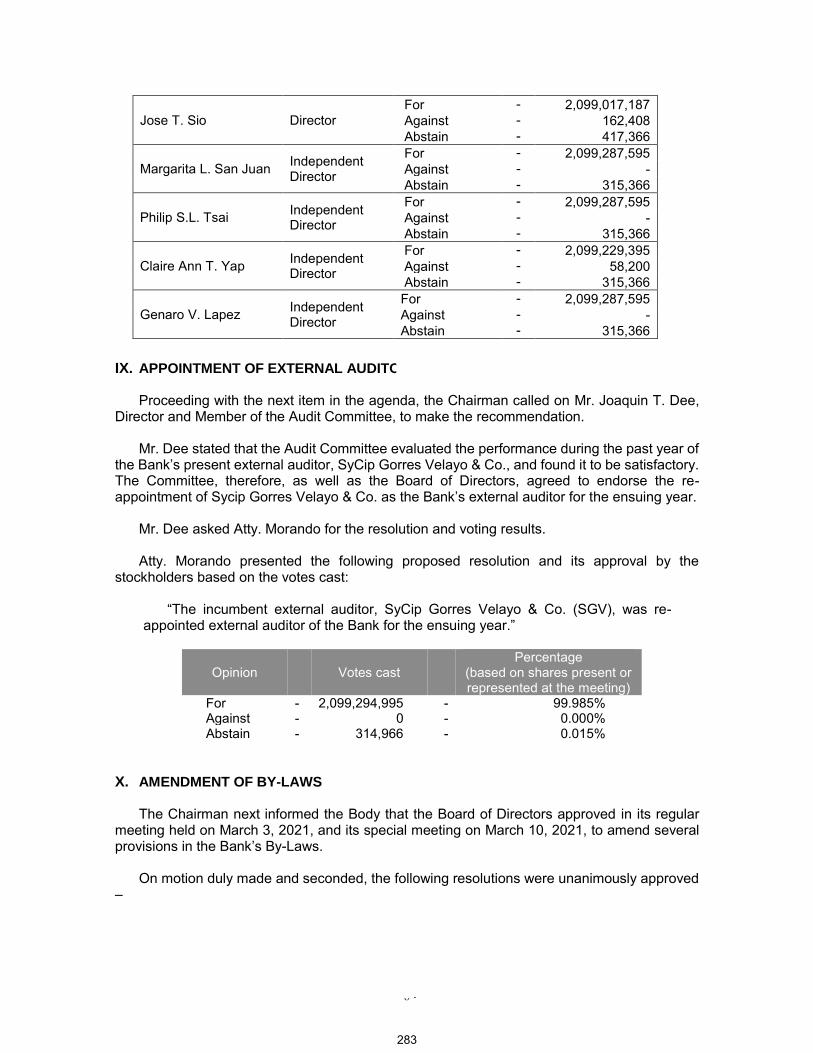
- 8 -
Jose T. Sio Director For - 2,099,017,187 Against - 162,408 Abstain - 417,366
Margarita L. San Juan Independent Director
For - 2,099,287,595 Against - - Abstain - 315,366
Philip S.L. Tsai Independent Director
For - 2,099,287,595 Against - - Abstain - 315,366
Claire Ann T. Yap Independent Director
For - 2,099,229,395 Against - 58,200 Abstain - 315,366
Genaro V. Lapez Independent Director
For - 2,099,287,595Against - -Abstain - 315,366
IX. APPOINTMENT OF EXTERNAL AUDITOR
Proceeding with the next item in the agenda, the Chairman called on Mr. Joaquin T. Dee,Director and Member of the Audit Committee, to make the recommendation.
Mr. Dee stated that the Audit Committee evaluated the performance during the past year of the Bank’s present external auditor, SyCip Gorres Velayo & Co., and found it to be satisfactory.The Committee, therefore, as well as the Board of Directors, agreed to endorse the re-appointment of Sycip Gorres Velayo & Co. as the Bank’s external auditor for the ensuing year.
Mr. Dee asked Atty. Morando for the resolution and voting results.
Atty. Morando presented the following proposed resolution and its approval by the stockholders based on the votes cast:
“The incumbent external auditor, SyCip Gorres Velayo & Co. (SGV), was re-appointed external auditor of the Bank for the ensuing year.”
Opinion Votes cast Percentage
(based on shares present or represented at the meeting)
For - 2,099,294,995 - 99.985%Against - 0 - 0.000% Abstain - 314,966 - 0.015%
X. AMENDMENT OF BY-LAWS
The Chairman next informed the Body that the Board of Directors approved in its regularmeeting held on March 3, 2021, and its special meeting on March 10, 2021, to amend several provisions in the Bank’s By-Laws.
On motion duly made and seconded, the following resolutions were unanimously approved –
283
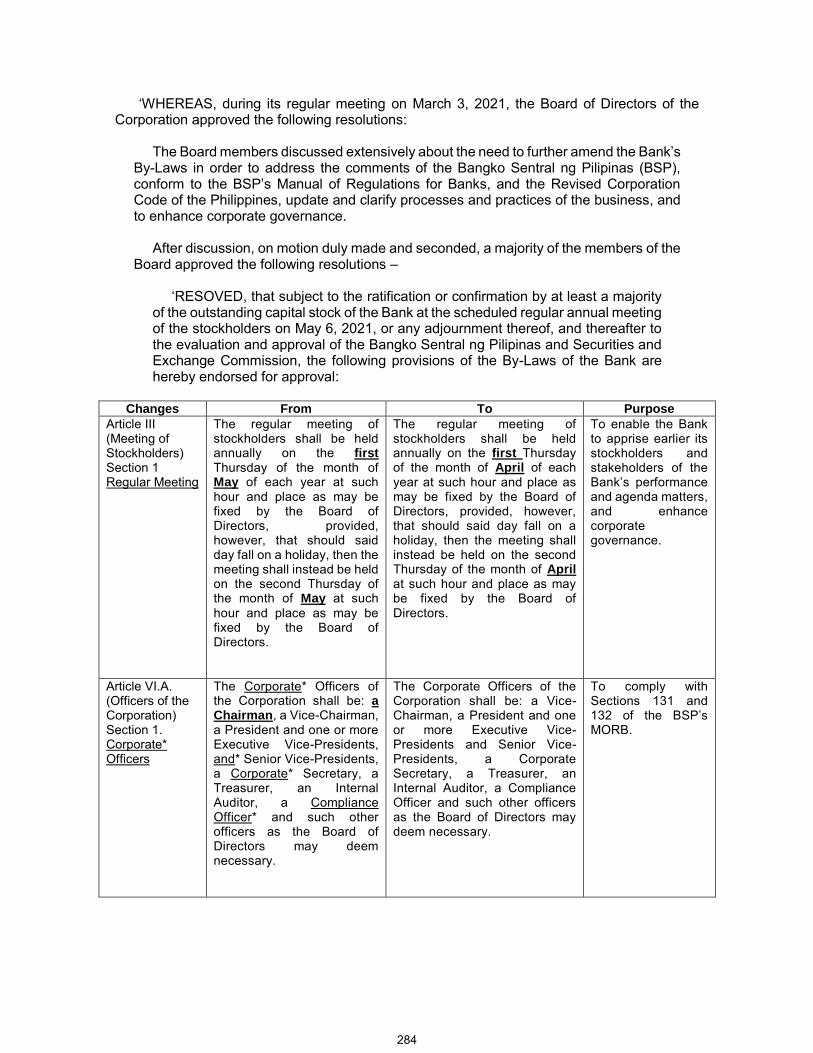
- 9 -
‘WHEREAS, during its regular meeting on March 3, 2021, the Board of Directors of the Corporation approved the following resolutions:
The Board members discussed extensively about the need to further amend the Bank’sBy-Laws in order to address the comments of the Bangko Sentral ng Pilipinas (BSP), conform to the BSP’s Manual of Regulations for Banks, and the Revised Corporation Code of the Philippines, update and clarify processes and practices of the business, and to enhance corporate governance.
After discussion, on motion duly made and seconded, a majority of the members of the Board approved the following resolutions –
‘RESOVED, that subject to the ratification or confirmation by at least a majority of the outstanding capital stock of the Bank at the scheduled regular annual meeting of the stockholders on May 6, 2021, or any adjournment thereof, and thereafter to the evaluation and approval of the Bangko Sentral ng Pilipinas and Securities and Exchange Commission, the following provisions of the By-Laws of the Bank are hereby endorsed for approval:
Changes From To Purpose
Article III (Meeting of Stockholders) Section 1 Regular Meeting
The regular meeting of stockholders shall be held annually on the firstThursday of the month of May of each year at such hour and place as may be fixed by the Board of Directors, provided, however, that should said day fall on a holiday, then the meeting shall instead be held on the second Thursday of the month of May at such hour and place as may be fixed by the Board of Directors.
The regular meeting of stockholders shall be held annually on the first Thursday of the month of April of each year at such hour and place as may be fixed by the Board of Directors, provided, however, that should said day fall on a holiday, then the meeting shall instead be held on the second Thursday of the month of Aprilat such hour and place as may be fixed by the Board of Directors.
To enable the Bank to apprise earlier its stockholders and stakeholders of the Bank’s performance and agenda matters, and enhance corporate governance.
Article VI.A. (Officers of the Corporation) Section 1. Corporate* Officers
The Corporate* Officers of the Corporation shall be: aChairman, a Vice-Chairman, a President and one or more Executive Vice-Presidents, and* Senior Vice-Presidents, a Corporate* Secretary, a Treasurer, an Internal Auditor, a Compliance Officer* and such other officers as the Board of Directors may deem necessary.
The Corporate Officers of the Corporation shall be: a Vice-Chairman, a President and one or more Executive Vice-Presidents and Senior Vice-Presidents, a Corporate Secretary, a Treasurer, an Internal Auditor, a Compliance Officer and such other officers as the Board of Directors may deem necessary.
To comply with Sections 131 and 132 of the BSP’s MORB.
284
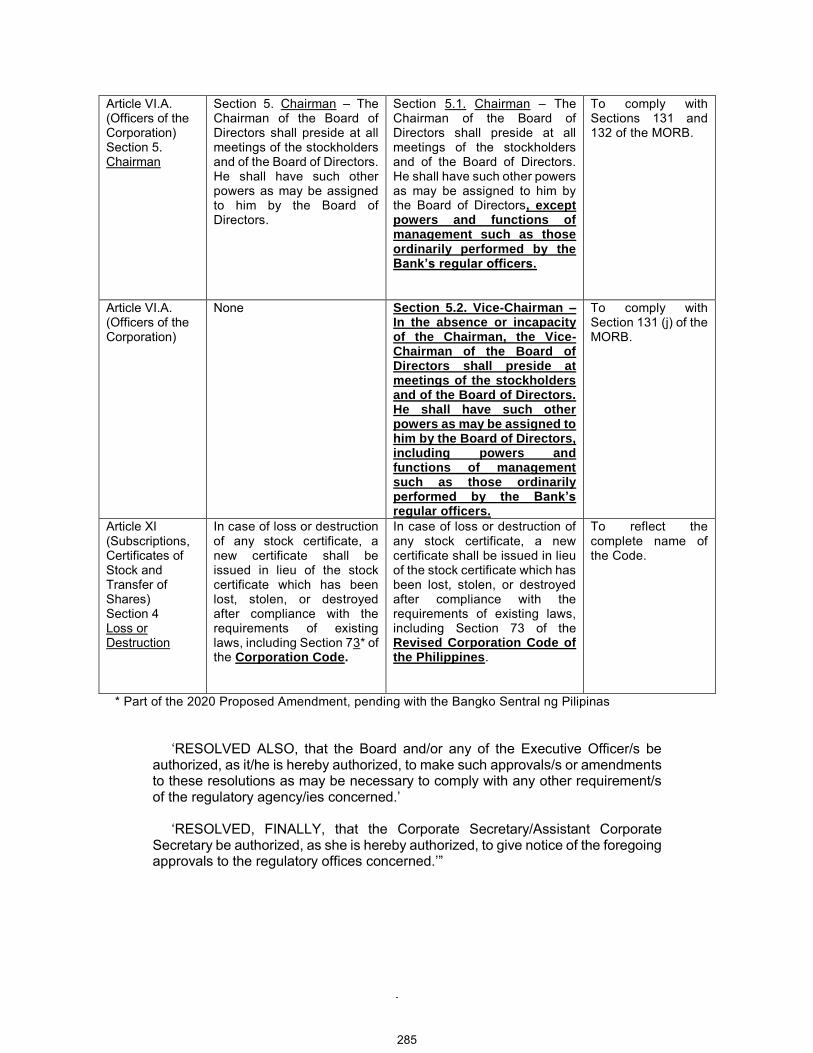
- 10 -
Article VI.A. (Officers of the Corporation) Section 5. Chairman
Section 5. Chairman – The Chairman of the Board of Directors shall preside at all meetings of the stockholders and of the Board of Directors. He shall have such other powers as may be assigned to him by the Board of Directors.
Section 5.1. Chairman – The Chairman of the Board of Directors shall preside at all meetings of the stockholders and of the Board of Directors. He shall have such other powers as may be assigned to him by the Board of Directors, exceptpowers and functions of management such as those ordinarily performed by the Bank’s regular officers.
To comply with Sections 131 and 132 of the MORB.
Article VI.A. (Officers of the Corporation)
None Section 5.2. Vice-Chairman – In the absence or incapacity of the Chairman, the Vice-Chairman of the Board of Directors shall preside at meetings of the stockholders and of the Board of Directors. He shall have such other powers as may be assigned to him by the Board of Directors, including powers and functions of management such as those ordinarily performed by the Bank’s regular officers.
To comply with Section 131 (j) of the MORB.
Article XI (Subscriptions, Certificates of Stock and Transfer of Shares) Section 4 Loss or Destruction
In case of loss or destruction of any stock certificate, a new certificate shall be issued in lieu of the stock certificate which has been lost, stolen, or destroyed after compliance with the requirements of existing laws, including Section 73* of the Corporation Code.
In case of loss or destruction of any stock certificate, a new certificate shall be issued in lieu of the stock certificate which has been lost, stolen, or destroyed after compliance with the requirements of existing laws, including Section 73 of the Revised Corporation Code of the Philippines.
To reflect the complete name of the Code.
* Part of the 2020 Proposed Amendment, pending with the Bangko Sentral ng Pilipinas
‘RESOLVED ALSO, that the Board and/or any of the Executive Officer/s be authorized, as it/he is hereby authorized, to make such approvals/s or amendments to these resolutions as may be necessary to comply with any other requirement/s of the regulatory agency/ies concerned.’
‘RESOLVED, FINALLY, that the Corporate Secretary/Assistant Corporate Secretary be authorized, as she is hereby authorized, to give notice of the foregoing approvals to the regulatory offices concerned.’”
285
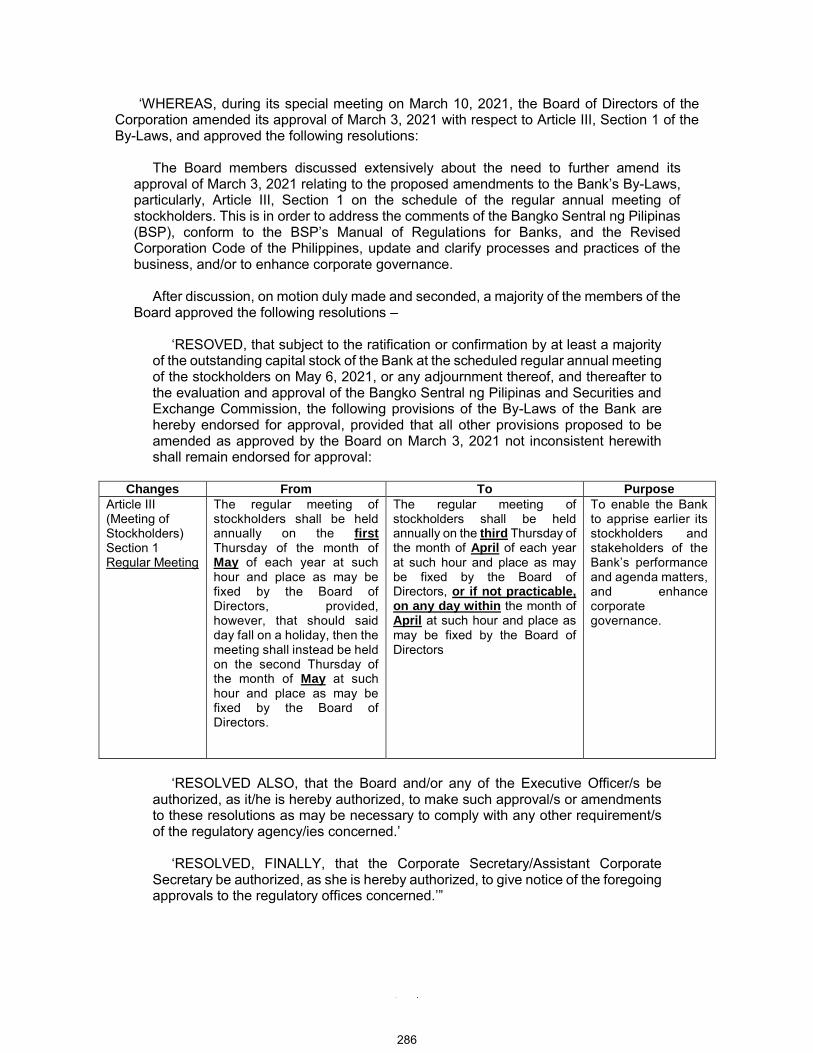
- 11 -
‘WHEREAS, during its special meeting on March 10, 2021, the Board of Directors of the Corporation amended its approval of March 3, 2021 with respect to Article III, Section 1 of the By-Laws, and approved the following resolutions:
The Board members discussed extensively about the need to further amend its approval of March 3, 2021 relating to the proposed amendments to the Bank’s By-Laws, particularly, Article III, Section 1 on the schedule of the regular annual meeting of stockholders. This is in order to address the comments of the Bangko Sentral ng Pilipinas (BSP), conform to the BSP’s Manual of Regulations for Banks, and the Revised Corporation Code of the Philippines, update and clarify processes and practices of the business, and/or to enhance corporate governance.
After discussion, on motion duly made and seconded, a majority of the members of the Board approved the following resolutions –
‘RESOVED, that subject to the ratification or confirmation by at least a majority of the outstanding capital stock of the Bank at the scheduled regular annual meeting of the stockholders on May 6, 2021, or any adjournment thereof, and thereafter to the evaluation and approval of the Bangko Sentral ng Pilipinas and Securities and Exchange Commission, the following provisions of the By-Laws of the Bank are hereby endorsed for approval, provided that all other provisions proposed to be amended as approved by the Board on March 3, 2021 not inconsistent herewith shall remain endorsed for approval:
Changes From To Purpose
Article III (Meeting of Stockholders) Section 1 Regular Meeting
The regular meeting of stockholders shall be held annually on the firstThursday of the month of May of each year at such hour and place as may be fixed by the Board of Directors, provided, however, that should said day fall on a holiday, then the meeting shall instead be held on the second Thursday of the month of May at such hour and place as may be fixed by the Board of Directors.
The regular meeting of stockholders shall be held annually on the third Thursday of the month of April of each year at such hour and place as may be fixed by the Board of Directors, or if not practicable,on any day within the month of April at such hour and place as may be fixed by the Board of Directors
To enable the Bank to apprise earlier its stockholders and stakeholders of the Bank’s performance and agenda matters, and enhance corporate governance.
‘RESOLVED ALSO, that the Board and/or any of the Executive Officer/s be authorized, as it/he is hereby authorized, to make such approval/s or amendments to these resolutions as may be necessary to comply with any other requirement/s of the regulatory agency/ies concerned.’
‘RESOLVED, FINALLY, that the Corporate Secretary/Assistant Corporate Secretary be authorized, as she is hereby authorized, to give notice of the foregoing approvals to the regulatory offices concerned.’”
286
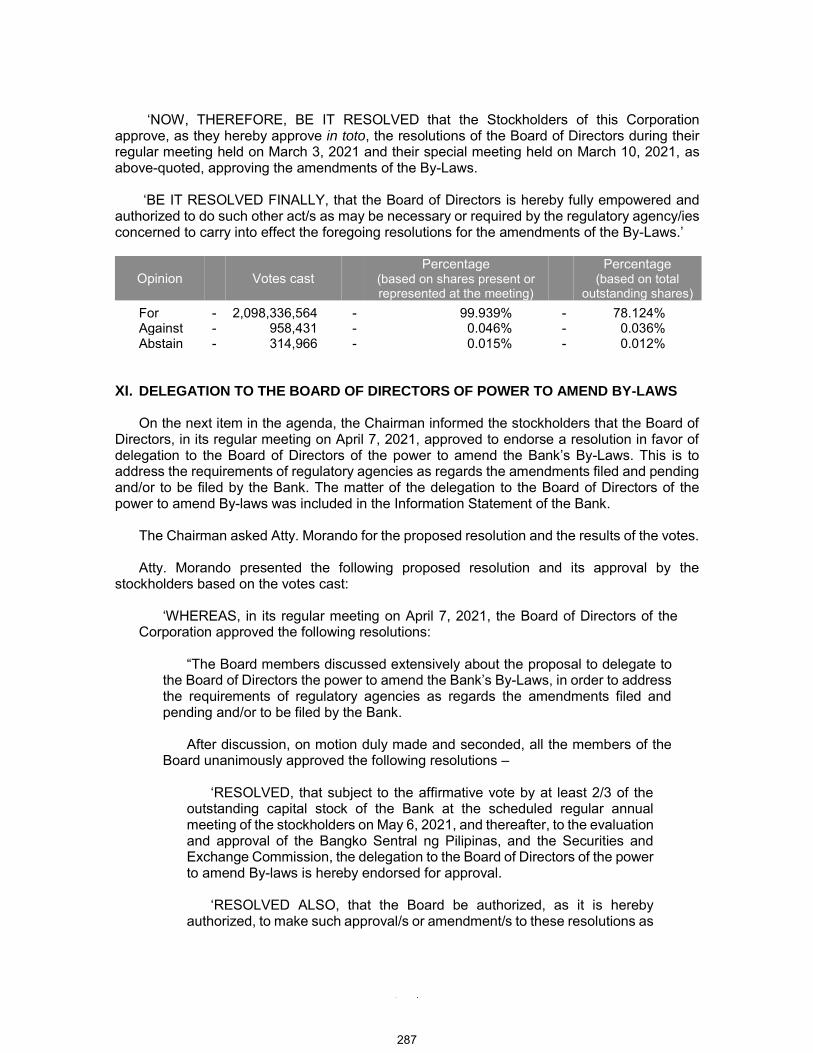
- 12 -
‘NOW, THEREFORE, BE IT RESOLVED that the Stockholders of this Corporation approve, as they hereby approve in toto, the resolutions of the Board of Directors during their regular meeting held on March 3, 2021 and their special meeting held on March 10, 2021, as above-quoted, approving the amendments of the By-Laws.
‘BE IT RESOLVED FINALLY, that the Board of Directors is hereby fully empowered and authorized to do such other act/s as may be necessary or required by the regulatory agency/ies concerned to carry into effect the foregoing resolutions for the amendments of the By-Laws.’
Opinion Votes cast Percentage
(based on shares present or represented at the meeting)
Percentage (based on total
outstanding shares) For - 2,098,336,564 - 99.939% - 78.124%Against - 958,431 - 0.046% - 0.036%Abstain - 314,966 - 0.015% - 0.012%
XI. DELEGATION TO THE BOARD OF DIRECTORS OF POWER TO AMEND BY-LAWS
On the next item in the agenda, the Chairman informed the stockholders that the Board ofDirectors, in its regular meeting on April 7, 2021, approved to endorse a resolution in favor of delegation to the Board of Directors of the power to amend the Bank’s By-Laws. This is to address the requirements of regulatory agencies as regards the amendments filed and pending and/or to be filed by the Bank. The matter of the delegation to the Board of Directors of the power to amend By-laws was included in the Information Statement of the Bank.
The Chairman asked Atty. Morando for the proposed resolution and the results of the votes.
Atty. Morando presented the following proposed resolution and its approval by the stockholders based on the votes cast:
‘WHEREAS, in its regular meeting on April 7, 2021, the Board of Directors of the Corporation approved the following resolutions:
“The Board members discussed extensively about the proposal to delegate to the Board of Directors the power to amend the Bank’s By-Laws, in order to address the requirements of regulatory agencies as regards the amendments filed and pending and/or to be filed by the Bank.
After discussion, on motion duly made and seconded, all the members of the Board unanimously approved the following resolutions –
‘RESOLVED, that subject to the affirmative vote by at least 2/3 of the outstanding capital stock of the Bank at the scheduled regular annual meeting of the stockholders on May 6, 2021, and thereafter, to the evaluation and approval of the Bangko Sentral ng Pilipinas, and the Securities and Exchange Commission, the delegation to the Board of Directors of the power to amend By-laws is hereby endorsed for approval.
‘RESOLVED ALSO, that the Board be authorized, as it is hereby authorized, to make such approval/s or amendment/s to these resolutions as
287

- 13 -
may be necessary to comply with any other requirement/s of the regulatory agency/ies concerned.
‘RESOLVED, FINALLY, that the Corporate Secretary/Assistant Corporate Secretary be authorized, as she is hereby authorized, to give notice of the foregoing approvals to the regulatory offices concerned.’”
“NOW THEREFORE, BE IT RESOLVED that the Stockholders of this Corporation approve, as they hereby approve in toto, the resolutions of the Board of Directors during their regular meeting held on April 7, 2021, as above-quoted, approving to endorse the delegation to the Board of Directors of the power to amend the By-Laws of the Bank.”
“BE IT RESOLVED FINALLY, that the Board of Directors is hereby fully empowered and authorized to do such other act/s as may be necessary or required by the regulatory agency/ies concerned to carry into effect the foregoing resolutions.”
Opinion Votes cast Percentage
(based on shares present or represented at the meeting)
Percentage (based on total
outstanding shares) For - 2,078,404,481 - 98.990% - 77.382%Against - 20,890,514 - 0.995% - 0.778%Abstain - 314,966 - 0.015% - 0.012%
XII. OTHER MATTERS
The Chairman announced that the Board of Directors, in their meeting held earlier, approveda cash dividend in the total peso amount of P2.7 billion, similar to last year’s figure, representingOne Peso (P1.00) per share. Further, the Board approved to set and/or recommend May 21, 2021 as the record date and June 4, 2021 as the payment/issuance date of the cash dividends, and to delegate to the President the authority to change the foregoing date/s as may be required to comply with the regulatory requirements.
Next, the Chairman stated that it is time to address the questions and comments from the stockholders sent via e-mail. As mentioned in the Guidelines for participation in the meeting via remote communication, which was posted in the Bank’s website, questions or comments submitted and received but not addressed during the livestream, shall be answered directly by e-mail to the stockholder concerned. Chairman Sy then gave the floor to the Head of Investorand Corporate Relations Group, Mr. Alexander C. Escucha, to read aloud the questions andcomments.
Mr. Escucha began by reading the question sent by stockholder, Mr. Lamberto Cervania. Mr. Cervania wanted to know whether the Bank can sustain its positive performance, considering the decline in net income of other banks.
President Whang recognized that 2021 will continue to be challenging due to the pandemic. He emphasized that health and economy are interdependent, and that prolonged lockdowns caused unemployment and underemployment. Whiles businesses continue to struggle, the Bank sees the resiliency of the Filipino people to work around the “new normal”. He mentioned that loan growth might continue to be muted but the Bank will continue to provide financial support for its clients and stakeholders. He also looked at positive signs of economic recovery,
288
- 14 -
as business activities reopen and the Government’s vaccination program peaks in the coming months.
Mr. Escucha next read the question from stockholder Marcelino Florete, who asked how high the NPL ratio might be this year. President Whang responded that the NPL industry forecast stands at 4% to 4.5%. He expressed hope that the level of economy which occurred during the 1997 Asian financial crisis will not happen, as the economic environment today is different. The Government’s efforts through the Bayanihan Acts 1 and 2, where loan payments were extended, contributed to easing economic hardships. With the Government’s support, the interest environment will help the economy.
Mr. Escucha continued with a question from stockholder Jasmin Ong-Chan, who inquired on the Bank’s plans for digitalization.
President Whang replied that even before the pandemic, the Bank had already started building its digital foundation to provide an efficient alternative channel for its customers. Transactions in the Bank’s digital channel have outpaced over-the-counter transactions in the branches. He further commented that the pandemic accelerated this need, with people staying and working from home, and pushed the Bank with a sense of urgency. More features will be added in the Bank’s mobile app, such as sending money using just the mobile number or email address of the recipient. The Bank is also working on an omni-channel platform which will provide seamless digital onboarding across its online and mobile banking spaces. He further commented that the Bank will continue to improve its offerings in the digital space.
Mr. Escucha next relayed another inquiry from stockholder Marcelino Florete, through broker Summit Securities. Mr. Florete asked if the Bank can buy back its shares. Mr. Escucha summarized the Bank’s reply, and noted that although share buyback is an accepted practice abroad and domestically for non-financial entities, the General Banking Law expressly prohibits banks and other financial institutions from buying back its shares.
Mr. Escucha announced the conclusion of the question and answer session, and undertook to reply by e-mail to all other questions directly to the Bank stockholders.
XIII. ADJOURNMENT
There being no other business to transact or matter to be taken up, Chairman Hans Sy, on behalf of the Board of Directors and Management of the Bank, expressed gratitude to all those who participated in the meeting. He thanked everyone for their continued support. Thereafter, the meeting was adjourned at 4:55 P.M.
Prepared by: Attested by:
(Signed) (Signed)ATTY. CORAZON I. MORANDO
Corporate Secretary and Secretary of the Meeting
HANS T. SY Chairman of the Board
and Chairman of the Meeting
289
Related Documents