22nd National Forum on Quality Improvement in Health Care: December 5-8, 2010 One of the most common adverse events reported in hospitals is a patient fall. 1,2 Unintentional patient falls are also the primary etiology of non-fatal injuries in patients over 65, and the accidental death annual mortality rate attributed to fall-related injuries is approximately 41 per 100,000 patients. 3 e economic impact of patient falls is substantial, with an average fall- related injury cost per patient of $24,962, 4 estimated annual costs of $16 to $19 billion for injuries related to non-fatal falls, and approximately $170 million attributed to fall-related deaths each year. 5-7 National initiatives such as Healthy People 2010, 8 the Institute for Healthcare Improvement, 9 and the Joint Commission 10 have provided specific goals and guidance on preventing patient falls, preventing harm from falls, and reducing death from accidental falls. Many falls are preventable using an evidence-based approach, with appropriate risk assessment, 11,12 risk-reduction strategies for fall prevention, 10,13 and enhancing technology such as use of bed-exit alarms. 13 Despite national initiatives and increasing awareness of the public health issue of patient falls, many acute care hospitals continue to face unique challenges in fall reduction due to the multiple risk factors for unintentional falls in high-risk patients. Saddleback Memorial Medical Center is a 325-bed hospital with locations in Laguna Hills and San Clemente, which has been working over the past 30 years to enhance the health and well-being of South Orange County residents. In the first quarter of 2009, a spike in falls was noted, with an average all-fall rate of 3.39 per 1000 patient days and average bed-related fall rate of 2.10 per 1000 patient days. Per the hospital’s existing quality improvement principles, quality improvement (QI) efforts were initiated. QI efforts include utilization of a multidisciplinary team, root-cause analyses, comprehensive education, staff competency evaluations, and “Lean” 14 methodologies; Saddleback’s team utilized Lean methods for the challenges of implementing 138 new beds* for med/surg and telemetry at the Laguna Hills campus in an effort to improve patient outcomes. Lean is a philosophy and methodology that is used to help eliminate waste and improve efficiency, quality and value for customers (patients) by analyzing and improving processes and creating standard work (a predictable process with little variation). 15 Maureen Dempsey, RN, MSHCA; Kathy Dawson, RN, MSN, NEA-BC l Saddleback Memorial Medical Center, Laguna Hills, CA * Stryker S3 ® Med/Surg Bed configured to include Chaperone ® Bed Exit with Zone Control ® with Isoflex ® Pressure Redistribution Surface, Stryker Inc., Portage, MI References We would like to recognize and acknowledge the following departments, team leaders, and associated staff for their efforts in this quality improvement study: Nursing: Carol Hadley, Anna De La Cerna, Judy Price, Maria Gutierrez, Debby Saffan, Carleen Fellows, Brandi Cassingham, Christine Kim, Taees Ghassemi, Vanessa Whitmarsh, Loraine Chapman, Stephanie Zingg ; Building Services: Bill Bucher; Nguyen Nguyen; Environmental Services: Marc Businger, Emma Gonzalez, Laura Chaidez; Professional Development: Lori Conconi, Sherry Choquette; Stryker Patient Care Representative: Dan Ucker; Patient: Karen Allen; Organizational Performance: Maureen S. Dempsey, Carrie Henahan; Physical erapy: Susan Roof Special recognition goes out to LaDonna Butler who submitted the original proposal to the Capital Review and Finance Committees outlining the acquisition of medical/surgical beds. Her efforts began the quality improvement initiative at our facility. 1. Oliver D. Assessing the risk of falls in hospitals: time for a re-think? Can J Nurs Res. 2006;38:89-94. 2. Terrell KM, Weaver CS, Giles BK, et al. ED patient falls and resulting injuries. J Emerg Nurs. 2009;35:89-92. 3. Currie L. Fall and injury prevention. In Hughes RG (ed): Patient Safety and Quality: An Evidence-Based Handbook for Nurses. (AHRQ Publication No. 08-0043). http://www.ncbi.nlm.nih.gov/bookshelf/ br.fcgi?book=nursehb&part=ch10. Accessed November 1, 2010. 4. ECRI: Enterprise approach key to addressing CMS final rule on hospital-acquired conditions. Special Advisory. Nov 2007. 5. Stevens JA, Corso PS, Finkelstein EA, et al. The costs of fatal and non-fatal falls among older adults. Inj Prev. 2006. 2006;12:290–295. 6. Shekelle P, Maglione M, Chang J, et al. Falls prevention interventions in the medicare population. Baltimore, MD: U.S. Department of Health and Human Services, Health Care Financing Administration; 2003. 7. Centers for Medicare and Medicaid Services. Medicare program: Changes to the hospital inpatient prospective payment systems and fiscal year 2008 rates. Fed Regist.2007;72:47379-47428. 8. U.S. Department of Health and Human Services. Healthy people 2010 - with understanding and improving health and objectives for improving health. 2. Washington, DC: U.S. Government Printing Office; 2000. 9. The Institute for Healthcare Improvement. Preventing Harm From Falls. http://www.ihi.org/IHI/Topics/ PatientSafety/ReducingHarmfromFalls Accessed November 1, 2010. 10. Joint Commission. NPSG 09.02.0.1. http://www. jointcommission.org/AccreditationPrograms/ LongTermCare/Standards/09_FAQs/NPSG/Patient_falls/ NPSG.09.02.01/Fall+reduction+program.htm. Accessed November 1, 2010. 11. Morse JM. Preventing patient falls. Thousand Oaks, CA: Sage; 1997. 12. Hendrich A, Nyhuis A, Kippenbrock T, et al. Hospital falls: development of a predictive model for clinical practice. Appl Nurs Res. 1995;8:129-139. 13. Boushon B, Nielsen G, Quigley P, et al. Transforming Care at the Bedside How-to Guide: Reducing Patient Injuries from Falls. Cambridge, MA: Institute for Healthcare Improve- ment; 2008. http://www.ihi.org/IHI/Topics/PatientSafety/ ReducingHarmfromFalls/Tools/TCABHowToGuideReduc- ingPatientInjuriesfromFalls.htm. Accessed November 1, 2010. 14. Varkey P, Reller MK, Resar RK. Basics of quality improvement in healthcare. Mayo Clinic Proceedings. http://www.mayoclinicproceedings.com/ content/82/6/735.full 15. Liker, J. The Toyota Way. New York, NY: McGraw-Hill; 2004 16. Poe SS, Cvach M, Dawson PB, et al. The Johns Hopkins Fall Risk Assessment Tool: post-implementation evaluation. J Nurs Care Qual. 2007;22:293-298. e results of this comprehensive QI initiative are presented in Figures 1-3. Figure 1 is a longitudinal flow chart which illustrates “all fall” rates from Q1 2009 through Q3 2010 associated with timing of QI interventions. Figure 2 demonstrates the decrease in average “all-fall” rates and average “bed-related fall” rates by quarter from Q1 2009 through Q3 2010. Figure 3 shows the results of staff competency audits at 30, 90, and 120 days. From the time of the spike in “all falls” and “bed-related falls” in Q1 2009, the facility has achieved a relative reduction of 26% in “all falls” and a relative reduction of 40% in “bed-related falls”. In the month of October 2010, total and bed-related fall rates continued to drop. e average rate for total falls in October was 1.37. e average rate for bed-related falls in October was 0.55.

Welcome message from author
This document is posted to help you gain knowledge. Please leave a comment to let me know what you think about it! Share it to your friends and learn new things together.
Transcript
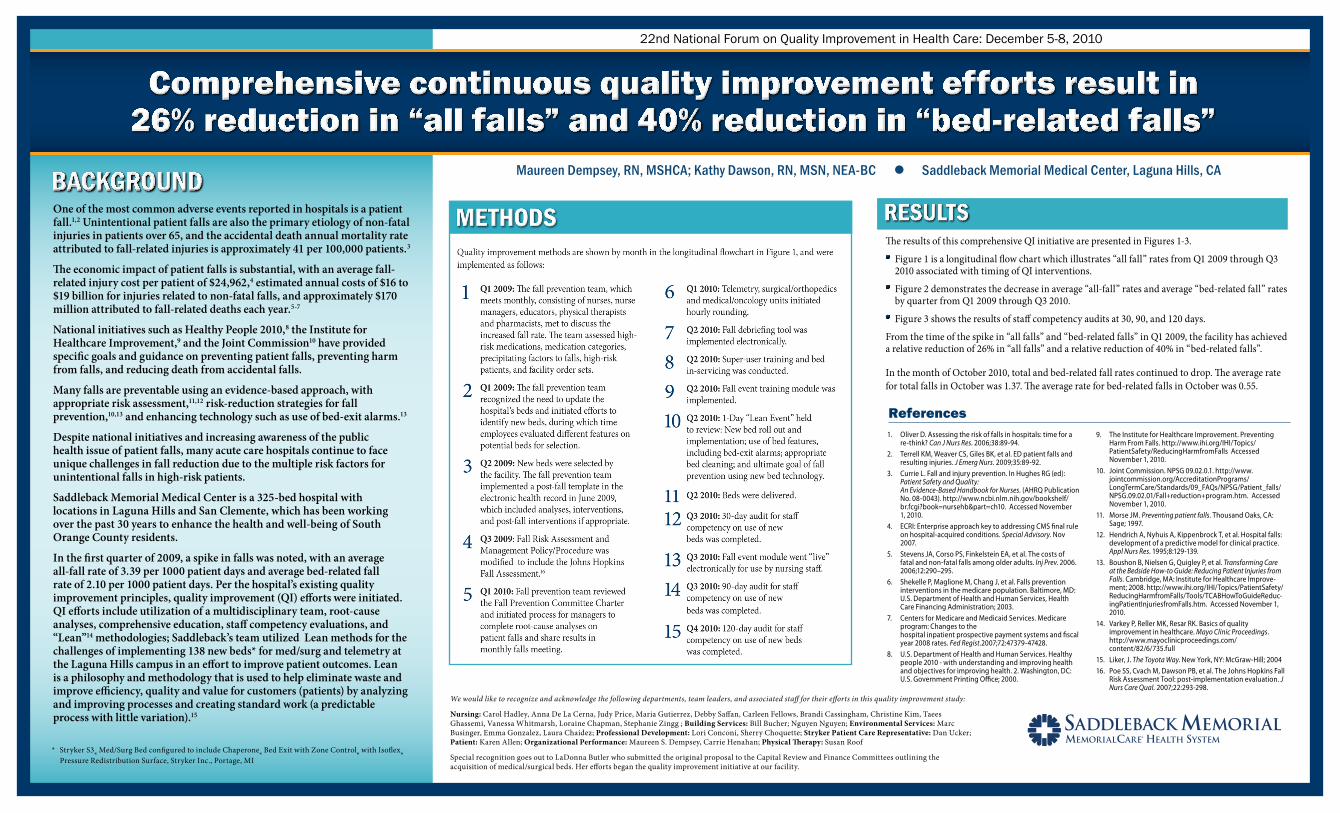
Comprehensive continuous quality improvement efforts result in 26% reduction in “all falls” and 40% reduction in “bed-related falls”
22nd National Forum on Quality Improvement in Health Care: December 5-8, 2010
One of the most common adverse events reported in hospitals is a patient fall.1,2 Unintentional patient falls are also the primary etiology of non-fatal injuries in patients over 65, and the accidental death annual mortality rate attributed to fall-related injuries is approximately 41 per 100,000 patients.3
The economic impact of patient falls is substantial, with an average fall-related injury cost per patient of $24,962,4 estimated annual costs of $16 to $19 billion for injuries related to non-fatal falls, and approximately $170 million attributed to fall-related deaths each year.5-7
National initiatives such as Healthy People 2010,8 the Institute for Healthcare Improvement,9 and the Joint Commission10 have provided specific goals and guidance on preventing patient falls, preventing harm from falls, and reducing death from accidental falls.
Many falls are preventable using an evidence-based approach, with appropriate risk assessment,11,12 risk-reduction strategies for fall prevention,10,13 and enhancing technology such as use of bed-exit alarms.13
Despite national initiatives and increasing awareness of the public health issue of patient falls, many acute care hospitals continue to face unique challenges in fall reduction due to the multiple risk factors for unintentional falls in high-risk patients.
Saddleback Memorial Medical Center is a 325-bed hospital with locations in Laguna Hills and San Clemente, which has been working over the past 30 years to enhance the health and well-being of South Orange County residents.
In the first quarter of 2009, a spike in falls was noted, with an average all-fall rate of 3.39 per 1000 patient days and average bed-related fall rate of 2.10 per 1000 patient days. Per the hospital’s existing quality improvement principles, quality improvement (QI) efforts were initiated. QI efforts include utilization of a multidisciplinary team, root-cause analyses, comprehensive education, staff competency evaluations, and “Lean”14 methodologies; Saddleback’s team utilized Lean methods for the challenges of implementing 138 new beds* for med/surg and telemetry at the Laguna Hills campus in an effort to improve patient outcomes. Lean is a philosophy and methodology that is used to help eliminate waste and improve efficiency, quality and value for customers (patients) by analyzing and improving processes and creating standard work (a predictable process with little variation).15
Maureen Dempsey, RN, MSHCA; Kathy Dawson, RN, MSN, NEA-BC l Saddleback Memorial Medical Center, Laguna Hills, CA
* Stryker S3® Med/Surg Bed configured to include Chaperone
® Bed Exit with Zone Control
® with Isoflex
®
Pressure Redistribution Surface, Stryker Inc., Portage, MI
References
We would like to recognize and acknowledge the following departments, team leaders, and associated staff for their efforts in this quality improvement study:
Nursing: Carol Hadley, Anna De La Cerna, Judy Price, Maria Gutierrez, Debby Saffan, Carleen Fellows, Brandi Cassingham, Christine Kim, Taees Ghassemi, Vanessa Whitmarsh, Loraine Chapman, Stephanie Zingg ; Building Services: Bill Bucher; Nguyen Nguyen; Environmental Services: Marc Businger, Emma Gonzalez, Laura Chaidez; Professional Development: Lori Conconi, Sherry Choquette; Stryker Patient Care Representative: Dan Ucker; Patient: Karen Allen; Organizational Performance: Maureen S. Dempsey, Carrie Henahan; Physical Therapy: Susan Roof
Special recognition goes out to LaDonna Butler who submitted the original proposal to the Capital Review and Finance Committees outlining the acquisition of medical/surgical beds. Her efforts began the quality improvement initiative at our facility.
1. Oliver D. Assessing the risk of falls in hospitals: time for a re-think? Can J Nurs Res. 2006;38:89-94.
2. Terrell KM, Weaver CS, Giles BK, et al. ED patient falls and resulting injuries. J Emerg Nurs. 2009;35:89-92.
3. Currie L. Fall and injury prevention. In Hughes RG (ed): Patient Safety and Quality: An Evidence-Based Handbook for Nurses. (AHRQ Publication No. 08-0043). http://www.ncbi.nlm.nih.gov/bookshelf/br.fcgi?book=nursehb&part=ch10. Accessed November 1, 2010.
4. ECRI: Enterprise approach key to addressing CMS final rule on hospital-acquired conditions. Special Advisory. Nov 2007.
5. Stevens JA, Corso PS, Finkelstein EA, et al. The costs of fatal and non-fatal falls among older adults. Inj Prev. 2006. 2006;12:290–295.
6. Shekelle P, Maglione M, Chang J, et al. Falls prevention interventions in the medicare population. Baltimore, MD: U.S. Department of Health and Human Services, Health Care Financing Administration; 2003.
7. Centers for Medicare and Medicaid Services. Medicare program: Changes to the hospital inpatient prospective payment systems and fiscal year 2008 rates. Fed Regist.2007;72:47379-47428.
8. U.S. Department of Health and Human Services. Healthy people 2010 - with understanding and improving health and objectives for improving health. 2. Washington, DC: U.S. Government Printing Office; 2000.
9. The Institute for Healthcare Improvement. Preventing Harm From Falls. http://www.ihi.org/IHI/Topics/PatientSafety/ReducingHarmfromFalls Accessed November 1, 2010.
10. Joint Commission. NPSG 09.02.0.1. http://www.jointcommission.org/AccreditationPrograms/LongTermCare/Standards/09_FAQs/NPSG/Patient_falls/NPSG.09.02.01/Fall+reduction+program.htm. Accessed November 1, 2010.
11. Morse JM. Preventing patient falls. Thousand Oaks, CA: Sage; 1997.
12. Hendrich A, Nyhuis A, Kippenbrock T, et al. Hospital falls: development of a predictive model for clinical practice. Appl Nurs Res. 1995;8:129-139.
13. Boushon B, Nielsen G, Quigley P, et al. Transforming Care at the Bedside How-to Guide: Reducing Patient Injuries from Falls. Cambridge, MA: Institute for Healthcare Improve-ment; 2008. http://www.ihi.org/IHI/Topics/PatientSafety/ ReducingHarmfromFalls/Tools/TCABHowToGuideReduc-ingPatientInjuriesfromFalls.htm. Accessed November 1, 2010.
14. Varkey P, Reller MK, Resar RK. Basics of quality improvement in healthcare. Mayo Clinic Proceedings. http://www.mayoclinicproceedings.com/content/82/6/735.full
15. Liker, J. The Toyota Way. New York, NY: McGraw-Hill; 200416. Poe SS, Cvach M, Dawson PB, et al. The Johns Hopkins Fall
Risk Assessment Tool: post-implementation evaluation. J Nurs Care Qual. 2007;22:293-298.
The results of this comprehensive QI initiative are presented in Figures 1-3.
Figure 1 is a longitudinal flow chart which illustrates “all fall” rates from Q1 2009 through Q3 2010 associated with timing of QI interventions.
Figure 2 demonstrates the decrease in average “all-fall” rates and average “bed-related fall” rates by quarter from Q1 2009 through Q3 2010.
Figure 3 shows the results of staff competency audits at 30, 90, and 120 days.
From the time of the spike in “all falls” and “bed-related falls” in Q1 2009, the facility has achieved a relative reduction of 26% in “all falls” and a relative reduction of 40% in “bed-related falls”.
In the month of October 2010, total and bed-related fall rates continued to drop. The average rate for total falls in October was 1.37. The average rate for bed-related falls in October was 0.55.

Lean principles and methods are effective when customized for clinical challenges
A multidisciplinary team approach is useful to address complex clinical challenges because multiple viewpoints are essential for successful QI efforts
Fall prevention policies and procedures should be updated regularly according to evidence-based best practice recommendations
If beds are outdated, bed technology should be updated to ensure evidence-based prevention strategies such as bed-exit alarms can be utilized for high-risk patients
Comprehensive and ongoing staff education is essential to ensure fall-prevention efforts are implemented on high-risk patients
Staff competency audits are useful in identifying strengths and weaknesses of staff for ongoing educational efforts
CRITICAL ELEMENTSAll elements were not tested at 30, 90, and 120 day time points*
Hands on elements
Locate gray power cords and plug both cords into wall outlet power source
Connect break-away cable into “pigtail” for nurse’s call light
Demonstrate side rail use: up, down, and intermediate positioning
Demonstrate bed up, down, and various positions including cardiac positioning and back to Fowler’s position
Demonstrate emergency procedures (CPR) by manual and end of bed control release
Demonstrate braking function: set and release
Demonstrate ibed function in setting – 1. Bed in low position; 2. Brake on; 3. Three side rails up and locked; 4. Zone selected
Safety monitoring: Green light on when ALL staff leaves room. (If green light not able to be set, use nurse call light to summon assistance – Do Not Leave Patient)
Ergonomic considerations: Utilize intermediate rail height for transfers of patient/ambulation and raise bed for patient assist to stand, baths, etc
Ensure patient comfort and call light in reach upon leaving room
Direct Patient Care Personnel
Demonstrate weight function/button
Demonstrate zeroing of bed with bed linens and other appropriate equipment present. Must be done by housekeeping when finished cleaning and linens in place. (EVS defined responsibility)
Demonstrate bed exit alarm with arm/disarm function and zone control. (Utilize zone alarms including Zone 1 for all patients; Zone 2 for high-risk fall pts (13 or greater score) and Zone 3 nursing judgment (may include cervical pts)
Locate gray power cords and plug both cords into wall outlet power source.
Connect break-away cable into “pigtail” for nurse’s call light
Demonstrate side rail use: up, down, and intermediate positioning
Safety monitoring: Green light on when ALL staff leaves room. (If green light not able to be set, staff is to use nurse call light to summon assistance – Do Not Leave Patient)
Ensure patient comfort and call light in reach upon leaving room
Not correct setting – amber light on pt in bed not mobile
Amber light on correctly – pt mobile and in chair or other places
No light on – no setting for pts in bed not mobile
Position S3 to a safe height
Raise the head of the bed
Unplug bed prior to cleaning or servicing the unit
Fold down the head-end of the mattress
Use a damp, clean, soft cloth, wipe down the entire mattress surface with a mild soap and water solution
Hand wash all surfaces of bed with warm water and mild detergent
After cleaning the head section, fold back the mattress plug the bed back in and then lower the head-end
Fold back the foot-end of the mattress
Wipe down all mattress/bed surfaces as described above
To finish, wipe bed and surface clean and DRY thoroughly to avoid build up of cleaning solution
Fold down mattress and plug in the bed
Compliance Audits: 30-, 90- and 120-days
Direct Observation Audit (N = 30)
House-wide Physical Bed Audit (N = 118)
Cleaning Audit (N = 5)
Compliance Rate (% of respondents)0% 10% 20% 30% 40% 50% 60% 70% 80% 90% 100%
Hands on elements
Direct patient care personnel
30-day Compliance 90-day Compliance 120-day Compliance compliance not measured
* Elements tested for compliance at various time points were determined by the fall prevention team
0
1
2
3
4
5
6
7
8
Q308 Q4 08 Q1 09 Q2 09 Q3 09 Q4 09 Q1 10 Q2 10 Q310
2E 2W 3E 3WGoal = CALNOC Top 25th percentile (Q3 08 to Q2 09: CALNOC Top 25th percentile = 1.96; Q3 09 to Q2 10: CALNOC Top 25th percentile = 2.03)
Patie
nt F
all R
ate
(per
100
0 pa
tient
day
s)
1st Quarter 2009 – Increase in falls noted; root-cause analysis performed 3 month duration Fall prevention team consisted of nurses, nurse managers, educators, and pharmacists;
team assessed high risk medications, medication categories, precipitating factors to falls, high risk patients, order sets
Group began looking at beds early Jan 2009; employees were given an opportunity to evaluate the different features on the potential beds to be selected.
2nd Quarter 2009 – Final beds selected; Fall debriefing tool developed Final decision made on bed selection
Implemented the post-fall template in EPIC June 2009 which included analysis and appropriate interventions; interventions initiated post-fall if indicated
3rd Quarter 2009 – Johns Hopkins Fall Assessment initiated Fall Risk Assessment and Management Policy/Procedure modified July 2009 to include
Johns Hopkins Fall Assessment
1st Quarter 2010 – Fall Prevention Committee Charter reviewed; Hourly rounding initiated Team reviewed Fall Prevention Committee Charter in January 2010; discussed the need for the
managers to complete a root-cause analysis on their patient falls. Previous months falls would be discussed at the monthly falls meeting.
The telemetry and medical/surgical units started hourly rounding in February 2010.
2nd Quarter 2010 – Fall debriefing tool implemented electronically; Bed in-servicing Fall event module was implemented in mRMr training module.
A 1-day Toyota LEAN focus group was held on April 8, 2010; staff from the bedside and support focused on the problem of Fall Prevention utilizing technology of newly selected beds.
Beds were delivered and in-servicing completed in May 2010.
3rd Quarter 2010 – 30-Day competency evaluations; Fall event module went live 30-day staff competency evaluation completed and 30-day evaluation of cleaning completed July 8, 2010.
Fall event module went live in August 2010 to be actively used by Saddleback nursing staff.
Results of 90-day staff competency evaluations completed as of September 24, 2010.
Timeline for education/implementation: Week of April 26 – super user training Week of May 3 – all employee training May 11, 18, 25 – actual bed deliveries
Q1 09 Increase in falls noted – root-cause analysis performed 3 month duration
Bed selection process initiated Avg. rate all falls = 3.39;
avg. rate bed-related falls = 2.10
Q2 09 Final beds selected Fall debriefing tool developed
Q3 09 Johns Hopkins Fall Assessment initiated
Q1 10 Fall Prevention Committee Charter reviewed
Hourly rounding initiated
Q3 08 Q4 08 Q1 09 Q2 09 Q3 09 Q4 09 Q1 10 Q2 10 Q3 10
Q1 2009 – QI Initiated
Q1 2009 – Q3 2010 Relative reduction in all fall rates: 26%Q1 2009 – Q3 2010 Relative reduction in bed-related fall rates: 40%
Fall debriefing tool implemented electronically
1 day LEAN focus group
Bed in-servicing
Q2 10
Quarter
Q3 10 30-day staff competency evaluation
30-day cleaning evaluation
Fall event module went live
90-day staff competency evaluation
Avg. rate all falls = 2.51 (rr from spike = 26%); avg. rate bed-related falls = 1.25 (rr from spike = 40%)
See enlarged text at right
See enlarged text at right
Figure 3. Results of 30, 90, and 120-day staff competency audits(Text enlarged due to small font)
CRITICAL ELEMENTS All elements were not tested at 30, 90, and 120 day time points*
Direct Observation Audit (N = 30) Hands on elementsLocate gray power cords and plug both cords into wall outlet power sourceConnect break-away cable into “pigtail” for nurse’s call lightDemonstrate side rail use: up, down, and intermediate positioningDemonstrate bed up, down, and various positions including cardiac positioning and back to Fowler’s positionDemonstrate emergency procedures (CPR) by manual and end of bed control releaseDemonstrate braking function: set and releaseDemonstrate ibed function in setting – 1. Bed in low position; 2. Brake on; 3. Three side rails up and locked; 4. Zone selectedSafety monitoring: Green light on when ALL staff leaves room. (If green light not able to be set, use nurse call light to summon assistance – Do Not Leave Patient)Ergonomic considerations: Utilize intermediate rail height for transfers of patient/ambulation and raise bed for patient assist to stand, baths, etcEnsure patient comfort and call light in reach upon leaving roomDirect Patient Care PersonnelDemonstrate weight function/buttonDemonstrate zeroing of bed with bed linens and other appropriate equipment present. Must be done by housekeeping when finished cleaning and linens in place. (EVS defined responsibility)Demonstrate bed exit alarm with arm/disarm function and zone control. (Utilize zone alarms including Zone 1 for all patients; Zone 2 for high-risk fall pts (13 or greater score) and Zone 3 nursing judgment (may include cervical pts)
House-wide Physical Bed Audit (N = 118) Locate gray power cords and plug both cords into wall outlet power source. Connect break-away cable into “pigtail” for nurse’s call lightDemonstrate side rail use: up, down, and intermediate positioningSafety monitoring: Green light on when ALL staff leaves room. (If green light not able to be set, staff is to use nurse call light to summon assistance – Do Not Leave Patient)Ensure patient comfort and call light in reach upon leaving roomNot correct setting – amber light on pt in bed not mobileAmber light on correctly – pt mobile and in chair or other placesNo light on – no setting for pts in bed not mobile
Cleaning Audit (N = 5)
Figure 1. Longitudinal flowchart all-fall rates and interventions, Q1 2009 - Q3 2010(Text enlarged due to small font)
1st Quarter 2009 – Increase in falls noted; root-cause analysis performed 3 month duration Fall prevention team consisted of nurses, nurse managers, educators, and pharmacists; team assessed high risk
medications, medication categories, precipitating factors to falls, high risk patients, order sets Group began looking at beds early Jan 2009; employees were given an opportunity to evaluate the different
features on the potential beds to be selected.2nd Quarter 2009 – Final beds selected; Fall debriefing tool developed Final decision made on bed selection Implemented the post-fall template in EPIC June 2009 which included analysis and appropriate interventions;
interventions initiated post-fall if indicated3rd Quarter 2009 – Johns Hopkins Fall Assessment initiated
Fall Risk Assessment and Management Policy/Procedure modified July 2009 to include Johns Hopkins Fall Assessment
1st Quarter 2010 – Fall Prevention Committee Charter reviewed; Hourly rounding initiated Team reviewed Fall Prevention Committee Charter in January 2010; discussed the need for the managers to
complete a root-cause analysis on their patient falls. Previous months falls would be discussed at the monthly falls meeting.
The telemetry and medical/surgical units started hourly rounding in February 2010.2nd Quarter 2010 – Fall debriefing tool implemented electronically; Bed in-servicing Fall event module was implemented in mRMr training module. A 1-day Toyota LEAN focus group was held on April 8, 2010; staff from the bedside and support focused on the
problem of Fall Prevention utilizing technology of newly selected beds. Beds were delivered and in-servicing completed in May 2010.3rd Quarter 2010 – 30-Day competency evaluations; Fall event module went live 30-day staff competency evaluation completed and 30-day evaluation of cleaning completed July 8, 2010. Fall event module went live in August 2010 to be actively used by Saddleback nursing staff. Results of 90-day staff competency evaluations completed as of September 24, 2010.
Timeline for education/implementation: Week of April 26 – super user training Week of May 3 – all employee training May 11, 18, 25 – actual bed deliveries
Position S3 to a safe heightRaise the head of the bedUnplug bed prior to cleaning or servicing the unitFold down the head-end of the mattressUse a damp, clean, soft cloth, wipe down the entire mattress surface with a mild soap and water solutionHand wash all surfaces of bed with warm water and mild detergent
After cleaning the head section, fold back the mattress plug the bed back in and then lower the head-endFold back the foot-end of the mattressWipe down all mattress/bed surfaces as described aboveTo finish, wipe bed and surface clean and DRY thoroughly to avoid build up of cleaning solutionFold down mattress and plug in the bed
Related Documents