REPORT TO THE BOARD OF GOVERNORS SUBJECT UBC BUDGET OUTLOOK MEETING DATE FEBRUARY 4, 2014 APPROVED FOR SUBMISSION Forwarded to the Board of Governors on the Recommendation of the President Presented By Pierre Ouillet, Vice-President Finance, Resources & Operations David Farrar, Provost and Vice-President Academic Deborah Buszard, Deputy Vice-Chancellor and Principal, Okanagan Ian Burgess, Comptroller Michael Shakespeare, Associate Vice-President Finance & Operations, Okanagan Report Date January 16, 2014 DECISION REQUESTED For Information EXECUTIVE SUMMARY Please find enclosed per annual process a preview of the University budget that will come to the Board for approval in March. Different audiences will look at the University budget with different lenses: • How is the University investing in its people, particularly faculty? • How is the University supporting its infrastructure? • Is the University appropriately funded? As a result, this year’s format has been improved to: • Provide a University-wide perspective, including Faculty spending allocations (enabled by more accurate budgeting at the Faculty level), • Articulate the balance between central and Faculty funding, and between infrastructure and people; • Identify the major shortfalls and options to address them. Key take-ways: The Provincial model of tuition cap and operating cuts puts tremendous pressure on the sector to cut costs and diversify revenues. • UBC continues to respond by driving deep operating efficiencies and aggressively diversifying revenues. • Key metrics demonstrate relative success despite a challenging environment, but the lack of public funding for infrastructure is concerning Agenda Item #2.2 CLOSED Template revised: 5/27/2013 10:07 AM

2.2 2014.02 Operating Budget Outlook CLOSED
Dec 05, 2015
5 year UBC budget outlook 2014-2019
Welcome message from author
This document is posted to help you gain knowledge. Please leave a comment to let me know what you think about it! Share it to your friends and learn new things together.
Transcript

REPORT TO THE BOARD OF GOVERNORS
SUBJECT UBC BUDGET OUTLOOK
MEETING DATE FEBRUARY 4, 2014
APPROVED FOR SUBMISSION
Forwarded to the Board of Governors on the Recommendation of the President
Presented By Pierre Ouillet, Vice-President Finance, Resources & Operations
David Farrar, Provost and Vice-President Academic
Deborah Buszard, Deputy Vice-Chancellor and Principal, Okanagan
Ian Burgess, Comptroller
Michael Shakespeare, Associate Vice-President Finance & Operations, Okanagan
Report Date January 16, 2014
DECISION REQUESTED For Information
EXECUTIVE SUMMARY
Please find enclosed per annual process a preview of the University budget that will come to the Board for approval in March.
Different audiences will look at the University budget with different lenses: • How is the University investing in its people, particularly faculty?• How is the University supporting its infrastructure?• Is the University appropriately funded?
As a result, this year’s format has been improved to: • Provide a University-wide perspective, including Faculty spending allocations (enabled by more
accurate budgeting at the Faculty level), • Articulate the balance between central and Faculty funding, and between infrastructure and
people; • Identify the major shortfalls and options to address them.
Key take-ways: The Provincial model of tuition cap and operating cuts puts tremendous pressure on the sector to cut costs and diversify revenues.
• UBC continues to respond by driving deep operating efficiencies and aggressively diversifyingrevenues.
• Key metrics demonstrate relative success despite a challenging environment, but the lack ofpublic funding for infrastructure is concerning
Agenda Item #2.2
CLOSED
Template revised: 5/27/2013 10:07 AM
itilstra
Sticky Note
Marked set by itilstra
itilstra
Toope
UBCV Budget Outlook – January 2014
Both campuses present central balanced budgets but Faculties are challenged • In Vancouver, revenues remain split 60-40 between Faculties and UBC-wide services. Faculty
revenue growth is mostly spent on faculty salary increases, central growth is mostly spent on infrastructure and facilities
• In the Okanagan, 75% of new revenues are invested in the Faculties • Faculties are projecting to spend down $27m of reserves in Vancouver and $3m in the Okanagan.
Most Faculties have plans to reduce costs and increase revenues to balance budgets over time but Professional programs, particularly Law and Medicine, are challenged
To maintain its standing, UBC must address 3 major funding shortfalls:
• Infrastructure (need for Provincial support) and student services (need for student engagement) • Professional programs, through pricing adjustments and targeted expansion • Research investments (federal approach and innovation strategy)
Page 2

UBC Operating Budget 2014-2015 Outlook
CONFIDENTIAL NOT FOR DISTRIBUTION February 4, 2014 Report to the Board of Governors
Introduction
2
• Different audiences will look at the University budget with different lenses ⇒ How is the University investing in its people, particularly faculty? ⇒ How is the University supporting its infrastructure? ⇒ Is the University appropriately funded?
• As a result, this year’s format has been improved to: ⇒ Provide a University-wide perspective, including Faculty spending
allocations (enabled by more accurate budgeting at the Faculty level) ⇒ Articulate the balance between central and Faculty funding, and between
infrastructure and people ⇒ Identify the major shortfalls and options to address them
Key messages
3
• The Provincial model of tuition cap and operating cuts puts tremendous pressure on the sector to cut costs an diversify revenues ⇒ UBC continues to respond by driving deep operating efficiencies and aggressively
diversifying revenues ⇒ Key metrics demonstrate relative success despite a challenging environment, but the
lack of public funding for infrastructure is concerning
• Both campuses present central balanced budgets but Faculties are challenged ⇒ In Vancouver, revenues remain split 60-40 between Faculties and UBC-wide services.
Faculty revenue growth is mostly spent on faculty salary increases, central growth is mostly spent on infrastructure and facilities
⇒ In the Okanagan, 75% of new revenues are invested in the Faculties ⇒ Faculties are projecting to spend down $27m of reserves in Vancouver and $3m in the
Okanagan. Most Faculties have plans to reduce costs and increase revenues to balance budgets over time but Professional programs, particularly Law and Medicine, are challenged
• To maintain its standing, UBC must address 3 major funding shortfalls ⇒ Infrastructure (need for Provincial support) and student services (need for student
engagement) ⇒ Professional programs, through pricing adjustments and targeted expansion ⇒ Research investments (federal approach and innovation strategy)
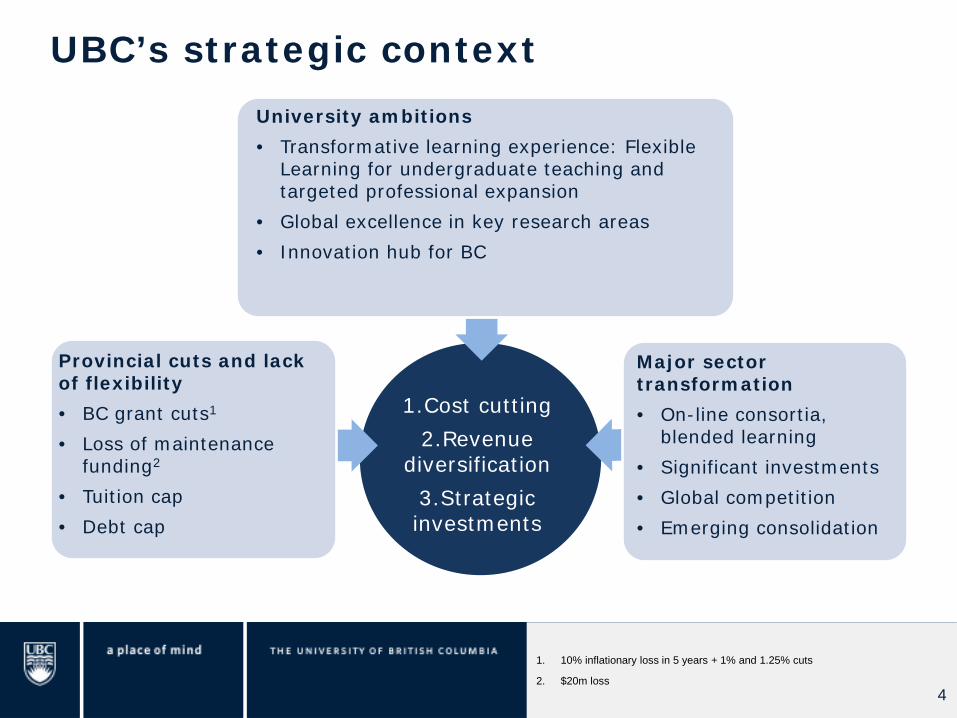
UBC’s strategic context
4
Provincial cuts and lack of flexibility • BC grant cuts1
• Loss of maintenance funding2
• Tuition cap • Debt cap
University ambitions • Transformative learning experience: Flexible
Learning for undergraduate teaching and targeted professional expansion
• Global excellence in key research areas • Innovation hub for BC
Major sector transformation • On-line consortia,
blended learning • Significant investments • Global competition • Emerging consolidation
1.Cost cutting 2.Revenue
diversification 3.Strategic investments
1. 10% inflationary loss in 5 years + 1% and 1.25% cuts
2. $20m loss 4
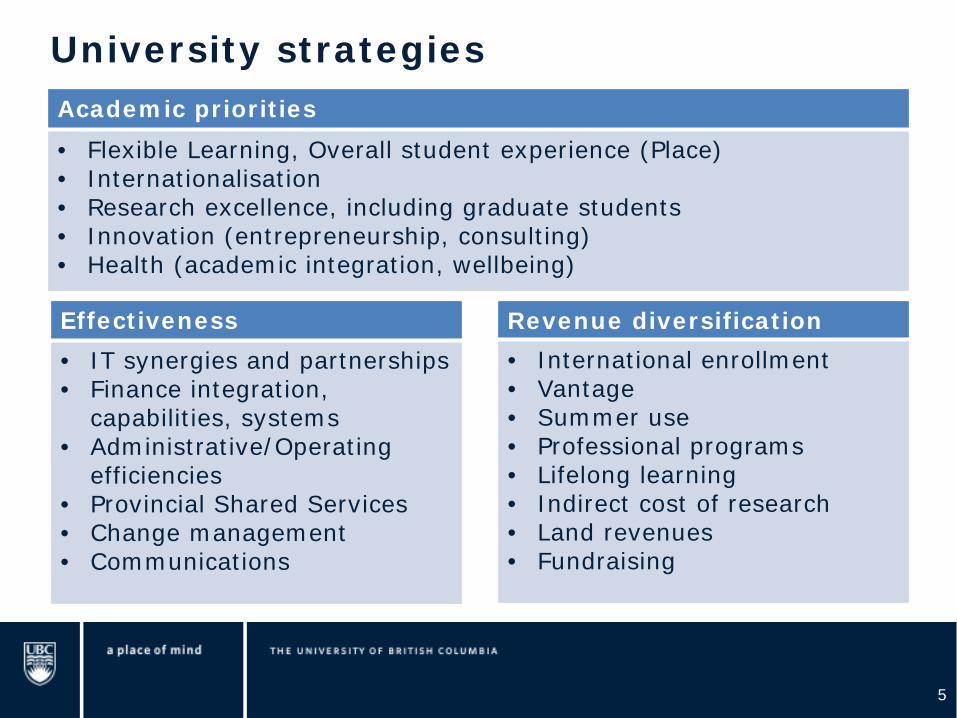
University strategies
5
Academic priorities • Flexible Learning, Overall student experience (Place) • Internationalisation • Research excellence, including graduate students • Innovation (entrepreneurship, consulting) • Health (academic integration, wellbeing)
Effectiveness • IT synergies and partnerships • Finance integration,
capabilities, systems • Administrative/Operating
efficiencies • Provincial Shared Services • Change management • Communications
Revenue diversification • International enrollment • Vantage • Summer use • Professional programs • Lifelong learning • Indirect cost of research • Land revenues • Fundraising

Key metrics
6
(1) Bachelor within 6 years, Vancouver only as Okanagan is too recent; (2) 2 and 5 years after graduation; (3) BC graduates working in positions related to their education; (4) Ratio of deferred maintenance ($578m) divided by the total value of the buildings; (5) 91% of funding for all projects comes from donors or project revenues; 97% of this funding is raised by Board 3; (6) Going-concern funding level; (7) Operating revenues outside of the Provincial grants as % of total revenues; (8) Financing costs/total revenues; (9) S&P, Moody’s
Teaching # applicants/seat 3.3 Average entry GPA 90% Graduation rate1 78% Employment 2/5 years2 93/96% Employment relevance3 84%
Assets Deferred maintenance4 16% Fundraising $213m External Capital $5 91% Endowment $1,129m Staff Pension Plan6 112%
Finance Operating deficit $0m Non-public revenues7 57% International tuition $105m External debt burden8 1.6% Credit rating9 AA+/Aa1
Research and Innovation Total research funding $519m Industry/NGO funding $170m Spin-off companies 160 Industry partnerships 1,100 Teams with e@UBC 80
6

Analyzing metrics
7
• From a teaching perspective, UBC is a leader in BC and in Canada: ⇒ Highest entry GPA in the country; only Canadian University to have
adopted broad-based admission across the board ⇒ Graduation rate in-line with peers1 and on a upward trajectory in the
Okanagan ⇒ High employment success and relevance
• UBC is BC’s research powerhouse and an innovation leader in Canada, but is at risk of losing momentum on research: ⇒ UBC accounts for 70% of the research in BC, is #1 in Canada for Tech
Licensing Revenue and generates a $10 billion economic impact in BC ⇒ However, federal support for research is tapering, Provincial support for
graduate students is strikingly less that comparable jurisdictions and UBC's world rankings are being affected
• UBC’s infrastructure continues to be a concern: ⇒ Financial assets well managed and relatively healthy (SPP2, endowment) ⇒ The elimination of Provincial funding for deferred maintenance continues to
be devastating (deferred maintenance above $500m, diversion of operating resources). Seismic risk presents a safety issue
1. UBC Vancouver 78% compared to U of T 71% and McGill 81%; attrition is party driven by mobility within the system
2. Staff Pension Plan 7
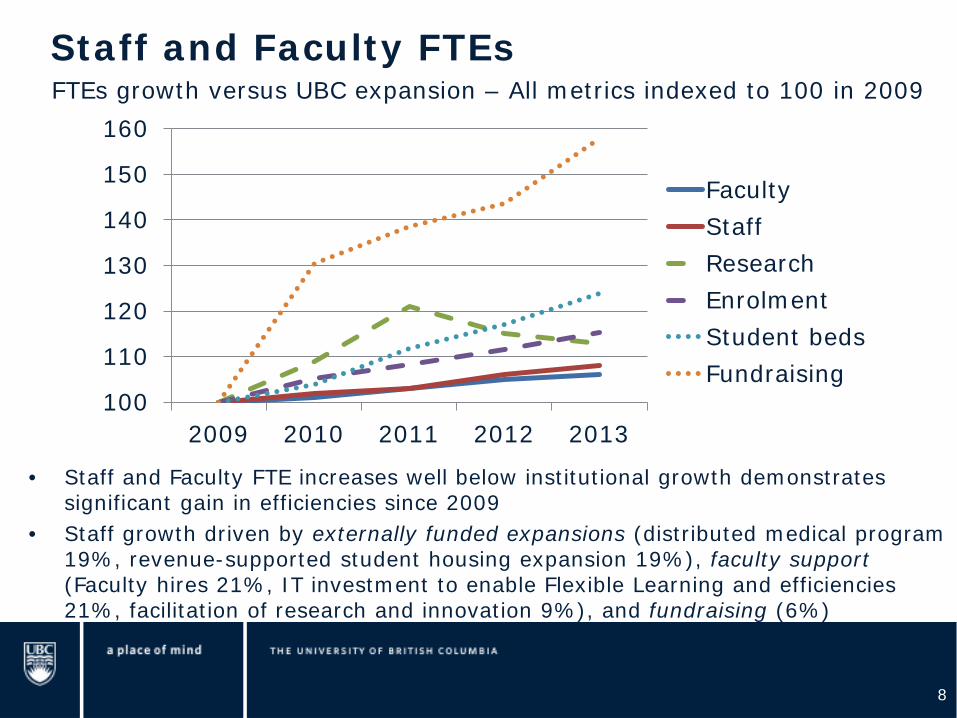
Staff and Faculty FTEs
8
FTEs growth versus UBC expansion – All metrics indexed to 100 in 2009
• Staff and Faculty FTE increases well below institutional growth demonstrates significant gain in efficiencies since 2009
• Staff growth driven by externally funded expansions (distributed medical program 19%, revenue-supported student housing expansion 19%), faculty support (Faculty hires 21%, IT investment to enable Flexible Learning and efficiencies 21%, facilitation of research and innovation 9%), and fundraising (6%)
100
110
120
130
140
150
160
2009 2010 2011 2012 2013
FacultyStaffResearchEnrolmentStudent bedsFundraising
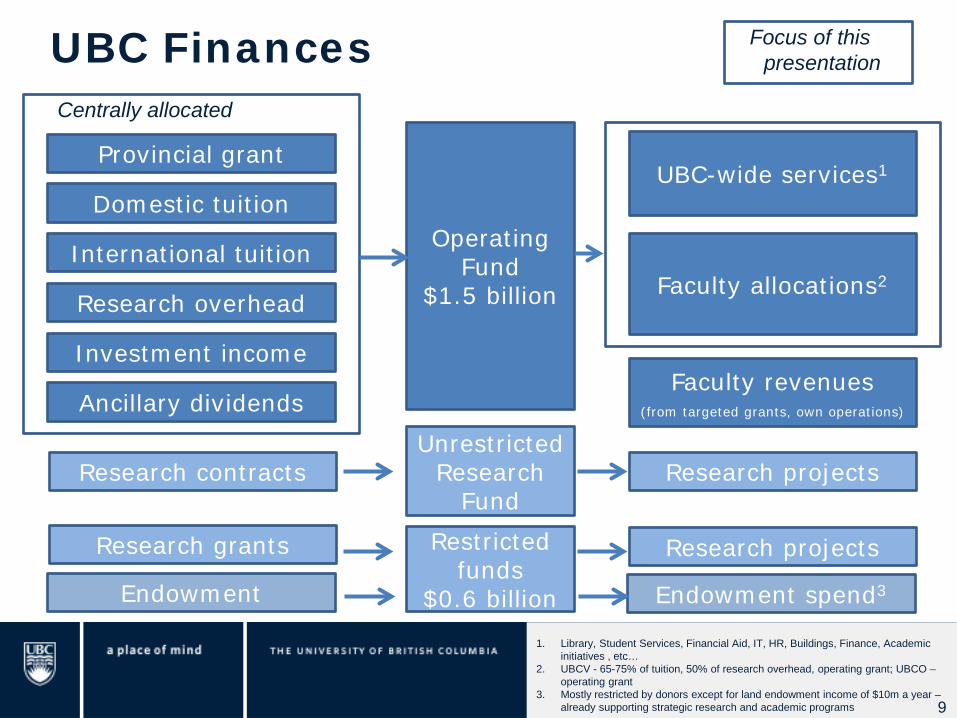
UBC Finances
9
Provincial grant
Domestic tuition
International tuition
Research overhead
Investment income
Endowment
Ancillary dividends
Operating Fund
$1.5 billion
Unrestricted Research
Fund Restricted
funds $0.6 billion
UBC-wide services1
Faculty allocations2
Research projects
Research projects
Centrally allocated
Faculty revenues (from targeted grants, own operations)
Research contracts
Research grants
Endowment spend3
Focus of this presentation
1. Library, Student Services, Financial Aid, IT, HR, Buildings, Finance, Academic initiatives , etc…
2. UBCV - 65-75% of tuition, 50% of research overhead, operating grant; UBCO – operating grant
3. Mostly restricted by donors except for land endowment income of $10m a year – already supporting strategic research and academic programs 9

Vancouver campus
10
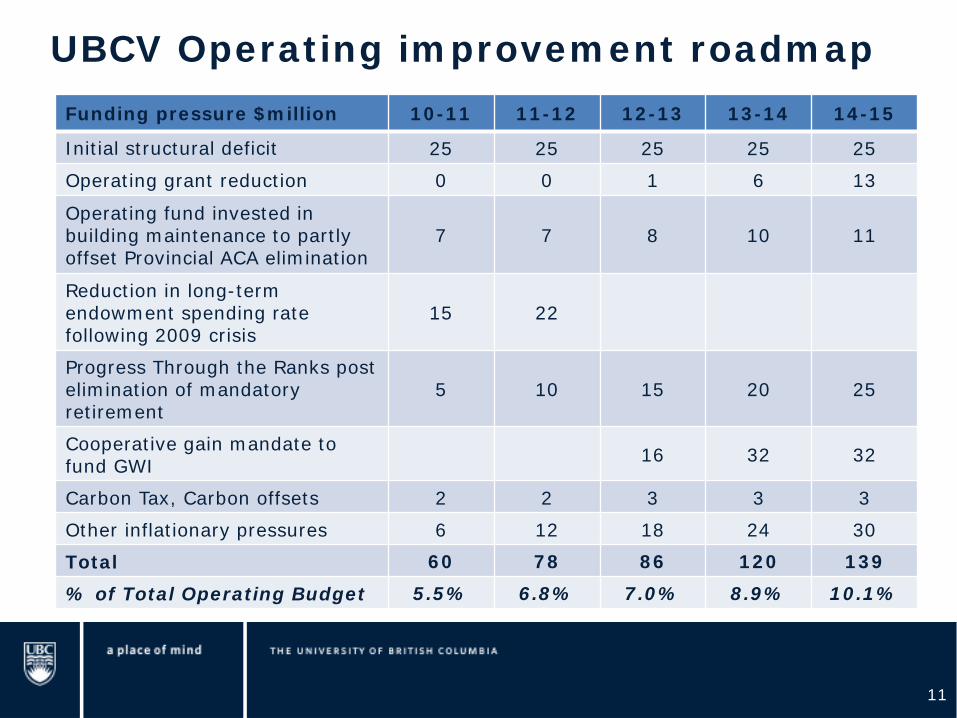
UBCV Operating improvement roadmap
11
Funding pressure $million 10-11 11-12 12-13 13-14 14-15
Initial structural deficit 25 25 25 25 25
Operating grant reduction 0 0 1 6 13
Operating fund invested in building maintenance to partly offset Provincial ACA elimination
7 7 8 10 11
Reduction in long-term endowment spending rate following 2009 crisis
15 22
Progress Through the Ranks post elimination of mandatory retirement
5 10 15 20 25
Cooperative gain mandate to fund GWI 16 32 32
Carbon Tax, Carbon offsets 2 2 3 3 3
Other inflationary pressures 6 12 18 24 30
Total 60 78 86 120 139
% of Total Operating Budget 5.5% 6.8% 7.0% 8.9% 10.1%

Summary
12
• UBC Vancouver central budget is balanced for the 5th year in a row ⇒ Revenues remain split 60-40 between Faculties and UBC-wide services ⇒ Faculty revenue growth is mostly spent on faculty salary increases, central
growth is mostly spent on infrastructure and facilities
• Faculties are projecting to spend down $27m of reserves ⇒ Most Faculties have plans to reduce costs and increase revenues to balance
budgets over time assuming that General Wage Increases are funded ⇒ Professional programs, particularly Law and Medicine, are challenged
• To maintain its standing, UBC must address 3 major funding shortfalls: ⇒ Infrastructure (need for Provincial support) and student services (need for
student engagement) ⇒ Professional programs, through pricing adjustments and targeted expansion ⇒ Research investments (federal approach and innovation strategy)
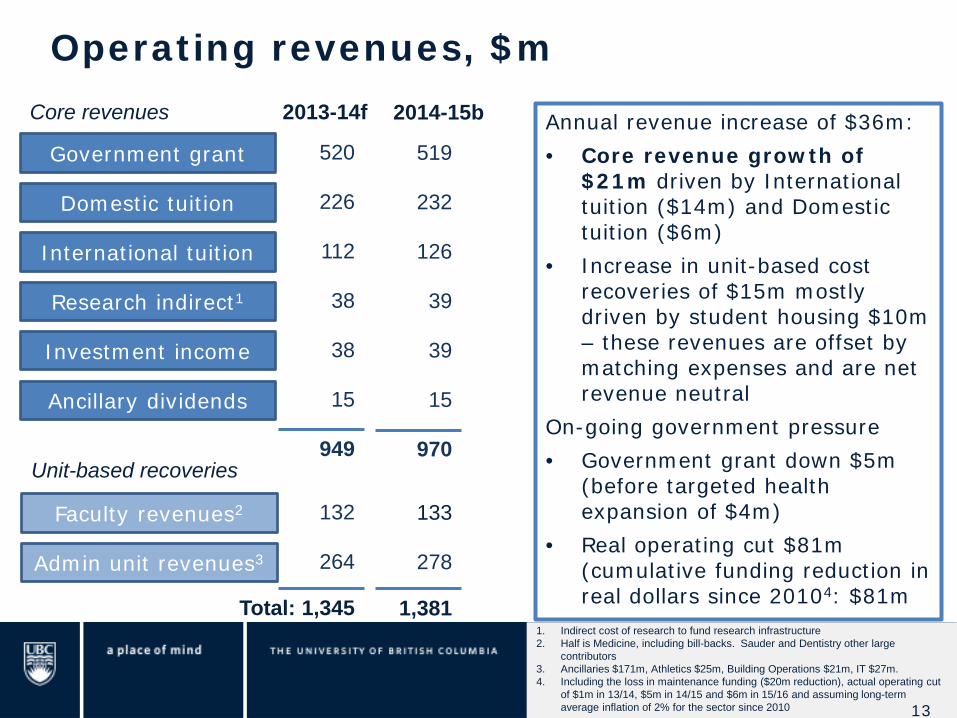
Operating revenues, $m
13
Annual revenue increase of $36m: • Core revenue growth of
$21m driven by International tuition ($14m) and Domestic tuition ($6m)
• Increase in unit-based cost recoveries of $15m mostly driven by student housing $10m – these revenues are offset by matching expenses and are net revenue neutral
On-going government pressure • Government grant down $5m
(before targeted health expansion of $4m)
• Real operating cut $81m (cumulative funding reduction in real dollars since 20104: $81m
Government grant
Domestic tuition
International tuition
Research indirect1
Investment income
Faculty revenues2
Ancillary dividends
132
Core revenues
Unit-based recoveries
Admin unit revenues3 264 Total: 1,345
520
226
38
112
38
15
949
2013-14f
133
278
1,381
519
232
39
126
39
15
970
2014-15b
1. Indirect cost of research to fund research infrastructure 2. Half is Medicine, including bill-backs. Sauder and Dentistry other large
contributors 3. Ancillaries $171m, Athletics $25m, Building Operations $21m, IT $27m. 4. Including the loss in maintenance funding ($20m reduction), actual operating cut
of $1m in 13/14, $5m in 14/15 and $6m in 15/16 and assuming long-term average inflation of 2% for the sector since 2010 13

Total recurring expenses up $34m: • $9m in Faculty salaries under
Faculties • $7m in maintenance costs, renewal
and utilities under Facilities • $10m in Student housing to cover
mortgages and operating costs of new beds2 under Student Services
Core recurring expense up $21m split between Faculties ($13m) and central services ($8m): • Faculty expense increase spent on
faculty salaries (GWI and PTR3) and teaching
• Central expense increase spent on learning support and infrastructure
Faculties continue to use reserves to absorb inflationary pressures – they will need to further cut expenses and drive revenues
Operating expenses, $m
14
Teaching, IT, Library
Research support
Student Services, Aid
Development, Alumni
Community, Industry
Faculties
Facilities
708 1,374
142
35
7
260
25
143
2013-14f
Administration 54
720 1,408
146
37
7
2721
25
150
51
2014-15b
Faculty draw-downs (29)
(27) 1,345 1,381
1. $272m budget is comprised of Student housing, Bookstore and other ancillary operations $196m, Student Services $19m and Student financial Aid $57m
2. Mostly covered by rental fees
3. General Wage Increases and Progress Through the Ranks 14

Faculty/Central split
15
0%10%20%30%40%50%60%70%
2011 2012 2013 2014 2015
Faculty share
Share of total revenue spent at the Faculty level:
• 58% of core revenues are allocated to the Faculties
• This ratio has been stable for 5 years
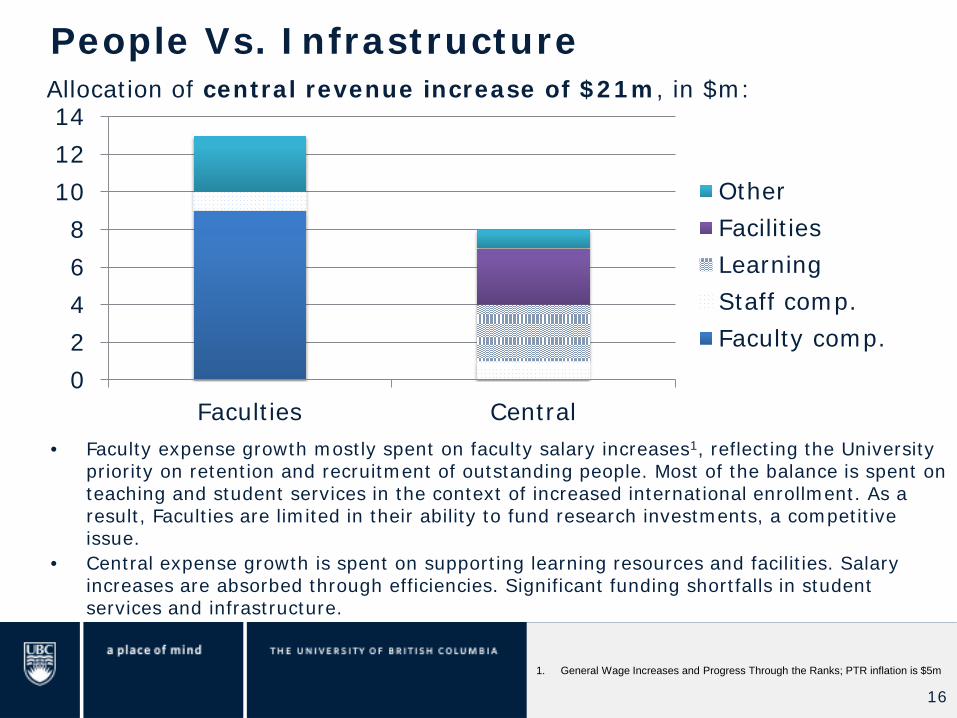
People Vs. Infrastructure
16
Allocation of central revenue increase of $21m, in $m:
• Faculty expense growth mostly spent on faculty salary increases1, reflecting the University priority on retention and recruitment of outstanding people. Most of the balance is spent on teaching and student services in the context of increased international enrollment. As a result, Faculties are limited in their ability to fund research investments, a competitive issue.
• Central expense growth is spent on supporting learning resources and facilities. Salary increases are absorbed through efficiencies. Significant funding shortfalls in student services and infrastructure.
02468
101214
Faculties Central
OtherFacilitiesLearningStaff comp.Faculty comp.
1. General Wage Increases and Progress Through the Ranks; PTR inflation is $5m
16

Key investments
17
Investment, $m Central Faculty Major items Faculty salaries1 9 GWI, PTR2
Staff salaries1 0.8 1 Central AAPS market adjustments
Faculty expenses 3 Infrastructure for increased enrolment
Learning – Student support
2.0 ISI Financial Aid $1m, Student admission and support, Athletics
Learning – Central 1.0 Library inflation, CTLT3
Learning – Faculties 1.5 Flexible Learning, VSE4, Faculty support
Learning – IT 1.6 Start of system renewal
Research/Innovation 1.2 UILO, International Offices
Community Engagement
0.3 Communication; (+$1.5m one-time seed funding for Faculty consulting)
Work environment 0.1 Sustainable assets 2.5 Maintenance, commodity costs
Total 8+3 13 $21m budget increase augmented by $3m use of contingencies
1. Salaries and benefits 2. General Wage Increases, Progress Through the Ranks 3. Centre for Teaching, Learning and Technology 4. Vancouver School of Economics 17

Rationale for investments
18
Investment allocation reflects Place & Promise priorities:
• First invest in people given the critical importance of retention and recruitment (particularly faculty) but in the context of overall financial restraint
• Major focus on Teaching Excellence
⇒ Flexible Learning initiative providing a leading edge experience to students (course redesign, multi-channel delivery, improved access): 37 courses already transformed positively impacting 11,000 students; 41 courses under way
⇒ Other investments in Learning Management systems and core student services
• Minimal investment in research infrastructure and international reach
• Reallocation of operating funding to support building maintenance given the on-going lack of Provincial funding
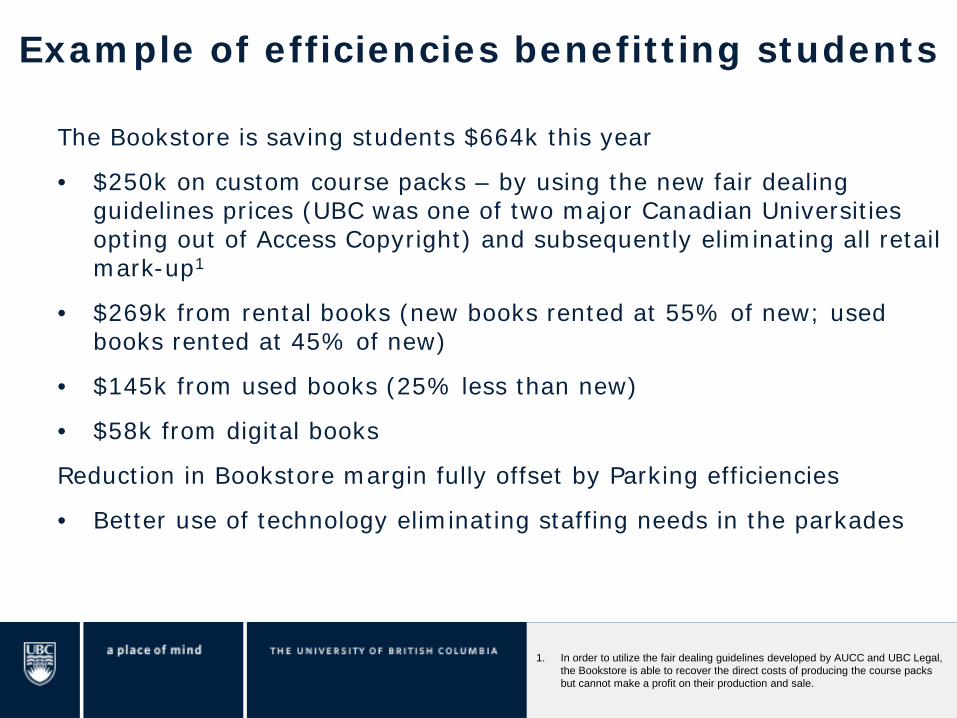
Example of efficiencies benefitting students
19
The Bookstore is saving students $664k this year
• $250k on custom course packs – by using the new fair dealing guidelines prices (UBC was one of two major Canadian Universities opting out of Access Copyright) and subsequently eliminating all retail mark-up1
• $269k from rental books (new books rented at 55% of new; used books rented at 45% of new)
• $145k from used books (25% less than new)
• $58k from digital books
Reduction in Bookstore margin fully offset by Parking efficiencies
• Better use of technology eliminating staffing needs in the parkades
1. In order to utilize the fair dealing guidelines developed by AUCC and UBC Legal, the Bookstore is able to recover the direct costs of producing the course packs but cannot make a profit on their production and sale.

Faculty budgets
20
Total deficit of $27m
⇒ Faculty reserves down from $172m to $145m
3 types of strategic evolutions:
• International growth and undergraduate transformation (Arts, Science, ApSci, LFS): rapid increase in international students; Flexible Learning to address bottlenecks and improve experience; program transformation (targeted expansions, dual degrees) Complex transition, financial stability over time if General Wage Increases are in line with Provincial mandate and are provincially funded
• Professional program diversification (Education, Sauder, Pharmacy, Dentistry, Forestry): opportunities to increase role in professional education Various levels of maturity and central support required
• Challenging funding models (Law, Medicine): insufficient opportunities for revenue diversification Need to work with government on tuition reset for Law and on a new operating model for Medicine that better integrates with the Health Authorities (Academic Health Center)
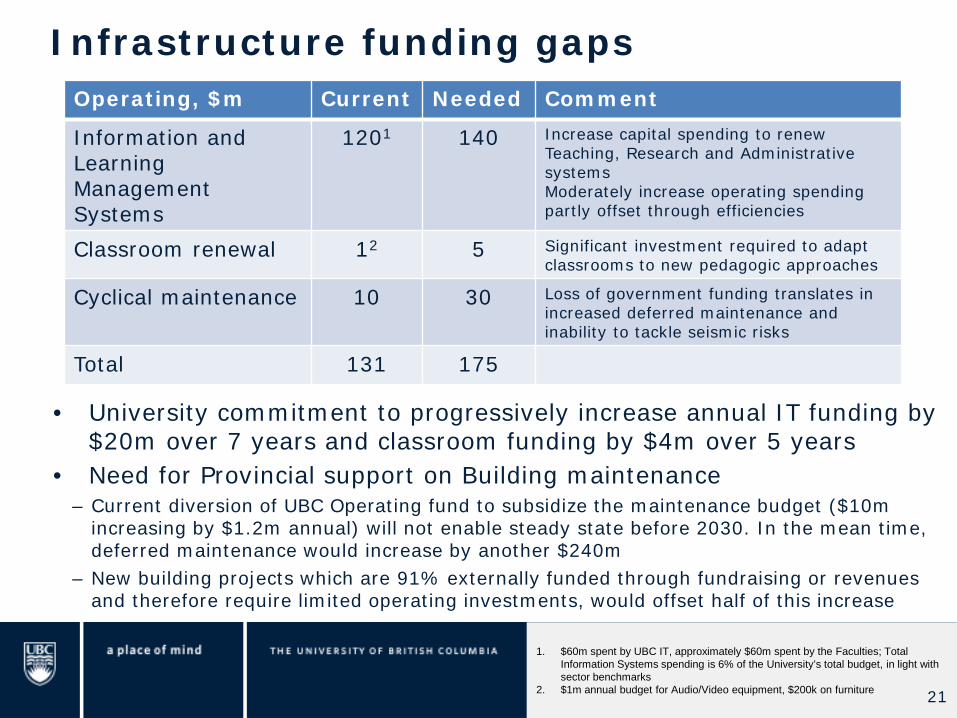
Infrastructure funding gaps
21
• University commitment to progressively increase annual IT funding by $20m over 7 years and classroom funding by $4m over 5 years
• Need for Provincial support on Building maintenance – Current diversion of UBC Operating fund to subsidize the maintenance budget ($10m
increasing by $1.2m annual) will not enable steady state before 2030. In the mean time, deferred maintenance would increase by another $240m
– New building projects which are 91% externally funded through fundraising or revenues and therefore require limited operating investments, would offset half of this increase
Operating, $m Current Needed Comment
Information and Learning Management Systems
1201 140 Increase capital spending to renew Teaching, Research and Administrative systems Moderately increase operating spending partly offset through efficiencies
Classroom renewal 12 5 Significant investment required to adapt classrooms to new pedagogic approaches
Cyclical maintenance 10 30 Loss of government funding translates in increased deferred maintenance and inability to tackle seismic risks
Total 131 175
1. $60m spent by UBC IT, approximately $60m spent by the Faculties; Total Information Systems spending is 6% of the University’s total budget, in light with sector benchmarks
2. $1m annual budget for Audio/Video equipment, $200k on furniture 21
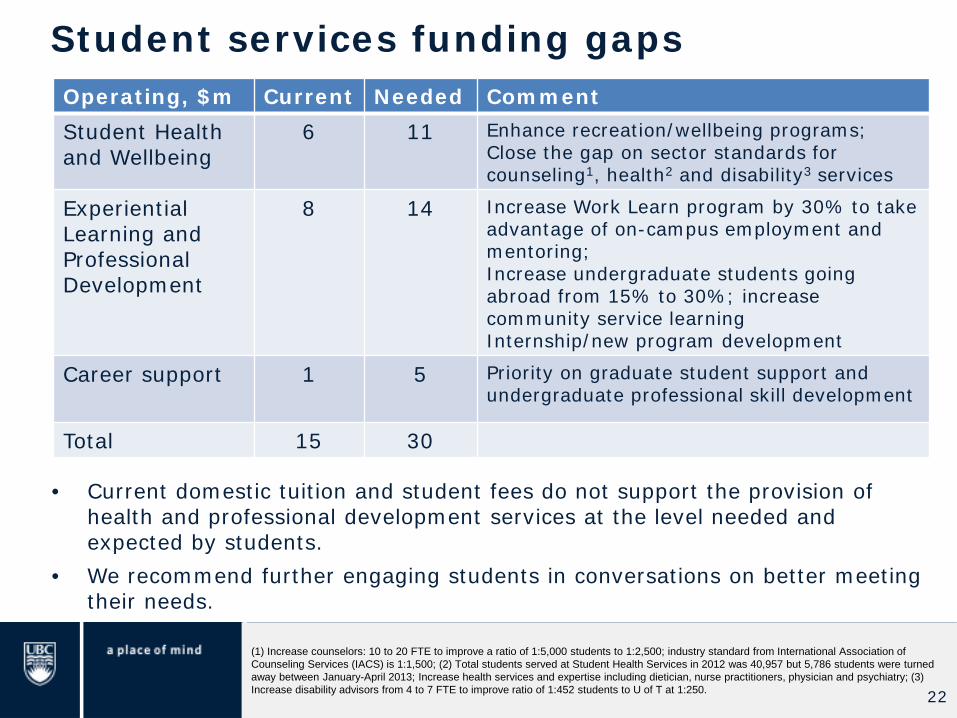
Student services funding gaps
22
• Current domestic tuition and student fees do not support the provision of health and professional development services at the level needed and expected by students.
• We recommend further engaging students in conversations on better meeting their needs.
Operating, $m Current Needed Comment Student Health and Wellbeing
6 11 Enhance recreation/wellbeing programs; Close the gap on sector standards for counseling1, health2 and disability3 services
Experiential Learning and Professional Development
8 14 Increase Work Learn program by 30% to take advantage of on-campus employment and mentoring; Increase undergraduate students going abroad from 15% to 30%; increase community service learning Internship/new program development
Career support 1 5 Priority on graduate student support and undergraduate professional skill development
Total 15 30
(1) Increase counselors: 10 to 20 FTE to improve a ratio of 1:5,000 students to 1:2,500; industry standard from International Association of Counseling Services (IACS) is 1:1,500; (2) Total students served at Student Health Services in 2012 was 40,957 but 5,786 students were turned away between January-April 2013; Increase health services and expertise including dietician, nurse practitioners, physician and psychiatry; (3) Increase disability advisors from 4 to 7 FTE to improve ratio of 1:452 students to U of T at 1:250. 22

Strategic support for Faculties
23
Revenues • International diversity. Increasing the geographic diversity of student pool is
critical. Both Vantage and enhanced International recruitment strategies are essential.
• International tuition. Opportunity to explore program specific tuition. • Targeted Tuition increases for Professional programs. Guiding principles
include ability to pay commensurate with future income, restructuring of Student Financial Aid to guarantee access, grand-fathering of current students. Example: Law JD
• Professional programs growth. Significant opportunities in Business, Engineering, Health and Education. Many departments require support – strategic (SDS) and business development (lacking today)
• Very targeted undergraduate expansion. Address bottlenecks and build excellence through scale. Example: Life Sciences
Costs • GWI. General Wage Increases must be entirely government funded • Faculty and staff attrition. Cost reduction measures are unavoidable in some
areas, particularly for Medicine and Law.

5 year outlook (vs 14/15 base)
24
Revenue diversification 14/15 15/16 16/17 17/18 18/19 19/20
Non-public revenues 56% 57% 59% 60% 61% 62%
Revenue growth $m
BC grant (6)
Domestic tuition 24
International tuition 154
Vantage dividend 10
Indirect costs of research 8
Land revenue (Trek) 13
Summer use profit 3
Investment income 10
Other1 1
Tuition risk (15)
Total 202
Investment needs $m
Faculty deficit (27)
Incremental teaching costs2 (61)
Student Financial Aid (7)
Faculty PTR3 (24)
Staff salaries4 (5)
Maintenance, seismic5 (27)
Flexible Learning (5)
IT, Classrooms (25)
Research (8)
Other6 (13)
Total (202)
1. Royalties, dividends 2. From increased enrolment, flowing to Faculties 3. Based on forecast retirements by PAIR 4. $0.7m p.a. for half of Merit Pay (15/16), AAPS market 14/15, Staff Pension Plan $1.8m 5. Includes $1.2m annual maintenance increase, operating costs of new buildings, utilities inflation, $3m seismic fund, $4m capital financing 6. Student Services, Healthy University, Innovation, Marketing; $6m contingency (3% of additional revenues) 24

Conclusions
25
• Stronger government support is essential – GWI funding – Flexibility (professional tuition and student fees in a small numbers of
critical areas, access to debt) – Infrastructure support (building maintenance, seismic upgrades)
• UBC must pursue its revenue diversification strategy – International enrollment supported by geographic diversity – Professional programs (from Masters to Certificates) supported by a
coherent organizational structure (under review)
• In the mean time, further cost reductions are unavoidable – This may include attrition in Faculty and staff position
• UBC’s long-term success depends on its ability to maintain/enhance excellence
– Ability to attract best international students depends on Learning Excellence (Flexible Learning) and on global Rankings
– This means continuous investment in Learning and stronger investment in key research areas – current funding is not sufficient to keep pace

Okanagan campus
26
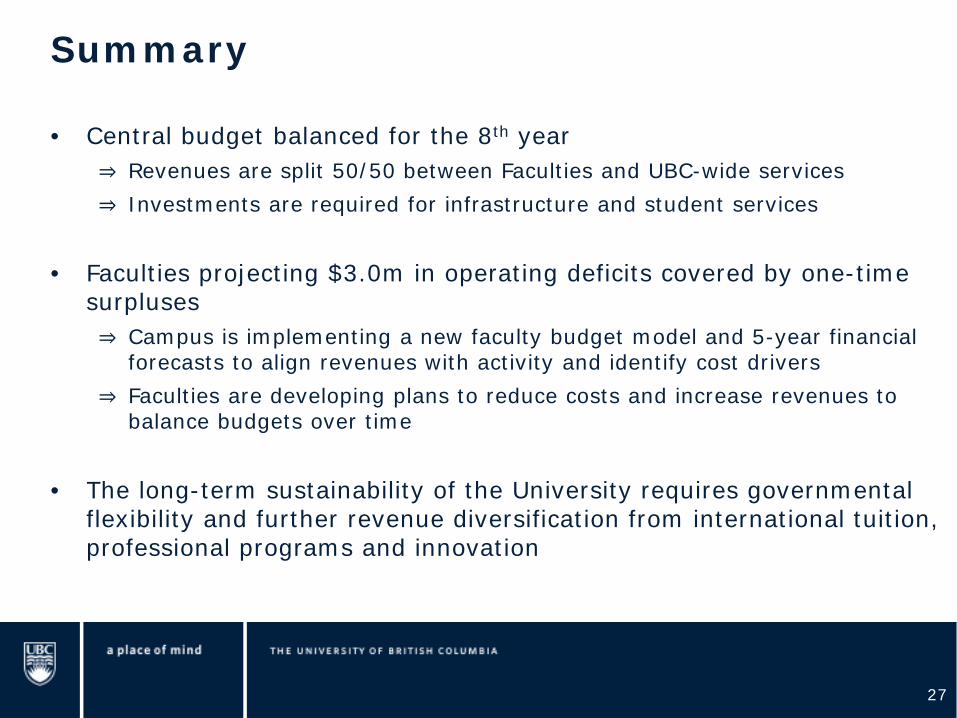
Summary
27
• Central budget balanced for the 8th year ⇒ Revenues are split 50/50 between Faculties and UBC-wide services ⇒ Investments are required for infrastructure and student services
• Faculties projecting $3.0m in operating deficits covered by one-time surpluses ⇒ Campus is implementing a new faculty budget model and 5-year financial
forecasts to align revenues with activity and identify cost drivers ⇒ Faculties are developing plans to reduce costs and increase revenues to
balance budgets over time
• The long-term sustainability of the University requires governmental flexibility and further revenue diversification from international tuition, professional programs and innovation
Operating revenues, $m
28
Annual revenue increase of $2.9m • Core revenue growth of $2.7m
driven by International tuition ($2.0m) and Domestic tuition ($0.8m)
On-going government pressure • Government grant down $0.6m
(before BSN program expansion of $0.4m)
• Real operating cut $9m (cumulative funding reduction in real dollars since 20104)
Government grant
Domestic tuition
International tuition
Research overhead
Investment income
Faculty revenues
Ancillary dividends
0.6
Core revenues
Unit-based recoveries
Admin unit revenues3 5.3 Total: 121.7
67.2
33.9
-
13.6
0.8
0.3
115.8
2013-14f1
0.7
5.4
124.6
66.9
34.7
-
15.6
0.9
0.4
118.5
2014-15b2
1. Forecast 2. Budget 3. Including Ancillaries $2m, and Athletics $2m. Excludes flow-through revenues for U-Pass. 4. Including the loss in maintenance funding ($740K reduction), actual operating cut of $0.2m in 13/14, in $0.7m in 14/15, $0.8m in 15/16 and
assuming long-term average inflation of 2% for the sector since 2010, 28

Operating expenses, $m
29
• Annual expense increase of
$5.3m mainly due to: – $1.9m in direct Faculty
investment and $2.4m Faculty reserves (incrementally over FY14)
– $0.7m for Research support – $0.3m increase in Facilities
• Research support increase of $0.7m mainly due to:
– $0.5m in innovation initiatives
– $0.2m for VPR position
1. Facilities includes Building Operations, Utilities, Security, Sustainability, Risk Management Services, Debt Servicing and Parking Services
2. Administration includes Deputy Vice-Chancellor’s Office, Finance, Human Resources and other administrative services 29
Teaching, IT, Library
Research support
Student Services, Aid
Alumni, Development
Community, Industry
Faculties
Facilities1
62.6 122.3
11.4
1.0
1.0
20.8
1.6
18.2
2013-14f
Administration2 5.7
67.3 127.6
11.5
1.7
1.0
20.7
1.6
18.5
5.5
2014-15b
Faculty reserve (0.6)
(3.0) 121.7 124.6

Key investments1
30
Investment, $m Central Faculty Major items Faculty salaries 1.9 Investments in innovation and
international, GWI
Staff salaries 0.1 Central AAPS market adjustments
Learning – Student support
0.7 ISI Financial Aid $300K, International student supports $200k, Athletics $200K
Learning – Central 0.2 Library $100K, IT $100K
Research 0.5 Innovation initiatives
Sustainable Assets 0.2 Maintenance
Total 1.7 1.9
1. All investments on a recurring basis and include reallocations of existing funds
30
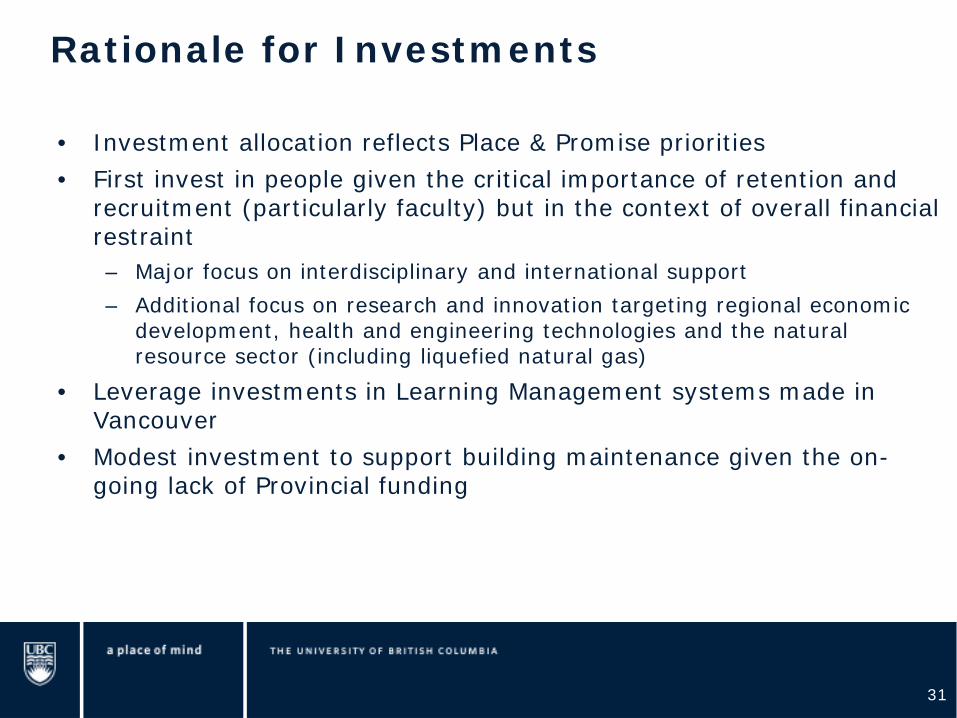
Rationale for Investments
31
• Investment allocation reflects Place & Promise priorities • First invest in people given the critical importance of retention and
recruitment (particularly faculty) but in the context of overall financial restraint
– Major focus on interdisciplinary and international support – Additional focus on research and innovation targeting regional economic
development, health and engineering technologies and the natural resource sector (including liquefied natural gas)
• Leverage investments in Learning Management systems made in Vancouver
• Modest investment to support building maintenance given the on-going lack of Provincial funding

5 year outlook (vs 14/15 base)
32
Revenue diversification 14/15 15/16 16/17 17/18 18/19 19/20
Non-public revenues 44% 46% 48% 50% 53% 56%
Revenue growth $m
BC grant (0.8)
Domestic tuition 3.5
International tuition 27.8
Other1 0.3
Tuition risk (7.0)
Total 23.8
Investment needs $m
Int’l Student Financial Aid (2.1)
Capital financing 2 (1.2)
Building op costs/utilities (1.8)
Salaries (13.1)
UBC Brand / Marketing (0.3)
International Strategy (7.5)
Innovation Strategy (0.7)
Total (26.7)
1. Includes ancillary dividends and endowment spending growth
2. Per capital plan net of housing revenues 32

Related Documents


![[오픈소스컨설팅]Amazon AWS snapshot 관리가이드 - 2014.02 기준](https://static.cupdf.com/doc/110x72/558bee4dd8b42a195c8b45cc/amazon-aws-snapshot-201402-.jpg)
