20th-century glacier recession and regional hydroclimatic changes in northwestern Patagonia Mariano H. Masiokas a,b, ⁎ , Ricardo Villalba a , Brian H. Luckman b , Marcelo E. Lascano a , Silvia Delgado a , Petr Stepanek c a Instituto Argentino de Nivología, Glaciología y Ciencias Ambientales (IANIGLA-CRICYT-CONICET), Mendoza, Argentina b Department of Geography, University of Western Ontario, London, Ontario, Canada c Czech Hydrometeorological Institute (CHMI), Regional Office Brno, Czech Republic Received in revised form 5 July 2006; accepted 5 July 2006 Available online 9 February 2007 Abstract This paper documents the occurrence of significant glacier and hydroclimatic changes in northwestern Patagonia during the past century. Drastic, widespread glacier recession is documented by repeat photography of some of the earliest glacier images from southern South America. Linear trends in regionally-averaged annual and seasonal temperature and precipitation records indicate significant warming and decreasing precipitation over the 1912–2002 interval. A climatic index is developed, based on winter precipitation and summer temperature records, that mimics glacier mass balance relationships and shows a strong negative trend which agrees with the drastic glacier recession shown by the photographic comparisons. Short positive periods of this climatic index broadly correspond with known evidence of glacier advances in the region. Regionally-averaged mean annual streamflow records east of the mountains were used in an independent verification check of the climatic series used in this study. This regional runoff record shows a strong negative trend, remarkable similarities with the climatic index, and highly significant positive (negative) correlations with the regional precipitation (temperature) series. This highlights the existence of a strong, regionally coherent hydroclimatic signal across this region and supports the utility of these records as environmental indicators for northwestern Patagonia between ca. 38° and 45°S. Given the significant socio-economic importance of rivers and glaciers in this area, further research is needed to evaluate the full range of natural hydroclimate variability and improve understanding of potential impacts of the future warmer and drier climates projected for this region. © 2007 Elsevier B.V. All rights reserved. Keywords: North Patagonian Andes; repeat photography; glacier recession; hydroclimatic variability 1. Introduction In many mountainous areas of the world glaciers are critical sources of fresh water that crucially contribute to the sustainability of socio-economic activities such as hydroelectric power generation, agriculture, and tourism (e.g. Coudrain et al., 2005). In such regions long, complete instrumental climate records are usually scarce. Glaciers can provide a longer term perspective for the study of climatic variations (e.g. Klok and Oerlemans, 2004), and are considered key indicators for the early detection of global climate changes (Oerlemans, 1994; Dyurgerov and Meier, 2000; Oerle- mans, 2001; Hoelzle et al., 2003; Oerlemans, 2005; Haeberli, 2005). Available online at www.sciencedirect.com Global and Planetary Change 60 (2008) 85 – 100 www.elsevier.com/locate/gloplacha ⁎ Corresponding author. Department of Geography, University of Western Ontario, London, Ontario, Canada, N6A 5C2. Tel.: +1 519 661 3423; fax: +1 519 661 3750. E-mail address: [email protected] (M.H. Masiokas). 0921-8181/$ - see front matter © 2007 Elsevier B.V. All rights reserved. doi:10.1016/j.gloplacha.2006.07.031

Welcome message from author
This document is posted to help you gain knowledge. Please leave a comment to let me know what you think about it! Share it to your friends and learn new things together.
Transcript
Available online at www.sciencedirect.com
ge 60 (2008) 85–100www.elsevier.com/locate/gloplacha
Global and Planetary Chan
20th-century glacier recession and regional hydroclimatic changesin northwestern Patagonia
Mariano H. Masiokas a,b,⁎, Ricardo Villalba a, Brian H. Luckman b, Marcelo E. Lascano a,Silvia Delgado a, Petr Stepanek c
a Instituto Argentino de Nivología, Glaciología y Ciencias Ambientales (IANIGLA-CRICYT-CONICET), Mendoza, Argentinab Department of Geography, University of Western Ontario, London, Ontario, Canadac Czech Hydrometeorological Institute (CHMI), Regional Office Brno, Czech Republic
Received in revised form 5 July 2006; accepted 5 July 2006Available online 9 February 2007
Abstract
This paper documents the occurrence of significant glacier and hydroclimatic changes in northwestern Patagonia during the pastcentury. Drastic, widespread glacier recession is documented by repeat photography of some of the earliest glacier images fromsouthern South America. Linear trends in regionally-averaged annual and seasonal temperature and precipitation records indicatesignificant warming and decreasing precipitation over the 1912–2002 interval. A climatic index is developed, based on winterprecipitation and summer temperature records, that mimics glacier mass balance relationships and shows a strong negative trendwhich agrees with the drastic glacier recession shown by the photographic comparisons. Short positive periods of this climatic indexbroadly correspondwith known evidence of glacier advances in the region. Regionally-averagedmean annual streamflow records east ofthemountains were used in an independent verification check of the climatic series used in this study. This regional runoff record shows astrong negative trend, remarkable similarities with the climatic index, and highly significant positive (negative) correlations with theregional precipitation (temperature) series. This highlights the existence of a strong, regionally coherent hydroclimatic signal across thisregion and supports the utility of these records as environmental indicators for northwestern Patagonia between ca. 38° and 45°S. Giventhe significant socio-economic importance of rivers and glaciers in this area, further research is needed to evaluate the full range of naturalhydroclimate variability and improve understanding of potential impacts of the future warmer and drier climates projected for this region.© 2007 Elsevier B.V. All rights reserved.
Keywords: North Patagonian Andes; repeat photography; glacier recession; hydroclimatic variability
1. Introduction
In many mountainous areas of the world glaciers arecritical sources of fresh water that crucially contributeto the sustainability of socio-economic activities such
⁎ Corresponding author. Department of Geography, University ofWestern Ontario, London, Ontario, Canada, N6A 5C2. Tel.: +1 519661 3423; fax: +1 519 661 3750.
E-mail address: [email protected] (M.H. Masiokas).
0921-8181/$ - see front matter © 2007 Elsevier B.V. All rights reserved.doi:10.1016/j.gloplacha.2006.07.031
as hydroelectric power generation, agriculture, andtourism (e.g. Coudrain et al., 2005). In such regionslong, complete instrumental climate records are usuallyscarce. Glaciers can provide a longer term perspectivefor the study of climatic variations (e.g. Klok andOerlemans, 2004), and are considered key indicatorsfor the early detection of global climate changes(Oerlemans, 1994; Dyurgerov and Meier, 2000; Oerle-mans, 2001; Hoelzle et al., 2003; Oerlemans, 2005;Haeberli, 2005).
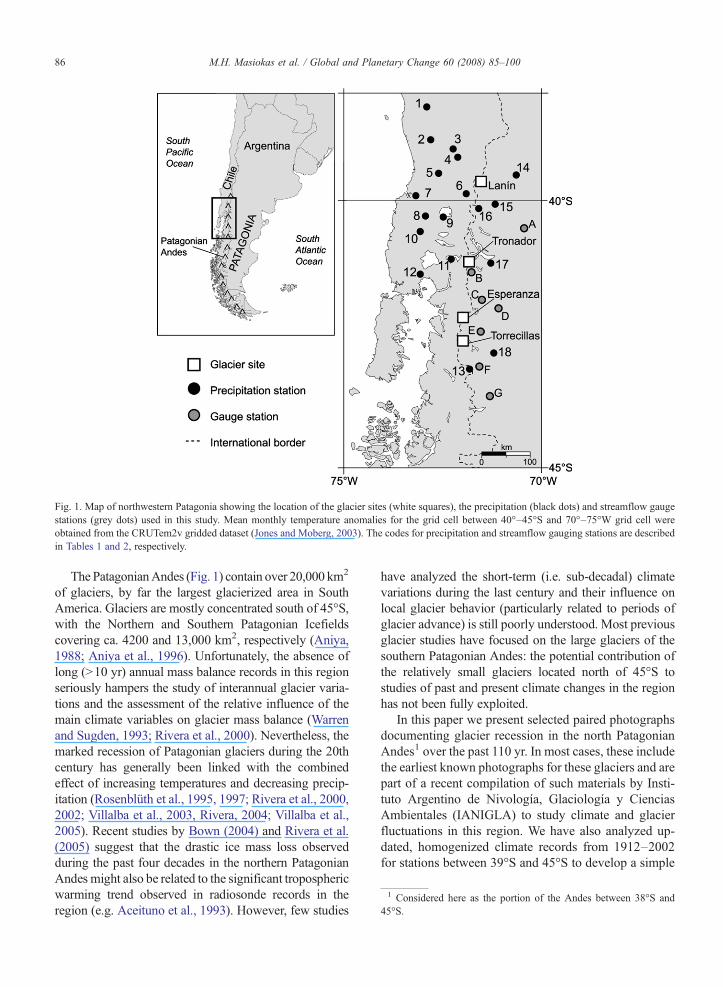
Fig. 1. Map of northwestern Patagonia showing the location of the glacier sites (white squares), the precipitation (black dots) and streamflow gaugestations (grey dots) used in this study. Mean monthly temperature anomalies for the grid cell between 40°–45°S and 70°–75°W grid cell wereobtained from the CRUTem2v gridded dataset (Jones and Moberg, 2003). The codes for precipitation and streamflow gauging stations are describedin Tables 1 and 2, respectively.
1 Considered here as the portion of the Andes between 38°S and45°S.
86 M.H. Masiokas et al. / Global and Planetary Change 60 (2008) 85–100
The PatagonianAndes (Fig. 1) contain over 20,000 km2
of glaciers, by far the largest glacierized area in SouthAmerica. Glaciers are mostly concentrated south of 45°S,with the Northern and Southern Patagonian Icefieldscovering ca. 4200 and 13,000 km2, respectively (Aniya,1988; Aniya et al., 1996). Unfortunately, the absence oflong (N10 yr) annual mass balance records in this regionseriously hampers the study of interannual glacier varia-tions and the assessment of the relative influence of themain climate variables on glacier mass balance (Warrenand Sugden, 1993; Rivera et al., 2000). Nevertheless, themarked recession of Patagonian glaciers during the 20thcentury has generally been linked with the combinedeffect of increasing temperatures and decreasing precip-itation (Rosenblüth et al., 1995, 1997; Rivera et al., 2000,2002; Villalba et al., 2003, Rivera, 2004; Villalba et al.,2005). Recent studies by Bown (2004) and Rivera et al.(2005) suggest that the drastic ice mass loss observedduring the past four decades in the northern PatagonianAndes might also be related to the significant troposphericwarming trend observed in radiosonde records in theregion (e.g. Aceituno et al., 1993). However, few studies
have analyzed the short-term (i.e. sub-decadal) climatevariations during the last century and their influence onlocal glacier behavior (particularly related to periods ofglacier advance) is still poorly understood. Most previousglacier studies have focused on the large glaciers of thesouthern Patagonian Andes: the potential contribution ofthe relatively small glaciers located north of 45°S tostudies of past and present climate changes in the regionhas not been fully exploited.
In this paper we present selected paired photographsdocumenting glacier recession in the north PatagonianAndes1 over the past 110 yr. In most cases, these includethe earliest known photographs for these glaciers and arepart of a recent compilation of such materials by Insti-tuto Argentino de Nivología, Glaciología y CienciasAmbientales (IANIGLA) to study climate and glacierfluctuations in this region. We have also analyzed up-dated, homogenized climate records from 1912–2002for stations between 39°S and 45°S to develop a simple
87M.H. Masiokas et al. / Global and Planetary Change 60 (2008) 85–100
climatic index or “mass balance proxy” based on April–September (long winter) precipitation and October–March (long summer) temperature series. Given the lackof mass balance records for this region, this index pro-vides a rough measure of the relative magnitude of theaccumulation and ablation seasons in any given year.Comparison of available glacier history with decadal-scale variations in this climatic index provides insightinto the causes of glacier fluctuations in this regionduring the 20th century. The reliability of the regionalclimatic series developed in this study was also assessedby comparison with independently measured stream-flow records from rivers east of the Andes. As riverdischarge is mainly fed by winter precipitation, closeagreement between these variables provides mutualverification of the quality of these records.
2. Study area
The north Patagonian Andes (Fig. 1) form an effectivetopographic barrier to the westerly air masses thatdominate circulation in this region, resulting in steepprecipitation gradients across the mountain range. At ca.40°–41°S, themain cordillera experiences over 4000mmprecipitation per year (Prohaska, 1976) whereas the xericPatagonian steppe, less than 100 km east of the Andes,receives less than 200 mm/yr (Veblen and Lorenz, 1988;Villalba et al., 2003). Mean annual temperatures varyfrom ca. 11 °C at the Chilean coast to ca. 8 °C at theforest–steppe limit in Argentina (Prohaska, 1976; Miller,1976). Although absolute minimum temperatures in thisregion can fall below −15 °C, mean temperatures for thecoldest month (July) vary between 4°–8 °C in Chile and2°–4 °C in Argentina. Mean temperatures for the warm-est month (January) range from 14° to 18 °C in bothregions (Prohaska, 1976). These mild environmentalconditions and the lower elevations of the northPatagonian Andes limit the glacierized area to relativelysmall glaciers on the highest peaks and volcanoes alongthe mountain range (Lliboutry, 1998).
Twentieth-century glacier changes in the north Pata-gonian Andes have been studied using aerial photo-graphs, satellite imagery, historical documents, tree-ringrecords and fieldmeasurements (e.g. Rabassa et al., 1978;Villalba et al., 1990; Rivera et al., 2002; Bown, 2004;Rivera et al., 2005). However, and in contrast to the southPatagonian Andes (i.e. south of 45°S), few preliminaryglacier inventories are available for this area. Lliboutry(1998) estimated that glaciers covered approximately300 km2 between 35°S and 45°S and occurred mainlywest of the continental divide. The relatively small size ofglaciers in this area makes them particularly sensitive to
synoptic changes in climate (Oerlemans and Fortuin,1992), and thereby valuable sources of information forthe study of hydroclimatic variations in this region.
Rivers originating in the north Patagonian Andeshave a huge socio-economic importance at regional andnational scales as sources of fresh water for domesticconsumption, irrigation, industries, hydroelectric gener-ation, and recreational activities. For example, 51.8% ofArgentina's total hydroelectric generation in 2003 wasbased on the rivers flowing from the north PatagonianAndes (Secretaría de Energía, 2004). On the Chileanside, the multi-million dollar salmon farming industryclosely depends on fresh water volumes from the moun-tains to regulate the salinity and oxygen of the estuarineenvironments where the farming structures are located(Lara et al., 2005). No data are available that documentthe direct contribution of glacier melt to streamflow forthese rivers. However, given the relatively small numberand volume of glaciers in this area, this contribution islikely to be relatively small compared with snowmeltexcept for headwater reaches of rivers fed directly byglaciers. Fortunately a remarkably good database ofmean monthly discharges exists for most of the riverseast of the Andes. In some cases the available recordsextend for almost 90 yr with few missing months and aresome of the longest, most complete runoff records inSouth America. Of particular relevance for the purposesof this study, these records can be used as an indepen-dent check to verify the reliability of the limited climaticinformation available for this area.
3. Data and methods
3.1. Repeat ground photography
Historical records represent a valuable tool to studyglacier fluctuations because they can provide preciseinformation about past glacier volumes and frontalpositions (e.g. Zumbühl and Holzhauser, 1988). Pairedwith recent photographs, these historical documents canalso be used to show, in a simple yet powerful way,the impacts of recent climate changes on these re-mote, climate-sensitive environments (Hamilton, 1965;Rogers et al., 1984). The beauty and remoteness of thePatagonian Andes have attracted explorers, climbersand researchers since the beginning of the 20th century,and a relatively good collection of historical documentsexists for some specific areas (e.g. Kölliker et al., 1917;De Agostini, 1945). Many publications contain maps,site descriptions and terrestrial photographs that can beused to establish the former position of the glaciers. Forexample, the detailed 1856 drawing of the Frías valley
88 M.H. Masiokas et al. / Global and Planetary Change 60 (2008) 85–100
and Mount Tronador (Fonck and Hess, 1857), and apicture of Frías Glacier taken by De Agostini in the1930s were used by Villalba et al. (1990) to complementtheir tree-ring based chronology of ice front positions atthis site.
Until recently these valuable documents have not beenanalyzed or compiled into an accessible regional databasethat could facilitate glaciological and environmentalstudies in Patagonia. In the late 1990s, IANIGLA beganto collect available scientific and non-scientific biblio-graphic materials concerning Patagonian environments
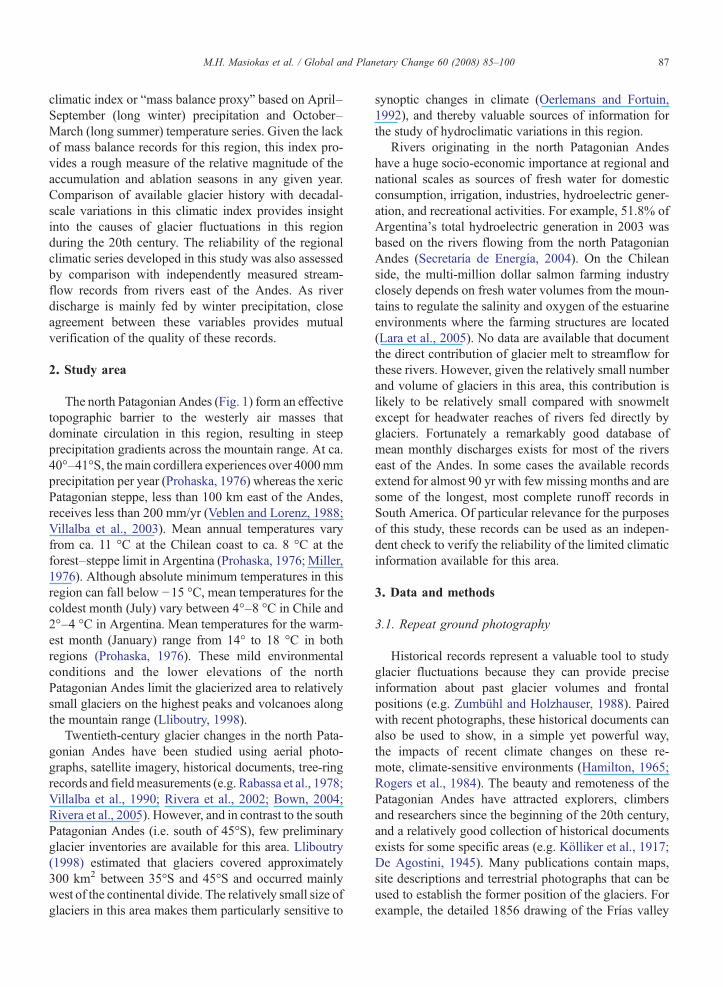
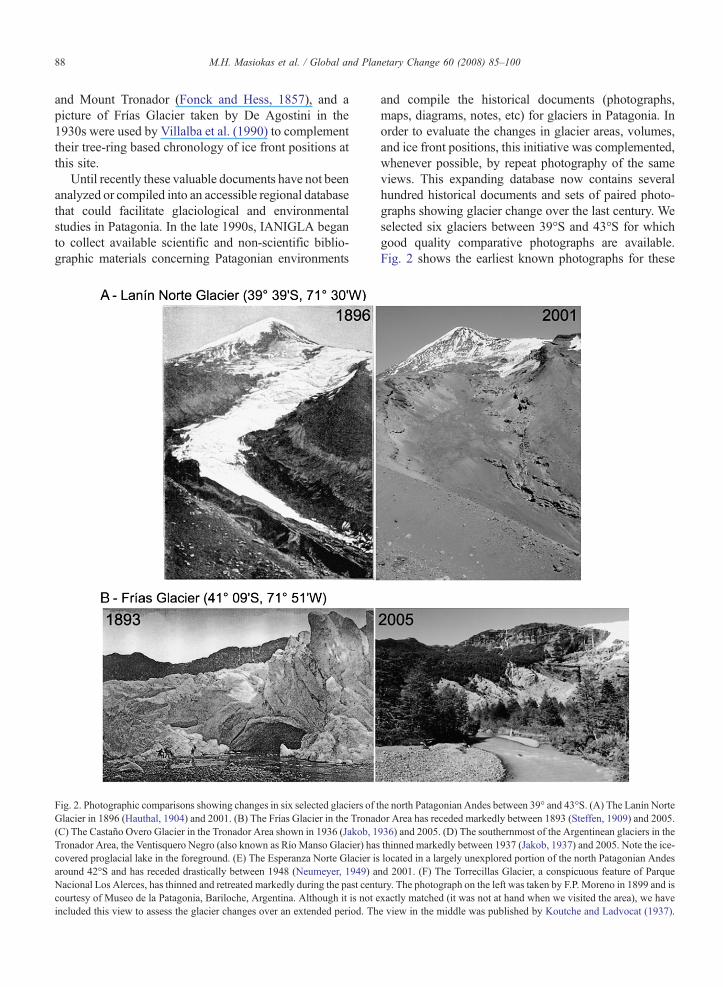
Fig. 2. Photographic comparisons showing changes in six selected glaciers of tGlacier in 1896 (Hauthal, 1904) and 2001. (B) The Frías Glacier in the Tronad(C) The Castaño Overo Glacier in the Tronador Area shown in 1936 (Jakob, 1Tronador Area, the Ventisquero Negro (also known as Río Manso Glacier) hascovered proglacial lake in the foreground. (E) The Esperanza Norte Glacier isaround 42°S and has receded drastically between 1948 (Neumeyer, 1949) aNacional Los Alerces, has thinned and retreated markedly during the past centcourtesy of Museo de la Patagonia, Bariloche, Argentina. Although it is not eincluded this view to assess the glacier changes over an extended period. Th
and compile the historical documents (photographs,maps, diagrams, notes, etc) for glaciers in Patagonia. Inorder to evaluate the changes in glacier areas, volumes,and ice front positions, this initiative was complemented,whenever possible, by repeat photography of the sameviews. This expanding database now contains severalhundred historical documents and sets of paired photo-graphs showing glacier change over the last century. Weselected six glaciers between 39°S and 43°S for whichgood quality comparative photographs are available.Fig. 2 shows the earliest known photographs for these
he north Patagonian Andes between 39° and 43°S. (A) The Lanín Norteor Area has receded markedly between 1893 (Steffen, 1909) and 2005.936) and 2005. (D) The southernmost of the Argentinean glaciers in thethinned markedly between 1937 (Jakob, 1937) and 2005. Note the ice-located in a largely unexplored portion of the north Patagonian Andesnd 2001. (F) The Torrecillas Glacier, a conspicuous feature of Parqueury. The photograph on the left was taken by F.P. Moreno in 1899 and isxactly matched (it was not at hand when we visited the area), we havee view in the middle was published by Koutche and Ladvocat (1937).
Fig. 2 (continued ).
89M.H. Masiokas et al. / Global and Planetary Change 60 (2008) 85–100
glaciers and includes some of the earliest documentedglacier positions in Patagonia.
3.2. Climate records
The poor quality of climatic data and the inadequatespatial distribution of meteorological stations in Patagonia
limit the characterization of climatic variability of thisregion (Rosenblüth et al., 1997). Furthermore, it is verydifficult and often impossible to obtain the stationmetadata (data about the stations’ histories) to evaluatepossible non-climatic variation or inhomogeneities in therecords. We have compiled climate data from severalsources to obtain a relatively complete, updated climatic
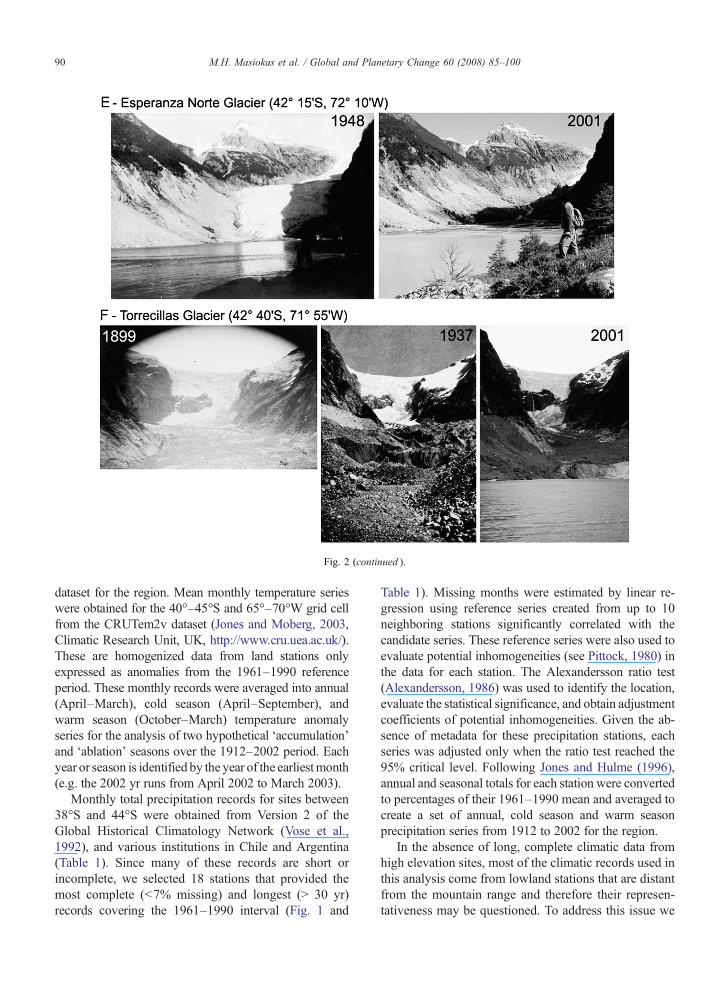
Fig. 2 (continued ).
90 M.H. Masiokas et al. / Global and Planetary Change 60 (2008) 85–100
dataset for the region. Mean monthly temperature serieswere obtained for the 40°–45°S and 65°–70°W grid cellfrom the CRUTem2v dataset (Jones and Moberg, 2003,Climatic Research Unit, UK, http://www.cru.uea.ac.uk/).These are homogenized data from land stations onlyexpressed as anomalies from the 1961–1990 referenceperiod. These monthly records were averaged into annual(April–March), cold season (April–September), andwarm season (October–March) temperature anomalyseries for the analysis of two hypothetical ‘accumulation’and ‘ablation’ seasons over the 1912–2002 period. Eachyear or season is identified by the year of the earliestmonth(e.g. the 2002 yr runs from April 2002 to March 2003).
Monthly total precipitation records for sites between38°S and 44°S were obtained from Version 2 of theGlobal Historical Climatology Network (Vose et al.,1992), and various institutions in Chile and Argentina(Table 1). Since many of these records are short orincomplete, we selected 18 stations that provided themost complete (b7% missing) and longest (N 30 yr)records covering the 1961–1990 interval (Fig. 1 and
Table 1). Missing months were estimated by linear re-gression using reference series created from up to 10neighboring stations significantly correlated with thecandidate series. These reference series were also used toevaluate potential inhomogeneities (see Pittock, 1980) inthe data for each station. The Alexandersson ratio test(Alexandersson, 1986) was used to identify the location,evaluate the statistical significance, and obtain adjustmentcoefficients of potential inhomogeneities. Given the ab-sence of metadata for these precipitation stations, eachseries was adjusted only when the ratio test reached the95% critical level. Following Jones and Hulme (1996),annual and seasonal totals for each station were convertedto percentages of their 1961–1990 mean and averaged tocreate a set of annual, cold season and warm seasonprecipitation series from 1912 to 2002 for the region.
In the absence of long, complete climatic data fromhigh elevation sites, most of the climatic records used inthis analysis come from lowland stations that are distantfrom the mountain range and therefore their represen-tativeness may be questioned. To address this issue we
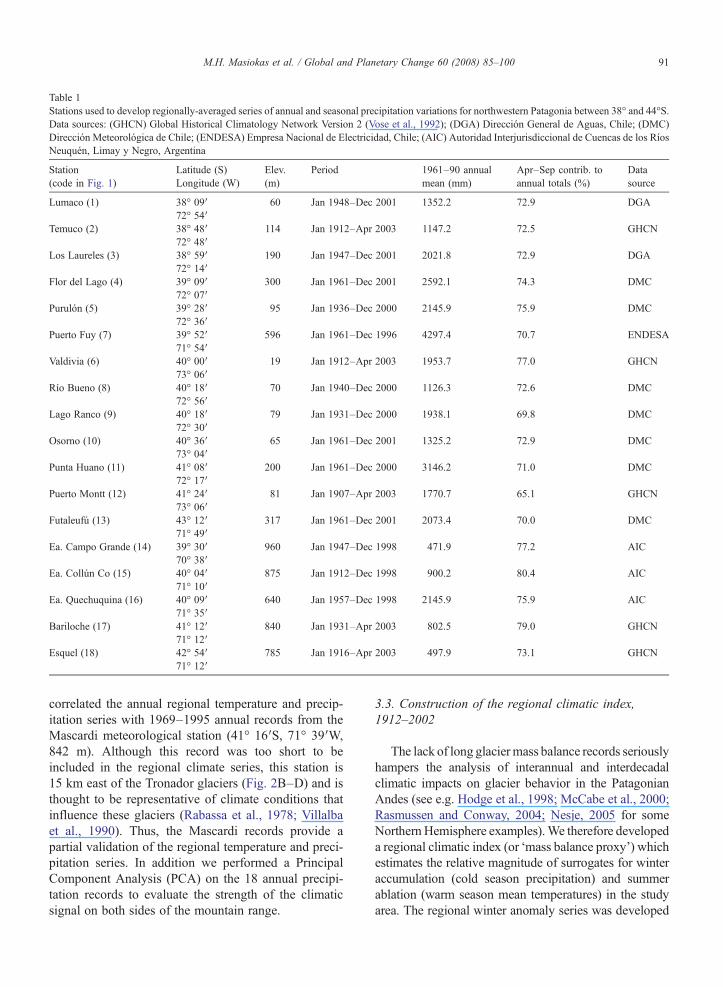
Table 1Stations used to develop regionally-averaged series of annual and seasonal precipitation variations for northwestern Patagonia between 38° and 44°S.Data sources: (GHCN) Global Historical Climatology Network Version 2 (Vose et al., 1992); (DGA) Dirección General de Aguas, Chile; (DMC)Dirección Meteorológica de Chile; (ENDESA) Empresa Nacional de Electricidad, Chile; (AIC) Autoridad Interjurisdiccional de Cuencas de los RíosNeuquén, Limay y Negro, Argentina
Station(code in Fig. 1)
Latitude (S)Longitude (W)
Elev.(m)
Period 1961–90 annualmean (mm)
Apr–Sep contrib. toannual totals (%)
Datasource
Lumaco (1) 38° 09′ 60 Jan 1948–Dec 2001 1352.2 72.9 DGA72° 54′
Temuco (2) 38° 48′ 114 Jan 1912–Apr 2003 1147.2 72.5 GHCN72° 48′
Los Laureles (3) 38° 59′ 190 Jan 1947–Dec 2001 2021.8 72.9 DGA72° 14′
Flor del Lago (4) 39° 09′ 300 Jan 1961–Dec 2001 2592.1 74.3 DMC72° 07′
Purulón (5) 39° 28′ 95 Jan 1936–Dec 2000 2145.9 75.9 DMC72° 36′
Puerto Fuy (7) 39° 52′ 596 Jan 1961–Dec 1996 4297.4 70.7 ENDESA71° 54′
Valdivia (6) 40° 00′ 19 Jan 1912–Apr 2003 1953.7 77.0 GHCN73° 06′
Río Bueno (8) 40° 18′ 70 Jan 1940–Dec 2000 1126.3 72.6 DMC72° 56′
Lago Ranco (9) 40° 18′ 79 Jan 1931–Dec 2000 1938.1 69.8 DMC72° 30′
Osorno (10) 40° 36′ 65 Jan 1961–Dec 2001 1325.2 72.9 DMC73° 04′
Punta Huano (11) 41° 08′ 200 Jan 1961–Dec 2000 3146.2 71.0 DMC72° 17′
Puerto Montt (12) 41° 24′ 81 Jan 1907–Apr 2003 1770.7 65.1 GHCN73° 06′
Futaleufú (13) 43° 12′ 317 Jan 1961–Dec 2001 2073.4 70.0 DMC71° 49′
Ea. Campo Grande (14) 39° 30′ 960 Jan 1947–Dec 1998 471.9 77.2 AIC70° 38′
Ea. Collún Co (15) 40° 04′ 875 Jan 1912–Dec 1998 900.2 80.4 AIC71° 10′
Ea. Quechuquina (16) 40° 09′ 640 Jan 1957–Dec 1998 2145.9 75.9 AIC71° 35′
Bariloche (17) 41° 12′ 840 Jan 1931–Apr 2003 802.5 79.0 GHCN71° 12′
Esquel (18) 42° 54′ 785 Jan 1916–Apr 2003 497.9 73.1 GHCN71° 12′
91M.H. Masiokas et al. / Global and Planetary Change 60 (2008) 85–100
correlated the annual regional temperature and precip-itation series with 1969–1995 annual records from theMascardi meteorological station (41° 16′S, 71° 39′W,842 m). Although this record was too short to beincluded in the regional climate series, this station is15 km east of the Tronador glaciers (Fig. 2B–D) and isthought to be representative of climate conditions thatinfluence these glaciers (Rabassa et al., 1978; Villalbaet al., 1990). Thus, the Mascardi records provide apartial validation of the regional temperature and preci-pitation series. In addition we performed a PrincipalComponent Analysis (PCA) on the 18 annual precipi-tation records to evaluate the strength of the climaticsignal on both sides of the mountain range.
3.3. Construction of the regional climatic index,1912–2002
The lack of long glaciermass balance records seriouslyhampers the analysis of interannual and interdecadalclimatic impacts on glacier behavior in the PatagonianAndes (see e.g. Hodge et al., 1998; McCabe et al., 2000;Rasmussen and Conway, 2004; Nesje, 2005 for someNorthern Hemisphere examples).We therefore developeda regional climatic index (or ‘mass balance proxy’) whichestimates the relative magnitude of surrogates for winteraccumulation (cold season precipitation) and summerablation (warm season mean temperatures) in the studyarea. The regional winter anomaly series was developed
92 M.H. Masiokas et al. / Global and Planetary Change 60 (2008) 85–100
by averaging anomalies (Z scores) of the April–Sep-tember precipitation totals from the individual stations,each standardized to the 1961–1990mean. The October–March gridded temperature records were also convertedto Z scores. The climatic index was developed by sub-tracting the temperature anomalies from the precipitationanomalies such that relatively wet winters and coolsummers result in positive indices (overall ‘positive’massbalance conditions in the region), and vice versa. In yearswhen heavy winter precipitation was followed by warmsummers the climatic index is close to zero.2 In develop-ing these proxies the choice of specific months and lengthof season is somewhat arbitrary and only intended toprovide a simple yet reasonable surrogate for the relativeimportance of accumulation vs. ablation in any givenyear. It is not known for example whether precipitation ortemperature variability is the more significant driver ofmass balance variations in this region: obviously, as ad-ditional north Patagonian glacier mass balance data be-come available (e.g. Rivera et al., 2005), more realisticselection and weighting for these proxies can be devel-oped. We compared the smoothed, low-frequency (i.e.decadal or longer) variations in the regional climatic indexwith the periods of glacier advances that have beenreported for this region during the 20th century (suchdata are only available for the Tronador Area at around41°10′S, Fig. 1). Although preliminary and largelyqualitative, this exercise provided the first assessment ofthe potential influence of decadal climate variations onglacier behavior in northwestern Patagonia. Given thesmall size of these glaciers (7–19 km2; Rabassa et al.,1978) we expect them to have a relatively short responsetime to climate fluctuations (Johannesson et al., 1989).However, the possible influence of non-climatic, site-specific factors (such as bed topography, debris cover, etc)at individual glaciers, coupled with the small sample sizeand inherent limitations in dating glacier deposits (Porter,1981) suggest such comparisons should be interpretedcautiously.
3.4. Relationship between regional streamflow recordsand climate
The northwestern Patagonian climate usually has drysummers and wet winters: 65–80% of annual precipi-tation falls between April and September (Table 1).Therefore the climatic index described above may also
2 However, in the absence of mass balance data, the climatic indexshould be interpreted cautiously. The mean climate index over the 1961–1990 period is simply a reference level and does not imply a zero netbalance.
be used as a measure of the balance between wintermoisture input and summer evapotranspiration in agiven basin. In addition, and given the relatively smallglacierized area in the north Patagonian Andes, varia-tions in this index should be strongly related to thedischarge of local rivers that are mainly fed by winterprecipitation. Therefore agreement between the inde-pendent estimates of regional river discharges and re-gional climatic records should provide an additional testof the quality and consistency of these records.
Mean monthly discharges were obtained for sevenimportant rivers between 40° and 44°S that have thelongest and most complete flow records in Patagonia(Fig. 1 and Table 2). Missing monthly values in eachgauge station were estimated using a reference seriescreated from those remaining streamflow records signi-ficantly correlated with the candidate series. The gaugestation records for the Futaleufú and Limay rivers (dis-continued in 1976 and 1990 respectively due to damconstruction) were updated with data from activegauging stations upstream from the original sites. Sub-sequently, mean annual (April–March) streamflow re-cords were expressed as percentages of their 1961–1990mean and averaged to create a regional streamflow seriesfor 1903–2004. Simple correlation analyses were used toevaluate the strength of the relationships between theregionally-averaged streamflow record, the climaticindex, and the annual and seasonal temperature andprecipitation composites from the study area. The sta-tistical significance of these correlations was estimatedusing an ‘effective sample size’ based on the lag-1 auto-correlation of the raw data (Dawdy and Matalas, 1964).The statistical significance of least-squares linear trendsin these regional records was assessed following a con-servative approach which also accounts for the temporalautocorrelation in these time series (the AdjSE+AdjDFapproach, Santer et al., 2000).
4. Results
4.1. Photographic comparisons
Fig. 2 includes some of the earliest documentedglacier positions in Patagonia and clearly indicates thatglacier recession has been a generalized phenomenon inthe north Patagonian Andes during the past century.However, the large temporal gap between observations(N100 yr in some cases) indicates that these images canonly be used as endpoints of the sequence of glaciervariations during this time frame. In addition to themarked glacier front retreats of, for example, the LanínNorte and Frías glaciers (Fig. 2A and B), some of the
Table 2Streamflow records used in this study. Mean annual discharges refer to an April–March water year and were obtained mostly from Subsecretaría deRecursos Hídricos (SSRH, 2004). Notes: (†) April 1990–September 2005 completed with data from Aluminé (at Huechahue), Chimehuin (at PuestoConfluencia), Caleufú (at Puesto Córdoba) and LimaySuperior (at Villa Llanquín); (‡) April 1976–September 2005 fromFutaleufú Embalse (43° 07′S,71° 39′W, 320 m); data from E. Flamenco (personal communication), and Compañía Administradora del MercadoMayorista Eléctrico (CAMMESA),http://memnet2.cammesa.com/
River(basin area in km2)
Gauge station(code)
Latitude (S)Longitude (W)
Elevation(m)
Period of record(% missing)
Mean annual discharge(m3 s−1)
Limay (26400) Paso Limay (A) 40°32′ 538 Apr 1903–Sep 2005 (†) 717.370°26′
Manso (750) Los Alerces (B) 41°23′ 728 Apr 1951–Mar 2003 (1.7) 44.771°46′
Quemquemtreu (650) Escuela No. 139 (C) 41°54′ 750 Apr 1956–Mar 2003 (1.6) 9.571°30′
Chubut (1200) El Maitén (D) 42°06′ 680 Apr 1943–Mar 2003 (0.8) 19.571°10′
Carrileufú (580) Cholila (E) 42°30′ 535 Apr 1957–Mar 2003 (2.3) 48.471°32′
Futaleufú (4650) Balza Garzón (F) 43°09′ 320 Apr 1948–Sep 2005 (‡) 277.771°34′
Carrenlufú (1500) La Elena (G) 43°42′ 802 Apr 1954–Mar 2003 (1.5) 33.371°18′
Table 3Linear trend analysis for regional temperature, precipitation, climaticindex, and streamflow variations in northwestern Patagonia between1912 and 2002. The lag-1 autocorrelation coefficient in the regressionresiduals of each series (r1) was used to calculate an ‘effective samplesize’ (neff) and estimate the statistical significance (t test) of lineartrends (Santer et al., 2000). Notes: ⁎(⁎⁎) significant at the 0.05 (0.01)confidence level
Variable r1 neff Linear trend(values per decade)
Temperature Apr–Mar 0.386 40 +0.056 °C⁎⁎
Temperature Apr–Sep 0.360 43 +0.056 °C⁎
Temperature Oct–Mar 0.202 60 +0.056 °C⁎⁎
Precipitation Apr–Mar 0.040 84 −4.67%⁎⁎
Precipitation Apr–Sep 0.025 89 −4.89%⁎⁎
Precipitation Oct–Mar 0.031 86 −3.71%⁎⁎
Climate Index 0.095 75 −0.399 Z scores⁎⁎
Runoff Apr–Mar 0.145 68 −3.91%⁎⁎
93M.H. Masiokas et al. / Global and Planetary Change 60 (2008) 85–100
less steep glaciers (e.g. Ventisquero Negro, Fig. 2D)have lost ice mass mainly by thinning. Overall, thesecomparisons reveal that over the past century the climateconditions in the region have clearly favored ablationover accumulation in the mass balance of these glaciers.
4.2. Climate changes in northwestern Patagonia,1912–2002
A series of long, homogeneous annual, cold season,and warm season regionalized temperature and precip-itation records between 1912–2002 were used tocomplement the photographic comparisons and analyzethe possible climatic influence in this noticeable icemass loss. Despite the broad spatial extent and inherentlow-elevation nature of these climatic series, theregionalized climate records revealed a strong coherentsignal that provides a reliable indicator of climaticconditions across northwestern Patagonia (Fig. 1).These records are significantly correlated (r=0.87 fortemperature; 0.86 for precipitation, pb0.01) with the1969–1995 records from the higher elevation Mascardistation, ca. 15 km east of the Tronador glaciers(Fig. 2B–D). In addition, even though annual precipi-tation totals vary from over 4000 mm to less than500 mm (Table 1), a Principal Component Analysisperformed on the 18 precipitation records indicates that62.9% of the variance in these records can be explainedby the first Principal Component over the 1961–1995common interval.
The linear trend analyses performed on the annual(April–March), cold season (April–September), andwarm season (October–March) regional temperature andprecipitation series (Table 3) showed that these variableshave experienced opposite long-term patterns between1912 and 2002. Annual and seasonal gridded tempera-ture records showed similar, statistically significantpositive linear trends of around +0.056 °C per decadeeven after a marked adjustment to the degrees of freedomdue to the serial correlation in their regression residuals.Highly significant negative linear trends were found forthe equivalent precipitation records with cold season
94 M.H. Masiokas et al. / Global and Planetary Change 60 (2008) 85–100
totals showing the steepest decrease at −4.89% per de-cade (Table 3).
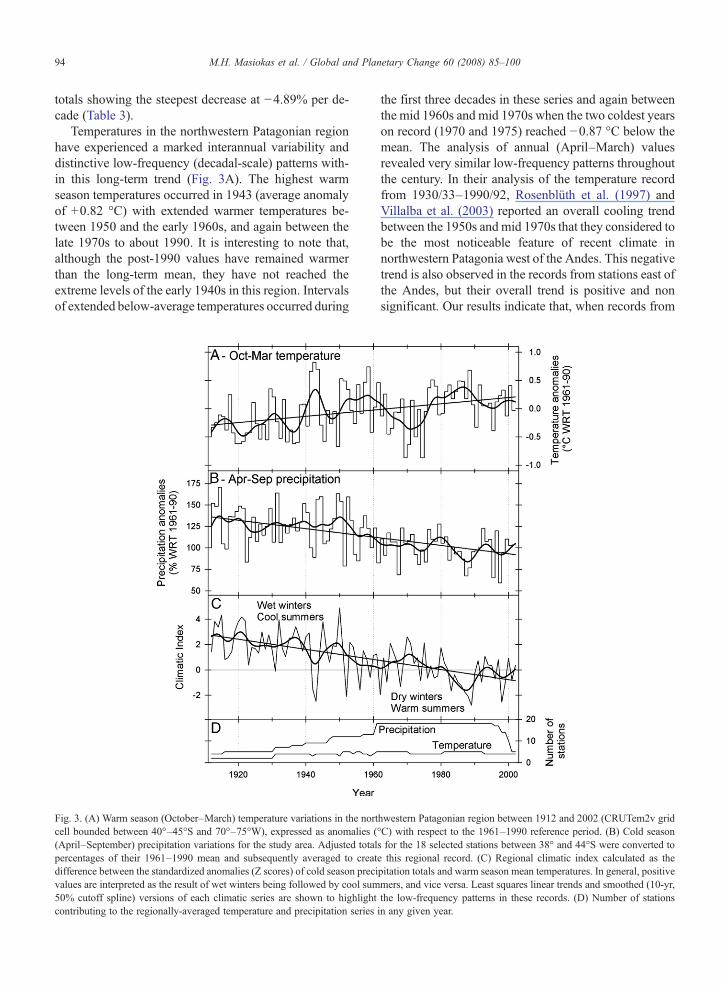
Temperatures in the northwestern Patagonian regionhave experienced a marked interannual variability anddistinctive low-frequency (decadal-scale) patterns with-in this long-term trend (Fig. 3A). The highest warmseason temperatures occurred in 1943 (average anomalyof +0.82 °C) with extended warmer temperatures be-tween 1950 and the early 1960s, and again between thelate 1970s to about 1990. It is interesting to note that,although the post-1990 values have remained warmerthan the long-term mean, they have not reached theextreme levels of the early 1940s in this region. Intervalsof extended below-average temperatures occurred during
Fig. 3. (A) Warm season (October–March) temperature variations in the nortcell bounded between 40°–45°S and 70°–75°W), expressed as anomalies ((April–September) precipitation variations for the study area. Adjusted totalpercentages of their 1961–1990 mean and subsequently averaged to creatdifference between the standardized anomalies (Z scores) of cold season precivalues are interpreted as the result of wet winters being followed by cool sum50% cutoff spline) versions of each climatic series are shown to highlightcontributing to the regionally-averaged temperature and precipitation series
the first three decades in these series and again betweenthe mid 1960s and mid 1970s when the two coldest yearson record (1970 and 1975) reached −0.87 °C below themean. The analysis of annual (April–March) valuesrevealed very similar low-frequency patterns throughoutthe century. In their analysis of the temperature recordfrom 1930/33–1990/92, Rosenblüth et al. (1997) andVillalba et al. (2003) reported an overall cooling trendbetween the 1950s and mid 1970s that they considered tobe the most noticeable feature of recent climate innorthwestern Patagonia west of the Andes. This negativetrend is also observed in the records from stations east ofthe Andes, but their overall trend is positive and nonsignificant. Our results indicate that, when records from
hwestern Patagonian region between 1912 and 2002 (CRUTem2v grid°C) with respect to the 1961–1990 reference period. (B) Cold seasons for the 18 selected stations between 38° and 44°S were converted toe this regional record. (C) Regional climatic index calculated as thepitation totals and warm season mean temperatures. In general, positivemers, and vice versa. Least squares linear trends and smoothed (10-yr,the low-frequency patterns in these records. (D) Number of stationsin any given year.
95M.H. Masiokas et al. / Global and Planetary Change 60 (2008) 85–100
both sides of the Andes are analyzed over the 1912–2002period, this cooling trend is insufficient to counteractthe overall warming trend observed across the region(Fig. 3A).
Above-average cold season precipitation totals domi-nate the first four decades of the regional series andculminate around the mid 1950s. Subsequently there is astrong decrease in winter totals, interrupted by shortperiods of increased precipitation around 1970, 1980,and the mid 1990s (Fig. 3B). The extended below-average interval between 1983 and 1992 is the mostconspicuous feature of the later portion of the regionalseries. The two driest years on record are 1998 (aver-aging 59.5% of the 1961–1990 precipitation) and 1996(65.3%, Fig. 3B). As the cold season totals averagebetween 65% and 80% of the annual (April–March)total (Table 1) these two series are almost identical,highlighting the strong influence of winter totals onannual precipitation variations at interannual and inter-decadal timescales.
4.3. Localized glacier advances and their relationshipwith the regional climatic index
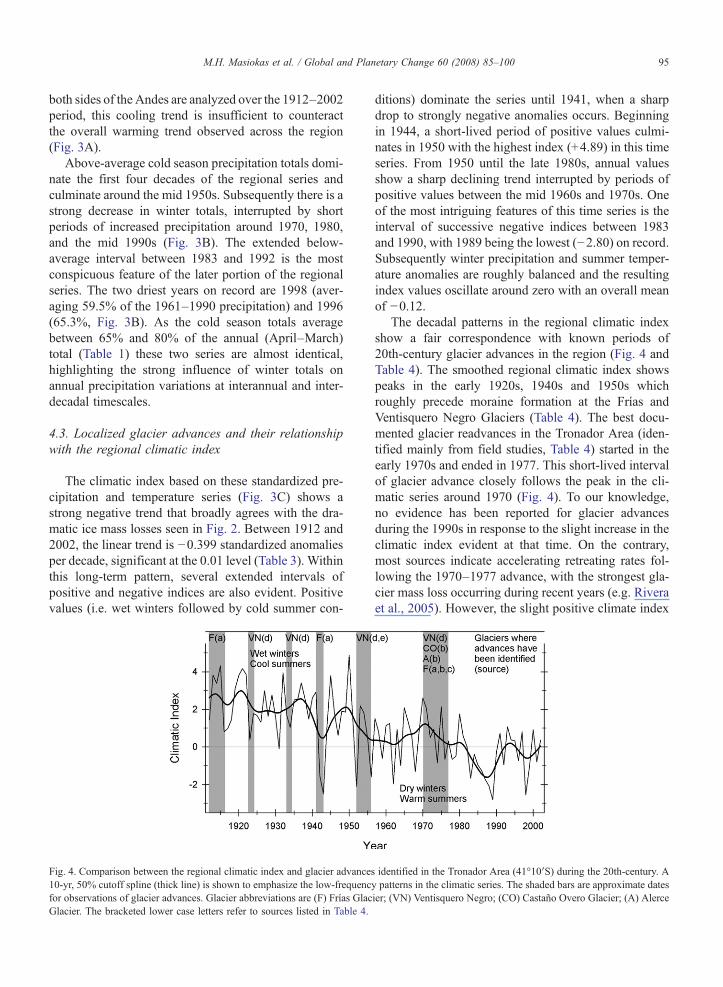
The climatic index based on these standardized pre-cipitation and temperature series (Fig. 3C) shows astrong negative trend that broadly agrees with the dra-matic ice mass losses seen in Fig. 2. Between 1912 and2002, the linear trend is −0.399 standardized anomaliesper decade, significant at the 0.01 level (Table 3). Withinthis long-term pattern, several extended intervals ofpositive and negative indices are also evident. Positivevalues (i.e. wet winters followed by cold summer con-
Fig. 4. Comparison between the regional climatic index and glacier advances10-yr, 50% cutoff spline (thick line) is shown to emphasize the low-frequencfor observations of glacier advances. Glacier abbreviations are (F) Frías GlacGlacier. The bracketed lower case letters refer to sources listed in Table 4.
ditions) dominate the series until 1941, when a sharpdrop to strongly negative anomalies occurs. Beginningin 1944, a short-lived period of positive values culmi-nates in 1950 with the highest index (+4.89) in this timeseries. From 1950 until the late 1980s, annual valuesshow a sharp declining trend interrupted by periods ofpositive values between the mid 1960s and 1970s. Oneof the most intriguing features of this time series is theinterval of successive negative indices between 1983and 1990, with 1989 being the lowest (−2.80) on record.Subsequently winter precipitation and summer temper-ature anomalies are roughly balanced and the resultingindex values oscillate around zero with an overall meanof −0.12.
The decadal patterns in the regional climatic indexshow a fair correspondence with known periods of20th-century glacier advances in the region (Fig. 4 andTable 4). The smoothed regional climatic index showspeaks in the early 1920s, 1940s and 1950s whichroughly precede moraine formation at the Frías andVentisquero Negro Glaciers (Table 4). The best docu-mented glacier readvances in the Tronador Area (iden-tified mainly from field studies, Table 4) started in theearly 1970s and ended in 1977. This short-lived intervalof glacier advance closely follows the peak in the cli-matic series around 1970 (Fig. 4). To our knowledge,no evidence has been reported for glacier advancesduring the 1990s in response to the slight increase in theclimatic index evident at that time. On the contrary,most sources indicate accelerating retreating rates fol-lowing the 1970–1977 advance, with the strongest gla-cier mass loss occurring during recent years (e.g. Riveraet al., 2005). However, the slight positive climate index
identified in the Tronador Area (41°10′S) during the 20th-century. Ay patterns in the climatic series. The shaded bars are approximate datesier; (VN) Ventisquero Negro; (CO) Castaño Overo Glacier; (A) Alerce
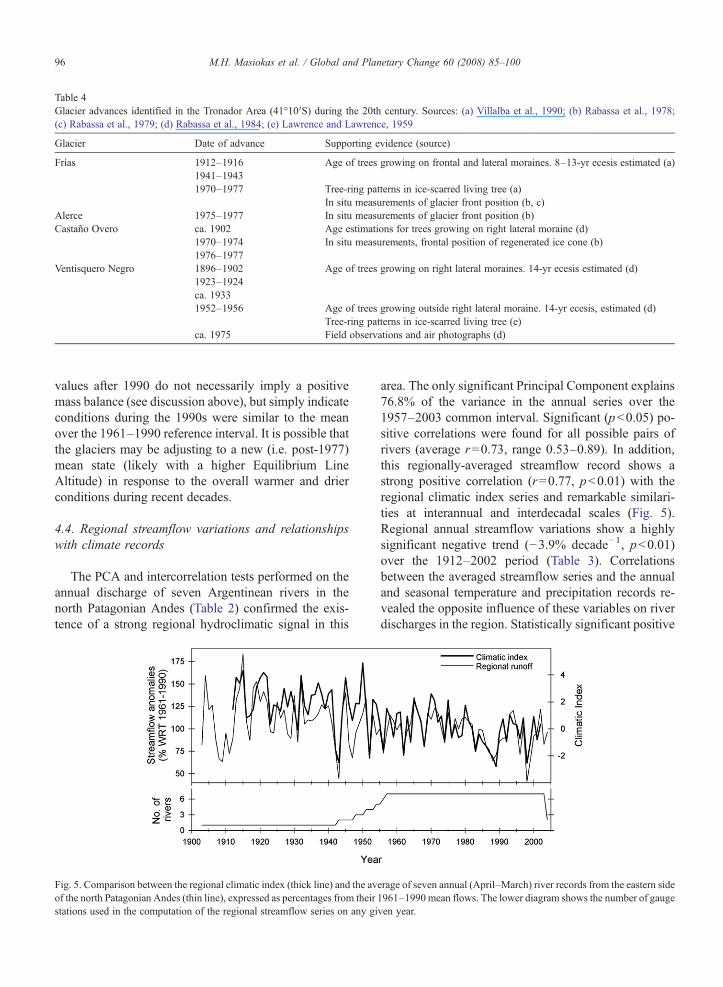
Table 4Glacier advances identified in the Tronador Area (41°10′S) during the 20th century. Sources: (a) Villalba et al., 1990; (b) Rabassa et al., 1978;(c) Rabassa et al., 1979; (d) Rabassa et al., 1984; (e) Lawrence and Lawrence, 1959
Glacier Date of advance Supporting evidence (source)
Frías 1912–1916 Age of trees growing on frontal and lateral moraines. 8–13-yr ecesis estimated (a)1941–19431970–1977 Tree-ring patterns in ice-scarred living tree (a)
In situ measurements of glacier front position (b, c)Alerce 1975–1977 In situ measurements of glacier front position (b)Castaño Overo ca. 1902 Age estimations for trees growing on right lateral moraine (d)
1970–1974 In situ measurements, frontal position of regenerated ice cone (b)1976–1977
Ventisquero Negro 1896–1902 Age of trees growing on right lateral moraines. 14-yr ecesis estimated (d)1923–1924ca. 19331952–1956 Age of trees growing outside right lateral moraine. 14-yr ecesis, estimated (d)
Tree-ring patterns in ice-scarred living tree (e)ca. 1975 Field observations and air photographs (d)
96 M.H. Masiokas et al. / Global and Planetary Change 60 (2008) 85–100
values after 1990 do not necessarily imply a positivemass balance (see discussion above), but simply indicateconditions during the 1990s were similar to the meanover the 1961–1990 reference interval. It is possible thatthe glaciers may be adjusting to a new (i.e. post-1977)mean state (likely with a higher Equilibrium LineAltitude) in response to the overall warmer and drierconditions during recent decades.
4.4. Regional streamflow variations and relationshipswith climate records
The PCA and intercorrelation tests performed on theannual discharge of seven Argentinean rivers in thenorth Patagonian Andes (Table 2) confirmed the exis-tence of a strong regional hydroclimatic signal in this
Fig. 5. Comparison between the regional climatic index (thick line) and the avof the north Patagonian Andes (thin line), expressed as percentages from theirstations used in the computation of the regional streamflow series on any gi
area. The only significant Principal Component explains76.8% of the variance in the annual series over the1957–2003 common interval. Significant (pb0.05) po-sitive correlations were found for all possible pairs ofrivers (average r=0.73, range 0.53–0.89). In addition,this regionally-averaged streamflow record shows astrong positive correlation (r=0.77, pb0.01) with theregional climatic index series and remarkable similari-ties at interannual and interdecadal scales (Fig. 5).Regional annual streamflow variations show a highlysignificant negative trend (−3.9% decade−1, pb0.01)over the 1912–2002 period (Table 3). Correlationsbetween the averaged streamflow series and the annualand seasonal temperature and precipitation records re-vealed the opposite influence of these variables on riverdischarges in the region. Statistically significant positive
erage of seven annual (April–March) river records from the eastern side1961–1990 mean flows. The lower diagram shows the number of gaugeven year.
Table 5Paired correlations between the annual (April–March) streamflow record and annual and seasonal (April–September, October–March) precipitationand temperature series for the northwestern Patagonian region between 1912 and 2002. The statistical significance (t test) of the correlationswas estimated after accounting for the serial correlation in the intervening time series (Dawdy and Matalas, 1964). Notes: ⁎(⁎⁎) Significant at the0.05 (0.01) confidence level
Precipitation Temperature
Apr–Mar Apr–Sep Oct–Mar Apr–Mar Apr–Sep Oct–Mar
Runoff Apr–Mar 0.820⁎⁎ 0.798⁎⁎ 0.480⁎⁎ −0.375⁎⁎ −0.262⁎ −0.332⁎⁎Precipitation Apr–Mar 0.937⁎⁎ 0.620⁎⁎ −0.247⁎ −0.141 −0.252⁎
Apr–Sep 0.315⁎⁎ −0.187 −0.116 −0.181Oct–Mar −0.280⁎ −0.133 −0.313⁎⁎
Temperature Apr–Mar 0.800⁎⁎ 0.781⁎⁎
Apr–Sep 0.250⁎
97M.H. Masiokas et al. / Global and Planetary Change 60 (2008) 85–100
(negative) correlations with the regional precipitation(temperature) series were found for all three seasonsanalyzed (Table 5). However, the strongest correlations(up to +0.82) occurred with precipitation records, espe-cially with annual and cold season totals. The highestnegative correlations (r=−0.375) were found with theannual temperature series (Table 5).
5. Discussion and conclusions
The preliminary analyses presented here indicatemajor changes in the climate of northwestern Patagoniaover the last century with noticeable impacts on glaciersand river discharge in the region. Conservative lineartrend analyses revealed a strong, highly significant ten-dency towards drier and warmer conditions over the1912–2002 period. Over this interval, averaged warmseason (October–March) temperatures have increasedby 0.056 °C per decade, whereas cold season (April–September) precipitation records (on average ca. 73.5%of annual totals) have declined at a rate of 4.89% perdecade (Fig. 3AB and Table 3). Although clearly ap-parent in the gridded temperature records used in thisstudy, the previously identified cooling trend betweenthe 1950s and the mid 1970s for northwestern Patagoniawest of the Andes (Rosenblüth et al., 1997; Villalbaet al., 2003) is insufficient to counteract the overallwarming tendency observed in the entire region over the1912–2002 period. The comparison with independent-ly measured climate and streamflow records suggeststhat these regional temperature and precipitation seriescan be regarded as reliable indicators of climatic con-ditions for northwestern Patagonia between ca. 38° and45°S.
The small size of glaciers in the north PatagonianAndes and their relatively short response time to climatefluctuations makes them particularly suitable to com-plement studies of recent climate changes in this part of
the world. The comparison of past and present glacierfront positions from repeated ground photography(Fig. 2) provides powerful baseline information aboutthe long-term behavior of local ice masses. The goodquality paired photographs from six glaciers between39°S and 43°S document the strong glacier recessionover the past century in this region and corroborate thehighly significant trends towards warmer and drier con-ditions over the 20th century based on regionalizedtemperature and precipitation records. A simple climaticindex derived from these records provides a crude proxyfor glacier mass balance that is consistent with theobserved glacier recession in the region (Fig. 3C). Al-though this climatic index shows a marked negativetrend over the complete record, multi-year periods ofpositive values (i.e. wet winters followed by cool sum-mers) roughly coincide with known periods of glacieradvance during the 20th century (Fig. 4 and Table 4).For example, the well-documented interval of glacieradvances culminating in 1976–1977 probably tookplace in response to consecutive years of relatively wetand cool conditions during the early 1970s, implying arelatively short (less than a decade) glacier responsetime to climate. However, these tentative conclusionsare drawn on the limited, presently available database.Recent and ongoing glaciological studies (e.g. Bown,2004; Rivera et al., 2005) may ultimately provide morecomprehensive data to evaluate the relationships be-tween glaciers and synoptic changes in climate in thisarea.
The climatic index developed in this paper is stronglycorrelated with regional streamflow records derivedfrom the seven longest and most complete records fromthe north Patagonian Andes in Argentina, confirming thevalidity of this index and highlighting the regional natureof the changes observed in these variables. Correlationwith precipitation and temperature series provides fur-ther insight into the climate-runoff relationships in the
98 M.H. Masiokas et al. / Global and Planetary Change 60 (2008) 85–100
region, indicating a strong regional pattern of dischargeprimarily controlled by precipitation variability over thelast century. These preliminary findings have interestingimplications for the evaluation of the relative importanceof possible future changes in precipitation and tempera-tures in this region.
Results from several coupled atmosphere–ocean gen-eral circulation models (Cubasch et al., 2001; Bradleyet al., 2004) suggest that the temperature and precipita-tion trends observed in northwestern Patagonia willprobably continue well into the 21st century. Althoughfurther work is needed to evaluate the potential hydro-logical and socio-economic impacts of such predictions,an improved knowledge of recent (i.e. 20th-century)climate variability in this area will be of crucial impor-tance for future water resource management programsand regional development initiatives.
Acknowledgments
We would like to thank Christoph Kull for inviting usto participate in this special issue. Comments from twoanonymous reviewers significantly improved this man-uscript and are greatly appreciated. This research wassupported by the Argentinean Agency for the Promotionof Science and Technology (grant PICTR02–186), andthe CRN03 Project of the Inter American Institute forGlobal Change Research (IAI). We are grateful to DaríoTrombotto, Pepe Hernández, Alberto Ripalta, andSalvador Calí (IANIGLA, Mendoza), Club AndinoBariloche and Museo de la Patagonia (Bariloche), andBiblioteca Perito Moreno (Parques Nacionales, BuenosAires, Argentina) for their assistance in developing thephotographic database. We also thank Rocío Urrutia(Universidad Austral de Chile, Valdivia) for providingmost of the Chilean precipitation records, and EduardoFlamenco (INTA Castelar, Argentina) for the updatedstreamflow data. The GHCN v.2 precipitation recordswere obtained from the Climate Explorer website (http://climexp.knmi.nl) of the Royal Netherlands Meteorolog-ical Institute (KNMI). Regional hydroclimatic serieswere analyzed utilizing the AnClim and ProClimDBsoftware packages available at http://www.klimahom.com/software.
References
Aceituno, A., Fuenzalida, H., Rosenblüth, B., 1993. Climate along theextratropical west coast of South America. In: Mooney, H.A.,Fuentes, E.R., Kronberg, B.I. (Eds.), Earth system responses toglobal change — Contrasts between North and South America.Academic Press, pp. 61–69.
Alexandersson, H., 1986. A homogeneity test applied to precipitationdata. Journal of Climatology 6, 661–675.
Aniya, M., 1988. Glacier inventory for the Northern Patagonia Ice-field, Chile, and variations 1944/45 to 1985/86. Arctic and AlpineResearch 20 (2), 179–187.
Aniya, M., Sato, H., Naruse, R., Skvarca, P., Casassa, G., 1996. Theuse of satellite and airborne imagery to inventory outlet glaciers ofthe Southern Patagonia Icefield, South America. PhotogrammetricEngineering and Remote Sensing 62, 1361–1369.
Bown, F., 2004. Cambios climáticos en la Región de Los Lagos yrespuestas recientes del Glaciar Casa Pangue (41°08′S). MScThesis, Universidad de Chile, Santiago, 131 pp.
Bradley, R.S., Keimig, F.T., Diaz, H.F., 2004. Projected temperaturechanges along the American cordillera and the planned GCOSnetwork. Geophysical Research Letters 31, L16210, doi: 10.1029/2004GL020229.
Coudrain, A., Francou, B., Kundzewicz, Z.W., 2005. Glacier shrink-age in the Andes and consequences for water resources — edito-rial. Hydrological Sciences Journal 50 (6), 925–932.
Cubasch, U., Meehl, G.A., Boer, G.J., Stouffer, R.J., Dix, M., Noda,A., Senior, C.A., Raper, S., Yap, K.S., 2001. Projections offuture climate change. In: Houghton, J.T., et al. (Ed.), ClimateChange 2001: The Scientific Basis. Contribution of WorkingGroup I to the Third Assessment Report of the Intergovern-mental Panel on Climate Change. Cambridge University Press,pp. 525–582.
Dawdy, D.R., Matalas, N.C., 1964. Statistical and probability analysisof hydrologic data, part III: analysis of variance, covariance andtime series. In: Chow, V.T. (Ed.), Handbook of Applied Hydrology,A Compendium of Water-Resources Technology. McGraw-HillBook Company, New York, p. 8.68–8.90.
De Agostini, A.M., 1945. Viajes de exploración a la Cordillera Pata-gónica Austral. 2nd ed. Guillermo Kraft, Buenos Aires. 445 pp.
Dyurgerov,M.B.,Meier,M.F., 2000. Twentieth century climate change:evidence from small glaciers. Proceedings of the National Academyof Sciences 97, 1406–1411.
Fonck, F., Hess, F., 1857. Informe de los señores Francisco Fonck iFernando Hess sobre la espedicion a Nahuelhuapi. Anales de laUniversidad de Santiago de Chile XIV, 1–11.
Haeberli, W., 2005. Mountain glaciers in global climate-related ob-serving systems. In: Huber, U.M., Bugmann, H.K.M., Reasoner,M.A. (Eds.), Global change and mountain regions— An overviewof current knowledge. Springer, pp. 169–175.
Hamilton, T.D., 1965. Comparative glacier photographs from northernAlaska. Journal of Glaciology 5 (40), 479–487.
Hauthal, R., 1904. Gletscherbilder aus der argentinischen Cordillera.Zeitschrift des Deutschen und Oesterreichischen Alpenvereins 35,30–56.
Hodge, S.M., Trabant, D.C., Krimmel, R.M., Heinrichs, T.A., March,R.S., Josberger, E.G., 1998. Climate variations and changes in massof three glaciers in western North America. Journal of Climate 11,2161–2179.
Hoelzle,M.,Haeberli,W.,Dischl,M., Peschke,W., 2003. Secular glaciermass balances derived from cumulative glacier length changes.Global and Planetary Change 36 (4), 295–306.
Jakob, C., 1936. Alrededor del Tronador. Revista Geográfica Ameri-cana V (28), 1–21.
Jakob, C., 1937. La fiscalización de las reservas acuáticas es unaobligación nacional para la Argentina. Revista Geográfica Ameri-cana V (50), 313–326.
Johannesson, T., Raymond, C.F., Waddington, E.D., 1989. A simplemethod for determining the response time of glaciers. In: Oerlemans,
99M.H. Masiokas et al. / Global and Planetary Change 60 (2008) 85–100
J. (Ed.), Glacier Fluctuations and Climatic Change. KluwerAcademic Publishers, Dordretch, pp. 343–352.
Jones, P.D., Hulme, M., 1996. Calculating regional climatic time seriesfor temperature and precipitation: methods and illustrations. Inter-national Journal of Climatology 16, 361–377.
Jones, P.D., Moberg, A., 2003. Hemispheric and large-scale surface airtemperature variations: an extensive revision and an update to2001. Journal of Climate 16, 206–223.
Klok, E.J., Oerlemans, J., 2004. Climate reconstructions derived fromglobal glacier length records. Arctic, Antarctic, and Alpine Re-search 36 (4), 575–583.
Kölliker, A., Kühn, F., Reichert, A., Tomsen, A., Witte, L., 1917.Patagonia: Resultados de las expediciones realizadas en 1910a 1916. Sociedad Científica Alemana, Buenos Aires. 2 vols.430 pp.
Koutche, V., Ladvocat, H.J., 1937. Parque Nacional Los Alerces:Proyecto de reserva para la creación de un Parque Nacional enel Territorio Nacional del Chubut. In: Dirección de ParquesNacionales (eds.), Nuevos Parques Nacionales, Buenos Aires,pp. 35–94.
Lara, A., Urrutia, R., Villalba, R., Luckman, B.H., Soto, D., Aravena,J.C., McPhee, J., Wolodarsky, A., Pezoa, L., Leon, J., 2005. Thepotential use of tree-rings to reconstruct streamflow and estuarinesalinity in the Valdivian Rainforest eco-region, Chile. Dendro-chronologia 22, 155–161.
Lawrence, D.B., Lawrence, E.G., 1959. Recent glacier variations insouthern South America. American Geographical Society South-ern Chile Expedition Technical Report, vol. 641(04). Office ofNaval Research Contract, New York, USA. 39 pp.
Lliboutry, L., 1998. Glaciers of Chile and Argentina. In: Williams,R.S., Ferrigno, J.G. (Eds.), Satellite Image Atlas of Glaciers ofthe World: South America. USGS Professional Paper 1386-I,Online version 1.02.
McCabe, G.J., Fountain, A.G., Dyurgerov, M.B., 2000. Variability inwinter mass balance of Northern Hemisphere glaciers and relationswith atmospheric circulation. Arctic, Antarctic, and Alpine Re-search 32 (1), 64–72.
Miller, A., 1976. The climate of Chile. In: Schwerdtfeger, W. (Ed.),World Survey of Climatology. Climate of Central and SouthAmerica, vol. 12. Elsevier, Amsterdam, pp. 113–145.
Nesje, A., 2005. Briksdalsbreen in western Norway: AD 1900–2004 frontal fluctuations as a combined effect of variations inwinter precipitation and summer temperature. Holocene 15 (8),1245–1252.
Neumeyer, J.J., 1949. En el valle del Río Esperanza (Chubut). Anuariodel Club Andino Bariloche 17, 47–50.
Oerlemans, J., 1994. Quantifying global warming from the retreat ofglaciers. Science 264, 243–245.
Oerlemans, J., 2001. Glaciers and Climate Change. Balkema Publish-ers. 148 pp.
Oerlemans, J., 2005. Extracting a climate signal from 169 glacierrecords. Science 308, 675–677.
Oerlemans, J., Fortuin, J.P.F., 1992. Sensitivity of glaciers and smallice caps to greenhouse warming. Science 258, 115–117.
Pittock, A.B., 1980. Patterns of climatic variation in Argentina andChile — I. Precipitation, 1931–1960. Monthly Weather Review108, 1347–1361.
Porter, S.C., 1981. Glaciological evidence ofHolocene climatic change.In: Wigley, T.M.L., Ingram, M.J., Farmer, G. (Eds.), Climate andHistory. Cambridge University Press, pp. 83–110.
Prohaska, F., 1976. The climate of Argentina, Paraguay and Uruguay.In: Schwerdtfeger, W. (Ed.), World Survey of Climatology.
Climate of Central and South America, vol. 12. Elsevier, Amster-dam, pp. 13–112.
Rabassa, J., Rubulis, S., Suarez, J., 1978. Los glaciares del MonteTronador. Anales de Parques Nacionales XIV, 259–318.
Rabassa, J., Rubulis, S., Suárez, J., 1979. Rate of formation andsedimentology of (1976–1978) push-moraines, Frías Glacier,Mount Tronador (41°10′S; 71°53′W), Argentina. In: Schluechter,C. (Ed.), Moraines and Varves. A.A. Balkema, pp. 65–79.
Rabassa, J., Brandani, A., Boninsegna, J.A., Cobos, D.R., 1984.Cronología de la “Pequeña Edad del Hielo” en los glaciares RíoManso y Castaño Overo, Cerro Tronador, Provincia de Río Negro.Actas Noveno Congreso Geológico Argentino 3, 624–639.
Rasmussen, L.A., Conway, H., 2004. Climate and glacier variability inwestern North America. Journal of Climate 17, 1804–1815.
Rivera, A., 2004. Mass balance investigations at Glaciar Chico,Southern Patagonia Icefield, Chile. PhD thesis, University ofBristol, UK, 303 pp.
Rivera, A., Casassa, G., Acuña, C., Lange, H., 2000. Variacionesrecientes de glaciares en Chile. Revista de InvestigacionesGeográficas 34, 25–52.
Rivera, A., Acuña, C., Casassa, G., Bown, F., 2002. Use of remotesensing and field data to estimate the contribution of Chileanglaciers to the sea level rise. Annals of Glaciology 34, 367–372.
Rivera, A., Bown, F., Casassa, G., Acuña, C., Clavero, J., 2005.Glacier shrinkage and negative mass balance in the ChileanLake District (40°S). Hydrological Sciences Journal 50 (6),963–974.
Rogers, G.F., Malde, H.E., Turner, R.M., 1984. Bibliography of repeatphotography for evaluating landscape change. University of UtahPress, Salt Lake City. 179 pp.
Rosenblüth, B., Casassa, G., Fuenzalida, H., 1995. Recent climaticchanges in western Patagonia. Bulletin of Glacier Research 13,127–132.
Rosenblüth, B., Fuenzalida, H., Aceituno, P., 1997. Recent temper-ature variations in southern South America. International Journalof Climatology 17, 67–85.
Santer, B.D., Wigley, T.M.L., Boyle, J.S., Gaffen, D.J., Hnilo, J.J.,Nychka, D., Parker, D.E., Taylor, K.E., 2000. Statistical signifi-cance of trends and trend differences in layer-average atmospherictemperature time series. Journal of Geophysical Research 105 (D6),7337–7356.
Secretaría de Energía, 2004. Informe del Sector Eléctrico, Año 2003.Ministerio de Planificación Federal, Inversión Pública y Servicios.Secretaría de Energía, Argentina. 154 pp.
SSRH, 2004. Estadística Hidrológica de la República Argentina,Edición 2004. 1st Ed. Subsecretaría de Recursos Hídricos, BuenosAires, Argentina. CD-ROM.
Steffen, H., 1909. Viajes de Esploracion i Estudio en la PatagoniaOccidental: 1892–1902. vol. I. Anales de la Universidad de Chile,Imprenta Cervantes, Santiago. 409 pp.
Veblen, T.T., Lorenz, D.C., 1988. Recent vegetation changes along theforest/steppe ecotone in northern Patagonia. Annals of the Ameri-can Association of Geographers 78 (1), 93–111.
Villalba, R., Leiva, J.C., Rubulis, S., Suarez, J., Lenzano, L.E.,1990. Climate, tree-ring, and glacial fluctuations in the Río FríasValley, Río Negro, Argentina. Arctic and Alpine Research 22 (3),215–232.
Villalba, R., Lara, A., Boninsegna, J.A., Masiokas, M., Delgado, S.,Aravena, J.C., Roig, F., Schmelter, A., Wolodarsky, A., Ripalta,A., 2003. Large-scale temperature changes across the SouthernAndes: 20th-century variations in the context of the past 400 years.Climatic Change 59, 177–232.

100 M.H. Masiokas et al. / Global and Planetary Change 60 (2008) 85–100
Villalba, R., Masiokas, M., Kitzberger, T., Boninsegna, J.A., 2005.Biogeographical consequences of recent climate changes in thesouthern Andes of Argentina. In: Huber, U.M., Bugmann,H.K.M., Reasoner, M.A. (Eds.), Global Change and Moun-tain Regions, an Overview of Current Knowledge. Springer,pp. 157–166.
Vose, R.S., Schmoyer, R.L., Steurer, P.M., Peterson, T.C., Heim, R.,Karl, T.R., Eischeid, J.K., 1992. The global historical climatology
network: long-term monthly temperature, precipitation, sea levelpressure, and station pressure data. Tech. Rep. NDP-041, CarbonDioxide Information Analysis Center. Oak Ridge National Labora-tory, Oak Ridge, Tennessee, U.S.A.
Warren, C.R., Sugden, D.E., 1993. The Patagonian Icefields: a glacio-logical review. Arctic and Alpine Research 25, 316–331.
Zumbühl, H.J., Holzhauser, H., 1988. Glaciers des Alpes du Petit âgeglaciaire. Les Alpes 64 (3), 129–322.
Related Documents