International Journal of Civil Engineering and Technology (IJCIET), ISSN 0976 – 6308 (Print), ISSN 0976 – 6316(Online), Volume 5, Issue 5, May (2014), pp. 76-87 © IAEME 76 TESTING THE HOMOGENEITY OF RAINFALL RECORDS FOR SOME STATIONS IN IRAQ Najm Obaid Salim Alghazali¹, Dhelal Adnan Hussein Alawadi² (1) Corresponding author, Asst. Prof. Doctor, Civil Engineering Department, Babylon University, Iraq (2) M.Sc. Student, Civil Engineering Department, Babylon University, Iraq ABSTRACT In this study three homogeneity tests were used: Pettitt, Buishand and double mass curve tests. These tests were applied to thirteen Iraqi stations of monthly rainfall observations: Mosul, Kirkuk, Khanaqin, Ramadi, Baghdad, Karbala, Hilla, Najaf, Diwaniya, Samawa,Nasiriyah, Amara and Basrah for the period (1970-2010) for all stations except Ramadi (1981-2010) and Hilla (1980- 2010). Pettitt test indicated that there was no break point at any station, while Buishand test indicated that there was a break point only in Karbala station on March-1998 and double mass curve indicated that there was a break point at Karbala on March-1998 station and Samaw station on December-1991 so, they were corrected with double mass curve and retested by each of Pettitt and Buishand tests and they showed no break point. Keywords: Rainfall in Iraq, Homogeneity of Time Series, Pettitt Test, Buishand Test, Double Mass Curve Test. 1. INTRODUCTION Homogeneous rainfall is often required in hydrologic design. However it frequently occurs that rainfall data over different periods are not comparable since the measured amount of rainfall depends on such factors as the type, height and exposure of the raingauge, which have not always been the same. Therefore many meteorological institutes maintain an archive with information on the raingauge sites and the instrument used. Unfortunately it is often not possible to specify the nature of changes in the mean amount of rainfall from the station documentation. This is partly because it is not always known how a change in the instrument or in the raingauge site may influence the INTERNATIONAL JOURNAL OF CIVIL ENGINEERING AND TECHNOLOGY (IJCIET) ISSN 0976 – 6308 (Print) ISSN 0976 – 6316(Online) Volume 5, Issue 5, May (2014), pp. 76-87 © IAEME: www.iaeme.com/ijciet.asp Journal Impact Factor (2014): 7.9290 (Calculated by GISI) www.jifactor.com IJCIET ©IAEME

Welcome message from author
This document is posted to help you gain knowledge. Please leave a comment to let me know what you think about it! Share it to your friends and learn new things together.
Transcript

International Journal of Civil Engineering and Technology (IJCIET), ISSN 0976 – 6308 (Print),
ISSN 0976 – 6316(Online), Volume 5, Issue 5, May (2014), pp. 76-87 © IAEME
76
TESTING THE HOMOGENEITY OF RAINFALL RECORDS FOR SOME
STATIONS IN IRAQ
Najm Obaid Salim Alghazali¹, Dhelal Adnan Hussein Alawadi²
(1)Corresponding author, Asst. Prof. Doctor, Civil Engineering Department, Babylon
University, Iraq (2)
M.Sc. Student, Civil Engineering Department, Babylon University, Iraq
ABSTRACT
In this study three homogeneity tests were used: Pettitt, Buishand and double mass curve
tests. These tests were applied to thirteen Iraqi stations of monthly rainfall observations: Mosul,
Kirkuk, Khanaqin, Ramadi, Baghdad, Karbala, Hilla, Najaf, Diwaniya, Samawa,Nasiriyah, Amara
and Basrah for the period (1970-2010) for all stations except Ramadi (1981-2010) and Hilla (1980-
2010). Pettitt test indicated that there was no break point at any station, while Buishand test indicated
that there was a break point only in Karbala station on March-1998 and double mass curve indicated
that there was a break point at Karbala on March-1998 station and Samaw station on December-1991
so, they were corrected with double mass curve and retested by each of Pettitt and Buishand tests and
they showed no break point.
Keywords: Rainfall in Iraq, Homogeneity of Time Series, Pettitt Test, Buishand Test, Double Mass
Curve Test.
1. INTRODUCTION
Homogeneous rainfall is often required in hydrologic design. However it frequently occurs
that rainfall data over different periods are not comparable since the measured amount of rainfall
depends on such factors as the type, height and exposure of the raingauge, which have not always
been the same. Therefore many meteorological institutes maintain an archive with information on the
raingauge sites and the instrument used. Unfortunately it is often not possible to specify the nature of
changes in the mean amount of rainfall from the station documentation. This is partly because it is
not always known how a change in the instrument or in the raingauge site may influence the
INTERNATIONAL JOURNAL OF CIVIL ENGINEERING
AND TECHNOLOGY (IJCIET)
ISSN 0976 – 6308 (Print)
ISSN 0976 – 6316(Online)
Volume 5, Issue 5, May (2014), pp. 76-87
© IAEME: www.iaeme.com/ijciet.asp
Journal Impact Factor (2014): 7.9290 (Calculated by GISI)
www.jifactor.com
IJCIET
©IAEME
International Journal of Civil Engineering and Technology (IJCIET), ISSN 0976 – 6308 (Print),
ISSN 0976 – 6316(Online), Volume 5, Issue 5, May (2014), pp. 76-87 © IAEME
77
measured amount of rainfall and partly because it is highly questionable whether the station
information gives a complete picture of raingauge site during the period that the station has been in
operation.
Because of the uncertainty about possible changes, graphical methods are often used in
climatology and hydrology to obtain some insight into the homogeneity of a record. A popular tool is
a double mass curve which is obtained by plotting the cumulative amounts of the station under
consideration against the cumulative amounts of a set of neighboring stations. The plotted points
tend to fall along a straight line under conditions of homogeneity.
Though graphs are useful for detection of shift in the mean it is usually not obvious how real
changes can be distinguished from purely random fluctuations. Therefore it is always necessary to
test the significance of departure from homogeneity by statistical methods [1].
Busuioc and Storch[2] studied the variability of winter mean precipitation at 14 Romanian
gauge stations from 1901-1988. Pettitt’s statistics was used to detect changes of regimes in the time
series. Almost all stations exhibited systemic decrease (downward shift) at about 1960. Furthermore
upward were identified for the southwestern stations at 1933, and a downward shift in the mid of
1920’s in the northwest. An upward shift at about 1919 for the Bucharest station was likely
determined by the urbanization effect. They found that Pettitt’s statistic was sensitive to the presence
of trend and serial correlation.
Tarhule and Woo [3] examined changes in several rainfall characteristics in northern Nigeria.
The records at 25 locations were analyzed for the occurrence of abrupt changes using the Pettitt
test.They concluded that changes in rainfall over the Sahel were driven by a reduction in the
frequency of rain days of high rainfall intensities during the months of August and September
Karabork et al. [4] studied the homogeneity of 212 precipitation records in Turkey for the
period 1973-2002. They were checked by Pettitt Test. Stations were considered inhomogeneous if at
least one of the tests rejects the homogeneity. He found that 43 out of 212 stations were found to be
inhomogeneous.
Kang and Yusof[5]used Buishand and Pettitt test in checking homogeneity of daily rainfall
series in variables for 33 stations in Damansara, Johor and Kelantan. The results were assessed by
classifying the stations into 3 categories, which are useful, doubtful and suspect. They found that are
28 stations (84.84%) are homogeneous and “useful”, 4 stations (12.12%) are inhomogeneous and
“doubtful” and 1 station is considered as “suspect”.
Arndt and Redmond [6] used the double-mass method to subjectively identify in
homogeneities in temperature and precipitation observations for modernized cooperative observer
(COOP) stations in U.S. Results showed that in most long-term records, the accumulation of values
becomes so large that a double-mass plot masks significant changes in relationship between climate
elements.
Metzger and Sohn[7] used double mass analysis as consistency tool of rainfall data in three
watersheds: Chancay Lambayeque, Chillon and Ramis in Peru from 2008-2011. This analysis was
made to the stations for the three watersheds in order to determine whether there was a need for
corrections to the data. They found that the double mass analysis that applied to all stations had
shown a good behavior in time which meant that the data collection procedures or other local
conditions did not have a significant effect on the data, therefore there was no need for correction.
In this study homogeneity of thirteen Iraqi stations is checked using Pettitt, Buishand and
double mass curve tests.
2. DESCRIPTION OF THE STUDY AREA
The climate in Iraq is mainly of the continental, subtropical semi-arid type, with the north and
north-eastern mountainous regions having a Mediterranean climate. Rainfall is very seasonal and
International Journal of Civil Engineering and Technology (IJCIET), ISSN 0976 – 6308 (Print),
ISSN 0976 – 6316(Online), Volume 5, Issue 5, May (2014), pp. 76-87 © IAEME
78
occurs in the winter from December to February, except in the north and northeast of the country,
where the rainy season is from November to April. Average annual rainfall is estimated at 216 mm,
but ranges from 1200 mm in the northeast to less than 100 mm over 60 percent of the country in the
south[8].
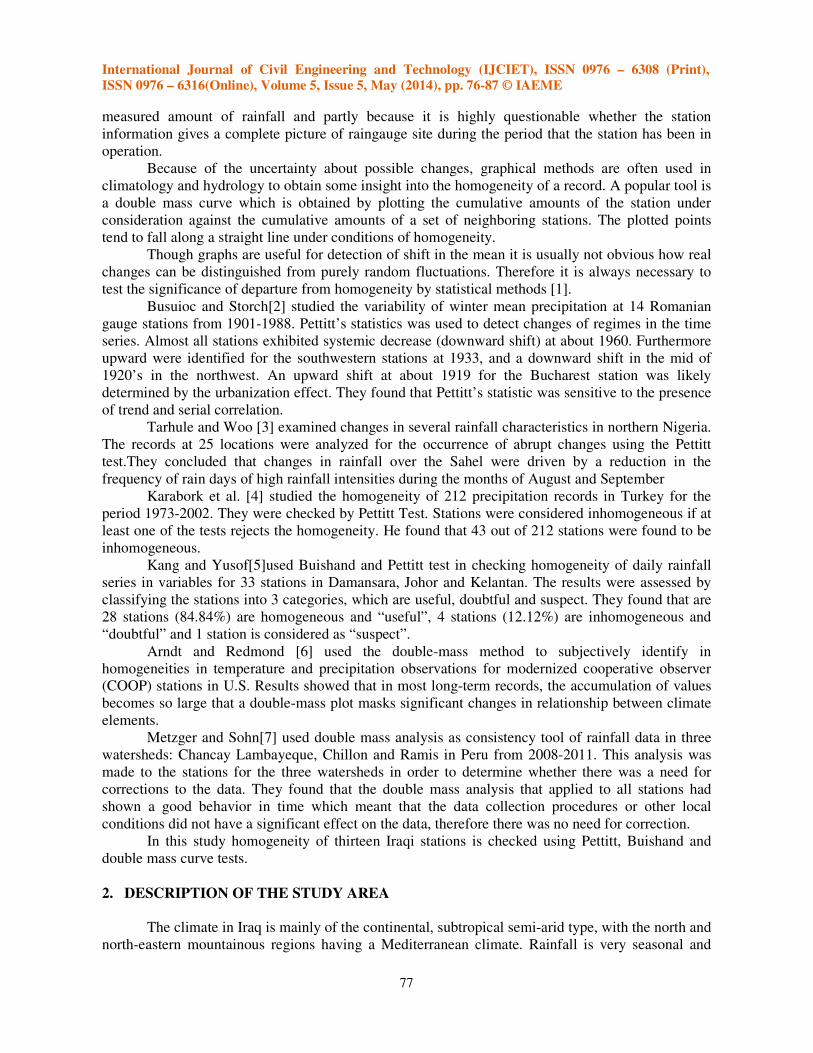
In this study total monthly rainfall data for thirteen meteorological stations in Iraq: Mosul,
Kirkuk, Khanaqin, Ramadi, Baghdad, Kerbala, Hilla, Najaf, Diwaniya, Samawa, Nasiriya, Amara
and Basra are used. Fig. 1 shows the stations, in orange color, that are used in this study. The
monthly rainfall of these thirteen stations is analyzed with periods (1970-2010) for all station except
(1981-2010) for Ramadi station and (1980-2010) for Hilla station [9].
Figure (1): Iraqi map showing the thirteen stations, in orange color, which are used in this
study
3. THEORY
3.1 Pettitt Test
Pettit [10] developed a nonparametric test that is capable of locating the period (month or
year) where a break is likely. The null hypothesis is that the data is independent, identically
distributed random quantities, and the alternative is that a stepwise shift in the mean is present. The
test statistic is related to the Mann–Whitney statistic [11].
To detect a break point at a continuous data [10]:
1. The observations (�) are ranked from 1 to N (i.e. ��, ��, …, ��).

International Journal of Civil Engineering and Technology (IJCIET), ISSN 0976 – 6308 (Print),
ISSN 0976 – 6316(Online), Volume 5, Issue 5, May (2014), pp. 76-87 © IAEME
79
2. Estimate the value of ��,� :
��=� 1 � 2�� � � 1,2,3, … , � …………….………….……...…. (1)
where�� is the rank of �� in the sample of �observations.
3. Estimate the value of �� :
�� � ���� �� ……………………………………………… …….. (2)
�� � �� ………….……………………………………......……..….. (3)
4. Detecting the value of ��:
�� � max����� |��| ……...…………………...……......……… ...... (4)
5. Estimate the value of ��� :
6.
��� � 2 ��� !"#$"%&"#'( ………………….……………........…..……… (5)
If ��� ) * , where * is the statistical significance of the test, then the null hypothesis is rejected.
3.2 Bushand Test This test is used to detect a change in the mean by studying the cumulative deviation from the
mean. It bases on the adjusted partial sums or cumulative deviation from the mean. According to
Buishand [1] the null hypothesis is that the data are homogenous and normally distributed and the
alternative hypothesis is that there is a date at which a change in a mean is occurred. The adjusted
partial sum is defined as:
+,-=0 ;+.- � ∑ 0�� � �12.�3� , 4 � 1,2, … , � ….…...…………...…….. (6)
where:
�1 : the mean of time series observations (��, ��, … , ��)
4 : the number of the observation at which a break point is occurred
Rescaled adjusted partial sums are obtained by dividing the +.- ′s by the sample standard
deviation:
+.-- � +.-/67 , 4 � 1,2, … , � ….…………...…………......………. (7)
67 � 8∑ 0"9:; 79�712²� …………….………..……………......…….……. (8)
A statistic which can be used for testing homogeneity is:
< � max,�.��|+.--| ……………………………......……………..… (9)
International Journal of Civil Engineering and Technology (IJCIET), ISSN 0976 – 6308 (Print),
ISSN 0976 – 6316(Online), Volume 5, Issue 5, May (2014), pp. 76-87 © IAEME
80
</√�is then compared with the critical values given by Buishand [1]. If a calculated </√� is less
than a critical </√� the null hypothesis is accepted but if a calculated </√� is greater than a
critical </√� the null hypothesis should be rejected.
3.3 Double mass Curve Test The theory of double mass curve is based on the fact that a graph of the accumulation of one
quantity against the accumulation of another quantity during the same period will plot as a straight
line so long as the data are proportional; the slope of the line will represent the constant of
proportionality between the quantities. A break in the slope of the double-mass curve means that a
change in the constant of proportionality between the two variables has occurred or perhaps that the
proportionality is not a constant at all rates of accumulation. If the possibility of a variable ratio
between the two quantities can be ignored, a break in the slope indicates the time at which a change
occurs in the relation between the two quantities. The difference in the slope of the lines on either
side of the break in the slope indicates the degree of change in the relation.
The use of accumulations of two measured variables plotted as a double mass curve may give
indefinite results. To give more definite results, the accumulation of one of the variables can be
plotted against the accumulations of a pattern, which is composed of all similar records in a given
area. The pattern which is composed of the average of many records is less affected by an
inconsistency in the record of any one station[12].
The theory of the double-mass curve suggests the method of adjusting an inconsistent record:
�> � ?>/?@�@ …………………………………………………….. (10)
where:
�>: the adjusted data
�@: the observed data
?>: the slope of graph to which records are adjusted
?@: the slope of graph at time �@ was observed
Significance of an apparent break in the double-mass curve can be determined by an analysis-
of-variance test (or covariance). The statistics used in this test is F, the ratio of the among-periods
variance to the within periods variance. The larger apparent shift in the relation the larger this ratio
becomes.
The test consists of computing f,the variance ratio, from the data being tested and comparing
the computed value with the tabulated value of the F distribution for the level of significance
selected (generally 5%) [12].The null hypothesis is that the break point is not statically significant
and doesn’t need to be adjusted, while the alternative hypothesis is that the break is statistically
significant and needs to be adjusted. The steps of computing f value is are explained in Searcy and
Hardison [12].
If A is smaller than F(α,k-1,N-k), where α is a level of significance (generally 5%), then the
null hypothesis is accepted but if A is larger than F(α,k-1,N-k) then the null hypothesis must be
rejected and the break is statistically significant and it should be adjusted.
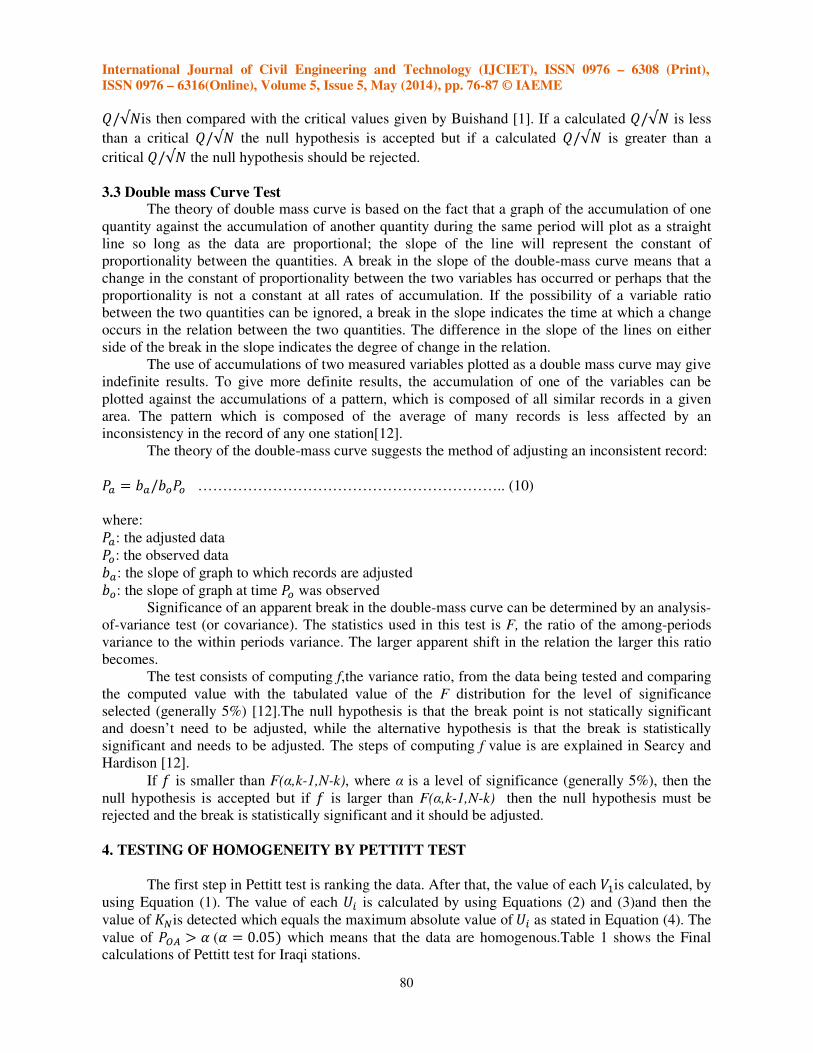
4. TESTING OF HOMOGENEITY BY PETTITT TEST
The first step in Pettitt test is ranking the data. After that, the value of each ��is calculated, by
using Equation (1). The value of each �� is calculated by using Equations (2) and (3)and then the
value of ��is detected which equals the maximum absolute value of �� as stated in Equation (4). The
value of ��� B * (* � 0.052 which means that the data are homogenous.Table 1 shows the Final
calculations of Pettitt test for Iraqi stations.
International Journal of Civil Engineering and Technology (IJCIET), ISSN 0976 – 6308 (Print),
ISSN 0976 – 6316(Online), Volume 5, Issue 5, May (2014), pp. 76-87 © IAEME
81
Table (1): Final calculations of Pettitt test for Iraqi stations
Station Sample Size
(N)
Significance
Level (α) �� ���
Mosul 492 0.05 4568 0.700489714
Kirkuk 492 0.05 5405 0.288621138
Khanaqin 492 0.05 4366 0.76702084
Ramadi 360 0.05 3310 0.490704409
Baghdad 492 0.05 2708 1.383267725
Hilla 372 0.05 5278 0.078473797
Karbala 492 0.05 4935 0.587826385
Najaf 492 0.05 3332 1.454581077
Diwaniyah 492 0.05 3108 1.230576698
Samawa 492 0.05 5376 0.467692963
Nasiriyah 492 0.05 3834 0.955127429
Amara 492 0.05 2586 1.428923379
Basrah 492 0.05 4699 0.659013415
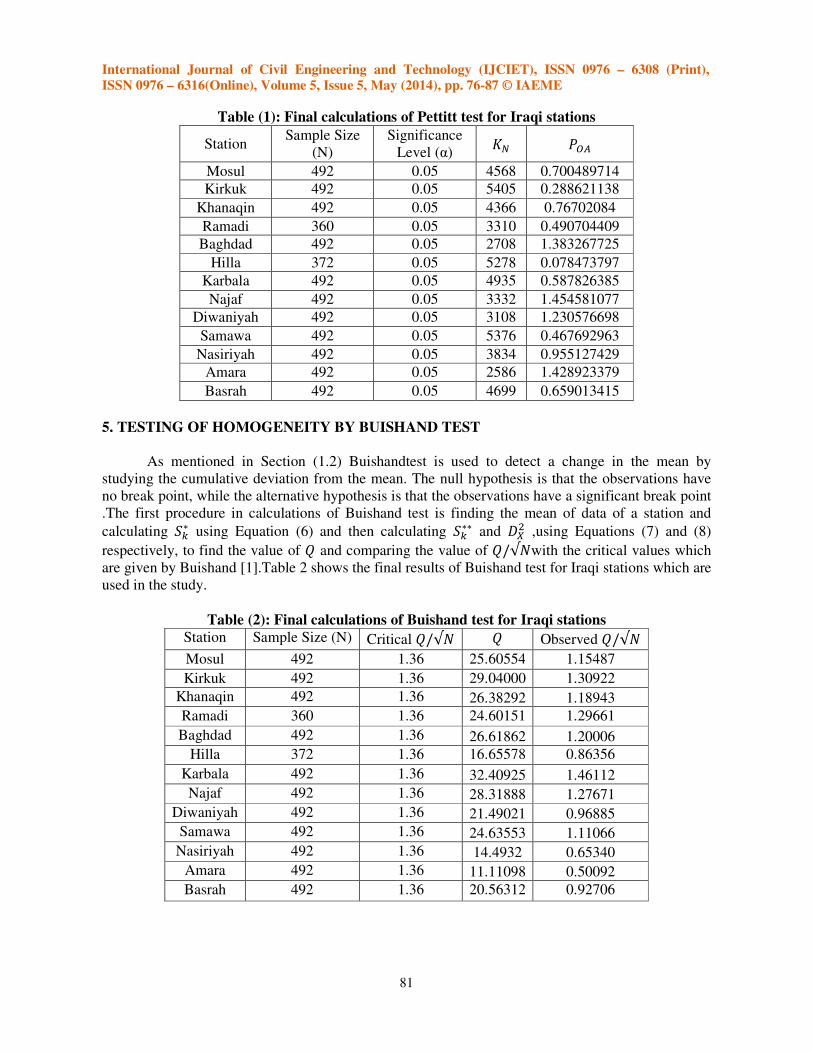
5. TESTING OF HOMOGENEITY BY BUISHAND TEST
As mentioned in Section (1.2) Buishandtest is used to detect a change in the mean by
studying the cumulative deviation from the mean. The null hypothesis is that the observations have
no break point, while the alternative hypothesis is that the observations have a significant break point
.The first procedure in calculations of Buishand test is finding the mean of data of a station and
calculating +.- using Equation (6) and then calculating +.-- and 67� ,using Equations (7) and (8)
respectively, to find the value of < and comparing the value of </√�with the critical values which
are given by Buishand [1].Table 2 shows the final results of Buishand test for Iraqi stations which are
used in the study.
Table (2): Final calculations of Buishand test for Iraqi stations
Station Sample Size (N) Critical </√� < Observed </√�
Mosul 492 1.36 25.60554 1.15487
Kirkuk 492 1.36 29.04000 1.30922
Khanaqin 492 1.36 26.38292 1.18943
Ramadi 360 1.36 24.60151 1.29661
Baghdad 492 1.36 26.61862 1.20006
Hilla 372 1.36 16.65578 0.86356
Karbala 492 1.36 32.40925 1.46112
Najaf 492 1.36 28.31888 1.27671
Diwaniyah 492 1.36 21.49021 0.96885
Samawa 492 1.36 24.63553 1.11066
Nasiriyah 492 1.36 14.4932 0.65340
Amara 492 1.36 11.11098 0.50092
Basrah 492 1.36 20.56312 0.92706
International Journal of Civil Engineering and Technology (IJCIET), ISSN 0976 – 6308 (Print),
ISSN 0976 – 6316(Online), Volume 5, Issue 5, May (2014), pp. 76-87 © IAEME
82
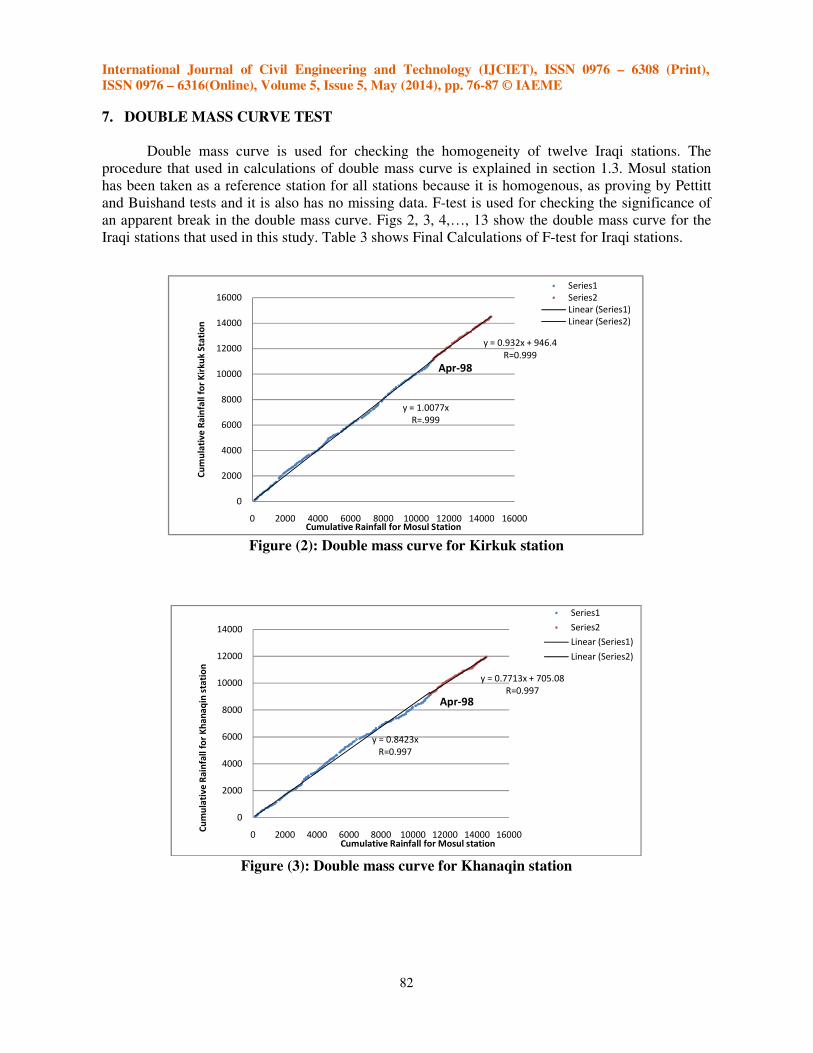
7. DOUBLE MASS CURVE TEST
Double mass curve is used for checking the homogeneity of twelve Iraqi stations. The
procedure that used in calculations of double mass curve is explained in section 1.3. Mosul station
has been taken as a reference station for all stations because it is homogenous, as proving by Pettitt
and Buishand tests and it is also has no missing data. F-test is used for checking the significance of
an apparent break in the double mass curve. Figs 2, 3, 4,…, 13 show the double mass curve for the
Iraqi stations that used in this study. Table 3 shows Final Calculations of F-test for Iraqi stations.
Figure (2): Double mass curve for Kirkuk station
Figure (3): Double mass curve for Khanaqin station
y = 1.0077x
R=.999
y = 0.932x + 946.4
R=0.999
0
2000
4000
6000
8000
10000
12000
14000
16000
0 2000 4000 6000 8000 10000 12000 14000 16000
Cu
mu
lati
ve
Ra
infa
ll f
or
Kir
ku
k S
tati
on
Cumulative Rainfall for Mosul Station
Apr-98
Series1
Series2
Linear (Series1)
Linear (Series2)
y = 0.8423x
R=0.997
y = 0.7713x + 705.08
R=0.997
0
2000
4000
6000
8000
10000
12000
14000
0 2000 4000 6000 8000 10000 12000 14000 16000
Cu
mu
lati
ve
Ra
infa
ll f
or
Kh
an
aq
in s
tati
on
Cumulative Rainfall for Mosul station
Apr-98
Series1
Series2
Linear (Series1)
Linear (Series2)
International Journal of Civil Engineering and Technology (IJCIET), ISSN 0976 – 6308 (Print),
ISSN 0976 – 6316(Online), Volume 5, Issue 5, May (2014), pp. 76-87 © IAEME
83
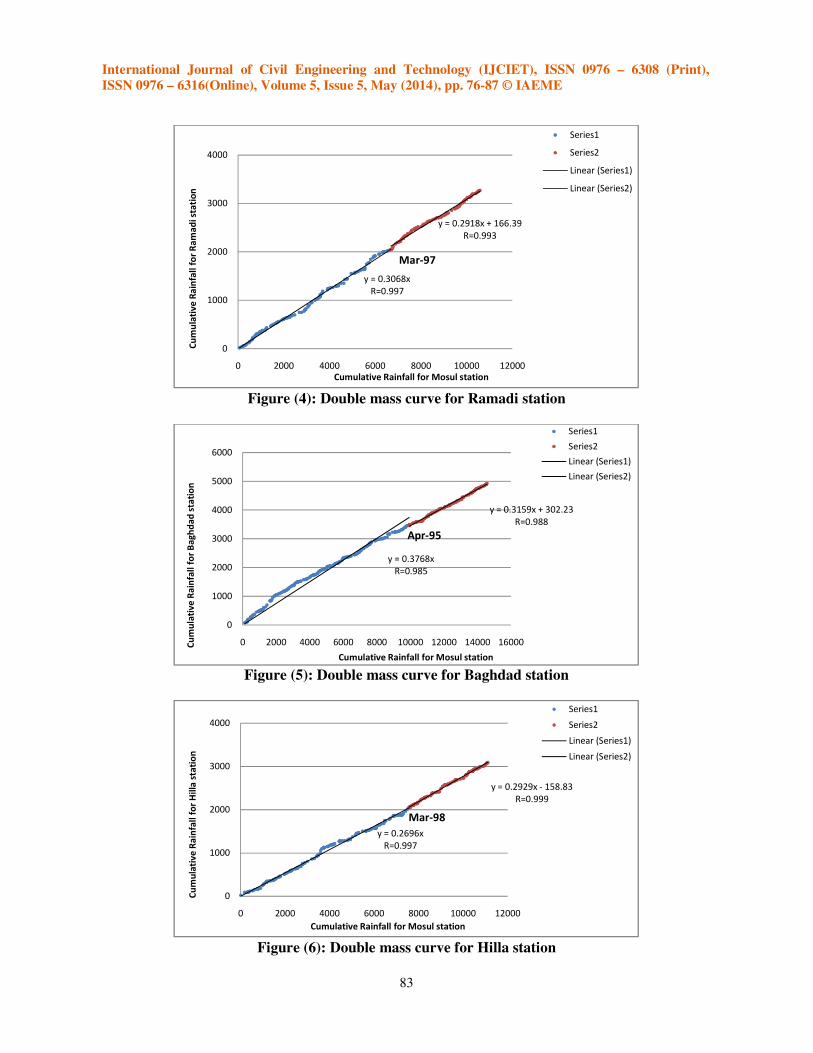
Figure (4): Double mass curve for Ramadi station
Figure (5): Double mass curve for Baghdad station
Figure (6): Double mass curve for Hilla station
y = 0.3068x
R=0.997
y = 0.2918x + 166.39
R=0.993
0
1000
2000
3000
4000
0 2000 4000 6000 8000 10000 12000
Cu
mu
lati
ve
Ra
infa
ll f
or
Ra
ma
di st
ati
on
Cumulative Rainfall for Mosul station
Mar-97
Series1
Series2
Linear (Series1)
Linear (Series2)
y = 0.3768x
R=0.985
y = 0.3159x + 302.23
R=0.988
0
1000
2000
3000
4000
5000
6000
0 2000 4000 6000 8000 10000 12000 14000 16000Cu
mu
lati
ve
Ra
infa
ll f
or
Ba
gh
da
d s
tati
on
Cumulative Rainfall for Mosul station
Apr-95
Series1
Series2
Linear (Series1)
Linear (Series2)
y = 0.2696x
R=0.997
y = 0.2929x - 158.83
R=0.999
0
1000
2000
3000
4000
0 2000 4000 6000 8000 10000 12000
Cu
mu
lati
ve
Ra
infa
ll f
or
Hil
la s
tati
on
Cumulative Rainfall for Mosul station
Mar-98
Series1
Series2
Linear (Series1)
Linear (Series2)

International Journal of Civil Engineering and Technology (IJCIET), ISSN 0976 – 6308 (Print),
ISSN 0976 – 6316(Online), Volume 5, Issue 5, May (2014), pp. 76-87 © IAEME
84
Figure (7): Double mass curve for Karbala station
Figure (8): Double mass curve for Najaf station
Figure (9): Double mass curve for Diwaniyah station
y = 0.3005x
R=0.991
y = 0.2234x + 717.16
R=0.999
0
1000
2000
3000
4000
5000
0 2000 4000 6000 8000 10000 12000 14000 16000Cu
mu
lati
ve
Ra
infa
ll
for
Ka
rba
la s
tati
on
Cumulative for Mosul station
Mar-98
Series1
Series2
Linear (Series1)
Linear (Series2)
y = 0.2955x
R=0.997
y = 0.239x + 536.91
R=0.995
0
1000
2000
3000
4000
5000
0 2000 4000 6000 8000 10000 12000 14000 16000Cu
mu
lati
ve
Ra
infa
ll f
or
Na
jaf
sta
tio
n
Cumulative Rainfall for Mosul station
Mar-98
Series1
Series2
Linear (Series1)
Linear (Series2)
y = 0.2977x
R=0.995
y = 0.2428x + 887.38
R=0.996
0
1000
2000
3000
4000
5000
0 2000 4000 6000 8000 10000 12000 14000 16000
Cu
mu
lati
ve
Ra
infa
llfo
r D
iwa
niy
ah
sta
tio
n
Cumulative Rainfall for Mosul station
Apr-02
Series1
Series2
Linear (Series1)
Linear (Series2)
International Journal of Civil Engineering and Technology (IJCIET), ISSN 0976 – 6308 (Print),
ISSN 0976 – 6316(Online), Volume 5, Issue 5, May (2014), pp. 76-87 © IAEME
85
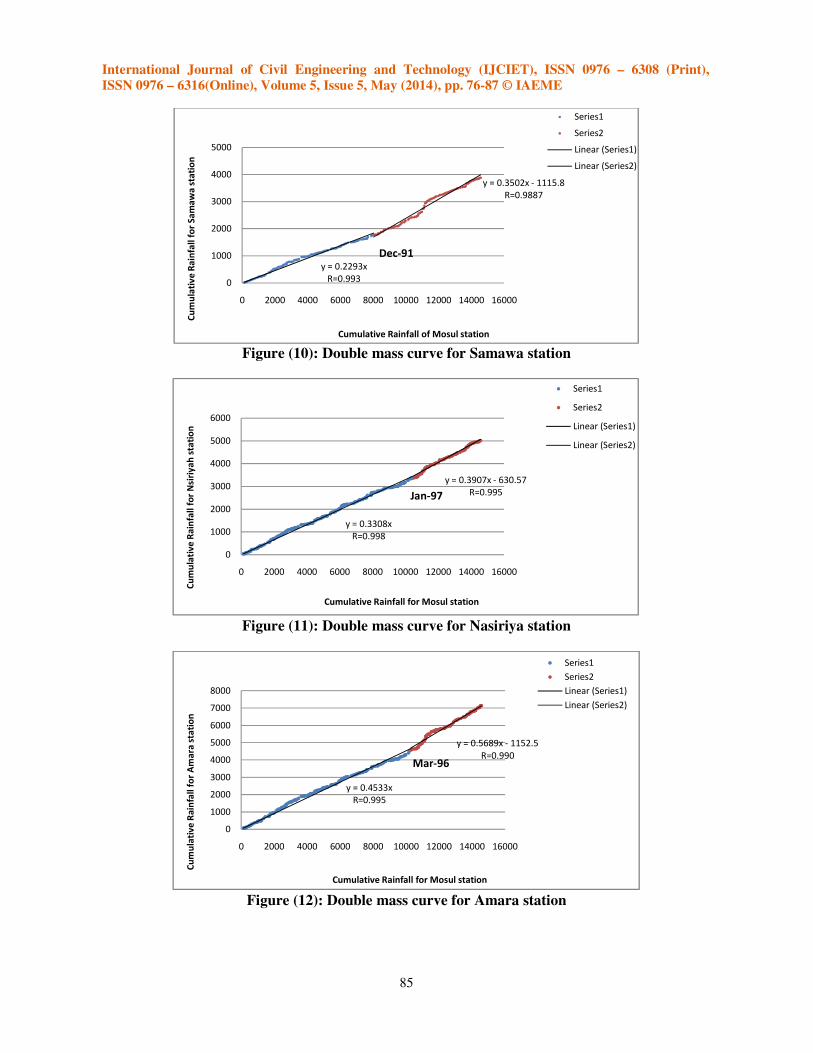
Figure (10): Double mass curve for Samawa station
Figure (11): Double mass curve for Nasiriya station
Figure (12): Double mass curve for Amara station
y = 0.2293x
R=0.993
y = 0.3502x - 1115.8
R=0.9887
0
1000
2000
3000
4000
5000
0 2000 4000 6000 8000 10000 12000 14000 16000
Cu
mu
lati
ve
Ra
infa
ll f
or
Sa
ma
wa
sta
tio
n
Cumulative Rainfall of Mosul station
Dec-91
Series1
Series2
Linear (Series1)
Linear (Series2)
y = 0.3308x
R=0.998
y = 0.3907x - 630.57
R=0.995
0
1000
2000
3000
4000
5000
6000
0 2000 4000 6000 8000 10000 12000 14000 16000
Cu
mu
lati
ve
Ra
infa
ll f
or
Nsi
riy
ah
sta
tio
n
Cumulative Rainfall for Mosul station
Jan-97
Series1
Series2
Linear (Series1)
Linear (Series2)
y = 0.4533x
R=0.995
y = 0.5689x - 1152.5
R=0.990
0
1000
2000
3000
4000
5000
6000
7000
8000
0 2000 4000 6000 8000 10000 12000 14000 16000
Cu
mu
lati
ve
Ra
infa
ll f
or
Am
ara
sta
tio
n
Cumulative Rainfall for Mosul station
Mar-96
Series1
Series2
Linear (Series1)
Linear (Series2)
International Journal of Civil Engineering and Technology (IJCIET), ISSN 0976 – 6308 (Print),
ISSN 0976 – 6316(Online), Volume 5, Issue 5, May (2014), pp. 76-87 © IAEME
86
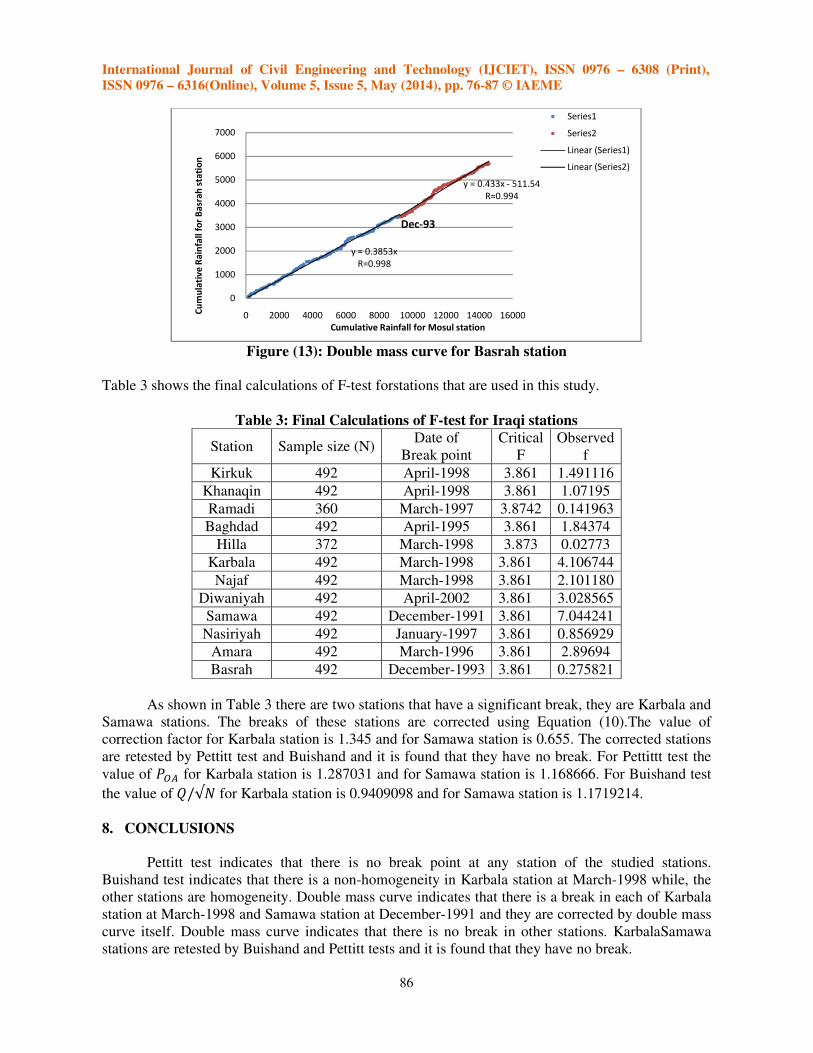
Figure (13): Double mass curve for Basrah station
Table 3 shows the final calculations of F-test forstations that are used in this study.
Table 3: Final Calculations of F-test for Iraqi stations
Station Sample size (N) Date of
Break point
Critical
F
Observed
f
Kirkuk 492 April-1998 3.861 1.491116
Khanaqin 492 April-1998 3.861 1.07195
Ramadi 360 March-1997 3.8742 0.141963
Baghdad 492 April-1995 3.861 1.84374
Hilla 372 March-1998 3.873 0.02773
Karbala 492 March-1998 3.861 4.106744
Najaf 492 March-1998 3.861 2.101180
Diwaniyah 492 April-2002 3.861 3.028565
Samawa 492 December-1991 3.861 7.044241
Nasiriyah 492 January-1997 3.861 0.856929
Amara 492 March-1996 3.861 2.89694
Basrah 492 December-1993 3.861 0.275821
As shown in Table 3 there are two stations that have a significant break, they are Karbala and
Samawa stations. The breaks of these stations are corrected using Equation (10).The value of
correction factor for Karbala station is 1.345 and for Samawa station is 0.655. The corrected stations
are retested by Pettitt test and Buishand and it is found that they have no break. For Pettittt test the
value of ��� for Karbala station is 1.287031 and for Samawa station is 1.168666. For Buishand test
the value of </√� for Karbala station is 0.9409098 and for Samawa station is 1.1719214.
8. CONCLUSIONS
Pettitt test indicates that there is no break point at any station of the studied stations.
Buishand test indicates that there is a non-homogeneity in Karbala station at March-1998 while, the
other stations are homogeneity. Double mass curve indicates that there is a break in each of Karbala
station at March-1998 and Samawa station at December-1991 and they are corrected by double mass
curve itself. Double mass curve indicates that there is no break in other stations. KarbalaSamawa
stations are retested by Buishand and Pettitt tests and it is found that they have no break.
y = 0.3853x
R=0.998
y = 0.433x - 511.54
R=0.994
0
1000
2000
3000
4000
5000
6000
7000
0 2000 4000 6000 8000 10000 12000 14000 16000Cu
mu
lati
ve
Ra
infa
ll f
or
Ba
sra
h s
tati
on
Cumulative Rainfall for Mosul station
Dec-93
Series1
Series2
Linear (Series1)
Linear (Series2)
International Journal of Civil Engineering and Technology (IJCIET), ISSN 0976 – 6308 (Print),
ISSN 0976 – 6316(Online), Volume 5, Issue 5, May (2014), pp. 76-87 © IAEME
87
9. REFERENCES
1. Buishand T. A., “Some Methods for Testing the Homogeneity of Rainfall Records”, Journal of
Hydrology, Elsevier Scientific Publishing Company, Amsterdam, Netherlands, 58, 1982,
PP. (11-27).
2. Busuioc A. and Storch H. V., “Changes in the Winter Precipitation in Romania and its
Relation to the Large-Scale Circulation”, Munksgraad, Tellus, U. K., Vol. 48A, 1996,
PP. (538-552).
3. Tarhule A. and Woo M. K., “Changes in Rainfall Characteristics in Northern Nigeria”,
International Journal of Climatology, Royal Meteorological Society, 18, 1998,
PP. (1261–1271).
4. Karabork M. C., Kahya E. and Komuscu A. U., “Analysis of Turkish Precipitation Data:
Homogeneity and the Southern Oscillation Forcings on Frequency Distributions”,
Hydrological Processes, John Wiley & Sons, Ltd., 21, 2007, PP.(3203–3210).
5. Kang H. M. and Yusof F., “Homogeneity Tests on Daily Rainfall Series in Peninsular
Malaysia”, Int. J. Contemp. Math. Sciences, Department of Mathematics, Johor, Malaysia
Vol. 7, No. 1, 2012, PP. (9 – 22).
6. Arndt D. S. and Redmond K. T., “Toward an Automated Tool for Detecting Relationship
Changes within Series of Observations”, Paper, Posted at the internet website
https://ams.confex.com/ams/pdfpapers/72826. pdf, 2004.
7. Metzger L. and Sohn S. J., “Validation of APCC Precipitation Forecasts by Using Hydrologic
Models”, Report, APEC Climate Center, Busan, Korea, 2011.
8. Frenken K., Irrigation in the Middle East region in figures”, Survay, Food and Agriculture
Organization of the United Nations (FAO), Rome, Italy, ISBN 978-92-5-106316-3, 2009.
9. Iraqi Meteorological Office, Baghdad, Iraq.
10. Pettitt A. N., “A Non-Parametric Approach to the Change-Point Problem”, Applied Statistics,
Leics, England, 28, No. 2, 1979, PP. (126-135).
11. Costa A. C. M., Negreiros J. and Soares A., “Identification of Inhomogeneities in Precipitation
Time Series Using Stochastic Simulation”, Springer Science+Business Media, 2008,
PP.(275–282).
12. Searcy J. K. and Hardison C. H., “Double-Mass Curves”, Geological Water Supply Paper
1541-8, Geological Survey, Washington, U.S, 1960.
Related Documents