Advanced Placement Macroeconomics Table of Information The table below contains essential equations, formulas, and graphs that you must know for the AP Macroeconomics exam. The formula sheet is divided up based on the six units of study that organize the AP Macro course. Each of the equations and graphs included below correspond with a specific task or skill that is explicitly indicated in the AP Macro Course Description as an area of knowledge you will be accountable for on the exam. Additional key terms and definitions are included in the final section of this formula sheet. Unit 1: Basic Economic Concepts 1.2: Calculate opportunity cost Note that opportunity costs are always expressed in terms of the good that is given up. 1.3: Calculate mutually beneficial terms of trade Mutually beneficial terms of trade are determined by looking at the two opportunity costs plotted on a Production Possibilities Curve (PPC) Model and choosing a number that falls between the opportunity costs. Key graph:

Welcome message from author
This document is posted to help you gain knowledge. Please leave a comment to let me know what you think about it! Share it to your friends and learn new things together.
Transcript
Advanced Placement Macroeconomics Table of Information
The table below contains essential equations, formulas, and graphs that you must know for theAP Macroeconomics exam. The formula sheet is divided up based on the six units of study thatorganize the AP Macro course. Each of the equations and graphs included below correspondwith a specific task or skill that is explicitly indicated in the AP Macro Course Description as anarea of knowledge you will be accountable for on the exam. Additional key terms and definitionsare included in the final section of this formula sheet.
Unit 1: Basic Economic Concepts
1.2: Calculate opportunity cost
Note that opportunity costs are always expressed in terms of the good that is given up.
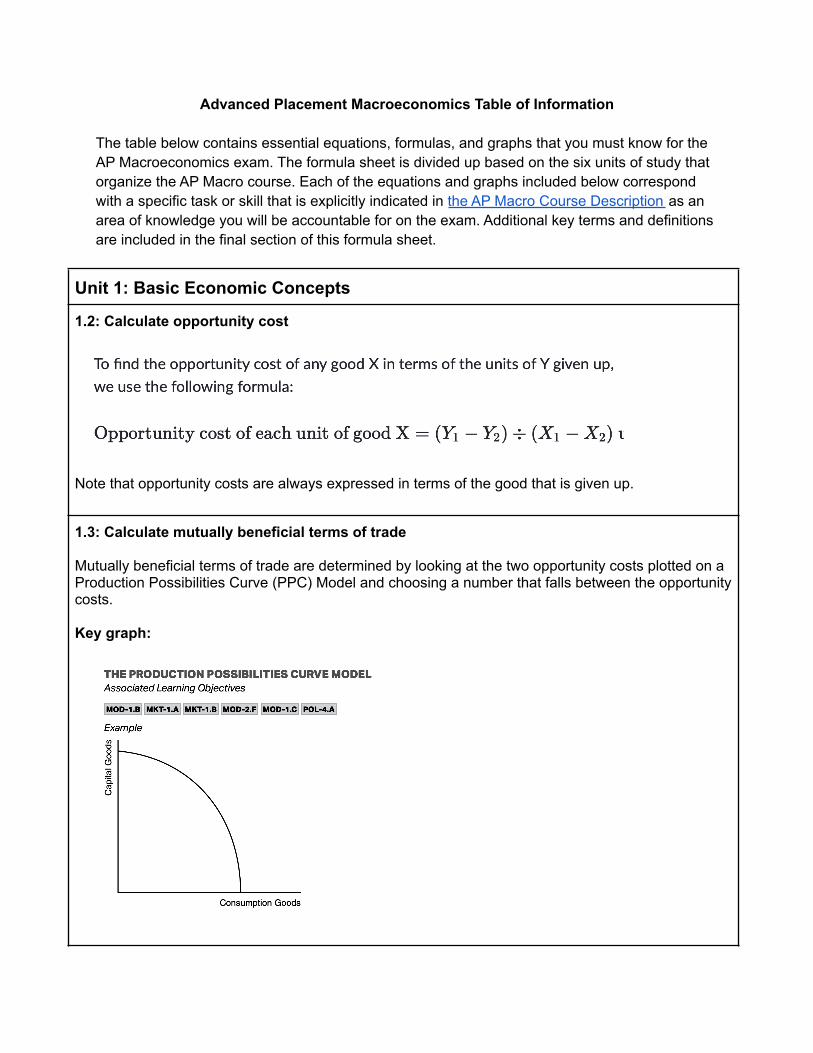
1.3: Calculate mutually beneficial terms of trade
Mutually beneficial terms of trade are determined by looking at the two opportunity costs plotted on aProduction Possibilities Curve (PPC) Model and choosing a number that falls between the opportunitycosts.
Key graph:
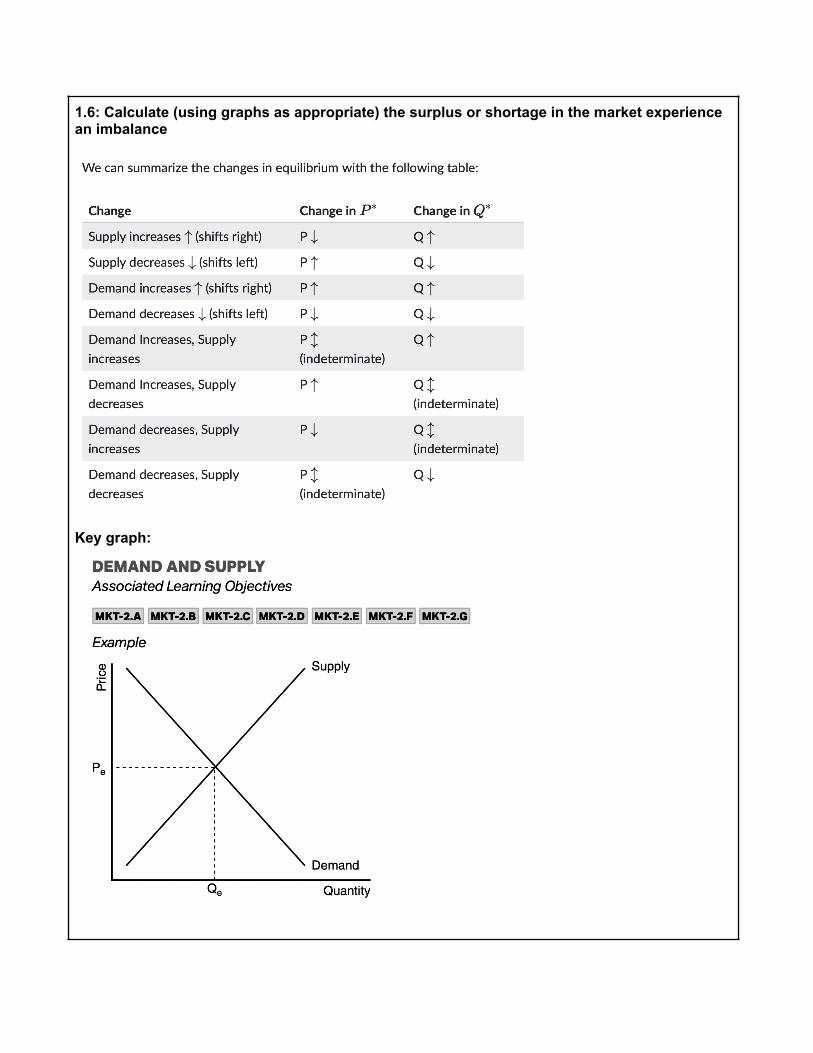
1.6: Calculate (using graphs as appropriate) the surplus or shortage in the market experiencean imbalance
Key graph:
Unit 2: Economic Indicators and the Business Cycle
2.1: Calculate nominal GDP
2.3: Calculate the unemployment rate and the labor force participation rate (LFPR)
The unemployment rate is the percentage of the labor force that is unemployed:
The LFPR is the percentage of the eligible population that is in the labor force:
2.4: Calculate the CPI, the inflation rate, and changes in real variables
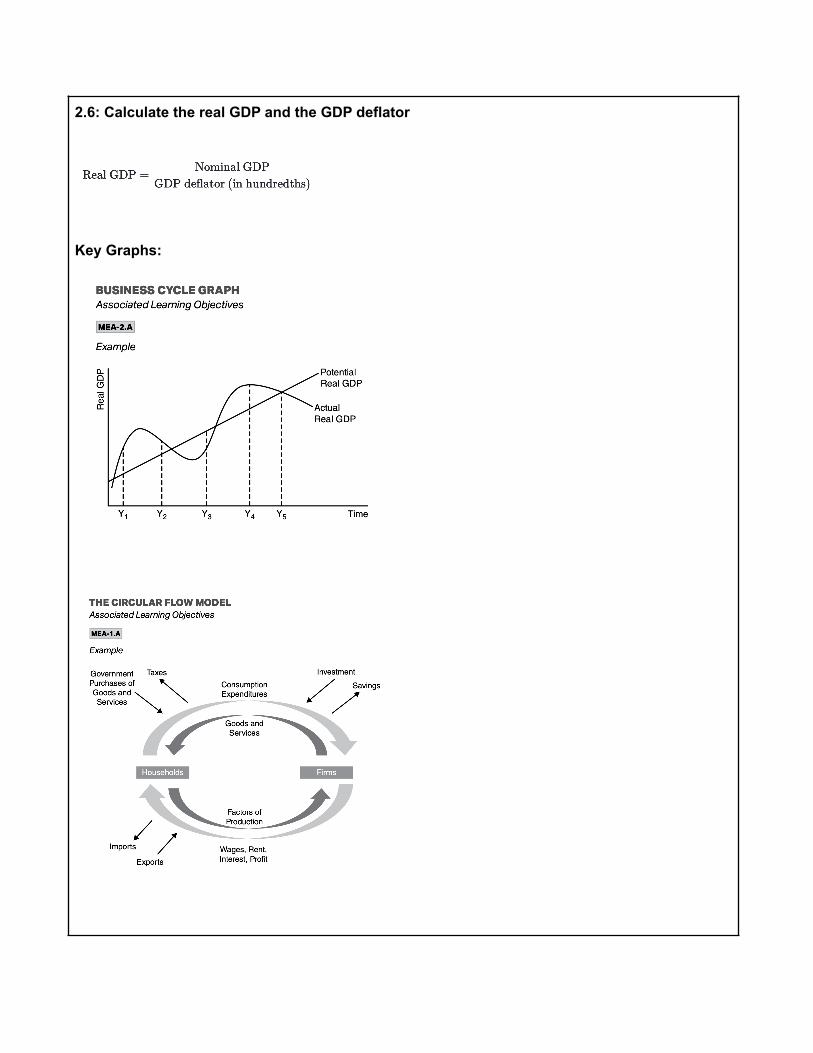
2.6: Calculate the real GDP and the GDP deflator
Key Graphs:
Unit 3: National Income and Price Determination
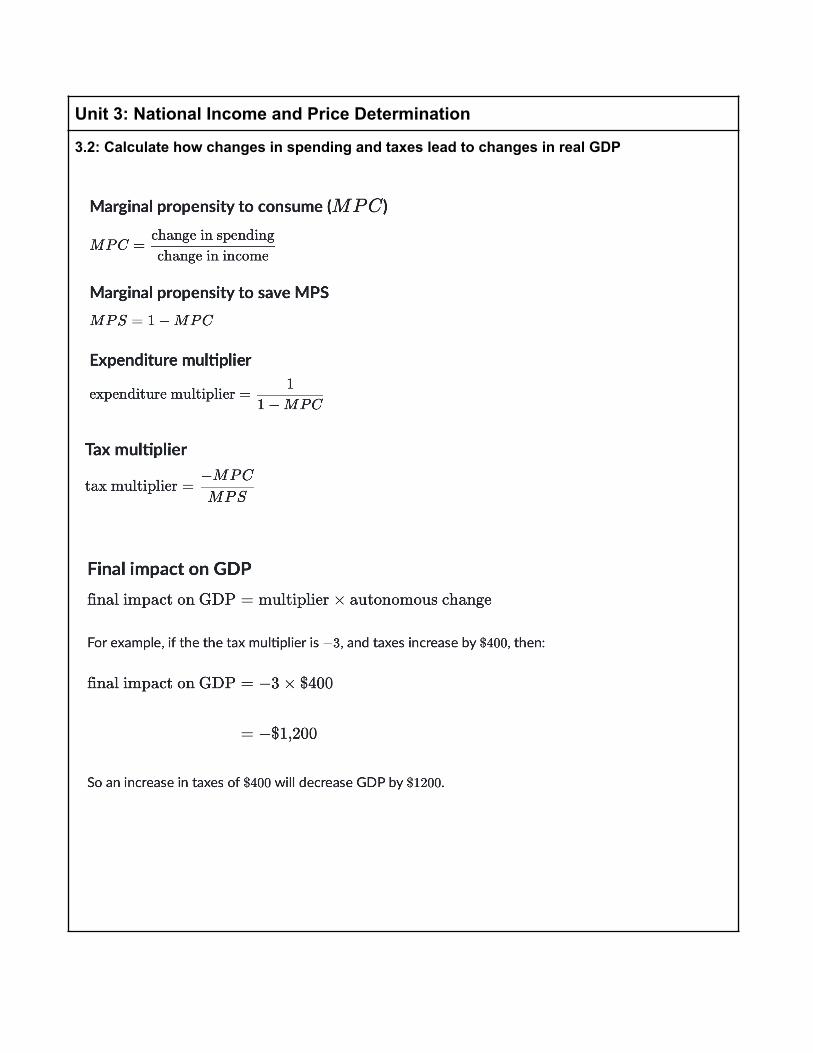
3.2: Calculate how changes in spending and taxes lead to changes in real GDP
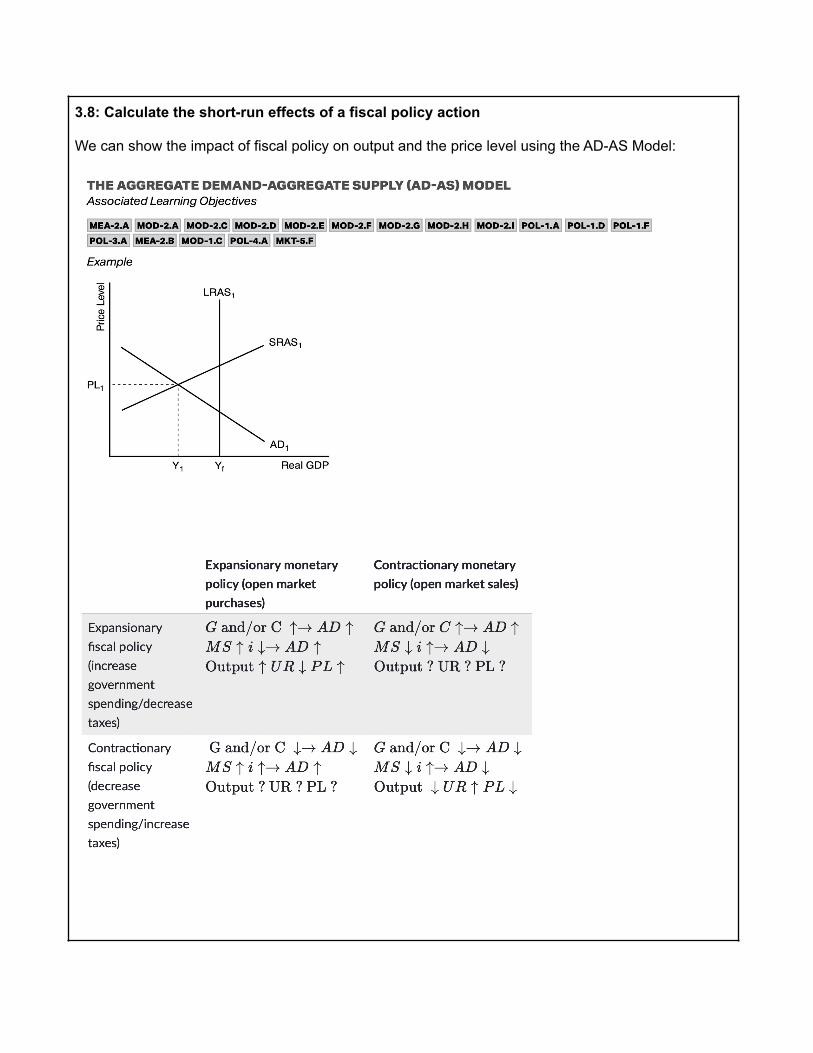
3.8: Calculate the short-run effects of a fiscal policy action
We can show the impact of fiscal policy on output and the price level using the AD-AS Model:
Unit 4: Financial Sector
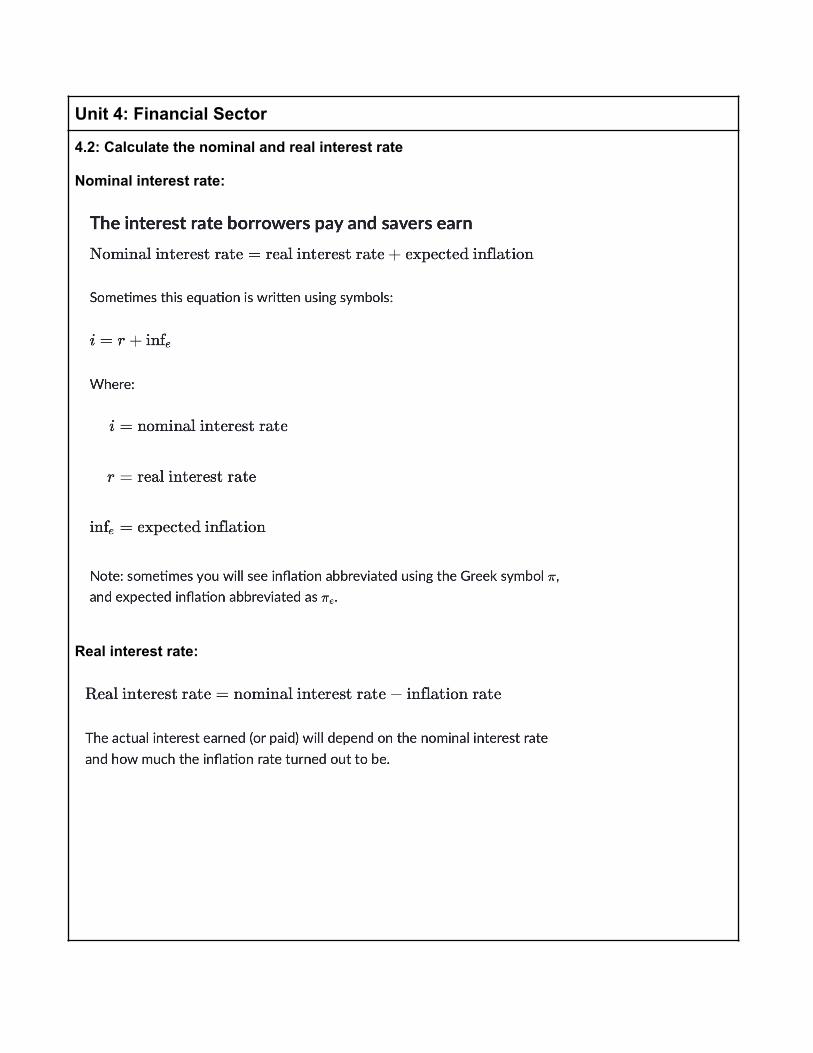
4.2: Calculate the nominal and real interest rate
Nominal interest rate:
Real interest rate:
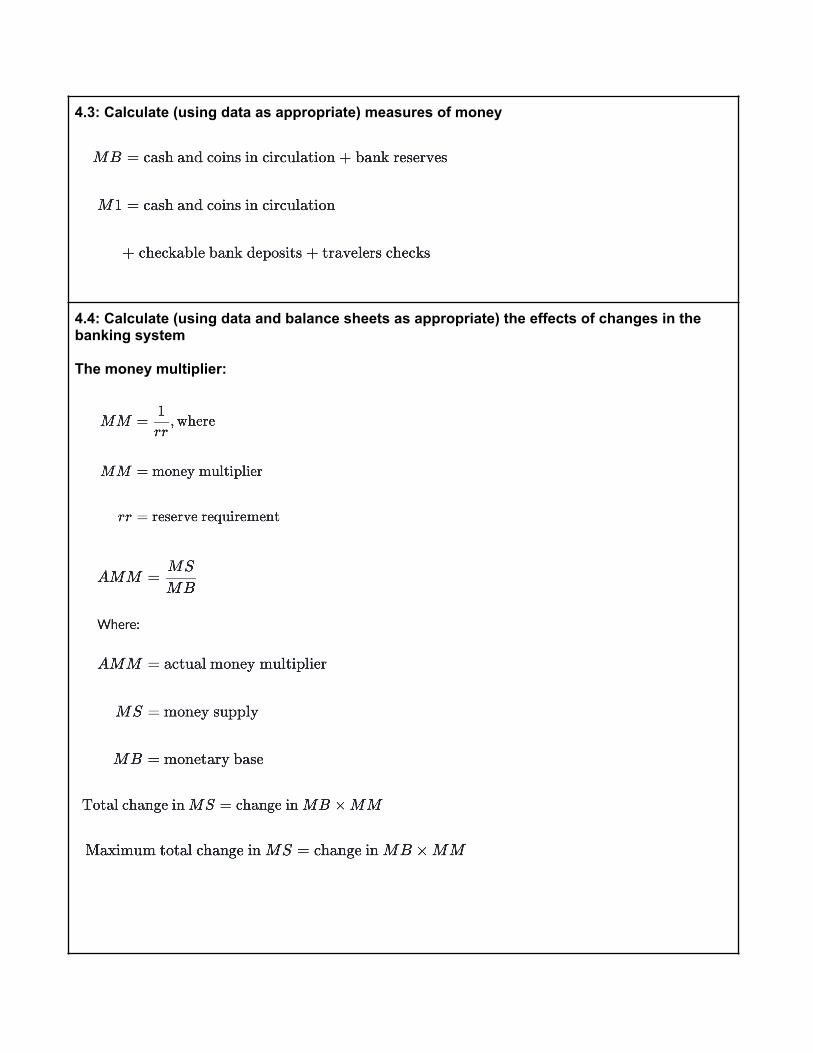
4.3: Calculate (using data as appropriate) measures of money
4.4: Calculate (using data and balance sheets as appropriate) the effects of changes in thebanking system
The money multiplier:
Calculate excess reserves:
Maximum new loans from a deposit:
Maximum increase in loans = (Deposit - reserves) x money multiplier
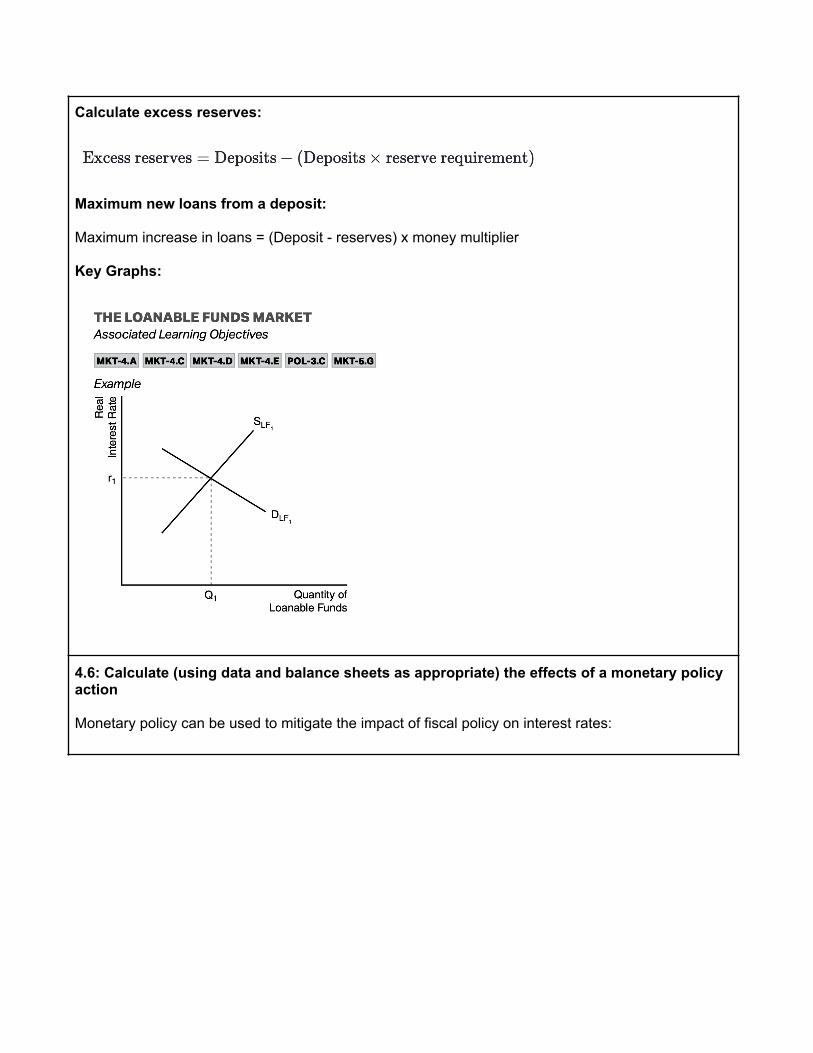
Key Graphs:
4.6: Calculate (using data and balance sheets as appropriate) the effects of a monetary policyaction
Monetary policy can be used to mitigate the impact of fiscal policy on interest rates:
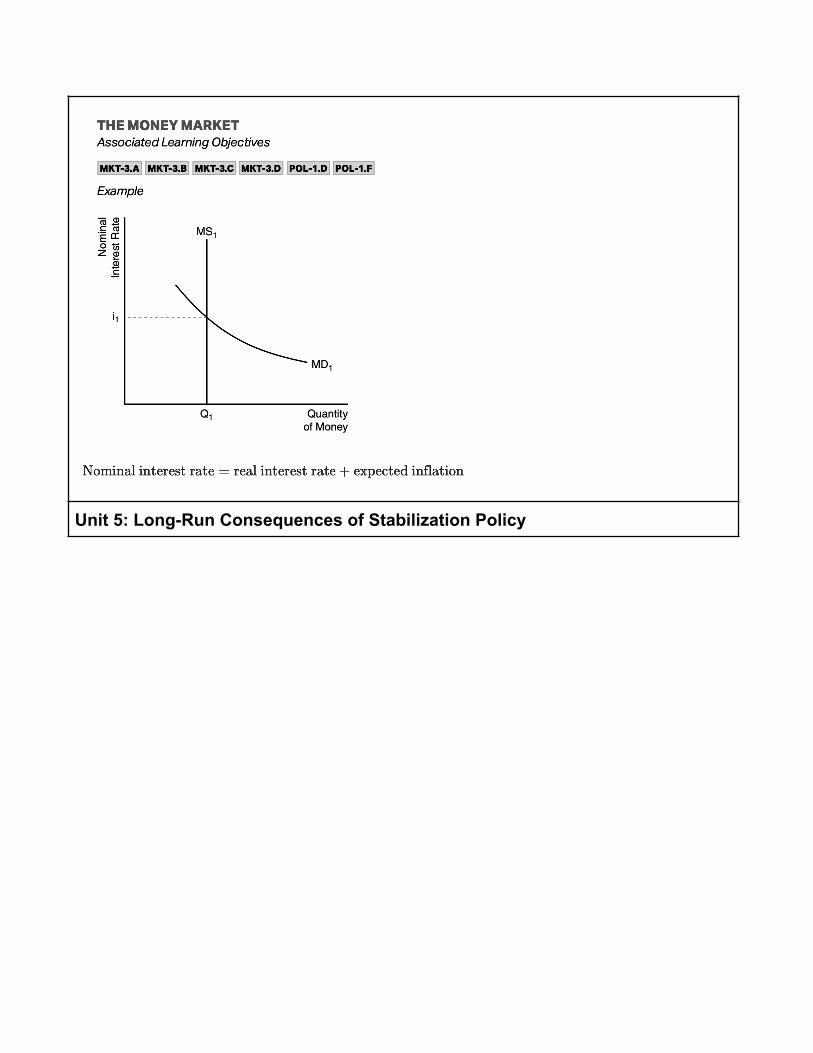
Unit 5: Long-Run Consequences of Stabilization Policy
5.3: Calculate the money supply, velocity, the price level, and real output using the quantitytheory of money
The equation of exchange:
The equation of exchange states that the effective money supply is equal to nominal GDP:
𝑀 𝑥 𝑉 = 𝑃 𝑥 𝑌
Where:
the effective money supply is the money supply multiplied by the velocity of money𝑀 𝑥 𝑉 = (𝑀) (𝑉)
is the price level multiplied by real GDP𝑃 𝑥 𝑌 = (𝑃) (𝑌)
Note that is the same as nominal GDP.𝑃 𝑥 𝑌
The quantity theory of money:
Or, alternatively:
5.6: Calculate (using graphs and data as appropriate) per capita GDP and economic growth
GDP per capita = GDP/population
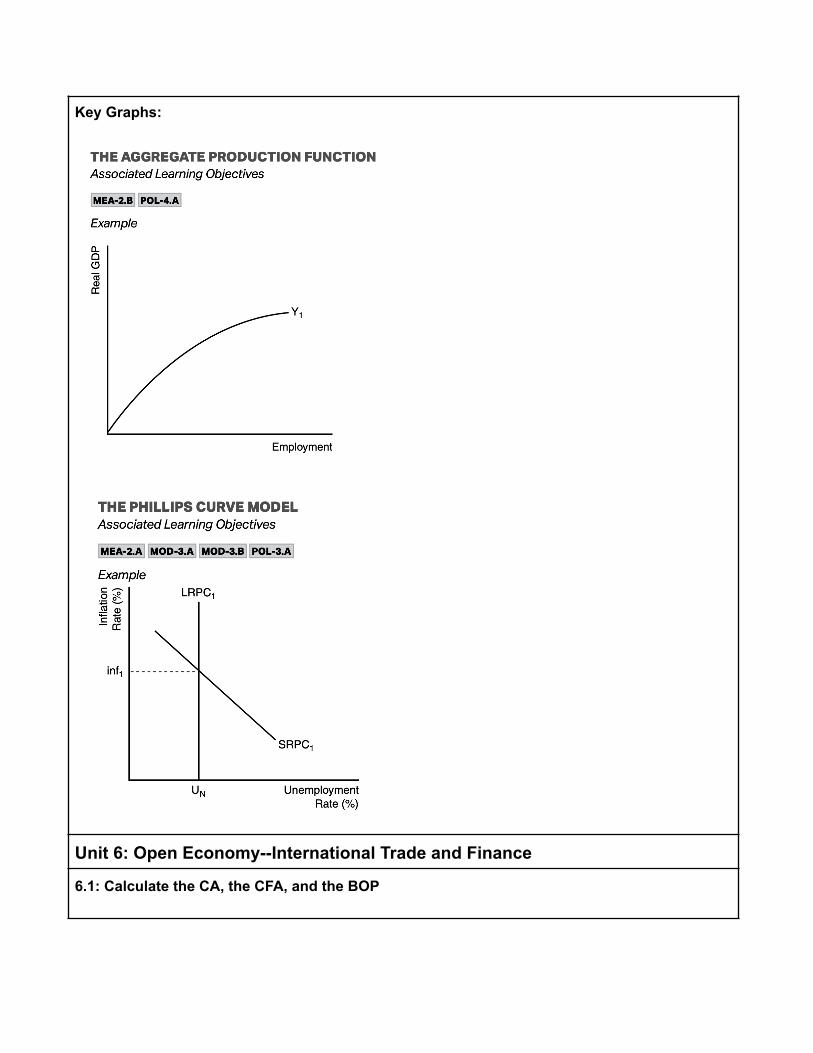
Key Graphs:
Unit 6: Open Economy--International Trade and Finance
6.1: Calculate the CA, the CFA, and the BOP
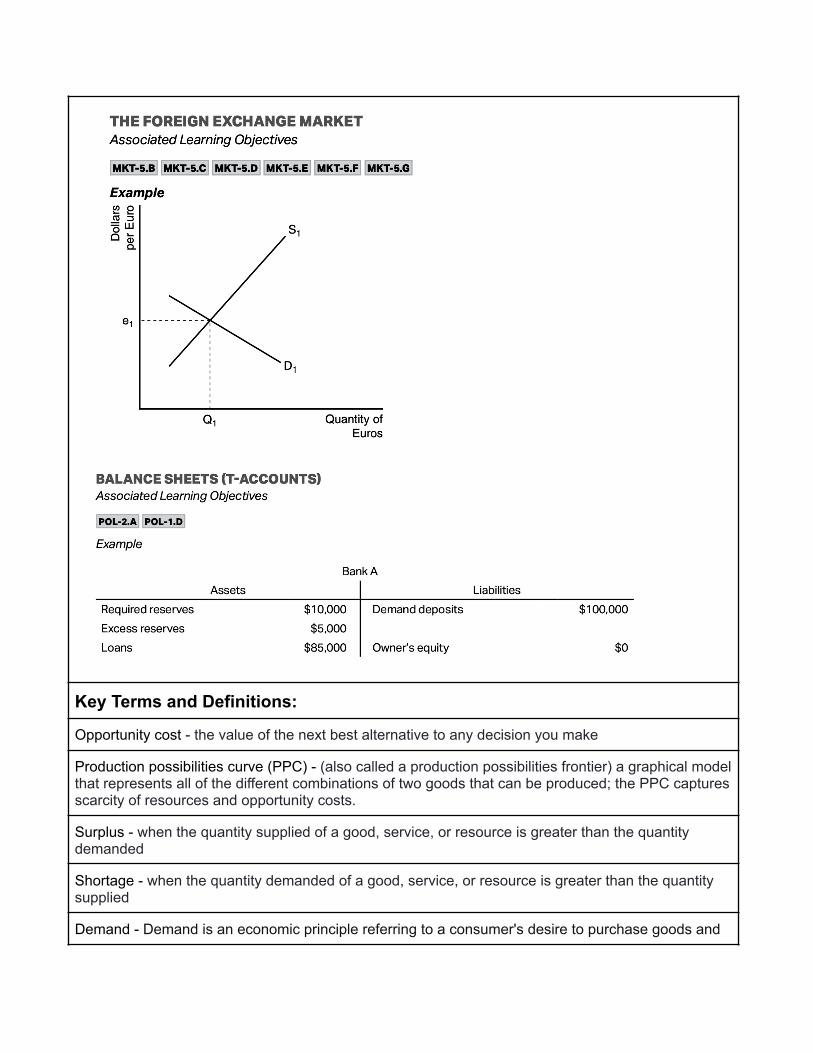
6.2: Calculate the value of one currency relative to another
Key Graphs:
Key Terms and Definitions:
Opportunity cost - the value of the next best alternative to any decision you make
Production possibilities curve (PPC) - (also called a production possibilities frontier) a graphical modelthat represents all of the different combinations of two goods that can be produced; the PPC capturesscarcity of resources and opportunity costs.
Surplus - when the quantity supplied of a good, service, or resource is greater than the quantitydemanded
Shortage - when the quantity demanded of a good, service, or resource is greater than the quantitysupplied
Demand - Demand is an economic principle referring to a consumer's desire to purchase goods and
services and willingness to pay a price for a specific good or service
Supply - describes the total amount of a specific good or service that is available to consumers
Equilibrium - in a market setting, an equilibrium occurs when price has adjusted until quantitysupplied is equal to quantity demanded
Disequilibrium - in a market setting, disequilibrium occurs when quantity supplied is not equal to thequantity demanded; when a market is experiencing a disequilibrium, there will be either a shortage ora surplus.
GDP - measures the value of the output of all goods and services produced within the country in ayear
Nominal GDP - the market value of the final production of goods and services within a country in agiven period using that year’s prices (also called “current prices”)
Real GDP - nominal GDP adjusted for changes in the price level, using prices from a base year(constant prices) instead of “current prices” used in nominal GDP; real GDP adjusts the level ofoutput for any price changes that may have occurred over time
GDP deflator - a price index used to adjust nominal GDP to find real GDP; the GDP deflatormeasures the average prices of all finished goods and services produced within a nation’s bordersover time.
Unemployment rate - when people are not working, but they are actively looking for work; forexample, Glenn did not work at all last week, though he tried to find a job, so he is consideredunemployed.
Labor force participation rate - the percentage of the eligible population that is in the labor force
CPI - an index that calculates the cost of a market basket of goods purchased by a typical family thatlives in an urban area; the purpose of the CPI is to track changes in the cost of living over time.
Inflation rate - the pace at which the overall price level is increasing; this is the percentage increase inthe price level from one period to the next.
Circular flow model - GDP can be represented by the circular flow diagram as a flow of income goingin one direction and expenditures on goods, services, and resources going in the opposite direction.In this diagram, households buy goods and services from businesses and businesses buy resourcesfrom households.
AD-AS model - The AD-AS (aggregate demand-aggregate supply) model is a way of illustratingnational income determination and changes in the price level. We can use this to illustrate phases ofthe business cycle and how different events can lead to changes in two of our key macroeconomicindicators: real GDP and inflation.
Fiscal policy - the use of taxes, government spending, and government transfers to stabilize aneconomy; the word “fiscal” refers to tax revenue and government spending.
Nominal interest rate - the interest rate that you earn (or pay) on a loan; this is the amount you see on
a sign advertising interest rates.
Real interest rate - the nominal interest rate adjusted for inflation; this is the effective interest rate thatyou earn (or pay).
Money multiplier - the ratio of the money supply to the monetary base (money in bank vaults andmoney in circulation); the money multiplier tells us how many additional dollars will be created witheach addition to the monetary base, such as when there is a$1$1dollar sign, 1 increase in a bank’s reserves.
Key concepts retrieved from the College Board; equations and images retrieved from KhanAcademy.
Related Documents


