2021 Third Quarter Earnings Review October 28, 2021 The Huntington National Bank is Member FDIC. ®, Huntington® and Huntington. Welcome.® are federally registered service marks of Huntington Bancshares Incorporated. ©2021 Huntington Bancshares Incorporated.

Welcome message from author
This document is posted to help you gain knowledge. Please leave a comment to let me know what you think about it! Share it to your friends and learn new things together.
Transcript

2021 Third Quarter Earnings Review
October 28, 2021
The Huntington National Bank is Member FDIC. ®, Huntington® and Huntington. Welcome.® are federally registered service marks of Huntington Bancshares Incorporated. ©2021 Huntington Bancshares Incorporated.
2021 Third Quarter Earnings Review
DisclaimerCAUTION REGARDING FORWARD-LOOKING STATEMENTS
This communication contains certain forward-looking statements, including, but not limited to, certain plans, expectations, goals, projections, and statements, which are not historical facts and are subject to numerous assumptions, risks, and uncertainties. Statements that do not describe historical or current facts, including statements about beliefs and expectations, are forward-looking statements. Forward-looking statements may be identified by words such as expect, anticipate, believe, intend, estimate, plan, target, goal, or similar expressions, or future or conditional verbs such as will, may, might, should, would, could, or similar variations. The forward-looking statements are intended to be subject to the safe harbor provided by Section 27A of the Securities Act of 1933, Section 21E of the Securities Exchange Act of 1934, and the Private Securities Litigation Reform Act of 1995.
While there is no assurance that any list of risks and uncertainties or risk factors is complete, below are certain factors which could cause actual results to differ materially from those contained or implied in the forward-looking statements: changes in general economic, political, or industry conditions; the magnitude and duration of the COVID-19 pandemic and its impact on the global economy and financial market conditions and our business, results of operations, and financial condition; uncertainty in U.S. fiscal and monetary policy, including the interest rate policies of the Federal Reserve Board; volatility and disruptions in global capital and credit markets; movements in interest rates; reform of LIBOR; competitive pressures on product pricing and services; success, impact, and timing of our business strategies, including market acceptance of any new products or services including those implementing our “Fair Play” banking philosophy; the nature, extent, timing, and results of governmental actions, examinations, reviews, reforms, regulations, and interpretations, including those related to the Dodd-Frank Wall Street Reform and Consumer Protection Act and the Basel III regulatory capital reforms, as well as those involving the OCC, Federal Reserve, FDIC, and CFPB; the possibility that the anticipated benefits of the transaction with TCF are not realized when expected or at all, including as a result of the impact of, or problems arising from, the integration of the two companies or as a result of the strength of the economy and competitive factors in the areas where Huntington does business; the possibility that the branch divestiture may be more expensive to complete than anticipated, including as a result of unexpected factors or events; diversion of management’s attention from ongoing business operations and opportunities; potential adverse reactions or changes to business or employee relationships, including those resulting from the announcement or completion of the branch divestiture; and other factors that may affect the future results of Huntington. Additional factors that could cause results to differ materially from those described above can be found in Huntington’s Annual Report on Form 10-K for the year ended December 31, 2020 and in its subsequent Quarterly Reports on Form 10-Q, including for the quarter ended March 31, 2021 and June 30, 2021, each of which is on file with the Securities and Exchange Commission (the “SEC”) and available in the “Investor Relations” section of Huntington’s website http://www.huntington.com, under the heading “Publications and Filings” and in other documents Huntington files with the SEC.
All forward-looking statements speak only as of the date they are made and are based on information available at that time. Huntington does not assume any obligation to update forward-looking statements to reflect circumstances or events that occur after the date the forward-looking statements were made or to reflect the occurrence of unanticipated events except as required by federal securities laws. As forward-looking statements involve significant risks and uncertainties, caution should be exercised against placing undue reliance on such statements.
2
2021 Third Quarter Earnings Review
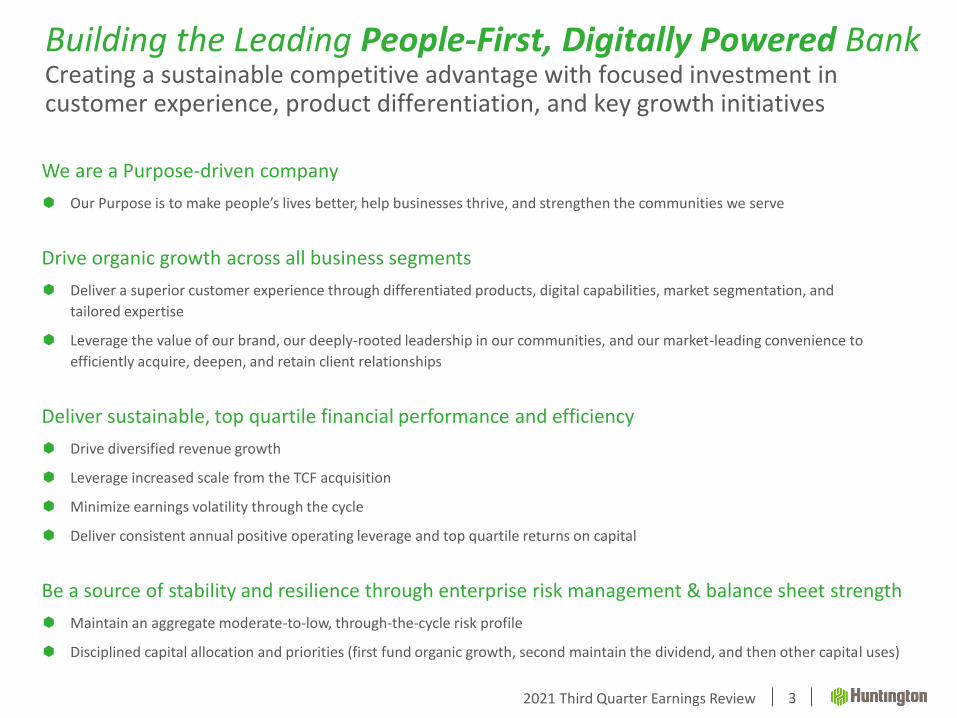
Building the Leading People-First, Digitally Powered BankCreating a sustainable competitive advantage with focused investment in customer experience, product differentiation, and key growth initiatives
3
We are a Purpose-driven company
Our Purpose is to make people’s lives better, help businesses thrive, and strengthen the communities we serve
Drive organic growth across all business segments
Deliver a superior customer experience through differentiated products, digital capabilities, market segmentation, and
tailored expertise
Leverage the value of our brand, our deeply-rooted leadership in our communities, and our market-leading convenience to
efficiently acquire, deepen, and retain client relationships
Deliver sustainable, top quartile financial performance and efficiency
Drive diversified revenue growth
Leverage increased scale from the TCF acquisition
Minimize earnings volatility through the cycle
Deliver consistent annual positive operating leverage and top quartile returns on capital
Be a source of stability and resilience through enterprise risk management & balance sheet strength
Maintain an aggregate moderate-to-low, through-the-cycle risk profile
Disciplined capital allocation and priorities (first fund organic growth, second maintain the dividend, and then other capital uses)

2021 Third Quarter Earnings Review
2021 Third Quarter HighlightsDriving organic growth while delivering on transaction economics
Core system conversion and branch consolidations completed subsequent to quarter-end
Finalized majority of actions driving achievement of all projected cost synergies
Revenue synergy initiatives underway to drive incremental top-line growth
Significant momentum in our business strategies; continued investment to drive organic growth
Continued strength in underlying loan portfolios and key drivers, including consumer originations, asset finance, specialty banking, and middle market pipelines (+36% year-over-year)
Successfully growing targeted areas of fee income opportunity, including wealth management, capital markets, card and payments
Ranked #1 nationally for SBA 7(a) loan origination by volume for fourth year in a row
4
Lower net charge-offs and decreased NPAs versus prior quarter
Board approval to increase 4Q21 dividend by a half cent to $0.155 per share, or $0.62 annualized
Repurchased $500 million of common stock through 9/30
TCF Integration
Driving Organic Growth
Credit Quality and Capital
Actions
Maintaining sustained investment capacity within the framework of top quartile returns; managing expenses dynamically to support revenue growth initiatives
Planned consolidation of 62 branches in 1Q22 (6% of combined branch network), in addition to the completed consolidation of 188 TCF branches, while retaining #1 branch share in Ohio and Michigan
Disciplined Expense
Management
2021 Third Quarter Earnings Review
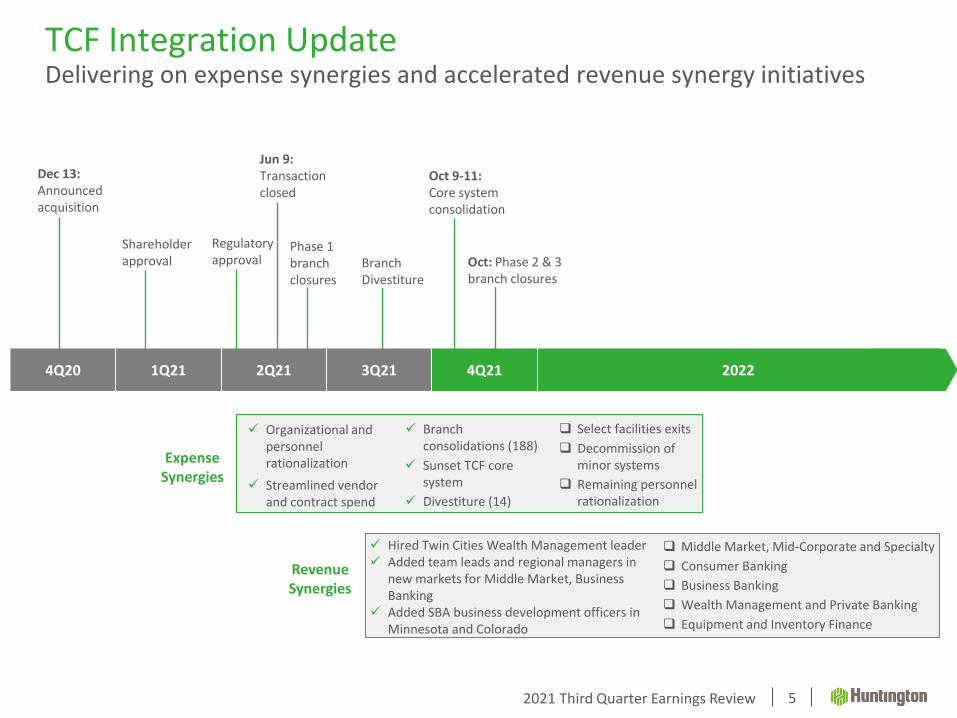
TCF Integration UpdateDelivering on expense synergies and accelerated revenue synergy initiatives
Jun 9: Transaction closed
5
Phase 1branch closures
Oct 9-11: Core system consolidation
Dec 13: Announced acquisition
4Q20 1Q21 2Q21 3Q21 4Q21 2022
Expense Synergies
Revenue Synergies
Shareholder approval
Regulatory approval
✓ Organizational and personnel rationalization
✓ Streamlined vendor and contract spend
Branch Divestiture
Oct: Phase 2 & 3branch closures
✓ Hired Twin Cities Wealth Management leader✓ Added team leads and regional managers in
new markets for Middle Market, Business Banking
✓ Added SBA business development officers in Minnesota and Colorado
❑ Select facilities exits
❑ Decommission of minor systems
❑ Remaining personnel rationalization
❑ Middle Market, Mid-Corporate and Specialty
❑ Consumer Banking
❑ Business Banking
❑ Wealth Management and Private Banking
❑ Equipment and Inventory Finance
✓ Branch consolidations (188)
✓ Sunset TCF core system
✓ Divestiture (14)
2021 Third Quarter Earnings Review
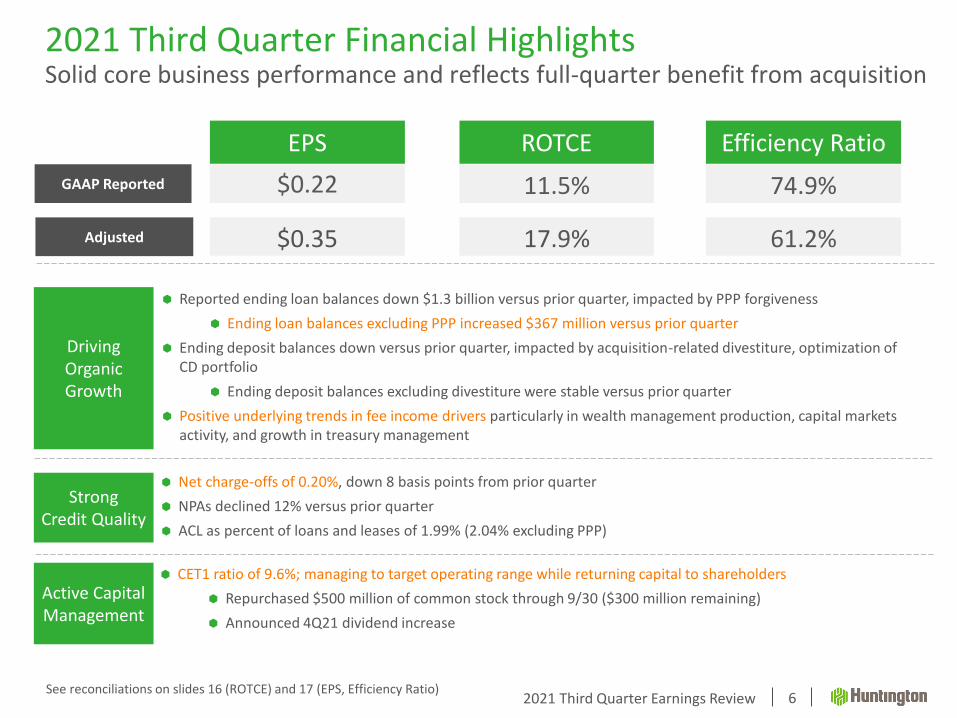
2021 Third Quarter Financial HighlightsSolid core business performance and reflects full-quarter benefit from acquisition
Reported ending loan balances down $1.3 billion versus prior quarter, impacted by PPP forgiveness
Ending loan balances excluding PPP increased $367 million versus prior quarter
Ending deposit balances down versus prior quarter, impacted by acquisition-related divestiture, optimization of CD portfolio
Ending deposit balances excluding divestiture were stable versus prior quarter
Positive underlying trends in fee income drivers particularly in wealth management production, capital markets activity, and growth in treasury management
6
Driving Organic Growth
StrongCredit Quality
Active Capital Management
CET1 ratio of 9.6%; managing to target operating range while returning capital to shareholders
Repurchased $500 million of common stock through 9/30 ($300 million remaining)
Announced 4Q21 dividend increase
Net charge-offs of 0.20%, down 8 basis points from prior quarter
NPAs declined 12% versus prior quarter
ACL as percent of loans and leases of 1.99% (2.04% excluding PPP)
$0.22
EPS
11.5%
ROTCE
74.9%
Efficiency Ratio
GAAP Reported
Adjusted $0.35 17.9% 61.2%
See reconciliations on slides 16 (ROTCE) and 17 (EPS, Efficiency Ratio)

2021 Third Quarter Earnings Review 7
Vs Linked Quarter Ending
Commercial loan balances decreased $1.6 billion. Commercial balances excluding PPP increased $141 million
Total C&I balances were down $1.4 billion, driven by $1.7 billion lower PPP balances, $209 million lower auto dealer floorplan balances, while all other C&I balances increased by $466 million
Late-stage middle market pipeline up 36% versus prior year
Consumer loan balances increased $226 million
Increase driven by growth in residential mortgage, RV / marine, and auto
Branch divestiture related to acquisition included sale of $209 million of held-for-sale loan balances
$107.7 $108.1
$4.2 $2.5
$111.9 $110.6
2Q21 3Q21Ending Loans and Leases ex PPP
Ending Balances
$82.4
$106.6
$5.0
$3.3
$87.4
$109.9
2Q21 3Q21Average Loans and Leases ex PPP
Total Loan and Lease BalancesAverage Balances
Loan and Lease Walk from Prior Quarter
($1.7) $0.1 $0.2
$111.9 $110.6
2Q21 Ending PPP Commercialex PPP
Consumer 3Q21 Ending
Note: $ in billions unless otherwise noted
Highlights
Loans and LeasesIncreasing momentum in production and pipelines
2021 Third Quarter Earnings Review
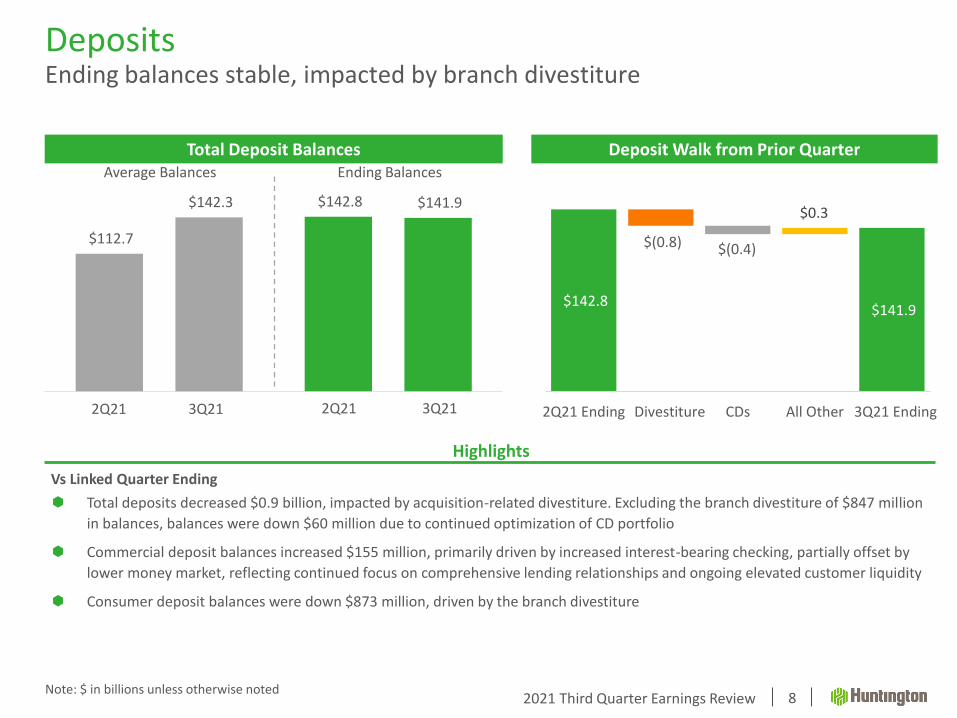
DepositsEnding balances stable, impacted by branch divestiture
8Note: $ in billions unless otherwise noted
Total Deposit Balances
$112.7
$142.8 $142.3 $141.9
Average Ending2Q21 3Q21
Average Balances Ending Balances
2Q21 3Q21
Deposit Walk from Prior Quarter
$(0.8) $(0.4)
$0.3
$142.8 $141.9
2Q21 Ending Divestiture CDs All Other 3Q21 Ending
Highlights
Vs Linked Quarter Ending
Total deposits decreased $0.9 billion, impacted by acquisition-related divestiture. Excluding the branch divestiture of $847 million
in balances, balances were down $60 million due to continued optimization of CD portfolio
Commercial deposit balances increased $155 million, primarily driven by increased interest-bearing checking, partially offset by
lower money market, reflecting continued focus on comprehensive lending relationships and ongoing elevated customer liquidity
Consumer deposit balances were down $873 million, driven by the branch divestiture
2021 Third Quarter Earnings Review
$769 $781 $902 $780 $1,085
$53 $49
$76
$54
$46
$10
$36
$822 $830
$978
$844
$1,167
2.96% 2.94%
3.48%
2.66%
2.90%
2.4 0%
2.6 0%
2.8 0%
3.0 0%
3.2 0%
3.4 0%
3.6 0%
3.8 0%
4.0 0%
4.2 0%
$0.00
$20 0.00
$40 0.00
$60 0.00
$80 0.00
$1, 000.0 0
3Q20 4Q20 1Q21 2Q21 3Q21
Purchase Accounting Accretion (PAA)Paycheck Protection Program (PPP)Net Interest Income, ex PAA and PPPNet Interest Margin
$ in millions
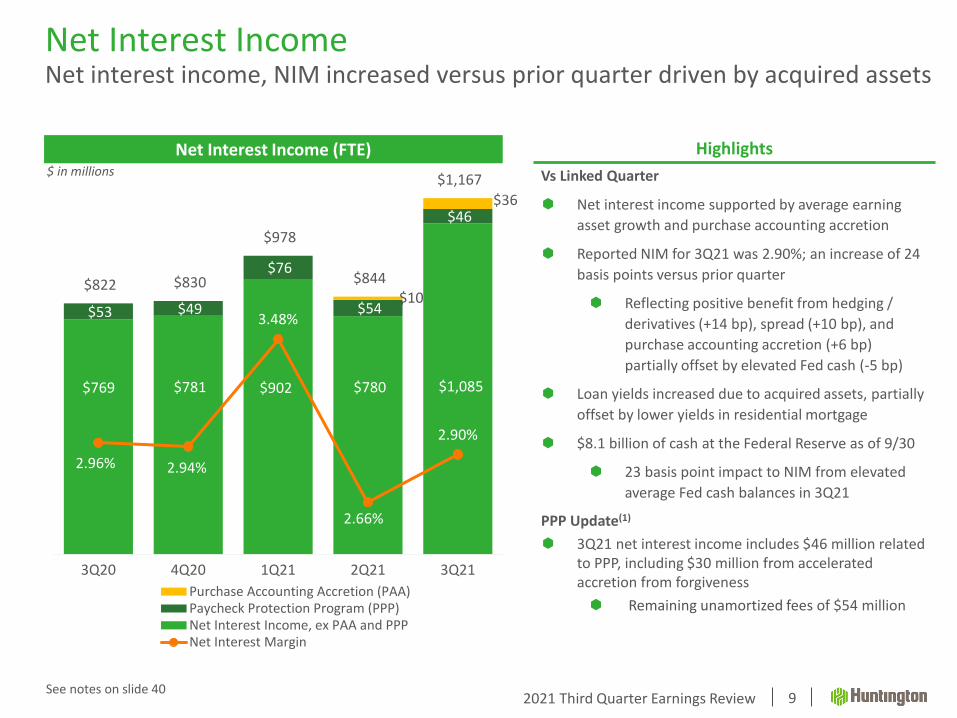
Net Interest IncomeNet interest income, NIM increased versus prior quarter driven by acquired assets
9
Net Interest Income (FTE)
Vs Linked Quarter
Net interest income supported by average earning
asset growth and purchase accounting accretion
Reported NIM for 3Q21 was 2.90%; an increase of 24
basis points versus prior quarter
Reflecting positive benefit from hedging /
derivatives (+14 bp), spread (+10 bp), and
purchase accounting accretion (+6 bp)
partially offset by elevated Fed cash (-5 bp)
Loan yields increased due to acquired assets, partially
offset by lower yields in residential mortgage
$8.1 billion of cash at the Federal Reserve as of 9/30
23 basis point impact to NIM from elevated
average Fed cash balances in 3Q21
PPP Update(1)
3Q21 net interest income includes $46 million related to PPP, including $30 million from accelerated accretion from forgiveness
Remaining unamortized fees of $54 million
Highlights
C
See notes on slide 40
2021 Third Quarter Earnings Review
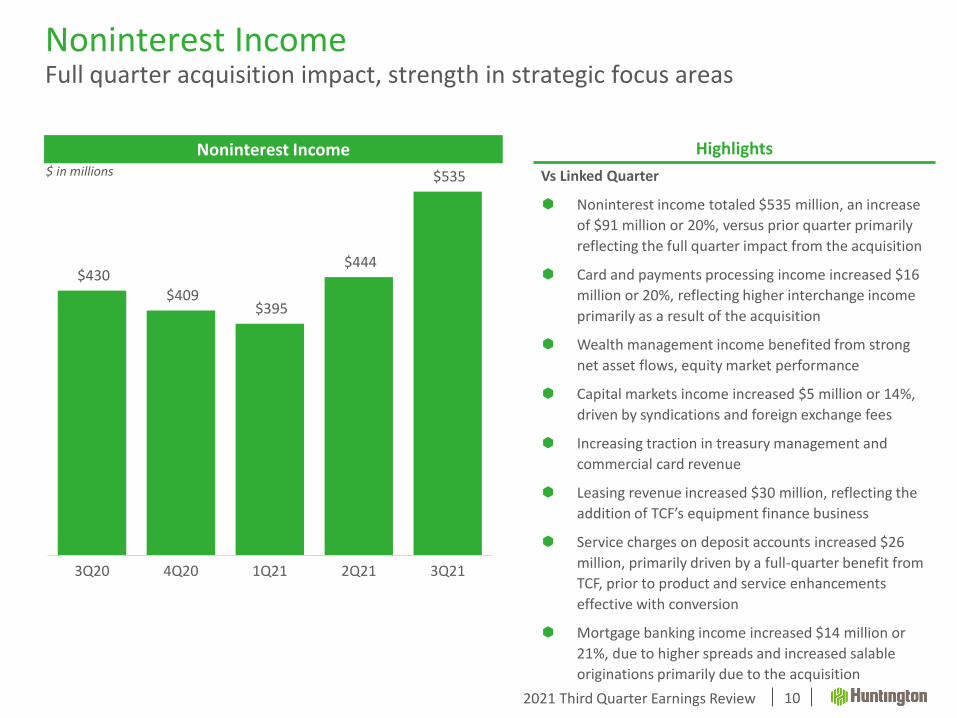
Noninterest IncomeFull quarter acquisition impact, strength in strategic focus areas
10
$430 $409
$395
$444
$535
3Q20 4Q20 1Q21 2Q21 3Q21
Vs Linked Quarter
Noninterest income totaled $535 million, an increase
of $91 million or 20%, versus prior quarter primarily
reflecting the full quarter impact from the acquisition
Card and payments processing income increased $16
million or 20%, reflecting higher interchange income
primarily as a result of the acquisition
Wealth management income benefited from strong
net asset flows, equity market performance
Capital markets income increased $5 million or 14%,
driven by syndications and foreign exchange fees
Increasing traction in treasury management and
commercial card revenue
Leasing revenue increased $30 million, reflecting the
addition of TCF’s equipment finance business
Service charges on deposit accounts increased $26
million, primarily driven by a full-quarter benefit from
TCF, prior to product and service enhancements
effective with conversion
Mortgage banking income increased $14 million or
21%, due to higher spreads and increased salable
originations primarily due to the acquisition
Noninterest Income$ in millions
Highlights

2021 Third Quarter Earnings Review
$772 $803 $1,055
$21
$269
$234
$712 $756 $793
$1,072
$1,289
3Q20 4Q20 1Q21 2Q21 3Q21NIE excluding Notable Items Notable Items
Noninterest ExpenseFull quarter of TCF expenses, focused on realizing expense synergies
11
Vs Linked Quarter
Noninterest expense of $1.3 billion, an increase of $217 million versus prior quarter driven by a full quarter impact of TCF expenses
Outside data processing increased $142 million largely driven by acquisition-related expenditures
Personnel costs increased $51 million primarily driven by an increase in average FTE employees related to timing of the acquisition
Notable item expense related to the acquisition decreased $35 million
The $234 million of Notable Items expense was driven primarily by outside data processing, personnel, and occupancy costs
56.1%60.2%
57.0%
83.1%
74.9%
55.5%62.0% 61.2%
3Q20 4Q20 1Q21 2Q21 3Q21
Efficiency Ratio
Adjusted Efficiency Ratio
See reconciliation on slide 17
Noninterest Expense$ in millions
Efficiency Ratio
Highlights
2021 Third Quarter Earnings Review
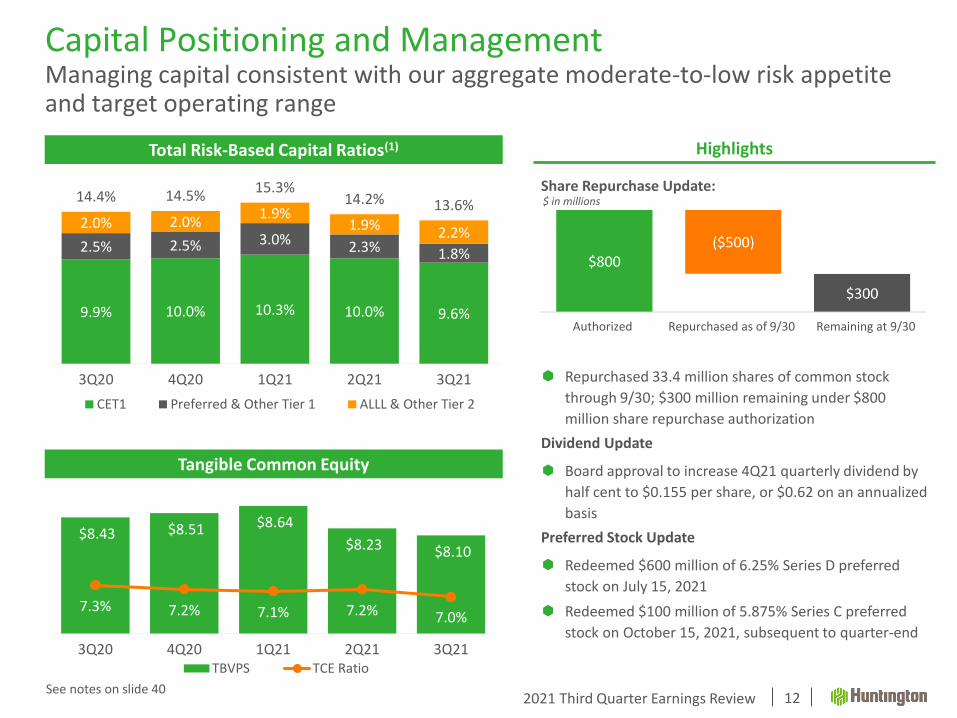
Share Repurchase Update:
Repurchased 33.4 million shares of common stock
through 9/30; $300 million remaining under $800
million share repurchase authorization
Dividend Update
Board approval to increase 4Q21 quarterly dividend by
half cent to $0.155 per share, or $0.62 on an annualized
basis
Preferred Stock Update
Redeemed $600 million of 6.25% Series D preferred
stock on July 15, 2021
Redeemed $100 million of 5.875% Series C preferred
stock on October 15, 2021, subsequent to quarter-end
$8.43 $8.51 $8.64
$8.23 $8.10
7.3% 7.2% 7.1% 7.2% 7.0%6.0 0%
6.5 0%
7.0 0%
7.5 0%
8.0 0%
8.5 0%
9.0 0%
9.5 0%
10.00%
$6.30
$6.80
$7.30
$7.80
$8.30
$8.80
3Q20 4Q20 1Q21 2Q21 3Q21TBVPS TCE Ratio
Capital Positioning and ManagementManaging capital consistent with our aggregate moderate-to-low risk appetite and target operating range
12
9.9% 10.0% 10.3% 10.0% 9.6%
2.5% 2.5% 3.0% 2.3% 1.8%
2.0% 2.0%1.9%
1.9% 2.2%
14.4% 14.5%15.3%
14.2% 13.6%
3Q20 4Q20 1Q21 2Q21 3Q21
CET1 Preferred & Other Tier 1 ALLL & Other Tier 2
See notes on slide 40
Total Risk-Based Capital Ratios(1)
Authorized Repurchased as of 9/30 Remaining at 9/30
Tangible Common Equity
Highlights
$ in millions

2021 Third Quarter Earnings Review
$1,878 $1,866 $1,741
$2,205
2.31% of loans
2.29% of loans 2.17% of
loans 2.08% of loans 1.99% of
loans
2.50% of loans ex.
PPP
2.46% of loans ex.
PPP2.33% of loans ex.
PPP 2.15% of loans ex.
PPP2.04% of loans ex.
PPP
3Q20 4Q20 1Q21 2Q21 3Q21
ACL as % of Total Loans & Leases ACL % ex PPP
$2,322
Allowance for Credit Losses (ACL)Improving credit metrics and economic outlook drives continued reserve release
13
Multiple scenarios utilized while using August baseline
as foundation
$117 million reserve release
Stable credit quality and improving economic outlook
allows for a reduction in ACL coverage from 2.08% to
1.99%
2Q21 increase in ACL was driven by the closing of the
TCF acquisition
$ in millions
Allowance for Credit Losses (ACL) Highlights
See reconciliation on slide 18
2021 Third Quarter Earnings Review
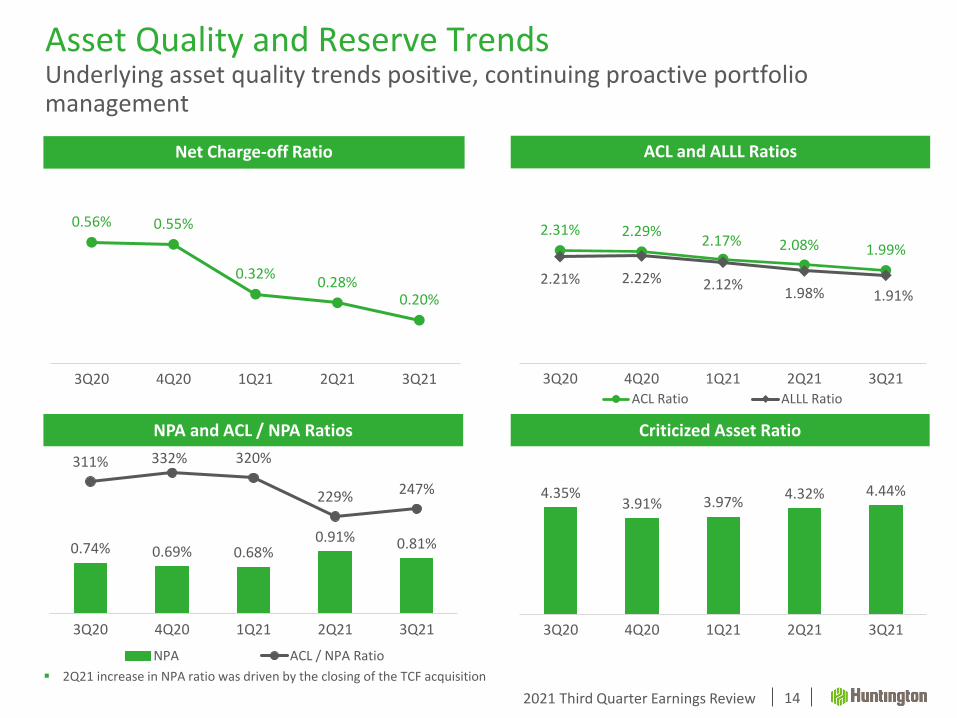
0.74% 0.69% 0.68%0.91% 0.81%
311% 332% 320%
229% 247%
3Q20 4Q20 1Q21 2Q21 3Q21
NPA ACL / NPA Ratio
NPA and ACL / NPA Ratios
2.31% 2.29%2.17% 2.08% 1.99%
2.21% 2.22% 2.12%1.98% 1.91%
3Q20 4Q20 1Q21 2Q21 3Q21ACL Ratio ALLL Ratio
4.35%3.91% 3.97%
4.32% 4.44%
3Q20 4Q20 1Q21 2Q21 3Q21
0.56% 0.55%
0.32%0.28%
0.20%
3Q20 4Q20 1Q21 2Q21 3Q21
Asset Quality and Reserve TrendsUnderlying asset quality trends positive, continuing proactive portfolio management
Criticized Asset Ratio
Net Charge-off Ratio ACL and ALLL Ratios
▪ 2Q21 increase in NPA ratio was driven by the closing of the TCF acquisition
14

2021 Third Quarter Earnings Review
Focus on Achieving Medium-Term Financial GoalsDriving organic revenue growth across all businesses to deliver top quartile financial performance
Efficiency
Ratio
56%
Return on Tangible
Common Equity
17%+
CET1
Ratio
9 – 10%
Targeting annual revenue growth slightly above nominal GDP
Managing annual expense growth relative to revenue outlook to achieve positive operating leverage
Targeting lower half of the long-term CET1 operating range
Capital Priorities1. Organic growth2. Dividend3. Buybacks / other
Positive Operating Leverage
Expecting a normalized effective tax rate to be in the range of 18% to 19%
15

2021 Third Quarter Earnings Review
Non-GAAP ReconciliationTangible common equity, ROTCE
16
($ in millions) 3Q21
Average common shareholders’ equity $17,428
Less: intangible assets and goodwill 5,577
Add: net tax effect of intangible assets 55
Average tangible common shareholders’ equity (A) $11,905
Net income available to common $333
Add: amortization of intangibles 13
Add: net of deferred tax (2)
Adjusted net income available to common 344
Adjusted net income available to common (annualized) (B) $1,365
Return on average tangible shareholders’ equity (B/A) 11.5%
($ in millions) 3Q21
Adjusted net income available to common (annualized) (B) $1,365
Return on average tangible shareholders’ equity 11.5%
Add: TCF acquisition-related net expenses, after tax (C) $192
Adjusted net income available to common (annualized) (E) $2,127
Adjusted return on average tangible shareholders’ equity (E/A) 17.9%
2021 Third Quarter Earnings Review
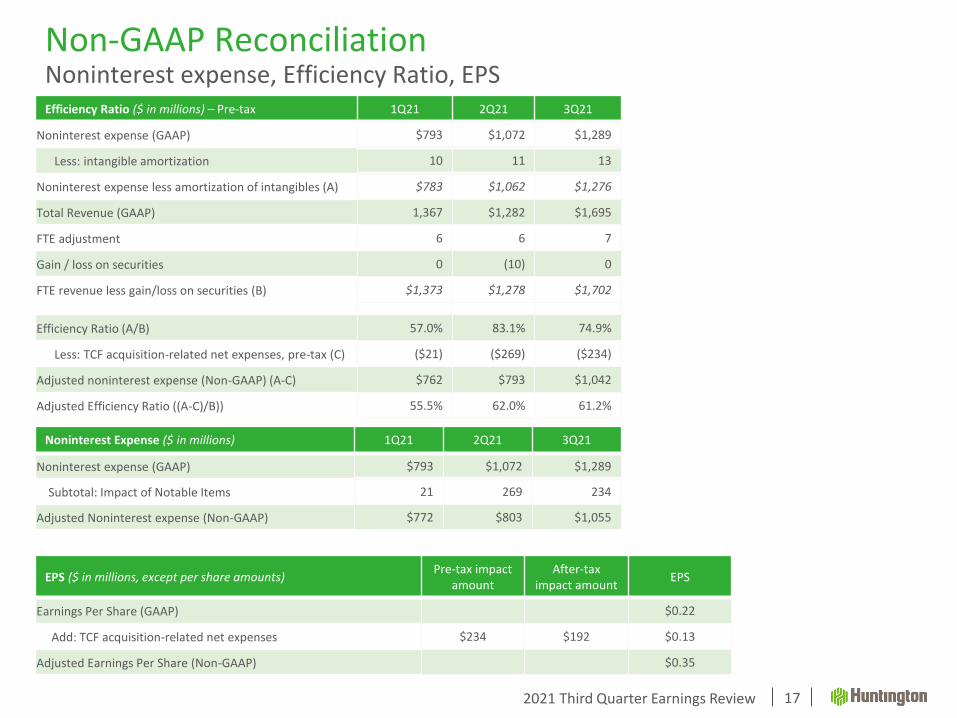
Non-GAAP ReconciliationNoninterest expense, Efficiency Ratio, EPS
17
Noninterest Expense ($ in millions) 1Q21 2Q21 3Q21
Noninterest expense (GAAP) $793 $1,072 $1,289
Subtotal: Impact of Notable Items 21 269 234
Adjusted Noninterest expense (Non-GAAP) $772 $803 $1,055
EPS ($ in millions, except per share amounts)Pre-tax impact
amountAfter-tax
impact amount EPS
Earnings Per Share (GAAP) $0.22
Add: TCF acquisition-related net expenses $234 $192 $0.13
Adjusted Earnings Per Share (Non-GAAP) $0.35
Efficiency Ratio ($ in millions) – Pre-tax 1Q21 2Q21 3Q21
Noninterest expense (GAAP) $793 $1,072 $1,289
Less: intangible amortization 10 11 13
Noninterest expense less amortization of intangibles (A) $783 $1,062 $1,276
Total Revenue (GAAP) 1,367 $1,282 $1,695
FTE adjustment 6 6 7
Gain / loss on securities 0 (10) 0
FTE revenue less gain/loss on securities (B) $1,373 $1,278 $1,702
Efficiency Ratio (A/B) 57.0% 83.1% 74.9%
Less: TCF acquisition-related net expenses, pre-tax (C) ($21) ($269) ($234)
Adjusted noninterest expense (Non-GAAP) (A-C) $762 $793 $1,042
Adjusted Efficiency Ratio ((A-C)/B)) 55.5% 62.0% 61.2%
2021 Third Quarter Earnings Review
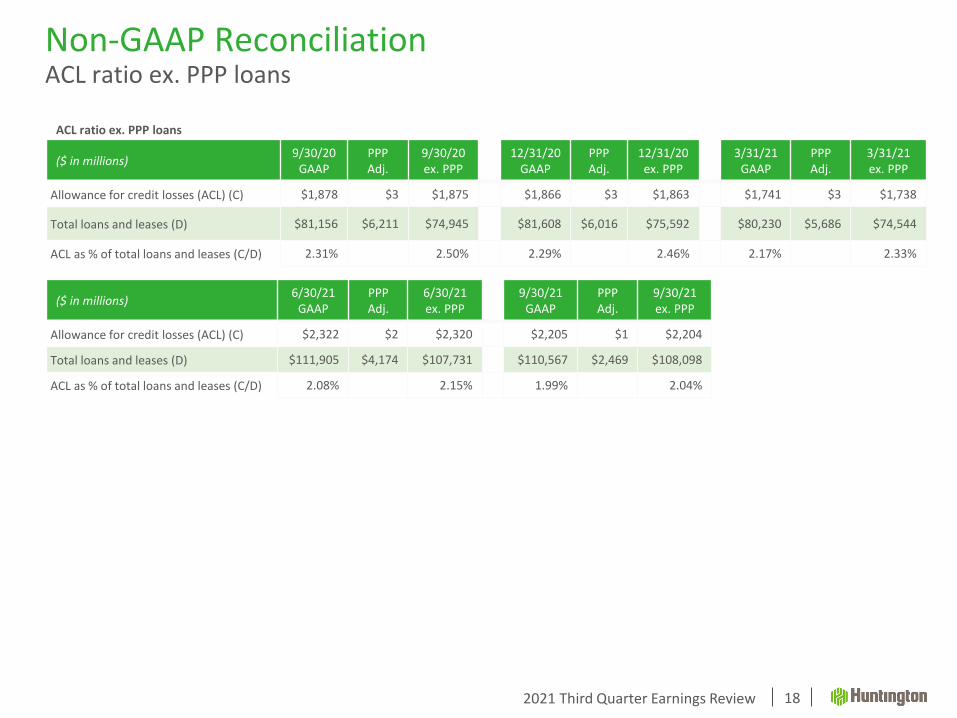
Non-GAAP ReconciliationACL ratio ex. PPP loans
18
($ in millions)9/30/20
GAAPPPP Adj.
9/30/20 ex. PPP
12/31/20 GAAP
PPP Adj.
12/31/20 ex. PPP
3/31/21 GAAP
PPP Adj.
3/31/21 ex. PPP
Allowance for credit losses (ACL) (C) $1,878 $3 $1,875 $1,866 $3 $1,863 $1,741 $3 $1,738
Total loans and leases (D) $81,156 $6,211 $74,945 $81,608 $6,016 $75,592 $80,230 $5,686 $74,544
ACL as % of total loans and leases (C/D) 2.31% 2.50% 2.29% 2.46% 2.17% 2.33%
($ in millions)6/30/21
GAAPPPP Adj.
6/30/21 ex. PPP
9/30/21 GAAP
PPP Adj.
9/30/21 ex. PPP
Allowance for credit losses (ACL) (C) $2,322 $2 $2,320 $2,205 $1 $2,204
Total loans and leases (D) $111,905 $4,174 $107,731 $110,567 $2,469 $108,098
ACL as % of total loans and leases (C/D) 2.08% 2.15% 1.99% 2.04%
ACL ratio ex. PPP loans

Appendix
2021 Third Quarter Earnings Review
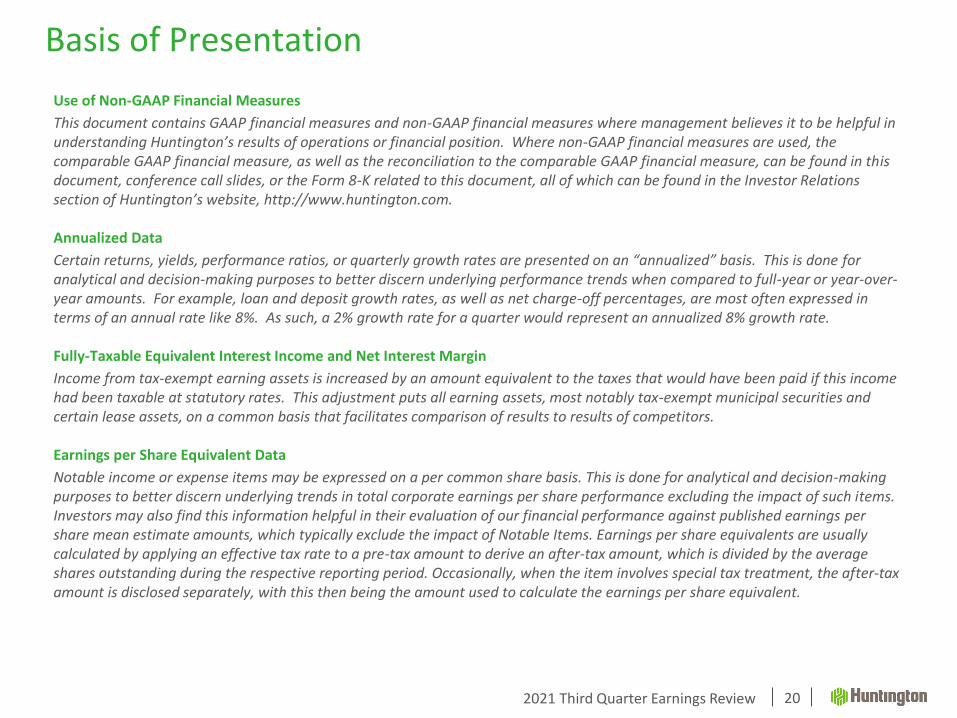
Basis of Presentation
20
Use of Non-GAAP Financial Measures
This document contains GAAP financial measures and non-GAAP financial measures where management believes it to be helpful in understanding Huntington’s results of operations or financial position. Where non-GAAP financial measures are used, the comparable GAAP financial measure, as well as the reconciliation to the comparable GAAP financial measure, can be found in this document, conference call slides, or the Form 8-K related to this document, all of which can be found in the Investor Relations section of Huntington’s website, http://www.huntington.com.
Annualized Data
Certain returns, yields, performance ratios, or quarterly growth rates are presented on an “annualized” basis. This is done foranalytical and decision-making purposes to better discern underlying performance trends when compared to full-year or year-over-year amounts. For example, loan and deposit growth rates, as well as net charge-off percentages, are most often expressed in terms of an annual rate like 8%. As such, a 2% growth rate for a quarter would represent an annualized 8% growth rate.
Fully-Taxable Equivalent Interest Income and Net Interest Margin
Income from tax-exempt earning assets is increased by an amount equivalent to the taxes that would have been paid if this incomehad been taxable at statutory rates. This adjustment puts all earning assets, most notably tax-exempt municipal securities and certain lease assets, on a common basis that facilitates comparison of results to results of competitors.
Earnings per Share Equivalent Data
Notable income or expense items may be expressed on a per common share basis. This is done for analytical and decision-making purposes to better discern underlying trends in total corporate earnings per share performance excluding the impact of such items. Investors may also find this information helpful in their evaluation of our financial performance against published earnings pershare mean estimate amounts, which typically exclude the impact of Notable Items. Earnings per share equivalents are usually calculated by applying an effective tax rate to a pre-tax amount to derive an after-tax amount, which is divided by the average shares outstanding during the respective reporting period. Occasionally, when the item involves special tax treatment, the after-tax amount is disclosed separately, with this then being the amount used to calculate the earnings per share equivalent.

2021 Third Quarter Earnings Review
Basis of Presentation
21
Rounding
Please note that columns of data in this document may not add due to rounding.
Notable Items
From time to time, revenue, expenses, or taxes are impacted by items judged by management to be outside of ordinary banking activities and/or by items that, while they may be associated with ordinary banking activities, are so unusually large that their outsized impact is believed by management at that time to be infrequent or short term in nature. We refer to such items as “Notable Items.” Management believes it is useful to consider certain financial metrics with and without Notable Items, in order to enable a better understanding of company results, increase comparability of period-to-period results, and to evaluate and forecast those results.
2021 Third Quarter Earnings Review
Table of Contents
22
Revenue Synergies 23
Purchase Accounting Detail 24
Digital Metrics 25
Mortgage Banking Noninterest Income 26
Balance Sheet 27
Investment Securities 28
Consumer Originations Detail 29
Wholesale Funding 32
Shares Outstanding 33
Credit Quality Review 34
Commercial Credit 35
Consumer Credit 36
Delinquencies 38
Criticized Commercial Loan Analysis 39
2021 Third Quarter Earnings Review
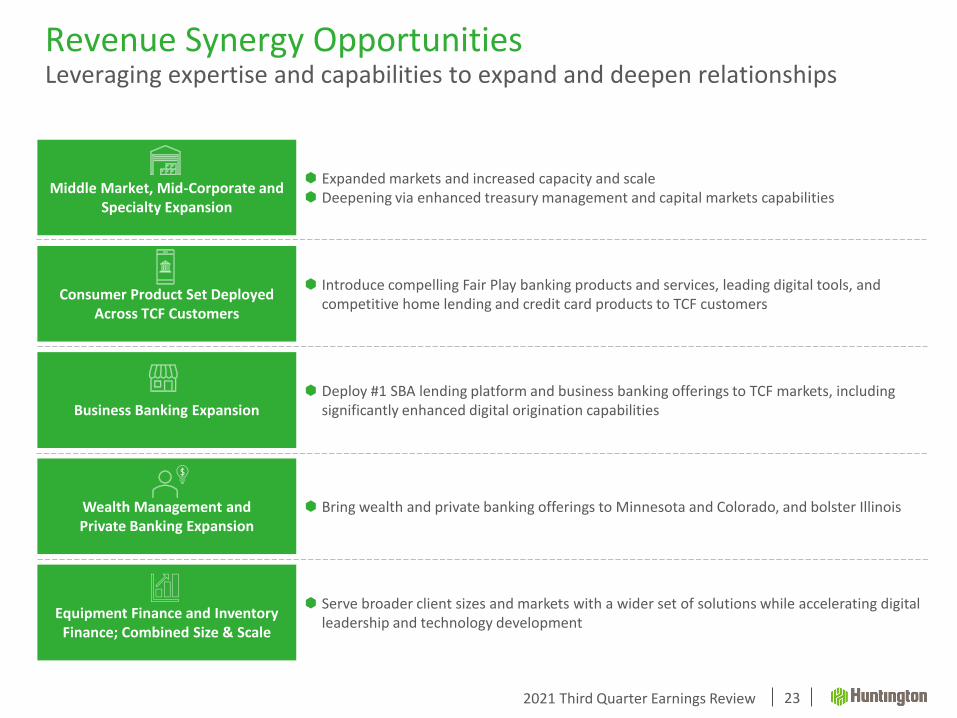
Revenue Synergy Opportunities Leveraging expertise and capabilities to expand and deepen relationships
23
Middle Market, Mid-Corporate and Specialty Expansion
Expanded markets and increased capacity and scale Deepening via enhanced treasury management and capital markets capabilities
1
Consumer Product Set Deployed Across TCF Customers
Introduce compelling Fair Play banking products and services, leading digital tools, and competitive home lending and credit card products to TCF customers
Business Banking Expansion Deploy #1 SBA lending platform and business banking offerings to TCF markets, including
significantly enhanced digital origination capabilities
Wealth Management and Private Banking Expansion
Bring wealth and private banking offerings to Minnesota and Colorado, and bolster Illinois
Equipment Finance and Inventory Finance; Combined Size & Scale
Serve broader client sizes and markets with a wider set of solutions while accelerating digital leadership and technology development
2021 Third Quarter Earnings Review 24
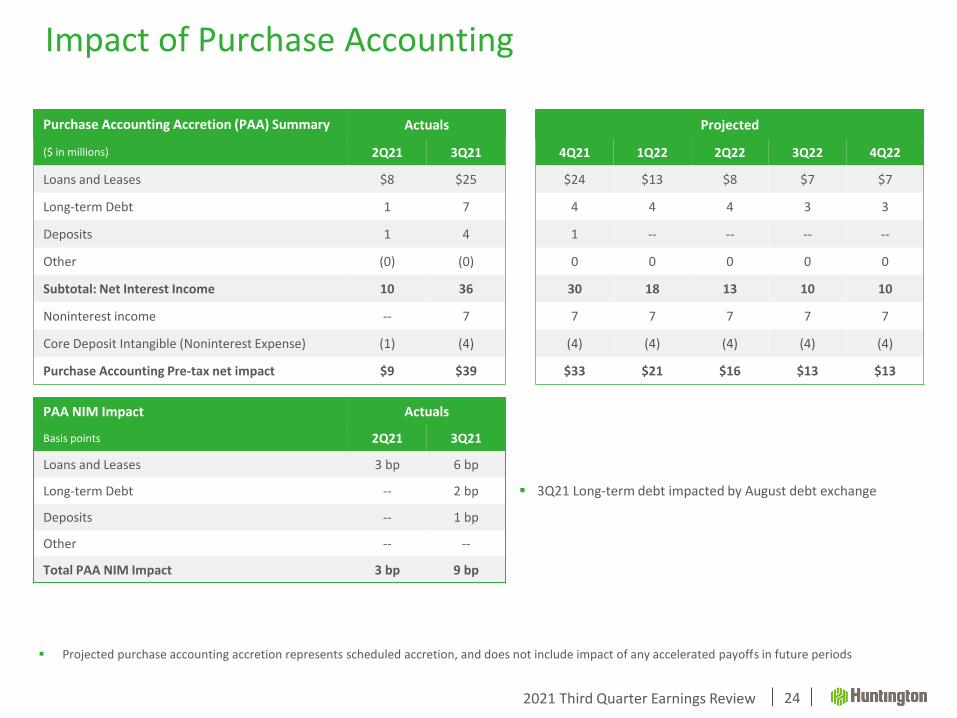
▪ Projected purchase accounting accretion represents scheduled accretion, and does not include impact of any accelerated payoffs in future periods
Purchase Accounting Accretion (PAA) Summary Actuals Projected
($ in millions) 2Q21 3Q21 4Q21 1Q22 2Q22 3Q22 4Q22
Loans and Leases $8 $25 $24 $13 $8 $7 $7
Long-term Debt 1 7 4 4 4 3 3
Deposits 1 4 1 -- -- -- --
Other (0) (0) 0 0 0 0 0
Subtotal: Net Interest Income 10 36 30 18 13 10 10
Noninterest income -- 7 7 7 7 7 7
Core Deposit Intangible (Noninterest Expense) (1) (4) (4) (4) (4) (4) (4)
Purchase Accounting Pre-tax net impact $9 $39 $33 $21 $16 $13 $13
▪ 3Q21 Long-term debt impacted by August debt exchange
PAA NIM Impact Actuals
Basis points 2Q21 3Q21
Loans and Leases 3 bp 6 bp
Long-term Debt -- 2 bp
Deposits -- 1 bp
Other -- --
Total PAA NIM Impact 3 bp 9 bp
Impact of Purchase Accounting
2021 Third Quarter Earnings Review
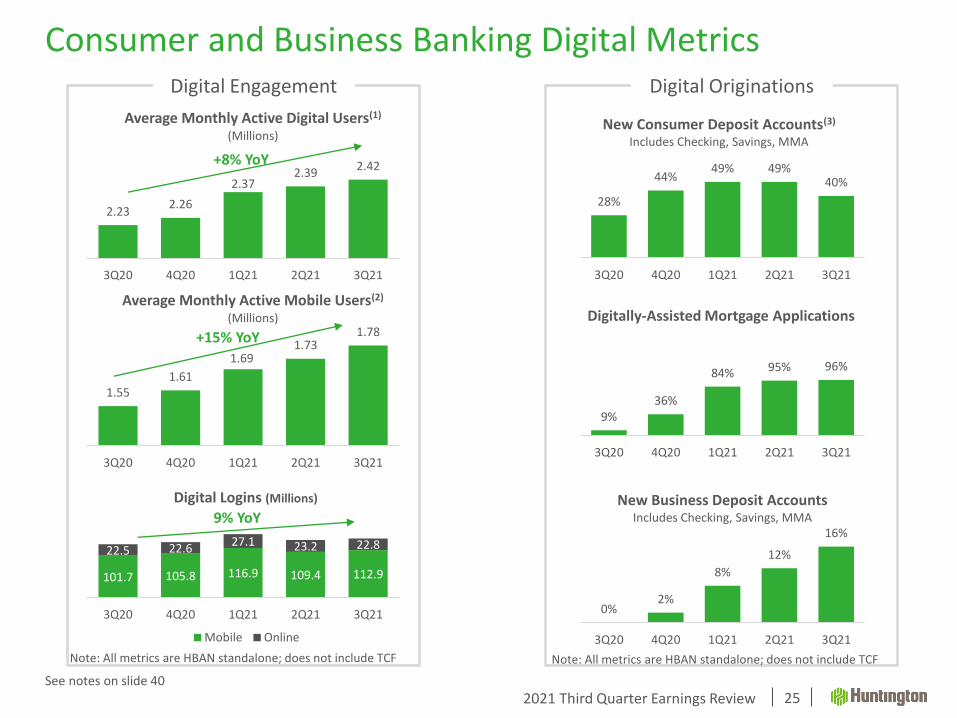
101.7 105.8 116.9 109.4 112.9
22.5 22.627.1 23.2 22.8
3Q20 4Q20 1Q21 2Q21 3Q21
Digital Logins (Millions)
Mobile Online
Consumer and Business Banking Digital Metrics
25
28%
44%49% 49%
40%
3Q20 4Q20 1Q21 2Q21 3Q21
9%36%
84% 95% 96%
3Q20 4Q20 1Q21 2Q21 3Q21
0%2%
8%
12%
16%
3Q20 4Q20 1Q21 2Q21 3Q21
Digital Originations
New Consumer Deposit Accounts(3)
Includes Checking, Savings, MMA
New Business Deposit AccountsIncludes Checking, Savings, MMA
Digitally-Assisted Mortgage Applications
2.232.26
2.372.39
2.42
3Q20 4Q20 1Q21 2Q21 3Q21
Average Monthly Active Digital Users(1)
(Millions)
1.551.61
1.691.73
1.78
3Q20 4Q20 1Q21 2Q21 3Q21
Average Monthly Active Mobile Users(2)
(Millions)
+8% YoY
+15% YoY
Digital Engagement
Note: All metrics are HBAN standalone; does not include TCF Note: All metrics are HBAN standalone; does not include TCF
9% YoY
See notes on slide 40
2021 Third Quarter Earnings Review
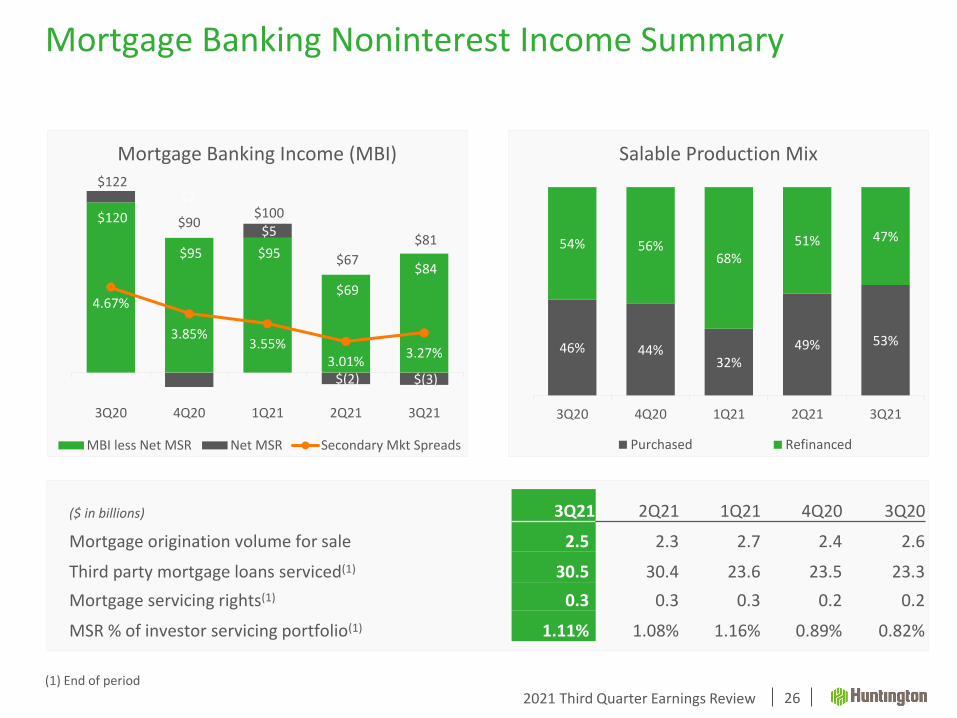
Mortgage Banking Noninterest Income Summary
26
$120
$95 $95
$69
$84
$5
$(2) $(3)
$122
$90 $100
$67
$81
4.67%
3.85%3.55%
3.01%3.27%
$(15)
$5
$25
$45
$65
$85
$105
$125
$145
3Q20 4Q20 1Q21 2Q21 3Q21
Mortgage Banking Income (MBI)
MBI less Net MSR Net MSR Secondary Mkt Spreads
($ in billions) 3Q21 2Q21 1Q21 4Q20 3Q20
Mortgage origination volume for sale 2.5) 2.3 2.7 2.4 2.6
Third party mortgage loans serviced(1) 30.5) 30.4 23.6 23.5 23.3
Mortgage servicing rights(1) 0.3) 0.3 0.3 0.2 0.2
MSR % of investor servicing portfolio(1) 1.11%) 1.08% 1.16% 0.89% 0.82%
46% 44%32%
49% 53%
54% 56%68%
51% 47%
3Q20 4Q20 1Q21 2Q21 3Q21
Salable Production Mix
Purchased Refinanced
(1) End of period
$2

Balance Sheet

2021 Third Quarter Earnings Review
Securities OverviewSecurities serve a dual purpose; liquidity and interest rate risk management
28
Securities
Securities portfolio increased $3.7 billion versus prior quarter, with a
focus on short duration securities
Mix of net purchases similar to current portfolio
3Q21 new money yields equivalent to portfolio yields
Investment portfolio is adequately positioned for a potential rise in rates
32% of portfolio classified as Held-to-Maturity to mitigate capital
volatility
Portfolio partially hedged with pay fixed swaps; reduces duration
risk and protects OCI / capital and liquidity
Shorter duration and high coupon securities allow faster
reinvestment as rates rise, minimal allocation to longer duration
securities
Hedging Strategy
Continue to reposition the balance sheet for higher rates in the future,
with a focus on earnings and capital protection
Upside rate protection continues to grow. Notional of downside
rate protection hedges fell $3.7 billion versus prior quarter due
to termination or maturity
Average life of the receive fixed swaps and floors / floor spreads
is less than 1.5 years as portfolio runs off, while the average life
of the pay fixed swaps is 4.8 years
Total Ending Securities
3Q21 Ending Portfolio Composition
Highlights
$23.8 $25.8 $27.7
$35.1 $38.8
2.13%1.87%
1.67% 1.59% 1.52%
3Q20 4Q20 1Q21 2Q21 3Q21
Securities Yield
UST and Agency debt, $0.5 ABS, $0.2
Agency MBS, $31.8
Munis, $3.6
Corporates, $1.8
Other, $0.8
$ in billions

2021 Third Quarter Earnings Review
Automobile – Production Trend
29
Originations 3Q21 2Q21 1Q21 4Q20 3Q20 2Q20 1Q20 4Q19 3Q19
Amount ($ in billions) $1.8 $1.9 $1.4 $1.4 $1.7 $1.2 $1.6 $1.9 $1.6
% new vehicles 38% 47% 49% 54% 48% 36% 47% 52% 46%
Avg. LTV 85% 84% 87% 86% 89% 90% 89% 88% 90%
Avg. FICO 772 770 771 774 777 770 778 781 773
Vintage Performance(1)
6-month losses 0.02% 0.03% 0.02% 0.02% 0.02% 0.02% 0.04%
9-month losses 0.04% 0.08% 0.05% 0.05% 0.06% 0.07%
12-month losses 0.11% 0.10% 0.10% 0.09% 0.13%
(1) Annualized
2021 Third Quarter Earnings Review
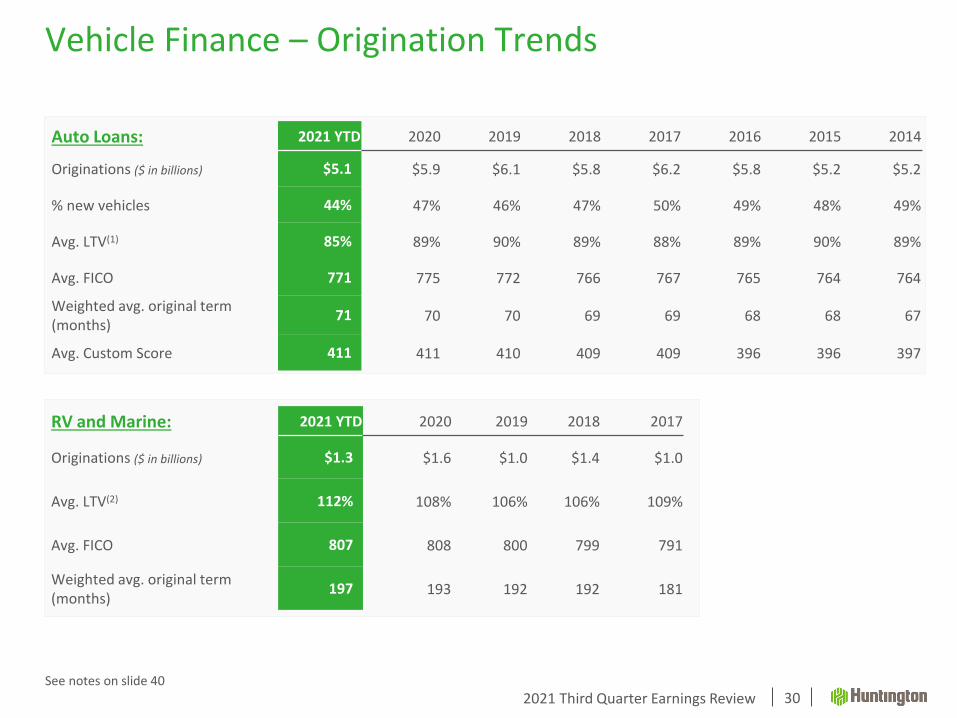
RV and Marine: 2021 YTD 2020 2019 2018 2017
Originations ($ in billions) $1.3 $1.6 $1.0 $1.4 $1.0
Avg. LTV(2) 112% 108% 106% 106% 109%
Avg. FICO 807 808 800 799 791
Weighted avg. original term (months)
197 193 192 192 181
Vehicle Finance – Origination Trends
30See notes on slide 40
Auto Loans: 2021 YTD 2020 2019 2018 2017 2016 2015 2014
Originations ($ in billions) $5.1 $5.9 $6.1 $5.8 $6.2 $5.8 $5.2 $5.2
% new vehicles 44% 47% 46% 47% 50% 49% 48% 49%
Avg. LTV(1) 85% 89% 90% 89% 88% 89% 90% 89%
Avg. FICO 771 775 772 766 767 765 764 764
Weighted avg. original term (months)
71 70 70 69 69 68 68 67
Avg. Custom Score 411 411 410 409 409 396 396 397

2021 Third Quarter Earnings Review
Home Equity: 2021 YTD 2020 2019 2018 2017 2016 2015 2014
Originations(1) ($ in billions) $3.0 $3.8 $3.7 $4.2 $4.3 $3.3 $2.9 $2.6
Avg. LTV 68% 68% 75% 77% 77% 78% 77% 76%
Avg. FICO 783 784 778 773 775 781 781 780
HPI Index(2) 271.8 241.9 228.5 218.6 208.5 198.2 187.7 179.6
Unemployment rate(3) 5.7% 8.1% 3.7% 3.9% 4.4% 4.9% 5.3% 6.2%
Residential Mortgage and Home Equity Origination Trends
See notes on slide 40
31
Residential Mortgage: 2021 YTD 2020 2019 2018 2017 2016 2015 2014
Originations ($ in billions) $5.1 $4.7 $2.9 $2.9 $2.7 $1.9 $1.5 $1.2
Avg. LTV 76% 77% 81% 83% 84% 84% 83% 83%
Avg. FICO 768 767 761 758 760 751 756 754
2021 Third Quarter Earnings Review
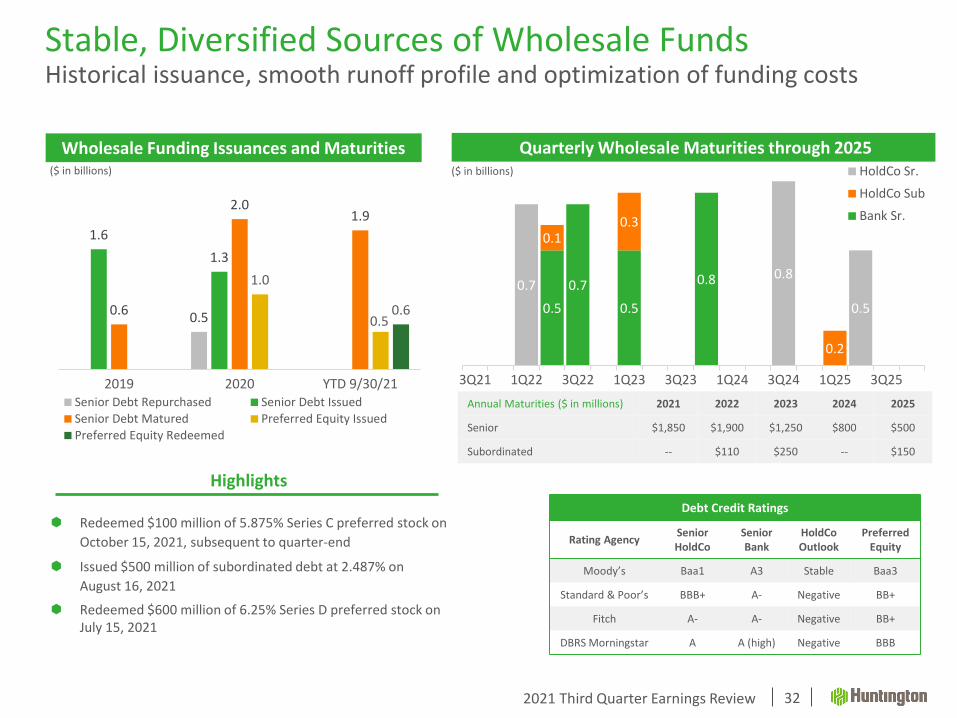
Debt Credit Ratings
Rating AgencySeniorHoldCo
Senior Bank
HoldCoOutlook
PreferredEquity
Moody’s Baa1 A3 Stable Baa3
Standard & Poor’s BBB+ A- Negative BB+
Fitch A- A- Negative BB+
DBRS Morningstar A A (high) Negative BBB
Wholesale Funding Issuances and Maturities
32
Redeemed $100 million of 5.875% Series C preferred stock on
October 15, 2021, subsequent to quarter-end
Issued $500 million of subordinated debt at 2.487% on
August 16, 2021
Redeemed $600 million of 6.25% Series D preferred stock on July 15, 2021
0.5
1.6
1.3
0.6
2.01.9
1.0
0.50.6
2019 2020 YTD 9/30/21Senior Debt Repurchased Senior Debt Issued
Senior Debt Matured Preferred Equity Issued
Preferred Equity Redeemed
0.5
0.7
0.5
0.8
0.10.3
0.2
0.70.8
0.5
3Q21 1Q22 3Q22 1Q23 3Q23 1Q24 3Q24 1Q25 3Q25
HoldCo Sr.
HoldCo Sub
Bank Sr.
($ in billions) ($ in billions)
Quarterly Wholesale Maturities through 2025
Annual Maturities ($ in millions) 2021 2022 2023 2024 2025
Senior $1,850 $1,900 $1,250 $800 $500
Subordinated -- $110 $250 -- $150
Highlights
Stable, Diversified Sources of Wholesale FundsHistorical issuance, smooth runoff profile and optimization of funding costs
2021 Third Quarter Earnings Review
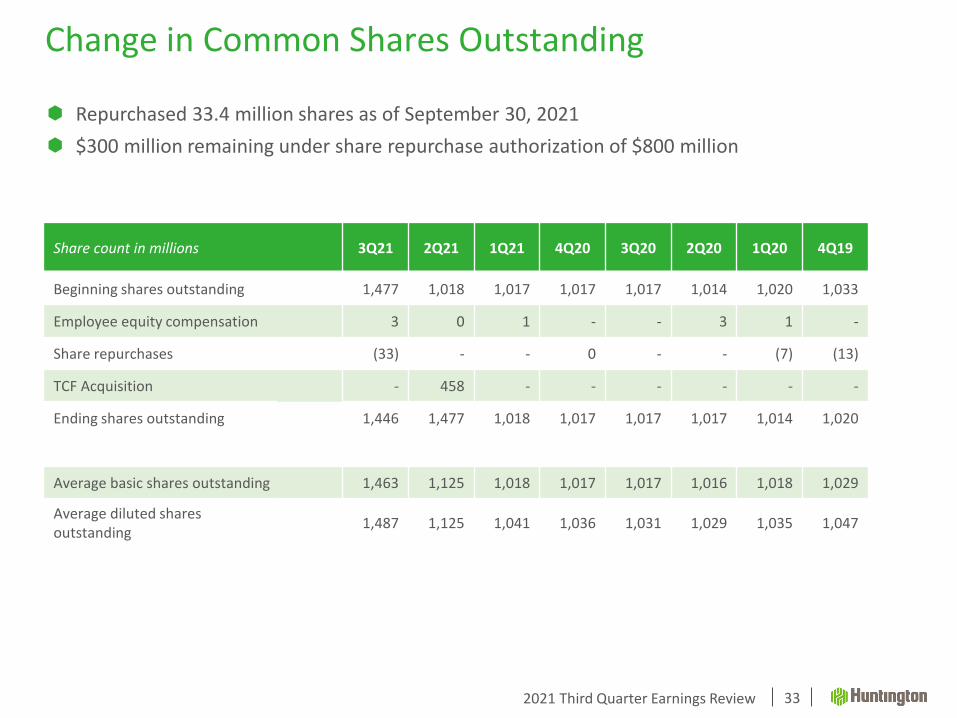
Repurchased 33.4 million shares as of September 30, 2021
$300 million remaining under share repurchase authorization of $800 million
Change in Common Shares Outstanding
33
Share count in millions 3Q21 2Q21 1Q21 4Q20 3Q20 2Q20 1Q20 4Q19
Beginning shares outstanding 1,477 1,018 1,017 1,017 1,017 1,014 1,020 1,033
Employee equity compensation 3 0 1 - - 3 1 -
Share repurchases (33) - - 0 - - (7) (13)
TCF Acquisition - 458 - - - - - -
Ending shares outstanding 1,446 1,477 1,018 1,017 1,017 1,017 1,014 1,020
Average basic shares outstanding 1,463 1,125 1,018 1,017 1,017 1,016 1,018 1,029
Average diluted shares outstanding
1,487 1,125 1,041 1,036 1,031 1,029 1,035 1,047

Credit Quality
2021 Third Quarter Earnings Review
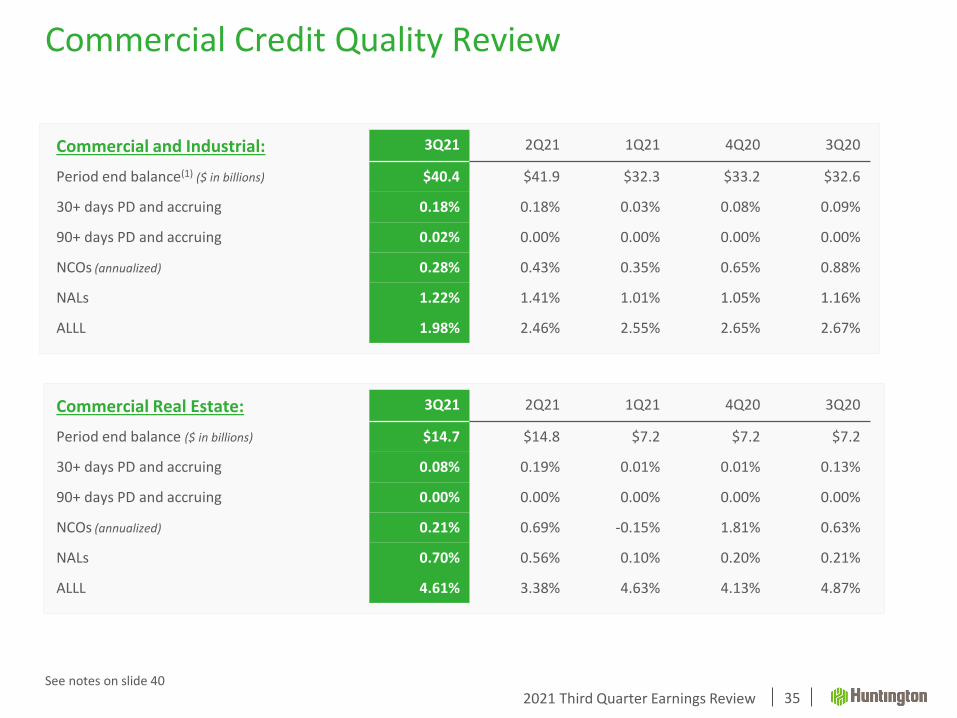
Commercial Credit Quality Review
35
Commercial and Industrial: 3Q21 2Q21 1Q21 4Q20 3Q20
Period end balance(1) ($ in billions) $40.4 $41.9 $32.3 $33.2 $32.6
30+ days PD and accruing 0.18% 0.18% 0.03% 0.08% 0.09%
90+ days PD and accruing 0.02% 0.00% 0.00% 0.00% 0.00%
NCOs (annualized) 0.28% 0.43% 0.35% 0.65% 0.88%
NALs 1.22% 1.41% 1.01% 1.05% 1.16%
ALLL 1.98% 2.46% 2.55% 2.65% 2.67%
See notes on slide 40
Commercial Real Estate: 3Q21 2Q21 1Q21 4Q20 3Q20
Period end balance ($ in billions) $14.7 $14.8 $7.2 $7.2 $7.2
30+ days PD and accruing 0.08% 0.19% 0.01% 0.01% 0.13%
90+ days PD and accruing 0.00% 0.00% 0.00% 0.00% 0.00%
NCOs (annualized) 0.21% 0.69% -0.15% 1.81% 0.63%
NALs 0.70% 0.56% 0.10% 0.20% 0.21%
ALLL 4.61% 3.38% 4.63% 4.13% 4.87%
2021 Third Quarter Earnings Review
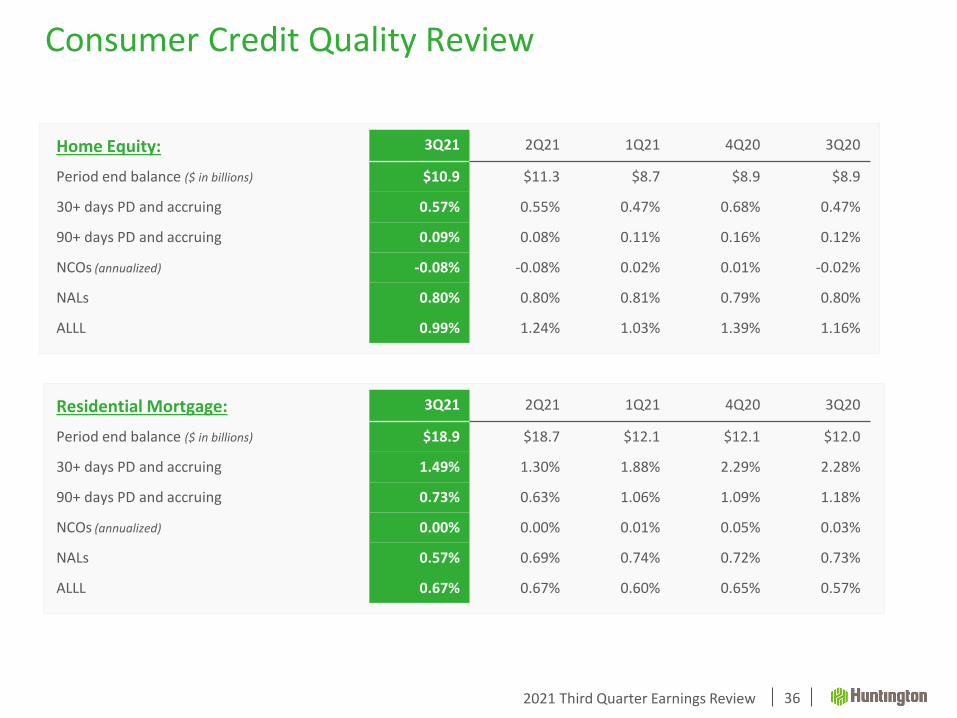
Consumer Credit Quality Review
36
Home Equity: 3Q21 2Q21 1Q21 4Q20 3Q20
Period end balance ($ in billions) $10.9 $11.3 $8.7 $8.9 $8.9
30+ days PD and accruing 0.57% 0.55% 0.47% 0.68% 0.47%
90+ days PD and accruing 0.09% 0.08% 0.11% 0.16% 0.12%
NCOs (annualized) -0.08% -0.08% 0.02% 0.01% -0.02%
NALs 0.80% 0.80% 0.81% 0.79% 0.80%
ALLL 0.99% 1.24% 1.03% 1.39% 1.16%
Residential Mortgage: 3Q21 2Q21 1Q21 4Q20 3Q20
Period end balance ($ in billions) $18.9 $18.7 $12.1 $12.1 $12.0
30+ days PD and accruing 1.49% 1.30% 1.88% 2.29% 2.28%
90+ days PD and accruing 0.73% 0.63% 1.06% 1.09% 1.18%
NCOs (annualized) 0.00% 0.00% 0.01% 0.05% 0.03%
NALs 0.57% 0.69% 0.74% 0.72% 0.73%
ALLL 0.67% 0.67% 0.60% 0.65% 0.57%
2021 Third Quarter Earnings Review
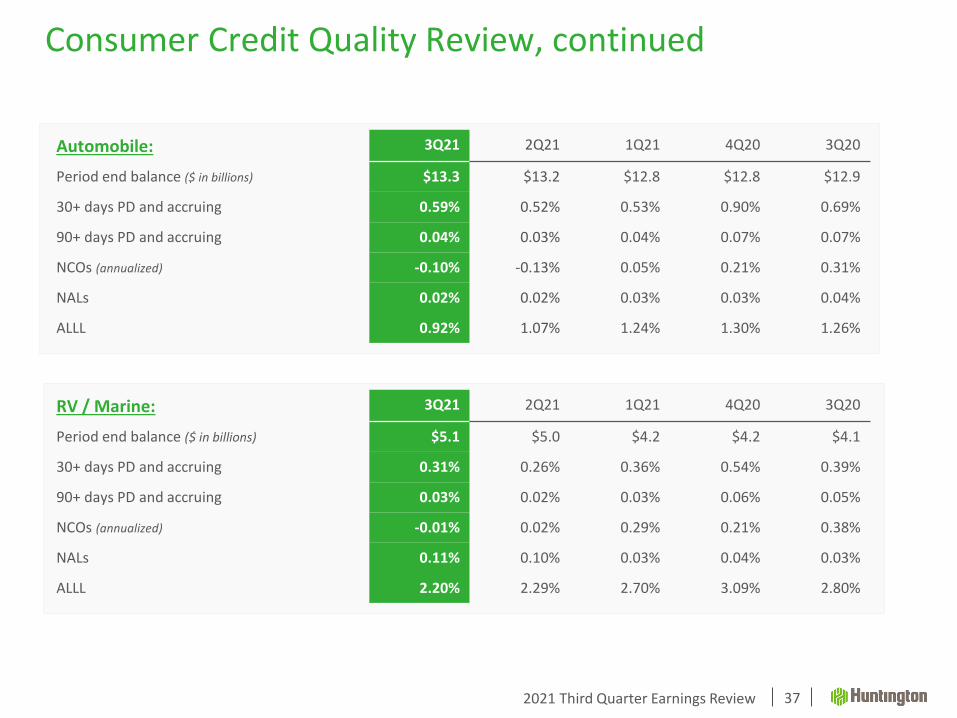
Consumer Credit Quality Review, continued
37
Automobile: 3Q21 2Q21 1Q21 4Q20 3Q20
Period end balance ($ in billions) $13.3 $13.2 $12.8 $12.8 $12.9
30+ days PD and accruing 0.59% 0.52% 0.53% 0.90% 0.69%
90+ days PD and accruing 0.04% 0.03% 0.04% 0.07% 0.07%
NCOs (annualized) -0.10% -0.13% 0.05% 0.21% 0.31%
NALs 0.02% 0.02% 0.03% 0.03% 0.04%
ALLL 0.92% 1.07% 1.24% 1.30% 1.26%
RV / Marine: 3Q21 2Q21 1Q21 4Q20 3Q20
Period end balance ($ in billions) $5.1 $5.0 $4.2 $4.2 $4.1
30+ days PD and accruing 0.31% 0.26% 0.36% 0.54% 0.39%
90+ days PD and accruing 0.03% 0.02% 0.03% 0.06% 0.05%
NCOs (annualized) -0.01% 0.02% 0.29% 0.21% 0.38%
NALs 0.11% 0.10% 0.03% 0.04% 0.03%
ALLL 2.20% 2.29% 2.70% 3.09% 2.80%

2021 Third Quarter Earnings Review
Consumer (90+ Days(2))Consumer (30+ Days(2))
Delinquencies
38See notes on slide 40
0.19%
0.15%
0.12%
0.26%
0.33%
3Q20 4Q20 1Q21 2Q21 3Q21
Commercial (30+ Days(1)) Commercial (90+ Days(1))
0.02% 0.02% 0.02% 0.02% 0.03%
3Q20 4Q20 1Q21 2Q21 3Q21
2.28%2.29%
1.88%
1.30%1.49%
0.69%
0.90%
0.53%
0.52%
0.59%
0.47%
0.68%0.47%
0.55%
0.57%
1.11%1.26%
0.93%0.80%
0.90%
3Q20 4Q20 1Q21 2Q21 3Q21Residential Mortgage Automobile
Home Equity Total Consumer
1.18%1.09% 1.06%
0.63%0.73%
0.07%0.07% 0.04% 0.03%
0.04%
0.12% 0.16%0.11% 0.08% 0.09%
0.42% 0.41% 0.38%
0.27% 0.31%
3Q20 4Q20 1Q21 2Q21 3Q21Residential Mortgage Automobile
Home Equity Total Consumer
2021 Third Quarter Earnings Review
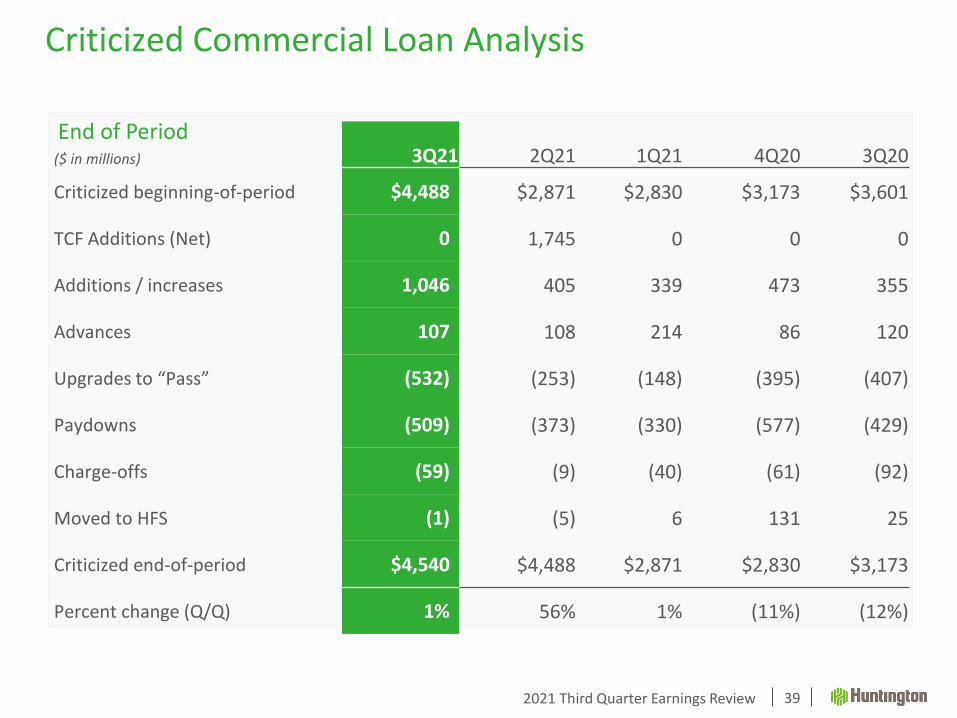
($ in millions) 3Q21 2Q21 1Q21 4Q20 3Q20
Criticized beginning-of-period $4,488 $2,871 $2,830 $3,173 $3,601
TCF Additions (Net) 0 1,745 0 0 0
Additions / increases 1,046 405 339 473 355
Advances 107 108 214 86 120
Upgrades to “Pass” (532) (253) (148) (395) (407)
Paydowns (509) (373) (330) (577) (429)
Charge-offs (59) (9) (40) (61) (92)
Moved to HFS (1) (5) 6 131 25
Criticized end-of-period $4,540 $4,488 $2,871 $2,830 $3,173
Percent change (Q/Q) 1% 56% 1% (11%) (12%)
Criticized Commercial Loan Analysis
39
End of Period
2021 Third Quarter Earnings Review
Notes
40
Slide 9:(1) Disclosed PPP impact only refers to legacy Huntington PPP. Legacy TCF PPP deferred fees were zeroed out as part of the purchase
accounting process, and all TCF PPP loans have a purchase accounting discount that is included in PAA metrics
Slide 12:(1) September 30, 2021 figures are estimated. Amounts are presented on a Basel III standardized approach basis for calculating risk-
weighted assets. The capital ratios reflect Huntington’s election of a five-year transition to delay for two years the full impact of CECL on regulatory capital, followed by a three-year transition period
Slide 25:(1) Active digital users – users of all web and/or mobile platforms who logged in at least once each month of the quarter(2) Active mobile users – users of all mobile platforms who logged in at least once each month of the quarter(3) Digital chart excludes fraud activity in Q1, Q2, and Q3 2021
Slide 30:(1) Auto LTV based on retail value(2) RV/Marine LTV based on wholesale value
Slide 31:(1) Originations are based on commitment amounts(2) FHFA Regional HPI ENC Season-Adj; U.S. and Census Division(3) Source: BLS.gov; average of monthly seasonally-adjusted unemployment rate for period
Slide 35:(1) C&I loan balances include PPP balances
Slide 38:(1) Amounts include Huntington Technology Finance administrative lease delinquencies(2) End of period; delinquent but accruing as a % of related outstandings at end of period
Related Documents