2021 Washington Statewide Human Services Transportation Plan

Welcome message from author
This document is posted to help you gain knowledge. Please leave a comment to let me know what you think about it! Share it to your friends and learn new things together.
Transcript
P A G E 1
2021 Washington Statewide Human Services Transportation Plan
This report is available in electronic format only. It can be downloaded and printed from the WSDOT Public Transportation Division website at www.wsdot.wa.gov/transit/planning#StatewideHumanServicesTransportation Plan.
For more information about this report, contact: WSDOT Public Transportation Division PO Box 47387 Olympia, WA 98504-7387
Title VI Notice to Public: It is the Washington State Department of Transportation’s (WSDOT) policy to assure that no person shall, on the grounds of race, color, or national origin, as provided by Title VI of the Civil Rights Act of 1964, be excluded from participation in, be denied the benefits of, or be otherwise discriminated against under any of its programs and activities. Any person who believes his/her Title VI protection has been violated, may file a complaint with WSDOT’s Office of Equal Opportunity (OEO). For additional information regarding Title VI complaint procedures and/or information regarding our non-discrimination obligations, please contact OEO’s Title VI Coordinator at 360-705-7090.
Americans with Disabilities Act (ADA) Information: This material can be made available in an alternate format by emailing the Office of Equal Opportunity at [email protected] or by calling toll free, 855-362-4ADA (4232). Persons who are deaf or hard of hearing may make a request by calling the Washington State Relay at 711.
Notificación de Titulo VI al Público: Es la política del Departamento de Transportación del Estado de Washington (WSDOT, por sus siglas en inglés) asegurarse que ninguna persona, por razón de raza, color, o origen nacionalidad, según provee el Título VI de la Ley de Derechos Civiles de 1964, pueda ser excluido de la participación, negado los beneficios de o ser discriminado de otra manera bajo cualquiera de sus programas y actividades. Cualquier persona que crea que su protección bajo el Titulo VI ha sido violada, puede presentar una queja o reclamación ante la Comisión para la Igualdad de Oportunidades en el Empleo de Estados Unidos (EEOC, por sus siglas en inglés). Para obtener información adicional sobre los procedimientos de quejas y/o reclamaciones bajo el Titulo VI y/o información sobre nuestras obligaciones anti-discriminatorias, pueden contactar al coordinador del Título VI en la EEOC 360-705-7090.
Información del Acta Americans with Disabilities Act (ADA): Este material es disponible en un formato alternativo enviando un email/ correo electrónico a la Comisión Estadounidense de Igualdad de Oportunidades en el Empleo [email protected] o llamando gratis al 855-362-4ADA (4232). Personas sordas o con discapacidad auditiva pueden solicitar llamando Washington State Relay al 711.

LETTER FROM THE SECRETARY [PLACEHOLDER FOR REVIEW AND COMMENT PERIOD]
P A G E 3
CONTENTS LETTER FROM THE SECRETARY............................................................................................................................................. 3
EXECUTIVE SUMMARY ............................................................................................................................................................. 8
Organization of plan ............................................................................................................................................................. 8
Stakeholder collaboration ................................................................................................................................................... 9
Integration with statewide policy objectives ................................................................................................................. 9
Statewide coordination efforts.......................................................................................................................................... 9
Major findings and goals.................................................................................................................................................... 10
Strategies and recommended actions ............................................................................................................................10
Strategies and actions ready for implementation.........................................................................................................10
Strategies and actions requiring further legislative direction .....................................................................................11
More information ................................................................................................................................................................11
Acknowledgements ............................................................................................................................................................12
CHAPTER 1: HUMAN SERVICES TRANSPORTATION TODAY ....................................................................................13
National and statewide agencies in human services transportation......................................................................13
Federal: ...............................................................................................................................................................................13
Statewide: ...........................................................................................................................................................................13
Policies and programs that serve people with special transportation needs.......................................................14
Americans with Disabilities Act.......................................................................................................................................14
Non-emergency medical transportation: Medicaid and Medicare ..........................................................................14
Veterans Affairs Benefits..................................................................................................................................................15
Discounted Fare Requirement .........................................................................................................................................15
McKinney Vento Homeless Assistance Act ...................................................................................................................15
Mobility management ......................................................................................................................................................16
Human services transportation providers.....................................................................................................................16
People who are eligible for human services transportation.....................................................................................19
Eligible demographic groups and where they live in Washington ............................................................................20
Mobility needs index for people eligible for human services transportation ...........................................................37
Demographic groups with additional mobility barriers ..............................................................................................37
Key destinations for people with special transportation needs..................................................................................43
Human Services Transportation service models ....................................................................................................... 44
Fixed-route transportation ..............................................................................................................................................44
Route-deviated transportation........................................................................................................................................44
Demand response transportation...................................................................................................................................45
Measuring levels of service in human services transportation................................................................................45
Accessible public transit in Washington ........................................................................................................................45
P A G E 4
CHAPTER 2: FUNDING HUMAN SERVICES TRANSPORTATION ..............................................................................50
Consolidated Grant Program............................................................................................................................................50
Rural Mobility grants ........................................................................................................................................................51
State Paratransit/Special Needs grants .........................................................................................................................51
Federal Section 5310: Enhanced Mobility of Seniors and People with Disabilities.................................................51
Federal Section 5311: Formula Grants for Rural Areas...............................................................................................51
Federal Section 5339: Bus and Bus Facilities Infrastructure Investment Program .................................................51
COVID-19 federal relief .....................................................................................................................................................51
CARES Act............................................................................................................................................................................. 51
CRRSAA ................................................................................................................................................................................. 52
ARP .........................................................................................................................................................................................53
Funding for nonemergency medical transportation programs ................................................................................54
Funding for community transportation providers.......................................................................................................54
Public transportation revenues and expenses ............................................................................................................54
Public transportation capital project expenses ...........................................................................................................54
Public transportation operating expenses ....................................................................................................................54
Other important funding sources ...................................................................................................................................55
Federal transportation funding under FAST Act ..........................................................................................................55
Federal Section 5307: Urbanized Area Formula grants...............................................................................................55
Federal social service agency programs for human services transportation............................................................56
CHAPTER 3: HUMAN SERVICES TRANSPORTATION GOALS, UNMET NEEDS AND STRATEGIES .................57
Methodology: goals, unmet needs and strategies.......................................................................................................57
Unmet needs in human services transportation...........................................................................................................57
GOAL 1: Human services transportation is accessible and helps more people get to the places they need to go ................................................................................................................................................58
Unmet needs: accessibility...............................................................................................................................................58
GOAL 2: People feel safe using human services transportation .............................................................................61
Unmet needs: safety .........................................................................................................................................................61
GOAL 3: Human services transportation is easy to us .................................................................. 63
Unmet needs: ease of use.................................................................................................................................................63
Strategies in human services transportation................................................................................................................65
Strategies and actions ready for implementation.........................................................................................................65
Strategies and actions requiring further legislative direction .....................................................................................69
P A G E 5

CHAPTER 4: COVID-19 RESPONSE......................................................................................................................................71
Safety and sanitation..........................................................................................................................................................71
Fare structuring and collection ........................................................................................................................................72
Meal and prescription delivery ........................................................................................................................................73
Communication....................................................................................................................................................................73
Vaccine access and distribution ....................................................................................................................................... 74
Applying lessons learned................................................................................................................................................... 74
CHAPTER 5: EMERGING TRENDS ........................................................................................................................................75
Emerging issues in nonemergency medical transportation ......................................................................................75
People with cancer ...........................................................................................................................................................75
People with kidney disease ............................................................................................................................................. 76
Seniors and the aging population ..................................................................................................................................77
New mobility services for NEMT trips............................................................................................................................77
Rising healthcare expenses ..............................................................................................................................................79
Emerging technology trends.............................................................................................................................................79
Autonomous vehicles ........................................................................................................................................................79
Broadband access .............................................................................................................................................................79
Real-time information systems .......................................................................................................................................80
Data standardization for transportation providers ......................................................................................................80
New fare payment systems..............................................................................................................................................80
CHAPTER 6: OUTREACH AND ENGAGEMENT FOR THIS PLAN................................................................................81
Community outreach and COVID-19 .............................................................................................................................81
How community input is reflected in the plan.............................................................................................................81
PHASE 1: Summary of outreach from 2018-2019 ......................................................................................................81
Human Services Steering Committee.............................................................................................................................81
Statewide community engagement ................................................................................................................................82
Local plan analysis.............................................................................................................................................................82
Public engagement............................................................................................................................................................82
Key themes .........................................................................................................................................................................83
PHASE 2: Summary of outreach from 2020-2021......................................................................................................85
Stakeholder discussion groups.........................................................................................................................................85
Online open house ...........................................................................................................................................................87
Review and comment period ...........................................................................................................................................87
Key themes .........................................................................................................................................................................87
P A G E 6
APPENDIX 1: ADDITIONAL DEMOGRAPHIC DATA AND ANALYSES ................................................ 88
Measures of poverty...........................................................................................................................................................88
Access to transit...................................................................................................................................................................88
Access to major destinations and services ...................................................................................................................89
Job opportunities...............................................................................................................................................................90
Healthcare and medical facilities....................................................................................................................................91
Household necessities.......................................................................................................................................................92
APPENDIX 2: DATA SOURCES AND METHODOLOGIES ..............................................................................................96
2009 & 2017 National Household Travel Survey data...............................................................................................96
Identifying demand response services for human services riders ..........................................................................96
Demand response level of service................................................................................................................................... 96
Demand response service and mobility needs.............................................................................................................. 96
APPENDIX 3: HUMAN SERVICES STEERING COMMITTEE MEMBERS .................................................97
Membership from 2018 to 2021, in alphabetical order.............................................................................................97
GLOSSARY ...................................................................................................................................................................................98
FOOTNOTES ............................................................................................................................................................................ 100
P A G E 7

EXECUTIVE SUMMARY
Human services transportation are types of transportation services that are specifically designed to serve people with special transportation needs. Washington state law defines people with special transportation needs as “persons, including their personal attendants, who because of physical or mental disability, income status, or age are unable to transport themselves or purchase transportation.
The Statewide Human Services Transportation Plan (HSTP), prepared by the Washington State Department of Transportation, serves as a strategic framework for addressing the state’s existing and future human services transportation needs. Developed through collaboration with affected stakeholders and with public input, the Statewide HSTP provides a set of goals and strategies to facilitate coordination and maximize resources to meet the transportation needs of the most vulnerable people in our state.
Regional planning efforts have succeeded in revealing local needs and transportation issues specific to each region within the state. This plan provides a unique opportunity to advance those local findings regarding unmet needs, as well as to develop common strategies at a statewide level.
The Statewide HSTP’s primary objectives include:
• Identify statewide human services transportation unmet needs, gaps and barriers.
• Investigate best practices in improving human service transportation planning and service delivery as implemented both nationally and in Washington state.
• Develop strategies and recommendations to improve access and mobility, safety and the user experience for people with special transportation needs.
Organization of plan The Statewide HSTP has six chapters, three appendices and a glossary:
• Chapter 1: Human services transportation today
• Chapter 2: Funding human services transportation
• Chapter 3: Human services transportation goals, unmet needs, and strategies
• Chapter 4: COVID-19 response
• Chapter 5: Emerging trends
• Chapter 6: Outreach and engagement for this plan
• Appendix 1: Additional demographic data and analyses
• Appendix 2: Data sources and methodologies
• Appendix 3: Human services steering committee members
• Glossary
P A G E 8
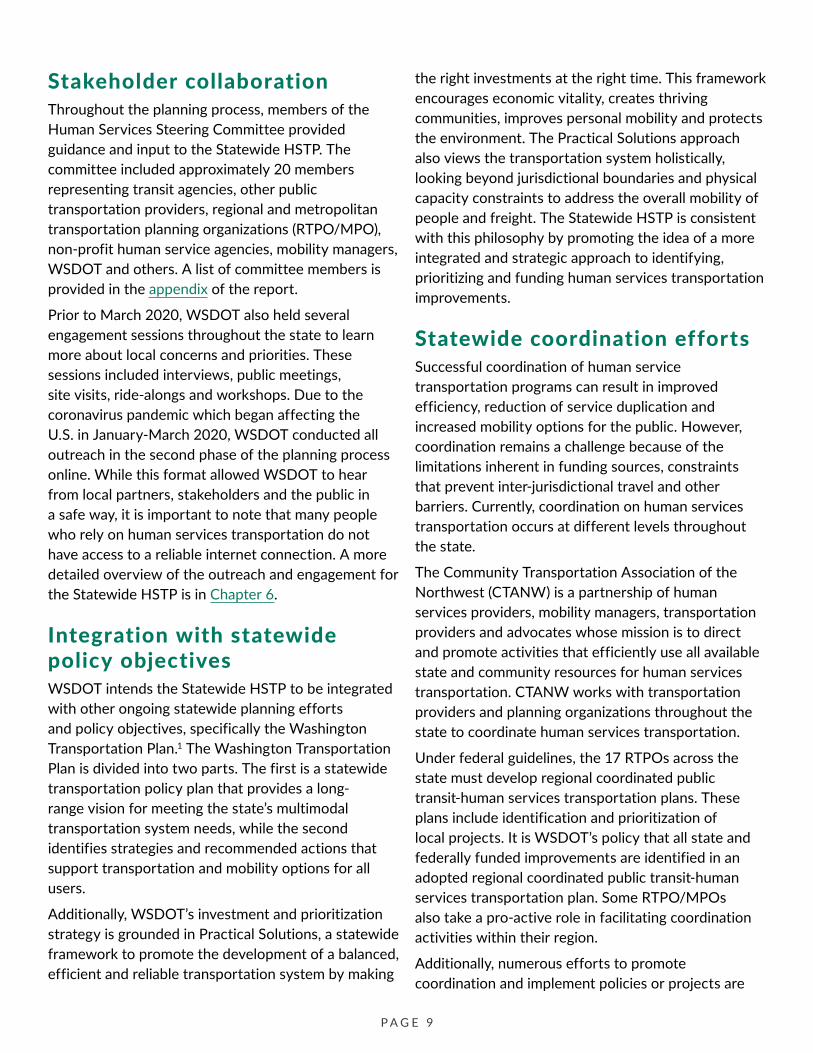
Stakeholder collaboration Throughout the planning process, members of the Human Services Steering Committee provided guidance and input to the Statewide HSTP. The committee included approximately 20 members representing transit agencies, other public transportation providers, regional and metropolitan transportation planning organizations (RTPO/MPO), non-profit human service agencies, mobility managers, WSDOT and others. A list of committee members is provided in the appendix of the report.
Prior to March 2020, WSDOT also held several engagement sessions throughout the state to learn more about local concerns and priorities. These sessions included interviews, public meetings, site visits, ride-alongs and workshops. Due to the coronavirus pandemic which began affecting the U.S. in January-March 2020, WSDOT conducted all outreach in the second phase of the planning process online. While this format allowed WSDOT to hear from local partners, stakeholders and the public in a safe way, it is important to note that many people who rely on human services transportation do not have access to a reliable internet connection. A more detailed overview of the outreach and engagement for the Statewide HSTP is in Chapter 6.
Integration with statewide policy objectives WSDOT intends the Statewide HSTP to be integrated with other ongoing statewide planning efforts and policy objectives, specifically the Washington Transportation Plan.1 The Washington Transportation Plan is divided into two parts. The first is a statewide transportation policy plan that provides a long-range vision for meeting the state’s multimodal transportation system needs, while the second identifies strategies and recommended actions that support transportation and mobility options for all users.
Additionally, WSDOT’s investment and prioritization strategy is grounded in Practical Solutions, a statewide framework to promote the development of a balanced, efficient and reliable transportation system by making
the right investments at the right time. This framework encourages economic vitality, creates thriving communities, improves personal mobility and protects the environment. The Practical Solutions approach also views the transportation system holistically, looking beyond jurisdictional boundaries and physical capacity constraints to address the overall mobility of people and freight. The Statewide HSTP is consistent with this philosophy by promoting the idea of a more integrated and strategic approach to identifying, prioritizing and funding human services transportation improvements.
Statewide coordination efforts Successful coordination of human service transportation programs can result in improved efficiency, reduction of service duplication and increased mobility options for the public. However, coordination remains a challenge because of the limitations inherent in funding sources, constraints that prevent inter-jurisdictional travel and other barriers. Currently, coordination on human services transportation occurs at different levels throughout the state.
The Community Transportation Association of the Northwest (CTANW) is a partnership of human services providers, mobility managers, transportation providers and advocates whose mission is to direct and promote activities that efficiently use all available state and community resources for human services transportation. CTANW works with transportation providers and planning organizations throughout the state to coordinate human services transportation.
Under federal guidelines, the 17 RTPOs across the state must develop regional coordinated public transit-human services transportation plans. These plans include identification and prioritization of local projects. It is WSDOT’s policy that all state and federally funded improvements are identified in an adopted regional coordinated public transit-human services transportation plan. Some RTPO/MPOs also take a pro-active role in facilitating coordination activities within their region.
Additionally, numerous efforts to promote coordination and implement policies or projects are
P A G E 9
underway at the local level within Washington state. Some of these efforts are organized at the county level and others are multi-county in nature and generally result in collaboration between public transit agencies and their human service agency partners.
Major findings and goals Research, data analysis, and engagement efforts helped identify several current issues in human services transportation.
• Many people with special transportation needs continue to have limited or no meaningful access to transportation options.
• Transportation providers struggle to provide robust service in urban areas while also sustaining high levels of service and geographic coverage in rural areas.
• People with special transportation needs do not always feel safe using the options available to them.
• People who rely on special transportation services the most often cannot access them easily or find it too complicated to use the available services.
• Coordination between transportation providers and human services providers is an essential component of a modern human services transportation system.
• Addressing unmet need in human services transportation requires funding.
This stakeholder feedback helped WSDOT identify 3 primary goals to address in this version of the Statewide HSTP:
• Accessibility: Human services transportation is accessible and helps more people get to the places they need to go.
• Safety: People feel safe using human services transportation.
• Ease of use: Human services transportation is easy to use.
Strategies and recommended actions Stakeholders also played a large role in identifying and refining a list of strategies and actions that WSDOT and its partners can take to address the unmet needs in human services transportation. These strategies (numbered) and actions (lettered) are split into two groups: • Ready for implementation: there are few barriers
to implementation. • Require further legislative direction: there are
several barriers to implementation, including funding, policy, or capacity.
Additional details – including descriptions, proposed timeframes, and deliverables – are covered in Chapter 3.
Strategies and actions ready for implementation The list of strategies (numbered) and actions (lettered) below can serve as an action plan for the duration of the next planning cycle for the Statewide HSTP:
1) Improve services for people with mobility barriers. a) WSDOT and transportation providers should
continue to support national efforts to increase flexibility for use of federal funds (e.g., Coordinating Council on Access and Mobility).
2) Ensure an ongoing pool of qualified and trained operators to keep customers safe. a) CTANW should continue to explore
standardized operator training across the state for human services transportation providers.
b) WSDOT, CTANW and transit agencies should consider developing a proposal for job training and commercial drivers’ license training that enables underrepresented populations to fill jobs in public transportation and electrification maintenance.
3) Improve the influence of people with mobility barriers in transportation plans and decisions. a) Government agencies and other transportation
service providers should deploy updated tools and invest staff resources to better engage people with mobility barriers.
P A G E 1 0

b) Government agencies should update grant selection processes to improve the consideration of mobility for people with mobility barriers.
c) WSDOT should update planning guidance to enable more robust consideration of mobility for people with mobility barriers.
d) WSDOT should develop better methodologies to identify unmet needs for people with mobility barriers and estimate costs.
4) Make it easier to use technology to plan, book and pay for public transportation.
a) Public transportation providers should pursue a central repository of data that could support improved services and travel information for people with mobility barriers and one-call/one-click programs.
b) Public transportation providers should integrate accessibility features and eligibility into transportation data standards.
c) The Joint Transportation Committee (JTC) should complete their study that assesses opportunities to improve rural broadband service.
d) State agencies should update policies to support rural broadband expansion based on findings from the JTC study to assess broadband needs.
e) WSDOT should provide technical support to transportation service providers to update data standards and provide data that meets these standards.
f) Public transportation providers should provide peer support to collaborate and develop regional fare programs.
5) Improve access to transit and on-demand mobility for people with mobility barriers.
a) WSDOT, local jurisdictions and transit agencies should invest staff resources to emphasize universal access, rider comfort and safety in planning, project development, scoping, design and delivery of transit stops.
b) Government agencies and other transportation service providers should include considerations
for people with mobility barriers in grants, programs and policies that relate to mobility on demand and first/last-mile to transit connections.
c) WSDOT and transit agencies should pilot the use of vanpools program flexibility for non-work trips (e.g., groceries, medical appointments, training and education).
Strategies and actions requiring further legislative direction Not all strategies and actions identified in this plan are ready for implementation. Strategy 9 covers high-priority actions that require additional direction and funding from the Legislature.
6) Maintain and expand services for people with mobility barriers.
a) Communities should maintain existing public transportation services, including paratransit and human services transportation. To do so, additional federal, state, and/or local funded is needed.
b) Communities should expand public transportation services to improve mobility for people with mobility barriers. To do so, additional federal, state and/or local funding is needed.
c) Communities should expand access to transportation services for people with mobility barriers and improve the efficiency of public transportation services by expanding mobility management and coalitions. To do so, additional federal, state and/or local funding is needed.
d) Communities should improve emergency response planning for people with mobility barriers. To do so, additional federal, state and/ or local funding is needed.
e) Transportation providers should provide data and technology that makes it easier for people with mobility barriers to plan, book and pay for public.
For more information about this plan, visit our Public transportation plans page.
P A G E 1 1

Acknowledgements The Statewide HSTP was developed with the financial support of the Federal Transit Administration (FTA), the state of Washington, and the contribution of individuals and agencies throughout Washington. These individuals and agencies spent many hours in conversation with the project team either answering interview questions or serving on a steering committee. They offered insights and helped develop recommendations and review documents.
This plan was produced by WSDOT with consultant support provided by PRR, Inc. and The Athena Group, LLC.
In addition to the many people who helped develop this plan, WSDOT particularly thanks the following agencies, organizations and groups for their ongoing engagement on the Human Services Steering Committee:
• Association for County Human Services
• CTANW
• City of Seattle Aging and Disability Services
• Eastern Washington University Urban & Regional Planning Program
• Goin
• Governor’s committee on Disability Issues and Employment
• Hopelink
• Community in Motion
• Medstar
• Muckleshoot Tribe
• Pierce Transit Authority
• People for People
• Puget Sound Regional Council
• Tribal Transportation Planning Organization
• Washington State Department of Commerce
• Washington State Department of Health
• Washington State Department of Social and Health Services
• Washington State Healthcare Authority (HCA)
• Washington State Office of Financial Management
• Washington State Office of the Superintendent for Public Instruction
• Washington State Department of Veterans Affairs
P A G E 1 2

CHAPTER 1: HUMAN SERVICES TRANSPORTATION TODAY
Human services transportation are types of transportation services that are specifically designed to serve people with special transportation needs. Washington state law defines people with special transportation needs as “persons, including their personal attendants, who because of physical or mental disability, income status, or age are unable to transport themselves or purchase transportation.”2
State law also helps differentiate human services transportation programs and services from the broader public transportation system. Federal law and local communities may define people with special transportation needs differently.
While public transportation is designed with all riders in mind, this plan focuses on people with mobility barriers and the programs and services they rely on. These transportation services include bus routes, door-to-door service, taxis and other private mobility options, and other services in the human services transportation providers section of this plan.
National and statewide agencies in human services transportation Several federal and state agencies work to provide funding, programs and services for people with special transportation needs in Washington. In many cases, state agencies administer programs created through federal policies or funding.
Federal and state agencies involved in human services transportation include, but are not limited to:
Federal: • Federal Transit Administration (FTA)
• Federal Highway Administration (FHWA)
• Coordinating Council on Access and Mobility (CCAM)
• Department of Education
• Department of Health and Human Services
• Department of Veterans Affairs
Statewide: • Healthcare Authority (HCA)
• Department for Social and Health Services (DSHS)
• Washington State Department for Veterans Affairs
• Office of the Superintendent of Public Instruction
• WSDOT
P A G E 1 3
Policies and programs that serve people with special transportation needs The state of Washington and the federal government oversee various programs that support the mobility of people with special transportation needs. There are also hundreds of local programs, companies and organizations keeping Washingtonians with special transportation needs moving. The following policies and programs include the major programmatic components of the state’s human services transportation system.
Americans with Disabilities Act The Americans with Disabilities Act (ADA) of 1990 is a federal civil rights law that prohibits discrimination and ensures equal opportunity and access for people with disabilities.3 These protections include public transportation services and programs. Specifically, equal access means the same access enjoyed by members of the public without disabilities.
To comply with the ADA, public transit operators must make accommodations to ensure their systems are accessible for people with disabilities:
• Fixed-route buses must have lifts or ramps so that wheelchair users (or people with other mobility devices) can use the bus.
• Fixed-route buses must have priority seating designated for people with disabilities or the elderly.
• Transit systems must have voice announcements of stops and stations to help blind or people with visual impairments navigate the system.
• Existing key rail stations and all new rail stations must be accessible and meet ADA requirements.
• Design and construction of new and rehabilitated facilities must comply with ADA requirements.
• Public transit providers must make written or other materials available in accessible formats upon request.
Paratransit Some people with disabilities cannot independently use transit service even with ADA accommodations. For these people, transit operators must provide complementary specialized paratransit services.
Specialized paratransit service is typically prescheduled transportation provided by an accessible van, bus, taxi or car for people with disabilities who are functionally incapable of using fixed-route service.
Transit providers must conduct a paratransit eligibility process that conforms to ADA requirements. While the ADA does not list individual disabilities that are eligible, it states that an individual must have a disability to use paratransit. The ADA defines a disability as a physical or mental impairment that substantially limits one or more major life activities.4
Although each paratransit provider is unique, ADA paratransit services are available for any purpose, and there is no limit to the number of trips an ADA-paratransit-eligible person may take.
Non-emergency medical transportation: Medicaid and Medicare Non-emergency medical transportation (NEMT) refers to services that provide nonemergency, nonmilitary, surface transportation services of any kind to beneficiaries or clients for the purpose of receiving medical care.
NEMT is transportation for routine and preventive healthcare purposes such as standard doctor’s appointments, kidney dialysis treatments, and chemotherapy sessions. It excludes emergency transportation. While there are many organizations that coordinate rides for people who need medical care (e.g., American Cancer Society’s Road to Recovery program), there are two major NEMT programs through the federal government: Medicaid and Medicare.
Medicaid By far the most significant program that funds NEMT in Washington is Medicaid, administered by the Washington State HCA as Apple Health.
P A G E 1 4
Medicaid is a federal program that pays for basic health services for people with low-income and long-term care for older adults and people with disabilities.
FTA requires states to provide NEMT for Medicaid-eligible people who could not otherwise access medical facilities and services. Medicaid eligibility is primarily determined by income levels and family size. Screening is administered through a local Department of Social and Health Services Home and Community Services office or online through www.wahealthplanfinder.org. Due to the higher cost of living in Washington, the Medicaid eligibility threshold is 138 percent of the federal poverty level for households. Nearly a quarter of all Washington residents are enrolled in Medicaid.5
In Washington state, HCA contracts its NEMT work out with regional brokerages. The brokerages:
• Screen clients for eligibility based on their income and family size.
• Determine trip eligibility.
• Determine the appropriate transportation service.
• Solicit and manage service partners.
• Oversee program administration.
More information about the regional brokers is in Medicaid brokerages.
Medicare Medicare is a federal insurance program funded by payroll taxes. Most citizens are automatically eligible for Medicare once they reach age 65, but certain disabilities and medical needs (e.g., kidney dialysis) allow citizens to tap into these benefits before age 65. The Department of Social and Health Services oversees Medicare eligibility in Washington.
Medicare is less comprehensive and more restrictive than Medicaid in terms of the transportation services available. The Medicare program has multiple options (i.e., parts) with different levels of coverage and different fees. Participants must be enrolled in Medicare Advantage (i.e., Part C) to use the full extent of the transportation benefits for NEMT. Approximately six percent of Washington residents are enrolled in the Medicare Advantage program.6
Medicare Parts A and B only cover trips by ambulance. Medicare Part D primarily provides lower prescription costs and does not include transportation benefits.
Veterans Affairs Benefits After being discharged from active military service, veterans are eligible for special transportation programs. These benefits include transportation reimbursements for trips to medical appointments and, in some cases, rides for veterans who need help getting to and from Veterans Affairs health care facilities through the Veterans Transportation Service. These services are available to veterans who meet one or more of the following criteria:
• Over 65 years old.
• Live with a permanent and total disability.
• Live in a nursing home or long-term care facility due to a disability.
• Receive Social Security Disability Insurance or Supplemental Security Income.
Many veterans who are eligible for these services are also eligible for other types of human services transportation due to their age, ability, or income.
Discounted Fare Requirement Even though riding transit is often more affordable than owning a car, transit fares may still be cost-prohibitive for many people.
Through the Federal Transit Act, the FTA requires all federally subsidized transit providers to offer 50 percent discounted fares during off-peak hours for seniors (i.e., ages 65 or older), people with disabilities (eligibility determined by the provider) and Medicare cardholders.7 Some transportation providers extend these discounts to other groups, including students, children, and people with low incomes. This discount provides a strong incentive for older adults and people with disabilities to use fixed-route transit service if they are able.
McKinney Vento Homeless Assistance Act The McKinney-Vento Homeless Assistance Act of 1987 is a federal law that requires and provides funding for public schools to ensure that homeless
P A G E 1 5

youth have equal access to the same free, appropriate public education, as provided to other children and youth. The law is also inclusive of preschool education.8
Funding provided through the McKinney-Vento Act allows schools to facilitate transportation options for homeless youth. Although programs funded through the McKinney-Vento Act are operated at the local level, the McKinney-Vento Act covers the entire state.
Other locally funded school bus transportation systems fall outside of the scope of this plan.
Mobility management Mobility management is a rider-centered approach to designing and delivering transportation services. Mobility managers work with riders, planners, and stakeholders to deliver the transportation options that best meet the community’s needs.
In Washington state, mobility managers do research to assess needs and gaps, convene meetings, and build coalitions that work with communities to address transportation issues. This may include facilitating public/private partnerships, working with transit providers to streamline the scheduling process, and other innovative programs. Managers work with transportation planners, government agencies, and transportation providers to ensure the availability of well-coordinated, affordable, and accessible services.
Unlike the other programs, mobility management services are not restricted to any one demographic group. All mobility management activities contribute to a central goal: connecting customers to the transportation options that are most responsive to their needs. Mobility managers excel at staying informed about existing community transportation services, sharing that knowledge with customers and helping riders use all the services for which they are eligible.
Travel training Travel training programs provides riders with training and information about how to safely use all their mobility options, including human services transportation. This service helps keep riders informed about the options and services that are available to people with special transportation needs.
Nonprofits and transit agencies often provide travel training programs and coordinate the programs with mobility management initiatives.
New riders may need additional support to understand their options and training for how to use them. Travel training helps riders navigate eligibility requirements for specialized transportation such as paratransit or Medicaid rides. Travel trainers also provide riders with guided instruction in:
• Planning and scheduling trips with different providers.
• Identifying which routes will reach the destination.
• Boarding and paying for trips.
Travel training programs are often coordinated with mobility management initiatives and provided through nonprofits and transit agencies.
One-call, one-click To procure a ride, riders must sometimes navigate a lot of information, often scattered across multiple websites or transportation providers. One-call, One-click programs provide a central location for riders to learn about and explore their mobility options in each region or area, through options like a telephone call, website, or app. One-call, One Click programs vary by region, depending on the available mobility options and staff capacity for one-on-one personal assistance.
As technology advances, One-call, One-Click programs hold significant potential to further streamline the user-experience in human services transportation. New platforms and data standards may allow future riders to schedule, confirm and pay for rides in real time with one call or one click.
Human services transportation providers Across the state, public, private, tribal and nonprofit entities all contribute to the success of the human services transportation system.
Community transportation providers
Community transportation providers are nonprofit, public and private organizations that help to meet unique transportation needs of individual communities
P A G E 1 6
throughout Washington state. Community transportation providers’ services help people lead more independent and dignified lives.
Typically, transportation is just one of many services community transportation providers offer. Coordinating their transportation services requires partnerships between various organizations, including health care providers, senior services, affordable housing providers, veteran services, community colleges, workforce partners, government agencies and other social service agencies.
Many community transportation providers serve specific groups of people. For example, an assisted living facility that serves seniors and others with disabilities might use a van to take residents to medical appointments or community centers. Alternatively, a homeless shelter might focus on providing free trips to a food bank or transporting food to residents.
Other community transportation providers may focus on filling in the transportation gaps between other public transportation providers or serve residents at times of the day when transit agencies have limited service.
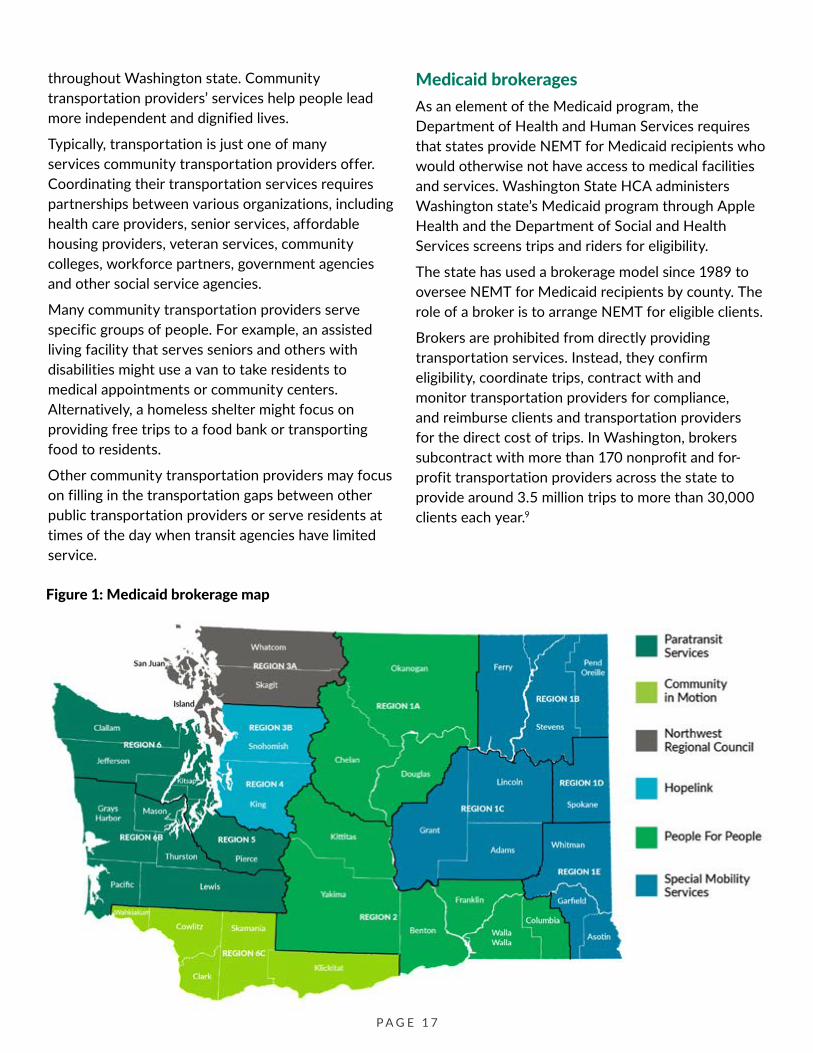
Figure 1: Medicaid brokerage map
Medicaid brokerages As an element of the Medicaid program, the Department of Health and Human Services requires that states provide NEMT for Medicaid recipients who would otherwise not have access to medical facilities and services. Washington State HCA administers Washington state’s Medicaid program through Apple Health and the Department of Social and Health Services screens trips and riders for eligibility.
The state has used a brokerage model since 1989 to oversee NEMT for Medicaid recipients by county. The role of a broker is to arrange NEMT for eligible clients.
Brokers are prohibited from directly providing transportation services. Instead, they confirm eligibility, coordinate trips, contract with and monitor transportation providers for compliance, and reimburse clients and transportation providers for the direct cost of trips. In Washington, brokers subcontract with more than 170 nonprofit and for-profit transportation providers across the state to provide around 3.5 million trips to more than 30,000 clients each year.9
P A G E 1 7
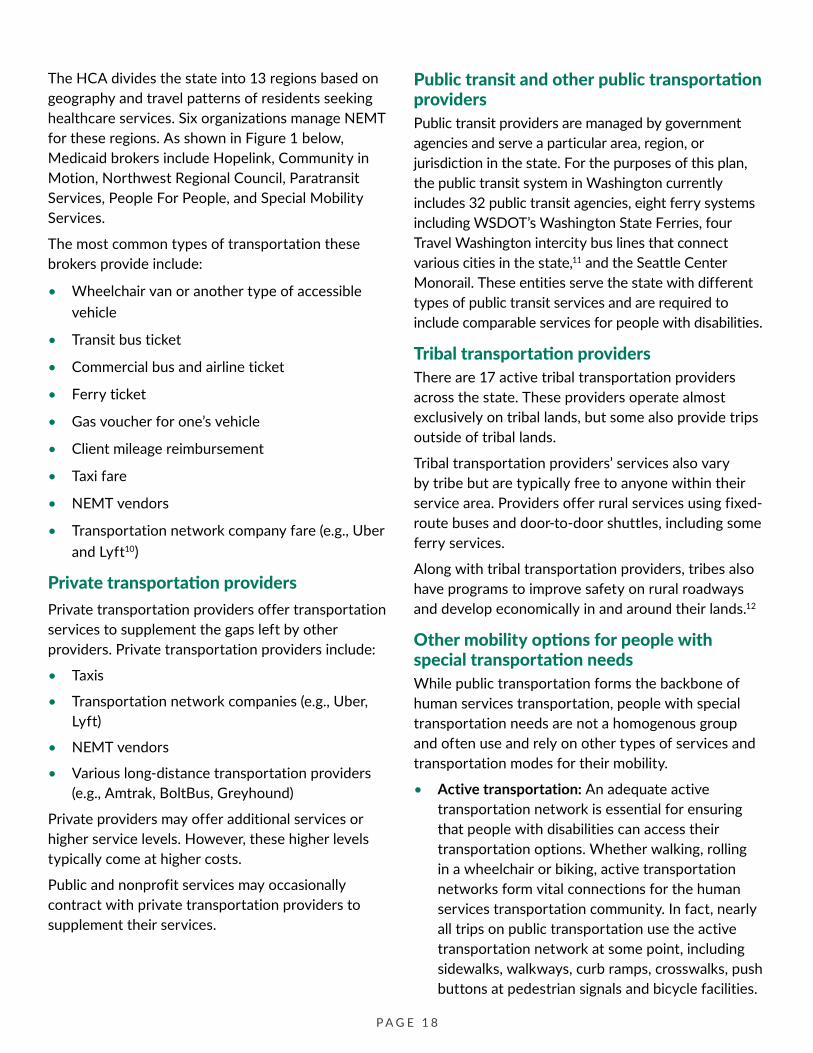
The HCA divides the state into 13 regions based on geography and travel patterns of residents seeking healthcare services. Six organizations manage NEMT for these regions. As shown in Figure 1 below, Medicaid brokers include Hopelink, Community in Motion, Northwest Regional Council, Paratransit Services, People For People, and Special Mobility Services.
The most common types of transportation these brokers provide include:
• Wheelchair van or another type of accessible vehicle
• Transit bus ticket
• Commercial bus and airline ticket
• Ferry ticket
• Gas voucher for one’s vehicle
• Client mileage reimbursement
• Taxi fare
• NEMT vendors
• Transportation network company fare (e.g., Uber and Lyft10)
Private transportation providers
Private transportation providers offer transportation services to supplement the gaps left by other providers. Private transportation providers include:
• Taxis
• Transportation network companies (e.g., Uber, Lyft)
• NEMT vendors
• Various long-distance transportation providers (e.g., Amtrak, BoltBus, Greyhound)
Private providers may offer additional services or higher service levels. However, these higher levels typically come at higher costs.
Public and nonprofit services may occasionally contract with private transportation providers to supplement their services.
Public transit and other public transportation providers Public transit providers are managed by government agencies and serve a particular area, region, or jurisdiction in the state. For the purposes of this plan, the public transit system in Washington currently includes 32 public transit agencies, eight ferry systems including WSDOT’s Washington State Ferries, four Travel Washington intercity bus lines that connect various cities in the state,11 and the Seattle Center Monorail. These entities serve the state with different types of public transit services and are required to include comparable services for people with disabilities.
Tribal transportation providers There are 17 active tribal transportation providers across the state. These providers operate almost exclusively on tribal lands, but some also provide trips outside of tribal lands.
Tribal transportation providers’ services also vary by tribe but are typically free to anyone within their service area. Providers offer rural services using fixed-route buses and door-to-door shuttles, including some ferry services.
Along with tribal transportation providers, tribes also have programs to improve safety on rural roadways and develop economically in and around their lands.12
Other mobility options for people with special transportation needs While public transportation forms the backbone of human services transportation, people with special transportation needs are not a homogenous group and often use and rely on other types of services and transportation modes for their mobility.
• Active transportation: An adequate active transportation network is essential for ensuring that people with disabilities can access their transportation options. Whether walking, rolling in a wheelchair or biking, active transportation networks form vital connections for the human services transportation community. In fact, nearly all trips on public transportation use the active transportation network at some point, including sidewalks, walkways, curb ramps, crosswalks, push buttons at pedestrian signals and bicycle facilities.
P A G E 1 8
• Volunteer driver programs: Transit agencies and community transportation providers sometimes oversee volunteer driver programs that supplement other forms of transit service. The scale and quality of service is directly connected to the number of volunteer drivers available on any given day. As a result, scheduling trips typically requires some amount of coordination and advanced planning.
One example of a volunteer program is the American Cancer Society’s Road to Recovery. Road to Recovery provides free rides to people who need to get to and from their cancer care medical appointments.13
Organizations typically reimburse volunteer drivers for mileage. Drivers can write off mileage on their federal income taxes if they fill out Schedule A.
• Informal transportation networks: In the absence of convenient service, many people with special transportation needs rely on friends and family members for rides. Informal transportation networks provide a familiar and simple alternative for people with special transportation needs, but it shifts the burden of logistics, planning and costs onto these caretakers.
People who are eligible for human services transportation Most human services transportation programs have strict eligibility requirements that include factors such as a person’s age, income, disability status, and military veteran status. These factors form eligible demographic groups:
• Seniors (age 65 and up): eligible for Medicare and discounted fares.
• Veterans: eligible for veteran benefits as a part of their federal military service.
• People with disabilities: eligible for paratransit, Apple Health (Medicaid) and discounted fares.
• People with low incomes: eligible for Medicaid and discounted fares.
• Students experiencing homelessness (21 and under): Eligible for McKinney Vento homeless assistance.14
• In some cases, an individual might be eligible for multiple programs. For example, a 70-year-old veteran with a disability would be eligible for veteran’s transportation, paratransit services, discounted fares and Medicare Advantage.
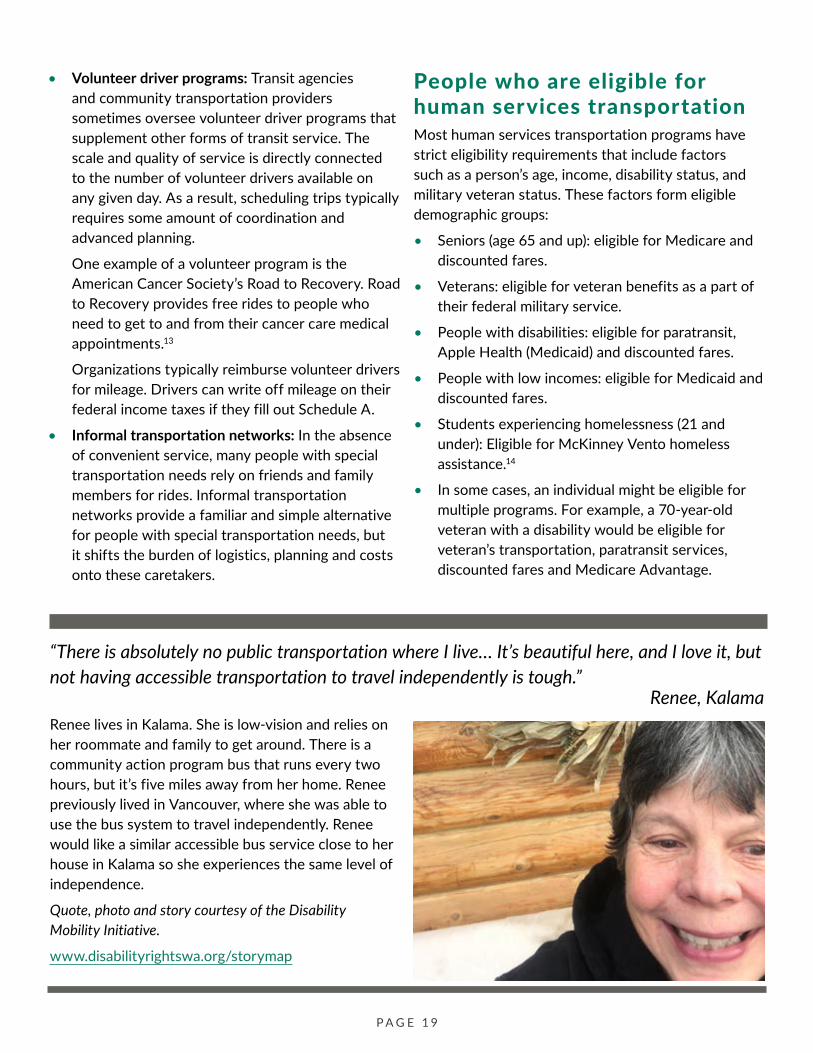
“There is absolutely no public transportation where I live… It’s beautiful here, and I love it, but not having accessible transportation to travel independently is tough.”
Renee, Kalama Renee lives in Kalama. She is low-vision and relies on her roommate and family to get around. There is a community action program bus that runs every two hours, but it’s five miles away from her home. Renee previously lived in Vancouver, where she was able to use the bus system to travel independently. Renee would like a similar accessible bus service close to her house in Kalama so she experiences the same level of independence.
Quote, photo and story courtesy of the Disability Mobility Initiative.
www.disabilityrightswa.org/storymap
P A G E 1 9
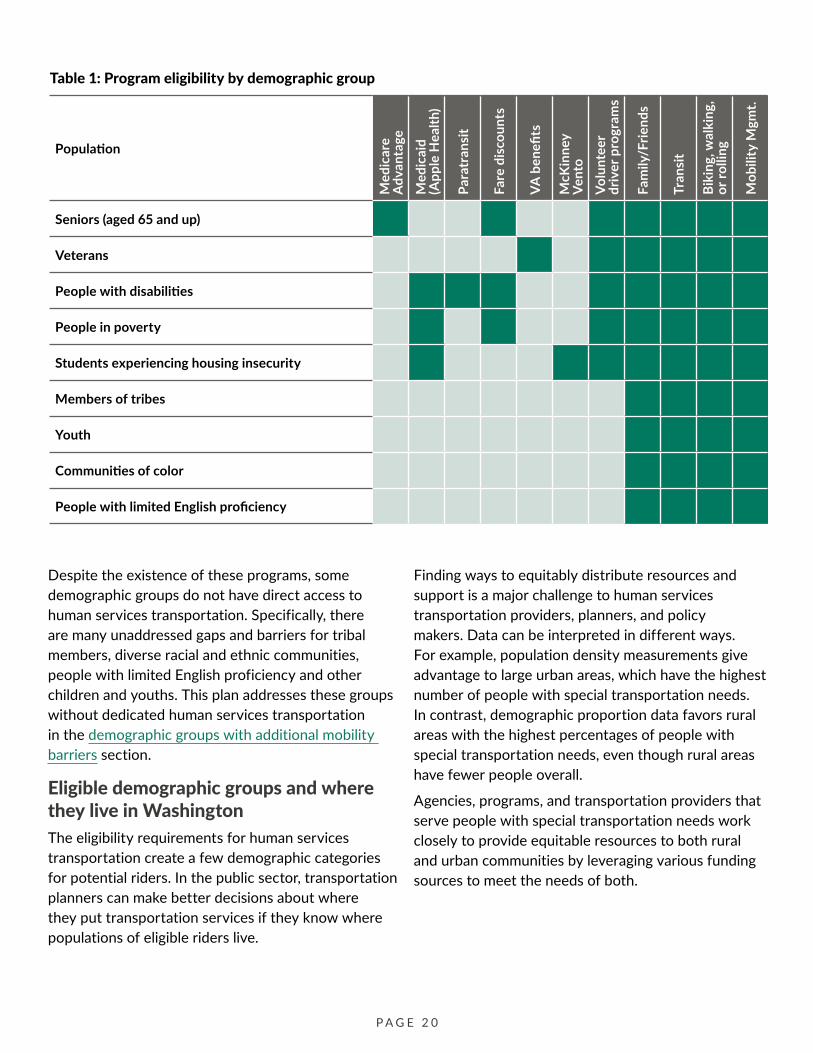
Table 1: Program eligibility by demographic group
Population
Med
icar
eA
dvan
tage
Med
icai
d(A
pple
Hea
lth)
Para
tran
sit
Fare
dis
coun
ts
VA b
enefi
ts
McK
inne
yVe
nto
Volu
ntee
rdr
iver
pro
gram
s
Fam
ily/F
riend
s
Tran
sit
Biki
ng, w
alki
ng,
or ro
lling
Mob
ility
Mgm
t.
Seniors (aged 65 and up)
Veterans
People with disabilities
People in poverty
Students experiencing housing insecurity
Members of tribes
Youth
Communities of color
People with limited English proficiency
Despite the existence of these programs, some demographic groups do not have direct access to human services transportation. Specifically, there are many unaddressed gaps and barriers for tribal members, diverse racial and ethnic communities, people with limited English proficiency and other children and youths. This plan addresses these groups without dedicated human services transportation in the demographic groups with additional mobility barriers section.
Eligible demographic groups and where they live in Washington The eligibility requirements for human services transportation create a few demographic categories for potential riders. In the public sector, transportation planners can make better decisions about where they put transportation services if they know where populations of eligible riders live.
Finding ways to equitably distribute resources and support is a major challenge to human services transportation providers, planners, and policy makers. Data can be interpreted in different ways. For example, population density measurements give advantage to large urban areas, which have the highest number of people with special transportation needs. In contrast, demographic proportion data favors rural areas with the highest percentages of people with special transportation needs, even though rural areas have fewer people overall.
Agencies, programs, and transportation providers that serve people with special transportation needs work closely to provide equitable resources to both rural and urban communities by leveraging various funding sources to meet the needs of both.
P A G E 2 0

SENIORS (AGED 65 AND UP) The term “seniors” refers to people ages 65 and up. Many statewide human services programs use this age as an eligibility requirement for transportation benefits, including Medicare and reduced fare programs.
Approximately one million (15 percent) Washington residents are seniors. Counties on the Olympic peninsula have some of the highest proportions of seniors. As such, Jefferson, Pacific and Clallam counties are in the top-five counties in the state for proportion of seniors, with 34, 29 and 28 percent of their population ages 65 and up, respectively.
The table and map below show the number and percentage of seniors in each county of the state. More information on demographic trends for the aging population are included in Chapter 5: Emerging Trends.
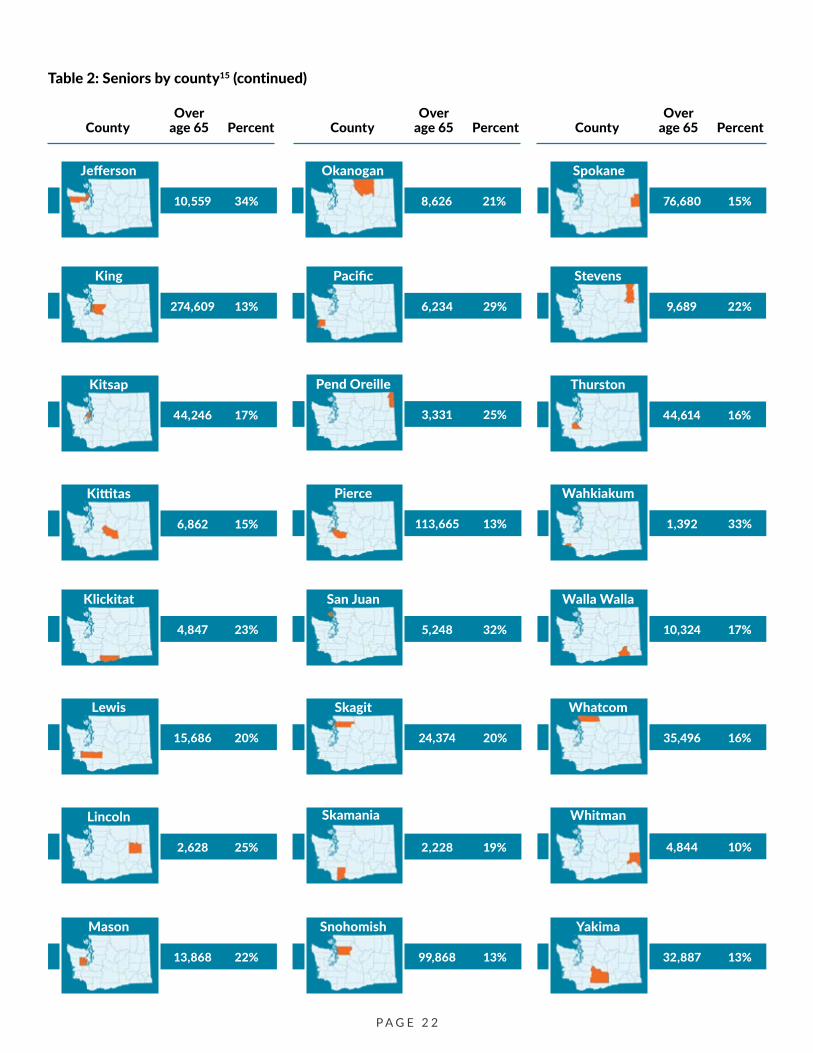
Table 2: Seniors by county15
Over Over Over County age 65 Percent County age 65 Percent County age 65 Percent
Adams
2,103 11%
Clark
67,720 15%
Asotin
4,950 22%
Columbia
1,093 27%
Benton
27,443 14%
Cowlitz
19,408 18%
Chelan
13,790 18%
Douglas
6,848 17%
Clallam
20,891 28%
Ferry
1,833 24%
Franklin
7,860 9%
Garfield
484 22%
Grant
12,526 13%
Grays Harbor
14,607 20%
Island
19,138 23%
P A G E 2 1
Cowlitz
Table 2: Seniors by county15 (continued)
Over Over Over County age 65 Percent County age 65 Percent County age 65 Percent
Jefferson
10,559 34%
Okanogan
8,626 21%
King
274,609 13%
Pacific
6,234 29%
Kitsap
44,246 17%
Pend Oreille
3,331 25%
Kittitas
6,862 15%
Pierce
113,665 13%
Klickitat
4,847 23%
San Juan
5,248 32%
Lewis
15,686 20%
Skagit
24,374 20%
Lincoln
2,628 25%
Wahkiakum
1,392 33%
Walla Walla
10,324 17%
Mason
13,868 22%
Whatcom
35,496 16%
Stevens
9,689 22%
Thurston
44,614 16%
Snohomish
99,868 13%
Yakima
32,887 13%
2,228 19%
Skamania
4,844 10%
Whitman
76,680 15%
Spokane
P A G E 2 2
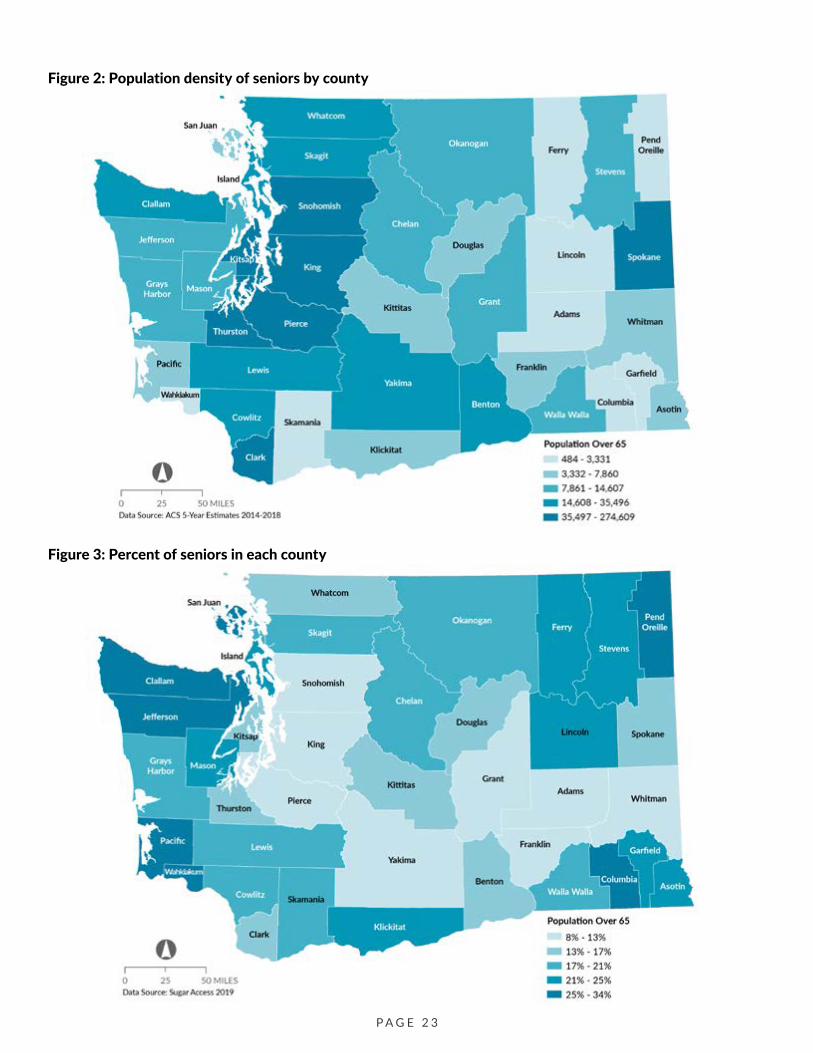
Figure 2: Population density of seniors by county
Figure 3: Percent of seniors in each county
P A G E 2 3

VETERANS
Table 3: Veterans by county17
County Veterans Percent
Veterans who served in active duty in a branch of the military (i.e., Air Force, Army, Coast Guard, Marine Corps, Navy, Space Force) are eligible for benefits through Veterans Affairs. These benefits reimburse a veteran’s transportation costs to and from a Veterans Affairs facility. Many veterans are also eligible for disability or senior benefits. They may also be eligible for housing, food, and medical care through programs like the Washington Veterans Housing Program and the Washington Financial Assistance Program. Nationwide, the veteran’s population is declining. Washington state’s veteran population has changed drastically, declining by nearly 18 percent since 2000. Estimates from the U.S. Department of Veterans Affairs suggest that by 2048 the total veteran population will be 13.6 million, down from 19.5 million in 2020.16
With seven military bases in Washington, nearly 10 percent of state’s residents are veterans, which is higher than the national average of 7.5 percent. King County alone is home to a fifth of the state’s veteran population. The table and maps below show the number and percentage of veterans in each county of the state.
County Veterans Percent County Veterans Percent
513 4%
Adams
33,035 9%
Clark
2,236 13%
Asotin
462 14%
Columbia
12,922 9%
Benton
9,484 12%
Cowlitz
4,821 8%
Chelan
2,642 9%
Douglas
9,178 15%
Clallam
792 13%
Ferry
3,603 6%
Franklin
220 13%
Garfield
5,496 8%
Grant
7,461 13%
Grays Harbor
12,382 20%
Island
P A G E 2 4

Cowlitz
Table 3: Veterans by county17 (continued)
County Veterans Percent County Veterans Percent County Veterans Percent
4,208 16%
Jefferson
3,501 11%
Okanogan
104,243 6%
King
2,372 13%
Pacific
32,777 17%
Kitsap
1,604 15%
Pend Oreille
3,458 9%
Kittitas
86,159 13%
Pierce
2,343 14%
Klickitat
1,537 11%
San Juan
7,726 13%
Lewis
10,804 11%
Skagit
1,153 14%
Lincoln
487 14%
Wahkiakum
7,136 14%
Mason
4,778 10%
Walla Walla
13,791 8%
Whatcom
4,715 14%
Stevens
28,992 14%
Thurston
52,413 9%
Snohomish
11,527 7%
Yakima
1,238 13%
Skamania
2,153 5%
Whitman
43,351 11%
Spokane
P A G E 2 5
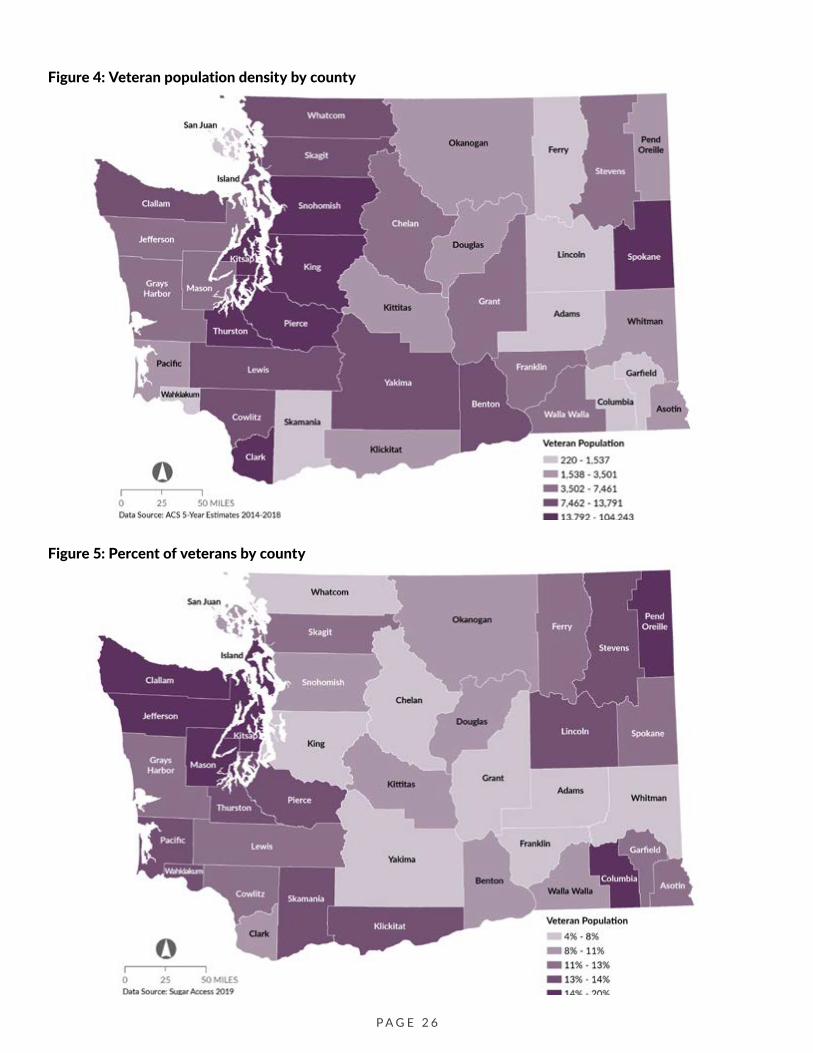
Figure 4: Veteran population density by county
Figure 5: Percent of veterans by county
P A G E 2 6
PEOPLE WITH DISABILITIES
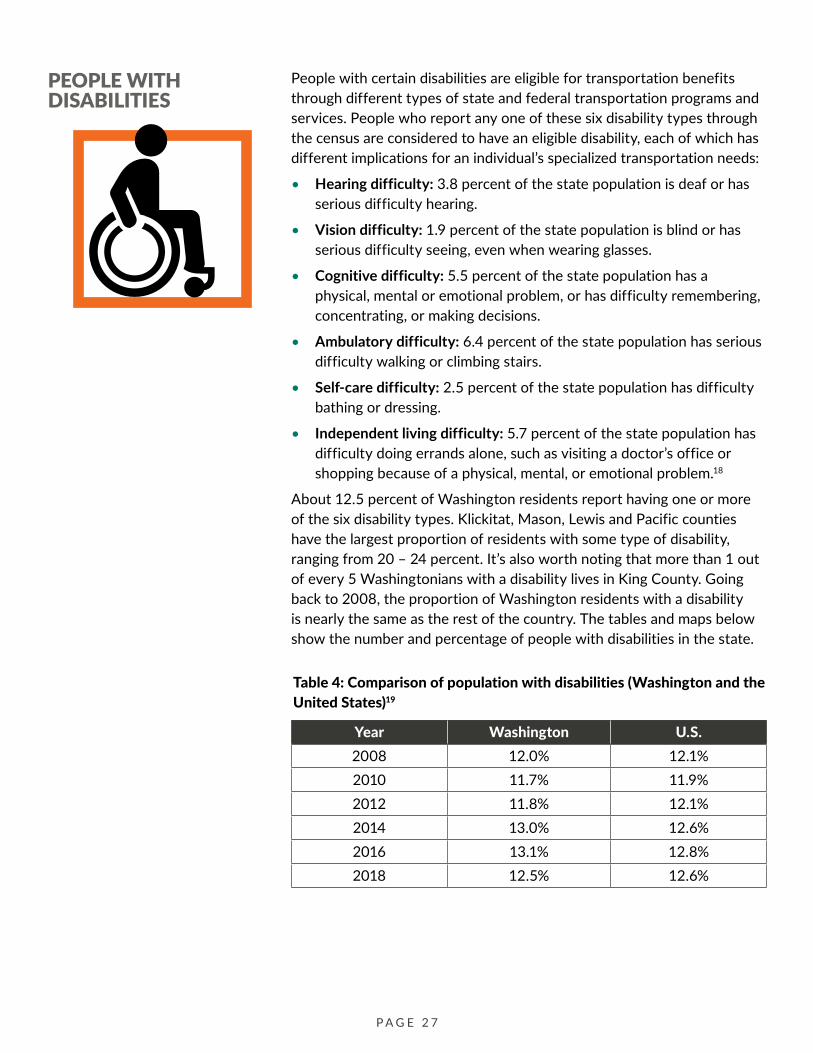
People with certain disabilities are eligible for transportation benefits through different types of state and federal transportation programs and services. People who report any one of these six disability types through the census are considered to have an eligible disability, each of which has different implications for an individual’s specialized transportation needs:
• Hearing difficulty: 3.8 percent of the state population is deaf or has serious difficulty hearing.
• Vision difficulty: 1.9 percent of the state population is blind or has serious difficulty seeing, even when wearing glasses.
• Cognitive difficulty: 5.5 percent of the state population has a physical, mental or emotional problem, or has difficulty remembering, concentrating, or making decisions.
• Ambulatory difficulty: 6.4 percent of the state population has serious difficulty walking or climbing stairs.
• Self-care difficulty: 2.5 percent of the state population has difficulty bathing or dressing.
• Independent living difficulty: 5.7 percent of the state population has difficulty doing errands alone, such as visiting a doctor’s office or shopping because of a physical, mental, or emotional problem.18
About 12.5 percent of Washington residents report having one or more of the six disability types. Klickitat, Mason, Lewis and Pacific counties have the largest proportion of residents with some type of disability, ranging from 20 – 24 percent. It’s also worth noting that more than 1 out of every 5 Washingtonians with a disability lives in King County. Going back to 2008, the proportion of Washington residents with a disability is nearly the same as the rest of the country. The tables and maps below show the number and percentage of people with disabilities in the state.
Table 4: Comparison of population with disabilities (Washington and the United States)19
Year Washington U.S. 2008 12.0% 12.1% 2010 11.7% 11.9% 2012 11.8% 12.1% 2014 13.0% 12.6% 2016 13.1% 12.8% 2018 12.5% 12.6%
P A G E 2 7

Table 5: Disability status by county20 (continued)
People with People with People with County Disabilities Percent County Disabilities Percent County Disabilities Percent
Jefferson
5,168 17%
Okanogan
7,293 18%
King
205,142 10%
Kitsap
37,896 15%
Kittitas
5,969 13%
Klickitat
3,976 19%
Lewis
15,607 21%
Lincoln
2,009 19%
Mason
12,690 21%
Adams
2,171 11%
Clark
56,633 12%
Asotin
4,271 19%
Columbia
927 23%
Benton
27,148 14%
Cowlitz
21,713 21%
Chelan
10,509 14%
Douglas
7,905 19%
Clallam
14,597 20%
Ferry
1,922 26%
Franklin
9,894 11%
Garfield
407 18%
Grant
11,475 12%
Grays Harbor
13.648 20%
Island
11,718 15%
P A G E 2 8
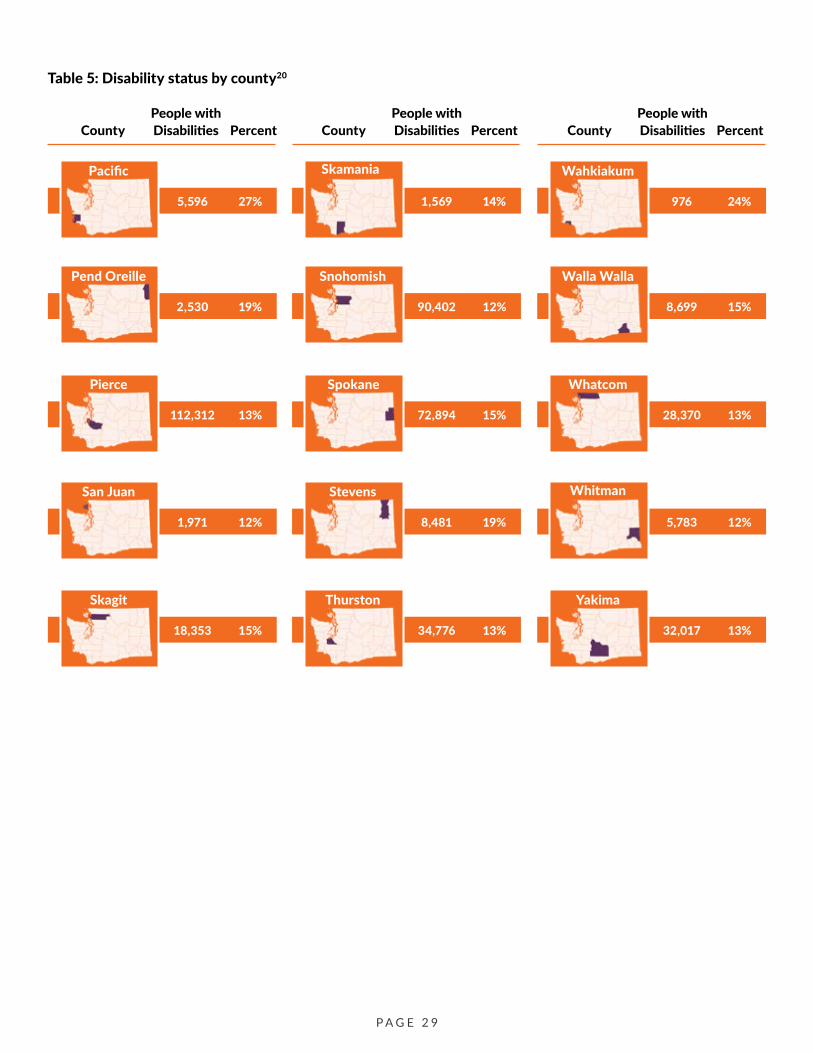
Table 5: Disability status by county20
People with People with People with County Disabilities Percent County Disabilities Percent County Disabilities Percent
Pacific
5,596 27%
Pend Oreille
2,530 19%
Pierce
112,312 13%
San Juan
1,971 12%
Skagit
18,353 15%
Snohomish
90,402 12%
1,569 14%
Skamania
Stevens
8,481 19%
Thurston
34,776 13%
72,894 15%
Spokane
Wahkiakum
976 24%
Walla Walla
8,699 15%
Whatcom
28,370 13%
Yakima
32,017 13%
5,783 12%
Whitman
P A G E 2 9
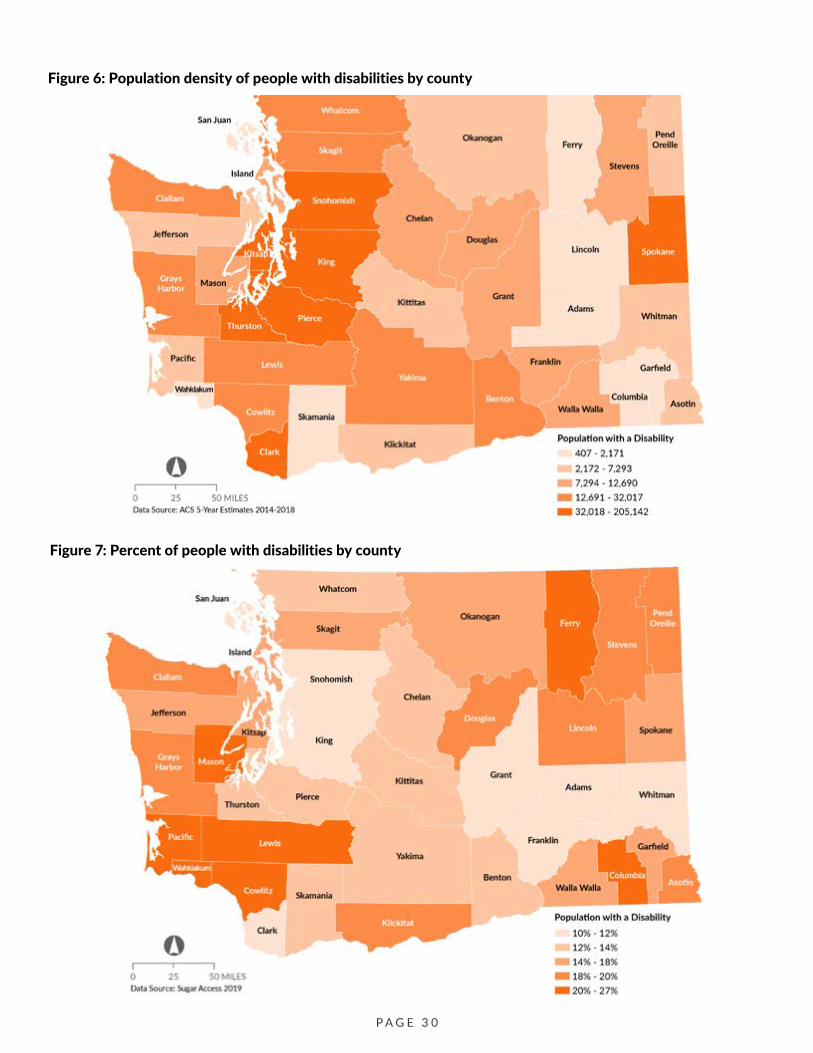
Figure 6: Population density of people with disabilities by county
Figure 7: Percent of people with disabilities by county
P A G E 3 0

PEOPLE WITH LOW INCOMES21
People with low incomes are eligible for statewide human services transportation programs such as Medicaid and discounted fares. Eligibility often depends on an individual’s or family’s income compared to benchmarks set by the federal government. The Federal Poverty Level (FPL) is the most common benchmark to determine who is eligible for human services subsidies, programs, and transportation benefits.
The Department of Health and Human Services sets the poverty threshold for the country and uses a different percentage of that threshold to adjust for the cost of living in each state. In 2021, they set the FPL at an annual income of $12,880 for individuals. While Medicaid eligibility is currently 138 percent of the FPL in Washington, $17,784 annually for individuals, this is still far below the necessary income to meet most individual or families’ basic needs. Because of the high cost of living in Washington, this plan considers anyone making less than 200 percent of the FPL as a person with a low income. Many discounted fare programs and other income-based programs in Washington use 200 percent of the FPL as an eligibility requirement.
In 2021, 200 percent of the FPL was an annual income of $25,760 for individuals. More than a quarter of Washington residents fall within this limit. More details on the FPL and other measures of poverty are in Appendix 1.22
American Community Survey five-year estimates (2014-2018) show that the Puget Sound region contains some of the highest numbers of people living under 200 percent of the FPL. Roughly 442,221 people in King County and 222,747 people in Pierce County live under 200 percent of the FPL. Although rural counties like Adams, Yakima, Okanogan, Whitman and Pacific counties have significantly lower population totals, they have the highest proportions of people living under 200 percent of the FPL. As such, nearly 51 percent of Adams County residents live under 200 percent of the FPL. The table and maps below show the number and proportion of people living under 200 percent of the poverty line.
P A G E 3 1

Table 6: People living in poverty in Washington by county23
Populationunder 200
Populationunder 200
Populationunder 200
County percent of
the FPL Percent County percent of
the FPL Percent County percent of
the FPL Percent
Adams
9,735 51%
Douglas
14,566 35%
Asotin
7,824 36%
Ferry
3,280 44%
Benton
58,036 30%
Franklin
33,431 38%
Chelan
24,440 33%
Garfield
679 31%
Clallam
25,740 35%
Grant
39,540 42%
Clark
114,578 25%
Grays Harbor
27,069 39%
Columbia
1,282 32%
Klickitat
8,091 38%
Cowlitz
37,095 36%
Lewis
27,141 36%
Lincoln
3,097 30%
Kitsap
57,038 23%
Kittitas
14,405 34%
Jefferson
9,307 31%
Okanogan
19,007 46%
18,191 24%
Island
21,488 35%
Mason
442.211 21%
King
P A G E 3 2
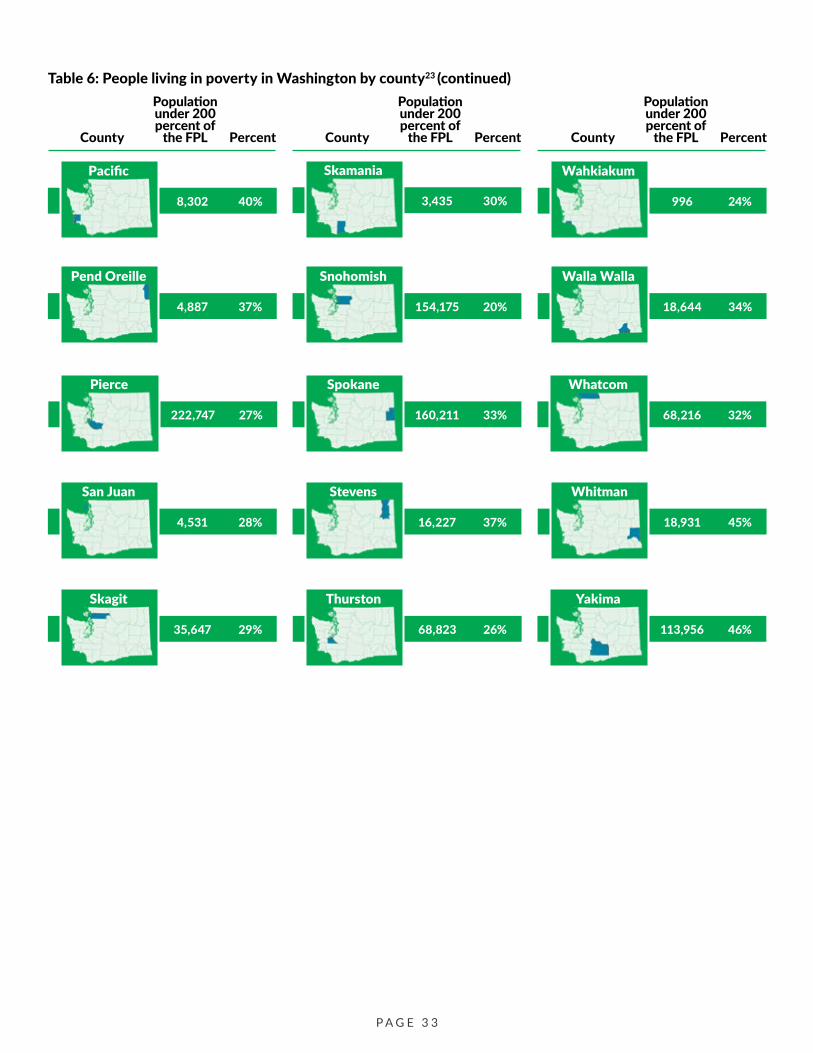
Table 6: People living in poverty in Washington by county23 (continued)
Populationunder 200
Populationunder 200
Populationunder 200
County percent of
the FPL Percent County percent of
the FPL Percent County percent of
the FPL Percent
Pacific
8,302 40%
Skamania
3,435 30%
Pend Oreille
4,887 37%
Snohomish
154,175 20%
Pierce
222,747 27%
Spokane
160,211 33%
San Juan
4,531 28%
Stevens
16,227 37%
Skagit
35,647 29%
Thurston
68,823 26%
Wahkiakum
996 24%
Walla Walla
18,644 34%
Whatcom
68,216 32%
Whitman
18,931 45%
Yakima
113,956 46%
P A G E 3 3

Figure 8: Population density of people living below 200% of the poverty line
Figure 9: Percent of people living below 200% of the poverty line
P A G E 3 4

Transportation cost burden
The following subsections highlight the relationship between income, transportation costs, housing insecurity, and employment. More than one third (36 percent) of all American households agree or strongly agree that transportation costs are a financial burden (see Figure 10). The ratio is even higher in rural
Figure 10: Is travel a financial burden?
Strongly disagree Not ascertained 40.0% 36.5
areas, with nearly half (49 percent) of all households indicating that transportation costs are a financial burden (see Figure 11). 1 out of 4 frequent public transportation riders agree or strongly agree that public transportation reduces their financial burden (see Figure 12).24
Neutral Strongly agree Disagree Agree 37.8 37.8
Wei
ghte
d Pe
rcen
tage
of
Hou
seho
ld 31.4 29.430.0% 26.4
Rural Urban Cluster Urban
0.7 5.5
14.2 12.4
1.5 6.5
21.0
12.3
20.0% 12.3
10.0% 5.7 1.8
0.0%
Area Classification
Figure 11: Is travel a financial burden? (by geographic area).
40.0%
Wei
ghte
d Pe
rcen
tage
of
Hou
seho
ld
Not ascertained Strongly disagree Disagree Neutral Agree Strongly agree
30.0%
20.0%
10.0%
0.0%
Travel Mode
Figure 12: Transportation mode and financial burden.
Neutral Strongly agree Disagree Agree Strongly disagree Not ascertained 33.335.0% 32.331.2
29.0
Bike Walk Public Transit
2.2
22.8 21.4
15.4
6.0 2.5
21.9
7.9
1.6Wei
ghte
d Pe
rcen
tage
of
Hou
seho
ld 30.0%
25.0% 20.0%
25.2 20.5
14.415.0% 10.0% 6.5
4.15.0% 0.0%
Travel Mode
P A G E 3 5
6.8
Poverty and homelessness Many people living in poverty in Washington also face housing insecurity or homelessness. Homelessness further constrains an individual’s ability to pay for transportation and makes it harder to take advantage of human services transportation programs.
As of 2019, an estimated 21,577 people were experiencing homelessness in Washington. A bit under half of this population was unsheltered.25 At that time, Washington contained the fifth highest population of people experiencing homelessness in the country after California, Texas, New York and Florida. Table 7 contains additional data about homelessness in Washington in 2019.
Table 7: 2019 demographic breakdown of homelessness in Washington26
People experiencing homelessness
Number of people in Washington
Family households 2,116
Veterans 1,607
Unaccompanied young adults (aged 18-24) 1,777
Individuals experiencing chronic homelessness 6,756
People experiencing homelessness often rely on public transit and human services transportation for access to other services like food banks, medical care, job opportunities, and education. Most individuals experiencing homelessness are eligible for transportation programs designed to reduce poverty, such as Medicaid.
Some public transit agencies also offer bus ticket vouchers that fully cover the costs of transportation to ensure that riders can afford food or medical care, such as King County Metro’s Human Services Bus Ticket Program.27 However, transit agencies must work closely with human services providers to distribute bus ticket vouchers to riders without a permanent address.
While human services transportation is an effective tool to lifting people out of poverty, it is just one of many solutions needed to address the underlying causes of homelessness.
Students experiencing housing insecurity Public school data from the state’s 2018-2019 school year shows that an estimated 40,186 public school students experienced homelessness or some form of housing insecurity during the year. This figure includes students living in shelters, hotels and motels, trailer parks, campgrounds, or doubled up in the same room.28,29
Washington state receives annual funding from the U.S. Department of Education and the State Legislature to provide homeless students transportation to and from education facilities through the McKinney Vento Homeless Assistance Act. The act defines these children as “individuals who lack a fixed, regular, and adequate nighttime residence” and provides examples of children who would fall under this definition:30
• Children and youth sharing housing due to loss of housing, economic hardship, or a similar reason.
• Children and youth living in motels, hotels, trailer parks, or campgrounds due to lack of alternative accommodations.
• Children and youth living in emergency or transitional shelters.
• Children and youth abandoned in hospitals. • Children and youth whose primary nighttime
residence is not ordinarily used as a regular sleeping accommodation (e.g., park benches, etc.).
• Children and youth living in cars, parks, public spaces, abandoned buildings, substandard housing, bus, or train stations.
• Migratory children and youth living in any of the above situations.
The McKinney Vento Homeless Assistance Act allows local education agencies to determine the most appropriate mode of transportation.31 The State Office of Superintendent of Public Instruction distributes funding from the act to local education agencies through a competitive grant process. The state also supplements this funding with a competitive State Homeless Student Stability grant to Washington school districts.32 Additionally, the State Office of Superintendent of Public Instruction appoints staff to ensure that children and youth can attend and fully participate in school, regardless of their housing situation (more information in the Youth section).
P A G E 3 6

This form of human services transportation helps students who are experiencing housing insecurity to get to and from school. However, for other types of trips, students require additional support services.
Suburbanization of poverty
As housing prices rise in urban centers across the state, many people are leaving for more affordable housing in the suburbs and rural areas. This suburbanization of poverty has large ramifications in human services transportation. Suburban areas contain fewer services over a larger area, meaning trips take longer, are less direct, and are more expensive for providers to operate.
The county-level data shows that rural counties have a larger proportion of people with special transportation needs. Without extensive investments in affordable housing in urban centers, we should assume that people will continue to look for low-cost housing further away from human services. Similarly, if this trend continues, we can assume that transportation providers’ costs will also rise across the state.
Unemployment and underemployment Access to jobs is critical in human services transportation, particularly for unemployed and underemployed individuals. The unemployed population includes all jobless persons who are available to take a job and have actively sought work in the past four weeks. In 2017, the average unemployment rate of Washington is 6 percent, slightly lower than US average. However, the unemployment rates vary greatly across counties from 3.9 percent to 10.1 percent.
Underemployment occurs when a person is in the labor force but is not obtaining sufficient hours or wages to make a living. This includes people who work less than full-time but would be working full-time if possible, and people who are in jobs not commensurate with their training or financial needs. It is a measure of how well the labor force is being used. The underemployment rate in Washington State was highest after the great recession, which was 18.4 percent in 2011. The rate decreased each year to 9.2 percent in 2018, however it is still nearly a percentage point higher in Washington than national average, which is 8.5 percent.33
Many of these trends are more challenging to track from 2020 - 2021 due to the coronavirus pandemic, which spurred several policy changes around employment including social distance requirements, designations of essential services, and the expansion of federal unemployment benefits.
Mobility needs index for people eligible for human services transportation People eligible for human services transportation include people aged 65 and over, veterans, people with a disability, and people with low incomes. Figure 10 shows where these people live by county.34,35 The highest density counties in red correlate with major urban areas in the state. These counties include Island, Snohomish, King, Kitsap, Thurston, Pierce, Clark, and Spokane counties.
Other groups with mobility barriers While many people with mobility barriers are eligible for paratransit and human services programs, many are not. Examples include: • Members of tribes36
• Ethnically and racially diverse communities • People who speak English as a second language
• Youth
Despite the additional obstacles they may face, these groups are only eligible for human services transportation if they fall within an eligible category (e.g., seniors, veterans, people with a disability, and people with low incomes). The following section describes each of these groups and their unique transportation needs.
Members of tribes There are 29 federally recognized tribes in Washington state. Tribal lands comprise approximately 8 percent of the state’s land area.37 According to the Washington State Office of Financial Management, roughly 1.8 percent (138,462 people) of the state’s total population identifies as American Indian or Alaska Native.38
There are 17 tribes in Washington that oversee tribal transportation services on their land. However, access to essential services outside of the tribal jurisdiction,
P A G E 3 7

NOOKSACK LUMMI
UPPER SKAGIT SWINOMISH LOWER ELWHA
KLALLAM
HOH
QUINAULT
SKOKOMISH
SQUAXIN
PORT GAMBLE S’KLALLAM JAMESTOWN S’KLALLAM
TULALIP STILLAGUAMISH
SAUK-SUIATTLE
MUCKLESHOOT
SUQUAMISH SNOQUALMIE
PUYALLUP
NISQUALLY CHEHALIS
SHOALWATER BAY
COWLITZ
YAKAMA
COLVILLE
SPOKANE
KALISPEL
W A S H I N G T O N
SAMISH
Figure 13: Mobility needs index for seniors, veterans, people with disabilities, and people living in poverty
Figure 14: Federally recognized tribes in Washington State
MAKAH
QUILEUTE
P A G E 3 8
on nontribal lands, may be limited. This includes trips to specialized medical services like chemotherapy and kidney dialysis, higher education, and jobs. These services can be far away from tribal residences. As a result, some tribal members need to make difficult transfers between transportation service providers. Others must walk or roll in a wheelchair along the shoulders of rural roads where sidewalks do not exist.
It is also important to note that tribal members live throughout Washington, not only on tribal lands. Tribal membership doesn’t necessarily mean that an individual can take advantage of the tribal transportation services.
Ethnically and racially diverse communities In the past, public works agencies used policies and practices such as redlining, that created racially exclusive neighborhoods typically reserved only for white residents, among other discriminatory practices.
Even today these policies and practices have a lingering effect on residential segregation and disproportionately affect certain racial and ethnic groups, including but not limited to the Black, Indigenous and Native American, Hispanic, Latino, Asian, and Pacific Islander communities of Washington state. These communities were often relegated to neighborhoods and areas with limited access to human services transportation. In some cases, the
state was directly responsible for installing highways that cut through these diverse neighborhoods and communities, while offering few or no opportunities for community input.
Present day factors that affect access to human services transportation resources include language barriers (see People who speak English as a second language) and large-scale displacement from rising housing costs.
While some nonprofits may focus on providing transportation to specific ethnic communities, public services are not allowed to provide services for any specific racial or ethnic group. Leadership and staff at many agencies are dedicated to working on policies and programs to promote equity, serving historically underserved demographic groups, and removing language and cultural barriers to public transportation services. The state still has a long way to go to address the structural inequities in transportation. The recently created state Equity Office will help with just that, by “promoting access to equitable opportunities and resources that reduce disparities, including racial and ethnic disparities, and improve outcomes statewide across all sectors of government.”39,40
P A G E 3 9
PEOPLE WHO SPEAK ENGLISH AS A SECOND LANGUAGE
Language barriers make it hard for transportation providers to make potential users aware of their programs and services. Similarly, language barriers also make it harder for Washingtonians with limited English proficiency to understand what mobility options are available to them. Without comprehensive translation services among different service providers, riders with limited English proficiency struggle to use the human services transportation system.
Additionally, much of Washington’s agricultural industries rely on migrant workers. These workers need seasonal transportation access to get to their job sites and other social and community services. As such, their transportation access is vital to ensure that agricultural products can reach consumers around the state. However, without some translation or in-language services, many of these individuals would not be able to take advantage of the existing programs.
The Census Bureau defines a “limited English-speaking household” as one in which no household member over the age of 14 can do either of the following:
• Speak only English
• Speak a non-English language and speak English “very well”
Census data shows that approximately 7.6 percent of all individuals in Washington have limited English proficiency. This census data also helps identify where limited English-speaking households live across the state, but the percentages vary by county:
• Adams County (29 percent) and Franklin County (24 percent) contain the largest proportion of limited English-speaking households in the state.
• King County (11 percent) may have a lower proportion but is home to more than 200,000 people with limited English proficiency, nearly 41 percent of all limited English-speaking households in the state.
Transportation providers work to ensure that people with limited English proficiency can access the human services they need. Yet without sufficient translation materials and support for limited English proficient populations, the already complex field of transportation and human services quickly becomes more challenging to navigate.
P A G E 4 0
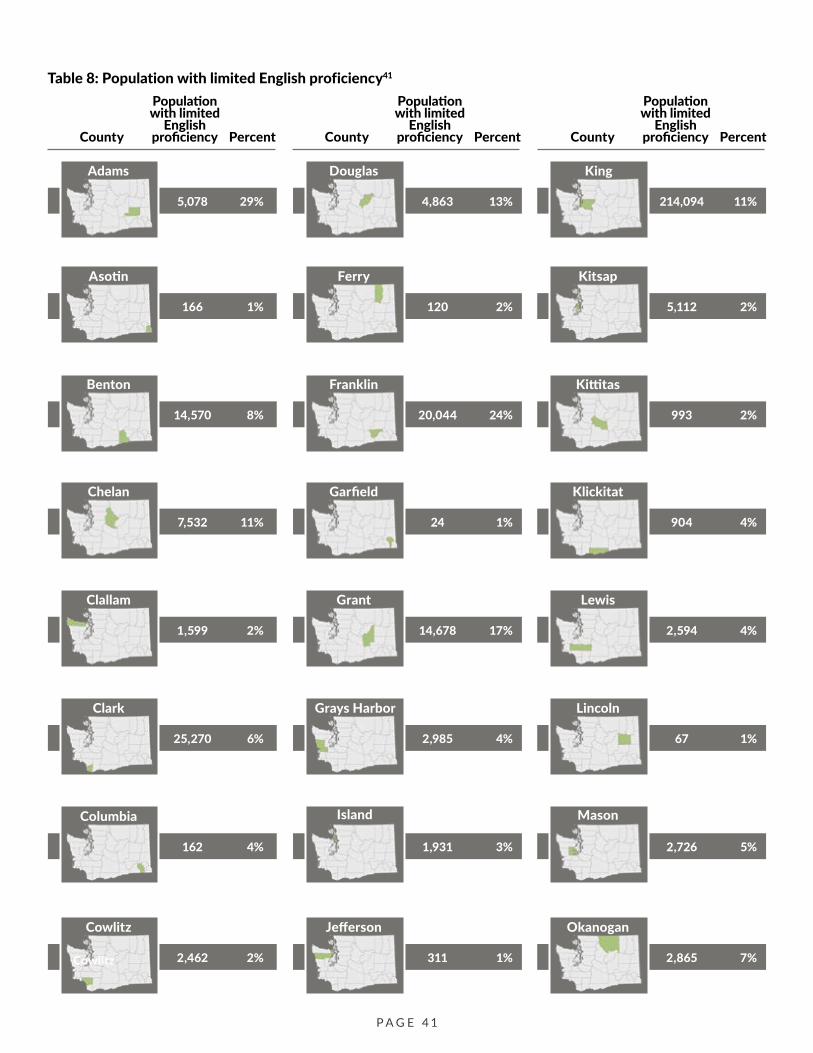
Table 8: Population with limited English proficiency41
County
Populationwith limited
Englishproficiency Percent County
Populationwith limited
Englishproficiency Percent County
Populationwith limited
Englishproficiency Percent
Adams
5,078 29%
Douglas
4,863 13%
Asotin
166 1%
Ferry
120 2%
Benton
14,570 8%
Franklin
20,044 24%
Chelan
7,532 11%
Garfield
24 1%
Clallam
1,599 2%
Grant
14,678 17%
Clark
25,270 6%
Grays Harbor
2,985 4%
Columbia
162 4%
Klickitat
904 4%
Cowlitz
2,462 2%
Lewis
2,594 4%
Cowlitz
Lincoln
67 1%
Kitsap
5,112 2%
Kittitas
993 2%
Jefferson
311 1%
Okanogan
2,865 7%
1,931 3%
Island
2,726 5%
Mason
214,094 11%
King
P A G E 4 1

Table 8: Population with limited English proficiency41 (continued) Populationwith limited
Populationwith limited
Populationwith limited
County English
proficiency Percent County English
proficiency Percent County English
proficiency Percent
Pacific
1,038 5%
Skamania
154 1%
Pend Oreille
67 1%
Snohomish
57,329 8%
Pierce
45,160 6%
Spokane
11.975 3%
San Juan
363 2%
Stevens
326 1%
Skagit
8,537 7%
Thurston
10,388 4%
Wahkiakum
40 1%
Walla Walla
4,702 8%
Whatcom
7,772 4%
Whitman
2,059 4%
Yakima
37,024 16%
P A G E 4 2

Youth In Washington, 28 percent of households include children under 18 years old, which is the same as the national average (28 percent).42 Youth and families with young children face additional mobility challenges. On public transit, the costs multiply quickly for families with children.
For example, a $2.50 bus fare would multiply into a $20 round trip for a family of four. Many working parents must also pay for childcare or adjust their work schedules to provide care of their children. Either situation provides additional financial and transportation challenges.
Although students experiencing homelessness may be eligible for school bus transportation to and from school through the McKinney Vento Act, traditional school bus systems fall outside of the scope of this plan because traditional school bus systems are not eligible for state human services transportation funding.43
Key destinations for people with mobility barriers Despite their special transportation needs, people who rely on human services transportation are trying to get to the same destinations as everyone else:
Healthcare Healthcare facilities play a critical role in keeping people healthy and providing life-sustaining care to people with chronic conditions. Access to healthcare is essential for people with special transportation needs. These facilities include:
• Doctors’ offices
• Hospitals
• Pharmacies
• Cancer treatment centers
• Dialysis centers
Food/nutrition
Access to healthy food is critical for families and individuals with special transportation needs. This includes access to:
• Grocery stores
• Markets
• Food banks
Retail/shopping Access to retail and shopping destinations helps improve the quality of life for people with limited mobility. Examples include:
• Shopping malls
• Small businesses
• Other retailers across the state
Recreation/social Access to recreation and social events also helps improve the quality of life and helps reduce the isolation for people with special transportation needs. Examples include:
• Community centers
• Senior centers
• Places of worship
• Parks
Banking Money and financial resources are another critical destination for people with special transportation needs as they continue to support themselves and their families. This includes:
• Banks and credit unions
• ATMs
• Lenders and other financial institutions
Jobs/education
Access to jobs and education help improve the economic opportunities and quality of life for people with special transportation needs. Examples include:
• Job centers
• Major employers and businesses
• Universities
• Public schools
Human services transportation providers work hard to ensure that these key destinations are accessible for riders with a few different transportation service models.
P A G E 4 3

-
Table 9: Human services transportation models
Type of service Type of vehicle used Vehicle follows a specific route?
Reservation needed?
Flexible drop off locations?
Fixed-route transportation
• Bus • Ferry • Light rail • Commuter rail • Streetcar
Yes No No
Route-deviated transportation • Bus • Shuttle • Van
Yes Sometimes Yes
Demand response transportation • Bus (typically smaller) • Shuttle • Van
No Yes Yes
Human Services Transportation service models Transportation providers use three transportation models to serve riders with special transportation needs: • Fixed-route transportation • Route-deviated transportation
• Demand response transportation
Depending on the unique characteristics of a community, some services are more flexible than others. Transportation providers may use all three models depending on the unique characteristics of a community or region – there is no one-size-fits-all approach. Table 7 highlights the types of vehicles and relative flexibility of each model.
Fixed-route transportation Fixed-route transportation refers to types of transportation that follow a specific route and make scheduled stops along the way. This service type often uses larger vehicles, such as buses, ferries, and passenger rail (including light rail, commuter rail, and street cars). While all types of services providers can operate fixed-route transportation, it is most frequently associated with public transportation providers. If this service is not accessible for people with special transportation needs, public
transportation providers are required to provide a comparable service with accessible features.
Generally, fixed route transportation vehicles have more capacity than their alternatives and as a result are most efficient and affordable to operate in denser areas with many prospective riders. However, many rural transit providers offer fixed route transit services that provide essential connections to major population centers and employment hubs in their region.
As of 2018, 30 transit agencies operated 1,452 transit routes with 23,484 transit stops in 29 counties in Washington. Their service frequency varied by region and time of day. The remaining 10 counties in Washington either lack fixed-route services or lack data on record.44
Route-deviated transportation Route-deviated transportation is very similar to fixed-route transportation, but the driver can make minor changes in drop-off or pick-up locations that are within a reasonable distance of the route. Riders must schedule this service in advance if they want to include a flexible pick-up location and must notify the driver of any deviations in drop-off location.
This type of service typically uses smaller vehicles than fixed route transportation, including buses, shuttles, and vans. The smaller vehicles can better navigate narrow roads in each community. Because
P A G E 4 4
of the route deviations, any rail-based services do not apply. Route-deviated service allows flexibility for riders and provides a means of stretching limited resources in areas with lower population. As a result, these services are common in rural areas. However, route-deviated services also help address first and last mile service gaps in urban areas.45
Demand response transportation Demand response transportation, occasionally referred to as dial-a-ride or demand area response transit, is the most flexible type of transportation service. Rather than serving a specific route, demand response transportation serves an area with a designated boundary and must typically be booked in advance. A typical demand response trip involves a few steps:
1. A passenger contacts a demand response provider or mobility manager to arrange a ride and provides their origin and destination.
2. A dispatch team arranges for the transportation service and notifies the rider of the scheduling logistics.
3. The operator picks up the passenger in a car, van or small bus and transports them to their destination.
Recent innovations in scheduling and booking software may create opportunities to streamline this process and make it more user-friendly.
All types of transportation providers, including public transit providers, nonprofits, and private companies can provide demand response transportation.
Paratransit is a specific type of demand response transportation designed specifically for people with disabilities. ADA laws require public transit agencies to provide a comparable and accessible demand response service if their fixed route service is not accessible. Paratransit riders must apply for eligibility before using the services.
While demand response service highlights flexibility, that flexibility typically comes at a higher operating cost than fixed route transportation. These services are more common and efficient in rural areas with fewer riders and on the outskirts of urban areas with less robust fixed-route transit service.
Measuring levels of service in human services transportation In many ways, public transit serves as the cornerstone for human services transportation. Across the state, public transit agencies use different combinations of service models to serve people with special transportation needs within their communities. Some transit providers focus primarily on fixed-route transportation, while others exclusively provide flexible services through a demand response model. However, it is difficult to visually compare levels of service across the state because of the differences between service models.
Figure 15 shows the service areas for fixed-route and route-deviated transit in Washington as of 2018. These route-based services are critical in providing mobility for people with special transportation needs, but they only show a portion of the transit service in Washington state. Some providers may also provide flexible services beyond the traditional three-quarter mile distance from fixed route transit.
Figure 15 excludes flexible public transit like demand response services because they serve areas, instead of routes and stops. In 2018, approximately a quarter of the revenue vehicle miles and hours in the state were from flexible services. However, these flexible services accounted for only about 3 percent of all passenger trips. This observation is markedly regional though: for rural transit agencies, flexible services account for approximately half of their vehicle revenue miles and hours, and a quarter of their passenger trips.46
Accessible public transit in Washington Even if services are available, they must be accessible to people with special transportation needs to be effective. Accessibility measures are not interchangeable between fixed and flexible services. This section identifies the differences in measurement for accessible transit and proposes one methodology to compare transit service levels across the state.
P A G E 4 5

Figure 15: Transit service types in Washington
Fixed Route Transit Accessibility Accessibility measures the ease of reaching essential destinations. Accessibility factors into a trip in two ways:
• The ease of traveling from home or some other starting point to a pick-up location (e.g., bus stop, transit center)
• The ease of traveling from the drop-off location to the destination
This plan examines accessibility to jobs and to other locations of interest by fixed-route transit47 during morning peak travel time. Approximately three-quarters of seniors, veterans and those living at 200 percent of the FPL have fixed-route transit access to general locations of interest, like hospitals, grocery
stores, and schools. However, only one-third of the individuals in these groups can access jobs through fixed-route transit. Due to different data formats and a general lack of flexible transit data, WSDOT is unable to conduct the same analysis for deviated fixed-route and demand-response services.
Table 10: Top quintile transit accessibility to jobs and other locations in Washington
Demographic Group
Jobs Other locations
Over 65 36% 76%
Veteran 31% 76%
Poverty 37% 79%
P A G E 4 6

Figure 16: Number of jobs accessible by fixed route transit
Demand response level of service Demand response service is a major source of mobility for human services riders. However, there is little data about the extent of demand response service coverage in Washington. This lack of data makes it challenging for public officials and advocates to identify gaps in mobility service and unmet needs.
This plan adapts a methodology for estimating the level of service (LOS) for demand response transit in Washington state.48,49 The Transit Capacity and Quality of Service Manual, published by the Transportation Research Board, defines several measures of demand
response level of service. This plan uses service-span measures, such as the days per week and hours per day that service is available as a key measure of service availability and quality of service.
Figure 18 is a map of demand response level of service by county based on a total of 44 transit agencies and community providers that operated demand response service in the 2018 Summary of Public Transportation. LOS 1 indicates a high demand response level of service, accounting for days and hours of service, while LOS 8 is a comparably low level of service days and hours.
P A G E 4 7
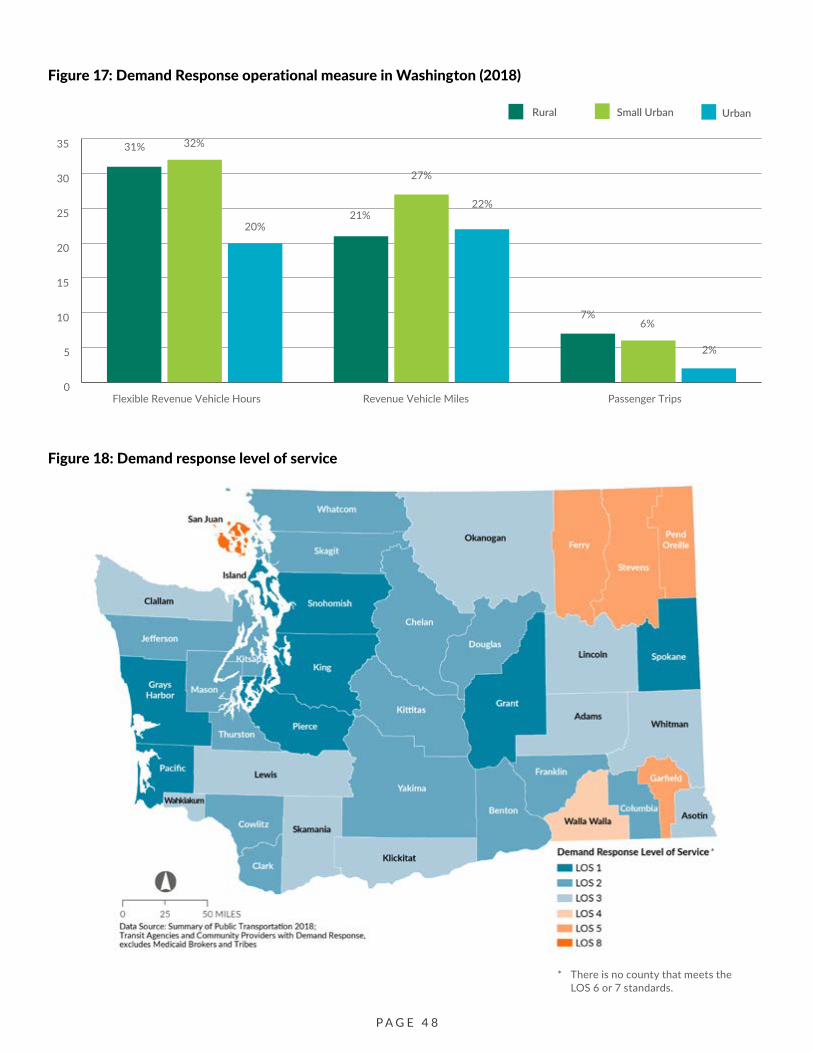
Figure 17: Demand Response operational measure in Washington (2018)
Rural Small Urban Urban
21%
27%
22%
7% 6%
2%
31% 32%
20%
0
5
10
15
20
25
30
35
Flexible Revenue Vehicle Hours Revenue Vehicle Miles Passenger Trips
Figure 18: Demand response level of service
*
* There is no county that meets the LOS 6 or 7 standards.
P A G E 4 8
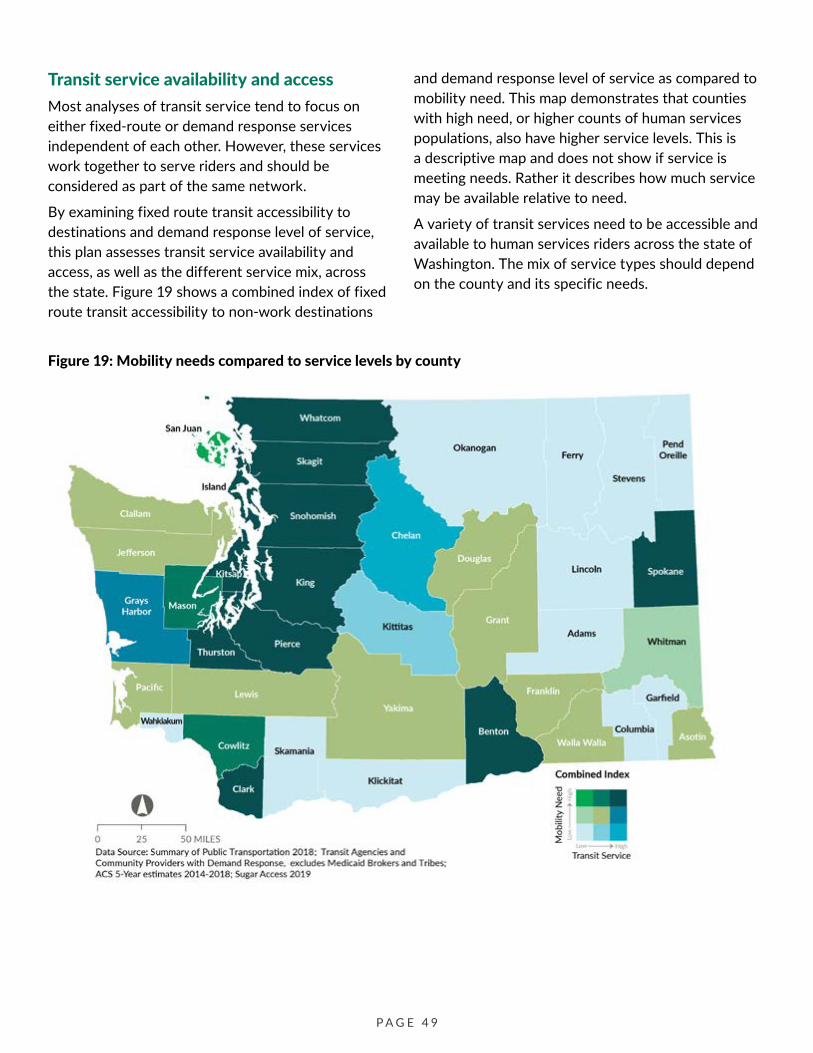
Transit service availability and access Most analyses of transit service tend to focus on either fixed-route or demand response services independent of each other. However, these services work together to serve riders and should be considered as part of the same network.
By examining fixed route transit accessibility to destinations and demand response level of service, this plan assesses transit service availability and access, as well as the different service mix, across the state. Figure 19 shows a combined index of fixed route transit accessibility to non-work destinations
and demand response level of service as compared to mobility need. This map demonstrates that counties with high need, or higher counts of human services populations, also have higher service levels. This is a descriptive map and does not show if service is meeting needs. Rather it describes how much service may be available relative to need.
A variety of transit services need to be accessible and available to human services riders across the state of Washington. The mix of service types should depend on the county and its specific needs.
Figure 19: Mobility needs compared to service levels by county
P A G E 4 9

-
CHAPTER 2: FUNDING HUMAN SERVICES TRANSPORTATION
Most human services transportation is funded through local tax dollars in the local transit district. However, this funding isn’t comprehensive. Providers typically overcome the gaps and barriers not covered by local funds with statewide grants. This section highlights each grant or funding source for different programs, what types of projects get awarded, and the dollar amounts. It also details the regulatory requirements that guide the use of those funds.
Consolidated Grant Program WSDOT administers the Consolidated Grant Program. The purpose of the program is to:
• Provide and improve public transportation services within and between rural communities, and between cities.
• Provide paratransit/special needs services to people who because of age, disability or income are unable to provide transportation for themselves.
• Provide funds to support mobility management activities.
• Provide planning funds to research public transportation related issues.
• Purchase new/replacement vehicles and other equipment.
Nonprofits, tribes, public transit agencies and local agencies in Washington state are eligible to apply for the grant program. Other government agencies are also eligible to apply if their project benefits the greater public.
Table 11 shows the five funding sources that form the Consolidated Grant Program (i.e., two state and three federal). The table also shows that the program awards some funds through a competitive grant process, while other program distributions are based on a predetermined formula. The paratransit special needs formula is based on the amount spent by each agency on route deviated service. The rural mobility formula is based on sales equity, bringing rural areas of the state with less businesses closer to the state average of sales tax collected.
Table 11: Transportation funding awards (competitive and formula funding)
Funding program 2019 2021 biennium
Awarded total (in millions) 50
Competitive (in millions)
Formula (in millions)
State Rural Mobility grants $32.2 $16.1 $16.1
State Paratransit/ Special Needs grants $62.7 $14.3 $48.4
Federal Section 5310 $11.3 $11.3 -
Federal Section 5311 $24.9 $24.9 -
Federal Section 5339 $10.8 $7 $3.8
Total $141.8
P A G E 5 0
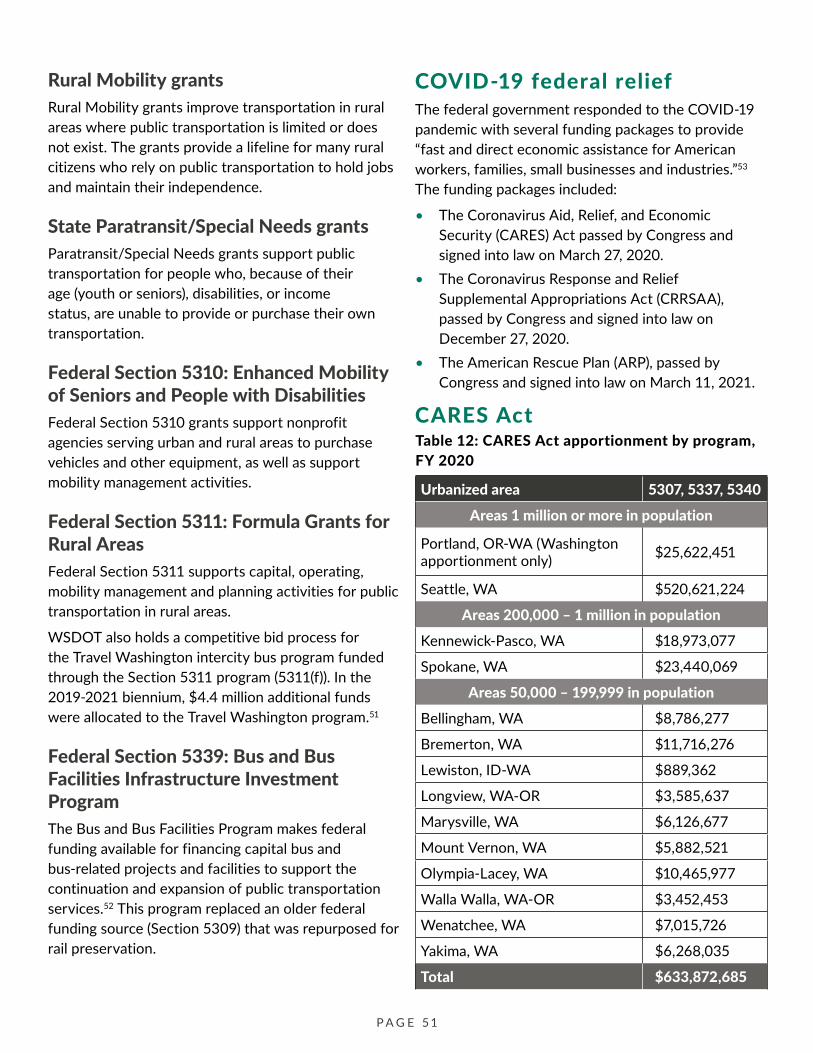
Rural Mobility grants Rural Mobility grants improve transportation in rural areas where public transportation is limited or does not exist. The grants provide a lifeline for many rural citizens who rely on public transportation to hold jobs and maintain their independence.
State Paratransit/Special Needs grants Paratransit/Special Needs grants support public transportation for people who, because of their age (youth or seniors), disabilities, or income status, are unable to provide or purchase their own transportation.
Federal Section 5310: Enhanced Mobility of Seniors and People with Disabilities Federal Section 5310 grants support nonprofit agencies serving urban and rural areas to purchase vehicles and other equipment, as well as support mobility management activities.
Federal Section 5311: Formula Grants for Rural Areas Federal Section 5311 supports capital, operating, mobility management and planning activities for public transportation in rural areas.
WSDOT also holds a competitive bid process for the Travel Washington intercity bus program funded through the Section 5311 program (5311(f)). In the 2019-2021 biennium, $4.4 million additional funds were allocated to the Travel Washington program.51
Federal Section 5339: Bus and Bus Facilities Infrastructure Investment Program The Bus and Bus Facilities Program makes federal funding available for financing capital bus and bus-related projects and facilities to support the continuation and expansion of public transportation services.52 This program replaced an older federal funding source (Section 5309) that was repurposed for rail preservation.
COVID-19 federal relief The federal government responded to the COVID-19 pandemic with several funding packages to provide “fast and direct economic assistance for American workers, families, small businesses and industries.”53
The funding packages included:
• The Coronavirus Aid, Relief, and Economic Security (CARES) Act passed by Congress and signed into law on March 27, 2020.
• The Coronavirus Response and Relief Supplemental Appropriations Act (CRRSAA), passed by Congress and signed into law on December 27, 2020.
• The American Rescue Plan (ARP), passed by Congress and signed into law on March 11, 2021.
CARES Act Table 12: CARES Act apportionment by program, FY 2020
Urbanized area 5307, 5337, 5340
Areas 1 million or more in population
Portland, OR-WA (Washington apportionment only) $25,622,451
Seattle, WA $520,621,224
Areas 200,000 – 1 million in population
Kennewick-Pasco, WA $18,973,077
Spokane, WA $23,440,069
Areas 50,000 – 199,999 in population
Bellingham, WA $8,786,277
Bremerton, WA $11,716,276
Lewiston, ID-WA $889,362
Longview, WA-OR $3,585,637
Marysville, WA $6,126,677
Mount Vernon, WA $5,882,521
Olympia-Lacey, WA $10,465,977
Walla Walla, WA-OR $3,452,453
Wenatchee, WA $7,015,726
Yakima, WA $6,268,035
Total $633,872,685
P A G E 5 1
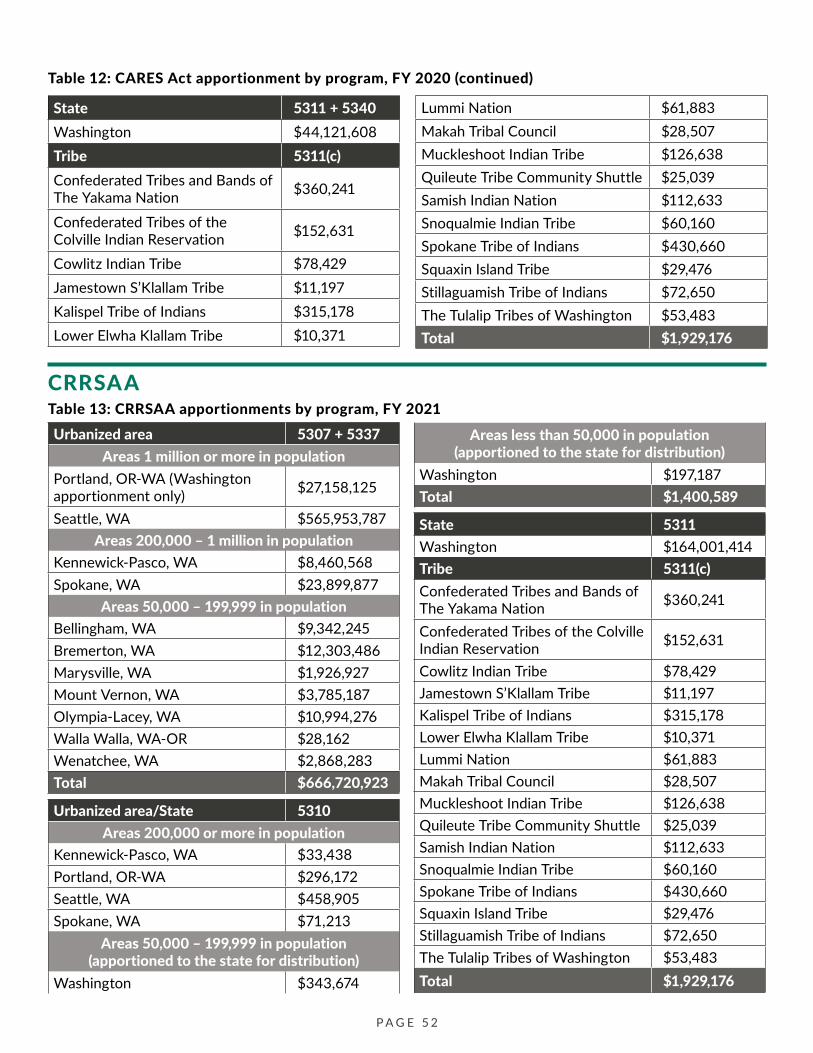
Table 12: CARES Act apportionment by program, FY 2020 (continued)
State 5311 + 5340 Washington $44,121,608 Tribe 5311(c) Confederated Tribes and Bands of The Yakama Nation $360,241
Confederated Tribes of the Colville Indian Reservation $152,631
Cowlitz Indian Tribe $78,429 Jamestown S’Klallam Tribe $11,197 Kalispel Tribe of Indians $315,178 Lower Elwha Klallam Tribe $10,371
Lummi Nation $61,883 Makah Tribal Council $28,507 Muckleshoot Indian Tribe $126,638 Quileute Tribe Community Shuttle $25,039 Samish Indian Nation $112,633 Snoqualmie Indian Tribe $60,160 Spokane Tribe of Indians $430,660 Squaxin Island Tribe $29,476 Stillaguamish Tribe of Indians $72,650 The Tulalip Tribes of Washington $53,483 Total $1,929,176
CRRSAA Table 13: CRRSAA apportionments by program, FY 2021 Urbanized area 5307 + 5337
Areas 1 million or more in population Portland, OR-WA (Washington apportionment only) $27,158,125
Seattle, WA $565,953,787 Areas 200,000 – 1 million in population
Kennewick-Pasco, WA $8,460,568 Spokane, WA $23,899,877
Areas 50,000 – 199,999 in population Bellingham, WA $9,342,245 Bremerton, WA $12,303,486 Marysville, WA $1,926,927 Mount Vernon, WA $3,785,187 Olympia-Lacey, WA $10,994,276 Walla Walla, WA-OR $28,162 Wenatchee, WA $2,868,283 Total $666,720,923
Urbanized area/State 5310 Areas 200,000 or more in population
Kennewick-Pasco, WA $33,438 Portland, OR-WA $296,172 Seattle, WA $458,905 Spokane, WA $71,213
Areas 50,000 – 199,999 in population (apportioned to the state for distribution)
Washington $343,674
Areas less than 50,000 in population (apportioned to the state for distribution)
Washington $197,187 Total $1,400,589
State 5311 Washington $164,001,414 Tribe 5311(c) Confederated Tribes and Bands of The Yakama Nation $360,241
Confederated Tribes of the Colville Indian Reservation $152,631
Cowlitz Indian Tribe $78,429 Jamestown S’Klallam Tribe $11,197 Kalispel Tribe of Indians $315,178 Lower Elwha Klallam Tribe $10,371 Lummi Nation $61,883 Makah Tribal Council $28,507 Muckleshoot Indian Tribe $126,638 Quileute Tribe Community Shuttle $25,039 Samish Indian Nation $112,633 Snoqualmie Indian Tribe $60,160 Spokane Tribe of Indians $430,660 Squaxin Island Tribe $29,476 Stillaguamish Tribe of Indians $72,650 The Tulalip Tribes of Washington $53,483 Total $1,929,176
P A G E 5 2
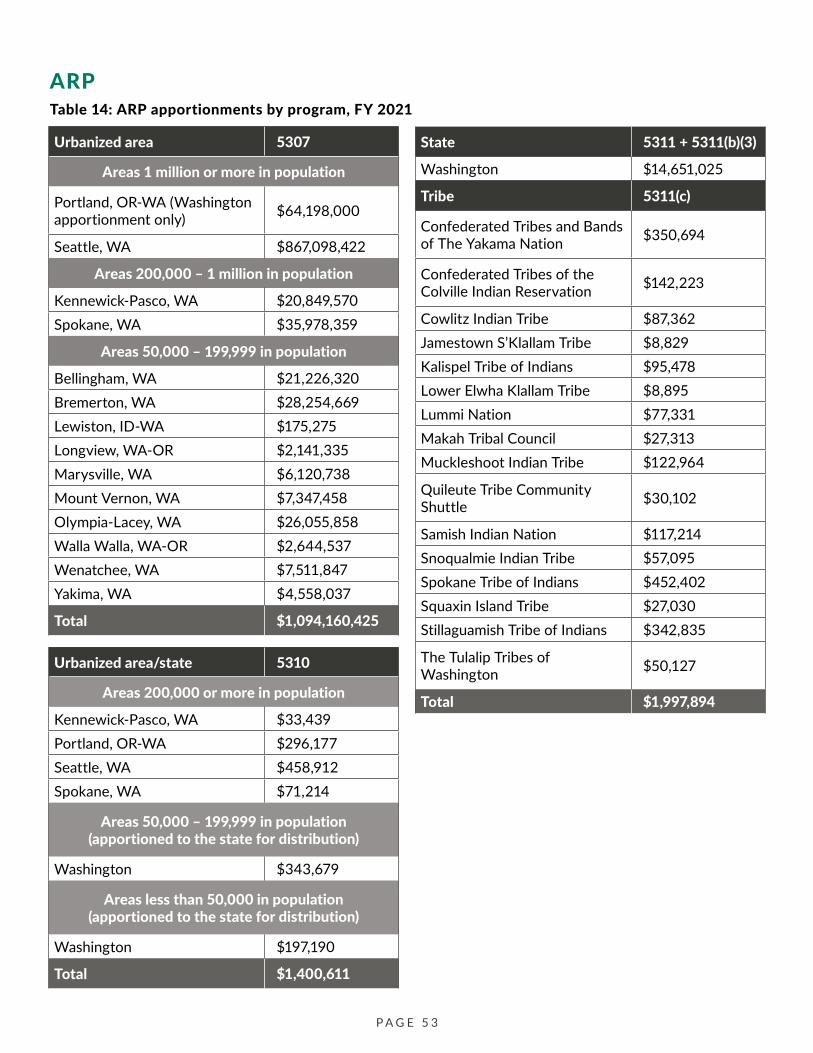
ARP Table 14: ARP apportionments by program, FY 2021
Urbanized area
Areas 1 million or more i
Portland, OR-WA (Washington apportionment only)
Seattle, WA
Areas 200,000 – 1 million
Kennewick-Pasco, WA Spokane, WA
Areas 50,000 – 199,999 i
Bellingham, WA Bremerton, WA Lewiston, ID-WA Longview, WA-OR Marysville, WA Mount Vernon, WA Olympia-Lacey, WA Walla Walla, WA-OR Wenatchee, WA Yakima, WA
Total
Urbanized area/state
Areas 200,000 or more i
Kennewick-Pasco, WA Portland, OR-WA Seattle, WA Spokane, WA
Areas 50,000 – 199,999 i(apportioned to the state f
Washington
Areas less than 50,000 i(apportioned to the state f
Washington
Total
5307
n population
$64,198,000
$867,098,422
in population
$20,849,570 $35,978,359
n population
$21,226,320 $28,254,669 $175,275 $2,141,335 $6,120,738 $7,347,458 $26,055,858 $2,644,537 $7,511,847 $4,558,037
$1,094,160,425
5310
n population
$33,439 $296,177 $458,912 $71,214
n population or distribution)
$343,679
n population or distribution)
$197,190
$1,400,611
State 5311 + 5311(b)(3)
Washington $14,651,025
Tribe 5311(c)
Confederated Tribes and Bands of The Yakama Nation $350,694
Confederated Tribes of the Colville Indian Reservation $142,223
Cowlitz Indian Tribe $87,362 Jamestown S’Klallam Tribe $8,829 Kalispel Tribe of Indians $95,478 Lower Elwha Klallam Tribe $8,895 Lummi Nation $77,331 Makah Tribal Council $27,313 Muckleshoot Indian Tribe $122,964
Quileute Tribe Community Shuttle $30,102
Samish Indian Nation $117,214 Snoqualmie Indian Tribe $57,095 Spokane Tribe of Indians $452,402 Squaxin Island Tribe $27,030 Stillaguamish Tribe of Indians $342,835
The Tulalip Tribes of Washington $50,127
Total $1,997,894
P A G E 5 3

Funding for nonemergency medical transportation programs Medicaid transportation brokers help meet the NEMT needs of Medicaid recipients throughout Washington state. Medicaid transportation brokers are funded primarily using federal Medicaid funding.54
Medicaid is a federal program that pays for the basic health services of people with low income, as well as for long-term care for seniors and people with disabilities.
Funding for community transportation providers Community transportation providers often receive funding through Federal Section 5311: Formula Grants for Rural Areas. WSDOT’s Public Transportation Division administers Section 5311 through the Consolidated Grant Program. Section 5311 has the specific goal of providing public transportation where it would not otherwise exist.55
Public transportation revenues and expenses Funding for public transportation comes from revenue generated at the local, state and federal levels. These revenues fund capital projects and operating costs that are vital in human services transportation. However, they do not exclusively fund services for people with special transportation needs.56
Public transportation revenues Most revenue for public transportation is locally generated (87 percent). State revenues (3 percent) and federal revenues (10 percent) make up the remainder of funding sources for public transportation. Table 15 shows the total 2019 revenues for public transportation.
Table 15: Public transportation revenue57
Public transportation capitalproject expenses Local sources pay for approximately 80 percent of expenses for public transportation capital projects. These sources include tax levies, general funds, specified contributions, reserve funds, and donations. The remainder is paid for by federal capital investment (12 percent), state capital investment (2 percent) and capital investment from other sources (6 percent).
Table 16 shows the total 2019 capital project expenses for public transportation.58
Table 16: Capital funding sources59
Capital funding sources
2019 capital funding
Percent of total
Local $2,331,031,640 80.34%
State $51,649,561 1.78%
Federal $341,399,935 11.77%
Other $177,319,053 6.11%
Total $2,901,400,189 100%
Public transportation operating expenses Table 17 breaks down the operating expenses by mode type for the calendar year 2019. Fixed route services (e.g., bus, commuter rail and light rail) make up more than four-fifths of all operating expenses (85 percent), while demand response services across the state account for far less (12 percent).
Table 17: Operating expenses by service mode60
Source of revenue 2019 revenue Percent of total
Local revenues $3,858,894,024 87.35% State revenues $118,205,777 2.68%
Federal revenues $440,396,091 9.97%
Total $4,417,495,892 100%
Operating expenses by service mode
2019 expenses Percent of total
Fixed route buses $1,289,620,844 72.94%
Commuter rail $56,879,437 3.22%
Light rail $148,164,435 8.38%
Route deviated $26,399,067 1.49%
Demand response $217,237,782 12.29%
Vanpool $29,793,318 1.69%
Total $1,768,094,883 100%
P A G E 5 4
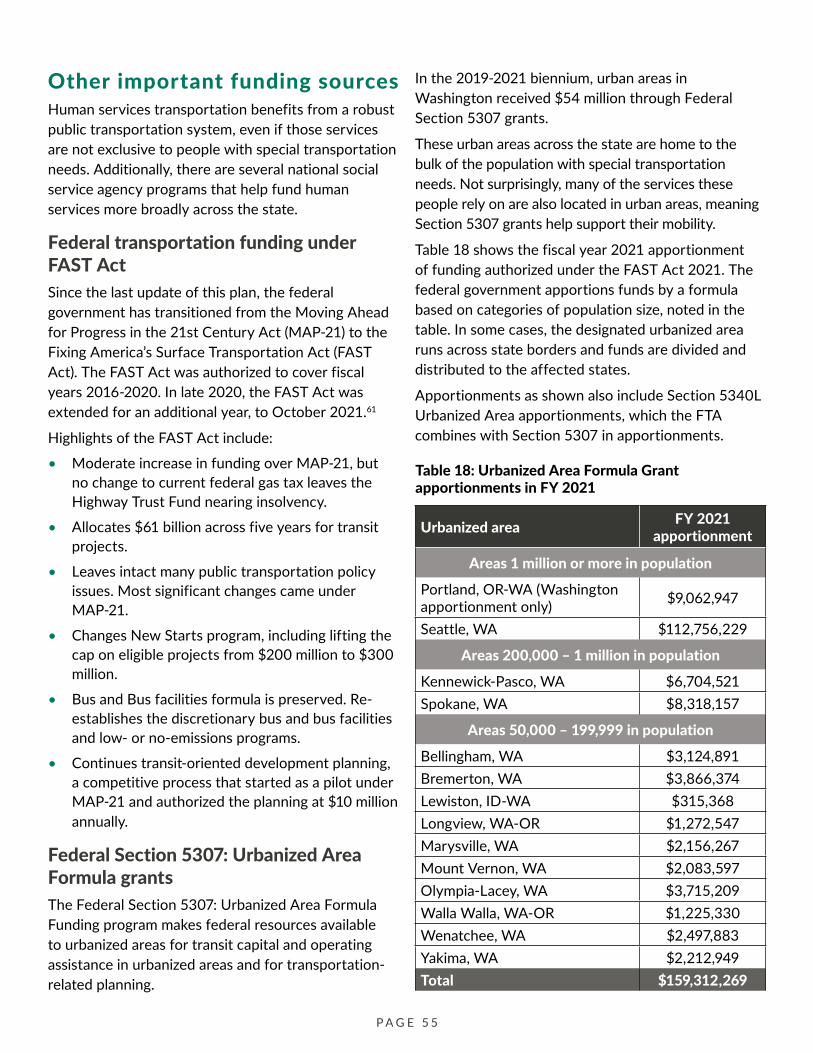
Other important funding sources Human services transportation benefits from a robust public transportation system, even if those services are not exclusive to people with special transportation needs. Additionally, there are several national social service agency programs that help fund human services more broadly across the state.
Federal transportation funding under FAST Act Since the last update of this plan, the federal government has transitioned from the Moving Ahead for Progress in the 21st Century Act (MAP-21) to the Fixing America’s Surface Transportation Act (FAST Act). The FAST Act was authorized to cover fiscal years 2016-2020. In late 2020, the FAST Act was extended for an additional year, to October 2021.61
Highlights of the FAST Act include:
• Moderate increase in funding over MAP-21, but no change to current federal gas tax leaves the Highway Trust Fund nearing insolvency.
• Allocates $61 billion across five years for transit projects.
• Leaves intact many public transportation policy issues. Most significant changes came under MAP-21.
• Changes New Starts program, including lifting the cap on eligible projects from $200 million to $300 million.
• Bus and Bus facilities formula is preserved. Re-establishes the discretionary bus and bus facilities and low- or no-emissions programs.
• Continues transit-oriented development planning, a competitive process that started as a pilot under MAP-21 and authorized the planning at $10 million annually.
Federal Section 5307: Urbanized Area Formula grants The Federal Section 5307: Urbanized Area Formula Funding program makes federal resources available to urbanized areas for transit capital and operating assistance in urbanized areas and for transportation-related planning.
In the 2019-2021 biennium, urban areas in Washington received $54 million through Federal Section 5307 grants.
These urban areas across the state are home to the bulk of the population with special transportation needs. Not surprisingly, many of the services these people rely on are also located in urban areas, meaning Section 5307 grants help support their mobility.
Table 18 shows the fiscal year 2021 apportionment of funding authorized under the FAST Act 2021. The federal government apportions funds by a formula based on categories of population size, noted in the table. In some cases, the designated urbanized area runs across state borders and funds are divided and distributed to the affected states.
Apportionments as shown also include Section 5340L Urbanized Area apportionments, which the FTA combines with Section 5307 in apportionments.
Table 18: Urbanized Area Formula Grant apportionments in FY 2021
Urbanized area FY 2021 apportionment
Areas 1 million or more in population
Portland, OR-WA (Washington apportionment only) $9,062,947
Seattle, WA $112,756,229
Areas 200,000 – 1 million in population
Kennewick-Pasco, WA $6,704,521 Spokane, WA $8,318,157
Areas 50,000 – 199,999 in population
Bellingham, WA $3,124,891 Bremerton, WA $3,866,374 Lewiston, ID-WA $315,368 Longview, WA-OR $1,272,547 Marysville, WA $2,156,267 Mount Vernon, WA $2,083,597 Olympia-Lacey, WA $3,715,209 Walla Walla, WA-OR $1,225,330 Wenatchee, WA $2,497,883 Yakima, WA $2,212,949 Total $159,312,269
P A G E 5 5

Federal social service agency programs for human services transportation In addition to traditional federal grant programs, there are 130 federal programs that provide funding for human services transportation, specifically for people with disabilities, the elderly and people with low incomes.
The CCAM supports these programs and publishes an inventory of the programs that may fund transportation, last updated in 2019. Agencies responsible for these programs include:
• Health and Human Services – 66 programs
• Department of Transportation – 12 programs
• Housing and Urban Development – 12 programs
• Department of Labor – 11 programs
• Department of Justice – 10 programs
• Department of Education – 10 programs
• Department of the Interior – 4 programs
• Department of Veterans Affairs – 3 programs
• Department of Agriculture – 2 programs
P A G E 5 6
CHAPTER 3: HUMAN SERVICES TRANSPORTATION GOALS, UNMET NEEDS AND STRATEGIES
Stakeholder feedback helped WSDOT identify three primary goals for human services transportation in Washington:
• GOAL 1: Human services transportation is accessible and helps more people get to the places they need to go.
• GOAL 2: People feel safe using human services transportation.
• GOAL 3: Human services transportation is easy to use.
Under each goal is a list of unmet needs, as well as strategies that stakeholders identified to address those unmet needs. The strategies do not correspond to an individual goal, as they often met more than one goal or unmet need.
Readers should also note that the list of unmet needs below each goal is not exhaustive. It represents a cross section of the most prominent issues noted across the state through a combination of outreach and research.
Methodology: goals, unmet needs and strategies From 2018-2020, WSDOT led a series of efforts to identify unmet needs and various strategies across the state. This included the development and facilitation of a Human Services Steering Committee, community engagement with hard-to-reach groups, and an analysis of coordinated public transit-human services transportation plans from across Washington.
Unmet needs in human services transportation Unmet needs limit or prevent people from accessing any critical human services they need to live a fulfilling life. Sometimes, transportation services don’t exist where and when riders need them. In other cases, there are physical, policy or administrative barriers that make services harder to use for riders.
The following sections highlight the most prominent gaps and barriers in human services transportation that, if resolved, would help expand mobility for people in Washington.
The inability to access human services leads to additional problems, including disparate health outcomes, lower wages and earning potential, and poor quality of life. Unmet needs consist of both gaps and barriers to mobility that prevent people from using or accessing human services transportation.
P A G E 5 7
GOAL 1: Human services transportation is accessible and helps more people get to the places they need to go Human services transportation is an affordable lifeline for the most vulnerable people in the state. To answer whether a human service transportation is accessible and helps more people get to the places they need to go, this plan asks: • Can riders get to their
transportation services? • Can the transportation
services reliably get them where they need to be on time?
In some cases, human services transportation keeps people alive by giving them access to preventative and critical medical care. These services also help people maintain their quality of life through access to healthy food, employment centers, education, banking institutions and other critical services.
Unmet needs: accessibility The following list highlights barriers and gaps in human services transportation that make it harder for people to travel to the essential services they rely on.
Limited boundaries for transit service areas make it hard for riders to access regional services Transportation providers, especially in the public sector, often have limited-service areas. Riders in urban areas often need access to services like specialized medical care, universities and colleges, grocery stores, and job centers. People living in rural areas need direct service or quick and easy transfers to access regional destinations.
Limited access to nonemergency healthcare services Many human services customers have serious medical conditions and need reliable access to healthcare. However, these riders may not meet the eligibility criteria for NEMT or aren’t aware of the existing services.
Whether it is a chronic illness requiring regular treatment (e.g., chemotherapy, kidney dialysis), a simple check-up, or pharmacy trip, human services riders need regular access to and from medical facilities. While some statewide programs like Medicaid and Medicare Advantage cover transportation costs for nonemergency healthcare, each program includes strict eligibility requirements, such as residency status, income level, age, disability status and other need-based criteria. If human services customers do not meet the eligibility requirements, they may pay a premium for private taxi or shuttle services. They may even defer their medical care, which often leads to worse, long-term health conditions.
Bedbound, supine and bariatric patients need ambulance services to get to and from the same medical provider appointments that others can drive to. They are not able to use most of the available services because these services often do not offer stretchers and do not provide medical services enroute to the destination.
Low Medicaid reimbursements creates gaps when a provider will not transport the patient due to reimbursement not covering their costs. Many of these patients may need weekly transport to dialysis, chemo treatment or even daily to a methadone clinic.
The state needs to expand nonemergency healthcare services for individuals who do not meet Medicaid’s minimum eligibility requirements or who are not old enough or eligible for Medicare transportation benefits. The state also needs to improve education about these programs and their eligibility requirements. Similarly, transportation providers need to continue expanding access to nonemergency healthcare services and working with healthcare providers to coordinate trips to their facilities.
P A G E 5 8
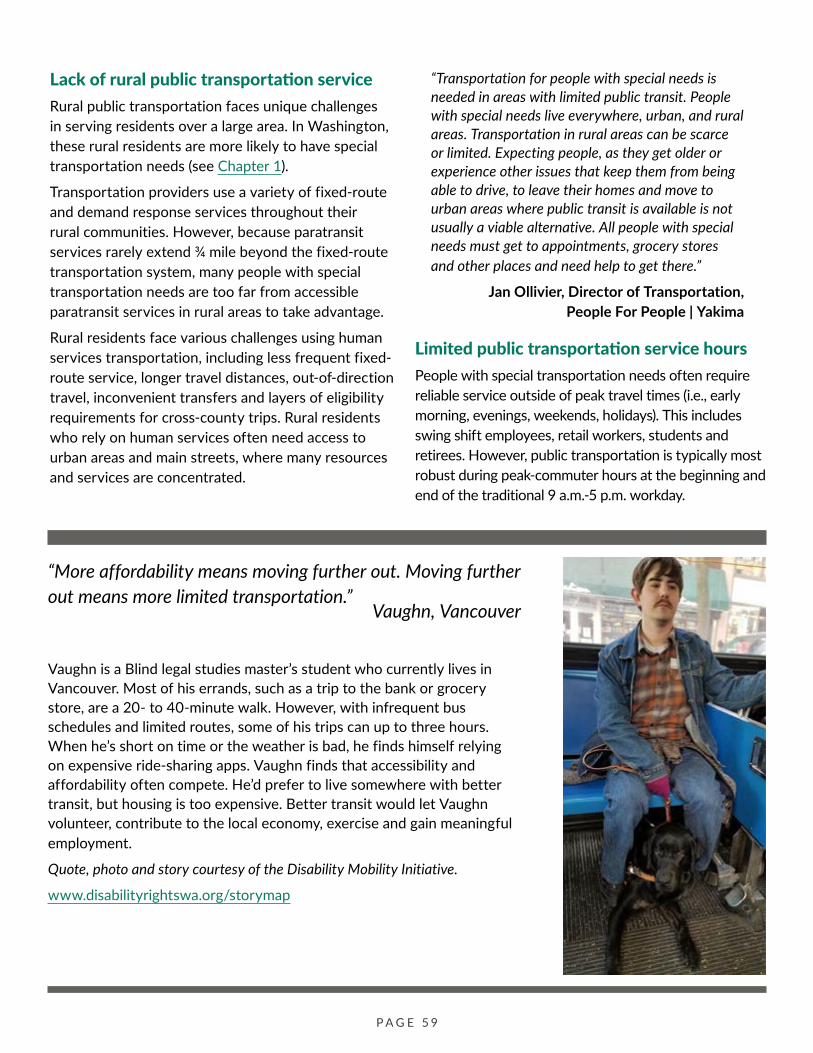
Lack of rural public transportation service Rural public transportation faces unique challenges in serving residents over a large area. In Washington, these rural residents are more likely to have special transportation needs (see Chapter 1).
Transportation providers use a variety of fixed-route and demand response services throughout their rural communities. However, because paratransit services rarely extend ¾ mile beyond the fixed-route transportation system, many people with special transportation needs are too far from accessible paratransit services in rural areas to take advantage.
Rural residents face various challenges using human services transportation, including less frequent fixed-route service, longer travel distances, out-of-direction travel, inconvenient transfers and layers of eligibility requirements for cross-county trips. Rural residents who rely on human services often need access to urban areas and main streets, where many resources and services are concentrated.
“Transportation for people with special needs is needed in areas with limited public transit. People with special needs live everywhere, urban, and rural areas. Transportation in rural areas can be scarce or limited. Expecting people, as they get older or experience other issues that keep them from being able to drive, to leave their homes and move to urban areas where public transit is available is not usually a viable alternative. All people with special needs must get to appointments, grocery stores and other places and need help to get there.”
Jan Ollivier, Director of Transportation, People For People | Yakima
Limited public transportation service hours People with special transportation needs often require reliable service outside of peak travel times (i.e., early morning, evenings, weekends, holidays). This includes swing shift employees, retail workers, students and retirees. However, public transportation is typically most robust during peak-commuter hours at the beginning and end of the traditional 9 a.m.-5 p.m. workday.
“More affordability means moving further out. Moving further out means more limited transportation.”
Vaughn, Vancouver
Vaughn is a Blind legal studies master’s student who currently lives in Vancouver. Most of his errands, such as a trip to the bank or grocery store, are a 20- to 40-minute walk. However, with infrequent bus schedules and limited routes, some of his trips can up to three hours. When he’s short on time or the weather is bad, he finds himself relying on expensive ride-sharing apps. Vaughn finds that accessibility and affordability often compete. He’d prefer to live somewhere with better transit, but housing is too expensive. Better transit would let Vaughn volunteer, contribute to the local economy, exercise and gain meaningful employment.
Quote, photo and story courtesy of the Disability Mobility Initiative.
www.disabilityrightswa.org/storymap
P A G E 5 9
Additionally, some public transit agencies in Washington expand service during the height of summer tourism and reduce their hours during the offseason. When public transportation is only available for limited parts of the day, week or year it creates challenges for people with special transportation needs.
Limited transportation travel speeds and reliability make human services inaccessible or inconvenient Many sources note that human services transportation options are often unreliable for riders.
Less frequent public transportation results in longer wait times, missed medical appointments, and other challenges for people with special transportation needs. Riders are often frustrated when demand response services show up early, late or cancel appointments.
Reliability and travel speed also affect the return trip home from an appointment. After chemotherapy or dialysis, most people do not want to wait for more than 30 minutes, sometimes outside the medical facility, to begin their trip back home.
These challenges are exacerbated when these human services riders need to use multiple types of public transportation services for a single trip. Longer wait times are also very challenging for vulnerable groups who must wait outside or risk missing the next bus.
People with low incomes cannot afford the cost of transportation services
Some people cannot afford the cost of transportation. For example, many people living in poverty cannot afford bus fare. Some seniors also cannot afford Medicare premiums that give them access to NEMT.
Many transportation providers already provide discounted fares or ticket voucher programs for
specific demographics (e.g., youth, seniors, students, people experiencing homelessness). Even with these discounts, many riders still struggle to afford their transit fares.
Lack of volunteer drivers leads to fewer rides for people with special transportation needs
Human services transportation providers occasionally use volunteer driver programs to support and supplement their operations. These programs often struggle to recruit and retain enough qualified drivers due to economic changes, competing employers in the public and private sector, retirements and volunteer driver burnout. Volunteer drivers also need sufficient training from professionals to operate vehicles safely.
Lack of coordination leads to inefficient services and gaps between providers People with special transportation needs continue to express frustration when public transportation services are confusing, inefficient or inconvenient. With several organizations, agencies, tribes and human service providers trying to provide service, staff from each organization struggle to coordinate and prevent gaps in coverage or duplication in service.
Across Washington, transit agencies, non-profits, mobility managers, local governments, state agencies and human services providers need to improve their coordination to ensure that their operational costs stay low and that services are available and convenient to riders. A lack of coordination between providers and transportation modes makes service more expensive and less efficient.
The state also needs to play a more direct role in supporting mobility managers. These staff provide several services that support coordination between public transportation, human services and people with special transportation needs.
P A G E 6 0
GOAL 2: People feel safe using human services transportation Safety is an essential component for all forms of transportation. In human services, transportation providers have an important role in ensuring the safety and comfort of all their riders. As a result, there is a need for safer transportation infrastructure, safer vehicles and trained drivers who can operate all safety equipment.
Unmet needs: safety Safety needs in human services transportation extends far beyond the actual trip. Riders should feel safe getting to the bus stop or pickup location, waiting for their ride, boarding the vehicle, during the trip, and when they reach their destination and deboard.
The following list of topics are all unmet safety needs in human services transportation.
Lack of safety features and accessible infrastructure at transit stops Insufficient shelters, bus stops, sidewalks and crosswalks limit access to public transportation. A trip is only as safe as its most dangerous part, and for some people the act of getting to the pickup can present hazards. Because of this, it is critical to ensure the safety of passengers not just while they are using transit, but also while they travel to their bus stop and wait for their bus to arrive.
Transit facilities and bus stops should be safe and meet or exceed ADA requirements, which help ensure equitable access for all Washingtonians, particularly for people who use wheelchairs or other assistive devices. Many stops in Washington lack adequate lighting, curb ramps, crosswalks, proper signaling mechanisms, shelter and seating, making them insufficient for people with special transportation needs.
Both the state and public transportation providers need to play a central role in working with cities, counties and tribes to improve the safety and accessibility of transit stops.
Improved bus stops may also increase ridership and decrease demand for ADA paratransit services. As bus stops improve, they become more accessible to people with special transportation needs. Improving access to transportation helps keep costs down for transit agencies by moving riders to a less expensive option.63
Lack of investment in rider comfort and safety People with special transportation needs want their transportation options to be comfortable and safe. Public transportation providers must ensure that all vehicles and equipment help to support and ensure the comfort and safety of riders. Providers need to maintain vehicle fleets and ADA equipment in a state of good repair.
Additionally, riders must often deal with long trips and transfers with no comfort stops or bathroom breaks. This means some riders may decide to not make the trip at all, whether it be to a medical appointment, grocery store, or other essential services, because of the barriers or they will likely face a more difficult trip than other customers.
Transportation providers also need to ensure that their vehicles undergo regular cleaning and sanitation practices to reduce the spread of illnesses among riders and operators.
P A G E 6 1

“In order to travel to Evergreen Hospital in Kirkland to see my neurologist, I would have to take TAP, transfer to DART and then transfer to King County Access. If I could drive, it would only take 20 minutes.” Jo Ann, Bothell
Jo Ann lives in Bothell. She uses TAP Transportation from Homage Senior Services. TAP takes her to the grocery store, LA Fitness, the dentist and hair appointments. But when she needs to go to her neurologist or other doctor appointments in another county, she has to make three transfers: from TAP to King County Metro DART to King County Metro Access.
Quote, photo and story courtesy of the Disability Mobility Initiative. www.disabilityrightswa.org/storymap
“Some bus stops don’t have shelters and it’s hard for people to be waiting for over half an hour in the winter, especially for people with a disability or a Blind person. Sometimes if you miss one bus, you have to wait two hours for the next one. It’s not a good service for people who rely on public transportation.” Amandeep, Lynnwood
Amandeep is a Blind student who lives in Lynnwood and attends Everett Community College. She gets around using the bus, but the buses she needs don’t stop very close to campus and the bus announcements at stops aren’t loud enough. In Amandeep’s ideal community, transit stops would have Braille signage consistently posted, with route numbers, direction of travel and schedule. Going to downtown Seattle would be much easier, so she could meet friends, go to meetings and go out to eat more often.
Quote, photo and story courtesy of the Disability Mobility Initiative. www.disabilityrightswa.org/storymap
In early 2020, the COVID-19 pandemic began sweeping across the nation and created a new set of challenges around passenger and operator safety. The pandemic has led to a series of major changes to rider safety as providers try to reduce the spread of a dangerous virus and keep riders and operators safe. Transit providers have rapidly pivoted their operations to support rider safety, including new cleaning schedules and procedures, face covering policies, fare collection, and other changes that helped reduce the spread of illness during shared trips. Chapter 4 contains more information on the pandemic and its effect on human services transportation.
Lack of trained drivers Many human services transportation programs rely on drivers who are trained to operate the vehicles and
the equipment specifically for people with disabilities. During outreach, many human services transportation providers noted a shortage of trained drivers – for staff and volunteer programs. To ensure the safety of all passengers, it is critical that staff and volunteer drivers are trained to safely use and operate the equipment on each vehicle. With no clear statewide approach, driver training programs are unique for each employer across the state. As a result, drivers cannot easily switch employers without additional time and money dedicated to training programs. Additionally, employment in human services transportation must appeal to drivers. Many public and nonprofit transportation providers face steep competition from the private sector, which tends to offer higher pay and more opportunities for people with a commercial driver’s licenses.
P A G E 6 2
GOAL 3: Human services transportation is easy to use
With numerous transportation providers, eligibility requirements and scheduling challenges, the human services transportation system is cumbersome and confusing for many riders and potential riders.
Unmet needs: ease of use Each of the topics below highlight an unmet need in human services transportation that make the services too confusing or hard to use.
Limited potential for shared rides under current regulations
Sometimes, rules and regulations at the state and federal level create inefficiencies in human services transportation. Providers express frustration when they are unable to serve more people due to regulations about sharing rides or operating in different jurisdictions.
Many state and federal funding sources have strict requirements about where and how to use the money. Providers need some additional flexibility in how they may use money to quickly pivot to the needs of their communities.
Regulatory challenges exist at every level of governance including federal policies, state policies and local regulations. Policy makers at each level must work together with their communities to identify and address regulatory inefficiencies in human service transportation.
Lack of centralized technology systems among transportation providers
Transportation providers need better technology systems to increase the efficiency of their service and improve communication by providing riders with real-time information about their trip.
Each year, private companies are developing new hardware and software to help transportation providers deliver better service. To determine the best ways to improve their service, transportation providers need financial support to pilot and test hardware and software that support their dispatch, scheduling, communications and operations.
All riders want reliable information about when their transportation will arrive and updates about delays. As transportation providers adopt new technologies, there is also a growing need to develop common data standards so providers can better coordinate their services. Different transportation providers use a multitude of dispatch and scheduling software with different data standards. Different standards make it hard for different providers to coordinate their services and hard for people to use them. Without a common standard for transportation data in Washington, people with special transportation needs will bear the brunt of these inefficiencies, including a lack of real-time information, long waits, difficult transfers and additional costs to use private transportation providers like taxis or shuttles.
P A G E 6 3
Lack of easy-to-understand information about eligibility requirements Given the complex system of programs and benefits, public transportation providers and governments across Washington need to make their eligibility requirements easy to understand. Confusing eligibility requirements make it hard for new riders to understand what options are available and how much they will cost. These individuals miss opportunities to take advantage of affordable public transportation, special programs or dedicated services simply because they do not know that they are eligible.
Lack of rider assistance and education
Some potential riders do not use human services transportation options because they are simply unaware of them or have never used any form of public transportation before. These people need mobility management assistance, travel training and education about their options.
Providers and public officials need help promoting the various programs and services they have available to people with special transportation needs. These people need specific tools to:
• Navigate the transportation system.
• Understand eligibility requirements.
• Find information on amenities, such as transfer points and bus stops.
• Use apps that show different modes, static maps and informational phone services.
Limited internet access across the state makes it hard for riders to learn about services and use digital wayfinding tools
Internet service is now a prominent tool for wayfinding and rider information. However, internet service can be expensive and is not always robust
outside of urban areas. Lack of easy, fast internet access limits people’s ability to use online tools and access information about a trip.
The 2019 American Community Survey estimates there are more than 250,000 households without access to a wired internet connection, nearly 9 percent of the state.64,65 Further, while the 2019 American Community Survey data does not account for a cellphone data plan or satellite internet service, the 2017 National Household Travel Survey data shows that 4 percent of households in Washington have never used a smartphone, tablet or PC to access to the internet in the month before the survey.66
The COVID-19 pandemic increased and intensified this gap between people with and without reliable internet access. In 2020 and 2021, many individuals and families shifted to remote ways of working, learning, visiting the doctor, and connecting with friends and families. With an increased reliance on the broadband network for work, school, healthcare and recreation, many families do not have access to a reliable internet connection, cannot afford the costs, or lack the technical skills to log on and use online tools.
Lack of outreach and awareness for people with limited English proficiency
People with limited English proficiency need additional help to understand the programs, services and eligibility requirements for transportation programs. At all levels of government, public officials and transportation providers need to adapt policies and procedures that ensure people with limited English proficiency understand which services they can use and how to use them. Public officials and transportation providers must ensure that outreach and marketing materials are inclusive, culturally sensitive and designed for people with limited English proficiency.
P A G E 6 4

Strategies in human services transportation Based on the plan goals, strategies were developed through stakeholder engagement. Some strategies and actions this plan identified through engagement and research can be implemented right away. Some strategies need more work or further legislative direction before WSDOT and partners can begin.
Strategies and actions ready for implementation The following strategies and actions are already underway or can be pursued by public transportation providers using existing resources. The list may serve as an action plan for the next planning cycle of the Statewide HSTP:
Strategy 1: Improve services for people with mobility barriers
Action: WSDOT and transportation providers should continue to support national efforts to increase flexibility for use of federal funds (e.g., Coordinating Council on Access and Mobility) • Timeframe – Short-range (1-3 years)
• Deliverable – WSDOT supports Coordinating Council on Access and Mobility work to increase opportunities for coordinated transportation.
Funding and regulations lead transportation service providers to focus on either people with disabilities, people with low-incomes, or the elderly. The federal government is working to allow providers to provide services to a mix of these riders through cost-sharing agreements and coordination of resources. This would allow providers to offer services to more people and to deliver service more efficiently. If the federal government updates guidelines, WSDOT will develop model cost sharing agreements to expedite implementation.
Strategy 2: Ensure an ongoing pool of qualified and trained operators to keep customers safe
Action: CTANW should continue to explore standardized operator training across the state for human services transportation providers • Timeframe – Short-range (1-3 years)
• Deliverable – CTANW develops new affordable standardized operator training program for nonprofit and community-based organizations.
While driver training is mostly standardized in the public sector, many human services transportation trips rely on drivers from private and nonprofit sectors where driver training is not standardized. CTANW will create a training certification program and trainer database that covers Washington and Oregon. An affordable and standardized training program will ensure that there is a larger pool of qualified drivers across state.
Action: Government agencies and other transportation service providers should consider developing a proposal for job training and commercial drivers’ license training that enables underrepresented populations to fill jobs in public transportation and electrification maintenance.
P A G E 6 5

• Timeframe – Short-range (1-3 years)
• Deliverable – WSDOT, CTANW and transit agencies to develop a report and potentially a proposal.
Transportation providers are experiencing severe shortages in qualified drivers and maintenance crews. There is a fast-growing need for employees with expertise required to maintain electric vehicles and infrastructure. Education, training and licensing costs are a significant barrier to entry for underrepresented populations to these jobs. WSDOT, CTANW and transit agencies will examine opportunities to meet these needs.
Strategy 3: Improve the influence of people with mobility barriers in transportation plans and decisions
Action: Government agencies and other transportation service providers should deploy updated tools and invest staff resources to better engage people with mobility barriers • Timeframe – Short-range (1-3 years)
• Deliverable – WSDOT is updating guidance to help providers use modern tools to identify underserved demographic groups in their service area and will provide technical assistance on the use of these tools. Transportation service providers and government agencies will further incorporate the use of these tools in their work.
Some transportation planners struggle to identify historically disadvantaged populations to ensure their consideration and inclusion in transportation plans and studies. Newly available data sets, like the Department of Health’s Washington Tracking Network tool, and systems provide an opportunity.
Action: Government agencies should update grant selection processes to improve the consideration of mobility for people with mobility barriers • Timeframe – Short-range (1-3 years)
• Deliverable – WSDOT will implement requirements of the HEAL Act.
The Healthy Environment for All (HEAL) Act passed in 2021 and presents opportunities to expedite
equity and inclusion work across the agency. The act seeks to reduce environmental and health disparities in Washington, specifically calling out a need for equitable grant funding and public engagement for vulnerable communities.
Action: WSDOT should update planning guidance to enable more robust consideration of mobility for people with mobility barriers • Timeframe – Short-range (1-3 years)
• Deliverable – WSDOT should improve consideration of human services transportation in statewide transportation plans.
WSDOT should update planning guidance to improve the inclusion of human services transportation.
Action: WSDOT should develop better methodologies to identify unmet needs for people with mobility barriers and estimate costs • Timeframe – Short-range (1-3 years)
• Deliverable – WSDOT’s Public Transportation Division develops a preliminary report outlining methodologies and costs.
WSDOT’s Public Transportation Division is leading efforts to develop an improved methodology for estimating how much funding would be necessary to address the unmet needs in human services and public transportation. This process should involve engagement with stakeholders and service providers across the state.
Strategy 4: Make it easier to use technology to plan, book and pay for public transportation
Action: Public transportation providers should pursue a central repository of data that could support improved services and travel information for people with mobility barriers and one-call/ one-click programs • Timeframe – Mid-range (3-6 years)
• Deliverable – Hopelink, WSDOT, the Washington State Transit Association, and other stakeholders are pursuing the development of a central repository for data that enables one-call/one-click programs.
P A G E 6 6

One-call/one-click programs help centralize transportation information in one place, making it easier for all types of riders to plan, book and pay for their transportation. Centralized and standardized information would spur technology improvements. As a result, this information would be more readily accessible for riders, including people with mobility barriers.
Action: Public transportation providers should integrate accessibility features and eligibility into transportation data standards • Timeframe – Mid-range (4-6 years)
• Deliverable – WSDOT and providers will adopt updated data standards.
Data standards such as General Transit Feed Specifications (GTFS) and GTFS-flex provide a uniform way of displaying transportation information to technology developers, customers and other service providers.
Updated data standards can make it easier for people with special transportation needs to plan, book and pay for transportation. Some accessibility enhancements would include translations, text-to-speech and detailed information about how to navigate a transit facility in a wheelchair.
Action: The Joint Transportation Committee (JTC) should complete their study that assesses opportunities to improve rural broadband service • Timeframe – Short-range (1-3 years)
• Deliverable – JTC conducts a study to assess broadband needs (published by January 1, 2022).
In rural areas with limited internet coverage, it is hard for people with mobility barriers to access wayfinding and rider support services. By expanding fiber optic broadband access and wireless infrastructure, rural transportation providers and mobility managers can better leverage internet-based information and wayfinding services.
House Bill 1457 directed a JTC study to assess statewide broadband needs and identify opportunities for state highway right-of-way to aid in expanding broadband infrastructure to areas where service is lacking. The study will help identify where utility
providers should prioritize broadband investments and inform potential WSDOT policy changes that promote broadband expansion.
Action: State agencies should update policies to support rural broadband expansion based on findings from the JTC study to assess broadband needs • Timeframe – Mid-range (3-6 years)
• Deliverable – WSDOT updates utility policies.
WSDOT will begin updating its utility policies based on findings from the JTC study to assess broadband needs.
WSDOT utility engineers and real estate services will support the expansion of broadband services in rural areas by increasing flexibility in state utility policies and utility providers’ access to the state highway right-of-way.
Action: WSDOT should provide technical support to transportation service providers to update data standards and provide data that meets these standards • Timeframe – Short-range (1-3 years)
• Deliverable – WSDOT and public transportation and nonprofit providers supply data that meets updated standards.
Updated data and standards will help improve coordination between providers and create a more user-friendly environment for riders as they plan, book and pay for their trips. They also present opportunities to make transportation more accessible for people who need specialized services by integrating features like text-to-speech, accessibility information and translations.
Action: Public transportation providers should provide peer support to collaborate and develop regional fare programs • Timeframe – Long-range (6-10 years)
• Deliverable – Public transportation providers continue to provide and expand technical assistance for regional transportation programs that make switching between transit providers easier for riders with special transportation needs.
P A G E 6 7
Riders with mobility barriers often report that switching between providers on a trip is a major quality-of-life barrier. Switches generate longer wait times, additional coordination around eligibility, missed rides and increased costs if providers use different fare payment systems.
Regional reduced fare policies and agreements help streamline transfers by automatically qualifying riders for a discount rate on fares set by each transit agency.
Strategy 5: Improve access to transit and on-demand mobility for people with mobility barriers
Action: WSDOT, local jurisdictions and transit agencies should invest staff resources to emphasize universal access, rider comfort and safety in planning, project development, scoping, design and delivery of transit stops • Timeframe – Short-range (1-3 years)
• Deliverable – The state and public transportation partners will continue to coordinate on issues of transit stop rider comfort and safety identified in WSDOT’s Active Transportation Plan.
Transit stops are vital in connecting individuals to destinations like work, school, and other essential services. Riders with mobility barriers should have an increased voice in the design and planning of transit stops and their accessibility. Coordination across state agencies, local jurisdictions, and transit agencies should continue to seek ways to implement rider comfort and safety treatments for these riders. This may be emphasized at the planning, project scoping, design or delivery phases of projects. The WSDOT Active Transportation Plan includes goals and strategies on coordination that public transportation partners can continue to execute and build upon. The WSDOT Multimodal Technical Forum is another example of a valuable coordination resource in this effort.
Action: Government agencies and other transportation service providers should include considerations for people with mobility barriers in grants, programs and policies that relate to mobility on demand and first/last-mile to transit connections
• Timeframe – Short-range (1-3 years)
• Deliverable – WSDOT’s new First Mile/Last Mile Connections grants and related programs and policies will go through an equity review with external stakeholders through the Transportation Demand Management Technical and Executive committees.
WSDOT’s Public Transportation Division often oversees new grants programs and policies that may seek to address first/last-mile connections to public transportation. The division will work with transportation partners through the Transportation Demand Management Technical and Executive committees and the Grants Program Advisory Consultation group to include people with special transportation needs during the design and deployment of these programs.
Action: WSDOT and transit agencies should pilot the use of vanpools program flexibility for non-work trips (e.g., groceries, medical appointments, training and education) • Timeframe – Short-range (1-3 years)
• Deliverable – WSDOT and transit agencies pilot the use of vanpools for non-work trips.
Vanpool policies have historically limited use of vanpool vehicles to commute trips. By opening vanpools to human services, the state can better leverage existing vehicle fleets for multiple purposes. Recently, Substitute House Bill 1514 in passed in 2021 and reduced the required number of occupants for vanpools, but there is room to push for even more flexibility on trip purpose.
Strategies and actions requiring further legislative direction Not all strategies and actions that this plan identifies can be implemented immediately. The following will require additional direction and legal support from the Legislature, as well as coordination with various local jurisdictions, transportation providers and human services providers across the state.
Despite these challenges in implementation, stakeholders clearly identified these strategies and actions as high-priority ways to address the unmet needs in human services transportation.
P A G E 6 8
Strategy 6: Maintain and expand services for people with mobility barriers
Action: Communities should maintain existing public transportation services, including paratransit and human services transportation. To do so, additional federal, state, and/or local funded is needed. • Timeframe – Short-range (1-3 years)
• Deliverable – Public transportation providers will produce a report on unmet public transportation needs and continue to report costs and performance.
The costs to deliver existing human transportation services continues to grow. Existing services and programs will need additional funding to sustain current service levels.
Action: Communities should expand public transportation services to improve mobility for people with mobility barriers. To do so, additional federal, state and/or local funding is needed. • Timeframe – Short-range (1-3 years)
• Deliverable – Public transportation providers will produce a report on unmet public transportation needs and continue to report costs and performance.
• Deliverable – Public transportation providers will pursue a community of practice to learn from one another and better meet the needs of low-income communities.
Unmet public transportation needs exist across the state that affect both riders and providers. Even with various subsidy and discount programs for people living in poverty such as Medicaid and discounted fare requirements, the cost of transportation is still too high for many. Some transit agencies have fully implemented fare-free transit programs and might provide additional support, through a community of practice, for other providers who want to implement similar programs.
Many low-income riders work late at night or early in the morning when transit is not available. Without additional funding, transit providers will not be able
to extend their service hours without reducing their current service levels. This action would require sustainable funding, rather than a pilot program, to ensure its success.
Similarly, rural communities are more spread out, which increases the operational costs for providers. These providers need more funding to ensure a basic level of service across rural communities in Washington. With many human services sited in urban areas, rural residents rely on improved connections between rural and urban areas.
Accessible transit facilities are also critical for the success of human services transportation. If riders cannot access transportation facilities or bus stops, they cannot use the transportation services. Accessible multimodal connections are essential for serving riders with special transportation needs. Depending on who owns the land, local jurisdictions and transit agencies will need funding to improve stops and stations.
Lastly, Medicaid reimbursement rates are relatively low in Washington. This results in NEMT providers turning down some of the most expensive trip types that require specialized equipment and in-vehicle care. A higher reimbursement rate would help cover these costs and expand access to vital transportation and healthcare services.
Action: Communities should expand access to transportation services for people with mobility barriers and improve the efficiency of public transportation services by expanding mobility management and coalitions. To do so, additional federal, state and/or local funding is needed. • Timeframe – Short-range (1-3 years)
• Deliverable – Create and/or identify a dedicated funding source for mobility management.
Mobility management groups and coalitions support transportation providers and riders depend on mobility management for wayfinding and information referral services. Mobility managers could provide these services to more riders if provided additional funding.
P A G E 6 9
Action: Communities should improve emergency response planning for people with mobility barriers. To do so, additional federal, state and/or local funding is needed. • Timeframe – Short-range (1-3 years)
• Deliverable – Develop a community of practice around emergency management in human services transportation.
Certain demographic groups are more vulnerable during an emergency. Through additional collaboration, mobility management groups, human services providers, transportation providers and emergency management providers could better address the needs of these groups.
While one such model already exists in the Puget Sound (e.g., Regional Alliance for Resilient and Equitable Transportation – King County Mobility Coalition), additional funding is needed to create similar emergency management collaboration across the state.
Action: Transportation providers should provide data and technology that makes it easier for people with mobility barriers to plan, book and pay for public transportation. To do so, additional federal, state and/or local funding is needed. • Timeframe – Mid-range (4-6 years)
• Deliverable – Data standards to enable additional functionality, expanded data sets that include information like accessibility features and eligibility info, mechanisms to store and provide access to data, and software and hardware for agencies to include booking and payment technology.
Advancing data sets, standards, systems, and equipment will improve transportation access for people with mobility barriers by making it easier to plan, book and pay for trips. Examples include general transit speed specification flex, general on demand feed specification, and application protocol interfaces or data repositories. In addition to providing accessibility features like text-to-speech and translations, expanded use of technology will enhance efficiency for public transportation providers.
P A G E 7 0
CHAPTER 4: COVID-19 RESPONSE
While writing this plan, something unprecedented happened: on January 21, 2020, the Centers for Disease Control and Prevention (CDC) confirmed the first U.S. case of COVID-19 in Washington state. The virus continued to rapidly spread across the entire nation and created immense change, including to the transportation system.
The COVID-19 pandemic presented many challenges for Washington’s transportation system. Despite the challenges, transportation providers, community-based organizations, nonprofits and government agencies found ways to ensure mobility across the state. They worked together to provide Washington residents with transportation to essential medical appointments, jobs, food banks, shopping and other services.67
When faced with dramatic reductions in ridership during Gov. Inslee’s “Stay Home, Stay Healthy” order, many transportation providers across the state quickly shifted from providing rides to delivering essential goods and services. All transportation providers adapted their service in some way to maintain safety for their drivers and passengers.
This section focuses on how Washington’s transportation providers adapted to the pandemic. The following stories illustrate modifications and accommodations providers implemented during the pandemic to ensure driver and rider safety, and how these changes may affect the state’s transportation system in the future and during the next emergency.
WSDOT reviewed examples of innovation during the pandemic. Readers should note that the following examples are not an exhaustive accounting of the work that providers around the state performed for their communities. Several themes emerged:
• Safety and sanitation
• Fare structuring and collection
• Scheduling and staffing
• Strategic scheduling, use of assets and staffing
• Meal and prescription delivery
• Communication
• Vaccine access and distribution
Safety and sanitation During the pandemic, the first area of concern for transportation providers was safety for drivers and riders. Providers set out to solve various pandemic-related safety problems, including:
• Keeping drivers safe and physically distanced from riders while boarding and exiting vehicles.
• Sanitizing vehicles.
• Helping riders maintain distance from one another.
P A G E 7 1

Island Transit, which serves Whidbey and Camano Islands, installed custom Plexiglas shields in their buses to create a safe barrier between drivers and riders. While a commercially made option would have taken many weeks, it took Island Transit only five days to install shields on 12 buses once the design was ready. In Walla Walla, Valley Transit also installed custom Plexiglas barriers on all paratransit buses, as well as vapor guards on trolleys.
In addition to creating safe barriers for drivers, comprehensive sanitation procedures became crucial and fundamental to providers’ operations, especially paratransit. Virtually all providers in Washington instituted new, enhanced sanitation practices. These practices included more frequent or daily deep cleaning of vehicles, use of mask and face shields for drivers, and spacing out seating areas for riders. Many providers also encouraged and enforced mask wearing for riders through safety-conscious signage. On January 29, 2021, the CDC required mask wearing on all public transportation vehicles.
Fare structuring and collection Most transportation providers suspended fare collection at some point during the pandemic. These suspensions reduced contact between drivers and riders.
In many cases, providers paired suspended fare collection with rear-door-only boarding for further protection. The combination of these efforts helped create a safer environment for drivers and riders, keeping public and human services transportation a viable option for getting people where they need to be.
As they implemented the safety and sanitation measures described in the previous section, many providers were able to safely resume fare collection and front door boarding. Within three months of the “Stay Home, Stay Healthy” order, many transit providers who had suspended fare collection for safety reasons were able to resume collecting fares.
Strategic scheduling, use of assets and staffing
Transportation providers also addressed safety during the pandemic by updating their services and schedules.
Although ridership and revenue fell when many people began working from home and commuting less, riders still needed access to transportation for essential trips to jobs and services across the state. In response, Intercity Transit, Tran-Go, Twin Transit, Valley Transit and Whatcom Transit Authority replaced their fixed-route service with a fully demand-response model. River Cities Transit adjusted their service specifically to help riders to pick up meals at various sites like the Salvation Army and senior centers. These service changes saved money and better accommodated essential trips.
Providers also extended their normal wait times on paratransit to accommodate seniors who needed to pick up food or prescriptions.
Community Transit made the most of its fleet during the pandemic. The agency continued its bus-rapid-transit service on highly traveled routes, while bringing smaller vehicles into service to accommodate social-distancing requirements on routes with less ridership. Other transit agencies, such as Intercity Transit, implemented right-sizing strategies to free up paratransit buses, community vans and even vanpool vans to provide on-demand rides or meal delivery and prescription delivery, as discussed in the following section.
Providers also found unique ways to use their staff and resources more effectively, especially during the onset of the pandemic. When the pandemic reduced the daily number of drivers needed for operations, Jefferson Transit coordinated with its union to allow unassigned drivers to perform other tasks that kept them working. The new work included landscaping, maintenance and cleaning. Some drivers mowed lawns at park and rides. Others painted parking lots, lines, curbs, and even the lunchroom and bathrooms. The adjustment of duties allowed the transit agency to retain its experienced staff, who were able to return quickly to duty when regular service resumed.
Transportation providers expedited planning, routing and other time-intensive processes that often take months or years. One transit planner said, “I’ve never seen system changes happen so quickly in more than 30 years of working in this industry. We didn’t believe it was possible before COVID.”
P A G E 7 2

Meal and prescription delivery Longstanding coordination between transportation providers and community-based organizations played a significant role in providing large-scale food and prescription delivery during the pandemic.
People who depend on paratransit and other human services programs for access to meal programs, food banks and other food-related needs felt the early effects of the pandemic most acutely. Without the ability to transport themselves and limited information about the virus, these vulnerable groups needed extra resources and large programmatic changes to ensure their safety and mobility.
In Thurston County, Intercity Transit reassigned their community vans (normally a volunteer driver program) to local food banks for meal delivery. This type of load-spreading strategy allowed providers to rapidly adjust to the changing needs of the people they serve.
Snoqualmie Valley Transportation worked closely with Mt. Si Senior Center to transport meals that the center normally served in person. The partnership delivered food to seniors across Snoqualmie Valley in east King County. The partnership was also able to perform safety and wellness checks for the community.
In Pierce County, existing programs such as the Puget Sound Educational Service District’s Road to Independence made their drivers and vehicles available to Pierce County Human Services. This coordination resulted in Road to Independence drivers delivering meals to county residents. Pierce County Human Services used another existing partnership in between its Beyond the Borders program and Catholic Community Services’ Meals on Wheels program. In this effort, Beyond the Borders drivers made meal deliveries to Meals on Wheels participants.
In central Washington, drivers for People For People took the initiative to get their food handler permit and to date have delivered more than 3,500 meals to homebound seniors.
Twin Transit in Lewis County took part in a rapid response community services coalition with Lewis County Seniors and United Way to tackle the issue of
getting meals to seniors. Lewis County Seniors made the meals, United Way handled volunteer recruitment and fundraising, and Twin Transit managed delivery and logistics. Under this collaborative model, the group was able to meet rapidly expanding need, growing to serve more than 650 seniors 4,600 meals per week.
Ben Franklin Transit coordinated with local food banks for fare-free, drive-through events where riders could hop on a bus to one of four donation centers in the area and pick up food supplies. For those in need – particularly people with low incomes or without access to a vehicle – these services continue to provide options for to feeding their families. Establishing these partnerships was essential in facilitating a quick and efficient pivot to serve vulnerable populations with meal, prescription and essential deliveries during the pandemic. Partnerships implemented these strategies in much less than a year’s time, and most within a month of the start of the pandemic.
Communication Transportation providers relied heavily on communication tools during the pandemic. With extensive changes underway each month, transit agencies used technology to keep employees and riders informed of cancellations, service changes, cleaning policies, fares and re-routing.
Providers used digital marketing tools like email, social media and online open houses. They also developed COVID-19-specific graphics for buses, transit centers and bus stops. These communications played a central role in letting riders know that providers had implemented safety and sanitation procedures and requirements to keep riders and drivers safe. They also helped riders understand how these changes affected boarding routines, seating and schedules.
Leveraging a variety of communication tools to keep the public and employees informed was essential to keeping buses on the road, serving communities and ensuring the safety of passengers.
P A G E 7 3

Vaccine access and distribution In addition to the food-, prescription- and services-related aspects of their pandemic response, agencies and organizations found another opportunity to serve their communities by pivoting their services once again to provide rides to vaccination sites.
Many providers, already experienced in the shift from providing rides to providing services found they could easily adapt to the needs of the public and find ways for customers to get to vaccine sites, in many cases ensuring equal access for those who live in rural areas, do not have internet access, or lack reliable transportation.
Sound Transit offered free rides on Link Light Rail to the largest congregate vaccination site in the nation at Lumen field and to sister sites in Rainier Beach and Burien.68
The Snohomish Health District working in concert with the Snohomish County Transportation Coalition and the State Department of Health provided an interactive map to local vaccination sites, with links to transportation options.
Some transit agencies, such as Link Transit in Chelan and Douglas counties, provided dedicated shuttles for people who were unable to drive. These shuttles allowed people to travel from a central location to a clinic, where patients transferred from bus to golf cart to get their shot.
The King County Mobility Coalition and the State Department of Health both offered guidance for providing transportation to vaccine sites.
People For People created documentation to assist with vaccine appointment booking.
Many other providers across the state, from Garfield County Public Transportation Authority in southeastern Washington to Whatcom Transportation Authority in northwestern Washington, found ways to improve vaccination site awareness and access for their communities.
Applying lessons learned If there are lessons learned from the pandemic, they can be summed up in the themes of resiliency, creativity and service.
The pandemic offered transportation providers an unprecedented opportunity to use innovative strategies to serve people with special transportation needs. The term “essential trip” has become a part of the transportation mission and lexicon. Providers use the term to assure the public that they will be able to obtain transportation to and from essential destinations in a safe, secure manner, particularly destinations related to employment, healthcare and food.
The flexibility of transportation providers working in concert with WSDOT played a major role in keeping Washingtonians moving during a national crisis. For the front-line employees, the emphasis on sanitation and safety resulted in many changes for drivers and riders alike. WSDOT also helped facilitate this flexibility through its grant programs like the Rural Mobility Grant and CARES Act funds.
Additionally, the pandemic forced many providers to realign their budget priorities and service delivery models, often overnight. While suspending fare collection, providers also began transporting goods and services, rather than just riders. This change helped keep vulnerable populations safe and was only possible through coordination and strong partnerships in the human services sector.
Transportation providers rose to these challenges and developed new ways of solving problems during the COVID-19 pandemic. Their ability to adapt quickly was essential in keeping communities healthy and moving. Transit agencies and their partners have become more resilient during this time, doing more with less, finding creative solutions and serving their communities in life sustaining ways. While the pandemic is not over as of the writing of this section, it goes without saying that transportation in the state will never be the same.
P A G E 7 4
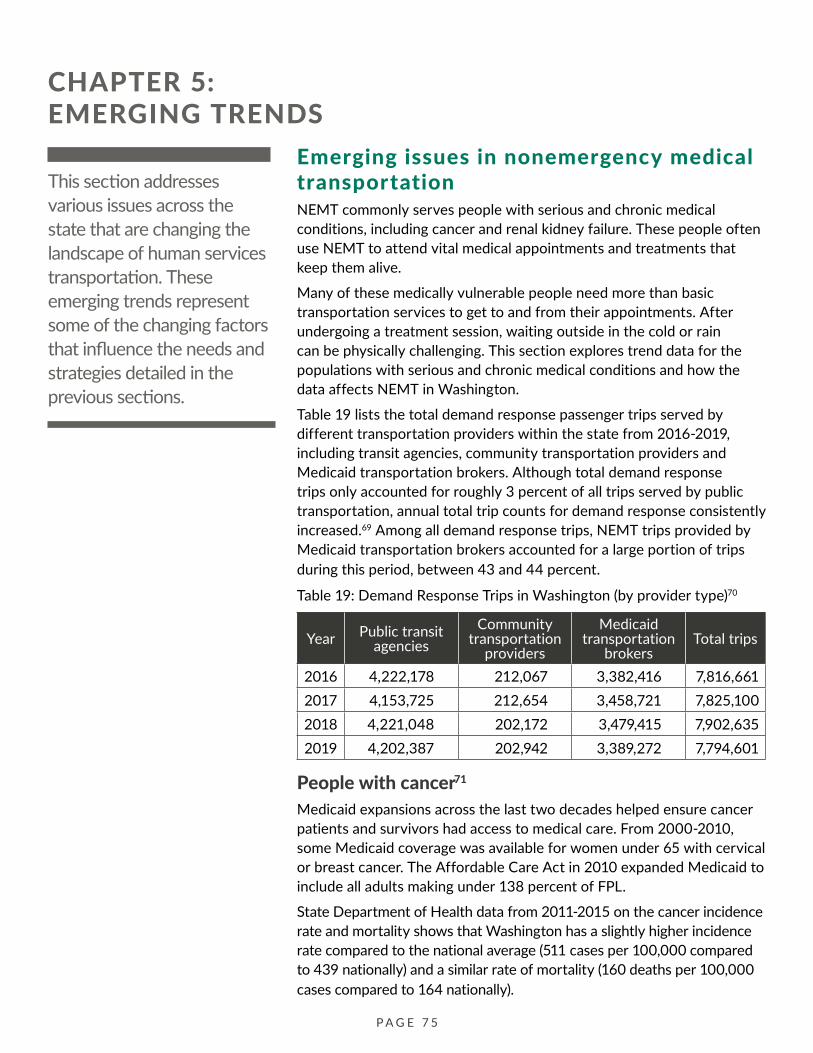
CHAPTER 5: EMERGING TRENDS
This section addresses various issues across the state that are changing the landscape of human services transportation. These emerging trends represent some of the changing factors that influence the needs and strategies detailed in the previous sections.
Emerging issues in nonemergency medical transportation NEMT commonly serves people with serious and chronic medical conditions, including cancer and renal kidney failure. These people often use NEMT to attend vital medical appointments and treatments that keep them alive.
Many of these medically vulnerable people need more than basic transportation services to get to and from their appointments. After undergoing a treatment session, waiting outside in the cold or rain can be physically challenging. This section explores trend data for the populations with serious and chronic medical conditions and how the data affects NEMT in Washington.
Table 19 lists the total demand response passenger trips served by different transportation providers within the state from 2016-2019, including transit agencies, community transportation providers and Medicaid transportation brokers. Although total demand response trips only accounted for roughly 3 percent of all trips served by public transportation, annual total trip counts for demand response consistently increased.69 Among all demand response trips, NEMT trips provided by Medicaid transportation brokers accounted for a large portion of trips during this period, between 43 and 44 percent.
Table 19: Demand Response Trips in Washington (by provider type)70
Year Public transit agencies
Communitytransportation
providers
Medicaid transportation
brokers Total trips
2016 4,222,178 212,067 3,382,416 7,816,661 2017 4,153,725 212,654 3,458,721 7,825,100 2018 4,221,048 202,172 3,479,415 7,902,635 2019 4,202,387 202,942 3,389,272 7,794,601
People with cancer71
Medicaid expansions across the last two decades helped ensure cancer patients and survivors had access to medical care. From 2000-2010, some Medicaid coverage was available for women under 65 with cervical or breast cancer. The Affordable Care Act in 2010 expanded Medicaid to include all adults making under 138 percent of FPL.
State Department of Health data from 2011-2015 on the cancer incidence rate and mortality shows that Washington has a slightly higher incidence rate compared to the national average (511 cases per 100,000 compared to 439 nationally) and a similar rate of mortality (160 deaths per 100,000 cases compared to 164 nationally).
P A G E 7 5
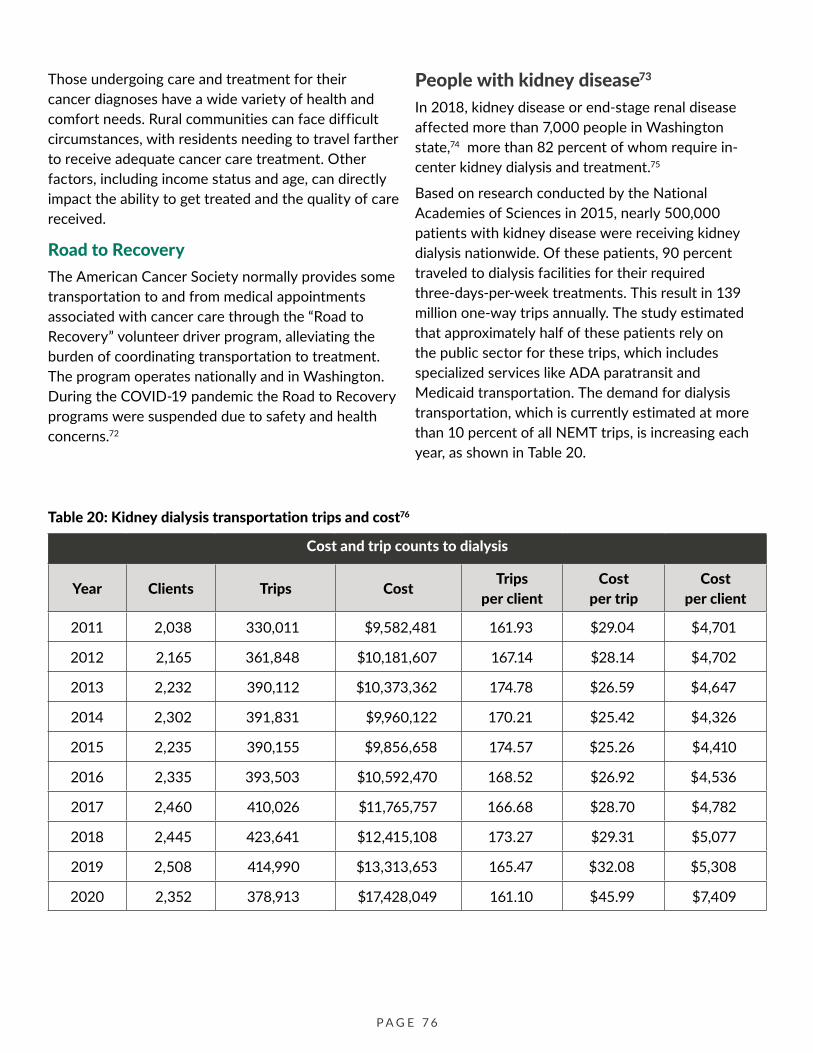
Those undergoing care and treatment for their cancer diagnoses have a wide variety of health and comfort needs. Rural communities can face difficult circumstances, with residents needing to travel farther to receive adequate cancer care treatment. Other factors, including income status and age, can directly impact the ability to get treated and the quality of care received.
Road to Recovery The American Cancer Society normally provides some transportation to and from medical appointments associated with cancer care through the “Road to Recovery” volunteer driver program, alleviating the burden of coordinating transportation to treatment. The program operates nationally and in Washington. During the COVID-19 pandemic the Road to Recovery programs were suspended due to safety and health concerns.72
Table 20: Kidney dialysis transportation trips and cost76
People with kidney disease73
In 2018, kidney disease or end-stage renal disease affected more than 7,000 people in Washington state,74 more than 82 percent of whom require in-center kidney dialysis and treatment.75
Based on research conducted by the National Academies of Sciences in 2015, nearly 500,000 patients with kidney disease were receiving kidney dialysis nationwide. Of these patients, 90 percent traveled to dialysis facilities for their required three-days-per-week treatments. This result in 139 million one-way trips annually. The study estimated that approximately half of these patients rely on the public sector for these trips, which includes specialized services like ADA paratransit and Medicaid transportation. The demand for dialysis transportation, which is currently estimated at more than 10 percent of all NEMT trips, is increasing each year, as shown in Table 20.
Cost and trip counts to dialysis
Year Clients Trips Cost Trips per client
Cost per trip
Cost per client
2011 2,038 330,011 $9,582,481 161.93 $29.04 $4,701
2012 2,165 361,848 $10,181,607 167.14 $28.14 $4,702
2013 2,232 390,112 $10,373,362 174.78 $26.59 $4,647
2014 2,302 391,831 $9,960,122 170.21 $25.42 $4,326
2015 2,235 390,155 $9,856,658 174.57 $25.26 $4,410
2016 2,335 393,503 $10,592,470 168.52 $26.92 $4,536
2017 2,460 410,026 $11,765,757 166.68 $28.70 $4,782
2018 2,445 423,641 $12,415,108 173.27 $29.31 $5,077
2019 2,508 414,990 $13,313,653 165.47 $32.08 $5,308
2020 2,352 378,913 $17,428,049 161.10 $45.99 $7,409
P A G E 7 6
Seniors and the aging population State population trends demonstrate an expanding share of people 65 and 85 or older. As these groups increase in size, more Washington residents will experience limitations to mobility and become eligible for human services. This trend will likely increase the demand for NEMT over time.77
Age 65 or older In 2019, more than 1.2 million (16 percent) people in Washington population were 65 or older, 1 percent higher than the U.S. average. This number is estimated to climb to 1.7 million (2 percent) in 2025, and to more than 2 million (22 percent) by 2040. Over the next 20 years, more than one in five Washingtonians will be over 65 and eligible for various human services transportation programs.
Some coastal counties, like Jefferson, Wahkiakum and San Juan, have larger proportions of seniors with as many as one third of the population over 65.
While much of the focus of this plan is on people over 65 due to the various eligibility requirements associated with age, it’s important to note that many 65-year-old Washingtonians are still quite active and mobile.
Age 85 or older Across the state, the general population is getting older over time, albeit gradually. From 2010 to 2019, the proportion of people 85 or older grew by a tenth of a percent (from 1.7-1.8 percent).78 The population density map in Figure 21 shows that urban areas in the central Puget Sound, Clark County and Spokane County have the largest numbers of people over 85 years old.
Looking at the percentages of people 85 and older (Figure 21) shows that, even though areas with metropolitan job centers have larger numbers of older adults, they also attract large amounts of younger working-age professionals. This makes the proportion older adults in metropolitan areas lower when compared to more rural areas of the state. The following parts of the state have the highest proportion of older adults:
• Clallam and Jefferson counties on the Olympic Peninsula.
• Lewis and Wahkiakum counties in southwest Washington.
• Walla Walla, Columbia and Garfield counties in southeast Washington.
As people reach age 85 and older, they are more likely to require additional assistance for their mobility needs, including relying on family members for rides, using assistive devices and working with personal assistants. They are also more likely to have chronic medical conditions that necessitate recurring doctor’s appointments and access to healthcare facilities.
As a result, it will become increasingly important for transportation providers to track the number of people over 85 in their region, particularly for counties that already have a large proportion of senior residents.
The aging population will require more assistance to support a high quality of life and will likely increase the demand for programs like Medicare and other nonemergency medical transportation services.
New mobility services for NEMT trips As many as 30 percent of patients nationwide skip doctor appointments and transportation is cited as a key reason for missed appointments, although this number does vary considerably around the country.79
These no-shows cost the healthcare industry $150 billion in lost revenue annually, as unused time slots cost a doctor an average of $200.80
Some transportation network companies are trying to supplement the transportation network to lower the transportation barrier to medical appointments. For example, Lyft, a rideshare company that operates in Washington and across the country, has participated in pilot programs that provide NEMT trips.81
State governments that are lowering NEMT regulations can save costs and increase the driver supply to better meet demand, while also reducing transportation barriers. However, hidden or multi-layered costs and risks may exist, such as the lack of accessible vehicles or disability assistance trained drivers. In one example, California responded by
P A G E 7 7

Figure 20: Population density of people over 85 years old by county
Figure 21: Percent of people over 85 years old by county
P A G E 7 8
establishing a tax on transportation network company rides to pay for wheelchair accessible rides.82
Rising healthcare expenses From 2001 to 2017, average total cost for healthcare increased by 87 percent in Washington state, while the average median income only increased by 41 percent.
For instance, in 2017, for a household with two adults, one school-age child and one preschooler in Yakima, healthcare expenses account for 15 percent of total household expenses. As the costs of healthcare continue to rise beyond salaries, many Washingtonians may struggle to afford both their healthcare and their medical transportation costs.83
Emerging technology trends Technology is a critical tool to support and enhance human services transportation in Washington. Many new technologies and systems have the potential to expand access to transportation, improve awareness of services and programs, and help coordinate services between providers.
Autonomous vehicles Autonomous vehicles present a new slate of opportunities and challenges in human services transportation.
For people who cannot operate a vehicle themselves, autonomous vehicles could result in better access to various human services like medical appointments and jobs. Additionally, autonomous vehicles may create a safer road system if the technology can reduce crashes caused by human error.
As the technology continues to advance, legislators and public officials will need to consider factors affecting human services transportation:
• If autonomous vehicles are more expensive, people with lower incomes may not be able to afford to use them.
• Some autonomous vehicles will need equipment to accommodate people with special transportation needs.
• Autonomous vehicles may increase access to single-occupancy vehicles and ultimately increase congestion, vehicle miles traveled and emissions.
• Autonomous vehicles cannot replace the direct care of personal assistants. Individuals with mobility impairments may still need additional support to get from their home into the vehicle, from the vehicle to their destination and for other aspects like checking in to a medical appointment.
• To serve people with special transportation needs, autonomous vehicles must be ADA compliant and accessible to people with special transportation needs, even factoring in drop off and pickup area accessibility and connectivity to public transit.
By building a policy framework around equity, autonomous vehicles can help improve mobility for people with special transportation needs.
Broadband access With the growing role of internet access in work, education, healthcare and many other facets of life, there is increasing focus in expanding broadband utility infrastructure to increase internet access across the state.
While the internet itself is no longer an emerging trend, the ongoing COVID-19 pandemic has pushed the expansion of broadband infrastructure to the forefront of policy and planning across the nation. The passage of the Statewide Broadband Act by the Washington State Legislature created the Governor’s Statewide Broadband Office. The act is focused on “expanding affordable, resilient broadband service to enable economic development, public safety, health care, and education in Washington’s communities.” The act also establishes specific goals for incrementally increasing broadband speeds until all Washington businesses and residents have access to both upload and download speeds of 150 megabits per second by 2028. The Statewide Broadband Office collaborates with the State Public Works Board and Utilities and Transportation Commission to meet these goals.
Several strategies and goals in this plan will depend on the network infrastructure of broadband providers. The Statewide Broadband Office’s work will be critical in advancing transportation technology strategies and in meeting the transportation needs of all Washingtonians. Examples include emergency
P A G E 7 9

preparedness and planning, connected autonomous vehicle infrastructure, telehealth, real-time information systems for riders and one-call one-click programs.
Real-time information systems Real time information systems are programs, typically smartphone applications, which provide up-to-date transit information to riders. Most real-time information systems take the guess work out of scheduling a trip by providing updates on bus location, expected pickup times and any delays on the route.
While many urban areas in the state already have some form of real-time information connected with transit systems, many rural areas lack the critical communications infrastructure to support this technology. Without internet access, most real-time information systems in rural areas are hard to use.
Data standardization for transportation providers With all the different transportation modes and service models, various transportation providers, and layers of eligibility requirements, planning a trip is complicated and hard to navigate for people with special transportation needs.
Data standards make it easier for riders to plan, book and pay for their transportation without being experts in human services transportation. By standardizing transit data, transportation providers and app developers can leverage new technology like smartphones, mapping tools and real-time information to better-connect riders to mobility services.
While transportation providers across the state made extensive progress in adopting data standards for fixed route transit, like GTFS and GTFS-flex mentioned in Strategy 4 there is still a lot of work to do:
• The state needs to develop tools to verify and confirm the quality of the current data standards.
• Transportation providers need to adopt additional data standards for flexible services that do not use fixed-routes or stops.
• Smaller transit providers and nonprofits need technical assistance, funding or additional staff to adopt and maintain these data standards.
• Some riders need additional data standard tools defined for their unique trip planning needs (e.g., translation tools for people who speak English as a second language, pathway navigation for people with vision difficulties).
WSDOT’s Public Transportation Division is involved in multiple data standards initiatives in the state of Washington and covering the entire west coast. The projects will help residents overcome these barriers to public transportation services by providing accessible, consistent and reliable transit data through data specifications.
New fare payment systems Over time, transportation providers adopted new innovative fare payment systems. Some public transportation providers use a plastic card that riders can load with various types of passes or simply add funds for their next trip. In some cases, transportation providers supplement their card services with a smartphone app that riders can use to pay their fare.
New fare payment systems add convenience and simplify the boarding process for many riders, but they also create some challenges in human services transportation. For example, transportation providers typically charge an up-front fee to purchase a card. This upfront fee may be cost-prohibitive and prevent riders from using the digital fare payment system. Additionally, while smartphone fare payment does not require a card, it does require a smartphone and reliable internet connection to function. Again, these types of systems may be cost-prohibitive for people with low incomes.
In rural areas of the state, people with special transportation needs often transfer between service providers. New fare payment systems make these transfers easier, but they have limitations if the providers use different systems. Additionally, unbanked riders cannot link a card to their bank account, and as a result may end up paying the full fare for both services.
P A G E 8 0

CHAPTER 6: OUTREACH AND ENGAGEMENT FOR THIS PLAN
The planning process for the Statewide HSTP involved outreach with partner organizations and agencies; transportation providers; regional, county and local governments; tribes; and riders. This section reviews the major engagement milestones, key takeaways and shows how they contributed to this plan.
Community outreach and COVID-19 The COVID-19 pandemic presented challenges for engagement. Typically, WSDOT staff seek to meet people where they are in their local communities, but this was not possible during the second phase of engagement. The shift in engagement strategies from in-person to virtual platforms led to more intimate discussions in which the planning team could focus on a more personal approach and hear lived experiences from riders and providers of human services transportation.
However, WSDOT recognizes that relying on virtual engagement may also leave out those who do not have access to the internet or are otherwise harder to reach. Additionally, virtual engagement eliminates the option of intercept outreach, which often engages people who would not seek to provide input on their own.
The COVID-19 pandemic also changed how WSDOT prioritized needs and solutions in the plan. The shift in services due to the pandemic challenged transit providers, both in rural Washington communities and in urban areas.
How community input is reflected in the plan Community input gathered from 2018 to 2020 informed the structure of the plan, the unmet needs in human services transportation, and the strategies that will help address those unmet needs.
Stories from riders and providers of human services transportation options added depth and nuance to WSDOT planners’ understanding of the current gaps in the system and how the system can be made to work better for Washingtonians.
PHASE 1: Summary of outreach from 2018-2019 WSDOT’s planners structured the first phase of engagement for this plan to understand the biggest challenges and opportunities in human services transportation.
Diverse groups of industry professionals, regional experts and several key demographic groups helped inform and guide this phase of engagement.
Human Services Steering Committee WSDOT initiated the Human Services Steering Committee in 2018. While membership changed over time, the committee was comprised of human services transportation providers and subject matter experts
P A G E 8 1

from different organizations in Washington. A full list of participating organizations is in the Executive Summary, while individual participants are listed in Appendix 3.
The committee helped guide the update of the Statewide HSTP by identifying various unmet needs in Washington, the sources of the needs (e.g., human services transportation customers, transportation providers, policy changes), and strategies to address the needs. In total, the committee identified 23 unmet needs and 49 strategies.
Statewide community engagement The Human Services Steering Committee also identified community engagement opportunities for the update of the Statewide HSTP. These included engagement with specific populations and hard-to-reach demographic groups. Based on the committee’s guidance, WSDOT hired a consultant to learn more about the unmet needs, strategies and emerging trends that mattered most to these communities and groups.84
Local plan analysis Regional and metropolitan planning organizations that receive FTA funds must plan for human services transportation in their communities. To meet this requirement, Washington’s 17 RTPOs each develop coordinated public transit-human services transportation plans. The plans identify unmet needs within their respective region, county or metropolitan area. WSDOT planners analyzed each plan and noted the trends and outliers across the local plans.
Public engagement In fall 2018, WSDOT contracted The Athena Group, LLC to lead statewide engagement efforts to inform the update of the Statewide Human Service Transportation Plan.
Athena coordinated a variety of engagement strategies, including ride-alongs with human service transportation riders and drivers, interviews with transportation and other service providers and four participatory events.
In total, the Athena Group engaged 173 community members, including 46 youth and 47 staff members
from various service-providing organizations throughout Washington state.
Ride-alongs Athena coordinated with five community transportation providers and transit agencies to travel in their transportation vehicles and lead informal conversations with riders and drivers in Pacific, Grant, Stevens, Pierce and Clallam counties. Ride-alongs took place mid-October 2018 and resulted in conversations with 22 riders and six transportation staff.
Interviews With WSDOT support, Athena coordinated 19 interviews with human service/specialized transportation providers, transportation network organizations and human services advocates. These took place from mid-October to mid-November 2018.
Athena used findings from these interviews, ride-alongs and local human service transportation plans to generate questions and statements for engagement participants to respond to with personal stories and experiences.
Conversations
In Spokane and Tacoma, Athena engaged homeless individuals and dialysis patients, respectively, in informal conversations about their current transportation options and needs. During this engagement, 36 homeless individuals and 17 dialysis patients shared their transportation stories and experiences. Additionally, one dialysis center staff and four homeless services providers shared their insights into their clients’ special transportation needs.
Participatory gatherings
Athena coordinated with local partners in Aberdeen and Brewster to facilitate participatory gatherings in December 2018. Both events were dual language and special efforts were taken to engage the Spanish-speaking community. More than 40 adults and youth participated in community-café-style conversations at St. Mary Parish in Aberdeen. In a similarly designed event at the Brewster Boys and Girls Club, 58 adults and youth participated.
P A G E 8 2

Key themes The range of thoughts and experiences with human services transportation vary as widely as the cultures and regions across Washington.
Although challenges exist between meeting special transportation needs of rural and urban residents, service providers continue to seek partnerships, creative funding and fresh solutions to maximize resources and meet as much need as possible. In the absence of available and accessible transportation services, Washington residents rely on their personal social networks, community service providers and inventive alternatives to reach their destinations and meet their basic needs. According to providers, there are multiple opportunities for state agencies like WSDOT to take on the role of “convener,” which would allow greater communication, coordination and collaboration between RTPOs, community-based organizations and local grassroots initiatives to meet transportation needs.
Because transportation plays such an important role in peoples’ lives, it is critical that transportation providers regularly and authentically connect with people in the communities they serve to understand what is working well, what gaps exist and what future steps would serve them best. By taking a whole-person and whole-family approach to engaging with their communities, human service transportation providers learn about valued resources, trusted individuals and culturally responsive processes that may be leveraged in meeting their transportation needs.
Interviews: key takeaways Based on the 19 initial stakeholder interviews and four additional provider interviews (the latter four conducted in Spokane), it became clear to WSDOT’s planners that public transit serves many people with special transportation needs, more in urban areas than rural areas. Providers seek equity in funding between rural and urban areas, in addition to greater funding and resources in both areas to maintain existing services and expand services. From the interviews, the most common factors affecting transportation decisions are cost, service hours and awareness about eligibility or how to access transportation services.
Interviewees also valued partnerships between transportation and other service providers that promote better use of provider resources and allow services to reach more people with special transportation needs.
Lastly, as mentioned previously, providers want WSDOT to play more of a convening role to promote cross-agency coordination. Several providers commented that knowing about other successful innovative transportation solutions throughout the state would better equip them to meet their regional transportation needs. The providers also highlighted the lack in coordination between healthcare, education and transportation systems, among others. Because WSDOT and other state agencies have a big-picture systems perspective, local and regional transportation and social service providers seek opportunities to access new systems information through more frequent networking events and see state agencies as filling the role of organizing these events.
Ride-alongs: key takeaways In speaking with riders and staff of transportation service providers, WSDOT’s planners learned that most of the providers’ riders learned about special needs transportation through a medical or social service provider.
Riders value personal interactions with transportation providers and seek knowledge, physical and social support from drivers.
Transportation providers also must make decisions every day between serving customers who are centrally located and those in outlying regions. This is because providers do not have enough funding, staffing or resources to meet all transportation needs.
Participatory gatherings and conversations: key takeaways Through one-on-one, small discussions and large-group conversations around Washington state, WSDOT’s planners learned about the following themes related to human services transportation.
P A G E 8 3
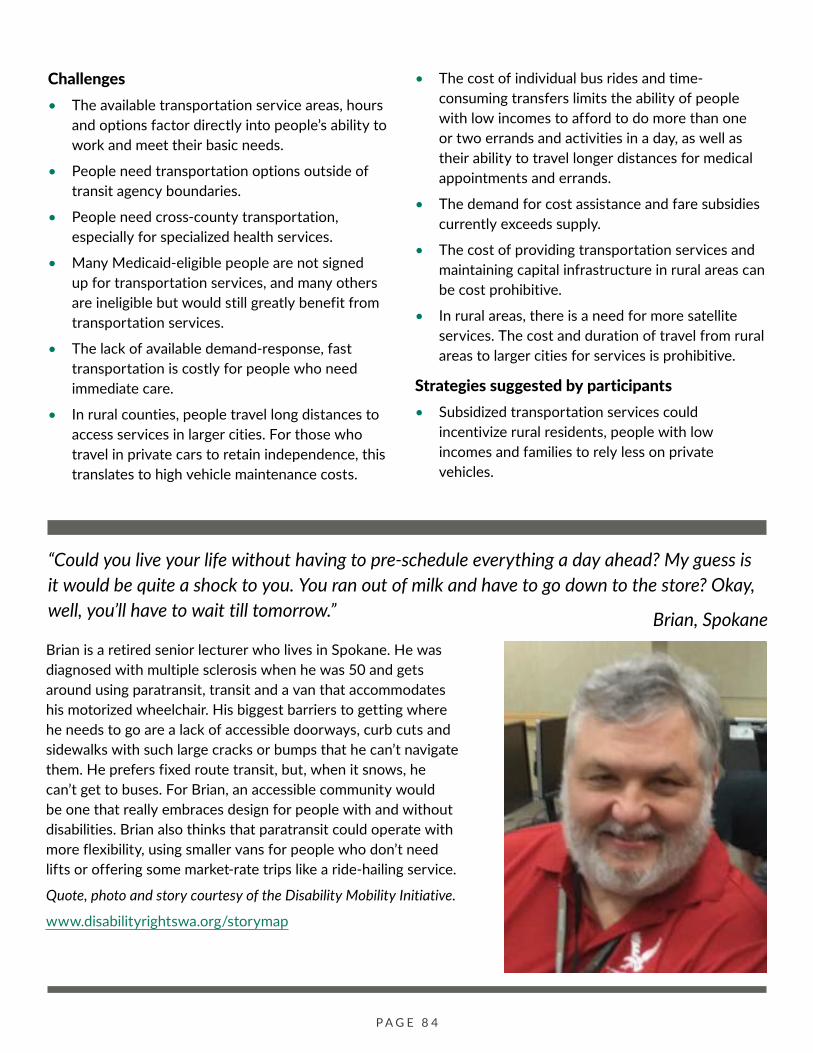
Challenges • The available transportation service areas, hours
and options factor directly into people’s ability to work and meet their basic needs.
• People need transportation options outside of transit agency boundaries.
• People need cross-county transportation, especially for specialized health services.
• Many Medicaid-eligible people are not signed up for transportation services, and many others are ineligible but would still greatly benefit from transportation services.
• The lack of available demand-response, fast transportation is costly for people who need immediate care.
• In rural counties, people travel long distances to access services in larger cities. For those who travel in private cars to retain independence, this translates to high vehicle maintenance costs.
• The cost of individual bus rides and time-consuming transfers limits the ability of people with low incomes to afford to do more than one or two errands and activities in a day, as well as their ability to travel longer distances for medical appointments and errands.
• The demand for cost assistance and fare subsidies currently exceeds supply.
• The cost of providing transportation services and maintaining capital infrastructure in rural areas can be cost prohibitive.
• In rural areas, there is a need for more satellite services. The cost and duration of travel from rural areas to larger cities for services is prohibitive.
Strategies suggested by participants • Subsidized transportation services could
incentivize rural residents, people with low incomes and families to rely less on private vehicles.
“Could you live your life without having to pre-schedule everything a day ahead? My guess is it would be quite a shock to you. You ran out of milk and have to go down to the store? Okay, well, you’ll have to wait till tomorrow.” Brian, Spokane Brian is a retired senior lecturer who lives in Spokane. He was diagnosed with multiple sclerosis when he was 50 and gets around using paratransit, transit and a van that accommodates his motorized wheelchair. His biggest barriers to getting where he needs to go are a lack of accessible doorways, curb cuts and sidewalks with such large cracks or bumps that he can’t navigate them. He prefers fixed route transit, but, when it snows, he can’t get to buses. For Brian, an accessible community would be one that really embraces design for people with and without disabilities. Brian also thinks that paratransit could operate with more flexibility, using smaller vans for people who don’t need lifts or offering some market-rate trips like a ride-hailing service.
Quote, photo and story courtesy of the Disability Mobility Initiative.
www.disabilityrightswa.org/storymap
P A G E 8 4
• In the human service transportation field, great customer service means meeting people where they are at, helping to find transportation solutions or alternatives, and providing information that explains why something is the way it is.
• People from historically marginalized communities (e.g., Spanish-speaking and low-income) desire inclusive services and engagement opportunities from transportation providers.
• Participants value clean, well-lit, well-maintained bus stops, sidewalks and surrounding areas.
• Language support is critical for Spanish-speakers in human services transportation.
• People desire safe, positive personal interactions and support when using transportation services.
• It is critical to continually reassess how well transportation and other service providers are informing the public (especially members of marginalized populations) of existing services and eligibility requirements and adjust accordingly.
• For people with low incomes, people experiencing homelessness, migrant workers, and other high-need, low-mobility populations, the timing and availability of healthcare services, vocational trainings and new job opportunities frequently conflicts with existing work and bus schedules. This points to the need for greater collaboration between transportation, social service, healthcare and economic development systems.
• People with high needs and low mobility (e.g., families with low incomes, people with severe medical conditions) would like more personalized and urgent modes of transportation such as rideshares from chemotherapy and shuttle vans to grocery stores.
• Regional providers would like to see WSDOT facilitate, incentivize and remove barriers to regional ridesharing, cross-agency collaboration and innovation.
• Human services transportation systems and resources need to be accessible in multiple formats. Users of all backgrounds, circumstances and abilities should be able to access the information and services they need.
PHASE 2: Summary of outreach from 2020-2021 In 2020, WSDOT continued statewide engagement efforts. Due to the pandemic, WSDOT prioritized the safety of community members and staff by shifting to virtual engagement opportunities. The purpose of this outreach was to inform partners and community members with special transportation needs about the progress of the Statewide HSTP update, and to give them meaningful opportunities to shape the development of the plan. During this time, WSDOT continued meeting with the Human Services Steering Committee as a resource to inform the plan. Staff also hosted three stakeholder discussion groups. Discussion group participants reviewed issues where human services transportation was not meeting the needs of riders or providers and identified possible solutions to address those needs. Finally, WSDOT held an online open house in December 2020 to share elements of the draft plan with the public and gather feedback. Through this statewide engagement, WSDOT heard that the need for human services transportation continues to exceed the available services, both in rural and urban areas. Staff listened to human services riders as they shared their experiences and heard from human services providers on ways to increase services to those who need it the most.
Stakeholder discussion groups In fall 2020, WSDOT held three facilitated discussion groups with RTPOs, human service and transportation providers, Washington tribes, and people with special transportation needs. The purpose of these discussion groups was to inform stakeholders about the progress of the HSTP update, confirm WSDOT’s understanding of the gaps the plan needed to address and discuss potential solutions to address those needs. Staff divided the conversation. In the first part, the group reviewed and discussed the gaps that WSDOT had identified through previous engagement as ongoing, unmet needs. In the second part of the discussion, participants broke into small groups to brainstorm solutions for the unmet needs. These two tables summarize the key themes from those discussions:
P A G E 8 5

Unmet Need Examples
What gaps and barriers are the most pressing in your everyday experience, or for those you serve?
• Funding/affordability issues. • Rigidity in scheduling and eligibility requirements. • Level of service issues (coverage in rural areas, integration between transit
systems, limits to on-demand services, non-commuter service hours, staffing). • Limited English proficiency.
Are there key unmet needs that WSDOT has not considered in its Statewide HSTP?
• Complicated granting process for small organizations and transit providers. • Smaller cities, counties, unincorporated areas and tribal organizations need
coordination support with local metropolitan planning organizations (MPO’s) and regional transportation planning organizations (RTPO’s) in rural areas
How has the COVID-19 pandemic heightened existing needs or created new mobility challenges?
• Shift of services to adhere to social distancing guidelines has put a strain on drivers and riders.
• Rural areas are more impacted due to lack of broadband and reduction of other social services.
Problem Statement Themes Responses
How do we bolster rural transportation service to meet the needs of residents with special transportation needs?
• Understand the specific needs of an area before trying to solve the problem. • Expand paratransit options. • Provide training and outreach to help prospective riders understand existing
services. • Empower coordinating entities in rural areas. • Provide funding for additional mobility training.
How do we improve access to non-emergency • Provide more point-to-point transportation options and flexibility. healthcare services for all • Incentivize entities to become point-to-point service provider Washington residents?
How do we expand programs for low-income individuals?
• Allow more flexible funding mechanisms. • Incentivize providers to make ride-sharing easier. • Expand service areas. • Encourage innovations that make it easier for riders to make reservations. • Encourage one fare, lower fare or fare-free programs.
How can we support • Incentivize coordination between transit providers and human services better coordination agencies. between providers to increase efficiency, lower • Develop a one-pass system to eliminate the need for transfers.
their costs, and improve • Offer more flexibility in funding to allow agencies and service providers to service for riders? coordinate and share resources more easily.
How can we reduce the red tape that makes it hard for people to use human services transportation?
• Identify and amend rules that force duplication of services. • Expand service areas. • Facilitate coordination of services between service providers.
P A G E 8 6
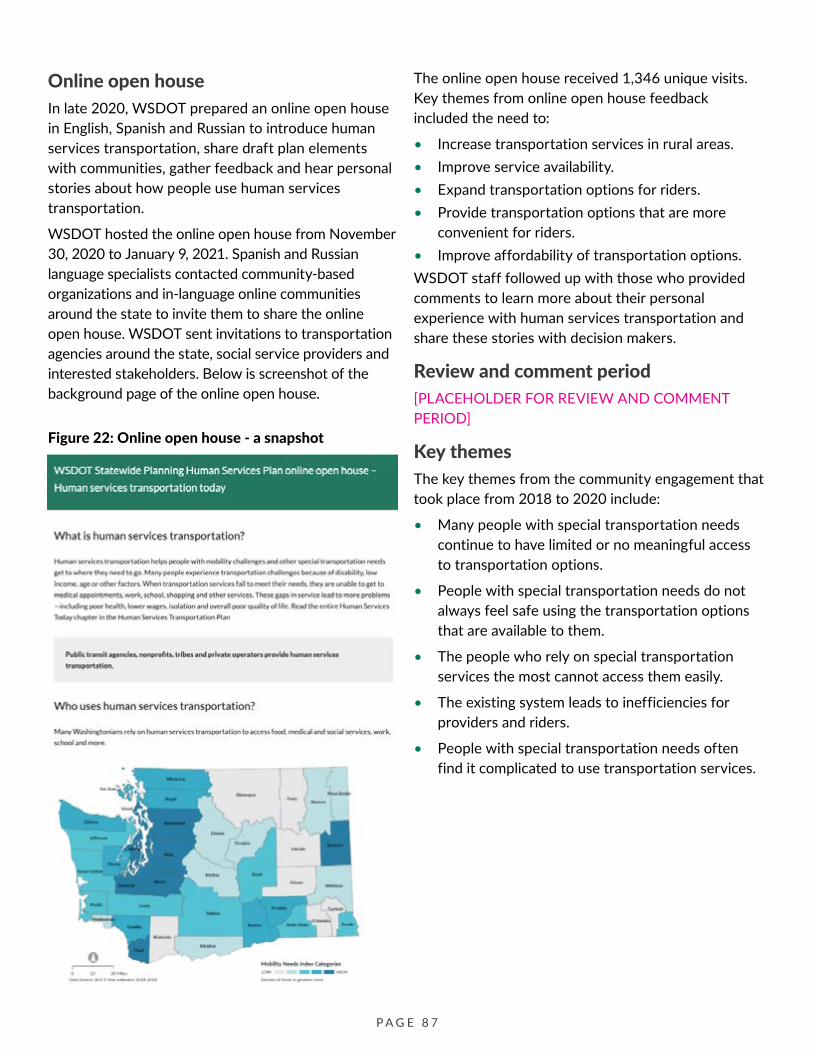
Online open house In late 2020, WSDOT prepared an online open house in English, Spanish and Russian to introduce human services transportation, share draft plan elements with communities, gather feedback and hear personal stories about how people use human services transportation.
WSDOT hosted the online open house from November 30, 2020 to January 9, 2021. Spanish and Russian language specialists contacted community-based organizations and in-language online communities around the state to invite them to share the online open house. WSDOT sent invitations to transportation agencies around the state, social service providers and interested stakeholders. Below is screenshot of the background page of the online open house.
Figure 22: Online open house - a snapshot
The online open house received 1,346 unique visits. Key themes from online open house feedback included the need to:
• Increase transportation services in rural areas. • Improve service availability. • Expand transportation options for riders. • Provide transportation options that are more
convenient for riders. • Improve affordability of transportation options. WSDOT staff followed up with those who provided comments to learn more about their personal experience with human services transportation and share these stories with decision makers.
Review and comment period [PLACEHOLDER FOR REVIEW AND COMMENT PERIOD]
Key themes The key themes from the community engagement that took place from 2018 to 2020 include:
• Many people with special transportation needs continue to have limited or no meaningful access to transportation options.
• People with special transportation needs do not always feel safe using the transportation options that are available to them.
• The people who rely on special transportation services the most cannot access them easily.
• The existing system leads to inefficiencies for providers and riders.
• People with special transportation needs often find it complicated to use transportation services.
P A G E 8 7
APPENDIX 1: ADDITIONAL DEMOGRAPHIC DATA AND ANALYSES
This appendix contains additional demographic information which supplements the data provided in the body of the plan.
Measures of poverty There are several different ways to measure poverty levels across the nation and specifically in Washington state. While this plan uses 200 percent of the Federal Poverty Level as the basis for assessing poverty, additional measures of poverty were also considered and used as supplementary research tools for this plan. • Federal Poverty Level (FPL)85 – this measure is issued by the US
Department of Health and Human Services. The FPL measures a family’s annual cash income to determine who is eligible for subsidies, programs and benefits. States often use different percentages of the FPL to measure poverty depending on their cost of living.
• Asset Limited, Income Constrained, Employed (ALICE)86 – ALICE uses a standardized set of measurements to quantify the cost of a basic household budget in each county in each state in the US, and to show how many households are struggling to afford it.
• Self-Sufficiency standard87 – the Self-Sufficiency Standard for Washington State defines the minimum income needed to realistically support a family, meeting basic needs without aid from government, community or personal aid. The basic needs include housing, childcare, food, health care, transportation and miscellaneous items. The standard is unique for each family type in each county within the State. In some counties with large income disparity, such as King County, the estimates also differ by regions within the county.
This plan uses 200 percent of the FPL as a measure of poverty because of its widespread use across the country as an eligibility requirement for many public programs and the state’s relatively high cost of living.
Accessibility is an important goal for ensuring that all types of people can efficiently get to their destination. The additional analysis below highlights accessibility to key destinations and services.
Access to transit Human services transportation helps riders get to all types of services and goods. But to make these connections, the transit services must also be accessible. Nearly 200,000 households, or 6.9 percent of all households in Washington, do not own a vehicle.88,89 Figure 23 identifies block groups, statistical divisions of census tracts that generally contain 600-3,000 people, where people can walk to their nearest transit stop within each time range. People without a vehicle, represented by dots, are overlaid with the accessibility map. The darker the color, the shorter the travel time needed, indicating easier accessibility. The unshaded
P A G E 8 8

block groups are areas where people don’t have access Access to major destinations within 20 mins. and services Roughly 55 percent of the state population lives
Access to jobs, healthcare and other essential within a 10-minute walk to a transit stop. The destinations helps ensure a high quality of life accompanying table (Table 21) demonstrates seniors, and reduces isolation for people with special Indigenous and Native American populations, veterans transportation needs. This section highlights various and people with a disability tend to live further away destination types and analyzes data to determine gaps from a transit stop than others. by demographic group and geography.
Figure 23: Estimated walking time to fixed route by transit stop
Table 21: Access to transit by demographic group
Demographics (2017 Census) Total population Percent of households within 10 min walk to transit stop
Age over 65 1,115,759 50% People of Color 1,668,930 66% Indigenous/Native American 140,825 49% Veteran 540,885 47% Low-income 1,984,415 59% People with disability 840,568 53% People with limited-English proficiency 510,969 69% Non-vehicle household 190,969 78% Total state population 7,169,967 55%
P A G E 8 9
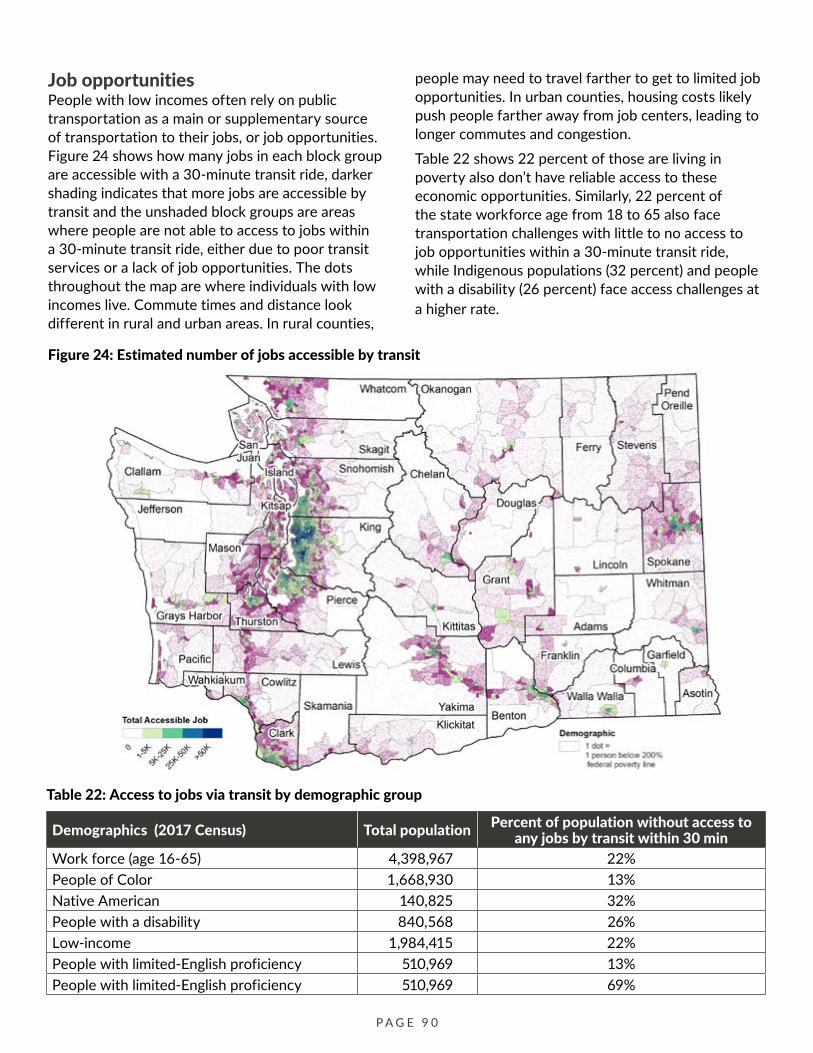
Job opportunities People with low incomes often rely on public transportation as a main or supplementary source of transportation to their jobs, or job opportunities. Figure 24 shows how many jobs in each block group are accessible with a 30-minute transit ride, darker shading indicates that more jobs are accessible by transit and the unshaded block groups are areas where people are not able to access to jobs within a 30-minute transit ride, either due to poor transit services or a lack of job opportunities. The dots throughout the map are where individuals with low incomes live. Commute times and distance look different in rural and urban areas. In rural counties,
people may need to travel farther to get to limited job opportunities. In urban counties, housing costs likely push people farther away from job centers, leading to longer commutes and congestion. Table 22 shows 22 percent of those are living in poverty also don’t have reliable access to these economic opportunities. Similarly, 22 percent of the state workforce age from 18 to 65 also face transportation challenges with little to no access to job opportunities within a 30-minute transit ride, while Indigenous populations (32 percent) and people with a disability (26 percent) face access challenges at a higher rate.
Figure 24: Estimated number of jobs accessible by transit
Table 22: Access to jobs via transit by demographic group
Demographics (2017 Census) Total population Percent of population without access to any jobs by transit within 30 min
Work force (age 16-65) 4,398,967 22% People of Color 1,668,930 13% Native American 140,825 32% People with a disability 840,568 26% Low-income 1,984,415 22% People with limited-English proficiency 510,969 13% People with limited-English proficiency 510,969 69%
P A G E 9 0

Healthcare and medical facilities Seniors rely on healthcare more and more as they age, and that reliance hinges upon easy transportation. Figure 25 shows the time it takes to access medical facilities by transit in different block groups. Seniors aged 65 or over are represented by dots. The darker shadings indicate shorter travel times are
Figure 25: Access to medical facilities by transit
needed, while the unshaded block groups indicate that people living there would need to travel for at least 60 minutes via transit to access healthcare. Table 23 breaks down access to medical facilities by demographic group, showing that less than 60 percent of seniors can access healthcare through a 30 minute or less transit trip.
Table 23: access to medical facilities via transit by demographic group
Demographics (2017 Census) Total population Percent of households within 30 min of medical facilities by transit
Age over 65 1,115,759 59% People of Color 1,668,930 73% Native American 140,825 61% Low-income 1,984,415 68% People with disability 840,568 61% People with limited-English proficiency 510,969 75% Non-vehicle household 190,969 78% Total state population 7,169,967 62%
P A G E 9 1

Medical issues and their influence on travel decisions Directed to people over 80 years old and individuals with medical conditions, one question in the NHTS asked how their medical conditions factor into their travel decisions. The most common responses demonstrate how their medical conditions and health effected their mobility: How does your medical condition effect your travel decisions? • Reduced day-to-day travel, 66 percent • Ask others for rides, 46 percent • Limited driving to daytime, 28 percent • Given up driving altogether, 21 percent • Use the bus or subway less frequently, 12 percent • Use dial-a-ride, 13 percent
• Use reduced fare taxi, 8 percent
Veteran Affairs Centers90
Veterans face unique and complex healthcare challenges. Figure 26 identifies block groups where on average, veterans can access their nearest VA center by transit within each time range. The darker the color, the shorter the travel time needed and better accessibility. The unshaded block groups are areas where veterans do not have access to a VA center within 90 minutes of transit. 46 percent of veterans don’t have access to any VA centers within 30 minutes and 21 percent of them don’t have access in 60 minutes.
Household necessities Grocery stores
Food is a basic and daily need for everyone, yet 12 percent of the Washington population faces the challenges of food insecurity. Economic and social conditions lead to limited or uncertain access to adequate food, which results in reduced quality and variety of food options, and even reduced food intake. One in nine people and one in six children in
Figure 26: Access to VA resources by transit for veterans
P A G E 9 2
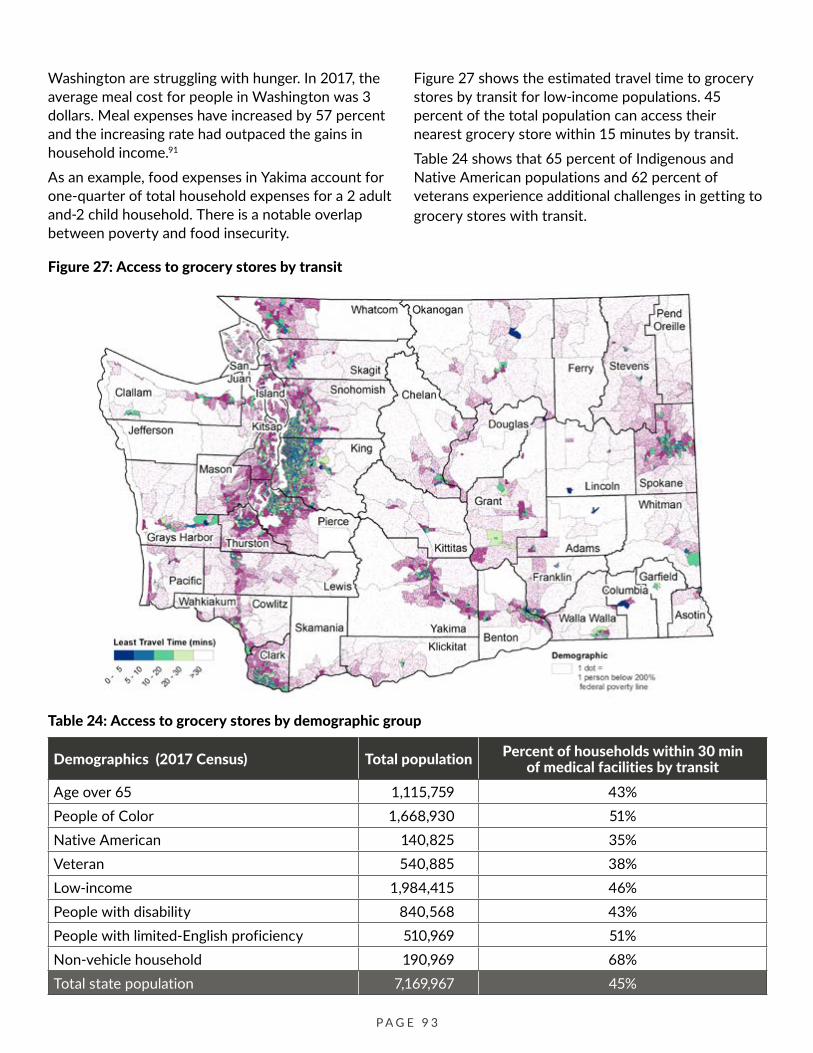
Washington are struggling with hunger. In 2017, the average meal cost for people in Washington was 3 dollars. Meal expenses have increased by 57 percent and the increasing rate had outpaced the gains in household income.91
As an example, food expenses in Yakima account for one-quarter of total household expenses for a 2 adult and-2 child household. There is a notable overlap between poverty and food insecurity.
Figure 27: Access to grocery stores by transit
Figure 27 shows the estimated travel time to grocery stores by transit for low-income populations. 45 percent of the total population can access their nearest grocery store within 15 minutes by transit. Table 24 shows that 65 percent of Indigenous and Native American populations and 62 percent of veterans experience additional challenges in getting to grocery stores with transit.
Table 24: Access to grocery stores by demographic group
Demographics (2017 Census) Total population Percent of households within 30 min of medical facilities by transit
Age over 65 1,115,759 43% People of Color 1,668,930 51% Native American 140,825 35% Veteran 540,885 38% Low-income 1,984,415 46% People with disability 840,568 43% People with limited-English proficiency 510,969 51% Non-vehicle household 190,969 68% Total state population 7,169,967 45%
P A G E 9 3

Library services There are 409 public libraries in Washington state. Figure 28 identifies block groups where on average, individuals can access their nearest library by transit within each time range. The darker shaded areas indicate higher accessibility. The unshaded block groups are areas where individuals don’t have
Figure 28: Access to libraries via transit
access. Households are shown as purple dots in the accessibility map.
Table 25 shows that only 13 percent of total population are within a 15-minute transit ride of a library. Libraries serve the public in several ways, including books, job training and employment resources, educational materials, internet access, language courses and human services resources.
Table 25: Access to libraries via transit by demographic group
Demographics (2017 Census) Total population Percent of households within 15 min of a library by transit
Age Over 65 1,115,759 12% People of Color 1,668,930 15% Native American 140,825 11% Veteran 540,885 10% Low-income 1,984,415 15% People with disability 840,568 13% People with limited-English proficiency 510,969 16% Non-vehicle household 190,969 32% Total state population 7,169,967 13%
P A G E 9 4
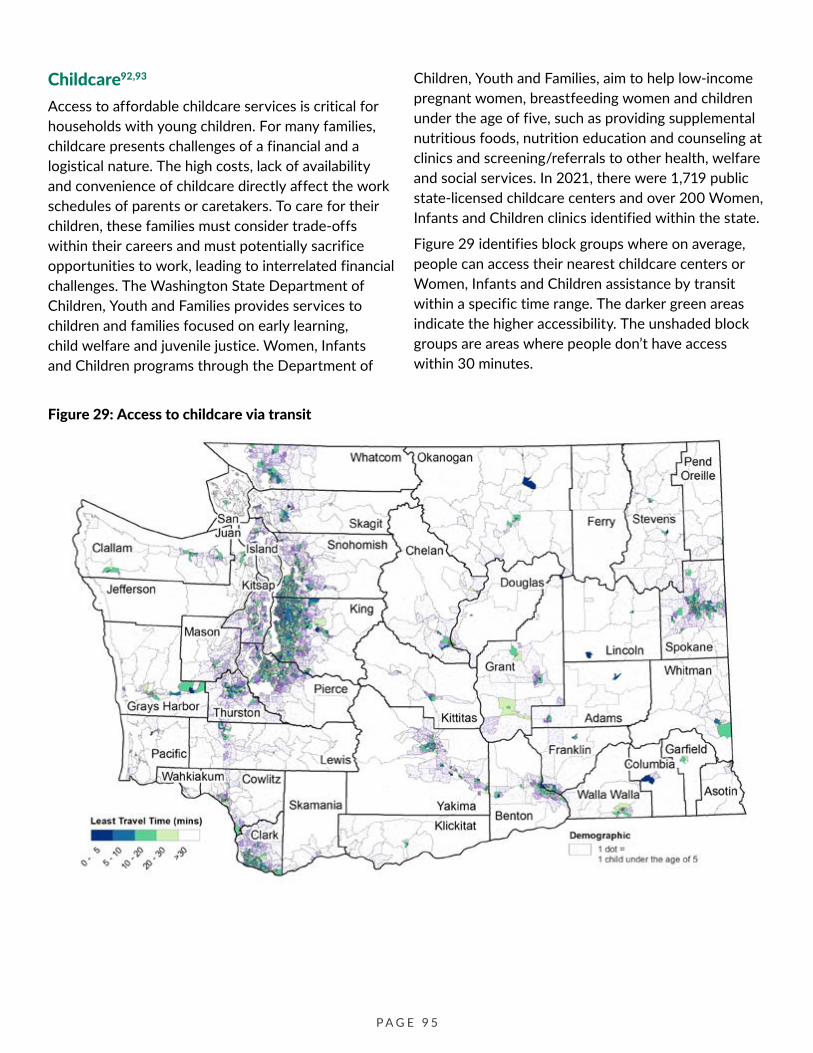
Childcare92,93
Access to affordable childcare services is critical for households with young children. For many families, childcare presents challenges of a financial and a logistical nature. The high costs, lack of availability and convenience of childcare directly affect the work schedules of parents or caretakers. To care for their children, these families must consider trade-offs within their careers and must potentially sacrifice opportunities to work, leading to interrelated financial challenges. The Washington State Department of Children, Youth and Families provides services to children and families focused on early learning, child welfare and juvenile justice. Women, Infants and Children programs through the Department of
Figure 29: Access to childcare via transit
Children, Youth and Families, aim to help low-income pregnant women, breastfeeding women and children under the age of five, such as providing supplemental nutritious foods, nutrition education and counseling at clinics and screening/referrals to other health, welfare and social services. In 2021, there were 1,719 public state-licensed childcare centers and over 200 Women, Infants and Children clinics identified within the state.
Figure 29 identifies block groups where on average, people can access their nearest childcare centers or Women, Infants and Children assistance by transit within a specific time range. The darker green areas indicate the higher accessibility. The unshaded block groups are areas where people don’t have access within 30 minutes.
P A G E 9 5
APPENDIX 2: DATA SOURCES AND METHODOLOGIES
2009 & 2017 National Household Travel Survey data The NHTS is a periodic survey conducted every 5-8 years since 1969. It is widely used for analyzing national transportation trends in personal and household travel in the US. This plan refers to the 2017 survey, which went out to 1,326 people from 650 households in Washington between April 19, 2016 – April 25, 2017.94 The survey results were sorted into Household, Person, Vehicle and Trip tables with weighting factors assigned for each table for generating unbiased population estimates. 21 travel modes were combined into five categories—auto, public transportation, biking/walking, taxis/ridesharing and air transportation. It is worth noting that ‘auto’ referred here doesn’t necessarily have to be owned by the traveler; some trips may involve in a carpool/ vanpool or a ride from a friend.
Identifying demand response services for human services riders Although human services transportation takes many different forms, flexible services like demand response transportation play a large role in transporting people with special transportation needs. Traditional performance measures capture data for fixed services, but few data methodologies successfully include demand-response transportation service coverage. The lack of data makes it challenging for public officials and advocates to identify gaps in mobility service and unmet needs. Estimating level of service for both fixed-route and demand response transportation in Washington State, as described in Chapter 1: Demand response level of service can help bridge the data gap.95,96
Demand response level of service As previously stated, currently there is no consistent way to describe demand response service across the state. Therefore, methods were adapted from
Godavarthy et al. 2015, Mattson et al. 2016, and Transit Capacity and Quality of Service Manual, 3rd edition 2013 to describe demand response level of service across Washington State by county. Demand response level of service is based on the days of service per week and the hours of service per day by county as detailed in the three studies.97,98,99
In counties with multiple providers, we selected the best LOS rating for that county. If service hours differed between weekend and weekday, we assigned the LOS category based on the average.
Demand response service and mobility needs After describing the level of demand response service, we replicated Godavarthy et al. 2015 and Mattson et al. 2016’s mobility index methodology to compare service levels with estimated need. Planning staff calculated population densities for populations aged 65 or older, population with a disability, population 200 percent below the poverty line, and veterans by county. The counties were ranked from highest population densities to lowest population densities and grouped into five equally sized classes by using quintile values for each of the four factors. Counties in the lowest 20 percent were given a value equal to 1, the next 20 percent were given a value equal to 2, and the highest 20 percent were given a value of 5. To produce a mobility needs index, planning staff averaged the four values for each county. This process ranks all regions on a scale of 1 to 5 with higher values identifying areas with greater mobility needs as specified in Godavarthy et al. 2015 and Mattson et al. 2016’s mobility index methodology. For the county level analysis, non-work accessibility scores were averaged for fixed route transit by county and categorized each county into quintiles.
By combining fixed-route accessibility with county-wide levels of service data for flexible transit options, this plan paints a more complete picture of the various services available to riders and the relative need in a particular county.
P A G E 9 6

APPENDIX 3: HUMAN SERVICES STEERING COMMITTEE MEMBERS
Membership from 2018 to 2021, in alphabetical order
Justin Bergener, Medstar and Goin
Sue Bush, Department of Social and Health Services
Angelena Campobasso, Tribal Transportation Planning Organization
Madelyn Carlson, People for People
Gil Cerise, Puget Sound Regional Council
Angie Coulter, CTANW
Betsy Dunbar, Medstar
Erika Estrada, Department of Health
Jenna Forty, OFM
Steve Gill, Department of Veterans Affairs
Glenn Gorton, Office of the Superintendent for Public Instruction
Tracy Graves, Health Care Authority
Dezerae Hayes, Tribal Transportation Planning Organization
Michael Kelly, Human Services Council
Jean Kim, Puget Sound Regional Council
Colleen Kuhn, Human Services Council
Francois Larrivee, Hopelink
Marki Lockhart, OlyCAP
Rafael Lozano, Department of Veterans Affairs
Anna McEnery, Association for County Human Services
Jon Morrison Winters, City of Seattle Aging and Disability Services
Sarah Nagpal, WSDOT Office of Equal Opportunity
Toby Olson, Governor’s Committee on Disability Issues and Employment
Riley Patterson, Muckleshoot Tribe
Kim Pearson, Puget Sound Regional Council
Tim Renfro, Pierce Transit
Stephen Riehl, Health Care Authority
Richard Rolland, Rolland Associates
Sennie Rose, Medstar
Elena Safariants, Department of Social and Health Services
Staci Sahoo, King County Mobility Coalition
Sara Sisco, Hopelink
Michele Thomas, Washington Low Income Housing Alliance
James Walters, Health Care Authority
Larry Watkinson, WSDOT
Leslie Wolff, Department of Commerce
Mahi Zeru, Department of Health
P A G E 9 7
GLOSSARY
ADA-accessible Public transportation revenue vehicles that, in compliance with ADA requirements, do not restrict access, are usable and provide allocated space and/or priority seating for individuals who use wheelchairs and that are accessible using lifts or ramps.
American Community Survey (ACS)
An ongoing survey by the United States Census Bureau that provides demographic information on a yearly basis.
Department of Social and Health Services (DSHS)
Washington’s state agency that provides comprehensive services and programs to vulnerable populations in human services. This agency oversees Medicare eligibility in Washington.
Demand Response/Demand Area Response Transportation (DART)
A transit mode composed of passenger cars, vans or small buses operating in response to calls from passengers or their agents to the transit operator, who then dispatches a vehicle to pick up the passengers and transport them to their destinations.
Dial-a-ride A type of transit service, typically demand response, which uses a phone or electronic system to coordinate on-demand rides. These services must typically be scheduled in advance.
Farebox revenue All income received directly from passengers, paid either in cash or through prepaid tickets, passes, etc. Includes donations from those passengers who donate money on a vehicle and reduced fares paid by passengers in a user-side subsidy arrangement.
Federal Transit Administration (FTA)
An agency within the United States Department of Transportation that provides financial and technical assistance to local public transit systems, including buses, subways, light rail, commuter rail, trolleys and ferries.
Fiscal year In Washington state, a 12-month period extending from July 1 of one calendar year to June 30 of the next calendar year.
Fixed route transportation service
Service provided on a repetitive, fixed schedule along a specific route with vehicles stopping to pick up and deliver passengers to specific locations.
Health and Human Services, Department of
A cabinet-level executive branch department of the U.S. federal government with the goal of protecting the health of all Americans and providing essential human services.
Healthcare Authority, Washington State (HCA)
A statewide body that oversees Apple Health (Medicaid) and several other statewide health programs in Washington state.
Human services transportation Programs that provide transportation services to people with special transportation needs.
Intercity bus Regularly scheduled public service using an over-the-road bus that operates with limited stops between two urbanized areas, or that connects rural areas to an urbanized area.
Light rail A transit mode that typically is an electric railway with a light volume traffic capacity as compared to heavy rail.
Medicaid A joint Federal/state program established to pay for medical services for people with disabilities, people 65 years and older, children and their caretakers, pregnant women and adults who meet the program’s financial requirements.
Medicare Federal health insurance for people ages 65 and older, and those who are under age 65 on Social Security Disability Income or diagnosed with certain diseases. Some Medicare Advantage plans, also known as “Part C”, include transportation benefits.
Metropolitan planning organization (MPO)
A municipal organization created pursuant to 49 U.S.C. 5303 to carry out the metropolitan transportation planning process of an urbanized area.
P A G E 9 8

Mobility management A comprehensive and customer-centered approach to designing and delivering transportation services to meet each community’s unique transportation needs. Mobility managers coordinate transportation services between public transit, private operators, cycling and walking, volunteer drivers, customers and other key stakeholders.
Non-emergency medical transportation (NEMT)
Transportation for routine and preventive healthcare purposes and excluding emergency transportation.
National Household Travel Survey (NHTS)
Conducted by the Federal Highway Administration (FHWA), the NHTS is the source of the Nation’s information about travel by U.S. residents in all 50 States and Washington, DC. This inventory of travel behavior includes trips made by all modes of travel (e.g., private vehicle, public transportation, pedestrian, and cycling) and for all purposes (e.g., travel to work, school, recreation and personal/ family trips).
Office of the Superintendent of Public Instruction
The primary agency charged with overseeing public K-12 education in Washington state.
Paratrans Comparable transit service required by the ADA for individuals with disabilities who are unable to use fixed route transportation systems.
People with low income For the purpose of this plan, “low income” refers to any individuals living below 200 percent of FPL.
Public transportation Any type of transportation service which includes the operation of a vehicle that provides general or special service to the public on a regular and continuing basis.
Regional transportation planning organization (RTPO)
An organization that identifies local transportation needs, conducts planning, assists local governments, and supports the statewide transportation planning process in nonmetropolitan regions of a state. States are provided the opportunity to designate RTPOs as a method for formalizing the engagement of officials from areas with a population size less than 50,000 as they incorporate rural transportation needs in the statewide transportation planning process.
Revenue vehicle Floating and rolling stock used to provide revenue service for passengers.
Revenue vehicle miles, hours, and trips
Time when a vehicle is available to the public and there is an expectation of carrying paying or subsidized passengers, as well as vehicles operated in fare free service. Revenue service includes layover/recovery time. Revenue service excludes deadhead, vehicle maintenance testing, school bus service and charter service.
Route deviated transportation A type of transit service that operates as conventional fixed-route bus service along a fixed alignment or path with scheduled time points at each terminal point and key intermediate locations. Route deviation service is different than conventional fixed-route bus service in that the bus may deviate from the route alignment to serve destinations within a prescribed distance (e.g., ¾ mile) of the route. Following an off-route deviation, the bus must return to the point on the route it left. • If they want to be taken off-
route as part of a service deviation, they must tell the bus operator when boarding.
• If they want to be picked up at an off-route location, they must call the transit system and request a pickup, and the dispatcher notifies the bus operator.
Special transportation need People, including their personal attendants, who because of physical or mental disability, income status or age are unable to transport themselves or purchase transportation.
Tribal Transportation Planning Organization (TTPO)
Founded in 2003, the organization and forum where tribes take an active role in statewide transportation planning through discussion and participation in tribal transportation system needs and opportunities.
P A G E 9 9
FOOTNOTES 1 WSDOT. 2020. Washington Transportation Plan 2 Washington State Legislature. 2009. Transportation
for persons with special needs. (RCW 81.66.10). 3 Federal Transit Administration.1990. Americans with
Disabilities Act. 4 United States Department of Justice, Civil Rights
Division. Information and Technical Assistance on the ADA.
5 Washington State Health Care Authority. 2019. Washington State Medicaid Explorer.
6 Centers for Medicare and Medicaid Services. 2019. Medicare Enrollment.
7 Federal Transit Administration. Are transit providers required to offer reduced transit fares to seniors, people with disabilities, or Medicare cardholders?
8 42 U.S.C. §119 (vi)(B). Education for Homeless Children and Youths.
9 2019 Washington State Summary of Public Transportation
10 Washington State HCA. 2021. Transportation Services (nonemergency)
11 WSDOT. 2020. Statewide Intercity Bus Network (Map).
12 Washington Traffic Safety Commission. 2021. Tribes.
13 American Cancer Society. Road to Recovery. www. cancer.org/treatment/support-programs-and-services/road-to-recovery.html
14 Additional details on tribes, ethnically and racially diverse communities, youth and families with young children, and people with limited English proficiency are included in the section on Demographic groups with additional mobility barriers.
15 ACS 5-year estimates (2014-2018). 16 Source: VA Veteran Population Projection Model,
2018. 17 ACS 5-year estimates (2014-2018).
18 United States Census Bureau. 2021. Disability. 19 Source: Disability Statistics, Cornell University,
derived from the American Community Survey (ACS).
20 ACS 5-year estimates (2014-2018). 21 Students are omitted from this data to avoid double
counting with Medicaid recipients 22 Health and Human Services. 2021. 2021 Poverty
Guidelines. 23 ACS 5-year estimates (2014-2018). 24 Federal Highway Administration. 2017. 2017
National Household Travel Survey, USDOT 25 Washington State Department of Commerce. 2018.
Homelessness in Washington State, 2018 Annual Report.
26 United States Interagency Council on Homelessness. 2019. Washington Homelessness Statistics.
27King County Housing, Homelessness and Community Development Division. 2021. King County Human Services Bus Ticket Program.
28 Washington Office of Superintendent of Public Instruction. 2021. Homeless Student Data and Grant Recipients.
29 Data shows that 97% of all students experiencing housing insecurity are considered low-income. As a result, subsequent maps and data do not differentiate between these two demographic groups.
30 Washington Office of Superintendent of Public Instruction. 2020. Homeless Education.
31 National Center for Homeless Education. McKinney Vento Law into Practice Brief Series. 2017. Transportation Children and Youth Experiencing Homelessness.
32 Washington Office of Superintendent of Public Instruction. 2020. Homeless Education Grants.
33 U.S. Department of Labor, Bureau of Labor Statistics, 2017
P A G E 1 0 0
https://uscode.house.gov/view.xhtml?path=/prelim@title42/chapter119/subchapter6/partB&edition=prelim
34 Godavarthy et al. and Mattson. 2015. Developing a Method for Assessing National Demand-Response Transit Level of Service.
35 Mattson, Godavarthy, and Hough. 2016. Method for Estimating Statewide Transit Needs and Investment Priorities for Rural and Small Urban Areas.
36 While some tribal transportation providers oversee human services transportation options, these programs are geographically focused and serve everyone within their jurisdiction.
37 WSDOT. 2006. Washington State Tribal Transportation Planning Organization.
38 Office of Financial Management. 2020. Population by Race.
39 Governor’s Interagency Council on Health Disparities. Office of Equity Task Force.
40 The Office of the Governor. 2021. Inslee Names Karen A. Johnson, PhD, Director of New State Office of Equity.
41 ACS 2014-2018, Table B16004. 42 ACS 2014-2018, Table S1101. 43 School transportation programs can use human
services funding to leverage existing public transportation services to get students to and from class, but not the independent bus system
44 Data from GTFS data feeds in 2018. 45 National Rural Transit Assistance Program. 2020.
Route Deviation Service Requirements. 46 2019 Washington State Summary of Public
Transportation 47 Sugar Access, 2019. 48 Godavarthy et al. and Mattson. 2015. Developing a
Method for Assessing National Demand-Response Transit Level of Service.
49 Mattson, Godavarthy, and Hough. 2016. Method for Estimating Statewide Transit Needs and Investment Priorities for Rural and Small Urban Areas.
50 Totals may vary from individual funding sources due to rounding.
51 The $4.4 million is a part of the 5311 total awarded funds ($24.9 million).
52 More information on the program and projects, “where WSDOT tracks” the Public Transportation – Consolidated Grants Program website and the 2020 Public Transportation Mobility Report.
53 CARES Act and the Consolidated Appropriations Act 54 Description of nonemergency medical
transportation from the 2019 Washington State Summary of Public Transportation
55 Description of Community Transportation Providers is from the 2019 Washington State Summary of Public Transportation.
56 Additional financial and operational data for transportation providers across the state is in the Summary of Public Transportation. This includes transit agencies, tribal transportation providers, community transportation providers, ferries, Medicaid transportation brokers, the Monorail, and the Travel Washington Intercity Bus Program. WSDOT updates and publishes this report annually on December 1.
57 2019 Washington State Summary of Public Transportation.
58 Totals may vary from individual funding sources due to rounding.
59 2019 Washington State Summary of Public Transportation.
60 2019 Washington State Summary of Public Transportation.
61 From 2021 Continuing Appropriations Act 62 FTA. 2020. CCAM Program Inventory. 63 Bartholomew, Keith. “The Role of Bus Stop Features
in Facilitating Accessibility.” National Institute for Transportation and Communities, TREC, Oct. 2020
64 2019 ACS 5-year estimates, table B28002. 65 Estimated number of total households in
Washington state: 2,848,396. 66 Federal Highway Administration. 2017. 2017
National Household Travel Survey, U.S. Department of Transportation, Washington, DC.
67 Most education facilities were not operating during the pandemic, hence the exclusion.
P A G E 1 0 1
68 At the time of writing (May 2021) this site was noted as the largest in the nation.
69 WSDOT. 2016-2019 Washington State Summary of Public Transportation.
70 Data shown begins in 2016, because of data quality issues with this dataset
71 Washington State Department of Health. 2019. Washington State Cancer Registry Data Online.
72 Road To Recovery 73 National Academies of Sciences, Engineering, and
Medicine 2019. Dialysis Transportation: Intersection of Transportation and Healthcare. Washington, DC: The National Academies Press.
74 USRDS prevalent count 2018. 75 USRDS 2020 Annual Report. 76 Source: Washington Health Care Authority (HCA);
note that the 2020 trip costs went up significantly due to a COVID related fee, which ensured transportation resources were made available for clients needing life sustaining service.
77 Office of Financial Management. 2019. 78 OFM Percent of Population Age 85 and Above,
2019 79 SCI Solutions: Missed appointments cost the U.S.
healthcare system $150B each year 80 NY Times: Companies Respond to an Urgent Health
Care Need: Transportation 81 CNBC: Lyft just hired a hotshot exec from
McKesson to run its growing business transporting patients to medical appointments
82 SF Examiner: Uber, Lyft to pay into fund to provide wheelchair-accessible trips
83 Pearce. (2017). The Self-Sufficiency Standard for Washington State 2017. Seattle, WA.
84 A summary of this report is available by request, contact [email protected]
85 US Census
86 United For ALICE (Asset Limited, Income Constrained, Employed)
87 The Self-Sufficiency Standard for Washington State 2017
88 U.S. Census Bureau. 2019. 2017 American Community Survey 5-Year Estimates
89 Federal Highway Administration. 2017. 2017 National Household Travel Survey, USDOT
90 WDVA: Washington State Veteran’s Benefits & Discounts
91 Source: Feeding American. (2019). Hunger in Washington.
92 WA Department of Children, Youth, Family. Early Childhood Education and Assistance Program.
93 WA Department of Children, Youth, Family. All licensed childcare centers in WA.
94 Children under the age of five were omitted from the survey results.
95 Godavarthy et al. and Mattson. 2015. Developing a Method for Assessing National Demand-Response Transit Level of Service.
96 Mattson, Godavarthy, and Hough. 2016. Method for Estimating Statewide Transit Needs and Investment Priorities for Rural and Small Urban Areas.
97 Kittelson & Assoc, Inc., Parsons Brinckerhoff, Inc., KFH Group, Inc., Texas A&M Transportation Institute, & Arup. 2013. Transit Capacity and Quality of Service Manual. Third Edition. Transit Cooperative Highway Research Program (TCRP) Report 165, published by Transportation Research Board, Washington.
98 Godavarthy et al. and Mattson. 2015. Developing a Method for Assessing National Demand-Response Transit Level of Service.
99 Mattson, Godavarthy, and Hough. 2016. Method for Estimating Statewide Transit Needs and Investment Priorities for Rural and Small Urban Areas.
P A G E 1 0 2
http://www.veteransresources.org/wp-content/uploads/2014/04/Vet-State-Benefits-Discounts-WA-2014.pdf

Related Documents