2021 Insurance Fact Book

Welcome message from author
This document is posted to help you gain knowledge. Please leave a comment to let me know what you think about it! Share it to your friends and learn new things together.
Transcript

TO THE READERWho could have predicted a year ago that in 2020 we would live in such interesting times? The year began with a pandemic that still rages at year-end; the 2020 Atlantic hurricane season was one for the record books; and Western wildfires have burned their way through homes and businesses.
For calamities seen and unforeseen—the insurance industry is there for its customers and is a vital component of the predicting and prevention work, as well as the rebuilding and recovery process. Year after year, insurers are in communities, helping them prepare and better manage risk, while also being financial first responders to assist in recovery from losses ranging from the extreme devastation of a wildfire to a broken windshield after a hailstorm.
The 2021 Insurance Information Institute (Triple-I) Insurance Fact Book has added content to address many of the year’s events, including: Emerging Risks: Insurer Response to the Pandemic; new sections on Civil Disturbance and COVID-19; Homeowners High-Risk Markets; and expanded commercial insurance data and more.
As always, the book provides valuable information on:
• World and U.S. catastrophes• Property/casualty and life/annuity insurance results and investments• Personal expenditures on auto and homeowners insurance• Major types of insurance losses, including vehicle accidents, homeowners claims, crime and
workplace accidents• State auto insurance laws
The Fact Book is meant to be used along with the institute’s website, www.iii.org, which features information for consumers, the industry, researchers, public policymakers and businesses. The Triple-I remains a vital and trusted source for the media, and we welcome you to find us on Facebook and follow us on Twitter at @iiiorg or connect with us on LinkedIn.
Some happy 2020 news to report: The Triple-I is now an affiliate of The Institutes, the leading provider of risk management and insurance education and research. Together, the Triple-I and The Institutes will be better equipped and empowered to serve both the information and education needs of those interested in risk management and insurance.
Thanks as always to the many associations, consultants and others who collect industry statistics and who have generously given permission to use their data—and thanks especially to our members, for their longstanding support.
Sean KevelighanChief Executive OfficerInsurance Information Institute
The 2021 Insurance Fact Book is published by the Insurance Information Institute, a primary source for information, analysis and referral on insurance subjects. The Fact Book contains material from numerous sources. Because these sources define and collect data in various ways, and moreover, are constantly refining the data, differences among similar data may occur.
©2021 Insurance Information Institute. ISBN 978-0-932387-85-1.
iiInsurance Information Institute | www.ii i.org 2021 Insurance Fact Book ii
Insurance Industry At A Glance .................................................................................................................................... v
Chapter 1: World Insurance Markets Premiums ........................................................................................................................................................................1 Reinsurance ...................................................................................................................................................................5 Leading Companies ....................................................................................................................................................7 International Sales .......................................................................................................................................................9 Captives And Other Risk-Financing Options .................................................................................................... 10 Microinsurance And Emerging Markets ............................................................................................................. 11
Chapter 2: U.S. Insurance Industry, All Sectors Premiums ..................................................................................................................................................................... 14 Leading Companies ................................................................................................................................................. 16 Health ........................................................................................................................................................................... 17 Employment And Other Economic Contributions ........................................................................................... 18 Mergers And Acquisitions ...................................................................................................................................... 21 Companies By State ................................................................................................................................................. 24 Premium Taxes By State ......................................................................................................................................... 25
Chapter 3: Distribution Property/Casualty ...................................................................................................................................................... 26 Life ................................................................................................................................................................................. 28 Annuities ...................................................................................................................................................................... 29
Chapter 4: Retirement Overview...................................................................................................................................................................... 30 IRAs ............................................................................................................................................................................... 33 401(k)s .......................................................................................................................................................................... 34 Mutual Funds .............................................................................................................................................................. 34 Annuities ...................................................................................................................................................................... 35
Chapter 5: Life/Annuity Financial Data Financial Results ........................................................................................................................................................ 38 Investments ................................................................................................................................................................. 41 Payouts ......................................................................................................................................................................... 42 Premiums By Line… .................................................................................................................................................. 43 Leading Companies ................................................................................................................................................. 47 Separate Accounts ................................................................................................................................................... 48
Chapter 6: Property/Casualty Financial Data Financial Results ........................................................................................................................................................ 49 Investments ................................................................................................................................................................. 56 Surplus Lines .............................................................................................................................................................. 58 Concentration............................................................................................................................................................. 59 Reinsurance ................................................................................................................................................................ 60 Premiums By State .................................................................................................................................................... 61 Incurred Losses By State ........................................................................................................................................ 62 Guaranty Funds ......................................................................................................................................................... 63
iiiInsurance Information Institute | www.ii i.org 2021 Insurance Fact Book iii
TABLE OF CONTENTS
Chapter 7: Property/Casualty Insurance By LinePremiums By Line ..................................................................................................................................................... 65Auto: Premiums .......................................................................................................................................................... 72Auto: Costs/Expenditures ....................................................................................................................................... 75Auto: Claims ................................................................................................................................................................ 80Auto: High-Risk Markets .......................................................................................................................................... 81Auto: Laws ................................................................................................................................................................... 83Homeowners: Premiums ......................................................................................................................................... 90 Homeowners: High-Risk Markets ......................................................................................................................... 91Homeowners: Costs/Expenditures ....................................................................................................................101Homeowners: Claims .............................................................................................................................................104Flood Insurance .......................................................................................................................................................109Earthquake Insurance ............................................................................................................................................114Commercial Lines ...................................................................................................................................................116
Chapter 8: LossesMajor Catastrophes: World ...................................................................................................................................140Major Catastrophes: United States ....................................................................................................................146U.S. Natural Catastrophes: Hurricanes, Wildfires, Convective Storms, Winter Storms, Floods, Earthquakes ..........................................................................................................................................................148U.S. Man-made Catastrophes: Fire, Civil Disorders, Terrorism, Nuclear Incidents .............................171 Crime: Arson .............................................................................................................................................................178Crime: Property ........................................................................................................................................................179Crime: Cyber And Identity Theft .........................................................................................................................180Motor Vehicles: Crashes .......................................................................................................................................187Motor Vehicles: Theft .............................................................................................................................................200
Recreation .................................................................................................................................................................202 Aviation ......................................................................................................................................................................206 Workplace .................................................................................................................................................................209 Home ..........................................................................................................................................................................212
Causes Of Death .....................................................................................................................................................213
Chapter 9: Factors Affecting CostsCost Of Goods And Services ..............................................................................................................................217
Fraud ...........................................................................................................................................................................221 Litigiousness .............................................................................................................................................................224
AppendicesSpecial Report: Emerging and Evolving Insurance Issues .........................................................................231Triple-I Resources ...................................................................................................................................................240Triple-I Members .....................................................................................................................................................241Triple-I Staff ...............................................................................................................................................................242
ivInsurance Information Institute | www.ii i.org 2021 Insurance Fact Book iv
TABLE OF CONTENTS
Insurance Industry At A Glance
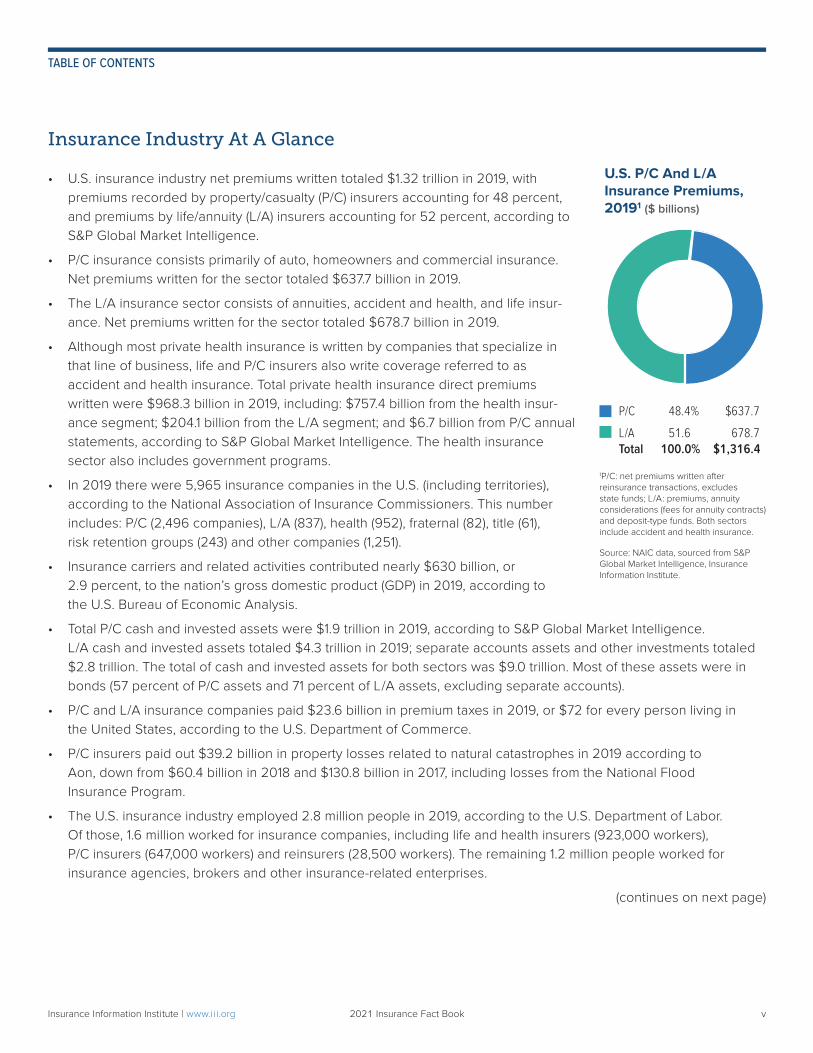
• U.S. insurance industry net premiums written totaled $1.32 trillion in 2019, with premiums recorded by property/casualty (P/C) insurers accounting for 48 percent, and premiums by life/annuity (L/A) insurers accounting for 52 percent, according to S&P Global Market Intelligence.
• P/C insurance consists primarily of auto, homeowners and commercial insurance. Net premiums written for the sector totaled $637.7 billion in 2019.
• The L/A insurance sector consists of annuities, accident and health, and life insur-ance. Net premiums written for the sector totaled $678.7 billion in 2019.
• Although most private health insurance is written by companies that specialize in that line of business, life and P/C insurers also write coverage referred to as accident and health insurance. Total private health insurance direct premiums written were $968.3 billion in 2019, including: $757.4 billion from the health insur-ance segment; $204.1 billion from the L/A segment; and $6.7 billion from P/C annual statements, according to S&P Global Market Intelligence. The health insurance sector also includes government programs.
• In 2019 there were 5,965 insurance companies in the U.S. (including territories), according to the National Association of Insurance Commissioners. This number includes: P/C (2,496 companies), L/A (837), health (952), fraternal (82), title (61), risk retention groups (243) and other companies (1,251).
• Insurance carriers and related activities contributed nearly $630 billion, or 2.9 percent, to the nation’s gross domestic product (GDP) in 2019, according to the U.S. Bureau of Economic Analysis.
• Total P/C cash and invested assets were $1.9 trillion in 2019, according to S&P Global Market Intelligence. L/A cash and invested assets totaled $4.3 trillion in 2019; separate accounts assets and other investments totaled $2.8 trillion. The total of cash and invested assets for both sectors was $9.0 trillion. Most of these assets were in bonds (57 percent of P/C assets and 71 percent of L/A assets, excluding separate accounts).
• P/C and L/A insurance companies paid $23.6 billion in premium taxes in 2019, or $72 for every person living in the United States, according to the U.S. Department of Commerce.
• P/C insurers paid out $39.2 billion in property losses related to natural catastrophes in 2019 according to Aon, down from $60.4 billion in 2018 and $130.8 billion in 2017, including losses from the National Flood Insurance Program.
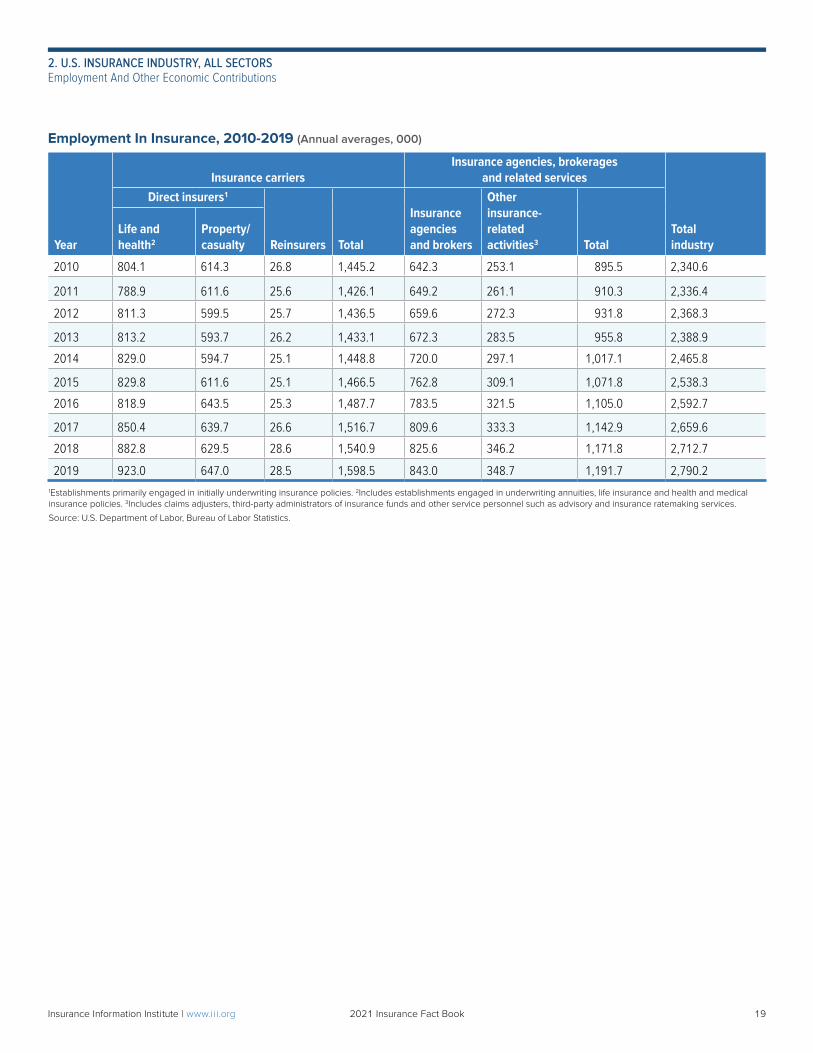
• The U.S. insurance industry employed 2.8 million people in 2019, according to the U.S. Department of Labor. Of those, 1.6 million worked for insurance companies, including life and health insurers (923,000 workers), P/C insurers (647,000 workers) and reinsurers (28,500 workers). The remaining 1.2 million people worked for insurance agencies, brokers and other insurance-related enterprises.
(continues on next page)
P/C 48.4% $637.7
L/A 51.6 678.7 Total 100.0% $1,316.4
U.S. P/C And L/A Insurance Premiums, 20191 ($ billions)
1P/C: net premiums written after reinsurance transactions, excludes state funds; L/A: premiums, annuity considerations (fees for annuity contracts) and deposit-type funds. Both sectors include accident and health insurance.
Source: NAIC data, sourced from S&P Global Market Intelligence, Insurance Information Institute.
vInsurance Information Institute | www.ii i.org 2021 Insurance Fact Book v
TABLE OF CONTENTS
• Insurers have responded quickly to the COVID-19 pandemic. Using information collected by the Insurance Industry Charitable Foundation (IICF), the Insurance Information Institute (Triple-I) estimates that by June 2020 U.S. insurers and their foundations had donated about $280 million in the fight against COVID-19. In addition, international insurers and their foundations donated more than $150 million. U.S. auto insurers have also responded to the pandemic by returning over $14 billion to their customers nationwide in response to reduced driving during the pandemic, according to a Triple-I estimate.
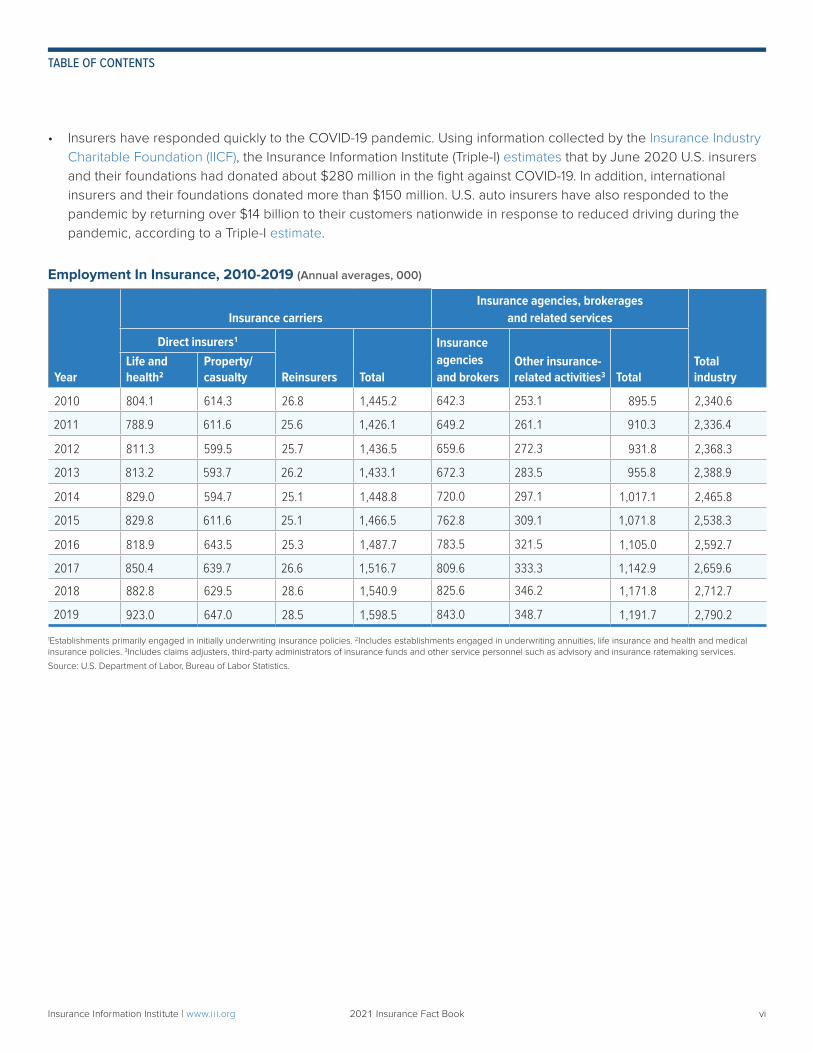
Employment In Insurance, 2010-2019 (Annual averages, 000)
Year
Insurance carriersInsurance agencies, brokerages
and related services
Total industry
Direct insurers1
Reinsurers Total
Insurance agencies and brokers
Other insurance- related activities3 Total
Life and health2
Property/casualty
2010 804.1 614.3 26.8 1,445.2 642.3 253.1 895.5 2,340.6
2011 788.9 611.6 25.6 1,426.1 649.2 261.1 910.3 2,336.4
2012 811.3 599.5 25.7 1,436.5 659.6 272.3 931.8 2,368.3
2013 813.2 593.7 26.2 1,433.1 672.3 283.5 955.8 2,388.9
2014 829.0 594.7 25.1 1,448.8 720.0 297.1 1,017.1 2,465.8
2015 829.8 611.6 25.1 1,466.5 762.8 309.1 1,071.8 2,538.3
2016 818.9 643.5 25.3 1,487.7 783.5 321.5 1,105.0 2,592.7
2017 850.4 639.7 26.6 1,516.7 809.6 333.3 1,142.9 2,659.6
2018 882.8 629.5 28.6 1,540.9 825.6 346.2 1,171.8 2,712.7
2019 923.0 647.0 28.5 1,598.5 843.0 348.7 1,191.7 2,790.2
1Establishments primarily engaged in initially underwriting insurance policies. 2Includes establishments engaged in underwriting annuities, life insurance and health and medical insurance policies. 3Includes claims adjusters, third-party administrators of insurance funds and other service personnel such as advisory and insurance ratemaking services.
Source: U.S. Department of Labor, Bureau of Labor Statistics.
viInsurance Information Institute | www.ii i.org 2021 Insurance Fact Book vi
TABLE OF CONTENTS
PREMIUMSWorld Life And Nonlife Insurance In 2019Outside the United States, the insurance industry is divided into life and nonlife (or general insurance), rather than life/annuity and property/casualty. Swiss Re’s 2019 world insurance study is based on direct premium data from 147 countries, with detailed information on the largest 88 markets. World insurance premiums rose 2.9 percent in 2019, adjusted for inflation, to $6.3 trillion. Nonlife premiums grew 3.5 percent in 2019, adjusted for inflation, slightly above the rate of growth from 2009 to 2018. Life insurance premiums grew 2.2 percent in 2019, faster than the 1.5 percent rise in 2009 to 2018, adjusted for inflation.
Outlook for 2020-2021Following 2.9 percent real growth in 2019, Swiss Re estimates total global insurance premiums would fall 1.4 percent in real terms in 2020 due to the COVID-19 pandemic and forecasts 3.4 percent rebound growth in 2021. China is forecast to drive the rebound in 2021 with 10 percent growth in the nonlife sector and 8.5 percent growth in thelife sector. After 2.2 percent growth in 2019, in 2020 global life premiums are estimated to fall 4.5 percent, and to grow 3 percent in 2021. Nonlife premiums will fare better: following 3.5 percent real growth in 2019, premiums are estimated to grow 1.1 percent in 2020 and to rebound with 3.6 percent growth in 2021 and 2022.
Top 10 Countries By Life And Nonlife Direct Premiums Written, 20191 (US$ millions)
Rank Country Life premiums Nonlife premiums2
Total premiums
AmountPercent change from prior year
Percent of total world premiums
1 United States3, 4, 5 $628,522 $1,831,601 $2,460,123 3.9% 39.10%
2 PR China5 329,432 287,967 617,399 7.4 9.81
3 Japan5, 6 341,328 118,019 459,357 4.8 7.30
4 United Kingdom5 264,221 102,022 366,243 -3.8 5.82
5 France5 167,588 94,694 262,283 -1.5 4.17
6 Germany5 101,550 142,301 243,852 -0.4 3.88
7 South Korea6 94,483 80,037 174,520 -3.3 2.77
8 Italy 124,133 43,705 167,838 -1.4 2.67
9 Canada5, 7 53,317 79,840 133,157 2.9 2.12
10 Taiwan 97,423 20,401 117,823 -3.4 1.871Before reinsurance transactions. 2Includes accident and health insurance. 3Nonlife premiums now include private medical insurance, which had been included for other countries. 4Nonlife premiums include state funds; life premiums are net premiums and are supplemented by estimated premiums for group pension business. 5Estimated or provisional. 6Financial year April 1, 2019 – March 31, 2020. 7Nonlife premiums are gross premiums, including reinsurance; life premiums are net premiums.
Source: Swiss Re, sigma, No. 4/2020.
Chapter 1
World Insurance Markets
1Insurance Information Institute | www.ii i.org 2021 Insurance Fact Book 1
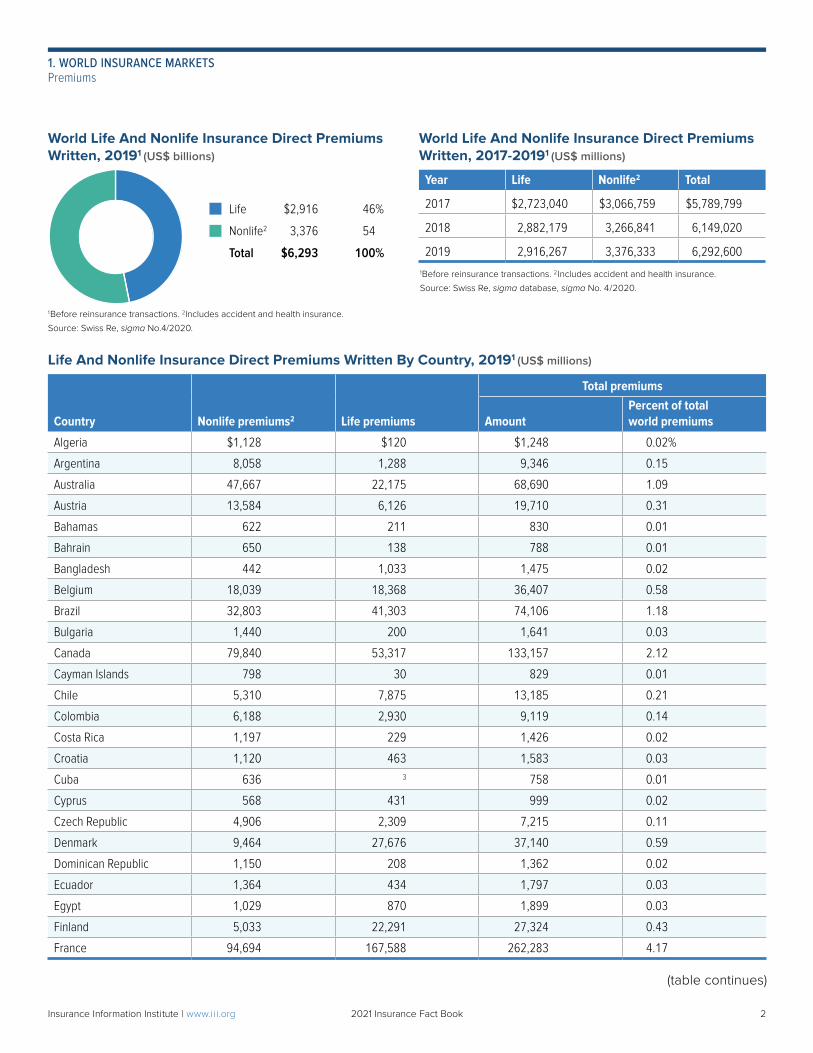
Life $2,916 46%
Nonlife2 3,376 54
Total $6,293 100%
World Life And Nonlife Insurance Direct Premiums Written, 2017-20191 (US$ millions)
Year Life Nonlife2 Total
2017 $2,723,040 $3,066,759 $5,789,799
2018 2,882,179 3,266,841 6,149,020
2019 2,916,267 3,376,333 6,292,600
World Life And Nonlife Insurance Direct Premiums Written, 20191 (US$ billions)
1Before reinsurance transactions. 2Includes accident and health insurance.
Source: Swiss Re, sigma No.4/2020.
1Before reinsurance transactions. 2Includes accident and health insurance.
Source: Swiss Re, sigma database, sigma No. 4/2020.
Life And Nonlife Insurance Direct Premiums Written By Country, 20191 (US$ millions)
Country Nonlife premiums2 Life premiums
Total premiums
Amount Percent of total world premiums
Algeria $1,128 $120 $1,248 0.02%
Argentina 8,058 1,288 9,346 0.15
Australia 47,667 22,175 68,690 1.09
Austria 13,584 6,126 19,710 0.31
Bahamas 622 211 830 0.01
Bahrain 650 138 788 0.01
Bangladesh 442 1,033 1,475 0.02
Belgium 18,039 18,368 36,407 0.58
Brazil 32,803 41,303 74,106 1.18
Bulgaria 1,440 200 1,641 0.03
Canada 79,840 53,317 133,157 2.12
Cayman Islands 798 30 829 0.01
Chile 5,310 7,875 13,185 0.21
Colombia 6,188 2,930 9,119 0.14
Costa Rica 1,197 229 1,426 0.02
Croatia 1,120 463 1,583 0.03
Cuba 636 3 758 0.01
Cyprus 568 431 999 0.02
Czech Republic 4,906 2,309 7,215 0.11
Denmark 9,464 27,676 37,140 0.59
Dominican Republic 1,150 208 1,362 0.02
Ecuador 1,364 434 1,797 0.03
Egypt 1,029 870 1,899 0.03
Finland 5,033 22,291 27,324 0.43
France 94,694 167,588 262,283 4.17
(table continues)
2Insurance Information Institute | www.ii i.org 2021 Insurance Fact Book 2
1. WORLD INSURANCE MARKETSPremiums
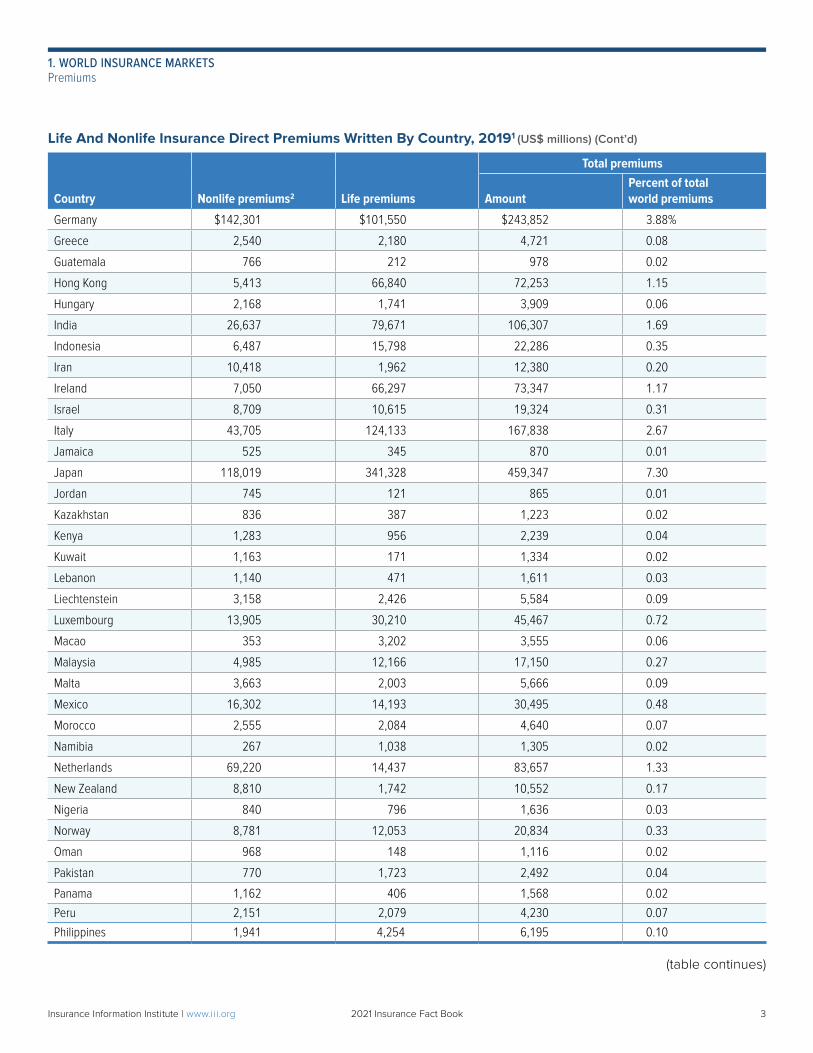
Life And Nonlife Insurance Direct Premiums Written By Country, 20191 (US$ millions) (Cont’d)
Country Nonlife premiums2 Life premiums
Total premiums
Amount Percent of total world premiums
Germany $142,301 $101,550 $243,852 3.88%
Greece 2,540 2,180 4,721 0.08
Guatemala 766 212 978 0.02
Hong Kong 5,413 66,840 72,253 1.15
Hungary 2,168 1,741 3,909 0.06
India 26,637 79,671 106,307 1.69
Indonesia 6,487 15,798 22,286 0.35
Iran 10,418 1,962 12,380 0.20
Ireland 7,050 66,297 73,347 1.17
Israel 8,709 10,615 19,324 0.31
Italy 43,705 124,133 167,838 2.67
Jamaica 525 345 870 0.01
Japan 118,019 341,328 459,347 7.30
Jordan 745 121 865 0.01
Kazakhstan 836 387 1,223 0.02
Kenya 1,283 956 2,239 0.04
Kuwait 1,163 171 1,334 0.02
Lebanon 1,140 471 1,611 0.03
Liechtenstein 3,158 2,426 5,584 0.09
Luxembourg 13,905 30,210 45,467 0.72
Macao 353 3,202 3,555 0.06
Malaysia 4,985 12,166 17,150 0.27
Malta 3,663 2,003 5,666 0.09
Mexico 16,302 14,193 30,495 0.48
Morocco 2,555 2,084 4,640 0.07
Namibia 267 1,038 1,305 0.02
Netherlands 69,220 14,437 83,657 1.33
New Zealand 8,810 1,742 10,552 0.17
Nigeria 840 796 1,636 0.03
Norway 8,781 12,053 20,834 0.33
Oman 968 148 1,116 0.02
Pakistan 770 1,723 2,492 0.04
Panama 1,162 406 1,568 0.02
Peru 2,151 2,079 4,230 0.07
Philippines 1,941 4,254 6,195 0.10
(table continues)
3Insurance Information Institute | www.ii i.org 2021 Insurance Fact Book 3
1. WORLD INSURANCE MARKETSPremiums
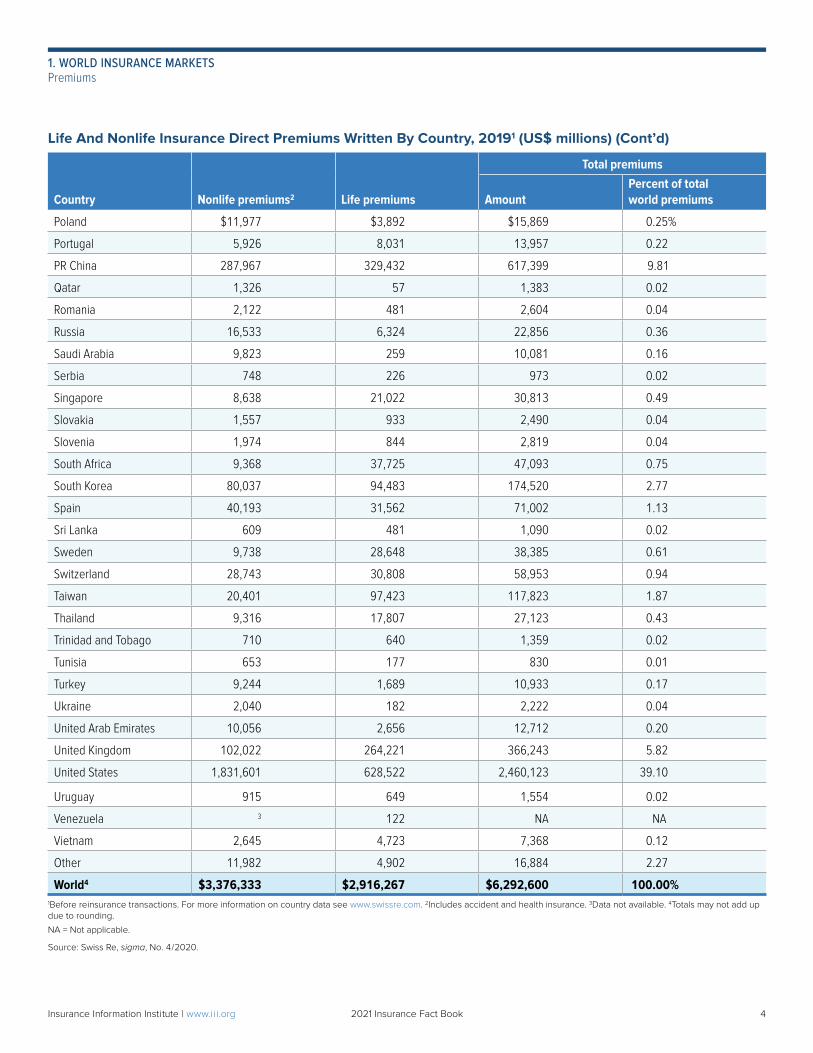
Life And Nonlife Insurance Direct Premiums Written By Country, 20191 (US$ millions) (Cont’d)
Country Nonlife premiums2 Life premiums
Total premiums
Amount Percent of total world premiums
Poland $11,977 $3,892 $15,869 0.25%
Portugal 5,926 8,031 13,957 0.22
PR China 287,967 329,432 617,399 9.81
Qatar 1,326 57 1,383 0.02
Romania 2,122 481 2,604 0.04
Russia 16,533 6,324 22,856 0.36
Saudi Arabia 9,823 259 10,081 0.16
Serbia 748 226 973 0.02
Singapore 8,638 21,022 30,813 0.49
Slovakia 1,557 933 2,490 0.04
Slovenia 1,974 844 2,819 0.04
South Africa 9,368 37,725 47,093 0.75
South Korea 80,037 94,483 174,520 2.77
Spain 40,193 31,562 71,002 1.13
Sri Lanka 609 481 1,090 0.02
Sweden 9,738 28,648 38,385 0.61
Switzerland 28,743 30,808 58,953 0.94
Taiwan 20,401 97,423 117,823 1.87
Thailand 9,316 17,807 27,123 0.43
Trinidad and Tobago 710 640 1,359 0.02
Tunisia 653 177 830 0.01
Turkey 9,244 1,689 10,933 0.17
Ukraine 2,040 182 2,222 0.04
United Arab Emirates 10,056 2,656 12,712 0.20
United Kingdom 102,022 264,221 366,243 5.82
United States 1,831,601 628,522 2,460,123 39.10
Uruguay 915 649 1,554 0.02
Venezuela 3 122 NA NA
Vietnam 2,645 4,723 7,368 0.12
Other 11,982 4,902 16,884 2.27
World4 $3,376,333 $2,916,267 $6,292,600 100.00%1Before reinsurance transactions. For more information on country data see www.swissre.com. 2Includes accident and health insurance. 3Data not available. 4Totals may not add up due to rounding.
NA = Not applicable.
Source: Swiss Re, sigma, No. 4/2020.
4Insurance Information Institute | www.ii i.org 2021 Insurance Fact Book 4
1. WORLD INSURANCE MARKETSPremiums
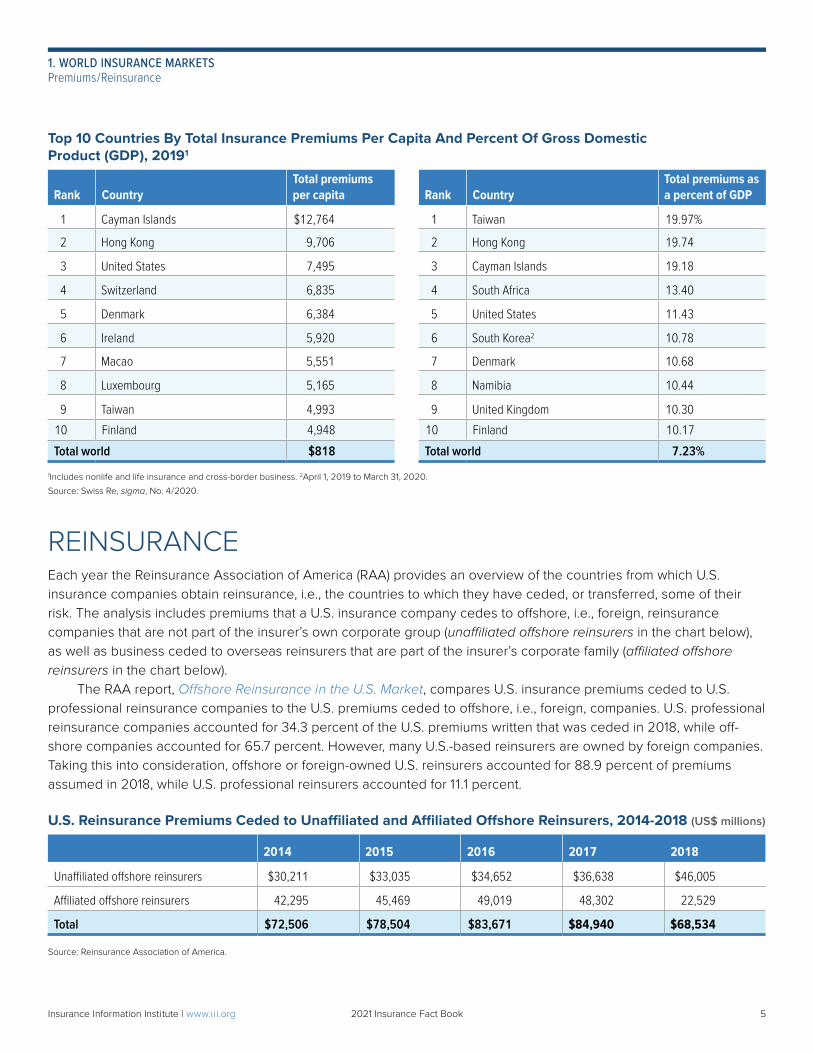
Top 10 Countries By Total Insurance Premiums Per Capita And Percent Of Gross Domestic Product (GDP), 20191
Rank CountryTotal premiums per capita Rank Country
Total premiums as a percent of GDP
1 Cayman Islands $12,764 1 Taiwan 19.97%
2 Hong Kong 9,706 2 Hong Kong 19.74
3 United States 7,495 3 Cayman Islands 19.18
4 Switzerland 6,835 4 South Africa 13.40
5 Denmark 6,384 5 United States 11.43
6 Ireland 5,920 6 South Korea2 10.78
7 Macao 5,551 7 Denmark 10.68
8 Luxembourg 5,165 8 Namibia 10.44
9 Taiwan 4,993 9 United Kingdom 10.30
10 Finland 4,948 10 Finland 10.17
Total world $818 Total world 7.23%
1Includes nonlife and life insurance and cross-border business. 2April 1, 2019 to March 31, 2020.
Source: Swiss Re, sigma, No. 4/2020.
REINSURANCEEach year the Reinsurance Association of America (RAA) provides an overview of the countries from which U.S. insurance companies obtain reinsurance, i.e., the countries to which they have ceded, or transferred, some of their risk. The analysis includes premiums that a U.S. insurance company cedes to offshore, i.e., foreign, reinsurance companies that are not part of the insurer’s own corporate group (unaffiliated offshore reinsurers in the chart below), as well as business ceded to overseas reinsurers that are part of the insurer’s corporate family (affiliated offshore reinsurers in the chart below). The RAA report, Offshore Reinsurance in the U.S. Market, compares U.S. insurance premiums ceded to U.S. professional reinsurance companies to the U.S. premiums ceded to offshore, i.e., foreign, companies. U.S. professional reinsurance companies accounted for 34.3 percent of the U.S. premiums written that was ceded in 2018, while off-shore companies accounted for 65.7 percent. However, many U.S.-based reinsurers are owned by foreign companies. Taking this into consideration, offshore or foreign-owned U.S. reinsurers accounted for 88.9 percent of premiums assumed in 2018, while U.S. professional reinsurers accounted for 11.1 percent.
U.S. Reinsurance Premiums Ceded to Unaffiliated and Affiliated Offshore Reinsurers, 2014-2018 (US$ millions)
2014 2015 2016 2017 2018
Unaffiliated offshore reinsurers $30,211 $33,035 $34,652 $36,638 $46,005
Affiliated offshore reinsurers 42,295 45,469 49,019 48,302 22,529
Total $72,506 $78,504 $83,671 $84,940 $68,534
Source: Reinsurance Association of America.
5Insurance Information Institute | www.ii i.org 2021 Insurance Fact Book 5
1. WORLD INSURANCE MARKETSPremiums/Reinsurance
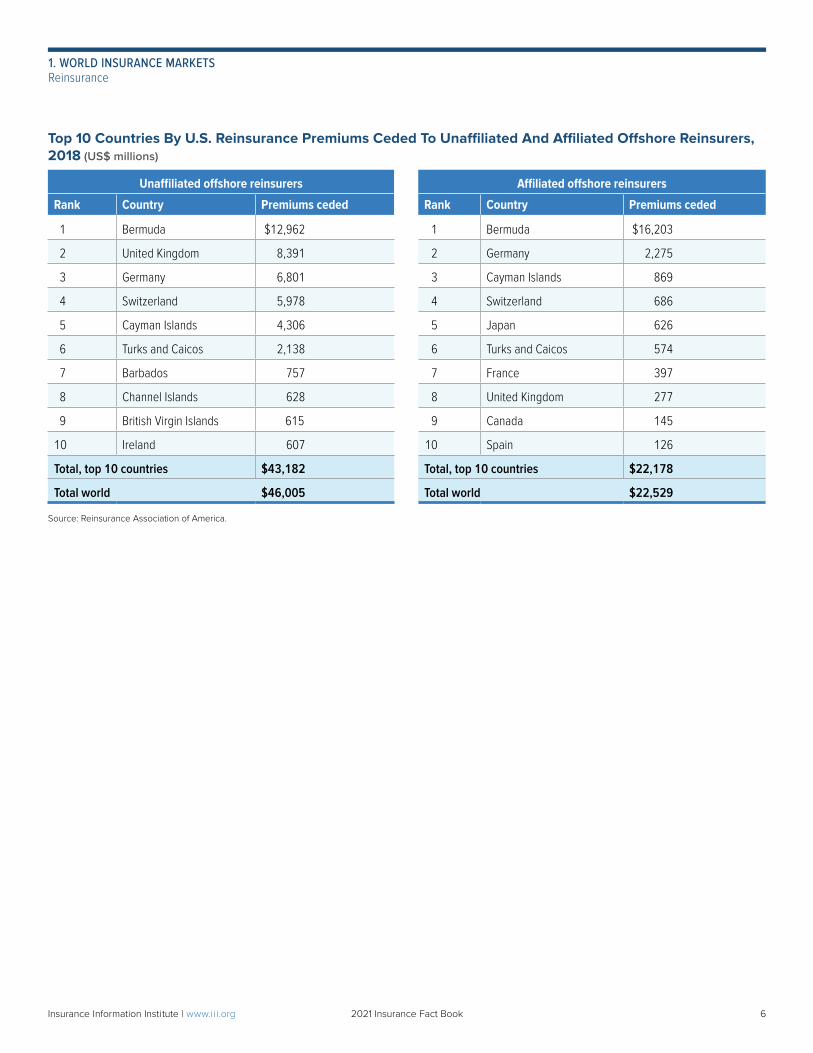
Top 10 Countries By U.S. Reinsurance Premiums Ceded To Unaffiliated And Affiliated Offshore Reinsurers, 2018 (US$ millions)
Unaffiliated offshore reinsurers Affiliated offshore reinsurers
Rank Country Premiums ceded Rank Country Premiums ceded
1 Bermuda $12,962 1 Bermuda $16,203
2 United Kingdom 8,391 2 Germany 2,275
3 Germany 6,801 3 Cayman Islands 869
4 Switzerland 5,978 4 Switzerland 686
5 Cayman Islands 4,306 5 Japan 626
6 Turks and Caicos 2,138 6 Turks and Caicos 574
7 Barbados 757 7 France 397
8 Channel Islands 628 8 United Kingdom 277
9 British Virgin Islands 615 9 Canada 145
10 Ireland 607 10 Spain 126
Total, top 10 countries $43,182 Total, top 10 countries $22,178
Total world $46,005 Total world $22,529
Source: Reinsurance Association of America.
6Insurance Information Institute | www.ii i.org 2021 Insurance Fact Book 6
1. WORLD INSURANCE MARKETSReinsurance
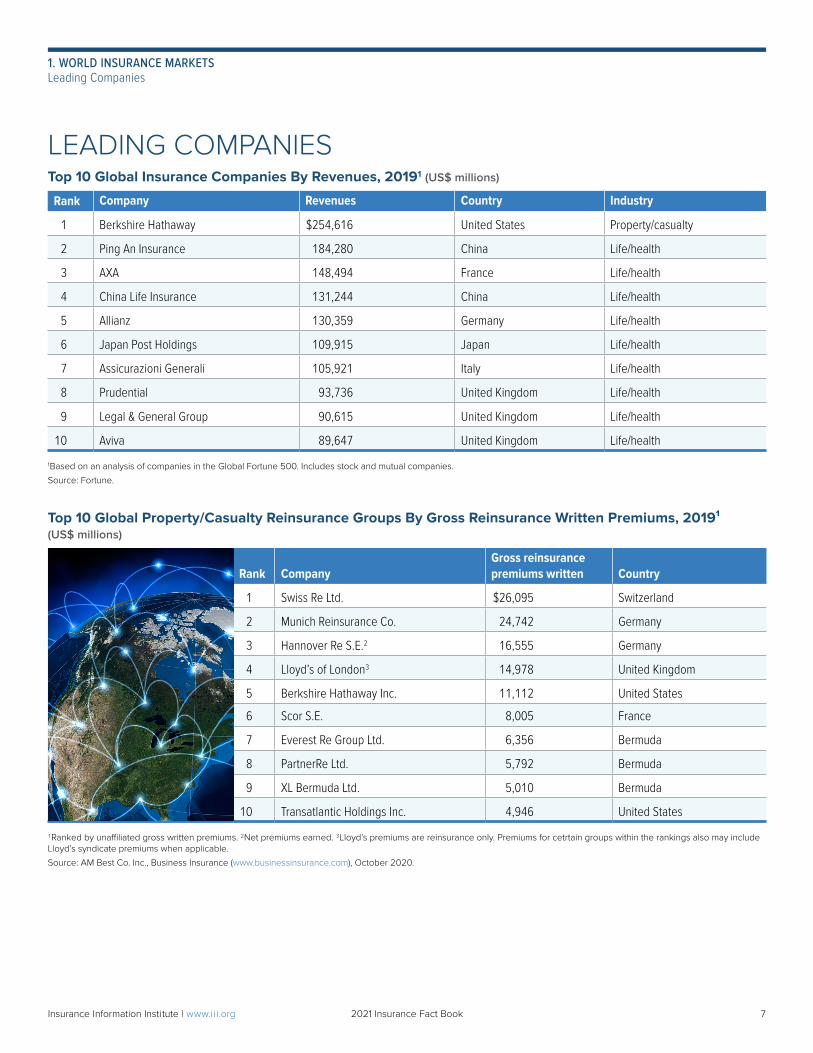
LEADING COMPANIESTop 10 Global Insurance Companies By Revenues, 20191 (US$ millions)
Rank Company Revenues Country Industry
1 Berkshire Hathaway $254,616 United States Property/casualty
2 Ping An Insurance 184,280 China Life/health
3 AXA 148,494 France Life/health
4 China Life Insurance 131,244 China Life/health
5 Allianz 130,359 Germany Life/health
6 Japan Post Holdings 109,915 Japan Life/health
7 Assicurazioni Generali 105,921 Italy Life/health
8 Prudential 93,736 United Kingdom Life/health
9 Legal & General Group 90,615 United Kingdom Life/health
10 Aviva 89,647 United Kingdom Life/health
1Based on an analysis of companies in the Global Fortune 500. Includes stock and mutual companies.
Source: Fortune.
Top 10 Global Property/Casualty Reinsurance Groups By Gross Reinsurance Written Premiums, 2019¹ (US$ millions)
Rank CompanyGross reinsurancepremiums written Country
1 Swiss Re Ltd. $26,095 Switzerland
2 Munich Reinsurance Co. 24,742 Germany
3 Hannover Re S.E.2 16,555 Germany
4 Lloyd’s of London3 14,978 United Kingdom
5 Berkshire Hathaway Inc. 11,112 United States
6 Scor S.E. 8,005 France
7 Everest Re Group Ltd. 6,356 Bermuda
8 PartnerRe Ltd. 5,792 Bermuda
9 XL Bermuda Ltd. 5,010 Bermuda
10 Transatlantic Holdings Inc. 4,946 United States
1Ranked by unaffiliated gross written premiums. 2Net premiums earned. 3Lloyd’s premiums are reinsurance only. Premiums for cetrtain groups within the rankings also may include Lloyd’s syndicate premiums when applicable.
Source: AM Best Co. Inc., Business Insurance (www.businessinsurance.com), October 2020.
7Insurance Information Institute | www.ii i.org 2021 Insurance Fact Book 7
1. WORLD INSURANCE MARKETSLeading Companies
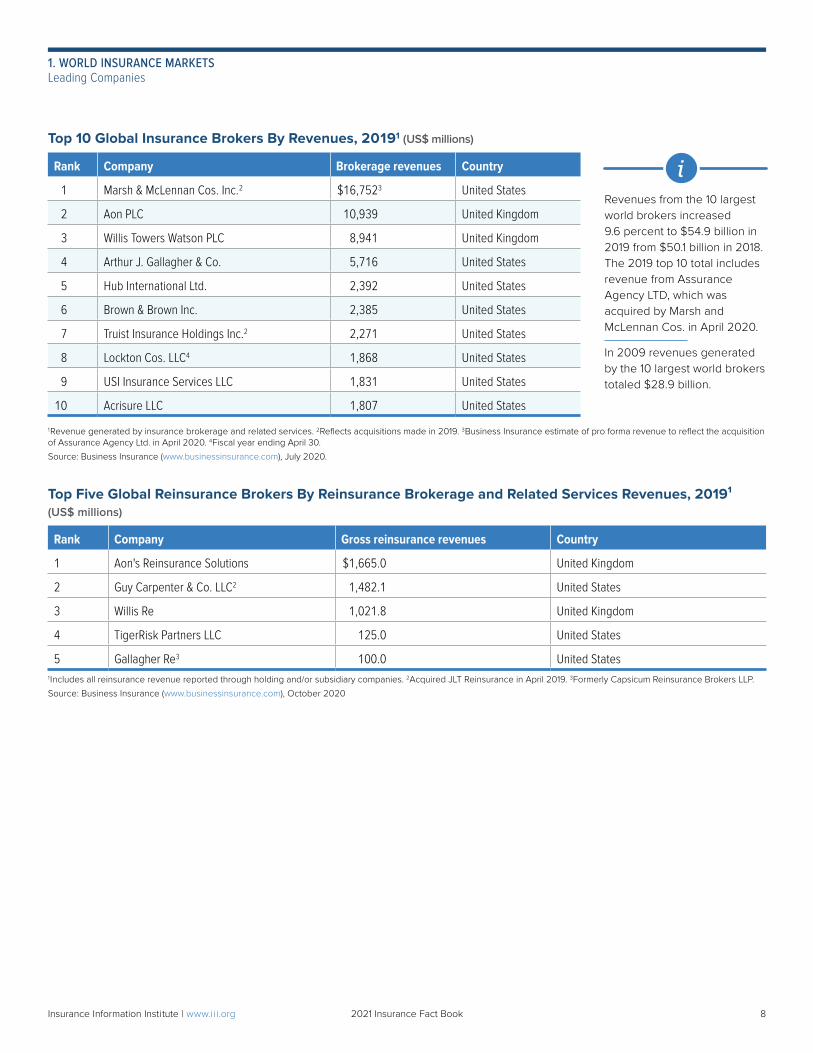
Top 10 Global Insurance Brokers By Revenues, 20191 (US$ millions)
Rank Company Brokerage revenues Country
1 Marsh & McLennan Cos. Inc.2 $16,7523 United States
2 Aon PLC 10,939 United Kingdom
3 Willis Towers Watson PLC 8,941 United Kingdom
4 Arthur J. Gallagher & Co. 5,716 United States
5 Hub International Ltd. 2,392 United States
6 Brown & Brown Inc. 2,385 United States
7 Truist Insurance Holdings Inc.2 2,271 United States
8 Lockton Cos. LLC4 1,868 United States
9 USI Insurance Services LLC 1,831 United States
10 Acrisure LLC 1,807 United States
1Revenue generated by insurance brokerage and related services. 2Reflects acquisitions made in 2019. 3Business Insurance estimate of pro forma revenue to reflect the acquisition of Assurance Agency Ltd. in April 2020. 4Fiscal year ending April 30.
Source: Business Insurance (www.businessinsurance.com), July 2020.
Top Five Global Reinsurance Brokers By Reinsurance Brokerage and Related Services Revenues, 2019¹ (US$ millions)
Rank Company Gross reinsurance revenues Country
1 Aon's Reinsurance Solutions $1,665.0 United Kingdom
2 Guy Carpenter & Co. LLC2 1,482.1 United States
3 Willis Re 1,021.8 United Kingdom
4 TigerRisk Partners LLC 125.0 United States
5 Gallagher Re3 100.0 United States1Includes all reinsurance revenue reported through holding and/or subsidiary companies. 2Acquired JLT Reinsurance in April 2019. 3Formerly Capsicum Reinsurance Brokers LLP.
Source: Business Insurance (www.businessinsurance.com), October 2020
iRevenues from the 10 largest world brokers increased 9.6 percent to $54.9 billion in 2019 from $50.1 billion in 2018. The 2019 top 10 total includes revenue from Assurance Agency LTD, which was acquired by Marsh and McLennan Cos. in April 2020.
In 2009 revenues generated by the 10 largest world brokers totaled $28.9 billion.
8Insurance Information Institute | www.ii i.org 2021 Insurance Fact Book 8
1. WORLD INSURANCE MARKETSLeading Companies
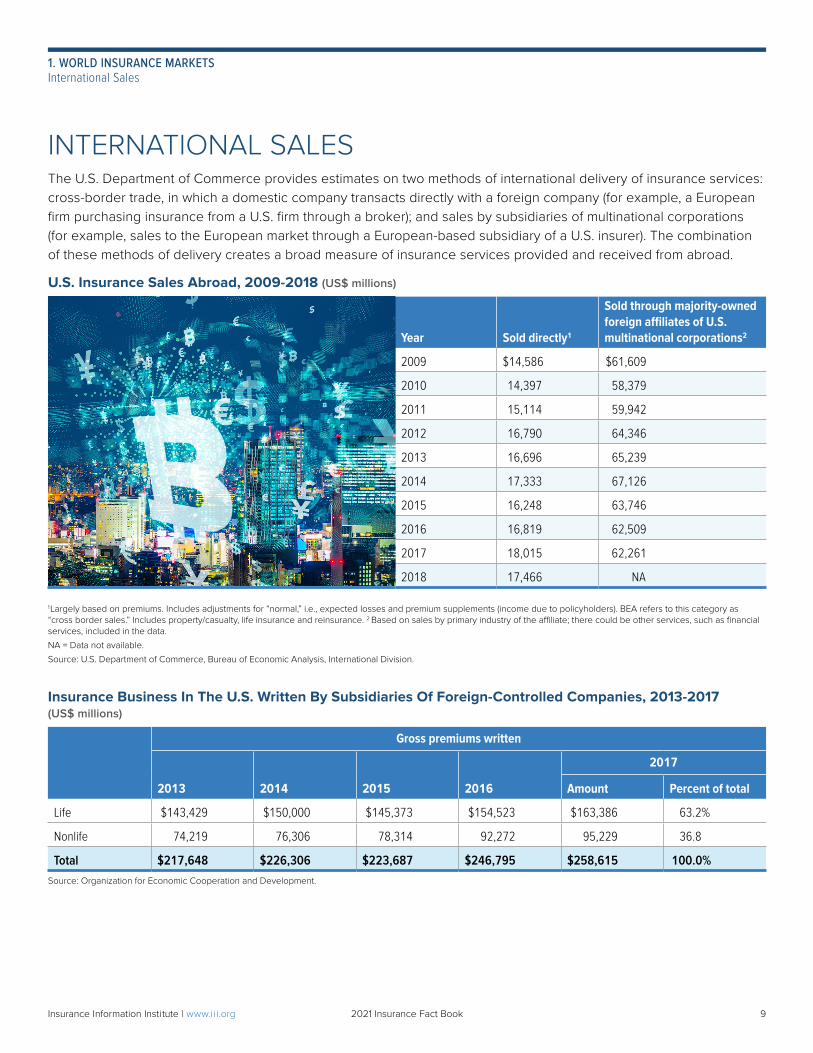
INTERNATIONAL SALESThe U.S. Department of Commerce provides estimates on two methods of international delivery of insurance services: cross-border trade, in which a domestic company transacts directly with a foreign company (for example, a European firm purchasing insurance from a U.S. firm through a broker); and sales by subsidiaries of multinational corporations (for example, sales to the European market through a European-based subsidiary of a U.S. insurer). The combination of these methods of delivery creates a broad measure of insurance services provided and received from abroad.
U.S. Insurance Sales Abroad, 2009-2018 (US$ millions)
Year Sold directly1
Sold through majority-owned foreign affiliates of U.S. multinational corporations2
2009 $14,586 $61,609
2010 14,397 58,379
2011 15,114 59,942
2012 16,790 64,346
2013 16,696 65,239
2014 17,333 67,126
2015 16,248 63,746
2016 16,819 62,509
2017 18,015 62,261
2018 17,466 NA
1Largely based on premiums. Includes adjustments for “normal,” i.e., expected losses and premium supplements (income due to policyholders). BEA refers to this category as “cross border sales.” Includes property/casualty, life insurance and reinsurance. 2 Based on sales by primary industry of the affiliate; there could be other services, such as financial services, included in the data.
NA = Data not available.
Source: U.S. Department of Commerce, Bureau of Economic Analysis, International Division.
Insurance Business In The U.S. Written By Subsidiaries Of Foreign-Controlled Companies, 2013-2017 (US$ millions)
Gross premiums written
2013 2014 2015 2016
2017
Amount Percent of total
Life $143,429 $150,000 $145,373 $154,523 $163,386 63.2%
Nonlife 74,219 76,306 78,314 92,272 95,229 36.8
Total $217,648 $226,306 $223,687 $246,795 $258,615 100.0%Source: Organization for Economic Cooperation and Development.
9Insurance Information Institute | www.ii i.org 2021 Insurance Fact Book 9
1. WORLD INSURANCE MARKETSInternational Sales
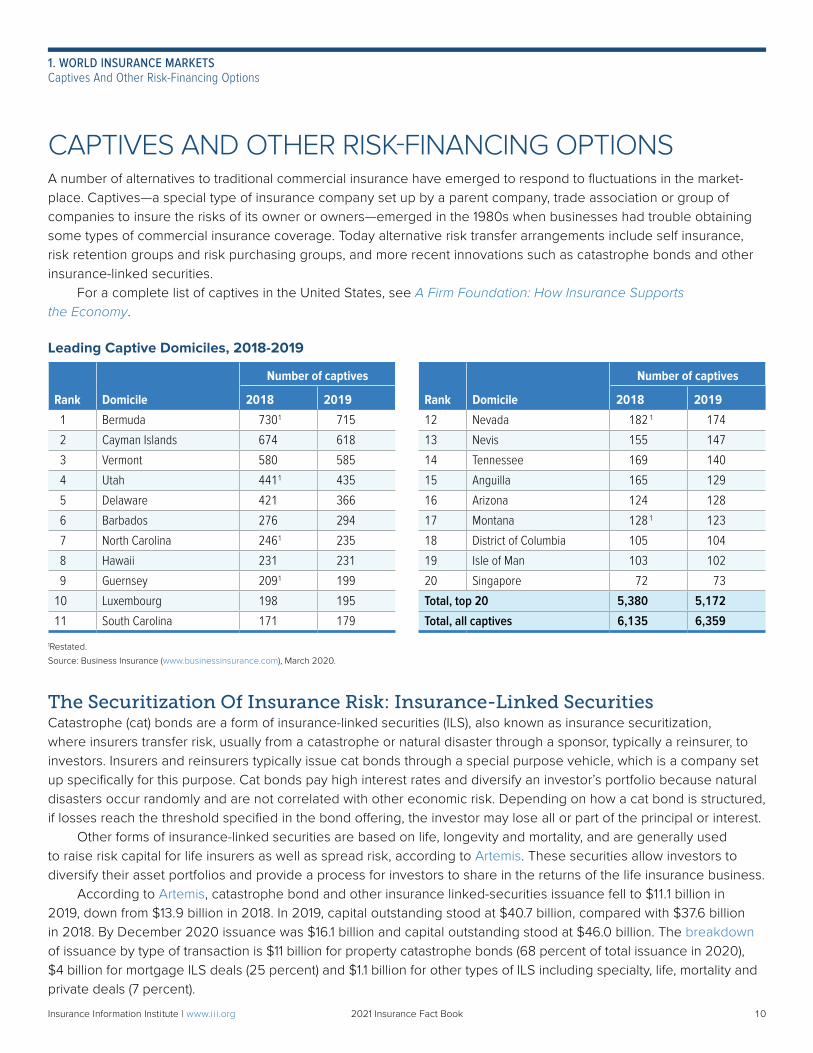
CAPTIVES AND OTHER RISK-FINANCING OPTIONSA number of alternatives to traditional commercial insurance have emerged to respond to fluctuations in the market-place. Captives—a special type of insurance company set up by a parent company, trade association or group of companies to insure the risks of its owner or owners—emerged in the 1980s when businesses had trouble obtaining some types of commercial insurance coverage. Today alternative risk transfer arrangements include self insurance, risk retention groups and risk purchasing groups, and more recent innovations such as catastrophe bonds and other insurance-linked securities. For a complete list of captives in the United States, see A Firm Foundation: How Insurance Supports the Economy.
Leading Captive Domiciles, 2018-2019
Rank Domicile
Number of captives
Rank Domicile
Number of captives
2018 2019 2018 2019
1 Bermuda 730 1 715 12 Nevada 182 1 174
2 Cayman Islands 674 618 13 Nevis 155 147
3 Vermont 580 585 14 Tennessee 169 140
4 Utah 441 1 435 15 Anguilla 165 129
5 Delaware 421 366 16 Arizona 124 128
6 Barbados 276 294 17 Montana 128 1 123
7 North Carolina 246 1 235 18 District of Columbia 105 104
8 Hawaii 231 231 19 Isle of Man 103 102
9 Guernsey 209 1 199 20 Singapore 72 73
10 Luxembourg 198 195 Total, top 20 5,380 5,172
11 South Carolina 171 179 Total, all captives 6,135 6,359
1Restated.
Source: Business Insurance (www.businessinsurance.com), March 2020.
The Securitization Of Insurance Risk: Insurance-Linked SecuritiesCatastrophe (cat) bonds are a form of insurance-linked securities (ILS), also known as insurance securitization, where insurers transfer risk, usually from a catastrophe or natural disaster through a sponsor, typically a reinsurer, to investors. Insurers and reinsurers typically issue cat bonds through a special purpose vehicle, which is a company set up specifically for this purpose. Cat bonds pay high interest rates and diversify an investor’s portfolio because natural disasters occur randomly and are not correlated with other economic risk. Depending on how a cat bond is structured, if losses reach the threshold specified in the bond offering, the investor may lose all or part of the principal or interest. Other forms of insurance-linked securities are based on life, longevity and mortality, and are generally used to raise risk capital for life insurers as well as spread risk, according to Artemis. These securities allow investors to diversify their asset portfolios and provide a process for investors to share in the returns of the life insurance business. According to Artemis, catastrophe bond and other insurance linked-securities issuance fell to $11.1 billion in 2019, down from $13.9 billion in 2018. In 2019, capital outstanding stood at $40.7 billion, compared with $37.6 billion in 2018. By December 2020 issuance was $16.1 billion and capital outstanding stood at $46.0 billion. The breakdown of issuance by type of transaction is $11 billion for property catastrophe bonds (68 percent of total issuance in 2020), $4 billion for mortgage ILS deals (25 percent) and $1.1 billion for other types of ILS including specialty, life, mortality and private deals (7 percent).
10Insurance Information Institute | www.ii i.org 2021 Insurance Fact Book 10
1. WORLD INSURANCE MARKETSCaptives And Other Risk-Financing Options
MICROINSURANCE AND EMERGING MARKETSMicroinsuranceA growing number of insurers are tapping into markets in developing countries through microinsurance projects, which provide low-cost insurance to individuals generally not covered by traditional insurance or government programs. Microinsurance covers those with low incomes for accidents, illnesses and natural disasters with premium payments customized for their income and level of risk, according to the Microinsurance Network. The global potential market for microinsurance is more than 2 billion people because microinsurance products tend to be much less costly than traditional products and thus extend protection to a much wider market. Products vary in type and structure but are generally distinguished by high volumes, low cost and efficient administration. Policies may be offered along with a small loan, with premiums as a small percentage of the loan amount. The approach is an outgrowth of the micro-financing projects developed by Bangladeshi Nobel Prize-winning banker and economist Muhammad Yunus, who helped millions of low-income individuals in Asia and Africa to set up businesses and buy houses. Today many innovative microinsurance products have been developed to protect the working poor against the financial impact of losses. The Microinsurance Network is a nonprofit global organization of microinsurance industry experts comprised of 80 institutional members from more than 40 countries committed to promoting the development and delivery of valuable insurance services for low-income people. According to the Network’s Annual Report 2017, while emerging markets account for around one-fifth of total global premium, they represent 80 percent of the world population, pointing toward an enormous potential for growth. The Network’s World Map of Microinsurance shows that almost 290 million people worldwide are covered by at least one microinsurance policy.
Insurance In Emerging MarketsWith limited growth prospects in the insurance markets of developed countries, insurers see emerging economies as presenting significant potential for growth and profitability. Premium growth in developing countries has been outpacing growth in industrialized countries. Swiss Re identifies emerging markets as countries in South and East Asia, Latin America and the Caribbean, Central and Eastern Europe, Africa, the Middle East (excluding Israel), Central Asia, and Turkey. Swiss Re’s 2020 sigma report on world insurance markets reported that premiums in emerging countries rose 6.6 percent in 2019, after adjusting for inflation, compared with 1.9 percent in 2018, and were mainly China-driven. Growth in developing markets outpaced growth in advanced markets, where premiums increased 2.1 percent in 2019 after rising 3.5 percent in 2018. Emerging markets accounted for 18.5 percent of total global premium volume in 2019, compared with 21.3 percent in 2018. Life sector premiums rose 5.6 percent in emerging markets in 2019, after inflation, following a 2.0 percent decrease in 2018. In advanced markets, life premiums rose 1.3 percent in 2019 and 3.9 percent in 2018. Nonlife sector premiums in emerging markets rose 7.7 percent in 2019, adjusted for inflation, compared with 6.9 percent in 2018, while nonlife premiums rose 2.7 percent last year in advanced markets after increasing 3.1 percent in 2018. Swiss Re expects premiums for life insurance to stagnate in 2020 in emerging markets in response to the COVID-19 pandemic, except for emerging Asia, and recover in 2021, particularly in China. The downturn in 2020 will affect emerging markets in Europe the most. Nonlife premiums are expected to grow 3 percent in 2020 in emerging markets, compared with declining 0.1 percent in total markets. Total premiums in emerging markets are expected to grow 7 percent in 2021.
11Insurance Information Institute | www.ii i.org 2021 Insurance Fact Book 11
1. WORLD INSURANCE MARKETSMicroinsurance And Emerging Markets
Other insurance channels: Emerging markets also benefit from remittances, which represent a significant way migrants send payments to their families in their home countries. The World Bank estimated that remittances amounted to $554 billion worldwide in 2019 and were the largest source of capital for low- and middle-income countries. During the COVID-19 pandemic, the World Bank expects remittances to fall 20 percent to $445 billion. The largest remittances flow into countries that have the largest number of emigrants living in advanced economies. Central America, the Middle East and countries that were in the former Soviet Union are the most reliant on remittances. According to Swiss Re, these payments improve the economic welfare and resilience in home countries. Currently only a small fraction of remittance payments is insured for the death or disability of the sender. Migrants using remittance systems can be made aware of the benefits of insuring their remittances. Swiss Re estimates that insurance premiums linked to remittances could reach $1 billion in the next decade. Insurers could then begin to introduce other traditional insurance products such as auto, accident or renters insurance. The parametric model is an alternative to traditional insurance where a specific trigger generates claims payments immediately. Triggers are designed to be objective and transparent, and insurers must thoroughly understand the consequences of the trigger. A payment schedule is set in advance based on the severity of an event. For example, an earthquake that reaches a certain magnitude defined by the U.S. Geological Survey, or a hurricane that meets the criteria of a certain category of storm by the National Weather Service, would serve as triggers. Other examples are crop yields and rainfall totals. Payments are made as soon as the triggers are reached, whether actual losses were sustained. Parametric insurance gives customers the advantage of fast claims payouts, often via mobile phone networks. For commercial insurers, it removes some of the barriers they face when entering new and developing markets. The Microinsurance Network looks to parametric insurance as a solution to losses by small farmers around the world who may be affected by extreme weather conditions.
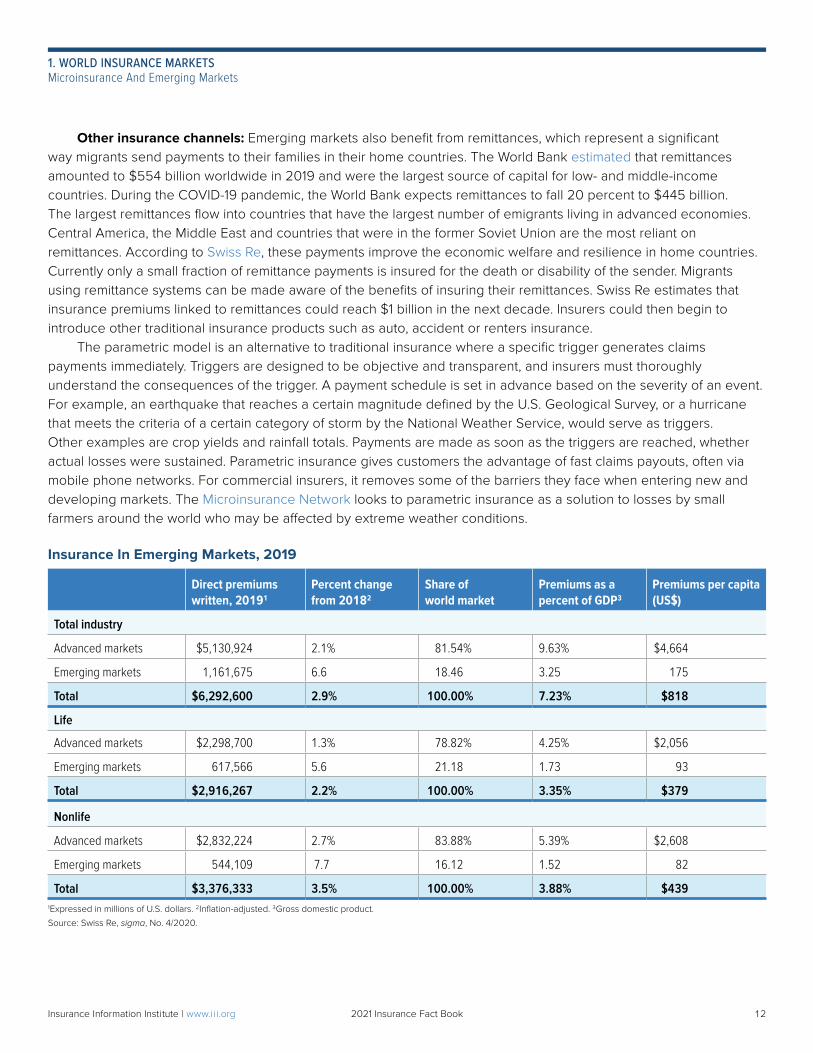
Insurance In Emerging Markets, 2019
Direct premiums written, 20191
Percent change from 20182
Share of world market
Premiums as a percent of GDP3
Premiums per capita (US$)
Total industry
Advanced markets $5,130,924 2.1% 81.54% 9.63% $4,664
Emerging markets 1,161,675 6.6 18.46 3.25 175
Total $6,292,600 2.9% 100.00% 7.23% $818
Life
Advanced markets $2,298,700 1.3% 78.82% 4.25% $2,056
Emerging markets 617,566 5.6 21.18 1.73 93
Total $2,916,267 2.2% 100.00% 3.35% $379
Nonlife
Advanced markets $2,832,224 2.7% 83.88% 5.39% $2,608
Emerging markets 544,109 7.7 16.12 1.52 82
Total $3,376,333 3.5% 100.00% 3.88% $439 1Expressed in millions of U.S. dollars. 2Inflation-adjusted. 3Gross domestic product.
Source: Swiss Re, sigma, No. 4/2020.
12Insurance Information Institute | www.ii i.org 2021 Insurance Fact Book 12
1. WORLD INSURANCE MARKETSMicroinsurance And Emerging Markets
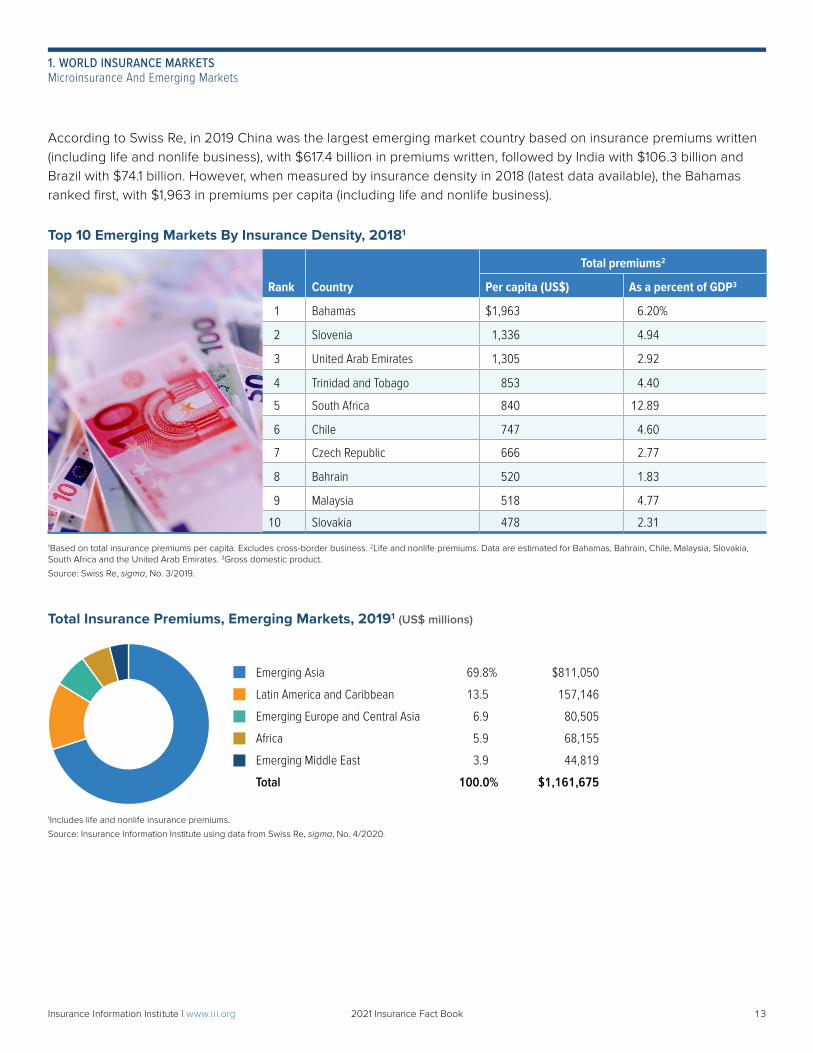
According to Swiss Re, in 2019 China was the largest emerging market country based on insurance premiums written (including life and nonlife business), with $617.4 billion in premiums written, followed by India with $106.3 billion and Brazil with $74.1 billion. However, when measured by insurance density in 2018 (latest data available), the Bahamas ranked first, with $1,963 in premiums per capita (including life and nonlife business).
Top 10 Emerging Markets By Insurance Density, 20181
Rank Country
Total premiums2
Per capita (US$) As a percent of GDP3
1 Bahamas $1,963 6.20%
2 Slovenia 1,336 4.94
3 United Arab Emirates 1,305 2.92
4 Trinidad and Tobago 853 4.40
5 South Africa 840 12.89
6 Chile 747 4.60
7 Czech Republic 666 2.77
8 Bahrain 520 1.83
9 Malaysia 518 4.77
10 Slovakia 478 2.31
1Based on total insurance premiums per capita. Excludes cross-border business. 2Life and nonlife premiums. Data are estimated for Bahamas, Bahrain, Chile, Malaysia, Slovakia, South Africa and the United Arab Emirates. 3Gross domestic product.
Source: Swiss Re, sigma, No. 3/2019.
Total Insurance Premiums, Emerging Markets, 20191 (US$ millions)
1Includes life and nonlife insurance premiums.
Source: Insurance Information Institute using data from Swiss Re, sigma, No. 4/2020.
Emerging Asia 69.8% $811,050
Latin America and Caribbean 13.5 157,146
Emerging Europe and Central Asia 6.9 80,505
Africa 5.9 68,155
Emerging Middle East 3.9 44,819
Total 100.0% $1,161,675
13Insurance Information Institute | www.ii i.org 2021 Insurance Fact Book 13
1. WORLD INSURANCE MARKETSMicroinsurance And Emerging Markets
Chapter 2
U.S. Insurance Industry, All Sectors
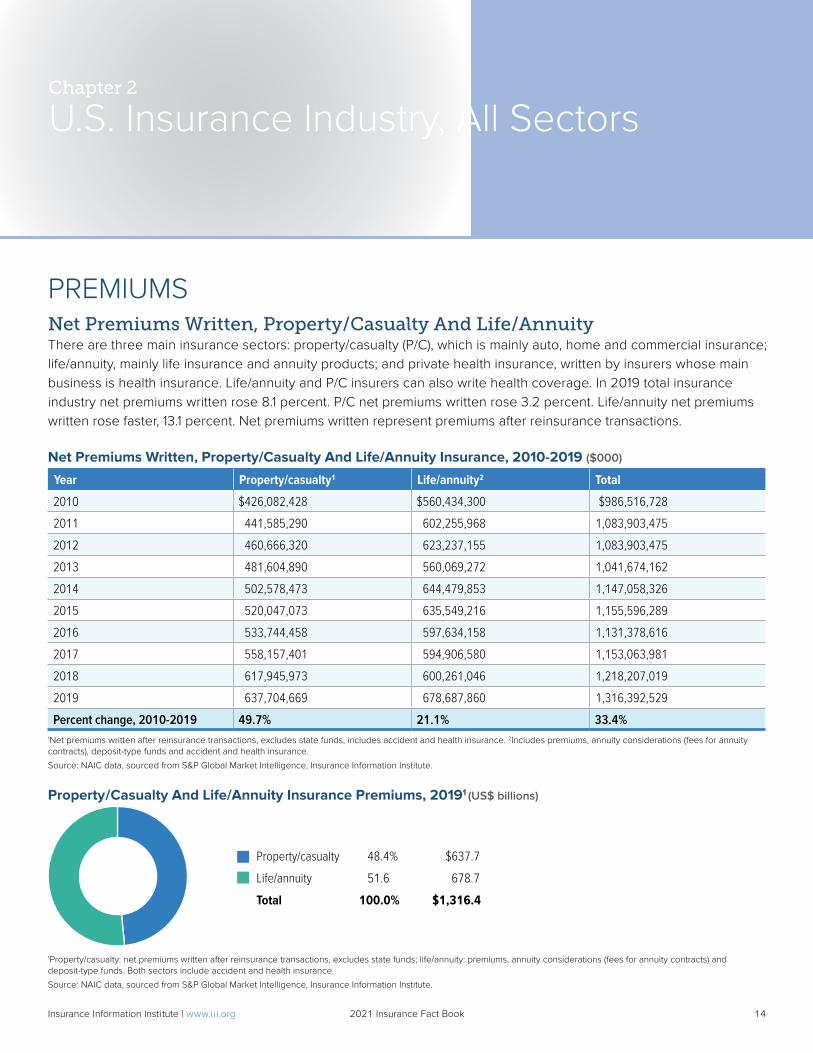
PREMIUMSNet Premiums Written, Property/Casualty And Life/AnnuityThere are three main insurance sectors: property/casualty (P/C), which is mainly auto, home and commercial insurance; life/annuity, mainly life insurance and annuity products; and private health insurance, written by insurers whose main business is health insurance. Life/annuity and P/C insurers can also write health coverage. In 2019 total insurance industry net premiums written rose 8.1 percent. P/C net premiums written rose 3.2 percent. Life/annuity net premiums written rose faster, 13.1 percent. Net premiums written represent premiums after reinsurance transactions.
Net Premiums Written, Property/Casualty And Life/Annuity Insurance, 2010-2019 ($000)
Year Property/casualty1 Life/annuity2 Total
2010 $426,082,428 $560,434,300 $986,516,728
2011 441,585,290 602,255,968 1,083,903,475
2012 460,666,320 623,237,155 1,083,903,475
2013 481,604,890 560,069,272 1,041,674,162
2014 502,578,473 644,479,853 1,147,058,326
2015 520,047,073 635,549,216 1,155,596,289
2016 533,744,458 597,634,158 1,131,378,616
2017 558,157,401 594,906,580 1,153,063,981
2018 617,945,973 600,261,046 1,218,207,019
2019 637,704,669 678,687,860 1,316,392,529
Percent change, 2010-2019 49.7% 21.1% 33.4%1Net premiums written after reinsurance transactions, excludes state funds, includes accident and health insurance. 2Includes premiums, annuity considerations (fees for annuity contracts), deposit-type funds and accident and health insurance.
Source: NAIC data, sourced from S&P Global Market Intelligence, Insurance Information Institute.
Property/Casualty And Life/Annuity Insurance Premiums, 20191 (US$ billions)
Property/casualty 48.4% $637.7
Life/annuity 51.6 678.7
Total 100.0% $1,316.4
1Property/casualty: net premiums written after reinsurance transactions, excludes state funds; life/annuity: premiums, annuity considerations (fees for annuity contracts) and deposit-type funds. Both sectors include accident and health insurance.
Source: NAIC data, sourced from S&P Global Market Intelligence, Insurance Information Institute.
14Insurance Information Institute | www.ii i.org 2021 Insurance Fact Book 14
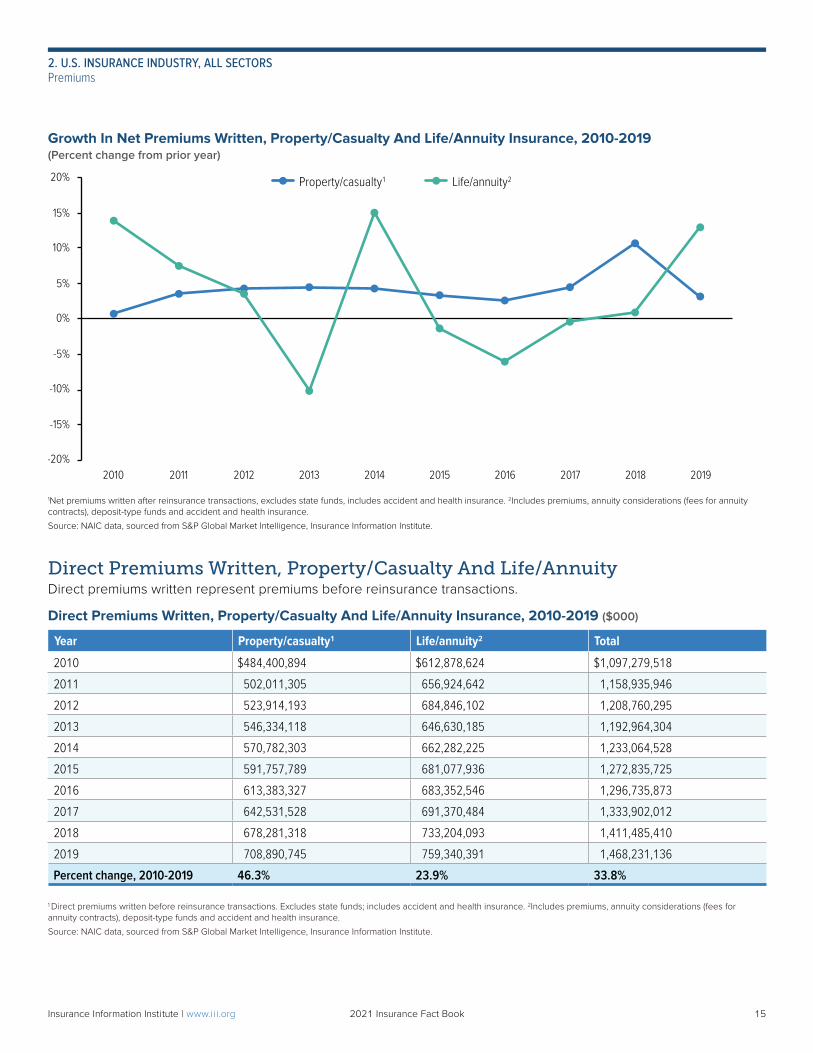
Growth In Net Premiums Written, Property/Casualty And Life/Annuity Insurance, 2010-2019 (Percent change from prior year)
1Net premiums written after reinsurance transactions, excludes state funds, includes accident and health insurance. 2Includes premiums, annuity considerations (fees for annuity contracts), deposit-type funds and accident and health insurance.
Source: NAIC data, sourced from S&P Global Market Intelligence, Insurance Information Institute.
Direct Premiums Written, Property/Casualty And Life/Annuity Direct premiums written represent premiums before reinsurance transactions.
Direct Premiums Written, Property/Casualty And Life/Annuity Insurance, 2010-2019 ($000)
Year Property/casualty1 Life/annuity2 Total
2010 $484,400,894 $612,878,624 $1,097,279,518
2011 502,011,305 656,924,642 1,158,935,946
2012 523,914,193 684,846,102 1,208,760,295
2013 546,334,118 646,630,185 1,192,964,304
2014 570,782,303 662,282,225 1,233,064,528
2015 591,757,789 681,077,936 1,272,835,725
2016 613,383,327 683,352,546 1,296,735,873
2017 642,531,528 691,370,484 1,333,902,012
2018 678,281,318 733,204,093 1,411,485,410
2019 708,890,745 759,340,391 1,468,231,136
Percent change, 2010-2019 46.3% 23.9% 33.8%
1 Direct premiums written before reinsurance transactions. Excludes state funds; includes accident and health insurance. 2Includes premiums, annuity considerations (fees for annuity contracts), deposit-type funds and accident and health insurance.
Source: NAIC data, sourced from S&P Global Market Intelligence, Insurance Information Institute.
-20%
-15%
-10%
-5%
0%
5%
10%
15%
20%
2010 2011 2012 2013 2014 2015 2016 2017 2018 2019
(
Property/casualty1 Life/annuity2
15Insurance Information Institute | www.ii i.org 2021 Insurance Fact Book 15
2. U.S. INSURANCE INDUSTRY, ALL SECTORSPremiums
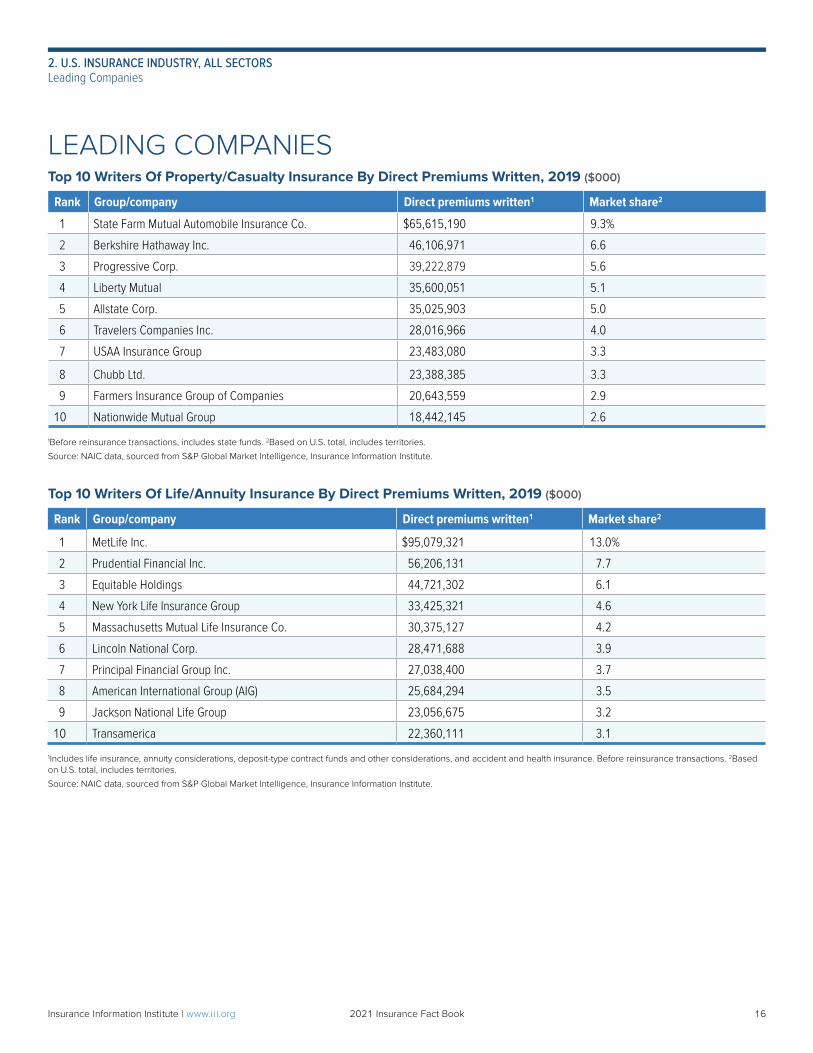
LEADING COMPANIESTop 10 Writers Of Property/Casualty Insurance By Direct Premiums Written, 2019 ($000)
Rank Group/company Direct premiums written1 Market share2
1 State Farm Mutual Automobile Insurance Co. $65,615,190 9.3%
2 Berkshire Hathaway Inc. 46,106,971 6.6
3 Progressive Corp. 39,222,879 5.6
4 Liberty Mutual 35,600,051 5.1
5 Allstate Corp. 35,025,903 5.0
6 Travelers Companies Inc. 28,016,966 4.0
7 USAA Insurance Group 23,483,080 3.3
8 Chubb Ltd. 23,388,385 3.3
9 Farmers Insurance Group of Companies 20,643,559 2.9
10 Nationwide Mutual Group 18,442,145 2.6
1Before reinsurance transactions, includes state funds. 2Based on U.S. total, includes territories.
Source: NAIC data, sourced from S&P Global Market Intelligence, Insurance Information Institute.
Top 10 Writers Of Life/Annuity Insurance By Direct Premiums Written, 2019 ($000)
Rank Group/company Direct premiums written1 Market share2
1 MetLife Inc. $95,079,321 13.0%
2 Prudential Financial Inc. 56,206,131 7.7
3 Equitable Holdings 44,721,302 6.1
4 New York Life Insurance Group 33,425,321 4.6
5 Massachusetts Mutual Life Insurance Co. 30,375,127 4.2
6 Lincoln National Corp. 28,471,688 3.9
7 Principal Financial Group Inc. 27,038,400 3.7
8 American International Group (AIG) 25,684,294 3.5
9 Jackson National Life Group 23,056,675 3.2
10 Transamerica 22,360,111 3.1
1Includes life insurance, annuity considerations, deposit-type contract funds and other considerations, and accident and health insurance. Before reinsurance transactions. 2Based on U.S. total, includes territories.
Source: NAIC data, sourced from S&P Global Market Intelligence, Insurance Information Institute.
16Insurance Information Institute | www.ii i.org 2021 Insurance Fact Book 16
2. U.S. INSURANCE INDUSTRY, ALL SECTORSLeading Companies
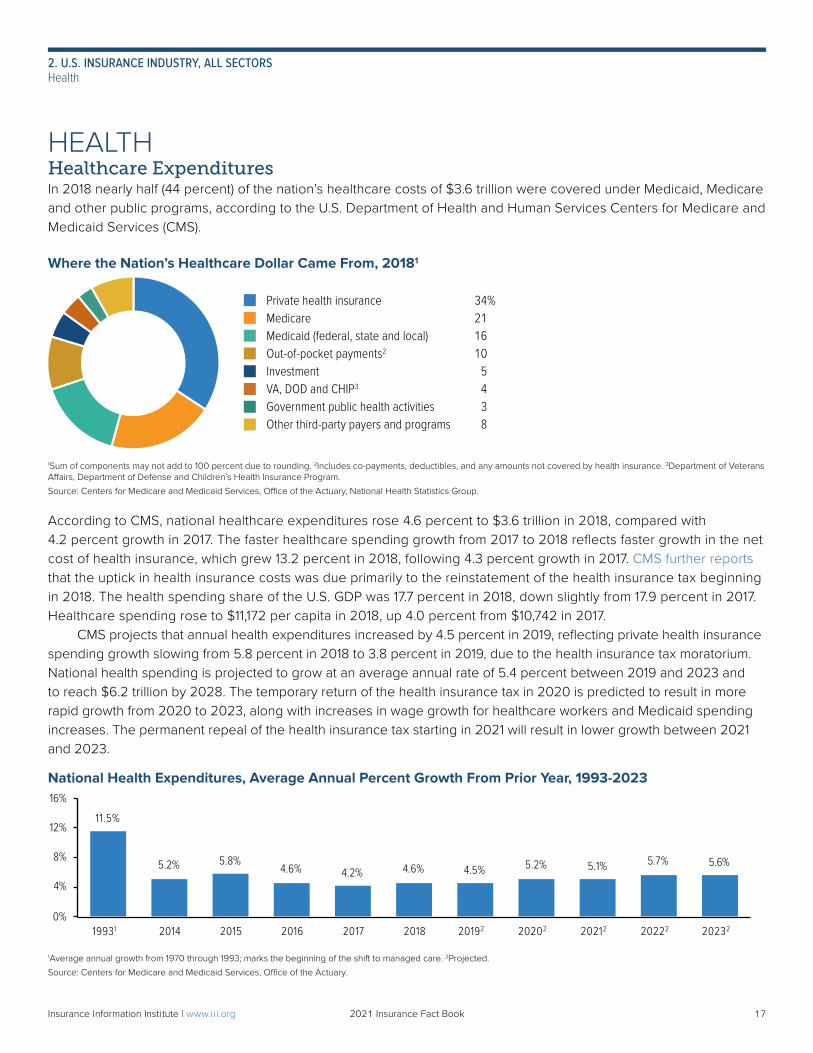
HEALTHHealthcare ExpendituresIn 2018 nearly half (44 percent) of the nation’s healthcare costs of $3.6 trillion were covered under Medicaid, Medicare and other public programs, according to the U.S. Department of Health and Human Services Centers for Medicare and Medicaid Services (CMS).
Where the Nation’s Healthcare Dollar Came From, 20181
1Sum of components may not add to 100 percent due to rounding. 2Includes co-payments, deductibles, and any amounts not covered by health insurance. 3Department of Veterans Affairs, Department of Defense and Children’s Health Insurance Program.
Source: Centers for Medicare and Medicaid Services, Office of the Actuary, National Health Statistics Group.
According to CMS, national healthcare expenditures rose 4.6 percent to $3.6 trillion in 2018, compared with 4.2 percent growth in 2017. The faster healthcare spending growth from 2017 to 2018 reflects faster growth in the net cost of health insurance, which grew 13.2 percent in 2018, following 4.3 percent growth in 2017. CMS further reports that the uptick in health insurance costs was due primarily to the reinstatement of the health insurance tax beginning in 2018. The health spending share of the U.S. GDP was 17.7 percent in 2018, down slightly from 17.9 percent in 2017. Healthcare spending rose to $11,172 per capita in 2018, up 4.0 percent from $10,742 in 2017. CMS projects that annual health expenditures increased by 4.5 percent in 2019, reflecting private health insurance spending growth slowing from 5.8 percent in 2018 to 3.8 percent in 2019, due to the health insurance tax moratorium. National health spending is projected to grow at an average annual rate of 5.4 percent between 2019 and 2023 and to reach $6.2 trillion by 2028. The temporary return of the health insurance tax in 2020 is predicted to result in more rapid growth from 2020 to 2023, along with increases in wage growth for healthcare workers and Medicaid spending increases. The permanent repeal of the health insurance tax starting in 2021 will result in lower growth between 2021 and 2023.
National Health Expenditures, Average Annual Percent Growth From Prior Year, 1993-2023
1Average annual growth from 1970 through 1993; marks the beginning of the shift to managed care. 2Projected.
Source: Centers for Medicare and Medicaid Services, Office of the Actuary.
Private health insurance 34%Medicare 21Medicaid (federal, state and local) 16Out-of-pocket payments2 10Investment 5VA, DOD and CHIP3 4Government public health activities 3Other third-party payers and programs 8
11.5%
5.2% 5.8%4.6% 4.2% 4.6% 4.5% 5.2% 5.1% 5.7% 5.6%
0%
4%
8%
12%
16%
19931 2014 2015 2016 2017 2018 20192 20202 20212 20222 20232
17Insurance Information Institute | www.ii i.org 2021 Insurance Fact Book 17
2. U.S. INSURANCE INDUSTRY, ALL SECTORSHealth
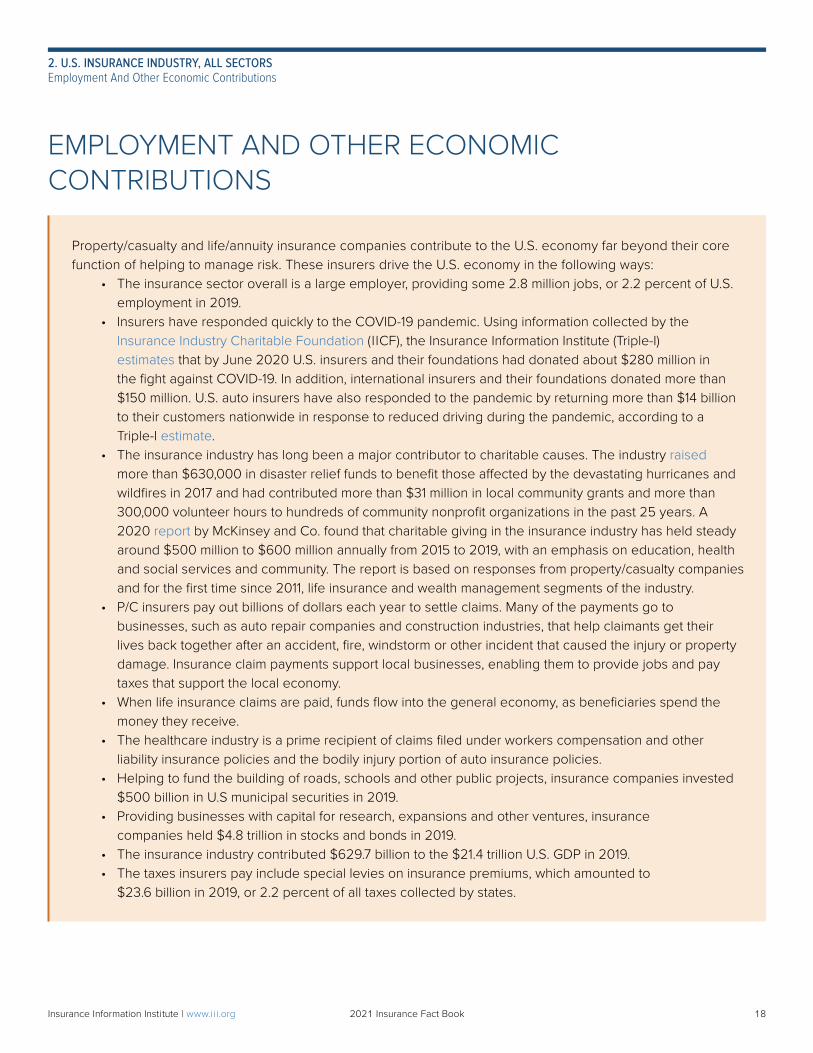
EMPLOYMENT AND OTHER ECONOMIC CONTRIBUTIONS
Property/casualty and life/annuity insurance companies contribute to the U.S. economy far beyond their core function of helping to manage risk. These insurers drive the U.S. economy in the following ways:
• The insurance sector overall is a large employer, providing some 2.8 million jobs, or 2.2 percent of U.S. employment in 2019.
• Insurers have responded quickly to the COVID-19 pandemic. Using information collected by the Insurance Industry Charitable Foundation (IICF), the Insurance Information Institute (Triple-I) estimates that by June 2020 U.S. insurers and their foundations had donated about $280 million in the fight against COVID-19. In addition, international insurers and their foundations donated more than $150 million. U.S. auto insurers have also responded to the pandemic by returning more than $14 billion to their customers nationwide in response to reduced driving during the pandemic, according to a Triple-I estimate.
• The insurance industry has long been a major contributor to charitable causes. The industry raised more than $630,000 in disaster relief funds to benefit those affected by the devastating hurricanes and wildfires in 2017 and had contributed more than $31 million in local community grants and more than 300,000 volunteer hours to hundreds of community nonprofit organizations in the past 25 years. A 2020 report by McKinsey and Co. found that charitable giving in the insurance industry has held steady around $500 million to $600 million annually from 2015 to 2019, with an emphasis on education, health and social services and community. The report is based on responses from property/casualty companies and for the first time since 2011, life insurance and wealth management segments of the industry.
• P/C insurers pay out billions of dollars each year to settle claims. Many of the payments go to businesses, such as auto repair companies and construction industries, that help claimants get their lives back together after an accident, fire, windstorm or other incident that caused the injury or property damage. Insurance claim payments support local businesses, enabling them to provide jobs and pay taxes that support the local economy.
• When life insurance claims are paid, funds flow into the general economy, as beneficiaries spend the money they receive.
• The healthcare industry is a prime recipient of claims filed under workers compensation and other liability insurance policies and the bodily injury portion of auto insurance policies.
• Helping to fund the building of roads, schools and other public projects, insurance companies invested $500 billion in U.S municipal securities in 2019.
• Providing businesses with capital for research, expansions and other ventures, insurance companies held $4.8 trillion in stocks and bonds in 2019.
• The insurance industry contributed $629.7 billion to the $21.4 trillion U.S. GDP in 2019.• The taxes insurers pay include special levies on insurance premiums, which amounted to
$23.6 billion in 2019, or 2.2 percent of all taxes collected by states.
18Insurance Information Institute | www.ii i.org 2021 Insurance Fact Book 18
2. U.S. INSURANCE INDUSTRY, ALL SECTORSEmployment And Other Economic Contributions
Employment In Insurance, 2010-2019 (Annual averages, 000)
Year
Insurance carriersInsurance agencies, brokerages
and related services
Totalindustry
Direct insurers1
Reinsurers Total
Insurance agencies and brokers
Other insurance-related activities3 Total
Life and health2
Property/casualty
2010 804.1 614.3 26.8 1,445.2 642.3 253.1 895.5 2,340.6
2011 788.9 611.6 25.6 1,426.1 649.2 261.1 910.3 2,336.4
2012 811.3 599.5 25.7 1,436.5 659.6 272.3 931.8 2,368.3
2013 813.2 593.7 26.2 1,433.1 672.3 283.5 955.8 2,388.9
2014 829.0 594.7 25.1 1,448.8 720.0 297.1 1,017.1 2,465.8
2015 829.8 611.6 25.1 1,466.5 762.8 309.1 1,071.8 2,538.3
2016 818.9 643.5 25.3 1,487.7 783.5 321.5 1,105.0 2,592.7
2017 850.4 639.7 26.6 1,516.7 809.6 333.3 1,142.9 2,659.6
2018 882.8 629.5 28.6 1,540.9 825.6 346.2 1,171.8 2,712.7
2019 923.0 647.0 28.5 1,598.5 843.0 348.7 1,191.7 2,790.21Establishments primarily engaged in initially underwriting insurance policies. 2Includes establishments engaged in underwriting annuities, life insurance and health and medical insurance policies. 3Includes claims adjusters, third-party administrators of insurance funds and other service personnel such as advisory and insurance ratemaking services.
Source: U.S. Department of Labor, Bureau of Labor Statistics.
19Insurance Information Institute | www.ii i.org 2021 Insurance Fact Book 19
2. U.S. INSURANCE INDUSTRY, ALL SECTORSEmployment And Other Economic Contributions
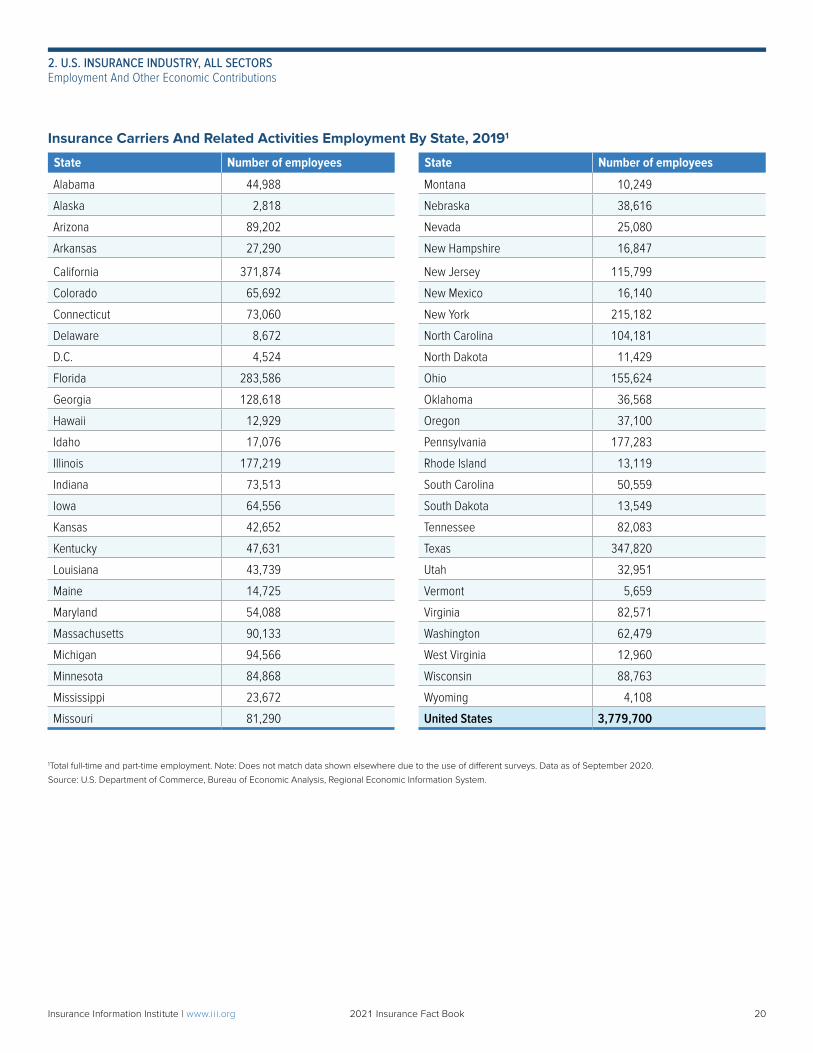
Insurance Carriers And Related Activities Employment By State, 20191
State Number of employees State Number of employees
Alabama 44,988 Montana 10,249
Alaska 2,818 Nebraska 38,616
Arizona 89,202 Nevada 25,080
Arkansas 27,290 New Hampshire 16,847
California 371,874 New Jersey 115,799
Colorado 65,692 New Mexico 16,140
Connecticut 73,060 New York 215,182
Delaware 8,672 North Carolina 104,181
D.C. 4,524 North Dakota 11,429
Florida 283,586 Ohio 155,624
Georgia 128,618 Oklahoma 36,568
Hawaii 12,929 Oregon 37,100
Idaho 17,076 Pennsylvania 177,283
Illinois 177,219 Rhode Island 13,119
Indiana 73,513 South Carolina 50,559
Iowa 64,556 South Dakota 13,549
Kansas 42,652 Tennessee 82,083
Kentucky 47,631 Texas 347,820
Louisiana 43,739 Utah 32,951
Maine 14,725 Vermont 5,659
Maryland 54,088 Virginia 82,571
Massachusetts 90,133 Washington 62,479
Michigan 94,566 West Virginia 12,960
Minnesota 84,868 Wisconsin 88,763
Mississippi 23,672 Wyoming 4,108
Missouri 81,290 United States 3,779,700
1Total full-time and part-time employment. Note: Does not match data shown elsewhere due to the use of different surveys. Data as of September 2020.
Source: U.S. Department of Commerce, Bureau of Economic Analysis, Regional Economic Information System.
20Insurance Information Institute | www.ii i.org 2021 Insurance Fact Book 20
2. U.S. INSURANCE INDUSTRY, ALL SECTORSEmployment And Other Economic Contributions
Gross Domestic Product
Insurance Sector’s Share Of Gross Domestic Product (GDP), 2015-2019 ($ billions)
Year Total GDP
Insurance carriers and related activities
GDP Percent of total GDP
2015 $18,224.8 $552.3 3.0%
2016 18,715.0 569.1 3.0
2017 19,519.4 558.8 2.9
2018 20,580.2 609.2 3.0
2019 21,427.7 629.7 2.9Source: U.S. Department of Commerce, Bureau of Economic Analysis.
Ownership Of U.S. Municipal SecuritiesInsurance companies help fund the construction of schools, roads and other public sector projects through their investments in municipal securities, which totaled $500 billion in 2019. The property/casualty insurance industry invested $285 billion in such securities in 2019, and the life/annuity insurance industry invested $215 billion, according to the Federal Reserve. (See here and here for further information on insurance industry investments.)
Insurance Company Holdings Of U.S. Municipal Securities, 2015-2019 ($ billions, end of year)
2015 2016 2017 2018 2019
Property/casualty insurance companies $357.5 $350.7 $338.9 $291.6 $285.2
Life insurance companies 177.3 185.2 197.8 190.0 215.0
Total $534.8 $535.9 $536.7 $481.6 $500.2Source: Board of Governors of the Federal Reserve System, June 11, 2020.
MERGERS AND ACQUISITIONSThe number of announced global insurance-related mergers and acquisitions (M&A) rose to 1,179 transactions in 2019 from 1,031 in 2018, as distribution transactions remain at record highs. However, the value of those transactions fell to $56.1 billion in 2019, from $147.6 billion in 2018, according to Conning Research. In the P/C sector M&A slowed about 6 percent from a year ago, with 98 transactions globally compared with 104 in 2018, and $16.1 billion in transaction values compared with $40.8 billion in 2018. Conning attributes the decline to firming prices that led to rising premiums, which in turn decreased the need to acquire companies; reserve adequacy concerns at targets; and higher prices for higher-quality companies. In the life/annuity sector M&A transactions totaled 61 in 2019, down from 69 in 2018. The sector had $14.2 billion in transaction values, down by about half from the 2018 value of $28 billion. In 2019 the number of insurance-related deals in which a U.S. firm was either a buyer or a target rose 7.4 percent to 825 from 768 transactions in 2018. The value of properties acquired in 2018 U.S. deals plummeted 58.7 percent to $41.5 billion from $100.5 billion in 2018, according to Conning data. The number of non-U.S. insurance-related M&A transactions (i.e., where a non-U.S. company was both buyer and seller) rose in 2019 to 354 from 263 in 2018, or 34.6 percent. The reported value of non-U.S. deals dropped 69 percent to $14.6 billion in 2019 from $47 billion in 2018.
Gross domestic product (GDP) is the total value of all final goods and services produced in the economy. The GDP growth rate is the primary indicator of the state of the economy.
The insurance industry contributed $629.7 billion to the $21.4 trillion GDP in 2019.
i
21Insurance Information Institute | www.ii i.org 2021 Insurance Fact Book 21
2. U.S. INSURANCE INDUSTRY, ALL SECTORSEmployment And Other Economic Contributions/Mergers and Acquisitions
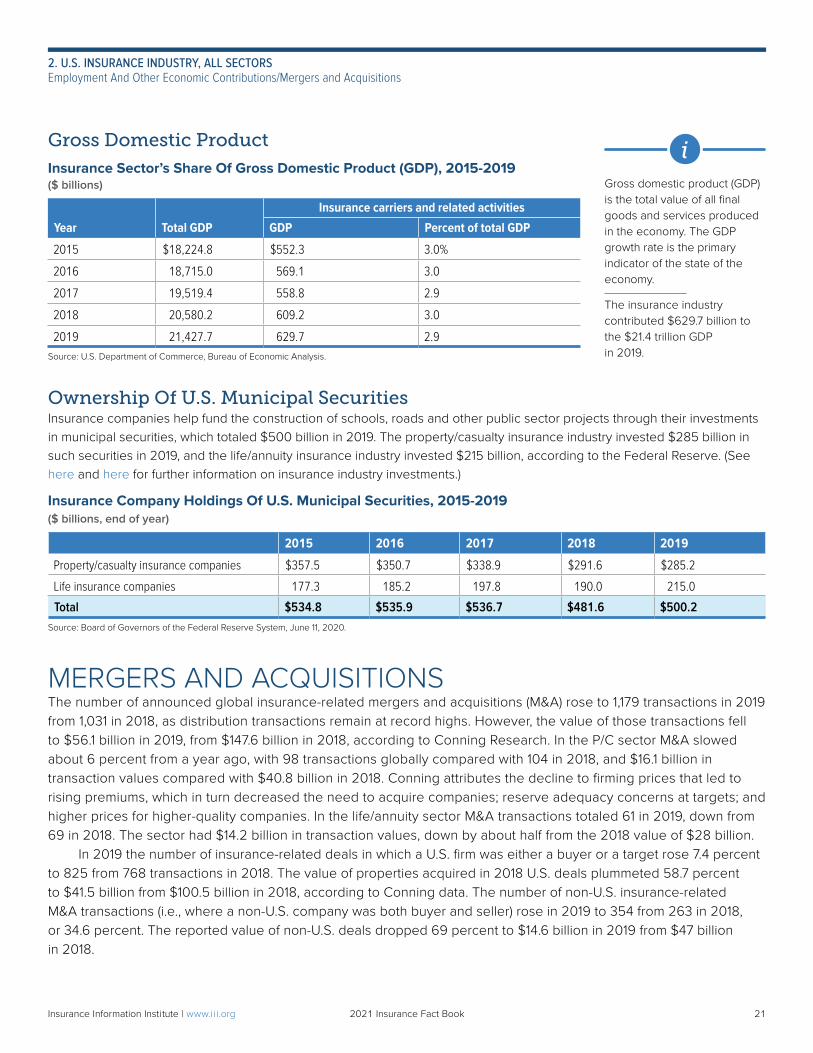
Reported Global Insurance-Related Mergers And Acquisitions By Sector, U.S. And Non-U.S. Acquirers, 2019
Number of transactions Transaction values ($ millions)1
Sector U.S.2 Non-U.S.3 Total U.S.2 Non-U.S.3 Total
Underwriting
Property/casualty 29 69 98 $8,805 $7,316 $16,121
Life/annuity 20 41 61 9,235 4,980 14,215
Health/managed care 22 12 34 17,410 2,109 19,519
Total 71 122 193 $35,450 $14,405 $49,855
Distribution and services
Distribution 682 203 885 $2,389 $171 $2,560
Services 72 29 101 3,669 0 3,669
Total 754 232 986 $6,058 $171 $6,229
Total, all sectors 825 354 1,179 $41,508 $14,576 $56,084 1Components may not add to totals due to rounding. 2Includes transactions where a U.S. company was the acquirer and/or the target. 3Includes transactions where a non-U.S. company was the acquirer and the target.
Source: ©2020 Conning, Inc., 2020: Global Property Casualty Insurance M&A in 2019 - Distribution Dominates; Global Life & Health Insurance M&A in 2019: The Quest for Growth Continues. Used with permission.
In 2019 the largest global transactions involved health companies as Centene Corp. acquired WellCare Health Plans, with an announced value of $17.3 billion. Led by this deal, the health sector accounted for $18.6 billion in transaction values or 46 percent of the top 10 M&A deals of 2019. Life deals ranked second, third and tenth largest, and as a whole the sector accounted for 29 percent of the transaction values of the top 10. The P/C sector, with three deals in the top 10, accounted for 17 percent of the total dollars involved in M&A in 2019. The services and distribution sectors both had one deal in the top 10 in 2019 and accounted for 6 percent and 3 percent, respectively, of the value of the top 10 deals.
Top 10 Global Insurance-Related Mergers And Acquisitions Announced, 2019 ($ millions)
Rank Buyer (country) Target (country) Sector Transaction value
1 Centene Corp. (U.S.) WellCare Health Plans Inc. (U.S.) Health $17,300
2 New York Life Insurance Co. (U.S.) Cigna Corp. (group life and disability) (U.S.) Life 6,300
3 Phoenix Group Holdings, plc (U.K.) ReAssure Group plc (U.K.) Life 4,211
4 Tokio Marine Holdings, plc (Japan) PURE Group (U.S.) Property/casualty 3,100
5 Prudential Financial (U.S.) Assurance IQ (U.S.) Services 2,350
6 Brookfield Business Partners (Bermuda) Genworth MI (Canada) Property/casualty 1,800
7 The Carlyle Group (U.S.) and T&D Holdings (Japan) Fortitude Group Holdings (U.S.) Property/casualty 1,800
8 Willis Towers Watson (Ireland) TRANZACT (U.S.) Distribution 1,300
9 Hapvida Sistema de Saude (Brazil) Grupo Sao Francisco (Brazil) Health 1,260
10 Resolution Life Holdings, Inc. (U.S.) Voya Financial, Inc. (in-force individual life) (U.S.) Life 1,250
Source: ©2020 Conning, Inc., 2020: Global Property Casualty Insurance M&A in 2019 - Distribution Dominates; Global Life & Health Insurance M&A in 2019: The Quest for Growth Continues. Used with permission.
22Insurance Information Institute | www.ii i.org 2021 Insurance Fact Book 22
2. U.S. INSURANCE INDUSTRY, ALL SECTORSMergers and Acquisitions
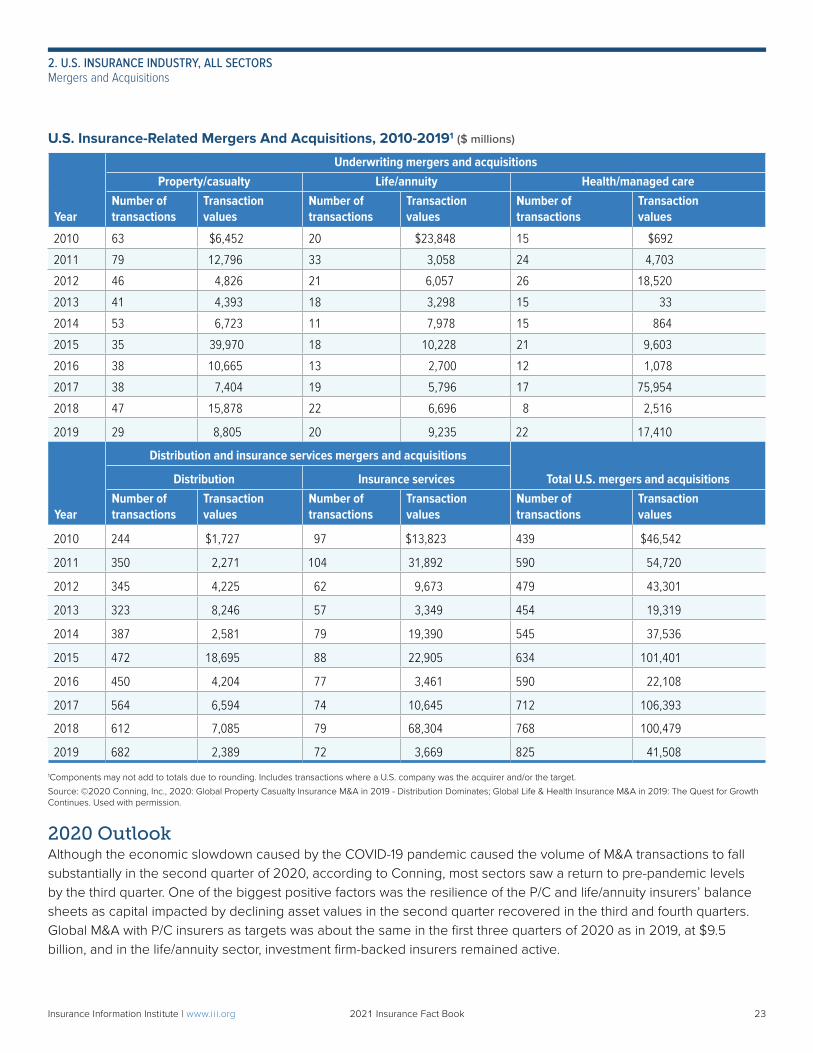
U.S. Insurance-Related Mergers And Acquisitions, 2010-20191 ($ millions)
Year
Underwriting mergers and acquisitionsProperty/casualty Life/annuity Health/managed care
Number of transactions
Transaction values
Number of transactions
Transaction values
Number of transactions
Transactionvalues
2010 63 $6,452 20 $23,848 15 $692
2011 79 12,796 33 3,058 24 4,703
2012 46 4,826 21 6,057 26 18,520
2013 41 4,393 18 3,298 15 33
2014 53 6,723 11 7,978 15 864
2015 35 39,970 18 10,228 21 9,603
2016 38 10,665 13 2,700 12 1,078
2017 38 7,404 19 5,796 17 75,954
2018 47 15,878 22 6,696 8 2,516
2019 29 8,805 20 9,235 22 17,410
Year
Distribution and insurance services mergers and acquisitions
Total U.S. mergers and acquisitionsDistribution Insurance servicesNumber of transactions
Transaction values
Number of transactions
Transactionvalues
Number of transactions
Transactionvalues
2010 244 $1,727 97 $13,823 439 $46,542
2011 350 2,271 104 31,892 590 54,720
2012 345 4,225 62 9,673 479 43,301
2013 323 8,246 57 3,349 454 19,319
2014 387 2,581 79 19,390 545 37,536
2015 472 18,695 88 22,905 634 101,401
2016 450 4,204 77 3,461 590 22,108
2017 564 6,594 74 10,645 712 106,393
2018 612 7,085 79 68,304 768 100,479
2019 682 2,389 72 3,669 825 41,508
1Components may not add to totals due to rounding. Includes transactions where a U.S. company was the acquirer and/or the target.
Source: ©2020 Conning, Inc., 2020: Global Property Casualty Insurance M&A in 2019 - Distribution Dominates; Global Life & Health Insurance M&A in 2019: The Quest for Growth Continues. Used with permission.
2020 Outlook Although the economic slowdown caused by the COVID-19 pandemic caused the volume of M&A transactions to fall substantially in the second quarter of 2020, according to Conning, most sectors saw a return to pre-pandemic levels by the third quarter. One of the biggest positive factors was the resilience of the P/C and life/annuity insurers’ balance sheets as capital impacted by declining asset values in the second quarter recovered in the third and fourth quarters. Global M&A with P/C insurers as targets was about the same in the first three quarters of 2020 as in 2019, at $9.5 billion, and in the life/annuity sector, investment firm-backed insurers remained active.
23Insurance Information Institute | www.ii i.org 2021 Insurance Fact Book 23
2. U.S. INSURANCE INDUSTRY, ALL SECTORSMergers and Acquisitions
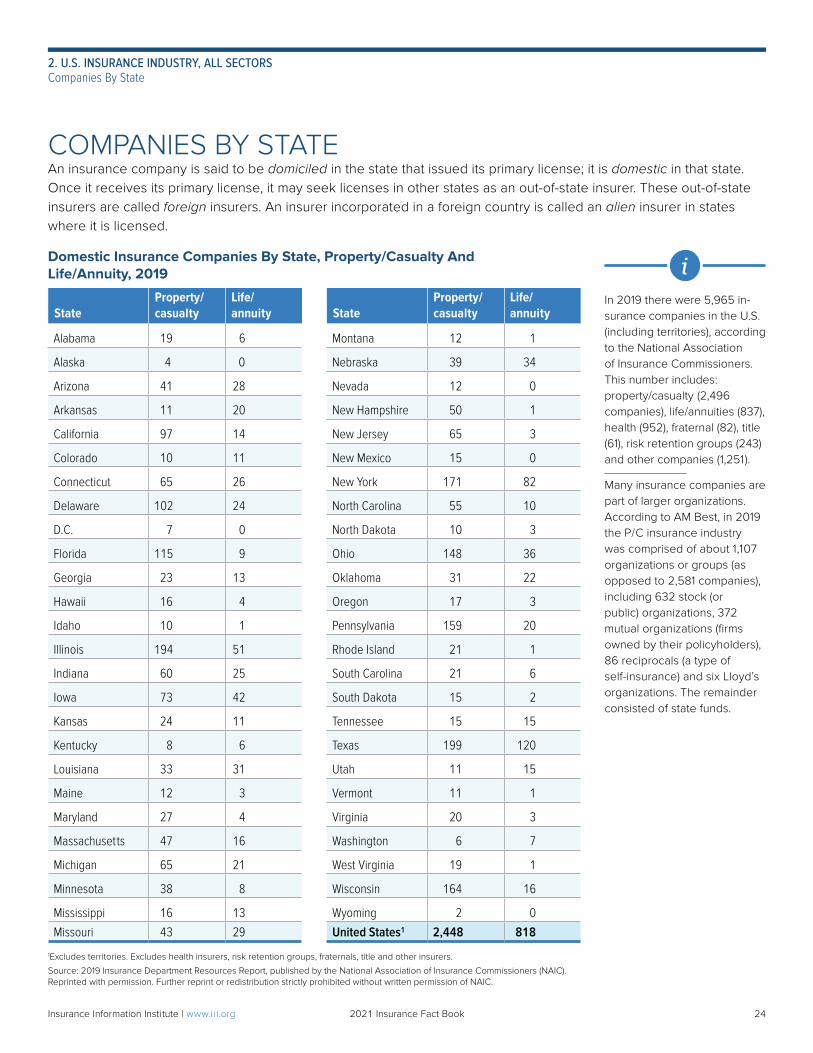
Domestic Insurance Companies By State, Property/Casualty And Life/Annuity, 2019
StateProperty/casualty
Life/ annuity State
Property/casualty
Life/ annuity
Alabama 19 6 Montana 12 1
Alaska 4 0 Nebraska 39 34
Arizona 41 28 Nevada 12 0
Arkansas 11 20 New Hampshire 50 1
California 97 14 New Jersey 65 3
Colorado 10 11 New Mexico 15 0
Connecticut 65 26 New York 171 82
Delaware 102 24 North Carolina 55 10
D.C. 7 0 North Dakota 10 3
Florida 115 9 Ohio 148 36
Georgia 23 13 Oklahoma 31 22
Hawaii 16 4 Oregon 17 3
Idaho 10 1 Pennsylvania 159 20
Illinois 194 51 Rhode Island 21 1
Indiana 60 25 South Carolina 21 6
Iowa 73 42 South Dakota 15 2
Kansas 24 11 Tennessee 15 15
Kentucky 8 6 Texas 199 120
Louisiana 33 31 Utah 11 15
Maine 12 3 Vermont 11 1
Maryland 27 4 Virginia 20 3
Massachusetts 47 16 Washington 6 7
Michigan 65 21 West Virginia 19 1
Minnesota 38 8 Wisconsin 164 16
Mississippi 16 13 Wyoming 2 0
Missouri 43 29 United States1 2,448 818
1Excludes territories. Excludes health insurers, risk retention groups, fraternals, title and other insurers.
Source: 2019 Insurance Department Resources Report, published by the National Association of Insurance Commissioners (NAIC). Reprinted with permission. Further reprint or redistribution strictly prohibited without written permission of NAIC.
COMPANIES BY STATEAn insurance company is said to be domiciled in the state that issued its primary license; it is domestic in that state. Once it receives its primary license, it may seek licenses in other states as an out-of-state insurer. These out-of-state insurers are called foreign insurers. An insurer incorporated in a foreign country is called an alien insurer in states where it is licensed.
In 2019 there were 5,965 in-surance companies in the U.S. (including territories), according to the National Association of Insurance Commissioners. This number includes: property/casualty (2,496 companies), life/annuities (837), health (952), fraternal (82), title (61), risk retention groups (243) and other companies (1,251).
Many insurance companies are part of larger organizations. According to AM Best, in 2019 the P/C insurance industry was comprised of about 1,107 organizations or groups (as opposed to 2,581 companies), including 632 stock (or public) organizations, 372 mutual organizations (firms owned by their policyholders), 86 reciprocals (a type of self-insurance) and six Lloyd’s organizations. The remainder consisted of state funds.
i
24Insurance Information Institute | www.ii i.org 2021 Insurance Fact Book 24
2. U.S. INSURANCE INDUSTRY, ALL SECTORSCompanies By State
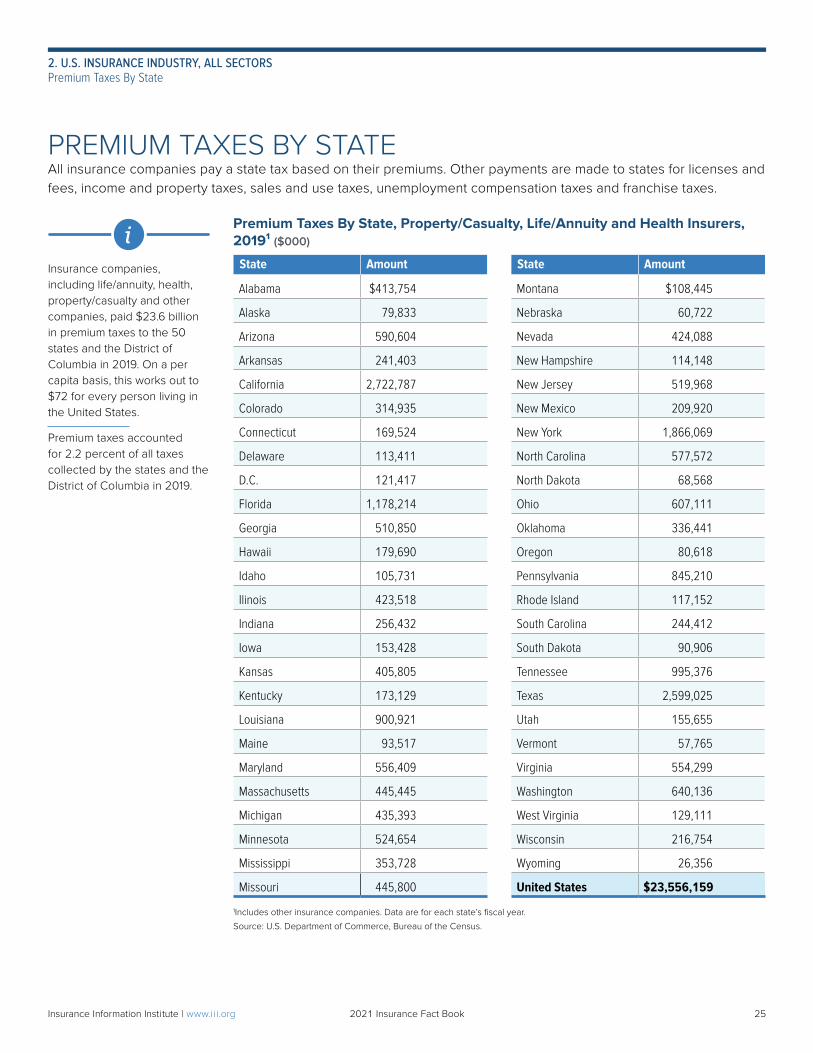
PREMIUM TAXES BY STATEAll insurance companies pay a state tax based on their premiums. Other payments are made to states for licenses and fees, income and property taxes, sales and use taxes, unemployment compensation taxes and franchise taxes.
Premium Taxes By State, Property/Casualty, Life/Annuity and Health Insurers, 2019¹ ($000)
State Amount State Amount
Alabama $413,754 Montana $108,445
Alaska 79,833 Nebraska 60,722
Arizona 590,604 Nevada 424,088
Arkansas 241,403 New Hampshire 114,148
California 2,722,787 New Jersey 519,968
Colorado 314,935 New Mexico 209,920
Connecticut 169,524 New York 1,866,069
Delaware 113,411 North Carolina 577,572
D.C. 121,417 North Dakota 68,568
Florida 1,178,214 Ohio 607,111
Georgia 510,850 Oklahoma 336,441
Hawaii 179,690 Oregon 80,618
Idaho 105,731 Pennsylvania 845,210
Ilinois 423,518 Rhode Island 117,152
Indiana 256,432 South Carolina 244,412
Iowa 153,428 South Dakota 90,906
Kansas 405,805 Tennessee 995,376
Kentucky 173,129 Texas 2,599,025
Louisiana 900,921 Utah 155,655
Maine 93,517 Vermont 57,765
Maryland 556,409 Virginia 554,299
Massachusetts 445,445 Washington 640,136
Michigan 435,393 West Virginia 129,111
Minnesota 524,654 Wisconsin 216,754
Mississippi 353,728 Wyoming 26,356
Missouri 445,800 United States $23,556,159
1Includes other insurance companies. Data are for each state’s fiscal year.
Source: U.S. Department of Commerce, Bureau of the Census.
Insurance companies, including life/annuity, health, property/casualty and other companies, paid $23.6 billion in premium taxes to the 50 states and the District of Columbia in 2019. On a per capita basis, this works out to $72 for every person living in the United States.
Premium taxes accounted for 2.2 percent of all taxes collected by the states and the District of Columbia in 2019.
i
25Insurance Information Institute | www.ii i.org 2021 Insurance Fact Book 25
2. U.S. INSURANCE INDUSTRY, ALL SECTORSPremium Taxes By State
Chapter 3
Distribution
PROPERTY/CASUALTYOverviewMany insurance companies use several different channels to distribute their products. In the early days of the U.S. insurance industry, insurers hired agents, often on a part-time basis, to sign up applicants for insurance. Some agents, known now as captive or exclusive agents, represented a single company. Others, the equivalent of today’s independent agents, worked for different companies. While the two agency systems were expanding, commercial insurance brokers, who were often underwriters, began to establish themselves. While agents usually represented insurers, brokers represented clients who were buying insurance. These three distribution channels (captive agents, independent agents and brokers) exist in much the same form today. Also, with the development of internet technology, alternative distribution channels sprang up. Insurers use other types of outlets as well such as banks, workplaces, associations and car dealers, to access potential policyholders.
Online Property/Casualty Insurance SalesAccording to the J.D. Power 2020 U.S. Auto Insurance StudySM released in June 2020, auto insurer websites contribute more to customer satisfaction than agents, accounting for 34 percent of an insurer’s total interaction score. Although the difference between the results recorded for websites is only one percentage point higher than the agent channel—which accounts for 33 percent of total interaction satisfaction—J.D. Power noted that the trend toward increased satisfaction with digital channels has been building steadily for more than a decade. In 2020 overall customer satisfaction with auto insurers achieved a record high of 835 out of a possible 1,000 points, indicating that insurers fulfilled service expectations. J.D. Power noted this improvement from its 2018 poll, especially for the largest auto insurers. The Triple-I’s 2020 Consumer Poll found that among the 61 percent of policyholders who compared pricesfor auto insurance at renewal, 36 percent of respondents said they did so online. Searching online was significantly more popular than talking to an agent by phone or in person. Each method was used by 20 percent of respondents, and respondents could report more than one method. Of those auto insurance customers who compared prices online, Generation X respondents ages 40 to 55 were the most likely to use this method—46 percent, compared with 45 percent of Generation Z respondents (ages 18 to 23); 44 percent of millennials (ages 24 to 39); and 24 percent of baby boomers (ages 56 to 74). In 2018, 31 percent of all respondents who said they had compared auto insurance prices did so online.
26Insurance Information Institute | www.ii i.org 2021 Insurance Fact Book 26
There were an estimated 36,500 independent agencies in the United States in 2018 (latest data available), down from 38,000 in 2016, according to the Independent Insurance Agents and Brokers of America’s (IIABA) 2018 Agency Universe Study.
The IIABA says the 2018 decrease primarily reflects a new data resource providing more accurate and insurance industry-focused data, along with increased mergers and acquisitions.
In 2018 the estimated percentage of small agencies (less than $150,000 in revenue) accounted for 35 percent of all agencies, while jumbo agencies (revenue of $10 million or more) accounted for 2 percent of agencies.
The proportion of agencies in small towns and rural areas returned to 19 percent in 2018, where it had been in 2014, after falling to 9 percent in 2016. About half of agencies are in large metropolitan areas.
In 2018, 12 percent of the agencies in the study were involved in acquisitions, 1 percent merged with another agency, and 3 percent converted from exclusive or captive agencies to independent agencies.
i Property/Casualty Insurance DistributionAgency writers, whose products are sold by independent agents or brokers representing several companies—and direct writers, which sell their own products through captive agents by mail, telephone, or via the internet and other means—each account for about half of the property/casualty (P/C) market. There is a degree of overlap as many insurers use multiple channels. AM Best organizes insurance into two main distribution channels: agency writers and direct writers. Its agency writers category includes insurers that distribute through independent agencies, brokers, general agents and managing general agents. Its direct writers category includes insurers that distribute through the internet, exclusive/captive agents, direct response and affinity groups.
• In 2019 direct writers accounted for 53.5 percent of P/C insurance net premiums written and agency writers accounted for 46.1 percent, according to AM Best.*
• In the personal lines market, direct writers accounted for 64.5 percent of net premiums written in 2019, and agency writers accounted for 35.4 percent. Direct writers accounted for 61.9 percent of the homeowners market, and agency writers accounted for 38.0 percent. Direct writers accounted for 65.8 percent of the personal auto market, and agency writers accounted for 34.1 percent.*
• Agency writers accounted for 76.5 percent of commercial P/C net premiums written, and direct writers accounted for 22.6 percent.*
*Unspecified distribution channels accounted for the remainder.
27Insurance Information Institute | www.ii i.org 2021 Insurance Fact Book 27
3. DISTRIBUTIONProperty/Casualty
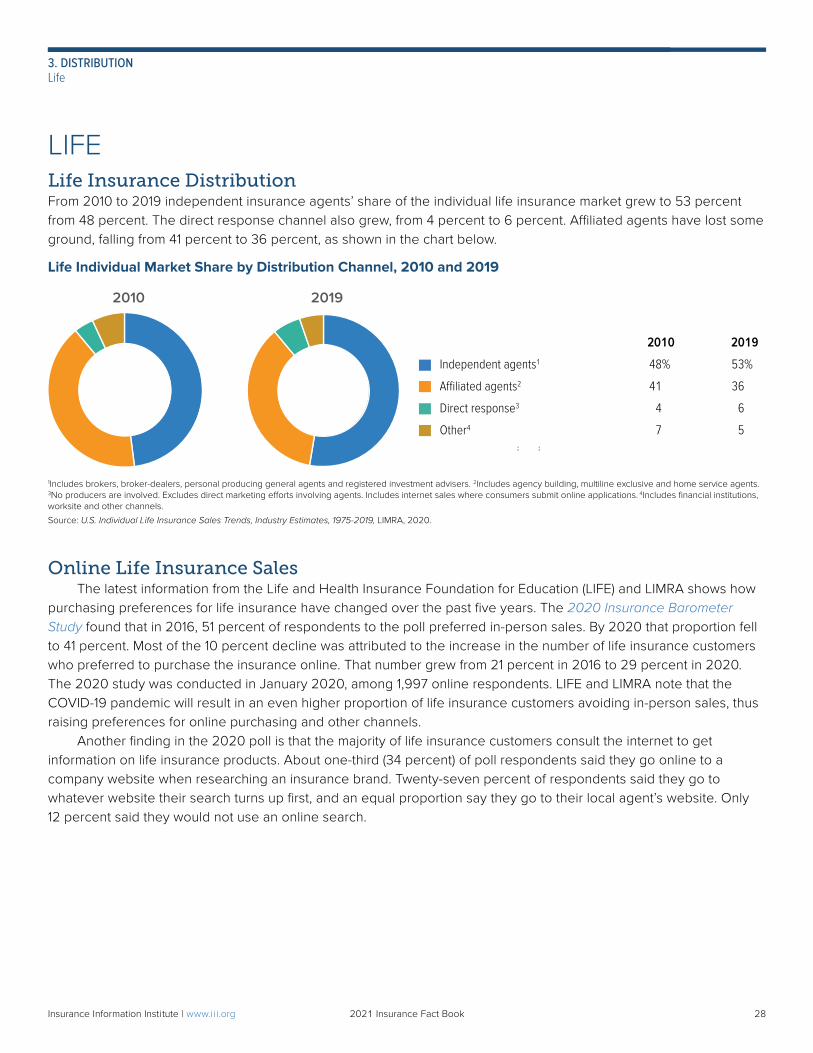
LIFELife Insurance DistributionFrom 2010 to 2019 independent insurance agents’ share of the individual life insurance market grew to 53 percent from 48 percent. The direct response channel also grew, from 4 percent to 6 percent. Affiliated agents have lost some ground, falling from 41 percent to 36 percent, as shown in the chart below.
Life Individual Market Share by Distribution Channel, 2010 and 2019
1Includes brokers, broker-dealers, personal producing general agents and registered investment advisers. 2Includes agency building, multiline exclusive and home service agents. 3No producers are involved. Excludes direct marketing efforts involving agents. Includes internet sales where consumers submit online applications. 4Includes financial institutions, worksite and other channels.
Source: U.S. Individual Life Insurance Sales Trends, Industry Estimates, 1975-2019, LIMRA, 2020.
Online Life Insurance Sales The latest information from the Life and Health Insurance Foundation for Education (LIFE) and LIMRA shows how purchasing preferences for life insurance have changed over the past five years. The 2020 Insurance Barometer Study found that in 2016, 51 percent of respondents to the poll preferred in-person sales. By 2020 that proportion fell to 41 percent. Most of the 10 percent decline was attributed to the increase in the number of life insurance customers who preferred to purchase the insurance online. That number grew from 21 percent in 2016 to 29 percent in 2020. The 2020 study was conducted in January 2020, among 1,997 online respondents. LIFE and LIMRA note that the COVID-19 pandemic will result in an even higher proportion of life insurance customers avoiding in-person sales, thus raising preferences for online purchasing and other channels. Another finding in the 2020 poll is that the majority of life insurance customers consult the internet to get information on life insurance products. About one-third (34 percent) of poll respondents said they go online to a company website when researching an insurance brand. Twenty-seven percent of respondents said they go to whatever website their search turns up first, and an equal proportion say they go to their local agent’s website. Only 12 percent said they would not use an online search.
.
2010 2019
2010 2019
Independent agents1 48% 53%
Affiliated agents2 41 36
Direct response3 4 6
Other4 7 5
28Insurance Information Institute | www.ii i.org 2021 Insurance Fact Book 28
3. DISTRIBUTIONLife
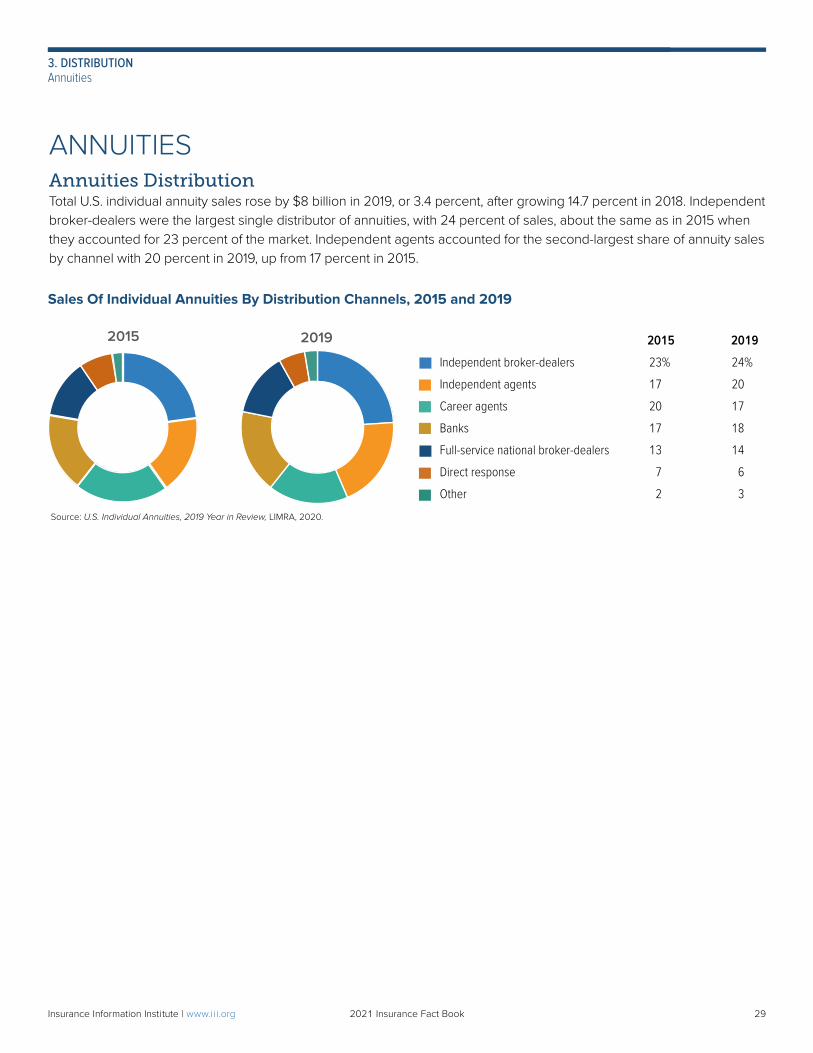
Sales Of Individual Annuities By Distribution Channels, 2015 and 2019
Source: U.S. Individual Annuities, 2019 Year in Review, LIMRA, 2020.
2015 2019
ANNUITIESAnnuities DistributionTotal U.S. individual annuity sales rose by $8 billion in 2019, or 3.4 percent, after growing 14.7 percent in 2018. Independent broker-dealers were the largest single distributor of annuities, with 24 percent of sales, about the same as in 2015 when they accounted for 23 percent of the market. Independent agents accounted for the second-largest share of annuity sales by channel with 20 percent in 2019, up from 17 percent in 2015.
29Insurance Information Institute | www.ii i.org 2021 Insurance Fact Book 29
3. DISTRIBUTIONAnnuities
2015 2019
Independent broker-dealers 23% 24%
Independent agents 17 20
Career agents 20 17
Banks 17 18
Full-service national broker-dealers 13 14
Direct response 7 6
Other 2 3
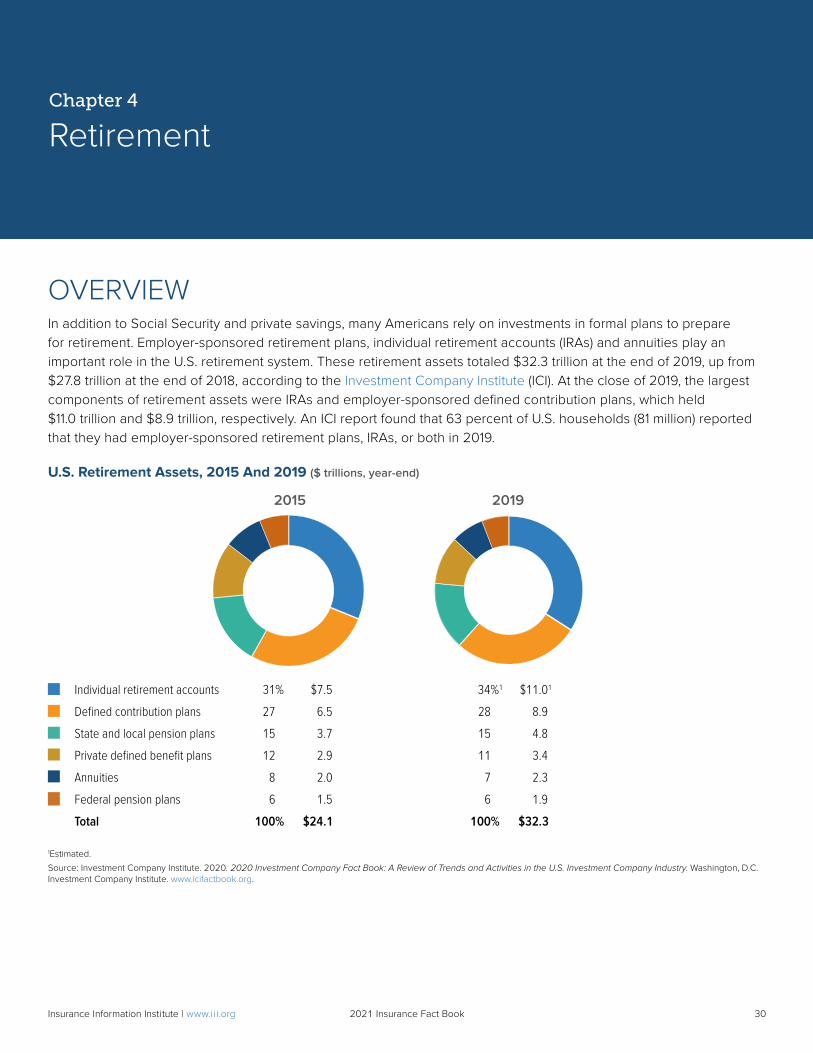
Chapter 4
Retirement
OVERVIEWIn addition to Social Security and private savings, many Americans rely on investments in formal plans to prepare for retirement. Employer-sponsored retirement plans, individual retirement accounts (IRAs) and annuities play an important role in the U.S. retirement system. These retirement assets totaled $32.3 trillion at the end of 2019, up from $27.8 trillion at the end of 2018, according to the Investment Company Institute (ICI). At the close of 2019, the largest components of retirement assets were IRAs and employer-sponsored defined contribution plans, which held $11.0 trillion and $8.9 trillion, respectively. An ICI report found that 63 percent of U.S. households (81 million) reported that they had employer-sponsored retirement plans, IRAs, or both in 2019.
U.S. Retirement Assets, 2015 And 2019 ($ trillions, year-end)
2015 2019
Individual retirement accounts 31% $7.5 34%1 $11.01
Defined contribution plans 27 6.5 28 8.9
State and local pension plans 15 3.7 15 4.8
Private defined benefit plans 12 2.9 11 3.4
Annuities 8 2.0 7 2.3
Federal pension plans 6 1.5 6 1.9
Total 100% $24.1 100% $32.3
1Estimated.
Source: Investment Company Institute. 2020. 2020 Investment Company Fact Book: A Review of Trends and Activities in the U.S. Investment Company Industry. Washington, D.C. Investment Company Institute. www.icifactbook.org.
30Insurance Information Institute | www.ii i.org 2021 Insurance Fact Book 30
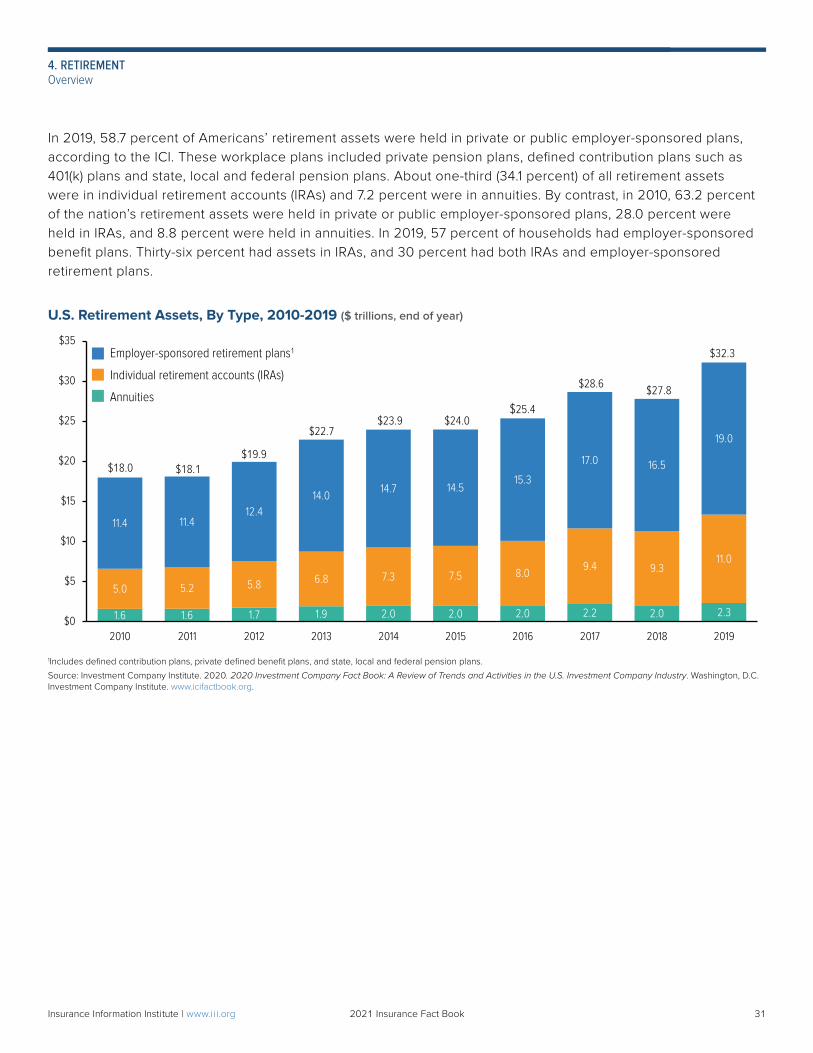
In 2019, 58.7 percent of Americans’ retirement assets were held in private or public employer-sponsored plans, according to the ICI. These workplace plans included private pension plans, defined contribution plans such as 401(k) plans and state, local and federal pension plans. About one-third (34.1 percent) of all retirement assets were in individual retirement accounts (IRAs) and 7.2 percent were in annuities. By contrast, in 2010, 63.2 percent of the nation’s retirement assets were held in private or public employer-sponsored plans, 28.0 percent were held in IRAs, and 8.8 percent were held in annuities. In 2019, 57 percent of households had employer-sponsored benefit plans. Thirty-six percent had assets in IRAs, and 30 percent had both IRAs and employer-sponsored retirement plans.
U.S. Retirement Assets, By Type, 2010-2019 ($ trillions, end of year)
1Includes defined contribution plans, private defined benefit plans, and state, local and federal pension plans.
Source: Investment Company Institute. 2020. 2020 Investment Company Fact Book: A Review of Trends and Activities in the U.S. Investment Company Industry. Washington, D.C. Investment Company Institute. www.icifactbook.org.
1.6 1.6 1.7 1.9 2.0 2.0 2.0 2.2 2.0 2.3
5.0 5.2 5.8 6.8 7.3 7.5 8.09.4 9.3
11.0
11.4 11.412.4
14.014.7 14.5
15.3
17.0 16.5
19.0
$0
$5
$10
$15
$20
$25
$30
$35
2010 2011 2012 2013 2014 2015 2016 2017 2018 2019
Employer-sponsored retirement plans1
Individual retirement accounts (IRAs)
Annuities
$18.0 $18.1$19.9
$22.7$23.9 $24.0
$25.4
$28.6 $27.8
$32.3
31Insurance Information Institute | www.ii i.org 2021 Insurance Fact Book 31
4. RETIREMENTOverview
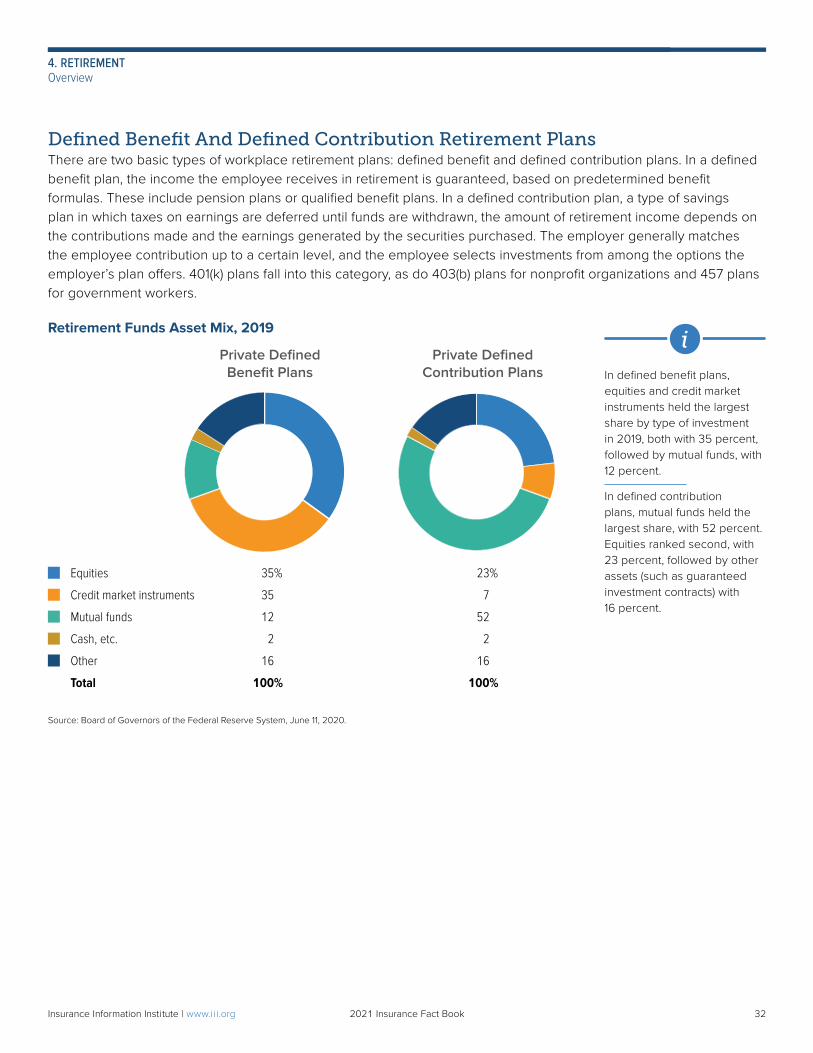
Defined Benefit And Defined Contribution Retirement PlansThere are two basic types of workplace retirement plans: defined benefit and defined contribution plans. In a defined benefit plan, the income the employee receives in retirement is guaranteed, based on predetermined benefit formulas. These include pension plans or qualified benefit plans. In a defined contribution plan, a type of savings plan in which taxes on earnings are deferred until funds are withdrawn, the amount of retirement income depends on the contributions made and the earnings generated by the securities purchased. The employer generally matches the employee contribution up to a certain level, and the employee selects investments from among the options the employer’s plan offers. 401(k) plans fall into this category, as do 403(b) plans for nonprofit organizations and 457 plans for government workers.
Retirement Funds Asset Mix, 2019
Private Defined Private Defined Benefit Plans Contribution Plans
Equities 35% 23%
Credit market instruments 35 7
Mutual funds 12 52
Cash, etc. 2 2
Other 16 16
Total 100% 100%
Source: Board of Governors of the Federal Reserve System, June 11, 2020.
In defined benefit plans, equities and credit market instruments held the largest share by type of investment in 2019, both with 35 percent, followed by mutual funds, with 12 percent.
In defined contribution plans, mutual funds held the largest share, with 52 percent. Equities ranked second, with 23 percent, followed by other assets (such as guaranteed investment contracts) with 16 percent.
i
32Insurance Information Institute | www.ii i.org 2021 Insurance Fact Book 32
4. RETIREMENTOverview
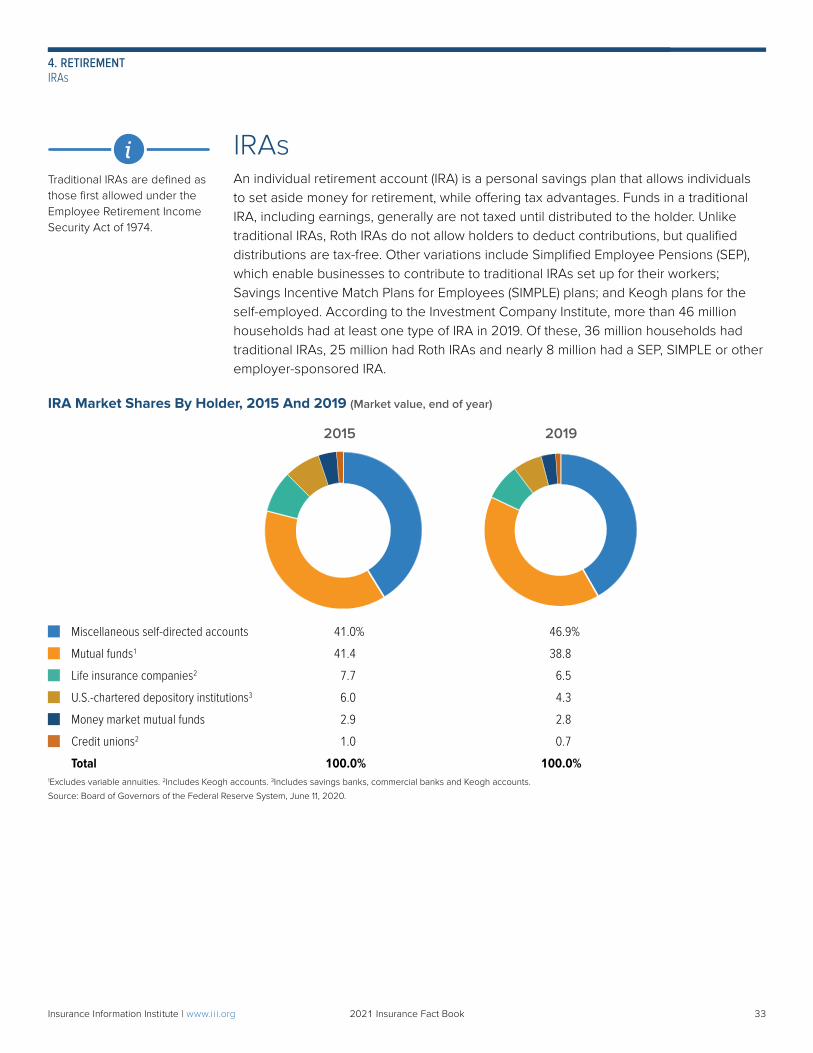
IRA Market Shares By Holder, 2015 And 2019 (Market value, end of year)
IRAsAn individual retirement account (IRA) is a personal savings plan that allows individuals to set aside money for retirement, while offering tax advantages. Funds in a traditional IRA, including earnings, generally are not taxed until distributed to the holder. Unlike traditional IRAs, Roth IRAs do not allow holders to deduct contributions, but qualified distributions are tax-free. Other variations include Simplified Employee Pensions (SEP), which enable businesses to contribute to traditional IRAs set up for their workers; Savings Incentive Match Plans for Employees (SIMPLE) plans; and Keogh plans for the self-employed. According to the Investment Company Institute, more than 46 million households had at least one type of IRA in 2019. Of these, 36 million households had traditional IRAs, 25 million had Roth IRAs and nearly 8 million had a SEP, SIMPLE or other employer-sponsored IRA.
2015 2019
Miscellaneous self-directed accounts 41.0% 46.9%
Mutual funds1 41.4 38.8
Life insurance companies2 7.7 6.5
U.S.-chartered depository institutions3 6.0 4.3
Money market mutual funds 2.9 2.8
Credit unions2 1.0 0.7
Total 100.0% 100.0%1Excludes variable annuities. 2Includes Keogh accounts. 3Includes savings banks, commercial banks and Keogh accounts.
Source: Board of Governors of the Federal Reserve System, June 11, 2020.
Traditional IRAs are defined as those first allowed under the Employee Retirement Income Security Act of 1974.
i
33Insurance Information Institute | www.ii i.org 2021 Insurance Fact Book 33
4. RETIREMENT IRAs
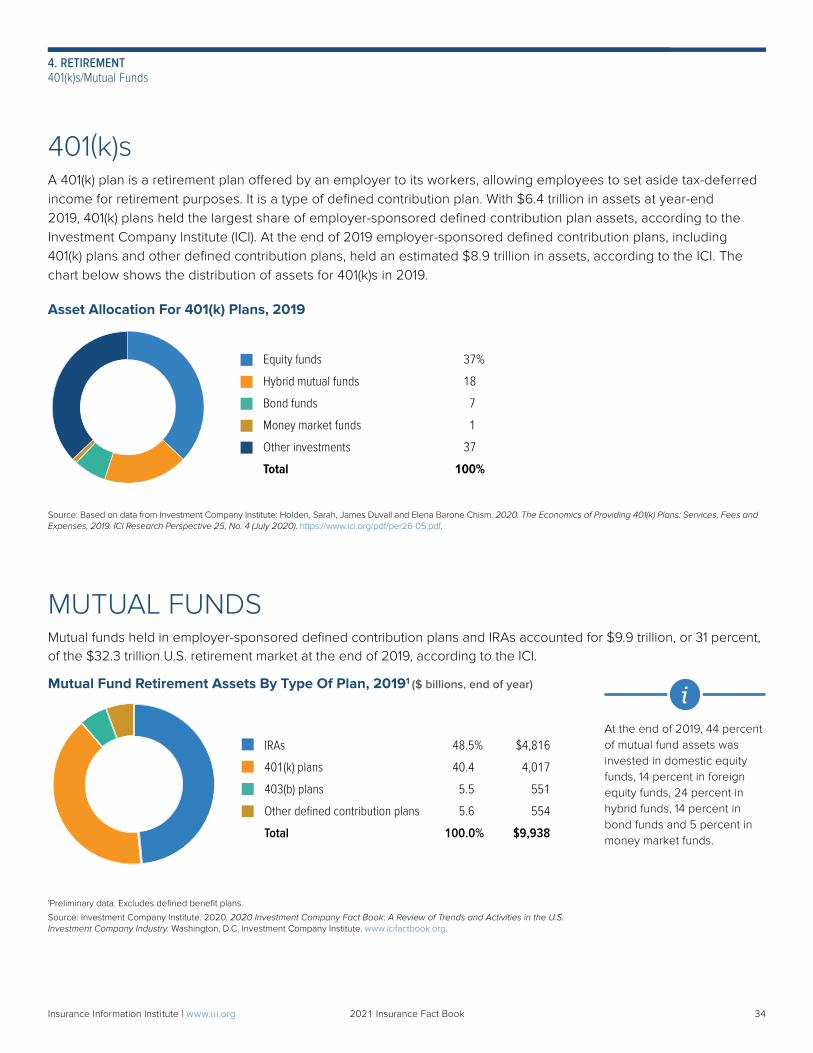
Mutual Fund Retirement Assets By Type Of Plan, 20191 ($ billions, end of year)
1Preliminary data. Excludes defined benefit plans.
Source: Investment Company Institute. 2020. 2020 Investment Company Fact Book: A Review of Trends and Activities in the U.S. Investment Company Industry. Washington, D.C. Investment Company Institute. www.icifactbook.org.
401(k)sA 401(k) plan is a retirement plan offered by an employer to its workers, allowing employees to set aside tax-deferred income for retirement purposes. It is a type of defined contribution plan. With $6.4 trillion in assets at year-end 2019, 401(k) plans held the largest share of employer-sponsored defined contribution plan assets, according to the Investment Company Institute (ICI). At the end of 2019 employer-sponsored defined contribution plans, including 401(k) plans and other defined contribution plans, held an estimated $8.9 trillion in assets, according to the ICI. The chart below shows the distribution of assets for 401(k)s in 2019.
Asset Allocation For 401(k) Plans, 2019
Source: Based on data from Investment Company Institute: Holden, Sarah, James Duvall and Elena Barone Chism. 2020. The Economics of Providing 401(k) Plans: Services, Fees and Expenses, 2019. ICI Research Perspective 25, No. 4 (July 2020). https://www.ici.org/pdf/per26-05.pdf.
Equity funds 37%
Hybrid mutual funds 18
Bond funds 7
Money market funds 1
Other investments 37
Total 100%
IRAs 48.5% $4,816
401(k) plans 40.4 4,017
403(b) plans 5.5 551
Other defined contribution plans 5.6 554
Total 100.0% $9,938
MUTUAL FUNDSMutual funds held in employer-sponsored defined contribution plans and IRAs accounted for $9.9 trillion, or 31 percent, of the $32.3 trillion U.S. retirement market at the end of 2019, according to the ICI.
At the end of 2019, 44 percent of mutual fund assets was invested in domestic equity funds, 14 percent in foreign equity funds, 24 percent in hybrid funds, 14 percent in bond funds and 5 percent in money market funds.
i
34Insurance Information Institute | www.ii i.org 2021 Insurance Fact Book 34
4. RETIREMENT 401(k)s/Mutual Funds
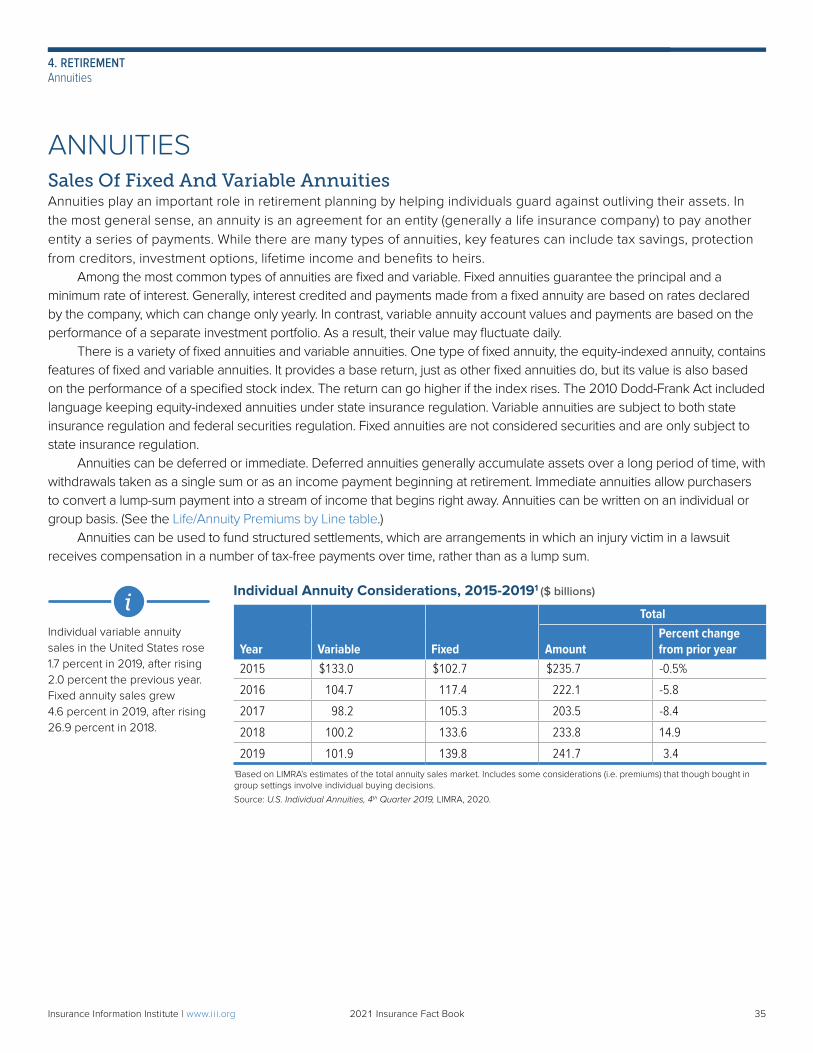
ANNUITIESSales Of Fixed And Variable AnnuitiesAnnuities play an important role in retirement planning by helping individuals guard against outliving their assets. In the most general sense, an annuity is an agreement for an entity (generally a life insurance company) to pay another entity a series of payments. While there are many types of annuities, key features can include tax savings, protection from creditors, investment options, lifetime income and benefits to heirs. Among the most common types of annuities are fixed and variable. Fixed annuities guarantee the principal and a minimum rate of interest. Generally, interest credited and payments made from a fixed annuity are based on rates declared by the company, which can change only yearly. In contrast, variable annuity account values and payments are based on the performance of a separate investment portfolio. As a result, their value may fluctuate daily. There is a variety of fixed annuities and variable annuities. One type of fixed annuity, the equity-indexed annuity, contains features of fixed and variable annuities. It provides a base return, just as other fixed annuities do, but its value is also based on the performance of a specified stock index. The return can go higher if the index rises. The 2010 Dodd-Frank Act included language keeping equity-indexed annuities under state insurance regulation. Variable annuities are subject to both state insurance regulation and federal securities regulation. Fixed annuities are not considered securities and are only subject to state insurance regulation. Annuities can be deferred or immediate. Deferred annuities generally accumulate assets over a long period of time, with withdrawals taken as a single sum or as an income payment beginning at retirement. Immediate annuities allow purchasers to convert a lump-sum payment into a stream of income that begins right away. Annuities can be written on an individual or group basis. (See the Life/Annuity Premiums by Line table.) Annuities can be used to fund structured settlements, which are arrangements in which an injury victim in a lawsuit receives compensation in a number of tax-free payments over time, rather than as a lump sum.
Individual Annuity Considerations, 2015-20191 ($ billions)
Year Variable Fixed
Total
AmountPercent change from prior year
2015 $133.0 $102.7 $235.7 -0.5%
2016 104.7 117.4 222.1 -5.8
2017 98.2 105.3 203.5 -8.4
2018 100.2 133.6 233.8 14.9
2019 101.9 139.8 241.7 3.41Based on LIMRA’s estimates of the total annuity sales market. Includes some considerations (i.e. premiums) that though bought in group settings involve individual buying decisions.
Source: U.S. Individual Annuities, 4th Quarter 2019, LIMRA, 2020.
Individual variable annuity sales in the United States rose 1.7 percent in 2019, after rising 2.0 percent the previous year. Fixed annuity sales grew 4.6 percent in 2019, after rising 26.9 percent in 2018.
i
35Insurance Information Institute | www.ii i.org 2021 Insurance Fact Book 35
4. RETIREMENTAnnuities
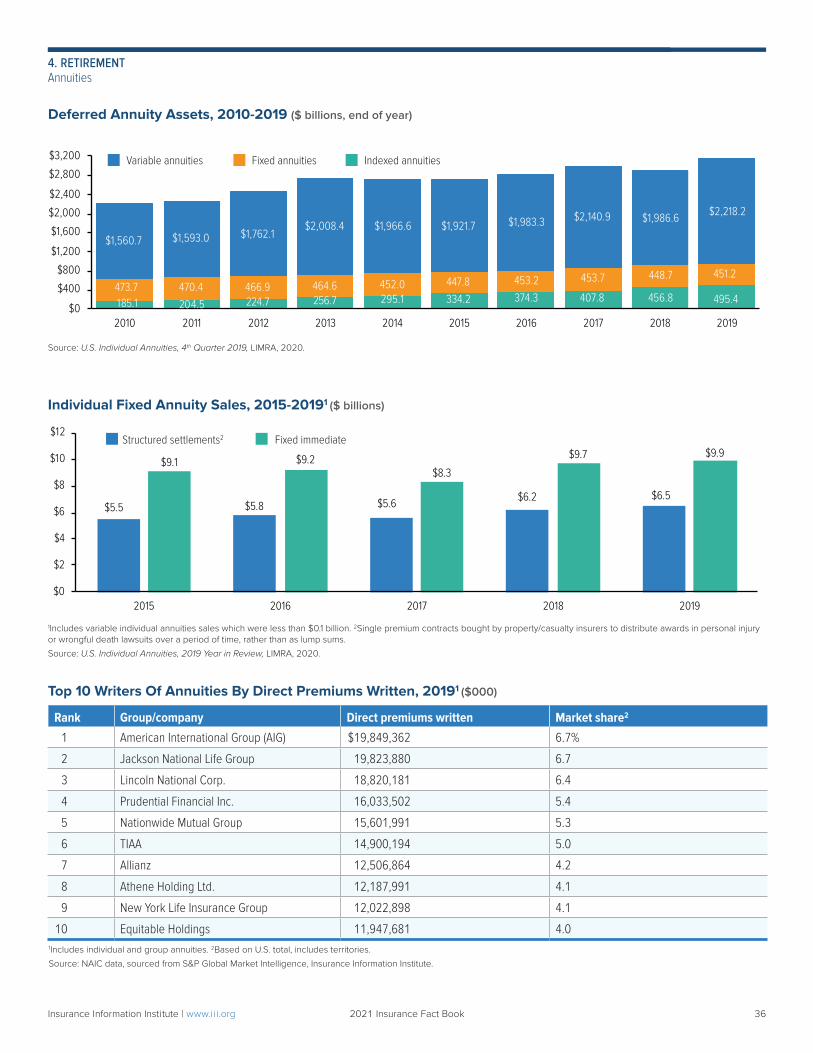
Deferred Annuity Assets, 2010-2019 ($ billions, end of year)
Individual Fixed Annuity Sales, 2015-20191 ($ billions)
1Includes variable individual annuities sales which were less than $0.1 billion. 2Single premium contracts bought by property/casualty insurers to distribute awards in personal injury or wrongful death lawsuits over a period of time, rather than as lump sums.
Source: U.S. Individual Annuities, 2019 Year in Review, LIMRA, 2020.
Top 10 Writers Of Annuities By Direct Premiums Written, 20191 ($000)
Rank Group/company Direct premiums written Market share2
1 American International Group (AIG) $19,849,362 6.7%
2 Jackson National Life Group 19,823,880 6.7
3 Lincoln National Corp. 18,820,181 6.4
4 Prudential Financial Inc. 16,033,502 5.4
5 Nationwide Mutual Group 15,601,991 5.3
6 TIAA 14,900,194 5.0
7 Allianz 12,506,864 4.2
8 Athene Holding Ltd. 12,187,991 4.1
9 New York Life Insurance Group 12,022,898 4.1
10 Equitable Holdings 11,947,681 4.01Includes individual and group annuities. 2Based on U.S. total, includes territories.
Source: NAIC data, sourced from S&P Global Market Intelligence, Insurance Information Institute.
$5.5 $5.8 $5.6 $6.2 $6.5
$9.1 $9.2 $8.3
$9.7 $9.9
$0
$2
$4
$6
$8
$10
$12
2015 2016 2017 2018 2019
185.1 204.5 224.7 256.7 295.1 334.2 374.3 407.8 456.8 495.4473.7 470.4 466.9 464.6 452.0 447.8 453.2 453.7 448.7 451.2
$1,560.7 $1,593.0 $1,762.1$2,008.4 $1,966.6 $1,921.7 $1,983.3 $2,140.9 $1,986.6 $2,218.2
$0
$400
$800
$1,200
$1,600
$2,000
$2,400
$2,800
$3,200
2010 2011 2012 2013 2014 2015 2016 2017 2018 2019
Source: U.S. Individual Annuities, 4th Quarter 2019, LIMRA, 2020.
Indexed annuitiesVariable annuities Fixed annuities
Fixed immediateStructured settlements2
36Insurance Information Institute | www.ii i.org 2021 Insurance Fact Book 36
4. RETIREMENTAnnuities
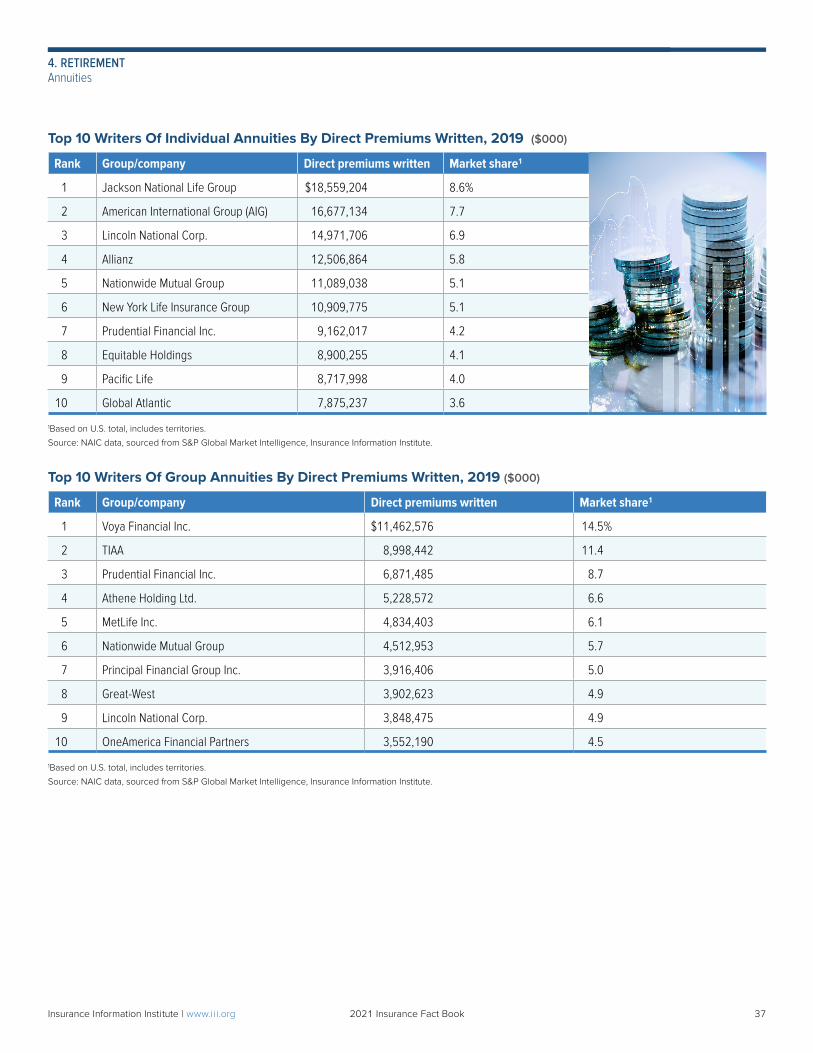
Top 10 Writers Of Individual Annuities By Direct Premiums Written, 2019 ($000)
Rank Group/company Direct premiums written Market share1
1 Jackson National Life Group $18,559,204 8.6%
2 American International Group (AIG) 16,677,134 7.7
3 Lincoln National Corp. 14,971,706 6.9
4 Allianz 12,506,864 5.8
5 Nationwide Mutual Group 11,089,038 5.1
6 New York Life Insurance Group 10,909,775 5.1
7 Prudential Financial Inc. 9,162,017 4.2
8 Equitable Holdings 8,900,255 4.1
9 Pacific Life 8,717,998 4.0
10 Global Atlantic 7,875,237 3.6
1Based on U.S. total, includes territories.
Source: NAIC data, sourced from S&P Global Market Intelligence, Insurance Information Institute.
Top 10 Writers Of Group Annuities By Direct Premiums Written, 2019 ($000)
Rank Group/company Direct premiums written Market share1
1 Voya Financial Inc. $11,462,576 14.5%
2 TIAA 8,998,442 11.4
3 Prudential Financial Inc. 6,871,485 8.7
4 Athene Holding Ltd. 5,228,572 6.6
5 MetLife Inc. 4,834,403 6.1
6 Nationwide Mutual Group 4,512,953 5.7
7 Principal Financial Group Inc. 3,916,406 5.0
8 Great-West 3,902,623 4.9
9 Lincoln National Corp. 3,848,475 4.9
10 OneAmerica Financial Partners 3,552,190 4.5
1Based on U.S. total, includes territories.
Source: NAIC data, sourced from S&P Global Market Intelligence, Insurance Information Institute.
37Insurance Information Institute | www.ii i.org 2021 Insurance Fact Book 37
4. RETIREMENTAnnuities
FINANCIAL RESULTSLife/Annuity SectorTraditional life insurance is no longer the primary business of many companies in the life insurance industry. The emphasis has shifted to the underwriting of annuities, which accounted for 48 percent of life/annuity direct premiums written in 2019. Annuities are contracts that accumulate funds or pay out a fixed or variable income stream. An income stream can be for a set time period or over the lifetimes of the contract holder or beneficiaries. Accident and health insurance, which includes distinctive products apart from traditional health insurance, accounts for 27 percent of direct premiums written. Traditional life insurance products such as universal life and term life for individuals, and group life, remain an important part of the business, making up the remaining 25 percent of direct premiums written. In addition to annuities, accident and health, and life insurance products, life insurers may offer other types of financial services such as asset management. Traditional health insurance, which is not included in this section and are not considered a part of the life/annuity sector, are described under Private Health Insurance. Health insurance pays for medical, surgical and hospital services received by the insured, as well as routine and preventive care, usually within a network format. Of the many types of plans available, most include a deductible paid by the insured, and benefits received are tax-free. Accident insurance and health insurance, which is included in the life/annuity and property/casualty (P/C) sectors, encompass a variety of specialty products related to health, such as reimbursement for the time a policyholder spent in a hospital or was disabled; short- and long-term disability based on employment; long-term care, and critical or catastrophic illness insurance. Accident and health insurance are not meant to replace health insurance.
2019 Financial ResultsNet income after taxes for the life/annuity insurance industry grew 18.1 percent in 2019 to $44.7 billion from $37.8 billion in 2018, according to S&P Global Market Intelligence. Net income before capital gains grew 21.1 percent in 2019 from 2018, but a net realized capital gains loss of $6.9 billion reduced the net income level to $44.7 billion. Premiums and annuity considerations rose 12.7 percent in 2019, following weak growth in 2018, reflecting the 26.8 rise in annuity premiums and deposits, as life insurance premiums were flat. Expenses grew slightly in 2019, up 0.4 percent, following a 10.6 percent increase in 2018. Capital and surplus rose to $422.2 billion in 2019, up 5.5 percent from $400.1 billion in 2018, according to S&P Global Market Intelligence.
Chapter 5
Life/Annuity Financial Data
Insurance Information Institute | www.ii i.org 2021 Insurance Fact Book 38
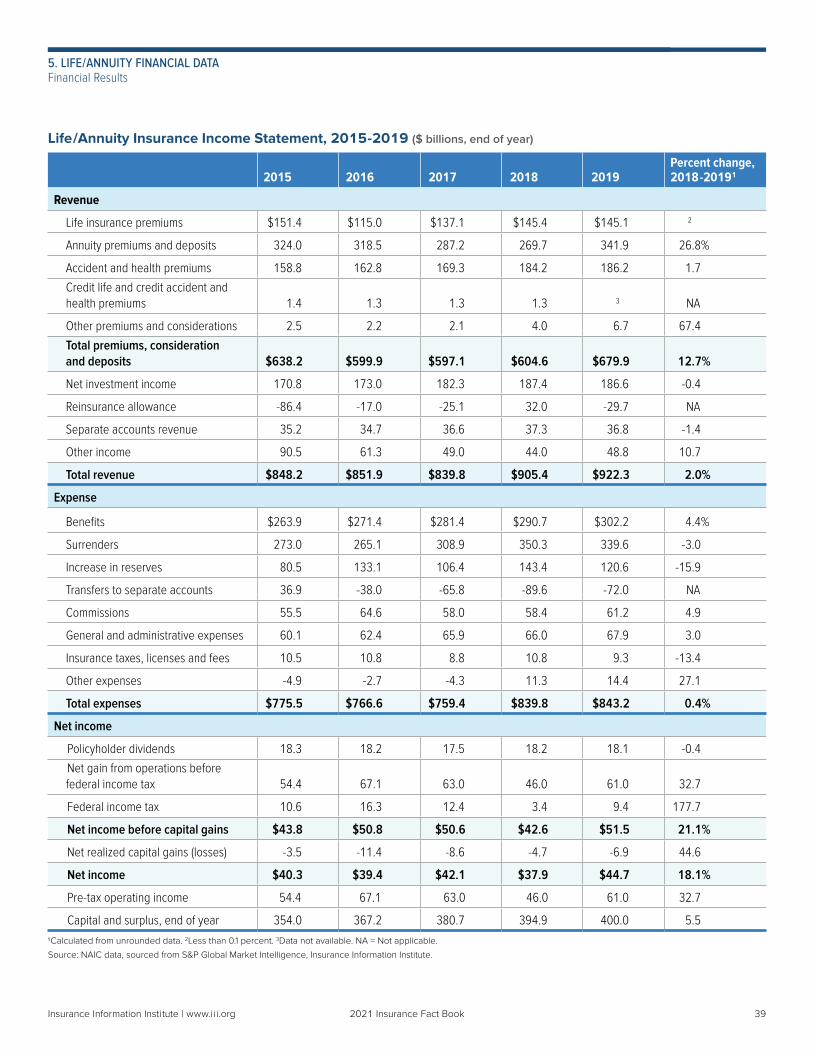
Life/Annuity Insurance Income Statement, 2015-2019 ($ billions, end of year)
2015 2016 2017 2018 2019Percent change, 2018-20191
Revenue
Life insurance premiums $151.4 $115.0 $137.1 $145.4 $145.1 2
Annuity premiums and deposits 324.0 318.5 287.2 269.7 341.9 26.8%
Accident and health premiums 158.8 162.8 169.3 184.2 186.2 1.7
Credit life and credit accident and health premiums 1.4 1.3 1.3 1.3 3 NA
Other premiums and considerations 2.5 2.2 2.1 4.0 6.7 67.4
Total premiums, consideration and deposits $638.2 $599.9 $597.1 $604.6 $679.9 12.7%
Net investment income 170.8 173.0 182.3 187.4 186.6 -0.4
Reinsurance allowance -86.4 -17.0 -25.1 32.0 -29.7 NA
Separate accounts revenue 35.2 34.7 36.6 37.3 36.8 -1.4
Other income 90.5 61.3 49.0 44.0 48.8 10.7
Total revenue $848.2 $851.9 $839.8 $905.4 $922.3 2.0%
Expense
Benefits $263.9 $271.4 $281.4 $290.7 $302.2 4.4%
Surrenders 273.0 265.1 308.9 350.3 339.6 -3.0
Increase in reserves 80.5 133.1 106.4 143.4 120.6 -15.9
Transfers to separate accounts 36.9 -38.0 -65.8 -89.6 -72.0 NA
Commissions 55.5 64.6 58.0 58.4 61.2 4.9
General and administrative expenses 60.1 62.4 65.9 66.0 67.9 3.0
Insurance taxes, licenses and fees 10.5 10.8 8.8 10.8 9.3 -13.4
Other expenses -4.9 -2.7 -4.3 11.3 14.4 27.1
Total expenses $775.5 $766.6 $759.4 $839.8 $843.2 0.4%
Net income
Policyholder dividends 18.3 18.2 17.5 18.2 18.1 -0.4
Net gain from operations before federal income tax 54.4 67.1 63.0 46.0 61.0 32.7
Federal income tax 10.6 16.3 12.4 3.4 9.4 177.7
Net income before capital gains $43.8 $50.8 $50.6 $42.6 $51.5 21.1%
Net realized capital gains (losses) -3.5 -11.4 -8.6 -4.7 -6.9 44.6
Net income $40.3 $39.4 $42.1 $37.9 $44.7 18.1%
Pre-tax operating income 54.4 67.1 63.0 46.0 61.0 32.7
Capital and surplus, end of year 354.0 367.2 380.7 394.9 400.0 5.5
1Calculated from unrounded data. 2Less than 0.1 percent. 3Data not available. NA = Not applicable.
Source: NAIC data, sourced from S&P Global Market Intelligence, Insurance Information Institute.
5. LIFE/ANNUITY FINANCIAL DATAFinancial Results
Insurance Information Institute | www.ii i.org 2021 Insurance Fact Book 39
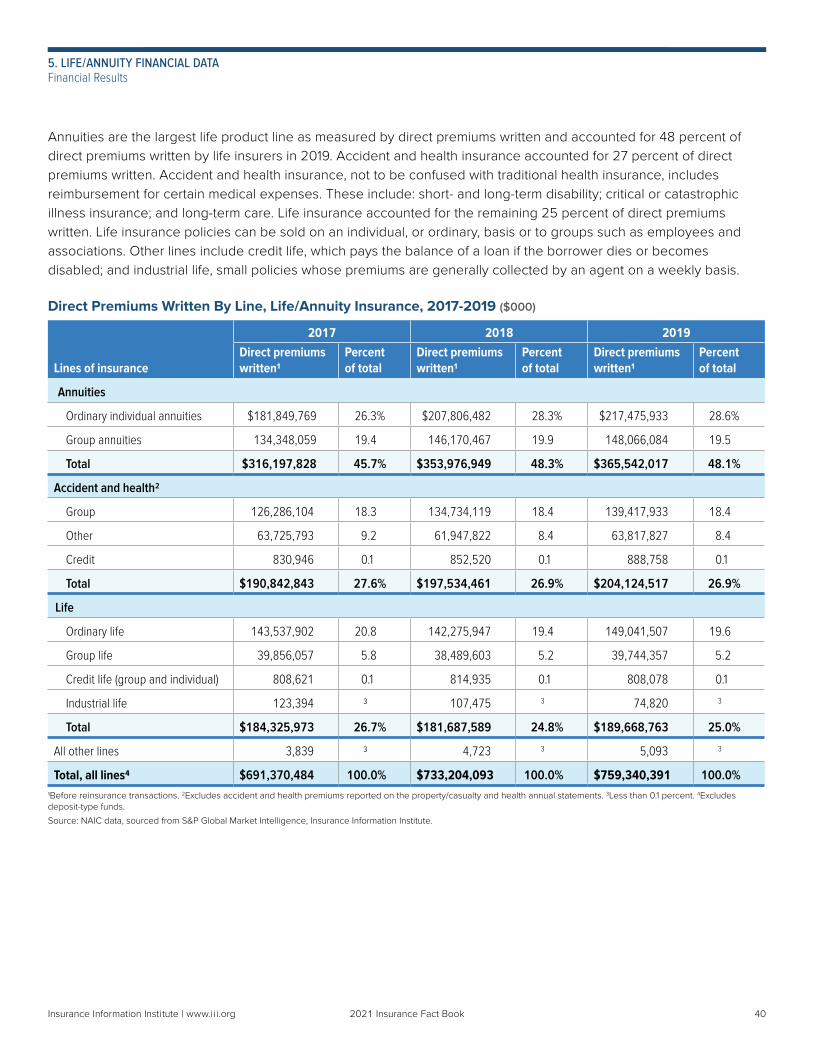
Annuities are the largest life product line as measured by direct premiums written and accounted for 48 percent of direct premiums written by life insurers in 2019. Accident and health insurance accounted for 27 percent of direct premiums written. Accident and health insurance, not to be confused with traditional health insurance, includes reimbursement for certain medical expenses. These include: short- and long-term disability; critical or catastrophic illness insurance; and long-term care. Life insurance accounted for the remaining 25 percent of direct premiums written. Life insurance policies can be sold on an individual, or ordinary, basis or to groups such as employees and associations. Other lines include credit life, which pays the balance of a loan if the borrower dies or becomes disabled; and industrial life, small policies whose premiums are generally collected by an agent on a weekly basis.
Direct Premiums Written By Line, Life/Annuity Insurance, 2017-2019 ($000)
Lines of insurance
2017 2018 2019Direct premiums written1
Percent of total
Direct premiums written1
Percent of total
Direct premiums written1
Percent of total
Annuities
Ordinary individual annuities $181,849,769 26.3% $207,806,482 28.3% $217,475,933 28.6%
Group annuities 134,348,059 19.4 146,170,467 19.9 148,066,084 19.5
Total $316,197,828 45.7% $353,976,949 48.3% $365,542,017 48.1%
Accident and health2
Group 126,286,104 18.3 134,734,119 18.4 139,417,933 18.4
Other 63,725,793 9.2 61,947,822 8.4 63,817,827 8.4
Credit 830,946 0.1 852,520 0.1 888,758 0.1
Total $190,842,843 27.6% $197,534,461 26.9% $204,124,517 26.9%
Life
Ordinary life 143,537,902 20.8 142,275,947 19.4 149,041,507 19.6
Group life 39,856,057 5.8 38,489,603 5.2 39,744,357 5.2
Credit life (group and individual) 808,621 0.1 814,935 0.1 808,078 0.1
Industrial life 123,394 3 107,475 3 74,820 3
Total $184,325,973 26.7% $181,687,589 24.8% $189,668,763 25.0%
All other lines 3,839 3 4,723 3 5,093 3
Total, all lines4 $691,370,484 100.0% $733,204,093 100.0% $759,340,391 100.0%1Before reinsurance transactions. 2Excludes accident and health premiums reported on the property/casualty and health annual statements. 3Less than 0.1 percent. 4Excludes deposit-type funds.
Source: NAIC data, sourced from S&P Global Market Intelligence, Insurance Information Institute.
5. LIFE/ANNUITY FINANCIAL DATAFinancial Results
Insurance Information Institute | www.ii i.org 2021 Insurance Fact Book 4040
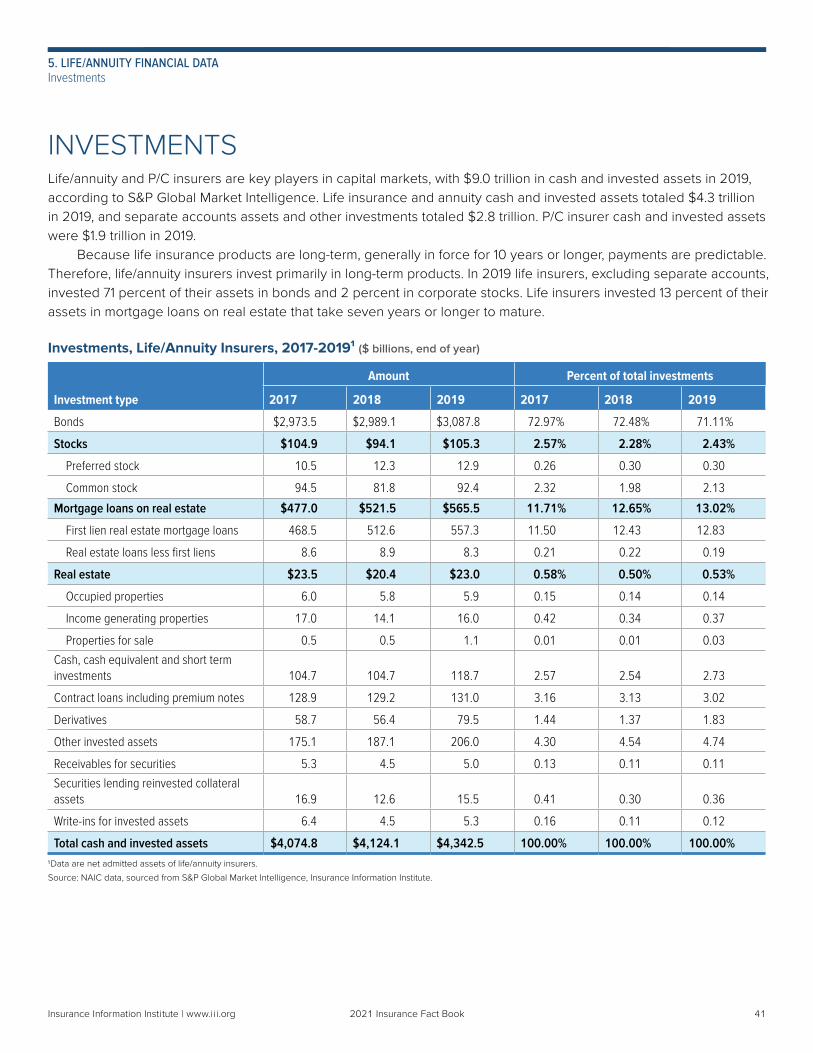
INVESTMENTSLife/annuity and P/C insurers are key players in capital markets, with $9.0 trillion in cash and invested assets in 2019, according to S&P Global Market Intelligence. Life insurance and annuity cash and invested assets totaled $4.3 trillion in 2019, and separate accounts assets and other investments totaled $2.8 trillion. P/C insurer cash and invested assets were $1.9 trillion in 2019. Because life insurance products are long-term, generally in force for 10 years or longer, payments are predictable. Therefore, life/annuity insurers invest primarily in long-term products. In 2019 life insurers, excluding separate accounts, invested 71 percent of their assets in bonds and 2 percent in corporate stocks. Life insurers invested 13 percent of their assets in mortgage loans on real estate that take seven years or longer to mature.
Investments, Life/Annuity Insurers, 2017-2019¹ ($ billions, end of year)
Amount Percent of total investments
Investment type 2017 2018 2019 2017 2018 2019
Bonds $2,973.5 $2,989.1 $3,087.8 72.97% 72.48% 71.11%
Stocks $104.9 $94.1 $105.3 2.57% 2.28% 2.43%
Preferred stock 10.5 12.3 12.9 0.26 0.30 0.30
Common stock 94.5 81.8 92.4 2.32 1.98 2.13
Mortgage loans on real estate $477.0 $521.5 $565.5 11.71% 12.65% 13.02%
First lien real estate mortgage loans 468.5 512.6 557.3 11.50 12.43 12.83
Real estate loans less first liens 8.6 8.9 8.3 0.21 0.22 0.19
Real estate $23.5 $20.4 $23.0 0.58% 0.50% 0.53%
Occupied properties 6.0 5.8 5.9 0.15 0.14 0.14
Income generating properties 17.0 14.1 16.0 0.42 0.34 0.37
Properties for sale 0.5 0.5 1.1 0.01 0.01 0.03
Cash, cash equivalent and short term investments 104.7 104.7 118.7 2.57 2.54 2.73
Contract loans including premium notes 128.9 129.2 131.0 3.16 3.13 3.02
Derivatives 58.7 56.4 79.5 1.44 1.37 1.83
Other invested assets 175.1 187.1 206.0 4.30 4.54 4.74
Receivables for securities 5.3 4.5 5.0 0.13 0.11 0.11
Securities lending reinvested collateral assets 16.9 12.6 15.5 0.41 0.30 0.36
Write-ins for invested assets 6.4 4.5 5.3 0.16 0.11 0.12
Total cash and invested assets $4,074.8 $4,124.1 $4,342.5 100.00% 100.00% 100.00%1Data are net admitted assets of life/annuity insurers.
Source: NAIC data, sourced from S&P Global Market Intelligence, Insurance Information Institute.
Insurance Information Institute | www.ii i.org 2021 Insurance Fact Book 41
5. LIFE/ANNUITY FINANCIAL DATA Investments
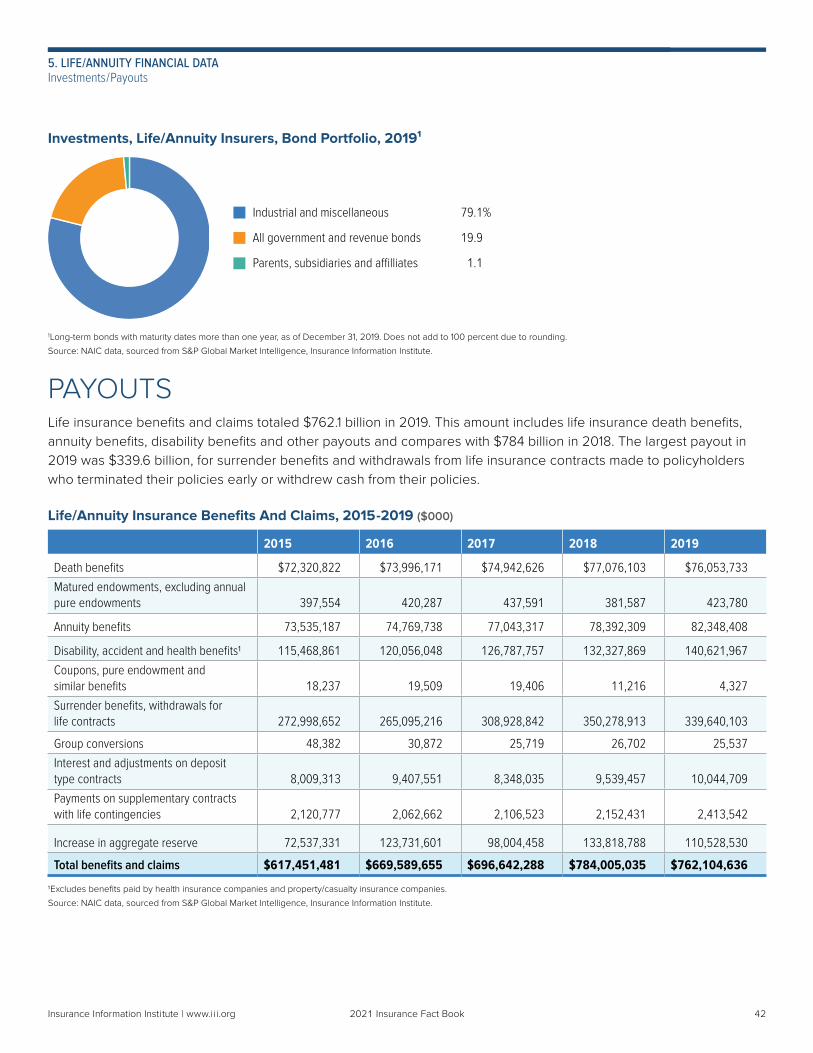
PAYOUTSLife insurance benefits and claims totaled $762.1 billion in 2019. This amount includes life insurance death benefits, annuity benefits, disability benefits and other payouts and compares with $784 billion in 2018. The largest payout in 2019 was $339.6 billion, for surrender benefits and withdrawals from life insurance contracts made to policyholders who terminated their policies early or withdrew cash from their policies.
Life/Annuity Insurance Benefits And Claims, 2015-2019 ($000)
2015 2016 2017 2018 2019
Death benefits $72,320,822 $73,996,171 $74,942,626 $77,076,103 $76,053,733
Matured endowments, excluding annual pure endowments 397,554 420,287 437,591 381,587 423,780
Annuity benefits 73,535,187 74,769,738 77,043,317 78,392,309 82,348,408
Disability, accident and health benefits1 115,468,861 120,056,048 126,787,757 132,327,869 140,621,967
Coupons, pure endowment and similar benefits 18,237 19,509 19,406 11,216 4,327
Surrender benefits, withdrawals for life contracts 272,998,652 265,095,216 308,928,842 350,278,913 339,640,103
Group conversions 48,382 30,872 25,719 26,702 25,537
Interest and adjustments on deposit type contracts 8,009,313 9,407,551 8,348,035 9,539,457 10,044,709
Payments on supplementary contracts with life contingencies 2,120,777 2,062,662 2,106,523 2,152,431 2,413,542
Increase in aggregate reserve 72,537,331 123,731,601 98,004,458 133,818,788 110,528,530
Total benefits and claims $617,451,481 $669,589,655 $696,642,288 $784,005,035 $762,104,636
1Excludes benefits paid by health insurance companies and property/casualty insurance companies.
Source: NAIC data, sourced from S&P Global Market Intelligence, Insurance Information Institute.
1Long-term bonds with maturity dates more than one year, as of December 31, 2019. Does not add to 100 percent due to rounding.
Source: NAIC data, sourced from S&P Global Market Intelligence, Insurance Information Institute.
Investments, Life/Annuity Insurers, Bond Portfolio, 2019¹
Industrial and miscellaneous 79.1%
All government and revenue bonds 19.9
Parents, subsidiaries and affilliates 1.1
Insurance Information Institute | www.ii i.org 2021 Insurance Fact Book 42
5. LIFE/ANNUITY FINANCIAL DATA Investments/Payouts
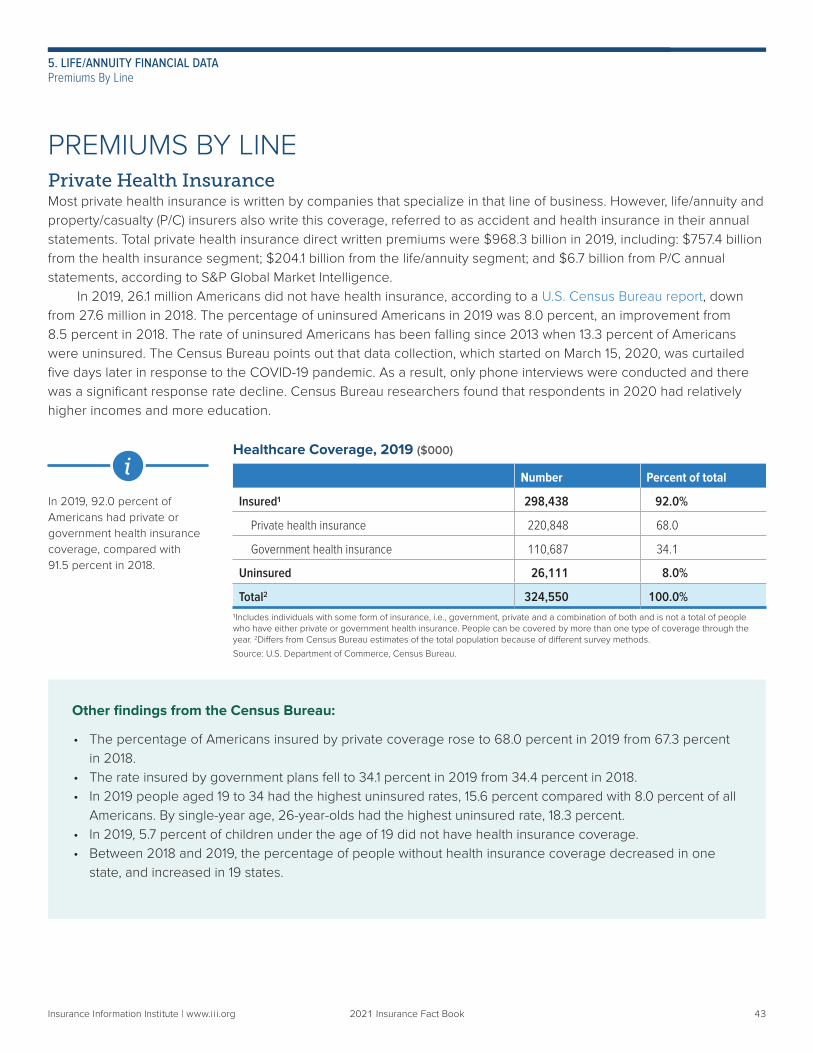
Other findings from the Census Bureau:
• The percentage of Americans insured by private coverage rose to 68.0 percent in 2019 from 67.3 percent in 2018.
• The rate insured by government plans fell to 34.1 percent in 2019 from 34.4 percent in 2018.• In 2019 people aged 19 to 34 had the highest uninsured rates, 15.6 percent compared with 8.0 percent of all
Americans. By single-year age, 26-year-olds had the highest uninsured rate, 18.3 percent.• In 2019, 5.7 percent of children under the age of 19 did not have health insurance coverage.• Between 2018 and 2019, the percentage of people without health insurance coverage decreased in one
state, and increased in 19 states.
Healthcare Coverage, 2019 ($000)
Number Percent of total
Insured1 298,438 92.0%
Private health insurance 220,848 68.0
Government health insurance 110,687 34.1
Uninsured 26,111 8.0%
Total2 324,550 100.0%1Includes individuals with some form of insurance, i.e., government, private and a combination of both and is not a total of people who have either private or government health insurance. People can be covered by more than one type of coverage through the year. 2Differs from Census Bureau estimates of the total population because of different survey methods.
Source: U.S. Department of Commerce, Census Bureau.
PREMIUMS BY LINEPrivate Health InsuranceMost private health insurance is written by companies that specialize in that line of business. However, life/annuity and property/casualty (P/C) insurers also write this coverage, referred to as accident and health insurance in their annual statements. Total private health insurance direct written premiums were $968.3 billion in 2019, including: $757.4 billion from the health insurance segment; $204.1 billion from the life/annuity segment; and $6.7 billion from P/C annual statements, according to S&P Global Market Intelligence. In 2019, 26.1 million Americans did not have health insurance, according to a U.S. Census Bureau report, down from 27.6 million in 2018. The percentage of uninsured Americans in 2019 was 8.0 percent, an improvement from 8.5 percent in 2018. The rate of uninsured Americans has been falling since 2013 when 13.3 percent of Americans were uninsured. The Census Bureau points out that data collection, which started on March 15, 2020, was curtailed five days later in response to the COVID-19 pandemic. As a result, only phone interviews were conducted and there was a significant response rate decline. Census Bureau researchers found that respondents in 2020 had relatively higher incomes and more education.
In 2019, 92.0 percent of Americans had private or government health insurance coverage, compared with 91.5 percent in 2018.
i
Insurance Information Institute | www.ii i.org 2021 Insurance Fact Book 43
5. LIFE/ANNUITY FINANCIAL DATA Premiums By Line
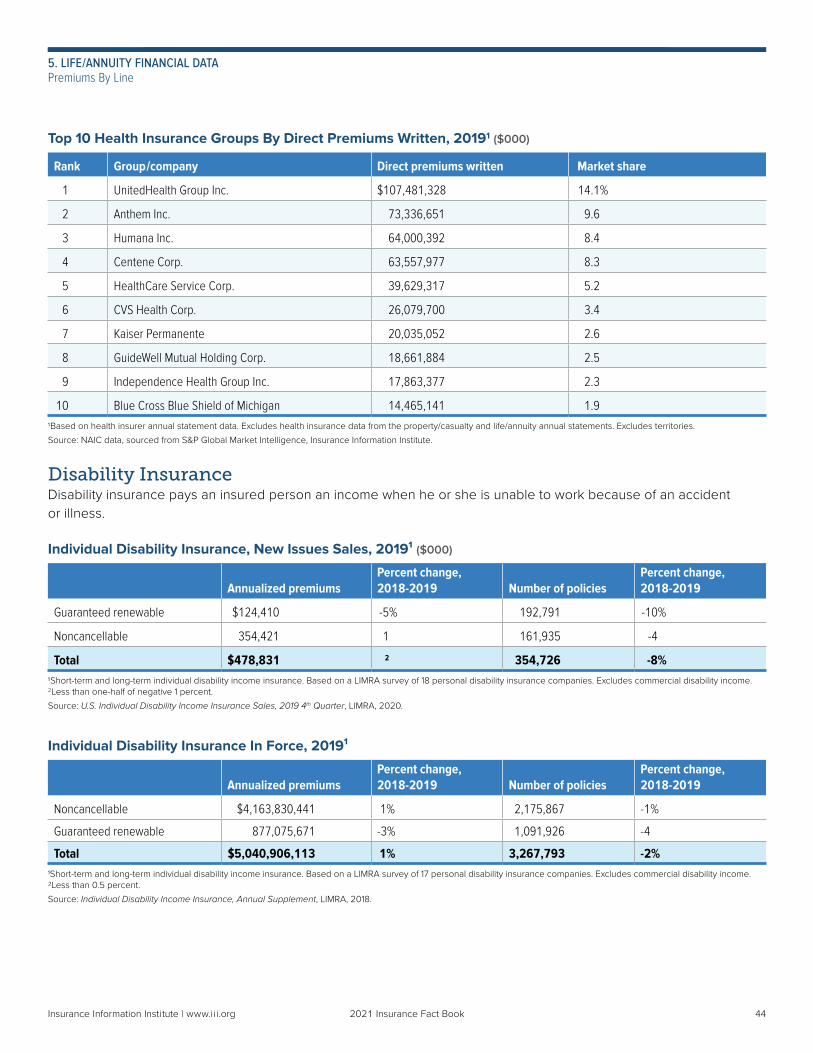
Top 10 Health Insurance Groups By Direct Premiums Written, 20191 ($000)
Rank Group/company Direct premiums written Market share
1 UnitedHealth Group Inc. $107,481,328 14.1%
2 Anthem Inc. 73,336,651 9.6
3 Humana Inc. 64,000,392 8.4
4 Centene Corp. 63,557,977 8.3
5 HealthCare Service Corp. 39,629,317 5.2
6 CVS Health Corp. 26,079,700 3.4
7 Kaiser Permanente 20,035,052 2.6
8 GuideWell Mutual Holding Corp. 18,661,884 2.5
9 Independence Health Group Inc. 17,863,377 2.3
10 Blue Cross Blue Shield of Michigan 14,465,141 1.91Based on health insurer annual statement data. Excludes health insurance data from the property/casualty and life/annuity annual statements. Excludes territories.
Source: NAIC data, sourced from S&P Global Market Intelligence, Insurance Information Institute.
Disability InsuranceDisability insurance pays an insured person an income when he or she is unable to work because of an accident or illness.
Individual Disability Insurance, New Issues Sales, 2019¹ ($000)
Annualized premiumsPercent change,2018-2019 Number of policies
Percent change,2018-2019
Guaranteed renewable $124,410 -5% 192,791 -10%
Noncancellable 354,421 1 161,935 -4
Total $478,831 2 354,726 -8%1Short-term and long-term individual disability income insurance. Based on a LIMRA survey of 18 personal disability insurance companies. Excludes commercial disability income. 2Less than one-half of negative 1 percent.
Source: U.S. Individual Disability Income Insurance Sales, 2019 4th Quarter, LIMRA, 2020.
Individual Disability Insurance In Force, 2019¹
Annualized premiumsPercent change,2018-2019 Number of policies
Percent change,2018-2019
Noncancellable $4,163,830,441 1% 2,175,867 -1%
Guaranteed renewable 877,075,671 -3% 1,091,926 -4
Total $5,040,906,113 1% 3,267,793 -2%1Short-term and long-term individual disability income insurance. Based on a LIMRA survey of 17 personal disability insurance companies. Excludes commercial disability income.2Less than 0.5 percent.
Source: Individual Disability Income Insurance, Annual Supplement, LIMRA, 2018.
Insurance Information Institute | www.ii i.org 2021 Insurance Fact Book 4444
5. LIFE/ANNUITY FINANCIAL DATA Premiums By Line
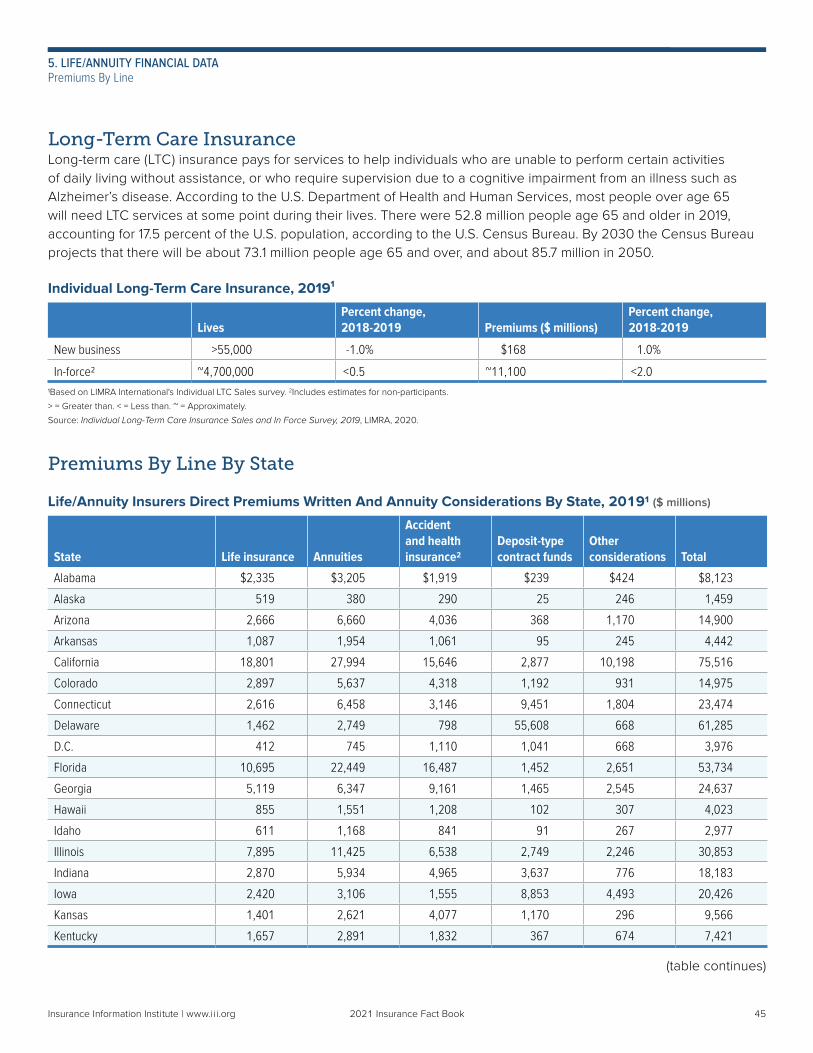
Long-Term Care InsuranceLong-term care (LTC) insurance pays for services to help individuals who are unable to perform certain activities of daily living without assistance, or who require supervision due to a cognitive impairment from an illness such as Alzheimer’s disease. According to the U.S. Department of Health and Human Services, most people over age 65 will need LTC services at some point during their lives. There were 52.8 million people age 65 and older in 2019, accounting for 17.5 percent of the U.S. population, according to the U.S. Census Bureau. By 2030 the Census Bureau projects that there will be about 73.1 million people age 65 and over, and about 85.7 million in 2050.
Individual Long-Term Care Insurance, 2019¹
LivesPercent change,2018-2019 Premiums ($ millions)
Percent change, 2018-2019
New business >55,000 -1.0% $168 1.0%
In-force2 ~4,700,000 <0.5 ~11,100 <2.01Based on LIMRA International's Individual LTC Sales survey. 2Includes estimates for non-participants.
> = Greater than. < = Less than. ~ = Approximately.
Source: Individual Long-Term Care Insurance Sales and In Force Survey, 2019, LIMRA, 2020.
Premiums By Line By State
Life/Annuity Insurers Direct Premiums Written And Annuity Considerations By State, 20191 ($ millions)
State Life insurance Annuities
Accident and health insurance2
Deposit-typecontract funds
Other considerations Total
Alabama $2,335 $3,205 $1,919 $239 $424 $8,123
Alaska 519 380 290 25 246 1,459
Arizona 2,666 6,660 4,036 368 1,170 14,900
Arkansas 1,087 1,954 1,061 95 245 4,442
California 18,801 27,994 15,646 2,877 10,198 75,516
Colorado 2,897 5,637 4,318 1,192 931 14,975
Connecticut 2,616 6,458 3,146 9,451 1,804 23,474
Delaware 1,462 2,749 798 55,608 668 61,285
D.C. 412 745 1,110 1,041 668 3,976
Florida 10,695 22,449 16,487 1,452 2,651 53,734
Georgia 5,119 6,347 9,161 1,465 2,545 24,637
Hawaii 855 1,551 1,208 102 307 4,023
Idaho 611 1,168 841 91 267 2,977
Illinois 7,895 11,425 6,538 2,749 2,246 30,853
Indiana 2,870 5,934 4,965 3,637 776 18,183
Iowa 2,420 3,106 1,555 8,853 4,493 20,426
Kansas 1,401 2,621 4,077 1,170 296 9,566
Kentucky 1,657 2,891 1,832 367 674 7,421
(table continues)
Insurance Information Institute | www.ii i.org 2021 Insurance Fact Book 45
5. LIFE/ANNUITY FINANCIAL DATA Premiums By Line
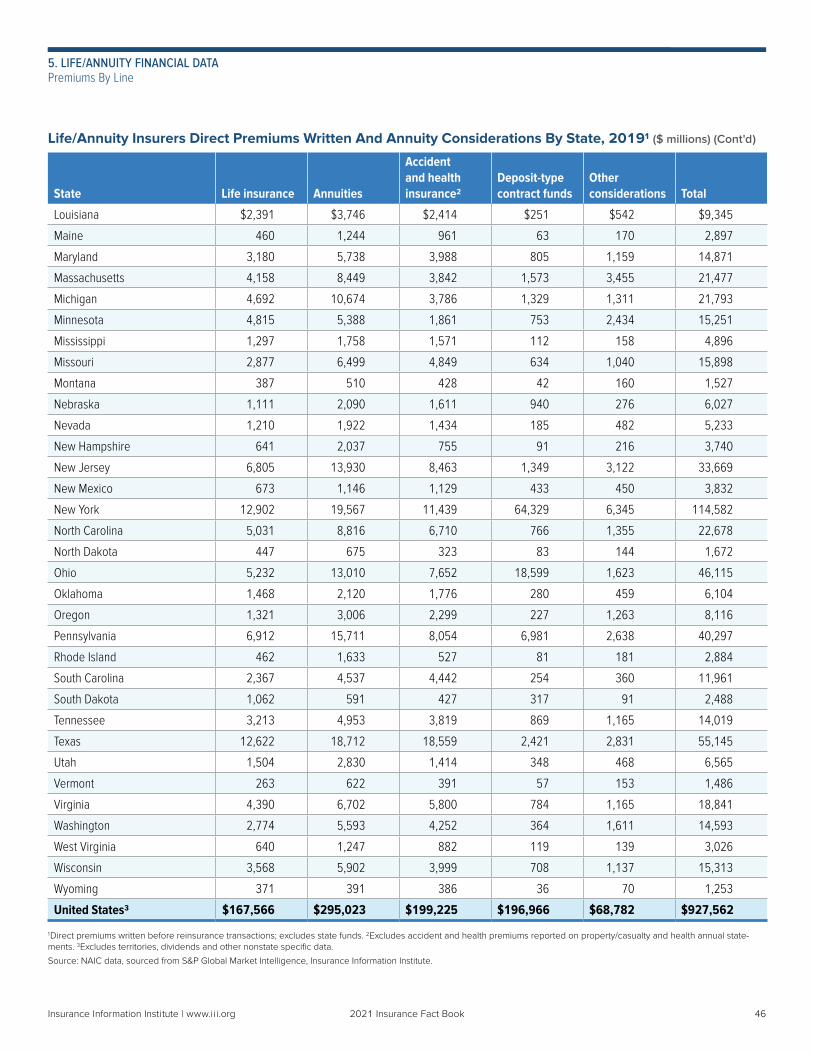
Life/Annuity Insurers Direct Premiums Written And Annuity Considerations By State, 20191 ($ millions) (Cont'd)
State Life insurance Annuities
Accident and health insurance2
Deposit-typecontract funds
Other considerations Total
Louisiana $2,391 $3,746 $2,414 $251 $542 $9,345
Maine 460 1,244 961 63 170 2,897
Maryland 3,180 5,738 3,988 805 1,159 14,871
Massachusetts 4,158 8,449 3,842 1,573 3,455 21,477
Michigan 4,692 10,674 3,786 1,329 1,311 21,793
Minnesota 4,815 5,388 1,861 753 2,434 15,251
Mississippi 1,297 1,758 1,571 112 158 4,896
Missouri 2,877 6,499 4,849 634 1,040 15,898
Montana 387 510 428 42 160 1,527
Nebraska 1,111 2,090 1,611 940 276 6,027
Nevada 1,210 1,922 1,434 185 482 5,233
New Hampshire 641 2,037 755 91 216 3,740
New Jersey 6,805 13,930 8,463 1,349 3,122 33,669
New Mexico 673 1,146 1,129 433 450 3,832
New York 12,902 19,567 11,439 64,329 6,345 114,582
North Carolina 5,031 8,816 6,710 766 1,355 22,678
North Dakota 447 675 323 83 144 1,672
Ohio 5,232 13,010 7,652 18,599 1,623 46,115
Oklahoma 1,468 2,120 1,776 280 459 6,104
Oregon 1,321 3,006 2,299 227 1,263 8,116
Pennsylvania 6,912 15,711 8,054 6,981 2,638 40,297
Rhode Island 462 1,633 527 81 181 2,884
South Carolina 2,367 4,537 4,442 254 360 11,961
South Dakota 1,062 591 427 317 91 2,488
Tennessee 3,213 4,953 3,819 869 1,165 14,019
Texas 12,622 18,712 18,559 2,421 2,831 55,145
Utah 1,504 2,830 1,414 348 468 6,565
Vermont 263 622 391 57 153 1,486
Virginia 4,390 6,702 5,800 784 1,165 18,841
Washington 2,774 5,593 4,252 364 1,611 14,593
West Virginia 640 1,247 882 119 139 3,026
Wisconsin 3,568 5,902 3,999 708 1,137 15,313
Wyoming 371 391 386 36 70 1,253
United States3 $167,566 $295,023 $199,225 $196,966 $68,782 $927,562
1Direct premiums written before reinsurance transactions; excludes state funds. 2Excludes accident and health premiums reported on property/casualty and health annual state-ments. 3Excludes territories, dividends and other nonstate specific data.
Source: NAIC data, sourced from S&P Global Market Intelligence, Insurance Information Institute.
Insurance Information Institute | www.ii i.org 2021 Insurance Fact Book 4646
5. LIFE/ANNUITY FINANCIAL DATA Premiums By Line
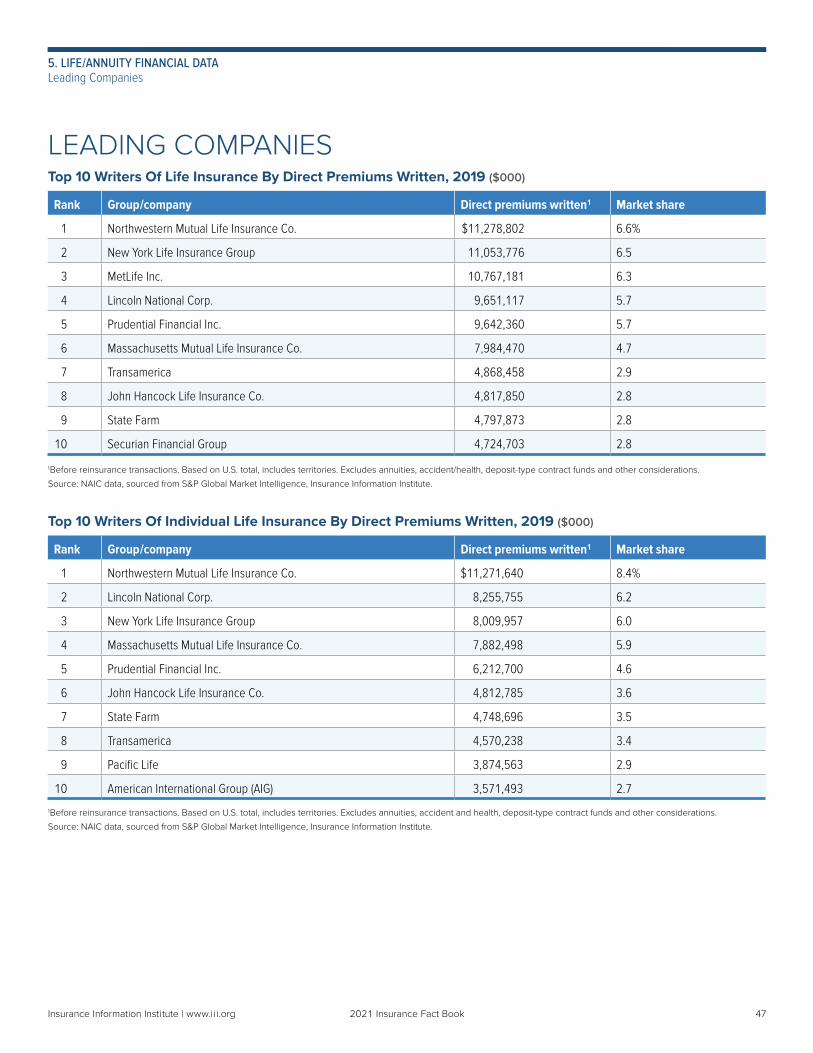
LEADING COMPANIESTop 10 Writers Of Life Insurance By Direct Premiums Written, 2019 ($000)
Rank Group/company Direct premiums written1 Market share
1 Northwestern Mutual Life Insurance Co. $11,278,802 6.6%
2 New York Life Insurance Group 11,053,776 6.5
3 MetLife Inc. 10,767,181 6.3
4 Lincoln National Corp. 9,651,117 5.7
5 Prudential Financial Inc. 9,642,360 5.7
6 Massachusetts Mutual Life Insurance Co. 7,984,470 4.7
7 Transamerica 4,868,458 2.9
8 John Hancock Life Insurance Co. 4,817,850 2.8
9 State Farm 4,797,873 2.8
10 Securian Financial Group 4,724,703 2.8
1Before reinsurance transactions. Based on U.S. total, includes territories. Excludes annuities, accident/health, deposit-type contract funds and other considerations.
Source: NAIC data, sourced from S&P Global Market Intelligence, Insurance Information Institute.
Top 10 Writers Of Individual Life Insurance By Direct Premiums Written, 2019 ($000)
Rank Group/company Direct premiums written1 Market share
1 Northwestern Mutual Life Insurance Co. $11,271,640 8.4%
2 Lincoln National Corp. 8,255,755 6.2
3 New York Life Insurance Group 8,009,957 6.0
4 Massachusetts Mutual Life Insurance Co. 7,882,498 5.9
5 Prudential Financial Inc. 6,212,700 4.6
6 John Hancock Life Insurance Co. 4,812,785 3.6
7 State Farm 4,748,696 3.5
8 Transamerica 4,570,238 3.4
9 Pacific Life 3,874,563 2.9
10 American International Group (AIG) 3,571,493 2.7
1Before reinsurance transactions. Based on U.S. total, includes territories. Excludes annuities, accident and health, deposit-type contract funds and other considerations.
Source: NAIC data, sourced from S&P Global Market Intelligence, Insurance Information Institute.
Insurance Information Institute | www.ii i.org 2021 Insurance Fact Book 4747
5. LIFE/ANNUITY FINANCIAL DATA Leading Companies
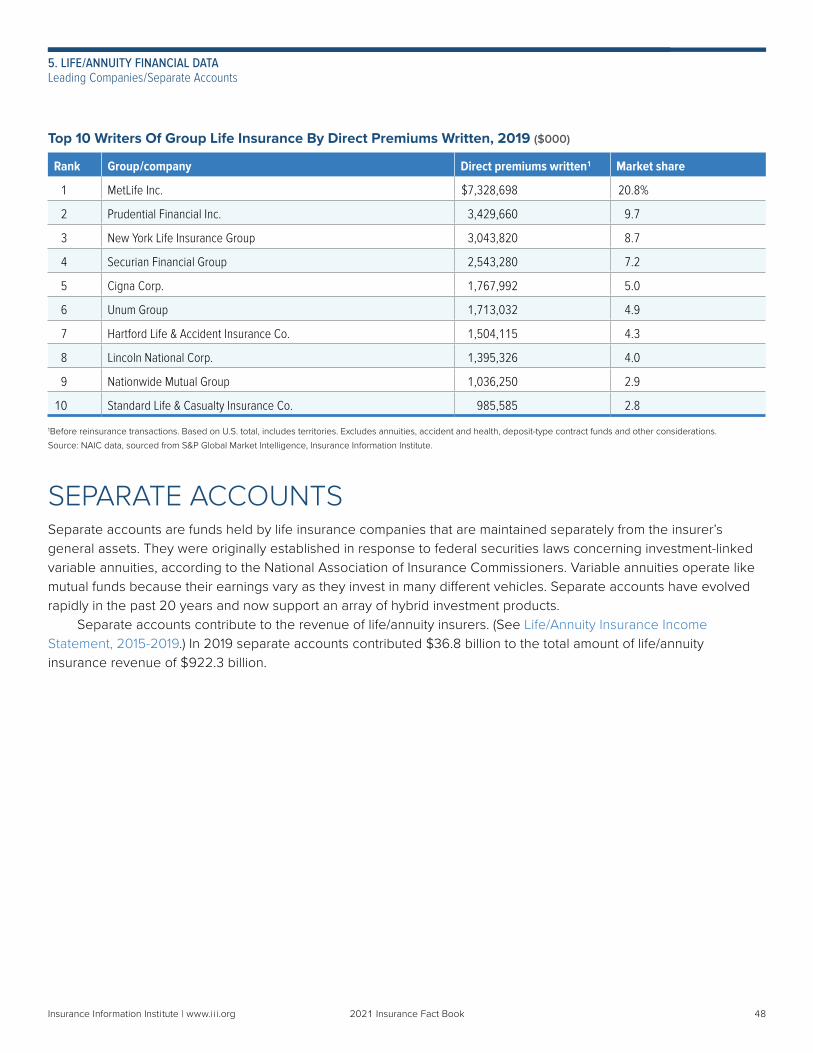
Top 10 Writers Of Group Life Insurance By Direct Premiums Written, 2019 ($000)
Rank Group/company Direct premiums written1 Market share
1 MetLife Inc. $7,328,698 20.8%
2 Prudential Financial Inc. 3,429,660 9.7
3 New York Life Insurance Group 3,043,820 8.7
4 Securian Financial Group 2,543,280 7.2
5 Cigna Corp. 1,767,992 5.0
6 Unum Group 1,713,032 4.9
7 Hartford Life & Accident Insurance Co. 1,504,115 4.3
8 Lincoln National Corp. 1,395,326 4.0
9 Nationwide Mutual Group 1,036,250 2.9
10 Standard Life & Casualty Insurance Co. 985,585 2.8
1Before reinsurance transactions. Based on U.S. total, includes territories. Excludes annuities, accident and health, deposit-type contract funds and other considerations.
Source: NAIC data, sourced from S&P Global Market Intelligence, Insurance Information Institute.
SEPARATE ACCOUNTSSeparate accounts are funds held by life insurance companies that are maintained separately from the insurer’s general assets. They were originally established in response to federal securities laws concerning investment-linked variable annuities, according to the National Association of Insurance Commissioners. Variable annuities operate like mutual funds because their earnings vary as they invest in many different vehicles. Separate accounts have evolved rapidly in the past 20 years and now support an array of hybrid investment products. Separate accounts contribute to the revenue of life/annuity insurers. (See Life/Annuity Insurance Income Statement, 2015-2019.) In 2019 separate accounts contributed $36.8 billion to the total amount of life/annuity insurance revenue of $922.3 billion.
Insurance Information Institute | www.ii i.org 2021 Insurance Fact Book 48
5. LIFE/ANNUITY FINANCIAL DATA Leading Companies/Separate Accounts
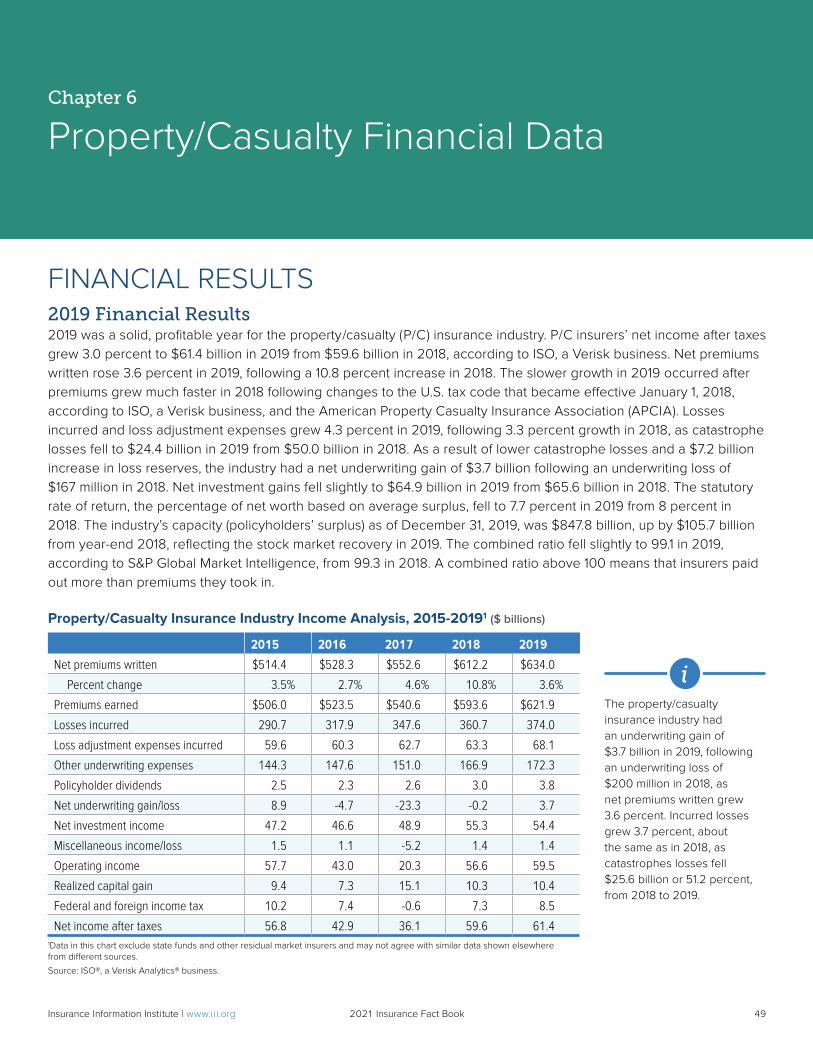
FINANCIAL RESULTS2019 Financial Results2019 was a solid, profitable year for the property/casualty (P/C) insurance industry. P/C insurers’ net income after taxes grew 3.0 percent to $61.4 billion in 2019 from $59.6 billion in 2018, according to ISO, a Verisk business. Net premiums written rose 3.6 percent in 2019, following a 10.8 percent increase in 2018. The slower growth in 2019 occurred after premiums grew much faster in 2018 following changes to the U.S. tax code that became effective January 1, 2018, according to ISO, a Verisk business, and the American Property Casualty Insurance Association (APCIA). Losses incurred and loss adjustment expenses grew 4.3 percent in 2019, following 3.3 percent growth in 2018, as catastrophe losses fell to $24.4 billion in 2019 from $50.0 billion in 2018. As a result of lower catastrophe losses and a $7.2 billion increase in loss reserves, the industry had a net underwriting gain of $3.7 billion following an underwriting loss of $167 million in 2018. Net investment gains fell slightly to $64.9 billion in 2019 from $65.6 billion in 2018. The statutory rate of return, the percentage of net worth based on average surplus, fell to 7.7 percent in 2019 from 8 percent in 2018. The industry’s capacity (policyholders’ surplus) as of December 31, 2019, was $847.8 billion, up by $105.7 billion from year-end 2018, reflecting the stock market recovery in 2019. The combined ratio fell slightly to 99.1 in 2019, according to S&P Global Market Intelligence, from 99.3 in 2018. A combined ratio above 100 means that insurers paid out more than premiums they took in.
Property/Casualty Insurance Industry Income Analysis, 2015-20191 ($ billions)
2015 2016 2017 2018 2019
Net premiums written $514.4 $528.3 $552.6 $612.2 $634.0
Percent change 3.5% 2.7% 4.6% 10.8% 3.6%
Premiums earned $506.0 $523.5 $540.6 $593.6 $621.9
Losses incurred 290.7 317.9 347.6 360.7 374.0
Loss adjustment expenses incurred 59.6 60.3 62.7 63.3 68.1
Other underwriting expenses 144.3 147.6 151.0 166.9 172.3
Policyholder dividends 2.5 2.3 2.6 3.0 3.8
Net underwriting gain/loss 8.9 -4.7 -23.3 -0.2 3.7
Net investment income 47.2 46.6 48.9 55.3 54.4
Miscellaneous income/loss 1.5 1.1 -5.2 1.4 1.4
Operating income 57.7 43.0 20.3 56.6 59.5
Realized capital gain 9.4 7.3 15.1 10.3 10.4
Federal and foreign income tax 10.2 7.4 -0.6 7.3 8.5
Net income after taxes 56.8 42.9 36.1 59.6 61.41Data in this chart exclude state funds and other residual market insurers and may not agree with similar data shown elsewhere from different sources.
Source: ISO®, a Verisk Analytics® business.
Chapter 6
Property/Casualty Financial Data
49
The property/casualty insurance industry had an underwriting gain of $3.7 billion in 2019, following an underwriting loss of $200 million in 2018, as net premiums written grew 3.6 percent. Incurred losses grew 3.7 percent, about the same as in 2018, as catastrophes losses fell $25.6 billion or 51.2 percent, from 2018 to 2019.
Insurance Information Institute | www.ii i.org 2021 Insurance Fact Book 49
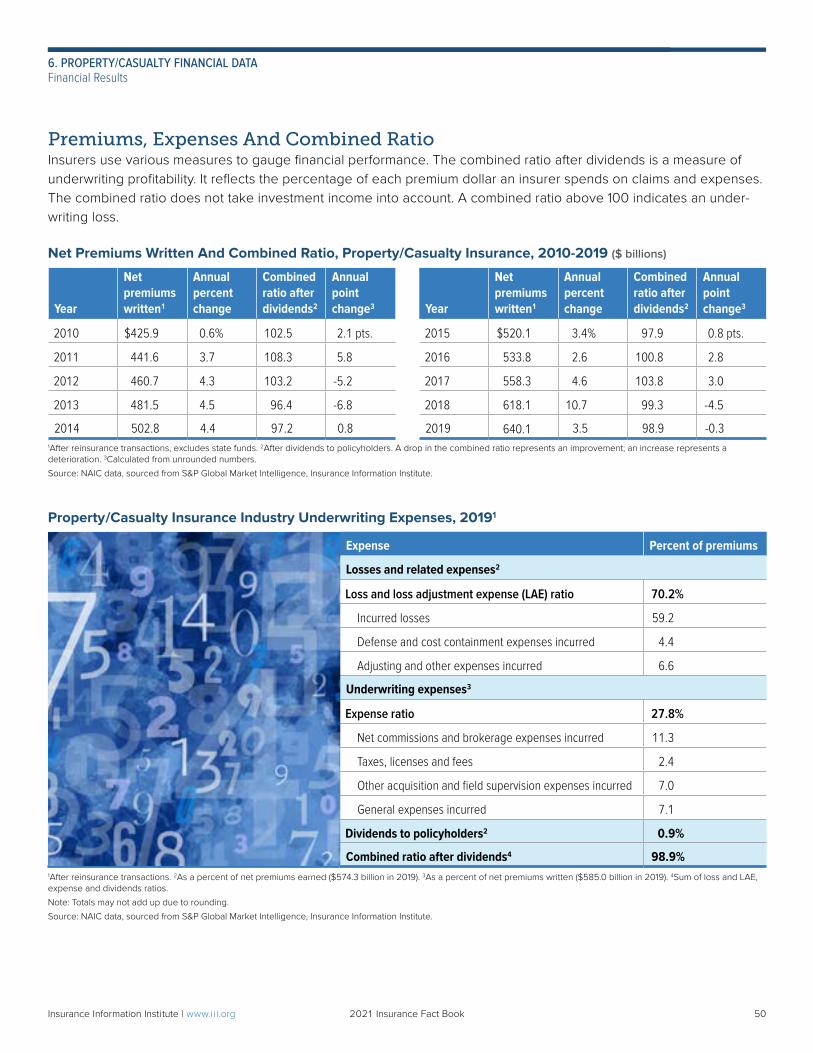
Premiums, Expenses And Combined RatioInsurers use various measures to gauge financial performance. The combined ratio after dividends is a measure of underwriting profitability. It reflects the percentage of each premium dollar an insurer spends on claims and expenses. The combined ratio does not take investment income into account. A combined ratio above 100 indicates an under-writing loss.
Net Premiums Written And Combined Ratio, Property/Casualty Insurance, 2010-2019 ($ billions)
Year
Net premiums written1
Annual percent change
Combined ratio after dividends2
Annual point change3 Year
Net premiums written1
Annual percent change
Combined ratio after dividends2
Annual point change3
2010 $425.9 0.6% 102.5 2.1 pts. 2015 $520.1 3.4% 97.9 0.8 pts.
2011 441.6 3.7 108.3 5.8 2016 533.8 2.6 100.8 2.8
2012 460.7 4.3 103.2 -5.2 2017 558.3 4.6 103.8 3.0
2013 481.5 4.5 96.4 -6.8 2018 618.1 10.7 99.3 -4.5
2014 502.8 4.4 97.2 0.8 2019 640.1 3.5 98.9 -0.31After reinsurance transactions, excludes state funds. 2After dividends to policyholders. A drop in the combined ratio represents an improvement; an increase represents a deterioration. 3Calculated from unrounded numbers.
Source: NAIC data, sourced from S&P Global Market Intelligence, Insurance Information Institute.
Property/Casualty Insurance Industry Underwriting Expenses, 20191
Expense Percent of premiums
Losses and related expenses2
Loss and loss adjustment expense (LAE) ratio 70.2%
Incurred losses 59.2
Defense and cost containment expenses incurred 4.4
Adjusting and other expenses incurred 6.6
Underwriting expenses3
Expense ratio 27.8%
Net commissions and brokerage expenses incurred 11.3
Taxes, licenses and fees 2.4
Other acquisition and field supervision expenses incurred 7.0
General expenses incurred 7.1
Dividends to policyholders2 0.9%
Combined ratio after dividends4 98.9%1After reinsurance transactions. 2As a percent of net premiums earned ($574.3 billion in 2019). 3As a percent of net premiums written ($585.0 billion in 2019). 4Sum of loss and LAE, expense and dividends ratios.
Note: Totals may not add up due to rounding.
Source: NAIC data, sourced from S&P Global Market Intelligence, Insurance Information Institute.
50Insurance Information Institute | www.ii i.org 2021 Insurance Fact Book 50
6. PROPERTY/CASUALTY FINANCIAL DATAFinancial Results
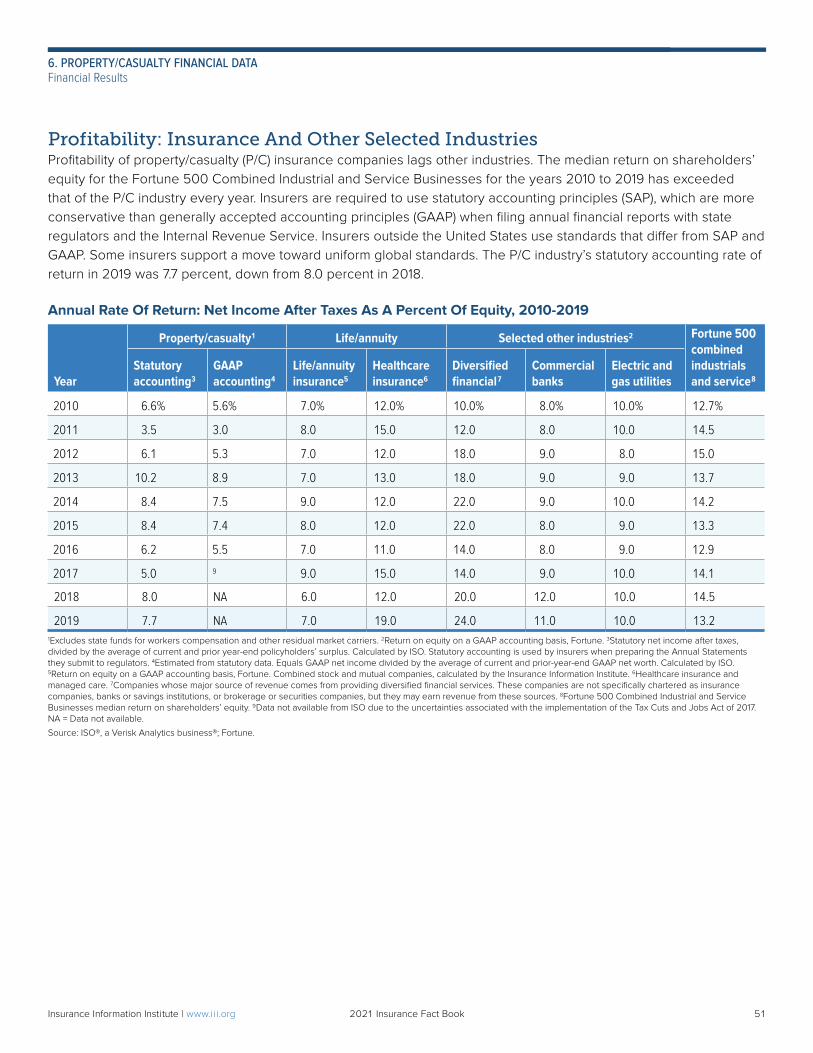
Profitability: Insurance And Other Selected IndustriesProfitability of property/casualty (P/C) insurance companies lags other industries. The median return on shareholders’ equity for the Fortune 500 Combined Industrial and Service Businesses for the years 2010 to 2019 has exceeded that of the P/C industry every year. Insurers are required to use statutory accounting principles (SAP), which are more conservative than generally accepted accounting principles (GAAP) when filing annual financial reports with state regulators and the Internal Revenue Service. Insurers outside the United States use standards that differ from SAP and GAAP. Some insurers support a move toward uniform global standards. The P/C industry’s statutory accounting rate of return in 2019 was 7.7 percent, down from 8.0 percent in 2018.
Annual Rate Of Return: Net Income After Taxes As A Percent Of Equity, 2010-2019
Year
Property/casualty1 Life/annuity Selected other industries2 Fortune 500 combined industrials and service8
Statutory accounting3
GAAP accounting4
Life/annuity insurance5
Healthcare insurance6
Diversified financial7
Commercial banks
Electric and gas utilities
2010 6.6% 5.6% 7.0% 12.0% 10.0% 8.0% 10.0% 12.7%
2011 3.5 3.0 8.0 15.0 12.0 8.0 10.0 14.5
2012 6.1 5.3 7.0 12.0 18.0 9.0 8.0 15.0
2013 10.2 8.9 7.0 13.0 18.0 9.0 9.0 13.7
2014 8.4 7.5 9.0 12.0 22.0 9.0 10.0 14.2
2015 8.4 7.4 8.0 12.0 22.0 8.0 9.0 13.3
2016 6.2 5.5 7.0 11.0 14.0 8.0 9.0 12.9
2017 5.0 9 9.0 15.0 14.0 9.0 10.0 14.1
2018 8.0 NA 6.0 12.0 20.0 12.0 10.0 14.5
2019 7.7 NA 7.0 19.0 24.0 11.0 10.0 13.21Excludes state funds for workers compensation and other residual market carriers. 2Return on equity on a GAAP accounting basis, Fortune. 3Statutory net income after taxes, divided by the average of current and prior year-end policyholders’ surplus. Calculated by ISO. Statutory accounting is used by insurers when preparing the Annual Statements they submit to regulators. 4Estimated from statutory data. Equals GAAP net income divided by the average of current and prior-year-end GAAP net worth. Calculated by ISO. 5Return on equity on a GAAP accounting basis, Fortune. Combined stock and mutual companies, calculated by the Insurance Information Institute. 6Healthcare insurance and managed care. 7Companies whose major source of revenue comes from providing diversified financial services. These companies are not specifically chartered as insurance companies, banks or savings institutions, or brokerage or securities companies, but they may earn revenue from these sources. 8Fortune 500 Combined Industrial and Service Businesses median return on shareholders’ equity. 9Data not available from ISO due to the uncertainties associated with the implementation of the Tax Cuts and Jobs Act of 2017.NA = Data not available.
Source: ISO®, a Verisk Analytics business®; Fortune.
51Insurance Information Institute | www.ii i.org 2021 Insurance Fact Book 51
6. PROPERTY/CASUALTY FINANCIAL DATAFinancial Results
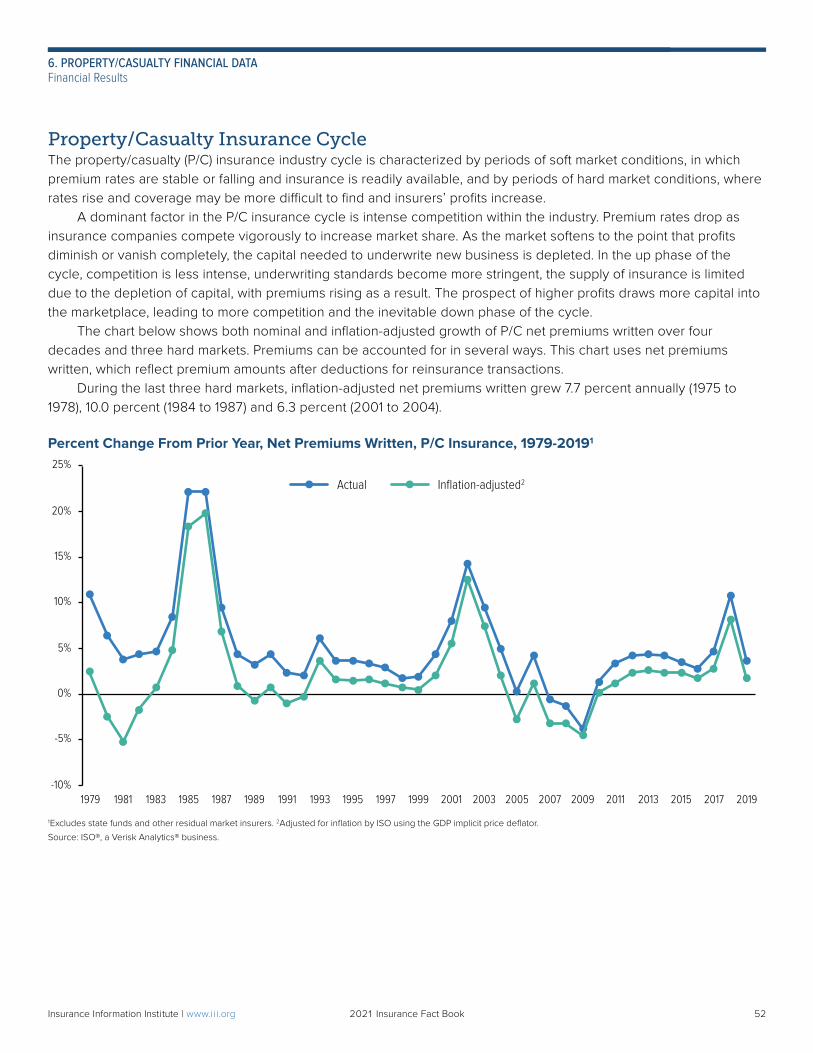
Property/Casualty Insurance CycleThe property/casualty (P/C) insurance industry cycle is characterized by periods of soft market conditions, in which premium rates are stable or falling and insurance is readily available, and by periods of hard market conditions, where rates rise and coverage may be more difficult to find and insurers’ profits increase. A dominant factor in the P/C insurance cycle is intense competition within the industry. Premium rates drop as insurance companies compete vigorously to increase market share. As the market softens to the point that profits diminish or vanish completely, the capital needed to underwrite new business is depleted. In the up phase of the cycle, competition is less intense, underwriting standards become more stringent, the supply of insurance is limited due to the depletion of capital, with premiums rising as a result. The prospect of higher profits draws more capital into the marketplace, leading to more competition and the inevitable down phase of the cycle. The chart below shows both nominal and inflation-adjusted growth of P/C net premiums written over four decades and three hard markets. Premiums can be accounted for in several ways. This chart uses net premiums written, which reflect premium amounts after deductions for reinsurance transactions. During the last three hard markets, inflation-adjusted net premiums written grew 7.7 percent annually (1975 to 1978), 10.0 percent (1984 to 1987) and 6.3 percent (2001 to 2004).
Percent Change From Prior Year, Net Premiums Written, P/C Insurance, 1979-20191
1Excludes state funds and other residual market insurers. 2Adjusted for inflation by ISO using the GDP implicit price deflator.
Source: ISO®, a Verisk Analytics® business.
-10%
-5%
0%
5%
10%
15%
20%
25%
1979 1981 1983 1985 1987 1989 1991 1993 1995 1997 1999 2001 2003 2005 2007 2009 2011 2013 2015 2017 2019
Actual Inflation-adjusted2
52Insurance Information Institute | www.ii i.org 2021 Insurance Fact Book 52
6. PROPERTY/CASUALTY FINANCIAL DATAFinancial Results
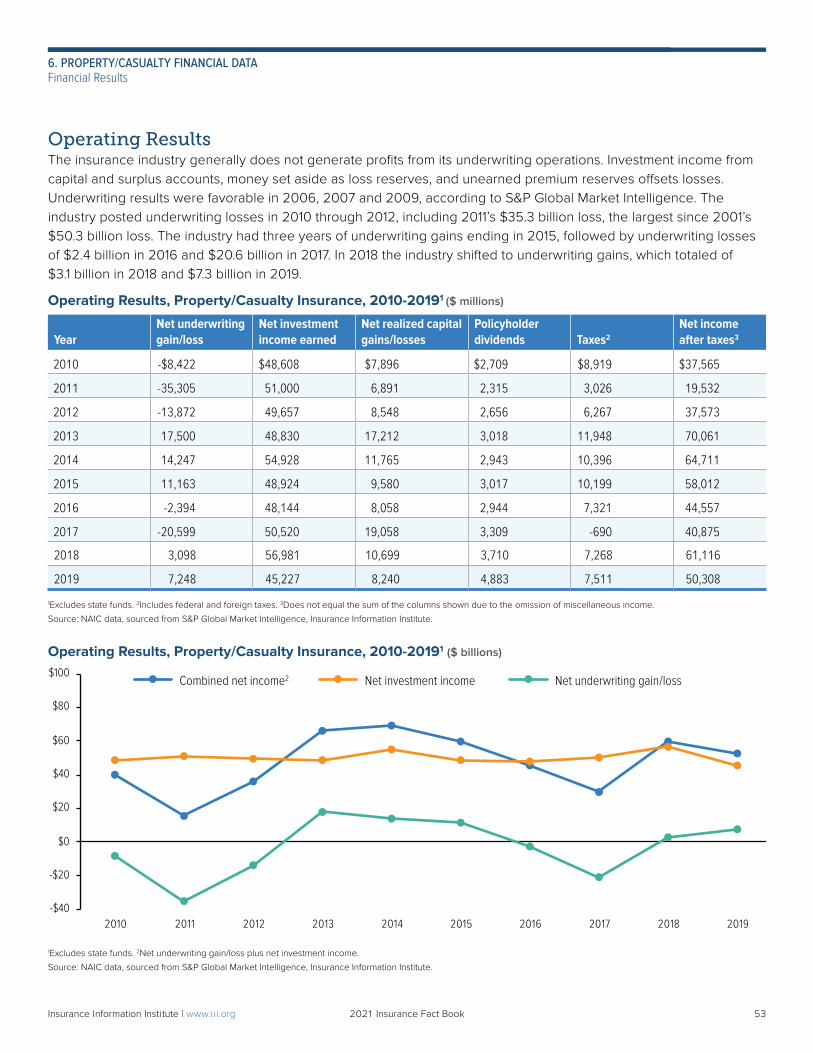
Operating ResultsThe insurance industry generally does not generate profits from its underwriting operations. Investment income from capital and surplus accounts, money set aside as loss reserves, and unearned premium reserves offsets losses. Underwriting results were favorable in 2006, 2007 and 2009, according to S&P Global Market Intelligence. The industry posted underwriting losses in 2010 through 2012, including 2011’s $35.3 billion loss, the largest since 2001’s $50.3 billion loss. The industry had three years of underwriting gains ending in 2015, followed by underwriting losses of $2.4 billion in 2016 and $20.6 billion in 2017. In 2018 the industry shifted to underwriting gains, which totaled of $3.1 billion in 2018 and $7.3 billion in 2019.
Operating Results, Property/Casualty Insurance, 2010-20191 ($ millions)
YearNet underwriting gain/loss
Net investment income earned
Net realized capital gains/losses
Policyholder dividends Taxes2
Net income after taxes3
2010 -$8,422 $48,608 $7,896 $2,709 $8,919 $37,565
2011 -35,305 51,000 6,891 2,315 3,026 19,532
2012 -13,872 49,657 8,548 2,656 6,267 37,573
2013 17,500 48,830 17,212 3,018 11,948 70,061
2014 14,247 54,928 11,765 2,943 10,396 64,711
2015 11,163 48,924 9,580 3,017 10,199 58,012
2016 -2,394 48,144 8,058 2,944 7,321 44,557
2017 -20,599 50,520 19,058 3,309 -690 40,875
2018 3,098 56,981 10,699 3,710 7,268 61,116
2019 7,248 45,227 8,240 4,883 7,511 50,308
1Excludes state funds. 2Includes federal and foreign taxes. 3Does not equal the sum of the columns shown due to the omission of miscellaneous income.
Source: NAIC data, sourced from S&P Global Market Intelligence, Insurance Information Institute.
Operating Results, Property/Casualty Insurance, 2010-20191 ($ billions)
1Excludes state funds. 2Net underwriting gain/loss plus net investment income.
Source: NAIC data, sourced from S&P Global Market Intelligence, Insurance Information Institute.
-$40
-$20
$0
$20
$40
$60
$80
$100
2010 2011 2012 2013 2014 2015 2016 2017 2018 2019
Combined net income2 Net investment income Net underwriting gain/loss
53Insurance Information Institute | www.ii i.org 2021 Insurance Fact Book 53
6. PROPERTY/CASUALTY FINANCIAL DATAFinancial Results
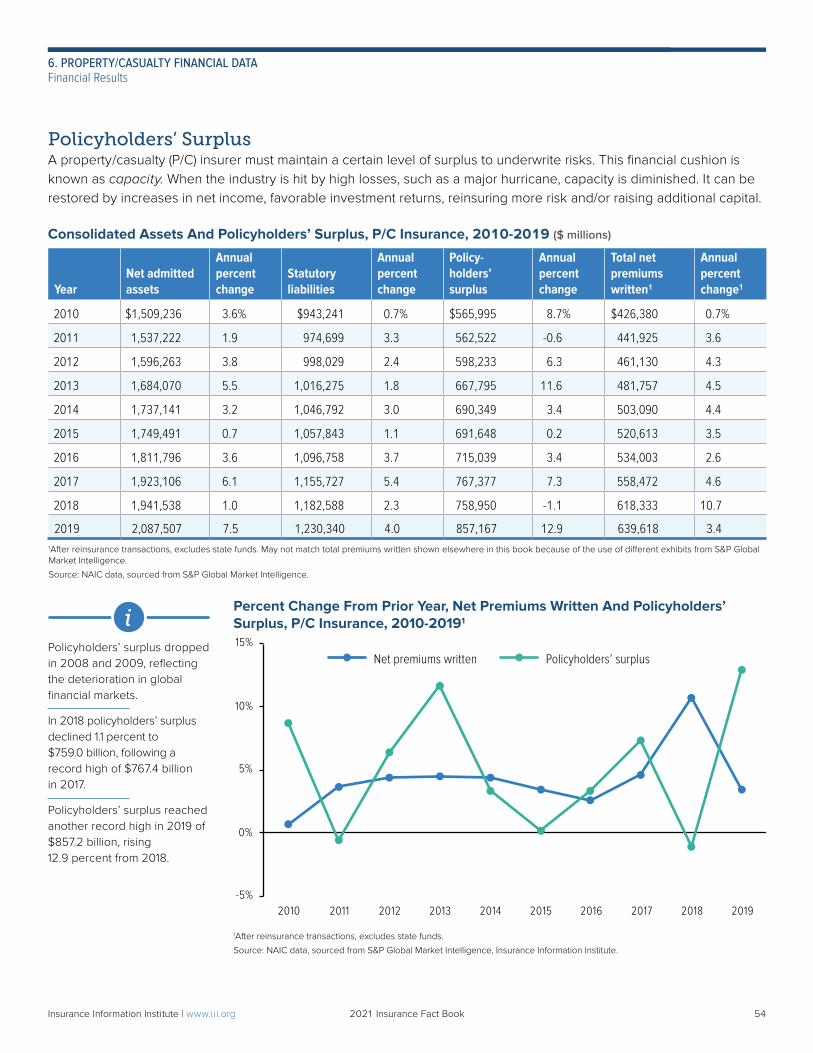
Policyholders’ SurplusA property/casualty (P/C) insurer must maintain a certain level of surplus to underwrite risks. This financial cushion is known as capacity. When the industry is hit by high losses, such as a major hurricane, capacity is diminished. It can be restored by increases in net income, favorable investment returns, reinsuring more risk and/or raising additional capital.
Consolidated Assets And Policyholders’ Surplus, P/C Insurance, 2010-2019 ($ millions)
YearNet admitted assets
Annual percent change
Statutory liabilities
Annual percent change
Policy- holders’ surplus
Annual percent change
Total net premiums written1
Annual percent change1
2010 $1,509,236 3.6% $943,241 0.7% $565,995 8.7% $426,380 0.7%
2011 1,537,222 1.9 974,699 3.3 562,522 -0.6 441,925 3.6
2012 1,596,263 3.8 998,029 2.4 598,233 6.3 461,130 4.3
2013 1,684,070 5.5 1,016,275 1.8 667,795 11.6 481,757 4.5
2014 1,737,141 3.2 1,046,792 3.0 690,349 3.4 503,090 4.4
2015 1,749,491 0.7 1,057,843 1.1 691,648 0.2 520,613 3.5
2016 1,811,796 3.6 1,096,758 3.7 715,039 3.4 534,003 2.6
2017 1,923,106 6.1 1,155,727 5.4 767,377 7.3 558,472 4.6
2018 1,941,538 1.0 1,182,588 2.3 758,950 -1.1 618,333 10.7
2019 2,087,507 7.5 1,230,340 4.0 857,167 12.9 639,618 3.41After reinsurance transactions, excludes state funds. May not match total premiums written shown elsewhere in this book because of the use of different exhibits from S&P Global Market Intelligence.
Source: NAIC data, sourced from S&P Global Market Intelligence.
Percent Change From Prior Year, Net Premiums Written And Policyholders’ Surplus, P/C Insurance, 2010-20191
1After reinsurance transactions, excludes state funds.
Source: NAIC data, sourced from S&P Global Market Intelligence, Insurance Information Institute.
Policyholders’ surplus dropped in 2008 and 2009, reflecting the deterioration in global financial markets.
In 2018 policyholders’ surplus declined 1.1 percent to $759.0 billion, following a record high of $767.4 billion in 2017.
Policyholders’ surplus reached another record high in 2019 of $857.2 billion, rising 12.9 percent from 2018.
i
-5%
0%
5%
10%
15%
2010 2011 2012 2013 2014 2015 2016 2017 2018 2019
Net premiums written Policyholders’ surplus
54Insurance Information Institute | www.ii i.org 2021 Insurance Fact Book 54
6. PROPERTY/CASUALTY FINANCIAL DATAFinancial Results
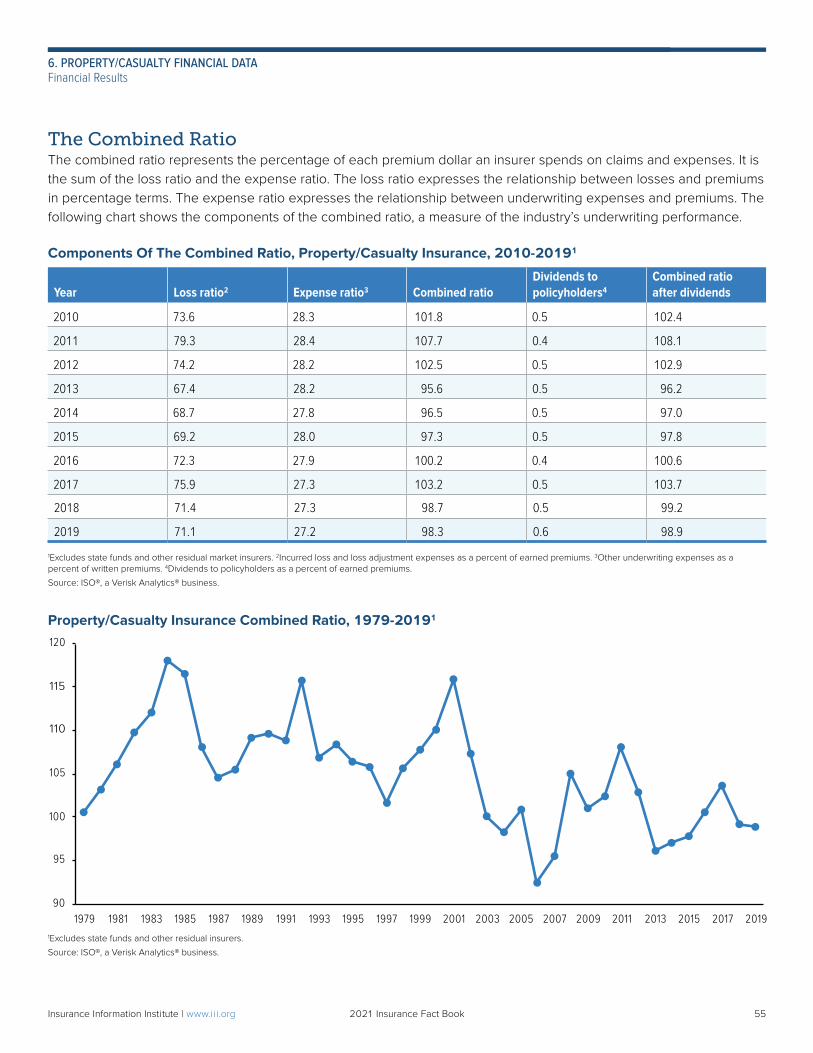
The Combined RatioThe combined ratio represents the percentage of each premium dollar an insurer spends on claims and expenses. It is the sum of the loss ratio and the expense ratio. The loss ratio expresses the relationship between losses and premiums in percentage terms. The expense ratio expresses the relationship between underwriting expenses and premiums. The following chart shows the components of the combined ratio, a measure of the industry’s underwriting performance.
Components Of The Combined Ratio, Property/Casualty Insurance, 2010-20191
Year Loss ratio2 Expense ratio3 Combined ratioDividends to policyholders4
Combined ratio after dividends
2010 73.6 28.3 101.8 0.5 102.4
2011 79.3 28.4 107.7 0.4 108.1
2012 74.2 28.2 102.5 0.5 102.9
2013 67.4 28.2 95.6 0.5 96.2
2014 68.7 27.8 96.5 0.5 97.0
2015 69.2 28.0 97.3 0.5 97.8
2016 72.3 27.9 100.2 0.4 100.6
2017 75.9 27.3 103.2 0.5 103.7
2018 71.4 27.3 98.7 0.5 99.2
2019 71.1 27.2 98.3 0.6 98.9
1Excludes state funds and other residual market insurers. 2Incurred loss and loss adjustment expenses as a percent of earned premiums. 3Other underwriting expenses as a percent of written premiums. 4Dividends to policyholders as a percent of earned premiums.
Source: ISO®, a Verisk Analytics® business.
Property/Casualty Insurance Combined Ratio, 1979-20191
90
95
100
105
110
115
120
1979 1981 1983 1985 1987 1989 1991 1993 1995 1997 1999 2001 2003 2005 2007 2009 2011 2013 2015 2017 20191Excludes state funds and other residual insurers.
Source: ISO®, a Verisk Analytics® business.
55Insurance Information Institute | www.ii i.org 2021 Insurance Fact Book 55
6. PROPERTY/CASUALTY FINANCIAL DATAFinancial Results
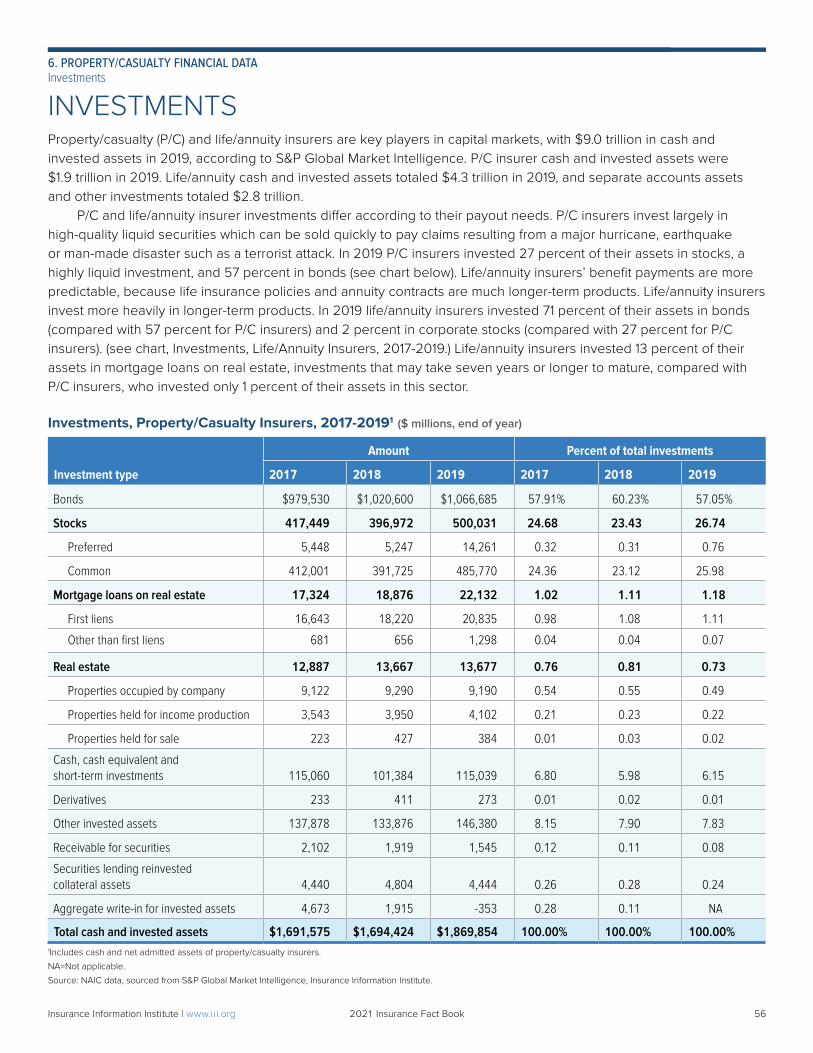
INVESTMENTSProperty/casualty (P/C) and life/annuity insurers are key players in capital markets, with $9.0 trillion in cash and invested assets in 2019, according to S&P Global Market Intelligence. P/C insurer cash and invested assets were $1.9 trillion in 2019. Life/annuity cash and invested assets totaled $4.3 trillion in 2019, and separate accounts assets and other investments totaled $2.8 trillion. P/C and life/annuity insurer investments differ according to their payout needs. P/C insurers invest largely in high-quality liquid securities which can be sold quickly to pay claims resulting from a major hurricane, earthquake or man-made disaster such as a terrorist attack. In 2019 P/C insurers invested 27 percent of their assets in stocks, a highly liquid investment, and 57 percent in bonds (see chart below). Life/annuity insurers’ benefit payments are more predictable, because life insurance policies and annuity contracts are much longer-term products. Life/annuity insurers invest more heavily in longer-term products. In 2019 life/annuity insurers invested 71 percent of their assets in bonds (compared with 57 percent for P/C insurers) and 2 percent in corporate stocks (compared with 27 percent for P/C insurers). (see chart, Investments, Life/Annuity Insurers, 2017-2019.) Life/annuity insurers invested 13 percent of their assets in mortgage loans on real estate, investments that may take seven years or longer to mature, compared with P/C insurers, who invested only 1 percent of their assets in this sector.
Investments, Property/Casualty Insurers, 2017-20191 ($ millions, end of year)
Amount Percent of total investments
Investment type 2017 2018 2019 2017 2018 2019
Bonds $979,530 $1,020,600 $1,066,685 57.91% 60.23% 57.05%
Stocks 417,449 396,972 500,031 24.68 23.43 26.74
Preferred 5,448 5,247 14,261 0.32 0.31 0.76
Common 412,001 391,725 485,770 24.36 23.12 25.98
Mortgage loans on real estate 17,324 18,876 22,132 1.02 1.11 1.18
First liens 16,643 18,220 20,835 0.98 1.08 1.11
Other than first liens 681 656 1,298 0.04 0.04 0.07
Real estate 12,887 13,667 13,677 0.76 0.81 0.73
Properties occupied by company 9,122 9,290 9,190 0.54 0.55 0.49
Properties held for income production 3,543 3,950 4,102 0.21 0.23 0.22
Properties held for sale 223 427 384 0.01 0.03 0.02
Cash, cash equivalent and short-term investments 115,060 101,384 115,039 6.80 5.98 6.15
Derivatives 233 411 273 0.01 0.02 0.01
Other invested assets 137,878 133,876 146,380 8.15 7.90 7.83
Receivable for securities 2,102 1,919 1,545 0.12 0.11 0.08
Securities lending reinvested collateral assets 4,440 4,804 4,444 0.26 0.28 0.24
Aggregate write-in for invested assets 4,673 1,915 -353 0.28 0.11 NA
Total cash and invested assets $1,691,575 $1,694,424 $1,869,854 100.00% 100.00% 100.00%1Includes cash and net admitted assets of property/casualty insurers.
NA=Not applicable.
Source: NAIC data, sourced from S&P Global Market Intelligence, Insurance Information Institute.
56Insurance Information Institute | www.ii i.org 2021 Insurance Fact Book 56
6. PROPERTY/CASUALTY FINANCIAL DATAInvestments
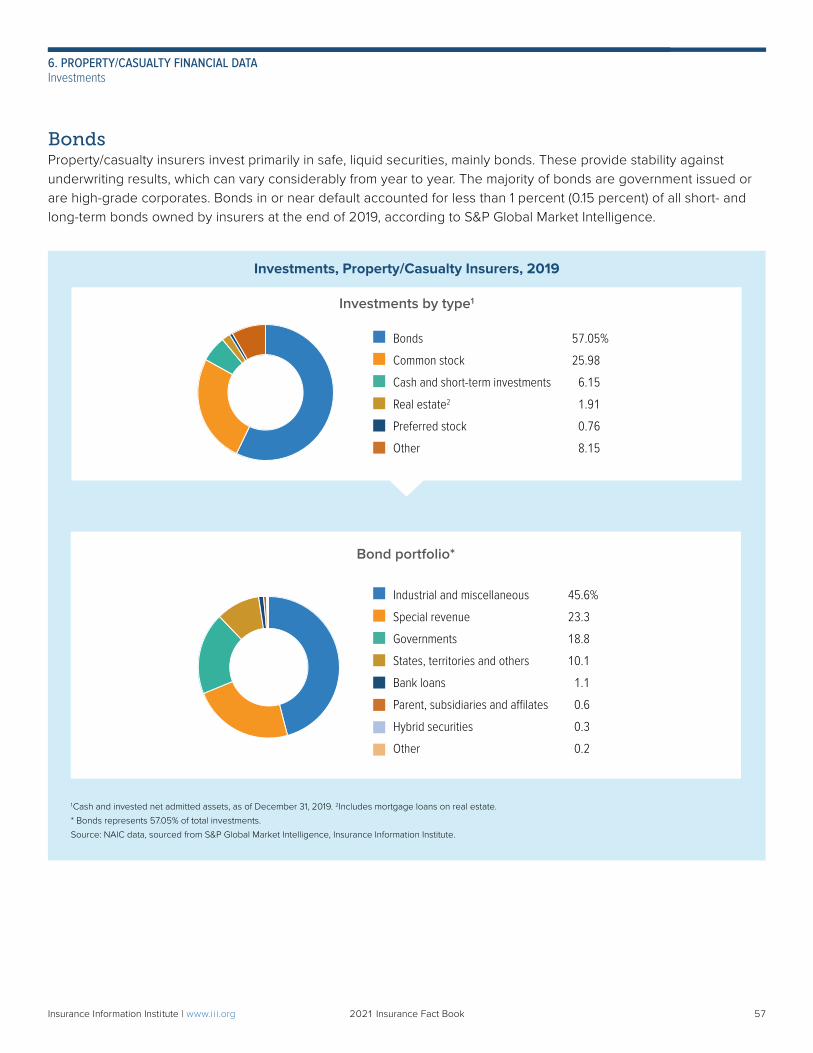
BondsProperty/casualty insurers invest primarily in safe, liquid securities, mainly bonds. These provide stability against underwriting results, which can vary considerably from year to year. The majority of bonds are government issued or are high-grade corporates. Bonds in or near default accounted for less than 1 percent (0.15 percent) of all short- and long-term bonds owned by insurers at the end of 2019, according to S&P Global Market Intelligence.
Investments, Property/Casualty Insurers, 2019
1Cash and invested net admitted assets, as of December 31, 2019. 2Includes mortgage loans on real estate.
* Bonds represents 57.05% of total investments.
Source: NAIC data, sourced from S&P Global Market Intelligence, Insurance Information Institute.
Investments by type1
Bonds 57.05%
Common stock 25.98
Cash and short-term investments 6.15
Real estate2 1.91
Preferred stock 0.76
Other 8.15
Industrial and miscellaneous 45.6%
Special revenue 23.3
Governments 18.8
States, territories and others 10.1
Bank loans 1.1
Parent, subsidiaries and affilates 0.6
Hybrid securities 0.3
Other 0.2
Bond portfolio*
57Insurance Information Institute | www.ii i.org 2021 Insurance Fact Book 57
6. PROPERTY/CASUALTY FINANCIAL DATAInvestments
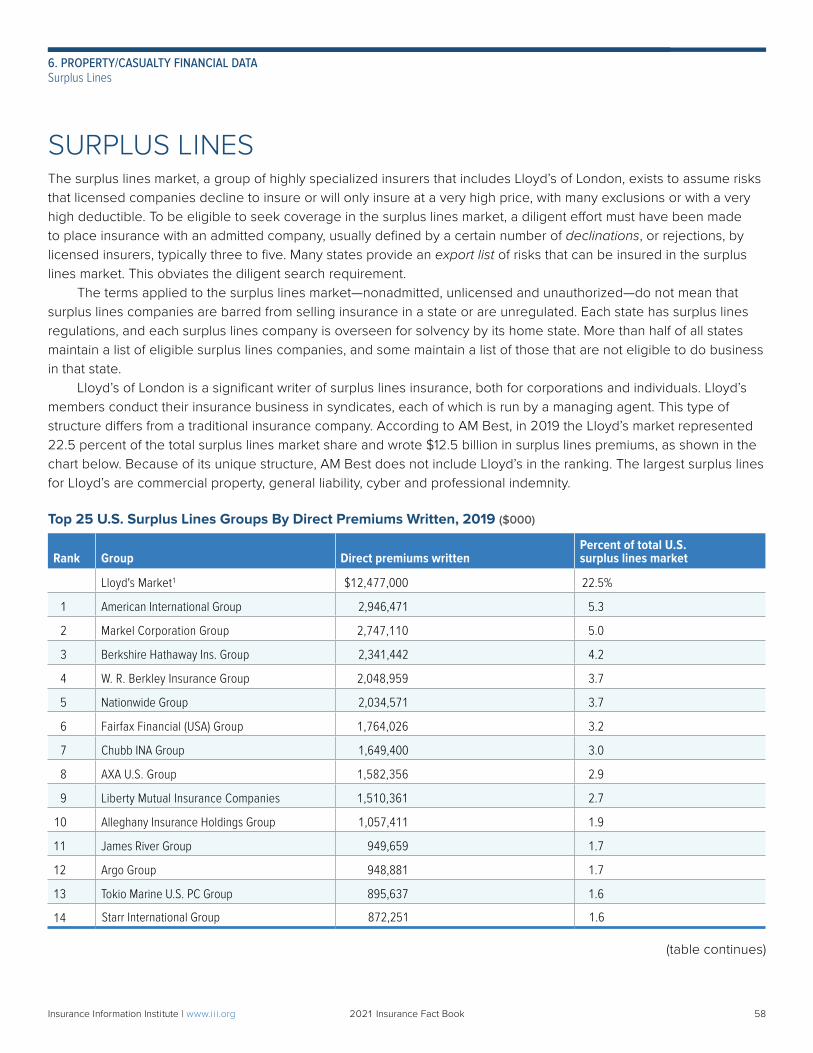
SURPLUS LINESThe surplus lines market, a group of highly specialized insurers that includes Lloyd’s of London, exists to assume risks that licensed companies decline to insure or will only insure at a very high price, with many exclusions or with a very high deductible. To be eligible to seek coverage in the surplus lines market, a diligent effort must have been made to place insurance with an admitted company, usually defined by a certain number of declinations, or rejections, by licensed insurers, typically three to five. Many states provide an export list of risks that can be insured in the surplus lines market. This obviates the diligent search requirement. The terms applied to the surplus lines market—nonadmitted, unlicensed and unauthorized—do not mean that surplus lines companies are barred from selling insurance in a state or are unregulated. Each state has surplus lines regulations, and each surplus lines company is overseen for solvency by its home state. More than half of all states maintain a list of eligible surplus lines companies, and some maintain a list of those that are not eligible to do business in that state. Lloyd’s of London is a significant writer of surplus lines insurance, both for corporations and individuals. Lloyd’s members conduct their insurance business in syndicates, each of which is run by a managing agent. This type of structure differs from a traditional insurance company. According to AM Best, in 2019 the Lloyd’s market represented 22.5 percent of the total surplus lines market share and wrote $12.5 billion in surplus lines premiums, as shown in the chart below. Because of its unique structure, AM Best does not include Lloyd’s in the ranking. The largest surplus lines for Lloyd’s are commercial property, general liability, cyber and professional indemnity.
Top 25 U.S. Surplus Lines Groups By Direct Premiums Written, 2019 ($000)
Rank Group Direct premiums writtenPercent of total U.S.surplus lines market
Lloyd's Market1 $12,477,000 22.5%
1 American International Group 2,946,471 5.3
2 Markel Corporation Group 2,747,110 5.0
3 Berkshire Hathaway Ins. Group 2,341,442 4.2
4 W. R. Berkley Insurance Group 2,048,959 3.7
5 Nationwide Group 2,034,571 3.7
6 Fairfax Financial (USA) Group 1,764,026 3.2
7 Chubb INA Group 1,649,400 3.0
8 AXA U.S. Group 1,582,356 2.9
9 Liberty Mutual Insurance Companies 1,510,361 2.7
10 Alleghany Insurance Holdings Group 1,057,411 1.9
11 James River Group 949,659 1.7
12 Argo Group 948,881 1.7
13 Tokio Marine U.S. PC Group 895,637 1.6
14 Starr International Group 872,251 1.6
(table continues)
58Insurance Information Institute | www.ii i.org 2021 Insurance Fact Book 58
6. PROPERTY/CASUALTY FINANCIAL DATASurplus Lines
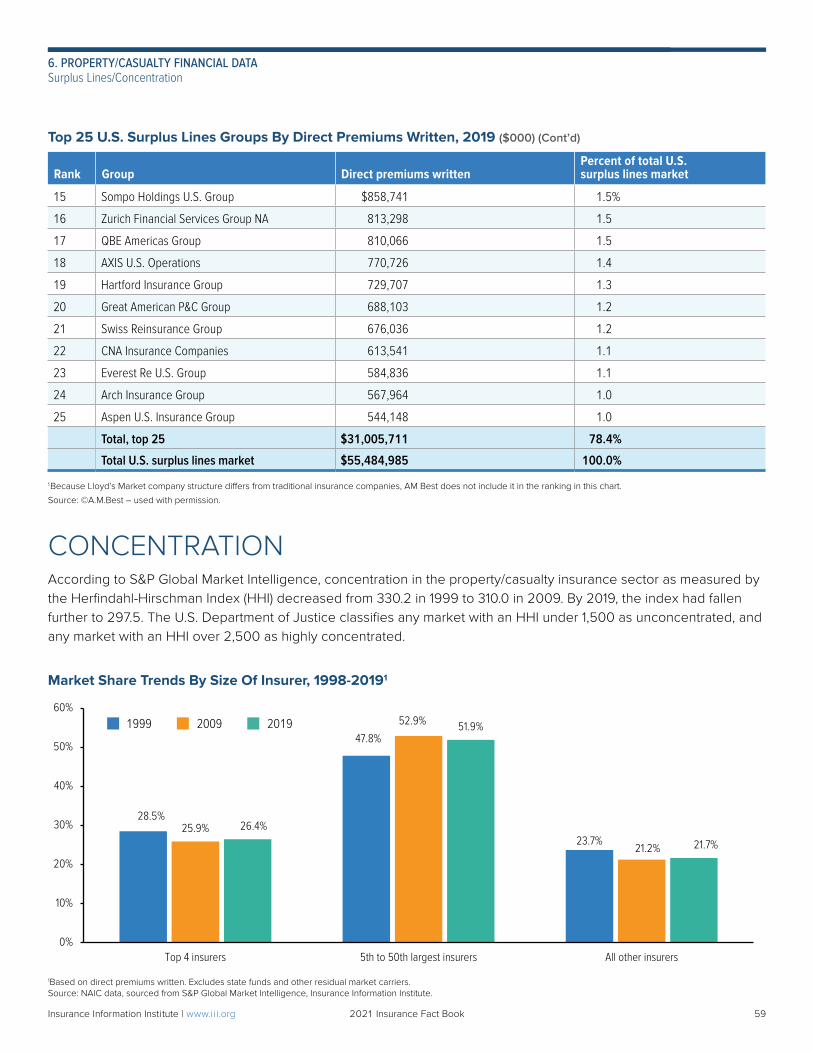
Top 25 U.S. Surplus Lines Groups By Direct Premiums Written, 2019 ($000) (Cont’d)
Rank Group Direct premiums writtenPercent of total U.S.surplus lines market
15 Sompo Holdings U.S. Group $858,741 1.5%
16 Zurich Financial Services Group NA 813,298 1.5
17 QBE Americas Group 810,066 1.5
18 AXIS U.S. Operations 770,726 1.4
19 Hartford Insurance Group 729,707 1.3
20 Great American P&C Group 688,103 1.2
21 Swiss Reinsurance Group 676,036 1.2
22 CNA Insurance Companies 613,541 1.1
23 Everest Re U.S. Group 584,836 1.1
24 Arch Insurance Group 567,964 1.0
25 Aspen U.S. Insurance Group 544,148 1.0
Total, top 25 $31,005,711 78.4%
Total U.S. surplus lines market $55,484,985 100.0%
1Because Lloyd’s Market company structure differs from traditional insurance companies, AM Best does not include it in the ranking in this chart.
Source: ©A.M.Best – used with permission.
CONCENTRATIONAccording to S&P Global Market Intelligence, concentration in the property/casualty insurance sector as measured by the Herfindahl-Hirschman Index (HHI) decreased from 330.2 in 1999 to 310.0 in 2009. By 2019, the index had fallen further to 297.5. The U.S. Department of Justice classifies any market with an HHI under 1,500 as unconcentrated, and any market with an HHI over 2,500 as highly concentrated.
Market Share Trends By Size Of Insurer, 1998-20191
1Based on direct premiums written. Excludes state funds and other residual market carriers. Source: NAIC data, sourced from S&P Global Market Intelligence, Insurance Information Institute.
28.5%
47.8%
23.7%25.9%
52.9%
21.2%
26.4%
51.9%
21.7%
0%
10%
20%
30%
40%
50%
60%
Top 4 insurers 5th to 50th largest insurers All other insurers
1999 2009 2019
59Insurance Information Institute | www.ii i.org 2021 Insurance Fact Book 59
6. PROPERTY/CASUALTY FINANCIAL DATASurplus Lines/Concentration
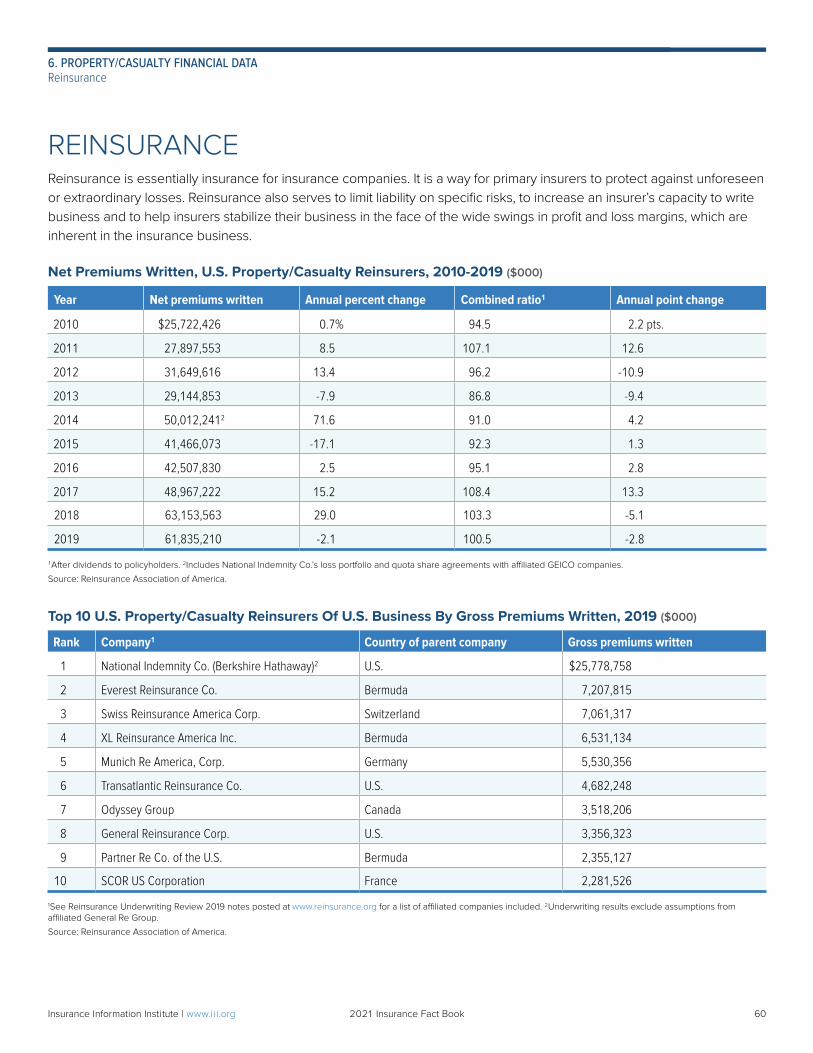
REINSURANCEReinsurance is essentially insurance for insurance companies. It is a way for primary insurers to protect against unforeseen or extraordinary losses. Reinsurance also serves to limit liability on specific risks, to increase an insurer’s capacity to write business and to help insurers stabilize their business in the face of the wide swings in profit and loss margins, which are inherent in the insurance business.
Net Premiums Written, U.S. Property/Casualty Reinsurers, 2010-2019 ($000)
Year Net premiums written Annual percent change Combined ratio1 Annual point change
2010 $25,722,426 0.7% 94.5 2.2 pts.
2011 27,897,553 8.5 107.1 12.6
2012 31,649,616 13.4 96.2 -10.9
2013 29,144,853 -7.9 86.8 -9.4
2014 50,012,2412 71.6 91.0 4.2
2015 41,466,073 -17.1 92.3 1.3
2016 42,507,830 2.5 95.1 2.8
2017 48,967,222 15.2 108.4 13.3
2018 63,153,563 29.0 103.3 -5.1
2019 61,835,210 -2.1 100.5 -2.8
1After dividends to policyholders. 2Includes National Indemnity Co.’s loss portfolio and quota share agreements with affiliated GEICO companies.
Source: Reinsurance Association of America.
Top 10 U.S. Property/Casualty Reinsurers Of U.S. Business By Gross Premiums Written, 2019 ($000)
Rank Company1 Country of parent company Gross premiums written
1 National Indemnity Co. (Berkshire Hathaway)2 U.S. $25,778,758
2 Everest Reinsurance Co. Bermuda 7,207,815
3 Swiss Reinsurance America Corp. Switzerland 7,061,317
4 XL Reinsurance America Inc. Bermuda 6,531,134
5 Munich Re America, Corp. Germany 5,530,356
6 Transatlantic Reinsurance Co. U.S. 4,682,248
7 Odyssey Group Canada 3,518,206
8 General Reinsurance Corp. U.S. 3,356,323
9 Partner Re Co. of the U.S. Bermuda 2,355,127
10 SCOR US Corporation France 2,281,526
1See Reinsurance Underwriting Review 2019 notes posted at www.reinsurance.org for a list of affiliated companies included. 2Underwriting results exclude assumptions from affiliated General Re Group.
Source: Reinsurance Association of America.
60Insurance Information Institute | www.ii i.org 2021 Insurance Fact Book 60
6. PROPERTY/CASUALTY FINANCIAL DATAReinsurance
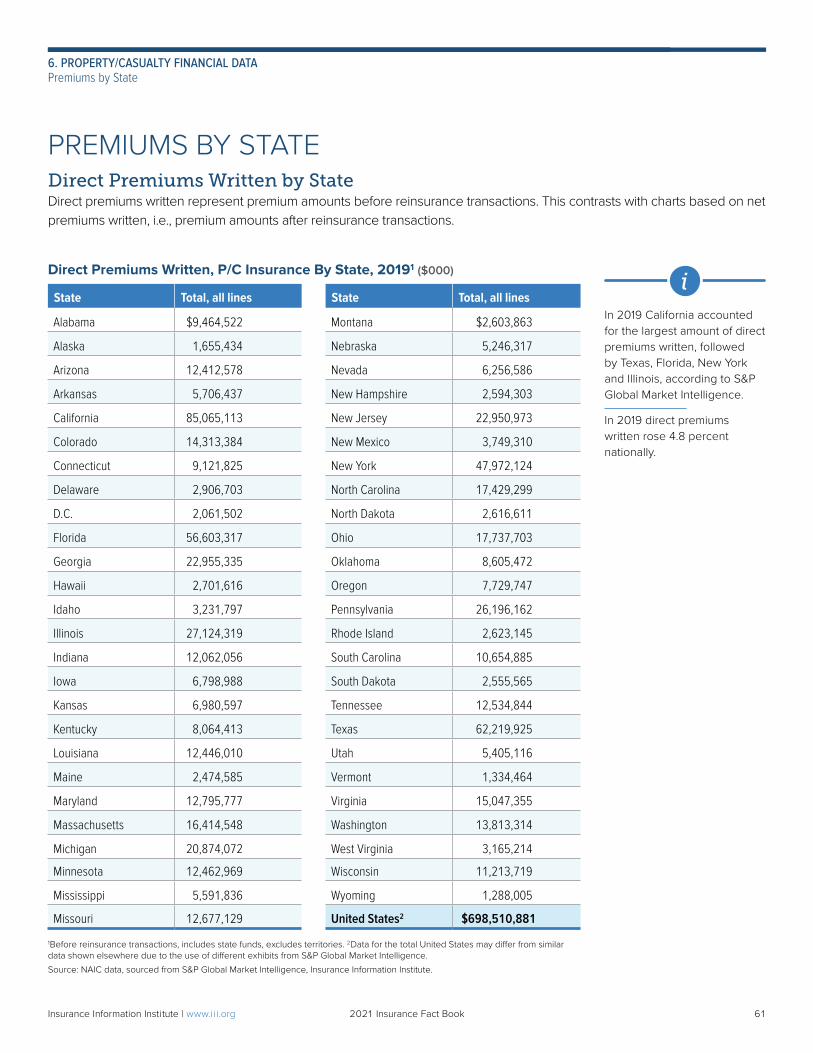
PREMIUMS BY STATEDirect Premiums Written by StateDirect premiums written represent premium amounts before reinsurance transactions. This contrasts with charts based on net premiums written, i.e., premium amounts after reinsurance transactions.
Direct Premiums Written, P/C Insurance By State, 20191 ($000)
State Total, all lines State Total, all lines
Alabama $9,464,522 Montana $2,603,863
Alaska 1,655,434 Nebraska 5,246,317
Arizona 12,412,578 Nevada 6,256,586
Arkansas 5,706,437 New Hampshire 2,594,303
California 85,065,113 New Jersey 22,950,973
Colorado 14,313,384 New Mexico 3,749,310
Connecticut 9,121,825 New York 47,972,124
Delaware 2,906,703 North Carolina 17,429,299
D.C. 2,061,502 North Dakota 2,616,611
Florida 56,603,317 Ohio 17,737,703
Georgia 22,955,335 Oklahoma 8,605,472
Hawaii 2,701,616 Oregon 7,729,747
Idaho 3,231,797 Pennsylvania 26,196,162
Illinois 27,124,319 Rhode Island 2,623,145
Indiana 12,062,056 South Carolina 10,654,885
Iowa 6,798,988 South Dakota 2,555,565
Kansas 6,980,597 Tennessee 12,534,844
Kentucky 8,064,413 Texas 62,219,925
Louisiana 12,446,010 Utah 5,405,116
Maine 2,474,585 Vermont 1,334,464
Maryland 12,795,777 Virginia 15,047,355
Massachusetts 16,414,548 Washington 13,813,314
Michigan 20,874,072 West Virginia 3,165,214
Minnesota 12,462,969 Wisconsin 11,213,719
Mississippi 5,591,836 Wyoming 1,288,005
Missouri 12,677,129 United States2 $698,510,881
1Before reinsurance transactions, includes state funds, excludes territories. 2Data for the total United States may differ from similar data shown elsewhere due to the use of different exhibits from S&P Global Market Intelligence.
Source: NAIC data, sourced from S&P Global Market Intelligence, Insurance Information Institute.
In 2019 California accounted for the largest amount of direct premiums written, followed by Texas, Florida, New York and Illinois, according to S&P Global Market Intelligence.
In 2019 direct premiums written rose 4.8 percent nationally.
61Insurance Information Institute | www.ii i.org 2021 Insurance Fact Book 61
6. PROPERTY/CASUALTY FINANCIAL DATAPremiums by State
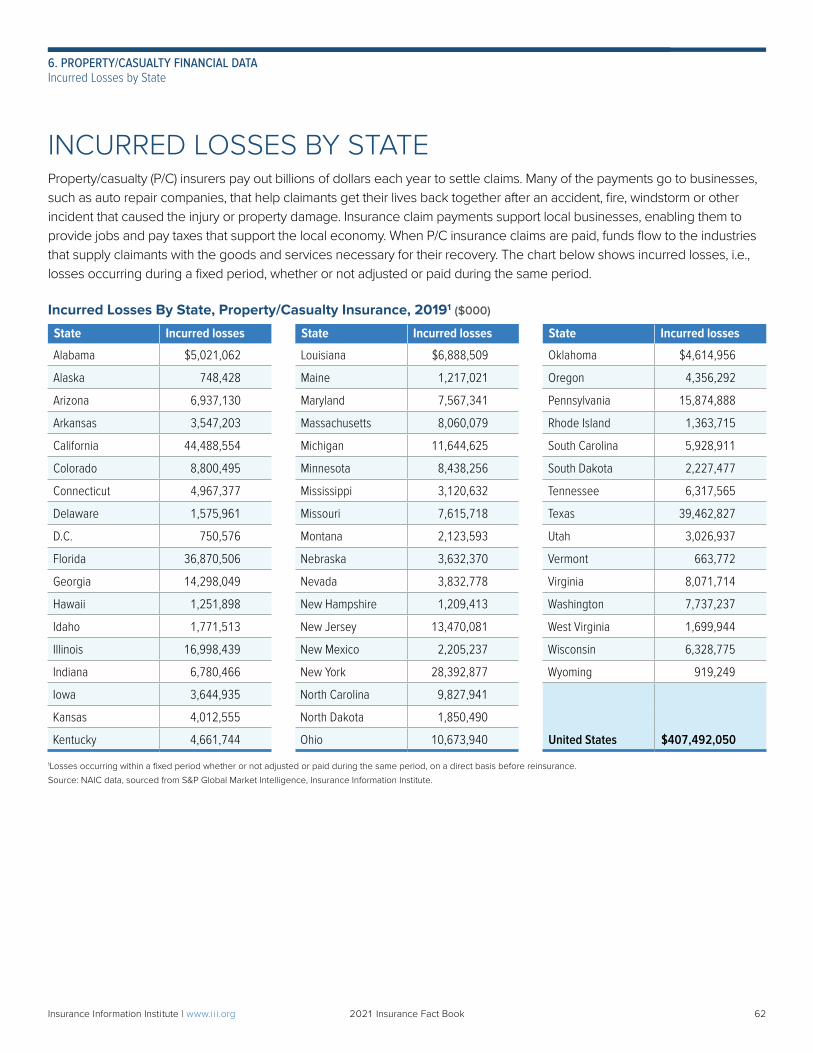
INCURRED LOSSES BY STATEProperty/casualty (P/C) insurers pay out billions of dollars each year to settle claims. Many of the payments go to businesses, such as auto repair companies, that help claimants get their lives back together after an accident, fire, windstorm or other incident that caused the injury or property damage. Insurance claim payments support local businesses, enabling them to provide jobs and pay taxes that support the local economy. When P/C insurance claims are paid, funds flow to the industries that supply claimants with the goods and services necessary for their recovery. The chart below shows incurred losses, i.e., losses occurring during a fixed period, whether or not adjusted or paid during the same period.
Incurred Losses By State, Property/Casualty Insurance, 20191 ($000)
State Incurred losses State Incurred losses State Incurred losses
Alabama $5,021,062 Louisiana $6,888,509 Oklahoma $4,614,956
Alaska 748,428 Maine 1,217,021 Oregon 4,356,292
Arizona 6,937,130 Maryland 7,567,341 Pennsylvania 15,874,888
Arkansas 3,547,203 Massachusetts 8,060,079 Rhode Island 1,363,715
California 44,488,554 Michigan 11,644,625 South Carolina 5,928,911
Colorado 8,800,495 Minnesota 8,438,256 South Dakota 2,227,477
Connecticut 4,967,377 Mississippi 3,120,632 Tennessee 6,317,565
Delaware 1,575,961 Missouri 7,615,718 Texas 39,462,827
D.C. 750,576 Montana 2,123,593 Utah 3,026,937
Florida 36,870,506 Nebraska 3,632,370 Vermont 663,772
Georgia 14,298,049 Nevada 3,832,778 Virginia 8,071,714
Hawaii 1,251,898 New Hampshire 1,209,413 Washington 7,737,237
Idaho 1,771,513 New Jersey 13,470,081 West Virginia 1,699,944
Illinois 16,998,439 New Mexico 2,205,237 Wisconsin 6,328,775
Indiana 6,780,466 New York 28,392,877 Wyoming 919,249
Iowa 3,644,935 North Carolina 9,827,941
United States $407,492,050
Kansas 4,012,555 North Dakota 1,850,490
Kentucky 4,661,744 Ohio 10,673,940
1Losses occurring within a fixed period whether or not adjusted or paid during the same period, on a direct basis before reinsurance.
Source: NAIC data, sourced from S&P Global Market Intelligence, Insurance Information Institute.
62Insurance Information Institute | www.ii i.org 2021 Insurance Fact Book 62
6. PROPERTY/CASUALTY FINANCIAL DATAIncurred Losses by State
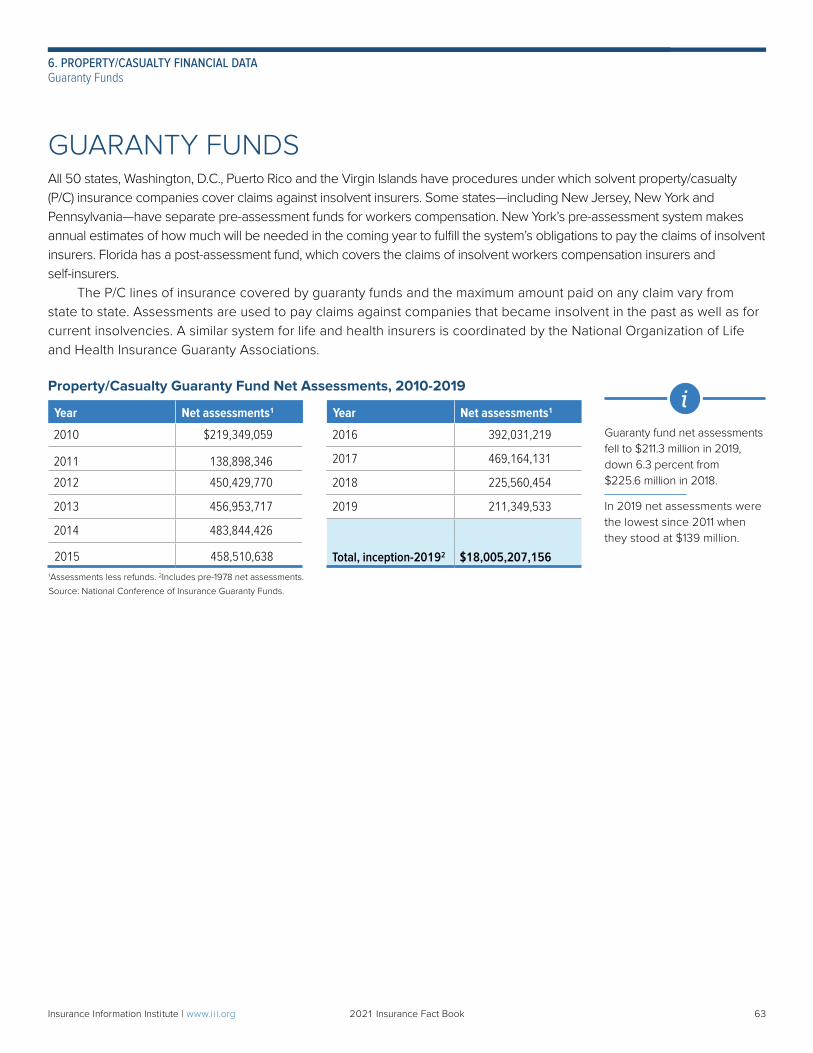
GUARANTY FUNDSAll 50 states, Washington, D.C., Puerto Rico and the Virgin Islands have procedures under which solvent property/casualty (P/C) insurance companies cover claims against insolvent insurers. Some states—including New Jersey, New York and Pennsylvania—have separate pre-assessment funds for workers compensation. New York’s pre-assessment system makes annual estimates of how much will be needed in the coming year to fulfill the system’s obligations to pay the claims of insolvent insurers. Florida has a post-assessment fund, which covers the claims of insolvent workers compensation insurers and self-insurers. The P/C lines of insurance covered by guaranty funds and the maximum amount paid on any claim vary from state to state. Assessments are used to pay claims against companies that became insolvent in the past as well as for current insolvencies. A similar system for life and health insurers is coordinated by the National Organization of Life and Health Insurance Guaranty Associations.
Property/Casualty Guaranty Fund Net Assessments, 2010-2019
Year Net assessments1 Year Net assessments1
2010 $219,349,059 2016 392,031,219
2011 138,898,346 2017 469,164,131
2012 450,429,770 2018 225,560,454
2013 456,953,717 2019 211,349,533
2014 483,844,426
Total, inception-20192 $18,005,207,1562015 458,510,6381Assessments less refunds. 2Includes pre-1978 net assessments.
Source: National Conference of Insurance Guaranty Funds.
Guaranty fund net assessments fell to $211.3 million in 2019, down 6.3 percent from $225.6 million in 2018.
In 2019 net assessments were the lowest since 2011 when they stood at $139 million.
63Insurance Information Institute | www.ii i.org 2021 Insurance Fact Book 63
6. PROPERTY/CASUALTY FINANCIAL DATAGuaranty Funds
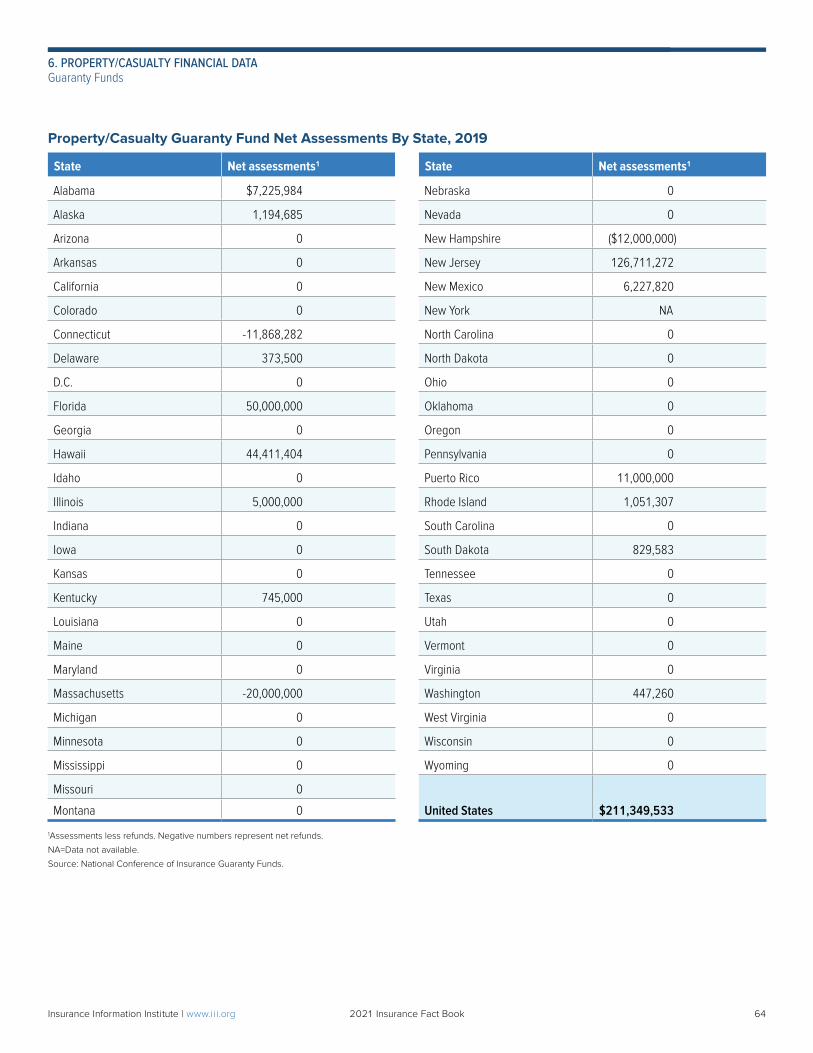
Property/Casualty Guaranty Fund Net Assessments By State, 2019
State Net assessments1 State Net assessments1
Alabama $7,225,984 Nebraska 0
Alaska 1,194,685 Nevada 0
Arizona 0 New Hampshire ($12,000,000)
Arkansas 0 New Jersey 126,711,272
California 0 New Mexico 6,227,820
Colorado 0 New York NA
Connecticut -11,868,282 North Carolina 0
Delaware 373,500 North Dakota 0
D.C. 0 Ohio 0
Florida 50,000,000 Oklahoma 0
Georgia 0 Oregon 0
Hawaii 44,411,404 Pennsylvania 0
Idaho 0 Puerto Rico 11,000,000
Illinois 5,000,000 Rhode Island 1,051,307
Indiana 0 South Carolina 0
Iowa 0 South Dakota 829,583
Kansas 0 Tennessee 0
Kentucky 745,000 Texas 0
Louisiana 0 Utah 0
Maine 0 Vermont 0
Maryland 0 Virginia 0
Massachusetts -20,000,000 Washington 447,260
Michigan 0 West Virginia 0
Minnesota 0 Wisconsin 0
Mississippi 0 Wyoming 0
Missouri 0
Montana 0 United States $211,349,533
1Assessments less refunds. Negative numbers represent net refunds.
NA=Data not available.
Source: National Conference of Insurance Guaranty Funds.
64Insurance Information Institute | www.ii i.org 2021 Insurance Fact Book 64
6. PROPERTY/CASUALTY FINANCIAL DATAGuaranty Funds
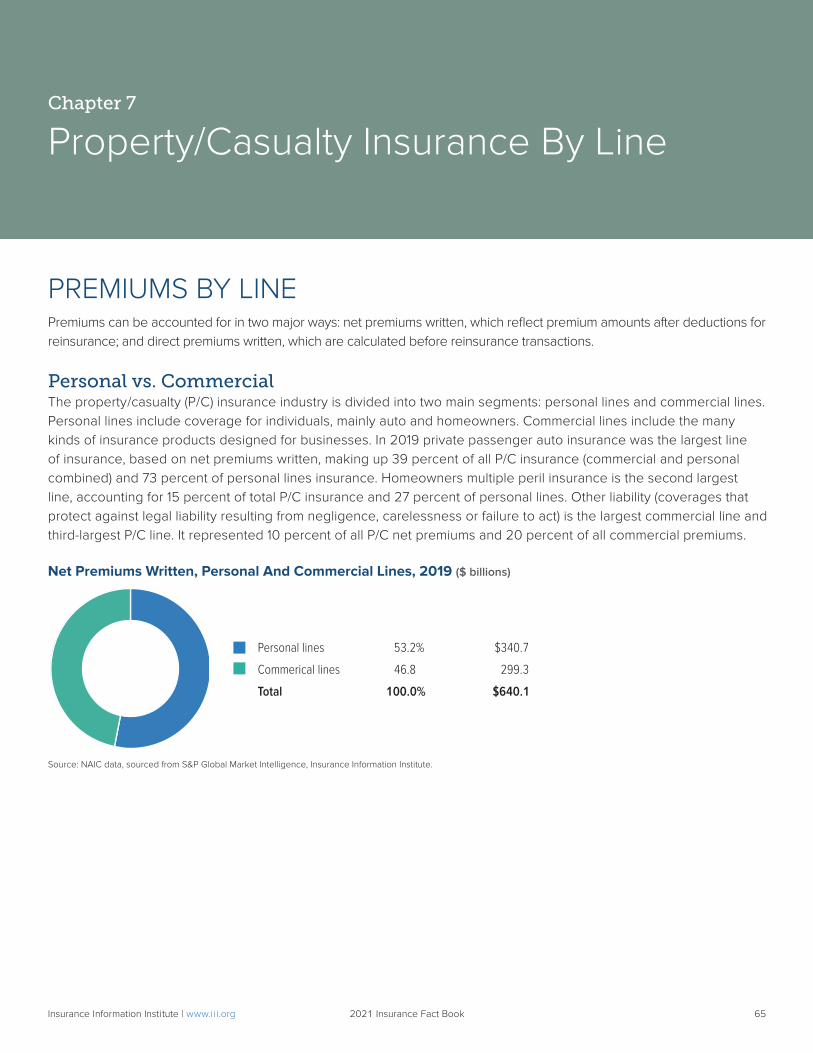
65
PREMIUMS BY LINEPremiums can be accounted for in two major ways: net premiums written, which reflect premium amounts after deductions for reinsurance; and direct premiums written, which are calculated before reinsurance transactions.
Personal vs. CommercialThe property/casualty (P/C) insurance industry is divided into two main segments: personal lines and commercial lines. Personal lines include coverage for individuals, mainly auto and homeowners. Commercial lines include the many kinds of insurance products designed for businesses. In 2019 private passenger auto insurance was the largest line of insurance, based on net premiums written, making up 39 percent of all P/C insurance (commercial and personal combined) and 73 percent of personal lines insurance. Homeowners multiple peril insurance is the second largest line, accounting for 15 percent of total P/C insurance and 27 percent of personal lines. Other liability (coverages that protect against legal liability resulting from negligence, carelessness or failure to act) is the largest commercial line and third-largest P/C line. It represented 10 percent of all P/C net premiums and 20 percent of all commercial premiums.
Net Premiums Written, Personal And Commercial Lines, 2019 ($ billions)
Personal lines 53.2% $340.7
Commerical lines 46.8 299.3
Total 100.0% $640.1
Source: NAIC data, sourced from S&P Global Market Intelligence, Insurance Information Institute.
Chapter 7
Property/Casualty Insurance By Line
Insurance Information Institute | www.ii i.org 2021 Insurance Fact Book 65
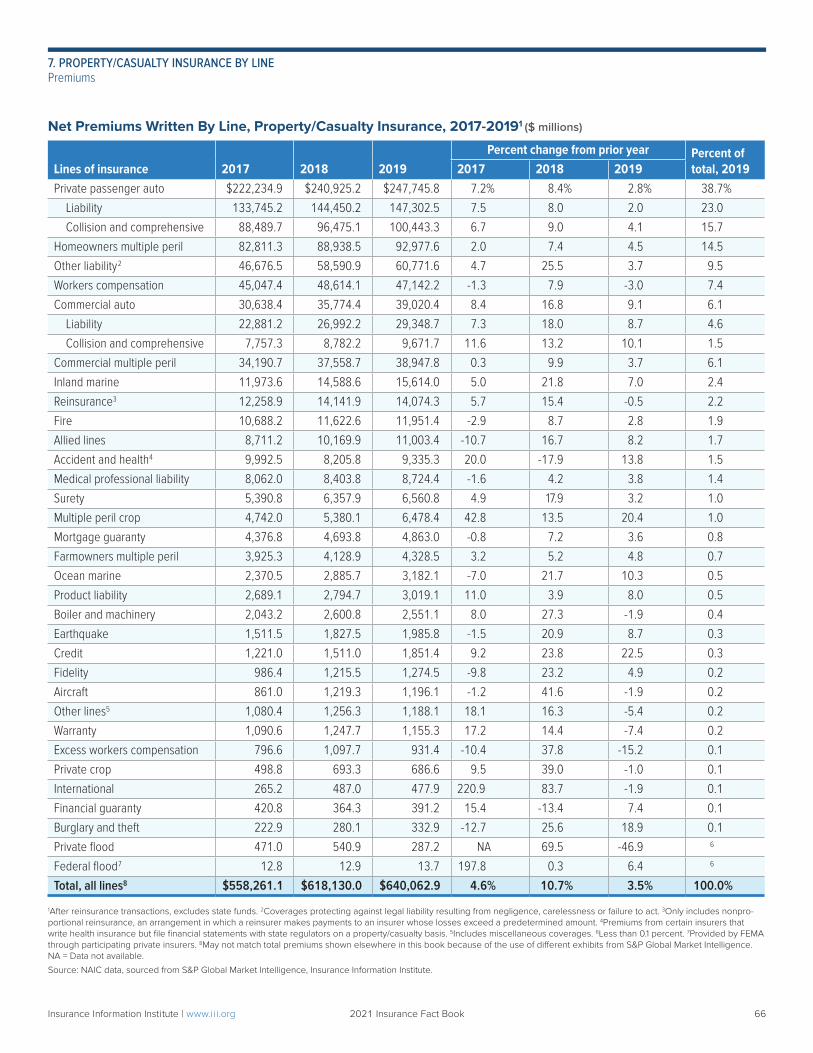
Net Premiums Written By Line, Property/Casualty Insurance, 2017-20191 ($ millions)
Lines of insurance 2017 2018 2019Percent change from prior year Percent of
total, 20192017 2018 2019Private passenger auto $222,234.9 $240,925.2 $247,745.8 7.2% 8.4% 2.8% 38.7%
Liability 133,745.2 144,450.2 147,302.5 7.5 8.0 2.0 23.0
Collision and comprehensive 88,489.7 96,475.1 100,443.3 6.7 9.0 4.1 15.7
Homeowners multiple peril 82,811.3 88,938.5 92,977.6 2.0 7.4 4.5 14.5
Other liability2 46,676.5 58,590.9 60,771.6 4.7 25.5 3.7 9.5
Workers compensation 45,047.4 48,614.1 47,142.2 -1.3 7.9 -3.0 7.4
Commercial auto 30,638.4 35,774.4 39,020.4 8.4 16.8 9.1 6.1
Liability 22,881.2 26,992.2 29,348.7 7.3 18.0 8.7 4.6
Collision and comprehensive 7,757.3 8,782.2 9,671.7 11.6 13.2 10.1 1.5
Commercial multiple peril 34,190.7 37,558.7 38,947.8 0.3 9.9 3.7 6.1
Inland marine 11,973.6 14,588.6 15,614.0 5.0 21.8 7.0 2.4
Reinsurance3 12,258.9 14,141.9 14,074.3 5.7 15.4 -0.5 2.2
Fire 10,688.2 11,622.6 11,951.4 -2.9 8.7 2.8 1.9
Allied lines 8,711.2 10,169.9 11,003.4 -10.7 16.7 8.2 1.7
Accident and health4 9,992.5 8,205.8 9,335.3 20.0 -17.9 13.8 1.5
Medical professional liability 8,062.0 8,403.8 8,724.4 -1.6 4.2 3.8 1.4
Surety 5,390.8 6,357.9 6,560.8 4.9 17.9 3.2 1.0
Multiple peril crop 4,742.0 5,380.1 6,478.4 42.8 13.5 20.4 1.0
Mortgage guaranty 4,376.8 4,693.8 4,863.0 -0.8 7.2 3.6 0.8
Farmowners multiple peril 3,925.3 4,128.9 4,328.5 3.2 5.2 4.8 0.7
Ocean marine 2,370.5 2,885.7 3,182.1 -7.0 21.7 10.3 0.5
Product liability 2,689.1 2,794.7 3,019.1 11.0 3.9 8.0 0.5
Boiler and machinery 2,043.2 2,600.8 2,551.1 8.0 27.3 -1.9 0.4
Earthquake 1,511.5 1,827.5 1,985.8 -1.5 20.9 8.7 0.3
Credit 1,221.0 1,511.0 1,851.4 9.2 23.8 22.5 0.3
Fidelity 986.4 1,215.5 1,274.5 -9.8 23.2 4.9 0.2
Aircraft 861.0 1,219.3 1,196.1 -1.2 41.6 -1.9 0.2
Other lines5 1,080.4 1,256.3 1,188.1 18.1 16.3 -5.4 0.2
Warranty 1,090.6 1,247.7 1,155.3 17.2 14.4 -7.4 0.2
Excess workers compensation 796.6 1,097.7 931.4 -10.4 37.8 -15.2 0.1
Private crop 498.8 693.3 686.6 9.5 39.0 -1.0 0.1
International 265.2 487.0 477.9 220.9 83.7 -1.9 0.1
Financial guaranty 420.8 364.3 391.2 15.4 -13.4 7.4 0.1
Burglary and theft 222.9 280.1 332.9 -12.7 25.6 18.9 0.1
Private flood 471.0 540.9 287.2 NA 69.5 -46.9 6
Federal flood7 12.8 12.9 13.7 197.8 0.3 6.4 6
Total, all lines8 $558,261.1 $618,130.0 $640,062.9 4.6% 10.7% 3.5% 100.0%
1After reinsurance transactions, excludes state funds. 2Coverages protecting against legal liability resulting from negligence, carelessness or failure to act. 3Only includes nonpro-portional reinsurance, an arrangement in which a reinsurer makes payments to an insurer whose losses exceed a predetermined amount. 4Premiums from certain insurers that write health insurance but file financial statements with state regulators on a property/casualty basis. 5Includes miscellaneous coverages. 6Less than 0.1 percent. 7Provided by FEMA through participating private insurers. 8May not match total premiums shown elsewhere in this book because of the use of different exhibits from S&P Global Market Intelligence. NA = Data not available.
Source: NAIC data, sourced from S&P Global Market Intelligence, Insurance Information Institute.
Insurance Information Institute | www.ii i.org 2021 Insurance Fact Book 66
7. PROPERTY/CASUALTY INSURANCE BY LINEPremiums
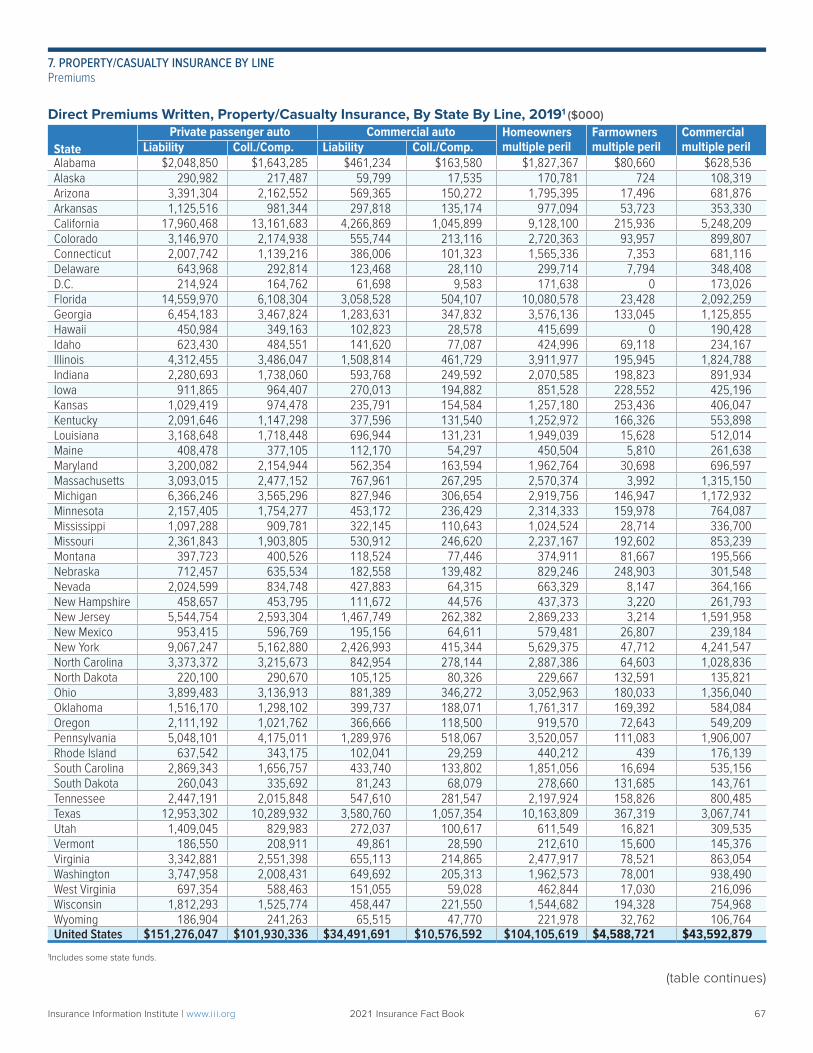
Direct Premiums Written, Property/Casualty Insurance, By State By Line, 20191 ($000)
StatePrivate passenger auto Commercial auto Homeowners
multiple perilFarmowners multiple peril
Commercial multiple perilLiability Coll./Comp. Liability Coll./Comp.
Alabama $2,048,850 $1,643,285 $461,234 $163,580 $1,827,367 $80,660 $628,536Alaska 290,982 217,487 59,799 17,535 170,781 724 108,319Arizona 3,391,304 2,162,552 569,365 150,272 1,795,395 17,496 681,876Arkansas 1,125,516 981,344 297,818 135,174 977,094 53,723 353,330California 17,960,468 13,161,683 4,266,869 1,045,899 9,128,100 215,936 5,248,209Colorado 3,146,970 2,174,938 555,744 213,116 2,720,363 93,957 899,807Connecticut 2,007,742 1,139,216 386,006 101,323 1,565,336 7,353 681,116Delaware 643,968 292,814 123,468 28,110 299,714 7,794 348,408D.C. 214,924 164,762 61,698 9,583 171,638 0 173,026Florida 14,559,970 6,108,304 3,058,528 504,107 10,080,578 23,428 2,092,259Georgia 6,454,183 3,467,824 1,283,631 347,832 3,576,136 133,045 1,125,855Hawaii 450,984 349,163 102,823 28,578 415,699 0 190,428Idaho 623,430 484,551 141,620 77,087 424,996 69,118 234,167Illinois 4,312,455 3,486,047 1,508,814 461,729 3,911,977 195,945 1,824,788Indiana 2,280,693 1,738,060 593,768 249,592 2,070,585 198,823 891,934Iowa 911,865 964,407 270,013 194,882 851,528 228,552 425,196Kansas 1,029,419 974,478 235,791 154,584 1,257,180 253,436 406,047Kentucky 2,091,646 1,147,298 377,596 131,540 1,252,972 166,326 553,898Louisiana 3,168,648 1,718,448 696,944 131,231 1,949,039 15,628 512,014Maine 408,478 377,105 112,170 54,297 450,504 5,810 261,638Maryland 3,200,082 2,154,944 562,354 163,594 1,962,764 30,698 696,597Massachusetts 3,093,015 2,477,152 767,961 267,295 2,570,374 3,992 1,315,150Michigan 6,366,246 3,565,296 827,946 306,654 2,919,756 146,947 1,172,932Minnesota 2,157,405 1,754,277 453,172 236,429 2,314,333 159,978 764,087Mississippi 1,097,288 909,781 322,145 110,643 1,024,524 28,714 336,700Missouri 2,361,843 1,903,805 530,912 246,620 2,237,167 192,602 853,239Montana 397,723 400,526 118,524 77,446 374,911 81,667 195,566Nebraska 712,457 635,534 182,558 139,482 829,246 248,903 301,548Nevada 2,024,599 834,748 427,883 64,315 663,329 8,147 364,166New Hampshire 458,657 453,795 111,672 44,576 437,373 3,220 261,793New Jersey 5,544,754 2,593,304 1,467,749 262,382 2,869,233 3,214 1,591,958New Mexico 953,415 596,769 195,156 64,611 579,481 26,807 239,184New York 9,067,247 5,162,880 2,426,993 415,344 5,629,375 47,712 4,241,547North Carolina 3,373,372 3,215,673 842,954 278,144 2,887,386 64,603 1,028,836North Dakota 220,100 290,670 105,125 80,326 229,667 132,591 135,821Ohio 3,899,483 3,136,913 881,389 346,272 3,052,963 180,033 1,356,040Oklahoma 1,516,170 1,298,102 399,737 188,071 1,761,317 169,392 584,084Oregon 2,111,192 1,021,762 366,666 118,500 919,570 72,643 549,209Pennsylvania 5,048,101 4,175,011 1,289,976 518,067 3,520,057 111,083 1,906,007Rhode Island 637,542 343,175 102,041 29,259 440,212 439 176,139South Carolina 2,869,343 1,656,757 433,740 133,802 1,851,056 16,694 535,156South Dakota 260,043 335,692 81,243 68,079 278,660 131,685 143,761Tennessee 2,447,191 2,015,848 547,610 281,547 2,197,924 158,826 800,485Texas 12,953,302 10,289,932 3,580,760 1,057,354 10,163,809 367,319 3,067,741Utah 1,409,045 829,983 272,037 100,617 611,549 16,821 309,535Vermont 186,550 208,911 49,861 28,590 212,610 15,600 145,376Virginia 3,342,881 2,551,398 655,113 214,865 2,477,917 78,521 863,054Washington 3,747,958 2,008,431 649,692 205,313 1,962,573 78,001 938,490West Virginia 697,354 588,463 151,055 59,028 462,844 17,030 216,096Wisconsin 1,812,293 1,525,774 458,447 221,550 1,544,682 194,328 754,968Wyoming 186,904 241,263 65,515 47,770 221,978 32,762 106,764United States $151,276,047 $101,930,336 $34,491,691 $10,576,592 $104,105,619 $4,588,721 $43,592,879
1Includes some state funds.
(table continues)
Insurance Information Institute | www.ii i.org 2021 Insurance Fact Book 67
7. PROPERTY/CASUALTY INSURANCE BY LINEPremiums
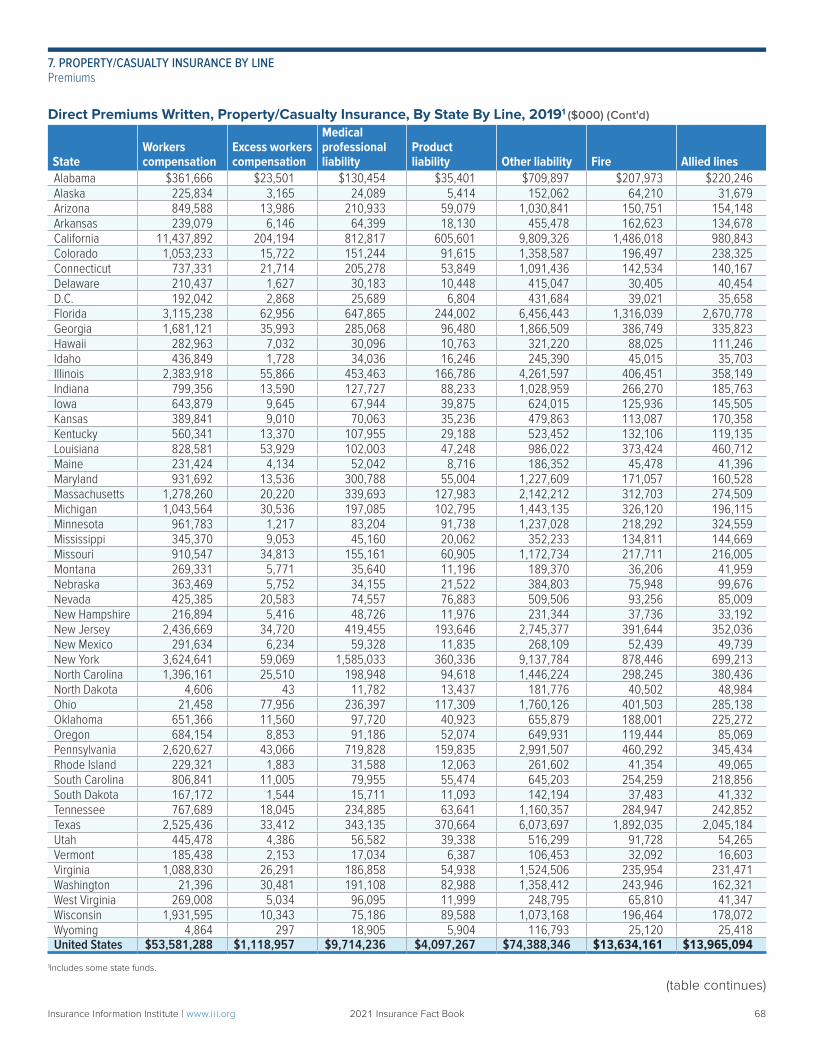
Direct Premiums Written, Property/Casualty Insurance, By State By Line, 20191 ($000) (Cont'd)
StateWorkers compensation
Excess workers compensation
Medical professional liability
Product liability Other liability Fire Allied lines
Alabama $361,666 $23,501 $130,454 $35,401 $709,897 $207,973 $220,246Alaska 225,834 3,165 24,089 5,414 152,062 64,210 31,679Arizona 849,588 13,986 210,933 59,079 1,030,841 150,751 154,148Arkansas 239,079 6,146 64,399 18,130 455,478 162,623 134,678California 11,437,892 204,194 812,817 605,601 9,809,326 1,486,018 980,843Colorado 1,053,233 15,722 151,244 91,615 1,358,587 196,497 238,325Connecticut 737,331 21,714 205,278 53,849 1,091,436 142,534 140,167Delaware 210,437 1,627 30,183 10,448 415,047 30,405 40,454D.C. 192,042 2,868 25,689 6,804 431,684 39,021 35,658Florida 3,115,238 62,956 647,865 244,002 6,456,443 1,316,039 2,670,778Georgia 1,681,121 35,993 285,068 96,480 1,866,509 386,749 335,823Hawaii 282,963 7,032 30,096 10,763 321,220 88,025 111,246Idaho 436,849 1,728 34,036 16,246 245,390 45,015 35,703Illinois 2,383,918 55,866 453,463 166,786 4,261,597 406,451 358,149Indiana 799,356 13,590 127,727 88,233 1,028,959 266,270 185,763Iowa 643,879 9,645 67,944 39,875 624,015 125,936 145,505Kansas 389,841 9,010 70,063 35,236 479,863 113,087 170,358Kentucky 560,341 13,370 107,955 29,188 523,452 132,106 119,135Louisiana 828,581 53,929 102,003 47,248 986,022 373,424 460,712Maine 231,424 4,134 52,042 8,716 186,352 45,478 41,396Maryland 931,692 13,536 300,788 55,004 1,227,609 171,057 160,528Massachusetts 1,278,260 20,220 339,693 127,983 2,142,212 312,703 274,509Michigan 1,043,564 30,536 197,085 102,795 1,443,135 326,120 196,115Minnesota 961,783 1,217 83,204 91,738 1,237,028 218,292 324,559Mississippi 345,370 9,053 45,160 20,062 352,233 134,811 144,669Missouri 910,547 34,813 155,161 60,905 1,172,734 217,711 216,005Montana 269,331 5,771 35,640 11,196 189,370 36,206 41,959Nebraska 363,469 5,752 34,155 21,522 384,803 75,948 99,676Nevada 425,385 20,583 74,557 76,883 509,506 93,256 85,009New Hampshire 216,894 5,416 48,726 11,976 231,344 37,736 33,192New Jersey 2,436,669 34,720 419,455 193,646 2,745,377 391,644 352,036New Mexico 291,634 6,234 59,328 11,835 268,109 52,439 49,739New York 3,624,641 59,069 1,585,033 360,336 9,137,784 878,446 699,213North Carolina 1,396,161 25,510 198,948 94,618 1,446,224 298,245 380,436North Dakota 4,606 43 11,782 13,437 181,776 40,502 48,984Ohio 21,458 77,956 236,397 117,309 1,760,126 401,503 285,138Oklahoma 651,366 11,560 97,720 40,923 655,879 188,001 225,272Oregon 684,154 8,853 91,186 52,074 649,931 119,444 85,069Pennsylvania 2,620,627 43,066 719,828 159,835 2,991,507 460,292 345,434Rhode Island 229,321 1,883 31,588 12,063 261,602 41,354 49,065South Carolina 806,841 11,005 79,955 55,474 645,203 254,259 218,856South Dakota 167,172 1,544 15,711 11,093 142,194 37,483 41,332Tennessee 767,689 18,045 234,885 63,641 1,160,357 284,947 242,852Texas 2,525,436 33,412 343,135 370,664 6,073,697 1,892,035 2,045,184Utah 445,478 4,386 56,582 39,338 516,299 91,728 54,265Vermont 185,438 2,153 17,034 6,387 106,453 32,092 16,603Virginia 1,088,830 26,291 186,858 54,938 1,524,506 235,954 231,471Washington 21,396 30,481 191,108 82,988 1,358,412 243,946 162,321West Virginia 269,008 5,034 96,095 11,999 248,795 65,810 41,347Wisconsin 1,931,595 10,343 75,186 89,588 1,073,168 196,464 178,072Wyoming 4,864 297 18,905 5,904 116,793 25,120 25,418United States $53,581,288 $1,118,957 $9,714,236 $4,097,267 $74,388,346 $13,634,161 $13,965,094
1Includes some state funds.
(table continues)
Insurance Information Institute | www.ii i.org 2021 Insurance Fact Book 68
7. PROPERTY/CASUALTY INSURANCE BY LINEPremiums
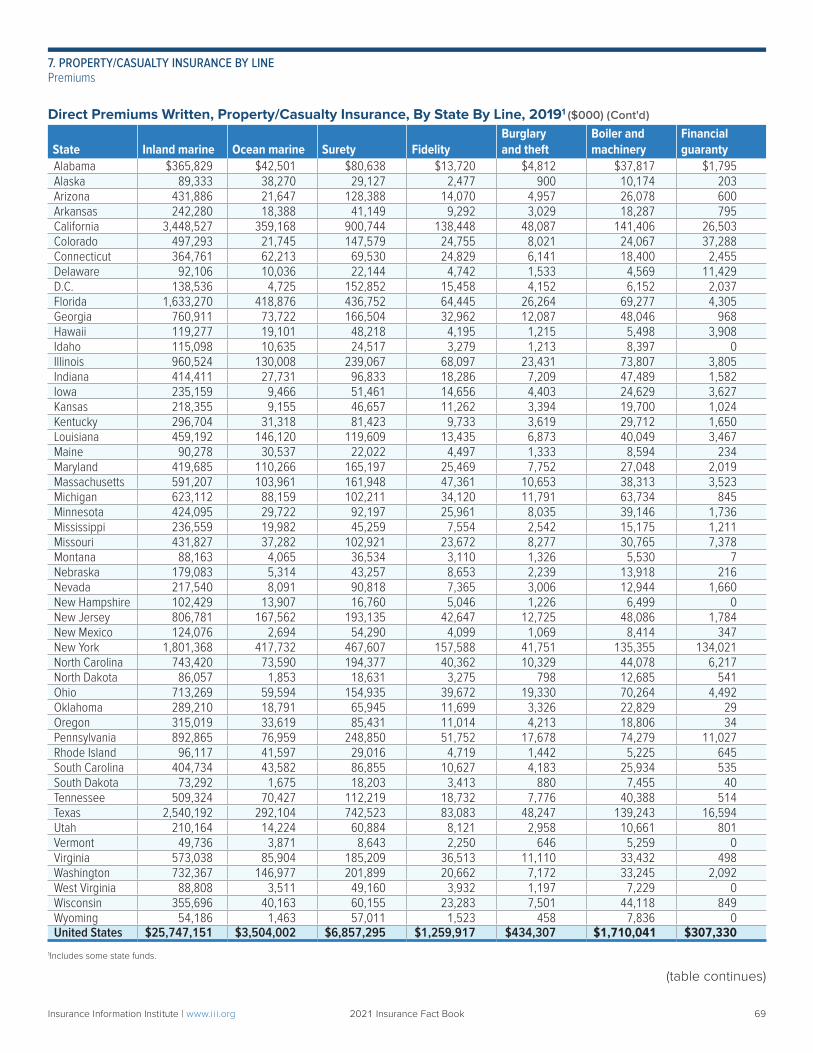
Direct Premiums Written, Property/Casualty Insurance, By State By Line, 20191 ($000) (Cont'd)
State Inland marine Ocean marine Surety FidelityBurglary and theft
Boiler and machinery
Financial guaranty
Alabama $365,829 $42,501 $80,638 $13,720 $4,812 $37,817 $1,795Alaska 89,333 38,270 29,127 2,477 900 10,174 203Arizona 431,886 21,647 128,388 14,070 4,957 26,078 600Arkansas 242,280 18,388 41,149 9,292 3,029 18,287 795California 3,448,527 359,168 900,744 138,448 48,087 141,406 26,503Colorado 497,293 21,745 147,579 24,755 8,021 24,067 37,288Connecticut 364,761 62,213 69,530 24,829 6,141 18,400 2,455Delaware 92,106 10,036 22,144 4,742 1,533 4,569 11,429D.C. 138,536 4,725 152,852 15,458 4,152 6,152 2,037Florida 1,633,270 418,876 436,752 64,445 26,264 69,277 4,305Georgia 760,911 73,722 166,504 32,962 12,087 48,046 968Hawaii 119,277 19,101 48,218 4,195 1,215 5,498 3,908Idaho 115,098 10,635 24,517 3,279 1,213 8,397 0Illinois 960,524 130,008 239,067 68,097 23,431 73,807 3,805Indiana 414,411 27,731 96,833 18,286 7,209 47,489 1,582Iowa 235,159 9,466 51,461 14,656 4,403 24,629 3,627Kansas 218,355 9,155 46,657 11,262 3,394 19,700 1,024Kentucky 296,704 31,318 81,423 9,733 3,619 29,712 1,650Louisiana 459,192 146,120 119,609 13,435 6,873 40,049 3,467Maine 90,278 30,537 22,022 4,497 1,333 8,594 234Maryland 419,685 110,266 165,197 25,469 7,752 27,048 2,019Massachusetts 591,207 103,961 161,948 47,361 10,653 38,313 3,523Michigan 623,112 88,159 102,211 34,120 11,791 63,734 845Minnesota 424,095 29,722 92,197 25,961 8,035 39,146 1,736Mississippi 236,559 19,982 45,259 7,554 2,542 15,175 1,211Missouri 431,827 37,282 102,921 23,672 8,277 30,765 7,378Montana 88,163 4,065 36,534 3,110 1,326 5,530 7Nebraska 179,083 5,314 43,257 8,653 2,239 13,918 216Nevada 217,540 8,091 90,818 7,365 3,006 12,944 1,660New Hampshire 102,429 13,907 16,760 5,046 1,226 6,499 0New Jersey 806,781 167,562 193,135 42,647 12,725 48,086 1,784New Mexico 124,076 2,694 54,290 4,099 1,069 8,414 347New York 1,801,368 417,732 467,607 157,588 41,751 135,355 134,021North Carolina 743,420 73,590 194,377 40,362 10,329 44,078 6,217North Dakota 86,057 1,853 18,631 3,275 798 12,685 541Ohio 713,269 59,594 154,935 39,672 19,330 70,264 4,492Oklahoma 289,210 18,791 65,945 11,699 3,326 22,829 29Oregon 315,019 33,619 85,431 11,014 4,213 18,806 34Pennsylvania 892,865 76,959 248,850 51,752 17,678 74,279 11,027Rhode Island 96,117 41,597 29,016 4,719 1,442 5,225 645South Carolina 404,734 43,582 86,855 10,627 4,183 25,934 535South Dakota 73,292 1,675 18,203 3,413 880 7,455 40Tennessee 509,324 70,427 112,219 18,732 7,776 40,388 514Texas 2,540,192 292,104 742,523 83,083 48,247 139,243 16,594Utah 210,164 14,224 60,884 8,121 2,958 10,661 801Vermont 49,736 3,871 8,643 2,250 646 5,259 0Virginia 573,038 85,904 185,209 36,513 11,110 33,432 498Washington 732,367 146,977 201,899 20,662 7,172 33,245 2,092West Virginia 88,808 3,511 49,160 3,932 1,197 7,229 0Wisconsin 355,696 40,163 60,155 23,283 7,501 44,118 849Wyoming 54,186 1,463 57,011 1,523 458 7,836 0United States $25,747,151 $3,504,002 $6,857,295 $1,259,917 $434,307 $1,710,041 $307,330
1Includes some state funds.
(table continues)
Insurance Information Institute | www.ii i.org 2021 Insurance Fact Book 69
7. PROPERTY/CASUALTY INSURANCE BY LINEPremiums
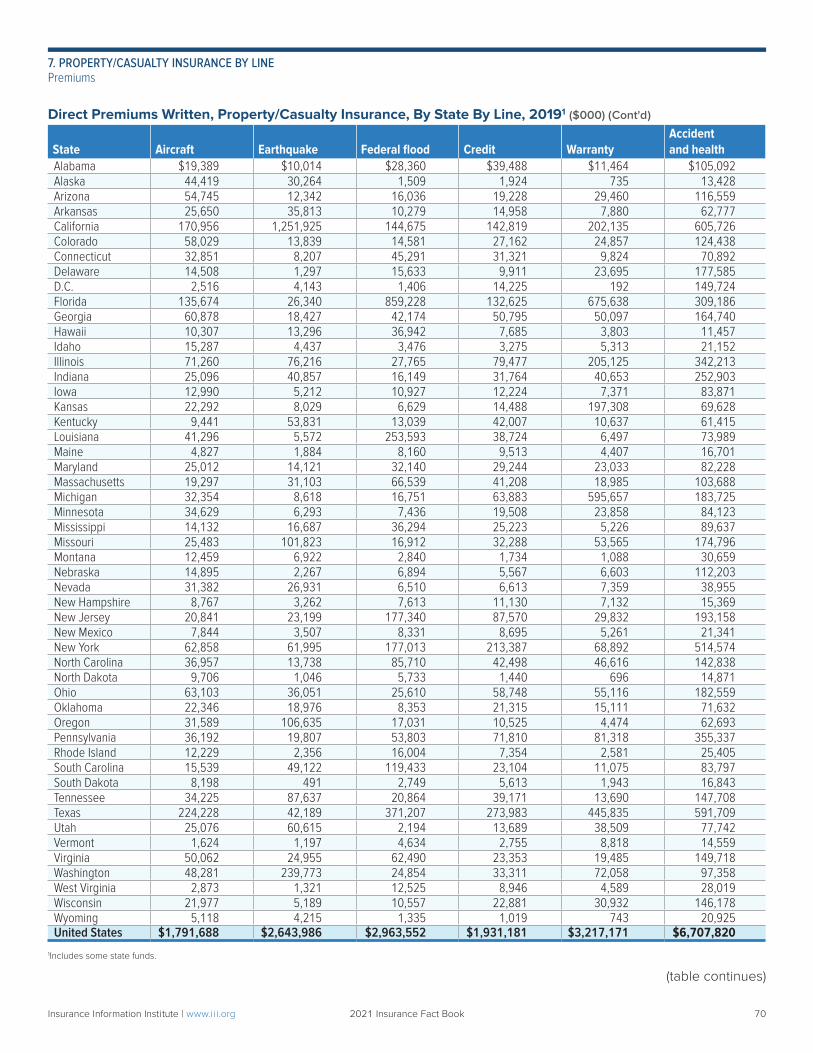
Direct Premiums Written, Property/Casualty Insurance, By State By Line, 20191 ($000) (Cont'd)
State Aircraft Earthquake Federal flood Credit WarrantyAccident and health
Alabama $19,389 $10,014 $28,360 $39,488 $11,464 $105,092Alaska 44,419 30,264 1,509 1,924 735 13,428Arizona 54,745 12,342 16,036 19,228 29,460 116,559Arkansas 25,650 35,813 10,279 14,958 7,880 62,777California 170,956 1,251,925 144,675 142,819 202,135 605,726Colorado 58,029 13,839 14,581 27,162 24,857 124,438Connecticut 32,851 8,207 45,291 31,321 9,824 70,892Delaware 14,508 1,297 15,633 9,911 23,695 177,585D.C. 2,516 4,143 1,406 14,225 192 149,724Florida 135,674 26,340 859,228 132,625 675,638 309,186Georgia 60,878 18,427 42,174 50,795 50,097 164,740Hawaii 10,307 13,296 36,942 7,685 3,803 11,457Idaho 15,287 4,437 3,476 3,275 5,313 21,152Illinois 71,260 76,216 27,765 79,477 205,125 342,213Indiana 25,096 40,857 16,149 31,764 40,653 252,903Iowa 12,990 5,212 10,927 12,224 7,371 83,871Kansas 22,292 8,029 6,629 14,488 197,308 69,628Kentucky 9,441 53,831 13,039 42,007 10,637 61,415Louisiana 41,296 5,572 253,593 38,724 6,497 73,989Maine 4,827 1,884 8,160 9,513 4,407 16,701Maryland 25,012 14,121 32,140 29,244 23,033 82,228Massachusetts 19,297 31,103 66,539 41,208 18,985 103,688Michigan 32,354 8,618 16,751 63,883 595,657 183,725Minnesota 34,629 6,293 7,436 19,508 23,858 84,123Mississippi 14,132 16,687 36,294 25,223 5,226 89,637Missouri 25,483 101,823 16,912 32,288 53,565 174,796Montana 12,459 6,922 2,840 1,734 1,088 30,659Nebraska 14,895 2,267 6,894 5,567 6,603 112,203Nevada 31,382 26,931 6,510 6,613 7,359 38,955New Hampshire 8,767 3,262 7,613 11,130 7,132 15,369New Jersey 20,841 23,199 177,340 87,570 29,832 193,158New Mexico 7,844 3,507 8,331 8,695 5,261 21,341New York 62,858 61,995 177,013 213,387 68,892 514,574North Carolina 36,957 13,738 85,710 42,498 46,616 142,838North Dakota 9,706 1,046 5,733 1,440 696 14,871Ohio 63,103 36,051 25,610 58,748 55,116 182,559Oklahoma 22,346 18,976 8,353 21,315 15,111 71,632Oregon 31,589 106,635 17,031 10,525 4,474 62,693Pennsylvania 36,192 19,807 53,803 71,810 81,318 355,337Rhode Island 12,229 2,356 16,004 7,354 2,581 25,405South Carolina 15,539 49,122 119,433 23,104 11,075 83,797South Dakota 8,198 491 2,749 5,613 1,943 16,843Tennessee 34,225 87,637 20,864 39,171 13,690 147,708Texas 224,228 42,189 371,207 273,983 445,835 591,709Utah 25,076 60,615 2,194 13,689 38,509 77,742Vermont 1,624 1,197 4,634 2,755 8,818 14,559Virginia 50,062 24,955 62,490 23,353 19,485 149,718Washington 48,281 239,773 24,854 33,311 72,058 97,358West Virginia 2,873 1,321 12,525 8,946 4,589 28,019Wisconsin 21,977 5,189 10,557 22,881 30,932 146,178Wyoming 5,118 4,215 1,335 1,019 743 20,925United States $1,791,688 $2,643,986 $2,963,552 $1,931,181 $3,217,171 $6,707,820
1Includes some state funds.
(table continues)
Insurance Information Institute | www.ii i.org 2021 Insurance Fact Book 70
7. PROPERTY/CASUALTY INSURANCE BY LINEPremiums
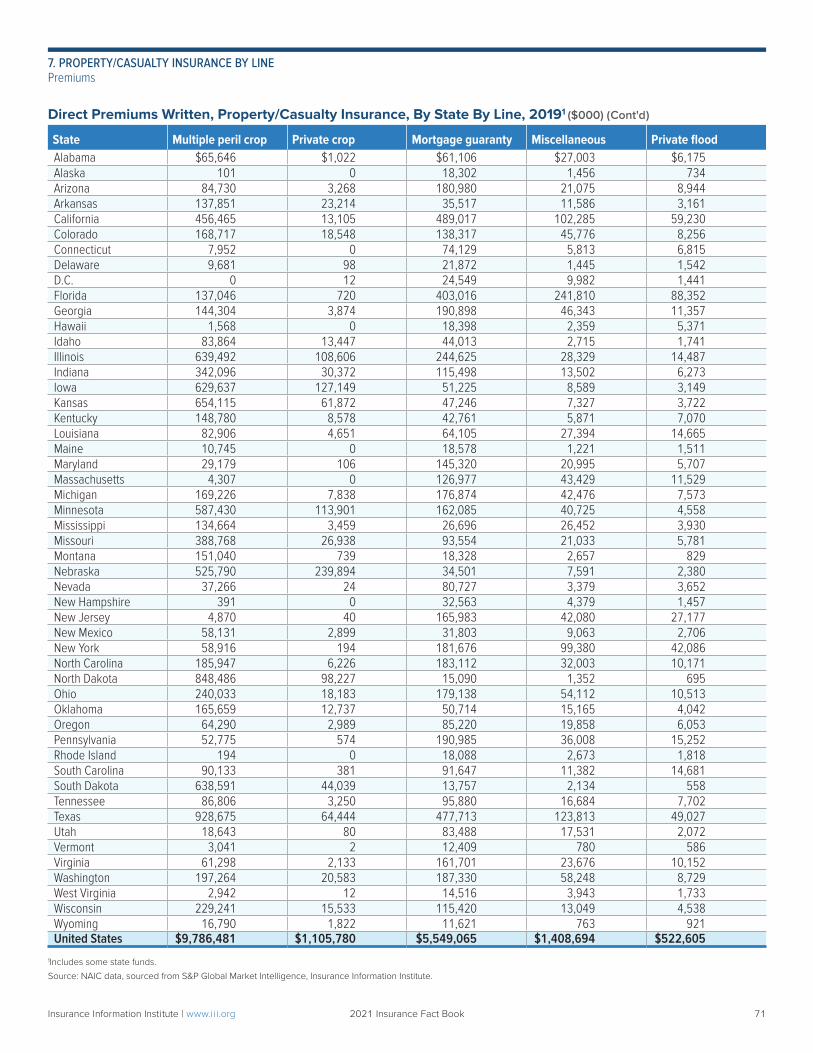
Direct Premiums Written, Property/Casualty Insurance, By State By Line, 20191 ($000) (Cont'd)
State Multiple peril crop Private crop Mortgage guaranty Miscellaneous Private floodAlabama $65,646 $1,022 $61,106 $27,003 $6,175Alaska 101 0 18,302 1,456 734Arizona 84,730 3,268 180,980 21,075 8,944Arkansas 137,851 23,214 35,517 11,586 3,161California 456,465 13,105 489,017 102,285 59,230Colorado 168,717 18,548 138,317 45,776 8,256Connecticut 7,952 0 74,129 5,813 6,815Delaware 9,681 98 21,872 1,445 1,542D.C. 0 12 24,549 9,982 1,441Florida 137,046 720 403,016 241,810 88,352Georgia 144,304 3,874 190,898 46,343 11,357Hawaii 1,568 0 18,398 2,359 5,371Idaho 83,864 13,447 44,013 2,715 1,741Illinois 639,492 108,606 244,625 28,329 14,487Indiana 342,096 30,372 115,498 13,502 6,273Iowa 629,637 127,149 51,225 8,589 3,149Kansas 654,115 61,872 47,246 7,327 3,722Kentucky 148,780 8,578 42,761 5,871 7,070Louisiana 82,906 4,651 64,105 27,394 14,665Maine 10,745 0 18,578 1,221 1,511Maryland 29,179 106 145,320 20,995 5,707Massachusetts 4,307 0 126,977 43,429 11,529Michigan 169,226 7,838 176,874 42,476 7,573Minnesota 587,430 113,901 162,085 40,725 4,558Mississippi 134,664 3,459 26,696 26,452 3,930Missouri 388,768 26,938 93,554 21,033 5,781Montana 151,040 739 18,328 2,657 829Nebraska 525,790 239,894 34,501 7,591 2,380Nevada 37,266 24 80,727 3,379 3,652New Hampshire 391 0 32,563 4,379 1,457New Jersey 4,870 40 165,983 42,080 27,177New Mexico 58,131 2,899 31,803 9,063 2,706New York 58,916 194 181,676 99,380 42,086North Carolina 185,947 6,226 183,112 32,003 10,171North Dakota 848,486 98,227 15,090 1,352 695Ohio 240,033 18,183 179,138 54,112 10,513Oklahoma 165,659 12,737 50,714 15,165 4,042Oregon 64,290 2,989 85,220 19,858 6,053Pennsylvania 52,775 574 190,985 36,008 15,252Rhode Island 194 0 18,088 2,673 1,818South Carolina 90,133 381 91,647 11,382 14,681South Dakota 638,591 44,039 13,757 2,134 558Tennessee 86,806 3,250 95,880 16,684 7,702Texas 928,675 64,444 477,713 123,813 49,027Utah 18,643 80 83,488 17,531 2,072Vermont 3,041 2 12,409 780 586Virginia 61,298 2,133 161,701 23,676 10,152Washington 197,264 20,583 187,330 58,248 8,729West Virginia 2,942 12 14,516 3,943 1,733Wisconsin 229,241 15,533 115,420 13,049 4,538Wyoming 16,790 1,822 11,621 763 921United States $9,786,481 $1,105,780 $5,549,065 $1,408,694 $522,605
1Includes some state funds.
Source: NAIC data, sourced from S&P Global Market Intelligence, Insurance Information Institute.
Insurance Information Institute | www.ii i.org 2021 Insurance Fact Book 71
7. PROPERTY/CASUALTY INSURANCE BY LINEPremiums
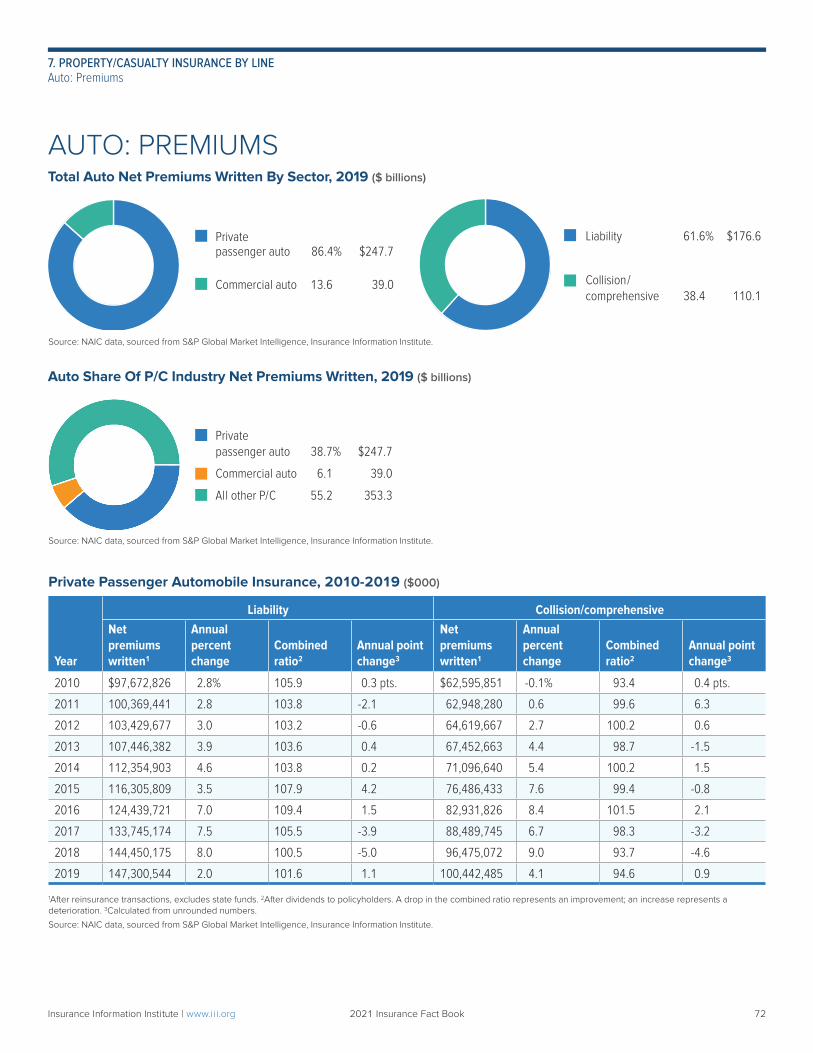
Liability 61.6% $176.6
Collision/ comprehensive 38.4 110.1
Private passenger auto 86.4% $247.7
Commercial auto 13.6 39.0
Private passenger auto 38.7% $247.7
Commercial auto 6.1 39.0
All other P/C 55.2 353.3
Source: NAIC data, sourced from S&P Global Market Intelligence, Insurance Information Institute.
Source: NAIC data, sourced from S&P Global Market Intelligence, Insurance Information Institute.
Auto Share Of P/C Industry Net Premiums Written, 2019 ($ billions)
Private Passenger Automobile Insurance, 2010-2019 ($000)
Year
Liability Collision/comprehensiveNet premiums written1
Annual percent change
Combined ratio2
Annual point change3
Net premiums written1
Annual percent change
Combined ratio2
Annual point change3
2010 $97,672,826 2.8% 105.9 0.3 pts. $62,595,851 -0.1% 93.4 0.4 pts.
2011 100,369,441 2.8 103.8 -2.1 62,948,280 0.6 99.6 6.3
2012 103,429,677 3.0 103.2 -0.6 64,619,667 2.7 100.2 0.6
2013 107,446,382 3.9 103.6 0.4 67,452,663 4.4 98.7 -1.5
2014 112,354,903 4.6 103.8 0.2 71,096,640 5.4 100.2 1.5
2015 116,305,809 3.5 107.9 4.2 76,486,433 7.6 99.4 -0.8
2016 124,439,721 7.0 109.4 1.5 82,931,826 8.4 101.5 2.1
2017 133,745,174 7.5 105.5 -3.9 88,489,745 6.7 98.3 -3.2
2018 144,450,175 8.0 100.5 -5.0 96,475,072 9.0 93.7 -4.6
2019 147,300,544 2.0 101.6 1.1 100,442,485 4.1 94.6 0.9
1After reinsurance transactions, excludes state funds. 2After dividends to policyholders. A drop in the combined ratio represents an improvement; an increase represents a deterioration. 3Calculated from unrounded numbers.
Source: NAIC data, sourced from S&P Global Market Intelligence, Insurance Information Institute.
AUTO: PREMIUMSTotal Auto Net Premiums Written By Sector, 2019 ($ billions)
Insurance Information Institute | www.ii i.org 2021 Insurance Fact Book 72
7. PROPERTY/CASUALTY INSURANCE BY LINEAuto: Premiums
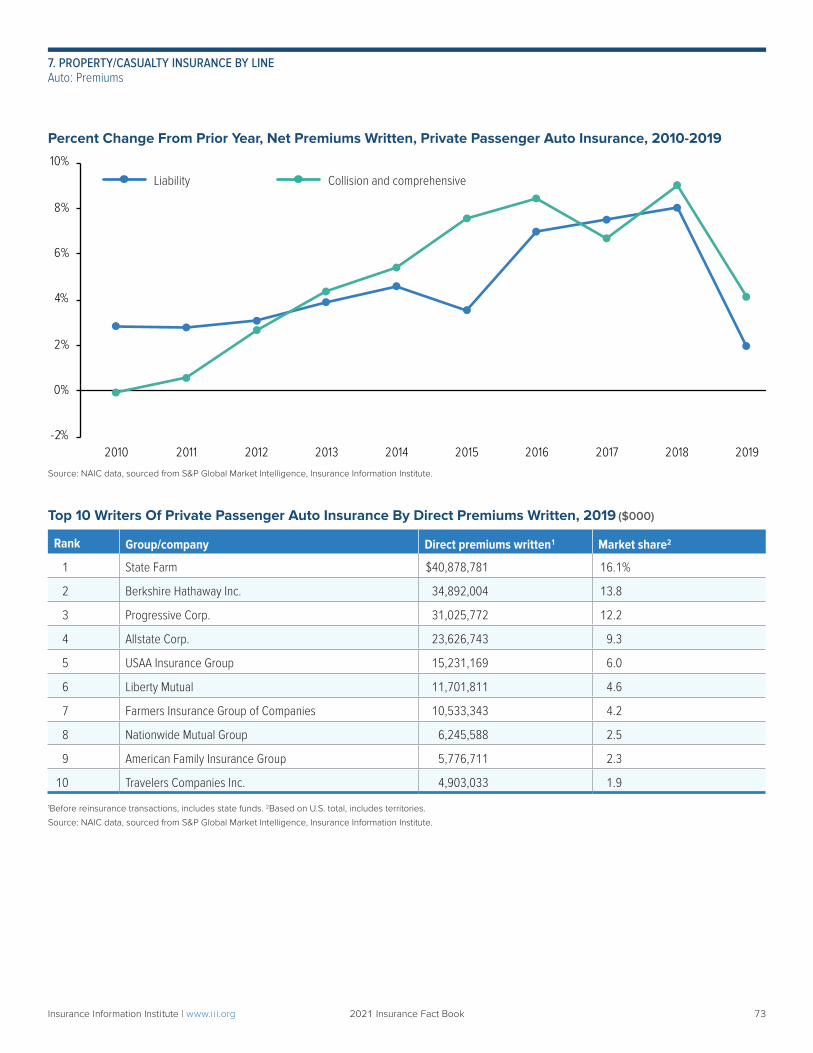
-2%
0%
2%
4%
6%
8%
10%
2010 2011 2012 2013 2014 2015 2016 2017 2018 2019
Percent Change From Prior Year, Net Premiums Written, Private Passenger Auto Insurance, 2010-2019
Source: NAIC data, sourced from S&P Global Market Intelligence, Insurance Information Institute.
Top 10 Writers Of Private Passenger Auto Insurance By Direct Premiums Written, 2019 ($000)
Rank Group/company Direct premiums written1 Market share2
1 State Farm $40,878,781 16.1%
2 Berkshire Hathaway Inc. 34,892,004 13.8
3 Progressive Corp. 31,025,772 12.2
4 Allstate Corp. 23,626,743 9.3
5 USAA Insurance Group 15,231,169 6.0
6 Liberty Mutual 11,701,811 4.6
7 Farmers Insurance Group of Companies 10,533,343 4.2
8 Nationwide Mutual Group 6,245,588 2.5
9 American Family Insurance Group 5,776,711 2.3
10 Travelers Companies Inc. 4,903,033 1.9
1Before reinsurance transactions, includes state funds. 2Based on U.S. total, includes territories.
Source: NAIC data, sourced from S&P Global Market Intelligence, Insurance Information Institute.
Liability Collision and comprehensive
Insurance Information Institute | www.ii i.org 2021 Insurance Fact Book 73
7. PROPERTY/CASUALTY INSURANCE BY LINEAuto: Premiums
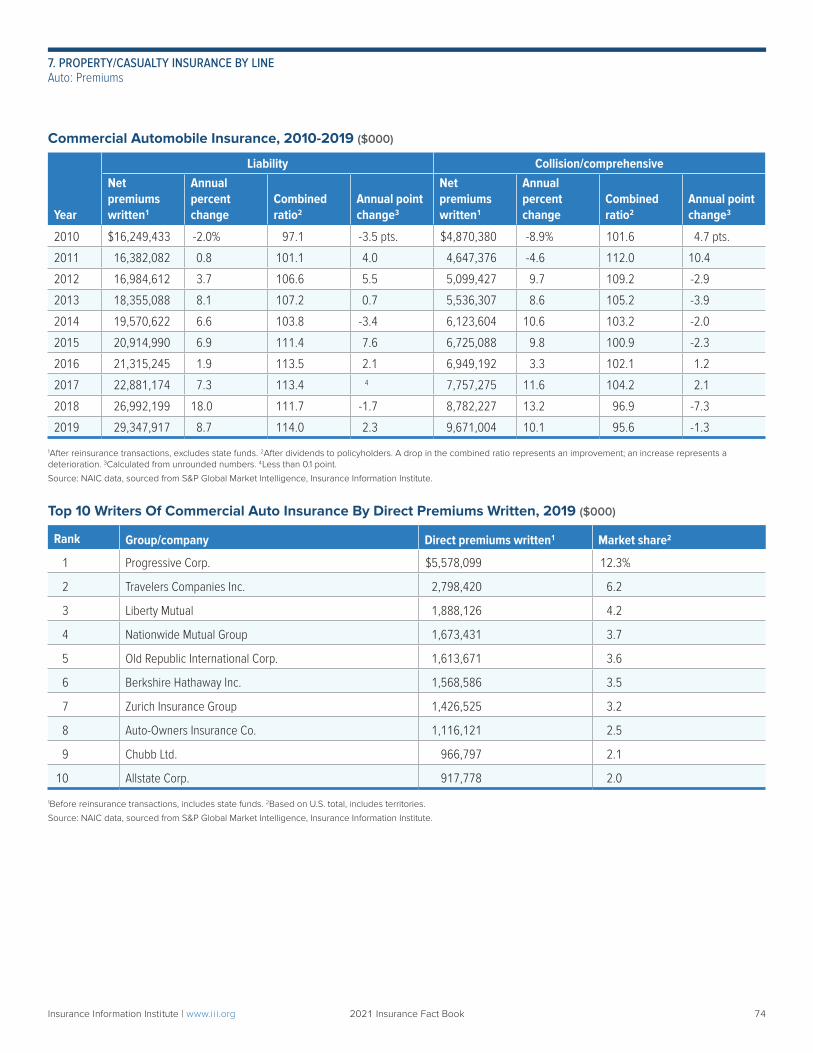
Commercial Automobile Insurance, 2010-2019 ($000)
Year
Liability Collision/comprehensiveNet premiums written1
Annual percent change
Combined ratio2
Annual point change3
Net premiums written1
Annual percent change
Combined ratio2
Annual point change3
2010 $16,249,433 -2.0% 97.1 -3.5 pts. $4,870,380 -8.9% 101.6 4.7 pts.
2011 16,382,082 0.8 101.1 4.0 4,647,376 -4.6 112.0 10.4
2012 16,984,612 3.7 106.6 5.5 5,099,427 9.7 109.2 -2.9
2013 18,355,088 8.1 107.2 0.7 5,536,307 8.6 105.2 -3.9
2014 19,570,622 6.6 103.8 -3.4 6,123,604 10.6 103.2 -2.0
2015 20,914,990 6.9 111.4 7.6 6,725,088 9.8 100.9 -2.3
2016 21,315,245 1.9 113.5 2.1 6,949,192 3.3 102.1 1.2
2017 22,881,174 7.3 113.4 4 7,757,275 11.6 104.2 2.1
2018 26,992,199 18.0 111.7 -1.7 8,782,227 13.2 96.9 -7.3
2019 29,347,917 8.7 114.0 2.3 9,671,004 10.1 95.6 -1.3
1After reinsurance transactions, excludes state funds. 2After dividends to policyholders. A drop in the combined ratio represents an improvement; an increase represents a deterioration. 3Calculated from unrounded numbers. 4Less than 0.1 point.
Source: NAIC data, sourced from S&P Global Market Intelligence, Insurance Information Institute.
Top 10 Writers Of Commercial Auto Insurance By Direct Premiums Written, 2019 ($000)
Rank Group/company Direct premiums written1 Market share2
1 Progressive Corp. $5,578,099 12.3%
2 Travelers Companies Inc. 2,798,420 6.2
3 Liberty Mutual 1,888,126 4.2
4 Nationwide Mutual Group 1,673,431 3.7
5 Old Republic International Corp. 1,613,671 3.6
6 Berkshire Hathaway Inc. 1,568,586 3.5
7 Zurich Insurance Group 1,426,525 3.2
8 Auto-Owners Insurance Co. 1,116,121 2.5
9 Chubb Ltd. 966,797 2.1
10 Allstate Corp. 917,778 2.0
1Before reinsurance transactions, includes state funds. 2Based on U.S. total, includes territories.
Source: NAIC data, sourced from S&P Global Market Intelligence, Insurance Information Institute.
Insurance Information Institute | www.ii i.org 2021 Insurance Fact Book 74
7. PROPERTY/CASUALTY INSURANCE BY LINEAuto: Premiums
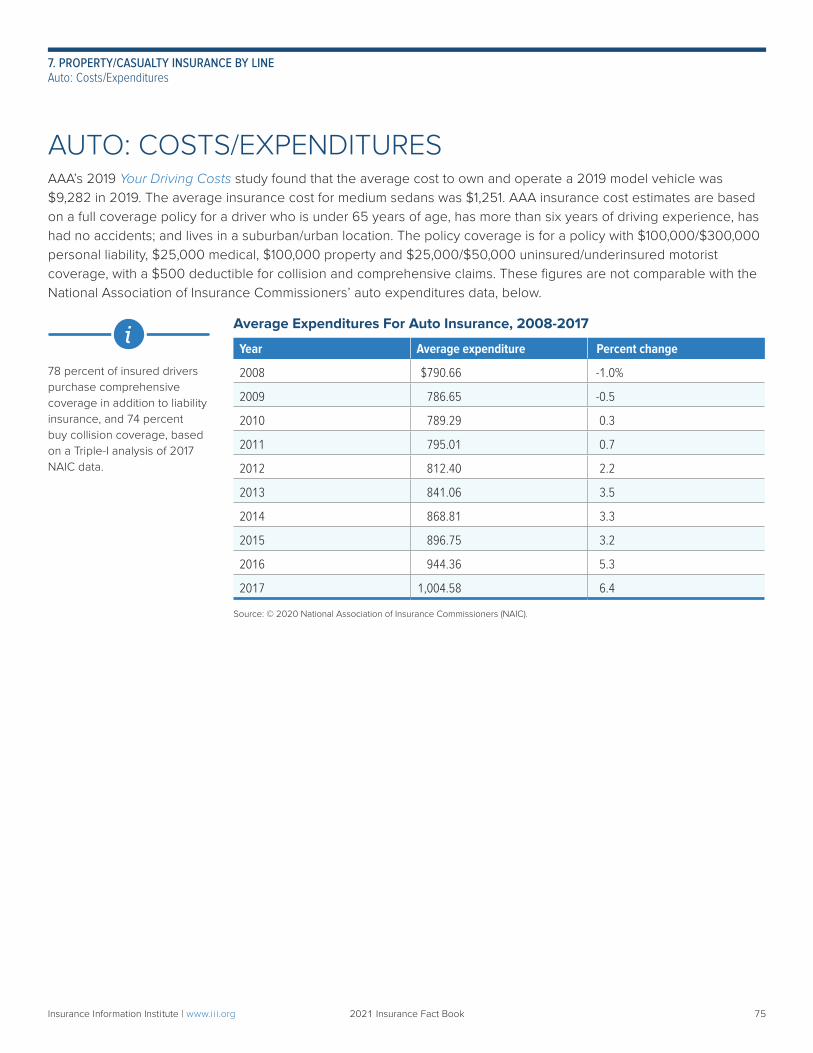
78 percent of insured drivers purchase comprehensive coverage in addition to liability insurance, and 74 percent buy collision coverage, based on a Triple-I analysis of 2017 NAIC data.
i
AUTO: COSTS/EXPENDITURESAAA’s 2019 Your Driving Costs study found that the average cost to own and operate a 2019 model vehicle was $9,282 in 2019. The average insurance cost for medium sedans was $1,251. AAA insurance cost estimates are based on a full coverage policy for a driver who is under 65 years of age, has more than six years of driving experience, has had no accidents; and lives in a suburban/urban location. The policy coverage is for a policy with $100,000/$300,000 personal liability, $25,000 medical, $100,000 property and $25,000/$50,000 uninsured/underinsured motorist coverage, with a $500 deductible for collision and comprehensive claims. These figures are not comparable with the National Association of Insurance Commissioners’ auto expenditures data, below.
Average Expenditures For Auto Insurance, 2008-2017
Year Average expenditure Percent change
2008 $790.66 -1.0%
2009 786.65 -0.5
2010 789.29 0.3
2011 795.01 0.7
2012 812.40 2.2
2013 841.06 3.5
2014 868.81 3.3
2015 896.75 3.2
2016 944.36 5.3
2017 1,004.58 6.4
Source: © 2020 National Association of Insurance Commissioners (NAIC).
Insurance Information Institute | www.ii i.org 2021 Insurance Fact Book 75
7. PROPERTY/CASUALTY INSURANCE BY LINEAuto: Costs/Expenditures
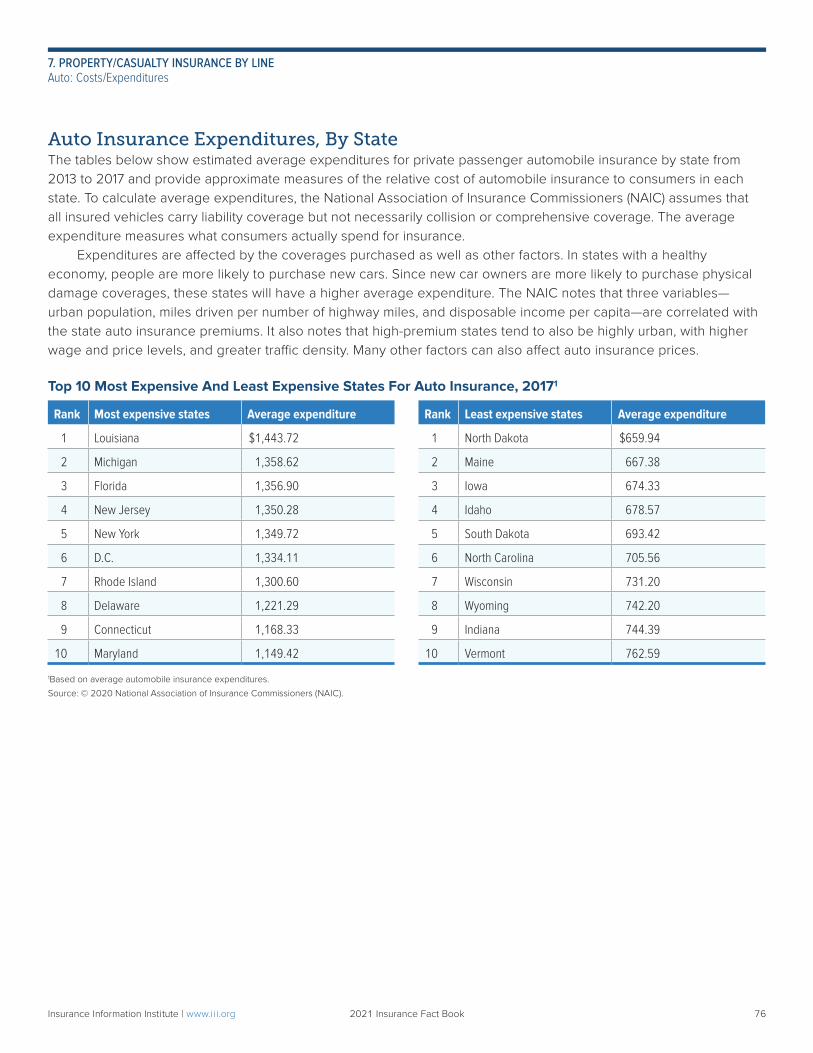
Auto Insurance Expenditures, By StateThe tables below show estimated average expenditures for private passenger automobile insurance by state from 2013 to 2017 and provide approximate measures of the relative cost of automobile insurance to consumers in each state. To calculate average expenditures, the National Association of Insurance Commissioners (NAIC) assumes that all insured vehicles carry liability coverage but not necessarily collision or comprehensive coverage. The average expenditure measures what consumers actually spend for insurance. Expenditures are affected by the coverages purchased as well as other factors. In states with a healthy economy, people are more likely to purchase new cars. Since new car owners are more likely to purchase physical damage coverages, these states will have a higher average expenditure. The NAIC notes that three variables— urban population, miles driven per number of highway miles, and disposable income per capita—are correlated with the state auto insurance premiums. It also notes that high-premium states tend to also be highly urban, with higher wage and price levels, and greater traffic density. Many other factors can also affect auto insurance prices.
Top 10 Most Expensive And Least Expensive States For Auto Insurance, 20171
Rank Most expensive states Average expenditure Rank Least expensive states Average expenditure
1 Louisiana $1,443.72 1 North Dakota $659.94
2 Michigan 1,358.62 2 Maine 667.38
3 Florida 1,356.90 3 Iowa 674.33
4 New Jersey 1,350.28 4 Idaho 678.57
5 New York 1,349.72 5 South Dakota 693.42
6 D.C. 1,334.11 6 North Carolina 705.56
7 Rhode Island 1,300.60 7 Wisconsin 731.20
8 Delaware 1,221.29 8 Wyoming 742.20
9 Connecticut 1,168.33 9 Indiana 744.39
10 Maryland 1,149.42 10 Vermont 762.59
1Based on average automobile insurance expenditures.
Source: © 2020 National Association of Insurance Commissioners (NAIC).
Insurance Information Institute | www.ii i.org 2021 Insurance Fact Book 76
7. PROPERTY/CASUALTY INSURANCE BY LINEAuto: Costs/Expenditures
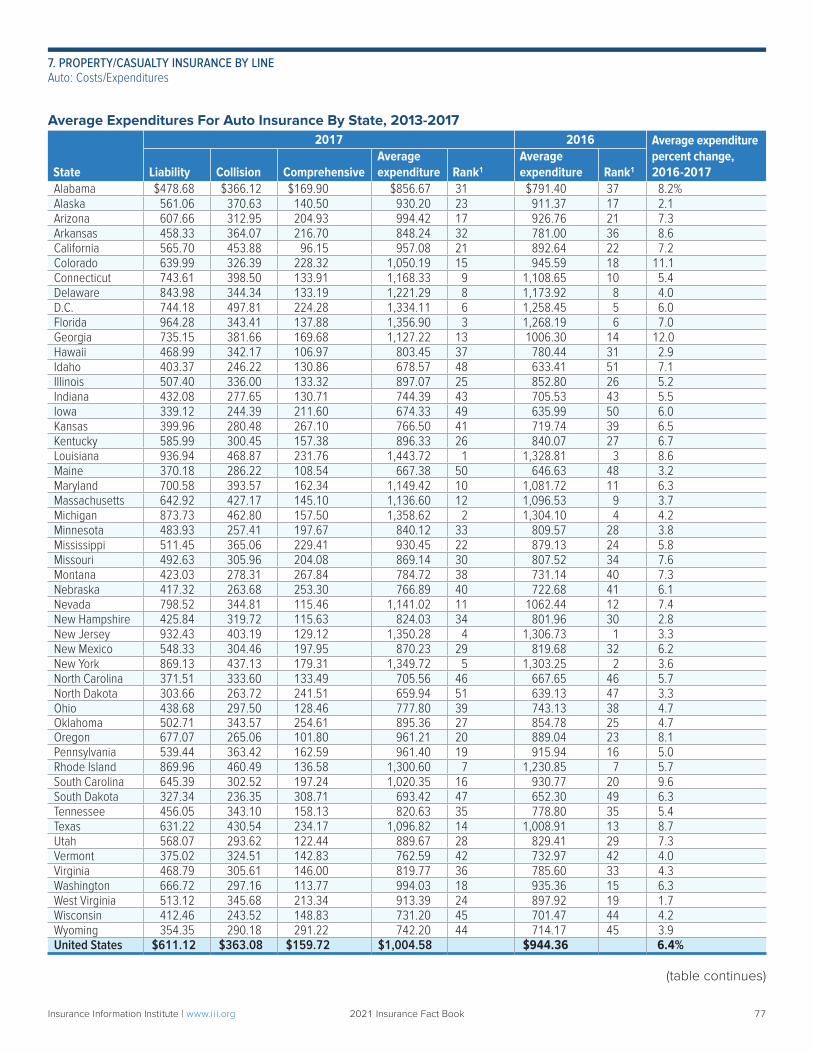
Average Expenditures For Auto Insurance By State, 2013-2017
State
2017 2016 Average expenditure percent change, 2016-2017Liability Collision Comprehensive
Average expenditure Rank1
Average expenditure Rank1
Alabama $478.68 $366.12 $169.90 $856.67 31 $791.40 37 8.2%Alaska 561.06 370.63 140.50 930.20 23 911.37 17 2.1Arizona 607.66 312.95 204.93 994.42 17 926.76 21 7.3Arkansas 458.33 364.07 216.70 848.24 32 781.00 36 8.6California 565.70 453.88 96.15 957.08 21 892.64 22 7.2Colorado 639.99 326.39 228.32 1,050.19 15 945.59 18 11.1Connecticut 743.61 398.50 133.91 1,168.33 9 1,108.65 10 5.4Delaware 843.98 344.34 133.19 1,221.29 8 1,173.92 8 4.0D.C. 744.18 497.81 224.28 1,334.11 6 1,258.45 5 6.0Florida 964.28 343.41 137.88 1,356.90 3 1,268.19 6 7.0Georgia 735.15 381.66 169.68 1,127.22 13 1006.30 14 12.0Hawaii 468.99 342.17 106.97 803.45 37 780.44 31 2.9Idaho 403.37 246.22 130.86 678.57 48 633.41 51 7.1Illinois 507.40 336.00 133.32 897.07 25 852.80 26 5.2Indiana 432.08 277.65 130.71 744.39 43 705.53 43 5.5Iowa 339.12 244.39 211.60 674.33 49 635.99 50 6.0Kansas 399.96 280.48 267.10 766.50 41 719.74 39 6.5Kentucky 585.99 300.45 157.38 896.33 26 840.07 27 6.7Louisiana 936.94 468.87 231.76 1,443.72 1 1,328.81 3 8.6Maine 370.18 286.22 108.54 667.38 50 646.63 48 3.2Maryland 700.58 393.57 162.34 1,149.42 10 1,081.72 11 6.3Massachusetts 642.92 427.17 145.10 1,136.60 12 1,096.53 9 3.7Michigan 873.73 462.80 157.50 1,358.62 2 1,304.10 4 4.2Minnesota 483.93 257.41 197.67 840.12 33 809.57 28 3.8Mississippi 511.45 365.06 229.41 930.45 22 879.13 24 5.8Missouri 492.63 305.96 204.08 869.14 30 807.52 34 7.6Montana 423.03 278.31 267.84 784.72 38 731.14 40 7.3Nebraska 417.32 263.68 253.30 766.89 40 722.68 41 6.1Nevada 798.52 344.81 115.46 1,141.02 11 1062.44 12 7.4New Hampshire 425.84 319.72 115.63 824.03 34 801.96 30 2.8New Jersey 932.43 403.19 129.12 1,350.28 4 1,306.73 1 3.3New Mexico 548.33 304.46 197.95 870.23 29 819.68 32 6.2New York 869.13 437.13 179.31 1,349.72 5 1,303.25 2 3.6North Carolina 371.51 333.60 133.49 705.56 46 667.65 46 5.7North Dakota 303.66 263.72 241.51 659.94 51 639.13 47 3.3Ohio 438.68 297.50 128.46 777.80 39 743.13 38 4.7Oklahoma 502.71 343.57 254.61 895.36 27 854.78 25 4.7Oregon 677.07 265.06 101.80 961.21 20 889.04 23 8.1Pennsylvania 539.44 363.42 162.59 961.40 19 915.94 16 5.0Rhode Island 869.96 460.49 136.58 1,300.60 7 1,230.85 7 5.7South Carolina 645.39 302.52 197.24 1,020.35 16 930.77 20 9.6South Dakota 327.34 236.35 308.71 693.42 47 652.30 49 6.3Tennessee 456.05 343.10 158.13 820.63 35 778.80 35 5.4Texas 631.22 430.54 234.17 1,096.82 14 1,008.91 13 8.7Utah 568.07 293.62 122.44 889.67 28 829.41 29 7.3Vermont 375.02 324.51 142.83 762.59 42 732.97 42 4.0Virginia 468.79 305.61 146.00 819.77 36 785.60 33 4.3Washington 666.72 297.16 113.77 994.03 18 935.36 15 6.3West Virginia 513.12 345.68 213.34 913.39 24 897.92 19 1.7Wisconsin 412.46 243.52 148.83 731.20 45 701.47 44 4.2Wyoming 354.35 290.18 291.22 742.20 44 714.17 45 3.9United States $611.12 $363.08 $159.72 $1,004.58 $944.36 6.4%
(table continues)
Insurance Information Institute | www.ii i.org 2021 Insurance Fact Book 77
7. PROPERTY/CASUALTY INSURANCE BY LINEAuto: Costs/Expenditures
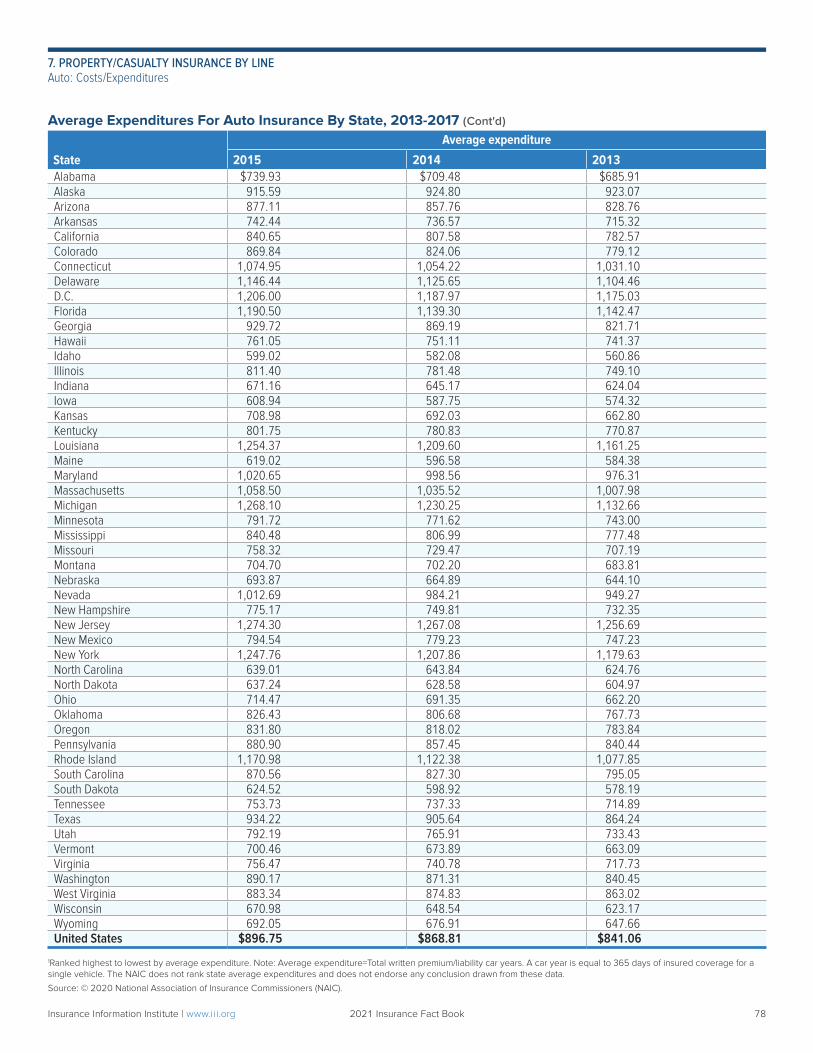
Average Expenditures For Auto Insurance By State, 2013-2017 (Cont'd)
State
Average expenditure
2015 2014 2013Alabama $739.93 $709.48 $685.91 Alaska 915.59 924.80 923.07Arizona 877.11 857.76 828.76Arkansas 742.44 736.57 715.32California 840.65 807.58 782.57Colorado 869.84 824.06 779.12Connecticut 1,074.95 1,054.22 1,031.10Delaware 1,146.44 1,125.65 1,104.46D.C. 1,206.00 1,187.97 1,175.03Florida 1,190.50 1,139.30 1,142.47Georgia 929.72 869.19 821.71Hawaii 761.05 751.11 741.37Idaho 599.02 582.08 560.86Illinois 811.40 781.48 749.10Indiana 671.16 645.17 624.04Iowa 608.94 587.75 574.32Kansas 708.98 692.03 662.80Kentucky 801.75 780.83 770.87Louisiana 1,254.37 1,209.60 1,161.25Maine 619.02 596.58 584.38Maryland 1,020.65 998.56 976.31Massachusetts 1,058.50 1,035.52 1,007.98Michigan 1,268.10 1,230.25 1,132.66Minnesota 791.72 771.62 743.00Mississippi 840.48 806.99 777.48Missouri 758.32 729.47 707.19Montana 704.70 702.20 683.81Nebraska 693.87 664.89 644.10Nevada 1,012.69 984.21 949.27New Hampshire 775.17 749.81 732.35New Jersey 1,274.30 1,267.08 1,256.69New Mexico 794.54 779.23 747.23New York 1,247.76 1,207.86 1,179.63North Carolina 639.01 643.84 624.76North Dakota 637.24 628.58 604.97Ohio 714.47 691.35 662.20Oklahoma 826.43 806.68 767.73Oregon 831.80 818.02 783.84Pennsylvania 880.90 857.45 840.44Rhode Island 1,170.98 1,122.38 1,077.85South Carolina 870.56 827.30 795.05South Dakota 624.52 598.92 578.19Tennessee 753.73 737.33 714.89Texas 934.22 905.64 864.24Utah 792.19 765.91 733.43Vermont 700.46 673.89 663.09Virginia 756.47 740.78 717.73Washington 890.17 871.31 840.45West Virginia 883.34 874.83 863.02Wisconsin 670.98 648.54 623.17Wyoming 692.05 676.91 647.66United States $896.75 $868.81 $841.06
1Ranked highest to lowest by average expenditure. Note: Average expenditure=Total written premium/liability car years. A car year is equal to 365 days of insured coverage for a single vehicle. The NAIC does not rank state average expenditures and does not endorse any conclusion drawn from these data.
Source: © 2020 National Association of Insurance Commissioners (NAIC).
Insurance Information Institute | www.ii i.org 2021 Insurance Fact Book 78
7. PROPERTY/CASUALTY INSURANCE BY LINEAuto: Costs/Expenditures
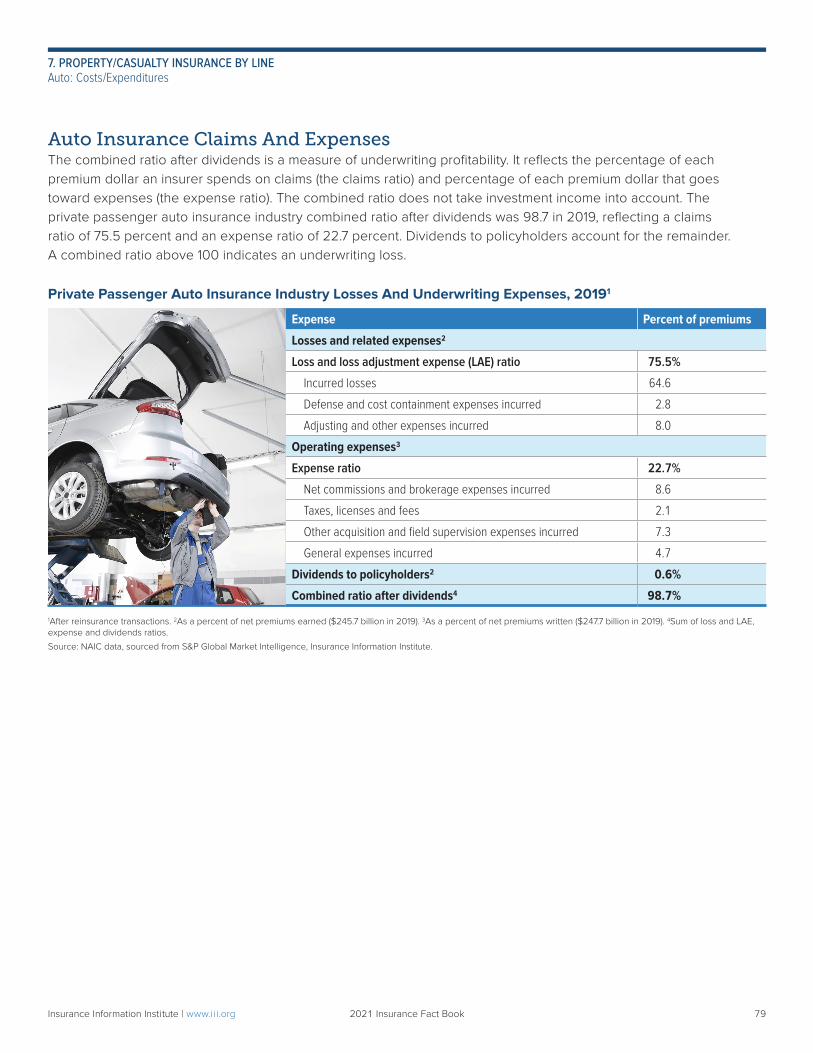
Auto Insurance Claims And ExpensesThe combined ratio after dividends is a measure of underwriting profitability. It reflects the percentage of each premium dollar an insurer spends on claims (the claims ratio) and percentage of each premium dollar that goes toward expenses (the expense ratio). The combined ratio does not take investment income into account. The private passenger auto insurance industry combined ratio after dividends was 98.7 in 2019, reflecting a claims ratio of 75.5 percent and an expense ratio of 22.7 percent. Dividends to policyholders account for the remainder. A combined ratio above 100 indicates an underwriting loss.
Private Passenger Auto Insurance Industry Losses And Underwriting Expenses, 20191
Expense Percent of premiums
Losses and related expenses2
Loss and loss adjustment expense (LAE) ratio 75.5%
Incurred losses 64.6
Defense and cost containment expenses incurred 2.8
Adjusting and other expenses incurred 8.0
Operating expenses3
Expense ratio 22.7%
Net commissions and brokerage expenses incurred 8.6
Taxes, licenses and fees 2.1
Other acquisition and field supervision expenses incurred 7.3
General expenses incurred 4.7
Dividends to policyholders2 0.6%
Combined ratio after dividends4 98.7%
1After reinsurance transactions. 2As a percent of net premiums earned ($245.7 billion in 2019). 3As a percent of net premiums written ($247.7 billion in 2019). 4Sum of loss and LAE, expense and dividends ratios.
Source: NAIC data, sourced from S&P Global Market Intelligence, Insurance Information Institute.
Insurance Information Institute | www.ii i.org 2021 Insurance Fact Book 79
7. PROPERTY/CASUALTY INSURANCE BY LINEAuto: Costs/Expenditures
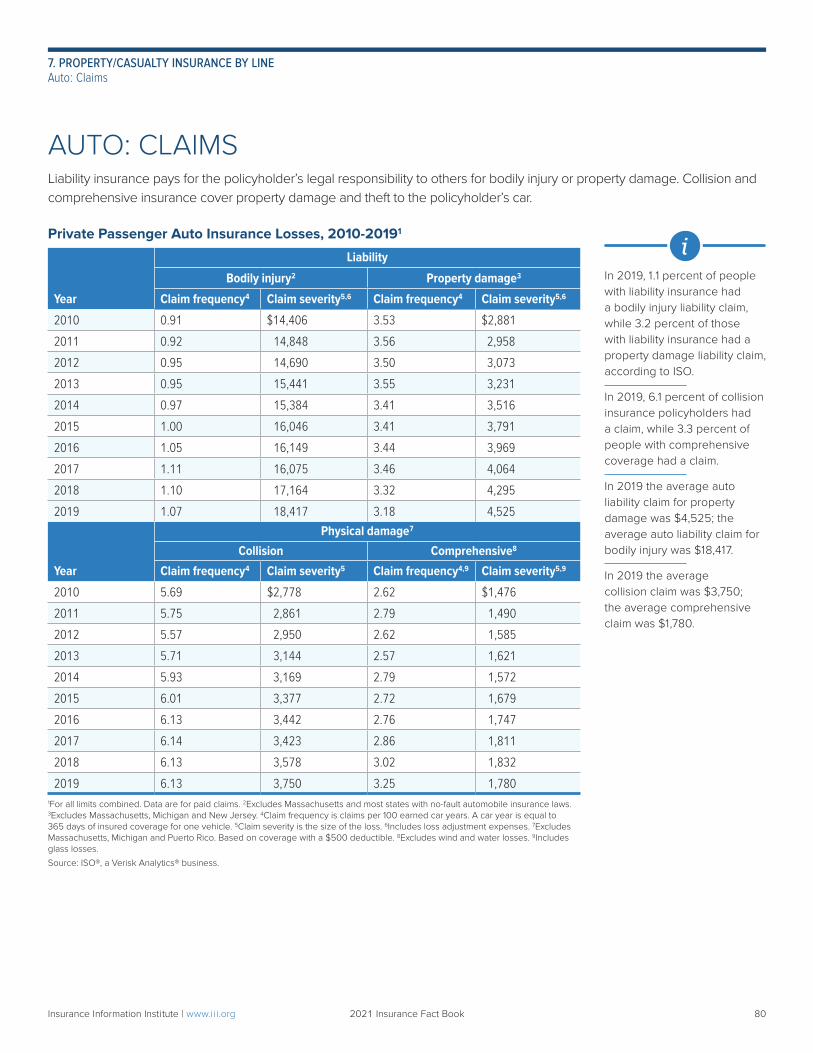
In 2019, 1.1 percent of people with liability insurance had a bodily injury liability claim, while 3.2 percent of those with liability insurance had a property damage liability claim, according to ISO.
In 2019, 6.1 percent of collision insurance policyholders had a claim, while 3.3 percent of people with comprehensive coverage had a claim.
In 2019 the average auto liability claim for property damage was $4,525; the average auto liability claim for bodily injury was $18,417.
In 2019 the average collision claim was $3,750; the average comprehensive claim was $1,780.
i
AUTO: CLAIMSLiability insurance pays for the policyholder’s legal responsibility to others for bodily injury or property damage. Collision and comprehensive insurance cover property damage and theft to the policyholder’s car.
Private Passenger Auto Insurance Losses, 2010-20191
Year
Liability
Bodily injury2 Property damage3
Claim frequency4 Claim severity5,6 Claim frequency4 Claim severity5,6
2010 0.91 $14,406 3.53 $2,881
2011 0.92 14,848 3.56 2,958
2012 0.95 14,690 3.50 3,073
2013 0.95 15,441 3.55 3,231
2014 0.97 15,384 3.41 3,516
2015 1.00 16,046 3.41 3,791
2016 1.05 16,149 3.44 3,969
2017 1.11 16,075 3.46 4,064
2018 1.10 17,164 3.32 4,295
2019 1.07 18,417 3.18 4,525
Year
Physical damage 7
Collision Comprehensive8
Claim frequency4 Claim severity5 Claim frequency4,9 Claim severity5,9
2010 5.69 $2,778 2.62 $1,476
2011 5.75 2,861 2.79 1,490
2012 5.57 2,950 2.62 1,585
2013 5.71 3,144 2.57 1,621
2014 5.93 3,169 2.79 1,572
2015 6.01 3,377 2.72 1,679
2016 6.13 3,442 2.76 1,747
2017 6.14 3,423 2.86 1,811
2018 6.13 3,578 3.02 1,832
2019 6.13 3,750 3.25 1,7801For all limits combined. Data are for paid claims. 2Excludes Massachusetts and most states with no-fault automobile insurance laws. 3Excludes Massachusetts, Michigan and New Jersey. 4Claim frequency is claims per 100 earned car years. A car year is equal to 365 days of insured coverage for one vehicle. 5Claim severity is the size of the loss. 6Includes loss adjustment expenses. 7Excludes Massachusetts, Michigan and Puerto Rico. Based on coverage with a $500 deductible. 8Excludes wind and water losses. 9Includes glass losses.
Source: ISO®, a Verisk Analytics® business.
Insurance Information Institute | www.ii i.org 2021 Insurance Fact Book 80
7. PROPERTY/CASUALTY INSURANCE BY LINEAuto: Claims
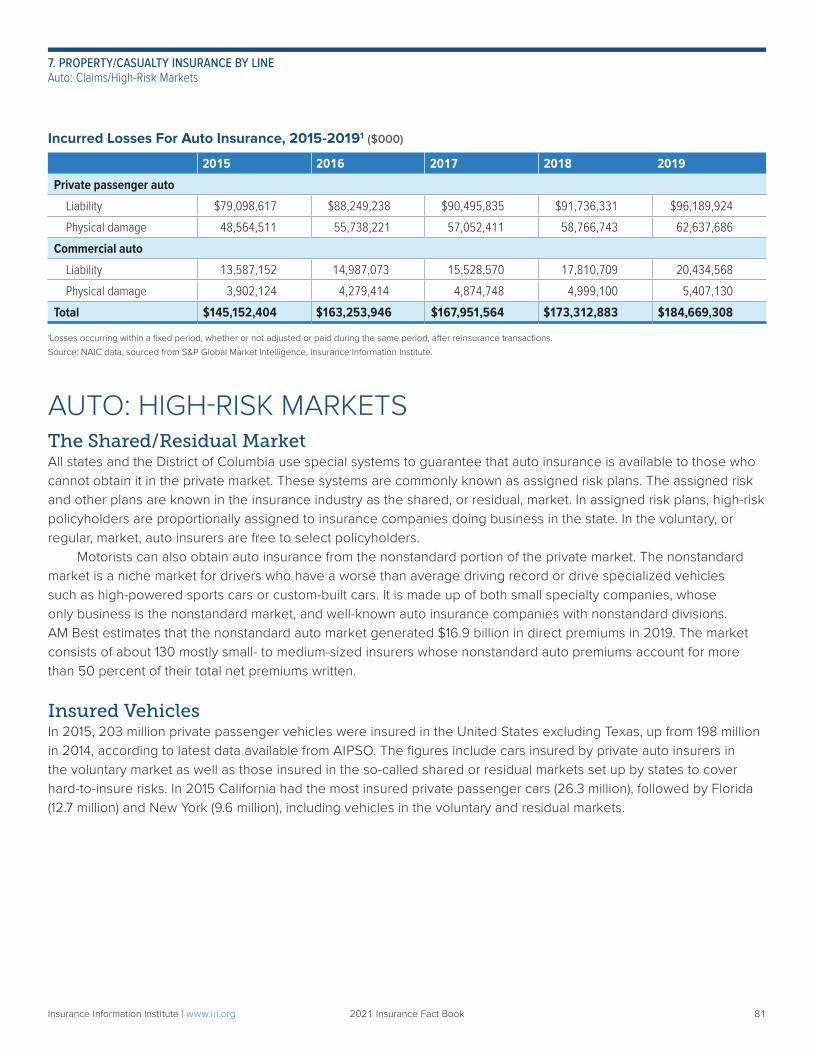
Incurred Losses For Auto Insurance, 2015-20191 ($000)
2015 2016 2017 2018 2019
Private passenger auto
Liability $79,098,617 $88,249,238 $90,495,835 $91,736,331 $96,189,924
Physical damage 48,564,511 55,738,221 57,052,411 58,766,743 62,637,686
Commercial auto
Liability 13,587,152 14,987,073 15,528,570 17,810,709 20,434,568
Physical damage 3,902,124 4,279,414 4,874,748 4,999,100 5,407,130
Total $145,152,404 $163,253,946 $167,951,564 $173,312,883 $184,669,308
1Losses occurring within a fixed period, whether or not adjusted or paid during the same period, after reinsurance transactions.
Source: NAIC data, sourced from S&P Global Market Intelligence, Insurance Information Institute.
AUTO: HIGH-RISK MARKETSThe Shared/Residual MarketAll states and the District of Columbia use special systems to guarantee that auto insurance is available to those who cannot obtain it in the private market. These systems are commonly known as assigned risk plans. The assigned risk and other plans are known in the insurance industry as the shared, or residual, market. In assigned risk plans, high-risk policyholders are proportionally assigned to insurance companies doing business in the state. In the voluntary, or regular, market, auto insurers are free to select policyholders. Motorists can also obtain auto insurance from the nonstandard portion of the private market. The nonstandard market is a niche market for drivers who have a worse than average driving record or drive specialized vehicles such as high-powered sports cars or custom-built cars. It is made up of both small specialty companies, whose only business is the nonstandard market, and well-known auto insurance companies with nonstandard divisions. AM Best estimates that the nonstandard auto market generated $16.9 billion in direct premiums in 2019. The market consists of about 130 mostly small- to medium-sized insurers whose nonstandard auto premiums account for more than 50 percent of their total net premiums written.
Insured VehiclesIn 2015, 203 million private passenger vehicles were insured in the United States excluding Texas, up from 198 million in 2014, according to latest data available from AIPSO. The figures include cars insured by private auto insurers in the voluntary market as well as those insured in the so-called shared or residual markets set up by states to cover hard-to-insure risks. In 2015 California had the most insured private passenger cars (26.3 million), followed by Florida (12.7 million) and New York (9.6 million), including vehicles in the voluntary and residual markets.
Insurance Information Institute | www.ii i.org 2021 Insurance Fact Book 81
7. PROPERTY/CASUALTY INSURANCE BY LINEAuto: Claims/High-Risk Markets
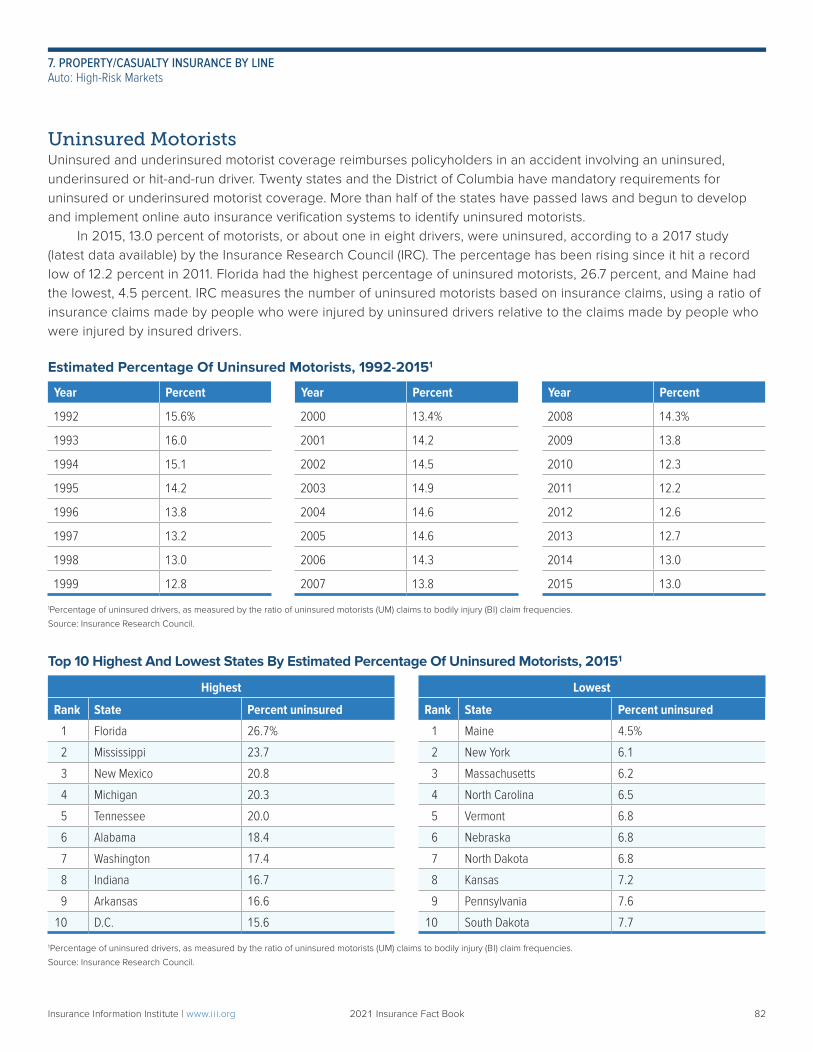
Uninsured MotoristsUninsured and underinsured motorist coverage reimburses policyholders in an accident involving an uninsured, underinsured or hit-and-run driver. Twenty states and the District of Columbia have mandatory requirements for uninsured or underinsured motorist coverage. More than half of the states have passed laws and begun to develop and implement online auto insurance verification systems to identify uninsured motorists. In 2015, 13.0 percent of motorists, or about one in eight drivers, were uninsured, according to a 2017 study (latest data available) by the Insurance Research Council (IRC). The percentage has been rising since it hit a record low of 12.2 percent in 2011. Florida had the highest percentage of uninsured motorists, 26.7 percent, and Maine had the lowest, 4.5 percent. IRC measures the number of uninsured motorists based on insurance claims, using a ratio of insurance claims made by people who were injured by uninsured drivers relative to the claims made by people who were injured by insured drivers.
Estimated Percentage Of Uninsured Motorists, 1992-20151
Year Percent Year Percent Year Percent
1992 15.6% 2000 13.4% 2008 14.3%
1993 16.0 2001 14.2 2009 13.8
1994 15.1 2002 14.5 2010 12.3
1995 14.2 2003 14.9 2011 12.2
1996 13.8 2004 14.6 2012 12.6
1997 13.2 2005 14.6 2013 12.7
1998 13.0 2006 14.3 2014 13.0
1999 12.8 2007 13.8 2015 13.0
1Percentage of uninsured drivers, as measured by the ratio of uninsured motorists (UM) claims to bodily injury (BI) claim frequencies.
Source: Insurance Research Council.
Top 10 Highest And Lowest States By Estimated Percentage Of Uninsured Motorists, 20151
Highest Lowest
Rank State Percent uninsured Rank State Percent uninsured
1 Florida 26.7% 1 Maine 4.5%
2 Mississippi 23.7 2 New York 6.1
3 New Mexico 20.8 3 Massachusetts 6.2
4 Michigan 20.3 4 North Carolina 6.5
5 Tennessee 20.0 5 Vermont 6.8
6 Alabama 18.4 6 Nebraska 6.8
7 Washington 17.4 7 North Dakota 6.8
8 Indiana 16.7 8 Kansas 7.2
9 Arkansas 16.6 9 Pennsylvania 7.6
10 D.C. 15.6 10 South Dakota 7.7
1Percentage of uninsured drivers, as measured by the ratio of uninsured motorists (UM) claims to bodily injury (BI) claim frequencies.
Source: Insurance Research Council.
Insurance Information Institute | www.ii i.org 2021 Insurance Fact Book 82
7. PROPERTY/CASUALTY INSURANCE BY LINEAuto: High-Risk Markets
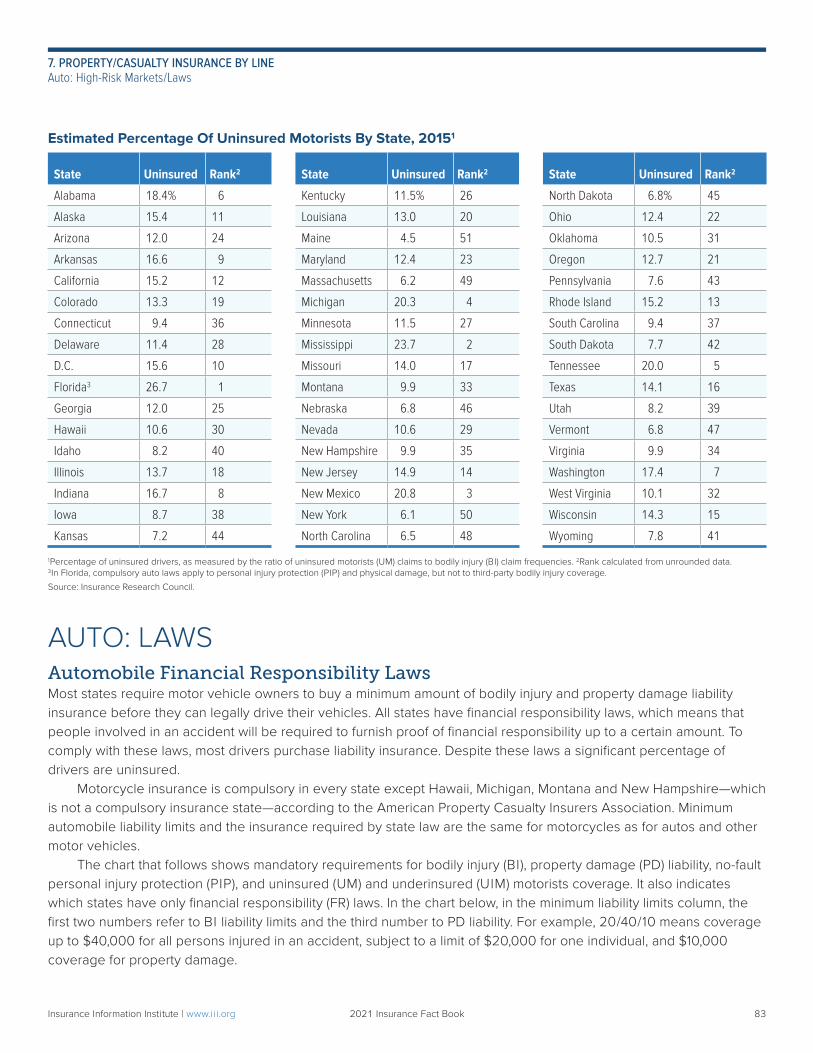
Estimated Percentage Of Uninsured Motorists By State, 20151
State Uninsured Rank2 State Uninsured Rank2 State Uninsured Rank2
Alabama 18.4% 6 Kentucky 11.5% 26 North Dakota 6.8% 45
Alaska 15.4 11 Louisiana 13.0 20 Ohio 12.4 22
Arizona 12.0 24 Maine 4.5 51 Oklahoma 10.5 31
Arkansas 16.6 9 Maryland 12.4 23 Oregon 12.7 21
California 15.2 12 Massachusetts 6.2 49 Pennsylvania 7.6 43
Colorado 13.3 19 Michigan 20.3 4 Rhode Island 15.2 13
Connecticut 9.4 36 Minnesota 11.5 27 South Carolina 9.4 37
Delaware 11.4 28 Mississippi 23.7 2 South Dakota 7.7 42
D.C. 15.6 10 Missouri 14.0 17 Tennessee 20.0 5
Florida3 26.7 1 Montana 9.9 33 Texas 14.1 16
Georgia 12.0 25 Nebraska 6.8 46 Utah 8.2 39
Hawaii 10.6 30 Nevada 10.6 29 Vermont 6.8 47
Idaho 8.2 40 New Hampshire 9.9 35 Virginia 9.9 34
Illinois 13.7 18 New Jersey 14.9 14 Washington 17.4 7
Indiana 16.7 8 New Mexico 20.8 3 West Virginia 10.1 32
Iowa 8.7 38 New York 6.1 50 Wisconsin 14.3 15
Kansas 7.2 44 North Carolina 6.5 48 Wyoming 7.8 41
1Percentage of uninsured drivers, as measured by the ratio of uninsured motorists (UM) claims to bodily injury (BI) claim frequencies. 2Rank calculated from unrounded data. 3In Florida, compulsory auto laws apply to personal injury protection (PIP) and physical damage, but not to third-party bodily injury coverage.
Source: Insurance Research Council.
AUTO: LAWSAutomobile Financial Responsibility LawsMost states require motor vehicle owners to buy a minimum amount of bodily injury and property damage liability insurance before they can legally drive their vehicles. All states have financial responsibility laws, which means that people involved in an accident will be required to furnish proof of financial responsibility up to a certain amount. To comply with these laws, most drivers purchase liability insurance. Despite these laws a significant percentage of drivers are uninsured. Motorcycle insurance is compulsory in every state except Hawaii, Michigan, Montana and New Hampshire—which is not a compulsory insurance state—according to the American Property Casualty Insurers Association. Minimum automobile liability limits and the insurance required by state law are the same for motorcycles as for autos and other motor vehicles. The chart that follows shows mandatory requirements for bodily injury (BI), property damage (PD) liability, no-fault personal injury protection (PIP), and uninsured (UM) and underinsured (UIM) motorists coverage. It also indicates which states have only financial responsibility (FR) laws. In the chart below, in the minimum liability limits column, the first two numbers refer to BI liability limits and the third number to PD liability. For example, 20/40/10 means coverage up to $40,000 for all persons injured in an accident, subject to a limit of $20,000 for one individual, and $10,000 coverage for property damage.
Insurance Information Institute | www.ii i.org 2021 Insurance Fact Book 83
7. PROPERTY/CASUALTY INSURANCE BY LINEAuto: High-Risk Markets/Laws
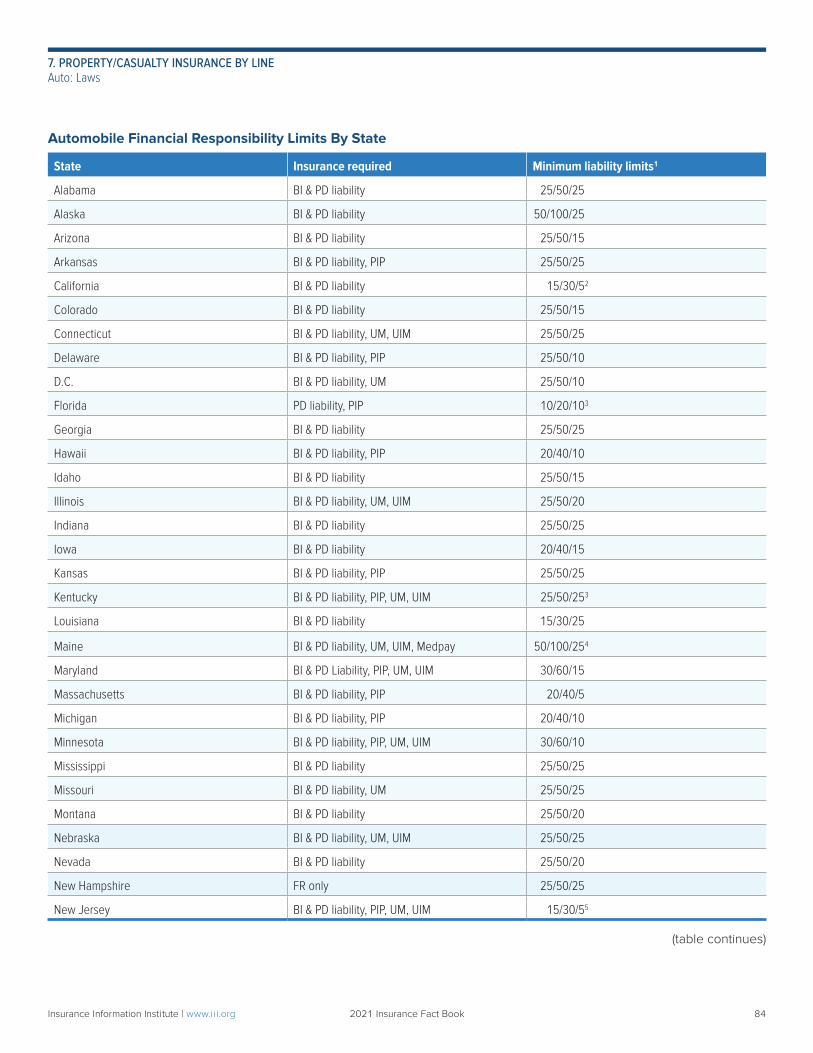
Automobile Financial Responsibility Limits By State
State Insurance required Minimum liability limits1
Alabama BI & PD liability 25/50/25
Alaska BI & PD liability 50/100/25
Arizona BI & PD liability 25/50/15
Arkansas BI & PD liability, PIP 25/50/25
California BI & PD liability 15/30/52
Colorado BI & PD liability 25/50/15
Connecticut BI & PD liability, UM, UIM 25/50/25
Delaware BI & PD liability, PIP 25/50/10
D.C. BI & PD liability, UM 25/50/10
Florida PD liability, PIP 10/20/103
Georgia BI & PD liability 25/50/25
Hawaii BI & PD liability, PIP 20/40/10
Idaho BI & PD liability 25/50/15
Illinois BI & PD liability, UM, UIM 25/50/20
Indiana BI & PD liability 25/50/25
Iowa BI & PD liability 20/40/15
Kansas BI & PD liability, PIP 25/50/25
Kentucky BI & PD liability, PIP, UM, UIM 25/50/253
Louisiana BI & PD liability 15/30/25
Maine BI & PD liability, UM, UIM, Medpay 50/100/254
Maryland BI & PD Liability, PIP, UM, UIM 30/60/15
Massachusetts BI & PD liability, PIP 20/40/5
Michigan BI & PD liability, PIP 20/40/10
Minnesota BI & PD liability, PIP, UM, UIM 30/60/10
Mississippi BI & PD liability 25/50/25
Missouri BI & PD liability, UM 25/50/25
Montana BI & PD liability 25/50/20
Nebraska BI & PD liability, UM, UIM 25/50/25
Nevada BI & PD liability 25/50/20
New Hampshire FR only 25/50/25
New Jersey BI & PD liability, PIP, UM, UIM 15/30/55
(table continues)
Insurance Information Institute | www.ii i.org 2021 Insurance Fact Book 84
7. PROPERTY/CASUALTY INSURANCE BY LINEAuto: Laws
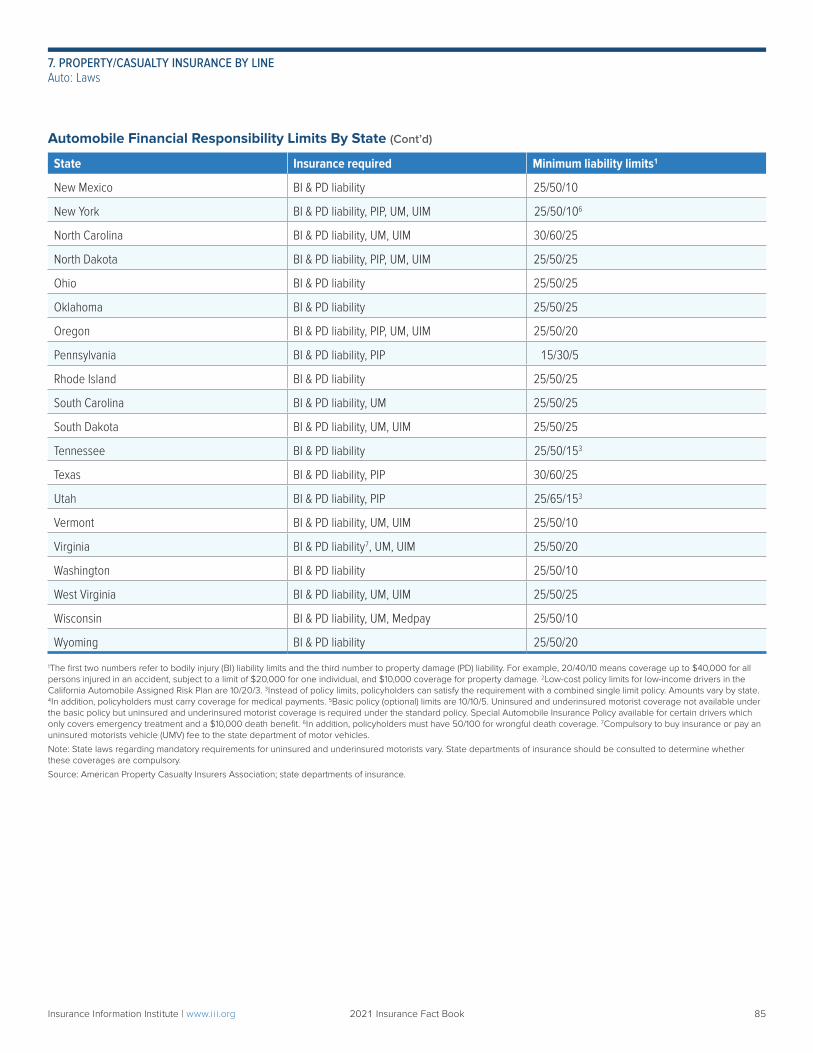
Automobile Financial Responsibility Limits By State (Cont’d)
State Insurance required Minimum liability limits1
New Mexico BI & PD liability 25/50/10
New York BI & PD liability, PIP, UM, UIM 25/50/106
North Carolina BI & PD liability, UM, UIM 30/60/25
North Dakota BI & PD liability, PIP, UM, UIM 25/50/25
Ohio BI & PD liability 25/50/25
Oklahoma BI & PD liability 25/50/25
Oregon BI & PD liability, PIP, UM, UIM 25/50/20
Pennsylvania BI & PD liability, PIP 15/30/5
Rhode Island BI & PD liability 25/50/25
South Carolina BI & PD liability, UM 25/50/25
South Dakota BI & PD liability, UM, UIM 25/50/25
Tennessee BI & PD liability 25/50/153
Texas BI & PD liability, PIP 30/60/25
Utah BI & PD liability, PIP 25/65/153
Vermont BI & PD liability, UM, UIM 25/50/10
Virginia BI & PD liability7, UM, UIM 25/50/20
Washington BI & PD liability 25/50/10
West Virginia BI & PD liability, UM, UIM 25/50/25
Wisconsin BI & PD liability, UM, Medpay 25/50/10
Wyoming BI & PD liability 25/50/20
1The first two numbers refer to bodily injury (BI) liability limits and the third number to property damage (PD) liability. For example, 20/40/10 means coverage up to $40,000 for all persons injured in an accident, subject to a limit of $20,000 for one individual, and $10,000 coverage for property damage. 2Low-cost policy limits for low-income drivers in the California Automobile Assigned Risk Plan are 10/20/3. 3Instead of policy limits, policyholders can satisfy the requirement with a combined single limit policy. Amounts vary by state. 4In addition, policyholders must carry coverage for medical payments. 5Basic policy (optional) limits are 10/10/5. Uninsured and underinsured motorist coverage not available under the basic policy but uninsured and underinsured motorist coverage is required under the standard policy. Special Automobile Insurance Policy available for certain drivers which only covers emergency treatment and a $10,000 death benefit. 6In addition, policyholders must have 50/100 for wrongful death coverage. 7Compulsory to buy insurance or pay an uninsured motorists vehicle (UMV) fee to the state department of motor vehicles.
Note: State laws regarding mandatory requirements for uninsured and underinsured motorists vary. State departments of insurance should be consulted to determine whether these coverages are compulsory.
Source: American Property Casualty Insurers Association; state departments of insurance.
Insurance Information Institute | www.ii i.org 2021 Insurance Fact Book 85
7. PROPERTY/CASUALTY INSURANCE BY LINEAuto: Laws
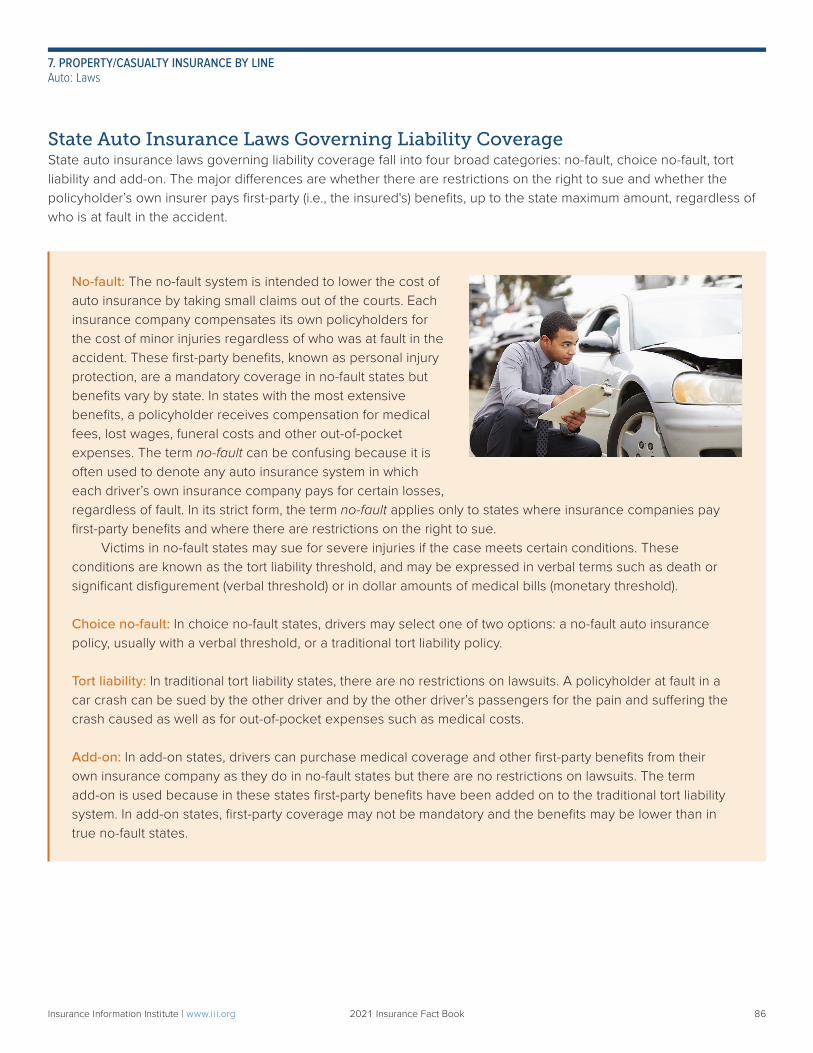
State Auto Insurance Laws Governing Liability CoverageState auto insurance laws governing liability coverage fall into four broad categories: no-fault, choice no-fault, tort liability and add-on. The major differences are whether there are restrictions on the right to sue and whether the policyholder’s own insurer pays first-party (i.e., the insured's) benefits, up to the state maximum amount, regardless of who is at fault in the accident.
No-fault: The no-fault system is intended to lower the cost of auto insurance by taking small claims out of the courts. Each insurance company compensates its own policyholders for the cost of minor injuries regardless of who was at fault in the accident. These first-party benefits, known as personal injury protection, are a mandatory coverage in no-fault states but benefits vary by state. In states with the most extensive benefits, a policyholder receives compensation for medical fees, lost wages, funeral costs and other out-of-pocket expenses. The term no-fault can be confusing because it is often used to denote any auto insurance system in which each driver’s own insurance company pays for certain losses, regardless of fault. In its strict form, the term no-fault applies only to states where insurance companies pay first-party benefits and where there are restrictions on the right to sue. Victims in no-fault states may sue for severe injuries if the case meets certain conditions. These conditions are known as the tort liability threshold, and may be expressed in verbal terms such as death or significant disfigurement (verbal threshold) or in dollar amounts of medical bills (monetary threshold).
Choice no-fault: In choice no-fault states, drivers may select one of two options: a no-fault auto insurance policy, usually with a verbal threshold, or a traditional tort liability policy.
Tort liability: In traditional tort liability states, there are no restrictions on lawsuits. A policyholder at fault in a car crash can be sued by the other driver and by the other driver’s passengers for the pain and suffering the crash caused as well as for out-of-pocket expenses such as medical costs.
Add-on: In add-on states, drivers can purchase medical coverage and other first-party benefits from their own insurance company as they do in no-fault states but there are no restrictions on lawsuits. The term add-on is used because in these states first-party benefits have been added on to the traditional tort liability system. In add-on states, first-party coverage may not be mandatory and the benefits may be lower than in true no-fault states.
Insurance Information Institute | www.ii i.org 2021 Insurance Fact Book 86
7. PROPERTY/CASUALTY INSURANCE BY LINEAuto: Laws
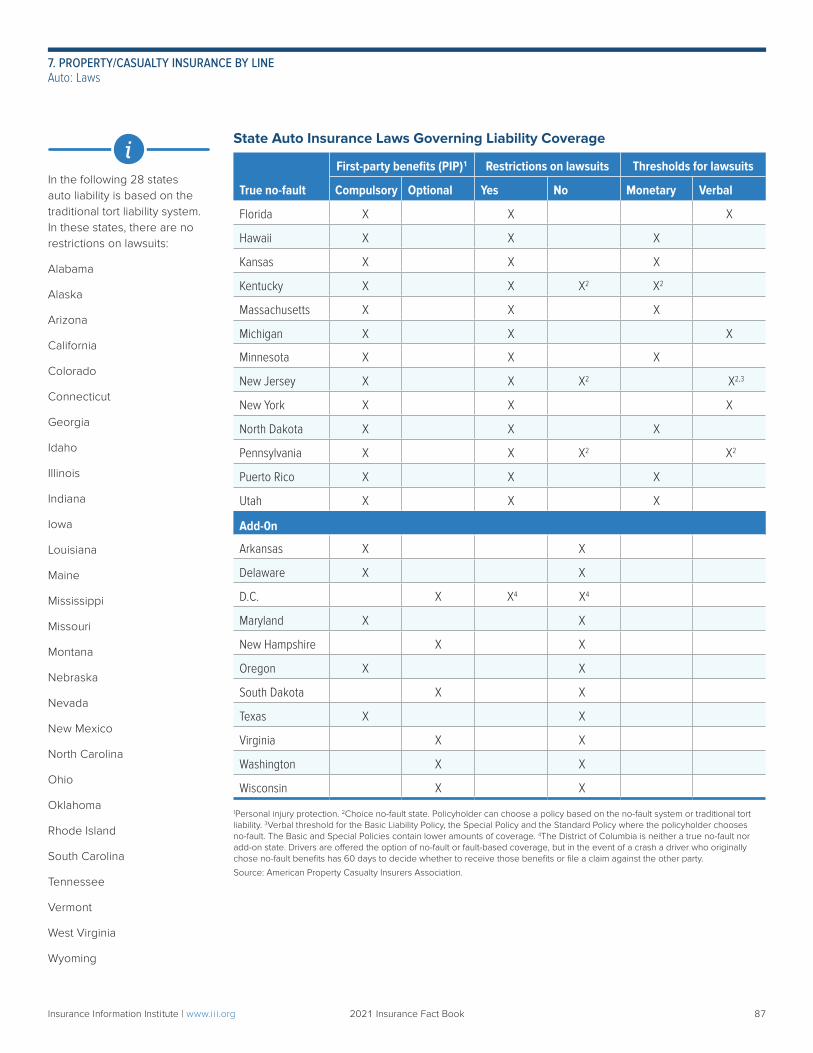
In the following 28 states auto liability is based on the traditional tort liability system. In these states, there are no restrictions on lawsuits:
Alabama
Alaska
Arizona
California
Colorado
Connecticut
Georgia
Idaho
Illinois
Indiana
Iowa
Louisiana
Maine
Mississippi
Missouri
Montana
Nebraska
Nevada
New Mexico
North Carolina
Ohio
Oklahoma
Rhode Island
South Carolina
Tennessee
Vermont
West Virginia
Wyoming
iState Auto Insurance Laws Governing Liability Coverage
First-party benefits (PIP)1 Restrictions on lawsuits Thresholds for lawsuits
True no-fault Compulsory Optional Yes No Monetary Verbal
Florida X X X
Hawaii X X X
Kansas X X X
Kentucky X X X2 X2
Massachusetts X X X
Michigan X X X
Minnesota X X X
New Jersey X X X2 X2,3
New York X X X
North Dakota X X X
Pennsylvania X X X2 X2
Puerto Rico X X X
Utah X X X
Add-0n
Arkansas X X
Delaware X X
D.C. X X4 X4
Maryland X X
New Hampshire X X
Oregon X X
South Dakota X X
Texas X X
Virginia X X
Washington X X
Wisconsin X X
1Personal injury protection. 2Choice no-fault state. Policyholder can choose a policy based on the no-fault system or traditional tort liability. 3Verbal threshold for the Basic Liability Policy, the Special Policy and the Standard Policy where the policyholder chooses no-fault. The Basic and Special Policies contain lower amounts of coverage. 4The District of Columbia is neither a true no-fault nor add-on state. Drivers are offered the option of no-fault or fault-based coverage, but in the event of a crash a driver who originally chose no-fault benefits has 60 days to decide whether to receive those benefits or file a claim against the other party.
Source: American Property Casualty Insurers Association.
Insurance Information Institute | www.ii i.org 2021 Insurance Fact Book 87
7. PROPERTY/CASUALTY INSURANCE BY LINEAuto: Laws
Seatbelt LawsThirty-four states and the District of Columbia have a primary seatbelt enforcement law, which allows law enforcement officers to stop a car for noncompliance with seatbelt laws. The other states have secondary laws; officials can only issue seatbelt violations if they stop motorists for other infractions. New Hampshire, the only state that does not have a seatbelt law that applies to adults, has a child restraint law. Seatbelts were in use 90.7 percent of the time nationwide in 2019, virtually unchanged from 89.6 percent in 2018, according to the National Highway Traffic Safety Administration (NHTSA). Generally, states with stronger seatbelt enforcement laws achieve higher rates of seatbelt use than states with weaker laws. State seat belt usage rates for 2019 published by NHTSA can be found here; details on state seatbelt laws published by the Insurance Institute for Highway Safety (IIHS) can be found here.
Impaired Driving LawsIn 2018, 10,511 people died in the United States in alcohol-impaired crashes, down 3.6 percent from 10,908 in 2017, according to the NHTSA. In 2018 alcohol-impaired crash fatalities accounted for 29 percent of all crash fatalities, the same proportion as in 2016 and 2017. NHTSA notes that this percentage is the lowest since 1982, when the Administration began recording alcohol data. Despite this improvement, the I IHS says that progress on alcohol- impaired driving has stalled, citing the fact that more than a quarter of all drivers who die in crashes in the United States have blood alcohol concentrations of 0.08 grams per deciliter or higher. More than 7,000 deaths could have been prevented in 2016 if all drivers were below the legal limit. Enforcement of existing laws and enacting laws such as mandating ignition interlocks and administrative license suspension are the most effective measures against impaired driving. For details on state laws curbing alcohol-impaired driving, see Facts + Statistics: Alcohol-impaired driving.
Alcohol Server Liability LawsMost states have enacted liquor liability laws which hold businesses and/or people who serve liquor liable for the damage a drunk driver causes. Forty-two states and the District of Columbia have laws or case law (law that comes about through a court ruling rather than an act of the legislature) that hold commercial servers of alcohol liable for the harm caused by their intoxicated patrons. Some of the laws have limitations. Thirty-eight states have enacted laws or have case law that permit social hosts who serve liquor to people who subsequently are involved in crashes to be held liable for any injury or death. These laws may have limited application, for example, many laws specify that the drinker must be obviously intoxicated. In some cases, the laws are only targeted at minors. For details on statutes or court cases holding alcoholic beverage servers liable by state, see Facts + Statistics: Alcohol-impaired driving.
Insurance Information Institute | www.ii i.org 2021 Insurance Fact Book 88
7. PROPERTY/CASUALTY INSURANCE BY LINEAuto: Laws
Older DriversIn 2018, 16 percent of the total U.S. resident population (52.4 million people) were 65 years old and older. That year 6,907 people age 65 and older were killed in traffic crashes, accounting for 19 percent of all traffic fatalities. Recognizing the need for older drivers to retain their mobility and independence, some states issue restricted licenses. Depending on ability, older drivers may be limited to driving during daylight hours or on non-freeway types of roads. In most states restrictions such as these can be placed on anyone’s drivers license regardless of age, if his or her medical condition warrants it. For details on state drivers license renewal laws including requirements for older drivers, see Background on: Older drivers.
Young DriversMotor vehicle crashes are the second leading cause of death among teens, according to the Centers for Disease Control’s Teen Driver Fact Sheet. According to the National Highway Traffic Safety Administration, 1,719 drivers between the ages of 15 to 20 died in motor vehicle crashes in 2018, down 7 percent from 1,844 in 2017. Drivers between the ages of 15 to 20 accounted for 8 percent of all drivers involved in fatal crashes in 2018. In contrast, young drivers accounted for 5.3 percent of total drivers in the United States. Twenty-four percent of drivers between the ages of 15 to 20 who were killed in motor vehicle crashes in 2018 had been drinking some amount of alcohol; 19 percent were alcohol- impaired, which is defined by a blood alcohol content of 0.08 grams
per deciliter or higher in most states. In 2018, 49 percent of drivers ages 15 to 20 involved in accidents were found not to be using a seatbelt or other restraint (in situations where the use of restraints was known).
Insurance Information Institute | www.ii i.org 2021 Insurance Fact Book 89
7. PROPERTY/CASUALTY INSURANCE BY LINEAuto: Laws
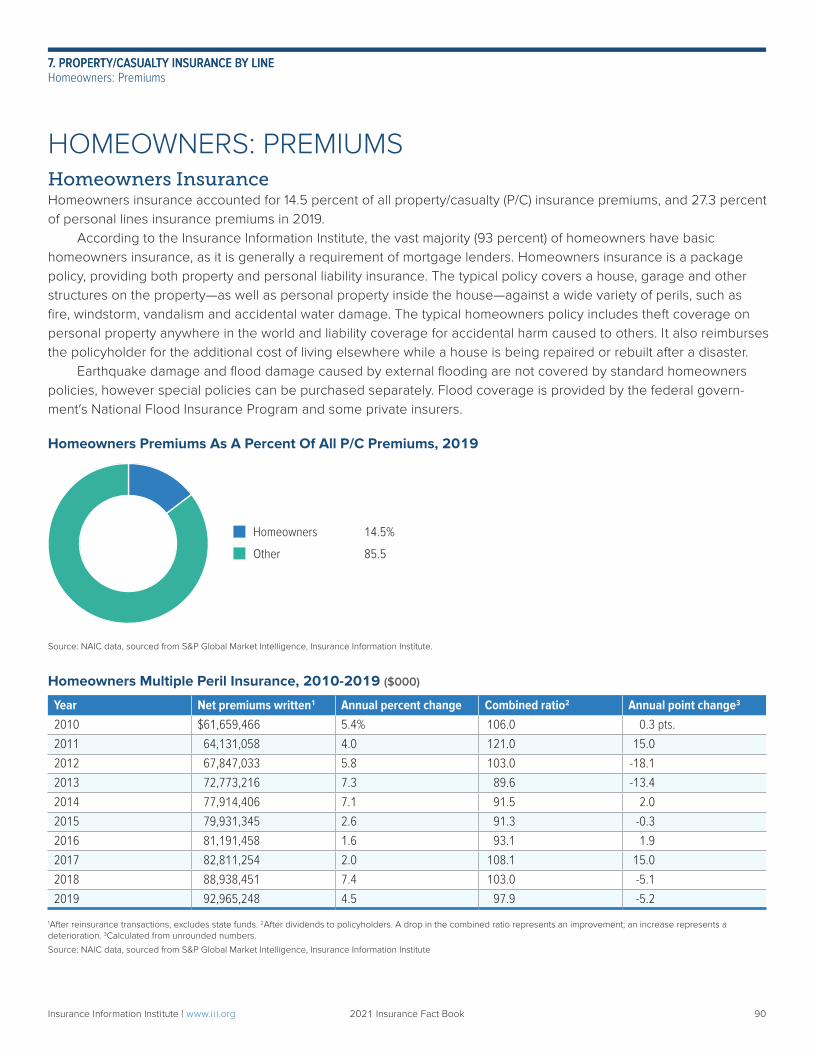
HOMEOWNERS: PREMIUMS Homeowners InsuranceHomeowners insurance accounted for 14.5 percent of all property/casualty (P/C) insurance premiums, and 27.3 percent of personal lines insurance premiums in 2019. According to the Insurance Information Institute, the vast majority (93 percent) of homeowners have basic homeowners insurance, as it is generally a requirement of mortgage lenders. Homeowners insurance is a package policy, providing both property and personal liability insurance. The typical policy covers a house, garage and other structures on the property—as well as personal property inside the house—against a wide variety of perils, such as fire, windstorm, vandalism and accidental water damage. The typical homeowners policy includes theft coverage on personal property anywhere in the world and liability coverage for accidental harm caused to others. It also reimburses the policyholder for the additional cost of living elsewhere while a house is being repaired or rebuilt after a disaster. Earthquake damage and flood damage caused by external flooding are not covered by standard homeowners policies, however special policies can be purchased separately. Flood coverage is provided by the federal govern-ment′s National Flood Insurance Program and some private insurers.
Homeowners Premiums As A Percent Of All P/C Premiums, 2019
Source: NAIC data, sourced from S&P Global Market Intelligence, Insurance Information Institute.
Homeowners Multiple Peril Insurance, 2010-2019 ($000)
Year Net premiums written1 Annual percent change Combined ratio2 Annual point change3
2010 $61,659,466 5.4% 106.0 0.3 pts.
2011 64,131,058 4.0 121.0 15.0
2012 67,847,033 5.8 103.0 -18.1
2013 72,773,216 7.3 89.6 -13.4
2014 77,914,406 7.1 91.5 2.0
2015 79,931,345 2.6 91.3 -0.3
2016 81,191,458 1.6 93.1 1.9
2017 82,811,254 2.0 108.1 15.0
2018 88,938,451 7.4 103.0 -5.1
2019 92,965,248 4.5 97.9 -5.2
1After reinsurance transactions, excludes state funds. 2After dividends to policyholders. A drop in the combined ratio represents an improvement; an increase represents a deterioration. 3Calculated from unrounded numbers.
Source: NAIC data, sourced from S&P Global Market Intelligence, Insurance Information Institute
Homeowners 14.5%
Other 85.5
7. PROPERTY/CASUALTY INSURANCE BY LINE
Insurance Information Institute | www.ii i.org 2021 Insurance Fact Book 90
7. PROPERTY/CASUALTY INSURANCE BY LINEHomeowners: Premiums
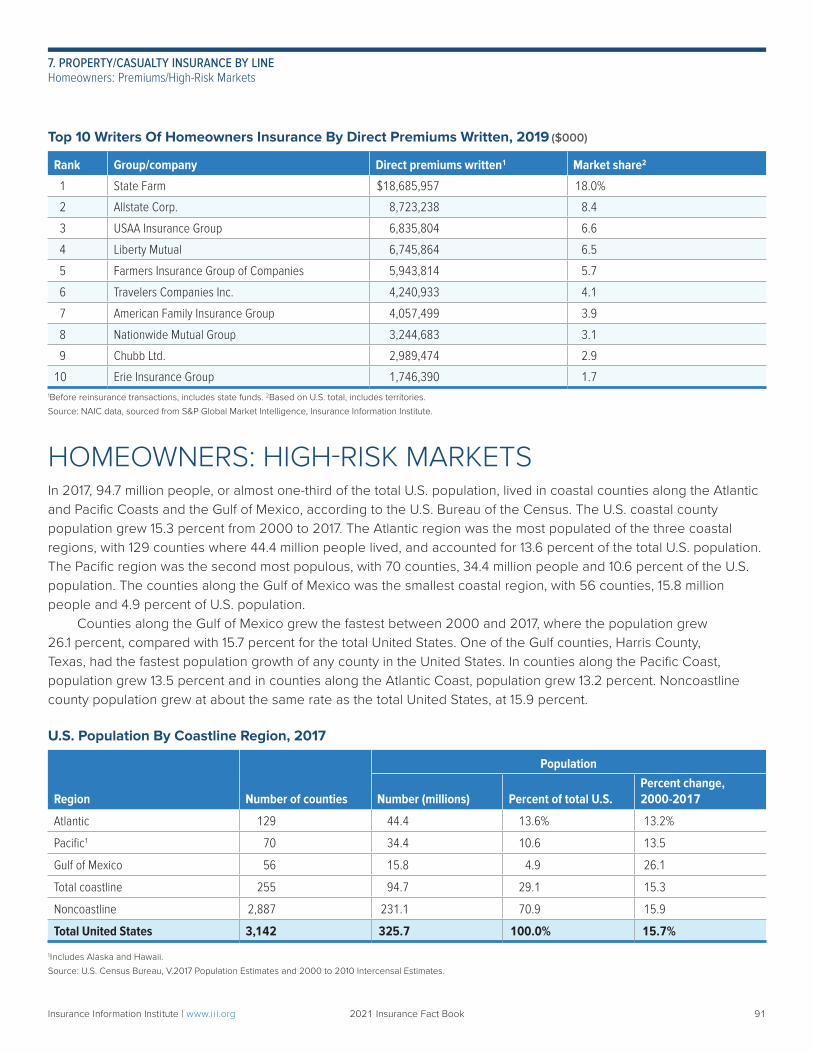
Top 10 Writers Of Homeowners Insurance By Direct Premiums Written, 2019 ($000)
Rank Group/company Direct premiums written1 Market share2
1 State Farm $18,685,957 18.0%
2 Allstate Corp. 8,723,238 8.4
3 USAA Insurance Group 6,835,804 6.6
4 Liberty Mutual 6,745,864 6.5
5 Farmers Insurance Group of Companies 5,943,814 5.7
6 Travelers Companies Inc. 4,240,933 4.1
7 American Family Insurance Group 4,057,499 3.9
8 Nationwide Mutual Group 3,244,683 3.1
9 Chubb Ltd. 2,989,474 2.9
10 Erie Insurance Group 1,746,390 1.71Before reinsurance transactions, includes state funds. 2Based on U.S. total, includes territories.
Source: NAIC data, sourced from S&P Global Market Intelligence, Insurance Information Institute.
HOMEOWNERS: HIGH-RISK MARKETSIn 2017, 94.7 million people, or almost one-third of the total U.S. population, lived in coastal counties along the Atlantic and Pacific Coasts and the Gulf of Mexico, according to the U.S. Bureau of the Census. The U.S. coastal county population grew 15.3 percent from 2000 to 2017. The Atlantic region was the most populated of the three coastal regions, with 129 counties where 44.4 million people lived, and accounted for 13.6 percent of the total U.S. population. The Pacific region was the second most populous, with 70 counties, 34.4 million people and 10.6 percent of the U.S. population. The counties along the Gulf of Mexico was the smallest coastal region, with 56 counties, 15.8 million people and 4.9 percent of U.S. population. Counties along the Gulf of Mexico grew the fastest between 2000 and 2017, where the population grew 26.1 percent, compared with 15.7 percent for the total United States. One of the Gulf counties, Harris County, Texas, had the fastest population growth of any county in the United States. In counties along the Pacific Coast, population grew 13.5 percent and in counties along the Atlantic Coast, population grew 13.2 percent. Noncoastline county population grew at about the same rate as the total United States, at 15.9 percent.
U.S. Population By Coastline Region, 2017
Population
Region Number of counties Number (millions) Percent of total U.S.Percent change, 2000-2017
Atlantic 129 44.4 13.6% 13.2%
Pacific1 70 34.4 10.6 13.5
Gulf of Mexico 56 15.8 4.9 26.1
Total coastline 255 94.7 29.1 15.3
Noncoastline 2,887 231.1 70.9 15.9
Total United States 3,142 325.7 100.0% 15.7%
1Includes Alaska and Hawaii.
Source: U.S. Census Bureau, V.2017 Population Estimates and 2000 to 2010 Intercensal Estimates.
Insurance Information Institute | www.ii i.org 2021 Insurance Fact Book 91
7. PROPERTY/CASUALTY INSURANCE BY LINEHomeowners: Premiums/High-Risk Markets
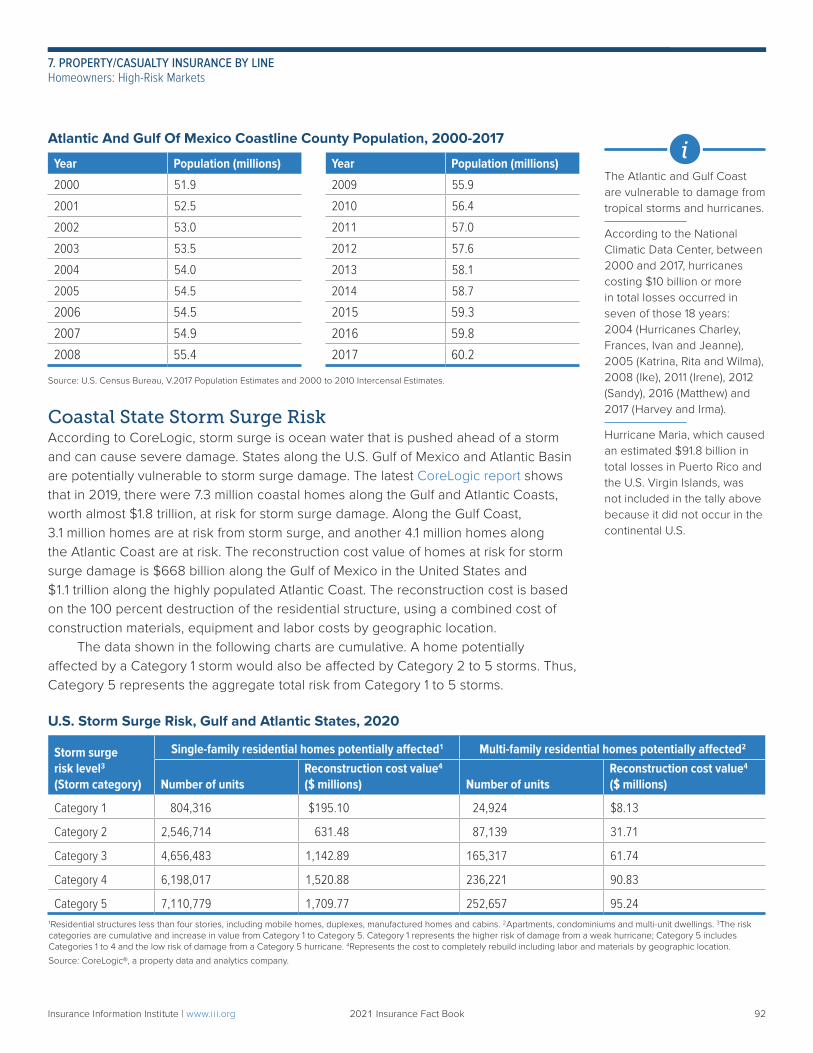
The Atlantic and Gulf Coast are vulnerable to damage from tropical storms and hurricanes.
According to the National Climatic Data Center, between 2000 and 2017, hurricanes costing $10 billion or more in total losses occurred in seven of those 18 years: 2004 (Hurricanes Charley, Frances, Ivan and Jeanne), 2005 (Katrina, Rita and Wilma), 2008 (Ike), 2011 (Irene), 2012 (Sandy), 2016 (Matthew) and 2017 (Harvey and Irma).
Hurricane Maria, which caused an estimated $91.8 billion in total losses in Puerto Rico and the U.S. Virgin Islands, was not included in the tally above because it did not occur in the continental U.S.
iAtlantic And Gulf Of Mexico Coastline County Population, 2000-2017
Year Population (millions) Year Population (millions)
2000 51.9 2009 55.9
2001 52.5 2010 56.4
2002 53.0 2011 57.0
2003 53.5 2012 57.6
2004 54.0 2013 58.1
2005 54.5 2014 58.7
2006 54.5 2015 59.3
2007 54.9 2016 59.8
2008 55.4 2017 60.2
Source: U.S. Census Bureau, V.2017 Population Estimates and 2000 to 2010 Intercensal Estimates.
Coastal State Storm Surge RiskAccording to CoreLogic, storm surge is ocean water that is pushed ahead of a storm and can cause severe damage. States along the U.S. Gulf of Mexico and Atlantic Basin are potentially vulnerable to storm surge damage. The latest CoreLogic report shows that in 2019, there were 7.3 million coastal homes along the Gulf and Atlantic Coasts, worth almost $1.8 trillion, at risk for storm surge damage. Along the Gulf Coast, 3.1 million homes are at risk from storm surge, and another 4.1 million homes along the Atlantic Coast are at risk. The reconstruction cost value of homes at risk for storm surge damage is $668 billion along the Gulf of Mexico in the United States and $1.1 trillion along the highly populated Atlantic Coast. The reconstruction cost is based on the 100 percent destruction of the residential structure, using a combined cost of construction materials, equipment and labor costs by geographic location. The data shown in the following charts are cumulative. A home potentially affected by a Category 1 storm would also be affected by Category 2 to 5 storms. Thus, Category 5 represents the aggregate total risk from Category 1 to 5 storms.
U.S. Storm Surge Risk, Gulf and Atlantic States, 2020
Storm surge risk level3 (Storm category)
Single-family residential homes potentially affected1 Multi-family residential homes potentially affected2
Number of unitsReconstruction cost value4 ($ millions) Number of units
Reconstruction cost value4 ($ millions)
Category 1 804,316 $195.10 24,924 $8.13
Category 2 2,546,714 631.48 87,139 31.71
Category 3 4,656,483 1,142.89 165,317 61.74
Category 4 6,198,017 1,520.88 236,221 90.83
Category 5 7,110,779 1,709.77 252,657 95.241Residential structures less than four stories, including mobile homes, duplexes, manufactured homes and cabins. 2Apartments, condominiums and multi-unit dwellings. 3The risk categories are cumulative and increase in value from Category 1 to Category 5. Category 1 represents the higher risk of damage from a weak hurricane; Category 5 includes Categories 1 to 4 and the low risk of damage from a Category 5 hurricane. 4Represents the cost to completely rebuild including labor and materials by geographic location.
Source: CoreLogic®, a property data and analytics company.
Insurance Information Institute | www.ii i.org 2021 Insurance Fact Book 92
7. PROPERTY/CASUALTY INSURANCE BY LINEHomeowners: High-Risk Markets
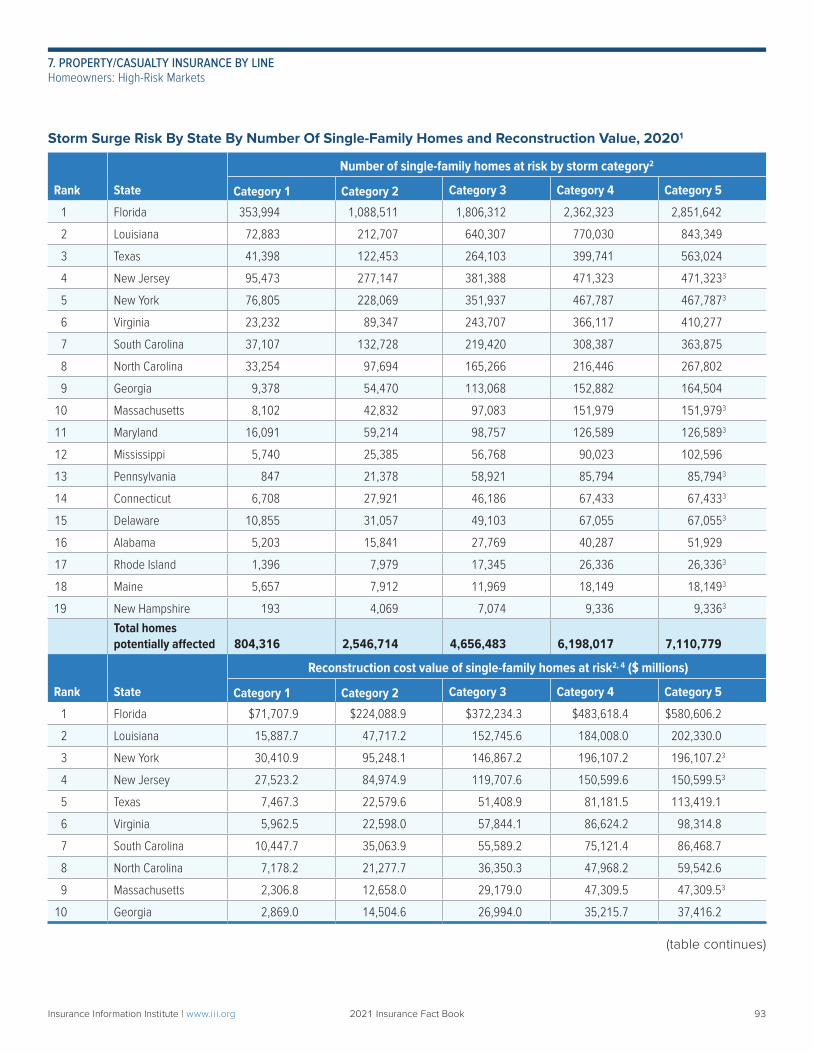
Storm Surge Risk By State By Number Of Single-Family Homes and Reconstruction Value, 20201
Number of single-family homes at risk by storm category2
Rank State Category 1 Category 2 Category 3 Category 4 Category 5
1 Florida 353,994 1,088,511 1,806,312 2,362,323 2,851,642
2 Louisiana 72,883 212,707 640,307 770,030 843,349
3 Texas 41,398 122,453 264,103 399,741 563,024
4 New Jersey 95,473 277,147 381,388 471,323 471,3233
5 New York 76,805 228,069 351,937 467,787 467,7873
6 Virginia 23,232 89,347 243,707 366,117 410,277
7 South Carolina 37,107 132,728 219,420 308,387 363,875
8 North Carolina 33,254 97,694 165,266 216,446 267,802
9 Georgia 9,378 54,470 113,068 152,882 164,504
10 Massachusetts 8,102 42,832 97,083 151,979 151,9793
11 Maryland 16,091 59,214 98,757 126,589 126,5893
12 Mississippi 5,740 25,385 56,768 90,023 102,596
13 Pennsylvania 847 21,378 58,921 85,794 85,7943
14 Connecticut 6,708 27,921 46,186 67,433 67,4333
15 Delaware 10,855 31,057 49,103 67,055 67,0553
16 Alabama 5,203 15,841 27,769 40,287 51,929
17 Rhode Island 1,396 7,979 17,345 26,336 26,3363
18 Maine 5,657 7,912 11,969 18,149 18,1493
19 New Hampshire 193 4,069 7,074 9,336 9,3363
Total homes potentially affected 804,316 2,546,714 4,656,483 6,198,017 7,110,779
Reconstruction cost value of single-family homes at risk2, 4 ($ millions)
Rank State Category 1 Category 2 Category 3 Category 4 Category 5
1 Florida $71,707.9 $224,088.9 $372,234.3 $483,618.4 $580,606.2
2 Louisiana 15,887.7 47,717.2 152,745.6 184,008.0 202,330.0
3 New York 30,410.9 95,248.1 146,867.2 196,107.2 196,107.23
4 New Jersey 27,523.2 84,974.9 119,707.6 150,599.6 150,599.53
5 Texas 7,467.3 22,579.6 51,408.9 81,181.5 113,419.1
6 Virginia 5,962.5 22,598.0 57,844.1 86,624.2 98,314.8
7 South Carolina 10,447.7 35,063.9 55,589.2 75,121.4 86,468.7
8 North Carolina 7,178.2 21,277.7 36,350.3 47,968.2 59,542.6
9 Massachusetts 2,306.8 12,658.0 29,179.0 47,309.5 47,309.53
10 Georgia 2,869.0 14,504.6 26,994.0 35,215.7 37,416.2
(table continues)
Insurance Information Institute | www.ii i.org 2021 Insurance Fact Book 93
7. PROPERTY/CASUALTY INSURANCE BY LINEHomeowners: High-Risk Markets
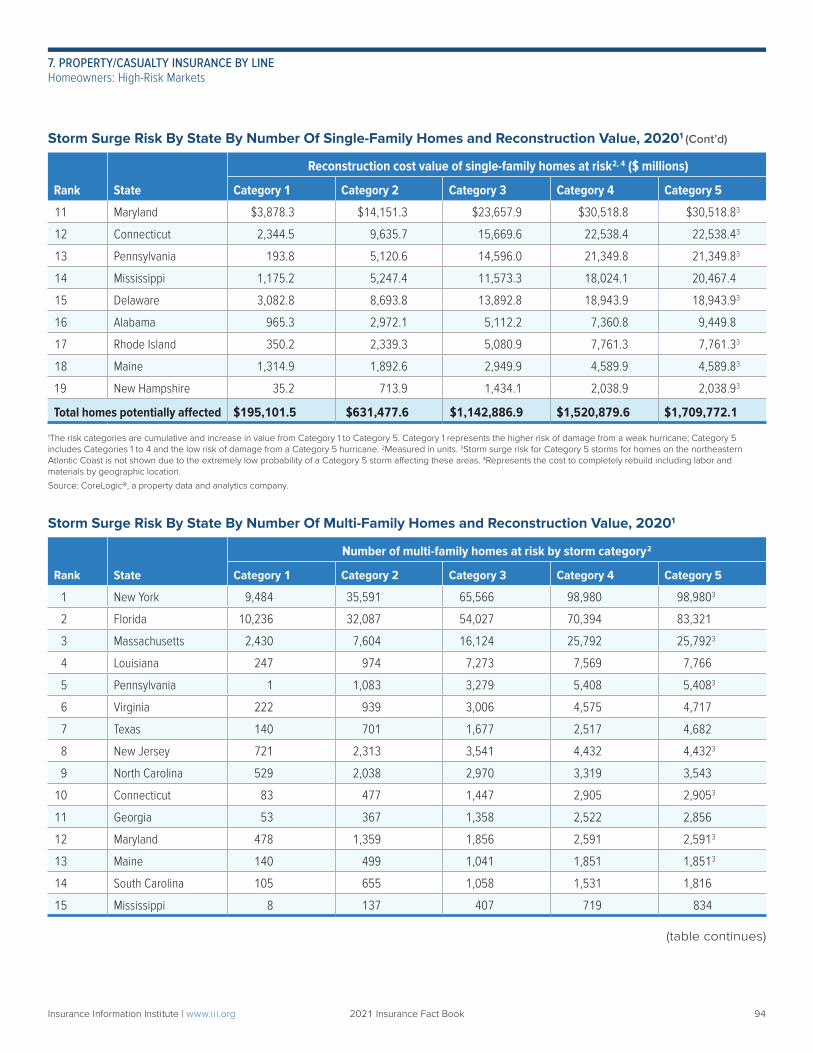
Storm Surge Risk By State By Number Of Single-Family Homes and Reconstruction Value, 20201 (Cont’d)
Reconstruction cost value of single-family homes at risk2, 4 ($ millions)
Rank State Category 1 Category 2 Category 3 Category 4 Category 5
11 Maryland $3,878.3 $14,151.3 $23,657.9 $30,518.8 $30,518.83
12 Connecticut 2,344.5 9,635.7 15,669.6 22,538.4 22,538.43
13 Pennsylvania 193.8 5,120.6 14,596.0 21,349.8 21,349.83
14 Mississippi 1,175.2 5,247.4 11,573.3 18,024.1 20,467.4
15 Delaware 3,082.8 8,693.8 13,892.8 18,943.9 18,943.93
16 Alabama 965.3 2,972.1 5,112.2 7,360.8 9,449.8
17 Rhode Island 350.2 2,339.3 5,080.9 7,761.3 7,761.33
18 Maine 1,314.9 1,892.6 2,949.9 4,589.9 4,589.83
19 New Hampshire 35.2 713.9 1,434.1 2,038.9 2,038.93
Total homes potentially affected $195,101.5 $631,477.6 $1,142,886.9 $1,520,879.6 $1,709,772.1
1The risk categories are cumulative and increase in value from Category 1 to Category 5. Category 1 represents the higher risk of damage from a weak hurricane; Category 5 includes Categories 1 to 4 and the low risk of damage from a Category 5 hurricane. 2Measured in units. 3Storm surge risk for Category 5 storms for homes on the northeastern Atlantic Coast is not shown due to the extremely low probability of a Category 5 storm affecting these areas. 4Represents the cost to completely rebuild including labor and materials by geographic location.
Source: CoreLogic®, a property data and analytics company.
Storm Surge Risk By State By Number Of Multi-Family Homes and Reconstruction Value, 20201
Number of multi-family homes at risk by storm category2
Rank State Category 1 Category 2 Category 3 Category 4 Category 5
1 New York 9,484 35,591 65,566 98,980 98,9803
2 Florida 10,236 32,087 54,027 70,394 83,321
3 Massachusetts 2,430 7,604 16,124 25,792 25,7923
4 Louisiana 247 974 7,273 7,569 7,766
5 Pennsylvania 1 1,083 3,279 5,408 5,4083
6 Virginia 222 939 3,006 4,575 4,717
7 Texas 140 701 1,677 2,517 4,682
8 New Jersey 721 2,313 3,541 4,432 4,4323
9 North Carolina 529 2,038 2,970 3,319 3,543
10 Connecticut 83 477 1,447 2,905 2,9053
11 Georgia 53 367 1,358 2,522 2,856
12 Maryland 478 1,359 1,856 2,591 2,5913
13 Maine 140 499 1,041 1,851 1,8513
14 South Carolina 105 655 1,058 1,531 1,816
15 Mississippi 8 137 407 719 834
(table continues)
Insurance Information Institute | www.ii i.org 2021 Insurance Fact Book 94
7. PROPERTY/CASUALTY INSURANCE BY LINEHomeowners: High-Risk Markets
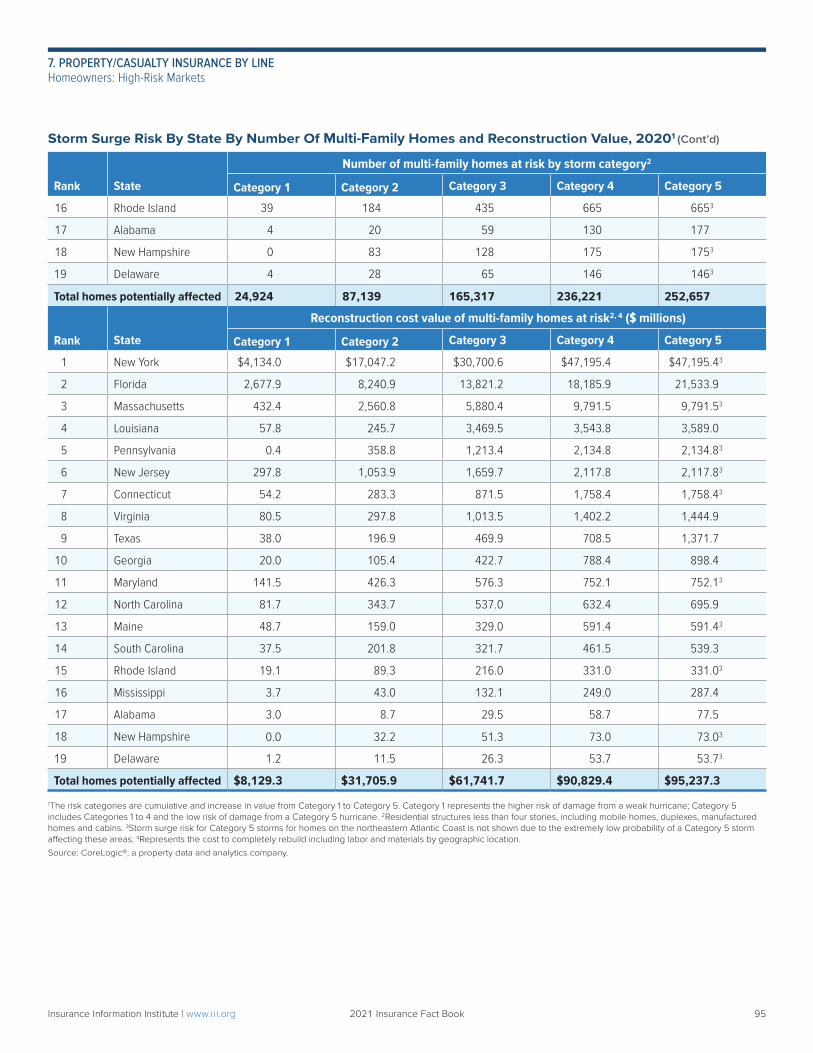
Storm Surge Risk By State By Number Of Multi-Family Homes and Reconstruction Value, 20201 (Cont’d)
Number of multi-family homes at risk by storm category2
Rank State Category 1 Category 2 Category 3 Category 4 Category 5
16 Rhode Island 39 184 435 665 6653
17 Alabama 4 20 59 130 177
18 New Hampshire 0 83 128 175 1753
19 Delaware 4 28 65 146 1463
Total homes potentially affected 24,924 87,139 165,317 236,221 252,657
Reconstruction cost value of multi-family homes at risk2, 4 ($ millions)
Rank State Category 1 Category 2 Category 3 Category 4 Category 5
1 New York $4,134.0 $17,047.2 $30,700.6 $47,195.4 $47,195.43
2 Florida 2,677.9 8,240.9 13,821.2 18,185.9 21,533.9
3 Massachusetts 432.4 2,560.8 5,880.4 9,791.5 9,791.53
4 Louisiana 57.8 245.7 3,469.5 3,543.8 3,589.0
5 Pennsylvania 0.4 358.8 1,213.4 2,134.8 2,134.83
6 New Jersey 297.8 1,053.9 1,659.7 2,117.8 2,117.83
7 Connecticut 54.2 283.3 871.5 1,758.4 1,758.43
8 Virginia 80.5 297.8 1,013.5 1,402.2 1,444.9
9 Texas 38.0 196.9 469.9 708.5 1,371.7
10 Georgia 20.0 105.4 422.7 788.4 898.4
11 Maryland 141.5 426.3 576.3 752.1 752.13
12 North Carolina 81.7 343.7 537.0 632.4 695.9
13 Maine 48.7 159.0 329.0 591.4 591.43
14 South Carolina 37.5 201.8 321.7 461.5 539.3
15 Rhode Island 19.1 89.3 216.0 331.0 331.03
16 Mississippi 3.7 43.0 132.1 249.0 287.4
17 Alabama 3.0 8.7 29.5 58.7 77.5
18 New Hampshire 0.0 32.2 51.3 73.0 73.03
19 Delaware 1.2 11.5 26.3 53.7 53.73
Total homes potentially affected $8,129.3 $31,705.9 $61,741.7 $90,829.4 $95,237.3
1The risk categories are cumulative and increase in value from Category 1 to Category 5. Category 1 represents the higher risk of damage from a weak hurricane; Category 5 includes Categories 1 to 4 and the low risk of damage from a Category 5 hurricane. 2Residential structures less than four stories, including mobile homes, duplexes, manufactured homes and cabins. 3Storm surge risk for Category 5 storms for homes on the northeastern Atlantic Coast is not shown due to the extremely low probability of a Category 5 storm affecting these areas. 4Represents the cost to completely rebuild including labor and materials by geographic location.Source: CoreLogic®, a property data and analytics company.
Insurance Information Institute | www.ii i.org 2021 Insurance Fact Book 95
7. PROPERTY/CASUALTY INSURANCE BY LINEHomeowners: High-Risk Markets
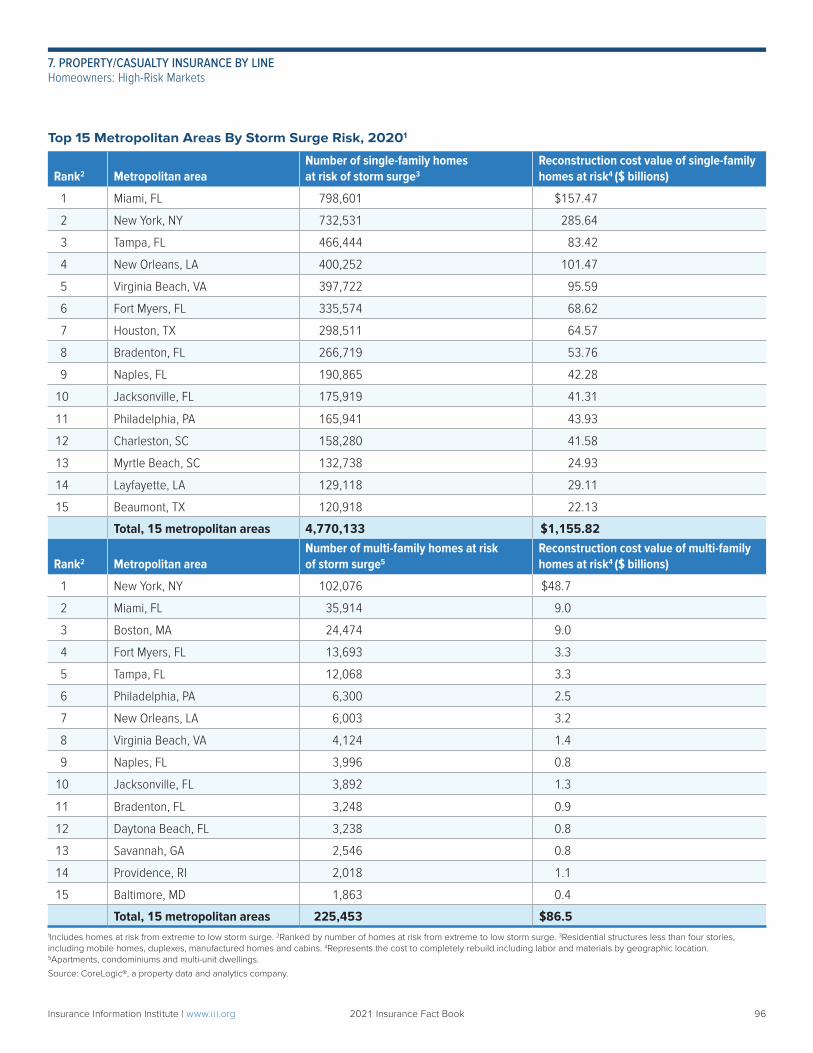
Top 15 Metropolitan Areas By Storm Surge Risk, 20201
Rank2 Metropolitan areaNumber of single-family homes at risk of storm surge3
Reconstruction cost value of single-family homes at risk4 ($ billions)
1 Miami, FL 798,601 $157.47
2 New York, NY 732,531 285.64
3 Tampa, FL 466,444 83.42
4 New Orleans, LA 400,252 101.47
5 Virginia Beach, VA 397,722 95.59
6 Fort Myers, FL 335,574 68.62
7 Houston, TX 298,511 64.57
8 Bradenton, FL 266,719 53.76
9 Naples, FL 190,865 42.28
10 Jacksonville, FL 175,919 41.31
11 Philadelphia, PA 165,941 43.93
12 Charleston, SC 158,280 41.58
13 Myrtle Beach, SC 132,738 24.93
14 Layfayette, LA 129,118 29.11
15 Beaumont, TX 120,918 22.13
Total, 15 metropolitan areas 4,770,133 $1,155.82
Rank2 Metropolitan areaNumber of multi-family homes at risk of storm surge5
Reconstruction cost value of multi-family homes at risk4 ($ billions)
1 New York, NY 102,076 $48.7
2 Miami, FL 35,914 9.0
3 Boston, MA 24,474 9.0
4 Fort Myers, FL 13,693 3.3
5 Tampa, FL 12,068 3.3
6 Philadelphia, PA 6,300 2.5
7 New Orleans, LA 6,003 3.2
8 Virginia Beach, VA 4,124 1.4
9 Naples, FL 3,996 0.8
10 Jacksonville, FL 3,892 1.3
11 Bradenton, FL 3,248 0.9
12 Daytona Beach, FL 3,238 0.8
13 Savannah, GA 2,546 0.8
14 Providence, RI 2,018 1.1
15 Baltimore, MD 1,863 0.4
Total, 15 metropolitan areas 225,453 $86.51Includes homes at risk from extreme to low storm surge. 2Ranked by number of homes at risk from extreme to low storm surge. 3Residential structures less than four stories, including mobile homes, duplexes, manufactured homes and cabins. 4Represents the cost to completely rebuild including labor and materials by geographic location. 5Apartments, condominiums and multi-unit dwellings.
Source: CoreLogic®, a property data and analytics company.
Insurance Information Institute | www.ii i.org 2021 Insurance Fact Book 96
7. PROPERTY/CASUALTY INSURANCE BY LINEHomeowners: High-Risk Markets
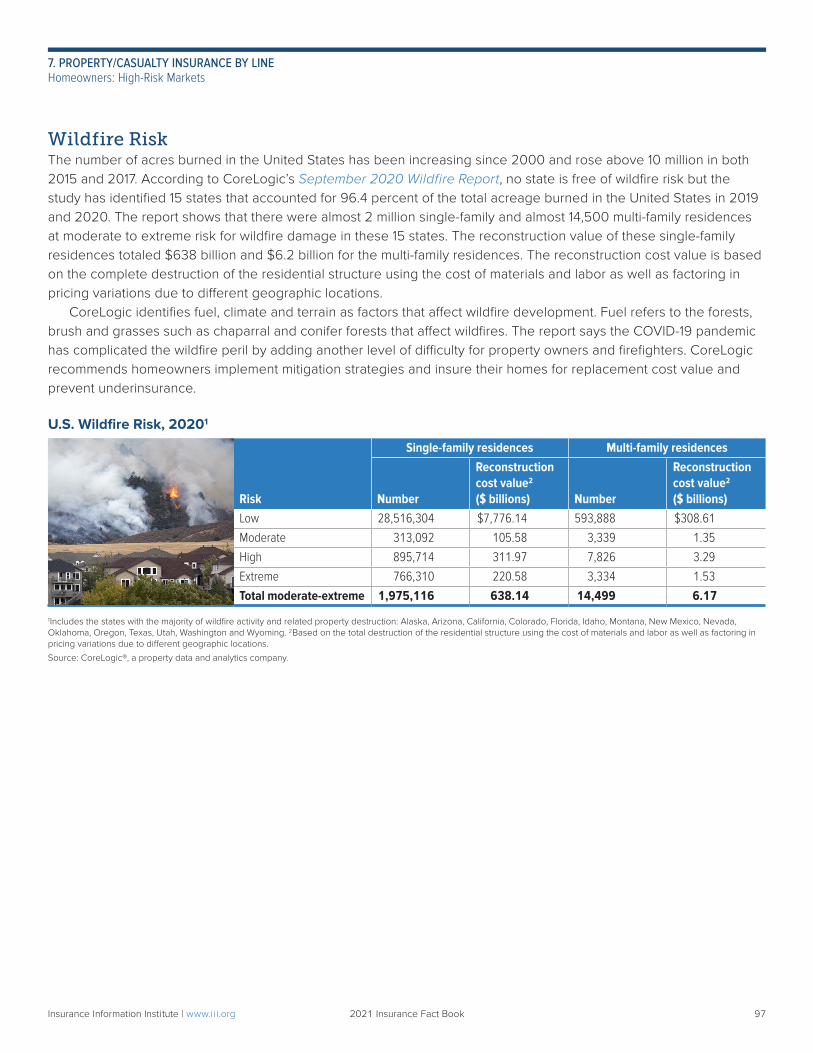
Wildfire RiskThe number of acres burned in the United States has been increasing since 2000 and rose above 10 million in both 2015 and 2017. According to CoreLogic’s September 2020 Wildfire Report, no state is free of wildfire risk but the study has identified 15 states that accounted for 96.4 percent of the total acreage burned in the United States in 2019 and 2020. The report shows that there were almost 2 million single-family and almost 14,500 multi-family residences at moderate to extreme risk for wildfire damage in these 15 states. The reconstruction value of these single-family residences totaled $638 billion and $6.2 billion for the multi-family residences. The reconstruction cost value is based on the complete destruction of the residential structure using the cost of materials and labor as well as factoring in pricing variations due to different geographic locations. CoreLogic identifies fuel, climate and terrain as factors that affect wildfire development. Fuel refers to the forests, brush and grasses such as chaparral and conifer forests that affect wildfires. The report says the COVID-19 pandemic has complicated the wildfire peril by adding another level of difficulty for property owners and firefighters. CoreLogic recommends homeowners implement mitigation strategies and insure their homes for replacement cost value and prevent underinsurance.
U.S. Wildfire Risk, 20201
Risk
Single-family residences Multi-family residences
Number
Reconstruction cost value2 ($ billions) Number
Reconstruction cost value2 ($ billions)
Low 28,516,304 $7,776.14 593,888 $308.61
Moderate 313,092 105.58 3,339 1.35
High 895,714 311.97 7,826 3.29
Extreme 766,310 220.58 3,334 1.53
Total moderate-extreme 1,975,116 638.14 14,499 6.17
1Includes the states with the majority of wildfire activity and related property destruction: Alaska, Arizona, California, Colorado, Florida, Idaho, Montana, New Mexico, Nevada, Oklahoma, Oregon, Texas, Utah, Washington and Wyoming. 2Based on the total destruction of the residential structure using the cost of materials and labor as well as factoring in pricing variations due to different geographic locations.
Source: CoreLogic®, a property data and analytics company.
Insurance Information Institute | www.ii i.org 2021 Insurance Fact Book 97
7. PROPERTY/CASUALTY INSURANCE BY LINEHomeowners: High-Risk Markets
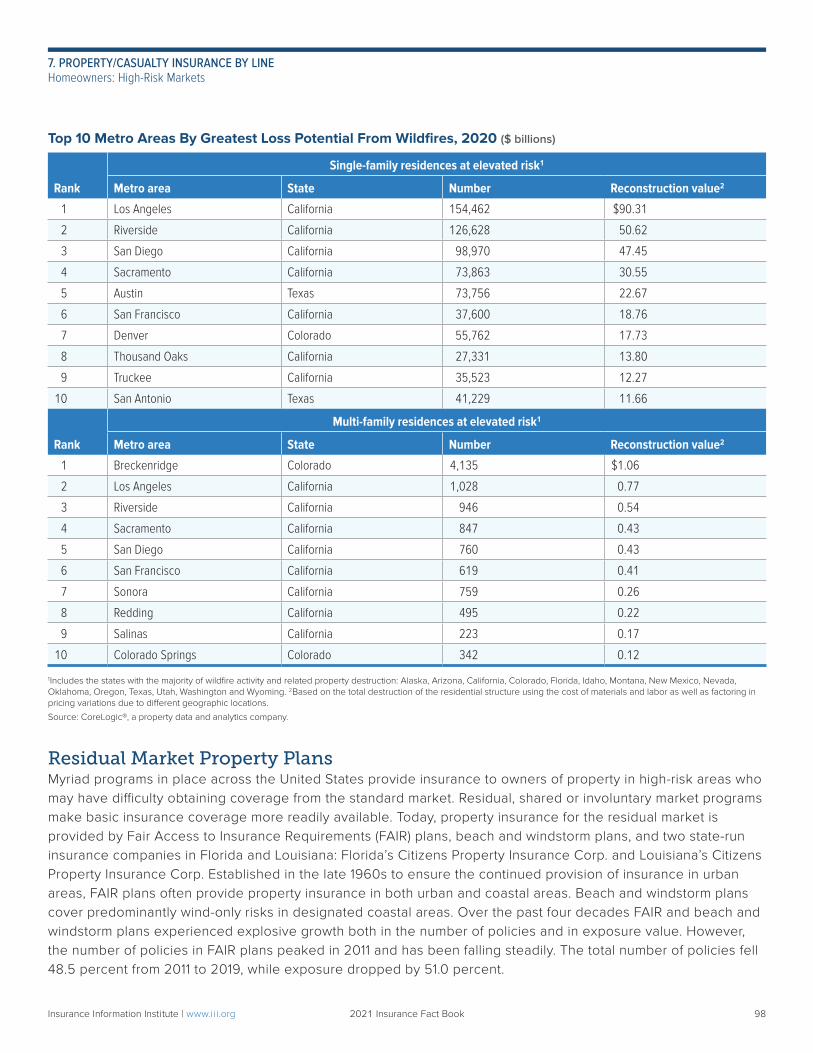
Top 10 Metro Areas By Greatest Loss Potential From Wildfires, 2020 ($ billions)
Single-family residences at elevated risk1
Rank Metro area State Number Reconstruction value2
1 Los Angeles California 154,462 $90.31
2 Riverside California 126,628 50.62
3 San Diego California 98,970 47.45
4 Sacramento California 73,863 30.55
5 Austin Texas 73,756 22.67
6 San Francisco California 37,600 18.76
7 Denver Colorado 55,762 17.73
8 Thousand Oaks California 27,331 13.80
9 Truckee California 35,523 12.27
10 San Antonio Texas 41,229 11.66
Multi-family residences at elevated risk1
Rank Metro area State Number Reconstruction value2
1 Breckenridge Colorado 4,135 $1.06
2 Los Angeles California 1,028 0.77
3 Riverside California 946 0.54
4 Sacramento California 847 0.43
5 San Diego California 760 0.43
6 San Francisco California 619 0.41
7 Sonora California 759 0.26
8 Redding California 495 0.22
9 Salinas California 223 0.17
10 Colorado Springs Colorado 342 0.12
1Includes the states with the majority of wildfire activity and related property destruction: Alaska, Arizona, California, Colorado, Florida, Idaho, Montana, New Mexico, Nevada, Oklahoma, Oregon, Texas, Utah, Washington and Wyoming. 2Based on the total destruction of the residential structure using the cost of materials and labor as well as factoring in pricing variations due to different geographic locations.
Source: CoreLogic®, a property data and analytics company.
Residual Market Property PlansMyriad programs in place across the United States provide insurance to owners of property in high-risk areas who may have difficulty obtaining coverage from the standard market. Residual, shared or involuntary market programs make basic insurance coverage more readily available. Today, property insurance for the residual market is provided by Fair Access to Insurance Requirements (FAIR) plans, beach and windstorm plans, and two state-run insurance companies in Florida and Louisiana: Florida’s Citizens Property Insurance Corp. and Louisiana’s Citizens Property Insurance Corp. Established in the late 1960s to ensure the continued provision of insurance in urban areas, FAIR plans often provide property insurance in both urban and coastal areas. Beach and windstorm plans cover predominantly wind-only risks in designated coastal areas. Over the past four decades FAIR and beach and windstorm plans experienced explosive growth both in the number of policies and in exposure value. However, the number of policies in FAIR plans peaked in 2011 and has been falling steadily. The total number of policies fell 48.5 percent from 2011 to 2019, while exposure dropped by 51.0 percent.
Insurance Information Institute | www.ii i.org 2021 Insurance Fact Book 98
7. PROPERTY/CASUALTY INSURANCE BY LINEHomeowners: High-Risk Markets
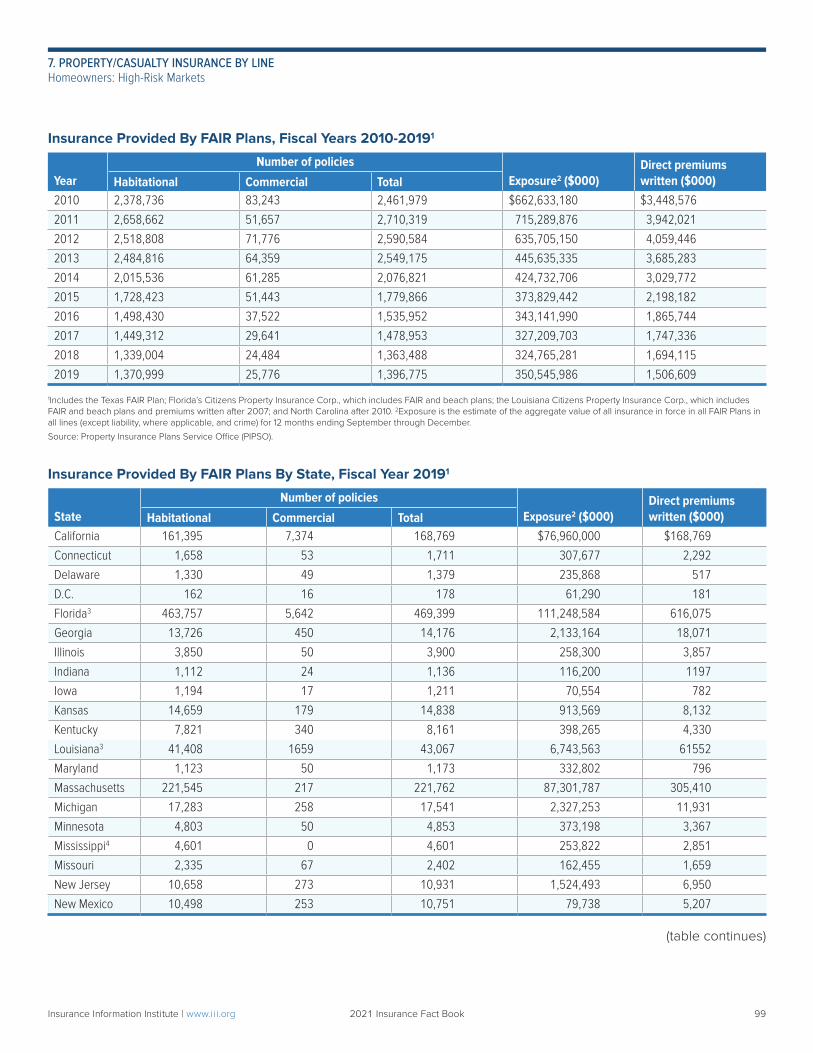
Insurance Provided By FAIR Plans, Fiscal Years 2010-20191
YearNumber of policies
Exposure2 ($000)Direct premiums written ($000)Habitational Commercial Total
2010 2,378,736 83,243 2,461,979 $662,633,180 $3,448,576
2011 2,658,662 51,657 2,710,319 715,289,876 3,942,021
2012 2,518,808 71,776 2,590,584 635,705,150 4,059,446
2013 2,484,816 64,359 2,549,175 445,635,335 3,685,283
2014 2,015,536 61,285 2,076,821 424,732,706 3,029,772
2015 1,728,423 51,443 1,779,866 373,829,442 2,198,182
2016 1,498,430 37,522 1,535,952 343,141,990 1,865,744
2017 1,449,312 29,641 1,478,953 327,209,703 1,747,336
2018 1,339,004 24,484 1,363,488 324,765,281 1,694,115
2019 1,370,999 25,776 1,396,775 350,545,986 1,506,609
1Includes the Texas FAIR Plan; Florida’s Citizens Property Insurance Corp., which includes FAIR and beach plans; the Louisiana Citizens Property Insurance Corp., which includes FAIR and beach plans and premiums written after 2007; and North Carolina after 2010. 2Exposure is the estimate of the aggregate value of all insurance in force in all FAIR Plans in all lines (except liability, where applicable, and crime) for 12 months ending September through December.
Source: Property Insurance Plans Service Office (PIPSO).
Insurance Provided By FAIR Plans By State, Fiscal Year 20191
StateNumber of policies
Exposure2 ($000)Direct premiums written ($000)Habitational Commercial Total
California 161,395 7,374 168,769 $76,960,000 $168,769
Connecticut 1,658 53 1,711 307,677 2,292
Delaware 1,330 49 1,379 235,868 517
D.C. 162 16 178 61,290 181
Florida3 463,757 5,642 469,399 111,248,584 616,075
Georgia 13,726 450 14,176 2,133,164 18,071
Illinois 3,850 50 3,900 258,300 3,857
Indiana 1,112 24 1,136 116,200 1197
Iowa 1,194 17 1,211 70,554 782
Kansas 14,659 179 14,838 913,569 8,132
Kentucky 7,821 340 8,161 398,265 4,330
Louisiana3 41,408 1659 43,067 6,743,563 61552
Maryland 1,123 50 1,173 332,802 796
Massachusetts 221,545 217 221,762 87,301,787 305,410
Michigan 17,283 258 17,541 2,327,253 11,931
Minnesota 4,803 50 4,853 373,198 3,367
Mississippi4 4,601 0 4,601 253,822 2,851
Missouri 2,335 67 2,402 162,455 1,659
New Jersey 10,658 273 10,931 1,524,493 6,950
New Mexico 10,498 253 10,751 79,738 5,207
(table continues)
Insurance Information Institute | www.ii i.org 2021 Insurance Fact Book 99
7. PROPERTY/CASUALTY INSURANCE BY LINEHomeowners: High-Risk Markets
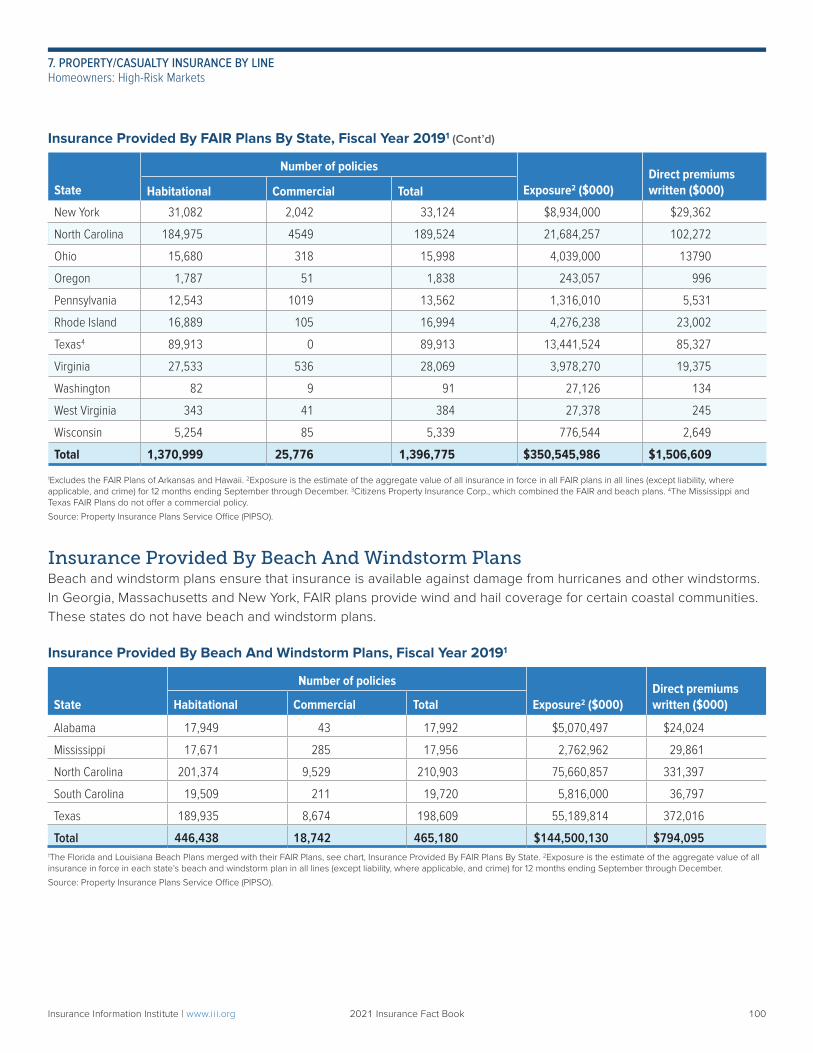
Insurance Provided By FAIR Plans By State, Fiscal Year 20191 (Cont’d)
State
Number of policies
Exposure2 ($000)Direct premiums written ($000)Habitational Commercial Total
New York 31,082 2,042 33,124 $8,934,000 $29,362
North Carolina 184,975 4549 189,524 21,684,257 102,272
Ohio 15,680 318 15,998 4,039,000 13790
Oregon 1,787 51 1,838 243,057 996
Pennsylvania 12,543 1019 13,562 1,316,010 5,531
Rhode Island 16,889 105 16,994 4,276,238 23,002
Texas4 89,913 0 89,913 13,441,524 85,327
Virginia 27,533 536 28,069 3,978,270 19,375
Washington 82 9 91 27,126 134
West Virginia 343 41 384 27,378 245
Wisconsin 5,254 85 5,339 776,544 2,649
Total 1,370,999 25,776 1,396,775 $350,545,986 $1,506,609
1Excludes the FAIR Plans of Arkansas and Hawaii. 2Exposure is the estimate of the aggregate value of all insurance in force in all FAIR plans in all lines (except liability, where applicable, and crime) for 12 months ending September through December. 3Citizens Property Insurance Corp., which combined the FAIR and beach plans. 4The Mississippi and Texas FAIR Plans do not offer a commercial policy.
Source: Property Insurance Plans Service Office (PIPSO).
Insurance Provided By Beach And Windstorm PlansBeach and windstorm plans ensure that insurance is available against damage from hurricanes and other windstorms. In Georgia, Massachusetts and New York, FAIR plans provide wind and hail coverage for certain coastal communities. These states do not have beach and windstorm plans.
Insurance Provided By Beach And Windstorm Plans, Fiscal Year 20191
State
Number of policies
Exposure2 ($000)Direct premiums written ($000)Habitational Commercial Total
Alabama 17,949 43 17,992 $5,070,497 $24,024
Mississippi 17,671 285 17,956 2,762,962 29,861
North Carolina 201,374 9,529 210,903 75,660,857 331,397
South Carolina 19,509 211 19,720 5,816,000 36,797
Texas 189,935 8,674 198,609 55,189,814 372,016
Total 446,438 18,742 465,180 $144,500,130 $794,0951The Florida and Louisiana Beach Plans merged with their FAIR Plans, see chart, Insurance Provided By FAIR Plans By State. 2Exposure is the estimate of the aggregate value of all insurance in force in each state’s beach and windstorm plan in all lines (except liability, where applicable, and crime) for 12 months ending September through December.
Source: Property Insurance Plans Service Office (PIPSO).
Insurance Information Institute | www.ii i.org 2021 Insurance Fact Book 100
7. PROPERTY/CASUALTY INSURANCE BY LINEHomeowners: High-Risk Markets
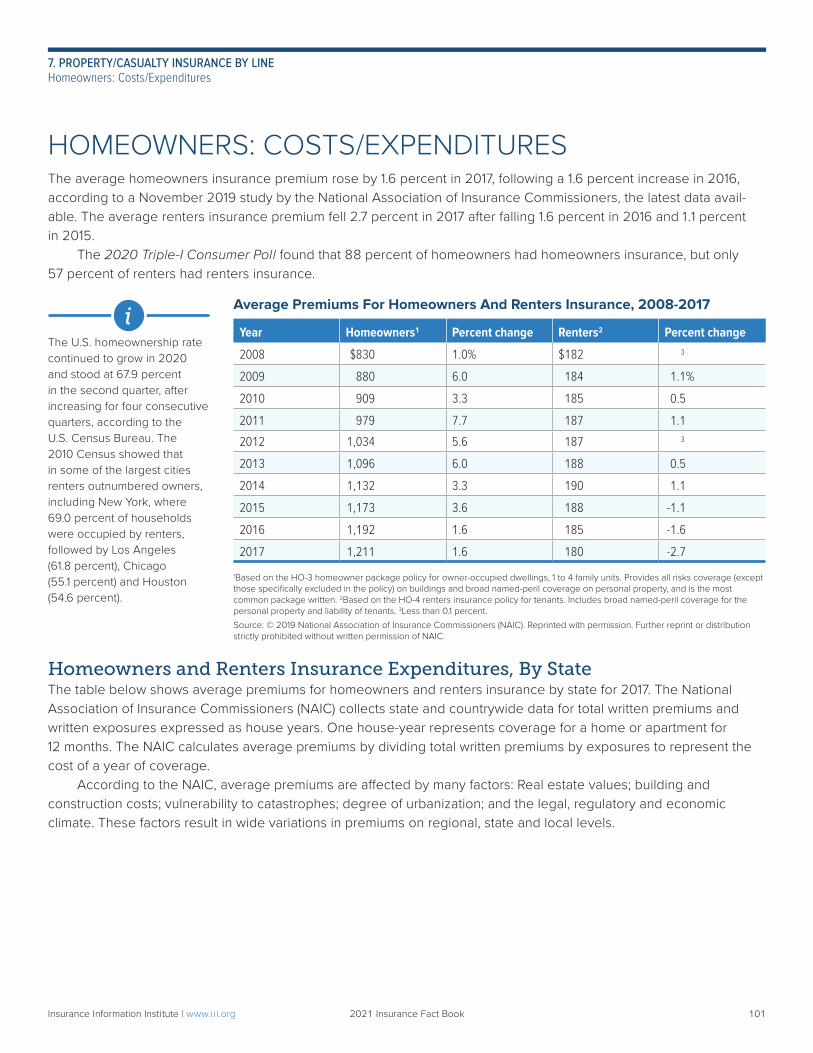
The U.S. homeownership rate continued to grow in 2020 and stood at 67.9 percent in the second quarter, after increasing for four consecutive quarters, according to the U.S. Census Bureau. The 2010 Census showed that in some of the largest cities renters outnumbered owners, including New York, where 69.0 percent of households were occupied by renters, followed by Los Angeles (61.8 percent), Chicago (55.1 percent) and Houston (54.6 percent).
i
HOMEOWNERS: COSTS/EXPENDITURESThe average homeowners insurance premium rose by 1.6 percent in 2017, following a 1.6 percent increase in 2016, according to a November 2019 study by the National Association of Insurance Commissioners, the latest data avail-able. The average renters insurance premium fell 2.7 percent in 2017 after falling 1.6 percent in 2016 and 1.1 percent in 2015. The 2020 Triple-I Consumer Poll found that 88 percent of homeowners had homeowners insurance, but only 57 percent of renters had renters insurance.
Average Premiums For Homeowners And Renters Insurance, 2008-2017
Year Homeowners1 Percent change Renters2 Percent change
2008 $830 1.0% $182 3
2009 880 6.0 184 1.1%
2010 909 3.3 185 0.5
2011 979 7.7 187 1.1
2012 1,034 5.6 187 3
2013 1,096 6.0 188 0.5
2014 1,132 3.3 190 1.1
2015 1,173 3.6 188 -1.1
2016 1,192 1.6 185 -1.6
2017 1,211 1.6 180 -2.7
1Based on the HO-3 homeowner package policy for owner-occupied dwellings, 1 to 4 family units. Provides all risks coverage (except those specifically excluded in the policy) on buildings and broad named-peril coverage on personal property, and is the most common package written. 2Based on the HO-4 renters insurance policy for tenants. Includes broad named-peril coverage for the personal property and liability of tenants. 3Less than 0.1 percent.
Source: © 2019 National Association of Insurance Commissioners (NAIC). Reprinted with permission. Further reprint or distribution strictly prohibited without written permission of NAIC.
Homeowners and Renters Insurance Expenditures, By StateThe table below shows average premiums for homeowners and renters insurance by state for 2017. The National Association of Insurance Commissioners (NAIC) collects state and countrywide data for total written premiums and written exposures expressed as house years. One house-year represents coverage for a home or apartment for 12 months. The NAIC calculates average premiums by dividing total written premiums by exposures to represent the cost of a year of coverage. According to the NAIC, average premiums are affected by many factors: Real estate values; building and construction costs; vulnerability to catastrophes; degree of urbanization; and the legal, regulatory and economic climate. These factors result in wide variations in premiums on regional, state and local levels.
Insurance Information Institute | www.ii i.org 2021 Insurance Fact Book 101
7. PROPERTY/CASUALTY INSURANCE BY LINEHomeowners: Costs/Expenditures
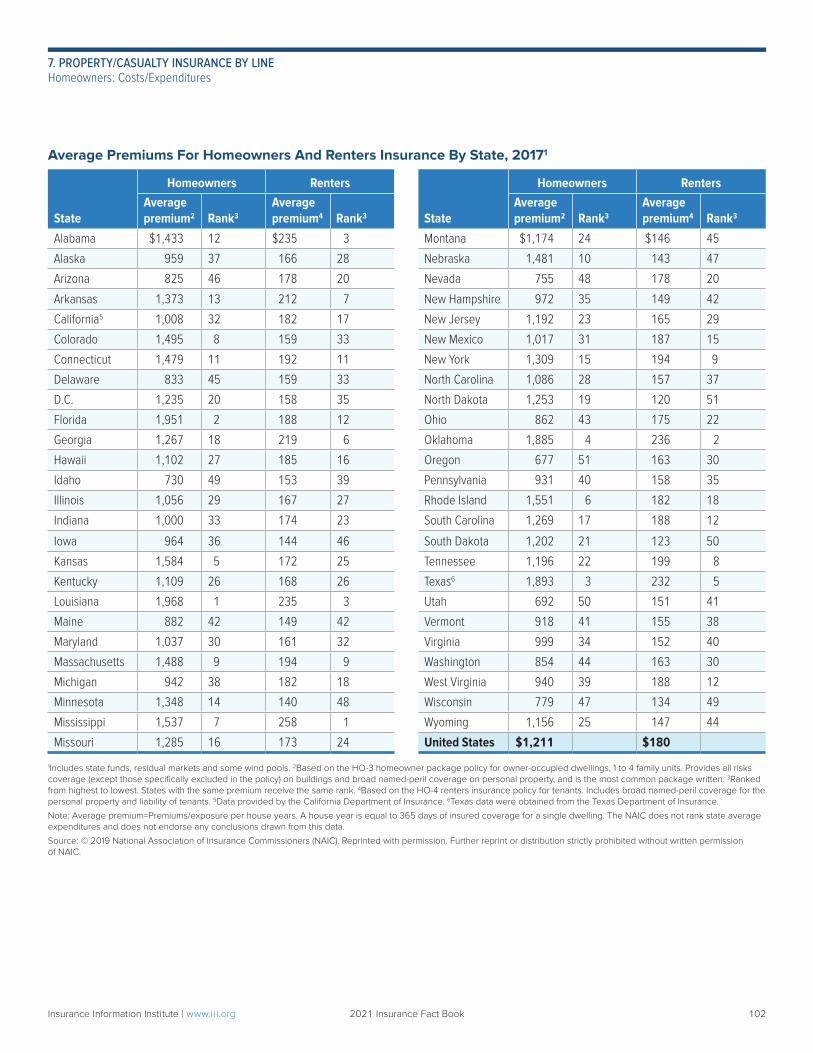
Average Premiums For Homeowners And Renters Insurance By State, 20171
State
Homeowners Renters
State
Homeowners RentersAverage premium2 Rank3
Average premium4 Rank3
Average premium2 Rank3
Average premium4 Rank3
Alabama $1,433 12 $235 3 Montana $1,174 24 $146 45
Alaska 959 37 166 28 Nebraska 1,481 10 143 47
Arizona 825 46 178 20 Nevada 755 48 178 20
Arkansas 1,373 13 212 7 New Hampshire 972 35 149 42
California5 1,008 32 182 17 New Jersey 1,192 23 165 29
Colorado 1,495 8 159 33 New Mexico 1,017 31 187 15
Connecticut 1,479 11 192 11 New York 1,309 15 194 9
Delaware 833 45 159 33 North Carolina 1,086 28 157 37
D.C. 1,235 20 158 35 North Dakota 1,253 19 120 51
Florida 1,951 2 188 12 Ohio 862 43 175 22
Georgia 1,267 18 219 6 Oklahoma 1,885 4 236 2
Hawaii 1,102 27 185 16 Oregon 677 51 163 30
Idaho 730 49 153 39 Pennsylvania 931 40 158 35
Illinois 1,056 29 167 27 Rhode Island 1,551 6 182 18
Indiana 1,000 33 174 23 South Carolina 1,269 17 188 12
Iowa 964 36 144 46 South Dakota 1,202 21 123 50
Kansas 1,584 5 172 25 Tennessee 1,196 22 199 8
Kentucky 1,109 26 168 26 Texas6 1,893 3 232 5
Louisiana 1,968 1 235 3 Utah 692 50 151 41
Maine 882 42 149 42 Vermont 918 41 155 38
Maryland 1,037 30 161 32 Virginia 999 34 152 40
Massachusetts 1,488 9 194 9 Washington 854 44 163 30
Michigan 942 38 182 18 West Virginia 940 39 188 12
Minnesota 1,348 14 140 48 Wisconsin 779 47 134 49
Mississippi 1,537 7 258 1 Wyoming 1,156 25 147 44
Missouri 1,285 16 173 24 United States $1,211 $180
1Includes state funds, residual markets and some wind pools. 2Based on the HO-3 homeowner package policy for owner-occupied dwellings, 1 to 4 family units. Provides all risks coverage (except those specifically excluded in the policy) on buildings and broad named-peril coverage on personal property, and is the most common package written. 3Ranked from highest to lowest. States with the same premium receive the same rank. 4Based on the HO-4 renters insurance policy for tenants. Includes broad named-peril coverage for the personal property and liability of tenants. 5Data provided by the California Department of Insurance. 6Texas data were obtained from the Texas Department of Insurance.
Note: Average premium=Premiums/exposure per house years. A house year is equal to 365 days of insured coverage for a single dwelling. The NAIC does not rank state average expenditures and does not endorse any conclusions drawn from this data.
Source: © 2019 National Association of Insurance Commissioners (NAIC). Reprinted with permission. Further reprint or distribution strictly prohibited without written permission of NAIC.
Insurance Information Institute | www.ii i.org 2021 Insurance Fact Book 102
7. PROPERTY/CASUALTY INSURANCE BY LINEHomeowners: Costs/Expenditures
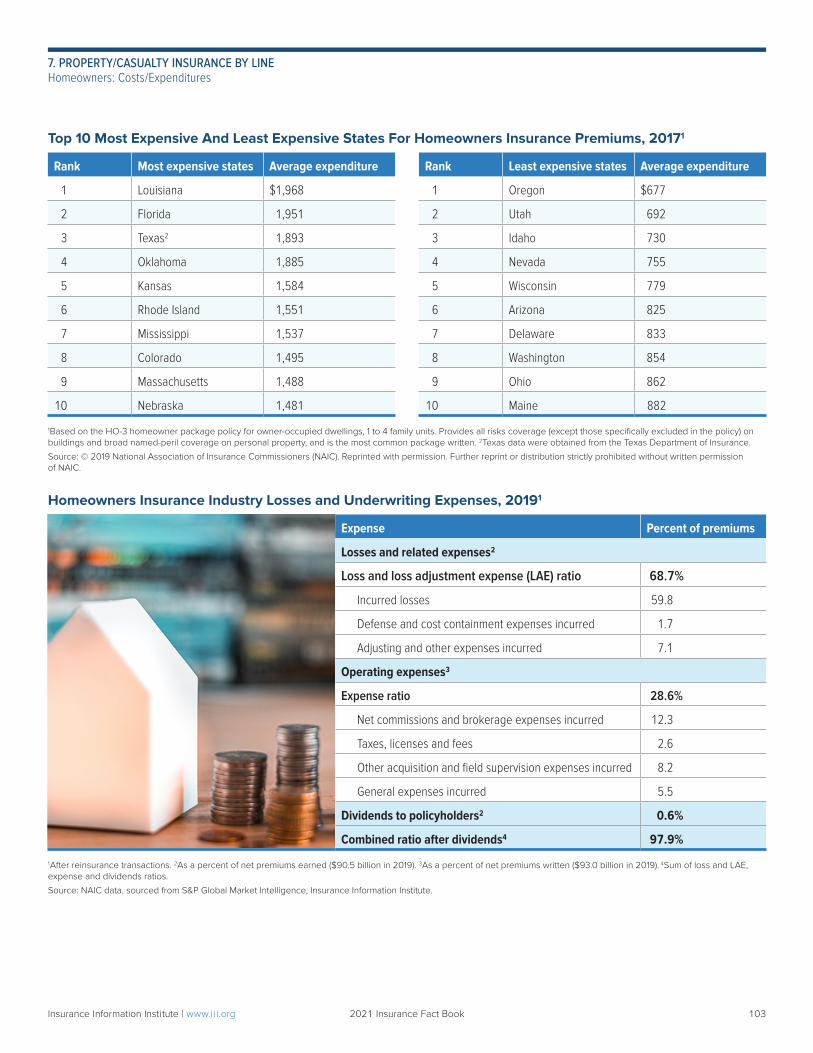
Top 10 Most Expensive And Least Expensive States For Homeowners Insurance Premiums, 20171
Rank Most expensive states Average expenditure Rank Least expensive states Average expenditure
1 Louisiana $1,968 1 Oregon $677
2 Florida 1,951 2 Utah 692
3 Texas2 1,893 3 Idaho 730
4 Oklahoma 1,885 4 Nevada 755
5 Kansas 1,584 5 Wisconsin 779
6 Rhode Island 1,551 6 Arizona 825
7 Mississippi 1,537 7 Delaware 833
8 Colorado 1,495 8 Washington 854
9 Massachusetts 1,488 9 Ohio 862
10 Nebraska 1,481 10 Maine 882
1Based on the HO-3 homeowner package policy for owner-occupied dwellings, 1 to 4 family units. Provides all risks coverage (except those specifically excluded in the policy) on buildings and broad named-peril coverage on personal property, and is the most common package written. 2Texas data were obtained from the Texas Department of Insurance.
Source: © 2019 National Association of Insurance Commissioners (NAIC). Reprinted with permission. Further reprint or distribution strictly prohibited without written permission of NAIC.
Homeowners Insurance Industry Losses and Underwriting Expenses, 20191
Expense Percent of premiums
Losses and related expenses2
Loss and loss adjustment expense (LAE) ratio 68.7%
Incurred losses 59.8
Defense and cost containment expenses incurred 1.7
Adjusting and other expenses incurred 7.1
Operating expenses3
Expense ratio 28.6%
Net commissions and brokerage expenses incurred 12.3
Taxes, licenses and fees 2.6
Other acquisition and field supervision expenses incurred 8.2
General expenses incurred 5.5
Dividends to policyholders2 0.6%
Combined ratio after dividends4 97.9%
1After reinsurance transactions. 2As a percent of net premiums earned ($90.5 billion in 2019). 3As a percent of net premiums written ($93.0 billion in 2019). 4Sum of loss and LAE, expense and dividends ratios.
Source: NAIC data, sourced from S&P Global Market Intelligence, Insurance Information Institute.
Insurance Information Institute | www.ii i.org 2021 Insurance Fact Book 103
7. PROPERTY/CASUALTY INSURANCE BY LINEHomeowners: Costs/Expenditures
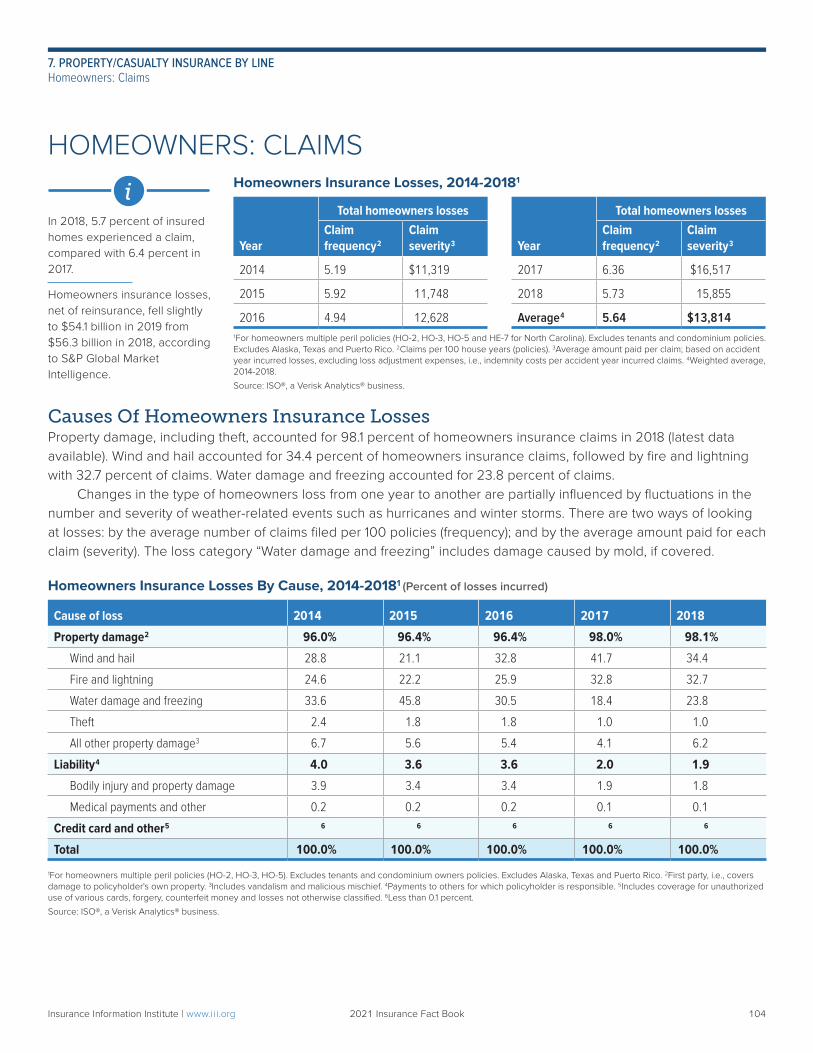
In 2018, 5.7 percent of insured homes experienced a claim, compared with 6.4 percent in 2017.
Homeowners insurance losses, net of reinsurance, fell slightly to $54.1 billion in 2019 from $56.3 billion in 2018, according to S&P Global Market Intelligence.
i
Causes Of Homeowners Insurance LossesProperty damage, including theft, accounted for 98.1 percent of homeowners insurance claims in 2018 (latest data available). Wind and hail accounted for 34.4 percent of homeowners insurance claims, followed by fire and lightning with 32.7 percent of claims. Water damage and freezing accounted for 23.8 percent of claims. Changes in the type of homeowners loss from one year to another are partially influenced by fluctuations in the number and severity of weather-related events such as hurricanes and winter storms. There are two ways of looking at losses: by the average number of claims filed per 100 policies (frequency); and by the average amount paid for each claim (severity). The loss category “Water damage and freezing” includes damage caused by mold, if covered.
Homeowners Insurance Losses By Cause, 2014-20181 (Percent of losses incurred)
Cause of loss 2014 2015 2016 2017 2018
Property damage2 96.0% 96.4% 96.4% 98.0% 98.1%
Wind and hail 28.8 21.1 32.8 41.7 34.4
Fire and lightning 24.6 22.2 25.9 32.8 32.7
Water damage and freezing 33.6 45.8 30.5 18.4 23.8
Theft 2.4 1.8 1.8 1.0 1.0
All other property damage3 6.7 5.6 5.4 4.1 6.2
Liability4 4.0 3.6 3.6 2.0 1.9
Bodily injury and property damage 3.9 3.4 3.4 1.9 1.8
Medical payments and other 0.2 0.2 0.2 0.1 0.1
Credit card and other5 6 6 6 6 6
Total 100.0% 100.0% 100.0% 100.0% 100.0%
1For homeowners multiple peril policies (HO-2, HO-3, HO-5). Excludes tenants and condominium owners policies. Excludes Alaska, Texas and Puerto Rico. 2First party, i.e., covers damage to policyholder's own property. 3Includes vandalism and malicious mischief. 4Payments to others for which policyholder is responsible. 5Includes coverage for unauthorized use of various cards, forgery, counterfeit money and losses not otherwise classified. 6Less than 0.1 percent.
Source: ISO®, a Verisk Analytics® business.
Homeowners Insurance Losses, 2014-20181
Year
Total homeowners losses
Year
Total homeowners lossesClaim frequency2
Claim severity3
Claim frequency2
Claim severity3
2014 5.19 $11,319 2017 6.36 $16,517
2015 5.92 11,748 2018 5.73 15,855
2016 4.94 12,628 Average4 5.64 $13,814 1For homeowners multiple peril policies (HO-2, HO-3, HO-5 and HE-7 for North Carolina). Excludes tenants and condominium policies. Excludes Alaska, Texas and Puerto Rico. 2Claims per 100 house years (policies). 3Average amount paid per claim; based on accident year incurred losses, excluding loss adjustment expenses, i.e., indemnity costs per accident year incurred claims. 4Weighted average, 2014-2018.
Source: ISO®, a Verisk Analytics® business.
HOMEOWNERS: CLAIMS
Insurance Information Institute | www.ii i.org 2021 Insurance Fact Book 104
7. PROPERTY/CASUALTY INSURANCE BY LINEHomeowners: Claims
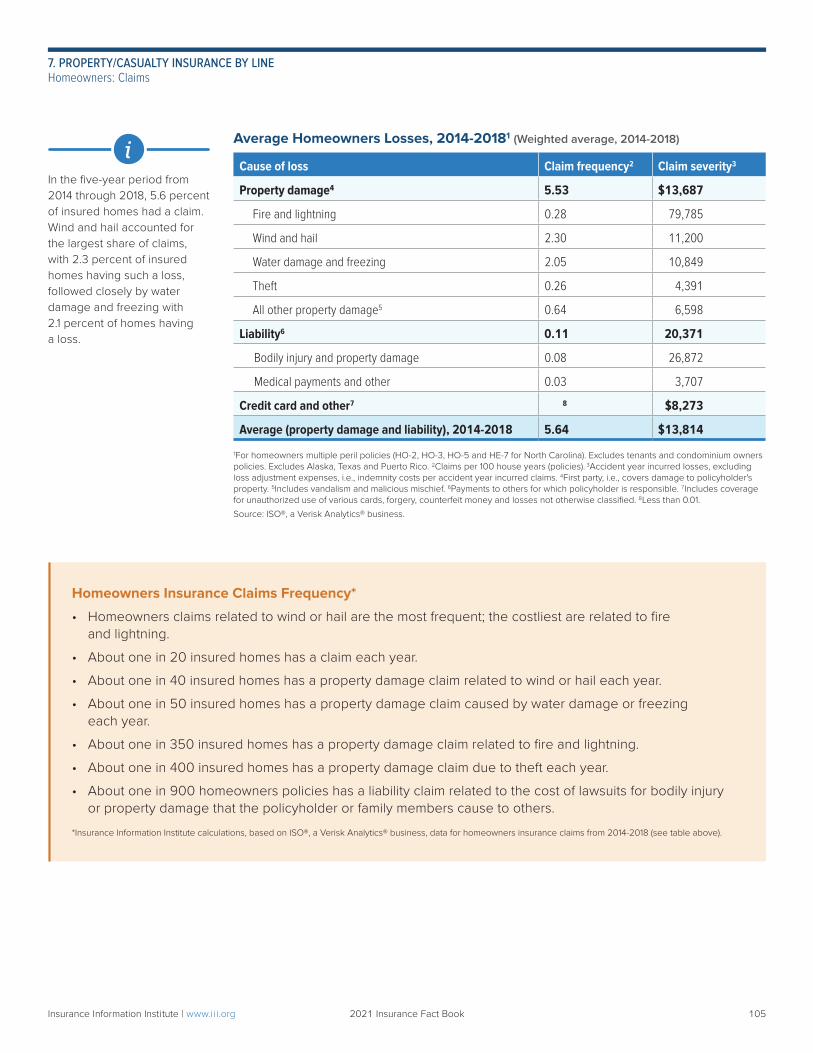
In the five-year period from 2014 through 2018, 5.6 percent of insured homes had a claim. Wind and hail accounted for the largest share of claims, with 2.3 percent of insured homes having such a loss, followed closely by water damage and freezing with 2.1 percent of homes having a loss.
iAverage Homeowners Losses, 2014-20181 (Weighted average, 2014-2018)
Cause of loss Claim frequency2 Claim severity3
Property damageProperty damage44 5.53 $13,687
Fire and lightning 0.28 79,785
Wind and hail 2.30 11,200
Water damage and freezing 2.05 10,849
Theft 0.26 4,391
All other property damage5 0.64 6,598
Liability6 0.11 20,371
Bodily injury and property damage 0.08 26,872
Medical payments and other 0.03 3,707
Credit card and other7 8 $8,273
Average (property damage and liability), 2014-2018 5.64 $13,814
1For homeowners multiple peril policies (HO-2, HO-3, HO-5 and HE-7 for North Carolina). Excludes tenants and condominium owners policies. Excludes Alaska, Texas and Puerto Rico. 2Claims per 100 house years (policies). 3Accident year incurred losses, excluding loss adjustment expenses, i.e., indemnity costs per accident year incurred claims. 4First party, i.e., covers damage to policyholder's property. 5Includes vandalism and malicious mischief. 6Payments to others for which policyholder is responsible. 7Includes coverage for unauthorized use of various cards, forgery, counterfeit money and losses not otherwise classified. 8Less than 0.01.
Source: ISO®, a Verisk Analytics® business.
Homeowners Insurance Claims Frequency*
• Homeowners claims related to wind or hail are the most frequent; the costliest are related to fire and lightning.
• About one in 20 insured homes has a claim each year.
• About one in 40 insured homes has a property damage claim related to wind or hail each year.
• About one in 50 insured homes has a property damage claim caused by water damage or freezing each year.
• About one in 350 insured homes has a property damage claim related to fire and lightning.
• About one in 400 insured homes has a property damage claim due to theft each year.
• About one in 900 homeowners policies has a liability claim related to the cost of lawsuits for bodily injury or property damage that the policyholder or family members cause to others.
*Insurance Information Institute calculations, based on ISO®, a Verisk Analytics® business, data for homeowners insurance claims from 2014-2018 (see table above).
Insurance Information Institute | www.ii i.org 2021 Insurance Fact Book 105
7. PROPERTY/CASUALTY INSURANCE BY LINEHomeowners: Claims
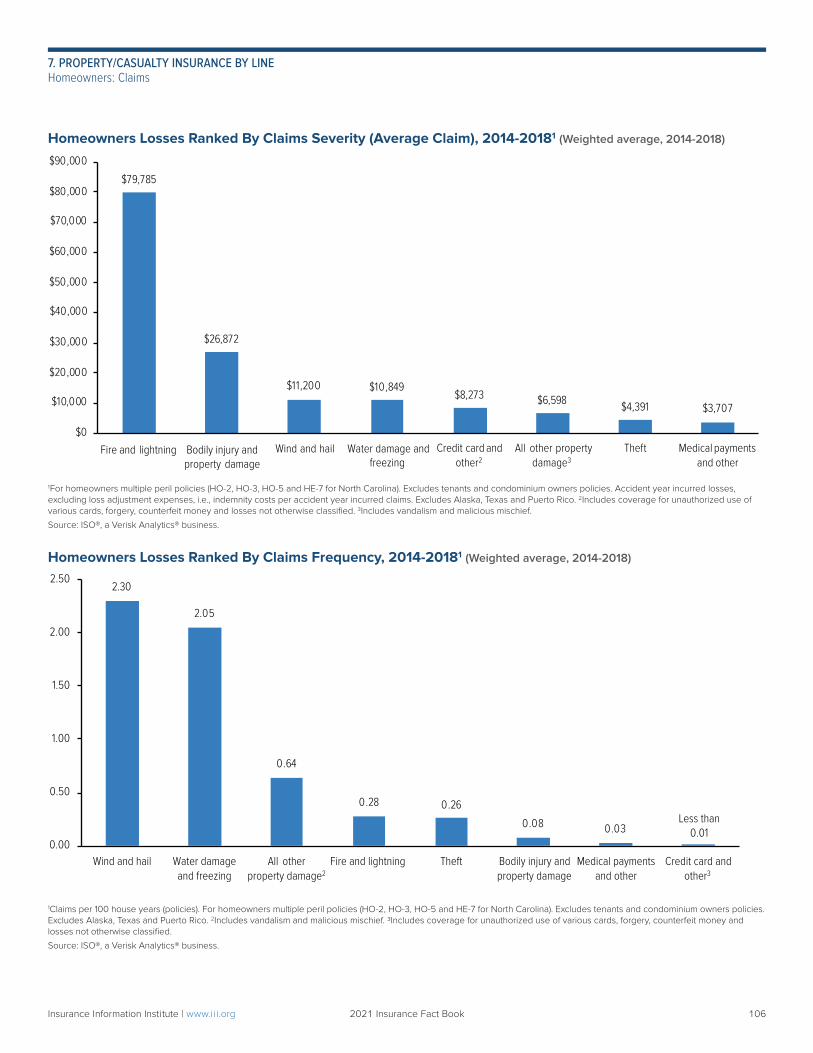
$79,785
$26,872
$11,200 $10,849$8,273 $6,598 $4,391 $3,707
$0
$10,000
$20,000
$30,000
$40,000
$50,000
$60,000
$70,000
$80,000
$90,000
Fire and lightning Wind and hail Water damage andfreezing
Credit card andother2
All other propertydamage3
Theft Medical paymentsand other
Bodily injury and property damage
2.30
2.05
0.64
0.28 0.26
0.08 0.03Less than
0.010.00
0.50
1.00
1.50
2.00
2.50
Wind and hail Water damageand freezing
All other property damage2
Fire and lightning Theft Bodily injury andproperty damage
Medical paymentsand other
Credit card andother3
Homeowners Losses Ranked By Claims Severity (Average Claim), 2014-20181 (Weighted average, 2014-2018)
Homeowners Losses Ranked By Claims Frequency, 2014-20181 (Weighted average, 2014-2018)
1For homeowners multiple peril policies (HO-2, HO-3, HO-5 and HE-7 for North Carolina). Excludes tenants and condominium owners policies. Accident year incurred losses, excluding loss adjustment expenses, i.e., indemnity costs per accident year incurred claims. Excludes Alaska, Texas and Puerto Rico. 2Includes coverage for unauthorized use of various cards, forgery, counterfeit money and losses not otherwise classified. 3Includes vandalism and malicious mischief.
Source: ISO®, a Verisk Analytics® business.
1Claims per 100 house years (policies). For homeowners multiple peril policies (HO-2, HO-3, HO-5 and HE-7 for North Carolina). Excludes tenants and condominium owners policies. Excludes Alaska, Texas and Puerto Rico. 2Includes vandalism and malicious mischief. 3Includes coverage for unauthorized use of various cards, forgery, counterfeit money and losses not otherwise classified.
Source: ISO®, a Verisk Analytics® business.
Insurance Information Institute | www.ii i.org 2021 Insurance Fact Book 106
7. PROPERTY/CASUALTY INSURANCE BY LINEHomeowners: Claims
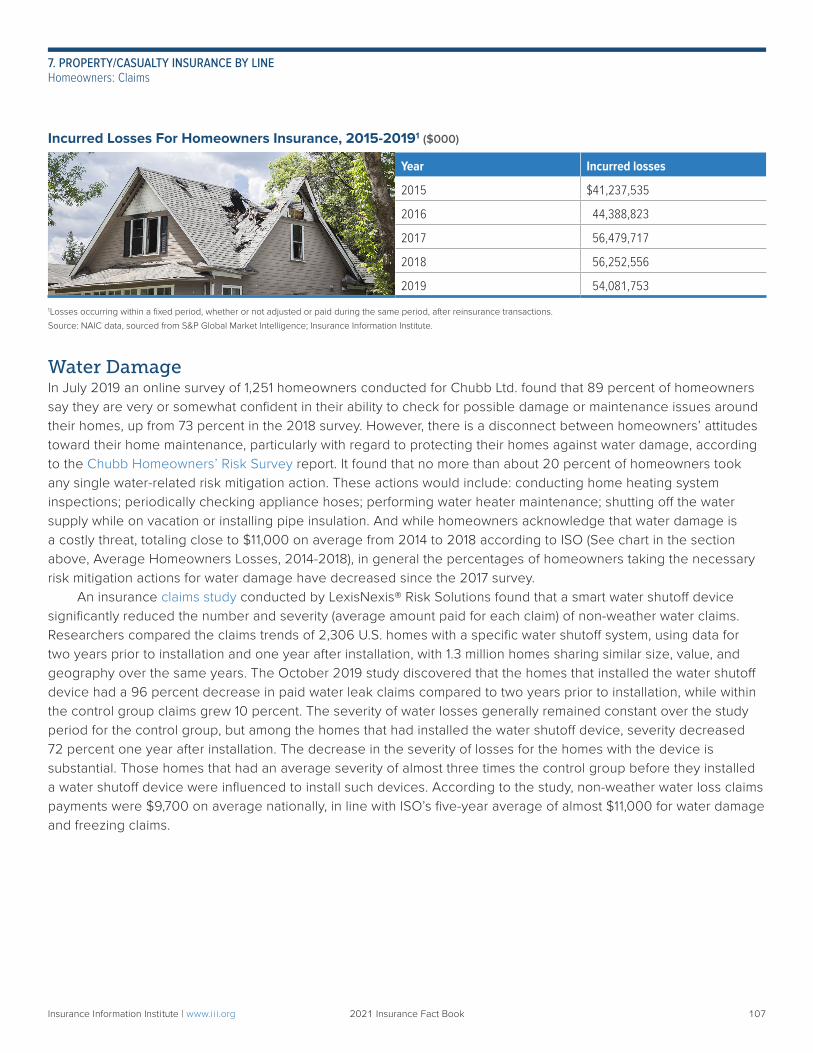
Incurred Losses For Homeowners Insurance, 2015-20191 ($000)
Year Incurred losses
2015 $41,237,535
2016 44,388,823
2017 56,479,717
2018 56,252,556
2019 54,081,753
1Losses occurring within a fixed period, whether or not adjusted or paid during the same period, after reinsurance transactions.
Source: NAIC data, sourced from S&P Global Market Intelligence; Insurance Information Institute.
Water DamageIn July 2019 an online survey of 1,251 homeowners conducted for Chubb Ltd. found that 89 percent of homeowners say they are very or somewhat confident in their ability to check for possible damage or maintenance issues around their homes, up from 73 percent in the 2018 survey. However, there is a disconnect between homeowners’ attitudes toward their home maintenance, particularly with regard to protecting their homes against water damage, according to the Chubb Homeowners’ Risk Survey report. It found that no more than about 20 percent of homeowners took any single water-related risk mitigation action. These actions would include: conducting home heating system inspections; periodically checking appliance hoses; performing water heater maintenance; shutting off the water supply while on vacation or installing pipe insulation. And while homeowners acknowledge that water damage is a costly threat, totaling close to $11,000 on average from 2014 to 2018 according to ISO (See chart in the section above, Average Homeowners Losses, 2014-2018), in general the percentages of homeowners taking the necessary risk mitigation actions for water damage have decreased since the 2017 survey. An insurance claims study conducted by LexisNexis® Risk Solutions found that a smart water shutoff device significantly reduced the number and severity (average amount paid for each claim) of non-weather water claims. Researchers compared the claims trends of 2,306 U.S. homes with a specific water shutoff system, using data for two years prior to installation and one year after installation, with 1.3 million homes sharing similar size, value, and geography over the same years. The October 2019 study discovered that the homes that installed the water shutoff device had a 96 percent decrease in paid water leak claims compared to two years prior to installation, while within the control group claims grew 10 percent. The severity of water losses generally remained constant over the study period for the control group, but among the homes that had installed the water shutoff device, severity decreased 72 percent one year after installation. The decrease in the severity of losses for the homes with the device is substantial. Those homes that had an average severity of almost three times the control group before they installed a water shutoff device were influenced to install such devices. According to the study, non-weather water loss claims payments were $9,700 on average nationally, in line with ISO’s five-year average of almost $11,000 for water damage and freezing claims.
Insurance Information Institute | www.ii i.org 2021 Insurance Fact Book 107
7. PROPERTY/CASUALTY INSURANCE BY LINEHomeowners: Claims
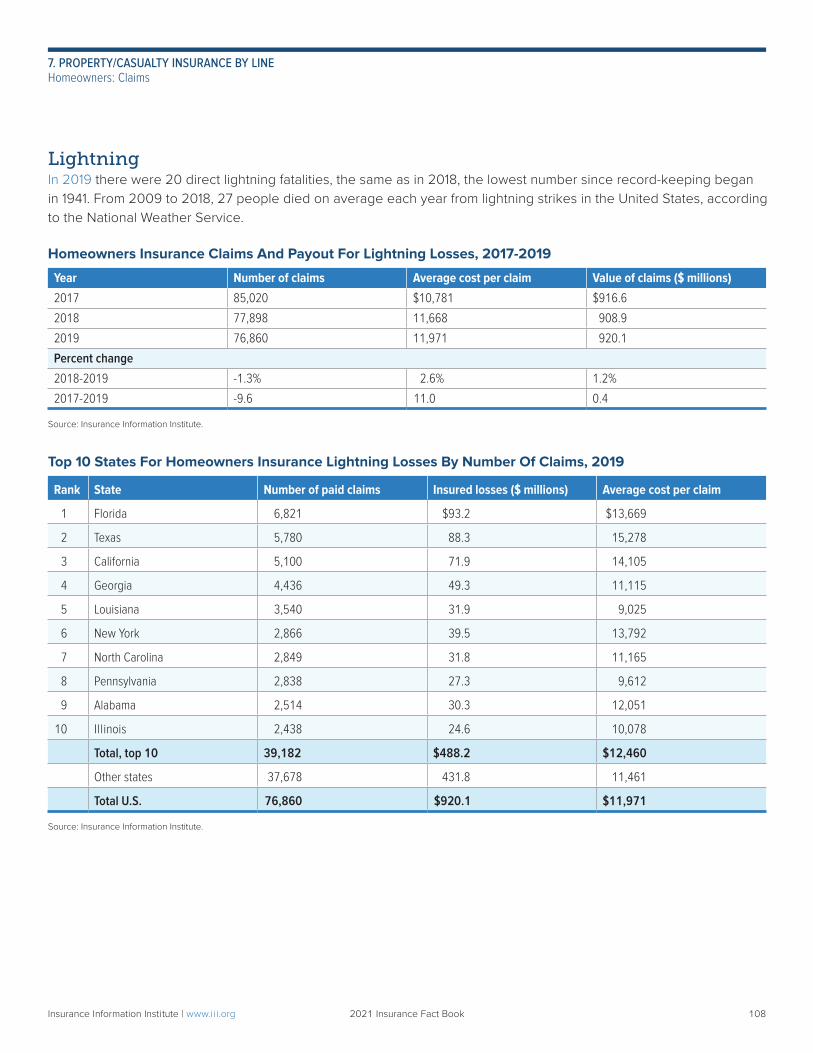
LightningIn 2019 there were 20 direct lightning fatalities, the same as in 2018, the lowest number since record-keeping began in 1941. From 2009 to 2018, 27 people died on average each year from lightning strikes in the United States, according to the National Weather Service.
Homeowners Insurance Claims And Payout For Lightning Losses, 2017-2019
Year Number of claims Average cost per claim Value of claims ($ millions)
2017 85,020 $10,781 $916.6
2018 77,898 11,668 908.9
2019 76,860 11,971 920.1
Percent change
2018-2019 -1.3% 2.6% 1.2%
2017-2019 -9.6 11.0 0.4
Source: Insurance Information Institute.
Top 10 States For Homeowners Insurance Lightning Losses By Number Of Claims, 2019
Rank State Number of paid claims Insured losses ($ millions) Average cost per claim
1 Florida 6,821 $93.2 $13,669
2 Texas 5,780 88.3 15,278
3 California 5,100 71.9 14,105
4 Georgia 4,436 49.3 11,115
5 Louisiana 3,540 31.9 9,025
6 New York 2,866 39.5 13,792
7 North Carolina 2,849 31.8 11,165
8 Pennsylvania 2,838 27.3 9,612
9 Alabama 2,514 30.3 12,051
10 Illinois 2,438 24.6 10,078
Total, top 10 39,182 $488.2 $12,460
Other states 37,678 431.8 11,461
Total U.S. 76,860 $920.1 $11,971
Source: Insurance Information Institute.
Insurance Information Institute | www.ii i.org 2021 Insurance Fact Book 108
7. PROPERTY/CASUALTY INSURANCE BY LINEHomeowners: Claims
As of September 2020, 60 insurance companies participated in the Write Your Own (WYO) program, started in 1983, in which insurers issue policies and adjust flood claims on behalf of the federal government under their own names.
In 2019, 88 percent of NFIP policies were held in the WYO program.
As of July 2020, 69 percent of policies covered single family homes; 21 percent covered condominiums and other residential properties; and 4 percent covered two- to four-family units. Business and other non-residential policies accounted for the remainder.
As of December 23, 2019, Hurricane Katrina in 2005 had the highest NFIP payouts, at $16.3 billion. Hurricane Harvey in September 2017 ranked second with $8.9 billion in NFIP payouts.
Hurricane Irma, also in 2017, ranked ninth with $1.1 billion in payouts.
i FLOOD INSURANCENational Flood Insurance ProgramFlood damage is excluded under standard homeowners and renters insurance policies. However, flood coverage is available as a separate policy from the National Flood Insurance Program (NFIP), administered by the Federal Emergency Management Agency (FEMA), and from many private insurers. Congress created the NFIP in 1968. The program makes federally backed flood insurance available in communities that agree to adopt and enforce floodplain management ordinances. The NFIP is self-supporting for the average historical loss year unless there is a widespread disaster. Since 2017 FEMA has been conducting a reinsurance program for the NFIP. The NFIP arranged for $1.33 billion in coverage for 2020, slightly more than in 2019, receiving the funds from 27 private reinsurers. In 2020 coverage will be 10.25 percent of NFIP losses between $4 billion and $6 billion; 34.68 percent of losses between $6 billion and $8 billion; and 21.8 percent of losses between $8 billion and $10 billion. These changes, as well as higher pricing, increased the cost of reinsurance coverage to $205 million in 2020 from $186 million in 2019. As of February 2020 FEMA had secured $1.2 billion in funding from catastrophe bonds for the NFIP. In August 2018 FEMA launched its first catastrophe bond to transfer risk from the NFIP to capital markets, acquiring $500 million of reinsurance protection from FloodSmart Re Ltd. (Series 2018-1 issuance). The transaction will cover NFIP losses from flood events that are directly or indirectly caused by a named storm event impacting the United States, including Puerto Rico, the U.S. Virgin Islands and the District of Columbia. In March 2019 FEMA secured a second catastrophe bond for $300 million from FloodSmart Re Ltd. (Series 2019-1) with coverage for three years with terms that are identical to the August 2018 catastrophe bond. Both the 2018 and 2019 bonds are still in-force. In February 2020 FEMA secured $400 million in reinsurance backed by catastrophe bonds from FloodSmart Re Ltd. (Series 2020-1). According to Artemis, FEMA’s reinsurance program protection for the NFIP is now $2.53 billion, combining traditional reinsurance and its catastrophe bond program, continuing its plan, begun in 2017, to reduce taxpayers’ burden of paying NFIP’s losses. Congress must periodically renew the program’s authority to operate. If the program were to lapse, claims would still be paid but the NFIP would stop selling and renewing policies (more details here.) In March, 2019 the Trump administration announced plans to reform the NFIP with a shift to fully risk-based pricing. FEMA said the program would begin to assess properties individually, instead of calculating rates based on whether a home falls in a designated flood zone. This could potentially drive more flood risk into private reinsurance and risk markets. FEMA said it will implement the new system on October 1, 2021.
Insurance Information Institute | www.ii i.org 2021 Insurance Fact Book 109
7. PROPERTY/CASUALTY INSURANCE BY LINEFlood Insurance
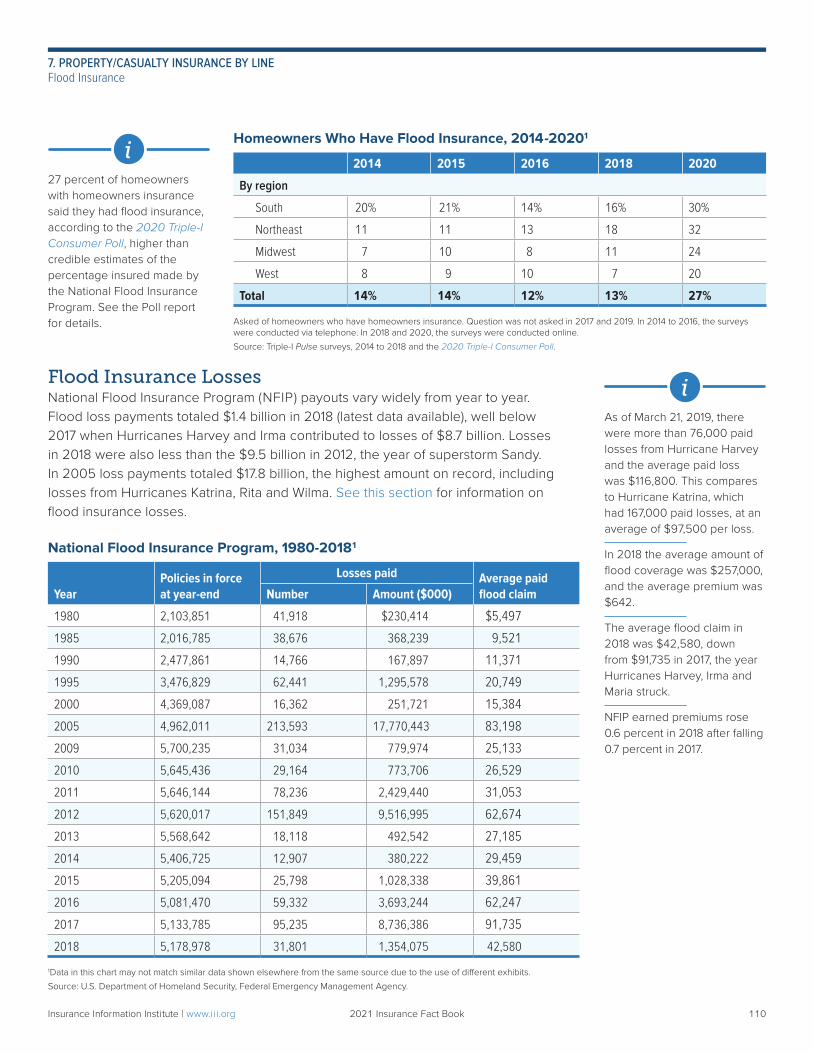
As of March 21, 2019, there were more than 76,000 paid losses from Hurricane Harvey and the average paid loss was $116,800. This compares to Hurricane Katrina, which had 167,000 paid losses, at an average of $97,500 per loss.
In 2018 the average amount of flood coverage was $257,000, and the average premium was $642.
The average flood claim in 2018 was $42,580, down from $91,735 in 2017, the year Hurricanes Harvey, Irma and Maria struck.
NFIP earned premiums rose 0.6 percent in 2018 after falling 0.7 percent in 2017.
i
27 percent of homeowners with homeowners insurance said they had flood insurance, according to the 2020 Triple-I Consumer Poll, higher than credible estimates of the percentage insured made by the National Flood Insurance Program. See the Poll report for details.
i
Flood Insurance LossesNational Flood Insurance Program (NFIP) payouts vary widely from year to year. Flood loss payments totaled $1.4 billion in 2018 (latest data available), well below 2017 when Hurricanes Harvey and Irma contributed to losses of $8.7 billion. Losses in 2018 were also less than the $9.5 billion in 2012, the year of superstorm Sandy. In 2005 loss payments totaled $17.8 billion, the highest amount on record, including losses from Hurricanes Katrina, Rita and Wilma. See this section for information on flood insurance losses.
National Flood Insurance Program, 1980-20181
YearPolicies in force at year-end
Losses paid Average paid flood claimNumber Amount ($000)
1980 2,103,851 41,918 $230,414 $5,497
1985 2,016,785 38,676 368,239 9,521
1990 2,477,861 14,766 167,897 11,371
1995 3,476,829 62,441 1,295,578 20,749
2000 4,369,087 16,362 251,721 15,384
2005 4,962,011 213,593 17,770,443 83,198
2009 5,700,235 31,034 779,974 25,133
2010 5,645,436 29,164 773,706 26,529
2011 5,646,144 78,236 2,429,440 31,053
2012 5,620,017 151,849 9,516,995 62,674
2013 5,568,642 18,118 492,542 27,185
2014 5,406,725 12,907 380,222 29,459
2015 5,205,094 25,798 1,028,338 39,861
2016 5,081,470 59,332 3,693,244 62,247
2017 5,133,785 95,235 8,736,386 91,735
2018 5,178,978 31,801 1,354,075 42,580
1Data in this chart may not match similar data shown elsewhere from the same source due to the use of different exhibits.
Source: U.S. Department of Homeland Security, Federal Emergency Management Agency.
Homeowners Who Have Flood Insurance, 2014-20201
2014 2015 2016 2018 2020
By region
South 20% 21% 14% 16% 30%
Northeast 11 11 13 18 32
Midwest 7 10 8 11 24
West 8 9 10 7 20
Total 14% 14% 12% 13% 27%
Asked of homeowners who have homeowners insurance. Question was not asked in 2017 and 2019. In 2014 to 2016, the surveys were conducted via telephone. In 2018 and 2020, the surveys were conducted online.
Source: Triple-I Pulse surveys, 2014 to 2018 and the 2020 Triple-I Consumer Poll.
Insurance Information Institute | www.ii i.org 2021 Insurance Fact Book 110
7. PROPERTY/CASUALTY INSURANCE BY LINEFlood Insurance
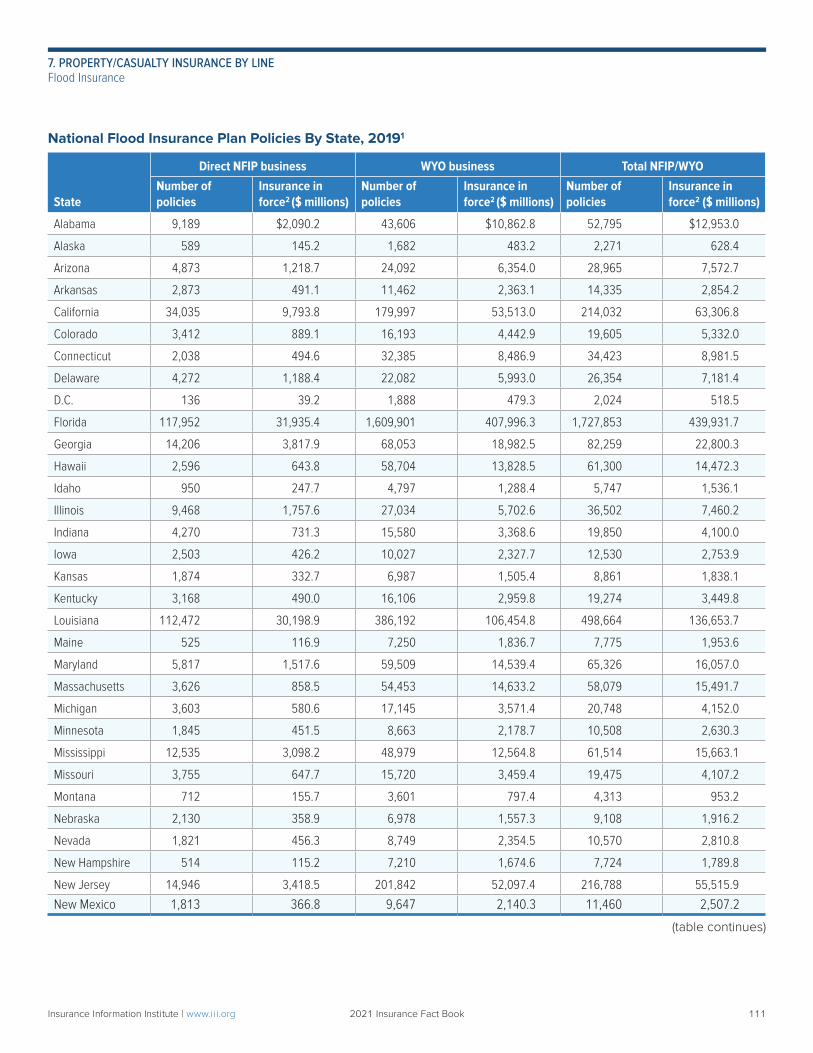
National Flood Insurance Plan Policies By State, 20191
State
Direct NFIP business WYO business Total NFIP/WYO
Number of policies
Insurance in force2 ($ millions)
Number of policies
Insurance in force2 ($ millions)
Number of policies
Insurance in force2 ($ millions)
Alabama 9,189 $2,090.2 43,606 $10,862.8 52,795 $12,953.0
Alaska 589 145.2 1,682 483.2 2,271 628.4
Arizona 4,873 1,218.7 24,092 6,354.0 28,965 7,572.7
Arkansas 2,873 491.1 11,462 2,363.1 14,335 2,854.2
California 34,035 9,793.8 179,997 53,513.0 214,032 63,306.8
Colorado 3,412 889.1 16,193 4,442.9 19,605 5,332.0
Connecticut 2,038 494.6 32,385 8,486.9 34,423 8,981.5
Delaware 4,272 1,188.4 22,082 5,993.0 26,354 7,181.4
D.C. 136 39.2 1,888 479.3 2,024 518.5
Florida 117,952 31,935.4 1,609,901 407,996.3 1,727,853 439,931.7
Georgia 14,206 3,817.9 68,053 18,982.5 82,259 22,800.3
Hawaii 2,596 643.8 58,704 13,828.5 61,300 14,472.3
Idaho 950 247.7 4,797 1,288.4 5,747 1,536.1
Illinois 9,468 1,757.6 27,034 5,702.6 36,502 7,460.2
Indiana 4,270 731.3 15,580 3,368.6 19,850 4,100.0
Iowa 2,503 426.2 10,027 2,327.7 12,530 2,753.9
Kansas 1,874 332.7 6,987 1,505.4 8,861 1,838.1
Kentucky 3,168 490.0 16,106 2,959.8 19,274 3,449.8
Louisiana 112,472 30,198.9 386,192 106,454.8 498,664 136,653.7
Maine 525 116.9 7,250 1,836.7 7,775 1,953.6
Maryland 5,817 1,517.6 59,509 14,539.4 65,326 16,057.0
Massachusetts 3,626 858.5 54,453 14,633.2 58,079 15,491.7
Michigan 3,603 580.6 17,145 3,571.4 20,748 4,152.0
Minnesota 1,845 451.5 8,663 2,178.7 10,508 2,630.3
Mississippi 12,535 3,098.2 48,979 12,564.8 61,514 15,663.1
Missouri 3,755 647.7 15,720 3,459.4 19,475 4,107.2
Montana 712 155.7 3,601 797.4 4,313 953.2
Nebraska 2,130 358.9 6,978 1,557.3 9,108 1,916.2
Nevada 1,821 456.3 8,749 2,354.5 10,570 2,810.8
New Hampshire 514 115.2 7,210 1,674.6 7,724 1,789.8
New Jersey 14,946 3,418.5 201,842 52,097.4 216,788 55,515.9
New Mexico 1,813 366.8 9,647 2,140.3 11,460 2,507.2
(table continues)
Insurance Information Institute | www.ii i.org 2021 Insurance Fact Book 111
7. PROPERTY/CASUALTY INSURANCE BY LINEFlood Insurance
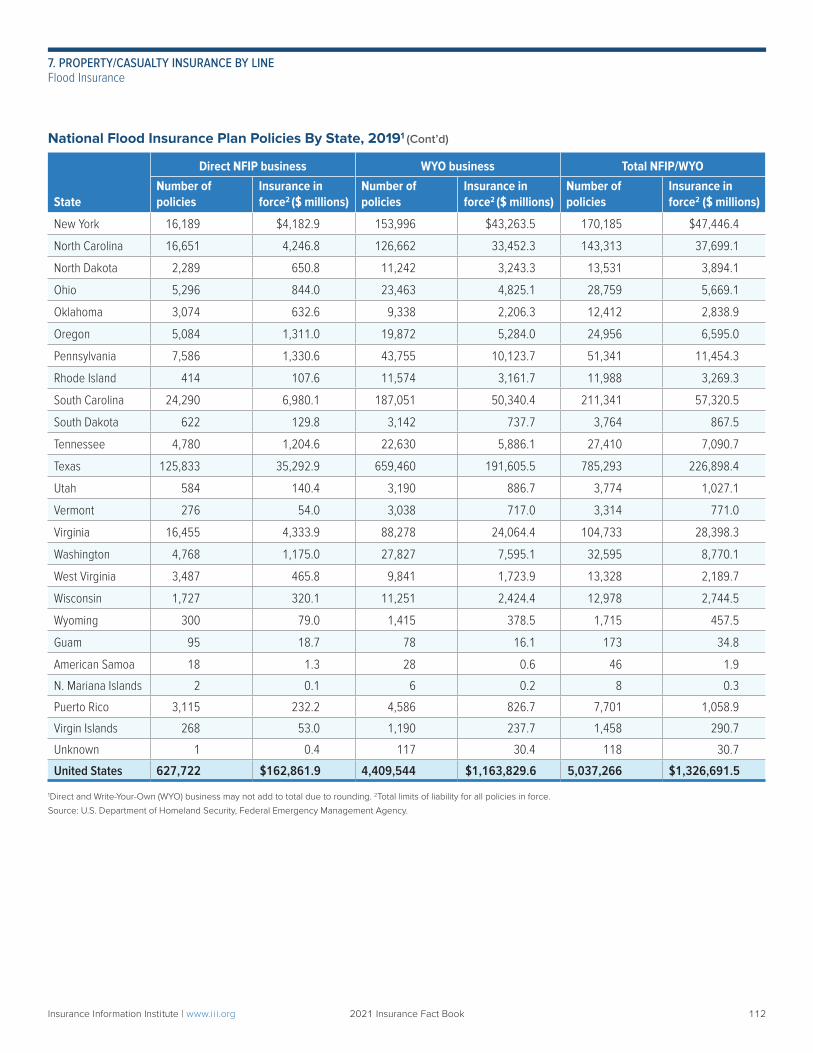
National Flood Insurance Plan Policies By State, 20191 (Cont’d)
State
Direct NFIP business WYO business Total NFIP/WYO
Number of policies
Insurance in force2 ($ millions)
Number of policies
Insurance in force2 ($ millions)
Number of policies
Insurance in force2 ($ millions)
New York 16,189 $4,182.9 153,996 $43,263.5 170,185 $47,446.4
North Carolina 16,651 4,246.8 126,662 33,452.3 143,313 37,699.1
North Dakota 2,289 650.8 11,242 3,243.3 13,531 3,894.1
Ohio 5,296 844.0 23,463 4,825.1 28,759 5,669.1
Oklahoma 3,074 632.6 9,338 2,206.3 12,412 2,838.9
Oregon 5,084 1,311.0 19,872 5,284.0 24,956 6,595.0
Pennsylvania 7,586 1,330.6 43,755 10,123.7 51,341 11,454.3
Rhode Island 414 107.6 11,574 3,161.7 11,988 3,269.3
South Carolina 24,290 6,980.1 187,051 50,340.4 211,341 57,320.5
South Dakota 622 129.8 3,142 737.7 3,764 867.5
Tennessee 4,780 1,204.6 22,630 5,886.1 27,410 7,090.7
Texas 125,833 35,292.9 659,460 191,605.5 785,293 226,898.4
Utah 584 140.4 3,190 886.7 3,774 1,027.1
Vermont 276 54.0 3,038 717.0 3,314 771.0
Virginia 16,455 4,333.9 88,278 24,064.4 104,733 28,398.3
Washington 4,768 1,175.0 27,827 7,595.1 32,595 8,770.1
West Virginia 3,487 465.8 9,841 1,723.9 13,328 2,189.7
Wisconsin 1,727 320.1 11,251 2,424.4 12,978 2,744.5
Wyoming 300 79.0 1,415 378.5 1,715 457.5
Guam 95 18.7 78 16.1 173 34.8
American Samoa 18 1.3 28 0.6 46 1.9
N. Mariana Islands 2 0.1 6 0.2 8 0.3
Puerto Rico 3,115 232.2 4,586 826.7 7,701 1,058.9
Virgin Islands 268 53.0 1,190 237.7 1,458 290.7
Unknown 1 0.4 117 30.4 118 30.7
United States 627,722 $162,861.9 4,409,544 $1,163,829.6 5,037,266 $1,326,691.5
1Direct and Write-Your-Own (WYO) business may not add to total due to rounding. 2Total limits of liability for all policies in force.
Source: U.S. Department of Homeland Security, Federal Emergency Management Agency.
Insurance Information Institute | www.ii i.org 2021 Insurance Fact Book 112
7. PROPERTY/CASUALTY INSURANCE BY LINEFlood Insurance
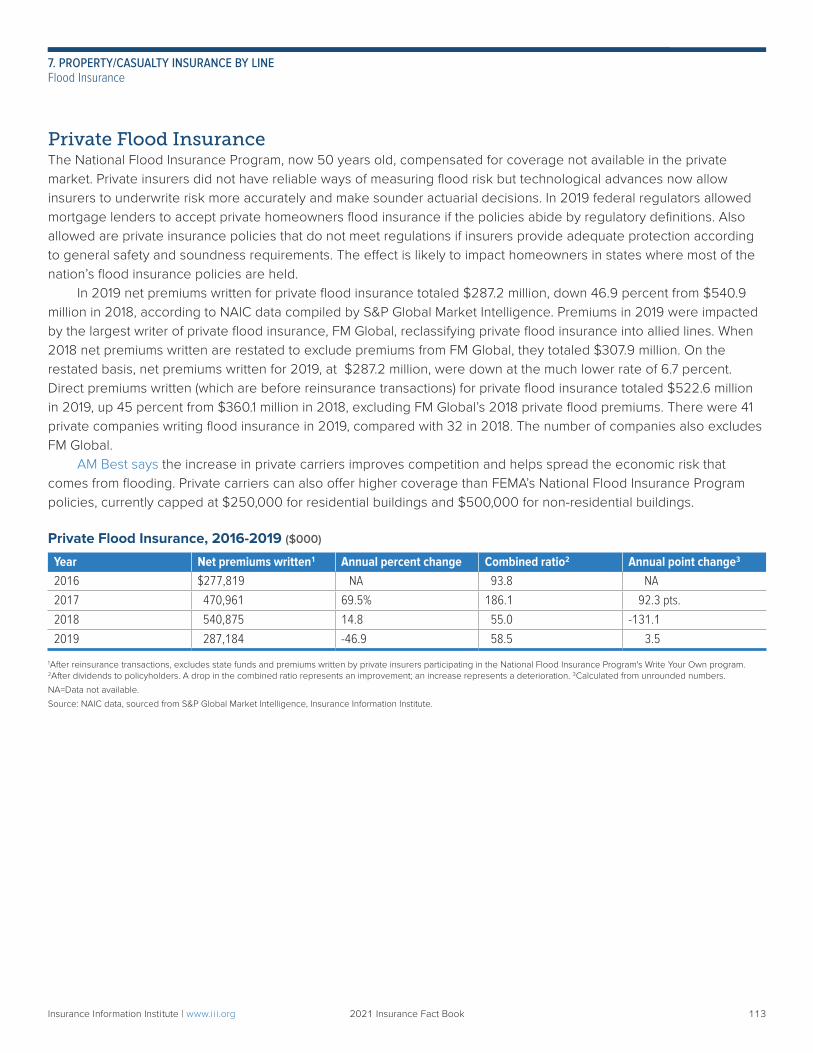
Private Flood InsuranceThe National Flood Insurance Program, now 50 years old, compensated for coverage not available in the private market. Private insurers did not have reliable ways of measuring flood risk but technological advances now allow insurers to underwrite risk more accurately and make sounder actuarial decisions. In 2019 federal regulators allowed mortgage lenders to accept private homeowners flood insurance if the policies abide by regulatory definitions. Also allowed are private insurance policies that do not meet regulations if insurers provide adequate protection according to general safety and soundness requirements. The effect is likely to impact homeowners in states where most of the nation’s flood insurance policies are held. In 2019 net premiums written for private flood insurance totaled $287.2 million, down 46.9 percent from $540.9 million in 2018, according to NAIC data compiled by S&P Global Market Intelligence. Premiums in 2019 were impacted by the largest writer of private flood insurance, FM Global, reclassifying private flood insurance into allied lines. When 2018 net premiums written are restated to exclude premiums from FM Global, they totaled $307.9 million. On the restated basis, net premiums written for 2019, at $287.2 million, were down at the much lower rate of 6.7 percent. Direct premiums written (which are before reinsurance transactions) for private flood insurance totaled $522.6 million in 2019, up 45 percent from $360.1 million in 2018, excluding FM Global’s 2018 private flood premiums. There were 41 private companies writing flood insurance in 2019, compared with 32 in 2018. The number of companies also excludes FM Global. AM Best says the increase in private carriers improves competition and helps spread the economic risk that comes from flooding. Private carriers can also offer higher coverage than FEMA’s National Flood Insurance Program policies, currently capped at $250,000 for residential buildings and $500,000 for non-residential buildings.
Private Flood Insurance, 2016-2019 ($000)
Year Net premiums written1 Annual percent change Combined ratio2 Annual point change3
2016 $277,819 NA 93.8 NA
2017 470,961 69.5% 186.1 92.3 pts.
2018 540,875 14.8 55.0 -131.1
2019 287,184 -46.9 58.5 3.5
1After reinsurance transactions, excludes state funds and premiums written by private insurers participating in the National Flood Insurance Program's Write Your Own program. 2After dividends to policyholders. A drop in the combined ratio represents an improvement; an increase represents a deterioration. 3Calculated from unrounded numbers.
NA=Data not available.
Source: NAIC data, sourced from S&P Global Market Intelligence, Insurance Information Institute.
Insurance Information Institute | www.ii i.org 2021 Insurance Fact Book 113
7. PROPERTY/CASUALTY INSURANCE BY LINEFlood Insurance
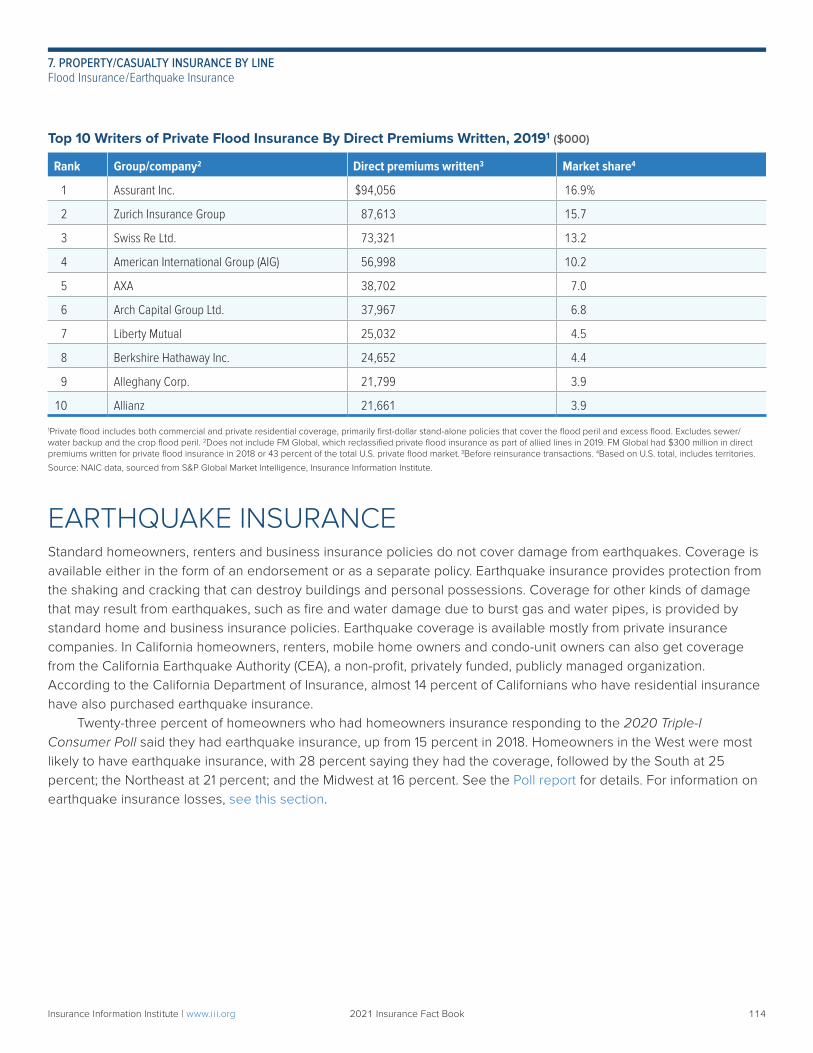
Top 10 Writers of Private Flood Insurance By Direct Premiums Written, 20191 ($000)
Rank Group/company2 Direct premiums written3 Market share4
1 Assurant Inc. $94,056 16.9%
2 Zurich Insurance Group 87,613 15.7
3 Swiss Re Ltd. 73,321 13.2
4 American International Group (AIG) 56,998 10.2
5 AXA 38,702 7.0
6 Arch Capital Group Ltd. 37,967 6.8
7 Liberty Mutual 25,032 4.5
8 Berkshire Hathaway Inc. 24,652 4.4
9 Alleghany Corp. 21,799 3.9
10 Allianz 21,661 3.9
1Private flood includes both commercial and private residential coverage, primarily first-dollar stand-alone policies that cover the flood peril and excess flood. Excludes sewer/water backup and the crop flood peril. 2Does not include FM Global, which reclassified private flood insurance as part of allied lines in 2019. FM Global had $300 million in direct premiums written for private flood insurance in 2018 or 43 percent of the total U.S. private flood market. 3Before reinsurance transactions. 4Based on U.S. total, includes territories.
Source: NAIC data, sourced from S&P Global Market Intelligence, Insurance Information Institute.
EARTHQUAKE INSURANCEStandard homeowners, renters and business insurance policies do not cover damage from earthquakes. Coverage is available either in the form of an endorsement or as a separate policy. Earthquake insurance provides protection from the shaking and cracking that can destroy buildings and personal possessions. Coverage for other kinds of damage that may result from earthquakes, such as fire and water damage due to burst gas and water pipes, is provided by standard home and business insurance policies. Earthquake coverage is available mostly from private insurance companies. In California homeowners, renters, mobile home owners and condo-unit owners can also get coverage from the California Earthquake Authority (CEA), a non-profit, privately funded, publicly managed organization. According to the California Department of Insurance, almost 14 percent of Californians who have residential insurance have also purchased earthquake insurance. Twenty-three percent of homeowners who had homeowners insurance responding to the 2020 Triple-I Consumer Poll said they had earthquake insurance, up from 15 percent in 2018. Homeowners in the West were most likely to have earthquake insurance, with 28 percent saying they had the coverage, followed by the South at 25 percent; the Northeast at 21 percent; and the Midwest at 16 percent. See the Poll report for details. For information on earthquake insurance losses, see this section.
Insurance Information Institute | www.ii i.org 2021 Insurance Fact Book 114
7. PROPERTY/CASUALTY INSURANCE BY LINEFlood Insurance/Earthquake Insurance
Earthquake Insurance, 2010-2019 ($000)
Year Net premiums written1 Annual percent change Combined ratio2 Annual point change3
2010 $1,443,598 12.0% 41.4 5.1 pts.
2011 1,467,372 1.6 55.8 14.4
2012 1,593,451 8.6 36.3 -19.5
2013 1,586,985 -0.4 30.3 -6.0
2014 1,641,847 3.5 34.0 3.7
2015 1,649,753 0.5 28.1 -5.8
2016 1,535,142 -6.9 34.4 6.2
2017 1,511,543 -1.5 42.3 8.0
2018 1,827,543 20.9 44.3 2.0
2019 1,982,730 8.5 29.0 -15.4
1After reinsurance transactions, excludes state funds, such as the California Earthquake Authority (CEA), a not-for-profit, privately funded, publicly managed organization that provides coverage in California. 2After dividends to policyholders. A drop in the combined ratio represents an improvement; an increase represents a deterioration. 3Calculated from unrounded numbers.
Source: NAIC data, sourced from S&P Global Market Intelligence, Insurance Information Institute.
Leading Writers Of Earthquake InsuranceThe California Earthquake Authority (CEA), a non-profit, publicly managed, privately funded organization that sells its policies through participating private insurance companies, was the leading writer of residential earthquake insurance in the United States, based on direct premiums written in 2019, according to data from S&P Global Market Intelligence. The CEA had $821 million in direct premiums written in 2019, all of which covered residential California properties. It accounted for 22.8 percent of the total U.S. earthquake insurance market in 2019. The nine other largest earthquake insurers in 2019 were all private insurance companies.
Top 10 Writers Of Earthquake Insurance By Direct Premiums Written, 2019 ($000)
Rank Group/company Direct premiums written1 Market share2
1 California Earthquake Authority $820,924 22.8%
2 State Farm 275,793 7.7
3 Zurich Insurance Group 235,140 6.5
4 Chubb Ltd. 173,210 4.8
5 Travelers Companies Inc. 139,969 3.9
6 Palomar Specialty Insurance Co. 139,639 3.9
7 American International Group (AIG) 128,798 3.6
8 AXA 104,071 2.9
9 GeoVera Insurance Group 103,954 2.9
10 Sompo Holdings Inc. 97,635 2.7
1Before reinsurance transactions, includes state funds. 2Based on U.S. total, includes territories.
Source: NAIC data, sourced from S&P Global Market Intelligence, Insurance Information Institute.
Insurance Information Institute | www.ii i.org 2021 Insurance Fact Book 115
7. PROPERTY/CASUALTY INSURANCE BY LINEEarthquake Insurance
COMMERCIAL LINESThe commercial lines sector of the property/casualty insurance industry generally provides insurance products for businesses while the personal lines sector offers products for individuals and households. However, the division between commercial and personal coverages is not precise. For example, inland marine insurance, which is included in the commercial lines sector, may cover some personal property such as expensive jewelry and fine art.
Leading Companies
Top 10 Writers Of Commercial Lines Insurance By Direct Premiums Written, 2019 ($000)
Rank Group/company Direct premiums written1 Market share2
1 Travelers Companies Inc. $18,666,277 5.5%
2 Chubb Ltd. 18,567,051 5.5
3 Liberty Mutual 16,794,384 5.0
4 Zurich Insurance Group 12,612,294 3.7
5 American International Group (AIG) 12,220,209 3.6
6 CNA Financial Corp. 10,602,312 3.1
7 Berkshire Hathaway Inc. 10,514,633 3.1
8 Hartford Financial Services 9,686,418 2.9
9 Nationwide Mutual Group 8,381,732 2.5
10 Tokio Marine Group 7,413,819 2.2
1Before reinsurance transactions, includes state funds. 2Based on U.S. total, includes territories.
Source: NAIC data, sourced from S&P Global Market Intelligence, Insurance Information Institute.
Top 10 Commercial Insurance Brokers Of U.S. Business By Revenue, 20191 ($ millions)
Rank Company Brokerage revenues
1 Marsh & McLennan Cos. Inc.2, 3 $7,934.4
2 Aon PLC 4,982.7
3 Willis Towers Watson PLC2 4,291.7
4 Arthur J. Gallagher & Co.2 3,944.3
5 Brown & Brown Inc.2 2,384.7
6 Truist Insurance Holdings Inc.2 2,270.8
7 Hub International Ltd.2 1,841.7
8 USI Insurance Services LLC2 1,813.0
9 Acrisure LLC2 1,716.2
10 Alliant Insurance Services Inc.2 1,576.4
1Companies that derive more than 49 percent of revenues from personal lines are not ranked. 2Reported U.S. acquisitions in 2019. 3Acquired Assurance Agency Ltd. on April 1, 2020. Business Insurance estimate of pro forma revenue to reflect acquisition.
Source: Business Insurance (www.businessinsurance.com), July 2020.
Insurance Information Institute | www.ii i.org 2021 Insurance Fact Book 116
7. PROPERTY/CASUALTY INSURANCE BY LINECommercial Lines
Incurred Losses
Incurred Losses For Commercial Insurance, 2015-20191 ($000)
Year Incurred losses
2015 $117,591,118
2016 124,688,807
2017 137,939,620
2018 148,768,919
2019 155,123,166
1Losses occurring within a fixed period, whether or not adjusted or paid during the same period, after reinsurance transactions.
Source: NAIC data, sourced from S&P Global Market Intelligence, Insurance Information Institute.
Workers Compensation Insurance And Excess Workers CompensationWorkers compensation insurance provides for the cost of medical care and rehabilitation for injured workers and lost wages and death benefits for the dependents of persons killed in work-related accidents. Workers compensation systems vary from state to state. Workers compensation combined ratios are expressed in two ways: calendar year results reflect claim payments and changes in reserves for accidents that happened in that year or earlier; and accident year results only include losses from a particular year. Excess workers compensation, a coverage geared to employers that self-insure for workers compensation, comes into play when claims exceed a designated dollar amount.
Workers Compensation Insurance, 2010-2019 ($000)
Net premiums written2
Annual percent change
Combined ratio1
Year Calendar year3
Annual point change4 Accident year5
Annual point change
2010 $32,247,870 -12.7% 107.9 6.4 pts. 114 7 pts.
2011 31,643,087 -1.9 116.1 8.2 110 -4
2012 35,664,230 12.7 117.6 1.5 102 -8
2013 38,947,491 9.2 110.4 -7.2 96 -6
2014 41,147,216 5.6 103.0 -7.4 92 -4
2015 43,753,885 6.3 101.9 -1.2 92 0
2016 45,355,102 3.7 95.5 -6.4 93 1
2017 45,619,831 0.6 95.6 0.1 96 3
2018 45,047,380 -1.3 92.2 -3.4 95 -1
2019 48,343,292 7.3 86.2 -5.9 996 4
1After dividends to policyholders. A drop in the combined ratio represents an improvement; an increase represents a deterioration. 2After reinsurance transactions, excludes state funds. 3Calendar year data are from S&P Global Market Intelligence. 4Calculated from unrounded data. 5Accident year data are from the National Council on Compensation Insurance (NCCI). 6Estimated by NCCI.
Source: NAIC data, sourced from S&P Global Market Intelligence, Insurance Information Institute; © National Council on Compensation Insurance.
Insurance Information Institute | www.ii i.org 2021 Insurance Fact Book 117
7. PROPERTY/CASUALTY INSURANCE BY LINECommercial Lines
Top 10 Writers Of Workers' Compensation Insurance By Direct Premiums Written, 2019 ($000)
Rank Group/Company Direct premiums written1 Market share2
1 Travelers Companies Inc. $4,211,529 7.8%
2 Hartford Financial Services 3,365,298 6.2
3 Zurich Insurance Group 2,640,320 4.9
4 Liberty Mutual 2,447,306 4.5
5 Chubb Ltd. 2,430,118 4.5
6 Berkshire Hathaway Inc. 2,311,261 4.3
7 AmTrust Financial 2,172,219 4.0
8 Accident Fund Group 1,744,640 3.2
9 American International Group (AIG) 1,453,477 2.7
10 Old Republic International Corp. 1,408,124 2.6
1Before reinsurance transactions, includes state funds. 2Based on U.S. total, includes territories.
Source: NAIC data, sourced from S&P Global Market Intelligence, Insurance Information Institute.
Excess Workers Compensation Insurance, 2010-2019 ($000)
Year Net premiums written1 Annual percent change Combined ratio2 Annual point change3
2010 $799,733 -15.0% 50.9 16.0 pts.
2011 816,435 2.1 134.7 83.8
2012 815,770 -0.1 153.6 18.9
2013 844,098 3.5 69.3 -84.3
2014 920,223 9.0 108.2 39.0
2015 929,393 1.0 113.6 5.4
2016 889,191 -4.3 111.6 -2.0
2017 796,587 -10.4 101.0 -10.6
2018 1,097,710 37.8 113.1 12.1
2019 931,400 -15.2 113.1 4
1After reinsurance transactions, excludes state funds. 2After dividends to policyholders. A drop in the combined ratio represents an improvement; an increase represents a deterioration. 3Calculated from unrounded data. 4Less than 0.1 point.
Source: NAIC data, sourced from S&P Global Market Intelligence, Insurance Information Institute.
Insurance Information Institute | www.ii i.org 2021 Insurance Fact Book 118
7. PROPERTY/CASUALTY INSURANCE BY LINECommercial Lines
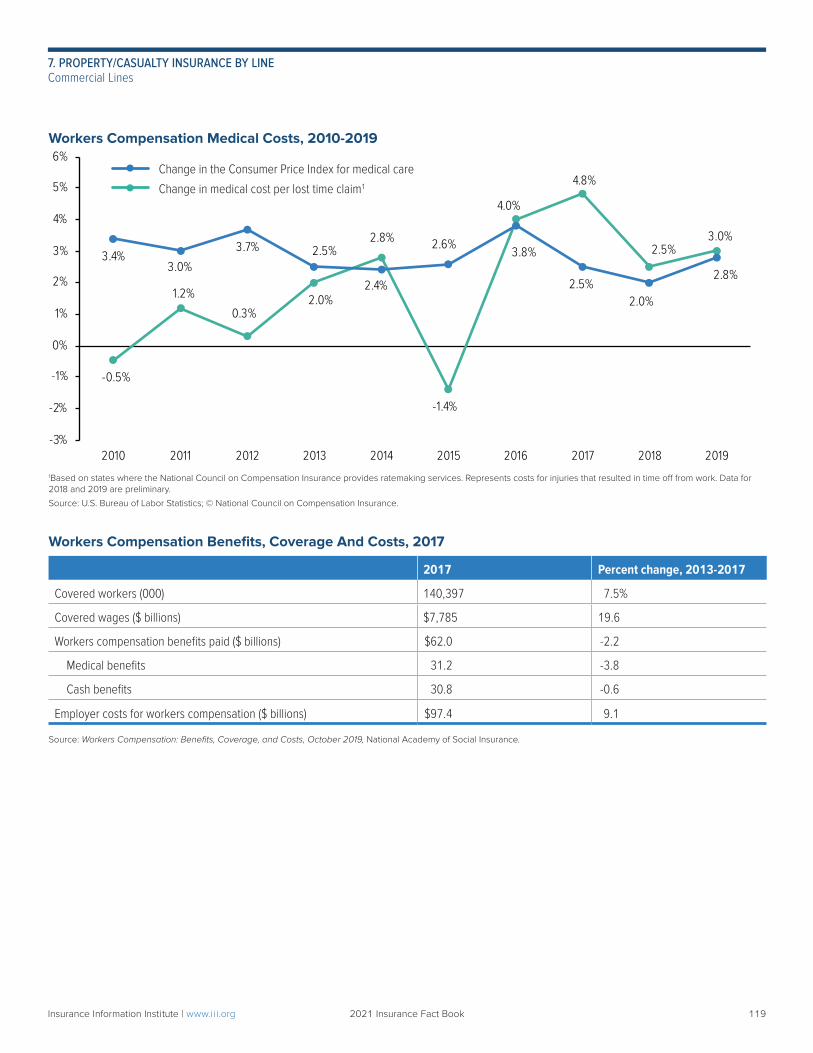
-0.5%
1.2%
0.3%2.0%
2.8%
-1.4%
4.0%
4.8%
2.5%3.0%
3.4%3.0%
3.7% 2.5%
2.4%
2.6%3.8%
2.5%2.0%
2.8%
-3%
-2%
-1%
0%
1%
2%
3%
4%
5%
6%
2010 2011 2012 2013 2014 2015 2016 2017 2018 2019
Workers Compensation Medical Costs, 2010-2019
Workers Compensation Benefits, Coverage And Costs, 2017
2017 Percent change, 2013-2017
Covered workers (000) 140,397 7.5%
Covered wages ($ billions) $7,785 19.6
Workers compensation benefits paid ($ billions) $62.0 -2.2
Medical benefits 31.2 -3.8
Cash benefits 30.8 -0.6
Employer costs for workers compensation ($ billions) $97.4 9.1
Source: Workers Compensation: Benefits, Coverage, and Costs, October 2019, National Academy of Social Insurance.
1Based on states where the National Council on Compensation Insurance provides ratemaking services. Represents costs for injuries that resulted in time off from work. Data for 2018 and 2019 are preliminary.
Source: U.S. Bureau of Labor Statistics; © National Council on Compensation Insurance.
Change in the Consumer Price Index for medical care
Change in medical cost per lost time claim1
Insurance Information Institute | www.ii i.org 2021 Insurance Fact Book 119
7. PROPERTY/CASUALTY INSURANCE BY LINECommercial Lines
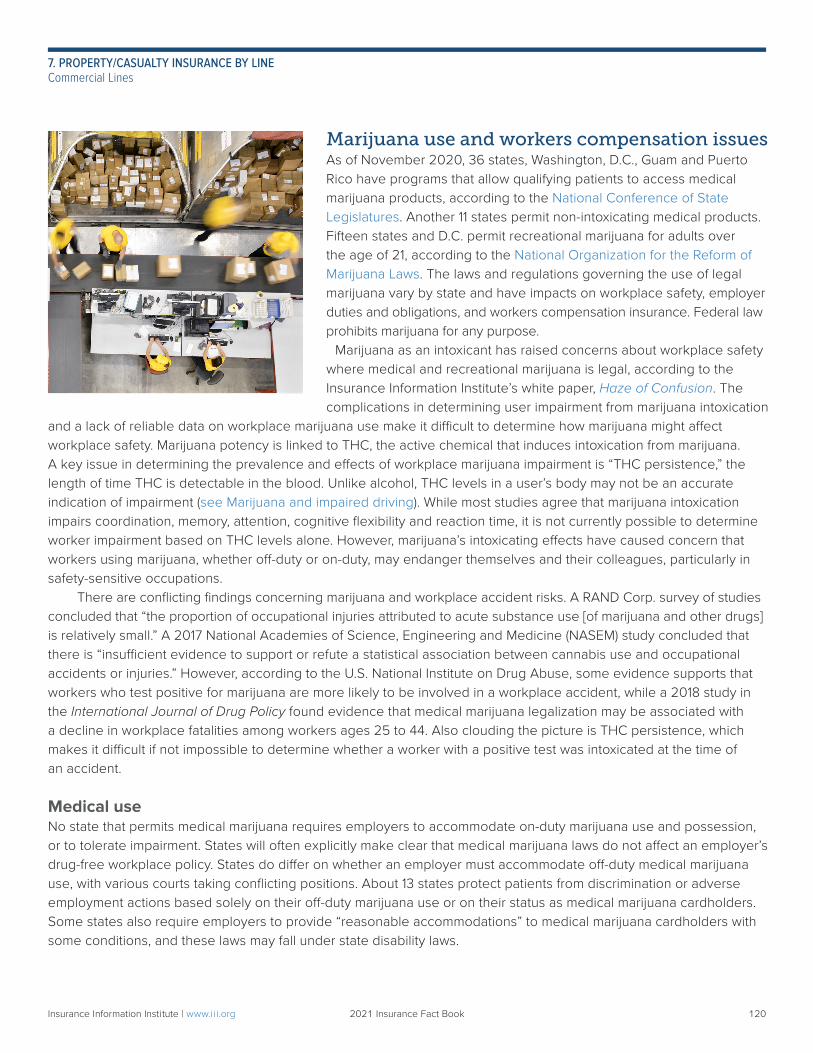
Marijuana use and workers compensation issuesAs of November 2020, 36 states, Washington, D.C., Guam and Puerto Rico have programs that allow qualifying patients to access medical marijuana products, according to the National Conference of State Legislatures. Another 11 states permit non-intoxicating medical products. Fifteen states and D.C. permit recreational marijuana for adults over the age of 21, according to the National Organization for the Reform of Marijuana Laws. The laws and regulations governing the use of legal marijuana vary by state and have impacts on workplace safety, employer duties and obligations, and workers compensation insurance. Federal law prohibits marijuana for any purpose. Marijuana as an intoxicant has raised concerns about workplace safety where medical and recreational marijuana is legal, according to the Insurance Information Institute’s white paper, Haze of Confusion. The complications in determining user impairment from marijuana intoxication
and a lack of reliable data on workplace marijuana use make it difficult to determine how marijuana might affect workplace safety. Marijuana potency is linked to THC, the active chemical that induces intoxication from marijuana. A key issue in determining the prevalence and effects of workplace marijuana impairment is “THC persistence,” the length of time THC is detectable in the blood. Unlike alcohol, THC levels in a user’s body may not be an accurate indication of impairment (see Marijuana and impaired driving). While most studies agree that marijuana intoxication impairs coordination, memory, attention, cognitive flexibility and reaction time, it is not currently possible to determine worker impairment based on THC levels alone. However, marijuana’s intoxicating effects have caused concern that workers using marijuana, whether off-duty or on-duty, may endanger themselves and their colleagues, particularly in safety-sensitive occupations. There are conflicting findings concerning marijuana and workplace accident risks. A RAND Corp. survey of studies concluded that “the proportion of occupational injuries attributed to acute substance use [of marijuana and other drugs] is relatively small.” A 2017 National Academies of Science, Engineering and Medicine (NASEM) study concluded that there is “insufficient evidence to support or refute a statistical association between cannabis use and occupational accidents or injuries.” However, according to the U.S. National Institute on Drug Abuse, some evidence supports that workers who test positive for marijuana are more likely to be involved in a workplace accident, while a 2018 study in the International Journal of Drug Policy found evidence that medical marijuana legalization may be associated with a decline in workplace fatalities among workers ages 25 to 44. Also clouding the picture is THC persistence, which makes it difficult if not impossible to determine whether a worker with a positive test was intoxicated at the time of an accident.
Medical useNo state that permits medical marijuana requires employers to accommodate on-duty marijuana use and possession, or to tolerate impairment. States will often explicitly make clear that medical marijuana laws do not affect an employer’s drug-free workplace policy. States do differ on whether an employer must accommodate off-duty medical marijuana use, with various courts taking conflicting positions. About 13 states protect patients from discrimination or adverse employment actions based solely on their off-duty marijuana use or on their status as medical marijuana cardholders. Some states also require employers to provide “reasonable accommodations” to medical marijuana cardholders with some conditions, and these laws may fall under state disability laws.
Insurance Information Institute | www.ii i.org 2021 Insurance Fact Book 120
7. PROPERTY/CASUALTY INSURANCE BY LINECommercial Lines
Implications for insurersMarijuana is prohibited under the Controlled Substances Act of 1970 (CSA), which established a schedule for substances regulated under federal law. Because of this prohibition, workers who use medical marijuana are not covered by the Americans with Disabilities Act. Coverage under employment practices liability insurance (EPLI) policies, which cover businesses against claims by employees alleging discrimination or wrongful termination, could be affected as marijuana and employment issues evolve, especially if states and/or courts begin to take a more affirmative stance that disability laws and other accommodation laws cover medical or recreational marijuana use. Workers compensation insurers need to address these issues related to marijuana use:
• Whether workers compensation covers a workplace injury in which the injured employee has tested positive for marijuana
• Whether workers compensation reimburses medical marijuana expenses incurred by an injured employee, and if so, how reimbursement works
The answers to these questions will largely depend on state law, as workers compensation is regulated on the state level and medical marijuana regulations vary by state. Workers compensation boards and courts can also interpret state statutes differently. Most states restrict benefits if an employee was intoxicated at the time of injury or if the intoxication was a “proximate cause” of the injury. Some states limit compensation if an injured employee refuses to take a drug test. However, as stated previously it is difficult to determine whether an injured worker was impaired by marijuana when an accident occurred because THC levels in a user’s body may not be an accurate indication of impairment. A handful of states hold that medical marijuana is a permissible and reimbursable treatment under workers compensation. Whether workers compensation insurers are required to reimburse medical marijuana expenses depends on the state. Many state medical marijuana laws specifically exempt certain entities from a reimbursement requirement—usually health insurance providers. It has been argued, as in New York state, that these types of exemptions do not include workers compensation insurers. Other state medical marijuana laws specifically exempt workers compensation insurers and employers from being required to reimburse medical marijuana. In contrast, some states specifically prohibit reimbursement or make medical marijuana ineligible for reimbursement. Currently an injured worker who qualifies for reimbursement under workers compensation is responsible for any purchases from a licensed medical marijuana dispensary. The worker then bills the workers compensation insurer or employer. Reimbursement is impeded by the fact that proper dosages for medical marijuana are still poorly understood and are not standardized across state medical programs. Furthermore, the potency of available medical marijuana and the maximum permissible purchasing amount varies by state.
Insurance Information Institute | www.ii i.org 2021 Insurance Fact Book 121
7. PROPERTY/CASUALTY INSURANCE BY LINECommercial Lines
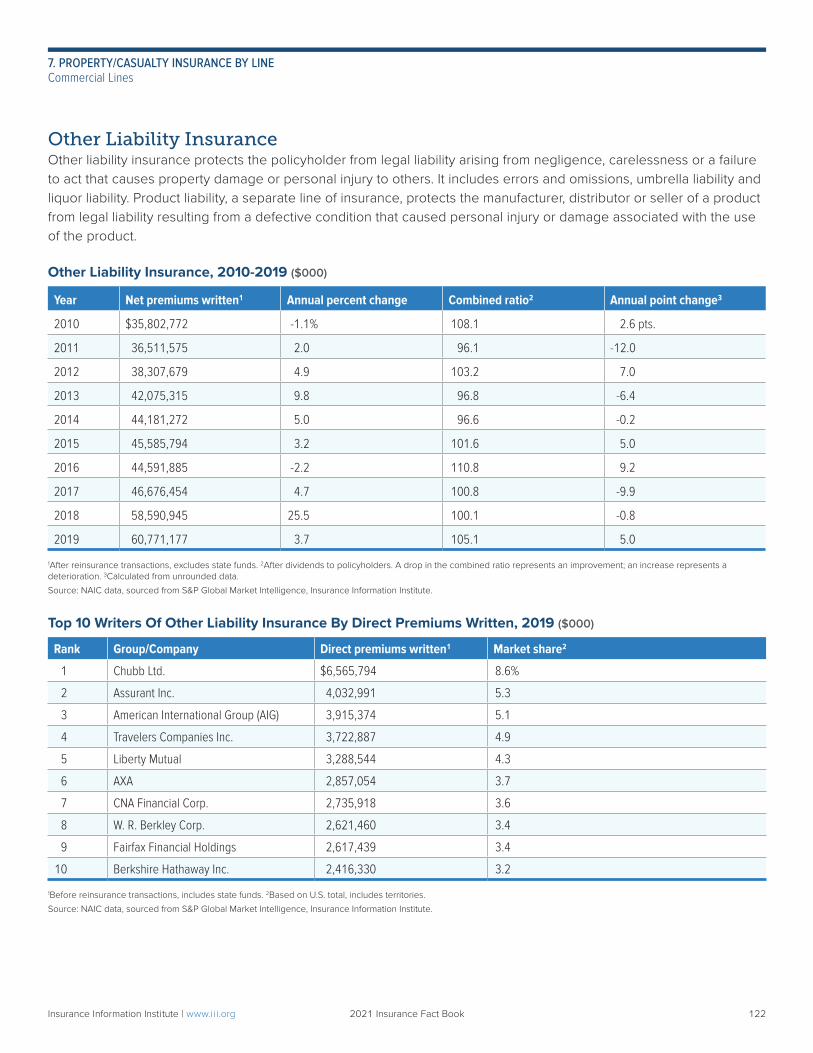
Other Liability InsuranceOther liability insurance protects the policyholder from legal liability arising from negligence, carelessness or a failure to act that causes property damage or personal injury to others. It includes errors and omissions, umbrella liability and liquor liability. Product liability, a separate line of insurance, protects the manufacturer, distributor or seller of a product from legal liability resulting from a defective condition that caused personal injury or damage associated with the use of the product.
Other Liability Insurance, 2010-2019 ($000)
Year Net premiums written1 Annual percent change Combined ratio2 Annual point change3
2010 $35,802,772 -1.1% 108.1 2.6 pts.
2011 36,511,575 2.0 96.1 -12.0
2012 38,307,679 4.9 103.2 7.0
2013 42,075,315 9.8 96.8 -6.4
2014 44,181,272 5.0 96.6 -0.2
2015 45,585,794 3.2 101.6 5.0
2016 44,591,885 -2.2 110.8 9.2
2017 46,676,454 4.7 100.8 -9.9
2018 58,590,945 25.5 100.1 -0.8
2019 60,771,177 3.7 105.1 5.0
1After reinsurance transactions, excludes state funds. 2After dividends to policyholders. A drop in the combined ratio represents an improvement; an increase represents a deterioration. 3Calculated from unrounded data.
Source: NAIC data, sourced from S&P Global Market Intelligence, Insurance Information Institute.
Top 10 Writers Of Other Liability Insurance By Direct Premiums Written, 2019 ($000)
Rank Group/Company Direct premiums written1 Market share2
1 Chubb Ltd. $6,565,794 8.6%
2 Assurant Inc. 4,032,991 5.3
3 American International Group (AIG) 3,915,374 5.1
4 Travelers Companies Inc. 3,722,887 4.9
5 Liberty Mutual 3,288,544 4.3
6 AXA 2,857,054 3.7
7 CNA Financial Corp. 2,735,918 3.6
8 W. R. Berkley Corp. 2,621,460 3.4
9 Fairfax Financial Holdings 2,617,439 3.4
10 Berkshire Hathaway Inc. 2,416,330 3.2
1Before reinsurance transactions, includes state funds. 2Based on U.S. total, includes territories.
Source: NAIC data, sourced from S&P Global Market Intelligence, Insurance Information Institute.
Insurance Information Institute | www.ii i.org 2021 Insurance Fact Book 122
7. PROPERTY/CASUALTY INSURANCE BY LINECommercial Lines
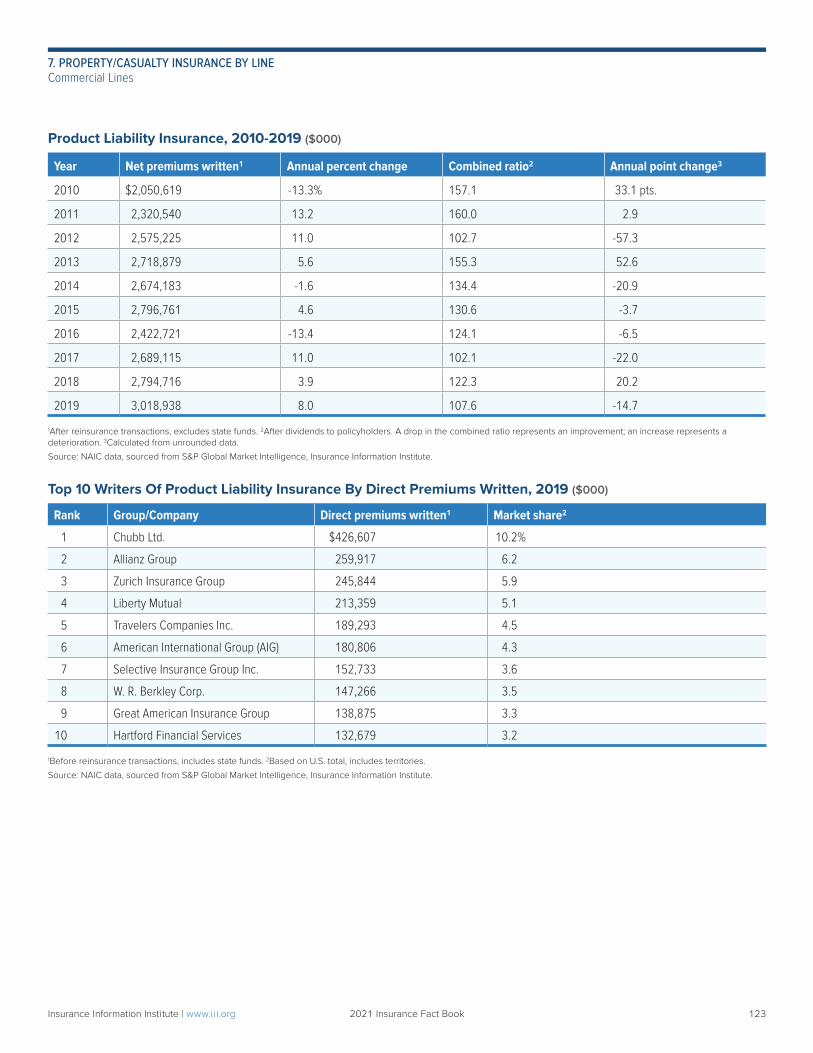
Product Liability Insurance, 2010-2019 ($000)
Year Net premiums written1 Annual percent change Combined ratio2 Annual point change3
2010 $2,050,619 -13.3% 157.1 33.1 pts.
2011 2,320,540 13.2 160.0 2.9
2012 2,575,225 11.0 102.7 -57.3
2013 2,718,879 5.6 155.3 52.6
2014 2,674,183 -1.6 134.4 -20.9
2015 2,796,761 4.6 130.6 -3.7
2016 2,422,721 -13.4 124.1 -6.5
2017 2,689,115 11.0 102.1 -22.0
2018 2,794,716 3.9 122.3 20.2
2019 3,018,938 8.0 107.6 -14.7
1After reinsurance transactions, excludes state funds. 2After dividends to policyholders. A drop in the combined ratio represents an improvement; an increase represents a deterioration. 3Calculated from unrounded data.
Source: NAIC data, sourced from S&P Global Market Intelligence, Insurance Information Institute.
Top 10 Writers Of Product Liability Insurance By Direct Premiums Written, 2019 ($000)
Rank Group/Company Direct premiums written1 Market share2
1 Chubb Ltd. $426,607 10.2%
2 Allianz Group 259,917 6.2
3 Zurich Insurance Group 245,844 5.9
4 Liberty Mutual 213,359 5.1
5 Travelers Companies Inc. 189,293 4.5
6 American International Group (AIG) 180,806 4.3
7 Selective Insurance Group Inc. 152,733 3.6
8 W. R. Berkley Corp. 147,266 3.5
9 Great American Insurance Group 138,875 3.3
10 Hartford Financial Services 132,679 3.2
1Before reinsurance transactions, includes state funds. 2Based on U.S. total, includes territories.
Source: NAIC data, sourced from S&P Global Market Intelligence, Insurance Information Institute.
Insurance Information Institute | www.ii i.org 2021 Insurance Fact Book 123
7. PROPERTY/CASUALTY INSURANCE BY LINECommercial Lines
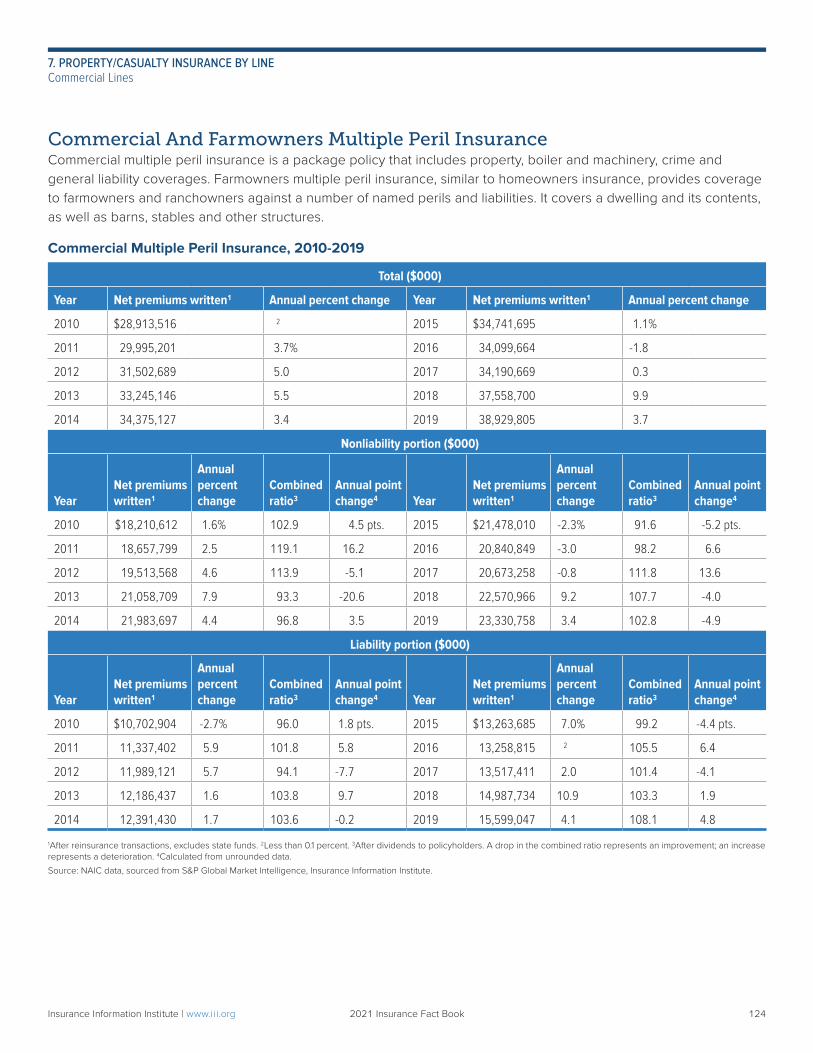
Commercial And Farmowners Multiple Peril InsuranceCommercial multiple peril insurance is a package policy that includes property, boiler and machinery, crime and general liability coverages. Farmowners multiple peril insurance, similar to homeowners insurance, provides coverage to farmowners and ranchowners against a number of named perils and liabilities. It covers a dwelling and its contents, as well as barns, stables and other structures.
Commercial Multiple Peril Insurance, 2010-2019
Total ($000)
Year Net premiums written1 Annual percent change Year Net premiums written1 Annual percent change
2010 $28,913,516 2 2015 $34,741,695 1.1%
2011 29,995,201 3.7% 2016 34,099,664 -1.8
2012 31,502,689 5.0 2017 34,190,669 0.3
2013 33,245,146 5.5 2018 37,558,700 9.9
2014 34,375,127 3.4 2019 38,929,805 3.7
Nonliability portion ($000)
YearNet premiums written1
Annual percent change
Combined ratio3
Annual point change4 Year
Net premiums written1
Annual percent change
Combined ratio3
Annual point change4
2010 $18,210,612 1.6% 102.9 4.5 pts. 2015 $21,478,010 -2.3% 91.6 -5.2 pts.
2011 18,657,799 2.5 119.1 16.2 2016 20,840,849 -3.0 98.2 6.6
2012 19,513,568 4.6 113.9 -5.1 2017 20,673,258 -0.8 111.8 13.6
2013 21,058,709 7.9 93.3 -20.6 2018 22,570,966 9.2 107.7 -4.0
2014 21,983,697 4.4 96.8 3.5 2019 23,330,758 3.4 102.8 -4.9
Liability portion ($000)
YearNet premiums written1
Annual percent change
Combined ratio3
Annual point change4 Year
Net premiums written1
Annual percent change
Combined ratio3
Annual point change4
2010 $10,702,904 -2.7% 96.0 1.8 pts. 2015 $13,263,685 7.0% 99.2 -4.4 pts.
2011 11,337,402 5.9 101.8 5.8 2016 13,258,815 2 105.5 6.4
2012 11,989,121 5.7 94.1 -7.7 2017 13,517,411 2.0 101.4 -4.1
2013 12,186,437 1.6 103.8 9.7 2018 14,987,734 10.9 103.3 1.9
2014 12,391,430 1.7 103.6 -0.2 2019 15,599,047 4.1 108.1 4.8
1After reinsurance transactions, excludes state funds. 2Less than 0.1 percent. 3After dividends to policyholders. A drop in the combined ratio represents an improvement; an increase represents a deterioration. 4Calculated from unrounded data.
Source: NAIC data, sourced from S&P Global Market Intelligence, Insurance Information Institute.
Insurance Information Institute | www.ii i.org 2021 Insurance Fact Book 124
7. PROPERTY/CASUALTY INSURANCE BY LINECommercial Lines
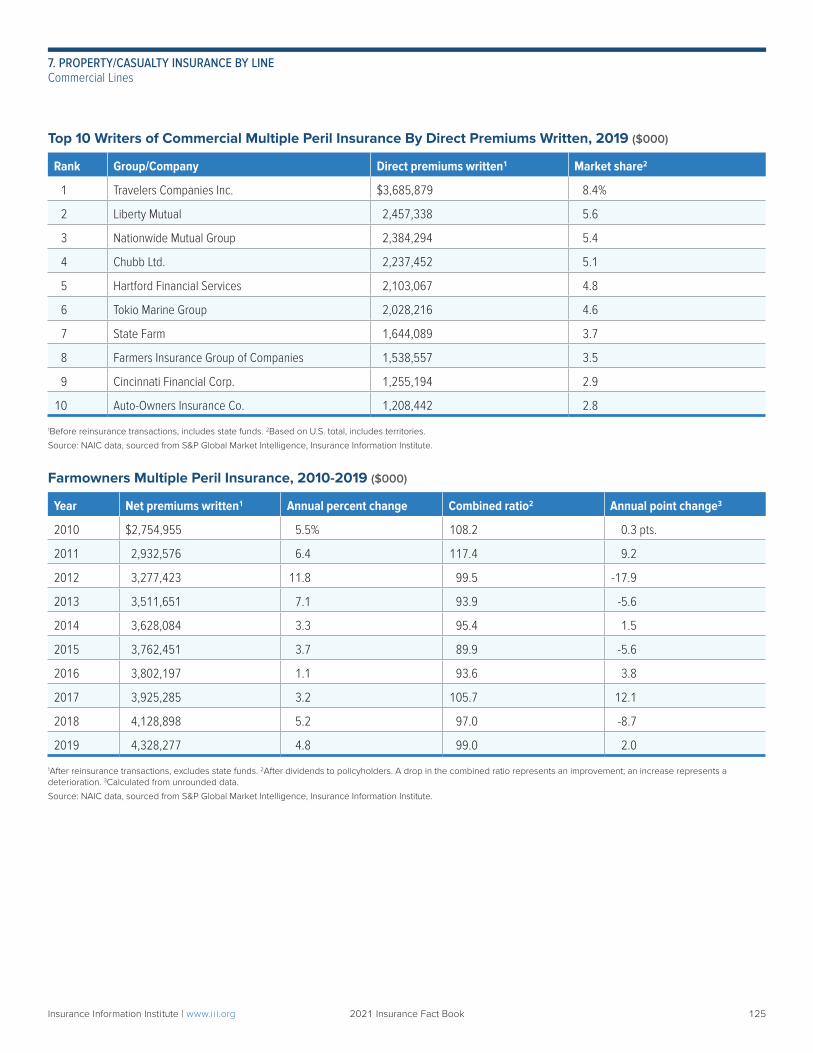
Top 10 Writers of Commercial Multiple Peril Insurance By Direct Premiums Written, 2019 ($000)
Rank Group/Company Direct premiums written1 Market share2
1 Travelers Companies Inc. $3,685,879 8.4%
2 Liberty Mutual 2,457,338 5.6
3 Nationwide Mutual Group 2,384,294 5.4
4 Chubb Ltd. 2,237,452 5.1
5 Hartford Financial Services 2,103,067 4.8
6 Tokio Marine Group 2,028,216 4.6
7 State Farm 1,644,089 3.7
8 Farmers Insurance Group of Companies 1,538,557 3.5
9 Cincinnati Financial Corp. 1,255,194 2.9
10 Auto-Owners Insurance Co. 1,208,442 2.8
1Before reinsurance transactions, includes state funds. 2Based on U.S. total, includes territories.
Source: NAIC data, sourced from S&P Global Market Intelligence, Insurance Information Institute.
Farmowners Multiple Peril Insurance, 2010-2019 ($000)
Year Net premiums written1 Annual percent change Combined ratio2 Annual point change3
2010 $2,754,955 5.5% 108.2 0.3 pts.
2011 2,932,576 6.4 117.4 9.2
2012 3,277,423 11.8 99.5 -17.9
2013 3,511,651 7.1 93.9 -5.6
2014 3,628,084 3.3 95.4 1.5
2015 3,762,451 3.7 89.9 -5.6
2016 3,802,197 1.1 93.6 3.8
2017 3,925,285 3.2 105.7 12.1
2018 4,128,898 5.2 97.0 -8.7
2019 4,328,277 4.8 99.0 2.0
1After reinsurance transactions, excludes state funds. 2After dividends to policyholders. A drop in the combined ratio represents an improvement; an increase represents a deterioration. 3Calculated from unrounded data.
Source: NAIC data, sourced from S&P Global Market Intelligence, Insurance Information Institute.
Insurance Information Institute | www.ii i.org 2021 Insurance Fact Book 125
7. PROPERTY/CASUALTY INSURANCE BY LINECommercial Lines
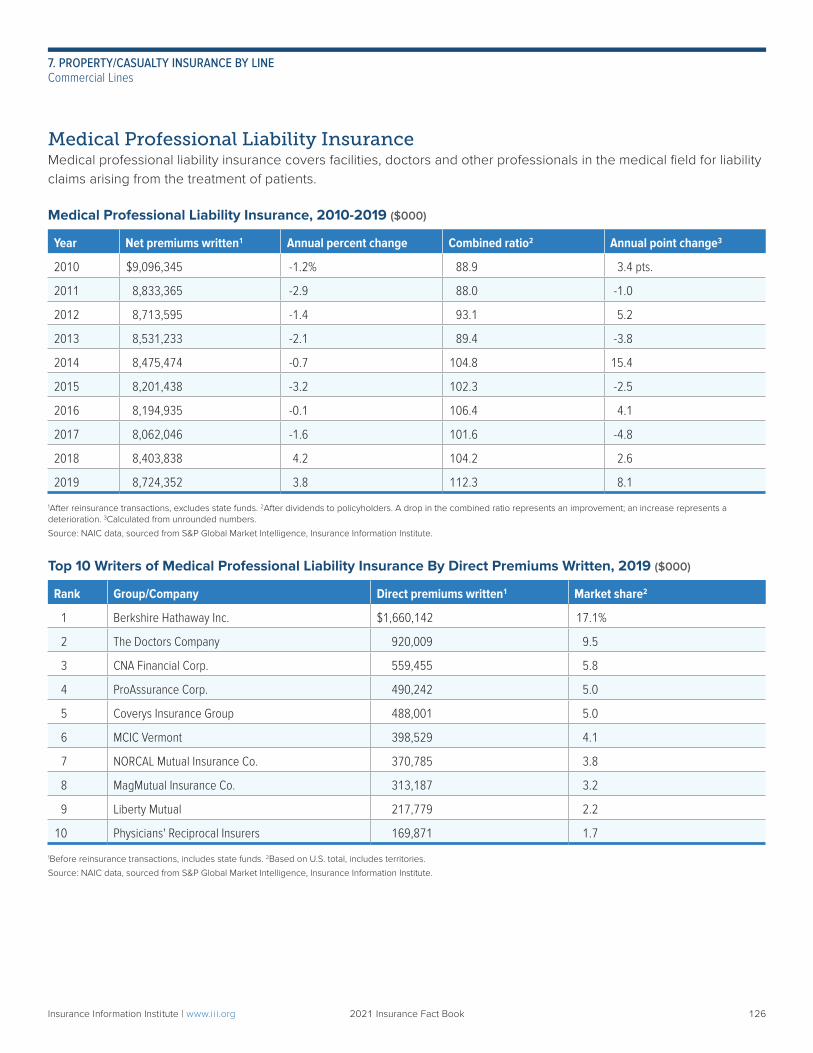
Medical Professional Liability InsuranceMedical professional liability insurance covers facilities, doctors and other professionals in the medical field for liability claims arising from the treatment of patients.
Medical Professional Liability Insurance, 2010-2019 ($000)
Year Net premiums written1 Annual percent change Combined ratio2 Annual point change3
2010 $9,096,345 -1.2% 88.9 3.4 pts.
2011 8,833,365 -2.9 88.0 -1.0
2012 8,713,595 -1.4 93.1 5.2
2013 8,531,233 -2.1 89.4 -3.8
2014 8,475,474 -0.7 104.8 15.4
2015 8,201,438 -3.2 102.3 -2.5
2016 8,194,935 -0.1 106.4 4.1
2017 8,062,046 -1.6 101.6 -4.8
2018 8,403,838 4.2 104.2 2.6
2019 8,724,352 3.8 112.3 8.1
1After reinsurance transactions, excludes state funds. 2After dividends to policyholders. A drop in the combined ratio represents an improvement; an increase represents a deterioration. 3Calculated from unrounded numbers.
Source: NAIC data, sourced from S&P Global Market Intelligence, Insurance Information Institute.
Top 10 Writers of Medical Professional Liability Insurance By Direct Premiums Written, 2019 ($000)
Rank Group/Company Direct premiums written1 Market share2
1 Berkshire Hathaway Inc. $1,660,142 17.1%
2 The Doctors Company 920,009 9.5
3 CNA Financial Corp. 559,455 5.8
4 ProAssurance Corp. 490,242 5.0
5 Coverys Insurance Group 488,001 5.0
6 MCIC Vermont 398,529 4.1
7 NORCAL Mutual Insurance Co. 370,785 3.8
8 MagMutual Insurance Co. 313,187 3.2
9 Liberty Mutual 217,779 2.2
10 Physicians' Reciprocal Insurers 169,871 1.7
1Before reinsurance transactions, includes state funds. 2Based on U.S. total, includes territories.
Source: NAIC data, sourced from S&P Global Market Intelligence, Insurance Information Institute.
Insurance Information Institute | www.ii i.org 2021 Insurance Fact Book 126
7. PROPERTY/CASUALTY INSURANCE BY LINECommercial Lines
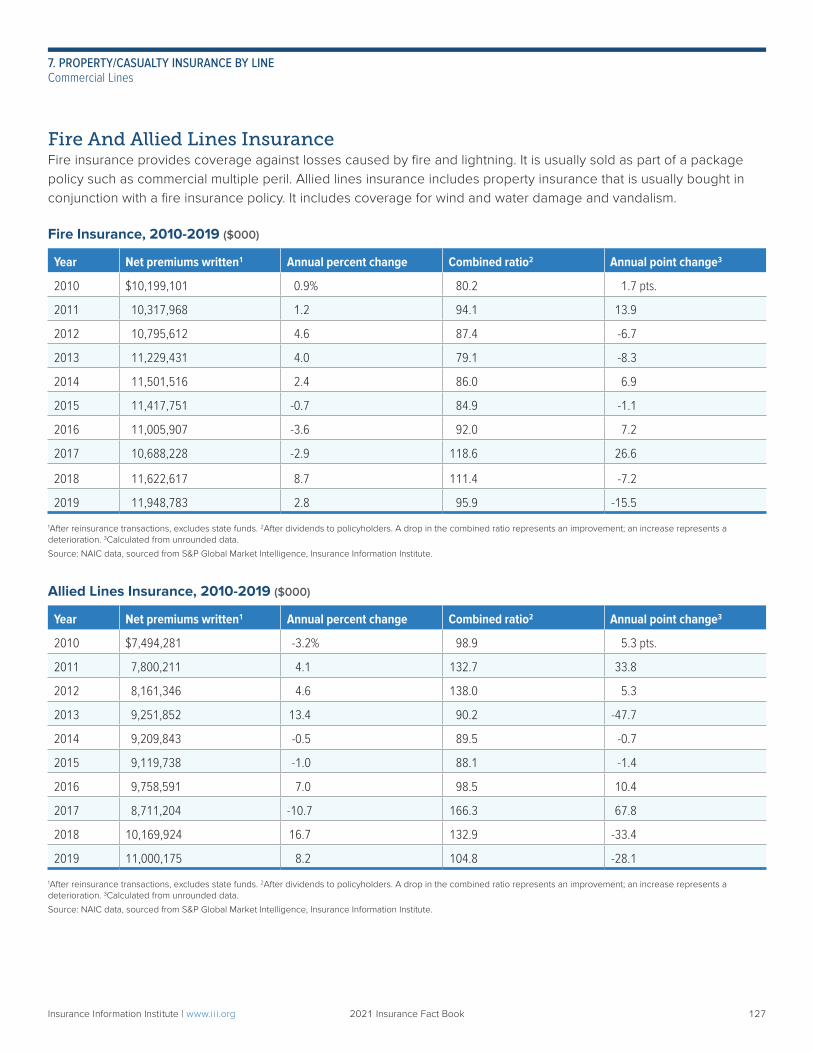
Fire And Allied Lines InsuranceFire insurance provides coverage against losses caused by fire and lightning. It is usually sold as part of a package policy such as commercial multiple peril. Allied lines insurance includes property insurance that is usually bought in conjunction with a fire insurance policy. It includes coverage for wind and water damage and vandalism.
Fire Insurance, 2010-2019 ($000)
Year Net premiums written1 Annual percent change Combined ratio2 Annual point change3
2010 $10,199,101 0.9% 80.2 1.7 pts.
2011 10,317,968 1.2 94.1 13.9
2012 10,795,612 4.6 87.4 -6.7
2013 11,229,431 4.0 79.1 -8.3
2014 11,501,516 2.4 86.0 6.9
2015 11,417,751 -0.7 84.9 -1.1
2016 11,005,907 -3.6 92.0 7.2
2017 10,688,228 -2.9 118.6 26.6
2018 11,622,617 8.7 111.4 -7.2
2019 11,948,783 2.8 95.9 -15.5
1After reinsurance transactions, excludes state funds. 2After dividends to policyholders. A drop in the combined ratio represents an improvement; an increase represents a deterioration. 3Calculated from unrounded data.
Source: NAIC data, sourced from S&P Global Market Intelligence, Insurance Information Institute.
Allied Lines Insurance, 2010-2019 ($000)
Year Net premiums written1 Annual percent change Combined ratio2 Annual point change3
2010 $7,494,281 -3.2% 98.9 5.3 pts.
2011 7,800,211 4.1 132.7 33.8
2012 8,161,346 4.6 138.0 5.3
2013 9,251,852 13.4 90.2 -47.7
2014 9,209,843 -0.5 89.5 -0.7
2015 9,119,738 -1.0 88.1 -1.4
2016 9,758,591 7.0 98.5 10.4
2017 8,711,204 -10.7 166.3 67.8
2018 10,169,924 16.7 132.9 -33.4
2019 11,000,175 8.2 104.8 -28.1
1After reinsurance transactions, excludes state funds. 2After dividends to policyholders. A drop in the combined ratio represents an improvement; an increase represents a deterioration. 3Calculated from unrounded data.
Source: NAIC data, sourced from S&P Global Market Intelligence, Insurance Information Institute.
Insurance Information Institute | www.ii i.org 2021 Insurance Fact Book 127
7. PROPERTY/CASUALTY INSURANCE BY LINECommercial Lines
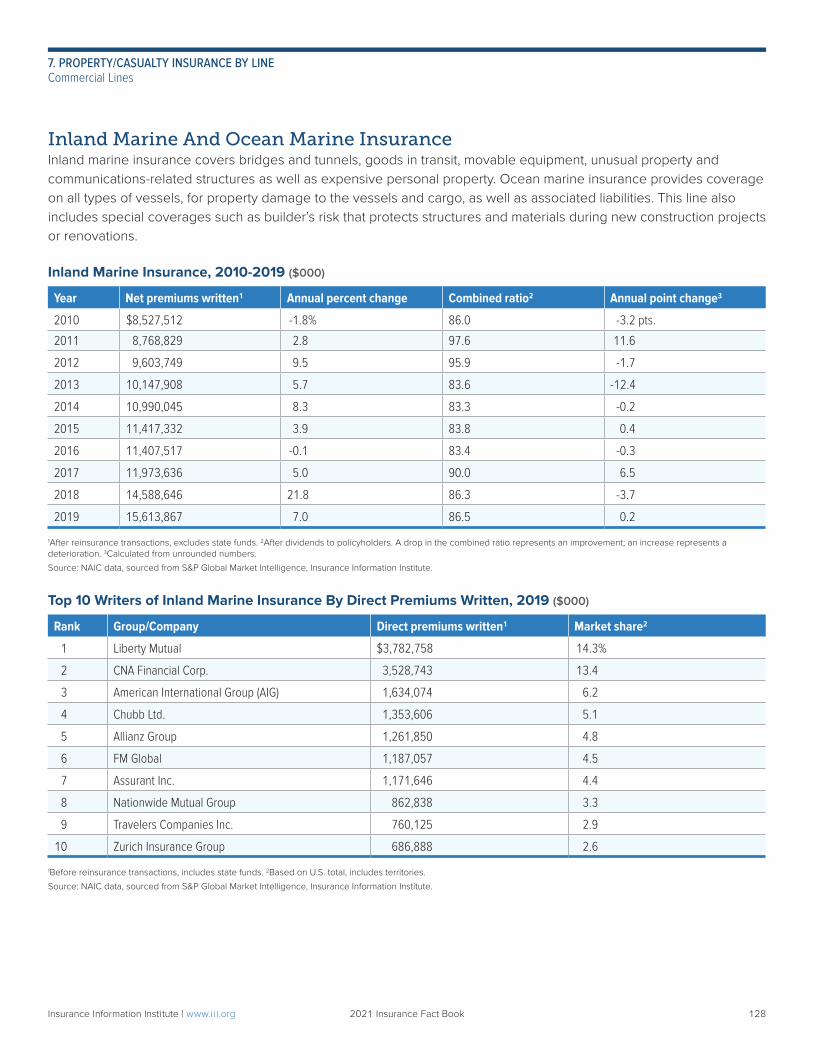
Inland Marine And Ocean Marine InsuranceInland marine insurance covers bridges and tunnels, goods in transit, movable equipment, unusual property and communications-related structures as well as expensive personal property. Ocean marine insurance provides coverage on all types of vessels, for property damage to the vessels and cargo, as well as associated liabilities. This line also includes special coverages such as builder’s risk that protects structures and materials during new construction projects or renovations.
Inland Marine Insurance, 2010-2019 ($000)
Year Net premiums written1 Annual percent change Combined ratio2 Annual point change3
2010 $8,527,512 -1.8% 86.0 -3.2 pts.
2011 8,768,829 2.8 97.6 11.6
2012 9,603,749 9.5 95.9 -1.7
2013 10,147,908 5.7 83.6 -12.4
2014 10,990,045 8.3 83.3 -0.2
2015 11,417,332 3.9 83.8 0.4
2016 11,407,517 -0.1 83.4 -0.3
2017 11,973,636 5.0 90.0 6.5
2018 14,588,646 21.8 86.3 -3.7
2019 15,613,867 7.0 86.5 0.2
1After reinsurance transactions, excludes state funds. 2After dividends to policyholders. A drop in the combined ratio represents an improvement; an increase represents a deterioration. 3Calculated from unrounded numbers.
Source: NAIC data, sourced from S&P Global Market Intelligence, Insurance Information Institute.
Top 10 Writers of Inland Marine Insurance By Direct Premiums Written, 2019 ($000)
Rank Group/Company Direct premiums written1 Market share2
1 Liberty Mutual $3,782,758 14.3%
2 CNA Financial Corp. 3,528,743 13.4
3 American International Group (AIG) 1,634,074 6.2
4 Chubb Ltd. 1,353,606 5.1
5 Allianz Group 1,261,850 4.8
6 FM Global 1,187,057 4.5
7 Assurant Inc. 1,171,646 4.4
8 Nationwide Mutual Group 862,838 3.3
9 Travelers Companies Inc. 760,125 2.9
10 Zurich Insurance Group 686,888 2.6
1Before reinsurance transactions, includes state funds. 2Based on U.S. total, includes territories.
Source: NAIC data, sourced from S&P Global Market Intelligence, Insurance Information Institute.
Insurance Information Institute | www.ii i.org 2021 Insurance Fact Book 128
7. PROPERTY/CASUALTY INSURANCE BY LINECommercial Lines
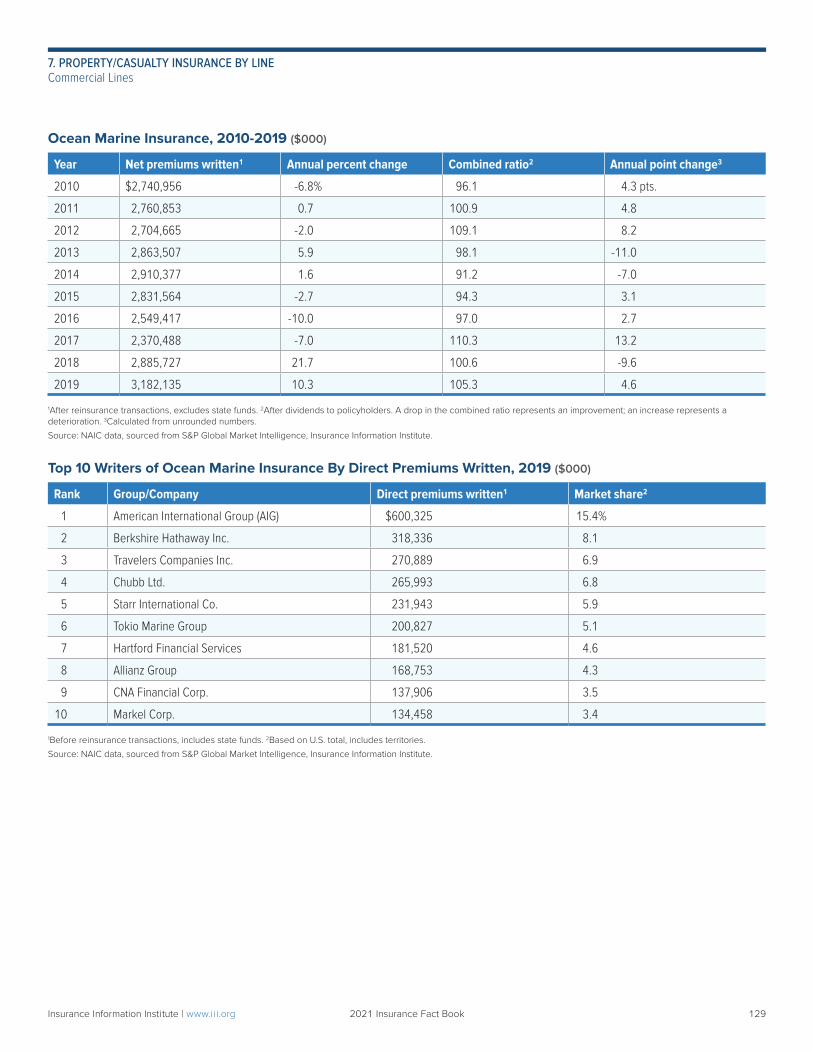
Ocean Marine Insurance, 2010-2019 ($000)
Year Net premiums written1 Annual percent change Combined ratio2 Annual point change3
2010 $2,740,956 -6.8% 96.1 4.3 pts.
2011 2,760,853 0.7 100.9 4.8
2012 2,704,665 -2.0 109.1 8.2
2013 2,863,507 5.9 98.1 -11.0
2014 2,910,377 1.6 91.2 -7.0
2015 2,831,564 -2.7 94.3 3.1
2016 2,549,417 -10.0 97.0 2.7
2017 2,370,488 -7.0 110.3 13.2
2018 2,885,727 21.7 100.6 -9.6
2019 3,182,135 10.3 105.3 4.6
1After reinsurance transactions, excludes state funds. 2After dividends to policyholders. A drop in the combined ratio represents an improvement; an increase represents a deterioration. 3Calculated from unrounded numbers.
Source: NAIC data, sourced from S&P Global Market Intelligence, Insurance Information Institute.
Top 10 Writers of Ocean Marine Insurance By Direct Premiums Written, 2019 ($000)
Rank Group/Company Direct premiums written1 Market share2
1 American International Group (AIG) $600,325 15.4%
2 Berkshire Hathaway Inc. 318,336 8.1
3 Travelers Companies Inc. 270,889 6.9
4 Chubb Ltd. 265,993 6.8
5 Starr International Co. 231,943 5.9
6 Tokio Marine Group 200,827 5.1
7 Hartford Financial Services 181,520 4.6
8 Allianz Group 168,753 4.3
9 CNA Financial Corp. 137,906 3.5
10 Markel Corp. 134,458 3.4
1Before reinsurance transactions, includes state funds. 2Based on U.S. total, includes territories.
Source: NAIC data, sourced from S&P Global Market Intelligence, Insurance Information Institute.
Insurance Information Institute | www.ii i.org 2021 Insurance Fact Book 129
7. PROPERTY/CASUALTY INSURANCE BY LINECommercial Lines
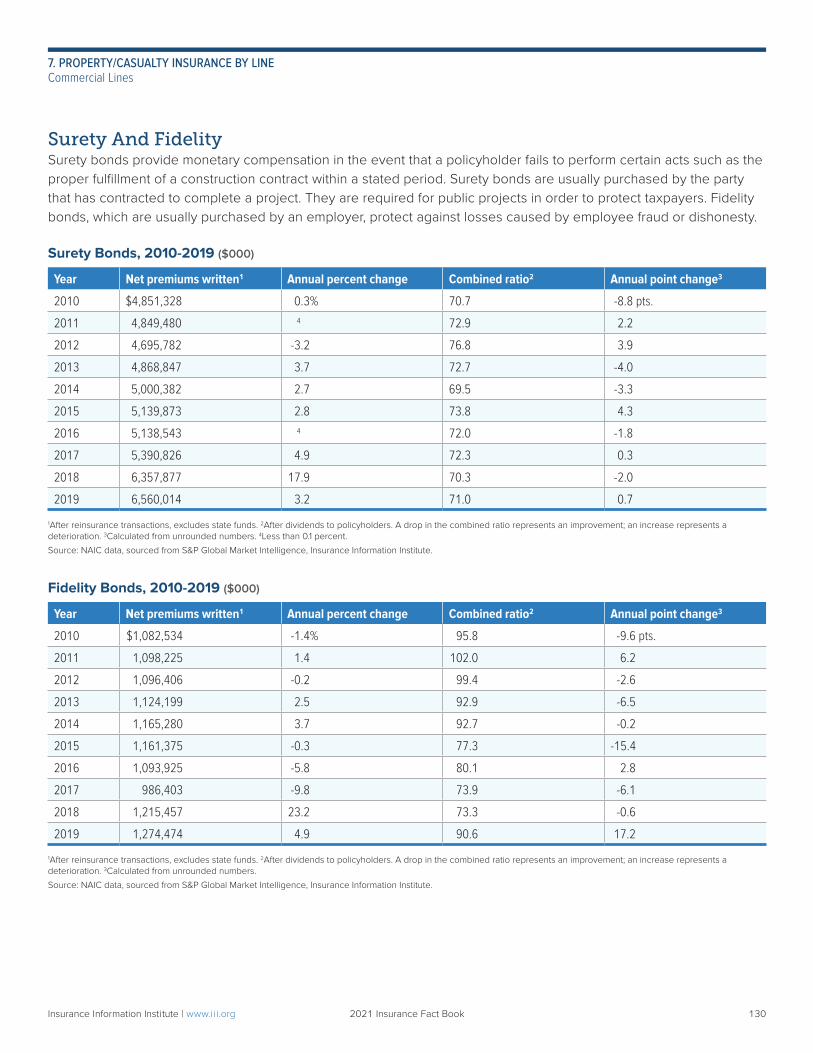
Surety And FidelitySurety bonds provide monetary compensation in the event that a policyholder fails to perform certain acts such as the proper fulfillment of a construction contract within a stated period. Surety bonds are usually purchased by the party that has contracted to complete a project. They are required for public projects in order to protect taxpayers. Fidelity bonds, which are usually purchased by an employer, protect against losses caused by employee fraud or dishonesty.
Surety Bonds, 2010-2019 ($000)
Year Net premiums written1 Annual percent change Combined ratio2 Annual point change3
2010 $4,851,328 0.3% 70.7 -8.8 pts.
2011 4,849,480 4 72.9 2.2
2012 4,695,782 -3.2 76.8 3.9
2013 4,868,847 3.7 72.7 -4.0
2014 5,000,382 2.7 69.5 -3.3
2015 5,139,873 2.8 73.8 4.3
2016 5,138,543 4 72.0 -1.8
2017 5,390,826 4.9 72.3 0.3
2018 6,357,877 17.9 70.3 -2.0
2019 6,560,014 3.2 71.0 0.7
1After reinsurance transactions, excludes state funds. 2After dividends to policyholders. A drop in the combined ratio represents an improvement; an increase represents a deterioration. 3Calculated from unrounded numbers. 4Less than 0.1 percent.
Source: NAIC data, sourced from S&P Global Market Intelligence, Insurance Information Institute.
Fidelity Bonds, 2010-2019 ($000)
Year Net premiums written1 Annual percent change Combined ratio2 Annual point change3
2010 $1,082,534 -1.4% 95.8 -9.6 pts.
2011 1,098,225 1.4 102.0 6.2
2012 1,096,406 -0.2 99.4 -2.6
2013 1,124,199 2.5 92.9 -6.5
2014 1,165,280 3.7 92.7 -0.2
2015 1,161,375 -0.3 77.3 -15.4
2016 1,093,925 -5.8 80.1 2.8
2017 986,403 -9.8 73.9 -6.1
2018 1,215,457 23.2 73.3 -0.6
2019 1,274,474 4.9 90.6 17.2
1After reinsurance transactions, excludes state funds. 2After dividends to policyholders. A drop in the combined ratio represents an improvement; an increase represents a deterioration. 3Calculated from unrounded numbers.
Source: NAIC data, sourced from S&P Global Market Intelligence, Insurance Information Institute.
Insurance Information Institute | www.ii i.org 2021 Insurance Fact Book 130
7. PROPERTY/CASUALTY INSURANCE BY LINECommercial Lines
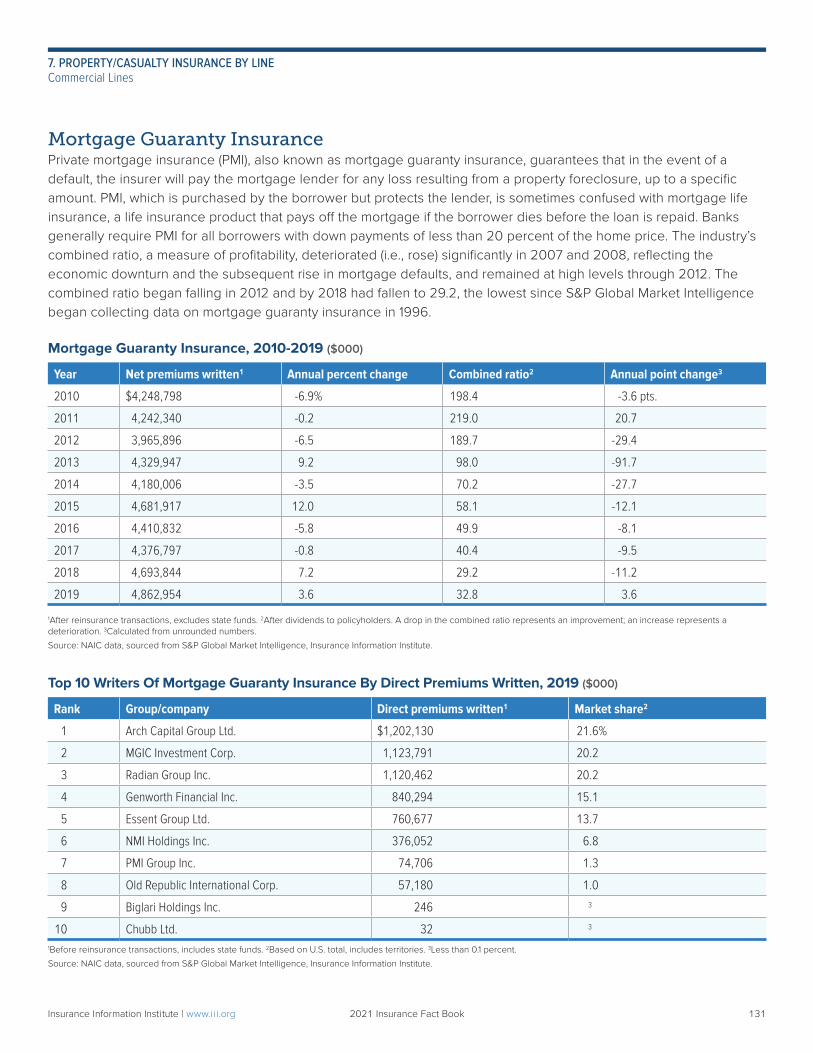
Mortgage Guaranty InsurancePrivate mortgage insurance (PMI), also known as mortgage guaranty insurance, guarantees that in the event of a default, the insurer will pay the mortgage lender for any loss resulting from a property foreclosure, up to a specific amount. PMI, which is purchased by the borrower but protects the lender, is sometimes confused with mortgage life insurance, a life insurance product that pays off the mortgage if the borrower dies before the loan is repaid. Banks generally require PMI for all borrowers with down payments of less than 20 percent of the home price. The industry’s combined ratio, a measure of profitability, deteriorated (i.e., rose) significantly in 2007 and 2008, reflecting the economic downturn and the subsequent rise in mortgage defaults, and remained at high levels through 2012. The combined ratio began falling in 2012 and by 2018 had fallen to 29.2, the lowest since S&P Global Market Intelligence began collecting data on mortgage guaranty insurance in 1996.
Mortgage Guaranty Insurance, 2010-2019 ($000)
Year Net premiums written1 Annual percent change Combined ratio2 Annual point change3
2010 $4,248,798 -6.9% 198.4 -3.6 pts.
2011 4,242,340 -0.2 219.0 20.7
2012 3,965,896 -6.5 189.7 -29.4
2013 4,329,947 9.2 98.0 -91.7
2014 4,180,006 -3.5 70.2 -27.7
2015 4,681,917 12.0 58.1 -12.1
2016 4,410,832 -5.8 49.9 -8.1
2017 4,376,797 -0.8 40.4 -9.5
2018 4,693,844 7.2 29.2 -11.2
2019 4,862,954 3.6 32.8 3.6
1After reinsurance transactions, excludes state funds. 2After dividends to policyholders. A drop in the combined ratio represents an improvement; an increase represents a deterioration. 3Calculated from unrounded numbers.
Source: NAIC data, sourced from S&P Global Market Intelligence, Insurance Information Institute.
Top 10 Writers Of Mortgage Guaranty Insurance By Direct Premiums Written, 2019 ($000)
Rank Group/company Direct premiums written1 Market share2
1 Arch Capital Group Ltd. $1,202,130 21.6%
2 MGIC Investment Corp. 1,123,791 20.2
3 Radian Group Inc. 1,120,462 20.2
4 Genworth Financial Inc. 840,294 15.1
5 Essent Group Ltd. 760,677 13.7
6 NMI Holdings Inc. 376,052 6.8
7 PMI Group Inc. 74,706 1.3
8 Old Republic International Corp. 57,180 1.0
9 Biglari Holdings Inc. 246 3
10 Chubb Ltd. 32 3
1Before reinsurance transactions, includes state funds. 2Based on U.S. total, includes territories. 3Less than 0.1 percent.
Source: NAIC data, sourced from S&P Global Market Intelligence, Insurance Information Institute.
Insurance Information Institute | www.ii i.org 2021 Insurance Fact Book 131
7. PROPERTY/CASUALTY INSURANCE BY LINECommercial Lines
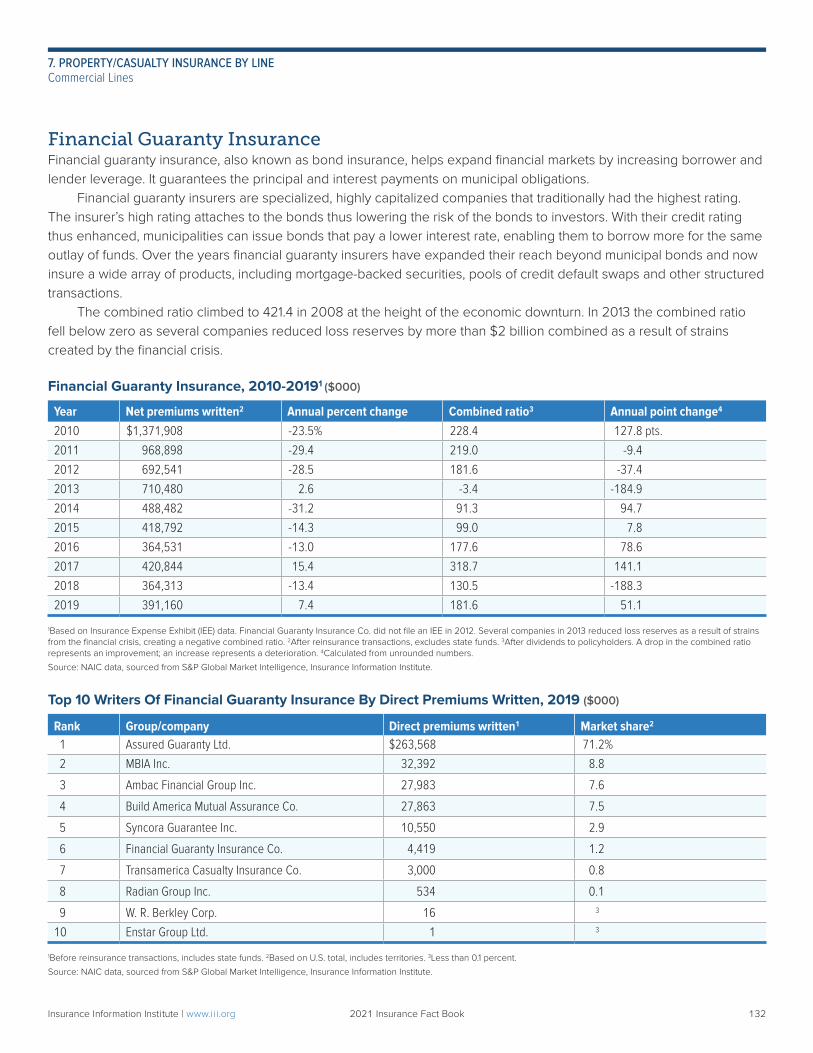
Financial Guaranty InsuranceFinancial guaranty insurance, also known as bond insurance, helps expand financial markets by increasing borrower and lender leverage. It guarantees the principal and interest payments on municipal obligations. Financial guaranty insurers are specialized, highly capitalized companies that traditionally had the highest rating. The insurer’s high rating attaches to the bonds thus lowering the risk of the bonds to investors. With their credit rating thus enhanced, municipalities can issue bonds that pay a lower interest rate, enabling them to borrow more for the same outlay of funds. Over the years financial guaranty insurers have expanded their reach beyond municipal bonds and now insure a wide array of products, including mortgage-backed securities, pools of credit default swaps and other structured transactions. The combined ratio climbed to 421.4 in 2008 at the height of the economic downturn. In 2013 the combined ratio fell below zero as several companies reduced loss reserves by more than $2 billion combined as a result of strains created by the financial crisis.
Financial Guaranty Insurance, 2010-20191 ($000)
Year Net premiums written2 Annual percent change Combined ratio3 Annual point change4
2010 $1,371,908 -23.5% 228.4 127.8 pts.
2011 968,898 -29.4 219.0 -9.4
2012 692,541 -28.5 181.6 -37.4
2013 710,480 2.6 -3.4 -184.9
2014 488,482 -31.2 91.3 94.7
2015 418,792 -14.3 99.0 7.8
2016 364,531 -13.0 177.6 78.6
2017 420,844 15.4 318.7 141.1
2018 364,313 -13.4 130.5 -188.3
2019 391,160 7.4 181.6 51.1
1Based on Insurance Expense Exhibit (IEE) data. Financial Guaranty Insurance Co. did not file an IEE in 2012. Several companies in 2013 reduced loss reserves as a result of strains from the financial crisis, creating a negative combined ratio. 2After reinsurance transactions, excludes state funds. 3After dividends to policyholders. A drop in the combined ratio represents an improvement; an increase represents a deterioration. 4Calculated from unrounded numbers.
Source: NAIC data, sourced from S&P Global Market Intelligence, Insurance Information Institute.
Top 10 Writers Of Financial Guaranty Insurance By Direct Premiums Written, 2019 ($000)
Rank Group/company Direct premiums written1 Market share2
1 Assured Guaranty Ltd. $263,568 71.2%
2 MBIA Inc. 32,392 8.8
3 Ambac Financial Group Inc. 27,983 7.6
4 Build America Mutual Assurance Co. 27,863 7.5
5 Syncora Guarantee Inc. 10,550 2.9
6 Financial Guaranty Insurance Co. 4,419 1.2
7 Transamerica Casualty Insurance Co. 3,000 0.8
8 Radian Group Inc. 534 0.1
9 W. R. Berkley Corp. 16 3
10 Enstar Group Ltd. 1 3
1Before reinsurance transactions, includes state funds. 2Based on U.S. total, includes territories. 3Less than 0.1 percent.
Source: NAIC data, sourced from S&P Global Market Intelligence, Insurance Information Institute.
Insurance Information Institute | www.ii i.org 2021 Insurance Fact Book 132
7. PROPERTY/CASUALTY INSURANCE BY LINECommercial Lines
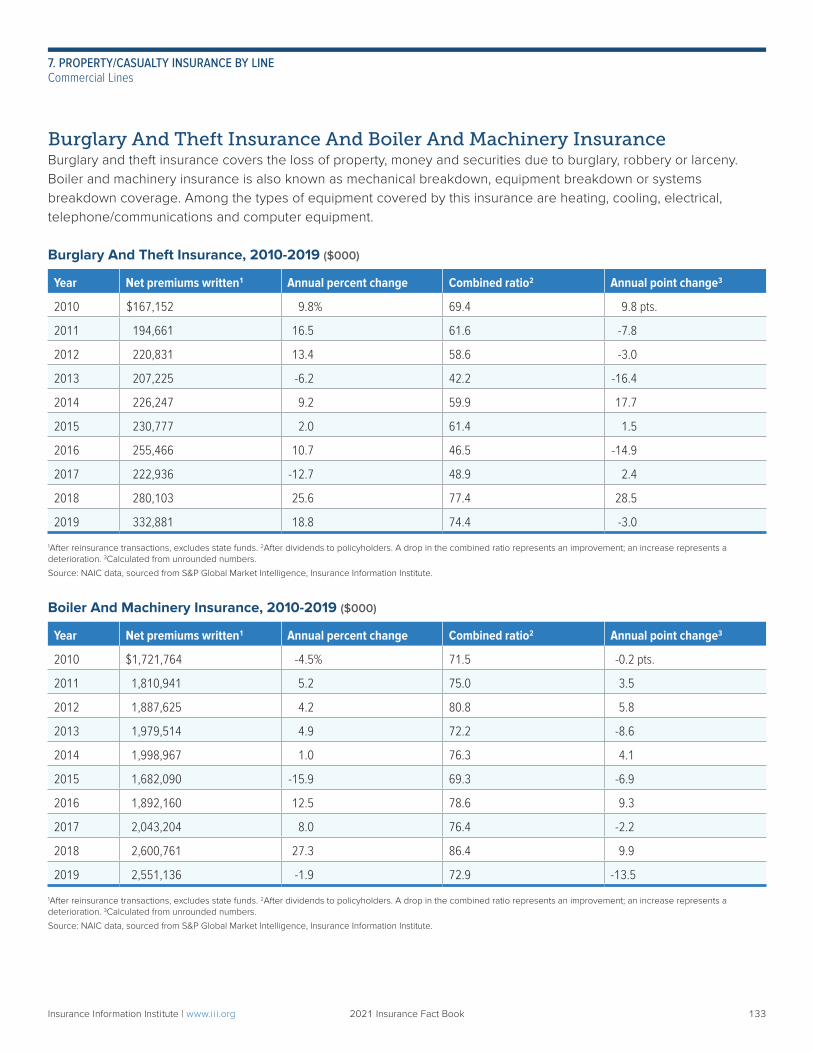
Burglary And Theft Insurance And Boiler And Machinery InsuranceBurglary and theft insurance covers the loss of property, money and securities due to burglary, robbery or larceny. Boiler and machinery insurance is also known as mechanical breakdown, equipment breakdown or systems breakdown coverage. Among the types of equipment covered by this insurance are heating, cooling, electrical, telephone/communications and computer equipment.
Burglary And Theft Insurance, 2010-2019 ($000)
Year Net premiums written1 Annual percent change Combined ratio2 Annual point change3
2010 $167,152 9.8% 69.4 9.8 pts.
2011 194,661 16.5 61.6 -7.8
2012 220,831 13.4 58.6 -3.0
2013 207,225 -6.2 42.2 -16.4
2014 226,247 9.2 59.9 17.7
2015 230,777 2.0 61.4 1.5
2016 255,466 10.7 46.5 -14.9
2017 222,936 -12.7 48.9 2.4
2018 280,103 25.6 77.4 28.5
2019 332,881 18.8 74.4 -3.0
1After reinsurance transactions, excludes state funds. 2After dividends to policyholders. A drop in the combined ratio represents an improvement; an increase represents a deterioration. 3Calculated from unrounded numbers.
Source: NAIC data, sourced from S&P Global Market Intelligence, Insurance Information Institute.
Boiler And Machinery Insurance, 2010-2019 ($000)
Year Net premiums written1 Annual percent change Combined ratio2 Annual point change3
2010 $1,721,764 -4.5% 71.5 -0.2 pts.
2011 1,810,941 5.2 75.0 3.5
2012 1,887,625 4.2 80.8 5.8
2013 1,979,514 4.9 72.2 -8.6
2014 1,998,967 1.0 76.3 4.1
2015 1,682,090 -15.9 69.3 -6.9
2016 1,892,160 12.5 78.6 9.3
2017 2,043,204 8.0 76.4 -2.2
2018 2,600,761 27.3 86.4 9.9
2019 2,551,136 -1.9 72.9 -13.5
1After reinsurance transactions, excludes state funds. 2After dividends to policyholders. A drop in the combined ratio represents an improvement; an increase represents a deterioration. 3Calculated from unrounded numbers.
Source: NAIC data, sourced from S&P Global Market Intelligence, Insurance Information Institute.
Insurance Information Institute | www.ii i.org 2021 Insurance Fact Book 133
7. PROPERTY/CASUALTY INSURANCE BY LINECommercial Lines
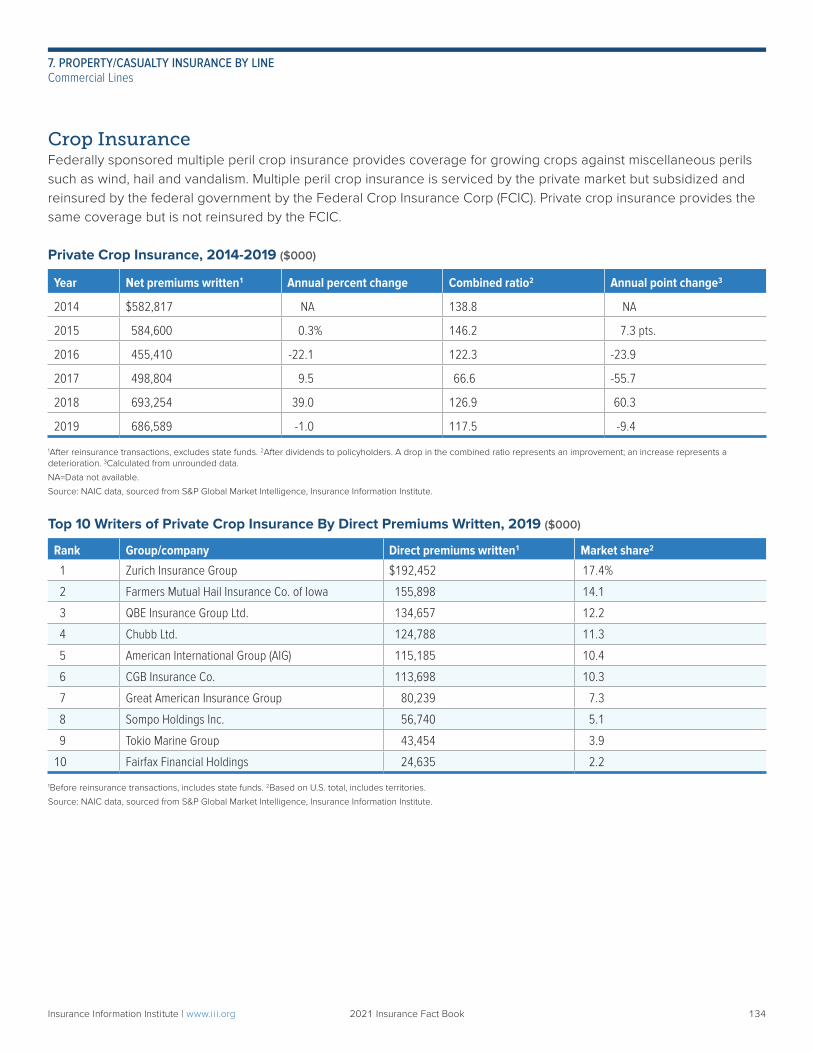
Crop InsuranceFederally sponsored multiple peril crop insurance provides coverage for growing crops against miscellaneous perils such as wind, hail and vandalism. Multiple peril crop insurance is serviced by the private market but subsidized and reinsured by the federal government by the Federal Crop Insurance Corp (FCIC). Private crop insurance provides the same coverage but is not reinsured by the FCIC.
Private Crop Insurance, 2014-2019 ($000)
Year Net premiums written1 Annual percent change Combined ratio2 Annual point change3
2014 $582,817 NA 138.8 NA
2015 584,600 0.3% 146.2 7.3 pts.
2016 455,410 -22.1 122.3 -23.9
2017 498,804 9.5 66.6 -55.7
2018 693,254 39.0 126.9 60.3
2019 686,589 -1.0 117.5 -9.4
1After reinsurance transactions, excludes state funds. 2After dividends to policyholders. A drop in the combined ratio represents an improvement; an increase represents a deterioration. 3Calculated from unrounded data.
NA=Data not available.
Source: NAIC data, sourced from S&P Global Market Intelligence, Insurance Information Institute.
Top 10 Writers of Private Crop Insurance By Direct Premiums Written, 2019 ($000)
Rank Group/company Direct premiums written1 Market share2
1 Zurich Insurance Group $192,452 17.4%
2 Farmers Mutual Hail Insurance Co. of Iowa 155,898 14.1
3 QBE Insurance Group Ltd. 134,657 12.2
4 Chubb Ltd. 124,788 11.3
5 American International Group (AIG) 115,185 10.4
6 CGB Insurance Co. 113,698 10.3
7 Great American Insurance Group 80,239 7.3
8 Sompo Holdings Inc. 56,740 5.1
9 Tokio Marine Group 43,454 3.9
10 Fairfax Financial Holdings 24,635 2.2
1Before reinsurance transactions, includes state funds. 2Based on U.S. total, includes territories.
Source: NAIC data, sourced from S&P Global Market Intelligence, Insurance Information Institute.
Insurance Information Institute | www.ii i.org 2021 Insurance Fact Book 134
7. PROPERTY/CASUALTY INSURANCE BY LINECommercial Lines
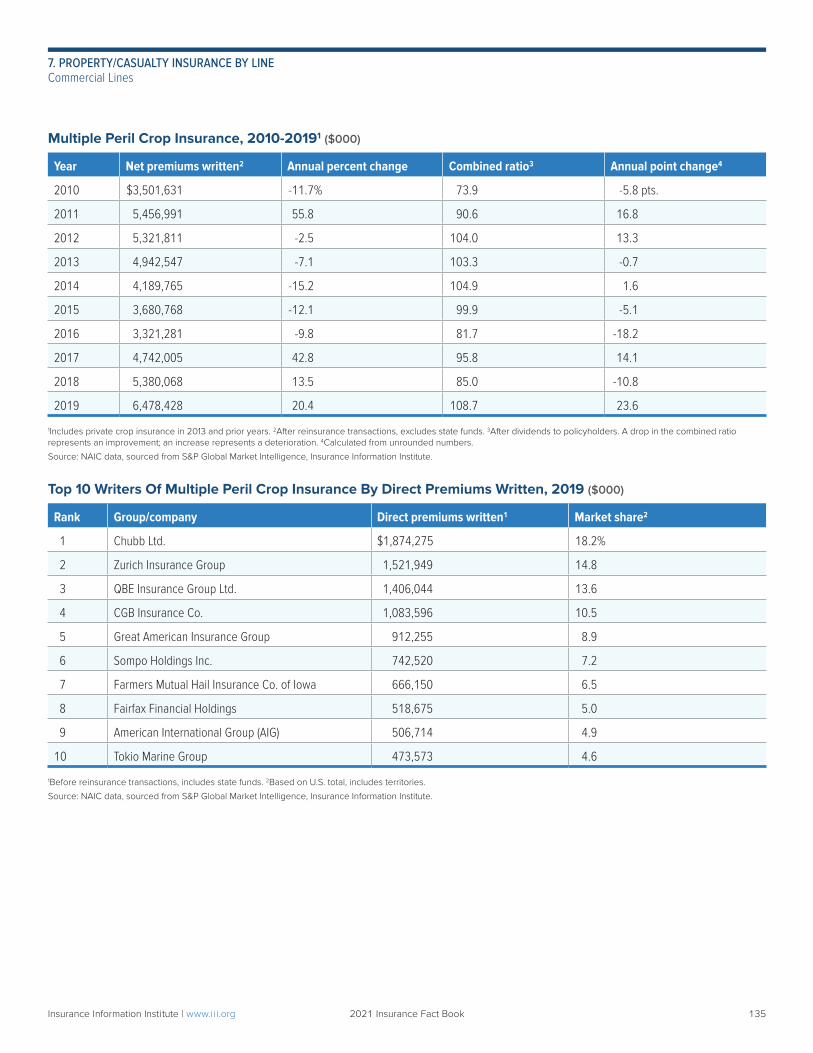
Multiple Peril Crop Insurance, 2010-20191 ($000)
Year Net premiums written2 Annual percent change Combined ratio3 Annual point change4
2010 $3,501,631 -11.7% 73.9 -5.8 pts.
2011 5,456,991 55.8 90.6 16.8
2012 5,321,811 -2.5 104.0 13.3
2013 4,942,547 -7.1 103.3 -0.7
2014 4,189,765 -15.2 104.9 1.6
2015 3,680,768 -12.1 99.9 -5.1
2016 3,321,281 -9.8 81.7 -18.2
2017 4,742,005 42.8 95.8 14.1
2018 5,380,068 13.5 85.0 -10.8
2019 6,478,428 20.4 108.7 23.6
1Includes private crop insurance in 2013 and prior years. 2After reinsurance transactions, excludes state funds. 3After dividends to policyholders. A drop in the combined ratio represents an improvement; an increase represents a deterioration. 4Calculated from unrounded numbers.
Source: NAIC data, sourced from S&P Global Market Intelligence, Insurance Information Institute.
Top 10 Writers Of Multiple Peril Crop Insurance By Direct Premiums Written, 2019 ($000)
Rank Group/company Direct premiums written1 Market share2
1 Chubb Ltd. $1,874,275 18.2%
2 Zurich Insurance Group 1,521,949 14.8
3 QBE Insurance Group Ltd. 1,406,044 13.6
4 CGB Insurance Co. 1,083,596 10.5
5 Great American Insurance Group 912,255 8.9
6 Sompo Holdings Inc. 742,520 7.2
7 Farmers Mutual Hail Insurance Co. of Iowa 666,150 6.5
8 Fairfax Financial Holdings 518,675 5.0
9 American International Group (AIG) 506,714 4.9
10 Tokio Marine Group 473,573 4.6
1Before reinsurance transactions, includes state funds. 2Based on U.S. total, includes territories.
Source: NAIC data, sourced from S&P Global Market Intelligence, Insurance Information Institute.
Insurance Information Institute | www.ii i.org 2021 Insurance Fact Book 135
7. PROPERTY/CASUALTY INSURANCE BY LINECommercial Lines
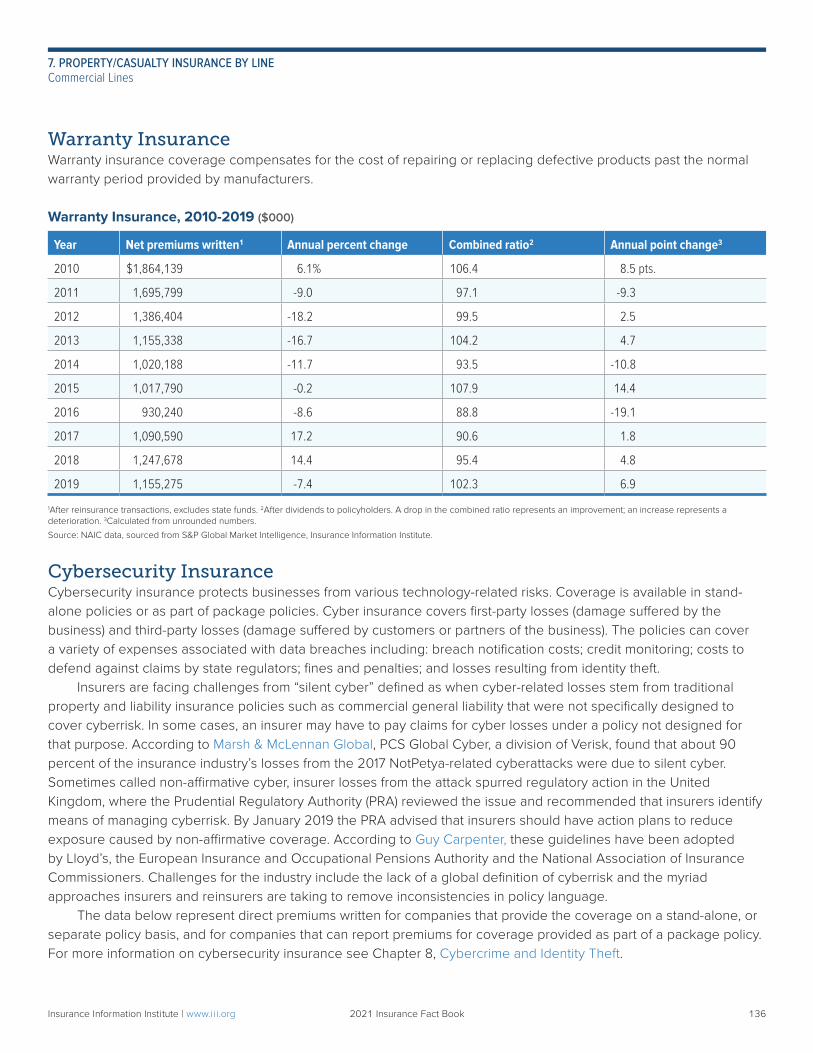
Warranty InsuranceWarranty insurance coverage compensates for the cost of repairing or replacing defective products past the normal warranty period provided by manufacturers.
Warranty Insurance, 2010-2019 ($000)
Year Net premiums written1 Annual percent change Combined ratio2 Annual point change3
2010 $1,864,139 6.1% 106.4 8.5 pts.
2011 1,695,799 -9.0 97.1 -9.3
2012 1,386,404 -18.2 99.5 2.5
2013 1,155,338 -16.7 104.2 4.7
2014 1,020,188 -11.7 93.5 -10.8
2015 1,017,790 -0.2 107.9 14.4
2016 930,240 -8.6 88.8 -19.1
2017 1,090,590 17.2 90.6 1.8
2018 1,247,678 14.4 95.4 4.8
2019 1,155,275 -7.4 102.3 6.9
1After reinsurance transactions, excludes state funds. 2After dividends to policyholders. A drop in the combined ratio represents an improvement; an increase represents a deterioration. 3Calculated from unrounded numbers.
Source: NAIC data, sourced from S&P Global Market Intelligence, Insurance Information Institute.
Cybersecurity InsuranceCybersecurity insurance protects businesses from various technology-related risks. Coverage is available in stand-alone policies or as part of package policies. Cyber insurance covers first-party losses (damage suffered by the business) and third-party losses (damage suffered by customers or partners of the business). The policies can cover a variety of expenses associated with data breaches including: breach notification costs; credit monitoring; costs to defend against claims by state regulators; fines and penalties; and losses resulting from identity theft. Insurers are facing challenges from “silent cyber” defined as when cyber-related losses stem from traditional property and liability insurance policies such as commercial general liability that were not specifically designed to cover cyberrisk. In some cases, an insurer may have to pay claims for cyber losses under a policy not designed for that purpose. According to Marsh & McLennan Global, PCS Global Cyber, a division of Verisk, found that about 90 percent of the insurance industry’s losses from the 2017 NotPetya-related cyberattacks were due to silent cyber. Sometimes called non-affirmative cyber, insurer losses from the attack spurred regulatory action in the United Kingdom, where the Prudential Regulatory Authority (PRA) reviewed the issue and recommended that insurers identify means of managing cyberrisk. By January 2019 the PRA advised that insurers should have action plans to reduce exposure caused by non-affirmative coverage. According to Guy Carpenter, these guidelines have been adopted by Lloyd’s, the European Insurance and Occupational Pensions Authority and the National Association of Insurance Commissioners. Challenges for the industry include the lack of a global definition of cyberrisk and the myriad approaches insurers and reinsurers are taking to remove inconsistencies in policy language. The data below represent direct premiums written for companies that provide the coverage on a stand-alone, or separate policy basis, and for companies that can report premiums for coverage provided as part of a package policy. For more information on cybersecurity insurance see Chapter 8, Cybercrime and Identity Theft.
Insurance Information Institute | www.ii i.org 2021 Insurance Fact Book 136
7. PROPERTY/CASUALTY INSURANCE BY LINECommercial Lines
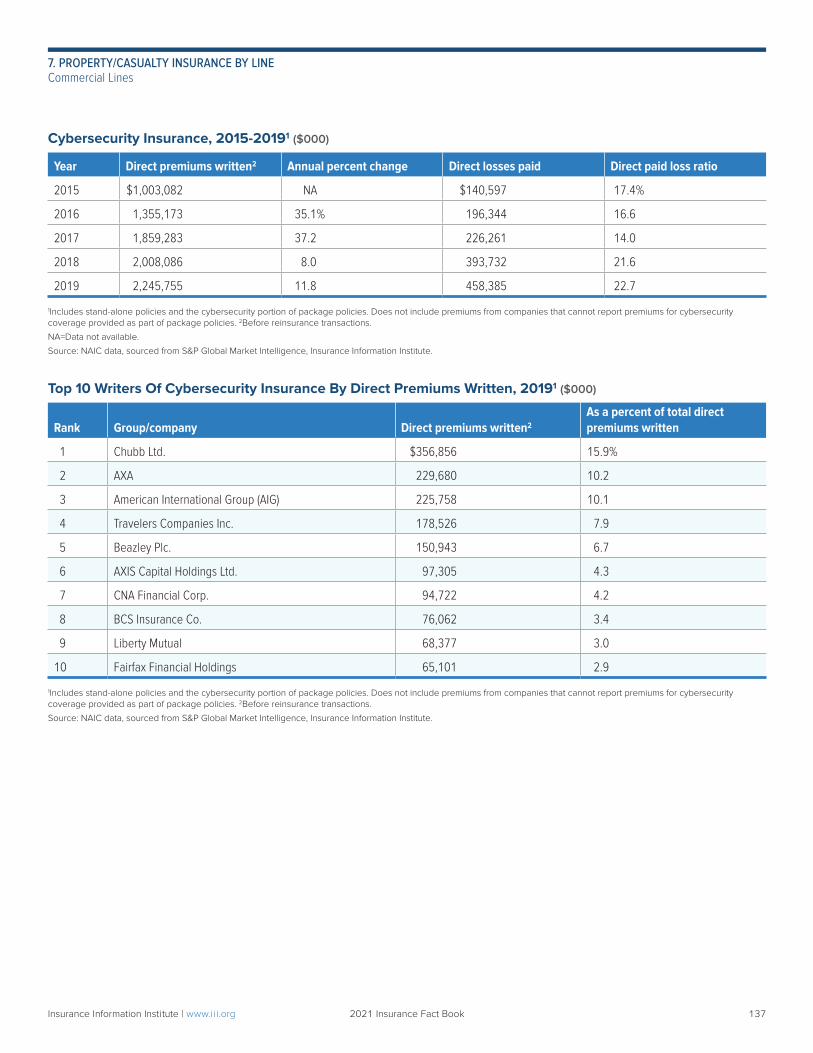
Cybersecurity Insurance, 2015-20191 ($000)
Year Direct premiums written2 Annual percent change Direct losses paid Direct paid loss ratio
2015 $1,003,082 NA $140,597 17.4%
2016 1,355,173 35.1% 196,344 16.6
2017 1,859,283 37.2 226,261 14.0
2018 2,008,086 8.0 393,732 21.6
2019 2,245,755 11.8 458,385 22.7
1Includes stand-alone policies and the cybersecurity portion of package policies. Does not include premiums from companies that cannot report premiums for cybersecurity coverage provided as part of package policies. 2Before reinsurance transactions.
NA=Data not available.
Source: NAIC data, sourced from S&P Global Market Intelligence, Insurance Information Institute.
Top 10 Writers Of Cybersecurity Insurance By Direct Premiums Written, 20191 ($000)
Rank Group/company Direct premiums written2
As a percent of total direct premiums written
1 Chubb Ltd. $356,856 15.9%
2 AXA 229,680 10.2
3 American International Group (AIG) 225,758 10.1
4 Travelers Companies Inc. 178,526 7.9
5 Beazley Plc. 150,943 6.7
6 AXIS Capital Holdings Ltd. 97,305 4.3
7 CNA Financial Corp. 94,722 4.2
8 BCS Insurance Co. 76,062 3.4
9 Liberty Mutual 68,377 3.0
10 Fairfax Financial Holdings 65,101 2.9
1Includes stand-alone policies and the cybersecurity portion of package policies. Does not include premiums from companies that cannot report premiums for cybersecurity coverage provided as part of package policies. 2Before reinsurance transactions.
Source: NAIC data, sourced from S&P Global Market Intelligence, Insurance Information Institute.
Insurance Information Institute | www.ii i.org 2021 Insurance Fact Book 137
7. PROPERTY/CASUALTY INSURANCE BY LINECommercial Lines
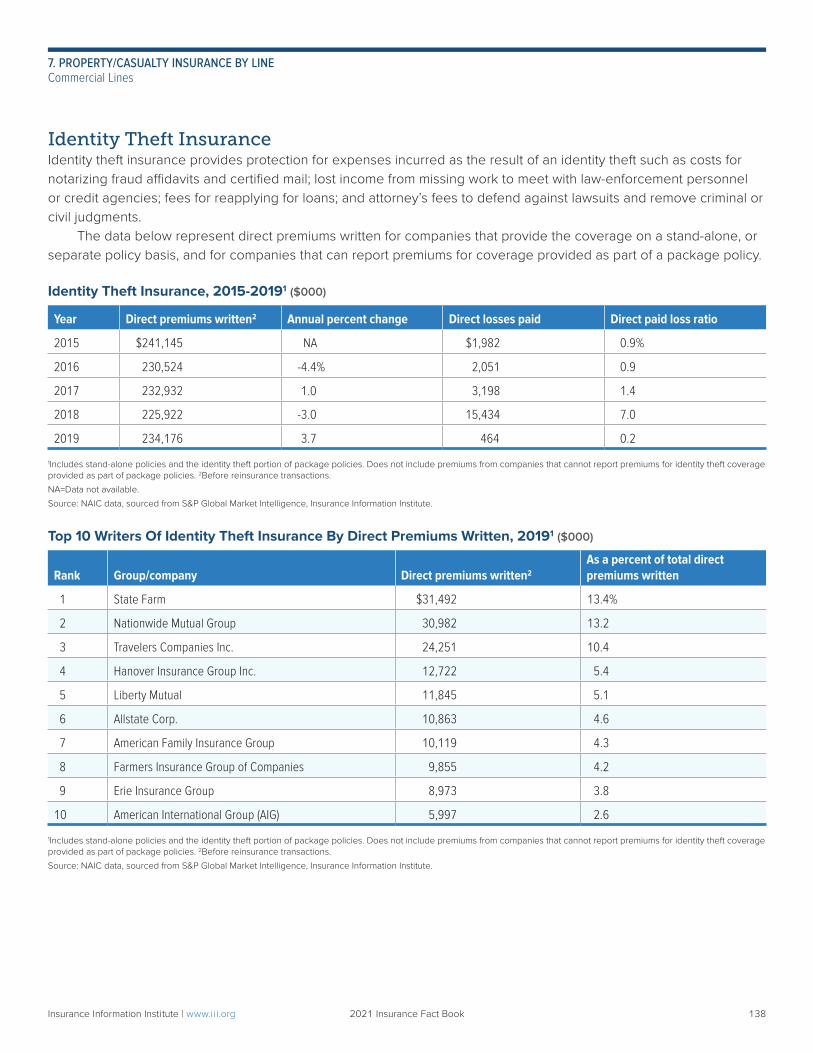
Identity Theft InsuranceIdentity theft insurance provides protection for expenses incurred as the result of an identity theft such as costs for notarizing fraud affidavits and certified mail; lost income from missing work to meet with law-enforcement personnel or credit agencies; fees for reapplying for loans; and attorney’s fees to defend against lawsuits and remove criminal or civil judgments. The data below represent direct premiums written for companies that provide the coverage on a stand-alone, or separate policy basis, and for companies that can report premiums for coverage provided as part of a package policy.
Identity Theft Insurance, 2015-20191 ($000)
Year Direct premiums written2 Annual percent change Direct losses paid Direct paid loss ratio
2015 $241,145 NA $1,982 0.9%
2016 230,524 -4.4% 2,051 0.9
2017 232,932 1.0 3,198 1.4
2018 225,922 -3.0 15,434 7.0
2019 234,176 3.7 464 0.2
1Includes stand-alone policies and the identity theft portion of package policies. Does not include premiums from companies that cannot report premiums for identity theft coverage provided as part of package policies. 2Before reinsurance transactions.
NA=Data not available.
Source: NAIC data, sourced from S&P Global Market Intelligence, Insurance Information Institute.
Top 10 Writers Of Identity Theft Insurance By Direct Premiums Written, 20191 ($000)
Rank Group/company Direct premiums written2
As a percent of total direct premiums written
1 State Farm $31,492 13.4%
2 Nationwide Mutual Group 30,982 13.2
3 Travelers Companies Inc. 24,251 10.4
4 Hanover Insurance Group Inc. 12,722 5.4
5 Liberty Mutual 11,845 5.1
6 Allstate Corp. 10,863 4.6
7 American Family Insurance Group 10,119 4.3
8 Farmers Insurance Group of Companies 9,855 4.2
9 Erie Insurance Group 8,973 3.8
10 American International Group (AIG) 5,997 2.6
1Includes stand-alone policies and the identity theft portion of package policies. Does not include premiums from companies that cannot report premiums for identity theft coverage provided as part of package policies. 2Before reinsurance transactions.
Source: NAIC data, sourced from S&P Global Market Intelligence, Insurance Information Institute.
Insurance Information Institute | www.ii i.org 2021 Insurance Fact Book 138
7. PROPERTY/CASUALTY INSURANCE BY LINECommercial Lines
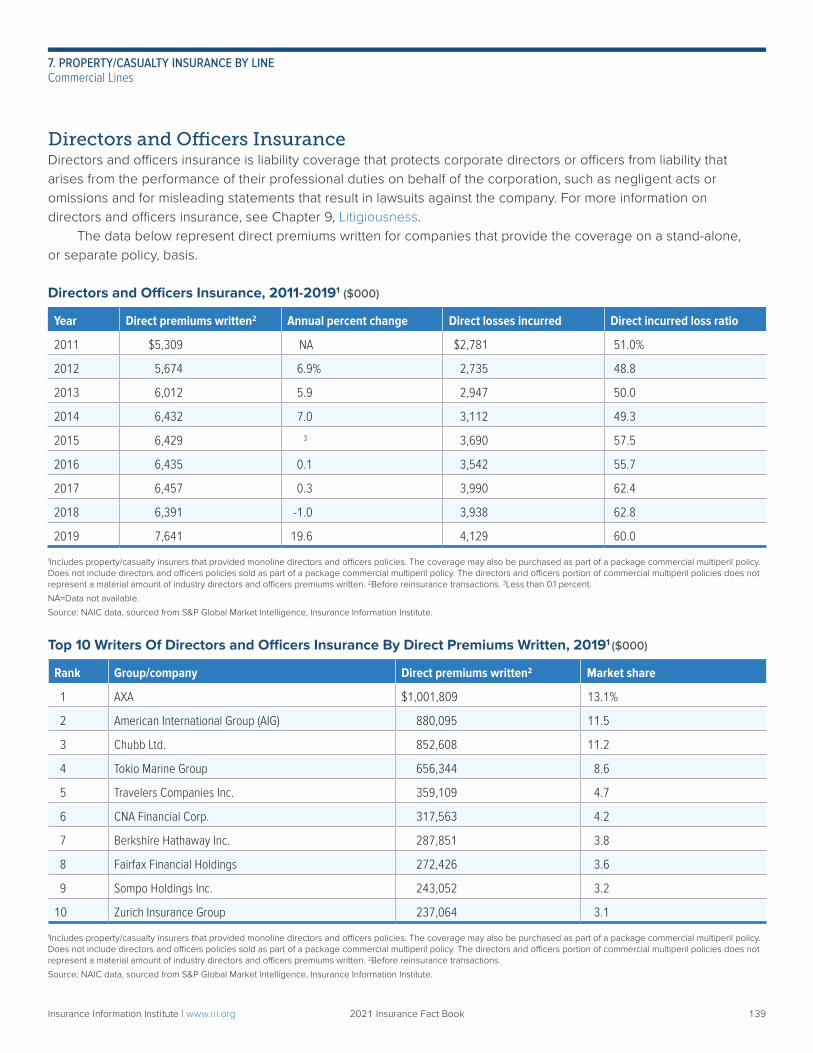
Directors and Officers InsuranceDirectors and officers insurance is liability coverage that protects corporate directors or officers from liability that arises from the performance of their professional duties on behalf of the corporation, such as negligent acts or omissions and for misleading statements that result in lawsuits against the company. For more information on directors and officers insurance, see Chapter 9, Litigiousness. The data below represent direct premiums written for companies that provide the coverage on a stand-alone, or separate policy, basis.
Directors and Officers Insurance, 2011-20191 ($000)
Year Direct premiums written2 Annual percent change Direct losses incurred Direct incurred loss ratio
2011 $5,309 NA $2,781 51.0%
2012 5,674 6.9% 2,735 48.8
2013 6,012 5.9 2,947 50.0
2014 6,432 7.0 3,112 49.3
2015 6,429 3 3,690 57.5
2016 6,435 0.1 3,542 55.7
2017 6,457 0.3 3,990 62.4
2018 6,391 -1.0 3,938 62.8
2019 7,641 19.6 4,129 60.0
1Includes property/casualty insurers that provided monoline directors and officers policies. The coverage may also be purchased as part of a package commercial multiperil policy. Does not include directors and officers policies sold as part of a package commercial multiperil policy. The directors and officers portion of commercial multiperil policies does not represent a material amount of industry directors and officers premiums written. 2Before reinsurance transactions. 3Less than 0.1 percent.
NA=Data not available.
Source: NAIC data, sourced from S&P Global Market Intelligence, Insurance Information Institute.
Top 10 Writers Of Directors and Officers Insurance By Direct Premiums Written, 20191 ($000)
Rank Group/company Direct premiums written2 Market share
1 AXA $1,001,809 13.1%
2 American International Group (AIG) 880,095 11.5
3 Chubb Ltd. 852,608 11.2
4 Tokio Marine Group 656,344 8.6
5 Travelers Companies Inc. 359,109 4.7
6 CNA Financial Corp. 317,563 4.2
7 Berkshire Hathaway Inc. 287,851 3.8
8 Fairfax Financial Holdings 272,426 3.6
9 Sompo Holdings Inc. 243,052 3.2
10 Zurich Insurance Group 237,064 3.1
1Includes property/casualty insurers that provided monoline directors and officers policies. The coverage may also be purchased as part of a package commercial multiperil policy. Does not include directors and officers policies sold as part of a package commercial multiperil policy. The directors and officers portion of commercial multiperil policies does not represent a material amount of industry directors and officers premiums written. 2Before reinsurance transactions.
Source: NAIC data, sourced from S&P Global Market Intelligence, Insurance Information Institute.
Insurance Information Institute | www.ii i.org 2021 Insurance Fact Book 139
7. PROPERTY/CASUALTY INSURANCE BY LINECommercial Lines
MAJOR CATASTROPHIES: WORLDWorld Insurance LossesNatural catastrophes: In 2019 insured losses from natural catastrophes totaled $71 billion, according to Aon, down from $100 billion-plus losses in 2017 and 2018. Insured losses were $100 billion in 2018 and $157 billion in 2017. Typhoons Hagibis and Faxai—both in Japan—were the largest insured losses in 2019, resulting in $9 billion and $6 billion in losses, respectively. In 2018 Japan’s Typhoon Jebi was the largest natural catastrophe ranked by insured losses, causing $12.5 billion in losses. Following 415 natural disaster events in 2018, Aon tallied 409 natural disasters in 2019, including 158 flooding events and 114 severe weather events. There were 33 tropical cyclones and 32 earthquakes, with winter weather, wildfires, European windstorms, droughts and other perils accounting for the remaining events. Natural catastrophe events resulted in 11,000 deaths in 2019. Eight of the top 10 deadliest natural catastrophes in 2019 involved flooding, including the deadliest event, the India monsoon floods that killed 1,750 people over the five months from June to October. Cyclone Idai in southern Africa ranked second with 1,300 deaths. Aon noted that the decade from 2010 to 2019 was the costliest in the modern record for global natural disasters. Insured losses during this period were $845 billion, paid by private and public insurance organizations. Disasters in the United States accounted for more than half of the losses, at $453 billion. Economic losses in the decade were $2.98 trillion, resulting in a protection gap of more than $2 trillion, which was mostly burdensome for developing and emerging countries. This protection deficit was worst in Asia, where only 12 percent of economic losses were covered by insurance.
Chapter 8
Losses
140Insurance Information Institute | www.ii i.org 2021 Insurance Fact Book 140
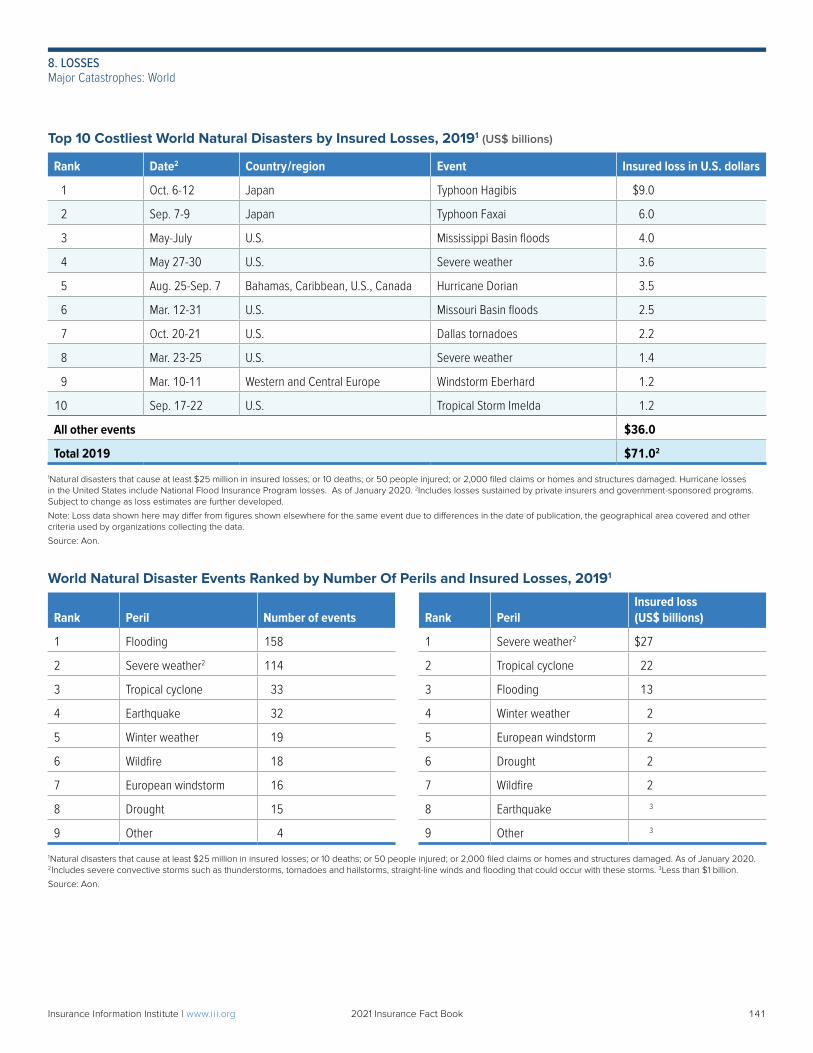
Top 10 Costliest World Natural Disasters by Insured Losses, 20191 (US$ billions)
Rank Date2 Country/region Event Insured loss in U.S. dollars
1 Oct. 6-12 Japan Typhoon Hagibis $9.0
2 Sep. 7-9 Japan Typhoon Faxai 6.0
3 May-July U.S. Mississippi Basin floods 4.0
4 May 27-30 U.S. Severe weather 3.6
5 Aug. 25-Sep. 7 Bahamas, Caribbean, U.S., Canada Hurricane Dorian 3.5
6 Mar. 12-31 U.S. Missouri Basin floods 2.5
7 Oct. 20-21 U.S. Dallas tornadoes 2.2
8 Mar. 23-25 U.S. Severe weather 1.4
9 Mar. 10-11 Western and Central Europe Windstorm Eberhard 1.2
10 Sep. 17-22 U.S. Tropical Storm Imelda 1.2
All other events $36.0
Total 2019 $71.02
1Natural disasters that cause at least $25 million in insured losses; or 10 deaths; or 50 people injured; or 2,000 filed claims or homes and structures damaged. Hurricane losses in the United States include National Flood Insurance Program losses. As of January 2020. 2Includes losses sustained by private insurers and government-sponsored programs. Subject to change as loss estimates are further developed.
Note: Loss data shown here may differ from figures shown elsewhere for the same event due to differences in the date of publication, the geographical area covered and other criteria used by organizations collecting the data.
Source: Aon.
World Natural Disaster Events Ranked by Number Of Perils and Insured Losses, 20191
Rank Peril Number of events Rank PerilInsured loss (US$ billions)
1 Flooding 158 1 Severe weather2 $27
2 Severe weather2 114 2 Tropical cyclone 22
3 Tropical cyclone 33 3 Flooding 13
4 Earthquake 32 4 Winter weather 2
5 Winter weather 19 5 European windstorm 2
6 Wildfire 18 6 Drought 2
7 European windstorm 16 7 Wildfire 2
8 Drought 15 8 Earthquake 3
9 Other 4 9 Other 3
1Natural disasters that cause at least $25 million in insured losses; or 10 deaths; or 50 people injured; or 2,000 filed claims or homes and structures damaged. As of January 2020. 2Includes severe convective storms such as thunderstorms, tornadoes and hailstorms, straight-line winds and flooding that could occur with these storms. 3Less than $1 billion.
Source: Aon.
141Insurance Information Institute | www.ii i.org 2021 Insurance Fact Book 141
8. LOSSESMajor Catastrophes: World
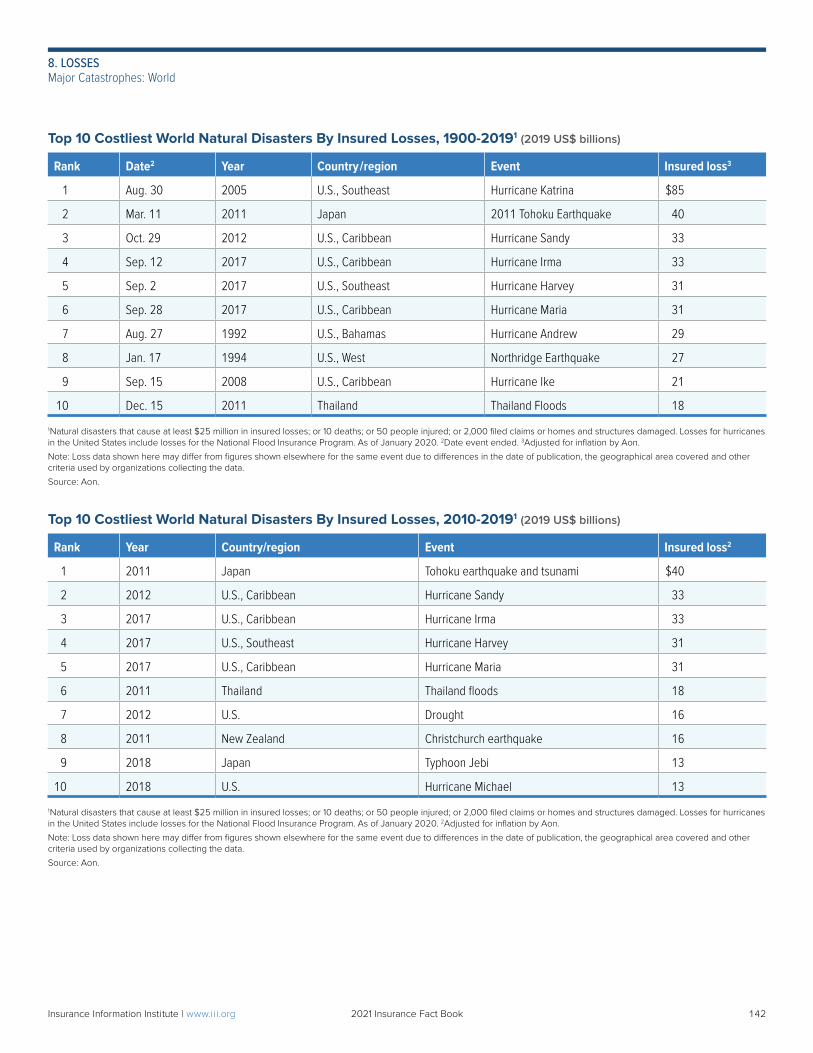
Top 10 Costliest World Natural Disasters By Insured Losses, 1900-20191 (2019 US$ billions)
Rank Date2 Year Country/region Event Insured loss3
1 Aug. 30 2005 U.S., Southeast Hurricane Katrina $85
2 Mar. 11 2011 Japan 2011 Tohoku Earthquake 40
3 Oct. 29 2012 U.S., Caribbean Hurricane Sandy 33
4 Sep. 12 2017 U.S., Caribbean Hurricane Irma 33
5 Sep. 2 2017 U.S., Southeast Hurricane Harvey 31
6 Sep. 28 2017 U.S., Caribbean Hurricane Maria 31
7 Aug. 27 1992 U.S., Bahamas Hurricane Andrew 29
8 Jan. 17 1994 U.S., West Northridge Earthquake 27
9 Sep. 15 2008 U.S., Caribbean Hurricane Ike 21
10 Dec. 15 2011 Thailand Thailand Floods 18
1Natural disasters that cause at least $25 million in insured losses; or 10 deaths; or 50 people injured; or 2,000 filed claims or homes and structures damaged. Losses for hurricanes in the United States include losses for the National Flood Insurance Program. As of January 2020. 2Date event ended. 3Adjusted for inflation by Aon.
Note: Loss data shown here may differ from figures shown elsewhere for the same event due to differences in the date of publication, the geographical area covered and other criteria used by organizations collecting the data.
Source: Aon.
Top 10 Costliest World Natural Disasters By Insured Losses, 2010-20191 (2019 US$ billions)
Rank Year Country/region Event Insured loss2
1 2011 Japan Tohoku earthquake and tsunami $40
2 2012 U.S., Caribbean Hurricane Sandy 33
3 2017 U.S., Caribbean Hurricane Irma 33
4 2017 U.S., Southeast Hurricane Harvey 31
5 2017 U.S., Caribbean Hurricane Maria 31
6 2011 Thailand Thailand floods 18
7 2012 U.S. Drought 16
8 2011 New Zealand Christchurch earthquake 16
9 2018 Japan Typhoon Jebi 13
10 2018 U.S. Hurricane Michael 13
1Natural disasters that cause at least $25 million in insured losses; or 10 deaths; or 50 people injured; or 2,000 filed claims or homes and structures damaged. Losses for hurricanes in the United States include losses for the National Flood Insurance Program. As of January 2020. 2Adjusted for inflation by Aon.
Note: Loss data shown here may differ from figures shown elsewhere for the same event due to differences in the date of publication, the geographical area covered and other criteria used by organizations collecting the data.
Source: Aon.
142Insurance Information Institute | www.ii i.org 2021 Insurance Fact Book 142
8. LOSSESMajor Catastrophes: World
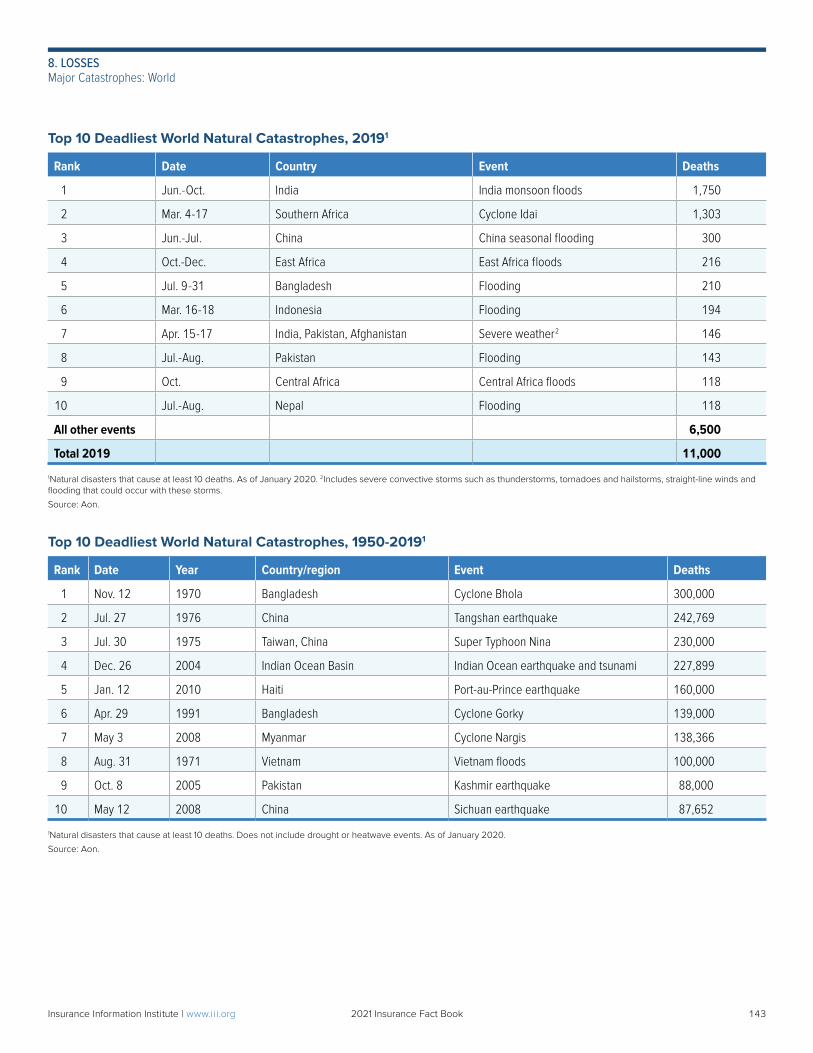
Top 10 Deadliest World Natural Catastrophes, 20191
Rank Date Country Event Deaths
1 Jun.-Oct. India India monsoon floods 1,750
2 Mar. 4-17 Southern Africa Cyclone Idai 1,303
3 Jun.-Jul. China China seasonal flooding 300
4 Oct.-Dec. East Africa East Africa floods 216
5 Jul. 9-31 Bangladesh Flooding 210
6 Mar. 16-18 Indonesia Flooding 194
7 Apr. 15-17 India, Pakistan, Afghanistan Severe weather2 146
8 Jul.-Aug. Pakistan Flooding 143
9 Oct. Central Africa Central Africa floods 118
10 Jul.-Aug. Nepal Flooding 118
All other events 6,500
Total 2019 11,000
1Natural disasters that cause at least 10 deaths. As of January 2020. 2Includes severe convective storms such as thunderstorms, tornadoes and hailstorms, straight-line winds and flooding that could occur with these storms.
Source: Aon.
Top 10 Deadliest World Natural Catastrophes, 1950-20191
Rank Date Year Country/region Event Deaths
1 Nov. 12 1970 Bangladesh Cyclone Bhola 300,000
2 Jul. 27 1976 China Tangshan earthquake 242,769
3 Jul. 30 1975 Taiwan, China Super Typhoon Nina 230,000
4 Dec. 26 2004 Indian Ocean Basin Indian Ocean earthquake and tsunami 227,899
5 Jan. 12 2010 Haiti Port-au-Prince earthquake 160,000
6 Apr. 29 1991 Bangladesh Cyclone Gorky 139,000
7 May 3 2008 Myanmar Cyclone Nargis 138,366
8 Aug. 31 1971 Vietnam Vietnam floods 100,000
9 Oct. 8 2005 Pakistan Kashmir earthquake 88,000
10 May 12 2008 China Sichuan earthquake 87,652
1Natural disasters that cause at least 10 deaths. Does not include drought or heatwave events. As of January 2020.
Source: Aon.
143Insurance Information Institute | www.ii i.org 2021 Insurance Fact Book 143
8. LOSSESMajor Catastrophes: World
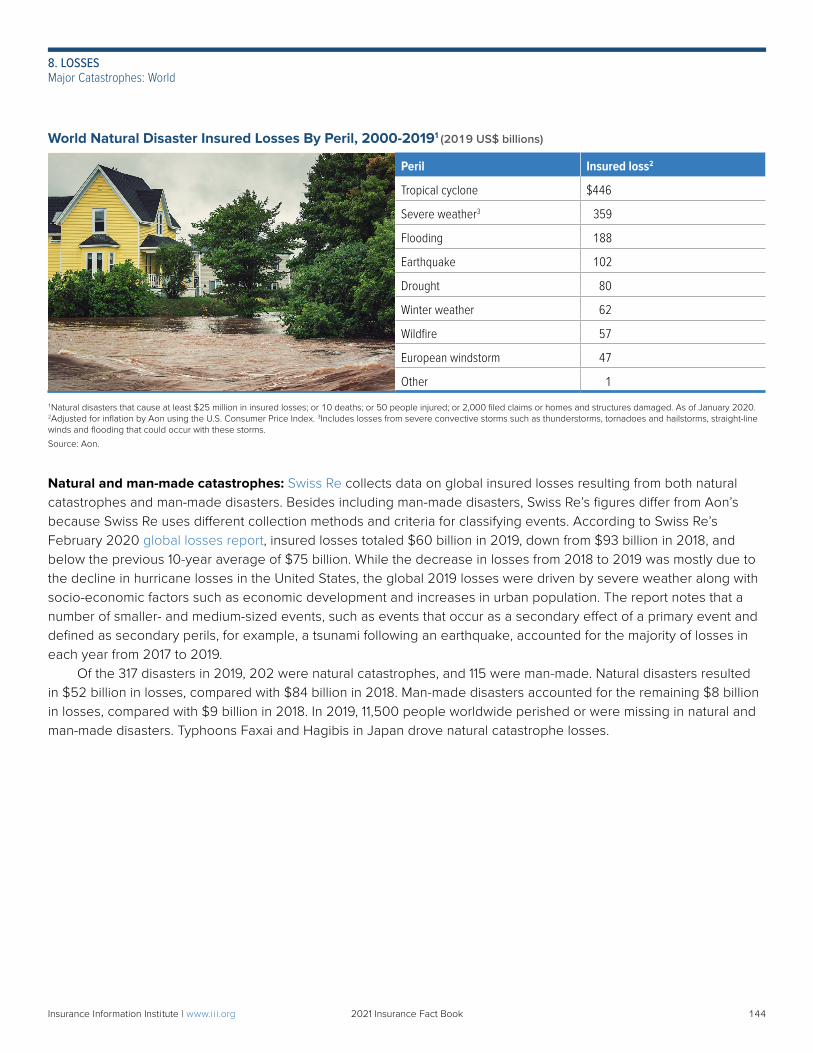
World Natural Disaster Insured Losses By Peril, 2000-20191 (2019 US$ billions)
Peril Insured loss2
Tropical cyclone $446
Severe weather3 359
Flooding 188
Earthquake 102
Drought 80
Winter weather 62
Wildfire 57
European windstorm 47
Other 1
1Natural disasters that cause at least $25 million in insured losses; or 10 deaths; or 50 people injured; or 2,000 filed claims or homes and structures damaged. As of January 2020. 2Adjusted for inflation by Aon using the U.S. Consumer Price Index. 3Includes losses from severe convective storms such as thunderstorms, tornadoes and hailstorms, straight-line winds and flooding that could occur with these storms.
Source: Aon.
Natural and man-made catastrophes: Swiss Re collects data on global insured losses resulting from both natural catastrophes and man-made disasters. Besides including man-made disasters, Swiss Re’s figures differ from Aon’s because Swiss Re uses different collection methods and criteria for classifying events. According to Swiss Re’s February 2020 global losses report, insured losses totaled $60 billion in 2019, down from $93 billion in 2018, and below the previous 10-year average of $75 billion. While the decrease in losses from 2018 to 2019 was mostly due to the decline in hurricane losses in the United States, the global 2019 losses were driven by severe weather along with socio-economic factors such as economic development and increases in urban population. The report notes that a number of smaller- and medium-sized events, such as events that occur as a secondary effect of a primary event and defined as secondary perils, for example, a tsunami following an earthquake, accounted for the majority of losses in each year from 2017 to 2019. Of the 317 disasters in 2019, 202 were natural catastrophes, and 115 were man-made. Natural disasters resulted in $52 billion in losses, compared with $84 billion in 2018. Man-made disasters accounted for the remaining $8 billion in losses, compared with $9 billion in 2018. In 2019, 11,500 people worldwide perished or were missing in natural and man-made disasters. Typhoons Faxai and Hagibis in Japan drove natural catastrophe losses.
144Insurance Information Institute | www.ii i.org 2021 Insurance Fact Book 144
8. LOSSESMajor Catastrophes: World
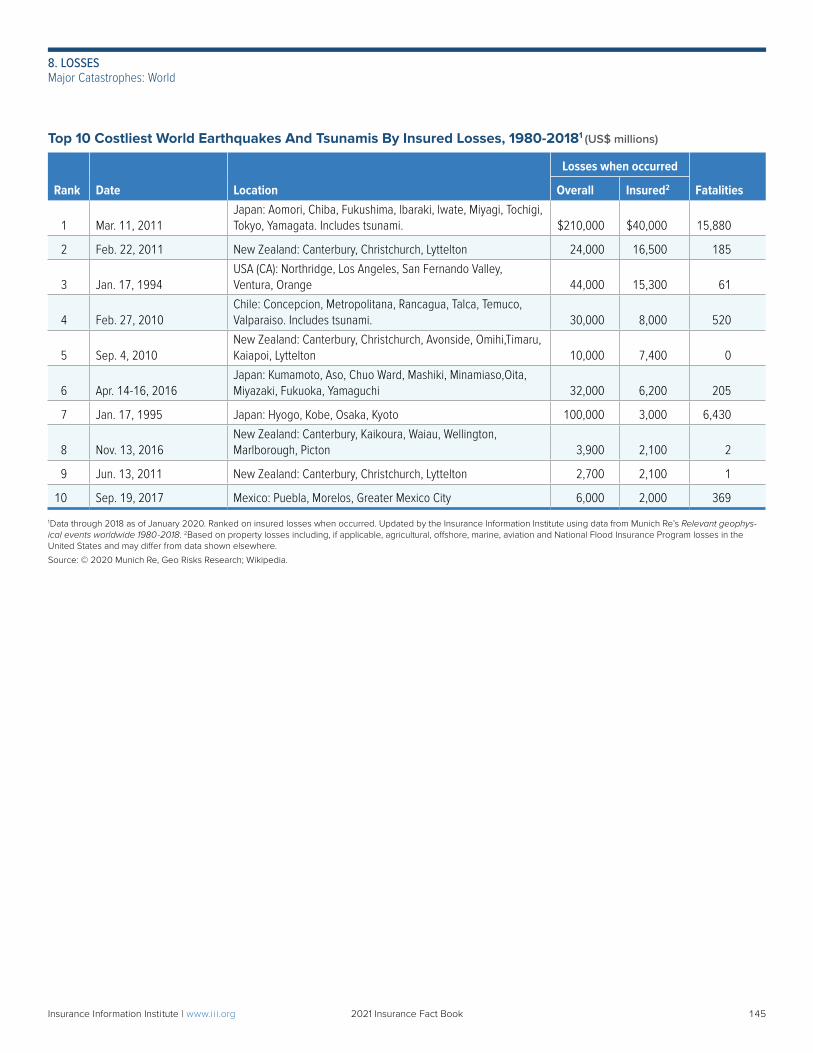
Top 10 Costliest World Earthquakes And Tsunamis By Insured Losses, 1980-20181 (US$ millions)
Rank Date Location
Losses when occurred
FatalitiesOverall Insured2
1 Mar. 11, 2011Japan: Aomori, Chiba, Fukushima, lbaraki, lwate, Miyagi, Tochigi, Tokyo, Yamagata. Includes tsunami. $210,000 $40,000 15,880
2 Feb. 22, 2011 New Zealand: Canterbury, Christchurch, Lyttelton 24,000 16,500 185
3 Jan. 17, 1994USA (CA): Northridge, Los Angeles, San Fernando Valley, Ventura, Orange 44,000 15,300 61
4 Feb. 27, 2010Chile: Concepcion, Metropolitana, Rancagua, Talca, Temuco, Valparaiso. Includes tsunami. 30,000 8,000 520
5 Sep. 4, 2010New Zealand: Canterbury, Christchurch, Avonside, Omihi,Timaru, Kaiapoi, Lyttelton 10,000 7,400 0
6 Apr. 14-16, 2016Japan: Kumamoto, Aso, Chuo Ward, Mashiki, Minamiaso,Oita, Miyazaki, Fukuoka, Yamaguchi 32,000 6,200 205
7 Jan. 17, 1995 Japan: Hyogo, Kobe, Osaka, Kyoto 100,000 3,000 6,430
8 Nov. 13, 2016New Zealand: Canterbury, Kaikoura, Waiau, Wellington, Marlborough, Picton 3,900 2,100 2
9 Jun. 13, 2011 New Zealand: Canterbury, Christchurch, Lyttelton 2,700 2,100 1
10 Sep. 19, 2017 Mexico: Puebla, Morelos, Greater Mexico City 6,000 2,000 369
1Data through 2018 as of January 2020. Ranked on insured losses when occurred. Updated by the Insurance Information Institute using data from Munich Re’s Relevant geophys-ical events worldwide 1980-2018. 2Based on property losses including, if applicable, agricultural, offshore, marine, aviation and National Flood Insurance Program losses in the United States and may differ from data shown elsewhere.
Source: © 2020 Munich Re, Geo Risks Research; Wikipedia.
145Insurance Information Institute | www.ii i.org 2021 Insurance Fact Book 145
8. LOSSESMajor Catastrophes: World
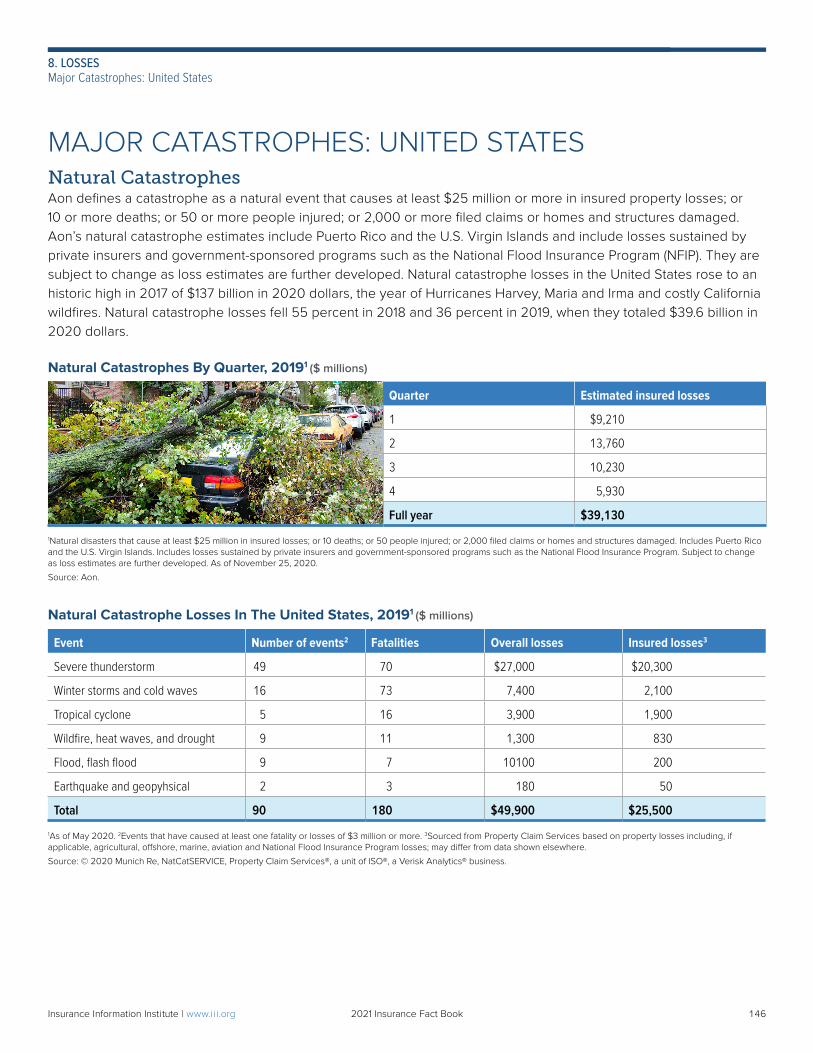
MAJOR CATASTROPHES: UNITED STATESNatural CatastrophesAon defines a catastrophe as a natural event that causes at least $25 million or more in insured property losses; or 10 or more deaths; or 50 or more people injured; or 2,000 or more filed claims or homes and structures damaged. Aon’s natural catastrophe estimates include Puerto Rico and the U.S. Virgin Islands and include losses sustained by private insurers and government-sponsored programs such as the National Flood Insurance Program (NFIP). They are subject to change as loss estimates are further developed. Natural catastrophe losses in the United States rose to an historic high in 2017 of $137 billion in 2020 dollars, the year of Hurricanes Harvey, Maria and Irma and costly California wildfires. Natural catastrophe losses fell 55 percent in 2018 and 36 percent in 2019, when they totaled $39.6 billion in 2020 dollars.
Natural Catastrophes By Quarter, 20191 ($ millions)
Quarter Estimated insured losses
1 $9,210
2 13,760
3 10,230
4 5,930
Full year $39,130
1Natural disasters that cause at least $25 million in insured losses; or 10 deaths; or 50 people injured; or 2,000 filed claims or homes and structures damaged. Includes Puerto Rico and the U.S. Virgin Islands. Includes losses sustained by private insurers and government-sponsored programs such as the National Flood Insurance Program. Subject to change as loss estimates are further developed. As of November 25, 2020.
Source: Aon.
Natural Catastrophe Losses In The United States, 20191 ($ millions)
Event Number of events2 Fatalities Overall losses Insured losses3
Severe thunderstorm 49 70 $27,000 $20,300
Winter storms and cold waves 16 73 7,400 2,100
Tropical cyclone 5 16 3,900 1,900
Wildfire, heat waves, and drought 9 11 1,300 830
Flood, flash flood 9 7 10100 200
Earthquake and geopyhsical 2 3 180 50
Total 90 180 $49,900 $25,500
1As of May 2020. 2Events that have caused at least one fatality or losses of $3 million or more. 3Sourced from Property Claim Services based on property losses including, if applicable, agricultural, offshore, marine, aviation and National Flood Insurance Program losses; may differ from data shown elsewhere.
Source: © 2020 Munich Re, NatCatSERVICE, Property Claim Services®, a unit of ISO®, a Verisk Analytics® business.
146Insurance Information Institute | www.ii i.org 2021 Insurance Fact Book 146
8. LOSSESMajor Catastrophes: United States
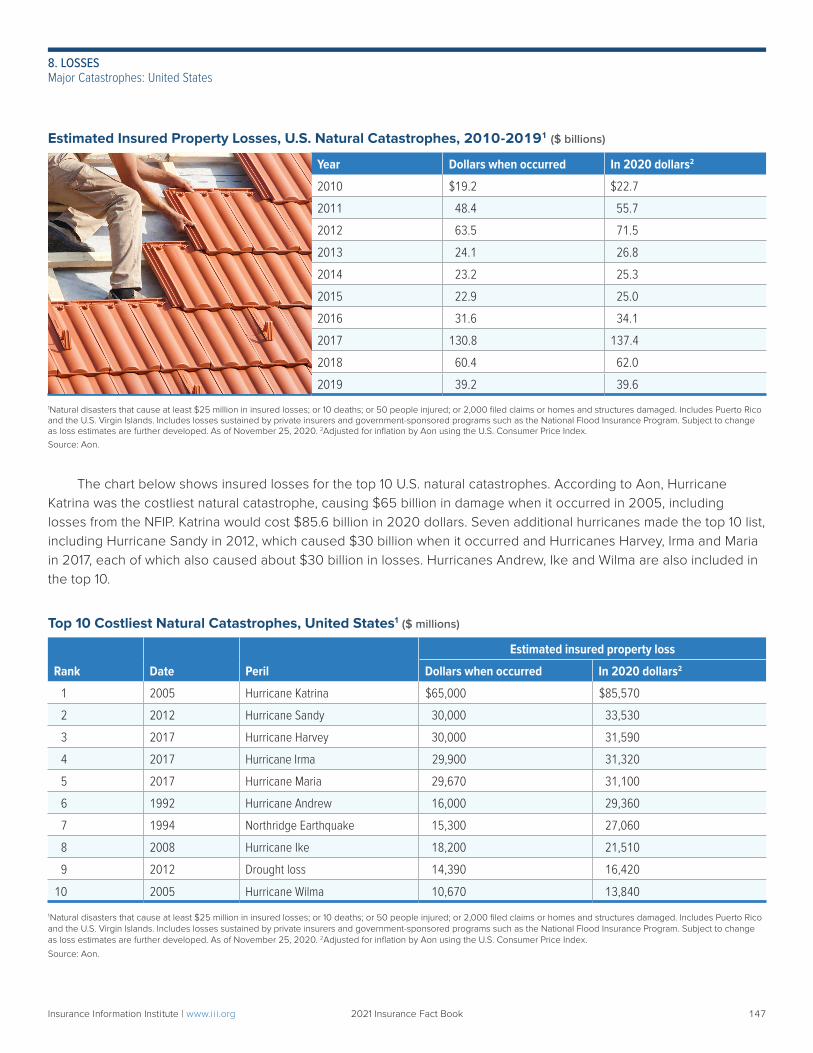
Estimated Insured Property Losses, U.S. Natural Catastrophes, 2010-20191 ($ billions)
Year Dollars when occurred In 2020 dollars2
2010 $19.2 $22.7
2011 48.4 55.7
2012 63.5 71.5
2013 24.1 26.8
2014 23.2 25.3
2015 22.9 25.0
2016 31.6 34.1
2017 130.8 137.4
2018 60.4 62.0
2019 39.2 39.6
1Natural disasters that cause at least $25 million in insured losses; or 10 deaths; or 50 people injured; or 2,000 filed claims or homes and structures damaged. Includes Puerto Rico and the U.S. Virgin Islands. Includes losses sustained by private insurers and government-sponsored programs such as the National Flood Insurance Program. Subject to change as loss estimates are further developed. As of November 25, 2020. 2Adjusted for inflation by Aon using the U.S. Consumer Price Index.Source: Aon.
The chart below shows insured losses for the top 10 U.S. natural catastrophes. According to Aon, Hurricane Katrina was the costliest natural catastrophe, causing $65 billion in damage when it occurred in 2005, including losses from the NFIP. Katrina would cost $85.6 billion in 2020 dollars. Seven additional hurricanes made the top 10 list, including Hurricane Sandy in 2012, which caused $30 billion when it occurred and Hurricanes Harvey, Irma and Maria in 2017, each of which also caused about $30 billion in losses. Hurricanes Andrew, Ike and Wilma are also included in the top 10.
Top 10 Costliest Natural Catastrophes, United States1 ($ millions)
Rank Date Peril
Estimated insured property loss
Dollars when occurred In 2020 dollars2
1 2005 Hurricane Katrina $65,000 $85,570
2 2012 Hurricane Sandy 30,000 33,530
3 2017 Hurricane Harvey 30,000 31,590
4 2017 Hurricane Irma 29,900 31,320
5 2017 Hurricane Maria 29,670 31,100
6 1992 Hurricane Andrew 16,000 29,360
7 1994 Northridge Earthquake 15,300 27,060
8 2008 Hurricane Ike 18,200 21,510
9 2012 Drought loss 14,390 16,420
10 2005 Hurricane Wilma 10,670 13,840
1Natural disasters that cause at least $25 million in insured losses; or 10 deaths; or 50 people injured; or 2,000 filed claims or homes and structures damaged. Includes Puerto Rico and the U.S. Virgin Islands. Includes losses sustained by private insurers and government-sponsored programs such as the National Flood Insurance Program. Subject to change as loss estimates are further developed. As of November 25, 2020. 2Adjusted for inflation by Aon using the U.S. Consumer Price Index.
Source: Aon.
147Insurance Information Institute | www.ii i.org 2021 Insurance Fact Book 147
8. LOSSESMajor Catastrophes: United States
U.S. NATURAL CATASTROPHES: HURRICANESA tropical cyclone is a rotating low-pressure weather system that has organized thunderstorms but no fronts, according to the National Oceanic and Atmospheric Administration. Hurricanes are tropical cyclones whose sustained winds have reached 74 mph. At this point the hurricane reaches Category 1 on the Saffir-Simpson Hurricane Wind Scale, which has a range of 1 to 5, based on the hurricane’s intensity at the time of landfall at the location experiencing the strongest winds. The scale provides examples of the type of damage and impacts in the United States associated with winds of the indicated intensity. It does not address the potential for other hurricane-related phenomena such as storm surge, rainfall-induced floods and tornadoes.
The Saffir-Simpson Hurricane Wind Scale
Category1
Sustained wind speed (mph) Wind damage Historical example
1 74-95 Very dangerous winds will produce some damageHurricane Dolly, 2008, South Padre Island, Texas
2 96-110 Extremely dangerous winds will cause extensive damageHurricane Frances, 2004, Port St. Lucie, Florida
3 111-129 Devastating damage will occurHurricane Ivan, 2004,Gulf Shores, Alabama
4 130-156 Catastrophic damage will occurHurricane Charley, 2004,Punta Gorda, Florida
5 157 or higher Catastrophic damage will occurHurricane Andrew, 1992,Cutler Ridge, Florida
1Category 3 or higher storms are classified as “major.”
Source: U.S. Department of Commerce, National Oceanic and Atmospheric Administration, National Hurricane Center.
Insured losses from hurricanes rose in the past 15 years as hurricane activity has intensified. When adjusted for inflation and after losses are tallied for the 2017 and 2018 hurricanes, nine of the 10 costliest hurricanes in U.S. history have struck since 2004. In addition to the increase in storm activity, construction along both the Gulf Coast and East Coast has continued to develop, and property values have increased, resulting in higher loss exposure.
2020 Hurricane SeasonAtlantic Basin: The record-breaking 2020 hurricane season produced 30 named storms. The old record was set in 2005 when there were 28 storms. Thirteen—Hanna, Isaias, Laura, Marco, Nana, Paulette, Sally, Teddy, Delta, Epsilon, Zeta, Eta and Iota—became hurricanes. Six—Laura, Teddy, Delta, Epsilon, Eta and Iota—became major (Category 3 or stronger) storms. A typical year has 12 named storms, six hurricanes, and three major hurricanes. Since all 21 of the letters of the alphabet that meteorologists use were exhausted, they began using the Greek alphabet to name storms. A record-breaking eleven named storms or hurricanes made landfall in the continental United States. Of those, six hurricanes made landfall in the continental United States. The 2020 Atlantic hurricane season also broke records as Tropical Storm Edouard formed as the earliest 5th named Atlantic storm on record, according to Colorado State University atmospheric scientist and Triple-I non-resident scholar, Dr. Phillip Klotzbach, and continued to shatter earliest storm records through Zeta as the earliest 27th named storm. The season began early as Tropical Storm Arthur formed on May 16 in the Atlantic Ocean, east of Florida, marking the sixth consecutive year that the hurricane season began before the traditional official beginning of the season on June 1. Tropical Storm Bertha, the second
148Insurance Information Institute | www.ii i.org 2021 Insurance Fact Book 148
8. LOSSESU.S. Natural Catastrophes: Hurricanes
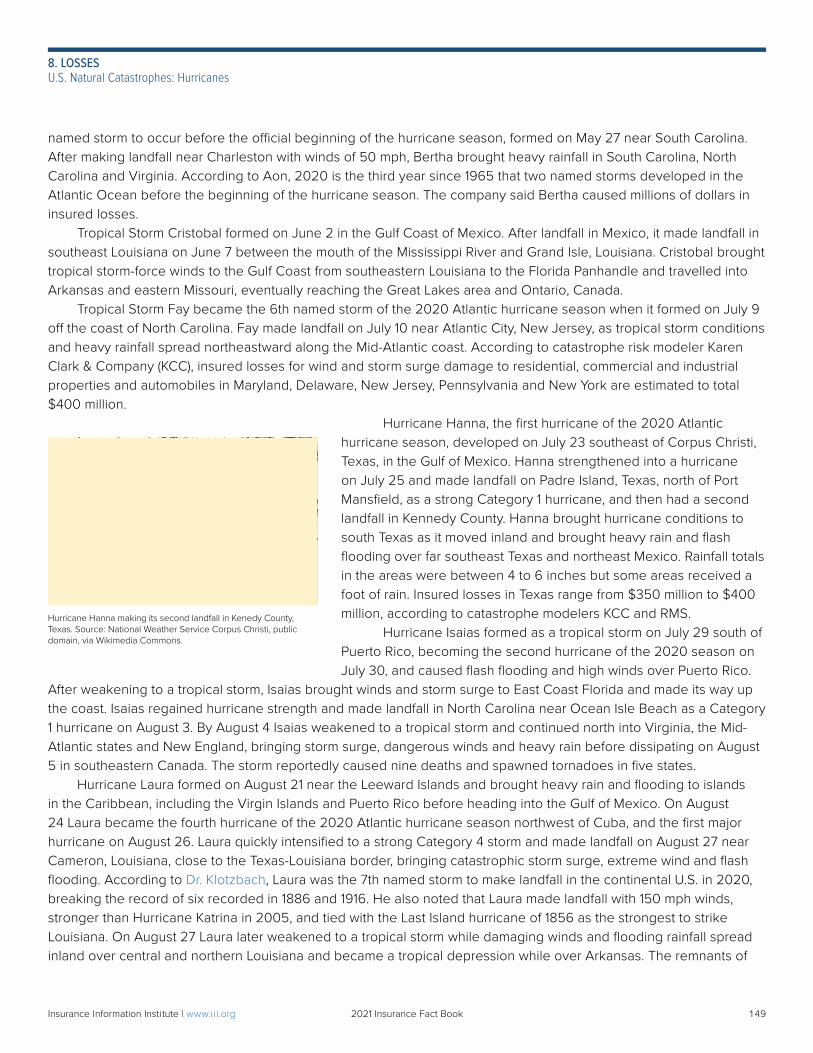
named storm to occur before the official beginning of the hurricane season, formed on May 27 near South Carolina. After making landfall near Charleston with winds of 50 mph, Bertha brought heavy rainfall in South Carolina, North Carolina and Virginia. According to Aon, 2020 is the third year since 1965 that two named storms developed in the Atlantic Ocean before the beginning of the hurricane season. The company said Bertha caused millions of dollars in insured losses. Tropical Storm Cristobal formed on June 2 in the Gulf Coast of Mexico. After landfall in Mexico, it made landfall in southeast Louisiana on June 7 between the mouth of the Mississippi River and Grand Isle, Louisiana. Cristobal brought tropical storm-force winds to the Gulf Coast from southeastern Louisiana to the Florida Panhandle and travelled into Arkansas and eastern Missouri, eventually reaching the Great Lakes area and Ontario, Canada. Tropical Storm Fay became the 6th named storm of the 2020 Atlantic hurricane season when it formed on July 9 off the coast of North Carolina. Fay made landfall on July 10 near Atlantic City, New Jersey, as tropical storm conditions and heavy rainfall spread northeastward along the Mid-Atlantic coast. According to catastrophe risk modeler Karen Clark & Company (KCC), insured losses for wind and storm surge damage to residential, commercial and industrial properties and automobiles in Maryland, Delaware, New Jersey, Pennsylvania and New York are estimated to total $400 million.
Hurricane Hanna, the first hurricane of the 2020 Atlantic hurricane season, developed on July 23 southeast of Corpus Christi, Texas, in the Gulf of Mexico. Hanna strengthened into a hurricane on July 25 and made landfall on Padre Island, Texas, north of Port Mansfield, as a strong Category 1 hurricane, and then had a second landfall in Kennedy County. Hanna brought hurricane conditions to south Texas as it moved inland and brought heavy rain and flash flooding over far southeast Texas and northeast Mexico. Rainfall totals in the areas were between 4 to 6 inches but some areas received a foot of rain. Insured losses in Texas range from $350 million to $400 million, according to catastrophe modelers KCC and RMS. Hurricane Isaias formed as a tropical storm on July 29 south of Puerto Rico, becoming the second hurricane of the 2020 season on July 30, and caused flash flooding and high winds over Puerto Rico.
After weakening to a tropical storm, Isaias brought winds and storm surge to East Coast Florida and made its way up the coast. Isaias regained hurricane strength and made landfall in North Carolina near Ocean Isle Beach as a Category 1 hurricane on August 3. By August 4 Isaias weakened to a tropical storm and continued north into Virginia, the Mid-Atlantic states and New England, bringing storm surge, dangerous winds and heavy rain before dissipating on August 5 in southeastern Canada. The storm reportedly caused nine deaths and spawned tornadoes in five states. Hurricane Laura formed on August 21 near the Leeward Islands and brought heavy rain and flooding to islands in the Caribbean, including the Virgin Islands and Puerto Rico before heading into the Gulf of Mexico. On August 24 Laura became the fourth hurricane of the 2020 Atlantic hurricane season northwest of Cuba, and the first major hurricane on August 26. Laura quickly intensified to a strong Category 4 storm and made landfall on August 27 near Cameron, Louisiana, close to the Texas-Louisiana border, bringing catastrophic storm surge, extreme wind and flash flooding. According to Dr. Klotzbach, Laura was the 7th named storm to make landfall in the continental U.S. in 2020, breaking the record of six recorded in 1886 and 1916. He also noted that Laura made landfall with 150 mph winds, stronger than Hurricane Katrina in 2005, and tied with the Last Island hurricane of 1856 as the strongest to strike Louisiana. On August 27 Laura later weakened to a tropical storm while damaging winds and flooding rainfall spread inland over central and northern Louisiana and became a tropical depression while over Arkansas. The remnants of
Hurricane Hanna making its second landfall in Kenedy County, Texas. Source: National Weather Service Corpus Christi, public domain, via Wikimedia Commons.
149Insurance Information Institute | www.ii i.org 2021 Insurance Fact Book 149
8. LOSSESU.S. Natural Catastrophes: Hurricanes
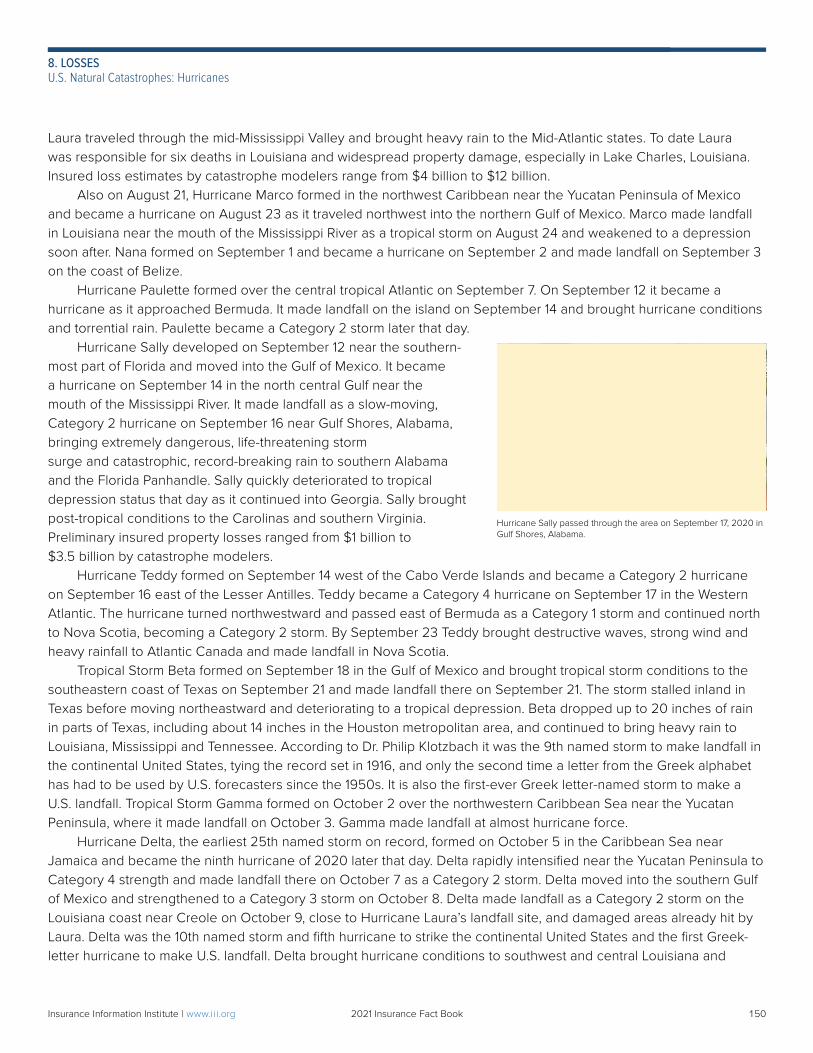
Laura traveled through the mid-Mississippi Valley and brought heavy rain to the Mid-Atlantic states. To date Laura was responsible for six deaths in Louisiana and widespread property damage, especially in Lake Charles, Louisiana. Insured loss estimates by catastrophe modelers range from $4 billion to $12 billion. Also on August 21, Hurricane Marco formed in the northwest Caribbean near the Yucatan Peninsula of Mexico and became a hurricane on August 23 as it traveled northwest into the northern Gulf of Mexico. Marco made landfall in Louisiana near the mouth of the Mississippi River as a tropical storm on August 24 and weakened to a depression soon after. Nana formed on September 1 and became a hurricane on September 2 and made landfall on September 3 on the coast of Belize. Hurricane Paulette formed over the central tropical Atlantic on September 7. On September 12 it became a hurricane as it approached Bermuda. It made landfall on the island on September 14 and brought hurricane conditions and torrential rain. Paulette became a Category 2 storm later that day. Hurricane Sally developed on September 12 near the southern-most part of Florida and moved into the Gulf of Mexico. It became a hurricane on September 14 in the north central Gulf near the mouth of the Mississippi River. It made landfall as a slow-moving, Category 2 hurricane on September 16 near Gulf Shores, Alabama, bringing extremely dangerous, life-threatening storm surge and catastrophic, record-breaking rain to southern Alabama and the Florida Panhandle. Sally quickly deteriorated to tropical depression status that day as it continued into Georgia. Sally brought post-tropical conditions to the Carolinas and southern Virginia. Preliminary insured property losses ranged from $1 billion to $3.5 billion by catastrophe modelers. Hurricane Teddy formed on September 14 west of the Cabo Verde Islands and became a Category 2 hurricane on September 16 east of the Lesser Antilles. Teddy became a Category 4 hurricane on September 17 in the Western Atlantic. The hurricane turned northwestward and passed east of Bermuda as a Category 1 storm and continued north to Nova Scotia, becoming a Category 2 storm. By September 23 Teddy brought destructive waves, strong wind and heavy rainfall to Atlantic Canada and made landfall in Nova Scotia. Tropical Storm Beta formed on September 18 in the Gulf of Mexico and brought tropical storm conditions to the southeastern coast of Texas on September 21 and made landfall there on September 21. The storm stalled inland in Texas before moving northeastward and deteriorating to a tropical depression. Beta dropped up to 20 inches of rain in parts of Texas, including about 14 inches in the Houston metropolitan area, and continued to bring heavy rain to Louisiana, Mississippi and Tennessee. According to Dr. Philip Klotzbach it was the 9th named storm to make landfall in the continental United States, tying the record set in 1916, and only the second time a letter from the Greek alphabet has had to be used by U.S. forecasters since the 1950s. It is also the first-ever Greek letter-named storm to make a U.S. landfall. Tropical Storm Gamma formed on October 2 over the northwestern Caribbean Sea near the Yucatan Peninsula, where it made landfall on October 3. Gamma made landfall at almost hurricane force. Hurricane Delta, the earliest 25th named storm on record, formed on October 5 in the Caribbean Sea near Jamaica and became the ninth hurricane of 2020 later that day. Delta rapidly intensified near the Yucatan Peninsula to Category 4 strength and made landfall there on October 7 as a Category 2 storm. Delta moved into the southern Gulf of Mexico and strengthened to a Category 3 storm on October 8. Delta made landfall as a Category 2 storm on the Louisiana coast near Creole on October 9, close to Hurricane Laura’s landfall site, and damaged areas already hit by Laura. Delta was the 10th named storm and fifth hurricane to strike the continental United States and the first Greek-letter hurricane to make U.S. landfall. Delta brought hurricane conditions to southwest and central Louisiana and
Hurricane Sally passed through the area on September 17, 2020 in Gulf Shores, Alabama.
150Insurance Information Institute | www.ii i.org 2021 Insurance Fact Book 150
8. LOSSESU.S. Natural Catastrophes: Hurricanes
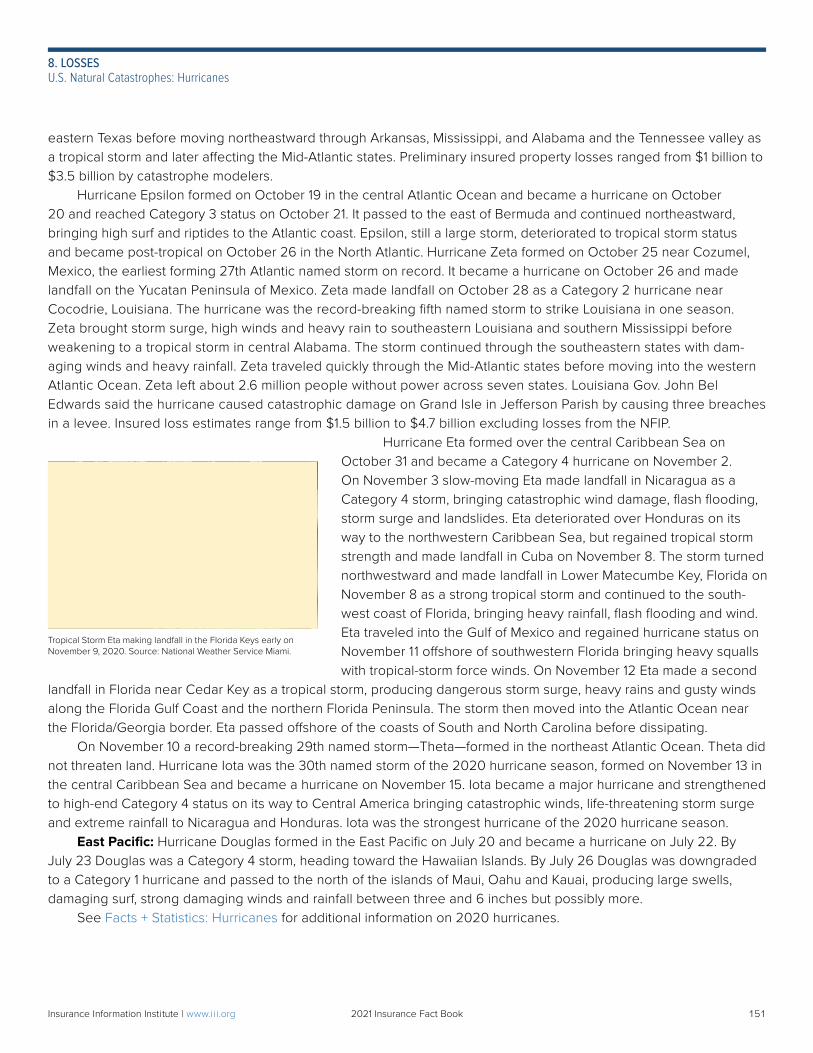
eastern Texas before moving northeastward through Arkansas, Mississippi, and Alabama and the Tennessee valley as a tropical storm and later affecting the Mid-Atlantic states. Preliminary insured property losses ranged from $1 billion to $3.5 billion by catastrophe modelers. Hurricane Epsilon formed on October 19 in the central Atlantic Ocean and became a hurricane on October 20 and reached Category 3 status on October 21. It passed to the east of Bermuda and continued northeastward, bringing high surf and riptides to the Atlantic coast. Epsilon, still a large storm, deteriorated to tropical storm status and became post-tropical on October 26 in the North Atlantic. Hurricane Zeta formed on October 25 near Cozumel, Mexico, the earliest forming 27th Atlantic named storm on record. It became a hurricane on October 26 and made landfall on the Yucatan Peninsula of Mexico. Zeta made landfall on October 28 as a Category 2 hurricane near Cocodrie, Louisiana. The hurricane was the record-breaking fifth named storm to strike Louisiana in one season. Zeta brought storm surge, high winds and heavy rain to southeastern Louisiana and southern Mississippi before weakening to a tropical storm in central Alabama. The storm continued through the southeastern states with dam-aging winds and heavy rainfall. Zeta traveled quickly through the Mid-Atlantic states before moving into the western Atlantic Ocean. Zeta left about 2.6 million people without power across seven states. Louisiana Gov. John Bel Edwards said the hurricane caused catastrophic damage on Grand Isle in Jefferson Parish by causing three breaches in a levee. Insured loss estimates range from $1.5 billion to $4.7 billion excluding losses from the NFIP.
Hurricane Eta formed over the central Caribbean Sea on October 31 and became a Category 4 hurricane on November 2. On November 3 slow-moving Eta made landfall in Nicaragua as a Category 4 storm, bringing catastrophic wind damage, flash flooding, storm surge and landslides. Eta deteriorated over Honduras on its way to the northwestern Caribbean Sea, but regained tropical storm strength and made landfall in Cuba on November 8. The storm turned northwestward and made landfall in Lower Matecumbe Key, Florida on November 8 as a strong tropical storm and continued to the south-west coast of Florida, bringing heavy rainfall, flash flooding and wind. Eta traveled into the Gulf of Mexico and regained hurricane status on November 11 offshore of southwestern Florida bringing heavy squalls with tropical-storm force winds. On November 12 Eta made a second
landfall in Florida near Cedar Key as a tropical storm, producing dangerous storm surge, heavy rains and gusty winds along the Florida Gulf Coast and the northern Florida Peninsula. The storm then moved into the Atlantic Ocean near the Florida/Georgia border. Eta passed offshore of the coasts of South and North Carolina before dissipating. On November 10 a record-breaking 29th named storm—Theta—formed in the northeast Atlantic Ocean. Theta did not threaten land. Hurricane Iota was the 30th named storm of the 2020 hurricane season, formed on November 13 in the central Caribbean Sea and became a hurricane on November 15. Iota became a major hurricane and strengthened to high-end Category 4 status on its way to Central America bringing catastrophic winds, life-threatening storm surge and extreme rainfall to Nicaragua and Honduras. Iota was the strongest hurricane of the 2020 hurricane season. East Pacific: Hurricane Douglas formed in the East Pacific on July 20 and became a hurricane on July 22. By July 23 Douglas was a Category 4 storm, heading toward the Hawaiian Islands. By July 26 Douglas was downgraded to a Category 1 hurricane and passed to the north of the islands of Maui, Oahu and Kauai, producing large swells, damaging surf, strong damaging winds and rainfall between three and 6 inches but possibly more. See Facts + Statistics: Hurricanes for additional information on 2020 hurricanes.
Tropical Storm Eta making landfall in the Florida Keys early on November 9, 2020. Source: National Weather Service Miami.
151Insurance Information Institute | www.ii i.org 2021 Insurance Fact Book 151
8. LOSSESU.S. Natural Catastrophes: Hurricanes
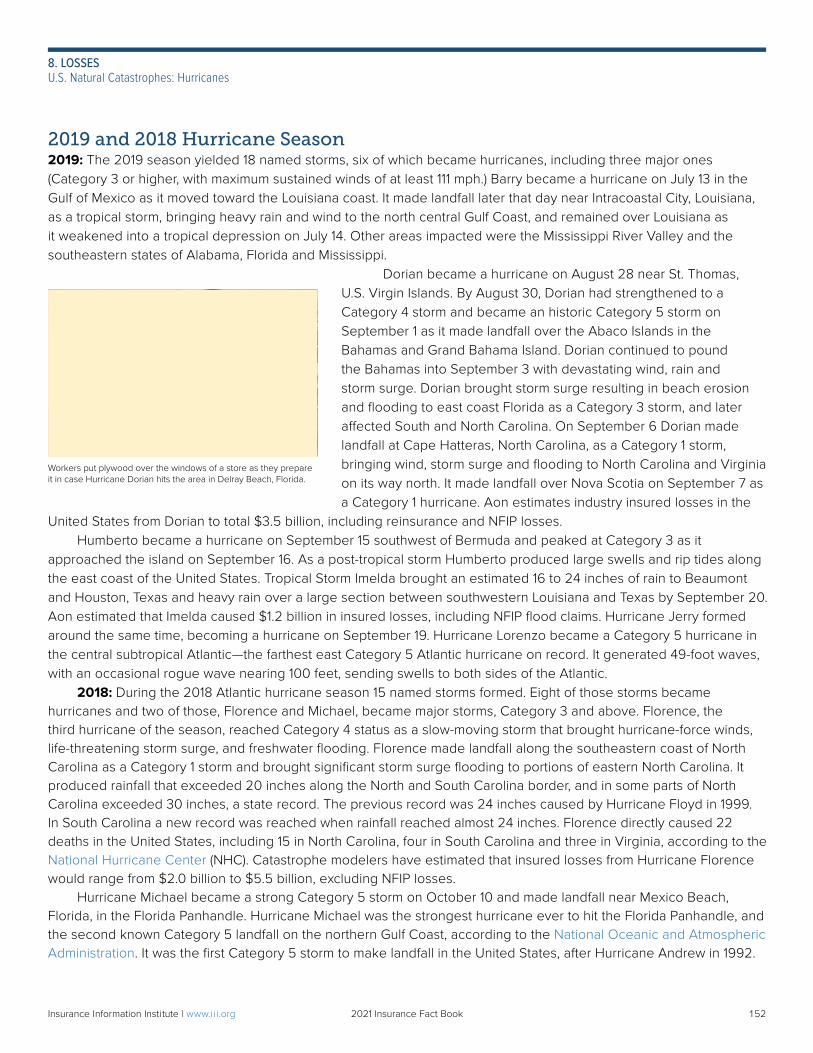
2019 and 2018 Hurricane Season2019: The 2019 season yielded 18 named storms, six of which became hurricanes, including three major ones (Category 3 or higher, with maximum sustained winds of at least 111 mph.) Barry became a hurricane on July 13 in the Gulf of Mexico as it moved toward the Louisiana coast. It made landfall later that day near Intracoastal City, Louisiana, as a tropical storm, bringing heavy rain and wind to the north central Gulf Coast, and remained over Louisiana as it weakened into a tropical depression on July 14. Other areas impacted were the Mississippi River Valley and the southeastern states of Alabama, Florida and Mississippi.
Dorian became a hurricane on August 28 near St. Thomas, U.S. Virgin Islands. By August 30, Dorian had strengthened to a Category 4 storm and became an historic Category 5 storm on September 1 as it made landfall over the Abaco Islands in the Bahamas and Grand Bahama Island. Dorian continued to pound the Bahamas into September 3 with devastating wind, rain and storm surge. Dorian brought storm surge resulting in beach erosion and flooding to east coast Florida as a Category 3 storm, and later affected South and North Carolina. On September 6 Dorian made landfall at Cape Hatteras, North Carolina, as a Category 1 storm, bringing wind, storm surge and flooding to North Carolina and Virginia on its way north. It made landfall over Nova Scotia on September 7 as a Category 1 hurricane. Aon estimates industry insured losses in the
United States from Dorian to total $3.5 billion, including reinsurance and NFIP losses. Humberto became a hurricane on September 15 southwest of Bermuda and peaked at Category 3 as it approached the island on September 16. As a post-tropical storm Humberto produced large swells and rip tides along the east coast of the United States. Tropical Storm Imelda brought an estimated 16 to 24 inches of rain to Beaumont and Houston, Texas and heavy rain over a large section between southwestern Louisiana and Texas by September 20. Aon estimated that Imelda caused $1.2 billion in insured losses, including NFIP flood claims. Hurricane Jerry formed around the same time, becoming a hurricane on September 19. Hurricane Lorenzo became a Category 5 hurricane in the central subtropical Atlantic—the farthest east Category 5 Atlantic hurricane on record. It generated 49-foot waves, with an occasional rogue wave nearing 100 feet, sending swells to both sides of the Atlantic. 2018: During the 2018 Atlantic hurricane season 15 named storms formed. Eight of those storms became hurricanes and two of those, Florence and Michael, became major storms, Category 3 and above. Florence, the third hurricane of the season, reached Category 4 status as a slow-moving storm that brought hurricane-force winds, life-threatening storm surge, and freshwater flooding. Florence made landfall along the southeastern coast of North Carolina as a Category 1 storm and brought significant storm surge flooding to portions of eastern North Carolina. It produced rainfall that exceeded 20 inches along the North and South Carolina border, and in some parts of North Carolina exceeded 30 inches, a state record. The previous record was 24 inches caused by Hurricane Floyd in 1999. In South Carolina a new record was reached when rainfall reached almost 24 inches. Florence directly caused 22 deaths in the United States, including 15 in North Carolina, four in South Carolina and three in Virginia, according to the National Hurricane Center (NHC). Catastrophe modelers have estimated that insured losses from Hurricane Florence would range from $2.0 billion to $5.5 billion, excluding NFIP losses. Hurricane Michael became a strong Category 5 storm on October 10 and made landfall near Mexico Beach, Florida, in the Florida Panhandle. Hurricane Michael was the strongest hurricane ever to hit the Florida Panhandle, and the second known Category 5 landfall on the northern Gulf Coast, according to the National Oceanic and Atmospheric Administration. It was the first Category 5 storm to make landfall in the United States, after Hurricane Andrew in 1992.
Workers put plywood over the windows of a store as they prepare it in case Hurricane Dorian hits the area in Delray Beach, Florida.
152Insurance Information Institute | www.ii i.org 2021 Insurance Fact Book 152
8. LOSSESU.S. Natural Catastrophes: Hurricanes
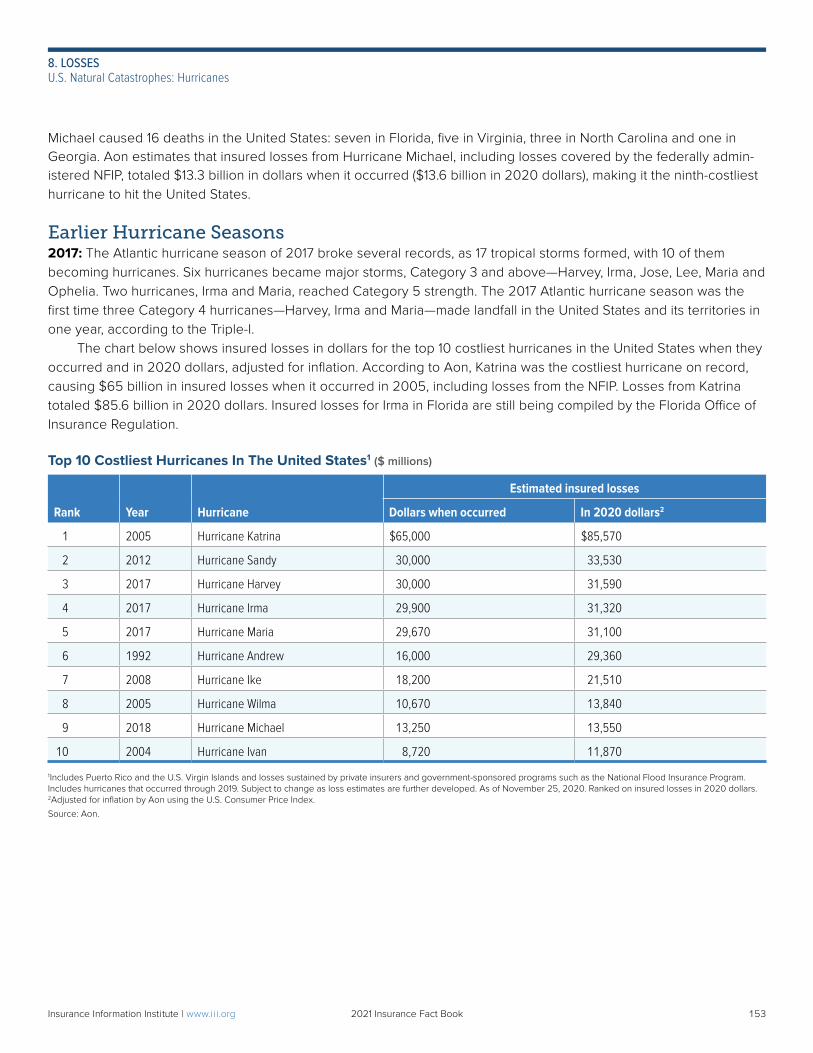
Michael caused 16 deaths in the United States: seven in Florida, five in Virginia, three in North Carolina and one in Georgia. Aon estimates that insured losses from Hurricane Michael, including losses covered by the federally admin-istered NFIP, totaled $13.3 billion in dollars when it occurred ($13.6 billion in 2020 dollars), making it the ninth-costliest hurricane to hit the United States.
Earlier Hurricane Seasons2017: The Atlantic hurricane season of 2017 broke several records, as 17 tropical storms formed, with 10 of them becoming hurricanes. Six hurricanes became major storms, Category 3 and above—Harvey, Irma, Jose, Lee, Maria and Ophelia. Two hurricanes, Irma and Maria, reached Category 5 strength. The 2017 Atlantic hurricane season was the first time three Category 4 hurricanes—Harvey, Irma and Maria—made landfall in the United States and its territories in one year, according to the Triple-I. The chart below shows insured losses in dollars for the top 10 costliest hurricanes in the United States when they occurred and in 2020 dollars, adjusted for inflation. According to Aon, Katrina was the costliest hurricane on record, causing $65 billion in insured losses when it occurred in 2005, including losses from the NFIP. Losses from Katrina totaled $85.6 billion in 2020 dollars. Insured losses for Irma in Florida are still being compiled by the Florida Office of Insurance Regulation.
Top 10 Costliest Hurricanes In The United States1 ($ millions)
Rank Year Hurricane
Estimated insured losses
Dollars when occurred In 2020 dollars2
1 2005 Hurricane Katrina $65,000 $85,570
2 2012 Hurricane Sandy 30,000 33,530
3 2017 Hurricane Harvey 30,000 31,590
4 2017 Hurricane Irma 29,900 31,320
5 2017 Hurricane Maria 29,670 31,100
6 1992 Hurricane Andrew 16,000 29,360
7 2008 Hurricane Ike 18,200 21,510
8 2005 Hurricane Wilma 10,670 13,840
9 2018 Hurricane Michael 13,250 13,550
10 2004 Hurricane Ivan 8,720 11,870
1Includes Puerto Rico and the U.S. Virgin Islands and losses sustained by private insurers and government-sponsored programs such as the National Flood Insurance Program. Includes hurricanes that occurred through 2019. Subject to change as loss estimates are further developed. As of November 25, 2020. Ranked on insured losses in 2020 dollars. 2Adjusted for inflation by Aon using the U.S. Consumer Price Index.
Source: Aon.
153Insurance Information Institute | www.ii i.org 2021 Insurance Fact Book 153
8. LOSSESU.S. Natural Catastrophes: Hurricanes
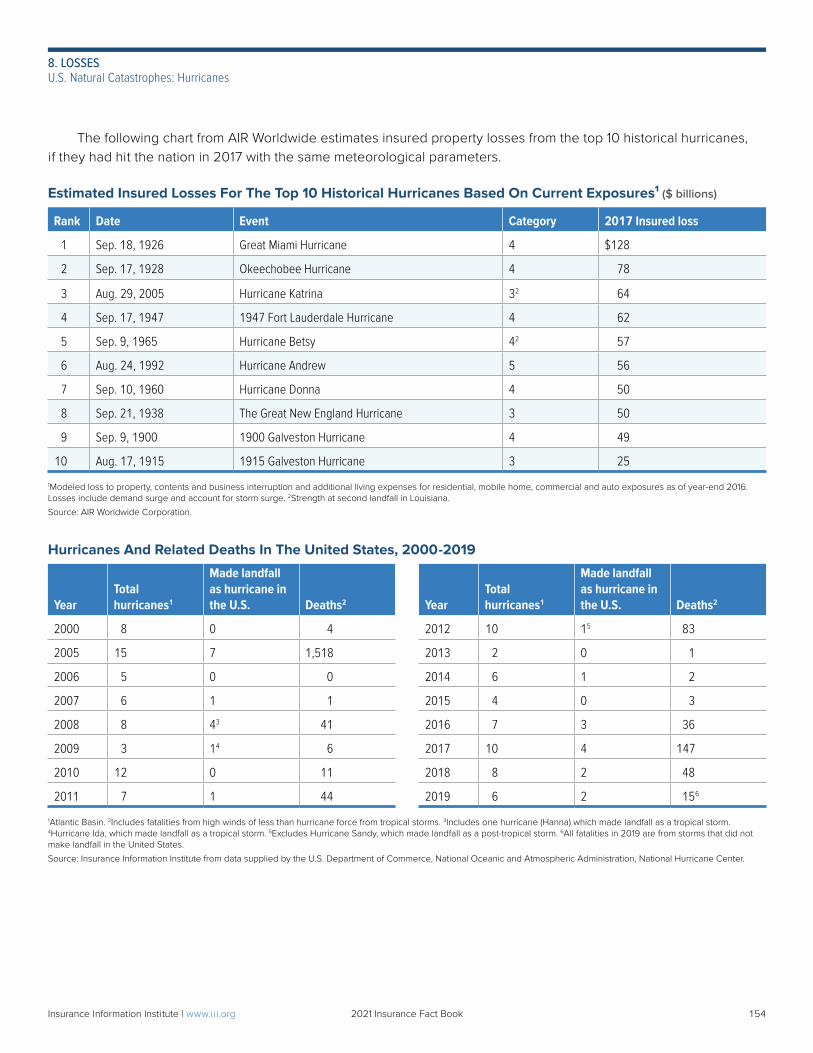
The following chart from AIR Worldwide estimates insured property losses from the top 10 historical hurricanes, if they had hit the nation in 2017 with the same meteorological parameters.
Estimated Insured Losses For The Top 10 Historical Hurricanes Based On Current Exposures¹ ($ billions)
Rank Date Event Category 2017 Insured loss
1 Sep. 18, 1926 Great Miami Hurricane 4 $128
2 Sep. 17, 1928 Okeechobee Hurricane 4 78
3 Aug. 29, 2005 Hurricane Katrina 32 64
4 Sep. 17, 1947 1947 Fort Lauderdale Hurricane 4 62
5 Sep. 9, 1965 Hurricane Betsy 42 57
6 Aug. 24, 1992 Hurricane Andrew 5 56
7 Sep. 10, 1960 Hurricane Donna 4 50
8 Sep. 21, 1938 The Great New England Hurricane 3 50
9 Sep. 9, 1900 1900 Galveston Hurricane 4 49
10 Aug. 17, 1915 1915 Galveston Hurricane 3 25
1Modeled loss to property, contents and business interruption and additional living expenses for residential, mobile home, commercial and auto exposures as of year-end 2016. Losses include demand surge and account for storm surge. 2Strength at second landfall in Louisiana.
Source: AIR Worldwide Corporation.
Hurricanes And Related Deaths In The United States, 2000-2019
YearTotal hurricanes1
Made landfall as hurricane in the U.S. Deaths2 Year
Total hurricanes1
Made landfall as hurricane in the U.S. Deaths2
2000 8 0 4 2012 10 15 83
2005 15 7 1,518 2013 2 0 1
2006 5 0 0 2014 6 1 2
2007 6 1 1 2015 4 0 3
2008 8 43 41 2016 7 3 36
2009 3 14 6 2017 10 4 147
2010 12 0 11 2018 8 2 48
2011 7 1 44 2019 6 2 15 6
1Atlantic Basin. 2Includes fatalities from high winds of less than hurricane force from tropical storms. 3Includes one hurricane (Hanna) which made landfall as a tropical storm. 4Hurricane Ida, which made landfall as a tropical storm. 5Excludes Hurricane Sandy, which made landfall as a post-tropical storm. 6All fatalities in 2019 are from storms that did not make landfall in the United States.
Source: Insurance Information Institute from data supplied by the U.S. Department of Commerce, National Oceanic and Atmospheric Administration, National Hurricane Center.
154Insurance Information Institute | www.ii i.org 2021 Insurance Fact Book 154
8. LOSSESU.S. Natural Catastrophes: Hurricanes
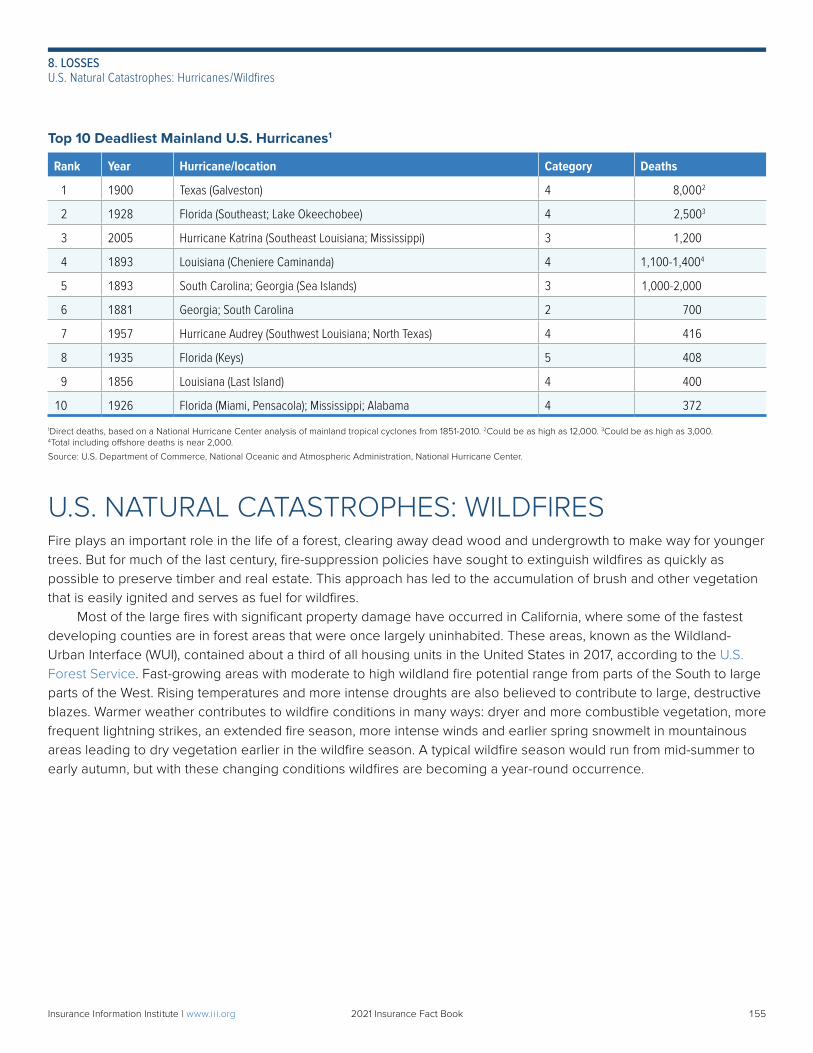
Top 10 Deadliest Mainland U.S. Hurricanes1
Rank Year Hurricane/location Category Deaths
1 1900 Texas (Galveston) 4 8,0002
2 1928 Florida (Southeast; Lake Okeechobee) 4 2,5003
3 2005 Hurricane Katrina (Southeast Louisiana; Mississippi) 3 1,200
4 1893 Louisiana (Cheniere Caminanda) 4 1,100-1,4004
5 1893 South Carolina; Georgia (Sea Islands) 3 1,000-2,000
6 1881 Georgia; South Carolina 2 700
7 1957 Hurricane Audrey (Southwest Louisiana; North Texas) 4 416
8 1935 Florida (Keys) 5 408
9 1856 Louisiana (Last Island) 4 400
10 1926 Florida (Miami, Pensacola); Mississippi; Alabama 4 372
1Direct deaths, based on a National Hurricane Center analysis of mainland tropical cyclones from 1851-2010. 2Could be as high as 12,000. 3Could be as high as 3,000. 4Total including offshore deaths is near 2,000.
Source: U.S. Department of Commerce, National Oceanic and Atmospheric Administration, National Hurricane Center.
U.S. NATURAL CATASTROPHES: WILDFIRESFire plays an important role in the life of a forest, clearing away dead wood and undergrowth to make way for younger trees. But for much of the last century, fire-suppression policies have sought to extinguish wildfires as quickly as possible to preserve timber and real estate. This approach has led to the accumulation of brush and other vegetation that is easily ignited and serves as fuel for wildfires. Most of the large fires with significant property damage have occurred in California, where some of the fastest developing counties are in forest areas that were once largely uninhabited. These areas, known as the Wildland-Urban Interface (WUI), contained about a third of all housing units in the United States in 2017, according to the U.S. Forest Service. Fast-growing areas with moderate to high wildland fire potential range from parts of the South to large parts of the West. Rising temperatures and more intense droughts are also believed to contribute to large, destructive blazes. Warmer weather contributes to wildfire conditions in many ways: dryer and more combustible vegetation, more frequent lightning strikes, an extended fire season, more intense winds and earlier spring snowmelt in mountainous areas leading to dry vegetation earlier in the wildfire season. A typical wildfire season would run from mid-summer to early autumn, but with these changing conditions wildfires are becoming a year-round occurrence.
155Insurance Information Institute | www.ii i.org 2021 Insurance Fact Book 155
8. LOSSESU.S. Natural Catastrophes: Hurricanes/Wildfires
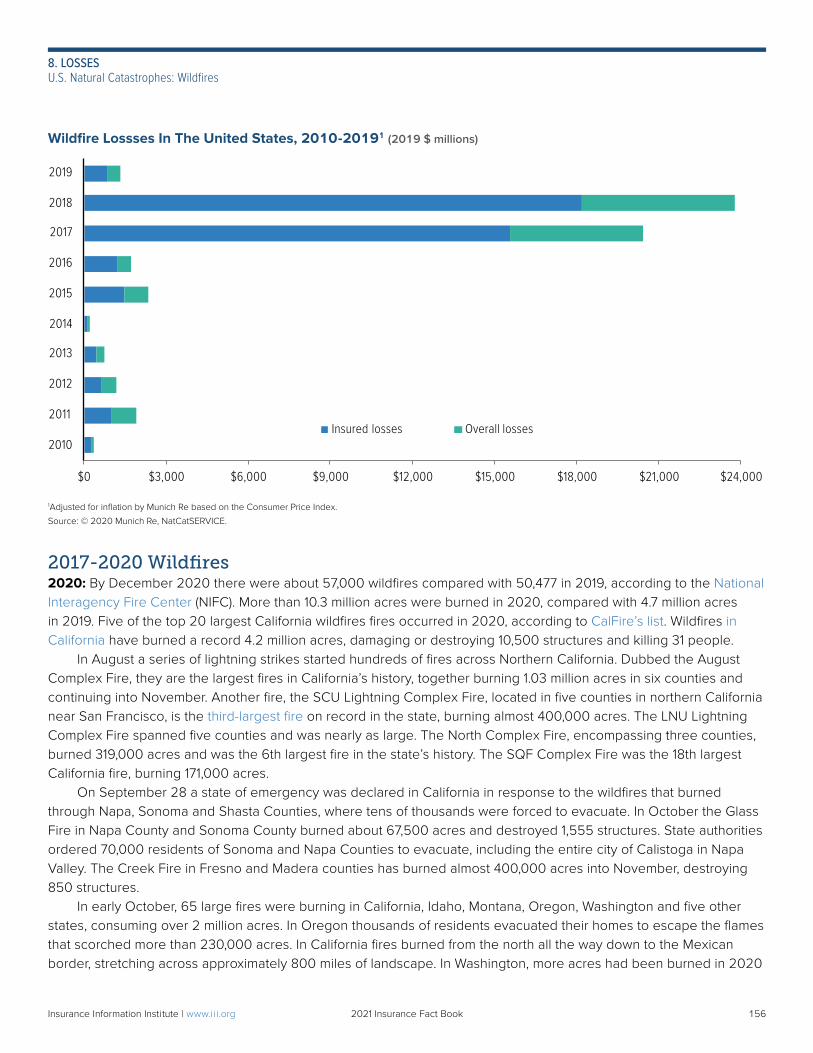
Wildfire Lossses In The United States, 2010-20191 (2019 $ millions)
1Adjusted for inflation by Munich Re based on the Consumer Price Index.
Source: © 2020 Munich Re, NatCatSERVICE.
2017-2020 Wildfires2020: By December 2020 there were about 57,000 wildfires compared with 50,477 in 2019, according to the National Interagency Fire Center (NIFC). More than 10.3 million acres were burned in 2020, compared with 4.7 million acres in 2019. Five of the top 20 largest California wildfires fires occurred in 2020, according to CalFire’s list. Wildfires in California have burned a record 4.2 million acres, damaging or destroying 10,500 structures and killing 31 people. In August a series of lightning strikes started hundreds of fires across Northern California. Dubbed the August Complex Fire, they are the largest fires in California’s history, together burning 1.03 million acres in six counties and continuing into November. Another fire, the SCU Lightning Complex Fire, located in five counties in northern California near San Francisco, is the third-largest fire on record in the state, burning almost 400,000 acres. The LNU Lightning Complex Fire spanned five counties and was nearly as large. The North Complex Fire, encompassing three counties, burned 319,000 acres and was the 6th largest fire in the state’s history. The SQF Complex Fire was the 18th largest California fire, burning 171,000 acres. On September 28 a state of emergency was declared in California in response to the wildfires that burned through Napa, Sonoma and Shasta Counties, where tens of thousands were forced to evacuate. In October the Glass Fire in Napa County and Sonoma County burned about 67,500 acres and destroyed 1,555 structures. State authorities ordered 70,000 residents of Sonoma and Napa Counties to evacuate, including the entire city of Calistoga in Napa Valley. The Creek Fire in Fresno and Madera counties has burned almost 400,000 acres into November, destroying 850 structures. In early October, 65 large fires were burning in California, Idaho, Montana, Oregon, Washington and five other states, consuming over 2 million acres. In Oregon thousands of residents evacuated their homes to escape the flames that scorched more than 230,000 acres. In California fires burned from the north all the way down to the Mexican border, stretching across approximately 800 miles of landscape. In Washington, more acres had been burned in 2020
$0 $3,000 $6,000 $9,000 $12,000 $15,000 $18,000 $21,000 $24,000
2010
2011
2012
2013
2014
2015
2016
2017
2018
2019
Insured losses Overall losses
156Insurance Information Institute | www.ii i.org 2021 Insurance Fact Book 156
8. LOSSESU.S. Natural Catastrophes: Wildfires
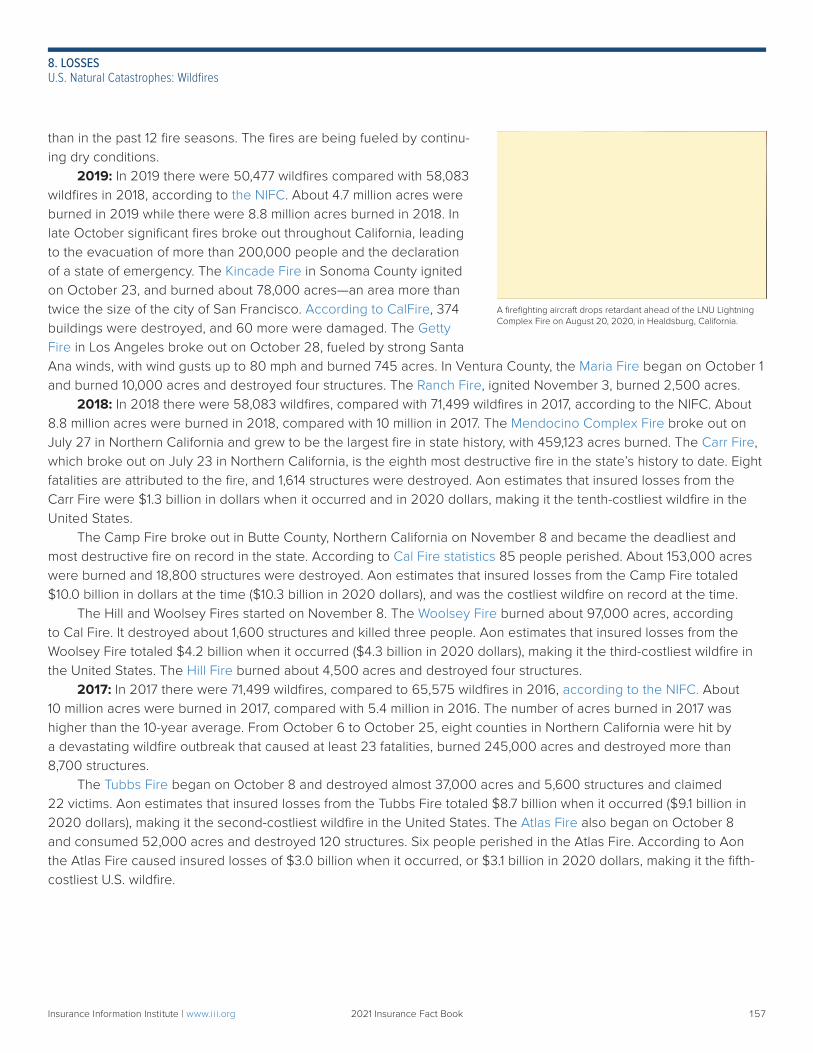
than in the past 12 fire seasons. The fires are being fueled by continu-ing dry conditions. 2019: In 2019 there were 50,477 wildfires compared with 58,083 wildfires in 2018, according to the NIFC. About 4.7 million acres were burned in 2019 while there were 8.8 million acres burned in 2018. In late October significant fires broke out throughout California, leading to the evacuation of more than 200,000 people and the declaration of a state of emergency. The Kincade Fire in Sonoma County ignited on October 23, and burned about 78,000 acres—an area more than twice the size of the city of San Francisco. According to CalFire, 374 buildings were destroyed, and 60 more were damaged. The Getty Fire in Los Angeles broke out on October 28, fueled by strong Santa Ana winds, with wind gusts up to 80 mph and burned 745 acres. In Ventura County, the Maria Fire began on October 1 and burned 10,000 acres and destroyed four structures. The Ranch Fire, ignited November 3, burned 2,500 acres. 2018: In 2018 there were 58,083 wildfires, compared with 71,499 wildfires in 2017, according to the NIFC. About 8.8 million acres were burned in 2018, compared with 10 million in 2017. The Mendocino Complex Fire broke out on July 27 in Northern California and grew to be the largest fire in state history, with 459,123 acres burned. The Carr Fire, which broke out on July 23 in Northern California, is the eighth most destructive fire in the state’s history to date. Eight fatalities are attributed to the fire, and 1,614 structures were destroyed. Aon estimates that insured losses from the Carr Fire were $1.3 billion in dollars when it occurred and in 2020 dollars, making it the tenth-costliest wildfire in the United States. The Camp Fire broke out in Butte County, Northern California on November 8 and became the deadliest and most destructive fire on record in the state. According to Cal Fire statistics 85 people perished. About 153,000 acres were burned and 18,800 structures were destroyed. Aon estimates that insured losses from the Camp Fire totaled $10.0 billion in dollars at the time ($10.3 billion in 2020 dollars), and was the costliest wildfire on record at the time. The Hill and Woolsey Fires started on November 8. The Woolsey Fire burned about 97,000 acres, according to Cal Fire. It destroyed about 1,600 structures and killed three people. Aon estimates that insured losses from the Woolsey Fire totaled $4.2 billion when it occurred ($4.3 billion in 2020 dollars), making it the third-costliest wildfire in the United States. The Hill Fire burned about 4,500 acres and destroyed four structures. 2017: In 2017 there were 71,499 wildfires, compared to 65,575 wildfires in 2016, according to the NIFC. About 10 million acres were burned in 2017, compared with 5.4 million in 2016. The number of acres burned in 2017 was higher than the 10-year average. From October 6 to October 25, eight counties in Northern California were hit by a devastating wildfire outbreak that caused at least 23 fatalities, burned 245,000 acres and destroyed more than 8,700 structures. The Tubbs Fire began on October 8 and destroyed almost 37,000 acres and 5,600 structures and claimed 22 victims. Aon estimates that insured losses from the Tubbs Fire totaled $8.7 billion when it occurred ($9.1 billion in 2020 dollars), making it the second-costliest wildfire in the United States. The Atlas Fire also began on October 8 and consumed 52,000 acres and destroyed 120 structures. Six people perished in the Atlas Fire. According to Aon the Atlas Fire caused insured losses of $3.0 billion when it occurred, or $3.1 billion in 2020 dollars, making it the fifth- costliest U.S. wildfire.
A firefighting aircraft drops retardant ahead of the LNU Lightning Complex Fire on August 20, 2020, in Healdsburg, California.
157Insurance Information Institute | www.ii i.org 2021 Insurance Fact Book 157
8. LOSSESU.S. Natural Catastrophes: Wildfires
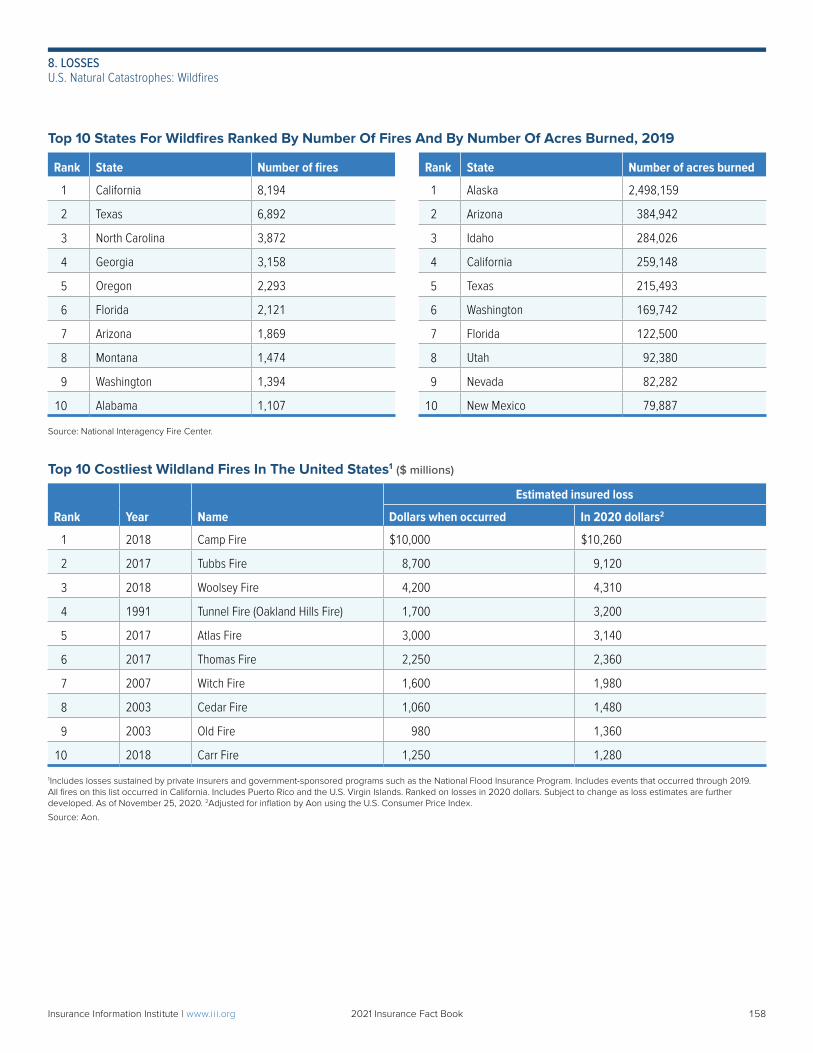
Top 10 States For Wildfires Ranked By Number Of Fires And By Number Of Acres Burned, 2019
Rank State Number of fires Rank State Number of acres burned
1 California 8,194 1 Alaska 2,498,159
2 Texas 6,892 2 Arizona 384,942
3 North Carolina 3,872 3 Idaho 284,026
4 Georgia 3,158 4 California 259,148
5 Oregon 2,293 5 Texas 215,493
6 Florida 2,121 6 Washington 169,742
7 Arizona 1,869 7 Florida 122,500
8 Montana 1,474 8 Utah 92,380
9 Washington 1,394 9 Nevada 82,282
10 Alabama 1,107 10 New Mexico 79,887
Source: National Interagency Fire Center.
Top 10 Costliest Wildland Fires In The United States1 ($ millions)
Rank Year Name
Estimated insured loss
Dollars when occurred In 2020 dollars2
1 2018 Camp Fire $10,000 $10,260
2 2017 Tubbs Fire 8,700 9,120
3 2018 Woolsey Fire 4,200 4,310
4 1991 Tunnel Fire (Oakland Hills Fire) 1,700 3,200
5 2017 Atlas Fire 3,000 3,140
6 2017 Thomas Fire 2,250 2,360
7 2007 Witch Fire 1,600 1,980
8 2003 Cedar Fire 1,060 1,480
9 2003 Old Fire 980 1,360
10 2018 Carr Fire 1,250 1,280
1Includes losses sustained by private insurers and government-sponsored programs such as the National Flood Insurance Program. Includes events that occurred through 2019. All fires on this list occurred in California. Includes Puerto Rico and the U.S. Virgin Islands. Ranked on losses in 2020 dollars. Subject to change as loss estimates are further developed. As of November 25, 2020. 2Adjusted for inflation by Aon using the U.S. Consumer Price Index.
Source: Aon.
158Insurance Information Institute | www.ii i.org 2021 Insurance Fact Book 158
8. LOSSESU.S. Natural Catastrophes: Wildfires
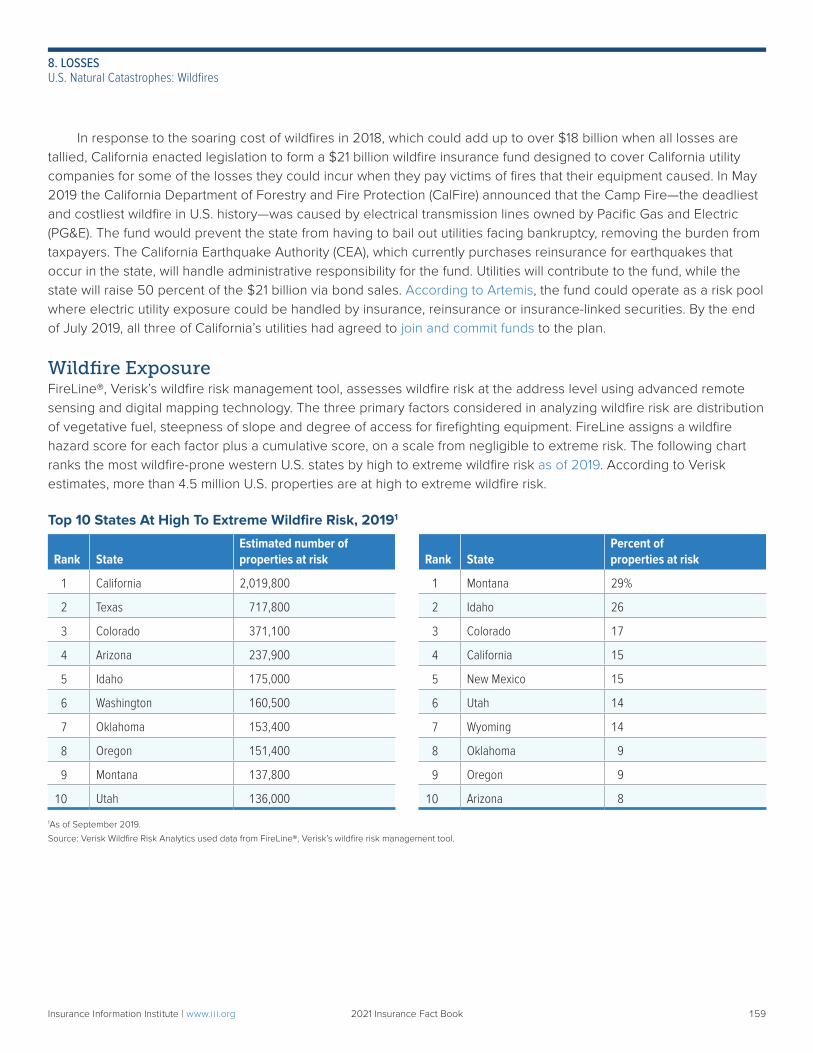
In response to the soaring cost of wildfires in 2018, which could add up to over $18 billion when all losses are tallied, California enacted legislation to form a $21 billion wildfire insurance fund designed to cover California utility companies for some of the losses they could incur when they pay victims of fires that their equipment caused. In May 2019 the California Department of Forestry and Fire Protection (CalFire) announced that the Camp Fire—the deadliest and costliest wildfire in U.S. history—was caused by electrical transmission lines owned by Pacific Gas and Electric (PG&E). The fund would prevent the state from having to bail out utilities facing bankruptcy, removing the burden from taxpayers. The California Earthquake Authority (CEA), which currently purchases reinsurance for earthquakes that occur in the state, will handle administrative responsibility for the fund. Utilities will contribute to the fund, while the state will raise 50 percent of the $21 billion via bond sales. According to Artemis, the fund could operate as a risk pool where electric utility exposure could be handled by insurance, reinsurance or insurance-linked securities. By the end of July 2019, all three of California’s utilities had agreed to join and commit funds to the plan.
Wildfire ExposureFireLine®, Verisk’s wildfire risk management tool, assesses wildfire risk at the address level using advanced remote sensing and digital mapping technology. The three primary factors considered in analyzing wildfire risk are distribution of vegetative fuel, steepness of slope and degree of access for firefighting equipment. FireLine assigns a wildfire hazard score for each factor plus a cumulative score, on a scale from negligible to extreme risk. The following chart ranks the most wildfire-prone western U.S. states by high to extreme wildfire risk as of 2019. According to Verisk estimates, more than 4.5 million U.S. properties are at high to extreme wildfire risk.
Top 10 States At High To Extreme Wildfire Risk, 20191
Rank StateEstimated number of properties at risk Rank State
Percent of properties at risk
1 California 2,019,800 1 Montana 29%
2 Texas 717,800 2 Idaho 26
3 Colorado 371,100 3 Colorado 17
4 Arizona 237,900 4 California 15
5 Idaho 175,000 5 New Mexico 15
6 Washington 160,500 6 Utah 14
7 Oklahoma 153,400 7 Wyoming 14
8 Oregon 151,400 8 Oklahoma 9
9 Montana 137,800 9 Oregon 9
10 Utah 136,000 10 Arizona 8
1As of September 2019.
Source: Verisk Wildfire Risk Analytics used data from FireLine®, Verisk’s wildfire risk management tool.
159Insurance Information Institute | www.ii i.org 2021 Insurance Fact Book 159
8. LOSSESU.S. Natural Catastrophes: Wildfires
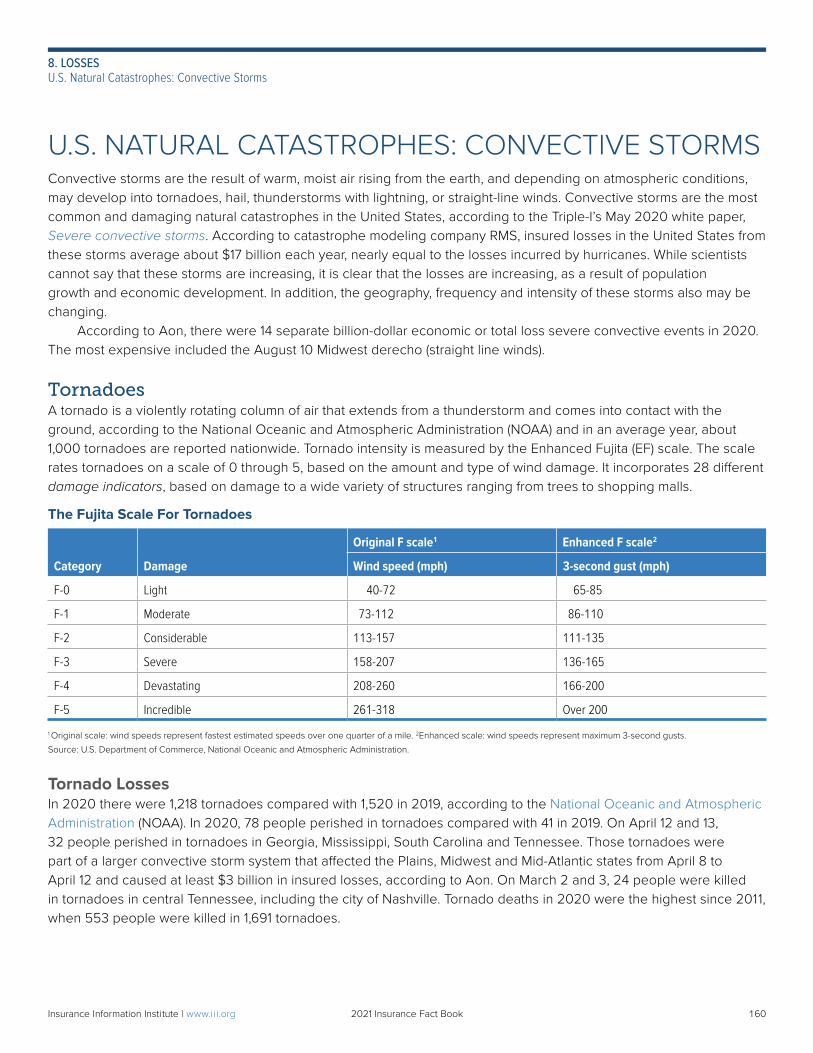
U.S. NATURAL CATASTROPHES: CONVECTIVE STORMSConvective storms are the result of warm, moist air rising from the earth, and depending on atmospheric conditions, may develop into tornadoes, hail, thunderstorms with lightning, or straight-line winds. Convective storms are the most common and damaging natural catastrophes in the United States, according to the Triple-I’s May 2020 white paper, Severe convective storms. According to catastrophe modeling company RMS, insured losses in the United States from these storms average about $17 billion each year, nearly equal to the losses incurred by hurricanes. While scientists cannot say that these storms are increasing, it is clear that the losses are increasing, as a result of population growth and economic development. In addition, the geography, frequency and intensity of these storms also may be changing. According to Aon, there were 14 separate billion-dollar economic or total loss severe convective events in 2020. The most expensive included the August 10 Midwest derecho (straight line winds).
TornadoesA tornado is a violently rotating column of air that extends from a thunderstorm and comes into contact with the ground, according to the National Oceanic and Atmospheric Administration (NOAA) and in an average year, about 1,000 tornadoes are reported nationwide. Tornado intensity is measured by the Enhanced Fujita (EF) scale. The scale rates tornadoes on a scale of 0 through 5, based on the amount and type of wind damage. It incorporates 28 different damage indicators, based on damage to a wide variety of structures ranging from trees to shopping malls.
The Fujita Scale For Tornadoes
Category Damage
Original F scale1 Enhanced F scale2
Wind speed (mph) 3-second gust (mph)
F-0 Light 40-72 65-85
F-1 Moderate 73-112 86-110
F-2 Considerable 113-157 111-135
F-3 Severe 158-207 136-165
F-4 Devastating 208-260 166-200
F-5 Incredible 261-318 Over 200
1 Original scale: wind speeds represent fastest estimated speeds over one quarter of a mile. 2Enhanced scale: wind speeds represent maximum 3-second gusts.
Source: U.S. Department of Commerce, National Oceanic and Atmospheric Administration.
Tornado LossesIn 2020 there were 1,218 tornadoes compared with 1,520 in 2019, according to the National Oceanic and Atmospheric Administration (NOAA). In 2020, 78 people perished in tornadoes compared with 41 in 2019. On April 12 and 13, 32 people perished in tornadoes in Georgia, Mississippi, South Carolina and Tennessee. Those tornadoes were part of a larger convective storm system that affected the Plains, Midwest and Mid-Atlantic states from April 8 to April 12 and caused at least $3 billion in insured losses, according to Aon. On March 2 and 3, 24 people were killed in tornadoes in central Tennessee, including the city of Nashville. Tornado deaths in 2020 were the highest since 2011, when 553 people were killed in 1,691 tornadoes.
160Insurance Information Institute | www.ii i.org 2021 Insurance Fact Book 160
8. LOSSESU.S. Natural Catastrophes: Convective Storms
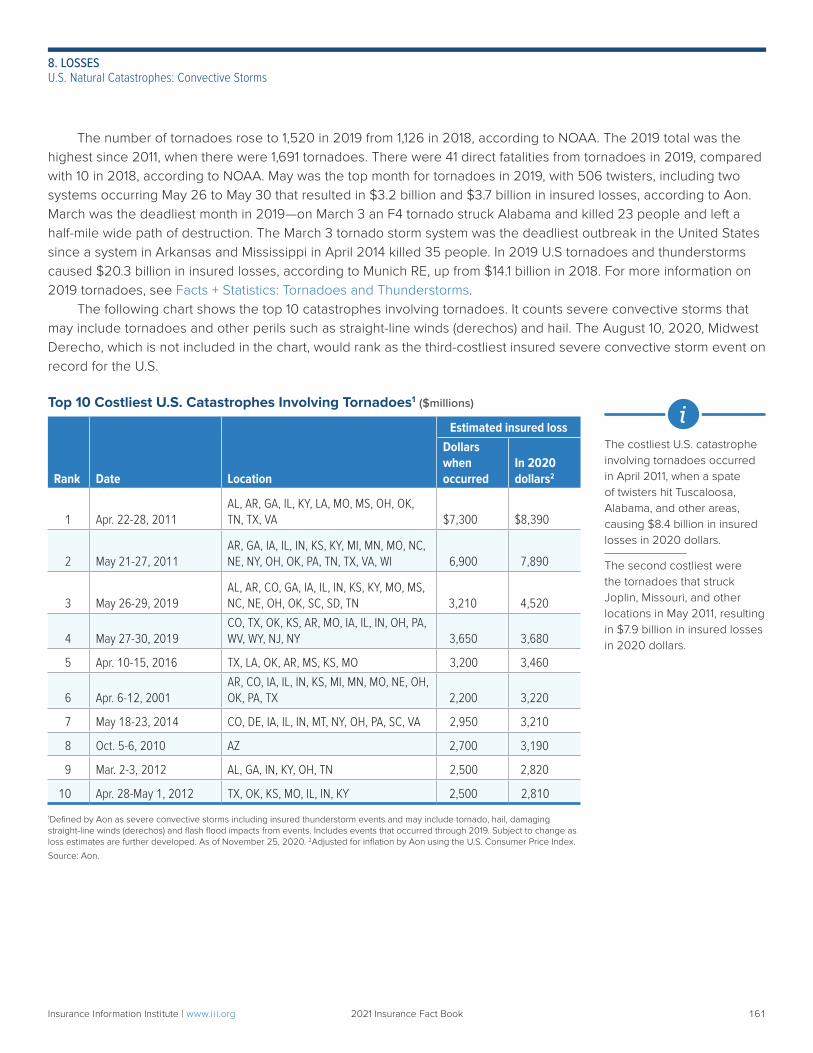
The number of tornadoes rose to 1,520 in 2019 from 1,126 in 2018, according to NOAA. The 2019 total was the highest since 2011, when there were 1,691 tornadoes. There were 41 direct fatalities from tornadoes in 2019, compared with 10 in 2018, according to NOAA. May was the top month for tornadoes in 2019, with 506 twisters, including two systems occurring May 26 to May 30 that resulted in $3.2 billion and $3.7 billion in insured losses, according to Aon. March was the deadliest month in 2019—on March 3 an F4 tornado struck Alabama and killed 23 people and left a half-mile wide path of destruction. The March 3 tornado storm system was the deadliest outbreak in the United States since a system in Arkansas and Mississippi in April 2014 killed 35 people. In 2019 U.S tornadoes and thunderstorms caused $20.3 billion in insured losses, according to Munich RE, up from $14.1 billion in 2018. For more information on 2019 tornadoes, see Facts + Statistics: Tornadoes and Thunderstorms. The following chart shows the top 10 catastrophes involving tornadoes. It counts severe convective storms that may include tornadoes and other perils such as straight-line winds (derechos) and hail. The August 10, 2020, Midwest Derecho, which is not included in the chart, would rank as the third-costliest insured severe convective storm event on record for the U.S.
Top 10 Costliest U.S. Catastrophes Involving Tornadoes1 ($millions)
Rank Date Location
Estimated insured lossDollars when occurred
In 2020 dollars2
1 Apr. 22-28, 2011AL, AR, GA, IL, KY, LA, MO, MS, OH, OK, TN, TX, VA $7,300 $8,390
2 May 21-27, 2011AR, GA, IA, IL, IN, KS, KY, MI, MN, MO, NC, NE, NY, OH, OK, PA, TN, TX, VA, WI 6,900 7,890
3 May 26-29, 2019AL, AR, CO, GA, IA, IL, IN, KS, KY, MO, MS,NC, NE, OH, OK, SC, SD, TN 3,210 4,520
4 May 27-30, 2019CO, TX, OK, KS, AR, MO, IA, IL, IN, OH, PA,WV, WY, NJ, NY 3,650 3,680
5 Apr. 10-15, 2016 TX, LA, OK, AR, MS, KS, MO 3,200 3,460
6 Apr. 6-12, 2001AR, CO, IA, IL, IN, KS, MI, MN, MO, NE, OH,OK, PA, TX 2,200 3,220
7 May 18-23, 2014 CO, DE, IA, IL, IN, MT, NY, OH, PA, SC, VA 2,950 3,210
8 Oct. 5-6, 2010 AZ 2,700 3,190
9 Mar. 2-3, 2012 AL, GA, IN, KY, OH, TN 2,500 2,820
10 Apr. 28-May 1, 2012 TX, OK, KS, MO, IL, IN, KY 2,500 2,810
1Defined by Aon as severe convective storms including insured thunderstorm events and may include tornado, hail, damaging straight-line winds (derechos) and flash flood impacts from events. Includes events that occurred through 2019. Subject to change as loss estimates are further developed. As of November 25, 2020. 2Adjusted for inflation by Aon using the U.S. Consumer Price Index.
Source: Aon.
The costliest U.S. catastrophe involving tornadoes occurred in April 2011, when a spate of twisters hit Tuscaloosa, Alabama, and other areas, causing $8.4 billion in insured losses in 2020 dollars.
The second costliest were the tornadoes that struck Joplin, Missouri, and other locations in May 2011, resulting in $7.9 billion in insured losses in 2020 dollars.
i
161Insurance Information Institute | www.ii i.org 2021 Insurance Fact Book 161
8. LOSSESU.S. Natural Catastrophes: Convective Storms
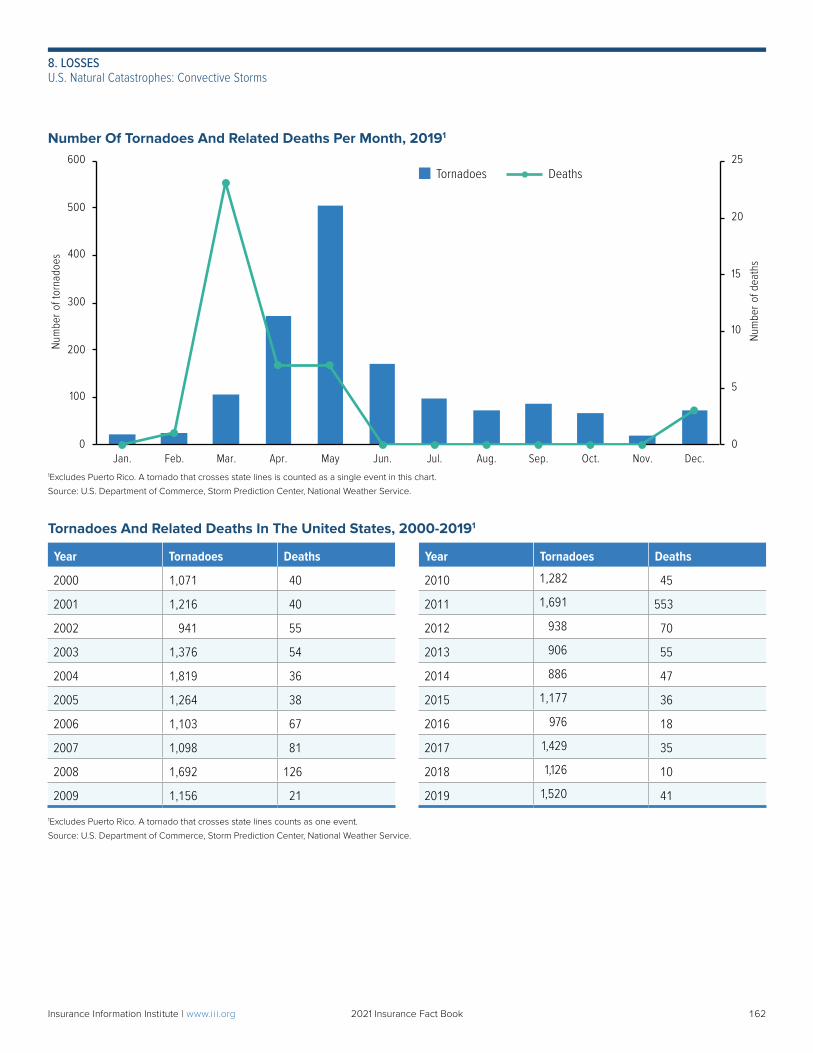
Number Of Tornadoes And Related Deaths Per Month, 20191
0
5
10
15
20
25
0
100
200
300
400
500
600
Jan. Feb. Mar. Apr. May Jun. Jul. Aug. Sep. Oct. Nov. Dec.
Num
ber
of d
eath
s
Num
ber
of to
rnad
oes
DeathsTornadoes
1Excludes Puerto Rico. A tornado that crosses state lines is counted as a single event in this chart.
Source: U.S. Department of Commerce, Storm Prediction Center, National Weather Service.
Tornadoes And Related Deaths In The United States, 2000-20191
Year Tornadoes Deaths Year Tornadoes Deaths
2000 1,071 40 2010 1,282 45
2001 1,216 40 2011 1,691 553
2002 941 55 2012 938 70
2003 1,376 54 2013 906 55
2004 1,819 36 2014 886 47
2005 1,264 38 2015 1,177 36
2006 1,103 67 2016 976 18
2007 1,098 81 2017 1,429 35
2008 1,692 126 2018 1,126 10
2009 1,156 21 2019 1,520 41
1Excludes Puerto Rico. A tornado that crosses state lines counts as one event.
Source: U.S. Department of Commerce, Storm Prediction Center, National Weather Service.
162Insurance Information Institute | www.ii i.org 2021 Insurance Fact Book 162
8. LOSSESU.S. Natural Catastrophes: Convective Storms
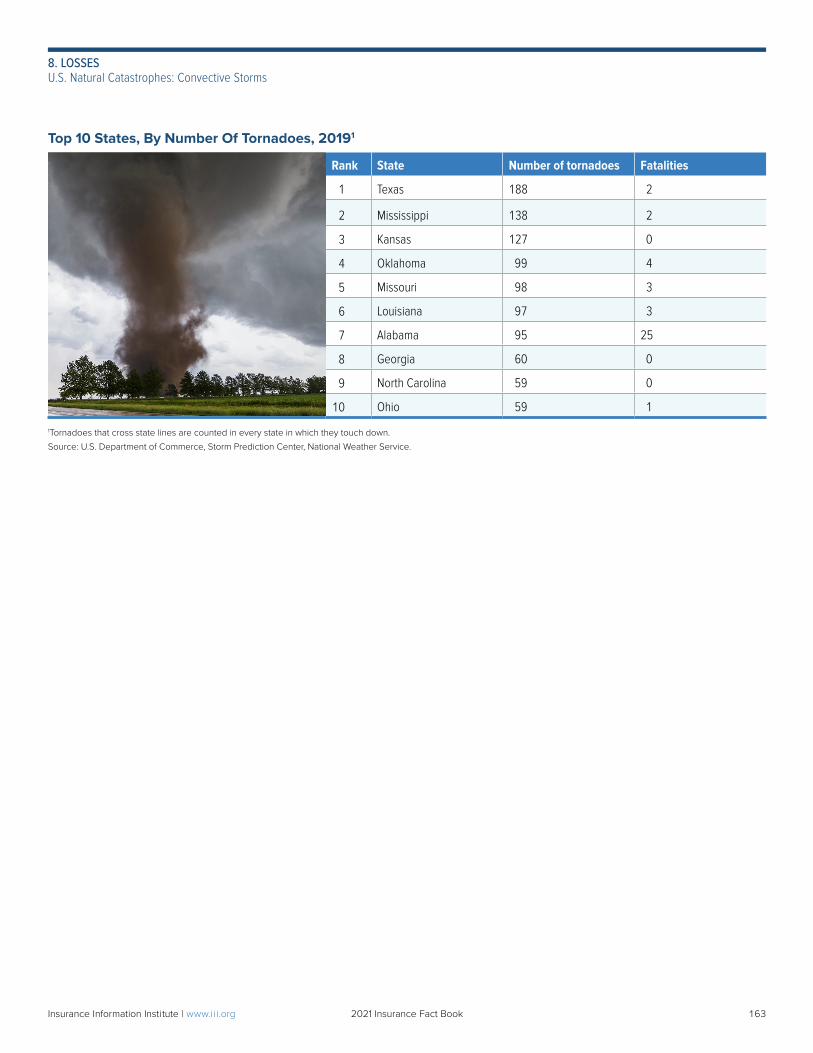
Top 10 States, By Number Of Tornadoes, 20191
Rank State Number of tornadoes Fatalities
1 Texas 188 2
2 Mississippi 138 2
3 Kansas 127 0
4 Oklahoma 99 4
5 Missouri 98 3
6 Louisiana 97 3
7 Alabama 95 25
8 Georgia 60 0
9 North Carolina 59 0
10 Ohio 59 1
1Tornadoes that cross state lines are counted in every state in which they touch down.
Source: U.S. Department of Commerce, Storm Prediction Center, National Weather Service.
163Insurance Information Institute | www.ii i.org 2021 Insurance Fact Book 163
8. LOSSESU.S. Natural Catastrophes: Convective Storms
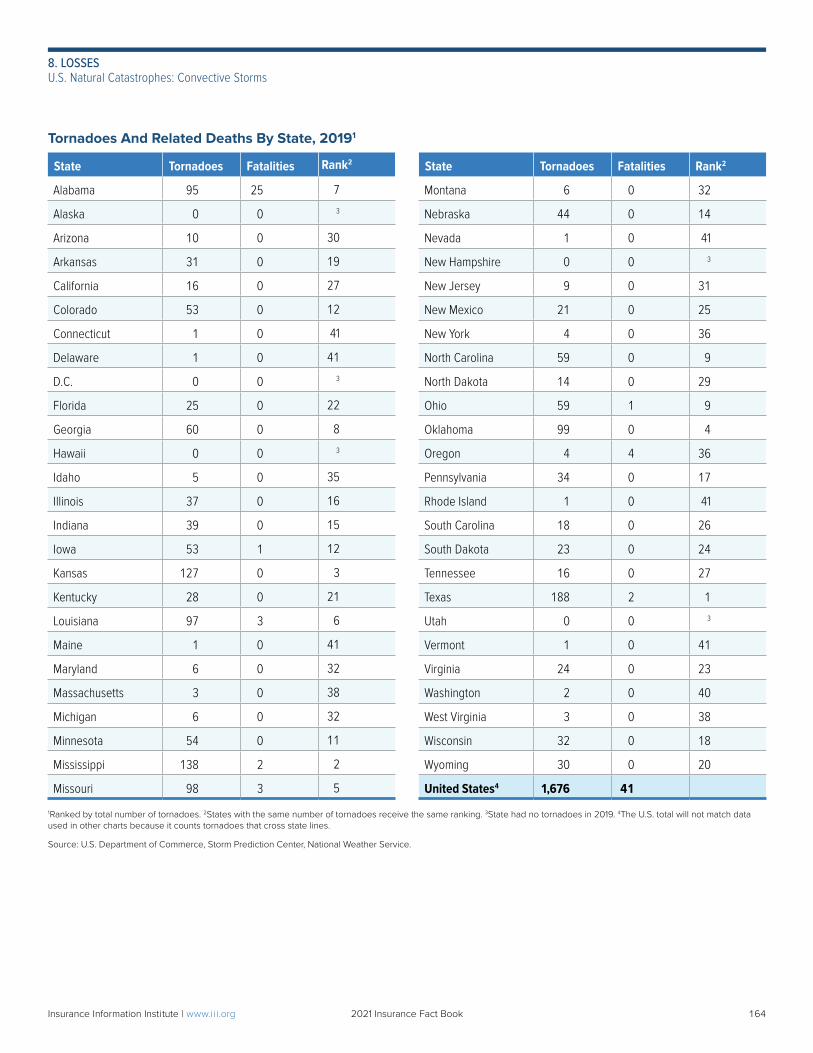
Tornadoes And Related Deaths By State, 20191
State Tornadoes Fatalities Rank2 State Tornadoes Fatalities Rank2
Alabama 95 25 7 Montana 6 0 32
Alaska 0 0 3 Nebraska 44 0 14
Arizona 10 0 30 Nevada 1 0 41
Arkansas 31 0 19 New Hampshire 0 0 3
California 16 0 27 New Jersey 9 0 31
Colorado 53 0 12 New Mexico 21 0 25
Connecticut 1 0 41 New York 4 0 36
Delaware 1 0 41 North Carolina 59 0 9
D.C. 0 0 3 North Dakota 14 0 29
Florida 25 0 22 Ohio 59 1 9
Georgia 60 0 8 Oklahoma 99 0 4
Hawaii 0 0 3 Oregon 4 4 36
Idaho 5 0 35 Pennsylvania 34 0 17
Illinois 37 0 16 Rhode Island 1 0 41
Indiana 39 0 15 South Carolina 18 0 26
Iowa 53 1 12 South Dakota 23 0 24
Kansas 127 0 3 Tennessee 16 0 27
Kentucky 28 0 21 Texas 188 2 1
Louisiana 97 3 6 Utah 0 0 3
Maine 1 0 41 Vermont 1 0 41
Maryland 6 0 32 Virginia 24 0 23
Massachusetts 3 0 38 Washington 2 0 40
Michigan 6 0 32 West Virginia 3 0 38
Minnesota 54 0 11 Wisconsin 32 0 18
Mississippi 138 2 2 Wyoming 30 0 20
Missouri 98 3 5 United States4 1,676 41
1Ranked by total number of tornadoes. 2States with the same number of tornadoes receive the same ranking. 3State had no tornadoes in 2019. 4The U.S. total will not match data used in other charts because it counts tornadoes that cross state lines.
Source: U.S. Department of Commerce, Storm Prediction Center, National Weather Service.
164Insurance Information Institute | www.ii i.org 2021 Insurance Fact Book 164
8. LOSSESU.S. Natural Catastrophes: Convective Storms
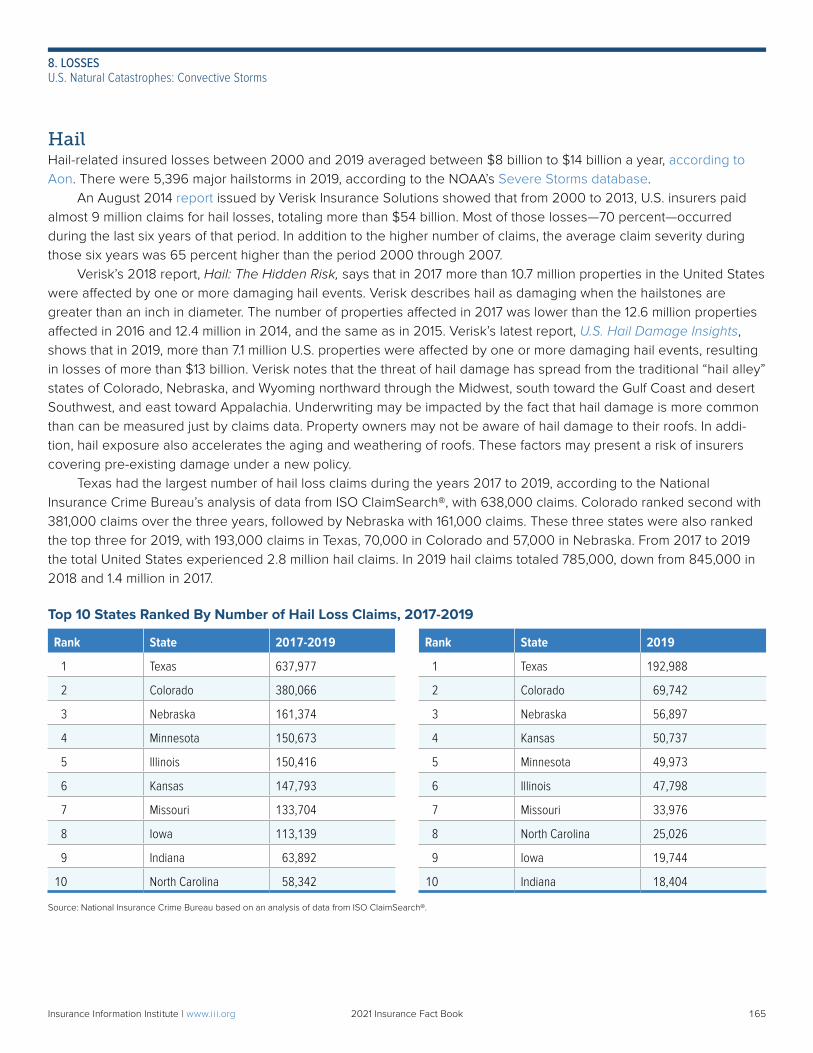
HailHail-related insured losses between 2000 and 2019 averaged between $8 billion to $14 billion a year, according to Aon. There were 5,396 major hailstorms in 2019, according to the NOAA’s Severe Storms database. An August 2014 report issued by Verisk Insurance Solutions showed that from 2000 to 2013, U.S. insurers paid almost 9 million claims for hail losses, totaling more than $54 billion. Most of those losses—70 percent—occurred during the last six years of that period. In addition to the higher number of claims, the average claim severity during those six years was 65 percent higher than the period 2000 through 2007. Verisk’s 2018 report, Hail: The Hidden Risk, says that in 2017 more than 10.7 million properties in the United States were affected by one or more damaging hail events. Verisk describes hail as damaging when the hailstones are greater than an inch in diameter. The number of properties affected in 2017 was lower than the 12.6 million properties affected in 2016 and 12.4 million in 2014, and the same as in 2015. Verisk’s latest report, U.S. Hail Damage Insights, shows that in 2019, more than 7.1 million U.S. properties were affected by one or more damaging hail events, resulting in losses of more than $13 billion. Verisk notes that the threat of hail damage has spread from the traditional “hail alley” states of Colorado, Nebraska, and Wyoming northward through the Midwest, south toward the Gulf Coast and desert Southwest, and east toward Appalachia. Underwriting may be impacted by the fact that hail damage is more common than can be measured just by claims data. Property owners may not be aware of hail damage to their roofs. In addi-tion, hail exposure also accelerates the aging and weathering of roofs. These factors may present a risk of insurers covering pre-existing damage under a new policy. Texas had the largest number of hail loss claims during the years 2017 to 2019, according to the National Insurance Crime Bureau’s analysis of data from ISO ClaimSearch®, with 638,000 claims. Colorado ranked second with 381,000 claims over the three years, followed by Nebraska with 161,000 claims. These three states were also ranked the top three for 2019, with 193,000 claims in Texas, 70,000 in Colorado and 57,000 in Nebraska. From 2017 to 2019 the total United States experienced 2.8 million hail claims. In 2019 hail claims totaled 785,000, down from 845,000 in 2018 and 1.4 million in 2017.
Top 10 States Ranked By Number of Hail Loss Claims, 2017-2019
Rank State 2017-2019 Rank State 2019
1 Texas 637,977 1 Texas 192,988
2 Colorado 380,066 2 Colorado 69,742
3 Nebraska 161,374 3 Nebraska 56,897
4 Minnesota 150,673 4 Kansas 50,737
5 Illinois 150,416 5 Minnesota 49,973
6 Kansas 147,793 6 Illinois 47,798
7 Missouri 133,704 7 Missouri 33,976
8 Iowa 113,139 8 North Carolina 25,026
9 Indiana 63,892 9 Iowa 19,744
10 North Carolina 58,342 10 Indiana 18,404
Source: National Insurance Crime Bureau based on an analysis of data from ISO ClaimSearch®.
165Insurance Information Institute | www.ii i.org 2021 Insurance Fact Book 165
8. LOSSESU.S. Natural Catastrophes: Convective Storms
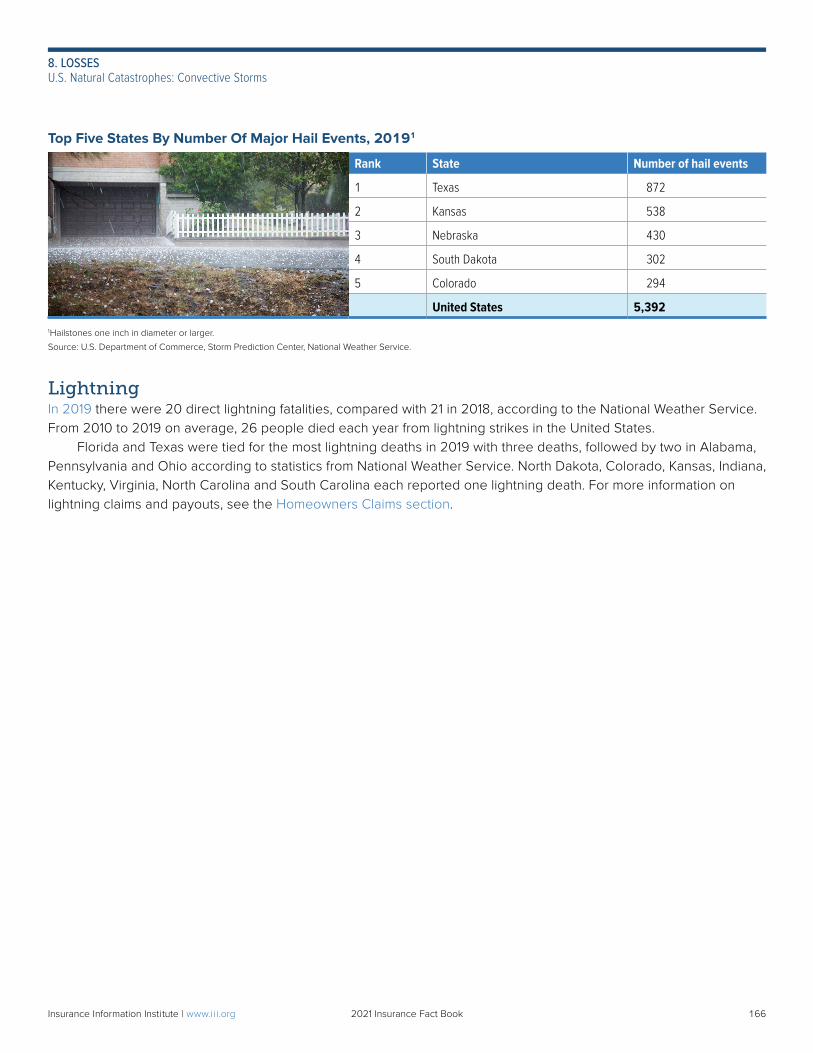
Top Five States By Number Of Major Hail Events, 20191
Rank State Number of hail events
1 Texas 872
2 Kansas 538
3 Nebraska 430
4 South Dakota 302
5 Colorado 294
United States 5,392
1Hailstones one inch in diameter or larger.
Source: U.S. Department of Commerce, Storm Prediction Center, National Weather Service.
LightningIn 2019 there were 20 direct lightning fatalities, compared with 21 in 2018, according to the National Weather Service. From 2010 to 2019 on average, 26 people died each year from lightning strikes in the United States. Florida and Texas were tied for the most lightning deaths in 2019 with three deaths, followed by two in Alabama, Pennsylvania and Ohio according to statistics from National Weather Service. North Dakota, Colorado, Kansas, Indiana, Kentucky, Virginia, North Carolina and South Carolina each reported one lightning death. For more information on lightning claims and payouts, see the Homeowners Claims section.
166Insurance Information Institute | www.ii i.org 2021 Insurance Fact Book 166
8. LOSSESU.S. Natural Catastrophes: Convective Storms
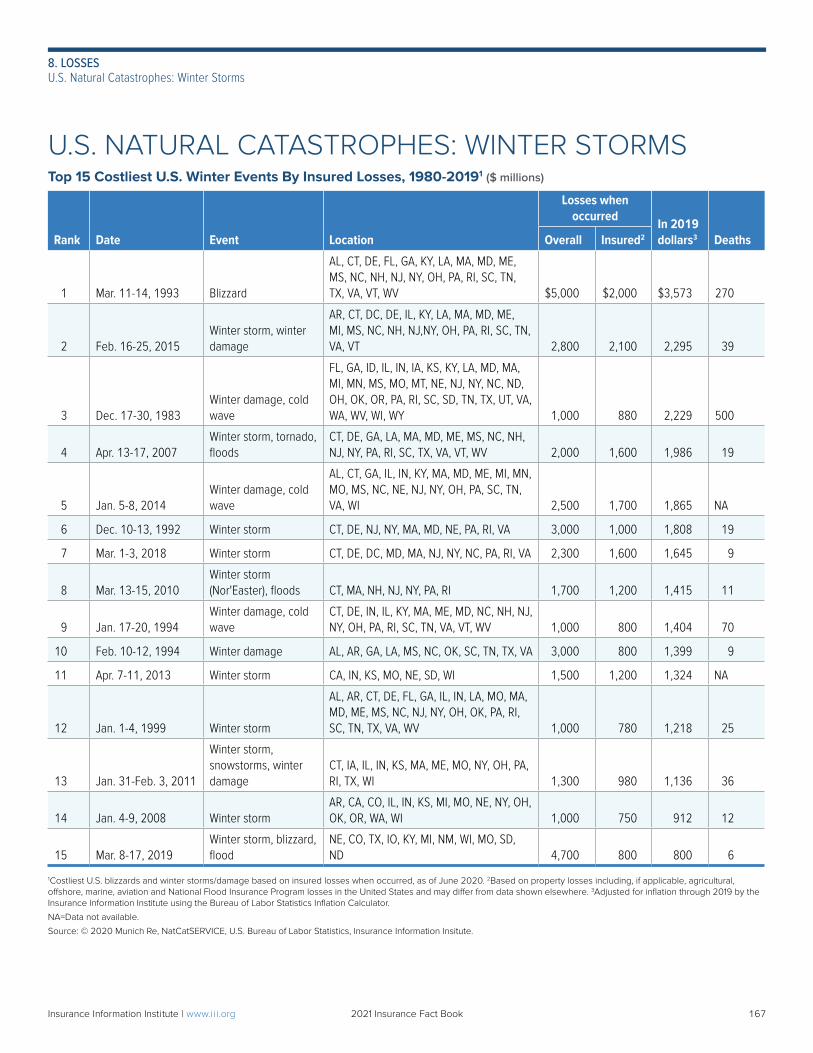
U.S. NATURAL CATASTROPHES: WINTER STORMSTop 15 Costliest U.S. Winter Events By Insured Losses, 1980-20191 ($ millions)
Rank Date Event Location
Losses when occurred
In 2019 dollars3 DeathsOverall Insured2
1 Mar. 11-14, 1993 Blizzard
AL, CT, DE, FL, GA, KY, LA, MA, MD, ME, MS, NC, NH, NJ, NY, OH, PA, RI, SC, TN, TX, VA, VT, WV $5,000 $2,000 $3,573 270
2 Feb. 16-25, 2015Winter storm, winter damage
AR, CT, DC, DE, IL, KY, LA, MA, MD, ME, MI, MS, NC, NH, NJ,NY, OH, PA, RI, SC, TN, VA, VT 2,800 2,100 2,295 39
3 Dec. 17-30, 1983Winter damage, cold wave
FL, GA, ID, IL, IN, IA, KS, KY, LA, MD, MA, MI, MN, MS, MO, MT, NE, NJ, NY, NC, ND, OH, OK, OR, PA, RI, SC, SD, TN, TX, UT, VA, WA, WV, WI, WY 1,000 880 2,229 500
4 Apr. 13-17, 2007Winter storm, tornado, floods
CT, DE, GA, LA, MA, MD, ME, MS, NC, NH, NJ, NY, PA, RI, SC, TX, VA, VT, WV 2,000 1,600 1,986 19
5 Jan. 5-8, 2014Winter damage, cold wave
AL, CT, GA, IL, IN, KY, MA, MD, ME, MI, MN, MO, MS, NC, NE, NJ, NY, OH, PA, SC, TN, VA, WI 2,500 1,700 1,865 NA
6 Dec. 10-13, 1992 Winter storm CT, DE, NJ, NY, MA, MD, NE, PA, RI, VA 3,000 1,000 1,808 19
7 Mar. 1-3, 2018 Winter storm CT, DE, DC, MD, MA, NJ, NY, NC, PA, RI, VA 2,300 1,600 1,645 9
8 Mar. 13-15, 2010Winter storm (Nor'Easter), floods CT, MA, NH, NJ, NY, PA, RI 1,700 1,200 1,415 11
9 Jan. 17-20, 1994Winter damage, cold wave
CT, DE, IN, IL, KY, MA, ME, MD, NC, NH, NJ, NY, OH, PA, RI, SC, TN, VA, VT, WV 1,000 800 1,404 70
10 Feb. 10-12, 1994 Winter damage AL, AR, GA, LA, MS, NC, OK, SC, TN, TX, VA 3,000 800 1,399 9
11 Apr. 7-11, 2013 Winter storm CA, IN, KS, MO, NE, SD, WI 1,500 1,200 1,324 NA
12 Jan. 1-4, 1999 Winter storm
AL, AR, CT, DE, FL, GA, IL, IN, LA, MO, MA, MD, ME, MS, NC, NJ, NY, OH, OK, PA, RI, SC, TN, TX, VA, WV 1,000 780 1,218 25
13 Jan. 31-Feb. 3, 2011
Winter storm, snowstorms, winter damage
CT, IA, IL, IN, KS, MA, ME, MO, NY, OH, PA, RI, TX, WI 1,300 980 1,136 36
14 Jan. 4-9, 2008 Winter stormAR, CA, CO, IL, IN, KS, MI, MO, NE, NY, OH, OK, OR, WA, WI 1,000 750 912 12
15 Mar. 8-17, 2019Winter storm, blizzard, flood
NE, CO, TX, IO, KY, MI, NM, WI, MO, SD, ND 4,700 800 800 6
1Costliest U.S. blizzards and winter storms/damage based on insured losses when occurred, as of June 2020. 2Based on property losses including, if applicable, agricultural, offshore, marine, aviation and National Flood Insurance Program losses in the United States and may differ from data shown elsewhere. 3Adjusted for inflation through 2019 by the Insurance Information Institute using the Bureau of Labor Statistics Inflation Calculator.
NA=Data not available.
Source: © 2020 Munich Re, NatCatSERVICE, U.S. Bureau of Labor Statistics, Insurance Information Insitute.
167Insurance Information Institute | www.ii i.org 2021 Insurance Fact Book 167
8. LOSSESU.S. Natural Catastrophes: Winter Storms
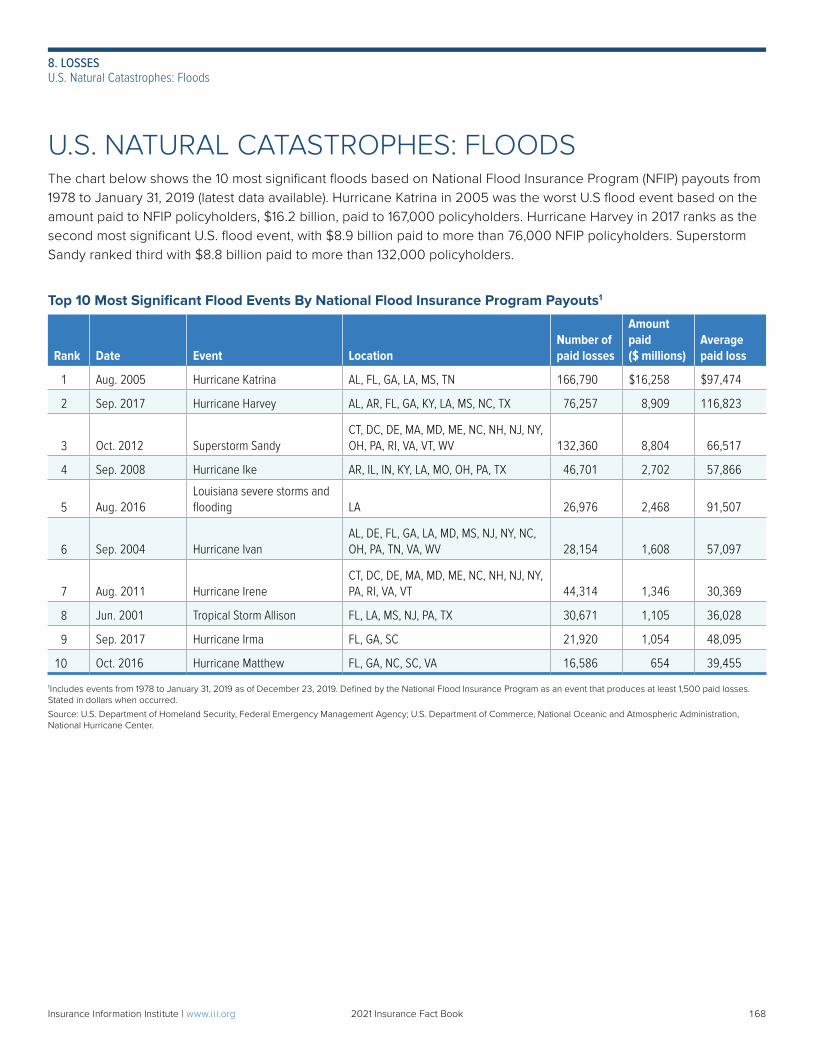
U.S. NATURAL CATASTROPHES: FLOODSThe chart below shows the 10 most significant floods based on National Flood Insurance Program (NFIP) payouts from 1978 to January 31, 2019 (latest data available). Hurricane Katrina in 2005 was the worst U.S flood event based on the amount paid to NFIP policyholders, $16.2 billion, paid to 167,000 policyholders. Hurricane Harvey in 2017 ranks as the second most significant U.S. flood event, with $8.9 billion paid to more than 76,000 NFIP policyholders. Superstorm Sandy ranked third with $8.8 billion paid to more than 132,000 policyholders.
Top 10 Most Significant Flood Events By National Flood Insurance Program Payouts1
Rank Date Event LocationNumber of paid losses
Amount paid ($ millions)
Average paid loss
1 Aug. 2005 Hurricane Katrina AL, FL, GA, LA, MS, TN 166,790 $16,258 $97,474
2 Sep. 2017 Hurricane Harvey AL, AR, FL, GA, KY, LA, MS, NC, TX 76,257 8,909 116,823
3 Oct. 2012 Superstorm SandyCT, DC, DE, MA, MD, ME, NC, NH, NJ, NY, OH, PA, RI, VA, VT, WV 132,360 8,804 66,517
4 Sep. 2008 Hurricane Ike AR, IL, IN, KY, LA, MO, OH, PA, TX 46,701 2,702 57,866
5 Aug. 2016Louisiana severe storms and flooding LA 26,976 2,468 91,507
6 Sep. 2004 Hurricane IvanAL, DE, FL, GA, LA, MD, MS, NJ, NY, NC, OH, PA, TN, VA, WV 28,154 1,608 57,097
7 Aug. 2011 Hurricane IreneCT, DC, DE, MA, MD, ME, NC, NH, NJ, NY, PA, RI, VA, VT 44,314 1,346 30,369
8 Jun. 2001 Tropical Storm Allison FL, LA, MS, NJ, PA, TX 30,671 1,105 36,028
9 Sep. 2017 Hurricane Irma FL, GA, SC 21,920 1,054 48,095
10 Oct. 2016 Hurricane Matthew FL, GA, NC, SC, VA 16,586 654 39,455
1Includes events from 1978 to January 31, 2019 as of December 23, 2019. Defined by the National Flood Insurance Program as an event that produces at least 1,500 paid losses. Stated in dollars when occurred.
Source: U.S. Department of Homeland Security, Federal Emergency Management Agency; U.S. Department of Commerce, National Oceanic and Atmospheric Administration, National Hurricane Center.
168Insurance Information Institute | www.ii i.org 2021 Insurance Fact Book 168
8. LOSSESU.S. Natural Catastrophes: Floods
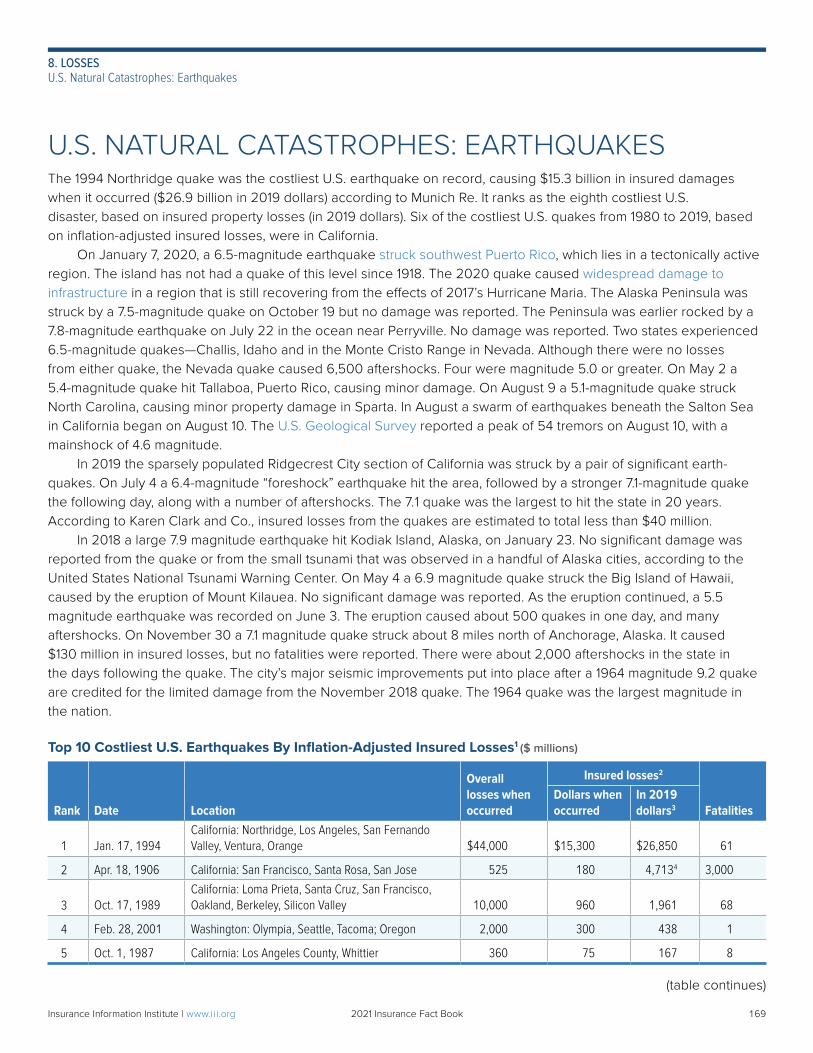
U.S. NATURAL CATASTROPHES: EARTHQUAKESThe 1994 Northridge quake was the costliest U.S. earthquake on record, causing $15.3 billion in insured damages when it occurred ($26.9 billion in 2019 dollars) according to Munich Re. It ranks as the eighth costliest U.S. disaster, based on insured property losses (in 2019 dollars). Six of the costliest U.S. quakes from 1980 to 2019, based on inflation-adjusted insured losses, were in California. On January 7, 2020, a 6.5-magnitude earthquake struck southwest Puerto Rico, which lies in a tectonically active region. The island has not had a quake of this level since 1918. The 2020 quake caused widespread damage to infrastructure in a region that is still recovering from the effects of 2017’s Hurricane Maria. The Alaska Peninsula was struck by a 7.5-magnitude quake on October 19 but no damage was reported. The Peninsula was earlier rocked by a 7.8-magnitude earthquake on July 22 in the ocean near Perryville. No damage was reported. Two states experienced 6.5-magnitude quakes—Challis, Idaho and in the Monte Cristo Range in Nevada. Although there were no losses from either quake, the Nevada quake caused 6,500 aftershocks. Four were magnitude 5.0 or greater. On May 2 a 5.4-magnitude quake hit Tallaboa, Puerto Rico, causing minor damage. On August 9 a 5.1-magnitude quake struck North Carolina, causing minor property damage in Sparta. In August a swarm of earthquakes beneath the Salton Sea in California began on August 10. The U.S. Geological Survey reported a peak of 54 tremors on August 10, with a mainshock of 4.6 magnitude. In 2019 the sparsely populated Ridgecrest City section of California was struck by a pair of significant earth-quakes. On July 4 a 6.4-magnitude “foreshock” earthquake hit the area, followed by a stronger 7.1-magnitude quake the following day, along with a number of aftershocks. The 7.1 quake was the largest to hit the state in 20 years. According to Karen Clark and Co., insured losses from the quakes are estimated to total less than $40 million. In 2018 a large 7.9 magnitude earthquake hit Kodiak Island, Alaska, on January 23. No significant damage was reported from the quake or from the small tsunami that was observed in a handful of Alaska cities, according to the United States National Tsunami Warning Center. On May 4 a 6.9 magnitude quake struck the Big Island of Hawaii, caused by the eruption of Mount Kilauea. No significant damage was reported. As the eruption continued, a 5.5 magnitude earthquake was recorded on June 3. The eruption caused about 500 quakes in one day, and many aftershocks. On November 30 a 7.1 magnitude quake struck about 8 miles north of Anchorage, Alaska. It caused $130 million in insured losses, but no fatalities were reported. There were about 2,000 aftershocks in the state in the days following the quake. The city’s major seismic improvements put into place after a 1964 magnitude 9.2 quake are credited for the limited damage from the November 2018 quake. The 1964 quake was the largest magnitude in the nation.
Top 10 Costliest U.S. Earthquakes By Inflation-Adjusted Insured Losses1 ($ millions)
Rank Date Location
Overall losses when occurred
Insured losses2
FatalitiesDollars when occurred
In 2019 dollars3
1 Jan. 17, 1994California: Northridge, Los Angeles, San Fernando Valley, Ventura, Orange $44,000 $15,300 $26,850 61
2 Apr. 18, 1906 California: San Francisco, Santa Rosa, San Jose 525 180 4,7134 3,000
3 Oct. 17, 1989California: Loma Prieta, Santa Cruz, San Francisco, Oakland, Berkeley, Silicon Valley 10,000 960 1,961 68
4 Feb. 28, 2001 Washington: Olympia, Seattle, Tacoma; Oregon 2,000 300 438 1
5 Oct. 1, 1987 California: Los Angeles County, Whittier 360 75 167 8
(table continues)
169Insurance Information Institute | www.ii i.org 2021 Insurance Fact Book 169
8. LOSSESU.S. Natural Catastrophes: Earthquakes
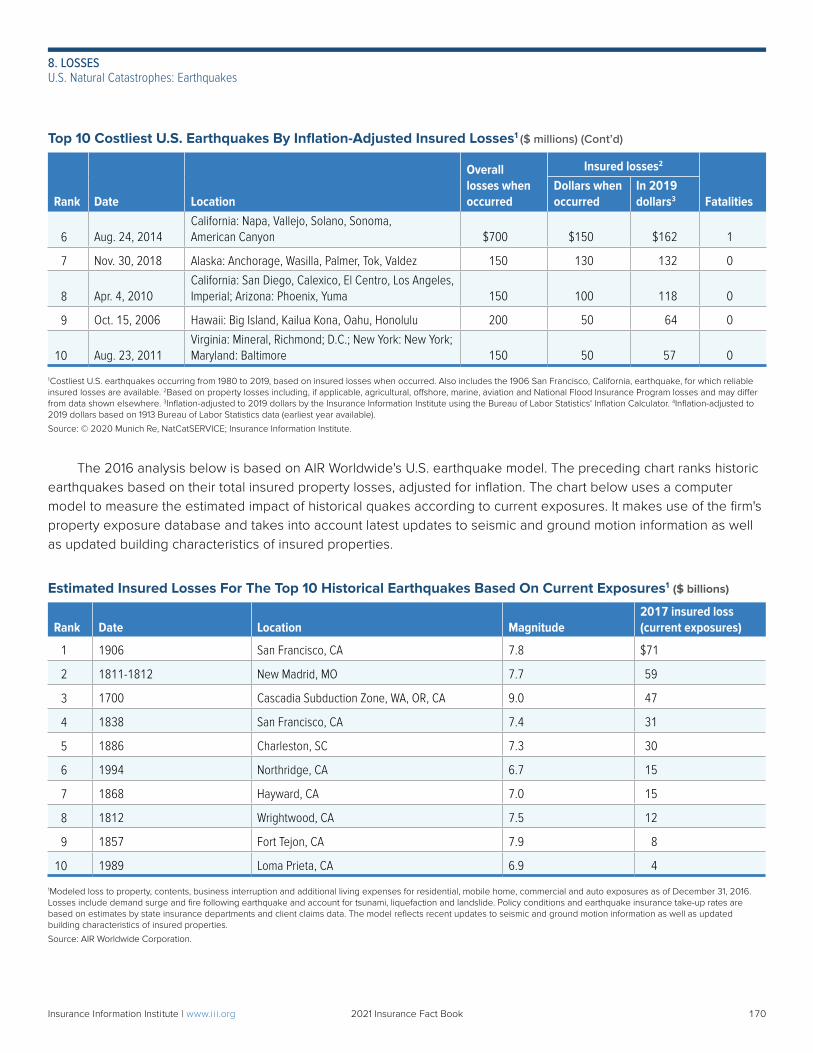
Top 10 Costliest U.S. Earthquakes By Inflation-Adjusted Insured Losses1 ($ millions) (Cont’d)
Rank Date Location
Overall losses when occurred
Insured losses2
FatalitiesDollars when occurred
In 2019 dollars3
6 Aug. 24, 2014California: Napa, Vallejo, Solano, Sonoma, American Canyon $700 $150 $162 1
7 Nov. 30, 2018 Alaska: Anchorage, Wasilla, Palmer, Tok, Valdez 150 130 132 0
8 Apr. 4, 2010California: San Diego, Calexico, El Centro, Los Angeles, Imperial; Arizona: Phoenix, Yuma 150 100 118 0
9 Oct. 15, 2006 Hawaii: Big Island, Kailua Kona, Oahu, Honolulu 200 50 64 0
10 Aug. 23, 2011Virginia: Mineral, Richmond; D.C.; New York: New York; Maryland: Baltimore 150 50 57 0
1Costliest U.S. earthquakes occurring from 1980 to 2019, based on insured losses when occurred. Also includes the 1906 San Francisco, California, earthquake, for which reliable insured losses are available. 2Based on property losses including, if applicable, agricultural, offshore, marine, aviation and National Flood Insurance Program losses and may differ from data shown elsewhere. 3Inflation-adjusted to 2019 dollars by the Insurance Information Institute using the Bureau of Labor Statistics' Inflation Calculator. 4Inflation-adjusted to 2019 dollars based on 1913 Bureau of Labor Statistics data (earliest year available).
Source: © 2020 Munich Re, NatCatSERVICE; Insurance Information Institute.
The 2016 analysis below is based on AIR Worldwide's U.S. earthquake model. The preceding chart ranks historic earthquakes based on their total insured property losses, adjusted for inflation. The chart below uses a computer model to measure the estimated impact of historical quakes according to current exposures. It makes use of the firm's property exposure database and takes into account latest updates to seismic and ground motion information as well as updated building characteristics of insured properties.
Estimated Insured Losses For The Top 10 Historical Earthquakes Based On Current Exposures1 ($ billions)
Rank Date Location Magnitude2017 insured loss (current exposures)
1 1906 San Francisco, CA 7.8 $71
2 1811-1812 New Madrid, MO 7.7 59
3 1700 Cascadia Subduction Zone, WA, OR, CA 9.0 47
4 1838 San Francisco, CA 7.4 31
5 1886 Charleston, SC 7.3 30
6 1994 Northridge, CA 6.7 15
7 1868 Hayward, CA 7.0 15
8 1812 Wrightwood, CA 7.5 12
9 1857 Fort Tejon, CA 7.9 8
10 1989 Loma Prieta, CA 6.9 4
1Modeled loss to property, contents, business interruption and additional living expenses for residential, mobile home, commercial and auto exposures as of December 31, 2016. Losses include demand surge and fire following earthquake and account for tsunami, liquefaction and landslide. Policy conditions and earthquake insurance take-up rates are based on estimates by state insurance departments and client claims data. The model reflects recent updates to seismic and ground motion information as well as updated building characteristics of insured properties.
Source: AIR Worldwide Corporation.
170Insurance Information Institute | www.ii i.org 2021 Insurance Fact Book 170
8. LOSSESU.S. Natural Catastrophes: Earthquakes
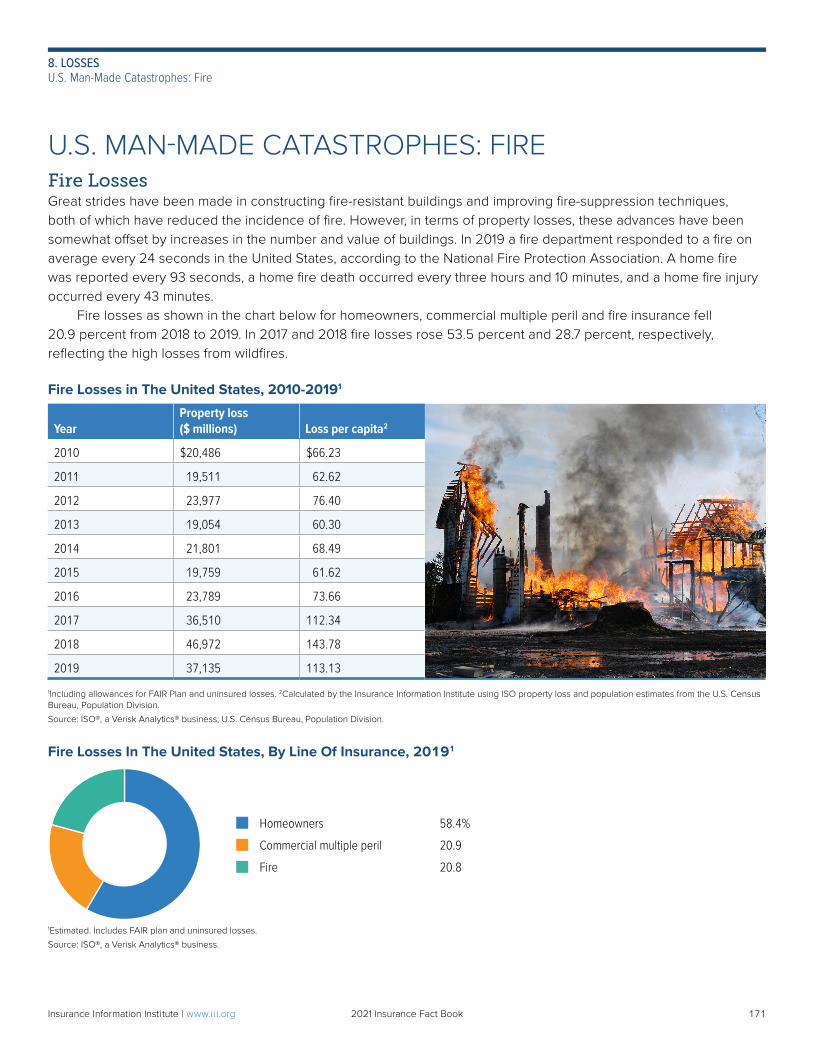
U.S. MAN-MADE CATASTROPHES: FIREFire LossesGreat strides have been made in constructing fire-resistant buildings and improving fire-suppression techniques, both of which have reduced the incidence of fire. However, in terms of property losses, these advances have been somewhat offset by increases in the number and value of buildings. In 2019 a fire department responded to a fire on average every 24 seconds in the United States, according to the National Fire Protection Association. A home fire was reported every 93 seconds, a home fire death occurred every three hours and 10 minutes, and a home fire injury occurred every 43 minutes. Fire losses as shown in the chart below for homeowners, commercial multiple peril and fire insurance fell 20.9 percent from 2018 to 2019. In 2017 and 2018 fire losses rose 53.5 percent and 28.7 percent, respectively, reflecting the high losses from wildfires.
Fire Losses in The United States, 2010-20191
YearProperty loss ($ millions) Loss per capita2
2010 $20,486 $66.23
2011 19,511 62.62
2012 23,977 76.40
2013 19,054 60.30
2014 21,801 68.49
2015 19,759 61.62
2016 23,789 73.66
2017 36,510 112.34
2018 46,972 143.78
2019 37,135 113.13
1Including allowances for FAIR Plan and uninsured losses. 2Calculated by the Insurance Information Institute using ISO property loss and population estimates from the U.S. Census Bureau, Population Division.
Source: ISO®, a Verisk Analytics® business; U.S. Census Bureau, Population Division.
Fire Losses In The United States, By Line Of Insurance, 20191
1Estimated. Includes FAIR plan and uninsured losses.
Source: ISO®, a Verisk Analytics® business.
Homeowners 58.4%
Commercial multiple peril 20.9
Fire 20.8
171Insurance Information Institute | www.ii i.org 2021 Insurance Fact Book 171
8. LOSSESU.S. Man-Made Catastrophes: Fire
Structure FiresThe National Fire Protection Association (NFPA) reports that there were 481,500 structure fires in the United States in 2019, down 3.5 percent from 2018. Of note, the number of structure fires in 2016 was the lowest since the NFPA began collecting data in 1977. Structure fires caused $12.3 billion in property damage in 2019, up 10.8 percent from $11.4 billion in 2018. The average loss for these structure fires was $25,545, up 14.8 percent from 2018. Vehicle and outside fires caused another $2.5 billion in property damage, bringing the total property loss from fires to $14.8 billion.
Structure Fires, 2010-20191
YearNumber of fires
Direct property damage2
($ billions)
YearNumber of fires
Direct property damage2
($ billions)
As reportedIn 2020 dollars3 As reported
In 2020dollars3
2010 482,000 $9.7 $11.5 2015 501,500 $10.3 $11.2
2011 484,500 9.7 11.1 2016 475,500 7.8 8.4
2012 480,500 9.8 11.1 2017 499,000 10.7 11.3
2013 487,500 9.5 10.5 2018 499,000 11.1 11.4
2014 494,000 9.8 10.7 2019 481,500 12.3 12.4
¹Estimates based on data reported by fire departments responding to the 2019 National Fire Experience Survey. May exclude reports from all fire departments. 2Does not include damage from major wildfires. 3Calculated from unrounded numbers by the Insurance Information Institute using the U.S Bureau of Labor Statistics' Inflation Calculator.
Source: Reproduced with permission from Fire Loss in the United States During 2019 by Marty Ahrens and Ben Evarts, ©2020 National Fire Protection Association www.nfpa.org.
Reported Fires By Property Use, 20191
Property use Fires Property loss2 ($ millions)Structures 481,500 $12,287Residential 361,500 7,976
Home 339,500 7,767
One- and two-family homes3 264,500 6,428
Apartments and other multi-family 75,000 1,339
Other residential structures4 22,000 209
Non-residential5 120,000 4,311
Vehicle fire 223,000 2,229 Highway vehicle fire 189,500 1,645 Other vehicle fire 33,500 584
Outside and other fire 587,000 304 Fire outside but no vehicle6 70,500 206
Fires in brush, grass, or wildlands7 244,500 NA
Outside rubbish fire 177,500 NA
All other fire 94,500 98Total 1,291,500 $14,820
1Estimates based on data reported by fire departments responding to the 2019 National Fire Experience Survey. May exclude reports from all fire departments. 2Includes overall direct property loss to contents, structures, vehicles, machinery, vegetation or any other property involved in a fire. Excludes indirect losses, such as business interruption or tempo-rary shelter costs. 3Includes manufactured homes. 4Includes hotels and motels, dormitories, rooming houses, residential board and care properties, and other residential properties. 5Public assembly, educational, institutional, retail, office, manufacturing, and industrial or utility properties. 6Outside storage, crops, timber, etc. 7Excludes crops and timber, with no value or loss involved.
NA=Data not available.
Source: Reproduced with permission from Fire Loss in the United States During 2019 by Marty Ahrens and Ben Evarts, ©2020 National Fire Protection Association www.nfpa.org.
172Insurance Information Institute | www.ii i.org 2021 Insurance Fact Book 172
8. LOSSESU.S. Man-Made Catastrophes: Fire
Top 10 Costliest Large-Loss Fires, 2019 ($ millions)
Rank State Month Type of facility Estimated loss
1 Texas November Petrochemical plant $1,100.0
2 California October Wildfire 383.8
3 California June Restaurant 36.0
4 California June Helicopter 30.0
4 Texas July Power generation plant 30.0
5 Ohio February Shipboard fire (In port for repairs) 25.0
6 California October Wildfire 20.5
6 Tennessee September Metal refining 20.5
7 North Carolina April Coffee shop gas explosion and fire 20.0
7 Massachusetts March Manufacturing 20.0
1Large-loss fires of $20 million or more in 2019.
Note: Loss data shown here may differ from figures shown elsewhere for the same event due to differences in the date of publication, the geographical area covered and other criteria used by organizations collecting the data.
Source: National Fire Protection Association www.nfpa.org.
Top 10 Costliest Large-Loss Fires In U.S. History ($ millions)
Rank Date Location/event
Estimated loss1
Dollars when occurred In 2020 dollars2
1 Sep. 11, 2001 World Trade Center (terrorist attacks) $33,400 $48, 5363
2 Oct. 8, 2017 Northern CA Wildland Urban Interface fire 10,000 10,504
3 Apr. 18, 1906 San Francisco Earthquake and Fire 350 9,973
4 Nov. 8, 2018 Camp Wildland Urban Interface fire 8,500 8,738
5 Oct. 8-9, 1871 Great Chicago Fire 168 3,599
6 Nov. 8, 2018 Woolsey Wildland Urban Interface fire 2,900 2,981
7 Oct. 20, 1991 Oakland, CA, firestorm 1,500 2,829
8 Oct. 20, 2007 San Diego County, CA, The Southern California Firestorm 1,800 2,232
9 Dec. 14, 2017 Southern CA Wildland Urban Interface fire 1,800 1,892
10 Sep. 12, 2015 Valley Fire, CA, Wildland Urban Interface fire 1,500 1,633
1Loss estimates are from National Fire Protection Association (NFPA) records. The list is limited to fires for which some reliable dollar loss estimates exists. 2Adjustment to 2020 dollars made by the NFPA using the Consumer Price Index, including the U.S. Census Bureau's estimates of the index for historical times. 3Differs from inflation-adjusted estimates made by other organizations due to the use of different deflators.
Source: ©National Fire Protection Association, www.nfpa.org.
173Insurance Information Institute | www.ii i.org 2021 Insurance Fact Book 173
8. LOSSESU.S. Man-Made Catastrophes: Fire
Top Catastrophic Multiple-Death Fires and Explosions, 20191
Rank2 Month State Type of facility Deaths
1 September California Dive boat 34
2 October Connecticut Airplane crash and fire 7
3 May New York Apartment building 6
3 June Wisconsin Single-family home 6
3 December Nevada Apartment building 6
4 February California Aircraft in single-family home 5
4 February New York Single-family home 5
4 April Illinois Single-family home 5
4 August Pennsylvania Day care 5
4 November Minnesota Apartment building 5
4 December Alabama Single-family home 5
1Fires that kill five or more people in residential property, or three or more people in nonhome or nonstructural property. 2Fires with the same number of deaths receive the same rank.
Source: ©National Fire Protection Association, www.nfpa.org.
Top 10 Most Catastrophic Multiple-Death Fires In U.S. History1
Rank Date Location/event Deaths
1 Sep. 11, 2001 New York, NY, World Trade Center terrorist attack 2,6662
2 Apr. 27, 1865 Mississippi River, SS Sultana steamship 1,547
3 Oct. 8, 1871 Peshtigo, WI, forest fire 1,152
4 Jun. 15, 1904 New York, NY, General Slocum steamship 1,030
5 Dec. 30, 1903 Chicago, IL, Iroquois Theater 602
6 Oct. 12, 1918 Cloquet, MN, forest fire 559
7 Nov. 28, 1942 Boston, MA, Cocoanut Grove night club 492
8 Apr. 16, 1947 Texas City, TX, SS Grandcamp and Monsanto Chemical Co. plant 468
9 Sep. 1, 1894 Hinckley, MN, forest fire 418
10 Dec. 6, 1907 Monongha, WV, coal mine explosion 361
1Fires that kill five or more people in home property, or three or more people in nonhome or nonstructural property. 2Revised to 2,976 by government officials.
Source: Reproduced with permission, © 2019 National Fire Protection Association https://www.nfpa.org.
174Insurance Information Institute | www.ii i.org 2021 Insurance Fact Book 174
8. LOSSESU.S. Man-Made Catastrophes: Fire
U.S. MAN-MADE CATASTROPHES: CIVIL DISORDERSOn May 26, 2020, after the death of George Floyd in police custody in Minneapolis, Minnesota, protests and riots broke out in that city and spread over the next weeks to another 140 U.S. cities, including Washington, D.C.; New York, New York; Chicago, Illinois; Philadelphia, Pennsylvania; and Los Angeles, California. The National Guard were called in at least 21 states and Washington, D.C. The Property Claim Services (PCS) a unit of a Verisk Analytics, designated the riots in Minneapolis a catastrophe, the first time that PCS has compiled insured losses for a civil disorder event since the Baltimore, Maryland, riots of April 2015. Those riots did not meet PCS’s threshold for a catastrophe (insured losses reaching $25 million) when they occurred. For the first time, PCS has designated the civil unrest in Minnesota and those events that followed across the United States from May 26 to June 8 as a multi-state catastrophe event. This makes the 2020 event the first time since 1992 that PCS has compiled significant insured losses for a civil disorder and declared it a catastrophe. PCS has included more than 20 states with significant losses for this catastrophe. A preliminary estimate of insured losses from PCS which is still subject to further evaluation, would be more than $1 billion, marking it as the costliest civil disorder in U.S. history. The second costliest U.S. civil disorder occurred from April 29 through May 4, 1992, in Los Angeles, California, after a jury acquitted Los Angeles Police Department officers for using excessive force in the arrest and beating of Rodney King. The event caused $775 million in insured losses, according to PCS, or about $1.4 billion in 2020 dollars. For more information on Civil Disorders, see Facts + Statistics, Civil Disorders.
U.S. MAN-MADE CATASTROPHES: TERRORISMNearly 3,000 people perished in the September 11, 2001, terrorist attacks in New York, Washington and Pennsylvania, excluding the 19 hijackers. Total insured losses from the terrorist attacks on the World Trade Center in New York City and the Pentagon were about $47.0 billion in 2019 dollars, including property, life, and liability insurance claim costs. It is the worst terrorist attack on record in terms of fatalities and insured property losses, which totaled about $27.1 billion in 2019 dollars, according to Swiss Re data. Loss estimates may differ from estimates calculated by other organizations.
175Insurance Information Institute | www.ii i.org 2021 Insurance Fact Book 175
8. LOSSESU.S. Man-Made Catastrophes: Civil Disorders/Terrorism
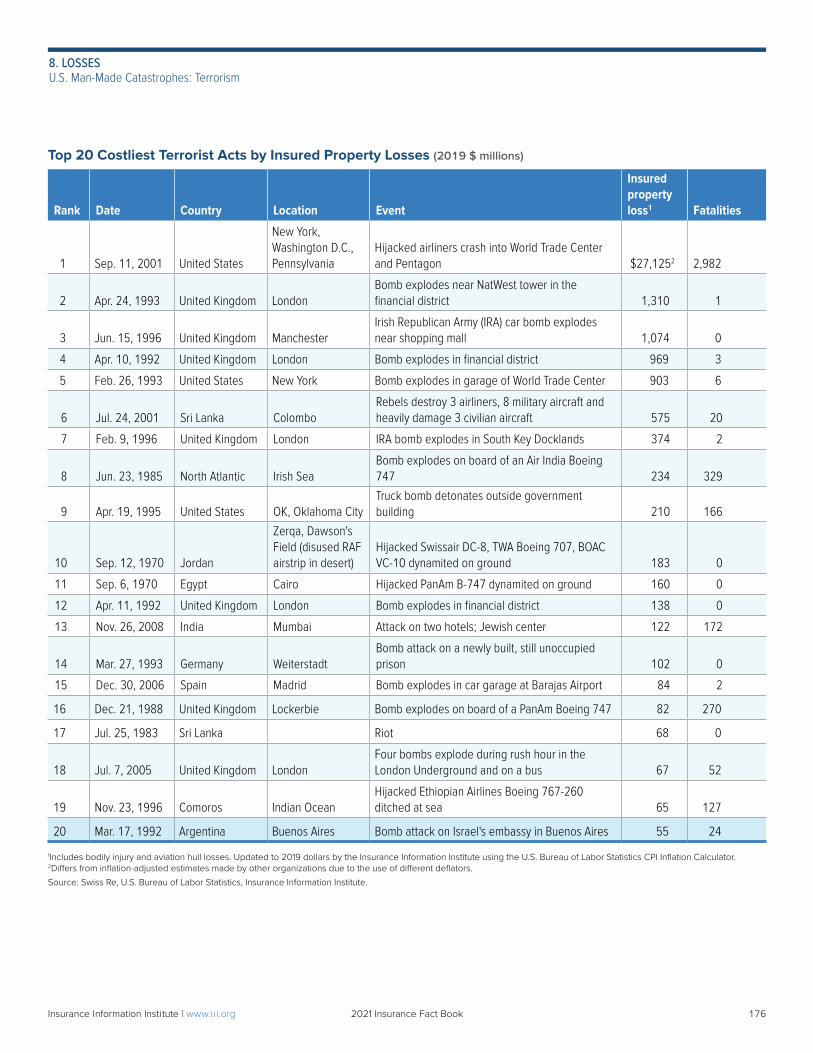
Top 20 Costliest Terrorist Acts by Insured Property Losses (2019 $ millions)
Rank Date Country Location Event
Insured property loss1 Fatalities
1 Sep. 11, 2001 United States
New York, Washington D.C., Pennsylvania
Hijacked airliners crash into World Trade Center and Pentagon $27,1252 2,982
2 Apr. 24, 1993 United Kingdom LondonBomb explodes near NatWest tower in the financial district 1,310 1
3 Jun. 15, 1996 United Kingdom ManchesterIrish Republican Army (IRA) car bomb explodes near shopping mall 1,074 0
4 Apr. 10, 1992 United Kingdom London Bomb explodes in financial district 969 3
5 Feb. 26, 1993 United States New York Bomb explodes in garage of World Trade Center 903 6
6 Jul. 24, 2001 Sri Lanka ColomboRebels destroy 3 airliners, 8 military aircraft and heavily damage 3 civilian aircraft 575 20
7 Feb. 9, 1996 United Kingdom London IRA bomb explodes in South Key Docklands 374 2
8 Jun. 23, 1985 North Atlantic Irish SeaBomb explodes on board of an Air India Boeing 747 234 329
9 Apr. 19, 1995 United States OK, Oklahoma CityTruck bomb detonates outside government building 210 166
10 Sep. 12, 1970 Jordan
Zerqa, Dawson's Field (disused RAF airstrip in desert)
Hijacked Swissair DC-8, TWA Boeing 707, BOAC VC-10 dynamited on ground 183 0
11 Sep. 6, 1970 Egypt Cairo Hijacked PanAm B-747 dynamited on ground 160 0
12 Apr. 11, 1992 United Kingdom London Bomb explodes in financial district 138 0
13 Nov. 26, 2008 India Mumbai Attack on two hotels; Jewish center 122 172
14 Mar. 27, 1993 Germany WeiterstadtBomb attack on a newly built, still unoccupied prison 102 0
15 Dec. 30, 2006 Spain Madrid Bomb explodes in car garage at Barajas Airport 84 2
16 Dec. 21, 1988 United Kingdom Lockerbie Bomb explodes on board of a PanAm Boeing 747 82 270
17 Jul. 25, 1983 Sri Lanka Riot 68 0
18 Jul. 7, 2005 United Kingdom LondonFour bombs explode during rush hour in the London Underground and on a bus 67 52
19 Nov. 23, 1996 Comoros Indian OceanHijacked Ethiopian Airlines Boeing 767-260 ditched at sea 65 127
20 Mar. 17, 1992 Argentina Buenos Aires Bomb attack on Israel's embassy in Buenos Aires 55 24
1Includes bodily injury and aviation hull losses. Updated to 2019 dollars by the Insurance Information Institute using the U.S. Bureau of Labor Statistics CPI Inflation Calculator. 2Differs from inflation-adjusted estimates made by other organizations due to the use of different deflators.
Source: Swiss Re, U.S. Bureau of Labor Statistics, Insurance Information Institute.
176Insurance Information Institute | www.ii i.org 2021 Insurance Fact Book 176
8. LOSSESU.S. Man-Made Catastrophes: Terrorism
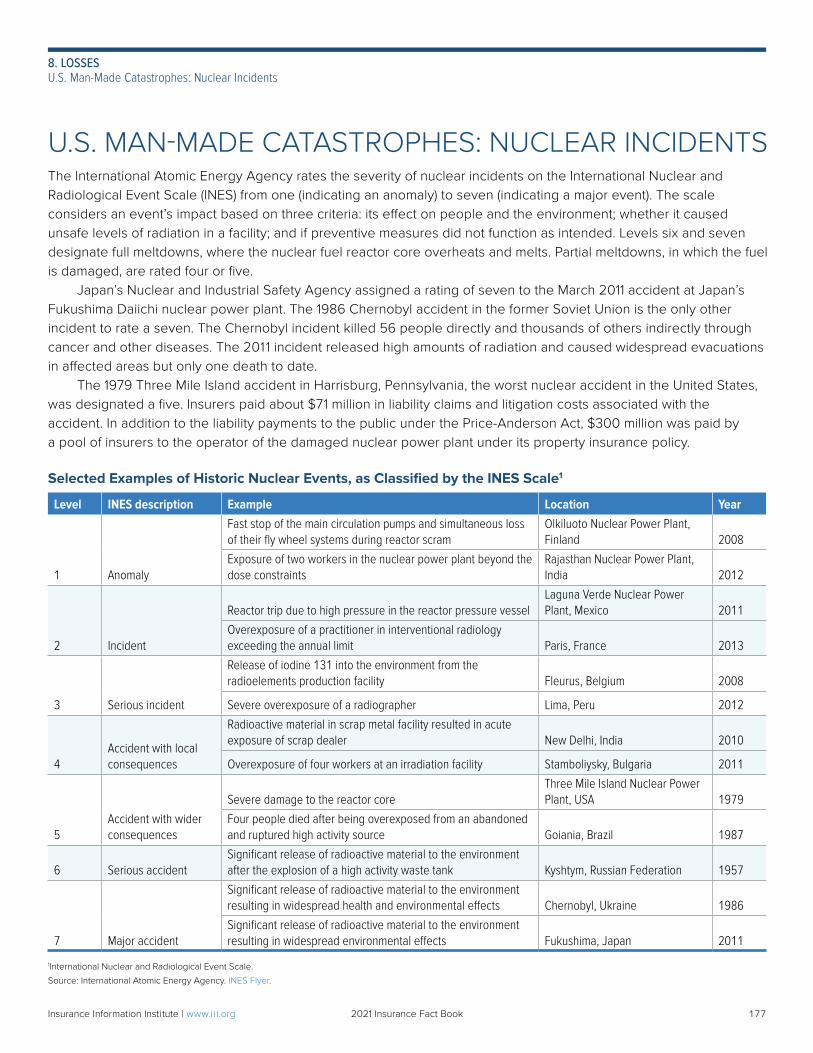
U.S. MAN-MADE CATASTROPHES: NUCLEAR INCIDENTSThe International Atomic Energy Agency rates the severity of nuclear incidents on the International Nuclear and Radiological Event Scale (INES) from one (indicating an anomaly) to seven (indicating a major event). The scale considers an event’s impact based on three criteria: its effect on people and the environment; whether it caused unsafe levels of radiation in a facility; and if preventive measures did not function as intended. Levels six and seven designate full meltdowns, where the nuclear fuel reactor core overheats and melts. Partial meltdowns, in which the fuel is damaged, are rated four or five. Japan’s Nuclear and Industrial Safety Agency assigned a rating of seven to the March 2011 accident at Japan’s Fukushima Daiichi nuclear power plant. The 1986 Chernobyl accident in the former Soviet Union is the only other incident to rate a seven. The Chernobyl incident killed 56 people directly and thousands of others indirectly through cancer and other diseases. The 2011 incident released high amounts of radiation and caused widespread evacuations in affected areas but only one death to date. The 1979 Three Mile Island accident in Harrisburg, Pennsylvania, the worst nuclear accident in the United States, was designated a five. Insurers paid about $71 million in liability claims and litigation costs associated with the accident. In addition to the liability payments to the public under the Price-Anderson Act, $300 million was paid by a pool of insurers to the operator of the damaged nuclear power plant under its property insurance policy.
Selected Examples of Historic Nuclear Events, as Classified by the INES Scale1
Level INES description Example Location Year
1 Anomaly
Fast stop of the main circulation pumps and simultaneous loss of their fly wheel systems during reactor scram
Olkiluoto Nuclear Power Plant, Finland 2008
Exposure of two workers in the nuclear power plant beyond the dose constraints
Rajasthan Nuclear Power Plant, India 2012
2 Incident
Reactor trip due to high pressure in the reactor pressure vesselLaguna Verde Nuclear Power Plant, Mexico 2011
Overexposure of a practitioner in interventional radiology exceeding the annual limit Paris, France 2013
3 Serious incident
Release of iodine 131 into the environment from the radioelements production facility Fleurus, Belgium 2008
Severe overexposure of a radiographer Lima, Peru 2012
4Accident with local consequences
Radioactive material in scrap metal facility resulted in acute exposure of scrap dealer New Delhi, India 2010
Overexposure of four workers at an irradiation facility Stamboliysky, Bulgaria 2011
5Accident with wider consequences
Severe damage to the reactor coreThree Mile Island Nuclear Power Plant, USA 1979
Four people died after being overexposed from an abandoned and ruptured high activity source Goiania, Brazil 1987
6 Serious accidentSignificant release of radioactive material to the environment after the explosion of a high activity waste tank Kyshtym, Russian Federation 1957
7 Major accident
Significant release of radioactive material to the environment resulting in widespread health and environmental effects Chernobyl, Ukraine 1986
Significant release of radioactive material to the environment resulting in widespread environmental effects Fukushima, Japan 2011
1International Nuclear and Radiological Event Scale.
Source: International Atomic Energy Agency. INES Flyer.
177Insurance Information Institute | www.ii i.org 2021 Insurance Fact Book 177
8. LOSSESU.S. Man-Made Catastrophes: Nuclear Incidents
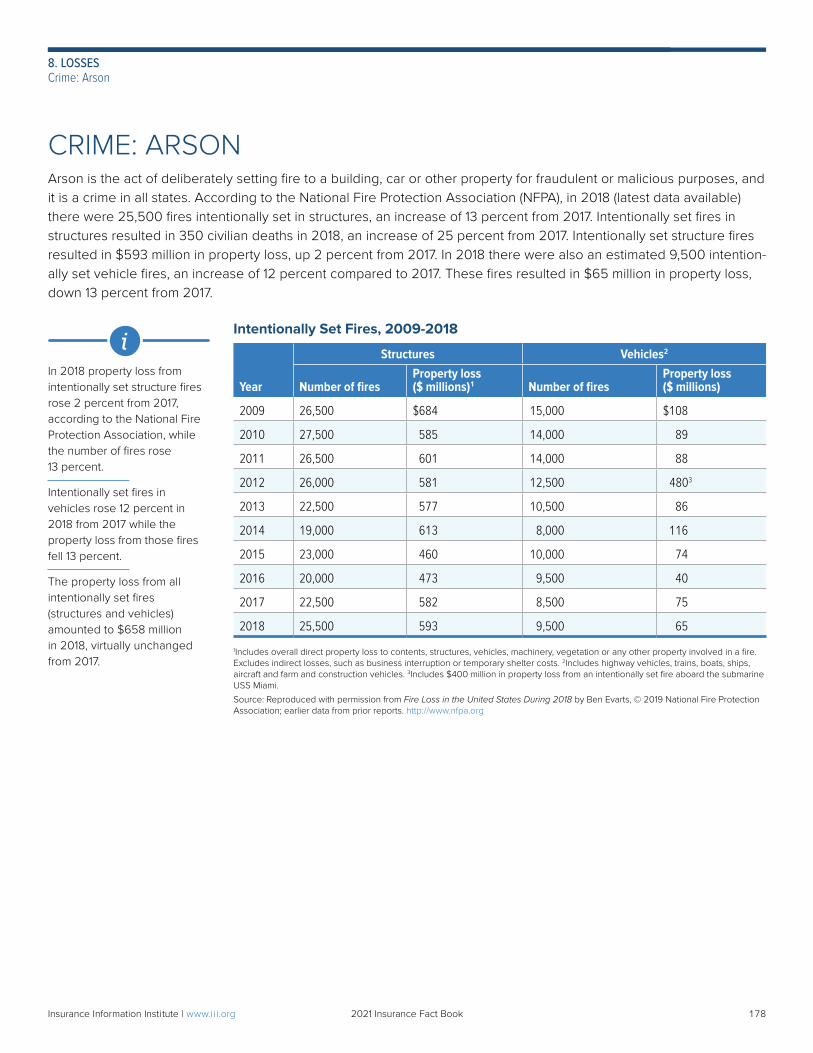
CRIME: ARSONArson is the act of deliberately setting fire to a building, car or other property for fraudulent or malicious purposes, and it is a crime in all states. According to the National Fire Protection Association (NFPA), in 2018 (latest data available) there were 25,500 fires intentionally set in structures, an increase of 13 percent from 2017. Intentionally set fires in structures resulted in 350 civilian deaths in 2018, an increase of 25 percent from 2017. Intentionally set structure fires resulted in $593 million in property loss, up 2 percent from 2017. In 2018 there were also an estimated 9,500 intention-ally set vehicle fires, an increase of 12 percent compared to 2017. These fires resulted in $65 million in property loss, down 13 percent from 2017.
Intentionally Set Fires, 2009-2018
Year
Structures Vehicles2
Number of firesProperty loss($ millions)1 Number of fires
Property loss($ millions)
2009 26,500 $684 15,000 $108
2010 27,500 585 14,000 89
2011 26,500 601 14,000 88
2012 26,000 581 12,500 4803
2013 22,500 577 10,500 86
2014 19,000 613 8,000 116
2015 23,000 460 10,000 74
2016 20,000 473 9,500 40
2017 22,500 582 8,500 75
2018 25,500 593 9,500 65
1Includes overall direct property loss to contents, structures, vehicles, machinery, vegetation or any other property involved in a fire. Excludes indirect losses, such as business interruption or temporary shelter costs. 2Includes highway vehicles, trains, boats, ships, aircraft and farm and construction vehicles. 3Includes $400 million in property loss from an intentionally set fire aboard the submarine USS Miami.
Source: Reproduced with permission from Fire Loss in the United States During 2018 by Ben Evarts, © 2019 National Fire Protection Association; earlier data from prior reports. http://www.nfpa.org
In 2018 property loss from intentionally set structure fires rose 2 percent from 2017, according to the National Fire Protection Association, while the number of fires rose 13 percent.
Intentionally set fires in vehicles rose 12 percent in 2018 from 2017 while the property loss from those fires fell 13 percent.
The property loss from all intentionally set fires (structures and vehicles) amounted to $658 million in 2018, virtually unchanged from 2017.
i
178Insurance Information Institute | www.ii i.org 2021 Insurance Fact Book 178
8. LOSSESCrime: Arson
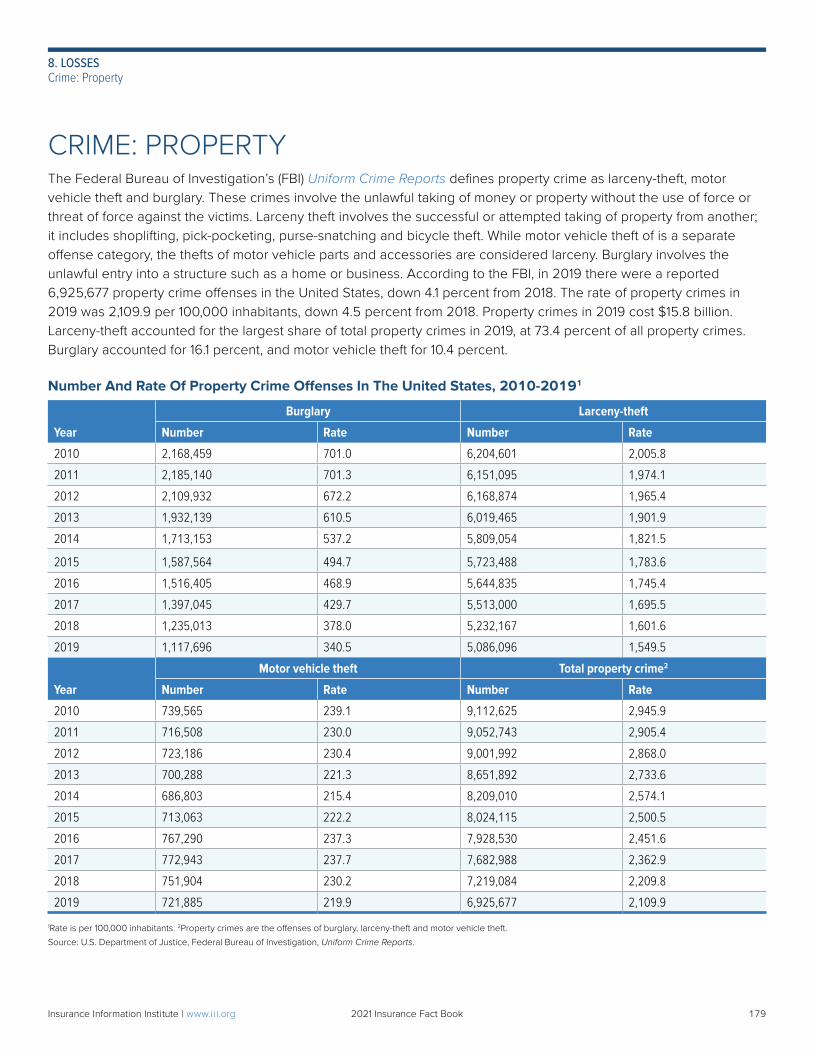
CRIME: PROPERTYThe Federal Bureau of Investigation’s (FBI) Uniform Crime Reports defines property crime as larceny-theft, motor vehicle theft and burglary. These crimes involve the unlawful taking of money or property without the use of force or threat of force against the victims. Larceny theft involves the successful or attempted taking of property from another; it includes shoplifting, pick-pocketing, purse-snatching and bicycle theft. While motor vehicle theft of is a separate offense category, the thefts of motor vehicle parts and accessories are considered larceny. Burglary involves the unlawful entry into a structure such as a home or business. According to the FBI, in 2019 there were a reported 6,925,677 property crime offenses in the United States, down 4.1 percent from 2018. The rate of property crimes in 2019 was 2,109.9 per 100,000 inhabitants, down 4.5 percent from 2018. Property crimes in 2019 cost $15.8 billion. Larceny-theft accounted for the largest share of total property crimes in 2019, at 73.4 percent of all property crimes. Burglary accounted for 16.1 percent, and motor vehicle theft for 10.4 percent.
Number And Rate Of Property Crime Offenses In The United States, 2010-20191
Year
Burglary Larceny-theft
Number Rate Number Rate
2010 2,168,459 701.0 6,204,601 2,005.8
2011 2,185,140 701.3 6,151,095 1,974.1
2012 2,109,932 672.2 6,168,874 1,965.4
2013 1,932,139 610.5 6,019,465 1,901.9
2014 1,713,153 537.2 5,809,054 1,821.5
2015 1,587,564 494.7 5,723,488 1,783.6
2016 1,516,405 468.9 5,644,835 1,745.4
2017 1,397,045 429.7 5,513,000 1,695.5
2018 1,235,013 378.0 5,232,167 1,601.6
2019 1,117,696 340.5 5,086,096 1,549.5
Year
Motor vehicle theft Total property crime2
Number Rate Number Rate
2010 739,565 239.1 9,112,625 2,945.9
2011 716,508 230.0 9,052,743 2,905.4
2012 723,186 230.4 9,001,992 2,868.0
2013 700,288 221.3 8,651,892 2,733.6
2014 686,803 215.4 8,209,010 2,574.1
2015 713,063 222.2 8,024,115 2,500.5
2016 767,290 237.3 7,928,530 2,451.6
2017 772,943 237.7 7,682,988 2,362.9
2018 751,904 230.2 7,219,084 2,209.8
2019 721,885 219.9 6,925,677 2,109.9
1Rate is per 100,000 inhabitants. 2Property crimes are the offenses of burglary, larceny-theft and motor vehicle theft.
Source: U.S. Department of Justice, Federal Bureau of Investigation, Uniform Crime Reports.
179Insurance Information Institute | www.ii i.org 2021 Insurance Fact Book 179
8. LOSSESCrime: Property
CRIME: CYBERCRIME AND IDENTITY THEFTAs businesses increasingly depend on electronic data and computer networks to conduct their daily operations, growing pools of personal and financial information are being transferred and stored online. This can leave individuals exposed to privacy violations, and financial institutions and other businesses exposed to potentially enormous liability, when a data security breach occurs. High-profile data breaches continue to threaten business with losses and consumers with exposure of their personal data. In 2020 more than 280 million Microsoft customer records were left unpro-tected on the web in January. A breach at Marriott Hotels in March reached a data system containing the personal information of about
5.2 million customers and MGM Resorts was hit by a February data breach that exposed the personal information of more than 10.6 million guests. In 2019 the worst data breaches were the Capital One Financial Corp. breach in July that exposed 100 million records and the October Adobe Creative Cloud breach that exposed 7 million users. In 2017 the largest U.S. credit bureau, Equifax Inc., suffered a breach that exposed the personal data, including Social Security numbers, of 145 million people. It was among the worst breaches on record because of the amount of sensitive information stolen. In 2019 ransomware attacks—a type of malware that denies access to an organization’s system—more than doubled from 2018. In 2019 an organization fell victim to ransomware every 14 seconds on average. Also troubling is that while more organizations purchase insurance to protect against the risk, ransom demands grow larger as attackers realize that companies can meet these demands. In 2019 there were 1,473 breaches, up 17 percent from 1,257 in 2018 but below the record of 1,632 breaches in 2017. However, the number of sensitive records (i.e., personal identifying information) exposed in 2019 totaled 164.7 million, down 65 percent from 471.2 million in 2018, according to the Identity Theft Resource Center’s 2019 End-of-Year Data Breach Report. The business sector again faced the highest number of breaches—644 in 2019 compared with 575 in 2018. The ITRC notes that while the business sector accounted for 44 percent of total 2019 breaches, these breaches exposed only 11 percent of all sensitive records. In 2019 the medical/healthcare sector ranked second for the number of breaches, with 525, exposing 39.4 million sensitive records. The education sector had 113 breaches, ranking third, with 2.3 million sensitive records exposed. Breaches in the banking/credit/financial sector—totaling 108—ranked fourth. However, those breaches exposed 100.6 million or 61 percent of total sensitive records. In July 2019 the Capital One breach alone exposed 99 percent of the sensitive records in the banking sector. In 2019 the ITRC reported that hacking was the most used method of breaching data, with 577 data breaches resulting in 15.3 million records exposed. This form of breach includes intrusion methods like phishing, ransomware, malware and skimming. Unauthorized access ranked second with 538 data breaches, but this method affected the highest number of records exposed by data breach type—142 million, or 86 percent of all sensitive records exposed in 2019. Employee error or negligence, improper exposure or lost data had the third highest number of breaches, 161, with 2.9 million records exposed. In the first three quarters of 2020 the ITRC tracked 846 data breaches. This number was down by 30 percent compared to the first three quarters of 2019, when there were 1,190 breaches. In 2020, 292 million people were impacted, down by 60 percent from the 897 million people whose identities were compromised in the same period in 2019. Of note, a ransomware attack at Blackbaud, a cloud computing software company used primarily by nonprofits, exposed data from at least 247 organizations. If the Blackbaud breach had been treated as multiple events in the tally,
180Insurance Information Institute | www.ii i.org 2021 Insurance Fact Book 180
8. LOSSESCrime: Cybercrime And Identity Theft
the number of breaches would only have declined by 10 percent compared with a year ago. While data breaches continue to decline, cyberattacks such as phishing, ransomware, malware and other tactics are rising, according to the ITRC, affecting companies and COVID-19 related government relief efforts such as unemployment benefits. According to the 2020 Cost of a Data Breach Report, sponsored by IBM Security and conducted by the Ponemon Institute, global data breaches cost companies $3.86 million per breach, on average. The study surveyed more than 500 organizations worldwide between August 2019 and April 2020. Cost factors included in the survey included legal, regulatory and technical activities related to breaches. Customers’ personally identifiable information (PII) was exposed in 80 percent of the breaches that occurred in the past year. Nearly 40 percent of malicious incidents were caused by stolen or compromised credentials and cloud misconfigurations. Attackers used previously exposed emails and passwords in one out of five breaches studied, stemming from more than 8.5 billion records exposed in 2019. Businesses that experienced breaches of corporate networks through the use of stolen or compro-mised credentials had nearly $1 million added to data breach costs over the global average, or $4.77 million. Cloud misconfigurations were used to breach networks nearly 20 percent of the time, increasing breach costs by more than half a million dollars to $4.41 million on average. State-sponsored threat actors were the most damaging type of adversary found in the 2020 study, although they accounted for 13 percent of all attacks. The resulting breach costs averaged $4.43 million. The COVID-19 pandemic brought more risk of data breaches because remote work conditions created less controlled environments. The report found that 70 percent of companies studied that adopted telework during the pandemic expect that it would exacerbate data breach costs. According to the Insurance Information Institute and J.D. Power 2019 Small Business Cyber Insurance and Security Spotlight SurveySM, 12 percent of businesses surveyed suffered one or more cyber incidents in 2019, up from 10 percent in 2018. Nearly 71 percent said they are “very concerned” about cyber incidents, up from 58 percent in 2018. Seventy-five percent said they believe the risk of being victimized by a cyberattack is growing at an alarming rate compared with 70 percent in 2018. Among the 44 percent of respondents who said they do not currently have cyber insurance and the 21 percent who said they do not know whether they do, 64 percent said they do not plan to purchase a cyber insurance policy in the next 12 months. This number is down from 70 percent in 2018. Given small companies’ growing awareness and concerns about cyberrisk, insurers and agents and brokers could potentially increase their overall support of this market by addressing the issues of affordability and coverage limitations that seem to be an obstacle to purchasing. Cyber insurance evolved as a product in the United States in the mid- to late-1990s as insurers had to expand coverage for a risk that is rapidly shifting in scope and nature. In 2019, 580 insurers reported writing cyber insurance, up from 545 in 2018, according to NAIC data sourced from S&P Global Market Intelligence. Direct premiums written totaled $2.2 billion in 2019, from companies that can report premiums for stand-alone and coverage provided as part of package policies, up from $2.0 billion in 2018. For more information on cyber insurance see Chapter 7, Commercial Lines.
181Insurance Information Institute | www.ii i.org 2021 Insurance Fact Book 181
8. LOSSESCrime: Cybercrime And Identity Theft
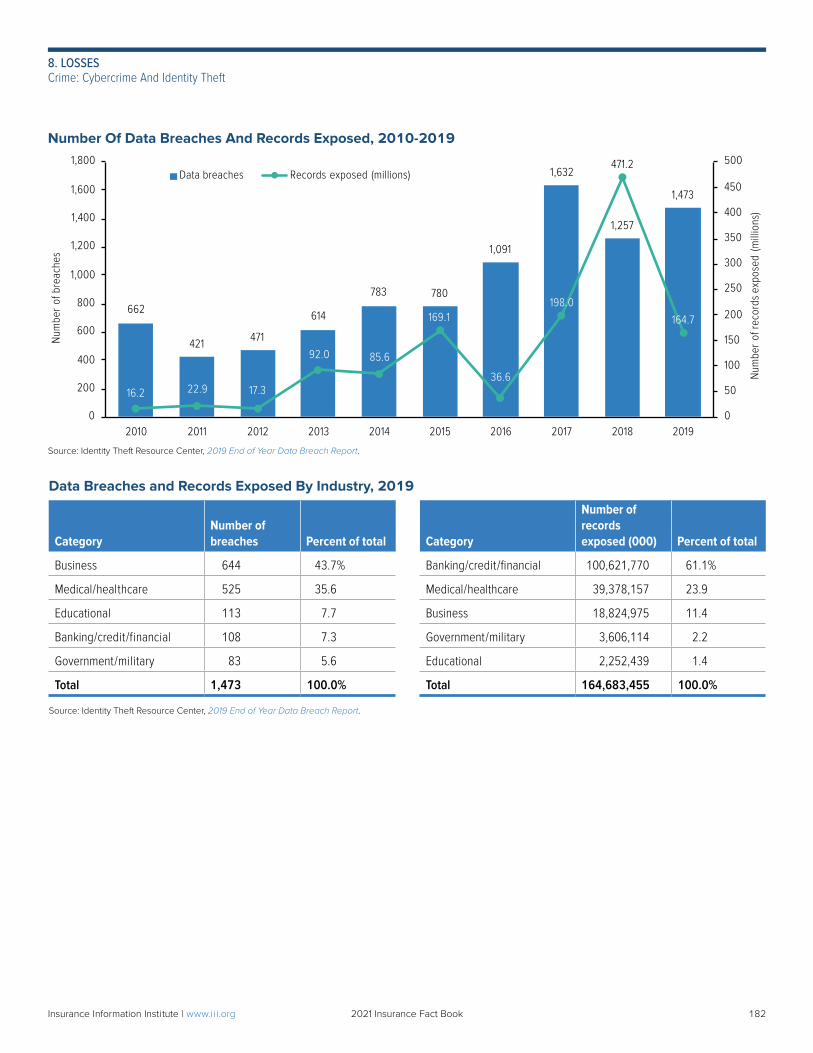
Number Of Data Breaches And Records Exposed, 2010-2019
Source: Identity Theft Resource Center, 2019 End of Year Data Breach Report.
Data Breaches and Records Exposed By Industry, 2019
CategoryNumber of breaches Percent of total Category
Number of recordsexposed (000) Percent of total
Business 644 43.7% Banking/credit/financial 100,621,770 61.1%
Medical/healthcare 525 35.6 Medical/healthcare 39,378,157 23.9
Educational 113 7.7 Business 18,824,975 11.4
Banking/credit/financial 108 7.3 Government/military 3,606,114 2.2
Government/military 83 5.6 Educational 2,252,439 1.4
Total 1,473 100.0% Total 164,683,455 100.0%
Source: Identity Theft Resource Center, 2019 End of Year Data Breach Report.
662
421 471
614
783 780
1,091
1,632
1,257
1,473
16.2 22.9 17.3
92.0 85.6
169.1
36.6
198.0
471.2
164.7
0
50
100
150
200
250
300
350
400
450
500
0
200
400
600
800
1,000
1,200
1,400
1,600
1,800
2010 2011 2012 2013 2014 2015 2016 2017 2018 2019
Data breaches Records exposed (millions)
Num
ber
of b
reac
hes
Num
ber
of re
cord
s ex
pose
d (m
illio
ns)
182Insurance Information Institute | www.ii i.org 2021 Insurance Fact Book 182
8. LOSSESCrime: Cybercrime And Identity Theft
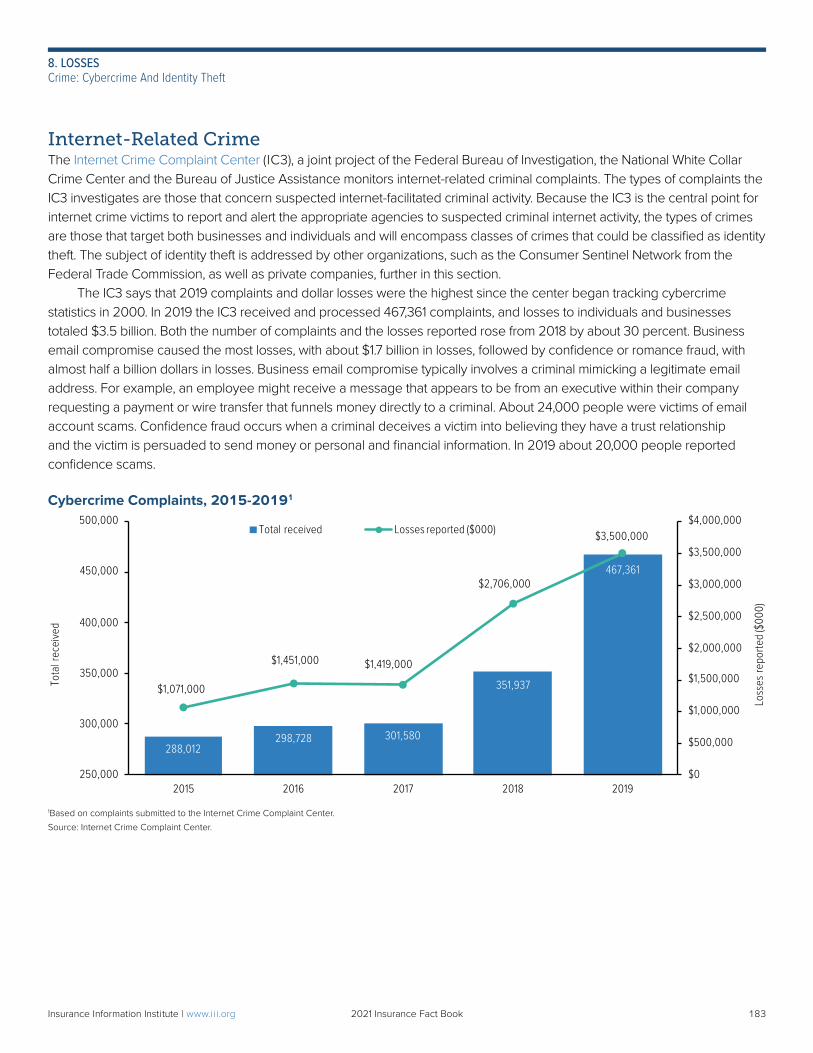
288,012298,728 301,580
351,937
467,361
$1,071,000
$1,451,000 $1,419,000
$2,706,000
$3,500,000
$0
$500,000
$1,000,000
$1,500,000
$2,000,000
$2,500,000
$3,000,000
$3,500,000
$4,000,000
250,000
300,000
350,000
400,000
450,000
500,000
2015 2016 2017 2018 2019
Total received Losses reported ($000)
Tota
l rec
eive
d
Loss
es re
porte
d ($
000)
Internet-Related CrimeThe Internet Crime Complaint Center (IC3), a joint project of the Federal Bureau of Investigation, the National White Collar Crime Center and the Bureau of Justice Assistance monitors internet-related criminal complaints. The types of complaints the IC3 investigates are those that concern suspected internet-facilitated criminal activity. Because the IC3 is the central point for internet crime victims to report and alert the appropriate agencies to suspected criminal internet activity, the types of crimes are those that target both businesses and individuals and will encompass classes of crimes that could be classified as identity theft. The subject of identity theft is addressed by other organizations, such as the Consumer Sentinel Network from the Federal Trade Commission, as well as private companies, further in this section. The IC3 says that 2019 complaints and dollar losses were the highest since the center began tracking cybercrime statistics in 2000. In 2019 the IC3 received and processed 467,361 complaints, and losses to individuals and businesses totaled $3.5 billion. Both the number of complaints and the losses reported rose from 2018 by about 30 percent. Business email compromise caused the most losses, with about $1.7 billion in losses, followed by confidence or romance fraud, with almost half a billion dollars in losses. Business email compromise typically involves a criminal mimicking a legitimate email address. For example, an employee might receive a message that appears to be from an executive within their company requesting a payment or wire transfer that funnels money directly to a criminal. About 24,000 people were victims of email account scams. Confidence fraud occurs when a criminal deceives a victim into believing they have a trust relationship and the victim is persuaded to send money or personal and financial information. In 2019 about 20,000 people reported confidence scams.
Cybercrime Complaints, 2015-20191
1Based on complaints submitted to the Internet Crime Complaint Center.
Source: Internet Crime Complaint Center.
183Insurance Information Institute | www.ii i.org 2021 Insurance Fact Book 183
8. LOSSESCrime: Cybercrime And Identity Theft
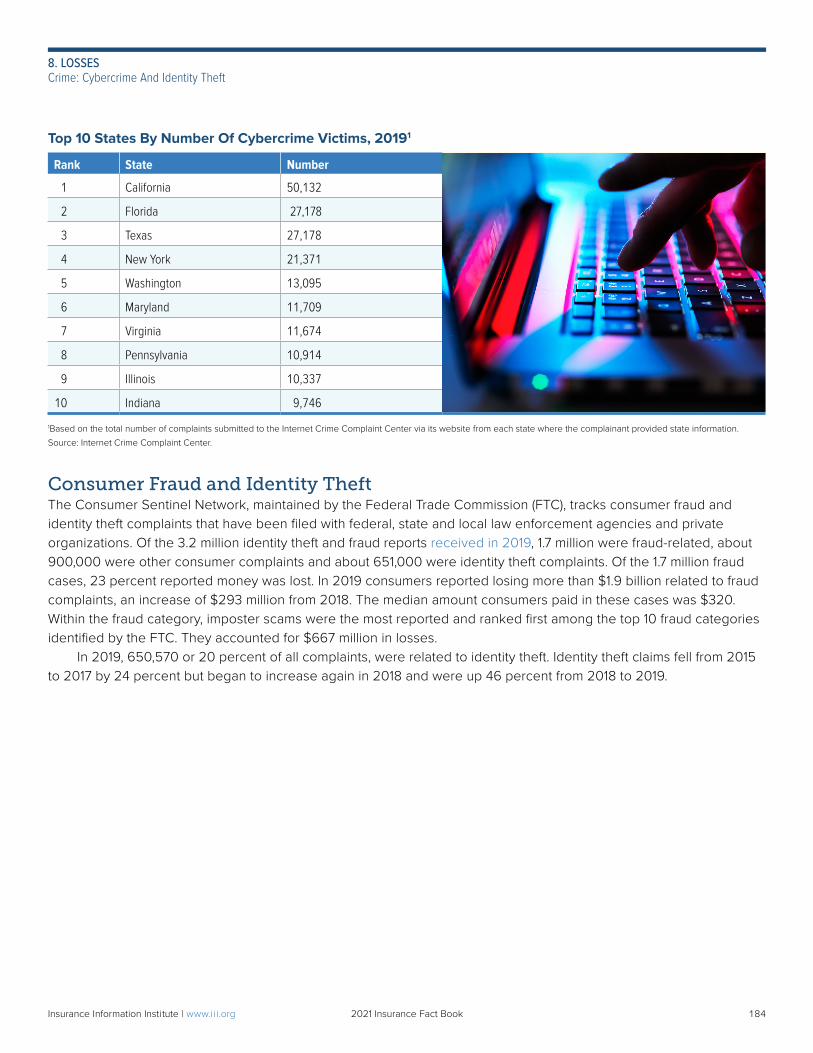
Top 10 States By Number Of Cybercrime Victims, 20191
Rank State Number
1 California 50,132
2 Florida 27,178
3 Texas 27,178
4 New York 21,371
5 Washington 13,095
6 Maryland 11,709
7 Virginia 11,674
8 Pennsylvania 10,914
9 Illinois 10,337
10 Indiana 9,746
1Based on the total number of complaints submitted to the Internet Crime Complaint Center via its website from each state where the complainant provided state information.
Source: Internet Crime Complaint Center.
Consumer Fraud and Identity TheftThe Consumer Sentinel Network, maintained by the Federal Trade Commission (FTC), tracks consumer fraud and identity theft complaints that have been filed with federal, state and local law enforcement agencies and private organizations. Of the 3.2 million identity theft and fraud reports received in 2019, 1.7 million were fraud-related, about 900,000 were other consumer complaints and about 651,000 were identity theft complaints. Of the 1.7 million fraud cases, 23 percent reported money was lost. In 2019 consumers reported losing more than $1.9 billion related to fraud complaints, an increase of $293 million from 2018. The median amount consumers paid in these cases was $320. Within the fraud category, imposter scams were the most reported and ranked first among the top 10 fraud categories identified by the FTC. They accounted for $667 million in losses. In 2019, 650,570 or 20 percent of all complaints, were related to identity theft. Identity theft claims fell from 2015 to 2017 by 24 percent but began to increase again in 2018 and were up 46 percent from 2018 to 2019.
184Insurance Information Institute | www.ii i.org 2021 Insurance Fact Book 184
8. LOSSESCrime: Cybercrime And Identity Theft
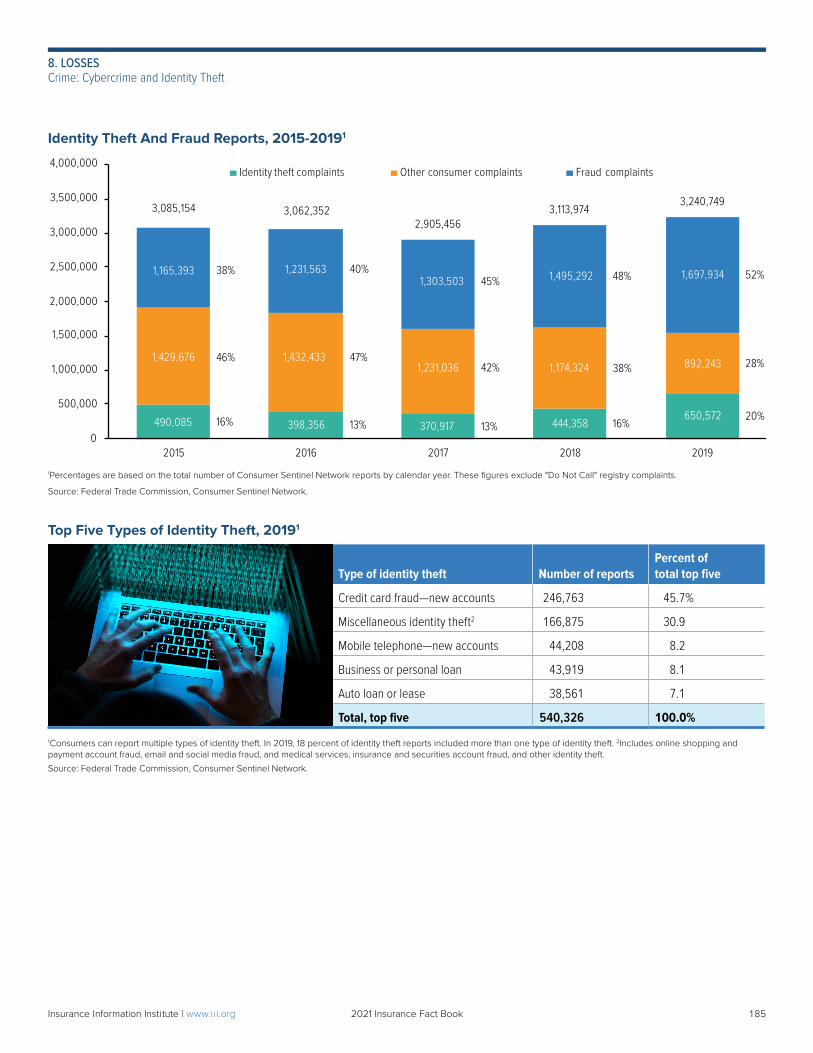
490,085 398,356 370,917 444,358650,572
1,429,676 1,432,4331,231,036 1,174,324 892,243
1,165,393 1,231,5631,303,503 1,495,292 1,697,934
0
500,000
1,000,000
1,500,000
2,000,000
2,500,000
3,000,000
3,500,000
4,000,000
2015 2016 2017 2018 2019
Identity theft complaints Other consumer complaints Fraud complaints
3,085,154 3,062,3522,905,456
3,113,9743,240,749
38%
46%
16%
40%
47%
13%
45%
42%
13%
52%
28%
20%
48%
38%
16%
1Percentages are based on the total number of Consumer Sentinel Network reports by calendar year. These figures exclude "Do Not Call" registry complaints.
Source: Federal Trade Commission, Consumer Sentinel Network.
Top Five Types of Identity Theft, 20191
Type of identity theft Number of reportsPercent of total top five
Credit card fraud—new accounts 246,763 45.7%
Miscellaneous identity theft2 166,875 30.9
Mobile telephone—new accounts 44,208 8.2
Business or personal loan 43,919 8.1
Auto loan or lease 38,561 7.1
Total, top five 540,326 100.0%
1Consumers can report multiple types of identity theft. In 2019, 18 percent of identity theft reports included more than one type of identity theft. 2Includes online shopping and payment account fraud, email and social media fraud, and medical services, insurance and securities account fraud, and other identity theft.
Source: Federal Trade Commission, Consumer Sentinel Network.
Identity Theft And Fraud Reports, 2015-20191
185Insurance Information Institute | www.ii i.org 2021 Insurance Fact Book 185
8. LOSSESCrime: Cybercrime and Identity Theft
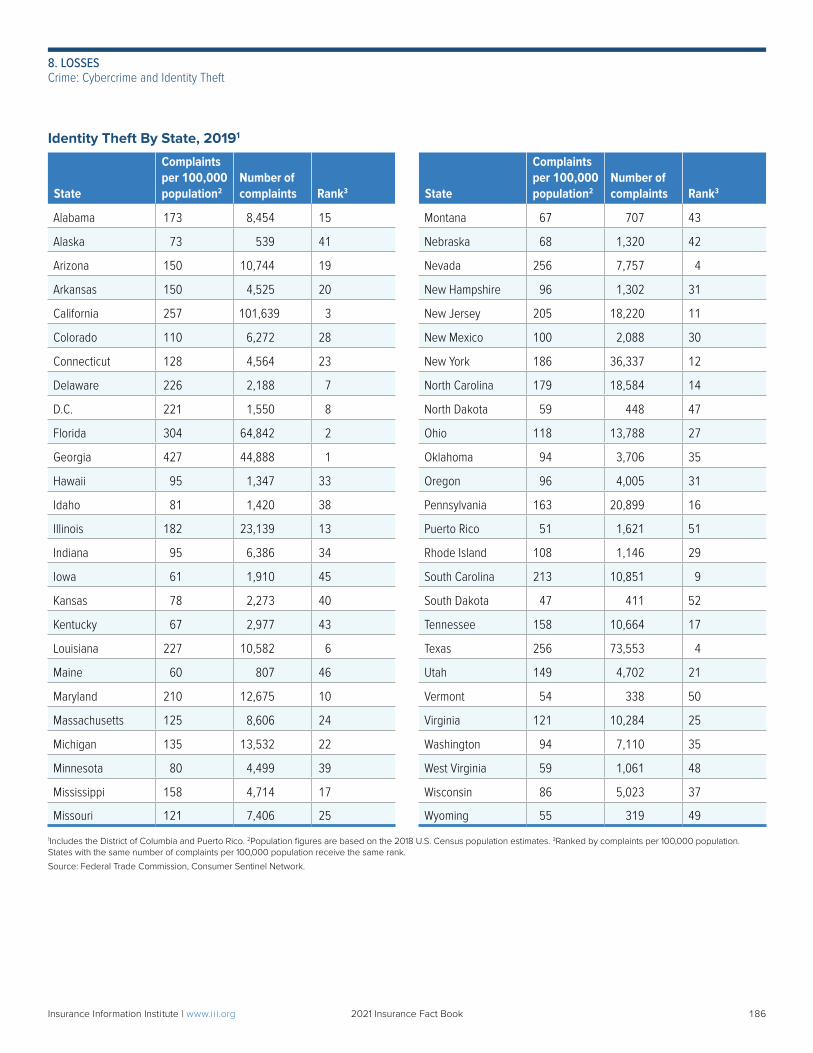
Identity Theft By State, 20191
State
Complaints per 100,000 population2
Number of complaints Rank3 State
Complaints per 100,000 population2
Number of complaints Rank3
Alabama 173 8,454 15 Montana 67 707 43
Alaska 73 539 41 Nebraska 68 1,320 42
Arizona 150 10,744 19 Nevada 256 7,757 4
Arkansas 150 4,525 20 New Hampshire 96 1,302 31
California 257 101,639 3 New Jersey 205 18,220 11
Colorado 110 6,272 28 New Mexico 100 2,088 30
Connecticut 128 4,564 23 New York 186 36,337 12
Delaware 226 2,188 7 North Carolina 179 18,584 14
D.C. 221 1,550 8 North Dakota 59 448 47
Florida 304 64,842 2 Ohio 118 13,788 27
Georgia 427 44,888 1 Oklahoma 94 3,706 35
Hawaii 95 1,347 33 Oregon 96 4,005 31
Idaho 81 1,420 38 Pennsylvania 163 20,899 16
Illinois 182 23,139 13 Puerto Rico 51 1,621 51
Indiana 95 6,386 34 Rhode Island 108 1,146 29
Iowa 61 1,910 45 South Carolina 213 10,851 9
Kansas 78 2,273 40 South Dakota 47 411 52
Kentucky 67 2,977 43 Tennessee 158 10,664 17
Louisiana 227 10,582 6 Texas 256 73,553 4
Maine 60 807 46 Utah 149 4,702 21
Maryland 210 12,675 10 Vermont 54 338 50
Massachusetts 125 8,606 24 Virginia 121 10,284 25
Michigan 135 13,532 22 Washington 94 7,110 35
Minnesota 80 4,499 39 West Virginia 59 1,061 48
Mississippi 158 4,714 17 Wisconsin 86 5,023 37
Missouri 121 7,406 25 Wyoming 55 319 49
1Includes the District of Columbia and Puerto Rico. 2Population figures are based on the 2018 U.S. Census population estimates. 3Ranked by complaints per 100,000 population. States with the same number of complaints per 100,000 population receive the same rank.
Source: Federal Trade Commission, Consumer Sentinel Network.
186Insurance Information Institute | www.ii i.org 2021 Insurance Fact Book 186
8. LOSSESCrime: Cybercrime and Identity Theft
The Scope Of Identity TheftAccording to Javelin Strategy & Research, in a report sponsored by Giact, Identity Fraud in the Digital Age, consumers are increasingly dependent on digital technology to solve problems and maximize their time efficiently. When they do not practice security measures, they become targets for criminals using malware attacks and other tactics designed to steal sensitive financial records. The study found that more than 60 percent of the time, consumers discover they are victims of identity fraud themselves, leaving financial service providers subject to reputation damage. The findings were from an online survey of 5,000 U.S adults conducted in October and November 2019. In 2019, 5.08 percent of consumers reported fraud incidents, down from 5.66 percent in 2018. However, the losses reported grew to $16.9 billion in 2019 from $14.7 billion in 2018. Criminal account takeover incidents grew 72 percent, leaving consumers vulnerable to significant losses. The type of accounts being taken over is changing, as criminals are targeting online, noncard accounts such as Amazon or eBay at close to takeover rates for checking or savings accounts. The researchers recommend that businesses use layers of effective fraud detection technology while using multi-factor identification where account access is granted only after the user provides two or more pieces of information.
MOTOR VEHICLES: CRASHESAccording to the National Highway Traffic Safety Administration (NHTSA), 36,096 people died in motor vehicle crashes in 2019, down 2.0 percent from 36,835 in 2018. The drop in 2019 was the third consecutive annual decline, which occurred despite a 0.9 percent increase from 2018 in vehicle miles traveled. Fatalities decreased slightly in 2019 for drivers, passengers, motorcyclists, pedestrians and pedal cyclists. Fatalities involving SUVs rose 3.4 percent from 2018 and rose slightly in crashes involving large trucks. The total fatality rate, measured as deaths per 100 million vehicle miles traveled, dropped to 1.10 in 2019, from 1.13 in 2018. NHTSA’s estimate for the first half of 2020, which includes about three months of data during the COVID-19 epidemic, shows
that traffic fatalities fell 2.0 percent from first half 2019, while vehicle miles traveled fell at the much faster rate of 16.6 percent, leading to an increase in the fatality rate per 100 million vehicle miles traveled to 1.25, up from 1.06 in the same period in 2018. According to Triple-I Chief Actuary James Lynch, the increase in traffic fatalities was likely caused by faster driving.
187Insurance Information Institute | www.ii i.org 2021 Insurance Fact Book 187
8. LOSSESCrime: Cybercrime and Identity Theft /Motor Vehicles: Crashes
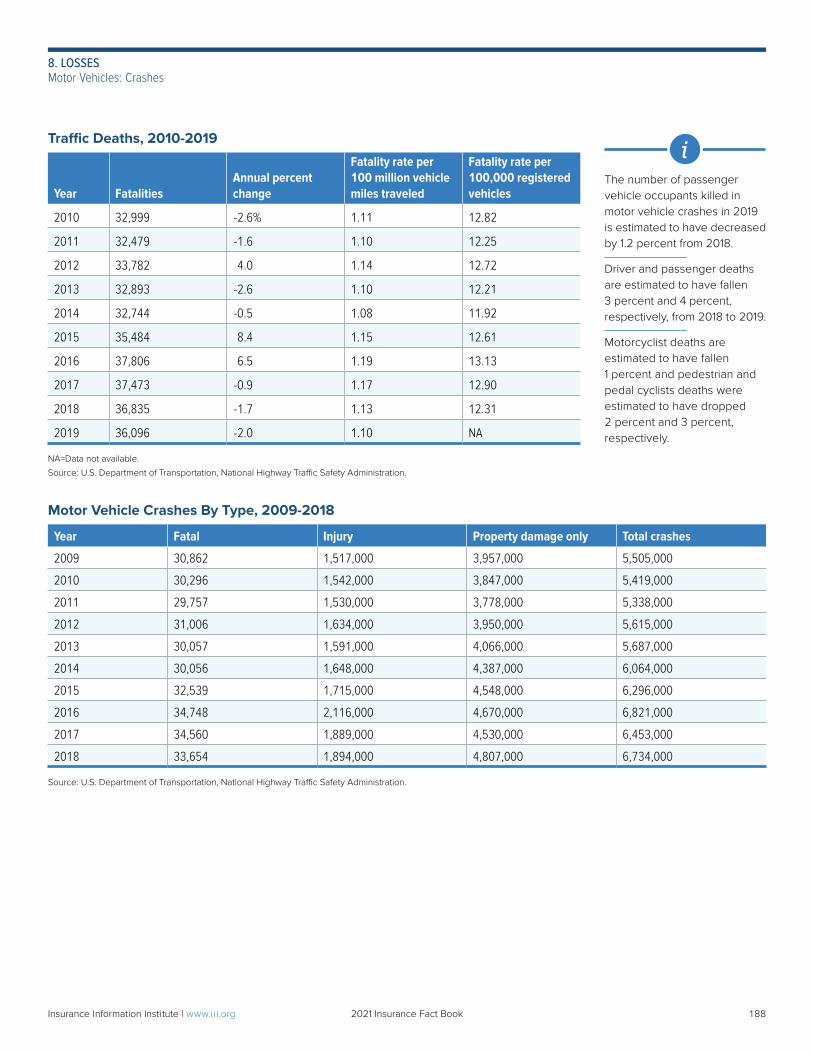
Traffic Deaths, 2010-2019
Year FatalitiesAnnual percent change
Fatality rate per 100 million vehicle miles traveled
Fatality rate per 100,000 registered vehicles
2010 32,999 -2.6% 1.11 12.82
2011 32,479 -1.6 1.10 12.25
2012 33,782 4.0 1.14 12.72
2013 32,893 -2.6 1.10 12.21
2014 32,744 -0.5 1.08 11.92
2015 35,484 8.4 1.15 12.61
2016 37,806 6.5 1.19 13.13
2017 37,473 -0.9 1.17 12.90
2018 36,835 -1.7 1.13 12.31
2019 36,096 -2.0 1.10 NA
NA=Data not available.
Source: U.S. Department of Transportation, National Highway Traffic Safety Administration.
Motor Vehicle Crashes By Type, 2009-2018
Year Fatal Injury Property damage only Total crashes
2009 30,862 1,517,000 3,957,000 5,505,000
2010 30,296 1,542,000 3,847,000 5,419,000
2011 29,757 1,530,000 3,778,000 5,338,000
2012 31,006 1,634,000 3,950,000 5,615,000
2013 30,057 1,591,000 4,066,000 5,687,000
2014 30,056 1,648,000 4,387,000 6,064,000
2015 32,539 1,715,000 4,548,000 6,296,000
2016 34,748 2,116,000 4,670,000 6,821,000
2017 34,560 1,889,000 4,530,000 6,453,000
2018 33,654 1,894,000 4,807,000 6,734,000
Source: U.S. Department of Transportation, National Highway Traffic Safety Administration.
The number of passenger vehicle occupants killed in motor vehicle crashes in 2019 is estimated to have decreased by 1.2 percent from 2018.
Driver and passenger deaths are estimated to have fallen 3 percent and 4 percent, respectively, from 2018 to 2019.
Motorcyclist deaths are estimated to have fallen 1 percent and pedestrian and pedal cyclists deaths were estimated to have dropped 2 percent and 3 percent, respectively.
i
188Insurance Information Institute | www.ii i.org 2021 Insurance Fact Book 188
8. LOSSESMotor Vehicles: Crashes
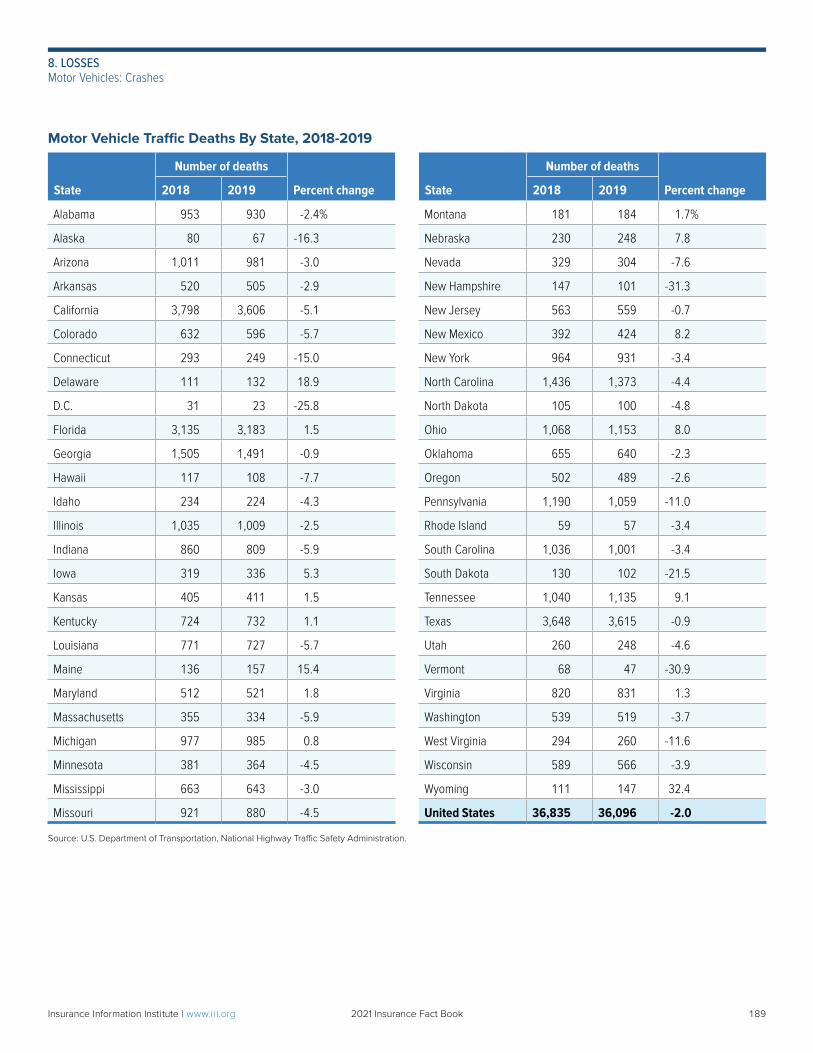
Motor Vehicle Traffic Deaths By State, 2018-2019
State
Number of deaths
Percent change State
Number of deaths
Percent change2018 2019 2018 2019
Alabama 953 930 -2.4% Montana 181 184 1.7%
Alaska 80 67 -16.3 Nebraska 230 248 7.8
Arizona 1,011 981 -3.0 Nevada 329 304 -7.6
Arkansas 520 505 -2.9 New Hampshire 147 101 -31.3
California 3,798 3,606 -5.1 New Jersey 563 559 -0.7
Colorado 632 596 -5.7 New Mexico 392 424 8.2
Connecticut 293 249 -15.0 New York 964 931 -3.4
Delaware 111 132 18.9 North Carolina 1,436 1,373 -4.4
D.C. 31 23 -25.8 North Dakota 105 100 -4.8
Florida 3,135 3,183 1.5 Ohio 1,068 1,153 8.0
Georgia 1,505 1,491 -0.9 Oklahoma 655 640 -2.3
Hawaii 117 108 -7.7 Oregon 502 489 -2.6
Idaho 234 224 -4.3 Pennsylvania 1,190 1,059 -11.0
Illinois 1,035 1,009 -2.5 Rhode Island 59 57 -3.4
Indiana 860 809 -5.9 South Carolina 1,036 1,001 -3.4
Iowa 319 336 5.3 South Dakota 130 102 -21.5
Kansas 405 411 1.5 Tennessee 1,040 1,135 9.1
Kentucky 724 732 1.1 Texas 3,648 3,615 -0.9
Louisiana 771 727 -5.7 Utah 260 248 -4.6
Maine 136 157 15.4 Vermont 68 47 -30.9
Maryland 512 521 1.8 Virginia 820 831 1.3
Massachusetts 355 334 -5.9 Washington 539 519 -3.7
Michigan 977 985 0.8 West Virginia 294 260 -11.6
Minnesota 381 364 -4.5 Wisconsin 589 566 -3.9
Mississippi 663 643 -3.0 Wyoming 111 147 32.4
Missouri 921 880 -4.5 United States 36,835 36,096 -2.0
Source: U.S. Department of Transportation, National Highway Traffic Safety Administration.
189Insurance Information Institute | www.ii i.org 2021 Insurance Fact Book 189
8. LOSSESMotor Vehicles: Crashes
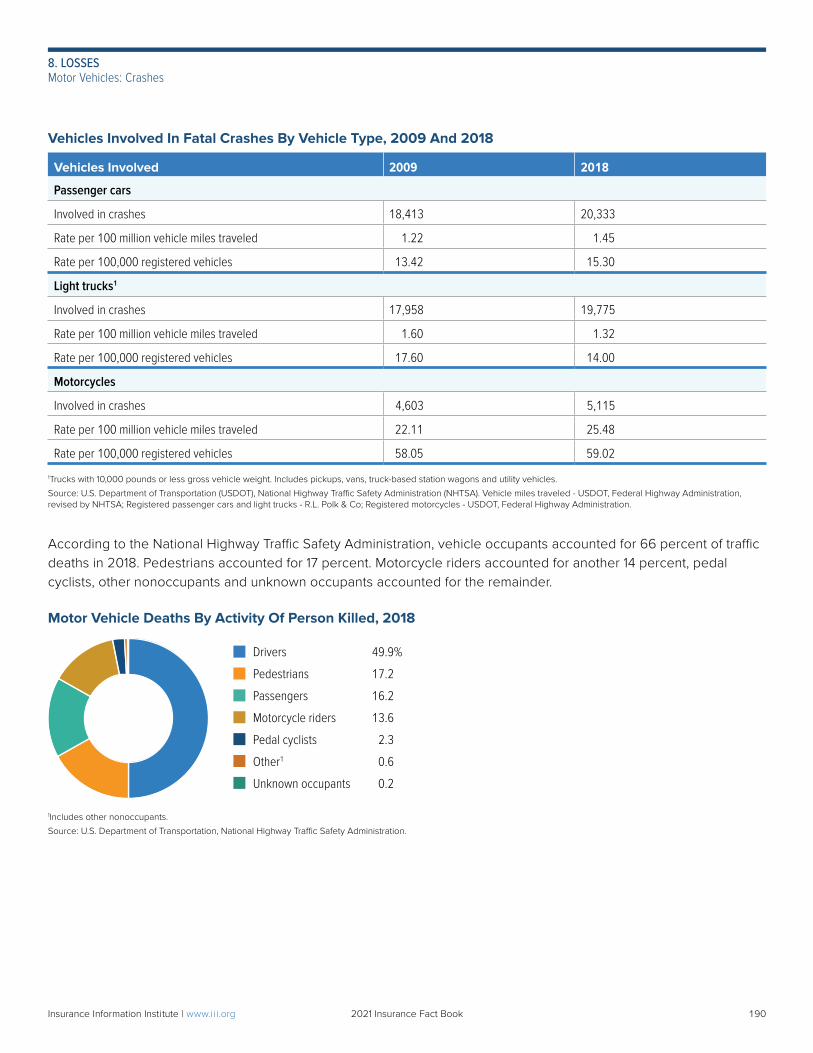
Vehicles Involved In Fatal Crashes By Vehicle Type, 2009 And 2018
Vehicles Involved 2009 2018
Passenger cars
Involved in crashes 18,413 20,333
Rate per 100 million vehicle miles traveled 1.22 1.45
Rate per 100,000 registered vehicles 13.42 15.30
Light trucks1
Involved in crashes 17,958 19,775
Rate per 100 million vehicle miles traveled 1.60 1.32
Rate per 100,000 registered vehicles 17.60 14.00
Motorcycles
Involved in crashes 4,603 5,115
Rate per 100 million vehicle miles traveled 22.11 25.48
Rate per 100,000 registered vehicles 58.05 59.02
1Trucks with 10,000 pounds or less gross vehicle weight. Includes pickups, vans, truck-based station wagons and utility vehicles.
Source: U.S. Department of Transportation (USDOT), National Highway Traffic Safety Administration (NHTSA). Vehicle miles traveled - USDOT, Federal Highway Administration, revised by NHTSA; Registered passenger cars and light trucks - R.L. Polk & Co; Registered motorcycles - USDOT, Federal Highway Administration.
According to the National Highway Traffic Safety Administration, vehicle occupants accounted for 66 percent of traffic deaths in 2018. Pedestrians accounted for 17 percent. Motorcycle riders accounted for another 14 percent, pedal cyclists, other nonoccupants and unknown occupants accounted for the remainder.
Motor Vehicle Deaths By Activity Of Person Killed, 2018
Drivers 49.9%
Pedestrians 17.2
Passengers 16.2
Motorcycle riders 13.6
Pedal cyclists 2.3
Other1 0.6
Unknown occupants 0.2
1Includes other nonoccupants.
Source: U.S. Department of Transportation, National Highway Traffic Safety Administration.
190Insurance Information Institute | www.ii i.org 2021 Insurance Fact Book 190
8. LOSSESMotor Vehicles: Crashes
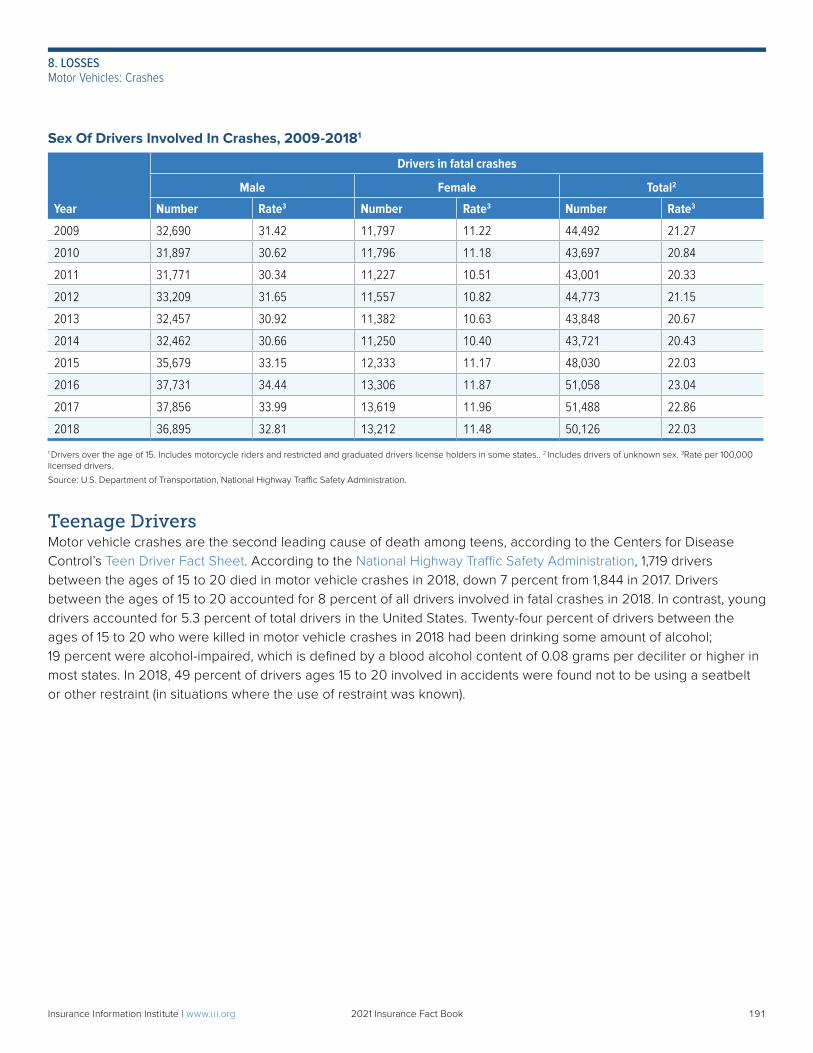
Sex Of Drivers Involved In Crashes, 2009-20181
Year
Drivers in fatal crashes
Male Female Total2
Number Rate3 Number Rate3 Number Rate3
2009 32,690 31.42 11,797 11.22 44,492 21.27
2010 31,897 30.62 11,796 11.18 43,697 20.84
2011 31,771 30.34 11,227 10.51 43,001 20.33
2012 33,209 31.65 11,557 10.82 44,773 21.15
2013 32,457 30.92 11,382 10.63 43,848 20.67
2014 32,462 30.66 11,250 10.40 43,721 20.43
2015 35,679 33.15 12,333 11.17 48,030 22.03
2016 37,731 34.44 13,306 11.87 51,058 23.04
2017 37,856 33.99 13,619 11.96 51,488 22.86
2018 36,895 32.81 13,212 11.48 50,126 22.03
1 Drivers over the age of 15. Includes motorcycle riders and restricted and graduated drivers license holders in some states.. 2 Includes drivers of unknown sex. 3Rate per 100,000 licensed drivers.
Source: U.S. Department of Transportation, National Highway Traffic Safety Administration.
Teenage DriversMotor vehicle crashes are the second leading cause of death among teens, according to the Centers for Disease Control’s Teen Driver Fact Sheet. According to the National Highway Traffic Safety Administration, 1,719 drivers between the ages of 15 to 20 died in motor vehicle crashes in 2018, down 7 percent from 1,844 in 2017. Drivers between the ages of 15 to 20 accounted for 8 percent of all drivers involved in fatal crashes in 2018. In contrast, young drivers accounted for 5.3 percent of total drivers in the United States. Twenty-four percent of drivers between the ages of 15 to 20 who were killed in motor vehicle crashes in 2018 had been drinking some amount of alcohol; 19 percent were alcohol-impaired, which is defined by a blood alcohol content of 0.08 grams per deciliter or higher in most states. In 2018, 49 percent of drivers ages 15 to 20 involved in accidents were found not to be using a seatbelt or other restraint (in situations where the use of restraint was known).
191Insurance Information Institute | www.ii i.org 2021 Insurance Fact Book 191
8. LOSSESMotor Vehicles: Crashes
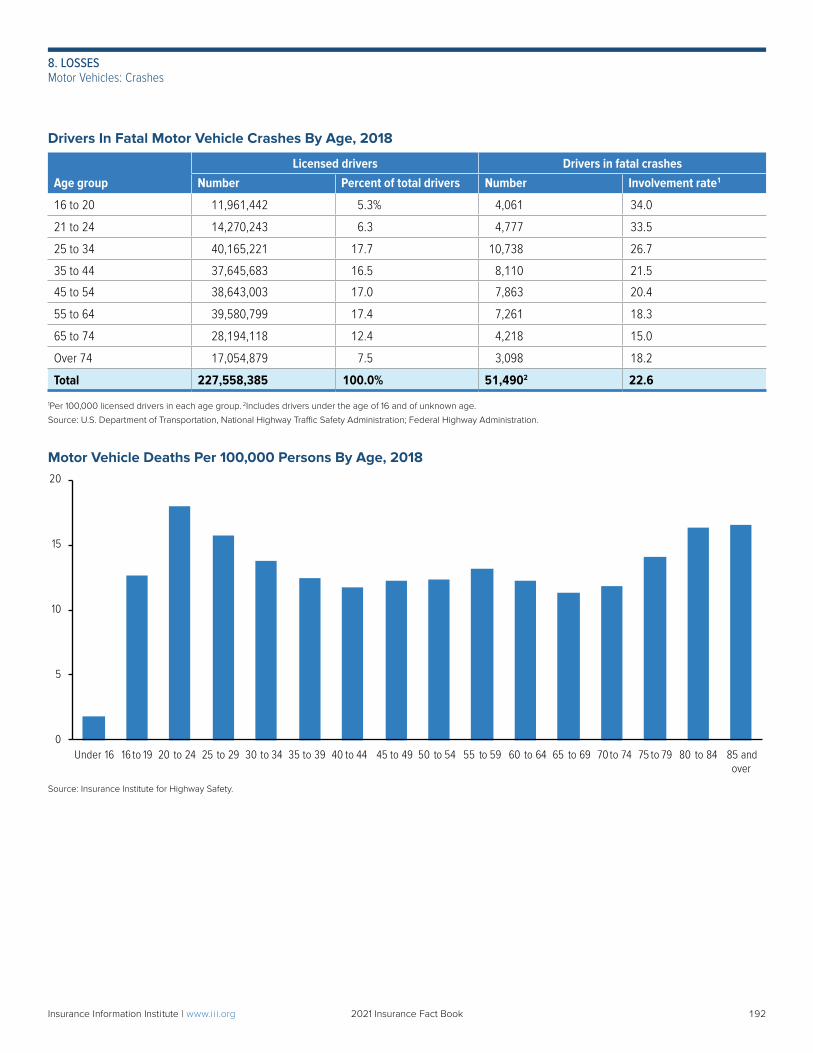
Drivers In Fatal Motor Vehicle Crashes By Age, 2018
Age groupLicensed drivers Drivers in fatal crashes
Number Percent of total drivers Number Involvement rate1
16 to 20 11,961,442 5.3% 4,061 34.0
21 to 24 14,270,243 6.3 4,777 33.5
25 to 34 40,165,221 17.7 10,738 26.7
35 to 44 37,645,683 16.5 8,110 21.5
45 to 54 38,643,003 17.0 7,863 20.4
55 to 64 39,580,799 17.4 7,261 18.3
65 to 74 28,194,118 12.4 4,218 15.0
Over 74 17,054,879 7.5 3,098 18.2
Total 227,558,385 100.0% 51,4902 22.6
1Per 100,000 licensed drivers in each age group. 2Includes drivers under the age of 16 and of unknown age.
Source: U.S. Department of Transportation, National Highway Traffic Safety Administration; Federal Highway Administration.
Motor Vehicle Deaths Per 100,000 Persons By Age, 2018
0
5
10
15
20
Under 16 16 to 19 20 to 24 25 to 29 30 to 34 35 to 39 40 to 44 45 to 49 50 to 54 55 to 59 60 to 64 65 to 69 70 to 74 75 to 79 80 to 84 85 andover
Source: Insurance Institute for Highway Safety.
192Insurance Information Institute | www.ii i.org 2021 Insurance Fact Book 192
8. LOSSESMotor Vehicles: Crashes
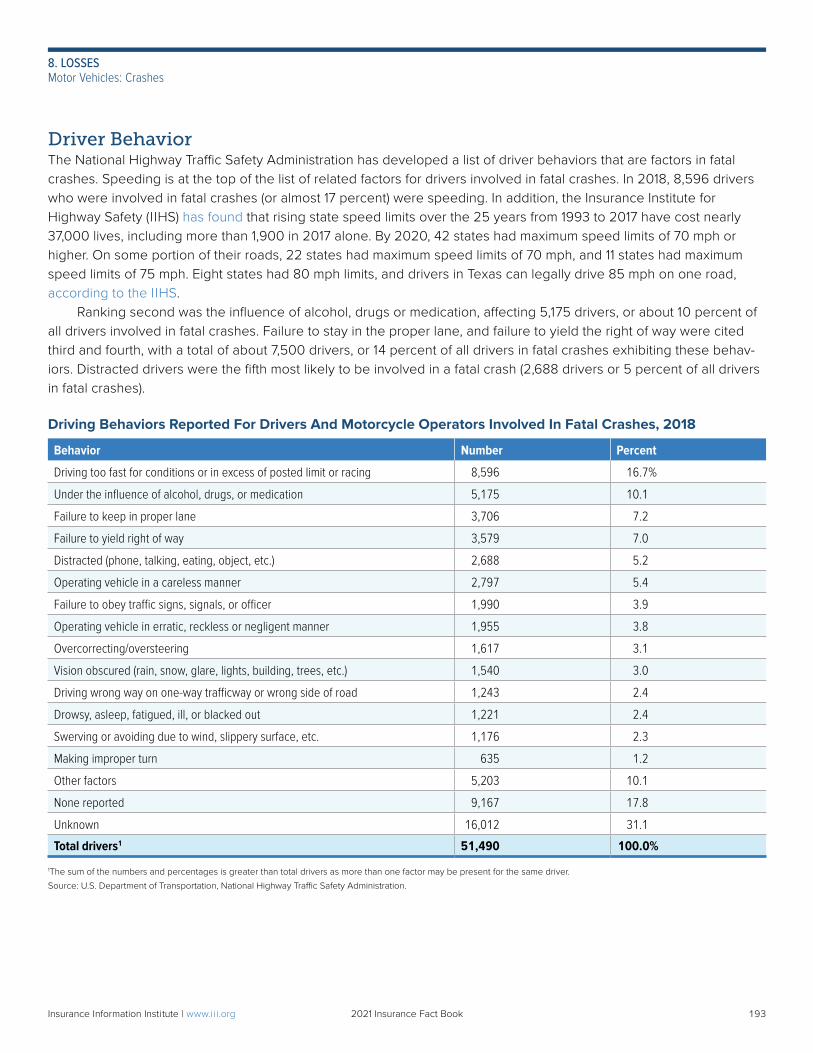
Driver BehaviorThe National Highway Traffic Safety Administration has developed a list of driver behaviors that are factors in fatal crashes. Speeding is at the top of the list of related factors for drivers involved in fatal crashes. In 2018, 8,596 drivers who were involved in fatal crashes (or almost 17 percent) were speeding. In addition, the Insurance Institute for Highway Safety (IIHS) has found that rising state speed limits over the 25 years from 1993 to 2017 have cost nearly 37,000 lives, including more than 1,900 in 2017 alone. By 2020, 42 states had maximum speed limits of 70 mph or higher. On some portion of their roads, 22 states had maximum speed limits of 70 mph, and 11 states had maximum speed limits of 75 mph. Eight states had 80 mph limits, and drivers in Texas can legally drive 85 mph on one road, according to the IIHS. Ranking second was the influence of alcohol, drugs or medication, affecting 5,175 drivers, or about 10 percent of all drivers involved in fatal crashes. Failure to stay in the proper lane, and failure to yield the right of way were cited third and fourth, with a total of about 7,500 drivers, or 14 percent of all drivers in fatal crashes exhibiting these behav-iors. Distracted drivers were the fifth most likely to be involved in a fatal crash (2,688 drivers or 5 percent of all drivers in fatal crashes).
Driving Behaviors Reported For Drivers And Motorcycle Operators Involved In Fatal Crashes, 2018
Behavior Number Percent
Driving too fast for conditions or in excess of posted limit or racing 8,596 16.7%
Under the influence of alcohol, drugs, or medication 5,175 10.1
Failure to keep in proper lane 3,706 7.2
Failure to yield right of way 3,579 7.0
Distracted (phone, talking, eating, object, etc.) 2,688 5.2
Operating vehicle in a careless manner 2,797 5.4
Failure to obey traffic signs, signals, or officer 1,990 3.9
Operating vehicle in erratic, reckless or negligent manner 1,955 3.8
Overcorrecting/oversteering 1,617 3.1
Vision obscured (rain, snow, glare, lights, building, trees, etc.) 1,540 3.0
Driving wrong way on one-way trafficway or wrong side of road 1,243 2.4
Drowsy, asleep, fatigued, ill, or blacked out 1,221 2.4
Swerving or avoiding due to wind, slippery surface, etc. 1,176 2.3
Making improper turn 635 1.2
Other factors 5,203 10.1
None reported 9,167 17.8
Unknown 16,012 31.1
Total drivers1 51,490 100.0%
1The sum of the numbers and percentages is greater than total drivers as more than one factor may be present for the same driver.
Source: U.S. Department of Transportation, National Highway Traffic Safety Administration.
193Insurance Information Institute | www.ii i.org 2021 Insurance Fact Book 193
8. LOSSESMotor Vehicles: Crashes
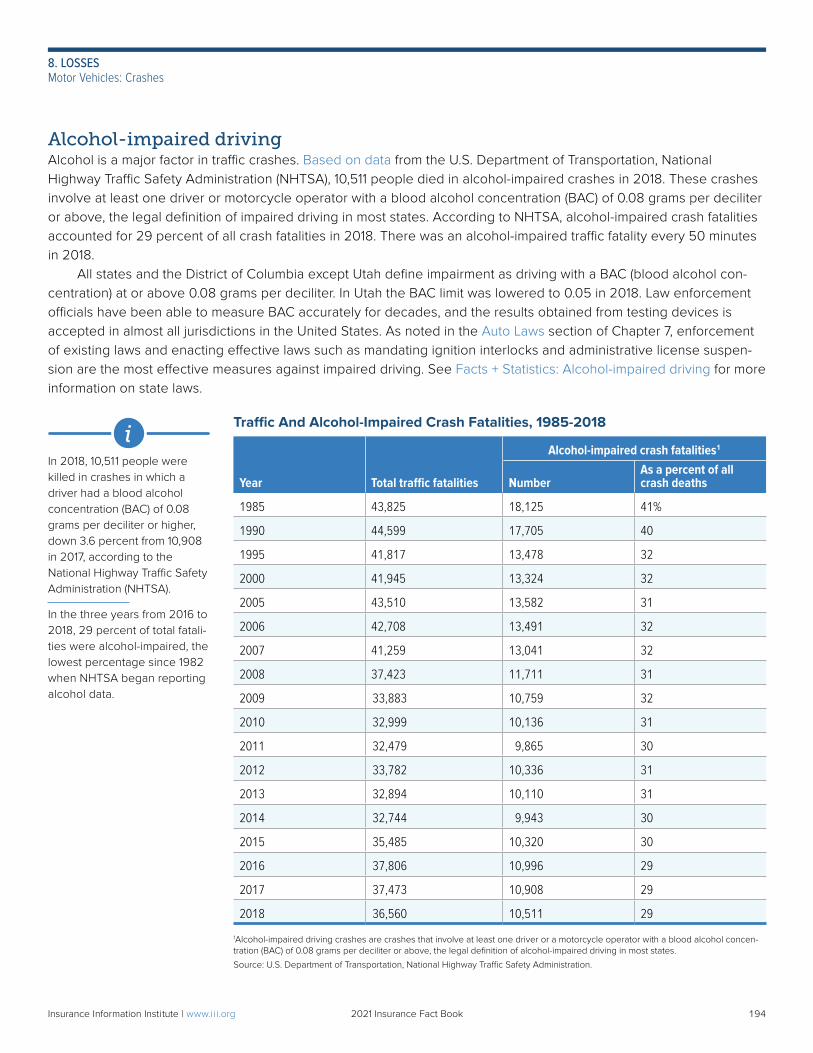
Alcohol-impaired drivingAlcohol is a major factor in traffic crashes. Based on data from the U.S. Department of Transportation, National Highway Traffic Safety Administration (NHTSA), 10,511 people died in alcohol-impaired crashes in 2018. These crashes involve at least one driver or motorcycle operator with a blood alcohol concentration (BAC) of 0.08 grams per deciliter or above, the legal definition of impaired driving in most states. According to NHTSA, alcohol-impaired crash fatalities accounted for 29 percent of all crash fatalities in 2018. There was an alcohol-impaired traffic fatality every 50 minutes in 2018. All states and the District of Columbia except Utah define impairment as driving with a BAC (blood alcohol con-centration) at or above 0.08 grams per deciliter. In Utah the BAC limit was lowered to 0.05 in 2018. Law enforcement officials have been able to measure BAC accurately for decades, and the results obtained from testing devices is accepted in almost all jurisdictions in the United States. As noted in the Auto Laws section of Chapter 7, enforcement of existing laws and enacting effective laws such as mandating ignition interlocks and administrative license suspen-sion are the most effective measures against impaired driving. See Facts + Statistics: Alcohol-impaired driving for more information on state laws.
Traffic And Alcohol-Impaired Crash Fatalities, 1985-2018
Alcohol-impaired crash fatalities1
Year Total traffic fatalities NumberAs a percent of all crash deaths
1985 43,825 18,125 41%
1990 44,599 17,705 40
1995 41,817 13,478 32
2000 41,945 13,324 32
2005 43,510 13,582 31
2006 42,708 13,491 32
2007 41,259 13,041 32
2008 37,423 11,711 31
2009 33,883 10,759 32
2010 32,999 10,136 31
2011 32,479 9,865 30
2012 33,782 10,336 31
2013 32,894 10,110 31
2014 32,744 9,943 30
2015 35,485 10,320 30
2016 37,806 10,996 29
2017 37,473 10,908 29
2018 36,560 10,511 29
1Alcohol-impaired driving crashes are crashes that involve at least one driver or a motorcycle operator with a blood alcohol concen-tration (BAC) of 0.08 grams per deciliter or above, the legal definition of alcohol-impaired driving in most states.
Source: U.S. Department of Transportation, National Highway Traffic Safety Administration.
iIn 2018, 10,511 people were killed in crashes in which a driver had a blood alcohol concentration (BAC) of 0.08 grams per deciliter or higher, down 3.6 percent from 10,908 in 2017, according to the National Highway Traffic Safety Administration (NHTSA).
In the three years from 2016 to 2018, 29 percent of total fatali-ties were alcohol-impaired, the lowest percentage since 1982 when NHTSA began reporting alcohol data.
194Insurance Information Institute | www.ii i.org 2021 Insurance Fact Book 194
8. LOSSESMotor Vehicles: Crashes
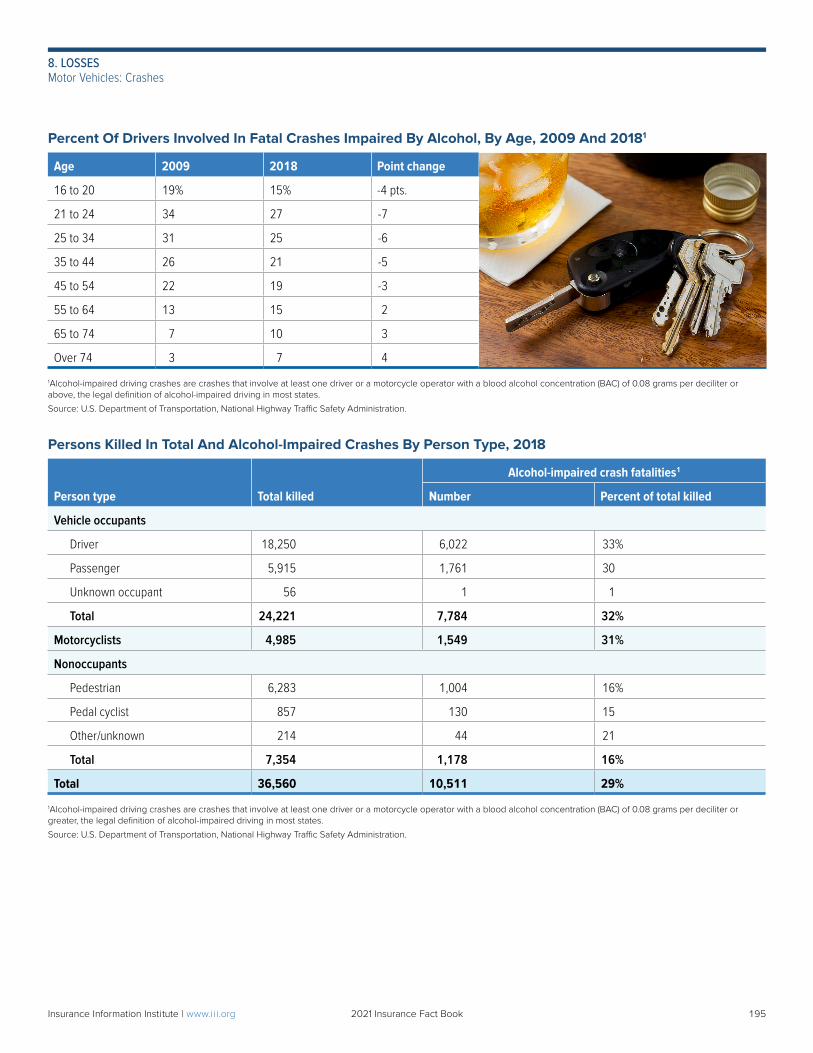
Percent Of Drivers Involved In Fatal Crashes Impaired By Alcohol, By Age, 2009 And 20181
Age 2009 2018 Point change
16 to 20 19% 15% -4 pts.
21 to 24 34 27 -7
25 to 34 31 25 -6
35 to 44 26 21 -5
45 to 54 22 19 -3
55 to 64 13 15 2
65 to 74 7 10 3
Over 74 3 7 4
1Alcohol-impaired driving crashes are crashes that involve at least one driver or a motorcycle operator with a blood alcohol concentration (BAC) of 0.08 grams per deciliter or above, the legal definition of alcohol-impaired driving in most states.
Source: U.S. Department of Transportation, National Highway Traffic Safety Administration.
Persons Killed In Total And Alcohol-Impaired Crashes By Person Type, 2018
Person type Total killed
Alcohol-impaired crash fatalities1
Number Percent of total killed
Vehicle occupants
Driver 18,250 6,022 33%
Passenger 5,915 1,761 30
Unknown occupant 56 1 1
Total 24,221 7,784 32%
Motorcyclists 4,985 1,549 31%
Nonoccupants
Pedestrian 6,283 1,004 16%
Pedal cyclist 857 130 15
Other/unknown 214 44 21
Total 7,354 1,178 16%
Total 36,560 10,511 29%
1Alcohol-impaired driving crashes are crashes that involve at least one driver or a motorcycle operator with a blood alcohol concentration (BAC) of 0.08 grams per deciliter or greater, the legal definition of alcohol-impaired driving in most states.
Source: U.S. Department of Transportation, National Highway Traffic Safety Administration.
195Insurance Information Institute | www.ii i.org 2021 Insurance Fact Book 195
8. LOSSESMotor Vehicles: Crashes
Marijuana and impaired drivingMarijuana intoxication can cause impaired driving, thereby increasing the risk of crashes. Marijuana is prohibited under the Controlled Substances Act of 1970 (CSA), which established a schedule for substances regulated under federal law. Despite the regulation of marijuana under federal law, in 1996 California became the first state in the U.S. to pass legislation permitting a medical marijuana program. Since then, about 36 states and the District of Columbia have passed legislation permitting comprehensive medical marijuana programs for qualifying patients to access marijuana and marijuana-related products. Since 2012 about 15 states and the District of Columbia have passed legislation permitting anyone over the age of 21 to possess and use marijuana, subject to certain limita-tions. Most of those states also have or are developing regulations for a commercial market to support recreational marijuana sales. Marijuana legalization is associated with an increase in impaired driving, increasing the risk of traffic crashes, although the magnitude of the increased risk is still a matter of study. A review from the Wiley Researcher Academy found evidence that 20 to 30 percent of crashes known to involve marijuana use occurred because of the marijuana use. This compares to roughly 85 percent of crashes that occurred because of alcohol use. The review estimated that the crash risk increased 22 percent while under the influence of marijuana, controlling for concurrent alcohol use. Another review found that someone driving under the influence of marijuana is 1.65 times more likely to be culpable as the cause in a fatal crash. Compared with marijuana, determining alcohol intoxication is relatively straightforward. Alcohol is processed at a rate that allows blood alcohol concentration (BAC) to correlate closely to intoxication, making it an effective and accurate benchmark for measuring impairment. Unlike alcohol, THC (the active chemical that induces user intoxication from marijuana) levels in a user’s body may not be an accurate indication of impairment. Moreover, THC is processed differently from alcohol. The AAA Foundation for Traffic Safety noted that THC can remain in a user’s body for weeks after marijuana is consumed. THC levels spike immediately after consumption but decline to low levels very quickly– long before impairment ends. It is therefore not currently possible to determine accurately when a user consumed marijuana based on the THC levels in their body, and THC detection in a user post-crash does not necessarily mean that marijuana impairment contributed to a traffic crash. Currently there is no agreed-upon impairment limit above which an individual is indisputably impaired and no breathalyzer-equivalent for marijuana impairment. (For more, please see Triple-I’s Background on Marijuana and Impaired Driving.) However, research does conclude that highway crashes have risen in states with legalized recreational use marijuana laws. In 2017 the Highway Loss Data Institute (HLDI) released an analysis of insurance losses in Colorado, Oregon and Washington that found that legalizing recreational marijuana use in the three states was associated with a combined 2.7 percent increase in the frequency of collision claims per insured vehicle year, relative to nearby control states without legalized recreational marijuana. In a 2018 report, HLDI estimates that the frequency of collision claims rose a combined 6 percent following the introduction of retail sales of recreational marijuana in Colorado, Nevada, Oregon and Washington, compared with the control states of Idaho, Montana, Utah and Wyoming. An Insurance Institute for Highway Safety (I IHS) 2018 study examined police-reported crashes from 2012 to 2016 before and after retail sales began in Colorado, Oregon and Washington. IIHS estimates that the three states combined saw a 5.2 percent increase in the rate of crashes per million vehicle registrations, compared with neighboring states that did not legalize marijuana sales. According to the IIHS, the 5.2 percent increase in police-reported crash rates following legalization of recreational marijuana use is consistent with the 6 percent increase in insurance claim rates estimated
196Insurance Information Institute | www.ii i.org 2021 Insurance Fact Book 196
8. LOSSESMotor Vehicles: Crashes
by HLDI. A 2020 study by the AAA Foundation for Traffic Safety shows that the percentage of drivers in Washington involved in fatal crashes who tested positive for marijuana increased 100 percent after the state made the drug legal for recreational use. Jacob Nelson, director of safety at AAA, said that it is reasonable to assume that more fatal crashes will involve drivers who test positive for THC but the organization’s officials acknowledge that the study found a correlation, however not a causative link. Studies involving recreational marijuana laws and their effect on motor vehicle fatalities are inconclusive. The Journal of the American Medical Association’s Internal Medicine published the results of two studies in June 2020. The first report studied changes in fatalities from 2014 to 2017 in Colorado and Washington State after recreational marijuana laws went into effect. Researchers found that fatalities in Colorado were higher by an average of 75 per year but had not risen in Washington. While the researchers noted that factors such as the availability of recreational cannabis stores, out-of-state cannabis tourism, and local factors in part may explain differing state results, further study is needed that incorporates the identification of policies and enforcement strategies to decrease fatalities. The second study included data from the first four states to legalize recreational marijuana—Colorado, Washington, Oregon and Alaska and concluded that legalization of recreational marijuana is associated with increased traffic fatality rates. Applying their results to national driving statistics, researchers found that nationwide legalization would be associated with 6,800 excess roadway deaths each year. The study used fatality data from 2016 to 2018, when marijuana was available commercially in the four states. A study published in the journal Drug and Alcohol Dependence suggests that chronic, heavy use of recreational marijuana impairs driving skills even when the driver is not high. The researchers used a driving simulator to evaluate the potential impact of cannabis use on driving performance. The study concluded that driving impairment was signifi-cantly worse among the study participants who began using marijuana regularly before age 16. The study, conducted by researchers at Harvard Medical School’s McLean Hospital, found that cannabis users hit more pedestrians, exceed-ed the speed limit more often, and drove through more red lights compared with non-users. At the time of the study, the marijuana users had not used for at least 12 hours and were not intoxicated.
Aggressive DrivingAggressive driving is a major factor in U.S. traffic crashes, playing a role not just in road rage but in a large number of fatal highway col-lisions each year. The National Highway Traffic Safety Administration (NHTSA) defines aggressive driving as occurring when “an individual commits a combination of moving traffic offenses so as to endanger other persons or property.” While aggressive driving is difficult to quantify, a 2009 study by the American Automobile Association reported that based on data tracked by NHTSA’s Fatal Accident Reporting System, aggressive driving played a role in 56 percent of fatal crashes from 2003 through 2007, with excessive speed
being the No. 1 factor. Speeding was also the leading driving behavior associated with fatal crashes in 2018 (almost 17 percent), followed by driving under the influence (10 percent), according to NHTSA. (See chart on p. 193, Driving Behaviors Reported For Drivers and Motorcycle Operators Involved In Fatal Crashes, 2018).
197Insurance Information Institute | www.ii i.org 2021 Insurance Fact Book 197
8. LOSSESMotor Vehicles: Crashes
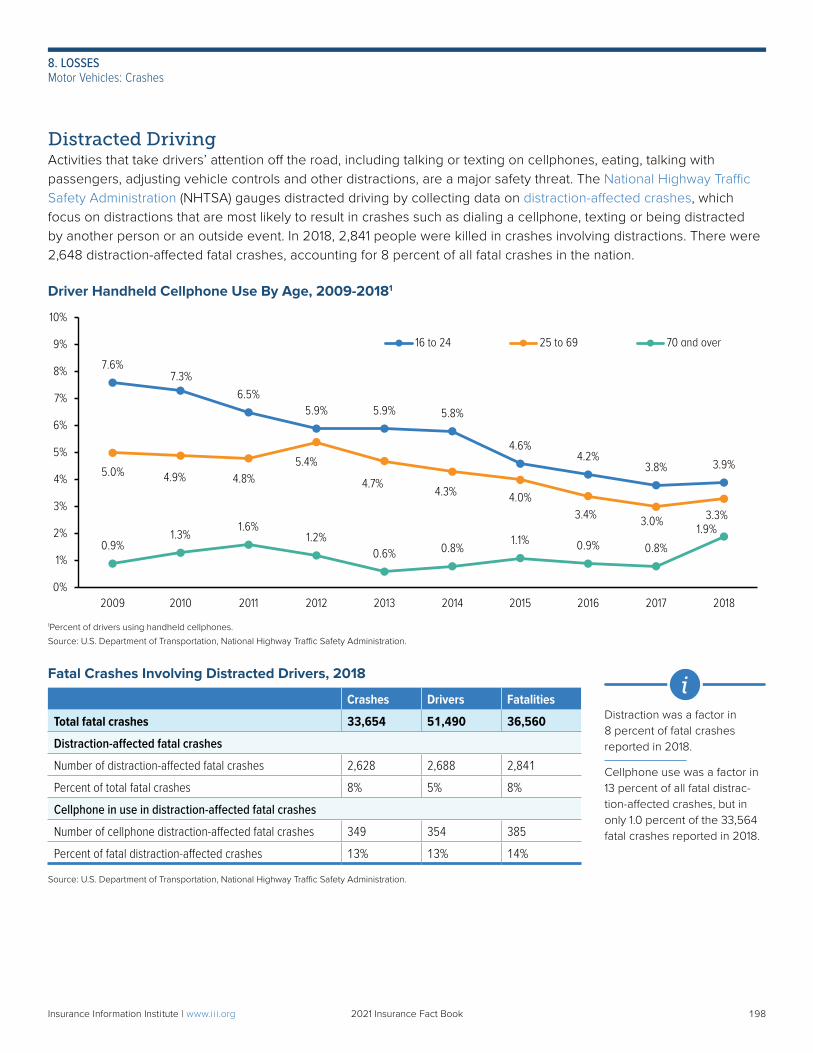
Distracted DrivingActivities that take drivers’ attention off the road, including talking or texting on cellphones, eating, talking with passengers, adjusting vehicle controls and other distractions, are a major safety threat. The National Highway Traffic Safety Administration (NHTSA) gauges distracted driving by collecting data on distraction-affected crashes, which focus on distractions that are most likely to result in crashes such as dialing a cellphone, texting or being distracted by another person or an outside event. In 2018, 2,841 people were killed in crashes involving distractions. There were 2,648 distraction-affected fatal crashes, accounting for 8 percent of all fatal crashes in the nation.
Driver Handheld Cellphone Use By Age, 2009-20181
7.6%7.3%
6.5%5.9% 5.9% 5.8%
4.6%4.2%
3.8% 3.9%5.0% 4.9% 4.8%
5.4%
4.7%4.3% 4.0%
3.4% 3.0% 3.3%
0.9%1.3%
1.6%1.2%
0.6% 0.8%1.1% 0.9% 0.8%
1.9%
0%
1%
2%
3%
4%
5%
6%
7%
8%
9%
10%
2009 2010 2011 2012 2013 2014 2015 2016 2017 2018
16 to 24 25 to 69 70 and over
1Percent of drivers using handheld cellphones.
Source: U.S. Department of Transportation, National Highway Traffic Safety Administration.
Fatal Crashes Involving Distracted Drivers, 2018
Crashes Drivers Fatalities
Total fatal crashes 33,654 51,490 36,560
Distraction-affected fatal crashes
Number of distraction-affected fatal crashes 2,628 2,688 2,841
Percent of total fatal crashes 8% 5% 8%
Cellphone in use in distraction-affected fatal crashes
Number of cellphone distraction-affected fatal crashes 349 354 385
Percent of fatal distraction-affected crashes 13% 13% 14%
Source: U.S. Department of Transportation, National Highway Traffic Safety Administration.
iDistraction was a factor in 8 percent of fatal crashes reported in 2018.
Cellphone use was a factor in 13 percent of all fatal distrac-tion-affected crashes, but in only 1.0 percent of the 33,564 fatal crashes reported in 2018.
198Insurance Information Institute | www.ii i.org 2021 Insurance Fact Book 198
8. LOSSESMotor Vehicles: Crashes
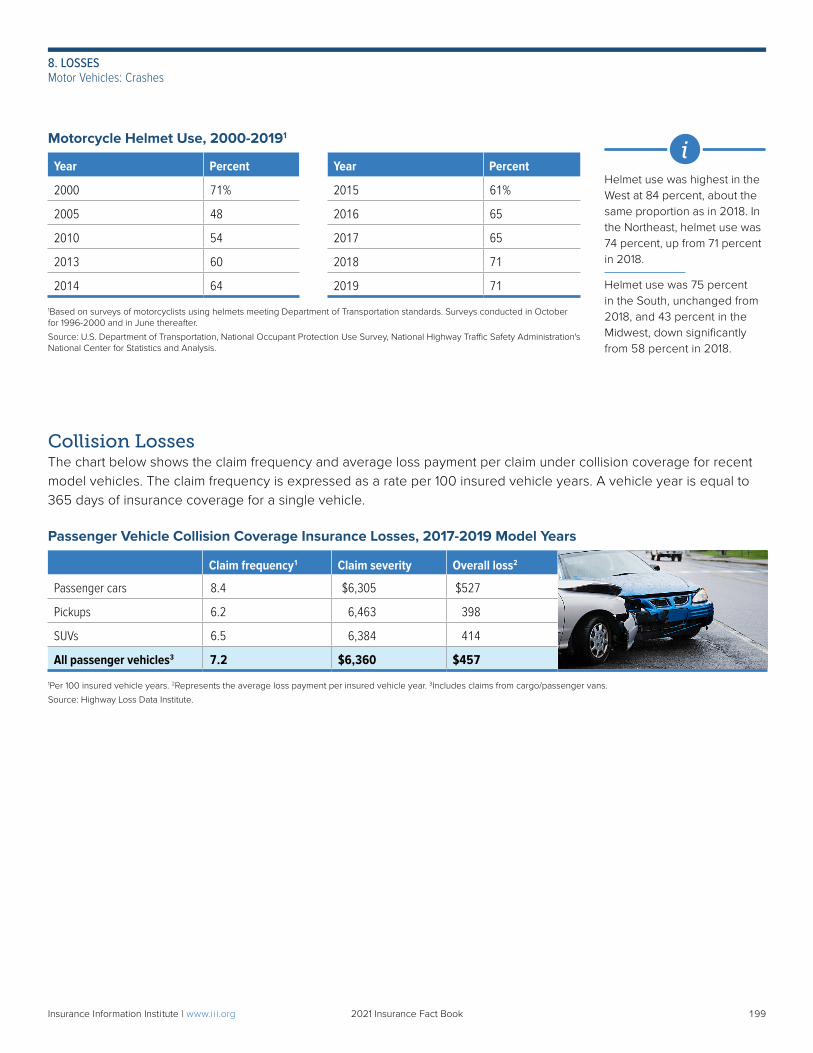
Motorcycle Helmet Use, 2000-20191
Year Percent Year Percent
2000 71% 2015 61%
2005 48 2016 65
2010 54 2017 65
2013 60 2018 71
2014 64 2019 71
1Based on surveys of motorcyclists using helmets meeting Department of Transportation standards. Surveys conducted in October for 1996-2000 and in June thereafter.
Source: U.S. Department of Transportation, National Occupant Protection Use Survey, National Highway Traffic Safety Administration's National Center for Statistics and Analysis.
Collision LossesThe chart below shows the claim frequency and average loss payment per claim under collision coverage for recent model vehicles. The claim frequency is expressed as a rate per 100 insured vehicle years. A vehicle year is equal to 365 days of insurance coverage for a single vehicle.
Passenger Vehicle Collision Coverage Insurance Losses, 2017-2019 Model Years
Claim frequency1 Claim severity Overall loss2
Passenger cars 8.4 $6,305 $527
Pickups 6.2 6,463 398
SUVs 6.5 6,384 414
All passenger vehicles3 7.2 $6,360 $457
1Per 100 insured vehicle years. 2Represents the average loss payment per insured vehicle year. 3Includes claims from cargo/passenger vans.
Source: Highway Loss Data Institute.
Helmet use was highest in the West at 84 percent, about the same proportion as in 2018. In the Northeast, helmet use was 74 percent, up from 71 percent in 2018.
Helmet use was 75 percent in the South, unchanged from 2018, and 43 percent in the Midwest, down significantly from 58 percent in 2018.
i
199Insurance Information Institute | www.ii i.org 2021 Insurance Fact Book 199
8. LOSSESMotor Vehicles: Crashes
MOTOR VEHICLES: THEFTThe FBI includes the theft or attempted theft of automobiles, trucks, buses, motorcycles, scooters, snowmobiles and other vehicles in its definition of motor vehicle theft. About $6.4 billion was lost to motor vehicle theft in 2019. The average dollar loss per theft was $8,886. Motor vehicles were stolen at a rate of 219.9 per 100,000 people in 2019, down from 230.2 in 2018. In 2019, 721,885 vehicles were stolen, down 4.0 percent from 751,885 vehicles in 2018.
Motor Vehicle Theft, 2010-2019
Year Vehicles stolen Percent change Year Vehicles stolen Percent change
2010 739,565 -7.0% 2015 713,063 3.8%
2011 716,508 -3.1 2016 767,290 7.6
2012 723,186 0.9 2017 772,943 0.7
2013 700,288 -3.2 2018 751,904 -2.7
2014 686,803 -1.9 2019 721,885 -4.0
Source: U.S. Department of Justice, Federal Bureau of Investigation, Uniform Crime Reports.
Top 10 U.S. Metropolitan Statistical Areas By Motor Vehicle Theft Rate, 2019
Rank Metropolitan Statistical Area1 Vehicles stolen Rate2
1 Bakersfield, CA 6,538 726.28
2 Albuquerque, NM 6,399 697.05
3 St. Joseph, MO-KS 770 614.90
4 Modesto, CA 3,156 573.13
5 Odessa, TX 946 569.11
6 Topeka, KS 1,293 557.40
7 Yuba City, CA 959 546.01
8 Merced, CA 1,483 534.07
9 Yakima, WA 1,325 528.16
10 Springfield, MO 2,420 514.57
1Metropolitan Statistical Areas are designated by the federal Office of Management and Budget and usually include areas much larger than the cities for which they are named. 2Rate of vehicle thefts reported per 100,000 people based on the 2019 U.S. Census Population Estimates.
Source: National Insurance Crime Bureau.
Four of the top U.S. Metropolitan Statistical Area for motor vehicle theft by theft rates were in California in 2019. The other six were Kansas, Missouri, New Mexico, Texas and Washington.
i
200Insurance Information Institute | www.ii i.org 2021 Insurance Fact Book 200
8. LOSSESMotor Vehicles: Theft
Top 10 States With The Most And The Fewest Number Of Motor Vehicle Thefts, 2019
Most motor vehicle thefts Fewest motor vehicle thefts
Rank State Vehicles stolen Rank State Vehicles stolen
1 California 141,757 1 Vermont 298
2 Texas 77,489 2 Wyoming 713
3 Florida 39,048 3 Maine 726
4 Washington 24,402 4 New Hampshire 893
5 Georgia 23,776 5 Rhode Island 1,358
6 Colorado 22,113 6 Idaho 1,571
7 Missouri 21,072 7 Delaware 1,604
8 Tennessee 19,180 8 South Dakota 1,756
9 Illinois 18,775 9 North Dakota 1,792
10 Ohio 18,672 10 D.C. 2,333
Source: U.S. Department of Justice, Federal Bureau of Investigation, Uniform Crime Reports.
Top 10 Most Frequently Stolen Vehicles, 2019
All model years1 2019 model year vehicles only
Rank Model Thefts Rank Model Thefts
1 Ford Pickup (Full size) 38,938 1 Ford Pick-Up (Full size) 1,767
2 Honda Civic 33,220 2 Ram Pick-Up (Full size) 1,547
3 Chevrolet Pickup (Full size) 32,583 3 Jeep Cherokee/Grand Cherokee 1,110
4 Honda Accord 30,745 4 Nissan Sentra 959
5 Toyota Camry 15,656 5 Dodge Charger 888
6 Nissan Altima 13,355 6 Nissan Altima 863
7 Toyota Corolla 12,137 7 Toyota Camry 770
8 Dodge Pickup (Full size) 11,292 8 Toyota Corolla 758
9 GMC Pickup (Full size) 11,164 9 Ford Transit 744
10 Honda CR-V 10,094 10 Dodge Challenger 689
1Includes all model years for each vehicle.
Source: National Insurance Crime Bureau.
201Insurance Information Institute | www.ii i.org 2021 Insurance Fact Book 201
8. LOSSESMotor Vehicles: Theft
RECREATIONWatercraft AccidentsFederal law requires owners of recreational boats and non-commercial watercraft to register them. In 2019 there were 11.9 million registered recreational watercraft, about the same as in 2018. A recreational watercraft accident must be reported to the U.S. Coast Guard: if a person dies or is injured and requires medical treatment beyond first aid; if damage to the boat or other property exceeds $2,000; if the boat is lost or if a person disappears from the boat. The U.S. Coast Guard says that alcohol, combined with typical conditions such as motion, vibration, engine noise, sun, wind and spray, can impair a person's abilities much faster than alcohol consumption on land. Operators with a blood alcohol concentration (BAC) above 0.10 grams per deciliter are estimated to be more than 10 times more likely to be killed in a watercraft accident than watercraft operators with zero BAC. Alcohol was a contributing factor in 330 recreational watercraft accidents in 2019 (7.9 percent of all accidents), accounting for 128 deaths (20.9 percent of all watercraft deaths) and 279 injuries (10.9 percent of all injuries). Other primary contributing factors were operator inexperience, accounting for 39 deaths, and operator inattention, resulting in 36 deaths.
Recreational Watercraft Accidents, 2015-20191
Accidents Fatalities
Injuries
Property damage ($ millions)Year Total
Involving alcohol use2 Total
Involving alcohol use2
2015 4,158 306 626 122 2,613 $42
2016 4,463 350 701 133 2,903 49
2017 4,291 323 658 118 2,629 46
2018 4,145 309 633 119 2,511 46
2019 4,168 330 613 128 2,559 55
1Includes accidents involving $2,000 or more in property damage. Includes U.S. territories and offshore accidents. 2The use of alcohol by a boat’s occupants was a direct or indirect cause of the accident.
Source: U.S. Department of Homeland Security, U.S. Coast Guard.
Top 10 States By Recreational Watercraft Accidents, 20191
Rank State Accidents Deaths People injuredProperty damage ($000)
1 Florida 679 62 421 $9,232
2 California 324 39 199 7,301
3 Texas 184 43 122 2,012
4 New York 165 17 119 5,615
5 Missouri 145 18 103 1,261
6 South Carolina 141 15 108 1,287
7 Maryland 130 16 101 866
8 Michigan 128 22 74 527
8 North Carolina 128 16 72 2,418
8 Ohio 128 13 61 2,516
1Includes accidents involving $2,000 or more in property damage. Includes watercraft such as motorboats and sailboats and other vessels such as Jet Skis.
Source: U.S. Department of Homeland Security, U.S. Coast Guard.
In 2019, 79 percent of fatal watercraft accident victims died by drowning, and of those, 86 percent were not wearing life jackets.
The most common types of watercraft involved in reported accidents in 2019 were open motorboats (45 percent), personal watercraft (such as Jet Skis, 19 percent) and cabin motorboats (16 percent).
i
202Insurance Information Institute | www.ii i.org 2021 Insurance Fact Book 202
8. LOSSESRecreation
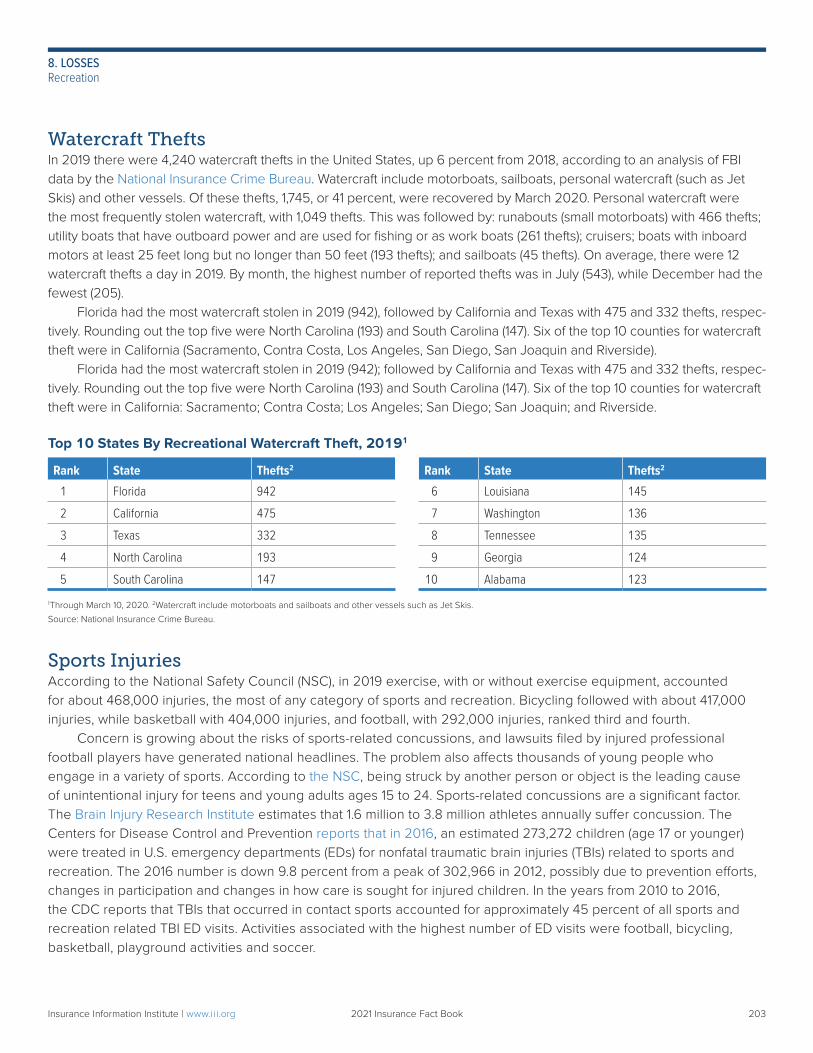
Watercraft TheftsIn 2019 there were 4,240 watercraft thefts in the United States, up 6 percent from 2018, according to an analysis of FBI data by the National Insurance Crime Bureau. Watercraft include motorboats, sailboats, personal watercraft (such as Jet Skis) and other vessels. Of these thefts, 1,745, or 41 percent, were recovered by March 2020. Personal watercraft were the most frequently stolen watercraft, with 1,049 thefts. This was followed by: runabouts (small motorboats) with 466 thefts; utility boats that have outboard power and are used for fishing or as work boats (261 thefts); cruisers; boats with inboard motors at least 25 feet long but no longer than 50 feet (193 thefts); and sailboats (45 thefts). On average, there were 12 watercraft thefts a day in 2019. By month, the highest number of reported thefts was in July (543), while December had the fewest (205). Florida had the most watercraft stolen in 2019 (942), followed by California and Texas with 475 and 332 thefts, respec-tively. Rounding out the top five were North Carolina (193) and South Carolina (147). Six of the top 10 counties for watercraft theft were in California (Sacramento, Contra Costa, Los Angeles, San Diego, San Joaquin and Riverside). Florida had the most watercraft stolen in 2019 (942); followed by California and Texas with 475 and 332 thefts, respec-tively. Rounding out the top five were North Carolina (193) and South Carolina (147). Six of the top 10 counties for watercraft theft were in California: Sacramento; Contra Costa; Los Angeles; San Diego; San Joaquin; and Riverside.
Top 10 States By Recreational Watercraft Theft, 20191
Rank State Thefts2 Rank State Thefts2
1 Florida 942 6 Louisiana 145
2 California 475 7 Washington 136
3 Texas 332 8 Tennessee 135
4 North Carolina 193 9 Georgia 124
5 South Carolina 147 10 Alabama 123
1Through March 10, 2020. 2Watercraft include motorboats and sailboats and other vessels such as Jet Skis.
Source: National Insurance Crime Bureau.
Sports InjuriesAccording to the National Safety Council (NSC), in 2019 exercise, with or without exercise equipment, accounted for about 468,000 injuries, the most of any category of sports and recreation. Bicycling followed with about 417,000 injuries, while basketball with 404,000 injuries, and football, with 292,000 injuries, ranked third and fourth. Concern is growing about the risks of sports-related concussions, and lawsuits filed by injured professional football players have generated national headlines. The problem also affects thousands of young people who engage in a variety of sports. According to the NSC, being struck by another person or object is the leading cause of unintentional injury for teens and young adults ages 15 to 24. Sports-related concussions are a significant factor. The Brain Injury Research Institute estimates that 1.6 million to 3.8 million athletes annually suffer concussion. The Centers for Disease Control and Prevention reports that in 2016, an estimated 273,272 children (age 17 or younger) were treated in U.S. emergency departments (EDs) for nonfatal traumatic brain injuries (TBIs) related to sports and recreation. The 2016 number is down 9.8 percent from a peak of 302,966 in 2012, possibly due to prevention efforts, changes in participation and changes in how care is sought for injured children. In the years from 2010 to 2016, the CDC reports that TBIs that occurred in contact sports accounted for approximately 45 percent of all sports and recreation related TBI ED visits. Activities associated with the highest number of ED visits were football, bicycling, basketball, playground activities and soccer.
203Insurance Information Institute | www.ii i.org 2021 Insurance Fact Book 203
8. LOSSESRecreation
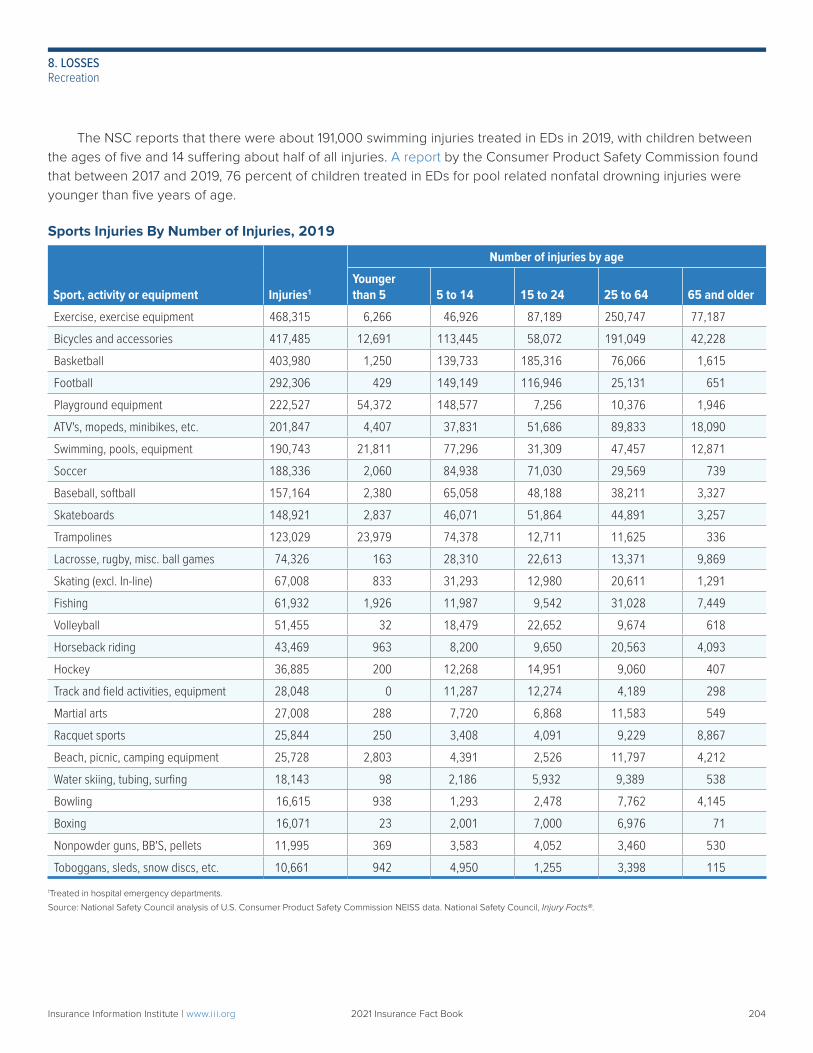
The NSC reports that there were about 191,000 swimming injuries treated in EDs in 2019, with children between the ages of five and 14 suffering about half of all injuries. A report by the Consumer Product Safety Commission found that between 2017 and 2019, 76 percent of children treated in EDs for pool related nonfatal drowning injuries were younger than five years of age.
Sports Injuries By Number of Injuries, 2019
Sport, activity or equipment Injuries1
Number of injuries by age
Younger than 5 5 to 14 15 to 24 25 to 64 65 and older
Exercise, exercise equipment 468,315 6,266 46,926 87,189 250,747 77,187
Bicycles and accessories 417,485 12,691 113,445 58,072 191,049 42,228
Basketball 403,980 1,250 139,733 185,316 76,066 1,615
Football 292,306 429 149,149 116,946 25,131 651
Playground equipment 222,527 54,372 148,577 7,256 10,376 1,946
ATV's, mopeds, minibikes, etc. 201,847 4,407 37,831 51,686 89,833 18,090
Swimming, pools, equipment 190,743 21,811 77,296 31,309 47,457 12,871
Soccer 188,336 2,060 84,938 71,030 29,569 739
Baseball, softball 157,164 2,380 65,058 48,188 38,211 3,327
Skateboards 148,921 2,837 46,071 51,864 44,891 3,257
Trampolines 123,029 23,979 74,378 12,711 11,625 336
Lacrosse, rugby, misc. ball games 74,326 163 28,310 22,613 13,371 9,869
Skating (excl. In-line) 67,008 833 31,293 12,980 20,611 1,291
Fishing 61,932 1,926 11,987 9,542 31,028 7,449
Volleyball 51,455 32 18,479 22,652 9,674 618
Horseback riding 43,469 963 8,200 9,650 20,563 4,093
Hockey 36,885 200 12,268 14,951 9,060 407
Track and field activities, equipment 28,048 0 11,287 12,274 4,189 298
Martial arts 27,008 288 7,720 6,868 11,583 549
Racquet sports 25,844 250 3,408 4,091 9,229 8,867
Beach, picnic, camping equipment 25,728 2,803 4,391 2,526 11,797 4,212
Water skiing, tubing, surfing 18,143 98 2,186 5,932 9,389 538
Bowling 16,615 938 1,293 2,478 7,762 4,145
Boxing 16,071 23 2,001 7,000 6,976 71
Nonpowder guns, BB'S, pellets 11,995 369 3,583 4,052 3,460 530
Toboggans, sleds, snow discs, etc. 10,661 942 4,950 1,255 3,398 115
1Treated in hospital emergency departments.
Source: National Safety Council analysis of U.S. Consumer Product Safety Commission NEISS data. National Safety Council, Injury Facts®.
204Insurance Information Institute | www.ii i.org 2021 Insurance Fact Book 204
8. LOSSESRecreation
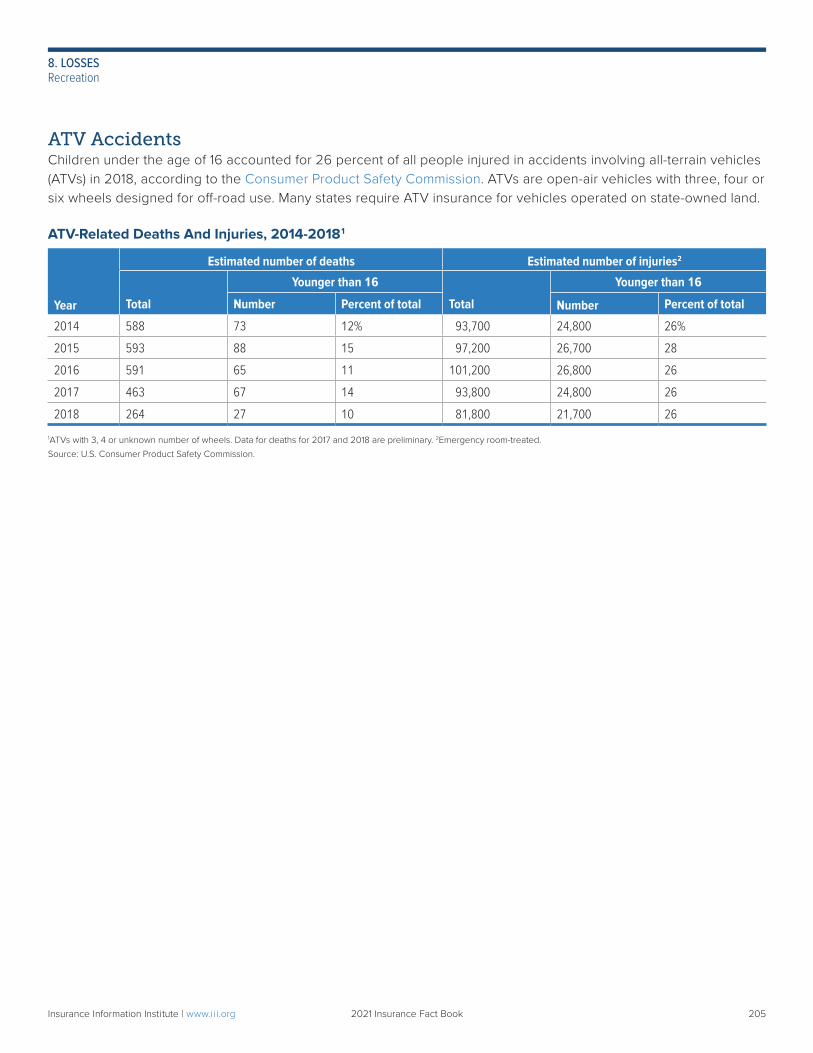
ATV AccidentsChildren under the age of 16 accounted for 26 percent of all people injured in accidents involving all-terrain vehicles (ATVs) in 2018, according to the Consumer Product Safety Commission. ATVs are open-air vehicles with three, four or six wheels designed for off-road use. Many states require ATV insurance for vehicles operated on state-owned land.
ATV-Related Deaths And Injuries, 2014-20181
Estimated number of deaths Estimated number of injuries2
Year Total
Younger than 16
Total
Younger than 16
Number Percent of total Number Percent of total
2014 588 73 12% 93,700 24,800 26%
2015 593 88 15 97,200 26,700 28
2016 591 65 11 101,200 26,800 26
2017 463 67 14 93,800 24,800 26
2018 264 27 10 81,800 21,700 26
1ATVs with 3, 4 or unknown number of wheels. Data for deaths for 2017 and 2018 are preliminary. 2Emergency room-treated.
Source: U.S. Consumer Product Safety Commission.
205Insurance Information Institute | www.ii i.org 2021 Insurance Fact Book 205
8. LOSSESRecreation
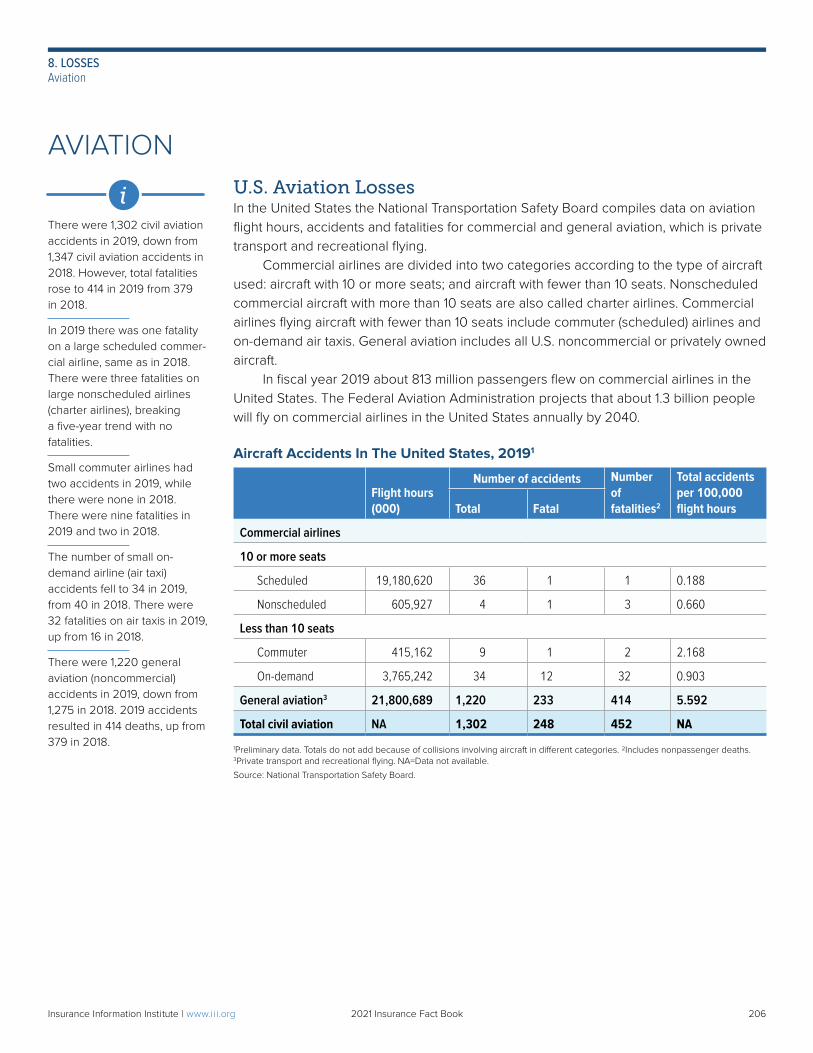
AVIATIONU.S. Aviation LossesIn the United States the National Transportation Safety Board compiles data on aviation flight hours, accidents and fatalities for commercial and general aviation, which is private transport and recreational flying. Commercial airlines are divided into two categories according to the type of aircraft used: aircraft with 10 or more seats; and aircraft with fewer than 10 seats. Nonscheduled commercial aircraft with more than 10 seats are also called charter airlines. Commercial airlines flying aircraft with fewer than 10 seats include commuter (scheduled) airlines and on-demand air taxis. General aviation includes all U.S. noncommercial or privately owned aircraft. In fiscal year 2019 about 813 million passengers flew on commercial airlines in the United States. The Federal Aviation Administration projects that about 1.3 billion people will fly on commercial airlines in the United States annually by 2040.
Aircraft Accidents In The United States, 20191
Flight hours (000)
Number of accidents Number of fatalities2
Total accidents per 100,000 flight hoursTotal Fatal
Commercial airlines
10 or more seats
Scheduled 19,180,620 36 1 1 0.188
Nonscheduled 605,927 4 1 3 0.660
Less than 10 seats
Commuter 415,162 9 1 2 2.168
On-demand 3,765,242 34 12 32 0.903
General aviation3 21,800,689 1,220 233 414 5.592
Total civil aviation NA 1,302 248 452 NA
1Preliminary data. Totals do not add because of collisions involving aircraft in different categories. 2Includes nonpassenger deaths. 3Private transport and recreational flying. NA=Data not available.
Source: National Transportation Safety Board.
There were 1,302 civil aviation accidents in 2019, down from 1,347 civil aviation accidents in 2018. However, total fatalities rose to 414 in 2019 from 379 in 2018.
In 2019 there was one fatality on a large scheduled commer-cial airline, same as in 2018. There were three fatalities on large nonscheduled airlines (charter airlines), breaking a five-year trend with no fatalities.
Small commuter airlines had two accidents in 2019, while there were none in 2018. There were nine fatalities in 2019 and two in 2018.
The number of small on- demand airline (air taxi) accidents fell to 34 in 2019, from 40 in 2018. There were 32 fatalities on air taxis in 2019, up from 16 in 2018.
There were 1,220 general aviation (noncommercial) accidents in 2019, down from 1,275 in 2018. 2019 accidents resulted in 414 deaths, up from 379 in 2018.
i
206Insurance Information Institute | www.ii i.org 2021 Insurance Fact Book 206
8. LOSSESAviation
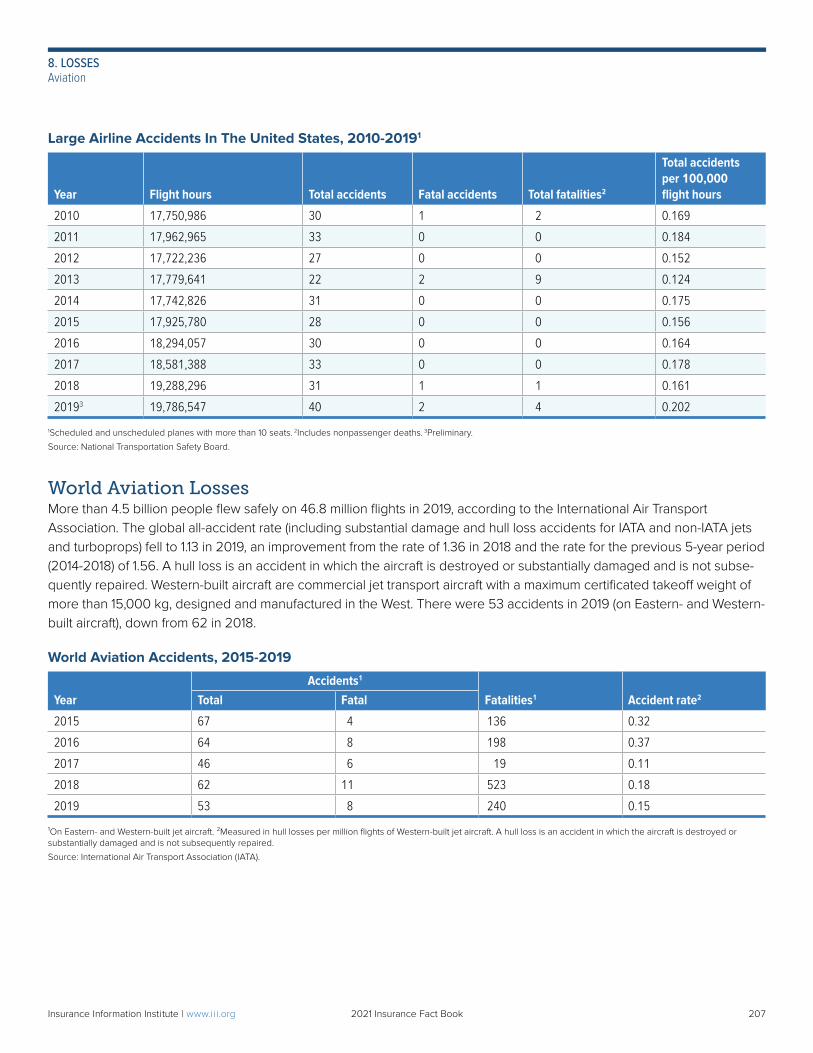
Large Airline Accidents In The United States, 2010-20191
Year Flight hours Total accidents Fatal accidents Total fatalities2
Total accidents per 100,000 flight hours
2010 17,750,986 30 1 2 0.169
2011 17,962,965 33 0 0 0.184
2012 17,722,236 27 0 0 0.152
2013 17,779,641 22 2 9 0.124
2014 17,742,826 31 0 0 0.175
2015 17,925,780 28 0 0 0.156
2016 18,294,057 30 0 0 0.164
2017 18,581,388 33 0 0 0.178
2018 19,288,296 31 1 1 0.161
20193 19,786,547 40 2 4 0.202
1Scheduled and unscheduled planes with more than 10 seats. 2Includes nonpassenger deaths. 3Preliminary.
Source: National Transportation Safety Board.
World Aviation LossesMore than 4.5 billion people flew safely on 46.8 million flights in 2019, according to the International Air Transport Association. The global all-accident rate (including substantial damage and hull loss accidents for IATA and non-IATA jets and turboprops) fell to 1.13 in 2019, an improvement from the rate of 1.36 in 2018 and the rate for the previous 5-year period (2014-2018) of 1.56. A hull loss is an accident in which the aircraft is destroyed or substantially damaged and is not subse-quently repaired. Western-built aircraft are commercial jet transport aircraft with a maximum certificated takeoff weight of more than 15,000 kg, designed and manufactured in the West. There were 53 accidents in 2019 (on Eastern- and Western-built aircraft), down from 62 in 2018.
World Aviation Accidents, 2015-2019
YearAccidents1
Fatalities1 Accident rate2Total Fatal
2015 67 4 136 0.32
2016 64 8 198 0.37
2017 46 6 19 0.11
2018 62 11 523 0.18
2019 53 8 240 0.15
¹On Eastern- and Western-built jet aircraft. ²Measured in hull losses per million flights of Western-built jet aircraft. A hull loss is an accident in which the aircraft is destroyed or substantially damaged and is not subsequently repaired.
Source: International Air Transport Association (IATA).
207Insurance Information Institute | www.ii i.org 2021 Insurance Fact Book 207
8. LOSSESAviation
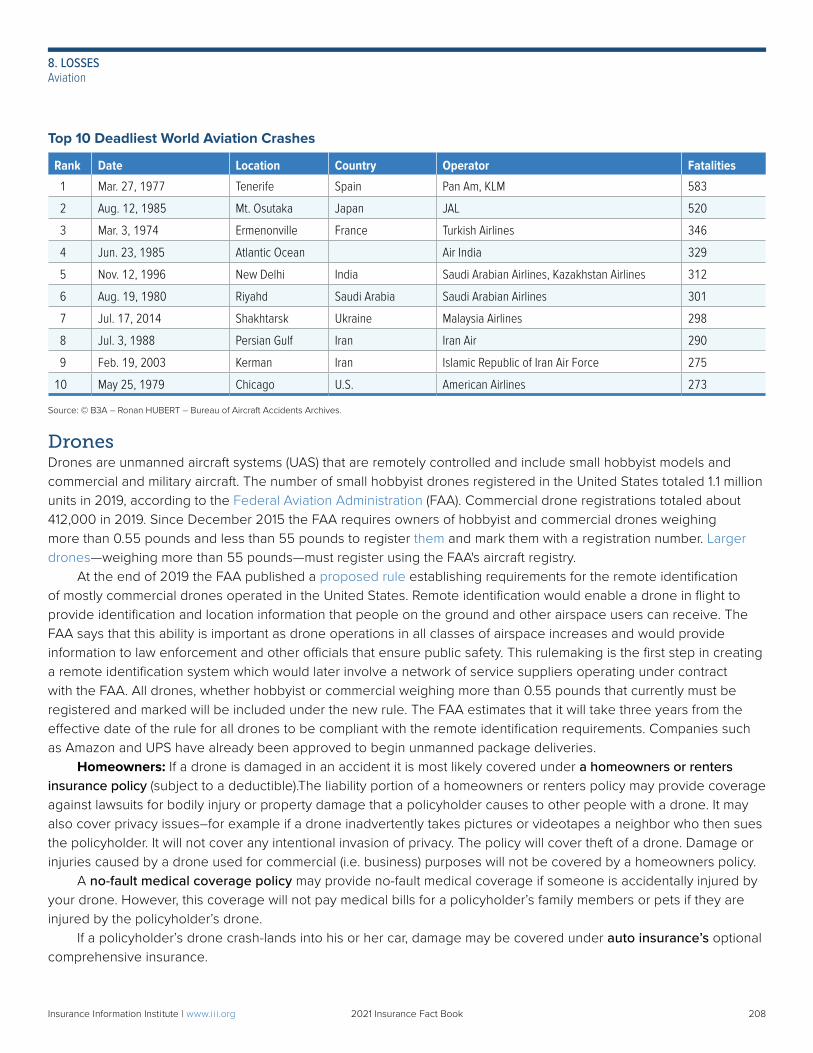
Top 10 Deadliest World Aviation Crashes
Rank Date Location Country Operator Fatalities
1 Mar. 27, 1977 Tenerife Spain Pan Am, KLM 583
2 Aug. 12, 1985 Mt. Osutaka Japan JAL 520
3 Mar. 3, 1974 Ermenonville France Turkish Airlines 346
4 Jun. 23, 1985 Atlantic Ocean Air India 329
5 Nov. 12, 1996 New Delhi India Saudi Arabian Airlines, Kazakhstan Airlines 312
6 Aug. 19, 1980 Riyahd Saudi Arabia Saudi Arabian Airlines 301
7 Jul. 17, 2014 Shakhtarsk Ukraine Malaysia Airlines 298
8 Jul. 3, 1988 Persian Gulf Iran Iran Air 290
9 Feb. 19, 2003 Kerman Iran Islamic Republic of Iran Air Force 275
10 May 25, 1979 Chicago U.S. American Airlines 273
Source: © B3A – Ronan HUBERT – Bureau of Aircraft Accidents Archives.
DronesDrones are unmanned aircraft systems (UAS) that are remotely controlled and include small hobbyist models and commercial and military aircraft. The number of small hobbyist drones registered in the United States totaled 1.1 million units in 2019, according to the Federal Aviation Administration (FAA). Commercial drone registrations totaled about 412,000 in 2019. Since December 2015 the FAA requires owners of hobbyist and commercial drones weighing more than 0.55 pounds and less than 55 pounds to register them and mark them with a registration number. Larger drones—weighing more than 55 pounds—must register using the FAA's aircraft registry. At the end of 2019 the FAA published a proposed rule establishing requirements for the remote identification of mostly commercial drones operated in the United States. Remote identification would enable a drone in flight to provide identification and location information that people on the ground and other airspace users can receive. The FAA says that this ability is important as drone operations in all classes of airspace increases and would provide information to law enforcement and other officials that ensure public safety. This rulemaking is the first step in creating a remote identification system which would later involve a network of service suppliers operating under contract with the FAA. All drones, whether hobbyist or commercial weighing more than 0.55 pounds that currently must be registered and marked will be included under the new rule. The FAA estimates that it will take three years from the effective date of the rule for all drones to be compliant with the remote identification requirements. Companies such as Amazon and UPS have already been approved to begin unmanned package deliveries. Homeowners: If a drone is damaged in an accident it is most likely covered under a homeowners or renters insurance policy (subject to a deductible).The liability portion of a homeowners or renters policy may provide coverage against lawsuits for bodily injury or property damage that a policyholder causes to other people with a drone. It may also cover privacy issues–for example if a drone inadvertently takes pictures or videotapes a neighbor who then sues the policyholder. It will not cover any intentional invasion of privacy. The policy will cover theft of a drone. Damage or injuries caused by a drone used for commercial (i.e. business) purposes will not be covered by a homeowners policy. A no-fault medical coverage policy may provide no-fault medical coverage if someone is accidentally injured by your drone. However, this coverage will not pay medical bills for a policyholder’s family members or pets if they are injured by the policyholder’s drone. If a policyholder’s drone crash-lands into his or her car, damage may be covered under auto insurance’s optional comprehensive insurance.
208Insurance Information Institute | www.ii i.org 2021 Insurance Fact Book 208
8. LOSSESAviation
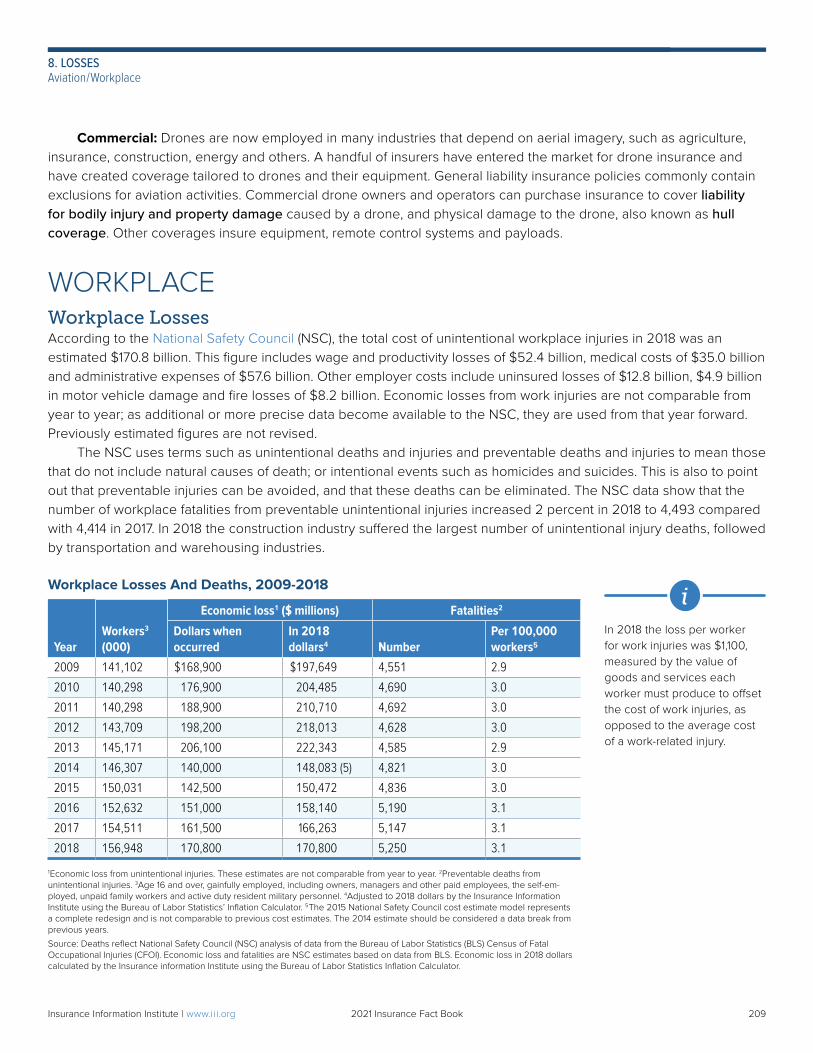
Commercial: Drones are now employed in many industries that depend on aerial imagery, such as agriculture, insurance, construction, energy and others. A handful of insurers have entered the market for drone insurance and have created coverage tailored to drones and their equipment. General liability insurance policies commonly contain exclusions for aviation activities. Commercial drone owners and operators can purchase insurance to cover liability for bodily injury and property damage caused by a drone, and physical damage to the drone, also known as hull coverage. Other coverages insure equipment, remote control systems and payloads.
WORKPLACEWorkplace LossesAccording to the National Safety Council (NSC), the total cost of unintentional workplace injuries in 2018 was an estimated $170.8 billion. This figure includes wage and productivity losses of $52.4 billion, medical costs of $35.0 billion and administrative expenses of $57.6 billion. Other employer costs include uninsured losses of $12.8 billion, $4.9 billion in motor vehicle damage and fire losses of $8.2 billion. Economic losses from work injuries are not comparable from year to year; as additional or more precise data become available to the NSC, they are used from that year forward. Previously estimated figures are not revised. The NSC uses terms such as unintentional deaths and injuries and preventable deaths and injuries to mean those that do not include natural causes of death; or intentional events such as homicides and suicides. This is also to point out that preventable injuries can be avoided, and that these deaths can be eliminated. The NSC data show that the number of workplace fatalities from preventable unintentional injuries increased 2 percent in 2018 to 4,493 compared with 4,414 in 2017. In 2018 the construction industry suffered the largest number of unintentional injury deaths, followed by transportation and warehousing industries.
Workplace Losses And Deaths, 2009-2018
YearWorkers3 (000)
Economic loss1 ($ millions) Fatalities2
Dollars when occurred
In 2018 dollars4 Number
Per 100,000 workers5
2009 141,102 $168,900 $197,649 4,551 2.9
2010 140,298 176,900 204,485 4,690 3.0
2011 140,298 188,900 210,710 4,692 3.0
2012 143,709 198,200 218,013 4,628 3.0
2013 145,171 206,100 222,343 4,585 2.9
2014 146,307 140,000 148,083 (5) 4,821 3.0
2015 150,031 142,500 150,472 4,836 3.0
2016 152,632 151,000 158,140 5,190 3.1
2017 154,511 161,500 166,263 5,147 3.1
2018 156,948 170,800 170,800 5,250 3.1
1Economic loss from unintentional injuries. These estimates are not comparable from year to year. 2Preventable deaths from unintentional injuries. 3Age 16 and over, gainfully employed, including owners, managers and other paid employees, the self-em-ployed, unpaid family workers and active duty resident military personnel. 4Adjusted to 2018 dollars by the Insurance Information Institute using the Bureau of Labor Statistics’ Inflation Calculator. 5The 2015 National Safety Council cost estimate model represents a complete redesign and is not comparable to previous cost estimates. The 2014 estimate should be considered a data break from previous years.
Source: Deaths reflect National Safety Council (NSC) analysis of data from the Bureau of Labor Statistics (BLS) Census of Fatal Occupational Injuries (CFOI). Economic loss and fatalities are NSC estimates based on data from BLS. Economic loss in 2018 dollars calculated by the Insurance information Institute using the Bureau of Labor Statistics Inflation Calculator.
In 2018 the loss per worker for work injuries was $1,100, measured by the value of goods and services each worker must produce to offset the cost of work injuries, as opposed to the average cost of a work-related injury.
i
209Insurance Information Institute | www.ii i.org 2021 Insurance Fact Book 209
8. LOSSESAviation/Workplace
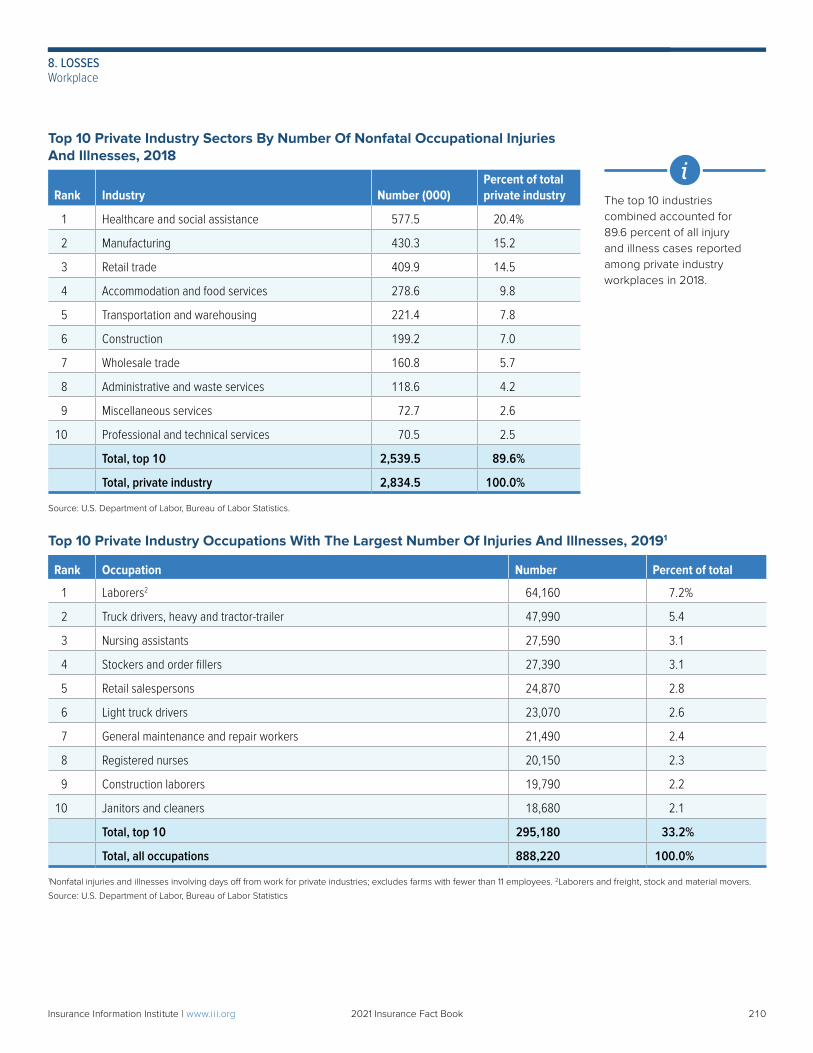
Top 10 Private Industry Sectors By Number Of Nonfatal Occupational Injuries And Illnesses, 2018
Rank Industry Number (000)Percent of total private industry
1 Healthcare and social assistance 577.5 20.4%
2 Manufacturing 430.3 15.2
3 Retail trade 409.9 14.5
4 Accommodation and food services 278.6 9.8
5 Transportation and warehousing 221.4 7.8
6 Construction 199.2 7.0
7 Wholesale trade 160.8 5.7
8 Administrative and waste services 118.6 4.2
9 Miscellaneous services 72.7 2.6
10 Professional and technical services 70.5 2.5
Total, top 10 2,539.5 89.6%
Total, private industry 2,834.5 100.0%
Source: U.S. Department of Labor, Bureau of Labor Statistics.
Top 10 Private Industry Occupations With The Largest Number Of Injuries And Illnesses, 20191
Rank Occupation Number Percent of total
1 Laborers2 64,160 7.2%
2 Truck drivers, heavy and tractor-trailer 47,990 5.4
3 Nursing assistants 27,590 3.1
4 Stockers and order fillers 27,390 3.1
5 Retail salespersons 24,870 2.8
6 Light truck drivers 23,070 2.6
7 General maintenance and repair workers 21,490 2.4
8 Registered nurses 20,150 2.3
9 Construction laborers 19,790 2.2
10 Janitors and cleaners 18,680 2.1
Total, top 10 295,180 33.2%
Total, all occupations 888,220 100.0%
1Nonfatal injuries and illnesses involving days off from work for private industries; excludes farms with fewer than 11 employees. 2Laborers and freight, stock and material movers.
Source: U.S. Department of Labor, Bureau of Labor Statistics
The top 10 industries combined accounted for 89.6 percent of all injury and illness cases reported among private industry workplaces in 2018.
i
210Insurance Information Institute | www.ii i.org 2021 Insurance Fact Book 210
8. LOSSESWorkplace
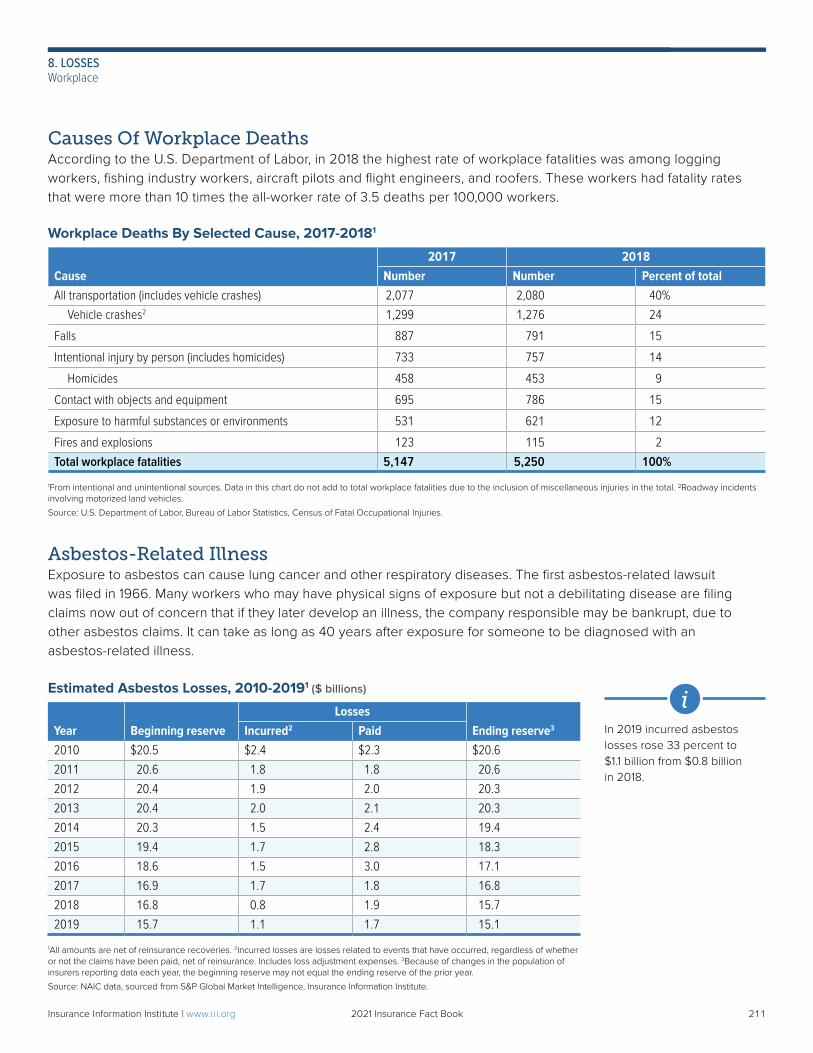
Causes Of Workplace DeathsAccording to the U.S. Department of Labor, in 2018 the highest rate of workplace fatalities was among logging workers, fishing industry workers, aircraft pilots and flight engineers, and roofers. These workers had fatality rates that were more than 10 times the all-worker rate of 3.5 deaths per 100,000 workers.
Workplace Deaths By Selected Cause, 2017-20181
Cause2017 2018
Number Number Percent of totalAll transportation (includes vehicle crashes) 2,077 2,080 40% Vehicle crashes2 1,299 1,276 24
Falls 887 791 15
Intentional injury by person (includes homicides) 733 757 14
Homicides 458 453 9
Contact with objects and equipment 695 786 15
Exposure to harmful substances or environments 531 621 12
Fires and explosions 123 115 2
Total workplace fatalities 5,147 5,250 100%
1From intentional and unintentional sources. Data in this chart do not add to total workplace fatalities due to the inclusion of miscellaneous injuries in the total. 2Roadway incidents involving motorized land vehicles.
Source: U.S. Department of Labor, Bureau of Labor Statistics, Census of Fatal Occupational Injuries.
Asbestos-Related IllnessExposure to asbestos can cause lung cancer and other respiratory diseases. The first asbestos-related lawsuit was filed in 1966. Many workers who may have physical signs of exposure but not a debilitating disease are filing claims now out of concern that if they later develop an illness, the company responsible may be bankrupt, due to other asbestos claims. It can take as long as 40 years after exposure for someone to be diagnosed with an asbestos-related illness.
Estimated Asbestos Losses, 2010-20191 ($ billions)
Year Beginning reserveLosses
Ending reserve3Incurred2 Paid2010 $20.5 $2.4 $2.3 $20.6
2011 20.6 1.8 1.8 20.6
2012 20.4 1.9 2.0 20.3
2013 20.4 2.0 2.1 20.3
2014 20.3 1.5 2.4 19.4
2015 19.4 1.7 2.8 18.3
2016 18.6 1.5 3.0 17.1
2017 16.9 1.7 1.8 16.8
2018 16.8 0.8 1.9 15.7
2019 15.7 1.1 1.7 15.1
1All amounts are net of reinsurance recoveries. 2Incurred losses are losses related to events that have occurred, regardless of whether or not the claims have been paid, net of reinsurance. Includes loss adjustment expenses. 3Because of changes in the population of insurers reporting data each year, the beginning reserve may not equal the ending reserve of the prior year.
Source: NAIC data, sourced from S&P Global Market Intelligence, Insurance Information Institute.
In 2019 incurred asbestos losses rose 33 percent to $1.1 billion from $0.8 billion in 2018.
i
211Insurance Information Institute | www.ii i.org 2021 Insurance Fact Book 211
8. LOSSESWorkplace
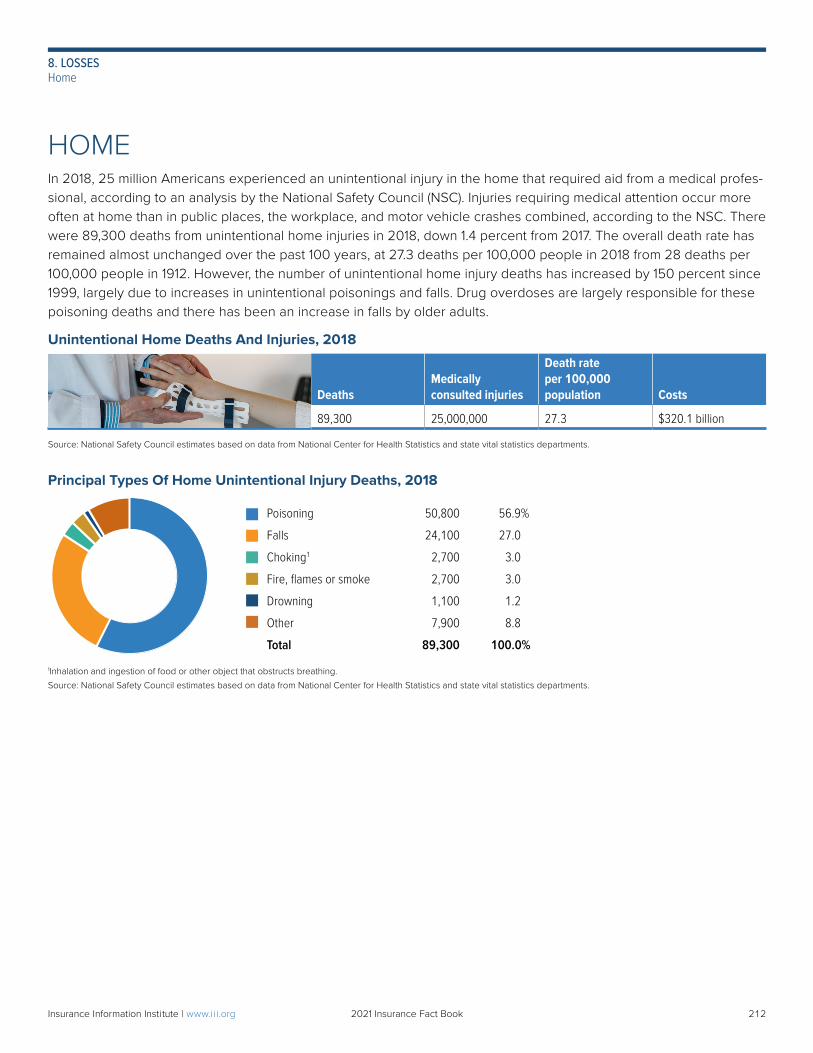
HOMEIn 2018, 25 million Americans experienced an unintentional injury in the home that required aid from a medical profes-sional, according to an analysis by the National Safety Council (NSC). Injuries requiring medical attention occur more often at home than in public places, the workplace, and motor vehicle crashes combined, according to the NSC. There were 89,300 deaths from unintentional home injuries in 2018, down 1.4 percent from 2017. The overall death rate has remained almost unchanged over the past 100 years, at 27.3 deaths per 100,000 people in 2018 from 28 deaths per 100,000 people in 1912. However, the number of unintentional home injury deaths has increased by 150 percent since 1999, largely due to increases in unintentional poisonings and falls. Drug overdoses are largely responsible for these poisoning deaths and there has been an increase in falls by older adults.
Unintentional Home Deaths And Injuries, 2018
DeathsMedically consulted injuries
Death rate per 100,000 population Costs
89,300 25,000,000 27.3 $320.1 billion
Source: National Safety Council estimates based on data from National Center for Health Statistics and state vital statistics departments.
Principal Types Of Home Unintentional Injury Deaths, 2018
Poisoning 50,800 56.9%
Falls 24,100 27.0
Choking1 2,700 3.0
Fire, flames or smoke 2,700 3.0
Drowning 1,100 1.2
Other 7,900 8.8
Total 89,300 100.0%
1Inhalation and ingestion of food or other object that obstructs breathing.
Source: National Safety Council estimates based on data from National Center for Health Statistics and state vital statistics departments.
212Insurance Information Institute | www.ii i.org 2021 Insurance Fact Book 212
8. LOSSESHome
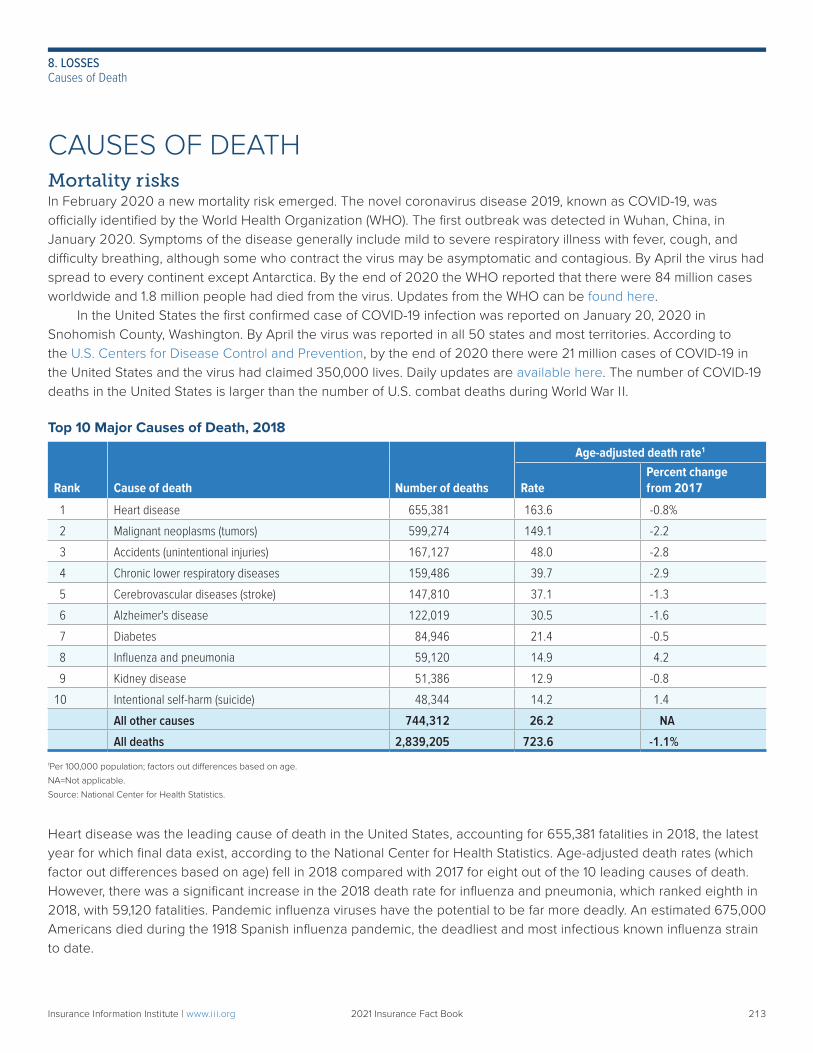
CAUSES OF DEATHMortality risksIn February 2020 a new mortality risk emerged. The novel coronavirus disease 2019, known as COVID-19, was officially identified by the World Health Organization (WHO). The first outbreak was detected in Wuhan, China, in January 2020. Symptoms of the disease generally include mild to severe respiratory illness with fever, cough, and difficulty breathing, although some who contract the virus may be asymptomatic and contagious. By April the virus had spread to every continent except Antarctica. By the end of 2020 the WHO reported that there were 84 million cases worldwide and 1.8 million people had died from the virus. Updates from the WHO can be found here. In the United States the first confirmed case of COVID-19 infection was reported on January 20, 2020 in Snohomish County, Washington. By April the virus was reported in all 50 states and most territories. According tothe U.S. Centers for Disease Control and Prevention, by the end of 2020 there were 21 million cases of COVID-19 inthe United States and the virus had claimed 350,000 lives. Daily updates are available here. The number of COVID-19 deaths in the United States is larger than the number of U.S. combat deaths during World War I I.
Top 10 Major Causes of Death, 2018
Rank Cause of death Number of deaths
Age-adjusted death rate1
RatePercent change from 2017
1 Heart disease 655,381 163.6 -0.8%
2 Malignant neoplasms (tumors) 599,274 149.1 -2.2
3 Accidents (unintentional injuries) 167,127 48.0 -2.8
4 Chronic lower respiratory diseases 159,486 39.7 -2.9
5 Cerebrovascular diseases (stroke) 147,810 37.1 -1.3
6 Alzheimer's disease 122,019 30.5 -1.6
7 Diabetes 84,946 21.4 -0.5
8 Influenza and pneumonia 59,120 14.9 4.2
9 Kidney disease 51,386 12.9 -0.8
10 Intentional self-harm (suicide) 48,344 14.2 1.4
All other causes 744,312 26.2 NA
All deaths 2,839,205 723.6 -1.1%
1Per 100,000 population; factors out differences based on age.
NA=Not applicable.
Source: National Center for Health Statistics.
Heart disease was the leading cause of death in the United States, accounting for 655,381 fatalities in 2018, the latest year for which final data exist, according to the National Center for Health Statistics. Age-adjusted death rates (which factor out differences based on age) fell in 2018 compared with 2017 for eight out of the 10 leading causes of death. However, there was a significant increase in the 2018 death rate for influenza and pneumonia, which ranked eighth in 2018, with 59,120 fatalities. Pandemic influenza viruses have the potential to be far more deadly. An estimated 675,000 Americans died during the 1918 Spanish influenza pandemic, the deadliest and most infectious known influenza strain to date.
213Insurance Information Institute | www.ii i.org 2021 Insurance Fact Book 213
8. LOSSESCauses of Death
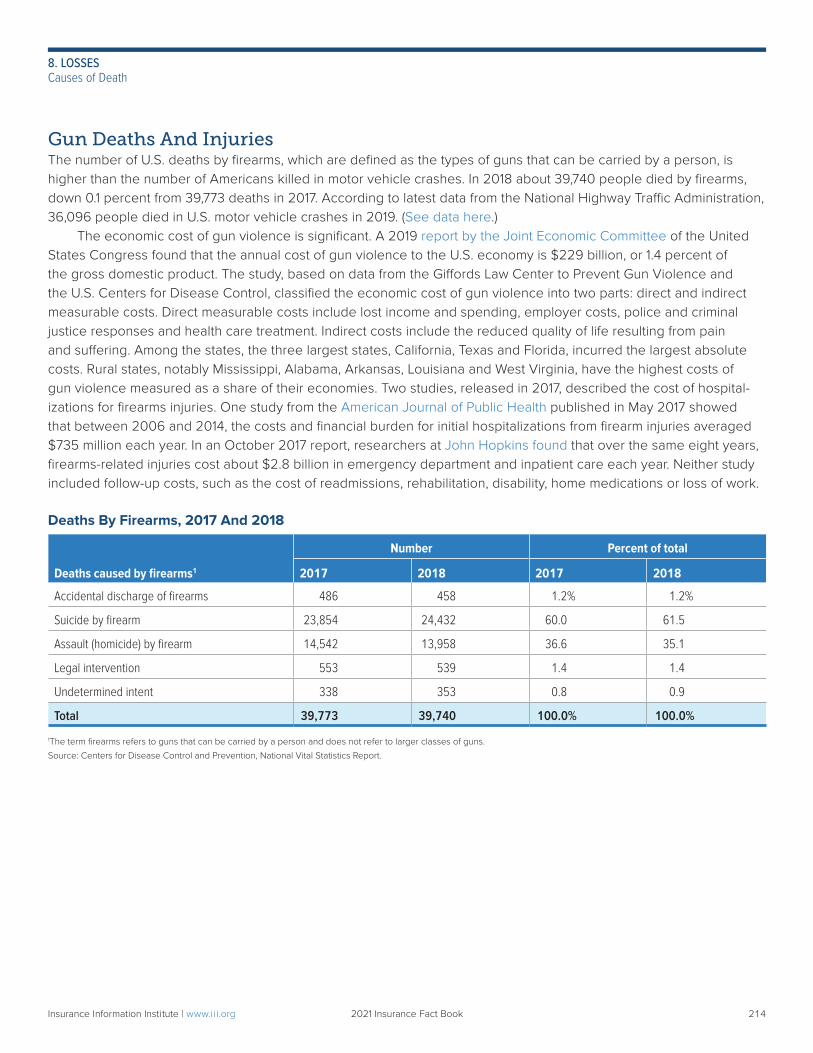
Gun Deaths And InjuriesThe number of U.S. deaths by firearms, which are defined as the types of guns that can be carried by a person, is higher than the number of Americans killed in motor vehicle crashes. In 2018 about 39,740 people died by firearms, down 0.1 percent from 39,773 deaths in 2017. According to latest data from the National Highway Traffic Administration, 36,096 people died in U.S. motor vehicle crashes in 2019. (See data here.) The economic cost of gun violence is significant. A 2019 report by the Joint Economic Committee of the United States Congress found that the annual cost of gun violence to the U.S. economy is $229 billion, or 1.4 percent of the gross domestic product. The study, based on data from the Giffords Law Center to Prevent Gun Violence and the U.S. Centers for Disease Control, classified the economic cost of gun violence into two parts: direct and indirect measurable costs. Direct measurable costs include lost income and spending, employer costs, police and criminal justice responses and health care treatment. Indirect costs include the reduced quality of life resulting from pain and suffering. Among the states, the three largest states, California, Texas and Florida, incurred the largest absolute costs. Rural states, notably Mississippi, Alabama, Arkansas, Louisiana and West Virginia, have the highest costs of gun violence measured as a share of their economies. Two studies, released in 2017, described the cost of hospital-izations for firearms injuries. One study from the American Journal of Public Health published in May 2017 showed that between 2006 and 2014, the costs and financial burden for initial hospitalizations from firearm injuries averaged $735 million each year. In an October 2017 report, researchers at John Hopkins found that over the same eight years, firearms-related injuries cost about $2.8 billion in emergency department and inpatient care each year. Neither study included follow-up costs, such as the cost of readmissions, rehabilitation, disability, home medications or loss of work.
Deaths By Firearms, 2017 And 2018
Deaths caused by firearms1
Number Percent of total
2017 2018 2017 2018
Accidental discharge of firearms 486 458 1.2% 1.2%
Suicide by firearm 23,854 24,432 60.0 61.5
Assault (homicide) by firearm 14,542 13,958 36.6 35.1
Legal intervention 553 539 1.4 1.4
Undetermined intent 338 353 0.8 0.9
Total 39,773 39,740 100.0% 100.0%
1The term firearms refers to guns that can be carried by a person and does not refer to larger classes of guns.
Source: Centers for Disease Control and Prevention, National Vital Statistics Report.
214Insurance Information Institute | www.ii i.org 2021 Insurance Fact Book 214
8. LOSSESCauses of Death
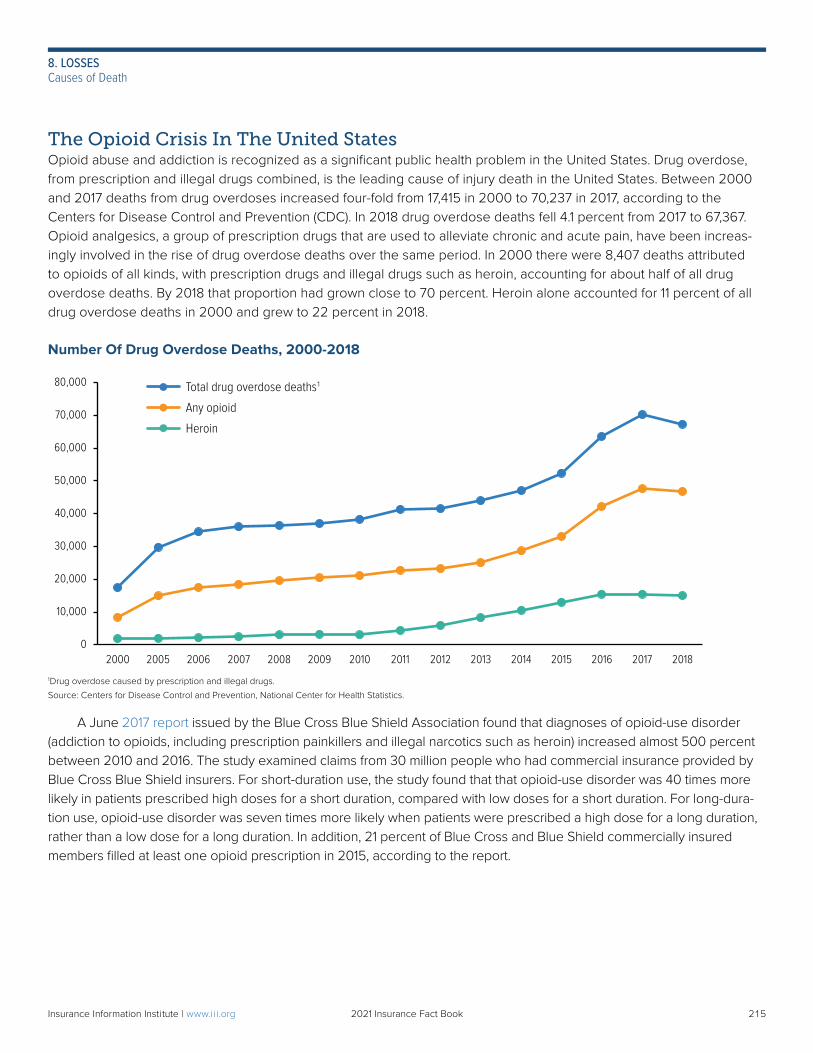
A June 2017 report issued by the Blue Cross Blue Shield Association found that diagnoses of opioid-use disorder (addiction to opioids, including prescription painkillers and illegal narcotics such as heroin) increased almost 500 percent between 2010 and 2016. The study examined claims from 30 million people who had commercial insurance provided by Blue Cross Blue Shield insurers. For short-duration use, the study found that that opioid-use disorder was 40 times more likely in patients prescribed high doses for a short duration, compared with low doses for a short duration. For long-dura-tion use, opioid-use disorder was seven times more likely when patients were prescribed a high dose for a long duration, rather than a low dose for a long duration. In addition, 21 percent of Blue Cross and Blue Shield commercially insured members filled at least one opioid prescription in 2015, according to the report.
1Drug overdose caused by prescription and illegal drugs.
Source: Centers for Disease Control and Prevention, National Center for Health Statistics.
0
10,000
20,000
30,000
40,000
50,000
60,000
70,000
80,000
2000 2005 2006 2007 2008 2009 2010 2011 2012 2013 2014 2015 2016 2017 2018
Total drug overdose deaths1
Any opioid
Heroin
The Opioid Crisis In The United StatesOpioid abuse and addiction is recognized as a significant public health problem in the United States. Drug overdose, from prescription and illegal drugs combined, is the leading cause of injury death in the United States. Between 2000 and 2017 deaths from drug overdoses increased four-fold from 17,415 in 2000 to 70,237 in 2017, according to the Centers for Disease Control and Prevention (CDC). In 2018 drug overdose deaths fell 4.1 percent from 2017 to 67,367. Opioid analgesics, a group of prescription drugs that are used to alleviate chronic and acute pain, have been increas-ingly involved in the rise of drug overdose deaths over the same period. In 2000 there were 8,407 deaths attributed to opioids of all kinds, with prescription drugs and illegal drugs such as heroin, accounting for about half of all drug overdose deaths. By 2018 that proportion had grown close to 70 percent. Heroin alone accounted for 11 percent of all drug overdose deaths in 2000 and grew to 22 percent in 2018.
Number Of Drug Overdose Deaths, 2000-2018
215Insurance Information Institute | www.ii i.org 2021 Insurance Fact Book 215
8. LOSSESCauses of Death
Many states and municipalities have filed lawsuits against the pharmaceutical companies that they hold responsible for the current opioid epidemic. The lawsuits attempt to seek reimbursement for healthcare expenses, substance abuse treatment, social services, court and correctional expenses and other costs resulting from opioid abuse. In 2018 around 2,300 lawsuits against opioid manufacturers, distributors and pharmacies were consolidated under one federal judge. The plaintiffs included almost 200 municipal governments, all pursuing reimbursement for the costs of drug addiction and its collateral damage. One case, the State of Oklahoma v. Purdue Pharma, was settled in March 2019 as the company and its owners, the Sackler family, ultimately agreed to pay $270 million. This was the first class-action settlement related to opioid litigation. The company declared bankruptcy in September. In October 2020 Purdue Pharma pled guilty to three criminal charges brought by the U.S. Justice Department for conspiracy to defraud the United States, violate an anti-kickback law and false representation. The company faces more than $8 billion in financial penalties. In October 2019 the court of the Northern District of Ohio was set to try three consolidated Ohio lawsuits in a test case against four entities—three distributors and one manufacturer. The case was ultimately settled for $260 million, with the money designated to help fight opioid addiction.
216Insurance Information Institute | www.ii i.org 2021 Insurance Fact Book 216
8. LOSSESCauses of Death
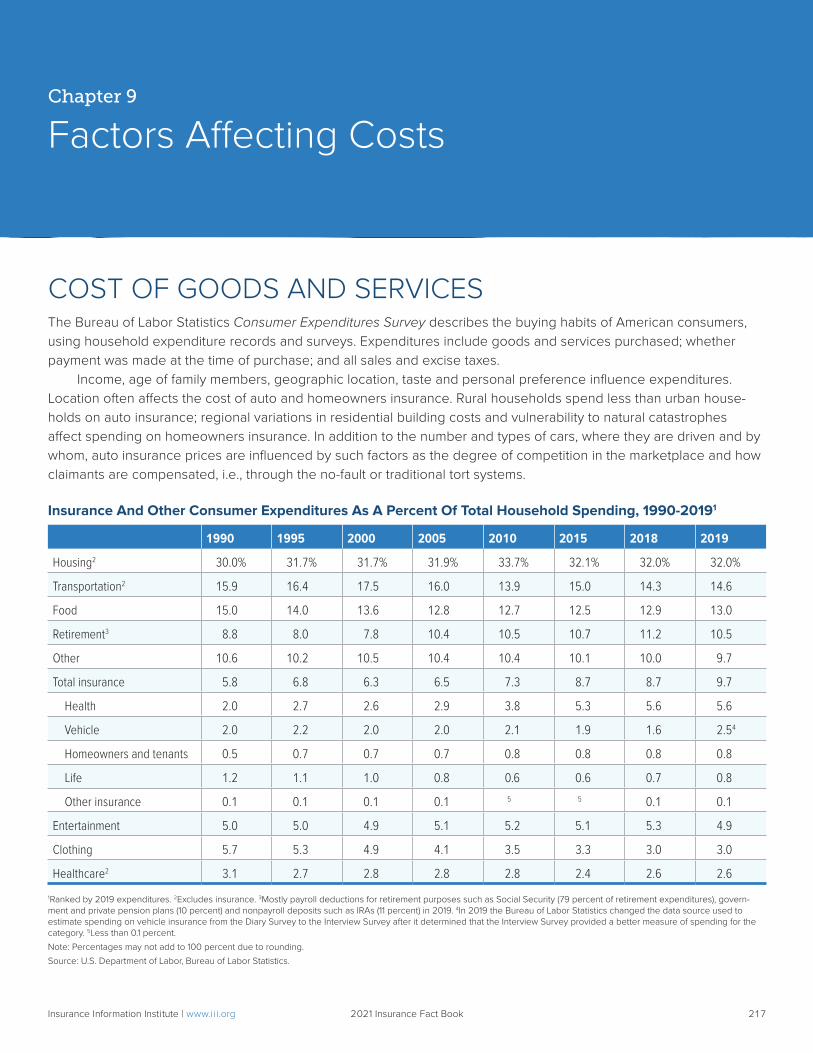
217Insurance Information Institute | www.ii i.org 2021 Insurance Fact Book 217
COST OF GOODS AND SERVICESThe Bureau of Labor Statistics Consumer Expenditures Survey describes the buying habits of American consumers, using household expenditure records and surveys. Expenditures include goods and services purchased; whether payment was made at the time of purchase; and all sales and excise taxes. Income, age of family members, geographic location, taste and personal preference influence expenditures. Location often affects the cost of auto and homeowners insurance. Rural households spend less than urban house-holds on auto insurance; regional variations in residential building costs and vulnerability to natural catastrophes affect spending on homeowners insurance. In addition to the number and types of cars, where they are driven and by whom, auto insurance prices are influenced by such factors as the degree of competition in the marketplace and how claimants are compensated, i.e., through the no-fault or traditional tort systems.
Insurance And Other Consumer Expenditures As A Percent Of Total Household Spending, 1990-20191
1990 1995 2000 2005 2010 2015 2018 2019
Housing2 30.0% 31.7% 31.7% 31.9% 33.7% 32.1% 32.0% 32.0%
Transportation2 15.9 16.4 17.5 16.0 13.9 15.0 14.3 14.6
Food 15.0 14.0 13.6 12.8 12.7 12.5 12.9 13.0
Retirement3 8.8 8.0 7.8 10.4 10.5 10.7 11.2 10.5
Other 10.6 10.2 10.5 10.4 10.4 10.1 10.0 9.7
Total insurance 5.8 6.8 6.3 6.5 7.3 8.7 8.7 9.7
Health 2.0 2.7 2.6 2.9 3.8 5.3 5.6 5.6
Vehicle 2.0 2.2 2.0 2.0 2.1 1.9 1.6 2.54
Homeowners and tenants 0.5 0.7 0.7 0.7 0.8 0.8 0.8 0.8
Life 1.2 1.1 1.0 0.8 0.6 0.6 0.7 0.8
Other insurance 0.1 0.1 0.1 0.1 5 5 0.1 0.1
Entertainment 5.0 5.0 4.9 5.1 5.2 5.1 5.3 4.9
Clothing 5.7 5.3 4.9 4.1 3.5 3.3 3.0 3.0
Healthcare2 3.1 2.7 2.8 2.8 2.8 2.4 2.6 2.6
1Ranked by 2019 expenditures. 2Excludes insurance. 3Mostly payroll deductions for retirement purposes such as Social Security (79 percent of retirement expenditures), govern-ment and private pension plans (10 percent) and nonpayroll deposits such as IRAs (11 percent) in 2019. 4In 2019 the Bureau of Labor Statistics changed the data source used to estimate spending on vehicle insurance from the Diary Survey to the Interview Survey after it determined that the Interview Survey provided a better measure of spending for the category. 5Less than 0.1 percent.
Note: Percentages may not add to 100 percent due to rounding.
Source: U.S. Department of Labor, Bureau of Labor Statistics.
Chapter 9
Factors Affecting Costs
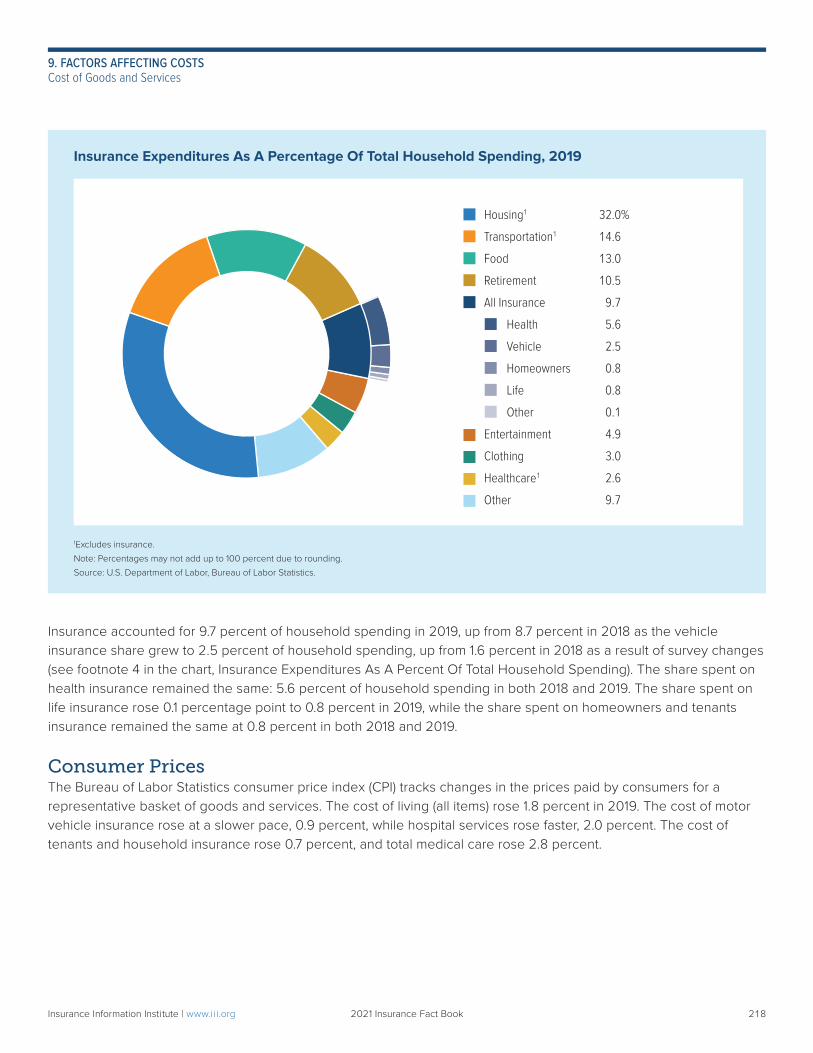
218
Insurance accounted for 9.7 percent of household spending in 2019, up from 8.7 percent in 2018 as the vehicle insurance share grew to 2.5 percent of household spending, up from 1.6 percent in 2018 as a result of survey changes (see footnote 4 in the chart, Insurance Expenditures As A Percent Of Total Household Spending). The share spent on health insurance remained the same: 5.6 percent of household spending in both 2018 and 2019. The share spent on life insurance rose 0.1 percentage point to 0.8 percent in 2019, while the share spent on homeowners and tenants insurance remained the same at 0.8 percent in both 2018 and 2019.
Consumer PricesThe Bureau of Labor Statistics consumer price index (CPI) tracks changes in the prices paid by consumers for a representative basket of goods and services. The cost of living (all items) rose 1.8 percent in 2019. The cost of motor vehicle insurance rose at a slower pace, 0.9 percent, while hospital services rose faster, 2.0 percent. The cost of tenants and household insurance rose 0.7 percent, and total medical care rose 2.8 percent.
Insurance Expenditures As A Percentage Of Total Household Spending, 2019
1Excludes insurance.
Note: Percentages may not add up to 100 percent due to rounding.
Source: U.S. Department of Labor, Bureau of Labor Statistics.
Housing1 32.0%
Transportation1 14.6
Food 13.0
Retirement 10.5
All Insurance 9.7
Health 5.6
Vehicle 2.5
Homeowners 0.8
Life 0.8
Other 0.1
Entertainment 4.9
Clothing 3.0
Healthcare1 2.6
Other 9.7
9. FACTORS AFFECTING COSTSCost of Goods and Services
Insurance Information Institute | www.ii i.org 2021 Insurance Fact Book 218
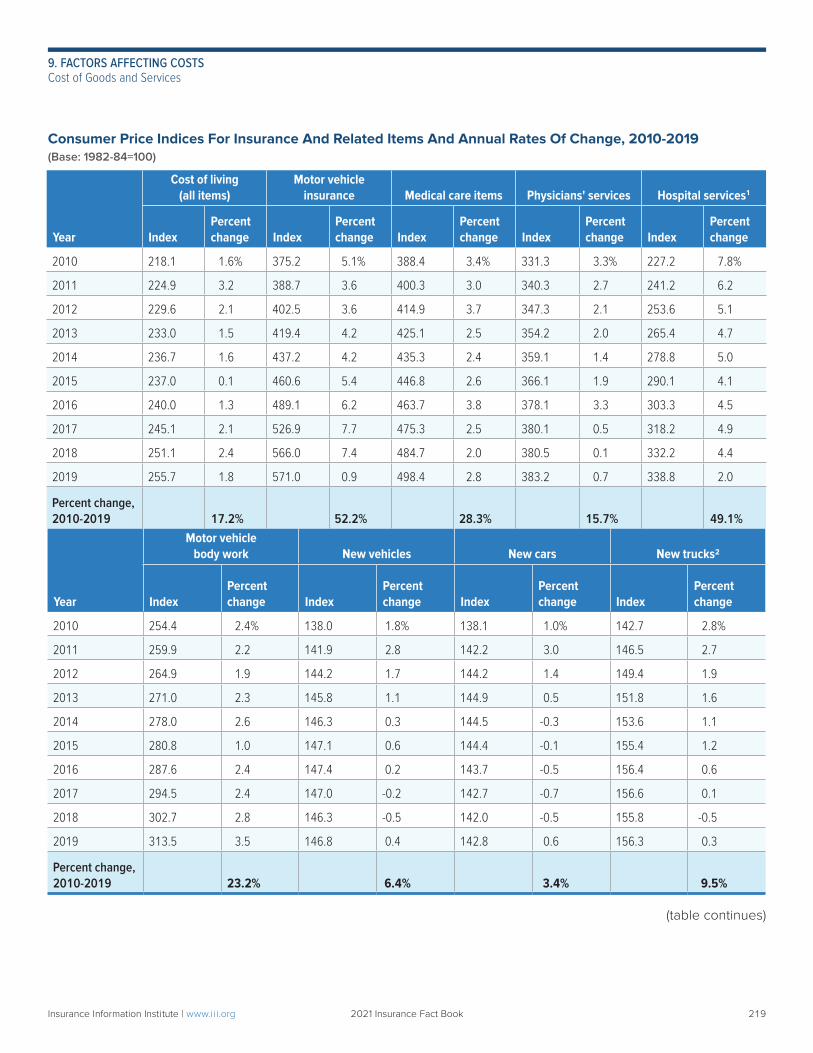
219
Consumer Price Indices For Insurance And Related Items And Annual Rates Of Change, 2010-2019 (Base: 1982-84=100)
Year
Cost of living (all items)
Motor vehicle insurance Medical care items Physicians' services Hospital services1
IndexPercentchange Index
Percentchange Index
Percentchange Index
Percentchange Index
Percentchange
2010 218.1 1.6% 375.2 5.1% 388.4 3.4% 331.3 3.3% 227.2 7.8%
2011 224.9 3.2 388.7 3.6 400.3 3.0 340.3 2.7 241.2 6.2
2012 229.6 2.1 402.5 3.6 414.9 3.7 347.3 2.1 253.6 5.1
2013 233.0 1.5 419.4 4.2 425.1 2.5 354.2 2.0 265.4 4.7
2014 236.7 1.6 437.2 4.2 435.3 2.4 359.1 1.4 278.8 5.0
2015 237.0 0.1 460.6 5.4 446.8 2.6 366.1 1.9 290.1 4.1
2016 240.0 1.3 489.1 6.2 463.7 3.8 378.1 3.3 303.3 4.5
2017 245.1 2.1 526.9 7.7 475.3 2.5 380.1 0.5 318.2 4.9
2018 251.1 2.4 566.0 7.4 484.7 2.0 380.5 0.1 332.2 4.4
2019 255.7 1.8 571.0 0.9 498.4 2.8 383.2 0.7 338.8 2.0
Percent change,2010-2019 17.2% 52.2% 28.3% 15.7% 49.1%
Year
Motor vehicle body work New vehicles New cars New trucks2
IndexPercentchange Index
Percentchange Index
Percentchange Index
Percentchange
2010 254.4 2.4% 138.0 1.8% 138.1 1.0% 142.7 2.8%
2011 259.9 2.2 141.9 2.8 142.2 3.0 146.5 2.7
2012 264.9 1.9 144.2 1.7 144.2 1.4 149.4 1.9
2013 271.0 2.3 145.8 1.1 144.9 0.5 151.8 1.6
2014 278.0 2.6 146.3 0.3 144.5 -0.3 153.6 1.1
2015 280.8 1.0 147.1 0.6 144.4 -0.1 155.4 1.2
2016 287.6 2.4 147.4 0.2 143.7 -0.5 156.4 0.6
2017 294.5 2.4 147.0 -0.2 142.7 -0.7 156.6 0.1
2018 302.7 2.8 146.3 -0.5 142.0 -0.5 155.8 -0.5
2019 313.5 3.5 146.8 0.4 142.8 0.6 156.3 0.3
Percent change, 2010-2019 23.2% 6.4% 3.4% 9.5%
(table continues)
9. FACTORS AFFECTING COSTSCost of Goods and Services
Insurance Information Institute | www.ii i.org 2021 Insurance Fact Book 219
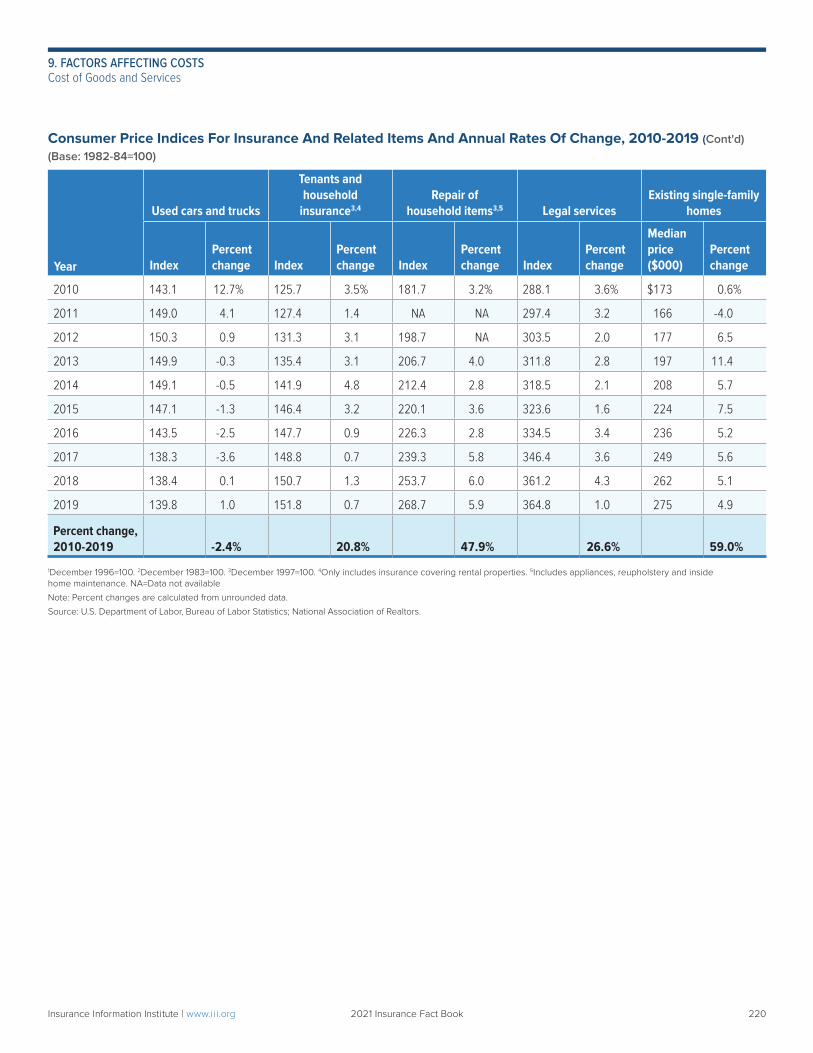
220
Consumer Price Indices For Insurance And Related Items And Annual Rates Of Change, 2010-2019 (Cont'd) (Base: 1982-84=100)
Year
Used cars and trucks
Tenants and household
insurance3,4
Repair of household items3,5 Legal services
Existing single-family homes
IndexPercentchange Index
Percentchange Index
Percentchange Index
Percentchange
Medianprice ($000)
Percentchange
2010 143.1 12.7% 125.7 3.5% 181.7 3.2% 288.1 3.6% $173 0.6%
2011 149.0 4.1 127.4 1.4 NA NA 297.4 3.2 166 -4.0
2012 150.3 0.9 131.3 3.1 198.7 NA 303.5 2.0 177 6.5
2013 149.9 -0.3 135.4 3.1 206.7 4.0 311.8 2.8 197 11.4
2014 149.1 -0.5 141.9 4.8 212.4 2.8 318.5 2.1 208 5.7
2015 147.1 -1.3 146.4 3.2 220.1 3.6 323.6 1.6 224 7.5
2016 143.5 -2.5 147.7 0.9 226.3 2.8 334.5 3.4 236 5.2
2017 138.3 -3.6 148.8 0.7 239.3 5.8 346.4 3.6 249 5.6
2018 138.4 0.1 150.7 1.3 253.7 6.0 361.2 4.3 262 5.1
2019 139.8 1.0 151.8 0.7 268.7 5.9 364.8 1.0 275 4.9
Percent change,2010-2019 -2.4% 20.8% 47.9% 26.6% 59.0%
1December 1996=100. 2December 1983=100. 3December 1997=100. 4Only includes insurance covering rental properties. 5Includes appliances, reupholstery and inside home maintenance. NA=Data not available
Note: Percent changes are calculated from unrounded data.
Source: U.S. Department of Labor, Bureau of Labor Statistics; National Association of Realtors.
9. FACTORS AFFECTING COSTSCost of Goods and Services
Insurance Information Institute | www.ii i.org 2021 Insurance Fact Book 220
221
FRAUDInsurance fraud is a deliberate deception perpetrated against or by an insurance company or agent for the purpose of financial gain. Fraud may be committed at different points in the insurance transaction by applicants for insurance, policyholders, third-party claimants or professionals who provide services to claimants. Insurance agents and company employees may also commit insurance fraud. Common frauds include padding, or inflating actual claims, misrepresenting facts on an insurance application, submitting claims for injuries or damage that never occurred or staging accidents.
Size Of The ProblemThe exact amount of fraud committed is difficult to determine. In the late 1980s the Insurance Information Institute interviewed claims adjusters and concluded that fraud accounted for about 10 percent of the property/casualty (P/C) insurance industry’s incurred losses each year. Using that measure, in 2018 and 2019 P/C fraud would amount to $37 billion each year. The amount of fraud experienced in a particular year can fluctuate based on the line of business, economic conditions and other factors, such as the constantly evolving nature of fraud. Recent reports suggest that the proportion of fraud may be as much as double the 10 percent. In a FRISS study, Insurance Fraud Report 2020: The Impacts Of COVID-19 On AI And Digitalization In Insurance, respondents to an annual global survey believe 18 percent of all claims on average contain an element of fraud, inflation or misrepresentation. The report also found that at a 2019 International Association of Special Investigation Units (IASIU) conference, investigators believed the proportion of fraud in global insurance claims to be 22 percent. Using all three measures would point to an estimate of fraud of between $37 billion and $81 billion on average for 2018 and 2019. Insurance fraud is the second costliest white-collar crime, according to the National Insurance Crime Bureau (NICB), trailing only tax evasion. The NICB is a not-for-profit organization that works with insurers and law enforcement to identify, detect and prosecute insurance crime, including fraud, and fosters fraud awareness, see nicb.org. The FBI says that insurance fraud (excluding health insurance) costs more than $40 billion each year, or an increase in insurance premiums of between $400 and $700 yearly for the average American family. The Insurance Research Council (IRC) estimated that between $5.6 billion and $7.7 billion was fraudulently added to paid claims for auto insurance bodily injury payments in 2012, compared with a range of $4.3 billion to $5.8 billion in 2002. The IRC studied more than 35,000 auto injury claims closed with payment and reported the results in its 2016 report, Fraud and Buildup in Auto Injury Claims. Fraud accounted for between 15 percent and 17 percent of total claims payments for auto insurance bodily injury.
Fighting Insurance FraudInsurers are on the front lines combating insurance fraud despite the increase in the number of states that have passed laws to criminalize such fraud. By 2016 every state and Washington, D.C. had enacted laws that classify fraud as a crime at least for some lines of insurance and have instituted immunity for reporting insurance fraud. Most states and the District of Columbia have fraud bureaus or divisions where fraud can be reported, investigated and prosecuted. About two dozen states and the District of Columbia require insurers to create and implement programs to reduce insurance
Insurance Information Institute | www.ii i.org 2021 Insurance Fact Book 221
9. FACTORS AFFECTING COSTSFraud
222
fraud. Many P/C insurers have created special investigative units within their companies. These use specially trained professionals to examine suspicious claims, then work with law enforcement officials and organizations like the NICB to catch perpetrators. See chart, Key State Laws Against Insurance Fraud in Facts + Statistics, Fraud. One of the most effective means of combating fraud is the adoption of data technologies that cut the time needed to recognize fraud. Advances in analytical technology are crucial in the fight against fraud to keep pace with sophis-ticated rings that constantly develop new scams. According to a company that develops insurance fraud analytics, insurers typically see evidence of organized staged accidents shortly after they start a direct internet channel for their customers. These websites allow criminals to exploit loopholes in consumer applications and underwriting and they test the systems by filing many applications and observing which ones are flagged for additional information.
Traditional approaches such as using automated red flags and business rules have been augmented by predictive modeling link analysis, which examines the relationships between items like people, places and events. Artificial intelligence can be used, along with other tools, to uncover fraud before a payment is made. These newer strategies are employed when claims are first filed. Suspicious claims are flagged for further review, while those with no suspicious elements are processed normally. In search of refinement, insurers are blending tools to improve their fraud detection programs. Programs that scan many insurance claims have been enhanced by the consolidation of insurance industry claims databases, such as ClaimSearch, from the Insurance Services Office (ISO), the world’s largest comprehensive
database of claims information. Systems that identify anomalies in a database can be used to develop algorithms that enable an insurer to automatically stop claim payments. A 2019 report published by the Coalition Against Insurance Fraud and the SAS Institute, State of Insurance Fraud Technology, based on an online survey of 84 mostly P/C insurers conducted in late 2018, found that nearly three-quar-ters of the survey participants said fraud had increased either significantly or slightly in the previous three years. About 40 percent of insurers polled said their technology budgets for 2019 would be larger, with predictive modeling and link or social network analysis the two most likely types of programs considered for investment. About 90 percent of respondents said they use technology primarily to detect claims fraud, a significant increase from 2016, and about half said they use it to combat underwriting fraud, up from 27 percent in 2016. The greatest challenges for insurers were limited IT resources, affecting about three-quarters of insurers, about the same as in 2016, followed by problems in data integration, with 76 percent reporting the problem, up from 64 percent in 2016. The 2020 Insurer SIU Benchmarking Study published by the Coalition Against Insurance Fraud found that insurers are increasing office investigators and using fewer field agents in their special investigating units, increasing outsourcing investigators and legal help, and focusing on larger and more complex cases. Although field investigators account for more than half of SIU personnel, the number of desk investigators grew to 16 percent of all investigators by 2019 and have likely risen during the COVID-19 pandemic and will do so post-pandemic. Expense is a factor in using desk investigators, which are about one-third less expensive than field investigators. Overall, SIUs focus more on large fraud rings that steal the most money rather than smaller scams, resulting in time and money savings. Outsourcing both surveillance and investigation has increased by 25 percent between 2017 and 2019, while outsourcing fraud-related legal services grew from 30 percent to 40 percent by 2019. FRISS’s report, Insurance Fraud Report 2020: The Impacts Of COVID-19 On AI And Digitalization In Insurance, says that the COVID-19 pandemic caused significant impacts to businesses. As noted by industry experts, recessions lead to higher incidence of fraud, and an increase in digital processes allows more opportunity for fraud, conditions that are
Insurance Information Institute | www.ii i.org 2021 Insurance Fact Book 222
9. FACTORS AFFECTING COSTSFraud

223
present during the current pandemic. The FRISS study found that 65 percent of the 443 respondents from 52 countries are focusing on digitalization, and one-third have increased fraud checks. FRISS also identified the top three fraud schemes occurring during the pandemic as the following: staged vehicle accidents and thefts; fraudulent procedure billing and phantom services; and faked home accidents. Even more alarming was the finding that 43 percent of respondents have reduced the funding of their operations due to the pandemic. Currently 68 percent of respondents are using automated red flags and business rules programs to combat fraud. Sixty-four percent rely on the experience of their fraud staff and 38 percent still rely on “homegrown” solutions, including instinct and manual methods to prevent and predict fraud. When asked what benefits respondents saw in adopting fraud detection software, three out of five cited improved loss ratios and half cited real-time detection. Insurers are also reviewing and adopting improved under-writing standards: about half of respondents reported introductions of new standards. The study says that most carriers are examining internal claim and policy history, and known fraud cases and lists. However less than half review loss information and payment history, which FRISS identifies as key factors of financial distress and propensity to perpetrate fraud.
Curbing Florida’s Assignment of Benefits AbuseIn 2019 legislators in Florida began to tackle the assignment of benefits (AOB) issue that had been plaguing the insurance industry for many years by passing AOB reform legislation that became law on July 1, 2019. At issue was the practice where a policyholder grants a third party–an auto glass repair company, a medical practitioner, or a home contractor–permission to directly bill an insurer to settle a claim. In Florida, abuse of AOBs fueled an insurance crisis. The pre-reform legal environment encouraged vendors and their attorneys to solicit unwarranted AOBs from tens of thousands of Floridians, conduct unnecessary or unnecessarily expensive work, then file tens of thousands of lawsuits against insurance companies that deny or dispute the claims. This mini-industry cost consumers billions of dollars as they were forced to pay higher premiums to cover needless repairs and excessive legal fees. The problem was once limited to personal injury protection (PIP) claims in personal auto insurance but then spread to homeowners insurance and auto glass coverage. There were roughly 1,300 AOB lawsuits statewide in 2000. There were more than 79,000 in 2013 and more than 153,000 in 2018, a 94 percent increase in just five years, according to the Insurance Information Institute’s March 2019 report, Florida’s assignment of benefits crisis. Before the new law, insurers were forced to pay all attorney fees in a contractor’s AOB suit—even when the contractor prevailed for any amount above the insurer’s pre-suit offer. One of the provisions of the new law mandates that insurers no longer must pay all attorney fees in AOB suits by contractors. A sliding scale now determines attorney fees. Other provisions are a mandatory 10-day notice by contractor AOB holders before filing suit—including notifying the named insured; allowing insurers to issue certain policies containing restricted or no assignment rights; and requir-ing insurers to report AOB claims and settlements to the Department of Insurance to monitor the new law’s impact on insurance rates and lawsuit filings, according to the Coalition Against Insurance Fraud. Although AOB litigation seems to be decreasing after the law was enacted, the legislation excluded auto glass repairs, which were the subject of more than 20,000 lawsuits in 2017.
Insurance Information Institute | www.ii i.org 2021 Insurance Fact Book 223
9. FACTORS AFFECTING COSTSFraud
224
LITIGIOUSNESSInsurers’ Legal Defense Costs
Lawsuits against businesses affect the cost of insurance and the products and services of the industries sued. Legal liability was the fourth-highest rated worry for business leaders in the United States in 2017, the same as in 2016, according to Travelers Insurance’s Business Risk Index. More than half of the 1,000+ business managers surveyed indicated they worried about it somewhat or a great deal. Since 2017, fewer business managers said legal liability was in their top five business worries, especially in 2020 when COVID-19-related economic uncertainty was the greatest worry for businesses. However, litigation is recognized as a significant drain on business. The U.S. Chamber of Commerce Institute for Legal Reform (ILR) has found that U.S. litigation costs reached 2.3 percent of gross
domestic product (GDP) in 2016. Analysts used data on liability insurance premiums and estimates of the liability exposure of uninsured or self-insured businesses and individuals to determine the total cost of litigation. Costs and compensation paid in the tort system totaled $429 billion. This amount is comprised of $250 billion from general and commercial liability exposure, which includes personal injury, consumer and other litigation; $160 billion, which stems from liability related to auto accident claims; and $19 billion from medical malpractice litigation. The study also found that 57 percent of tort system costs and compensation was paid out in compensation to plaintiffs. The remainder— 43 percent—was the cost of litigation of both sides and includes the operation costs for insurers. Tort costs and compensation vary significantly from state to state, and in the most expensive states these costs can be up to 2.1 times larger than in the least expensive states. One example is Florida, which has the highest tort system costs—3.6 percent of its GDP—compared with Alaska, Washington and Wyoming which have tort costs of less than 1.8 percent. New York has $6,066 in tort costs per household, the highest of any state, followed by California, Florida and New Jersey. In Washington D.C., per household tort costs were even higher—$6,257. Maine, North Carolina and South Dakota have the least expensive, about $2,000 in tort costs per household. Insurers are required to defend their policyholders against lawsuits. The costs of settling a claim are reported on insurers’ financial statements as defense and cost containment expenses incurred. These expenses include defense, litigation and medical cost containment. Expenditures for surveillance, litigation management and fees for appraisers, private investigators, hearing representatives and fraud investigators are included. In addition, attorney legal fees may be incurred owing to a duty to defend, even when coverage does not exist, because attorneys must be hired to issue opinions about coverage. Insurers’ defense costs as a percentage of incurred losses are relatively high in lines such as product liability and medical malpractice, reflecting the high cost of defending certain types of lawsuits, such as medical injury cases and class actions against pharmaceutical companies. For example, in 2019, in addition to $1.3 billion in product liability incurred losses, insurers spent $668 million on settlement expenses, which was equiva-lent to 50.4 percent of the losses.
Insurance Information Institute | www.ii i.org 2021 Insurance Fact Book 224
9. FACTORS AFFECTING COSTSLitigiousness
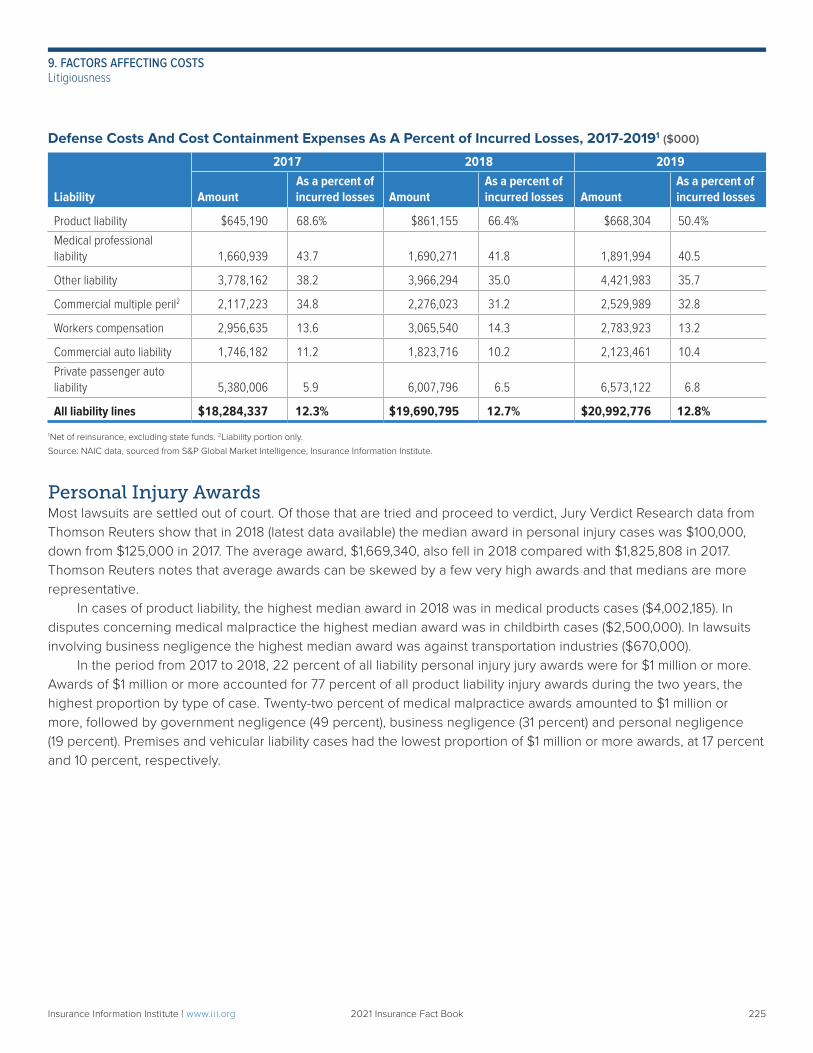
225
Defense Costs And Cost Containment Expenses As A Percent of Incurred Losses, 2017-20191 ($000)
2017 2018 2019
Liability AmountAs a percent of incurred losses Amount
As a percent of incurred losses Amount
As a percent of incurred losses
Product liability $645,190 68.6% $861,155 66.4% $668,304 50.4%
Medical professional liability 1,660,939 43.7 1,690,271 41.8 1,891,994 40.5
Other liability 3,778,162 38.2 3,966,294 35.0 4,421,983 35.7
Commercial multiple peril2 2,117,223 34.8 2,276,023 31.2 2,529,989 32.8
Workers compensation 2,956,635 13.6 3,065,540 14.3 2,783,923 13.2
Commercial auto liability 1,746,182 11.2 1,823,716 10.2 2,123,461 10.4
Private passenger auto liability 5,380,006 5.9 6,007,796 6.5 6,573,122 6.8
All liability lines $18,284,337 12.3% $19,690,795 12.7% $20,992,776 12.8%
1Net of reinsurance, excluding state funds. 2Liability portion only.
Source: NAIC data, sourced from S&P Global Market Intelligence, Insurance Information Institute.
Personal Injury AwardsMost lawsuits are settled out of court. Of those that are tried and proceed to verdict, Jury Verdict Research data from Thomson Reuters show that in 2018 (latest data available) the median award in personal injury cases was $100,000, down from $125,000 in 2017. The average award, $1,669,340, also fell in 2018 compared with $1,825,808 in 2017. Thomson Reuters notes that average awards can be skewed by a few very high awards and that medians are more representative. In cases of product liability, the highest median award in 2018 was in medical products cases ($4,002,185). In disputes concerning medical malpractice the highest median award was in childbirth cases ($2,500,000). In lawsuits involving business negligence the highest median award was against transportation industries ($670,000). In the period from 2017 to 2018, 22 percent of all liability personal injury jury awards were for $1 million or more. Awards of $1 million or more accounted for 77 percent of all product liability injury awards during the two years, the highest proportion by type of case. Twenty-two percent of medical malpractice awards amounted to $1 million or more, followed by government negligence (49 percent), business negligence (31 percent) and personal negligence (19 percent). Premises and vehicular liability cases had the lowest proportion of $1 million or more awards, at 17 percent and 10 percent, respectively.
Insurance Information Institute | www.ii i.org 2021 Insurance Fact Book 225
9. FACTORS AFFECTING COSTSLitigiousness
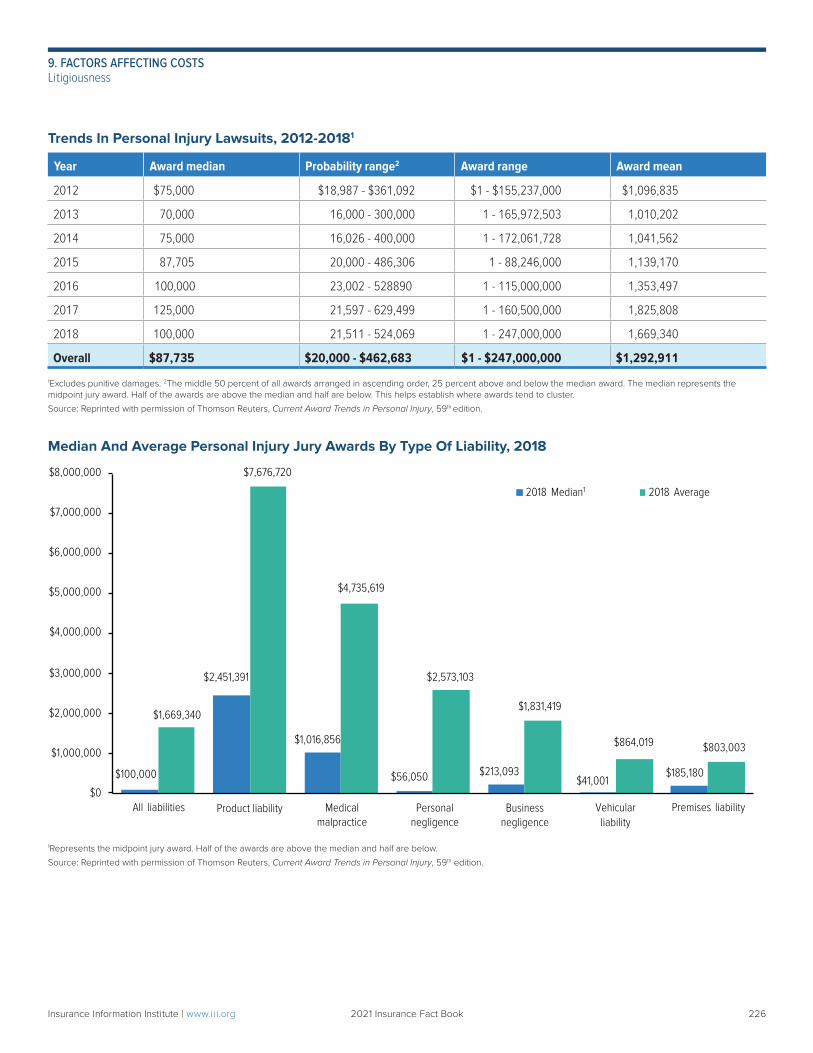
226
Trends In Personal Injury Lawsuits, 2012-20181
Year Award median Probability range2 Award range Award mean
2012 $75,000 $18,987 - $361,092 $1 - $155,237,000 $1,096,835
2013 70,000 16,000 - 300,000 1 - 165,972,503 1,010,202
2014 75,000 16,026 - 400,000 1 - 172,061,728 1,041,562
2015 87,705 20,000 - 486,306 1 - 88,246,000 1,139,170
2016 100,000 23,002 - 528890 1 - 115,000,000 1,353,497
2017 125,000 21,597 - 629,499 1 - 160,500,000 1,825,808
2018 100,000 21,511 - 524,069 1 - 247,000,000 1,669,340
Overall $87,735 $20,000 - $462,683 $1 - $247,000,000 $1,292,911
1Excludes punitive damages. 2The middle 50 percent of all awards arranged in ascending order, 25 percent above and below the median award. The median represents the midpoint jury award. Half of the awards are above the median and half are below. This helps establish where awards tend to cluster.
Source: Reprinted with permission of Thomson Reuters, Current Award Trends in Personal Injury, 59th edition.
Median And Average Personal Injury Jury Awards By Type Of Liability, 2018
1Represents the midpoint jury award. Half of the awards are above the median and half are below.
Source: Reprinted with permission of Thomson Reuters, Current Award Trends in Personal Injury, 59th edition.
$100,000
$1,016,856
$56,050 $213,093$41,001
$185,180
$1,669,340
$7,676,720
$4,735,619
$2,573,103
$1,831,419
$864,019 $803,003
$0
$1,000,000
$2,000,000
$3,000,000
$4,000,000
$5,000,000
$6,000,000
$7,000,000
$8,000,000
All liabilities Vehicular liability
Premises liability
2018 Median1 2018 Average
$2,451,391
Product liability Medical malpractice
Personal negligence
Business negligence
Insurance Information Institute | www.ii i.org 2021 Insurance Fact Book 226
9. FACTORS AFFECTING COSTSLitigiousness
227
Directors And Liability InsuranceDirectors and officers liability insurance (D&O) covers the directors and officers of a company for negligent acts or omissions and for misleading statements that result in lawsuits against the company. There are various forms of D&O coverage. Side A coverage provides D&O coverage for personal liability when directors and officers who are accused of wrongdoing are not indemnified by the firm. Side B coverage reimburses a corporation for its loss when it indemni-fies its directors and officers. Side C provides coverage for claims made specifically against the company. Corporate reimbursement coverage indemnifies directors and officers of the organization. D&O policies may be broadened to include coverage for employment practices liability (EPL). EPL coverage may also be purchased as a stand-alone policy. In 2018 the D&O liability insurance sector was impacted by law-suits concerning data breaches and privacy issues and the #MeToo movement, according to the 2019 RIMS Benchmark Survey (latest data available) from the Risk and Insurance Management Society and Advisen. The coverage is key to ensuring that companies comply with legislation such as the Dodd-Frank Wall Street Reform Act and the Consumer Protection Act. In 2018, 68 percent of corporations purchased D&O coverage, according to the 2019 RIMS Benchmark Survey, which recorded responses from 570 organizations. Information technology companies were the most likely to purchase D&O coverage in 2018, with 96 percent of respondents purchasing the coverage, followed by 83 percent of banks. Education and consumer staples companies followed with 82 percent and 79 percent, respectively, purchasing D&O coverage. Advisen reported that the number of new cases that may be covered by D&O coverage fell in 2017 compared with 2016. Total shareholder risks, an area that encompasses securities class actions, derivative shareholder suits and other suits brought by shareholders, has stayed at relatively constant levels over the four years ending in 2017. Advisen noted that in 2017 alone the number of new merger objection cases rose 28 percent from 2016 and another 27 percent in the first three quarters of 2018 from the same three quarters in 2017. For more information on D&O insurance, please see Chapter 7, Commercial Lines.
Employment Practices Liability InsuranceFollowing the flood of high-profile sexual harassment lawsuits since 2017 spurred by the #MeToo movement, there has been a dramatic increase in the purchase of employment practices liability insurance (EPLI). The coverage was developed in 1990, following the rise in employment-related lawsuits that emerged after the passage of the Americans with Disabilities Act of 1990 and the Civil Rights Act of 1991. The coverage protects businesses from the financial consequences of various types of employment lawsuits such as sexual harassment, job-related discrimination, hostile work environment, wrongful termination and retaliation. Other coverages include invasion of privacy, false imprison-ment, breach of contract, emotional distress and wage law violations. Sexual harassment lawsuits filed with the U.S. Equal Employment Opportunity Commission (EEOC) alone rose by more than 12 percent from 2016 to 2017. In 2017, the EEOC recovered almost $70 million in victim restitution, 47 percent more than the $47.5 million it recovered in 2016. Median loss from sexual harassment case verdicts rose from about $136,800 in 2015 to about $221,000 in 2018, according to Advisen and Nationwide. Employers currently are purchasing stand-alone EPLI policies, reversing the trend of including EPLI coverage with D&O insurance, according to the Risk and Insurance Management Society (RIMS). There are about 20 major carriers and about 20 smaller companies that offer the coverage. Insurance research firm found that U.S. companies spent an
Insurance Information Institute | www.ii i.org 2021 Insurance Fact Book 227
9. FACTORS AFFECTING COSTSLitigiousness
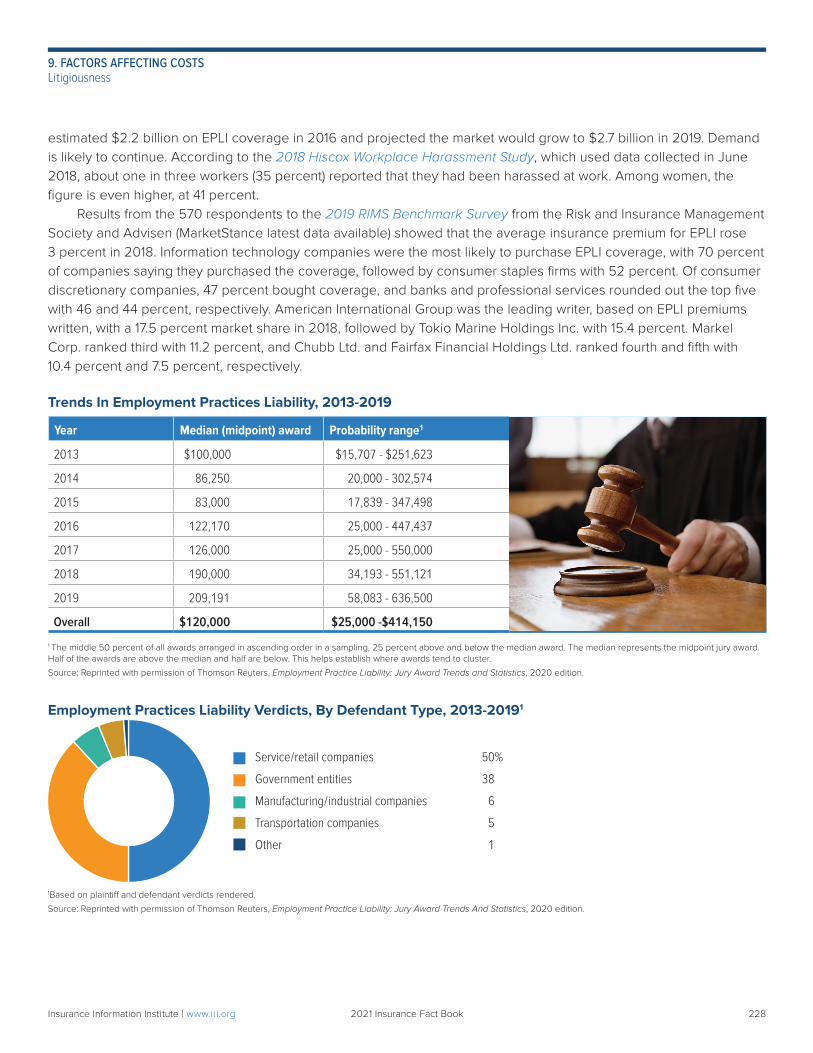
228
estimated $2.2 billion on EPLI coverage in 2016 and projected the market would grow to $2.7 billion in 2019. Demand is likely to continue. According to the 2018 Hiscox Workplace Harassment Study, which used data collected in June 2018, about one in three workers (35 percent) reported that they had been harassed at work. Among women, the figure is even higher, at 41 percent. Results from the 570 respondents to the 2019 RIMS Benchmark Survey from the Risk and Insurance Management Society and Advisen (MarketStance latest data available) showed that the average insurance premium for EPLI rose 3 percent in 2018. Information technology companies were the most likely to purchase EPLI coverage, with 70 percent of companies saying they purchased the coverage, followed by consumer staples firms with 52 percent. Of consumer discretionary companies, 47 percent bought coverage, and banks and professional services rounded out the top five with 46 and 44 percent, respectively. American International Group was the leading writer, based on EPLI premiums written, with a 17.5 percent market share in 2018, followed by Tokio Marine Holdings Inc. with 15.4 percent. Markel Corp. ranked third with 11.2 percent, and Chubb Ltd. and Fairfax Financial Holdings Ltd. ranked fourth and fifth with 10.4 percent and 7.5 percent, respectively.
Trends In Employment Practices Liability, 2013-2019
Year Median (midpoint) award Probability range1
2013 $100,000 $15,707 - $251,623
2014 86,250 20,000 - 302,574
2015 83,000 17,839 - 347,498
2016 122,170 25,000 - 447,437
2017 126,000 25,000 - 550,000
2018 190,000 34,193 - 551,121
2019 209,191 58,083 - 636,500
Overall $120,000 $25,000 -$414,150
1 The middle 50 percent of all awards arranged in ascending order in a sampling, 25 percent above and below the median award. The median represents the midpoint jury award. Half of the awards are above the median and half are below. This helps establish where awards tend to cluster.
Source: Reprinted with permission of Thomson Reuters, Employment Practice Liability: Jury Award Trends and Statistics, 2020 edition.
Employment Practices Liability Verdicts, By Defendant Type, 2013-20191
1Based on plaintiff and defendant verdicts rendered.
Source: Reprinted with permission of Thomson Reuters, Employment Practice Liability: Jury Award Trends And Statistics, 2020 edition.
Service/retail companies 50%
Government entities 38
Manufacturing/industrial companies 6
Transportation companies 5
Other 1
Insurance Information Institute | www.ii i.org 2021 Insurance Fact Book 228
9. FACTORS AFFECTING COSTSLitigiousness
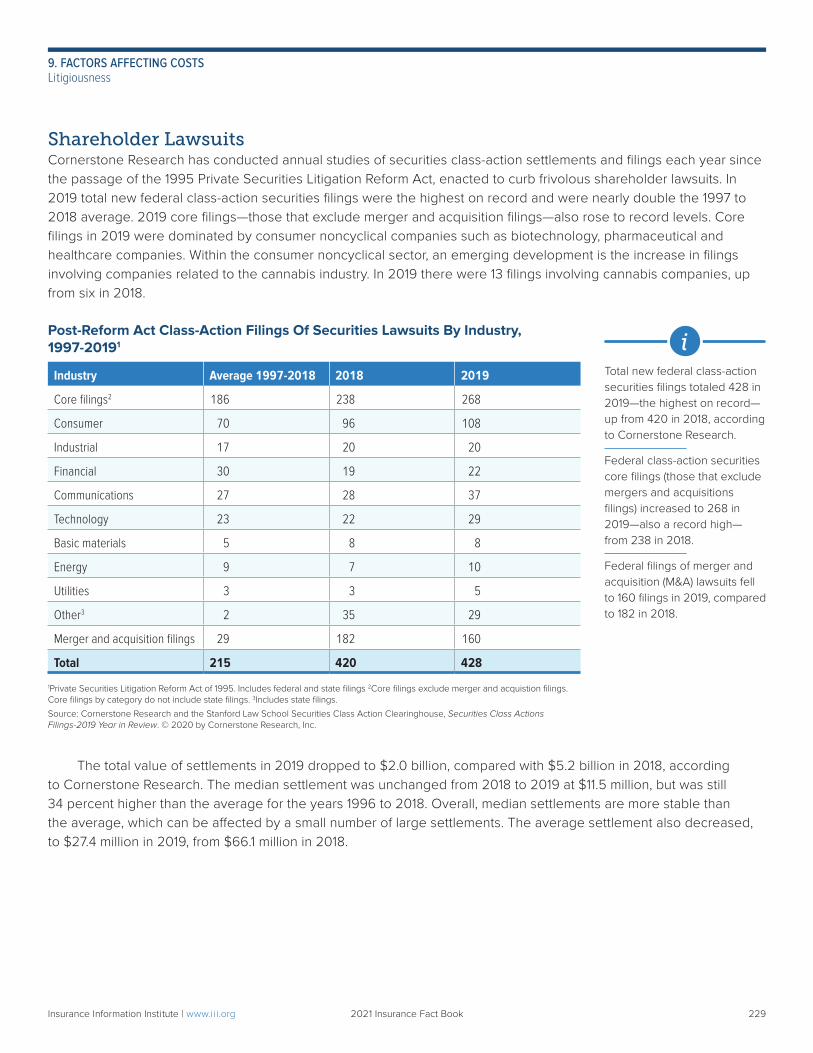
229
Shareholder LawsuitsCornerstone Research has conducted annual studies of securities class-action settlements and filings each year since the passage of the 1995 Private Securities Litigation Reform Act, enacted to curb frivolous shareholder lawsuits. In 2019 total new federal class-action securities filings were the highest on record and were nearly double the 1997 to 2018 average. 2019 core filings—those that exclude merger and acquisition filings—also rose to record levels. Core filings in 2019 were dominated by consumer noncyclical companies such as biotechnology, pharmaceutical and healthcare companies. Within the consumer noncyclical sector, an emerging development is the increase in filings involving companies related to the cannabis industry. In 2019 there were 13 filings involving cannabis companies, up from six in 2018.
Post-Reform Act Class-Action Filings Of Securities Lawsuits By Industry, 1997-20191
Industry Average 1997-2018 2018 2019
Core filings2 186 238 268
Consumer 70 96 108
Industrial 17 20 20
Financial 30 19 22
Communications 27 28 37
Technology 23 22 29
Basic materials 5 8 8
Energy 9 7 10
Utilities 3 3 5
Other3 2 35 29
Merger and acquisition filings 29 182 160
Total 215 420 428
1Private Securities Litigation Reform Act of 1995. Includes federal and state filings 2Core filings exclude merger and acquistion filings. Core filings by category do not include state filings. 3Includes state filings.
Source: Cornerstone Research and the Stanford Law School Securities Class Action Clearinghouse, Securities Class Actions Filings-2019 Year in Review. © 2020 by Cornerstone Research, Inc.
The total value of settlements in 2019 dropped to $2.0 billion, compared with $5.2 billion in 2018, according to Cornerstone Research. The median settlement was unchanged from 2018 to 2019 at $11.5 million, but was still 34 percent higher than the average for the years 1996 to 2018. Overall, median settlements are more stable than the average, which can be affected by a small number of large settlements. The average settlement also decreased, to $27.4 million in 2019, from $66.1 million in 2018.
Total new federal class-action securities filings totaled 428 in 2019—the highest on record—up from 420 in 2018, according to Cornerstone Research.
Federal class-action securities core filings (those that exclude mergers and acquisitions filings) increased to 268 in 2019—also a record high— from 238 in 2018.
Federal filings of merger and acquisition (M&A) lawsuits fell to 160 filings in 2019, compared to 182 in 2018.
Insurance Information Institute | www.ii i.org 2021 Insurance Fact Book 229
9. FACTORS AFFECTING COSTSLitigiousness
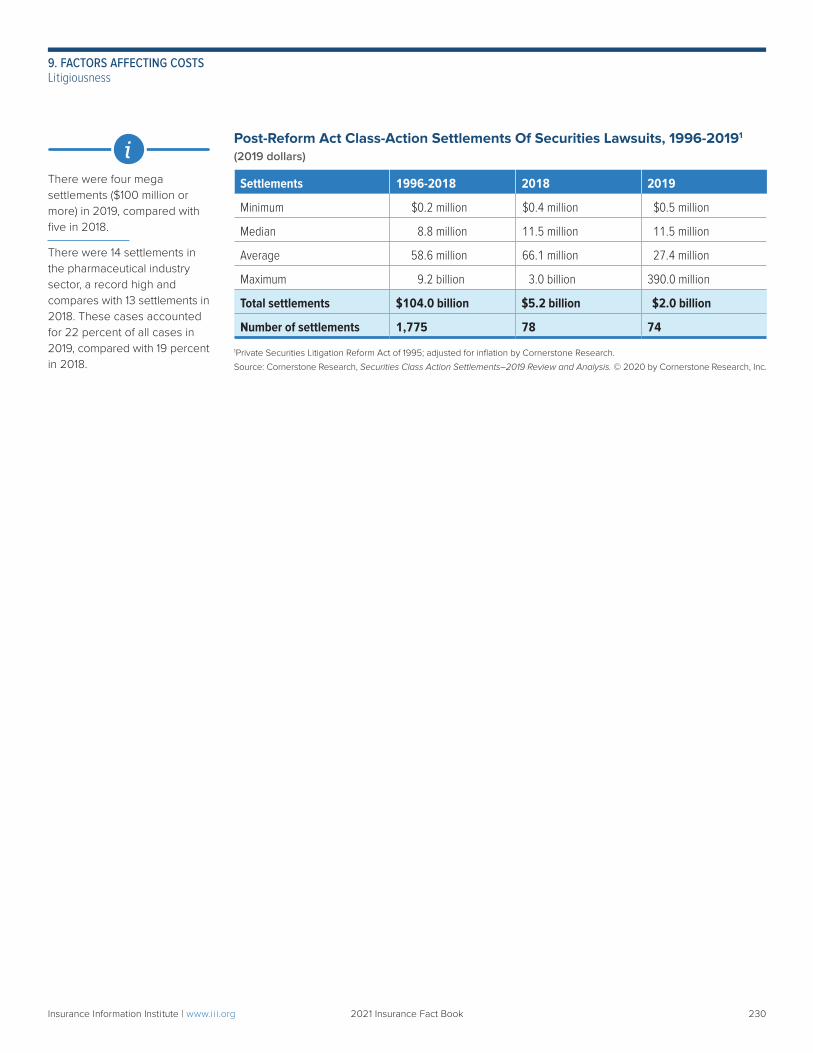
230
Post-Reform Act Class-Action Settlements Of Securities Lawsuits, 1996-20191
(2019 dollars)
Settlements 1996-2018 2018 2019
Minimum $0.2 million $0.4 million $0.5 million
Median 8.8 million 11.5 million 11.5 million
Average 58.6 million 66.1 million 27.4 million
Maximum 9.2 billion 3.0 billion 390.0 million
Total settlements $104.0 billion $5.2 billion $2.0 billion
Number of settlements 1,775 78 74
1Private Securities Litigation Reform Act of 1995; adjusted for inflation by Cornerstone Research.
Source: Cornerstone Research, Securities Class Action Settlements–2019 Review and Analysis. © 2020 by Cornerstone Research, Inc.
There were four mega settlements ($100 million or more) in 2019, compared with five in 2018.
There were 14 settlements in the pharmaceutical industry sector, a record high and compares with 13 settlements in 2018. These cases accounted for 22 percent of all cases in 2019, compared with 19 percent in 2018.
Insurance Information Institute | www.ii i.org 2021 Insurance Fact Book 230
9. FACTORS AFFECTING COSTSLitigiousness
231Insurance Information Institute | www.ii i.org 2021 Insurance Fact Book 231
EMERGING AND EVOLVING INSURANCE ISSUESCOVID-19 and Business Income (Interruption) Coverage
In the year since the 2020 Insurance Fact Book was published, the coronavirus pandemic has become the ultimate emerging and evolving issue, with implications spreading far beyond public health. Business lockdowns and the ensuing economic downturn triggered by the spread of COVID-19 are dramatically affecting insurers and the businesses and individuals they protect. A recent Insurance Information Institute (Triple-I) report says the world’s 10 largest insurance markets are cumulatively expected to see their gross domestic product (GDP) measures decrease by 4.5 percent in 2020 from 2019 because of COVID-19. In response to reduced driving during the pan-demic, U.S. auto insurers returned more than $14 billion to their customers through a combination of refunds, rate reductions and policyholder dividends. According to National Association of Insurance Commissioners (NAIC) data from Standard & Poor’s Global Market Intelligence, insurers issued $4.8 billion in dividends through the second quarter of 2020, amounting to almost $3.4 billion more than the same period a year ago. In addition, the insurance industry has provided approximately $280 million in charitable giving specifi-cally related to the pandemic. Triple-I Chief Actuary James Lynch says automobile claims frequency has declined sharply during the pan-demic, but some coverages showed “disturbing spikes in severity.” Property damage frequency, for example, was down more than 30 percent from a year earlier, but severity was up almost 20 percent. “This was likely caused by faster driving,” Lynch said. “Since the spring lockdowns have eased, custom-ers are driving more again, but they still haven’t returned to the levels of a year ago. Right now, people are driving about 12 percent fewer miles than they did a year ago.” However, there is ample evidence that drivers are still going faster than they did, particularly at rush hour. “That’s why mileage driven this year is down 12 percent, but traffic fatalities are up 4 percent,” Lynch said. “The concern is that frequency patterns will return to the norm, but fast driving will keep claim severity high, putting upward pressure on rates.”
EMERGING AND EVOLVING INSURANCE ISSUES Triple-I has been tracking COVID-19’s diverse insurance impacts and devoted a section of its website—Coronavirus news and updates—to curating its coverage of the pandemic. The section also includes content of the Future of American Insurance & Reinsurance (FAIR) campaign, which informs the public about the impact of COVID-19 on the economy and property/casualty (P/C) insurance.
COVID-19 and Business Income (Interruption) CoverageWhether business income (interruption) coverage (BI) in commercial property policies applies to COVID-19-related losses has become one of the dominant insurance debates during the pandemic. Lawsuits have been filed— some even before insurers have denied a claim— seeking to establish that policyholders are entitled to coverage for losses sustained during government- mandated pandemic shutdowns. The debate often focuses on a simple phrase in the insurance policy: “direct physical loss or damage.” BI coverage only applies to those losses that stem from direct physical loss or damage. Losses that do not come from direct physical damage are not covered. Are business interruptions related to COVID-19 caused by physical damage to property? Insurers say no, arguing that damage to property requires structural alter-ation like one would find in a typical claim, such as if a
232Insurance Information Institute | www.ii i.org 2021 Insurance Fact Book 232
fire destroyed the interior of a building or wind damaged windows and furniture. The virus leaves no visible imprint and after it has been killed, whatever it was attached to is as good as before. Even if some remediation is needed—like cleaning metal surfaces—insurers might argue that this is no different from cleaning dirt off a surface. They can cite cases in which judges have ruled there is no physical damage from mold if the mold can be cleaned off.
Others depart from this common-sense, legally recognized definition. Some plaintiffs’ attorneys argue that if coronavirus is not direct physical damage then insurers would not have created an exclusion for viruses in the first place. Which introduces the second major issue involving COVID-19 and business income (interruption) coverage: most insurers excluded losses from viruses and communicable diseases from their policies after the SARS outbreak in 2003. Nevertheless, multiple initiatives are afoot to compel insurers—through litigation and legislation—to pay such claims, regardless of their being specifically excluded. Mandating such retroactive rewriting of insurance contracts not only would set a precedent with consequences that would ripple out far beyond insurance—it would bankrupt the P/C insurance industry and could make insurance itself an untenable business position, making insurers responsible for perils that they did not calculate into their pricing. The data point invoked by those who would force property/casualty insurers to pay claims explicitly
excluded from the policies they wrote is the industry’s nearly $800 billion policyholder surplus. Many hear “surplus” and think of it as cash that is stashed away for emergencies. However, policyholder surplus is much more compli-cated. It is not a “rainy-day fund;” it is key to making sure insurers keep their promises to pay all future claims, from those for man-made and natural disasters to routine auto and homeowners claims. Insurers are regulated at the state level, and reg-ulators require each insurer to hold a certain amount in reserve to pay claims based on that insurer’s risk profile. The aggregation of these reserves—required by every state for every insurer doing business in those states— accounts for about half of the total industry surplus, according to Dr. Steven Weisbart, Triple-I non-resident scholar: about $400 billion. Each company’s regulator-required surplus can be thought of as that company’s “running on empty” mark— the point at which alarms go off, and regulators require it to set even more aside to make sure no policyholders are left in the lurch. Weisbart says $400 billion is the amount that sets off alarms for the entire industry. However, private rating agencies that gauge insurers’ financial strength and claims-paying ability do not want to see insurer reserves get anywhere near that point. To get a strong rating from AM Best, Fitch, S&P, or Moody’s, insurers must keep even more in reserve. If these additional reserves amount to about $200 billion for the industry, the nearly $800 billion surplus we started with now shrinks to about $200 billion—to cover claims by all personal and commercial policyholders in any given year without prompting regulatory and ratings agency actions that could drive up insurer costs and policyholder premiums. For context, the Property Claim Services (PCS) unit of ISO/Verisk had designated a record number of PCS catastrophe events for the United States for 2020 by early November, including multi-billion losses from five hurricanes and 14 convective storms. Wildfires, including a record-breaking number of acres burned in California, added to the losses, as well as nationwide civil unrest that caused about $1 billion in insured losses, according to PCS. All of these losses are in addition to routine
EMERGING AND EVOLVING INSURANCE ISSUESCOVID-19 and Business Income (Interruption) Coverage
233Insurance Information Institute | www.ii i.org 2021 Insurance Fact Book 233
claims, such as homeowners claims for water damage and freezing, auto claims and the myriad claims filed by businesses. If insurers were required to pay BI claims they never agreed to cover—and, therefore, did not set aside reserves for—the cost to the industry, related to small businesses alone could be as high as $383 billion per month. This would bankrupt the industry, leaving many policyholders uninsured and would make insurance itself a losing business proposition.
Learn more from the Triple-I BlogTrials and errors: Plaintiffs’ attorneys could complicate efforts to help businesses hurt by COVID-19
NC ruling goes against prevailing judicial wisdom on COVID-19 business interruptions
Government should provide business interruption support
UK business interruption litigation seems unlikely to affect us insurers
Business interruption vs. event cancellation: What’s the big difference?
Chubb CEO says business interruption policies are a good value and work as they should
US Treasury weighs in on debate surrounding business interruption insurance
Business interruption coverage: Policy language rules
Triple-I CEO among panelists discussing business interruption insurance legislation
P/C insurance group puts price tag on coronavirus business interruption
Business interruption claims related to COVID-19
COVID-19 and Workers CompensationWorkers compensation is another area affected by the pandemic, with many states changing rules for benefits payouts related to the virus, and several expanding or considering widening access to coverage beyond first responders and healthcare workers. Workers comp provides benefits to employees who suffer work-related injuries or illnesses. It helps pay for medical care, wages from lost work and more. Benefits vary by state. (See Insurance Fact Book, Chapter 7, Commercial Lines.) Questions about compensability ultimately will be answered on a state-by-state basis. Workers comp generally does not cover routine illnesses like a cold or flu because they cannot be tied to the workplace. However, some states have recognized that other conditions are employment related. Before the COVID-19 pandemic, the National Council on Compensation Insurance said that at least 18 states had policies in place that presumed firefighters’ and other first responders’ chronic lung or respiratory illnesses are work-related and therefore covered. COVID-19 presents a unique situation. Workers deemed “essential”—such healthcare workers, mass transit operators and grocery store workers—are at a high risk of exposure to the virus, but this does not guarantee a COVID-19 infection would be covered in most states.
EMERGING AND EVOLVING INSURANCE ISSUESCOVID-19 and Business Income (Interruption) Coverage/COVID-19 and Workers Compensation
234Insurance Information Institute | www.ii i.org 2021 Insurance Fact Book 234
Some states have extended coverage to include first responders, healthcare workers and other essential employees. A common approach is to amend state policy so that COVID-19 infections in certain workers are presumed to be work-related. This puts the burden on the employer and insurer to prove the infection was not work-related, making it easier for workers to file success-ful claims. Some employers and insurers have raised concerns that these presumption policies will increase insurance costs for employers at a time when businesses are already facing significant financial challenges.
Learn more from the Triple-I BlogNew CDC numbers raise concern for health, workers comp insurers
COVID-19 and workers compensation: Impact will become clearer…eventually
Wrap-Up: COVID-19 and workers comp
FAQS about COVID-19’ impact on workers comp
Mixed reactions to workers comp COVID-19 expansions
Workers comp premiums could soar with COVID-19 claims
Will workers comp claims for COVID-19 be paid?
COVID-19 Meets Extreme WeatherFrom hurricanes, tornadoes and hail to wildfires and record-setting heat and cold, extreme weather condi-tions and events are making headlines and show no signs of stopping. Many meteorologists have said they expect high temperatures, severe storms, wildfires and flooding to be the new normal.
The extremely active 2020 Atlantic hurricane season produced a record-breaking 30 named storms, of which 13 became hurricanes.
Convective StormsSevere convective storms—tornadoes, hail, drenching thunderstorms with lightning, and damaging straight-line winds — are among the biggest threats to life and property in the United States. Catastrophe modeling firm RMS says the average annual insured U.S. loss from convective storms nearly equals that from hurricanes, at around $17 billion. They were the costliest natural catastrophes for insurers in 2019, and the 2020 convective storm season turned out to be the worst in nearly a decade. According to Aon, the United States has recorded 14 billion-dollar economic loss events resulting from severe convective storms (which include tornadoes) by December 2020. Included in the tally is the August derecho in the Midwest, which Aon estimates to be the third-costliest severe convective storm in U.S history, with insured losses totaling about $3 billion.
EMERGING AND EVOLVING INSURANCE ISSUESCOVID-19 and Workers Compensation/COVID-19 Meets Extreme Weather
235Insurance Information Institute | www.ii i.org 2021 Insurance Fact Book 235
Although there were fewer tornadoes in 2020 compared to 2019, 78 people perished in tornadoes, compared with 41 in all of 2019, according to the National Oceanic and Atmospheric Administration. This year’s season struck just as COVID-19 began to emerge in the U.S. and complicate emergency preparation and response. For a variety of reasons, it is hard to say whether convective storm activity has increased in recent years. However, as discussed in a 2020 Triple-I paper—Severe Convective Storms: Evolving risks call for innovation to reduce costs, drive resilience—change is underway, and one thing is clear: These storms are becoming more costly. RMS reported that average storm-related personal lines insurance claims grew much faster than general inflation from 2001 to 2017: 11 percent per annum, versus a little over 2 percent. Population growth and economic development have contributed to increasing losses. At the same time, research suggests the geography, frequency and intensity of these storms also may be changing. (See Insurance Fact Book, Chapter 8, Tornadoes.)
Hurricane Season: The Worst of TimesUnder the best of circumstances, the Atlantic hurricane season is a challenging time. Despite improved fore-casting and analytical tools, engineering and pre-storm communication, hurricane-related losses continue to climb. But as Triple-I reported in a recent paper— Hurricane Season: More Than Just Wind and Water— the extremely active 2020 season did not arrive under the best of circumstances. It came on the heels of a pandemic that has not ebbed, and was accompanied by widespread civil unrest and atypical wildfire activity that complicated preparation and post-storm aid. Hurricanes have a long history of driving losses. According to data compiled by Aon, global insured weather-related property losses have outpaced the annual rate of inflation by about 7 percent since 1950. In 2020 there were six hurricanes with multi-billion-dollar losses in a record-tying season of 30 named storms and 13 hurricanes. Nine of the 10 costliest hurricanes in U.S.
history have occurred since 2004, and 2017, 2018 and 2019 represent the largest back-to-back-to-back insured property loss years in U.S. history. While it is tempting to attribute these growing losses to climate change, the data suggest rising hurricane losses—like increasing losses related to severe convec-tive storms—are due primarily to demographic changes: more people moving into hurricane-prone areas and building larger, more expensive homes. (See Insurance Fact Book, Chapter 8, Hurricanes.)
Learn more from the Triple-I BlogHurricane Delta triggered coral reef parametric insurance
Are late, wet hurricanes becoming a trend?
Mitigation matters—and Hurricane Sally proved it
Hurricane season: More than wind and water
Ordered to Evacuate Due to Hurricane Laura? You Might Have Insurance for Additional Living Expenses
Swiss Re: Katrina-like hurricane could cause up to $200 billion in damage today
Hurricane modeling: High-tech meets local insight
Hurricanes don’t just affect coasts, expert say: ‘Get flood insurance’
COVID-19 wrap-up: Pandemic complicates hurricane preparation
A better tool to predict impact of hurricanes?
EMERGING AND EVOLVING INSURANCE ISSUESCOVID-19 Meets Extreme Weather
https://www.iii.org/insuranceindustryblog/insured-lossesdue-to-civil-unrestseen-nearing-1992-levels/
236Insurance Information Institute | www.ii i.org 2021 Insurance Fact Book 236
If It Can Rain, It Can FloodAbout 90 percent of natural disasters in the U.S. involve flooding. This is why experts like Dan Kaniewski— managing director for public sector innovation at Marsh & McLennan and former deputy administrator for resil-ience at the Federal Emergency Management Agency (FEMA)—strenuously urge property owners to buy flood insurance.
Flood damage is excluded under standard homeowners and renters insurance policies. However, flood coverage is available as a separate policy from the National Flood Insurance Program (NFIP), administered by FEMA and from some private insurers. Flood was long considered an untouchable risk by private insurers because they did not have a reliable way to measure the risk. However, in recent years insurers have become more comfortable using sophisticated models to underwrite and price flood insurance, and modeling firms are getting better at predicting the risk. There were 41 private companies writing private flood insurance in 2019, compared with 32 in 2018, according to NAIC data compiled by S&P Global Market Intelligence. Increasing insurance capacity made available by the private market helps spread the risk associated with flooding, and growing competition should make the coverage—especially in communities not designated as flood zones—more affordable.
“The private flood insurance market in the United States has really started to gain traction over the past few years, but there’s still a large untapped opportunity out there,” said Marla Schwartz-Pourrabbani, a natural catastrophe specialist with Swiss Re. “Many people— even inside designated flood zones—don’t have coverage or are unaware that homeowners policies typically exclude coverage for flood damage.” A McKinsey & Co. analysis of flood insurance purchase rates in areas most affected by three Category 4 hurricanes that made landfall in the United States in 2017—Harvey, Irma, and Maria—found that as many as 80 percent of homeowners in Texas, 60 percent in Florida, and 99 percent in Puerto Rico lacked flood insurance. To make matters worse, a recent analysis by the nonprofit First Street Foundation found the United States to be woefully underprepared for damaging floods. Plans to reform the NFIP with a shift to fully risk-based pricing are expected to be implemented by October 2021. FEMA said the program would begin to assess properties individually, instead of calculating rates based on whether a home falls in a designated flood zone. This could drive more flood risk into private reinsurance and risk markets. (See Insurance Fact Book, Chapter 7, Flood Insurance.)
Learn more from the Triple-I BlogIf it can rain, it can flood: Buy flood insurance
Ahead of Hurricane Sally’s rains, many lack flood insurance
Hurricane Hanna leaves wind damage and flooding in its wake
Understanding FEMA and other flood maps
Hurricanes don’t just affect coasts; Experts say: ‘Get flood insurance’
Mississippi flood insurance purchases low, despite wetter rainy seasons—and they’re not alone
Nearly 80 percent of homeowners in coastal Carolinas uninsured for flood
EMERGING AND EVOLVING INSURANCE ISSUESCOVID-19 Meets Extreme Weather
https://firststreet.org/flood-lab/published-research/2020-national-flood-risk-assessment-highlights/
https://www.iii.org/insuranceindustryblog/ahead-of-hurricane-sallys-rains-many-lack-flood-insurance/
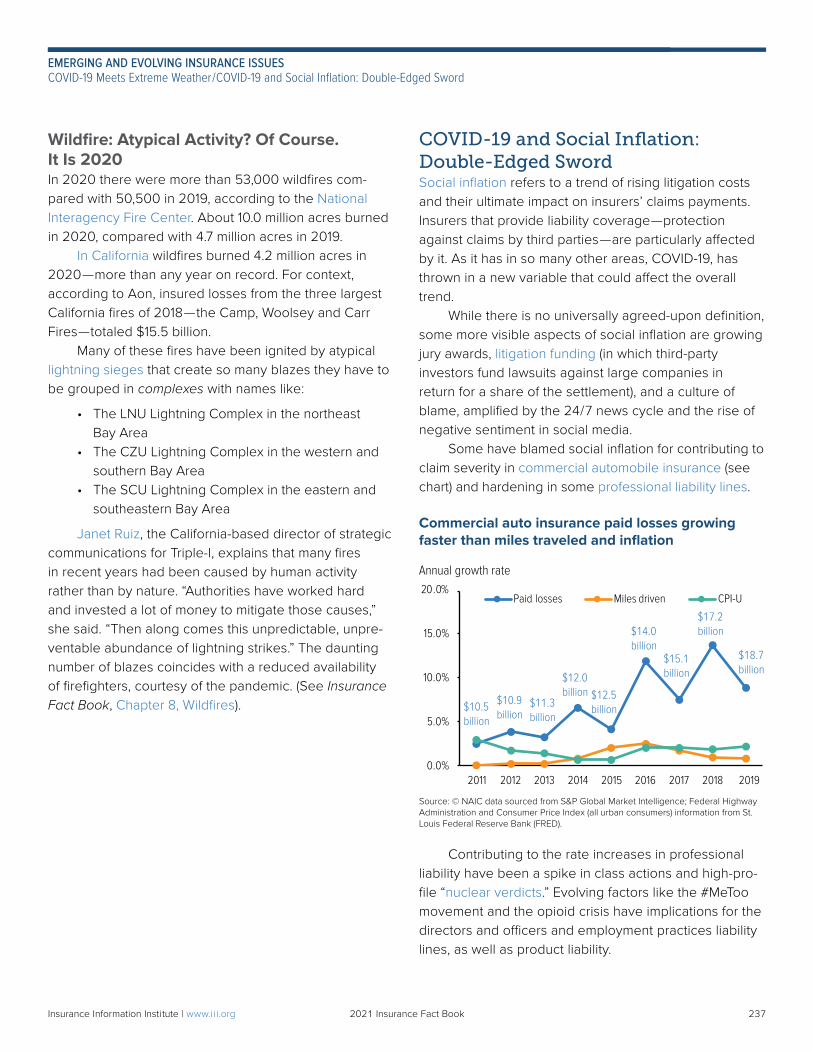
237Insurance Information Institute | www.ii i.org 2021 Insurance Fact Book 237
EMERGING AND EVOLVING INSURANCE ISSUESCOVID-19 Meets Extreme Weather/COVID-19 and Social Inflation: Double-Edged Sword
Wildfire: Atypical Activity? Of Course. It Is 2020In 2020 there were more than 53,000 wildfires com-pared with 50,500 in 2019, according to the National Interagency Fire Center. About 10.0 million acres burned in 2020, compared with 4.7 million acres in 2019.
In California wildfires burned 4.2 million acres in 2020—more than any year on record. For context, according to Aon, insured losses from the three largest California fires of 2018—the Camp, Woolsey and Carr Fires—totaled $15.5 billion.
Many of these fires have been ignited by atypical lightning sieges that create so many blazes they have to be grouped in complexes with names like:
• The LNU Lightning Complex in the northeastBay Area
• The CZU Lightning Complex in the western andsouthern Bay Area
• The SCU Lightning Complex in the eastern andsoutheastern Bay Area
Janet Ruiz, the California-based director of strategic communications for Triple-I, explains that many fires in recent years had been caused by human activity rather than by nature. “Authorities have worked hard and invested a lot of money to mitigate those causes,” she said. “Then along comes this unpredictable, unpre-ventable abundance of lightning strikes.” The daunting number of blazes coincides with a reduced availability of firefighters, courtesy of the pandemic. (See Insurance Fact Book, Chapter 8, Wildfires).
COVID-19 and Social Inflation: Double-Edged SwordSocial inflation refers to a trend of rising litigation costs and their ultimate impact on insurers’ claims payments. Insurers that provide liability coverage—protection against claims by third parties—are particularly affected by it. As it has in so many other areas, COVID-19, has thrown in a new variable that could affect the overall trend.
While there is no universally agreed-upon definition, some more visible aspects of social inflation are growing jury awards, litigation funding (in which third-party investors fund lawsuits against large companies in return for a share of the settlement), and a culture of blame, amplified by the 24/7 news cycle and the rise of negative sentiment in social media.
Some have blamed social inflation for contributing to claim severity in commercial automobile insurance (see chart) and hardening in some professional liability lines.
Commercial auto insurance paid losses growing faster than miles traveled and inflation
Contributing to the rate increases in professional liability have been a spike in class actions and high-pro-file “nuclear verdicts.” Evolving factors like the #MeToo movement and the opioid crisis have implications for the directors and officers and employment practices liability lines, as well as product liability.
Source: © NAIC data sourced from S&P Global Market Intelligence; Federal Highway Administration and Consumer Price Index (all urban consumers) information from St. Louis Federal Reserve Bank (FRED).
0.0%
5.0%
10.0%
15.0%
20.0%
2011 2012 2013 2014 2015 2016 2017 2018 2019
Paid losses Miles driven CPI-U
Annual growth rate
$17.2 billion
$10.5 billion
$10.9 billion
$11.3 billion
$12.5 billion
$12.0 billion
$14.0 billion
$15.1 billion
$18.7 billion
238Insurance Information Institute | www.ii i.org 2021 Insurance Fact Book 238
EMERGING AND EVOLVING INSURANCE ISSUESCOVID-19 and Social Inflation: Double-Edged Sword/COVID-19 and Cybersecurity
And then came COVID-19. If social inflation was complicated before the pandemic and subsequent economic lockdown, with some calling it a hoax, the subject must now be looked at through the additional lens of COVID-19’s long-term impact on liability questions, plaintiff expectations, and juror attitudes. AM Best said early in the crisis that COVID-19 could produce a big increase in social inflation. The reason: expectations that businesses would sue their insurers in an attempt to access their business income (interruption) coverage for losses relating to the coronavirus pandemic. Such lawsuits continue. On the other hand, some have said court closures and administrative slowdowns related to COVID-19 may be causing some plaintiffs to become more willing to accept settlements they previously would have rejected in pursuit of larger payouts.
Learn more from the Triple-I BlogLawyers’ group approves best practices to guide litigation funding
Social inflation and COVID-19
IRC study: Social inflation is real, and it hurts consumers, businesses
Florida dropped from 2020 ‘Judicial Hellholes’ list
Florida’s AOB crisis: A social-inflation microcosm
COVID-19 and CybersecurityCyberrisk has been with us for decades, but its nature and potential severity have changed dramatically since the 1970s and 1980s and with increasing speed, as our work and personal lives have become intertwined via the internet. Identity theft concerns have grown as computer networks facilitated the rise of consumer credit and online transactions and, more recently, various forms of malware have taken center stage in attacks. Cyberrisk has been further exacerbated by COVID-19 as many employees are working regularly from home for the first time.
“Anytime you’re taking about employees who are not used to working from home, who may not have the correct cybersecurity posture, a virtual private network (VPN) is critically important and having two-factor authen-tication is critically important,” Aon Senior Vice President Stephanie Snyder said. “We are already seeing targeted phishing campaigns globally,” said New Zealand Health IT Chief Executive Scott Arrol. “The cyber virus taking advantage of the biological virus.” Arrol also said that hackers seeking to exploit fears of COVID-19 are sending fake ads or links with online viruses. Cyberrisk requires continuous monitoring and mitigation. Large companies are better equipped than smaller ones than individuals to guard against the risks and soften the impact of events through insurance. As a result, smaller firms are vulnerable and increasingly targeted.
239Insurance Information Institute | www.ii i.org 2021 Insurance Fact Book 239
Because the threats are always evolving, cyber insurance is hard to underwrite and price with confidence due to limited standardized historical loss data. In addition to offering a range of products to address cyberperils, insurers and brokers work closely with customers to identify and address business and industry-specific risks. They also are working with third parties to address the data dearth that complicates underwriting.
Learn more from the Triple-I BlogRansomware claims rise in severity since start of pandemic
COVID-19 meets cyberrisk
Consumers lack understanding of personal cyber insurance: Triple-I/J.D. Power survey
Emerging cyber terrorism threats and the Federal Terrorism Risk Insurance Act
Cyber claims get paid; Why do many businesses believe they don’t?
Life & death: Cyberattacks interrupt more than business
EMERGING AND EVOLVING INSURANCE ISSUESCOVID-19 and Cybersecurity
I.I.I. Store
The I.I.I. Store is your gateway to a wide array of books and brochures from the Insurance Information Institute (Triple-I). Publications are available in print and PDF formats. Quantity discounts are available for many products. You may order online, call 212-346-5500, or email [email protected].
Insurance Fact Book Thousands of insurance facts, figures, tables and graphs, designed for quick and easy reference.
Insurance HandbookA guide to the insurance industry for reporters, public policymakers, students, insurance company employees, regulators and others.
Insuring Your Business: A Small Business Owners’ Guide To InsuranceA comprehensive insurance guide for small business owners.
A Firm Foundation Online: How Insurance Supports The Economy Shows the myriad ways in which insurance provides economic support—from offering employment and fueling the capital markets, to providing financial security and income to individuals and businesses. Provides national and state data. Selected state versions are also available.
Commercial Insurance OnlineA guide to the commercial insurance market—what it does, how it functions and its key players.
Triple-I Insurance DailyKeeps thousands of readers up-to-date on important events, issues and trends in the insurance industry, available by subscription. Transmitted early each business day via email. Contact: [email protected].
Social Media
Find us on:
iiiorg iiivideo
@iiiorg insurance-information-institute
The Triple-I BlogImproving understanding of insurance.
Resilience AcceleratorAn initiative of the Insurance Information Institute created to build awareness and adoption of insurance as a front-line defense against the impact of extreme weather events on households, businesses and communities.
Know Your Plan™ is the award-winning app that helps you, your family, and even your pets prepare to safely get out of harm’s way before trouble starts. Use preloaded checklists to discover key mitigation and preparation steps, or create your own lists from scratch. Either method lets you set due dates, chart progress, and include notes, contact lists and other information—and share your checklists with family and friends.
240Insurance Information Institute | www.ii i.org 2021 Insurance Fact Book 240
APPENDICESTriple-I Resources
Triple-I Member Companies AEGIS Insurance Services Inc. Allianz of America, Inc.Allstate Insurance CompanyAmerican Agricultural Insurance CompanyAmerican Family InsuranceAmerican Integrity Insurance GroupAmerisureArgo GroupBITCO Insurance CompaniesBuckleCanal InsuranceChesapeake Employers Insurance CompanyChubb GroupChurch Mutual Insurance Company, S.I.Concord Group InsuranceCOUNTRY FinancialCountry-Wide Insurance Company CSAA Insurance GroupCUMIS Insurance Society/CUNA MutualEMC Insurance CompaniesEncova Mutual Insurance GroupErie Insurance GroupFarm Bureau Town and Country Insurance Company of Missouri Farmers Group, Inc.Farmers Mutual of NebraskaFarmers Mutual of Tennessee Gen ReGlobal IndemnityGrange InsuranceGrange Insurance AssociationIFG CompaniesThe Hanover Insurance Group Inc.The Harford Mutual Insurance CompaniesThe Hartford Financial Services Group, Inc.The Horace Mann CompaniesIsland Insurance CompaniesKemper CorporationLiberty MutualLititz Mutual Insurance Company
Lloyd’sMAPFRE USAMaine Employers’ Mutual Insurance Company (MEMIC)MetLife Auto & HomeMillville Mutual Insurance CompanyMissouri Employers Mutual InsuranceMMG InsuranceMunich Re America, Inc.Mutual Assurance Society of VirginiaMutual of Enumclaw InsuranceNationwide Mutual Insurance CompanyThe Norfolk & Dedham GroupNuclear Electric Insurance LimitedOhio Mutual Insurance GroupPennsylvania Lumbermens Mutual Ins. Co.Providence MutualSECURA Insurance CompaniesSociety InsuranceState Farm Insurance Swiss Reinsurance America CorporationUSAAUtica National Insurance GroupWestfield GroupW. R. Berkley CorporationZurich North America
Associate MembersAonArthur J. GallagherCalifornia Earthquake AuthorityCrawford & CompanyDeloitteImperial PFSInsurance Council of Texas (ICT)LocktonOhio Insurance InstitutePennsylvania Association of Mutual Insurance Companies (PAMIC)Sompo Japan Research Institute, Inc. Transunion Insurance ServicesWisconsin Association of Mutual Insurance Companies (WAMIC)
MEMBERS
241Insurance Information Institute | www.ii i.org 2021 Insurance Fact Book 241
APPENDICESMembers
Insurance Information Institute110 William StreetNew York, NY 10038212-346-5500 | www.iii.org
STAFFMichael Barry Senior Vice President, Head of Media Relations & Public Affairs [email protected]
Brent Carris Research Analyst [email protected]
Katrina Cheung Communications Manager [email protected]
Max Dorfman Research Writer [email protected]
Jeff Dunsavage Senior Research Analyst [email protected]
Laura L. Favinger Chief Administrative Officer [email protected]
Mary-Anne Firneno Research Manager [email protected]
Mark Friedlander Director – Corporate Communications [email protected]
Valerie Germain Executive Assistant to Sean Kevelighan & Corporate Secretary [email protected]
Jennifer Ha Head of Editorial and Publications [email protected]
Scott Holeman Director – Media Relations [email protected]
Sean Kevelighan Chief Executive Officer [email protected]
Michel Leonard, Ph.D., CBE Vice President and Senior Economist [email protected]
Katja Charlene Lewis Web Content Manager [email protected]
Shorna Lewis Director – Operations [email protected]
Chi Wai Lima Creative Director [email protected]
James Lynch, FCAS, MAAA Chief Actuary and Senior Vice President – Research and Education [email protected]
Kris Maccini Director – Social Media [email protected]
Marielle Rodriguez Brand and Design Coordinator [email protected]
Janet Ruiz Director – Strategic Communication [email protected]
Maria Sassian Research Director [email protected]
Deena Snell Membership Director [email protected]
REPRESENTATIVEWilliam J. Davis Georgia Media Relations [email protected]
242Insurance Information Institute | www.ii i.org 2021 Insurance Fact Book 242
APPENDICESStaff/Representative
$116.00 USA
110 William Street, New York, NY 10038 | 212.346.5500
www.ii i.orgThe online source for up-to-date information on topics and issues that affect the insurance industry and its customers.
At the Triple-I, we want people to have the information they need to make educated decisions, manage risk, and appreciate the essential value of insurance. With more than 60 insurance company members—including regional, super-regional, national and global carriers—we are the #1 online source for insurance information.
Our website, blog and social media channels offer a wealth of data-driven research studies, white papers, videos, articles, infographics and other resources solely dedicated to explaining insurance and enhancing knowledge. Unlike other sources, our sole focus is creating and disseminating information to empower consumers. We neither lobby nor sell insurance. We provide objective, fact-based information about insurance —information that is rooted in economic and actuarial soundness.
If your business, organization, or educational institution is interested in membership, please visit www.iiimembership.org.
Related Documents