Welcome message from author
This document is posted to help you gain knowledge. Please leave a comment to let me know what you think about it! Share it to your friends and learn new things together.
Transcript


2021 Budget Executive Summary Town of Oakville | E - 2

2021 Budget Executive Summary Town of Oakville | E - 3
Vision
To be the most livable town in Canada
Council’s 2019–2022 Strategic Plan For our mission, vision and values to have significant impact on the organization, they also have to be accompanied by deliberate plans of actions to move us toward our desired future. Council’s 2019–2022 Strategic Plan outlines the goals, actions and measures that will help us to achieve Council’s strategic directions. The focus of this strategic plan is on the strategies, actions and measures to achieve Council’s five areas of focus for 2019–2022.
The town’s strategic plan is a continual work in progress. Over time, new priorities, new opportunities, new demands and new challenges will emerge, and incorporating annual business plans into the town’s strategic planning process ensures us the flexibility to respond quickly and effectively to these changing directions.

2021 Budget Executive Summary Town of Oakville | E - 4
Town of Oakville Strategic Plan Values
Accountability Dedication Honesty Innovation Respect Teamwork
Determine strategies and actions for each area of focus
Establish measures
Departmental business plans to achieve all other strategic goals
Track accomplishments / communicate results

2021 Budget Executive Summary Town of Oakville | E - 5
The following is an overview of the key objectives that fall within the five focus areas of the strategic plan:

2021 Budget Executive Summary Town of Oakville | E - 6
Annual Business Planning Process The 2019-2022 Strategic Plan is the essential driver of the town’s annual business planning process. Council’s strategic goals are incorporated into annual departmental business plans and budgets.
The annual budget development begins with internal staff review in which individual programs under go a line-by-line review to ensure the proposed budget is in line with service objectives and adjusted where appropriate to ensure budgets are reasonable and reflect average spending levels. In order to promote continuous improvement, all service areas are encouraged to review service delivery processes and find more effective ways to deliver service and potential cost savings.
Following internal staff reviews, the budget is reviewed by the internal Executive Management Team where the budget is evaluated from a corporate perspective to ensure it is within Council’s guideline of inflation and continuing to build on the five Strategic Objectives: Livability, Engaged Community, Accountable Government, Environment & Mobility. For information on how the town develops its budget, visit the Oakville.ca and watch the “Budget 101” video.
https://www.oakville.ca/townhall/budget-basics.html
How the Budget is Approved Following the internal staff review process, the proposed budget is presented to the Budget Committee for their review. Council is provided with an Executive Summary, the proposed budget book and several staff presentations. The
June
-Se
pt
Budget Development & Review
Oct
-N
ov
Exective Managment Review
Nov
embe
r
Budget Committee ReviewOverview Presentations N
ov -
Dec
Public Engagement
Dece
mbe
r
Budget Committee Recommendations
Dece
mbe
r
Council Approval

2021 Budget Executive Summary Town of Oakville | E - 7
Budget Committee then holds two public meetings where members of the public can participate in the budget process and ask questions. Members of the public can also send questions and comments into [email protected]. Once public input has been received the Budget Committee makes their recommendations and propose adjustments to staff which are then presented to Council for final approval.
Key Budget Dates The following meetings are scheduled for the review and approval of the 2021 Operating and Capital Budget:
Date Item
November 17, 2020 Budget Document & Overview Presentation
November 19, 2020 Commission Presentations
November 25, 2020 Virtual Budget Open House
December 1st and 3rd, 2020 Public Delegations
December 15, 2020 Budget Committee Deliberations & Recommendation
December 21, 2020 Council Approval

2021 Budget Executive Summary Town of Oakville | E - 8
2021 Budget Overview
The 2021 Proposed Budget represents a public investment of $429.2 million to provide the desired programs, services and infrastructure to residents of Oakville, while advancing Council’s strategic priorities and values. When offset by User Fees, Grants, Internal Recoveries and other revenues, the total tax property tax levy requirement is $214.7 million.
$429.2 M Gross Investment in Services
$348.3 M
$80.9 M
2021 Operating Budget
2021 Capital Budget
Net Property Tax Levy $214.7 M

2021 Budget Executive Summary Town of Oakville | E - 9
The town of Oakville’s budget is prepared using a performance based program based budgeting (PB2) methodology. PB2 focuses on programs rather than departments and emphasis is on the allocation of resources based on desired outcomes and measurement of actual program results against expected outcomes. Town programs have been
LIVABILITY•Planning•Building•Development
Engineering•Economic
Development•Emergency
Services• Strategic
Business Services
ENGAGED COMMUNITY
•Recreation & Culture
•Oakville Library•Municipal
Enforcement• Service Oakville•Political
Governance• Strategic Policy &
Communications• Facilities &
Construction Management
ACCOUNTABLE GOVERNEMENT•Admin
Executive Mgmt
•Asset Managment
• Information Technology
•Regulatory Services
•Corporate Support (HR, Finance, Legal)
ENVIRONMENT•Parks & Open
Spaces•Harbours•Cemetery• Storm Water
Capital•Green Fleet &
Energy Management Capital
MOBILITY• Infrastructure
Planning• Infrastructure
Maintenance•Transit•Parking

2021 Budget Executive Summary Town of Oakville | E - 10
organized to support the five Strategic Plan key focus areas and while they may have specific initiatives or projects at a given time that support several key focus areas, each program’s primary focus falls within one area:
Based on the above categorization, the town’s investment into town programs and services can be summarized into the five key focus areas:
LIVABILITY ENGAGED COMMUNITY
ACCOUNTABLEGOVERMENT
ENVIRONMENT MOBILITY
Total Gross Operating
Investment*
$ 65.8 $ 63.4 $ 28.5 $ 28.5 $ 81.6
Total Capital Investment $ 5.4 $ 8.3 $ 4.1 $ 37.1 $ 26.1
Total Gross Investment* $ 71.3 $ 71.7 $ 32.6 $ 65.6 $ 107.7
Total Net Tax Levy* $44.5 $45.0 $25.5 $19.3 $54.7
(Millions)
*Note: Total Gross Investment and Net Tax Levy excludes Corporate Revenue and Expenses that include financial expenses and revenues that do not relate to one particular program area.

2021 Budget Executive Summary Town of Oakville | E - 11

2021 Budget Executive Summary Town of Oakville | E - 12
2021 Strategic Investments and Initiatives
Both ongoing work and new initiatives advance the town toward its Vision. The section that follows identifies some key initiatives in 2021 that support the Strategic Plan key focus areas. Full details for all program Business Plans are available in the other respective sections of the 2021 Budget and Business Plan.
Livability
• $0.8 million to undertake planning work in support of the Livable Oakville plan by completing studies to maintain the character of the community and accommodate growth such as the Uptown and Palermo Growth Area studies, Bronte GO mixed-use node study and Urban Mobility strategy.
• $0.3 million to begin analysis, modeling and preliminary design work to support the implementation and advancement of the Midtown Urban Growth Centre.
• Resources to continue implementation of the Cultural Heritage Landscape strategy and heritage property designation strategy.
• Dedicated resources in 2021 to support the defence of the town’s Livable Oakville Plan.
• Implement the five- year Economic Development Strategy which includes lead servicing, corporate calling, marketing, research, auto mayors’ initiatives and liaison for commercial filming.
• Develop initiatives to assist businesses with economic recovery from the COVID-19 pandemic including the Digital Main Street program.
• $1.0 million to annualize the operation of a new Fire Station to enhance fire response times in the North-west quadrant of Oakville.
Community Engagement
• $0.5 million in funding to continue the website audit and refresh to support the development of new or enhanced tools to promote on-line public engagement.
• $ 0.9 million to annualize the operation of the new Oakville Trafalgar Community Centre and provide a range of program offerings.
• $ 0.4 million in capital to develop outdoor programming space at the Glen Abbey Library and expand Incubator Library locations.

2021 Budget Executive Summary Town of Oakville | E - 13
• Continue to apply an inclusion lens to all town programs and services by undertaking an assessment and review of HR policies, practices and tools to identify systemic barriers to diversity and inclusion in our processes and propose solutions to eliminate them.
• $0.5 million to finalize the North Park Master plan concept, obtain community input and complete detailed design.
• Continue to implement the Municipal Enforcement Strategy by including $0.8 million in additional one-time funds to support enhanced parks enforcement initiatives through-out the pandemic.
• Complete reviews of various licensing and enforcement by-laws such as the Noise by-law, Licensing by-law and Property Standards and Lot Maintenance by-laws.
Mobility
• $0.8M in funding for the Chartwell Road Grade Separation environmental assessment as part of the planning of new infrastructure required to promote the Midtown Urban Growth Centre
• $6.8M in active transportation programs and initiatives, as well as projects to design and construct cycle lanes, multi-use trails and sidewalks (Crosstown Trail expansion, Lakeshore Road multi-use trail and road improvements on Speers Road, North Service
Road, Wyecroft Road and Allan Street) to support opportunities for multi-modal transportation.
• $2.5 million in Traffic Management and Traffic Calming infrastructure and studies to promote safe travel and pedestrian safety on town roads.
• $1.9 million to enhance Oakville Transit service delivery through accessibility improvements to bus stops, additional specialized vehicle purchases to support home to hub and AODA requirements and On-Demand call centre scheduling software improvements.
• $0.3 million in additional operating funds to support winter control, road maintenance and street lighting in newly developed communities in North Oakville.
• $0.2 million in savings incorporated into the 2021 operating budget as a result of the initial implementation of the Fleet Optimization study.
Environment
• $14.4 million in Green Fleet infrastructure for installation of community wide and Transit EV charging infrastructure and purchase of electric conventional and specialized transit vehicles, ice resurfacers and hybrid building services inspection vehicles.
• $9.5 million in infrastructure improvements to create a climate change resilient community through storm sewer improvements, creek

2021 Budget Executive Summary Town of Oakville | E - 14
erosion and channel improvements and flooding protection and shoreline assessments specific examples in 2021 include Maplehurst, Woodhaven and Westminster Storm Sewers, Munn’s and Morrison Creek reaches and Shorewood Promenade.
• $4.6 million in capital funds to develop new neighbourhood parks, parkettes and trails in North Oakville and $0.3 million in additional operating funds to support on-going maintenance and upkeep of new park infrastructure.
• $3.2 million to support the overall health and viability of the towns tree canopy and natural environment through the EAB program, invasive species audit and control and woodlot preventative maintenance and tree planting programs.
• $0.2 million to facilitate partnerships to implement the Community Energy Plan and implement the Oakville Strategy for Biodiversity both recently approved by Council.
• Continue to promote environmentally sustainable practices through development of various strategies such as the Parkland and Open Space Dedication strategy, update of the Corporate Energy Conservation & Demand Management Plan, Sustainable Building Design Policy and Guidelines and updating the Official Plan, Urban Design Standards and Asset Management Plans to incorporate climate change adaptation policies.
• $0.3 million in savings for water, electricity and natural gas incorporated into the 2021 budget across various programs as a result of energy conservation initiatives.
Accountable Government
• $0.7 million in efficiencies incorporated into the 2021 budget and a further $1.0 million identified as future savings as a result of continuous improvement and innovation opportunities to enhance cost effective delivery of town programs and services via the Facility Review, Recreation Services Review, Plan-It Services Review and other initiatives.
• $1.6 million in funding to implement on-line and digital solutions to increase customer satisfaction such as implementation of one-line application and permit services related to land development, Service Oakville system improvements, single sign-on public portal, On-line licensing and digital arrival display screens on buses.
• $0.7 million in cyber security and technology infrastructure improvements to protect the town from vulnerabilities and improve detection.
• Update the Development Charges by-law to incorporate the recent Bill 197 amendments including the removal of the 10% mandatory discount for soft services increasing the amount of funds collected for growth infrastructure.

2021 Budget Executive Summary Town of Oakville | E - 15
Livable Oakville Performance Dashboard
One of the key objectives of Council’s Strategic Plan is to establish measures, track accomplishments and communicate the results. The Livable Oakville Performance Dashboard has been created to demonstrate our progress towards achieving our vision. Results can be found via the following link:
www.oakville.ca/dashboard/index.html
In addition to the performance measures included in the budget document, the town achieved ISO 37120 platinum certification with the World Council on City Data in 2016, 2017 and 2018. ISO 37120 Sustainable Development of Communities: Indicators for City Services and Quality of Life is comprised of 100 performance measures that track a city’s progress in delivering services and ensuring quality of life for its community. Platinum certification acknowledges that the town has achieved the highest standard in data collection and research to drive the delivery of high quality programs and services to the community.
2021 Budget Executive Summary Town of Oakville | E - 16
2021 Tax Levy Requirement
The total 2021 tax levy requirement to support town programs is $ 214,737,900. The largest share of the tax dollar is spent on Infrastructure Renewal followed by Emergency Services, Oakville Transit and the Road Network. The table below shows how $100 dollars paid in taxes goes to support the various programs and services provided by the town.
How Your Tax Dollars Are Spent
Per $100 Paid of Taxes

2021 BUDGET OVERVIEW OPERATING AND CAPITAL
2021 Budget Overview Town of Oakville | E-17
Overall, the 2021 operating and capital budgets ensure the town’s strong financial position is maintained and our residents continue to receive the programs and services they value. The 2021 budget has been prepared in accordance with Council direction to prepare the budget with an overall property tax increase in line with inflation.
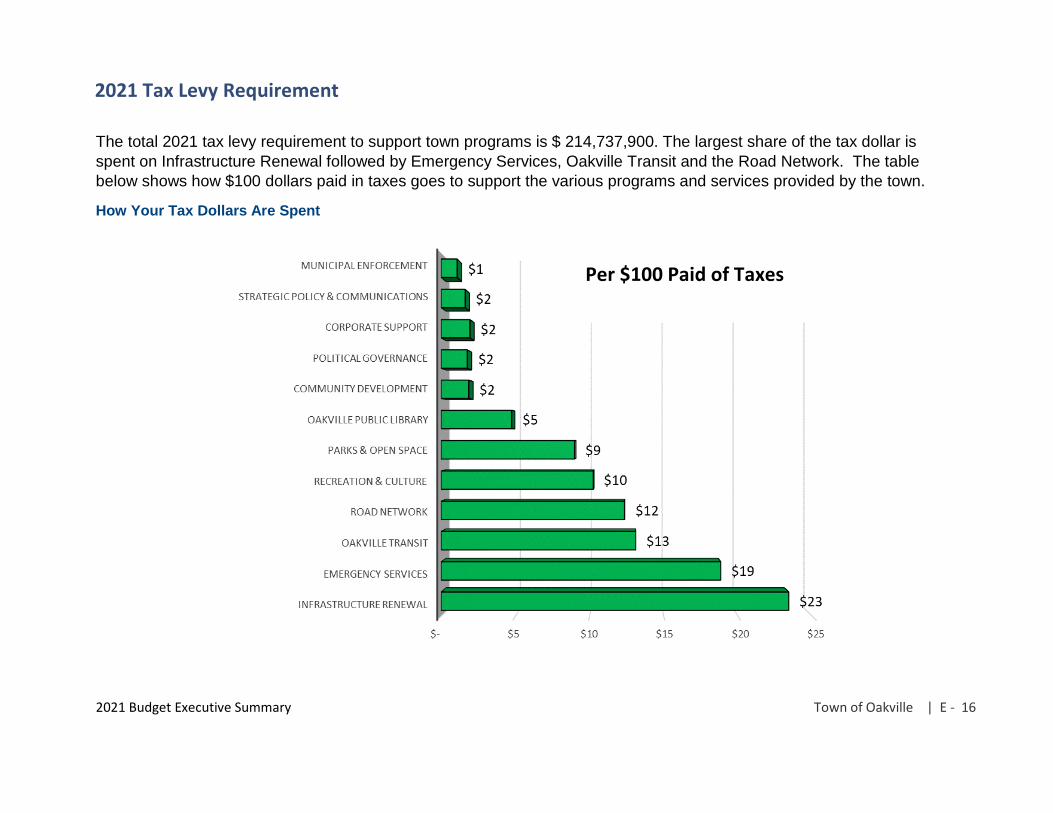
The total proposed 2021 tax increase to the town’s net budget is 2.29%. When combined with the proposed increase for the Region and Education the overall tax increase is 1.63%.
Assessment growth resulting from additional properties added to the roll or expansions/additions to existing properties reduces the overall tax increase. The 2021 staff recommended budget includes assessment growth of 1.30%, resulting in the proposed 2.29% tax increase for the town’s portion. The increase in property values does not provide additional revenue to the town. The tax rate is adjusted to ensure the town raises the same tax revenue under the new property values as it did prior to the reassessment.
Over the past several months, detailed work was completed to review previous year’s spending and revenue trends and adjust program budgets where necessary to bring them in line with actuals. As a result, there are several pressures that had to be accommodated within the proposed budget. These include, rising costs due to market conditions for various materials and supplies, personnel increases to include negotiated labour contracts and step progression, increased software costs related to new systems and rising maintenance fees and annualized operating costs of the new Fire Station #8 and Oakville Trafalgar Community Centre both of which opened fall of 2020. In addition costs related to growth for new infrastructure assumed through subdivisions in North Oakville such as road, sidewalk, street tree maintenance as well as neighborhood parks, parkettes and trails has also added pressure. Finally budgetary pressures associated with the COVID-19 pandemic are expected to continue into 2021 and is expected to have a significant impact on the overall town budget. In order to help mitigate the impact of these budget pressures as well as future impacts as the town grows and evolves, the Corporate Leadership plan was developed to support continuous improvement, innovation and sustainability. One of the main objectives of the plan is to promote continuous improvement across the organization which encourages staff to look for opportunities to increase efficiency and streamline processes. Savings found as a result are incorporated into the budget.
Combined Increase
1.63%
2021 Town Increase 2.29%
2021 Program Increase (before assessment growth)
3.59%
2021 Budget Overview Town of Oakville | E-18

The following table outlines 2021 Proposed Budget and the various budget drivers by program. As illustrated in the table, the total program budget increase before adjustments and 2021 assessment growth is $10.9 million representing a 5.26% increase. After adjustments and assessment growth the total 2021 tax levy requirement for the town’s portion of the tax bill is $4.8 million or 2.29%.
The town base budget increase is made up of components. Inflationary increases and adjustments reflect changes to the existing base that provides for the same level of service as provided in 2020. Program spending at this level reflects the costs to deliver the same level of service as previous years. Increases in program spending and resulting tax levy requirements are driven by the rising costs of materials and supplies, contracted and other purchased services as well as labour costs. Changes in revenue from user fees and other sources also impact the tax requirement. Inflation and Adjustments account for 1.43% of the increase or $3.0 million.
Total Total2021 Inflation Capital Budget 2021 $ Change % Change
Program and and Efficiencies Temporary from fromAdjustments Growth COVID Impacts 2020 2020
Emergency Services 38.81$ 0.84$ 1.12$ (0.01)$ 40.76$ (0.31)$ 40.45$ 1.64$ 4.2%
Oakville Transit 24.13$ 0.34$ 0.32$ (0.16)$ 24.63$ 3.54$ 28.17$ 4.04$ 16.7%
Road Network 25.66$ (0.14)$ 0.42$ (0.19)$ 25.75$ 0.79$ 26.54$ 0.88$ 3.4%Recreation and Culture 18.67$ (0.18)$ 0.73$ (0.50)$ 18.73$ 3.25$ 21.98$ 3.31$ 17.7%
All Parks & Open Spaces 18.12$ 0.19$ 0.29$ 0.01$ 18.61$ 0.70$ 19.30$ 1.18$ 6.5%
Corporate Services 13.05$ 0.37$ -$ (0.08)$ 13.34$ 0.01$ 13.35$ 0.30$ 2.3%Information Technology Solutions 11.51$ 0.55$ 0.27$ (0.01)$ 12.32$ (0.13)$ 12.20$ 0.68$ 5.9%
Oakville Public Library 10.05$ 0.21$ 0.02$ (0.01)$ 10.28$ (0.06)$ 10.21$ 0.16$ 1.6%
Community Development 5.04$ (1.13)$ 0.55$ (0.47)$ 3.98$ 0.03$ 4.01$ (1.02)$ -20.3%
Political Governance 3.94$ 0.04$ -$ (0.19)$ 3.79$ (0.00)$ 3.79$ (0.15)$ -3.7%
Facility & Construction Mgmt 2.96$ 0.06$ 0.07$ 0.01$ 3.10$ 0.07$ 3.17$ 0.21$ 7.2%
Strategic Policy & Communications 3.00$ 0.03$ -$ 0.42$ 3.45$ 0.03$ 3.48$ 0.48$ 16.0%
Municipal Enforcement 1.41$ (0.14)$ 0.02$ (0.00)$ 1.29$ 1.04$ 2.33$ 0.92$ 65.5%Corporate Revenue & Expenses (176.36)$ 1.94$ (1.61)$ -$ (176.03)$ (2.07)$ (178.10)$ (1.74)$ 1.0%
Total -$ $2.97 $2.21 (1.17)$ 4.01$ 6.89$ 10.89$ 10.89$
% Tax Levy Increase 1.43% 1.06% -0.57% 1.93% 3.32% 5.26%2021 Assessment Growth $(2.7) -1.30%
Tax Stabilization Reserve to Offset COVID Impacts $(3.4) -1.66%Net Tax Levy Increase 4.8$ 2.29%
2020 Restated Budget
2021 Base Budget
2021 Requested
Budget
2021 Cost Drivers
2021 Budget Overview Town of Oakville | E-19

In addition, the 2021 budget includes the impact of decisions made in previous years such as the annualized impact of service adjustments and operating costs for previously approved capital works to provide new infrastructure as the town grows such as new facilities, vehicles and equipment, software enhancement & parks. Also included are costs associated with the assumption of new subdivisions such as roads, street lighting and street trees. The tax levy requirement for the Capital and Growth component is an increase of $ 3.4 million in 2021. In 2017, a financial practice was implemented to align the assessment growth recognized in the budget with the growth impacts of that current year. As a result, deferred assessment funds have been transferred to reserve to be used in future years when growth budgetary pressures are higher than average. In 2021, a transfer from this reserve of $1.2 million has been budgeted to offset the growth impacts. Therefore, the net impact of capital and growth costs is a $2.2 million increase or 1.06% increase on the town’s budget.
In order to help offset these various inflationary and service adjustments the organization continues to look for opportunities to increase efficiency and streamline processes. Several service reviews were undertaken in 2019, and implementation plans or next steps identified. Phase 2 of these reviews continued during 2020 and savings identified as well as future reduction targets. A total of $1.2 million in savings have been incorporated into the budget in 2021 across various program areas to reflect reductions in utilities, fleet maintenance costs, mileage, efficiencies due to shift to on-line services and new service delivery methods. In addition, $1.0 million in Tax Stabilization funding has been incorporated into the 2021 budget to reflect future savings that will be realized as the implementation of these reviews continues to unfold and new systems and processes are in place. The 2021 budget also reflects costs of the minor re-organization which entails the creation of a new Infrastructure Services Commission as well as a new Asset Management program area and Strategic Initiatives division within the CAOs office which has been accomplished by utilizing a portion of the efficiency savings. Overall, total savings of $1.2 million have been incorporated which helps offset the budget impacts by 0.57%.
Budgetary pressures associated with the COVID-19 pandemic are expected to continue into 2021, in particular program revenues for Recreation & Culture, Oakville Transit, Parks Sport field rentals and Parking. Staff have spent considerable amount of time reviewing the financial impacts on programs and services experienced over the past several months and have assumed conditions will continue well into the beginning of 2021 and begin to gradually improve as the year progresses. In order to help minimize this impact temporary one-time mitigation measures have been incorporated into the budget.
2021 Budget Overview Town of Oakville | E-20

2021 COVID-19 Impacts
The total 2021 estimated budgetary impact of COVID-19 is $17.0 million, of which $15.8 million is associated with expected reductions in program revenues due to modified operations of various programs and services and reduced capacity limits in place to protect the health and safety of residents. In addition, increased costs associated with enhanced enforcement services, janitorial and other safety related costs are estimated at $1.2 million. Below is a summary of the 2021 revenue impacts by program and other associated costs.
In order to help offset, the impacts related to the pandemic, Council approved a motion to waive the annual 1% increase to the capital levy for the 2021 budget. In addition, over the past several months, potential temporary one-time mitigation options have been explored in all departments, in particular for those most affected by the operational limitations resulting
2021 Estimated COVID-19 Impacts
Revenue Impacts: 2021 Impact AssumptionsRecreation and Culture
7.3$ Q1 & Q2 estimated at 30% - 50% of normal levels, Q3 & Q4 is 50% - 75% of normal levels, ice & facility rental estimated at 75% all year. OCPA is estimated at 50% of normal levels for the year.
Oakville Transit4.9$ revenue adjusted to reflect 2019 ridership levels at 35% for Jan-Mar, 40% for
May-Aug and increasing to 60% for Sept-Dec. Parking 1.2$ 25% revenue shortfall anticipated based on experience in 2020.Parks & Open Space 0.9$ sportfield revenue estimated at 20% of normal levelsMunicipal Enforcement
0.2$ 20% impact anticipated base on 2020 experience, in particular for taxi, property maintenance, restaurant licenses.
Building Services0.4$ Anticipate a potential 3% revenue reduction on building permits, and 10%
revenue reduction for Committee of Adjustment Municipal Accomodation Tax 0.5$ 50% of normal level base on experience in 2020.Other (Clerks, Finance) 0.4$ various impacts based on experience in 2020.sub-total 15.8$
Expenditure Impacts:Temporary MES staffing & costs 0.8$ Additional staffing for Parks enforcement and other community safety needsEnhanced Janitorial 0.3$ various departmentsOther Misc. 0.1$ additional one-time communications support, masks, facility signage.sub-total 1.2$
Total COVID Impacts 17.0$
2021 Budget Overview Town of Oakville | E-21

in revenue shortfalls. These mitigation options are considered to be temporary in nature and have a minimal impact on service delivery with the exceptions being in cases where mandated by the Province. It should be noted that all of these budgetary reductions have been incorporated back into the forecasted 2022 budget. Overall, a total of $10.1 million in one-time mitigation measures have been incorporated into the 2021 Budget which include:
• Waive the 1% capital levy increase - $2.0 million • Temporary gapping of vacant positions and part-time hours in particular in Recreation, Transit, Library & Parks
which correlated with modified service delivery - $3.7 million • Savings in instructor/performer fess, program supplies and minor maintenance contracted services - $1.5 million • Savings in fuel and contracted taxi service due to modified service delivery - $0.8 million • Savings in personnel, supplies, utilities due to partial year closure of stand alone recreation facilities - $0.7 million • Savings in office supplies, mileage, professional development and other miscellaneous expenses as a result of
work from home arrangements and virtual training options - $0.5 million • Off-set reduction to transfer to Tourism reserve & grant to reflect revised Municipal Accommodation Tax revenue -
$0.5 million • Off-set transfer from reserve to offset reductions in Building and Harbours revenues - $0.4 million
In order to bring the budget in line with the inflationary guideline, Tax stabilization funding in the amount of $3.4 million has been used as an interim measure to off-set COVID-19 impact corporately. While it is anticipated that additional government support will be available, it is not known at this time.
2021 Budget Overview Town of Oakville | E-22

Overall, the proposed 2021 budget results in a 2.29% tax increase on the town’s share of the property tax bill after assessment growth. The town budget represents approximately 41.3% of the total property tax bill. Therefore, the proposed increase equates to a 0.95% increase on the total property tax bill or $6.73 per $100,000 of assessment. When combined with the projected increase for the Region of Halton of 1.84% and assuming no increase in education rates, the total proposed property tax increase is 1.63% or $11.57 per $100,000 of assessment, which is in line with inflation.
Total 2021 Operating Budget Increase by Cost Driver
Purpose
Overall Share of Tax Bill $ Increase
% Increase on the Tax
Levy
Impact on Total Tax
Bill
$ Increase per $100,000 of
Assessment*
Town of OakvilleInflationary Impacts/Revenue Adjustments 4.17$ 2.01% 0.83% $5.90Capital and Growth Impacts 2.21$ 1.06% 0.44% $3.12
Operational Efficiencies/Strategies (1.17)$ -0.57% -0.23% ($1.66)
Prior Year Assessment Growth from Reserve (1.20)$ -0.58% -0.24% ($1.70)
Capital Levy -$ 0.00% 0.00% $0.00
Total Base Operating Budget 4.01$ 1.93% 0.80% $5.67
COVID-19 Impacts & Additional Costs 17.02$ 8.21% 3.39% $24.08
One-time Mitigation Measures (10.13)$ -4.89% -2.02% ($14.33)Total Operating Budget incl. COVID-19 10.89$ 5.26% 1.37% $15.41
2021 Assessment Growth (2.69)$ -1.30% -0.54% ($3.81)
Tax Stabilization Reserve to Offset COVID Impacts (3.44)$ -1.66% -0.69% ($4.87)
Total Town of Oakville* 41.3% 4.76$ 2.29% 0.95% $6.73
Region of Halton** 37.1% 1.84% 0.68% $4.85
Education 21.6% 0.00% 0.00% $0.00Total * 1.63% $11.57
2021 Budget Overview Town of Oakville | E-23
2021 Operating Budget by Cost Component
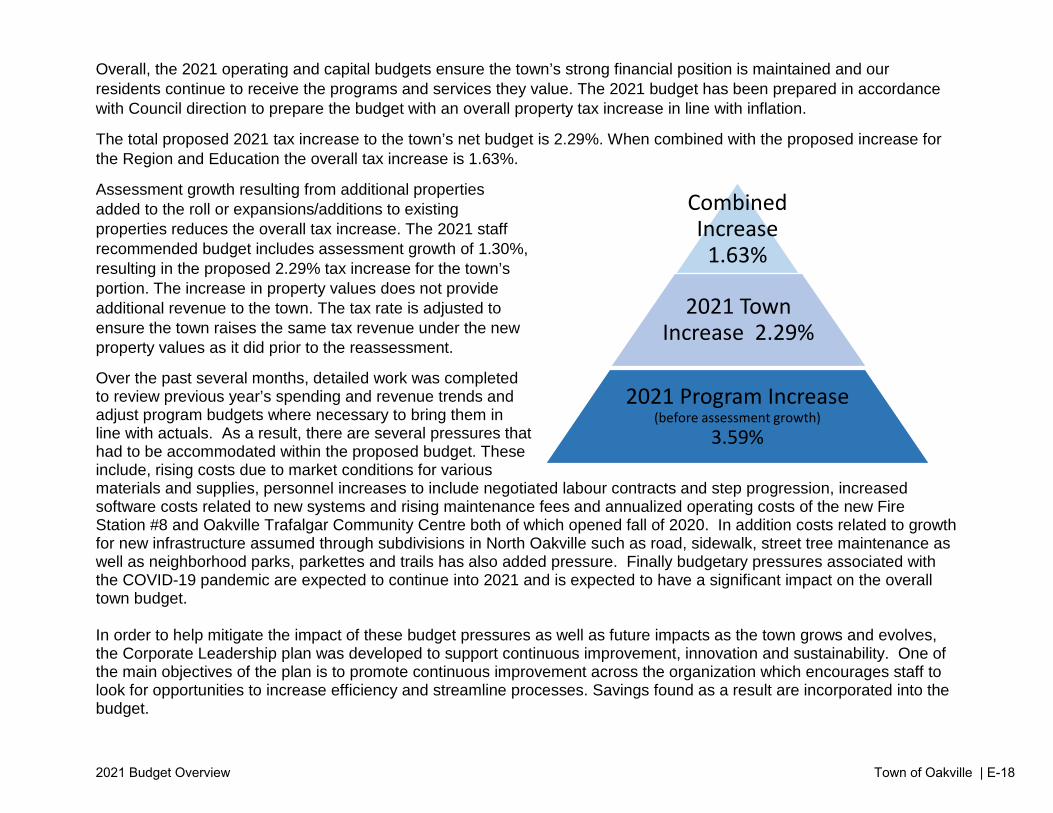
The gross expenditures proposed in the 2021 operating budget total $348.3 million including service adjustments for the town’s programs. Overall, 2021 expenditures have increased by $2.7 million as various one-time cost containment measures have been incorporated into the budget in order to off-set anticipated COVID-19 revenue shortfalls. Salaries and Benefits account for 48% or $167.0 million of the operating budget. This is an increase of $4.4 million over 2020 as a result of anticipated wage and benefit costs, movement through salary grids, and the cost of new positions required as a result of growth in the municipality and new capital infrastructure.
Purchased Services totals $38.7 million and includes costs for items such as communication, contracted services, software services, professional fees, training and development, insurance and printing.
Materials and Supplies include expenditures for utilities, fuel, vehicle parts, office supplies, construction and other materials. They represent 6% of the town’s gross expenditures and have increased by $0.4 million. Most expenditure items in this category have risen in line with inflation, however, a reduction to the fuel rates to reflect recent pricing has been incorporated.
Other Expenditures include community grants, rebates, financial expenses and debt charges. Other expenditures have decreased by $(0.6) million partially due a reduction in debt charges as old debt is paid off.
Minor Capital and Transfers to Reserves include the Capital Levy funding and other provisions for future expenditures (e.g. equipment replacement and transfers to tax stabilization reserves) and account for 24% of expenditures. In order to help offset COVID-19 impacts, Council waived the annual 1% increase to the Capital Levy funding in 2021, this represents $2.0 million savings.
Total Gross Budget
$348.3 M
2021 Budget Overview Town of Oakville | E-24

How is the Operating Budget Funded? Taxation revenues provide 62% (2020 – 60%) and is the largest source of the funding for the operating budget.
Fees and charges are the next largest source of funding at $65.7 million or 19%. Included in the fees and charges are increases to maintain cost recovery ratios for all programs. Fee revenue includes items such as Recreation and Culture user fees, Sportsfield rentals, Transit fares and Parking fees. In 2021, reductions to revenue have been incorporated in various programs as a result of the continued impact of the pandemic.
Interest and Penalties total $19.3 million or 6% of the total revenue, and Internal Recoveries $24.5 million or 7%.
The 2021 budget includes a $6.1 million dividend from Oakville Hydro of which $1.9 million is included in the base budget. The balance of the dividend is transferred to the hydro reserve which supports the hospital debt charges.
In 2021, Tax Stabilization funding of $3.4 million has been budgeted as an interim measure to help offset the one-time COVID-19 impacts as the town awaits further announcement of additional Safe Restart funding or other sources of relief.
2021 Budget Overview Town of Oakville | E-25

2021 Capital Budget by Program
The total 2021 capital budget is $80.9 million and is allocated across the town’s various programs and services based on state of infrastructure replacement and renewal needs, growth in the community and desired service enhancements as identified in various master plans.
The following chart illustrates the 2021 capital budget for each program. The largest investment is in Infrastructure Planning with $28.7 million at 35% which represents the town’s roads, bridges, sidewalks, cycle lanes and storm water infrastructure.
The second largest component in 2021 is Oakville Transit with $16.8 million or 21% of which a significant portion is dedicated to purchase of electric buses and EV infrastructure being funded through the Federal/Provincial Investing in Canada Infrastructure Program (ICIP) grant.
Parks and Open Spaces represents the third largest portion at $13.5 million or 17%, which includes new parks and trails in North Oakville, park facility renewals, forestry, cemetery and harbours. Facility and Construction Management undertake the major infrastructure renewal needs for facilities town wide, while minor repairs and rehab are budgeted within each program area. Likewise, Information Technology Solutions manages the town’s corporate wide systems and network infrastructure
Gross Capital Budget
$80.9 M
2021 Budget Overview Town of Oakville | E-26

How is the Capital Budget Funded?
Financing of the 2021 capital budget is provided by several different funding sources as illustrated in the table below.
The Capital Levy is the largest portion of the funding with $35.6 million or 44%. The Capital Levy is a primary source of funding for infrastructure renewal projects and allows capital work to be completed without the issuance of debt.
The second largest source of funding is Development Charges which will fund $14.5 million and is the primary source for Growth projects.
In 2021, 14% or $11.0 million of the funding is from Grants and External Revenue. The majority of which is from the Investing in Canada Infrastructure Program (ICIP) funding related to Transit. Other external sources represent cost sharing of for infrastructure with bordering municipalities or the Ministry of Transportation.
Other town funding sources include Equipment reserves ($8.5 million) and Capital Reserves ($2.3 million). Annual allocations from operating are transferred to Equipment reserves to ensure funding is in place to finance future replacement without the reliance on debt. The capital reserve is another town source of funding which is used primarily to fund strategic initiatives and larger rehabilitation projects.
Federal and Provincial Gas Tax totals $6.7 million with Federal funds allocated to larger infrastructure projects based on the agreement criteria such as road rehabilitation and storm water improvements. Provincial gas tax is a dedicated source of funding for Transit projects. There is no debt financing required in 2021.
2021 Budget Overview Town of Oakville | E-27

Budget Committee Referrals & Other Budget Information Reports During the course of 2020, items have been referred to the Budget Committee for consideration. The referrals are listed below for consideration by the Budget Committee. In addition, other reports have been included that provide additional information on specific 2021 budget priorities. These reports will be address as part of the November 19th, 2020 Budget Committee meeting.
Referrals:
Report Report Date Recommendation
Oakville's Community Energy Plan
Special Council 02/25/2020
That staff be directed to review options to implement a specific tax levy to support dedicated funding for climate change initiatives in the Town of Oakville as part of the 2021 budget process;
Regional Allocation Resource Requirements
P&D Council
3/9/2020
If additional staffing resources are identified as a result of the influx of applications, those positions can be reviewed through the 2021 budget process.
Review of Cricket Fields
Council
06/24/2019
That staff report on the costs, timing and process for proceeding with the proposed new cricket field planned for North Park, including the preliminary design and layout as well as the opportunity to fund ahead of the rest of park development.
Child Concession and Fare for Oakville Transit
Council
02/24/2020
That staff report back by April 2020 on the options for implementing a free program for Children 6-12 years of age.
2021 Budget Overview Town of Oakville | E-28

Additional Reports:
Report Date Recommendation
2021 Traffic Calming Program
Nov 19th, 2020 Budget Committee
To provide an overview of the 2021 Traffic Calming program.
2021 Road Resurfacing Program and Pavement Performance Update
Nov 19th, 2020 Budget Committee
To provide an update on the impacts of the 2020 budget deferral on the pavement network performance and the 2021 Road Resurfacing Program.
2021 Budget Overview Town of Oakville | E-29
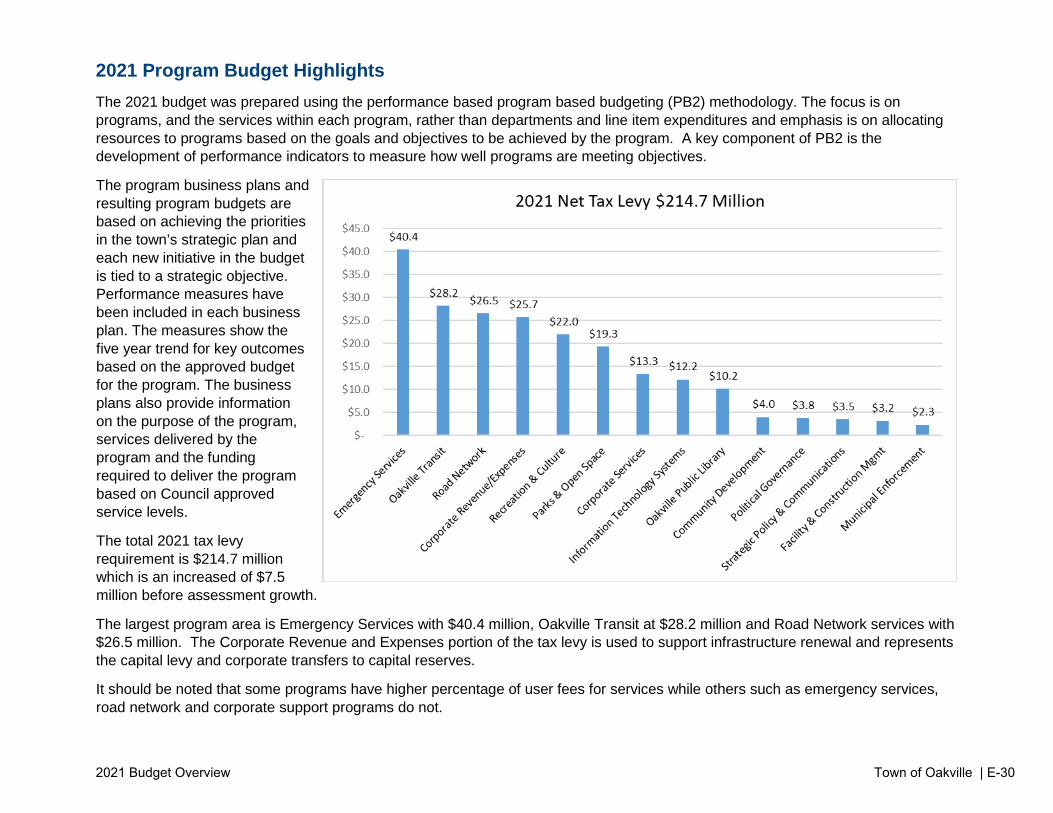
2021 Program Budget Highlights The 2021 budget was prepared using the performance based program based budgeting (PB2) methodology. The focus is on programs, and the services within each program, rather than departments and line item expenditures and emphasis is on allocating resources to programs based on the goals and objectives to be achieved by the program. A key component of PB2 is the development of performance indicators to measure how well programs are meeting objectives.
The program business plans and resulting program budgets are based on achieving the priorities in the town’s strategic plan and each new initiative in the budget is tied to a strategic objective. Performance measures have been included in each business plan. The measures show the five year trend for key outcomes based on the approved budget for the program. The business plans also provide information on the purpose of the program, services delivered by the program and the funding required to deliver the program based on Council approved service levels.
The total 2021 tax levy requirement is $214.7 million which is an increased of $7.5 million before assessment growth.
The largest program area is Emergency Services with $40.4 million, Oakville Transit at $28.2 million and Road Network services with $26.5 million. The Corporate Revenue and Expenses portion of the tax levy is used to support infrastructure renewal and represents the capital levy and corporate transfers to capital reserves.
It should be noted that some programs have higher percentage of user fees for services while others such as emergency services, road network and corporate support programs do not.
2021 Budget Overview Town of Oakville | E-30

As noted above the net tax levy increase in 2021 is $7.5 million, the largest program increases are seen in Transit ($4.0 million) and Recreation and Culture Services ($3.3 million). This is a reflection of the anticipated continued impacts of COVID-19 on user fee revenue for these two program areas. While temporary cost containment measures have been incorporated, due to capacity restrictions and program limitations, the decrease in revenues are expected to exceed mitigation efforts. Emergency Services is the third largest increase at $1.6 million which is a reflection of the annualized cost to operate new Fire Station #8 that opened late 2020.
Corporate Revenue and Expenses reflects the tax stabilization funding used to as an interim measure to off-set COVID-19 impact corporately as well as the $1.2 million transfer from reserve for deferred assessment growth to offset capital impacts. While it is anticipated that additional government support will be available, it is not known at this time. The reduction in the Community Development program area represents the anticipated increase in development related revenues due to the release of the Regional Allocation earlier this year. More details can be found in the individual business plans, however, some specific program drivers are discussed in the following section:
2021 Budget Overview Town of Oakville | E-31

Emergency Services - $40.5 million tax levy, $1.6 million increase Emergency Services provides services to educate the public with regards to fire related risks, prevents fires, enforces fire safety standards, suppresses fires and prepares and manages all emergencies throughout the town. Fire Suppression is the largest component of the budget at $35.1 million. The $1.6 million increase is primarily due to the annualization of the 20 new firefighters and facility costs to operate Fire Station #8 which opened in 2020. In order to help mitigate costs, three vacant positons approved in 2020 to support the Fire Master Plan have been gapped in 2021 as the introduction of these services has proven to be difficult under the current conditions resulting in savings of ($309,200).
Recreation and Culture - $22.0 million tax levy, $3.3 million increase Includes Recreation and Culture Hubs, Cultural Services and Program Development and Support. Included in the base budget is the annualized cost of operating the Oakville Trafalgar Community Centre (OTCC), as well as the phased in transfer to the Building Maintenance reserve for Trafalgar Park Community Centre. Centennial Pool closed in 2020, and the budget savings have been included as staffing has been transferred to OTCC. Temporary COVID-19 impacts are significant in the Recreation and Culture program budget due to the restrictions of the pandemic, capacity limits and program and facility offerings have been modified substantially resulting in an estimated reduction in revenues of $7.3 million. In order to mitigate the impact, Kinoak and Maplegrove arenas and White Oaks pool are scheduled to stay closed until September 2021 resulting in savings of $0.7 million. In addition, due to reduced program offerings, part-time budgets, instructor/performer costs and other programming supplies have been reduced temporarily by approximately $3.3 million. In addition to these savings, efficiency savings of $0.5 million have been incorporated which represent utility savings as a result of energy management initiatives, reduction in cost associated with the stand alone Nottinghill youth centre and other minor savings in mileage and contracted services for camps.
2021 Budget Overview Town of Oakville | E-32

Parks & Open Spaces - $19.3 million tax levy, $1.2 million increase Includes Parks Planning and Development, Parks Maintenance and Forestry services. The primary driver of the base budget increase are cost associated with growth impacts required to support new neighbourhood parks, village squares, trails as well as street trees planted in new North Oakville subdivisions along with inflationary increases for salaries, wages and benefits. Temporary COVID-19 impacts are anticipated to have a significant impact on sportsfield revenues of approximately $0.9 million which represents an 80% reduction from normal levels. One-time mitigation measures to help offset this impact total $245,000 and include temporary reductions to part-time staffing and general maintenance activities.
Oakville Transit - $28.2 million tax levy, $4.0 million increase Includes Transit Operations, Fleet and Maintenance and Planning and Accessible Services. The primary driver of the increase are the COVID-19 related impacts anticipated to ridership resulting in lower than average revenues of $4.9 million. Correlating cost reductions have been incorporated into the budget to reflect current 2020 service delivery with gradual increases anticipated as the year progresses with total temporary savings of $1.4 million in the form of reductions to casual driver hours, fuel and contracted taxi services. Also identified within the base budget are efficiency savings of ($164,300) which represents savings in utilities and efficiencies due to scheduling software. Capital and Growth impacts total $324,400 which are the annualized impacts due to route 1 being re-introduced to service North Oakville as well as two capital projects related to facility and onboard WIFI and the ITS Infrastructure upgrade.
Infrastructure Maintenance - $23.4 million tax levy, $0.11 million increase Includes Traffic and Works Operations, Fleet Services and Facilities & Admin. This 2021 budget includes Capital and Growth impacts of $0.3 million associated with maintenance of new roads built as a result of development as well as town road improvement such as road widenings, new sidewalks and bike lanes. In order to offset townwide COVID-19 impacts, one-time reductions in minor contracted maintenance totaling have been incorporated in various areas including catch basins, sidewalk and pavement repairs. In addition, as a result of the Fleet Optimization review, efficiency savings of $0.2 million for reductions to mileage and fleet maintenance repairs have been included.
2021 Budget Overview Town of Oakville | E-33
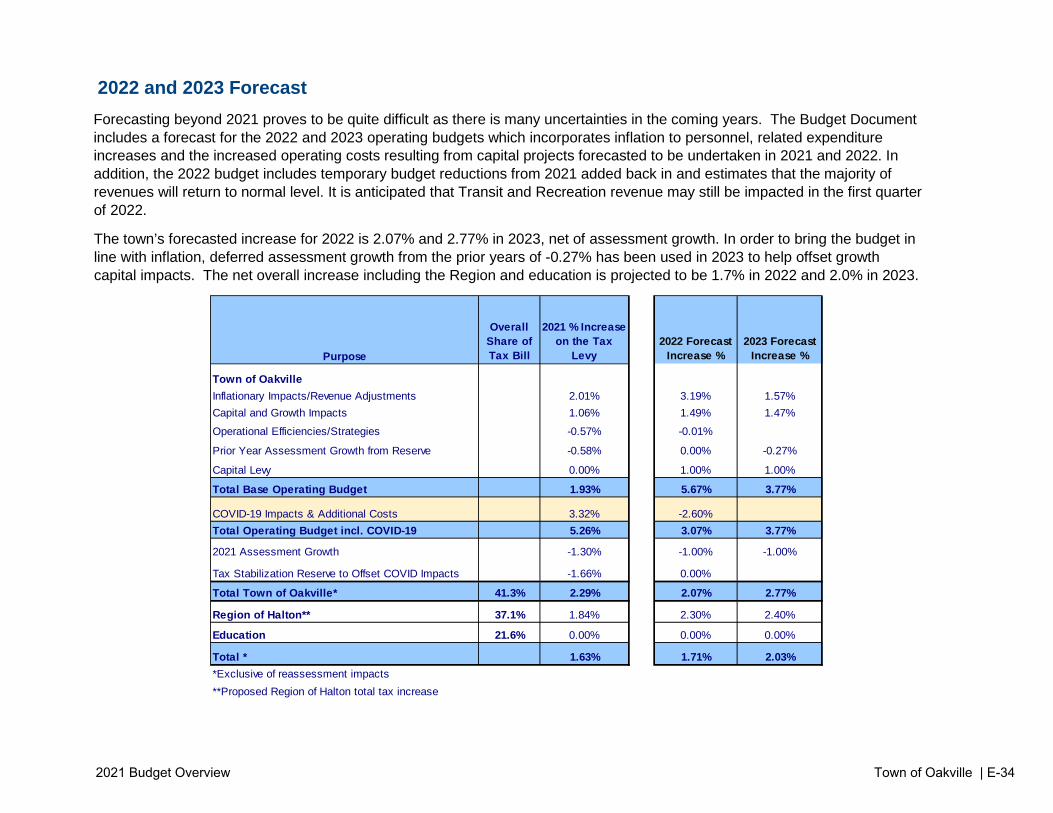
2022 and 2023 Forecast Forecasting beyond 2021 proves to be quite difficult as there is many uncertainties in the coming years. The Budget Document includes a forecast for the 2022 and 2023 operating budgets which incorporates inflation to personnel, related expenditure increases and the increased operating costs resulting from capital projects forecasted to be undertaken in 2021 and 2022. In addition, the 2022 budget includes temporary budget reductions from 2021 added back in and estimates that the majority of revenues will return to normal level. It is anticipated that Transit and Recreation revenue may still be impacted in the first quarter of 2022.
The town’s forecasted increase for 2022 is 2.07% and 2.77% in 2023, net of assessment growth. In order to bring the budget in line with inflation, deferred assessment growth from the prior years of -0.27% has been used in 2023 to help offset growth capital impacts. The net overall increase including the Region and education is projected to be 1.7% in 2022 and 2.0% in 2023.
Purpose
Overall Share of Tax Bill
2021 % Increase on the Tax
Levy2022 Forecast
Increase %2023 Forecast
Increase %
Town of OakvilleInflationary Impacts/Revenue Adjustments 2.01% 3.19% 1.57%Capital and Growth Impacts 1.06% 1.49% 1.47%
Operational Efficiencies/Strategies -0.57% -0.01%
Prior Year Assessment Growth from Reserve -0.58% 0.00% -0.27%
Capital Levy 0.00% 1.00% 1.00%
Total Base Operating Budget 1.93% 5.67% 3.77%
COVID-19 Impacts & Additional Costs 3.32% -2.60%Total Operating Budget incl. COVID-19 5.26% 3.07% 3.77%
2021 Assessment Growth -1.30% -1.00% -1.00%
Tax Stabilization Reserve to Offset COVID Impacts -1.66% 0.00%
Total Town of Oakville* 41.3% 2.29% 2.07% 2.77%
Region of Halton** 37.1% 1.84% 2.30% 2.40%
Education 21.6% 0.00% 0.00% 0.00%
Total * 1.63% 1.71% 2.03%*Exclusive of reassessment impacts**Proposed Region of Halton total tax increase
2021 Budget Overview Town of Oakville | E-34
2021 Capital Budget & Asset Management Planning In 2008, the Town of Oakville made a decision to leverage the PSAB 3150 initiative into developing comprehensive asset management processes and systems. Asset management assists in protecting and enhancing the quality of life in Oakville by leveraging the best possible asset information leading to better decisions about our assets—pipes, buildings, roads and parks— in a way that maintains the levels of service and manages risk in a cost-effective manner.
The Town of Oakville has maintained a complete inventory of all the town’s assets in the town’s Corporate Information System (CIS) since 2008 in which asset data is used on an annual basis to support the capital budget planning decisions. Our CIS inventory currently is integrated to the Town’s GIS system which will facilitate spatial analysis and provide an ability to confirm physical inventory for audit purposes. This will give the town an ability to coordinate capital spending among asset types. An example of this is Road Replacement with Storm System Replacement.
The current Asset Management Plan (AMP) has been developed following the Provincial requirements as outlined in Building Together – Guide for Municipal Asset Management Plans, as well as guidance provided in the International Infrastructure Management Manual and ISO 55000 standards for Asset Management. Currently, the Asset Management Plan is being adjusted to meet O. Reg. 588/17.
The Town of Oakville’s asset management system incorporates the following asset management principles:
Forward-Looking and Sustainable: The town will incorporate social, legislative, environmental and financial considerations into decisions, taking into account present and future service commitments, giving due attention to the long-term stewardship of assets.
Sound Asset Information: The town will collect, collate, control, and circulate the right asset information, at the right time, informing the right asset management decision-making.
Robust, Repeatable and Transparent Decision Making: The town will utilize a formal but scalable, consistent, and repeatable approach to manage infrastructure assets, enabling services to be provided in the most efficient and cost-effective manner.
Whole Life Cycle Cost Perspective: The town will consider the combined impact of all aspects of the asset life-cycle – acquiring, operating, maintaining, renewing, and retiring assets. No new assets will be constructed/acquired without considering future operating and maintenance costs. Asset performance will be monitored throughout the asset life cycle and will be used to inform recommendations on future asset acquisition.
Risk-Based Perspective: The town will direct resources, expenditures, and priorities to achieve the agreed service outcomes and benefits, at acceptable levels of risk.
2021 Budget Overview Town of Oakville | E-35

People-Focused (Customers and Staff): The town will adopt a serviceability-based approach to managing our assets and will only accommodate additional demand for services without detriment to current levels of service. The town will recruit, train, and retain the right staff.
The following financing policies and assumptions represent the sustainability framework outlined in the asset management plan which guides the affordability of the capital plan.
• Debt re-payment levels including the hospital commitment remain within the council approved policy limits; • Outstanding debt to reserve levels do not exceed the 1:1 ratio required to maintain AAA credit rating; • The 1% Capital levy increase is maintained; • Timing of Growth projects aligns with anticipated residential and non-residential development; • Capital reserves are maintained at sufficient levels to minimize risk, support future initiatives and provide for unknown
contingencies; • Equipment reserves are maintained at sufficient levels to support on-going life cycle replacements; • Building replacement reserve contributions are maintained and as new facilities are built contributions are increased and
phased in over five years;
The capital budget is built on a framework based on “drivers” in which to review and assess capital project needs. All financial tools available to the town need to be managed as a whole with the overall fiscal picture in mind. Therefore, the framework which was developed grouped projects into four categories:
Growth Infrastructure Renewal
Strategic Priorities Enterprise Initiatives
Cost to maintain current service levels as the town’s population grows. Needs identified in the Development Charges Study.
Costs to maintain existing infrastructure in a state of good repair. On-going replacement of infrastructure at end of useful life.
Costs for other initiatives identified to achieve council’s strategic goals or community enhancement identified in Master plans.
Costs that support on-going initiatives for the town’s self-supported programs; Cemeteries, Harbours, Building and Parking.
2021 Budget Overview Town of Oakville | E-36
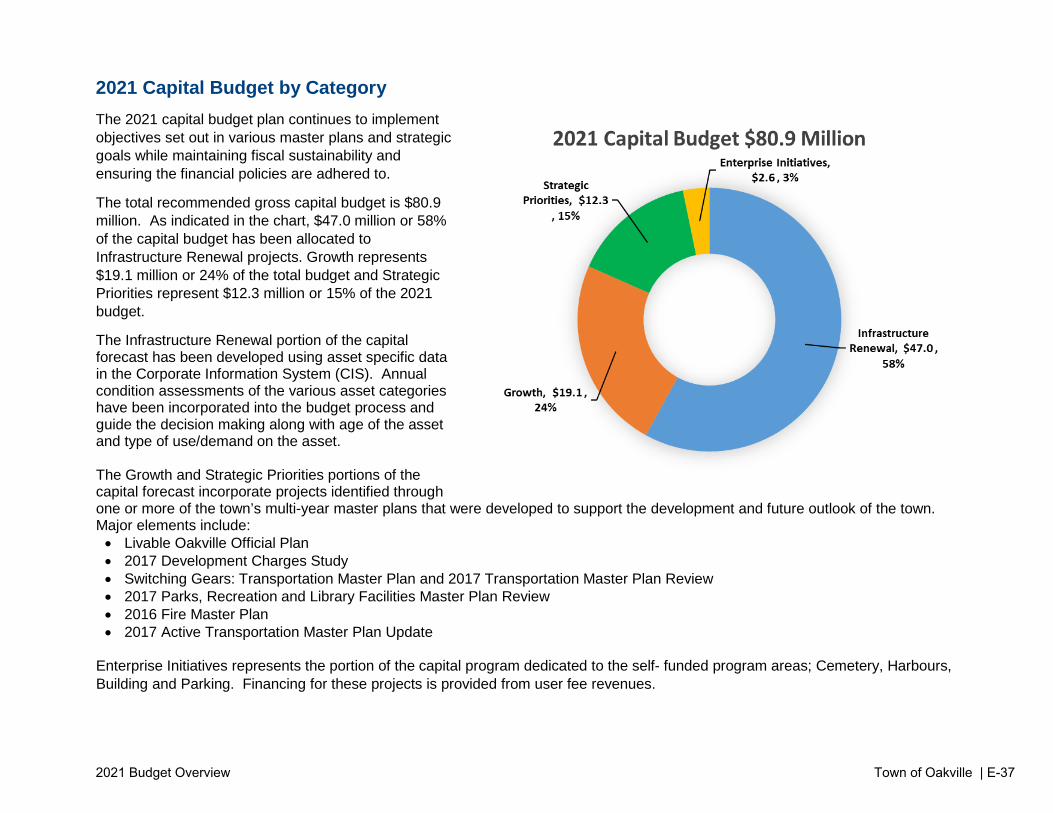
2021 Capital Budget by Category The 2021 capital budget plan continues to implement objectives set out in various master plans and strategic goals while maintaining fiscal sustainability and ensuring the financial policies are adhered to.
The total recommended gross capital budget is $80.9 million. As indicated in the chart, $47.0 million or 58% of the capital budget has been allocated to Infrastructure Renewal projects. Growth represents $19.1 million or 24% of the total budget and Strategic Priorities represent $12.3 million or 15% of the 2021 budget.
The Infrastructure Renewal portion of the capital forecast has been developed using asset specific data in the Corporate Information System (CIS). Annual condition assessments of the various asset categories have been incorporated into the budget process and guide the decision making along with age of the asset and type of use/demand on the asset. The Growth and Strategic Priorities portions of the capital forecast incorporate projects identified through one or more of the town’s multi-year master plans that were developed to support the development and future outlook of the town. Major elements include: • Livable Oakville Official Plan • 2017 Development Charges Study • Switching Gears: Transportation Master Plan and 2017 Transportation Master Plan Review • 2017 Parks, Recreation and Library Facilities Master Plan Review • 2016 Fire Master Plan • 2017 Active Transportation Master Plan Update
Enterprise Initiatives represents the portion of the capital program dedicated to the self- funded program areas; Cemetery, Harbours, Building and Parking. Financing for these projects is provided from user fee revenues.
2021 Budget Overview Town of Oakville | E-37

Infrastructure Renewal, $47.0 million
As illustrated in the chart, the budget for Infrastructure Renewal is $47.0 million representing 58% of the total budget. Infrastructure renewal projects consist of various repairs and replacement for town facilities, vehicles and equipment as well as continuous improvements to roads, bridges, park amenities and systems and network infrastructure. These projects are necessary in order to ensure that the existing infrastructure remains in a state of good repair so that service delivery to Oakville residents is not impacted. Significant investments include:
• $9.5 million in Storm Water and Erosion Control infrastructure improvements • $8.9 million in Road and Bridge rehabilitation • $8.7 million in Transit Vehicle Replacement & Renewal of which 7 conventional buses will
be converted to electric. • $6.7 million in various Facility Maintenance and Improvements • $3.9 million in Parks & Trail renewal • $2.4 million in Fire Vehicles and Specialized Equipment Replacements.
Growth, $19.1 million
Projects supporting growth of the town are of great importance with $26.5 million allocated in this category and represent the second largest portion of the budget with 23% allocated in this category. As the town grows it is important that new infrastructure is in place to maintain current levels of service for its residents. Funding for new growth infrastructure is primarily funded through development charges. 2021 highlights include:
• $4.6 million in new neighbourhood parks, parkettes and trails. • $3.7 million in additional Transit vehicles including 3 electric conventional buses and 1
specialized electric vehicle. • $2.0 million for Speers Road Fourth Line - Dorval – Widening and Active Transportation
design work • $2.7 million in new stand alone Active Transportation initiatives such as Crosstown Trail, Lakeshore Road Multi-use Path
and other cycle lane and pathways. • $1.6 million in Traffic Signal Upgrades and signal optimization improvements.
2021 Budget Overview Town of Oakville | E-38

Strategic Priorities, $12.3 million
These are projects that have been initiated by staff in order to achieve the goals set out in Council’s strategic plan or have been identified as community enhancements in master plans. Significant projects include:
• $2.7 million in on-line system solutions and network security upgrades • $2.5 million for Electric Bus charging infrastructure • $1.9 million to continue the EAB Management and regeneration program • $0.4 million in Traffic Calming initiatives
Enterprise Initiatives, $2.6 million
A total of $2.6 million has been included in the capital plan to support ongoing initiatives in the town’s three self-supported programs: Harbours, Cemeteries and Parking. Projects include:
• $1.0 million in Parking Vehicle and infrastructure upgrades, including installation of Electric Vehicle Charging Stations in various locations town wide
• $0.7 million for Busby Park Launch Ramp and Seawall rehabilitation • $0.6 million in hybrid vehicles for Building Inspection Services
Full list of 2021 capital projects and budgets have been included within each of the program area Business Plans as well as the 2020 State of Infrastructure(SOIR) for all assets. A guideline on how to interpret the SOIR is included in the next few pages.
2021 Budget Overview Town of Oakville | E-39

2021 Budget Overview Town of Oakville | E-40

2021 Budget Overview Town of Oakville | E-41
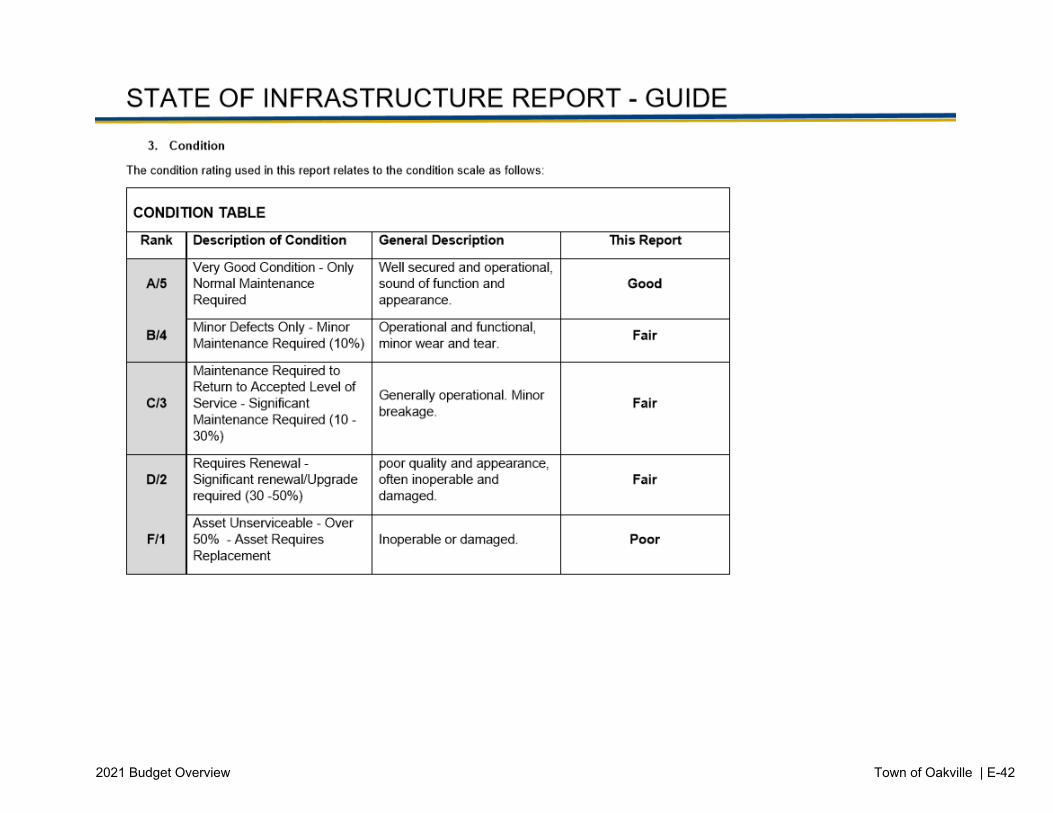
2021 Budget Overview Town of Oakville | E-42

Provincial PSAB Reporting Requirement
The Town of Oakville is required under Ontario Regulation 284/09 to report on amortization, post-employment benefits and solid waste landfill closures and post-closure expenses that are excluded from the annual budget. The town does not have a landfill within our level of authority therefore only includes the impact of amortization and post-employment liabilities.
The 2021 proposed budget excludes amortization expenses which are currently estimated at $45.0 million. Amortization expenses are not budgeted as municipalities use traditional transfers to reserve and reserve funds and annual capital levy funding to repair, maintain and replace existing assets. Funds are held in reserve and reserve funds and balances are reviewed annually in order to ensure that funding levels are adequate for future asset replacements.
The 2021 proposed budget includes $63.3 million in budgeted transfers directly to capital and reserves or reserve funds for the refurbishment and replacement of the town’s capital assets. Based on analysis completed during the preparation of the 2021 capital budget and financing strategy, the annual budgeted transfer provides adequate funding for the major repairs and replacement of existing tangible capital assets. Infrastructure renewal needs have been identified based on life cycle information and prudent repair and maintenance standards. Currently, all identified infrastructure renewal needs in 2021 have been funded. It should also be noted that as part of the town’s current budgeting practice, it is policy that as new assets are constructed or purchased for growth, additional transfers to reserves are built into the operating budget in the year the asset comes into service to ensure funding exists for the replacement of those assets. Included in the $63.3 million noted above is $0.55 million in increased transfers to reserves and reserve funds as a result of new capital assets.
The town has been required under PSAB to report post-employment liabilities within the financial statements for many years. Post-employment liabilities include both Workers Safety & Insurance Board (WSIB) and post-employment employee benefit liabilities. Actuarial reviews were conducted during 2016 which provided an updated estimate of the liability for financial reporting. The town’s current estimated liability reported in its financial statements is $36.3 million ($32.4 million for post-employment benefits and $3.9 million for WSIB). The town has budgeted to contribute a total of $673,300 ($377,600 for employee benefits and $295,700 for WSIB) to its Post-Employment Reserve fund which has a forecasted balance of $22.8 million at the end of 2020. Thus, the town has an estimated unfunded post-employment liability of $13.5 million. There is no requirement to have full funding in place for the post-employment benefits but full funding is required for the WSIB, which the town has. The current year annual cost of employee benefit post-employment benefits is expensed as paid throughout the year and is budgeted at $755,900.
2021 Budget Overview Town of Oakville | E-43
2021 BUDGET DETAILS OPERATING AND CAPITAL
2021 Budget Details Town of Oakville | E-44

2021 Gross Operating Budget by Program
*COVID Impact Column includes Tax Stabilization funding used to offset one-time impacts.
2020 2021 2021 2021 2021 2021 2021 2021
Restated Base Base Budget Capital, Growth & Temporary Requested Requested Requested
Budget Budget Increase % Service Adj. COVID Impacts* Budget Increase $ Increase %
EXPENDITURE BY PROGRAMPolitical Governance 3,950,400 3,805,700 -3.7% -2,500 3,803,200 -147,200 -3.7%
Administrative Executive Management 1,931,100 1,962,400 1.6% 503,700 2,466,100 535,000 27.7%
Economic Development 1,744,200 1,707,900 -2.1% 53,200 -500,000 1,261,100 -483,100 -27.7%
Strategic Policy and Communications 2,001,000 2,010,900 0.5% 419,900 32,000 2,462,800 461,800 23.1%
Service Oakvil le 1,176,100 1,198,600 1.9% -2,000 1,196,600 20,500 1.7%
Asset Management 746,100 761,100 2.0% 336,100 -1,100 1,096,100 350,000 46.9%
Financial Services 6,394,000 6,546,600 2.4% -252,200 -300 6,294,100 -99,900 -1.6%
Human Resources 2,881,500 3,001,000 4.1% -41,300 2,959,700 78,200 2.7%
Information Technology Solutions 11,875,200 12,416,600 4.6% 273,600 -126,300 12,563,900 688,700 5.8%
Regulatory Services 756,700 790,800 4.5% -10,000 780,800 24,100 3.2%
Legal Services 2,357,100 2,371,700 0.6% -13,000 2,358,700 1,600 0.1%
Facil ities & Construction Management 4,542,300 4,388,400 -3.4% 40,100 64,500 4,493,000 -49,300 -1.1%
Emergency Services 39,429,300 40,289,400 2.2% 1,119,800 -416,300 40,992,900 1,563,600 4.0%
Recreation and Culture 39,688,900 39,622,100 -0.2% 1,416,100 -4,174,600 36,863,600 -2,825,300 -7.1%
Oakvil le Public Library 10,838,200 10,988,000 1.4% 22,400 -107,400 10,903,000 64,800 0.6%
Parks & Open Space 23,352,200 23,494,000 0.6% 302,700 -245,100 23,551,600 199,400 0.9%
Cemeteries 1,140,000 1,309,800 14.9% 1,309,800 169,800 14.9%
Harbours 2,092,300 2,124,000 1.5% 1,692,100 -150,000 3,666,100 1,573,800 75.2%
Infrastructure Maintenance 36,293,400 36,791,900 1.4% 310,300 -383,400 36,718,800 425,400 1.2%
Oakvil le Transit 35,420,100 35,796,900 1.1% 324,400 -1,387,000 34,734,300 -685,800 -1.9%
Infrastructure Planning & Improvements 3,974,200 4,199,300 5.7% 133,900 4,333,200 359,000 9.0%
Parking 4,670,300 4,978,600 6.6% 52,100 826,700 5,857,400 1,187,100 25.4%
Municipal Enforcement 2,744,600 2,799,100 2.0% 23,400 827,500 3,650,000 905,400 33.0%
Building Services 10,407,700 9,490,500 -8.8% -23,400 -11,300 9,455,800 -951,900 -9.1%
Planning Services 7,348,500 7,541,600 2.6% 133,900 -800 7,674,700 326,200 4.4%
Development Services 4,683,300 4,694,600 0.2% 512,200 -20,000 5,186,800 503,500 10.8%
Strategic Business Services 1,248,000 1,281,800 2.7% -6,900 1,274,900 26,900 2.2%
Corporate Revenue & Expenses 81,848,200 82,672,700 1.0% -244,400 -2,072,900 80,355,400 -1,492,800 -1.8%
Total EXPENDITURE BY PROGRAM 345,534,900 349,036,000 1.0% 7,149,900 -7,921,500 348,264,400 2,729,500 0.8%
2021 Budget Details Town of Oakville | E-45

2021 Net Levy by Program
*COVID Impact Column includes Tax Stabilization funding used to offset one-time impacts.
2020 2021 2021 2021 2021 2021 2021 2021
Restated Base Base Budget Capital, Growth & Temporary Requested Requested Requested
Budget Budget Increase % Service Adj. COVID Impacts* Budget Increase $ Increase %
TAX LEVY BY PROGRAMPolitical Governance 3,938,800 3,794,900 -3.7% 0 -2,500 3,792,400 -146,400 -3.7%
Administrative Executive Management 1,931,100 1,312,100 -32.1% 503,700 0 1,815,800 -115,300 -6.0%
Economic Development 744,200 707,900 -4.9% 53,200 0 761,100 16,900 2.3%
Strategic Policy and Communications 2,001,000 2,010,900 0.5% 419,900 32,000 2,462,800 461,800 23.1%
Service Oakvil le 1,003,000 1,022,100 1.9% 0 -500 1,021,600 18,600 1.9%
Asset Management 746,100 761,100 2.0% 336,100 -1,100 1,096,100 350,000 46.9%
Financial Services 4,869,800 5,002,400 2.7% -252,200 24,700 4,774,900 -94,900 -1.9%
Human Resources 2,877,500 2,997,000 4.2% 0 -39,300 2,957,700 80,200 2.8%
Information Technology Solutions 11,514,200 12,049,600 4.6% 273,600 -126,300 12,196,900 682,700 5.9%
Regulatory Services 337,200 364,200 8.0% 0 35,000 399,200 62,000 18.4%
Legal Services 2,288,400 2,318,400 1.3% 0 -13,000 2,305,400 17,000 0.7%
Facil ities & Construction Management 2,960,500 3,064,200 3.5% 40,100 69,300 3,173,600 213,100 7.2%
Emergency Services 38,809,200 39,639,300 2.1% 1,119,800 -309,200 40,449,900 1,640,700 4.2%
Recreation and Culture 18,668,700 17,991,000 -3.6% 734,600 3,252,100 21,977,700 3,309,000 17.7%
Oakvil le Public Library 10,052,600 10,254,400 2.0% 22,400 -62,400 10,214,400 161,800 1.6%
Parks & Open Space 17,957,000 18,137,000 1.0% 302,700 697,000 19,136,700 1,179,700 6.6%
Cemeteries 164,500 167,300 1.7% 0 0 167,300 2,800 1.7%
Harbours 0 0 0 0 0 0 0.0%
Infrastructure Maintenance 23,347,000 23,563,300 0.9% 281,400 -383,400 23,461,300 114,300 0.5%
Oakvil le Transit 24,128,800 24,302,000 0.7% 324,400 3,539,900 28,166,300 4,037,500 16.7%
Infrastructure Planning & Improvements 2,316,900 2,449,000 5.7% 133,900 20,000 2,602,900 286,000 12.3%
Parking 0 -678,100 0 1,155,700 477,600 477,600 0.0%
Municipal Enforcement 1,407,200 1,262,600 -10.3% 23,400 1,043,500 2,329,500 922,300 65.5%
Building Services 201,400 260,500 29.3% -23,400 57,200 294,300 92,900 46.1%
Planning Services 2,890,700 1,906,100 -34.1% 133,900 -800 2,039,200 -851,500 -29.5%
Development Services 851,400 174,300 -79.5% 417,600 -20,000 571,900 -279,500 -32.8%
Strategic Business Services 349,100 353,100 1.1% 0 -6,900 346,200 -2,900 -0.8%
Corporate Revenue & Expenses 30,931,600 31,671,000 2.4% -409,700 -5,516,100 25,745,200 -5,186,400 -16.8%
Total LEVY BY PROGRAM 207,287,900 206,857,600 -0.2% 4,435,400 3,444,900 214,737,900 7,450,000 3.59%
Assement Growth -1.30%Tax Levy Requirement 2.29%
2021 Budget Details Town of Oakville | E-46
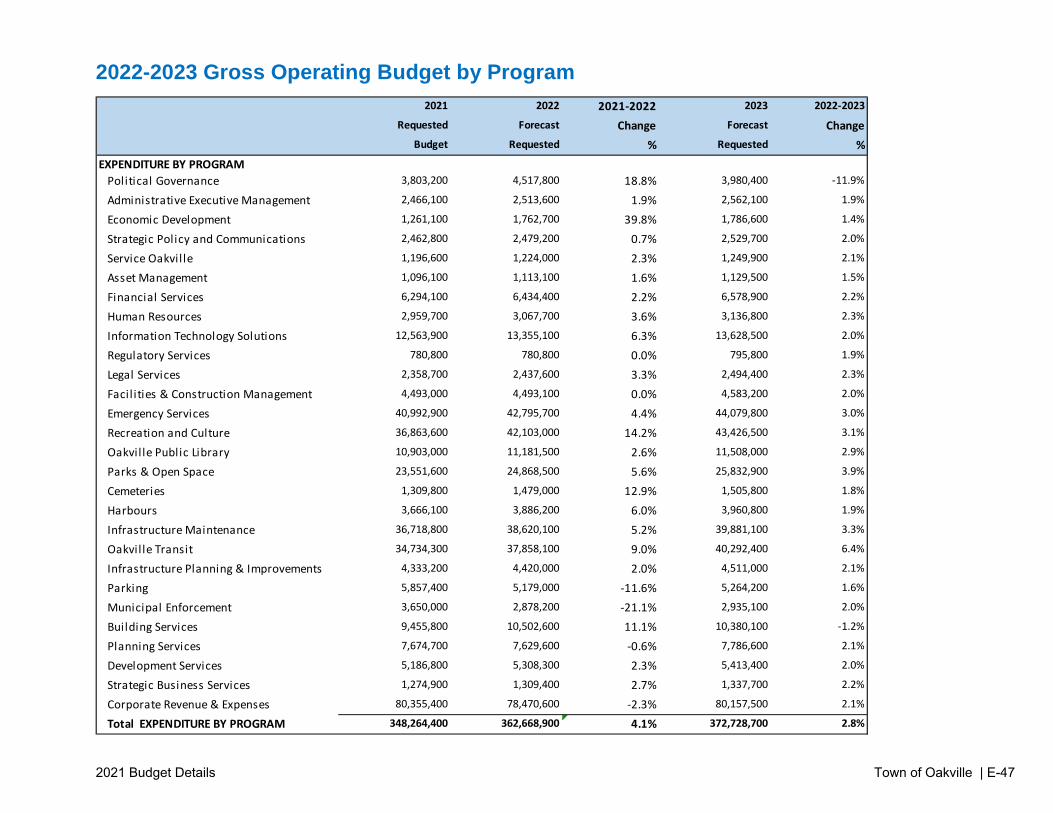
2022-2023 Gross Operating Budget by Program
2021 2022 2021-2022 2023 2022-2023
Requested Forecast Change Forecast ChangeBudget Requested % Requested %
EXPENDITURE BY PROGRAMPolitical Governance 3,803,200 4,517,800 18.8% 3,980,400 -11.9%
Administrative Executive Management 2,466,100 2,513,600 1.9% 2,562,100 1.9%
Economic Development 1,261,100 1,762,700 39.8% 1,786,600 1.4%
Strategic Policy and Communications 2,462,800 2,479,200 0.7% 2,529,700 2.0%
Service Oakvil le 1,196,600 1,224,000 2.3% 1,249,900 2.1%
Asset Management 1,096,100 1,113,100 1.6% 1,129,500 1.5%
Financial Services 6,294,100 6,434,400 2.2% 6,578,900 2.2%
Human Resources 2,959,700 3,067,700 3.6% 3,136,800 2.3%
Information Technology Solutions 12,563,900 13,355,100 6.3% 13,628,500 2.0%
Regulatory Services 780,800 780,800 0.0% 795,800 1.9%
Legal Services 2,358,700 2,437,600 3.3% 2,494,400 2.3%
Facil ities & Construction Management 4,493,000 4,493,100 0.0% 4,583,200 2.0%
Emergency Services 40,992,900 42,795,700 4.4% 44,079,800 3.0%
Recreation and Culture 36,863,600 42,103,000 14.2% 43,426,500 3.1%
Oakvil le Public Library 10,903,000 11,181,500 2.6% 11,508,000 2.9%
Parks & Open Space 23,551,600 24,868,500 5.6% 25,832,900 3.9%
Cemeteries 1,309,800 1,479,000 12.9% 1,505,800 1.8%
Harbours 3,666,100 3,886,200 6.0% 3,960,800 1.9%
Infrastructure Maintenance 36,718,800 38,620,100 5.2% 39,881,100 3.3%
Oakvil le Transit 34,734,300 37,858,100 9.0% 40,292,400 6.4%
Infrastructure Planning & Improvements 4,333,200 4,420,000 2.0% 4,511,000 2.1%
Parking 5,857,400 5,179,000 -11.6% 5,264,200 1.6%
Municipal Enforcement 3,650,000 2,878,200 -21.1% 2,935,100 2.0%
Building Services 9,455,800 10,502,600 11.1% 10,380,100 -1.2%
Planning Services 7,674,700 7,629,600 -0.6% 7,786,600 2.1%
Development Services 5,186,800 5,308,300 2.3% 5,413,400 2.0%
Strategic Business Services 1,274,900 1,309,400 2.7% 1,337,700 2.2%
Corporate Revenue & Expenses 80,355,400 78,470,600 -2.3% 80,157,500 2.1%
Total EXPENDITURE BY PROGRAM 348,264,400 362,668,900 4.1% 372,728,700 2.8%
2021 Budget Details Town of Oakville | E-47

2022-2023 Net Levy by Program
2021 2022 2021-2022 2023 2022-2023Requested Forecast Change Requested Change
Budget Requested % Increase $ %TAX LEVY BY PROGRAM
Political Governance 3,792,400 3,884,800 2.4% 3,969,300 2.2%
Administrative Executive Management 1,815,800 1,863,300 2.6% 1,911,800 2.6%
Economic Development 761,100 762,700 0.2% 786,600 3.1%
Strategic Policy and Communications 2,462,800 2,479,200 0.7% 2,529,700 2.0%
Service Oakvil le 1,021,600 1,044,000 2.2% 1,066,300 2.1%
Asset Management 1,096,100 1,113,100 1.6% 1,129,500 1.5%
Financial Services 4,774,900 4,876,000 2.1% 5,006,100 2.7%
Human Resources 2,957,700 3,063,700 3.6% 3,132,700 2.3%
Information Technology Solutions 12,196,900 12,988,100 6.5% 13,261,500 2.1%
Regulatory Services 399,200 346,600 -13.2% 353,000 1.8%
Legal Services 2,305,400 2,383,700 3.4% 2,439,900 2.4%
Facil ities & Construction Management 3,173,600 3,165,000 -0.3% 3,251,000 2.7%
Emergency Services 40,449,900 42,138,700 4.2% 43,414,300 3.0%
Recreation and Culture 21,977,700 20,898,100 -4.9% 21,796,600 4.3%
Oakvil le Public Library 10,214,400 10,442,200 2.2% 10,762,200 3.1%
Parks & Open Space 19,136,700 19,434,300 1.6% 20,340,200 4.7%
Cemeteries 167,300 170,500 1.9% 174,400 2.3%
Harbours 0 0 0.0% 0 0.0%
Infrastructure Maintenance 23,461,300 24,982,000 6.5% 25,881,400 3.6%
Oakvil le Transit 28,166,300 27,676,300 -1.7% 29,223,400 5.6%
Infrastructure Planning & Improvements 2,602,900 2,635,200 1.2% 2,690,800 2.1%
Parking 477,600 -612,300 -228.2% -644,800 5.3%
Municipal Enforcement 2,329,500 1,301,400 -44.1% 1,327,200 2.0%
Building Services 294,300 242,600 -17.6% 247,600 2.1%
Planning Services 2,039,200 2,097,300 2.8% 2,147,400 2.4%
Development Services 571,900 608,900 6.5% 628,000 3.1%
Strategic Business Services 346,200 363,000 4.9% 373,300 2.8%
Corporate Revenue & Expenses 25,745,200 30,971,600 20.3% 32,455,600 4.8%
Total LEVY BY PROGRAM 214,737,900 221,320,000 3.07% 229,655,000 3.77%
Assement Growth -1.00% -1.00%Tax Levy Requirement 2.07% 2.77%
2021 Budget Details Town of Oakville | E-48

Total Capital by Program & Financing
Total Development Gas Tax Program Funding Total Total Capital Long Term Total TotalProject Charges Funding Specific and Other External Town Levy Financing Corporate ProposedBudget Reserve Revenues Financing Reserves Financing Financing
CORPORATE INITIATIVESCorporate Initiatives 1,906,000 100,000 100,000 1,806,000 1,806,000 1,906,000
Total CORPORATE INITIATIVES 1,906,000 100,000 100,000 1,806,000 1,806,000 1,906,000CORPORATE SERVICES
Facilities and Construction Management 5,436,400 156,900 5,279,500 5,436,400 5,436,400Finance 140,000 50,000 50,000 90,000 90,000 140,000Information Technology Solutions 2,560,000 2,560,000 2,560,000 2,560,000
Total CORPORATE SERVICES 8,136,400 50,000 50,000 156,900 7,929,500 8,086,400 8,136,400COMMUNITY SERVICES
Parks and Open Space 12,530,000 4,702,000 205,000 4,907,000 2,451,000 5,172,000 7,623,000 12,530,000Cemeteries 116,000 116,000 116,000 116,000Harbours 890,000 190,000 190,000 700,000 700,000 890,000Emergency Services 2,923,100 100,000 100,000 2,436,600 386,500 2,823,100 2,923,100Recreation and Culture 1,656,800 228,800 1,428,000 1,656,800 1,656,800Oakville Public Library 570,300 66,300 66,300 504,000 504,000 570,300Infrastructure Maintenance 2,660,000 50,000 50,000 1,341,000 1,269,000 2,610,000 2,660,000Oakville Transit 16,809,100 287,500 1,772,400 10,553,000 12,612,900 3,063,200 1,133,000 4,196,200 16,809,100
Total COMMUNITY SERVICES 38,155,300 5,205,800 1,772,400 511,000 10,553,000 18,042,200 10,220,600 9,892,500 20,113,100 38,155,300COMMUNITY DEVELOPMENT
Infrastructure Planning 23,551,000 7,895,800 3,800,000 375,000 12,070,800 11,480,200 11,480,200 23,551,000Parking 1,046,000 903,000 70,000 973,000 73,000 73,000 1,046,000Municipal Enforcement 278,000 278,000 278,000 278,000Development Services 5,143,000 70,000 1,025,000 1,095,000 4,048,000 4,048,000 5,143,000Building Services 1,468,000 1,468,000 1,468,000 1,468,000Planning Services 1,262,000 1,146,000 1,146,000 116,000 116,000 1,262,000Total COMMUNITY DEVELOPMENT 32,748,000 9,111,800 4,825,000 903,000 445,000 15,284,800 1,468,000 15,995,200 17,463,200 32,748,000
TOTAL 80,945,700 14,367,600 6,697,400 1,414,000 10,998,000 33,477,000 11,845,500 35,623,200 47,468,700 80,945,700
2021 Budget Details Town of Oakville | E-49

Total Combined Operating and Capital by Program The total combined operating and capital expenditures is $393.6 million and is broken down by program in the following chart. (Note: the capital levy has been discounted from Corporate Revenue/Expenses so that it is not counted twice)
2021 Budget Details Town of Oakville | E-50

2021 BUDGET - LIVABILITY OPERATING AND CAPITAL
Livability Page 1

Livability
To be the most livable town in Canada.
• Provide a planning framework to maintain the character of the community • Protect cultural heritage assets of the community • Promote and support actions to maintain a resilient local economy
19% of 2021 Operating
Budget
7% of 2021 Capital Budget
Livability Page 2

2021 Operating Budget Summary
% of 2021 Operating Budget Funded by Tax Levy
PROGRAM
Total Expenses Net Budget Total Expenses Total Revenue Net Budget $ Change % Change
Economic Development 1,744$ 744$ 1,261$ 500$ 761$ 17$ 2%Emergency Services 39,429$ 38,809$ 40,993$ 543$ 40,450$ 1,641$ 4%Building Services 10,408$ 201$ 9,456$ 9,162$ 294$ 93$ 46%Planning Services 7,349$ 2,891$ 7,675$ 5,636$ 2,039$ (852)$ -29%Development Services 4,683$ 851$ 5,187$ 4,615$ 572$ (280)$ -33%Strategic Business Services 1,248$ 349$ 1,275$ 929$ 346$ (3)$ -1%Total 64,861$ 43,846$ 65,846$ 21,384$ 44,463$ 617$ 1%
(in $1,000's)
2020 Budget 2021 Budget
Livability Page 3

Livability Page 4
Program: Planning Services
Program Based Budget
2021 - 2023
Vision
• To promote the development and maintenance of a livable and sustainable community in order to enhance the natural, cultural, social and economic environments of the Town of Oakville.
Mission
• As a team, strive for excellence in creating and maintaining a livable community for present and future generations.
Planning Page 5

Program Services Planning delivers the following services:
Administration
• Establish overall departmental direction and provide leadership and guidance
Urban Design
• Ensure urban design policies and practices are created and sustained that implement and reflect the town’s strategic direction to enhance its built environment
Current Planning
• Review and process development applications to meet legislative requirements and comply with town policies and procedures for applicants, the public, the Committee of Adjustment and town Council
Policy Planning and Heritage
• Develop policies and programs to help guide and manage growth in Oakville while balancing community needs, economic prosperity and environmental sustainability
$0.4M
$1.1M
$(0.8)M
$1.3M
Planning Page 6
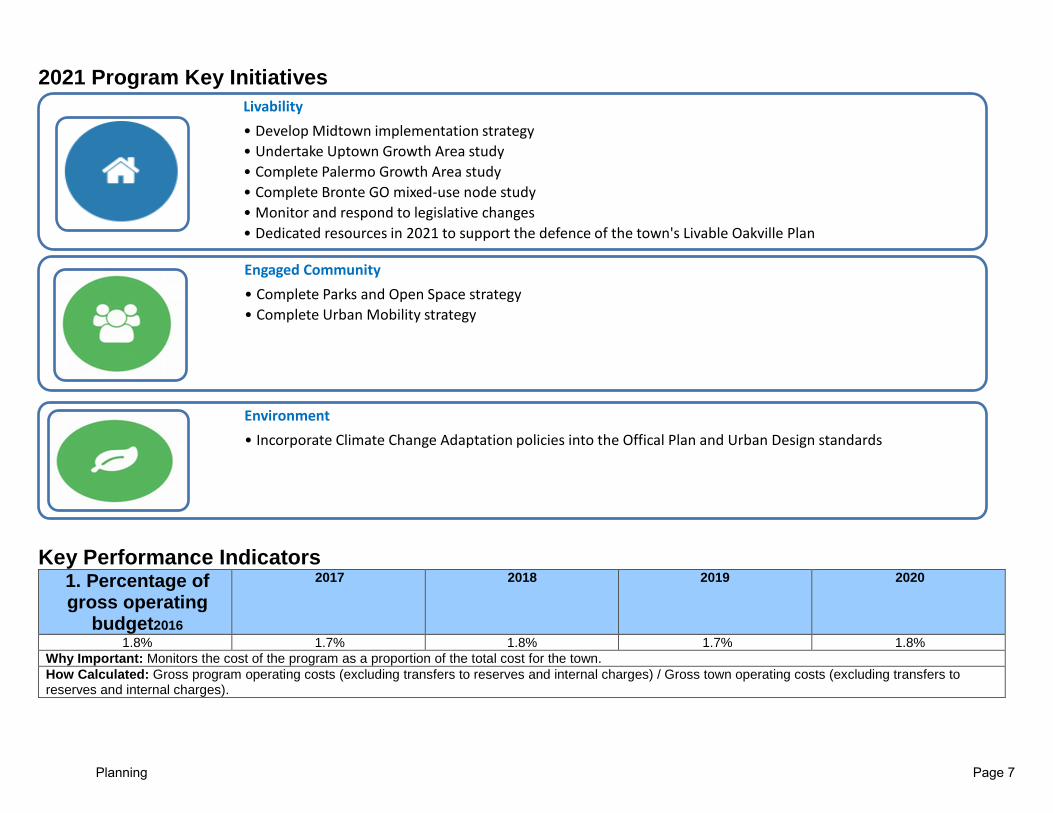
2021 Program Key Initiatives
Key Performance Indicators
1. Percentage of gross operating
budget2016
2017 2018 2019 2020
1.8% 1.7% 1.8% 1.7% 1.8% Why Important: Monitors the cost of the program as a proportion of the total cost for the town. How Calculated: Gross program operating costs (excluding transfers to reserves and internal charges) / Gross town operating costs (excluding transfers to reserves and internal charges).
Livability• Develop Midtown implementation strategy• Undertake Uptown Growth Area study• Complete Palermo Growth Area study• Complete Bronte GO mixed-use node study• Monitor and respond to legislative changes• Dedicated resources in 2021 to support the defence of the town's Livable Oakville Plan
Engaged Community• Complete Parks and Open Space strategy• Complete Urban Mobility strategy
Environment• Incorporate Climate Change Adaptation policies into the Offical Plan and Urban Design standards
Planning Page 7
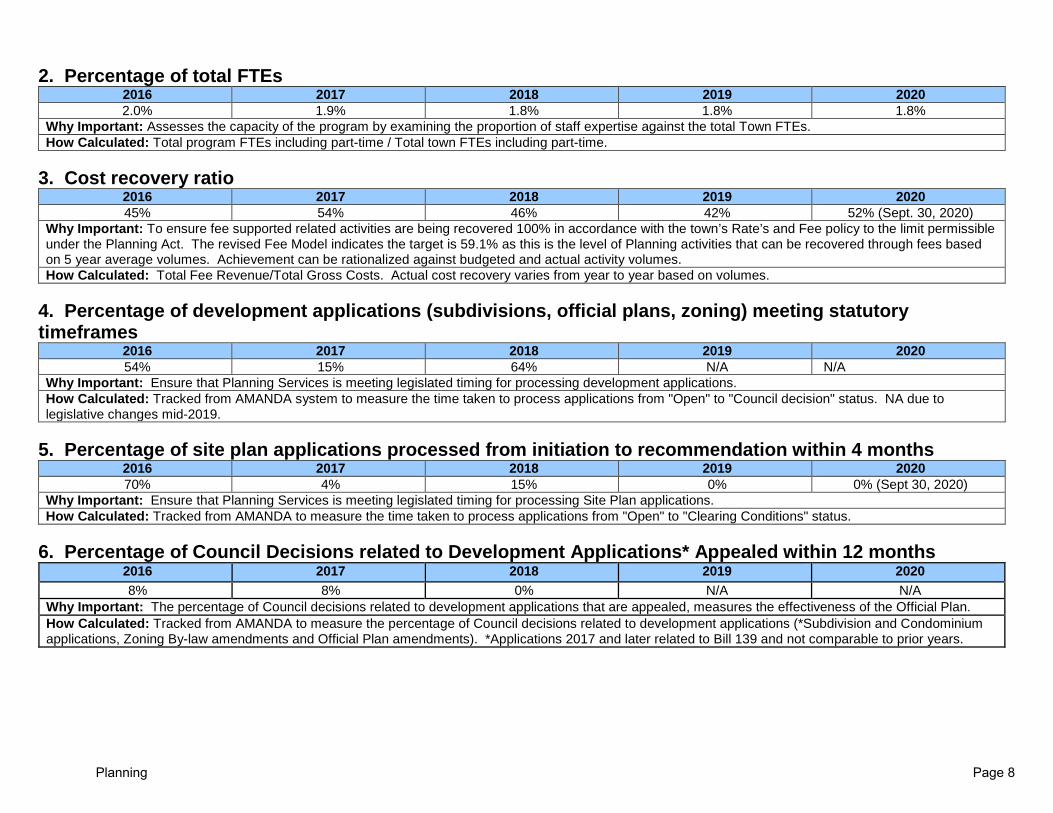
2. Percentage of total FTEs 2016 2017 2018 2019 2020 2.0% 1.9% 1.8% 1.8% 1.8%
Why Important: Assesses the capacity of the program by examining the proportion of staff expertise against the total Town FTEs. How Calculated: Total program FTEs including part-time / Total town FTEs including part-time.
3. Cost recovery ratio
2016 2017 2018 2019 2020 45% 54% 46% 42% 52% (Sept. 30, 2020)
Why Important: To ensure fee supported related activities are being recovered 100% in accordance with the town’s Rate’s and Fee policy to the limit permissible under the Planning Act. The revised Fee Model indicates the target is 59.1% as this is the level of Planning activities that can be recovered through fees based on 5 year average volumes. Achievement can be rationalized against budgeted and actual activity volumes. How Calculated: Total Fee Revenue/Total Gross Costs. Actual cost recovery varies from year to year based on volumes.
4. Percentage of development applications (subdivisions, official plans, zoning) meeting statutory timeframes
2016 2017 2018 2019 2020 54% 15% 64% N/A N/A
Why Important: Ensure that Planning Services is meeting legislated timing for processing development applications. How Calculated: Tracked from AMANDA system to measure the time taken to process applications from "Open" to "Council decision" status. NA due to legislative changes mid-2019.
5. Percentage of site plan applications processed from initiation to recommendation within 4 months
2016 2017 2018 2019 2020 70% 4% 15% 0% 0% (Sept 30, 2020)
Why Important: Ensure that Planning Services is meeting legislated timing for processing Site Plan applications. How Calculated: Tracked from AMANDA to measure the time taken to process applications from "Open" to "Clearing Conditions" status.
6. Percentage of Council Decisions related to Development Applications* Appealed within 12 months
2016 2017 2018 2019 2020 8% 8% 0% N/A N/A
Why Important: The percentage of Council decisions related to development applications that are appealed, measures the effectiveness of the Official Plan. How Calculated: Tracked from AMANDA to measure the percentage of Council decisions related to development applications (*Subdivision and Condominium applications, Zoning By-law amendments and Official Plan amendments). *Applications 2017 and later related to Bill 139 and not comparable to prior years.
Planning Page 8
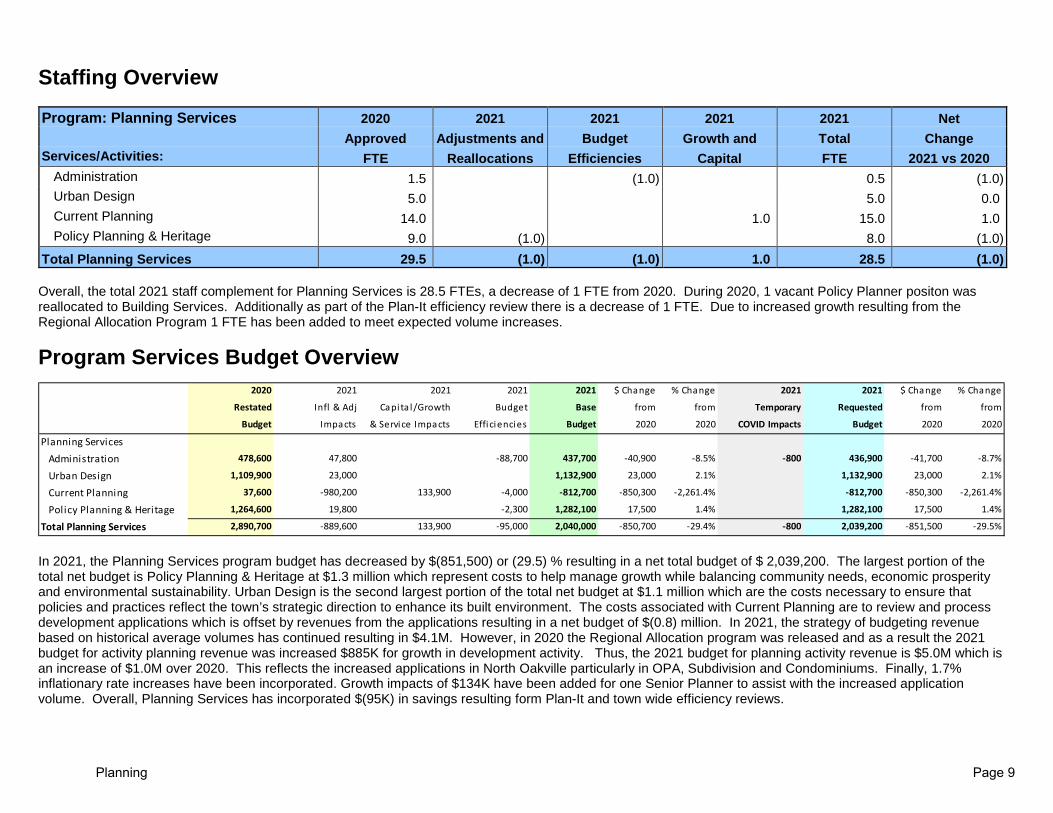
Staffing Overview
Program: Planning Services 2020 2021 2021 2021 2021 Net Approved Adjustments and Budget Growth and Total Change Services/Activities: FTE Reallocations Efficiencies Capital FTE 2021 vs 2020
Administration 1.5 (1.0) 0.5 (1.0) Urban Design 5.0 5.0 0.0 Current Planning 14.0 1.0 15.0 1.0 Policy Planning & Heritage 9.0 (1.0) 8.0 (1.0)
Total Planning Services 29.5 (1.0) (1.0) 1.0 28.5 (1.0) Overall, the total 2021 staff complement for Planning Services is 28.5 FTEs, a decrease of 1 FTE from 2020. During 2020, 1 vacant Policy Planner positon was reallocated to Building Services. Additionally as part of the Plan-It efficiency review there is a decrease of 1 FTE. Due to increased growth resulting from the Regional Allocation Program 1 FTE has been added to meet expected volume increases.
Program Services Budget Overview
In 2021, the Planning Services program budget has decreased by $(851,500) or (29.5) % resulting in a net total budget of $ 2,039,200. The largest portion of the total net budget is Policy Planning & Heritage at $1.3 million which represent costs to help manage growth while balancing community needs, economic prosperity and environmental sustainability. Urban Design is the second largest portion of the total net budget at $1.1 million which are the costs necessary to ensure that policies and practices reflect the town’s strategic direction to enhance its built environment. The costs associated with Current Planning are to review and process development applications which is offset by revenues from the applications resulting in a net budget of $(0.8) million. In 2021, the strategy of budgeting revenue based on historical average volumes has continued resulting in $4.1M. However, in 2020 the Regional Allocation program was released and as a result the 2021 budget for activity planning revenue was increased $885K for growth in development activity. Thus, the 2021 budget for planning activity revenue is $5.0M which is an increase of $1.0M over 2020. This reflects the increased applications in North Oakville particularly in OPA, Subdivision and Condominiums. Finally, 1.7% inflationary rate increases have been incorporated. Growth impacts of $134K have been added for one Senior Planner to assist with the increased application volume. Overall, Planning Services has incorporated $(95K) in savings resulting form Plan-It and town wide efficiency reviews.
2020 2021 2021 2021 2021 $ Change % Change 2021 2021 $ Change % Change
Restated Infl & Adj Capita l/Growth Budget Base from from Temporary Requested from from
Budget Impacts & Service Impacts Efficiencies Budget 2020 2020 COVID Impacts Budget 2020 2020
Planning ServicesAdministration 478,600 47,800 -88,700 437,700 -40,900 -8.5% -800 436,900 -41,700 -8.7%
Urban Design 1,109,900 23,000 1,132,900 23,000 2.1% 1,132,900 23,000 2.1%
Current Planning 37,600 -980,200 133,900 -4,000 -812,700 -850,300 -2,261.4% -812,700 -850,300 -2,261.4%
Policy Planning & Heritage 1,264,600 19,800 -2,300 1,282,100 17,500 1.4% 1,282,100 17,500 1.4%
Total Planning Services 2,890,700 -889,600 133,900 -95,000 2,040,000 -850,700 -29.4% -800 2,039,200 -851,500 -29.5%
Planning Page 9

Net Program Budget Change • Administration has decreased $(41,700) primarily due to budget
efficiencies of $(88,700) from Plan-It implementation. A partial reduction in the overall savings due to inflationary and contractual increases for wages and benefits are also included. In addition, internal charges have increased to reflect current business requirements.
• Urban Design has increased $23,000 primarily due to contractual and inflationary increases for wages and benefits. In addition, internal charges have increased which represents the time spent by other departments to assist the Urban Design program.
• Current Planning has decreased $(850,300) primarily due to base activity revenue having a modest increase to reflect average volumes as well as increased revenue from growth which fully mitigates expenditure increases from inflationary and contractual increases of wages and benefits. Inflationary increase of 1.7% to all Planning rates and fees have been incorporated. In addition internal charges have increased for staff time spent from other departments for Planning service delivery. Finally, one Senior Planner has been added to assist with increased growth volumes of applications.
• Policy Planning & Heritage has increased $17,500 primarily due to contractual and inflationary increases for wages and benefits along with a minimal increase to internal charges. Temporary funding has been added for one Heritage Planner to assist in Local Planning Appeal Tribunal (LPAT) hearings. Finally, $(2,300) in efficiencies from a town wide review has been included for skills improvement and mileage.
Planning Page 10

2021 Program Budget by Component– Net $ 2,039,200
In 2021, the Planning Services program has total expenditures of $7,674,700 and total revenues of $ 5,635,500 resulting in a net budget of $ 2,039,200. The main drivers for the change are the following:
• Personnel Services & Benefits represents 56% of the total gross expenditures for Planning Services with $4.3 million. In 2021, personnel costs have increased by $276,000, primarily due to temporary personnel budget added to support Planning legal matters anticipated for 2021. In addition, one Senior Planner to assist with growth volumes, one Heritage Planner to assist with LPAT hearings, as well as inflationary and contractual increases for salaries and benefits have been included. Increases are partially mitigated by efficiencies identified in the Plan-It organizational review.
• Internal Charges is the second largest cost component at 41% with $3.1 million and represent direct and indirect costs from other departments involved in the Planning application process. In 2021, internal charges have increased by $53,900 to reflect inflationary increases from other departments involved in the planning process that can be recovered through Planning fees.
• Purchased Services have decreased by $(5,100), due to town wide efficiency savings in skills improvement and mileage. • Activity Revenue represents 89% of the total revenue for Planning Services with $5.0 million. Activity revenue has increased by $1,056,900. While
inflationary increases to rates are included and average volumes incorporated for base increase of $175K the release of the Regional Allocation program has resulted in $882K additional growth revenue.
• Other Revenue has increased $116,500 as Tax Stabilization funding has been added to support the Planning legal matters anticipated for 2021 as well as temporary funding for Heritage Planner to support LPAT hearings.
• Internal Recoveries have increased by $4,300 to reflect the allocation from Building and Development Services’ departments fee for service recovery models.
Planning Page 11
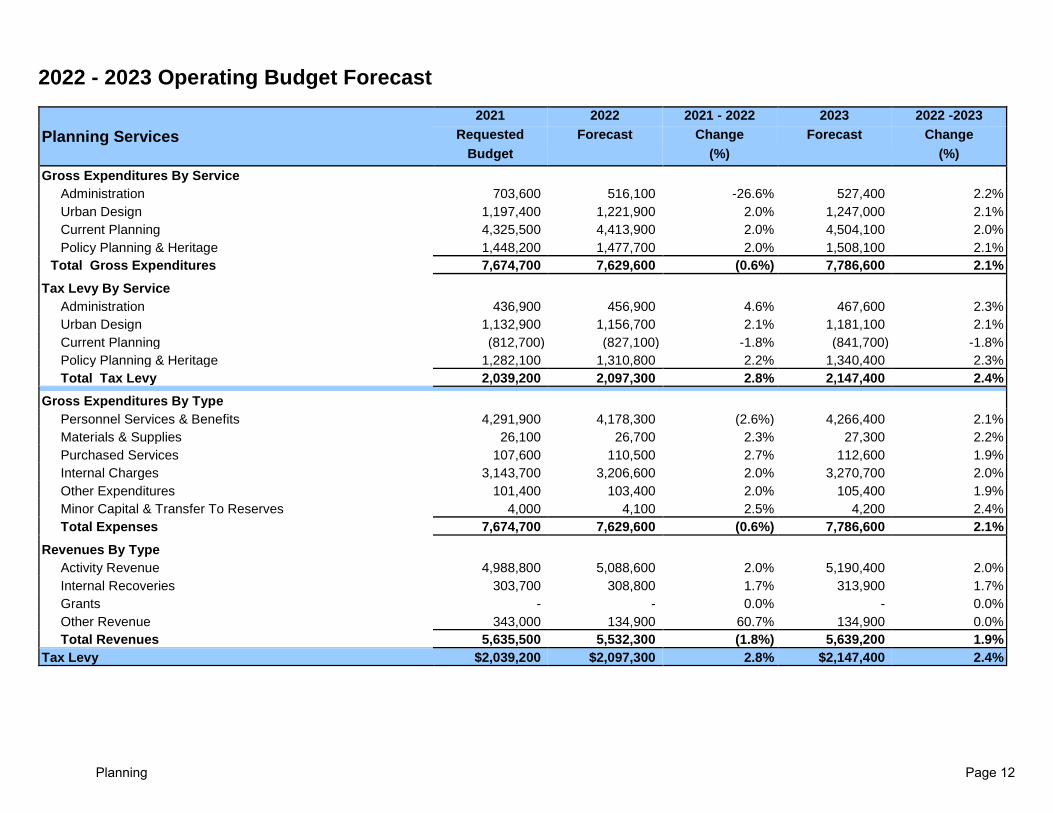
2022 - 2023 Operating Budget Forecast
Planning Services 2021 2022 2021 - 2022 2023 2022 -2023
Requested Forecast Change Forecast Change Budget (%) (%)
Gross Expenditures By Service Administration 703,600 516,100 -26.6% 527,400 2.2% Urban Design 1,197,400 1,221,900 2.0% 1,247,000 2.1% Current Planning 4,325,500 4,413,900 2.0% 4,504,100 2.0% Policy Planning & Heritage 1,448,200 1,477,700 2.0% 1,508,100 2.1% Total Gross Expenditures 7,674,700 7,629,600 (0.6%) 7,786,600 2.1% Tax Levy By Service Administration 436,900 456,900 4.6% 467,600 2.3% Urban Design 1,132,900 1,156,700 2.1% 1,181,100 2.1% Current Planning (812,700) (827,100) -1.8% (841,700) -1.8% Policy Planning & Heritage 1,282,100 1,310,800 2.2% 1,340,400 2.3% Total Tax Levy 2,039,200 2,097,300 2.8% 2,147,400 2.4% Gross Expenditures By Type Personnel Services & Benefits 4,291,900 4,178,300 (2.6%) 4,266,400 2.1% Materials & Supplies 26,100 26,700 2.3% 27,300 2.2% Purchased Services 107,600 110,500 2.7% 112,600 1.9% Internal Charges 3,143,700 3,206,600 2.0% 3,270,700 2.0% Other Expenditures 101,400 103,400 2.0% 105,400 1.9% Minor Capital & Transfer To Reserves 4,000 4,100 2.5% 4,200 2.4% Total Expenses 7,674,700 7,629,600 (0.6%) 7,786,600 2.1% Revenues By Type Activity Revenue 4,988,800 5,088,600 2.0% 5,190,400 2.0% Internal Recoveries 303,700 308,800 1.7% 313,900 1.7% Grants - - 0.0% - 0.0% Other Revenue 343,000 134,900 60.7% 134,900 0.0% Total Revenues 5,635,500 5,532,300 (1.8%) 5,639,200 1.9% Tax Levy $2,039,200 $2,097,300 2.8% $2,147,400 2.4%
Planning Page 12

2022 - 2023 Budget Forecast Highlights • The 2022 net budget is projected to increase by 2.8% or $ 58,100 and reflects inflationary increases to the cost of delivering services. Also, 2021 additional
funding for Planning legal matters has been reversed. • The 2023 net budget is projected to increase by 2.4% or $ 50,100 and reflects inflationary increases to the cost of delivering services.
2021 Recommended Capital Budget The capital budget will provide funds for Planning Services to undertake the required 5-year review of the Official Plan and other special planning projects and studies to support the review, including a Zoning Review, Urban Design Initiatives and Heritage Planning Studies.
Capital Budget Operating Impacts Project Project Title Classification 2021 2021 63101501 Official Plan/ Prov. Conformity Review Growth 200,000 63101801 Heritage Planning Studies Infrastructure Renewal 25,000 63102101 Lighting and Signage Study Strategic Priorities 91,000 63102102 Urban Design Initiatives (Design Direction and Studies) Growth 245,000 63102103 Zoning Review Growth 235,000 63102104 Special Planning Projects/Studies Growth 166,000 63102105 OP Implementation Growth 300,000
TOTAL 1,262,000
Planning Page 13

Planning Page 14

Program: Building Services
Program Based Budget
2021 - 2023
Vision
• To provide a centre of expertise for the community and the development industry regarding the requirements of the Ontario Building code, the town's zoning by-laws and Committee of Adjustment.
Mission
• To inform and assist our customers to ensure safe and orderly development and provide efficient delivery of building and zoning review approvals, inspections, minor variance and consent applications and other related services.
Building Page 15

Program Services The Building Services Department provides activities through the following services:
Building Admin
• Ensure that the operation of the department complies with legislative requirements and effective management practices
Permit and Zoning
• To undertake the review of all building permit applications to ensure compliance with the Ontario Building Code and the town’s zoning by-laws
Inspection Services
• Meet legislative requirements for carrying out inspections
Committee of Adjustment
• To ensure applications are processed in accordance with legislative requirements
• To ensure the Committee has all required documentation to make an informed decision
$0.2M
($0.1)M
($0.1)M
$0.3M
Building Page 16

2021 Program Key Initiatives
Livability• Monitor and respond to legislative changes
Accountable Government• Participate in creation of an online citizen portal where applicants can submit, make payments, check status
of permit applications and schedule building inspections• Introduce mobile inspection technology• Modernize the intake process and review process for building permits to support customer first philosphy
Enviornment• Implement town vehicles for Building inspectors usingy hybrid technolgy to support the enviornment
Building Page 17
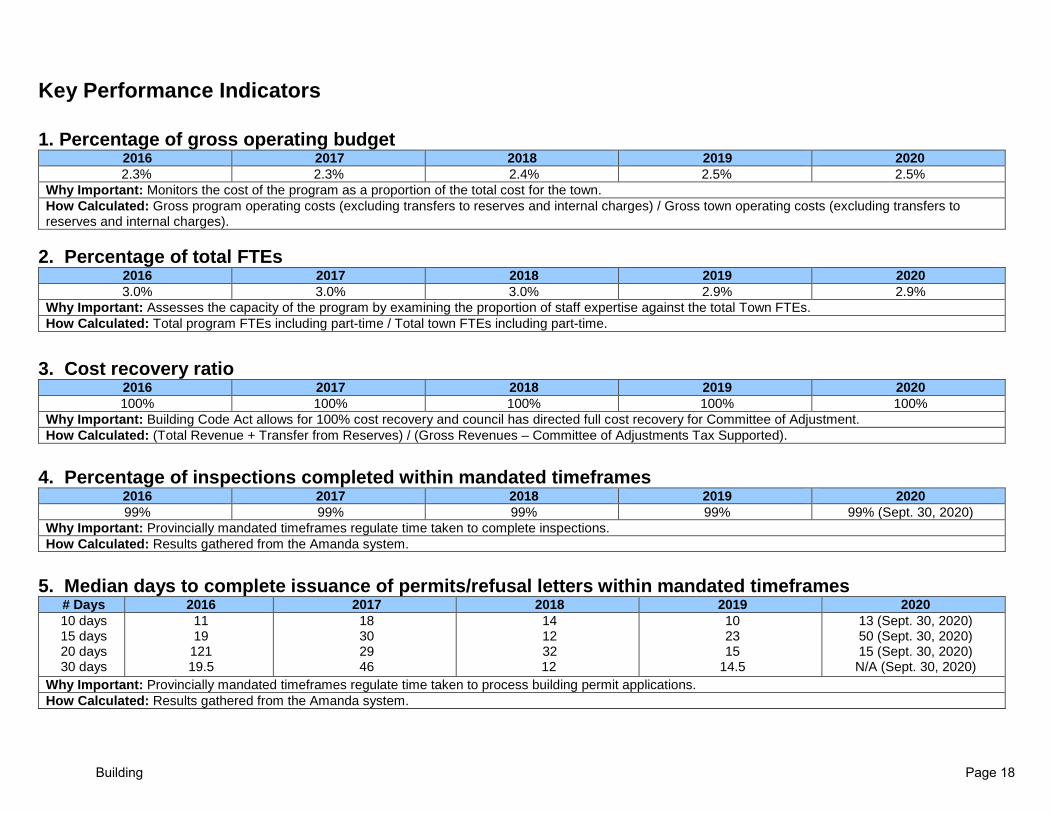
Key Performance Indicators 1. Percentage of gross operating budget
2016 2017 2018 2019 2020 2.3% 2.3% 2.4% 2.5% 2.5%
Why Important: Monitors the cost of the program as a proportion of the total cost for the town. How Calculated: Gross program operating costs (excluding transfers to reserves and internal charges) / Gross town operating costs (excluding transfers to reserves and internal charges).
2. Percentage of total FTEs
2016 2017 2018 2019 2020 3.0% 3.0% 3.0% 2.9% 2.9%
Why Important: Assesses the capacity of the program by examining the proportion of staff expertise against the total Town FTEs. How Calculated: Total program FTEs including part-time / Total town FTEs including part-time.
3. Cost recovery ratio
2016 2017 2018 2019 2020 100% 100% 100% 100% 100%
Why Important: Building Code Act allows for 100% cost recovery and council has directed full cost recovery for Committee of Adjustment. How Calculated: (Total Revenue + Transfer from Reserves) / (Gross Revenues – Committee of Adjustments Tax Supported).
4. Percentage of inspections completed within mandated timeframes
2016 2017 2018 2019 2020 99% 99% 99% 99% 99% (Sept. 30, 2020)
Why Important: Provincially mandated timeframes regulate time taken to complete inspections. How Calculated: Results gathered from the Amanda system.
5. Median days to complete issuance of permits/refusal letters within mandated timeframes
# Days 2016 2017 2018 2019 2020 10 days 15 days 20 days 30 days
11 19
121 19.5
18 30 29 46
14 12 32
12
10 23 15
14.5
13 (Sept. 30, 2020) 50 (Sept. 30, 2020) 15 (Sept. 30, 2020) N/A (Sept. 30, 2020)
Why Important: Provincially mandated timeframes regulate time taken to process building permit applications. How Calculated: Results gathered from the Amanda system.
Building Page 18
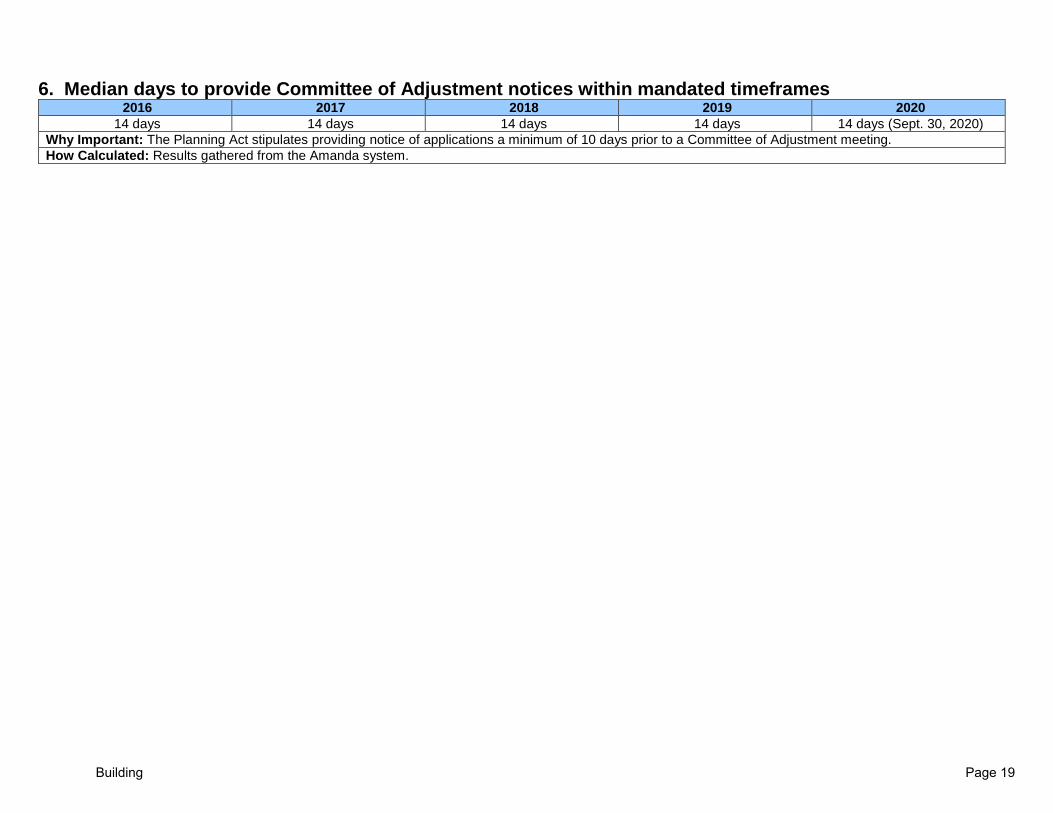
6. Median days to provide Committee of Adjustment notices within mandated timeframes 2016 2017 2018 2019 2020
14 days 14 days 14 days 14 days 14 days (Sept. 30, 2020) Why Important: The Planning Act stipulates providing notice of applications a minimum of 10 days prior to a Committee of Adjustment meeting. How Calculated: Results gathered from the Amanda system.
Building Page 19

Staffing Overview
Program: Building Services 2020 2021 2021 2021 2021 Net Approved Adjustments
d Budget Growth and Total Change
Services/Activities: FTE Reallocations Efficiencies Capital FTE 2021 vs 2020 Building Administration 1.8 1.8 0.0 Inspection Services 21.0 21.0 0.0 Permit & Zoning 22.2 1.0 23.2 1.0 Committee of Adjustment 2.3 2.3 0.0
Total Building Services 47.3 1.0 0.0 0.0 48.3 1.0 Overall, the total 2021 staff complement for Building Services is 47.3 FTEs, an increase of one FTE from 2020. During 2020 one vacant FTE was reallocated from Planning Service to create a Building Service Representative position to help alleviate workload pressures.
Program Services Budget Overview
With the exception of Committee of Adjustment, the Building Services program is a 100% cost recovered program, meaning total gross expenditures of $9.4 million have been fully offset by revenues and any surplus or shortfall is transferred to the Building Enterprise reserve fund, resulting in a net budget of zero for those services. For 2021, Building is projecting a surplus revenue transfer to reserve of $150K. Building Services ensures that all construction within the municipality meet Ontario Building Code minimum standards to ensure life safety for all residents, businesses and workers. In 2021, Building permit rates have increased 1.7% and average residential volumes have been projected based on past seven years average. However, with the ongoing global COVID pandemic there has been a reduction of 100 units or $297,300. Industrial, Commercial and Institutional (ICI) revenue has been reduced 43% to reflect emerging trends. Through various corporate and commission efficiency reviews Building Services has incorporated $294,700 in savings. The Committee of Adjustment service allows residents, builders, businesses and developers the opportunity to obtain minor variances from zoning regulations and/or the severance of lands. In 2021, the total net budget for Committee of Adjustment is $294,300, which has increased by $92,900 or 46% mainly driven by lower expected revenue due to lower volumes and includes COVID projections of $57,200 from reduced revenues.
2020 2021 2021 2021 2021 $ Change % Change 2021 2021 $ Change % Change
Restated Infl & Adj Capita l/Growth Budget Base from from Temporary Requested from from
Budget Impacts & Service Impacts Efficiencies Budget 2020 2020 COVID Impacts Budget 2020 2020
Building ServicesBuilding Administration 498,100 12,300 -277,200 233,200 -264,900 -53.2% 233,200 -264,900 -53.2%
Inspection Services -302,800 218,000 -23,400 -8,400 -116,600 186,200 61.5% -116,600 186,200 61.5%
Permit & Zoning -195,300 86,100 -7,400 -116,600 78,700 40.3% -116,600 78,700 40.3%
Committee of Adjustment 201,400 37,400 -1,700 237,100 35,700 17.7% 57,200 294,300 92,900 46.1%
Total Building Services 201,400 353,800 -23,400 -294,700 237,100 35,700 17.7% 57,200 294,300 92,900 46.1%
Building Page 20

Net Program Budget Change • Administration has decreased by ($264,900) as a result of budget
efficiencies from Plan-It implementation. Contractual and inflationary adjustments for wages and benefits have also been included.
• Inspection Services has increased by $186,200. This is mainly driven by lower expected revenue of $(847K) as the management team expects ICI activity to decline based on recent trends. A $(99K) reduction or 100 residential units is included as a possible decrease should COVID impacts reoccur in 2021. Additionally a net $(23,400) reduction has been implemented as a result of electric vehicle purchases for Building Inspectors. To mitigate the revenue shortfall the transfer to the Building Enterprise Reserve had been reduced for the program to equal net zero.
• Permit & Zoning has increased by $78,700. This is mainly driven by the reduction of ICI revenue and a 100 residential unit COVID contingency. In 2020 one vacant FTE was reallocated from the Planning Services department and incorporated into the 2021 budget. Furthermore, as a result of the Regional Allocation Program the need for a Building Services Supervisor of Service Delivery and Innovation has been identified and temporary funding added for a two year contract. Due to the reduced revenues and increase expenditures the transfer to the Building Enterprise reserve has been reduced however, the program remains 100% fee recoverable.
• Committee of Adjustment has increased by $92,900 mainly as a result of decreased revenue ($89,700) of which ($68,500) is anticipated from a possible COVID impact. To partially mitigate the revenue shortfalls one time reductions have been included for part-time personnel, materials and supplies and purchase services.
Building Page 21

2021 Program Budget by Component– Net $294,300
In 2021, total direct operating expenditures for Building Services and Committee of adjustment is $9,455,800 and total revenues is $9,161,500 which results in a net revenue transfer from the Building Enterprise reserve of $985,200 for an overall net budget of $294,300. Overall, the Building Services portion of the budget is net to zero by recovering 100% of costs of the services with the net budget of $294,300 related to Committee of Adjustments. The main drivers of the budget are as follows: • Personnel Services & Benefits represents the largest portion of the gross expenditures with $5.7 million. In 2021, personnel costs have increased by
$51,800, as efficiencies from Plan-It have been incorporated. These savings have been partially reduced by inflationary and contractual wage and benefit increases. As well, one vacant FTE was reallocated from Planning Services in 2020 and included in the 2021 budget. Finally due to the Regional Allocation Program the need for a Building Services Supervisor has been identified and temporary funding for a two year contract has been added. A one-time reduction of ($7,100) for Committee of Adjustment part-time funding has been removed as a COVID mitigation strategy.
• Internal Charges is the second largest component with $2.9 million, which have increased by $63,700 or 2.2% to reflect other departments direct and indirect costs attributed to the delivery of Building Services. Furthermore, $15,400 has been added for internal labour charges for 16 new electric vehicles purchased for Building Inspectors.
• Minor Capital and Transfer to Reserves, has decreased by $930,100 as revenues has declined resulting in a reduced transfer to the Building Enterprise reserve. Additionally, $80,000 has been added for the replacement value of electric vehicles to be phased in over several years.
• Purchased Services has decreased by $136,300 due to budget efficiencies. The purchase of electric vehicles has allowed for $(123,900) of mileage savings to be incorporated. Additionally, a town wide review has identified $(16,500) in skills improvement savings.
Building Page 22

• Activity Revenue represents 87% of the total revenue for the Building Services program. In 2021, activity revenue is projected to decrease by $1,478,400 mainly due to lower activity level for ICI permits and possible COVID reductions should a second wave occur in 2021. This decrease includes a COA revenue decrease of $(89,700), or (33.9%) driven by lower volume and COVID contingencies.
Building Page 23

2022 - 2023 Operating Budget Forecast
Building Services 2021 2022 2021 - 2022 2023 2022 -2023
Requested Forecast Change Forecast Change Budget (%) (%)
Gross Expenditures By Service Building Administration 303,600 315,100 3.8% 326,900 3.7% Inspection Services 3,737,000 4,544,700 21.6% 4,157,400 -8.5% Permit & Zoning 4,483,300 4,681,300 4.4% 4,915,200 5.0% Committee of Adjustment 931,900 961,500 3.2% 980,600 2.0% Total Gross Expenditures 9,455,800 10,502,600 11.1% 10,380,100 (1.2%) Tax Levy By Service Building Administration 233,200 244,400 4.8% 255,900 4.7% Inspection Services (116,600) (122,200) (4.8%) (127,800) (4.6%) Permit & Zoning (116,600) (122,200) (4.8%) (127,800) (4.6%) Committee of Adjustment 294,300 242,600 (17.6%) 247,300 1.9% Total Tax Levy 294,300 242,600 (17.6%) 247,600 2.1% Gross Expenditures By Type Personnel Services & Benefits 5,696,800 5,826,600 2.3% 5,819,000 (0.1%) Materials & Supplies 40,900 45,000 10.0% 45,800 1.8% Purchased Services 111,800 117,200 4.8% 121,900 4.0% Internal Charges 2,965,700 3,023,600 2.0% 3,082,700 2.0% Other Expenditures 6,900 7,000 1.4% 7,100 1.4% Minor Capital & Transfer To Reserves 633,700 1,483,200 134.1% 1,303,600 -12.1% Total Expenses 9,455,800 10,502,600 11.1% 10,380,100 (1.2%) Revenues By Type Activity Revenue 8,530,800 9,988,100 17.1% 9,911,200 (0.8%) Internal Recoveries 145,500 148,400 2.0% 151,300 2.0% Grants - - 0.0% - 0.0% Other Revenue 485,200 123,500 74.5% 70,000 (43.3%) Total Revenues 9,161,500 10,260,000 12.0% 10,132,500 (1.2%) Tax Levy $294,300 $242,600 (17.6%) $247,600 2.1%
Building Page 24
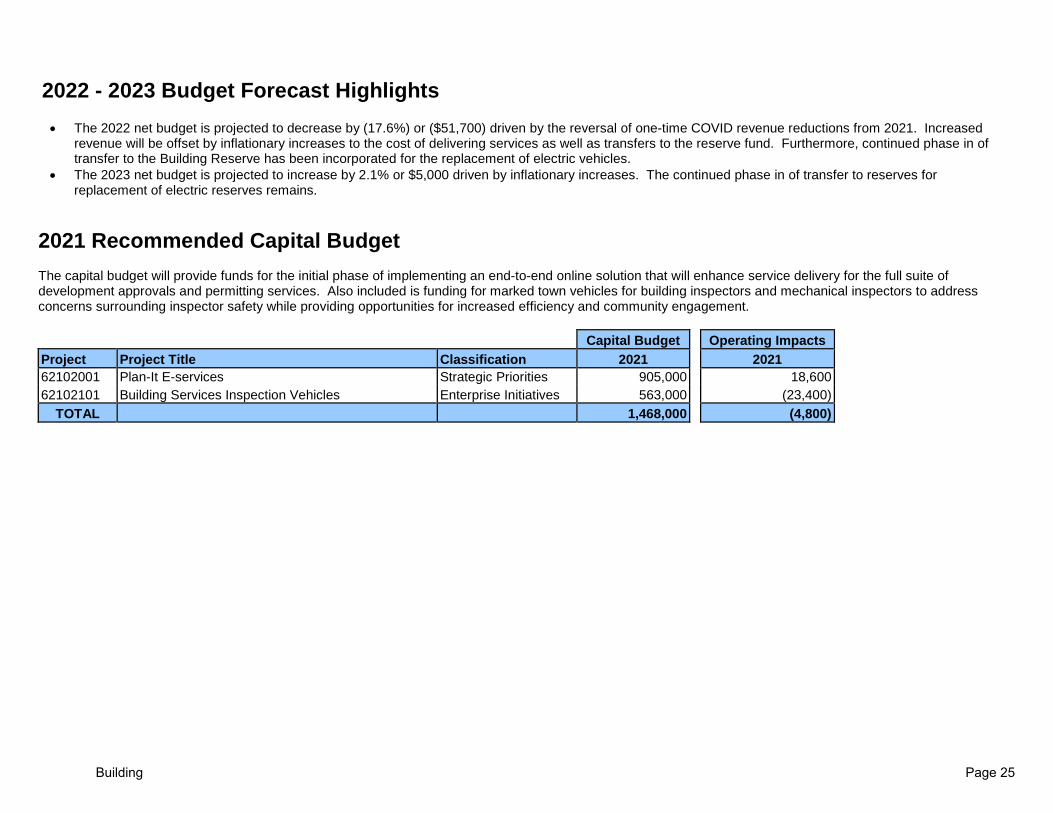
2022 - 2023 Budget Forecast Highlights • The 2022 net budget is projected to decrease by (17.6%) or ($51,700) driven by the reversal of one-time COVID revenue reductions from 2021. Increased
revenue will be offset by inflationary increases to the cost of delivering services as well as transfers to the reserve fund. Furthermore, continued phase in of transfer to the Building Reserve has been incorporated for the replacement of electric vehicles.
• The 2023 net budget is projected to increase by 2.1% or $5,000 driven by inflationary increases. The continued phase in of transfer to reserves for replacement of electric reserves remains.
2021 Recommended Capital Budget The capital budget will provide funds for the initial phase of implementing an end-to-end online solution that will enhance service delivery for the full suite of development approvals and permitting services. Also included is funding for marked town vehicles for building inspectors and mechanical inspectors to address concerns surrounding inspector safety while providing opportunities for increased efficiency and community engagement. Capital Budget Operating Impacts Project Project Title Classification 2021 2021 62102001 Plan-It E-services Strategic Priorities 905,000 18,600 62102101 Building Services Inspection Vehicles Enterprise Initiatives 563,000 (23,400)
TOTAL 1,468,000 (4,800)
Building Page 25

Building Page 26

Program: Development Services
Program Based Budget
2021 - 2023
Vision
• To ensure development proposals meet community objectives aimed at protecting and improving the livability of the community.
Mission
• Protecting the public and its interest in the greater community by ensuring land (re)development proposals comply with current engineering standards/practices and that our community is supported by stormwater management infrastructure and strategies that work to safeguard the community and its natural resources.
Development Services Page 27
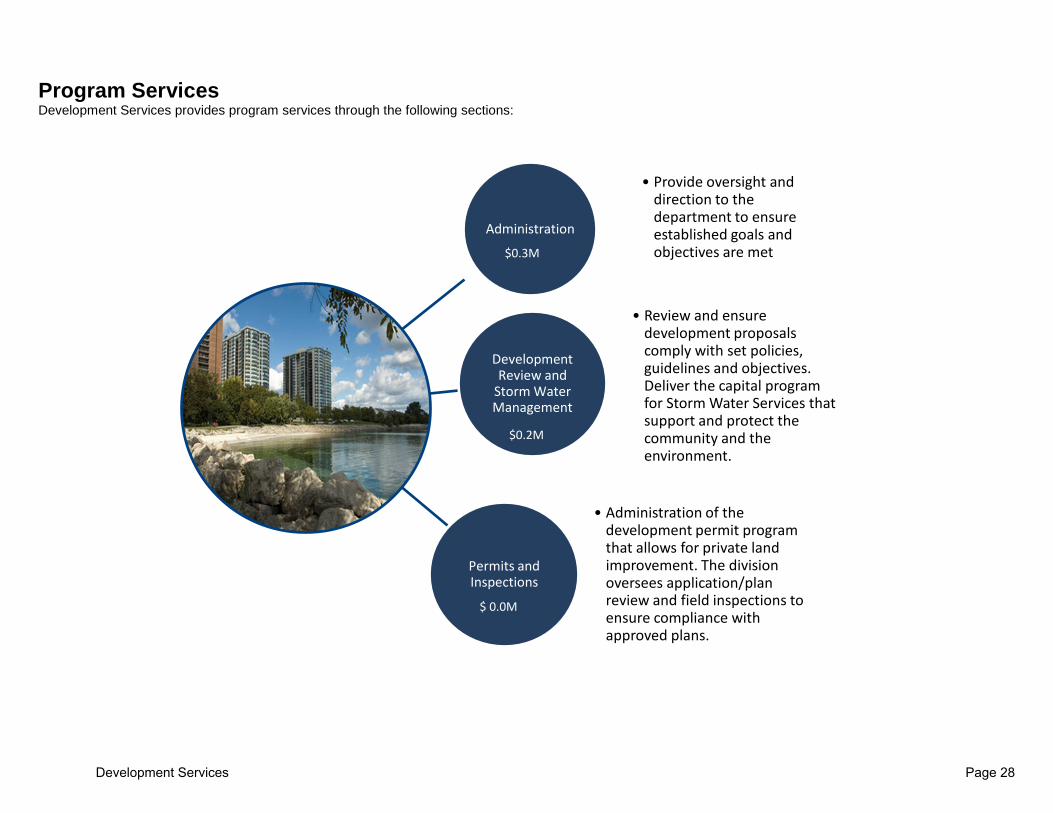
Program Services Development Services provides program services through the following sections:
Administration
• Provide oversight and direction to the department to ensure established goals and objectives are met
Development Review and
Storm Water Management
• Review and ensure development proposals comply with set policies, guidelines and objectives. Deliver the capital program for Storm Water Services that support and protect the community and the environment.
Permits and Inspections
• Administration of the development permit program that allows for private land improvement. The division oversees application/plan review and field inspections to ensure compliance with approved plans.
$0.3M
$0.2M
$ 0.0M
Development Services Page 28

2021 Program Key Initiatives
Accountable Government• Continue to implement Phase 3 of the Plan-it service improvements initiative which aims to improve our
services realted to property improvement projects. The 2021 Plan-it Program will focus on:• Intake process improvements and design (improved support for digitial application intake)• Inspection process improvements and redesign, including• online appointment booking• mobile technology (in the field service)
• Implementation of aspects of the Urban Forest Strategic Management Plan that apply to development proposals.
• Examine the opportunity to use licensing as an alternative to permitting for certain business services.• Examine finanical strategies (including that of a Stormwater Utility Model) available/suitable to financially
support the recommendations of the Storm Water Master Plan.• Develop new policies and procedures that compliment and protect new natural assets which serve to
enhance our natural areas and compliment our Biodiverstiy Strategy (e.g. Oakville's first Wildlife Pond in Bronte Green and the many wildlife habitat strucutures purposefully placed within/along our NHS areas.
Livability• Continue the implementation of the recommendations and captial projects identified in the Town's Storm
Water Master Plan which serve to protect the community and minimize the risk of urban flooding.• Delivery of the riverine and shoreline improvement projects that serve to protect land, persons and property. • Complete the vulnerable areas assessment of our key Lakefront public land areas; bringing forward options
and recommendations for mitigating the impacts should lake level predictions continue to remain above historical levels.
Environment• Develop new policies and procedures that compliment and protect new natural assets which serve to enhance
our natural areas and compliment our Biodiverstiy Strategy (e.g. Oakville's first Wildlife Pond in Bronte Green and the many wildlife habitat strucutures purposefully placed within/along our NHS areas.
Development Services Page 29

Key Performance Indicators 1. Percentage of gross operating budget
2016 2017 2018 2019 2020 1.6% 1.6% 1.6% 1.6% 1.5%
Why Important: Monitors the cost of the program as a proportion of the total cost for the town. How Calculated: Gross program operating costs (excluding transfers to reserves and internal charges) / Gross town operating costs (excluding transfers to reserves and internal charges).
2. Percentage of total FTEs 2016 2017 2018 2019 2020 1.8% 1.8% 1.8% 1.6% 1.6%
Why Important: Assesses the capacity of the program by examining the proportion of staff expertise against the total Town FTEs. How Calculated: Total program FTEs including part-time / Total town FTEs including part-time.
3. Cost recovery ratio 2016 2017 2018 2019 2020 81% 95% 90% 85% 87% (Sept 30, 2020)
Why Important: Monitors the programs alignment with the Town’s User Fee Policy and is measure that can be rationalized against expected and actual activity levels. How Calculated: Total Revenues generated from applications/Total expenses attributed to application processing.
4. Percentage of Scoped Site Plan applications processed within the prescribed timeframe (4 weeks) 2016 2017 2018 2019 2020 N/A N/A 71% 72% 53% (Sept 30, 2020)
Why Important: To ensure service delivery remains in line with service level expectations. The measure is important to ensure we are delivering upon our commitments to customers. * Service resourced at 75% for period between September 2019 and October 2020 due to vacancy and COVID impacts. How Calculated: Number of applications reviewed within the 28 day commitment over the total number of applications reviewed.
5. Percentage of permit applications processed within the prescribed timeframe (3 weeks) 2016 2017 2018 2019 2020 N/A 43% 67% 89% 85% (Sept 30, 2020)
Why Important: To ensure service delivery remains in line with service level expectations. The measure is important to ensure we are delivering upon our commitments to customers. How Calculated: Number of applications reviewed within the 21 day commitment over the total number of applications reviewed.
Development Services Page 30
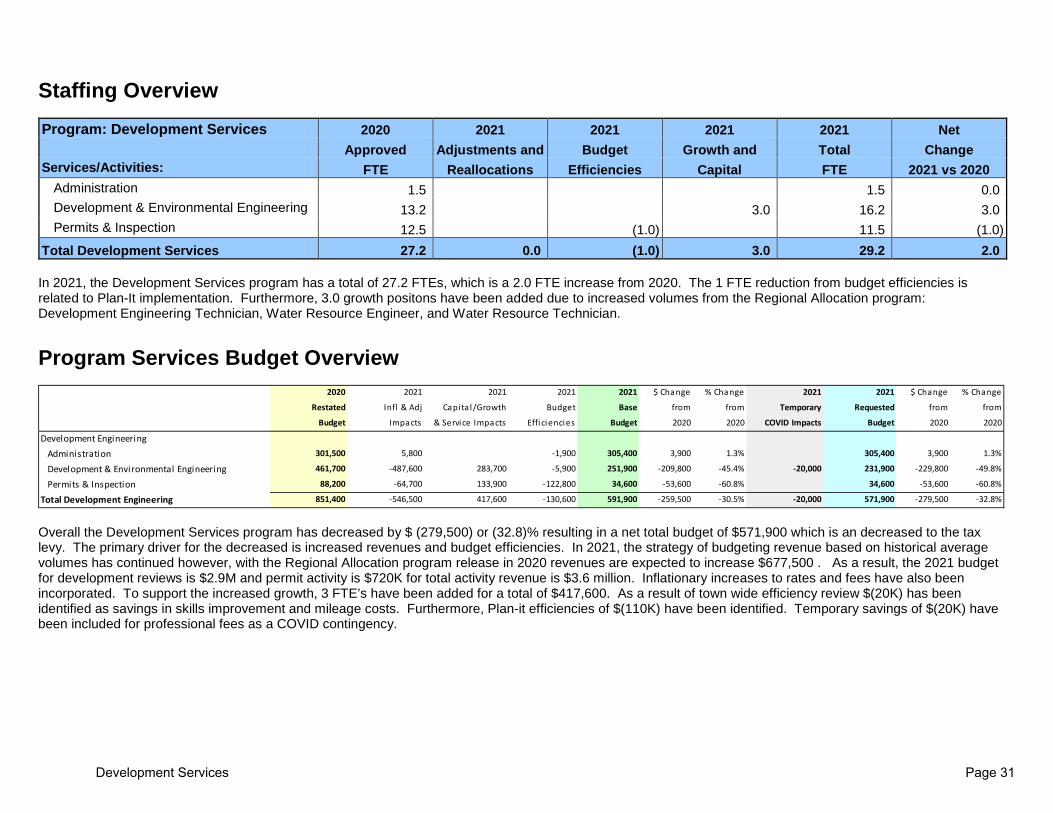
Staffing Overview Program: Development Services 2020 2021 2021 2021 2021 Net Approved Adjustments and Budget Growth and Total Change Services/Activities: FTE Reallocations Efficiencies Capital FTE 2021 vs 2020
Administration 1.5 1.5 0.0 Development & Environmental Engineering 13.2 3.0 16.2 3.0 Permits & Inspection 12.5 (1.0) 11.5 (1.0)
Total Development Services 27.2 0.0 (1.0) 3.0 29.2 2.0 In 2021, the Development Services program has a total of 27.2 FTEs, which is a 2.0 FTE increase from 2020. The 1 FTE reduction from budget efficiencies is related to Plan-It implementation. Furthermore, 3.0 growth positons have been added due to increased volumes from the Regional Allocation program: Development Engineering Technician, Water Resource Engineer, and Water Resource Technician.
Program Services Budget Overview
Overall the Development Services program has decreased by $ (279,500) or (32.8)% resulting in a net total budget of $571,900 which is an decreased to the tax levy. The primary driver for the decreased is increased revenues and budget efficiencies. In 2021, the strategy of budgeting revenue based on historical average volumes has continued however, with the Regional Allocation program release in 2020 revenues are expected to increase $677,500 . As a result, the 2021 budget for development reviews is $2.9M and permit activity is $720K for total activity revenue is $3.6 million. Inflationary increases to rates and fees have also been incorporated. To support the increased growth, 3 FTE’s have been added for a total of $417,600. As a result of town wide efficiency review $(20K) has been identified as savings in skills improvement and mileage costs. Furthermore, Plan-it efficiencies of $(110K) have been identified. Temporary savings of $(20K) have been included for professional fees as a COVID contingency.
2020 2021 2021 2021 2021 $ Change % Change 2021 2021 $ Change % Change
Restated Infl & Adj Capita l/Growth Budget Base from from Temporary Requested from from
Budget Impacts & Service Impacts Efficiencies Budget 2020 2020 COVID Impacts Budget 2020 2020
Development EngineeringAdministration 301,500 5,800 -1,900 305,400 3,900 1.3% 305,400 3,900 1.3%
Development & Environmental Engineering 461,700 -487,600 283,700 -5,900 251,900 -209,800 -45.4% -20,000 231,900 -229,800 -49.8%
Permits & Inspection 88,200 -64,700 133,900 -122,800 34,600 -53,600 -60.8% 34,600 -53,600 -60.8%
Total Development Engineering 851,400 -546,500 417,600 -130,600 591,900 -259,500 -30.5% -20,000 571,900 -279,500 -32.8%
Development Services Page 31

Net Program Budget Change • Administration has increased by $3,900 primarily due
inflationary adjustments for wages and benefits partially reduced with skills improvement savings.
• Development Engineering has decreased by $ (229,800) mainly due to an increase in subdivision agreement and supervision fees which is partially reduced by lower site plan fees resulting from reduced volumes. Additionally $37,500 was added for a new Plot Plan fee to commence in 2021. Rate increases of 1.7% for fees have been incorporated. $5,900 in budget efficiencies from a permanent reduction in mileage costs and $20,000 temporary reduction in professional fees are included. These were offset by inflationary and contractual increases for personnel. As well, 3 FTE’s were added to assist in increased volumes from growth as a result of the Regional Allocation program.
• Permits & Inspections has decreased by $ (53,600) primarily due to efficiencies from Plan-It implementation, skills improvement and mileage savings. For 2021 permitted activity decreased $(95K) however, supervision fees increased $280K with an overall net revenue increase of $160K.
Development Services Page 32

2021 Program Budget by Component– Net $571,900
In 2021, the Development Services program’s total expenditures are $5,186,800 and total revenues are $4,614,900 resulting in a net budget of $571,900. The net change from prior year is $ (279,500) or (32.8)%. The main drivers for the change are the following:
• Personnel Services & Benefits is the largest cost component of the budget at $3.5 million representing 67% of the total gross expenditures. In 2021 personnel costs have increased by $335,100. Inflationary increases and contractual obligations for wages have been incorporated. As a result of the Regional Allocation program 3 new FTE’s were added for 2021 which was partially mitigated with efficiencies from Plan-It implementation.
• Internal Charges is the second largest portion of the gross expenditures with $1.4 million or 27% and represent time other departments spend on the Development Engineering application process that can be recovered through fees. In 2021, internal charges have increased by $214,200 due to increases in the other departments time spent on development applications which are fee recoverable.
• Purchases Services has decreased by $(40,800) mainly driven by permanent budget efficiencies of $20,100 in mileage and skills improvement and $20,000 temporary savings in professional fees.
Development Services Page 33

• Activity Revenue is 79% of the total revenue for the Development Engineering program and represents fees recovered for various services provided. In 2021, activity revenue has increased by $677,500 primarily due to increased volumes resulting from the Regional Allocation program as well as inflationary increases for services fees. While inflationary increases were included for permit fees, average volumes have declined resulting in a $(94,700) reduction. Finally, a new Plot Plan fee to be introduced in 2021 adds $37,500 in new revenue.
• Internal Recoveries have increased by $105,500 to reflect inflationary increases to Development Engineering time spent on Planning Services activities.
Development Services Page 34
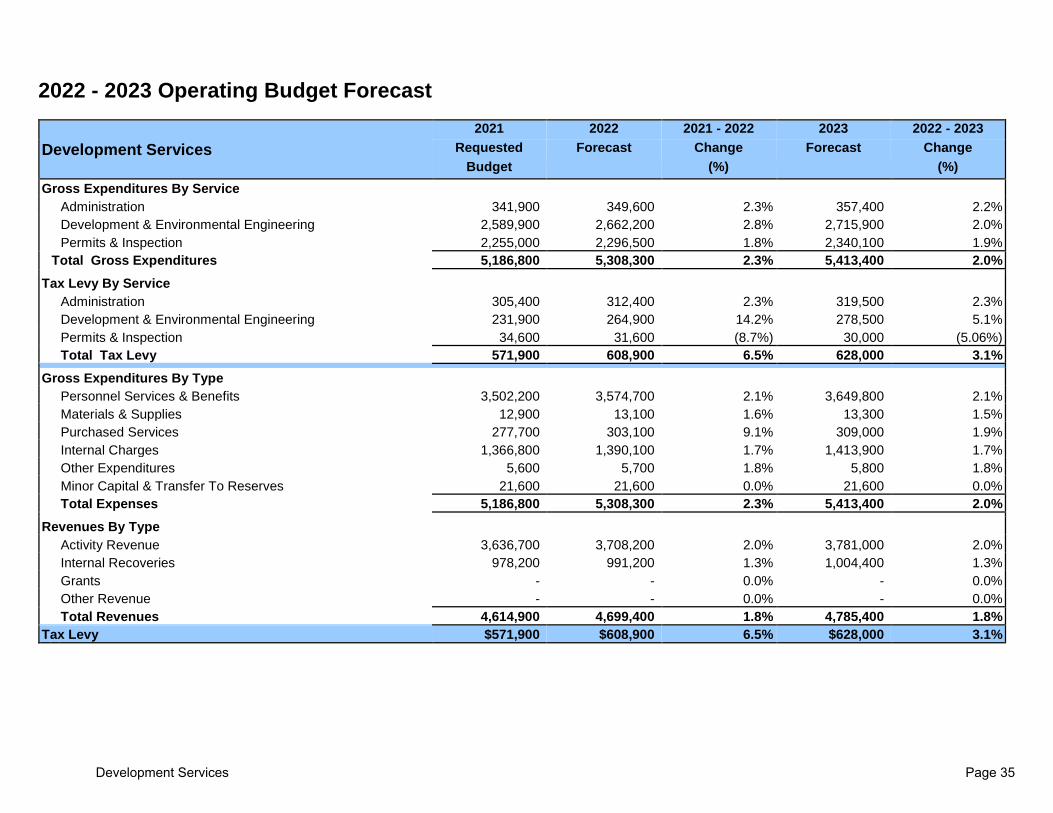
2022 - 2023 Operating Budget Forecast
Development Services 2021 2022 2021 - 2022 2023 2022 - 2023
Requested Forecast Change Forecast Change Budget (%) (%)
Gross Expenditures By Service Administration 341,900 349,600 2.3% 357,400 2.2% Development & Environmental Engineering 2,589,900 2,662,200 2.8% 2,715,900 2.0% Permits & Inspection 2,255,000 2,296,500 1.8% 2,340,100 1.9% Total Gross Expenditures 5,186,800 5,308,300 2.3% 5,413,400 2.0% Tax Levy By Service Administration 305,400 312,400 2.3% 319,500 2.3% Development & Environmental Engineering 231,900 264,900 14.2% 278,500 5.1% Permits & Inspection 34,600 31,600 (8.7%) 30,000 (5.06%) Total Tax Levy 571,900 608,900 6.5% 628,000 3.1% Gross Expenditures By Type Personnel Services & Benefits 3,502,200 3,574,700 2.1% 3,649,800 2.1% Materials & Supplies 12,900 13,100 1.6% 13,300 1.5% Purchased Services 277,700 303,100 9.1% 309,000 1.9% Internal Charges 1,366,800 1,390,100 1.7% 1,413,900 1.7% Other Expenditures 5,600 5,700 1.8% 5,800 1.8% Minor Capital & Transfer To Reserves 21,600 21,600 0.0% 21,600 0.0% Total Expenses 5,186,800 5,308,300 2.3% 5,413,400 2.0% Revenues By Type Activity Revenue 3,636,700 3,708,200 2.0% 3,781,000 2.0% Internal Recoveries 978,200 991,200 1.3% 1,004,400 1.3% Grants - - 0.0% - 0.0% Other Revenue - - 0.0% - 0.0% Total Revenues 4,614,900 4,699,400 1.8% 4,785,400 1.8% Tax Levy $571,900 $608,900 6.5% $628,000 3.1%
Development Services Page 35
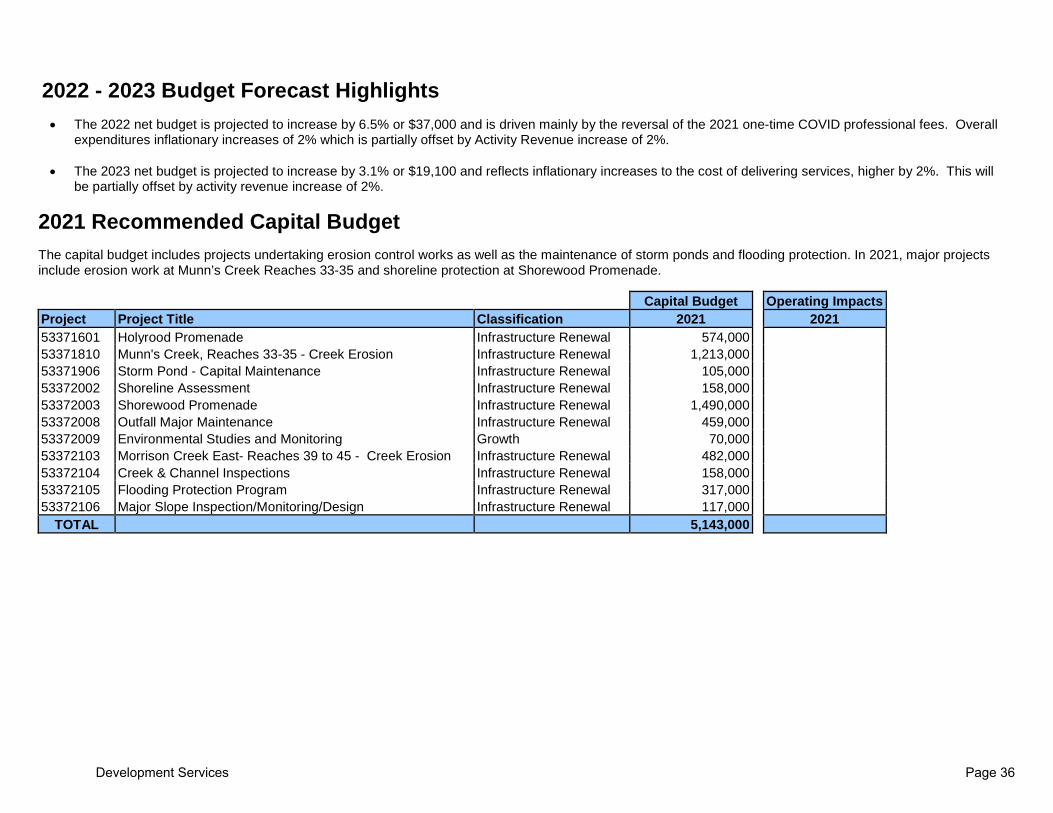
2022 - 2023 Budget Forecast Highlights • The 2022 net budget is projected to increase by 6.5% or $37,000 and is driven mainly by the reversal of the 2021 one-time COVID professional fees. Overall
expenditures inflationary increases of 2% which is partially offset by Activity Revenue increase of 2%. • The 2023 net budget is projected to increase by 3.1% or $19,100 and reflects inflationary increases to the cost of delivering services, higher by 2%. This will
be partially offset by activity revenue increase of 2%.
2021 Recommended Capital Budget
The capital budget includes projects undertaking erosion control works as well as the maintenance of storm ponds and flooding protection. In 2021, major projects include erosion work at Munn’s Creek Reaches 33-35 and shoreline protection at Shorewood Promenade.
Capital Budget Operating Impacts Project Project Title Classification 2021 2021 53371601 Holyrood Promenade Infrastructure Renewal 574,000 53371810 Munn's Creek, Reaches 33-35 - Creek Erosion Infrastructure Renewal 1,213,000 53371906 Storm Pond - Capital Maintenance Infrastructure Renewal 105,000 53372002 Shoreline Assessment Infrastructure Renewal 158,000 53372003 Shorewood Promenade Infrastructure Renewal 1,490,000 53372008 Outfall Major Maintenance Infrastructure Renewal 459,000 53372009 Environmental Studies and Monitoring Growth 70,000 53372103 Morrison Creek East- Reaches 39 to 45 - Creek Erosion Infrastructure Renewal 482,000 53372104 Creek & Channel Inspections Infrastructure Renewal 158,000 53372105 Flooding Protection Program Infrastructure Renewal 317,000 53372106 Major Slope Inspection/Monitoring/Design Infrastructure Renewal 117,000
TOTAL 5,143,000
Development Services Page 36

test
Program: Economic Development
Program Based Budget
2021 - 2023
Vision
• Oakville is the community where companies want to be.
Mission
• To support the growth of existing businesses and attract new ones so that Oakville’s business environment is strong, diversified and prosperous.
Page 37
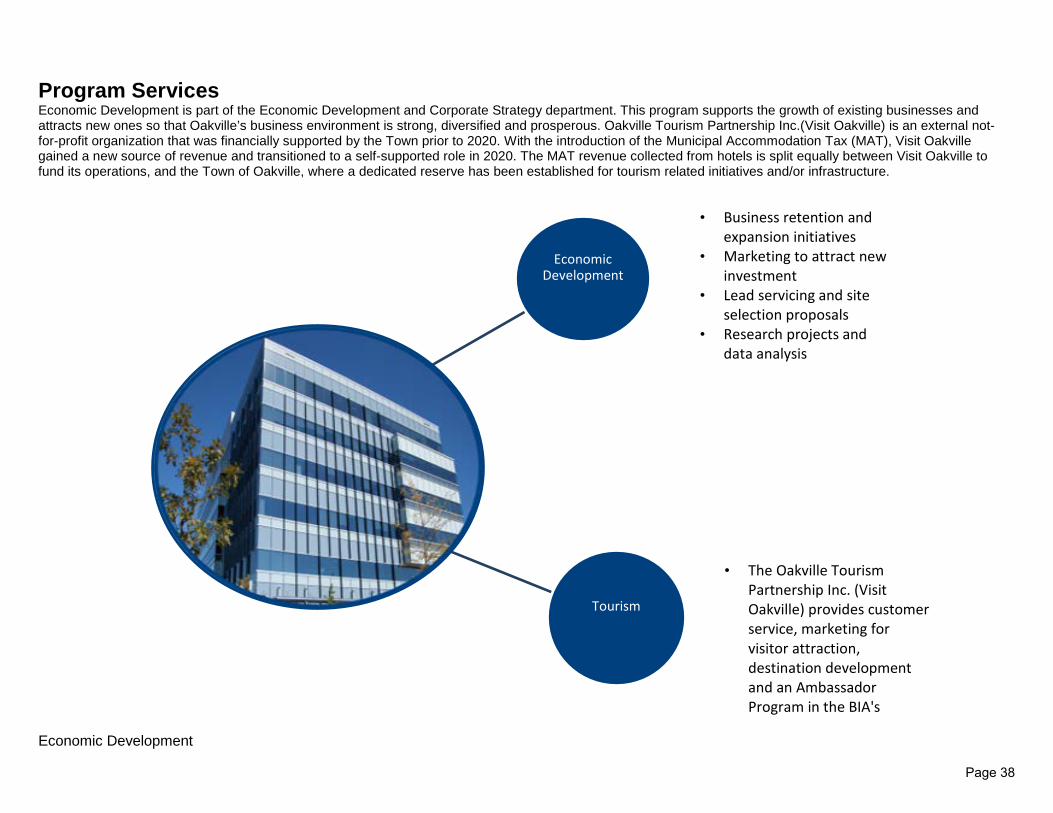
test
Economic Development
Program Services Economic Development is part of the Economic Development and Corporate Strategy department. This program supports the growth of existing businesses and attracts new ones so that Oakville’s business environment is strong, diversified and prosperous. Oakville Tourism Partnership Inc.(Visit Oakville) is an external not-for-profit organization that was financially supported by the Town prior to 2020. With the introduction of the Municipal Accommodation Tax (MAT), Visit Oakville gained a new source of revenue and transitioned to a self-supported role in 2020. The MAT revenue collected from hotels is split equally between Visit Oakville to fund its operations, and the Town of Oakville, where a dedicated reserve has been established for tourism related initiatives and/or infrastructure.
$0.0M
$0.8M
Economic Development
Tourism
• Business retention and expansion initiatives
• Marketing to attract new investment
• Lead servicing and site selection proposals
• Research projects and data analysis
• The Oakville Tourism Partnership Inc. (Visit Oakville) provides customer service, marketing for visitor attraction, destination development and an Ambassador Program in the BIA's
Page 38

test
Economic Development
2021 Program Key Initiatives
Key Performance Indicators 1. Percentage of gross operating budget
2016 2017 2018 2019 2020 0.3% 0.4% 0.3% 0.6% 0.5%
Why Important: Monitors the cost of the program as a proportion of the total cost for the town. How Calculated: Gross program operating costs (excluding transfers to reserves and internal charges) / Gross town operating costs (excluding transfers to reserves and internal charges).
2. Percentage of total FTEs
2016 2017 2018 2019 2020 0.3% 0.3% 0.3% 0.2% 0.2%
Why Important: Assesses the capacity of the program by examining the proportion of staff expertise against the total Town FTE’s. How Calculated: Total program FTEs including part-time / Total town FTEs including part-time.
3. Industrial occupancy rate
2016 2017 2018 2019 2020 97.2% Q4 97.4% Q4 99.0% Q4 96.6% 97.1% (Sept 30, 2020)
Why Important: Provides information about industrial activity and the availability of existing space for new investment. How Calculated: Source: CBRE Limited Industrial Market reports which provide vacancy rates.
Livability• Implement the 5-year Economic Development Strategy approved by Council in 2019 including lead servicing,
corporate calling, marketing, research, auto mayors' initiatives, and liaison for commercial filming.• Develop and implement initiatives to assist businesses with economic recovery from the COVID-19 pandemic
including the Digital Main Street Program.
Page 39

test
Economic Development
4. Office occupancy rate
2016 2017 2018 2019 2020
74.4% Q4 77.8% Q4 80.8% Q4 83.5% 83.0% (Sept 30, 2020) Why Important: Provides information about commercial activity and the availability of existing space for new investment. How Calculated: Source: CBRE Limited Oakville Office Market reports which provide office vacancy rates (direct and sublet). 5. Square feet of industrial development
2016 2017 2018 2019 2020 66,002 263,322 80,619 346,127 135,787 (Sept 30, 2020)
Why Important: Measure of the industrial development activity in Oakville for economic development analysis and review of initiatives. How Calculated: Town of Oakville Building Permit data – new construction and additions (excludes alterations). 6. Square feet of commercial development
2016 2017 2018 2019 2020 676,366 303,961 484,340 210,361
397,407 (Sept 30, 2020)
Why Important: Measure of the commercial development activity in Oakville for economic development analysis and review of initiatives. How Calculated: Town of Oakville Building Permit data – new construction and additions (excludes alterations). 7. Number of businesses per 100,000 population (ISO37120 Supporting Indicator 5.6)
2016 2017 2018 2019 2020 4,349 4,332 4,255 4,236 4,176 (June 2020)
Why Important: (ISO 37120 supporting indicator of economic health) – licensed businesses How Calculated: Source: Canadian Business Patterns, Statistics Canada, Data on statistical establishments as at December 2018 and June 2019 respectively. Oakville’s population increased in 2020 while the number of business establishments with one or more employee remained the same since December 2019. Statistics Canada has advised that June 2020 business establishments cannot be used to measure the impact of the COVID-19 pandemic. These figures continue to include most businesses that closed in the months since the crisis began. Those that close permanently will eventually cease to be included, once business wind-down and closeout procedures are completed and confirmed, which can take several months.
Page 40
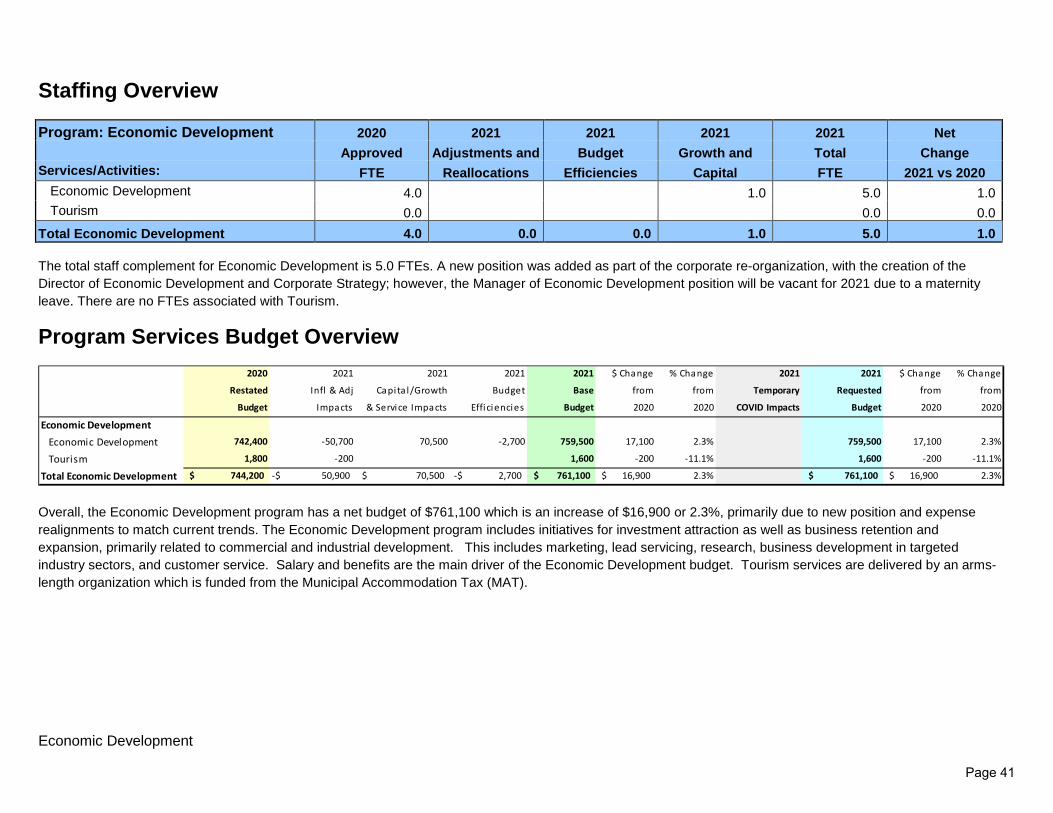
test
Economic Development
Staffing Overview
Program: Economic Development 2020 2021 2021 2021 2021 Net Approved Adjustments and Budget Growth and Total Change Services/Activities: FTE Reallocations Efficiencies Capital FTE 2021 vs 2020
Economic Development 4.0 1.0 5.0 1.0 Tourism 0.0 0.0 0.0
Total Economic Development 4.0 0.0 0.0 1.0 5.0 1.0 The total staff complement for Economic Development is 5.0 FTEs. A new position was added as part of the corporate re-organization, with the creation of the Director of Economic Development and Corporate Strategy; however, the Manager of Economic Development position will be vacant for 2021 due to a maternity leave. There are no FTEs associated with Tourism.
Program Services Budget Overview
Overall, the Economic Development program has a net budget of $761,100 which is an increase of $16,900 or 2.3%, primarily due to new position and expense realignments to match current trends. The Economic Development program includes initiatives for investment attraction as well as business retention and expansion, primarily related to commercial and industrial development. This includes marketing, lead servicing, research, business development in targeted industry sectors, and customer service. Salary and benefits are the main driver of the Economic Development budget. Tourism services are delivered by an arms-length organization which is funded from the Municipal Accommodation Tax (MAT).
2020 2021 2021 2021 2021 $ Change % Change 2021 2021 $ Change % Change
Restated Infl & Adj Capita l/Growth Budget Base from from Temporary Requested from from
Budget Impacts & Service Impacts Efficiencies Budget 2020 2020 COVID Impacts Budget 2020 2020
Economic DevelopmentEconomic Development 742,400 -50,700 70,500 -2,700 759,500 17,100 2.3% 759,500 17,100 2.3%
Tourism 1,800 -200 1,600 -200 -11.1% 1,600 -200 -11.1%
Total Economic Development 744,200$ 50,900-$ 70,500$ 2,700-$ 761,100$ 16,900$ 2.3% 761,100$ 16,900$ 2.3%
Page 41

test
Economic Development
Net Program Budget Change
• Economic Development has increased by $17,100, primarily due to the addition of the new Director position through the corporate reorganization. The Manager of Economic Development position was created through a mid-year conversion and $158,600 of gapping is being included for 2021 due to the incumbent’s maternity leave.
• Tourism has decreased by $(200) in official promotion. Tourism also includes the Municipal Accommodation Tax (MAT). This is split evenly with Visit Oakville, which allows them to become self-supporting. The 2021 temporary COVID reduction of $500,000 relates to lower tourism expected and decreased collection of MAT revenues. This has a net zero impact on the tax levy.
Page 42

test
Economic Development
2021 Program Budget by Component –Net $761,100
In 2021, the Economic Development program’s total expenditures are $1,261,100, and $1 million in revenues for Tourism, resulting in a net budget of $761,100. The net change from the prior year is $16,900 or 2.3%. The main drivers are the following:
• Personnel Services and Benefits make up 49% of the total expenditures and is the main driver of the budget. Personnel costs have increased by $14,500 and include contractual and inflationary increases for personnel. As well, the creation of the new Director position added budget dollars but is partially offset by gapping budgeted in 2021 for the Manager of Economic Development due to the incumbent’s maternity leave.
• Purchased Services make up 8% of total expenditures and mainly consist of consultant fees and promotion expenses to provide economic development services to the town. Purchased Services have decreased by $(2,400) due to corporate reductions in mileage and skills improvement.
• Other Expenditures make up 21% of total expenditures, which includes the Municipal Accommodation Tax flow-through for tourism. • Minor Capital & Transfer to Reserves make up 19% of total expenditures and includes distribution of MAT revenue, 50% to Visit Oakville and 50% to
reserves. • Internal Charges make up 2% of expenditures which represents a flow through to Financial Services for administration of the MAT program. • Revenues consist of the Municipal Accommodation Tax. Lower tourism expectations in 2021 has decreased MAT revenue collections.
Page 43

test
Economic Development
2022 - 2023 Operating Budget Forecast
Economic Development 2021 2022 2021 - 2022 2023 2022 - 2023
Requested Forecast Change Forecast Change Budget (%) (%)
Gross Expenditures By service Economic Development 759,500 756,300 -0.4% 770,600 1.9% Tourism 501,600 1,006,400 100.6% 1,016,000 1.0% Total Gross Expenditures 1,261,100 1,762,700 39.8% 1,786,600 1.4% Tax Levy By Service Economic Development 759,500 756,300 -0.4% 770,600 1.9% Tourism 1,600 6,400 300.0% 16,000 150.0% Total Tax Levy 761,100 762,700 0.2% 786,600 3.1% Gross Expenditures By Type Personnel Services & Benefits 614,300 608,500 (0.9%) 620,200 1.9% Materials & Supplies 7,200 7,300 1.4% 7,400 1.4% Purchased Services 104,700 106,600 1.8% 108,500 1.8% Internal Charges 25,000 50,000 100.0% 50,000 0.0% Other Expenditures 267,500 510,400 90.8% 520,600 2.0% Minor Capital & Transfer To Reserves 242,400 479,900 98.0% 479,900 0.0% Total Expenses 1,261,100 1,762,700 39.8% 1,786,600 1.4% Revenues By Type Activity Revenue - - 0.0% - 0.0% Internal Recoveries - - 0.0% - 0.0% Grants - - 0.0% - 0.0% Other Revenue 500,000 1,000,000 (100.0%) 1,000,000 0.0% Total Revenues 500,000 1,000,000 (100.0%) 1,000,000 0.0% Tax Levy $761,100 $762,700 0.2% $786,600 3.1%
2022 - 2023 Budget Forecast Highlights • The 2022 net budget is projected to increase by 0.2% or $ 1,600 and reflects inflationary increases to the cost of delivering services. • The 2023 net budget is projected to increase by 3.1% or $ 23,900 and reflects inflationary increases to the cost of delivering services.
Page 44

Program: Emergency Services
Program Based Budget
2021 - 2023
Vision
• To minimize or eliminate injuries, loss of life and property from natural, technological or human caused events.
Mission
• To protect people, property and the enviroment from emergency incidents through education, enforcement and reliable emergency response by highly trained profesionals.
Page 45

Emergency Services
Program Services The Oakville Fire Department provides services through the following programs:
Administration & Emergency
Planning
• Oversight, Leadership and Management
• Financial control• Preparedness
Response and Recovery from large scale emergencies
Suppression • Emergency response services
Training and Fire
Prevention
• Training programs to enhance fire fighter compentencies
• Inspection, Code Enforcement and Public Education programs
Communications• Dispatch and
Communication services
TOWARF• Provide marine
patrol along Oakville's waterfront
$1.5M
$35.1M
$2.8M
$1.1M $0M
$35.1M
$1.5M
Page 46

Emergency Services
2021 Program Key Initiatives
Livability• Continuous improvements for service & initiatives to respond and support legislative and industry standards
requirements
Engaged Community• Explore opportunites for engagment with the community and internal corporate partners for Fire Prevention
and Public Education enhancements
Accountable Government• Complete new Master Fire Plan
Page 47

Emergency Services
Key Performance Indicators
1. Percentage of gross operating budget
2016 2017 2018 2019 2020 15.2% 15.2% 15.2% 14.9% 15.5%
Why Important: Monitors the cost of the program as a proportion of the total cost for the town. How Calculated: Gross program operating costs (excluding transfers to reserves and internal charges) / Gross town operating costs (excluding transfers to reserves and internal charges)
2. Percentage of total FTEs
2016 2017 2018 2019 2020 14.2% 14.1% 13.9% 13.8% 14.9%
Why Important: Assesses the capacity of the program by examining the proportion of staff expertise against the total Town FTEs. How Calculated: Total program FTEs including part-time / Total town FTEs including part-time
3. Percentage of responses crew travel time is 240 seconds or less
2016 2017 2018 2019 2020 65% 62% 60.49% 60.35% 60.78% (Sept. 30, 2020)
Why Important: The average time fire crews leave the station until they arrive on location. How Calculated: Information is provided through the Computer Aided Dispatch system from Burlington Dispatch
4. Number of fire related injuries per 100,000 population
2016 2017 2018 2019 2020 1.58 3.3 5.2 3.3 1.87 (Sept. 30, 2020)
Why Important: Reflects characteristics such as density, code enforcement, smoke detector use, fire prevention and education. How Calculated: Total number of injuries x 100,000 / official population
5. Number of firefighters per 100,000 population (ISO 37120 core indicator 10.1)
2016 2017 2018 2019 2020 107 105 101 97 105
Why Important: National Fire Protection Association (NFPA) states median staffing rate in Canada is roughly 100 firefighters per 100,000 population. How Calculated: Total number of firefighters x 100,000 / official population
Page 48
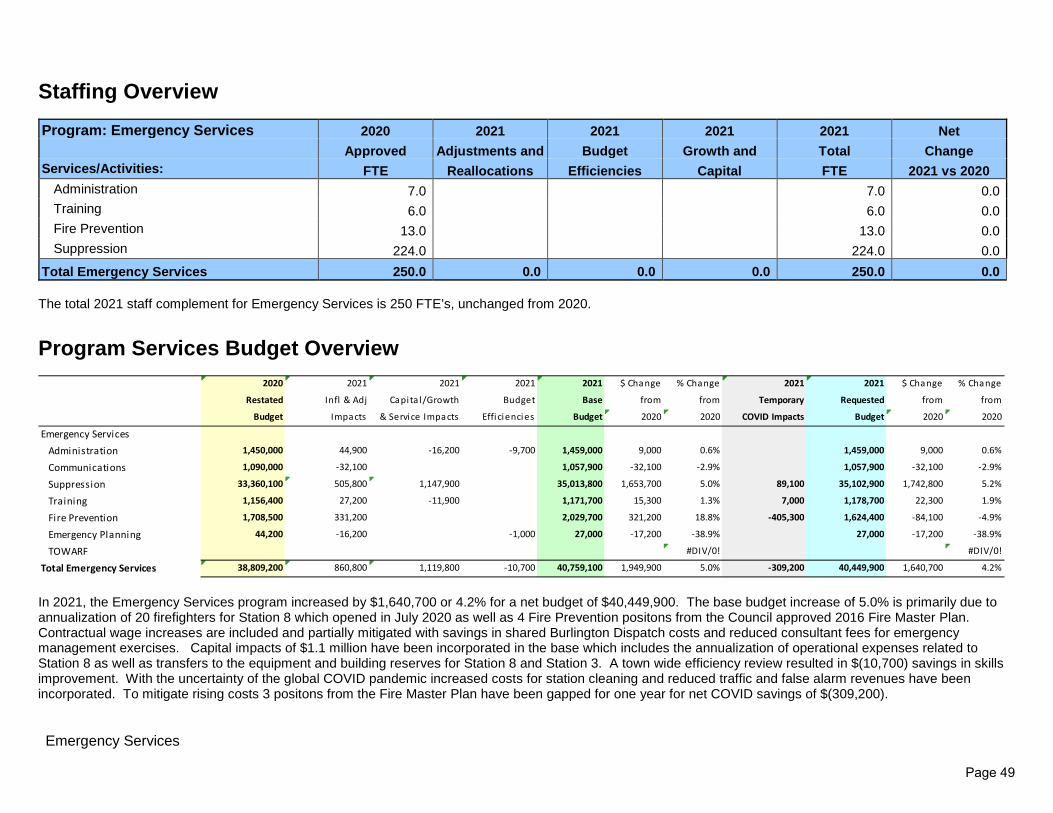
Emergency Services
Staffing Overview Program: Emergency Services 2020 2021 2021 2021 2021 Net Approved Adjustments and Budget Growth and Total Change Services/Activities: FTE Reallocations Efficiencies Capital FTE 2021 vs 2020
Administration 7.0 7.0 0.0 Training 6.0 6.0 0.0 Fire Prevention 13.0 13.0 0.0 Suppression 224.0 224.0 0.0
Total Emergency Services 250.0 0.0 0.0 0.0 250.0 0.0 The total 2021 staff complement for Emergency Services is 250 FTE’s, unchanged from 2020.
Program Services Budget Overview
In 2021, the Emergency Services program increased by $1,640,700 or 4.2% for a net budget of $40,449,900. The base budget increase of 5.0% is primarily due to annualization of 20 firefighters for Station 8 which opened in July 2020 as well as 4 Fire Prevention positons from the Council approved 2016 Fire Master Plan. Contractual wage increases are included and partially mitigated with savings in shared Burlington Dispatch costs and reduced consultant fees for emergency management exercises. Capital impacts of $1.1 million have been incorporated in the base which includes the annualization of operational expenses related to Station 8 as well as transfers to the equipment and building reserves for Station 8 and Station 3. A town wide efficiency review resulted in $(10,700) savings in skills improvement. With the uncertainty of the global COVID pandemic increased costs for station cleaning and reduced traffic and false alarm revenues have been incorporated. To mitigate rising costs 3 positons from the Fire Master Plan have been gapped for one year for net COVID savings of $(309,200).
2020 2021 2021 2021 2021 $ Change % Change 2021 2021 $ Change % Change
Restated Infl & Adj Capita l/Growth Budget Base from from Temporary Requested from from
Budget Impacts & Service Impacts Efficiencies Budget 2020 2020 COVID Impacts Budget 2020 2020
Emergency ServicesAdministration 1,450,000 44,900 -16,200 -9,700 1,459,000 9,000 0.6% 1,459,000 9,000 0.6%
Communications 1,090,000 -32,100 1,057,900 -32,100 -2.9% 1,057,900 -32,100 -2.9%
Suppression 33,360,100 505,800 1,147,900 35,013,800 1,653,700 5.0% 89,100 35,102,900 1,742,800 5.2%
Training 1,156,400 27,200 -11,900 1,171,700 15,300 1.3% 7,000 1,178,700 22,300 1.9%
Fire Prevention 1,708,500 331,200 2,029,700 321,200 18.8% -405,300 1,624,400 -84,100 -4.9%
Emergency Planning 44,200 -16,200 -1,000 27,000 -17,200 -38.9% 27,000 -17,200 -38.9%
TOWARF #DIV/0! #DIV/0!
Total Emergency Services 38,809,200 860,800 1,119,800 -10,700 40,759,100 1,949,900 5.0% -309,200 40,449,900 1,640,700 4.2%
Page 49

Emergency Services
Emergency Services provides services to educate the public with regards to fire related risks, prevents fires, enforces fire safety standards, suppresses fires and prepares and manages all emergencies throughout the town. Fire Suppression is the largest component of the budget at $35.1 million representing 87% of the total net budget which is comprised primarily of personnel costs to deliver emergency response services. Training and Fire Prevention total $2.8 million to create monthly training syllabuses; deliver programs based on legislated requirements and deliver Fire Protection and Prevention Act mandated programs. Administration, Emergency Planning and Communications makes up the balance with $2.5 million to ensure quality services are provided in accordance with standard operating guidelines and ensure adequate level of municipal preparedness for large scale emergencies.
Net Program Budget Change • Administration and Emergency Planning has decreased $(8,200)
which includes inflationary adjustments for wages and benefits. Capital impacts for Fire Station 8 have been included for partial year impacts of insurance. Mitigating the increase in expenses, one time professional fees and computer hardware have been reversed from 2020. Additionally consultant fees have been reduced 50% to fund one emergency management exercise in 2021.
• Training and Fire Prevention has decreased $(61,800) and includes inflationary and contractual agreements for salaries and benefits. Expenditure increases are fully mitigated by reversal of one time capital impacts for training of Station 8 staff. Finally, one Fire Prevention Officer, one Public Education Officer and one Administrative position have been gapped for one year as part of budget mitigation strategies.
• Suppression has increased $1,742,800 primarily due to annualized salaries for 20 new Firefighters FTEs hired for the July 2020 opening of Station 8. In addition partial year capital impacts for Station 8 utilities and specialized supplies have been incorporated. Also included is a transfer to building reserves for Station 3 & 8 and fire equipment reserve for Station 8 vehicles. Increases to salaries and benefits have been included as a result of OPFFA negotiated contract. Increase to health benefits have been included due to significant rate increases. One time COVID impacts of $89,100 have been added which includes increased station cleaning costs and decreased revenue for traffic and inspection revenue streams.
• Communications has decreased $(32,100) mainly as a result of lowered shared cost for the Burlington Dispatch system.
Page 50

Emergency Services
2021 Program Budget by Component – Net $40,449,900
The Emergency Services program’s total gross expenditures are $40,992,900 and total revenues are $ 543,000, resulting in a net budget of $40,449,900. In 2021, the net budget has increased by $1,640,700 or 4.2%. The main drivers for the budget are noted in the details below: • Personnel Services and Benefits are the largest cost component at $36.3 million and represent 89% of the total gross expenditures. In 2021, personnel
costs have increased by $1,507,500, primarily due to annualization of additional personnel for the July 2020 opening of Station 8. In addition contractual increases to salaries and recognition pay have been included. Significant rate increases to long term health premiums has cause a larger than normal benefit increase. Adjustments have been made where retirements have been replaced with new hires. As part of a corporate wide COVID mitigation strategy 3 positions identified in the Fire Master Plan have been gapped during 2021 for a total savings of $(412,300).
• Purchased Services total $1.8 million and in 2021, have decreased by $44,300 primarily due reduced consultant fees required for Emergency Management exercises, reversal of one-time capital impact of professional fees for Station 8 recruitment psychological testing and reduction of costs for the shared Burlington Dispatch system. Included for 2021 is a one-time cost for janitorial services to provide a deep clean of fire stations as a COVID avoidance strategy.
Page 51

Emergency Services
• Minor Capital & Transfers to Reserves total $1.7 million and include transfers to the Fire Vehicle and Equipment reserve for future replacements as assets reach the end of their useful life. In 2021, the budgeted transfer was increased by $162,300 due to a $93,200 transfer to the Building Maintenance reserve fund for Station 8 and Station 3, which will be phased in over the next several years. In addition a transfer to equipment reserves of $48,000 was added for vehicles purchased for Station 8. Finally $20,000 one-time desk and computer charges was reversed for new Fire Prevention personnel gapped in 2021.
• Materials & Supplies have decreased by $700 primarily due to one-time reduction in special event supplies as Fire Prevention week will be virtual should COVID restrictions remain. In addition the reversal of one time training and supply costs for the opening of station 8 have been included. Capital impacts for Station 8 which includes specialty supplies, utilities and diesel fuel which have been incorporated.
• Internal Charges have decreased by $13,100 to reflect labour costs historical averages. • Activity Revenue makes up 94% of total revenues which have decreased $(77,100). Included was a modest increase to reflect recent trends stemming from
new billing methods introduced for in-town vehicle accidents and Ministry of Transportation billings. However, one time temporary reduction of $(107,000) was included for reduced traffic and inspection revenue streams should COVID continue throughout 2021.
Page 52

Emergency Services
2022 - 2023 Operating Budget Forecast
Page 53

Emergency Services
2022 - 2023 Budget Forecast Highlights
• The 2022 net budget is projected to increase by 4.2% or $ 1,688,800 and reflects inflationary increases to the cost of delivering services. Funding is returned for the 3 Fire Prevention positons gapped in 2021 as well as reversal of COVID impacts to revenues and operational expenses. Furthermore, continued phase in of the transfer to the Building Maintenance reserve has been incorporated for Station 3 as well as Station 8 and phase in of vehicle reserves for Fire Prevention vehicles.
• The 2023 net budget is projected to increase by 3.0% or $ 1,275,600 and reflects inflationary increases to the cost of delivering services. This also includes operating impacts for the continued phase in of the Station 3 and Station 8 transfer to Building Maintenance Reserves.
2021 Recommended Capital Budget
The 2021 capital budget for Emergency Services will provide funds to ensure that the Fire station infrastructure, vehicles and equipment are maintained to a state of good repair. Highlights of the 2021 capital budget include the purchase of SCBA equipment $1.26M and a rescue truck $1.03M which have both reached the end of their useful life. Additionally an update to the 2011 Fire Master Plan will be conducted.
Capital Budget Operating Impacts Project Project Title Classification 2021 2021 43302101 SCBA Equipment Testing and Replacement Infrastructure Renewal 1,257,000 43302011 Specialized Equipment Replacement Infrastructure Renewal 151,000 43302007 Furniture and Equipment Replacement Infrastructure Renewal 42,000 43302105 Specialized Equipment - New Infrastructure Renewal 25,000 43302102 Fire Vehicle and Equipment Replacement Infrastructure Renewal 1,028,600 43302006 Protective Clothing Replacement Infrastructure Renewal 151,000 43302104 Fire Station Facility Maintenance Infrastructure Renewal 92,500 43302106 Fire Training Facility Infrastructure Renewal 76,000 43302103 Fire Master Plan Growth 100,000
TOTAL 2,923,100
Page 54

Emergency Services
Page 55
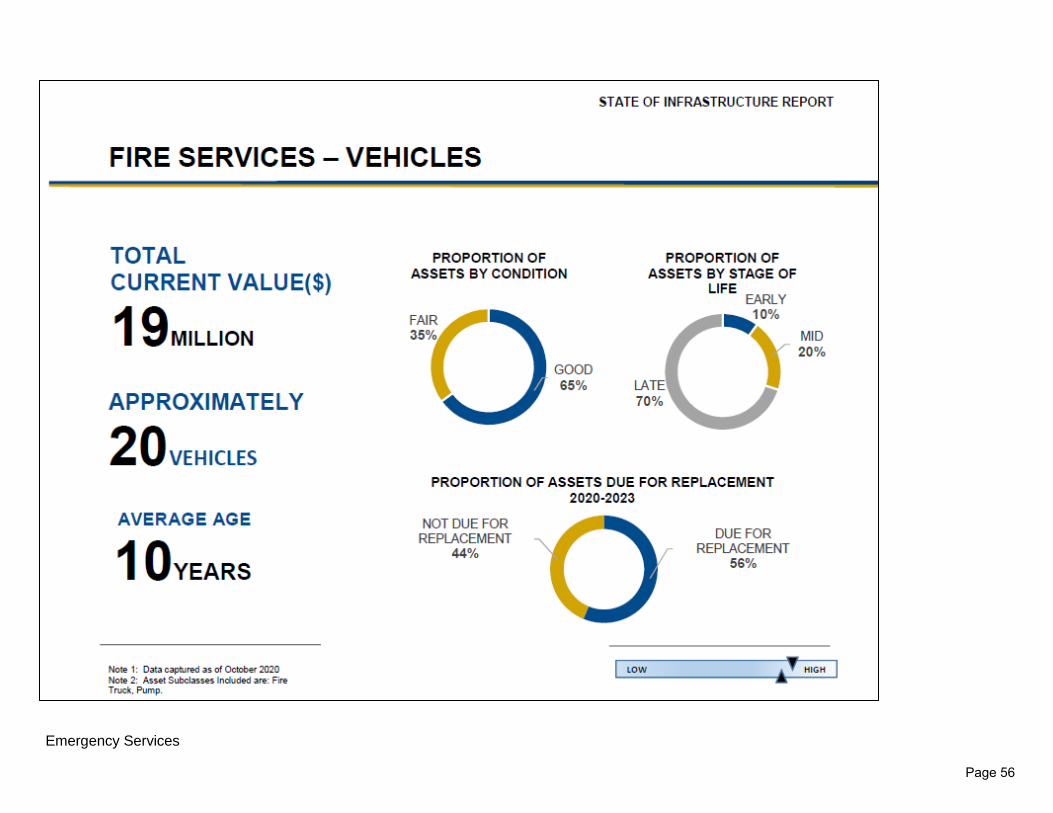
Emergency Services
Page 56
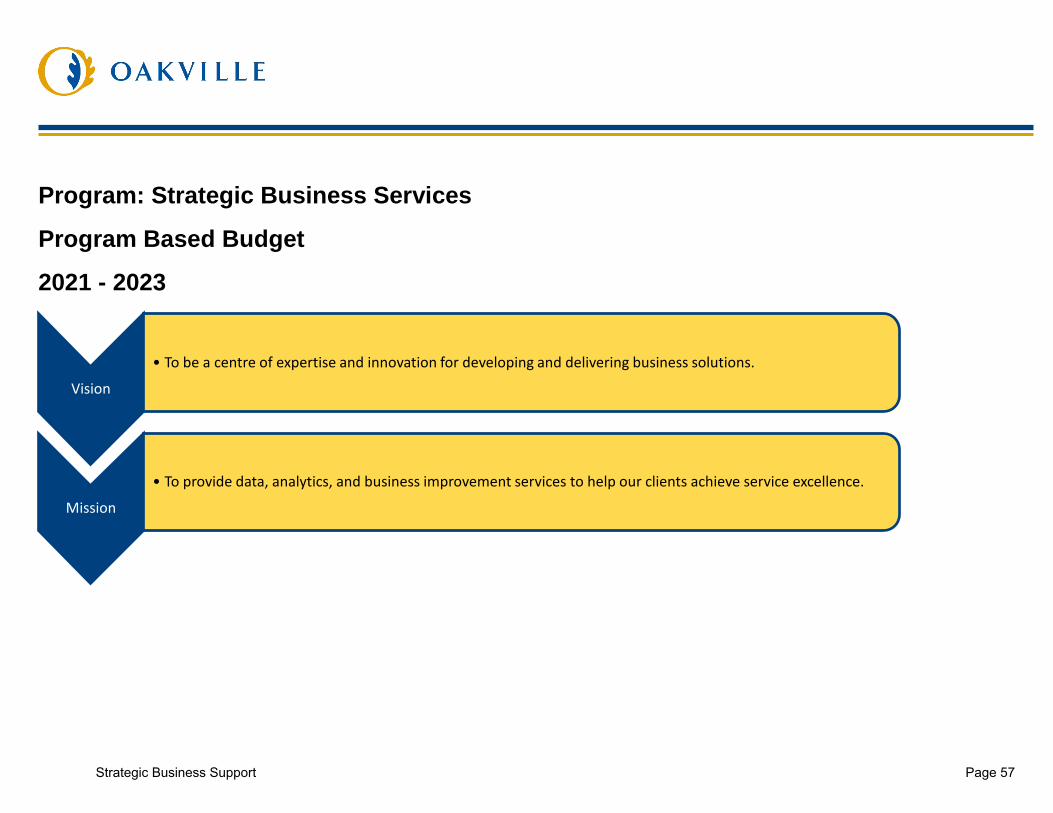
Program: Strategic Business Services
Program Based Budget
2021 - 2023
Vision
• To be a centre of expertise and innovation for developing and delivering business solutions.
Mission
• To provide data, analytics, and business improvement services to help our clients achieve service excellence.
Strategic Business Support Page 57

##D
Program Services Strategic Business Services provides services through the following activities:
Strategic Business Services
• Data Management• Geospatial Information• Data Analytics & Visualization • Business Solutions Coordination• Digital Engagement• Continuous Improvement &
Innovation• Project Management of Strategic
Initiatives
$0.3M
Strategic Business Support Page 58
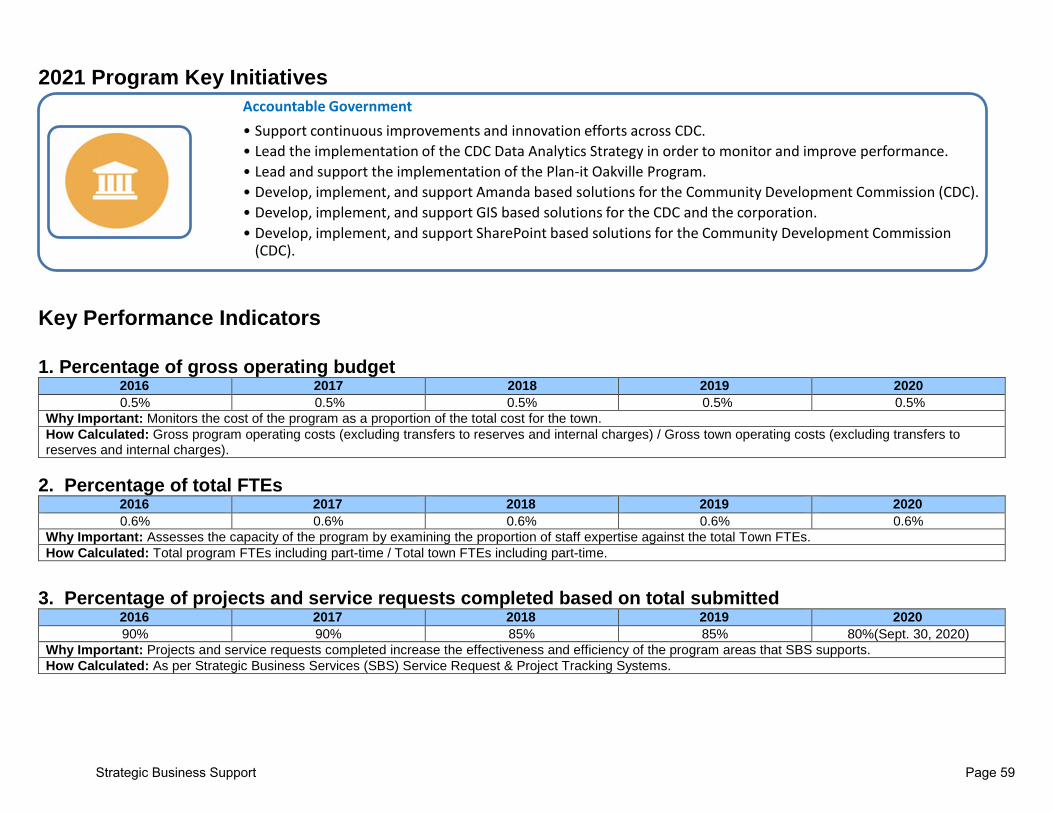
2021 Program Key Initiatives
Key Performance Indicators 1. Percentage of gross operating budget
2016 2017 2018 2019 2020 0.5% 0.5% 0.5% 0.5% 0.5%
Why Important: Monitors the cost of the program as a proportion of the total cost for the town. How Calculated: Gross program operating costs (excluding transfers to reserves and internal charges) / Gross town operating costs (excluding transfers to reserves and internal charges).
2. Percentage of total FTEs
2016 2017 2018 2019 2020 0.6% 0.6% 0.6% 0.6% 0.6%
Why Important: Assesses the capacity of the program by examining the proportion of staff expertise against the total Town FTEs. How Calculated: Total program FTEs including part-time / Total town FTEs including part-time.
3. Percentage of projects and service requests completed based on total submitted
2016 2017 2018 2019 2020 90% 90% 85% 85% 80%(Sept. 30, 2020)
Why Important: Projects and service requests completed increase the effectiveness and efficiency of the program areas that SBS supports. How Calculated: As per Strategic Business Services (SBS) Service Request & Project Tracking Systems.
Accountable Government• Support continuous improvements and innovation efforts across CDC.• Lead the implementation of the CDC Data Analytics Strategy in order to monitor and improve performance.• Lead and support the implementation of the Plan-it Oakville Program.• Develop, implement, and support Amanda based solutions for the Community Development Commission (CDC).• Develop, implement, and support GIS based solutions for the CDC and the corporation.• Develop, implement, and support SharePoint based solutions for the Community Development Commission
(CDC).
Strategic Business Support Page 59

Staffing Overview
Program: Strategic Business 2020 2021 2021 2021 2021 Net Services Approved Adjustments Budget Growth and Total Change
Services/Activities: FTE Reallocations Efficiencies Capital FTE 2021 vs 2020 Strategic Business Services 10.0 10.0 0.0
Total Strategic Business Services 10.0 0.0 0.0 0.0 10.0 0.0 The staff complement for Strategic Business Services remains unchanged from 2020 with 10.0 FTE’s.
Program Services Budget Overview
In 2021, the Strategic Business Services program net budget has decreased by $(2,900) or (.8)%. For 2021 inflationary adjustments were included as well as $1,800 in budget efficiencies from a town wide review. COVID mitigation has been included particularly a reduction of skills improvement and meals for a total of ($6,900). The program provides support to the Community Development Commission, with increased the services being provided to the Infrastructure Planning and Improvements and Municipal Enforcement departments. In addition, the town’s use of GIS continues to expand with the adoption of the GIS Strategic Plan.
2020 2021 2021 2021 2021 $ Change % Change 2021 2021 $ Change % Change
Restated Infl & Adj Capita l/Growth Budget Base from from Temporary Requested from from
Budget Impacts & Service Impacts Efficiencies Budget 2020 2020 COVID Impacts Budget 2020 2020
Strategic Business ServicesStrategic Business Services 349,100 2,200 1,800 353,100 4,000 1.1% -6,900 346,200 -2,900 -0.8%
Total Strategic Business Services 349,100 2,200 1,800 353,100 4,000 1.1% -6,900 346,200 -2,900 -0.8%
Strategic Business Support Page 60

Net Program Budget Change Strategic Business Services has decreased by $(2,900). Included are inflationary and step wage increases which are offset with increased capital labour recoveries and internal recoveries for support offered to the CDC commission which is fee recoverable. Temporary Covid reductions in purchased services have been incorporated should the pandemic continue in 2021.
Strategic Business Support Page 61

2021 Program Budget by Component– Net $ 346,200
In 2021, the Strategic Business Services program’s total expenditures are $1,274,900 and total revenues are $ 928,700 resulting in a net budget of $ 346,200. The net change from prior year has decreased by $(2,900) or (.8)%. The main drivers for the change are the following:
• Personnel Services & Benefits have increased by $32,800, which includes inflationary increases for salaries and benefits. • Internal Recoveries have increased by $29,800. Inflationary increase for the time spent by staff on activities that are fee recoverable have been included as
well as recovery of staff time working on the Plan-It project. • Purchased Services have decreased by $5,600 which includes COVID reductions in professional development, skills improvement, meals and mileage
should the pandemic continue into 2021. • Materials & Supplies includes the removal of drafting supplies and a modest office supply reduction to reflect current needs.
Strategic Business Support Page 62

2022 - 2023 Operating Budget Forecast
Strategic Business Support 2021 2022 2021 - 2022 2023 2022 - 2023
Requested Forecast Change Forecast Change Budget (%) (%)
Gross Expenditures By Service Strategic Business Services 1,274,900 1,309,400 2.7% 1,337,700 2.2% Total Gross Expenditures 1,274,900 1,309,400 2.7% 1,337,700 2.2% Tax Levy By Service Strategic Business Services 346,200 363,000 4.9% 373,300 2.8% Total Tax Levy 346,200 363,000 4.9% 373,300 2.8% Gross Expenditures By Type Personnel Services & Benefits 1,256,700 1,284,000 2.2% 1,311,900 2.2% Materials & Supplies 800 800 0.0% 800 0.0% Purchased Services 15,800 23,500 48.7% 23,900 1.7% Internal Charges - - 0.0% - 0.0% Other Expenditures - - 0.0% - 0.0% Minor Capital & Transfer To Reserves 1,600 1,100 31.3% 1,100 0.0% Total Expenses 1,274,900 1,309,400 2.7% 1,337,700 2.2% Revenues By Type Activity Revenue - - 0.0% - 0.0% Internal Recoveries 928,700 946,400 1.9% 964,400 1.9% Grants - - 0.0% - 0.0% Other Revenue - - 0.0% - 0.0% Total Revenues 928,700 946,400 1.9% 964,400 1.9% Tax Levy $346,200 $363,000 4.9% $373,300 2.8%
2022 - 2023 Budget Forecast Highlights • The 2022 net budget is projected to increase by 4.9% or $ 16,800 and reflects inflationary increases to the cost of delivering services as well as the reversal
of 2021 COVID reductions. • The 2023 net budget is projected to increase by 2.8% or $ 10,300 and reflects inflationary increases to the cost of delivering services.
Strategic Business Support Page 63

Strategic Business Support Page 64

2021 BUDGET – ENGAGED COMMUNITY OPERATING AND CAPITAL
Engaged Community Page 65

Engaged Community
Foster a community environment that engages residents of all ages, abilities and backgrounds.
• Engage the community in local government • Provide recreational and cultural events and spaces to promote shared community experiences • Provide effective licensing and enforcement framework to maintain community safety protection and enjoyment
Engaged Community Page 66
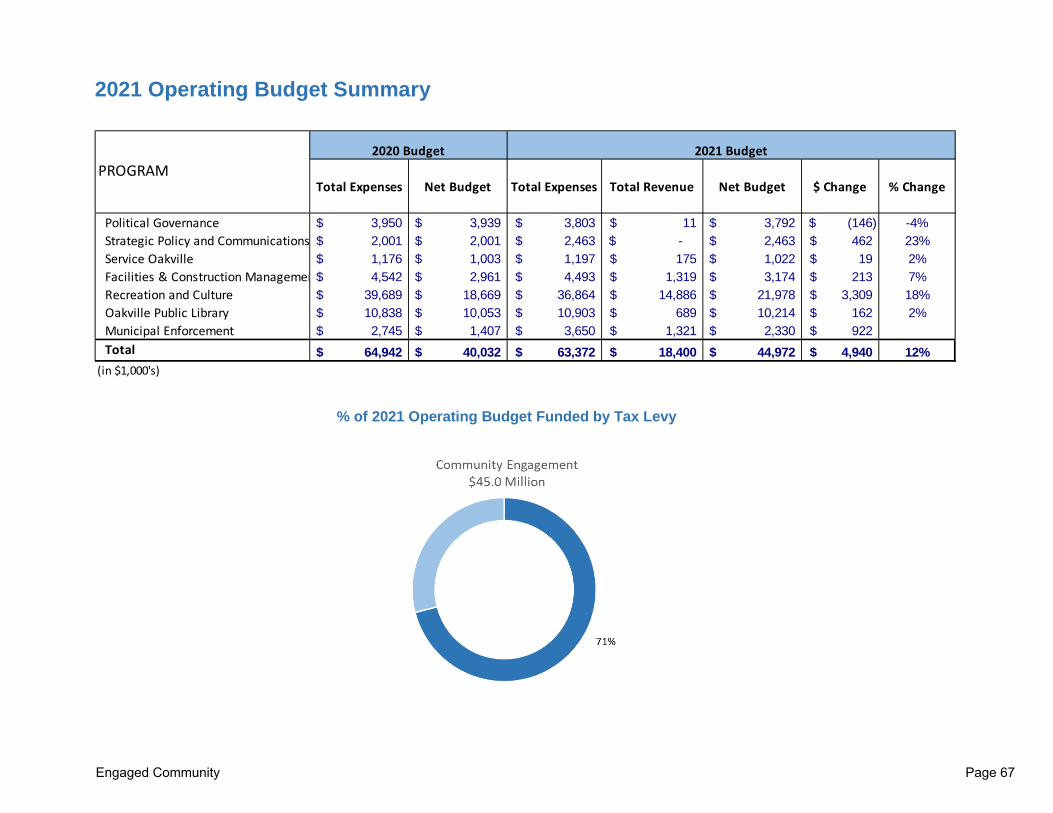
2021 Operating Budget Summary
% of 2021 Operating Budget Funded by Tax Levy
PROGRAMTotal Expenses Net Budget Total Expenses Total Revenue Net Budget $ Change % Change
Political Governance 3,950$ 3,939$ 3,803$ 11$ 3,792$ (146)$ -4%Strategic Policy and Communications 2,001$ 2,001$ 2,463$ -$ 2,463$ 462$ 23%Service Oakville 1,176$ 1,003$ 1,197$ 175$ 1,022$ 19$ 2%Facilities & Construction Managemen 4,542$ 2,961$ 4,493$ 1,319$ 3,174$ 213$ 7%Recreation and Culture 39,689$ 18,669$ 36,864$ 14,886$ 21,978$ 3,309$ 18%Oakville Public Library 10,838$ 10,053$ 10,903$ 689$ 10,214$ 162$ 2%Municipal Enforcement 2,745$ 1,407$ 3,650$ 1,321$ 2,330$ 922$ Total 64,942$ 40,032$ 63,372$ 18,400$ 44,972$ 4,940$ 12%
(in $1,000's)
2020 Budget 2021 Budget
Engaged Community Page 67

Engaged Community Page 68

test
Program: Recreation and Culture Services
Program Based Budget
2021 - 2023
Vision
• All residents of Oakville are engaged in meaningful, diverse and accessible recreation and cultural experiences that foster individual, family and community well-being.
Mission
• To support the development of a healthy, vibrant and cultural community in Oakville by:• Providing quality programs and services.• Enhancing community capacity.• Ensuring access to programs and services.
Page 69

test
Recreation and Culture Services
Program Services The Recreation and Cultural Services program is responsible for the effective delivery of recreation services that support healthy, active living, cultural services and experiences, community development and support, and the provision of high quality and accessible facilities. This requires an excellent understanding of the community, its demographics and the changing needs of the residents. This program also supports grant funding for Oakville Galleries, the Oakville Arts Council and the Cultural Grants program. Capital transfer to reserve funding and minor capital projects of $3.4M is included in the Recreation and Culture operating budget.
Admin • Establish Strategic Plans and Policies
Program Development
& Support
• Community Development
• Program Support• Registration and
Bookings• Marketing and
Development
Recreation & Culture Hubs
• Facility Admin and Maintenance Support
• Glen Abbey Hub• Sixteen Mile Hub• Iroquois Ridge Hub• River Oaks Hub• QEPCCC Hub• Oakville Trafalgar Hub• Trafalgar Park Hub• Sir John Colborne Centre
Cultural Services
• Administration and Grants
• Oakville Centre for the Performing Arts
• Museum• Events• Oakville Galleries
$0.5M
$3.0M
$3.4M
$15.0M
Page 70

test
Recreation and Culture Services
2021 Program Key Initiatives
Livability•Coach House revitilization to open in the Summer 2021, supported by Gas Tax Funding.
Engaged Community•Celebrated Oakville Trafalgar Community Centre's opening with a vitrual official ceremony.•Continued community engagement through progamming and events including winter recreation offerings, Canada Day and Santa Clause Parade events. •Continued outreach and inclusion actvties including diversified prorgamming offerings, partnerships with community groups and equitable access initiatives.
Accountable Government•Repurposed 5 full-time positions to offset operating impact of Oakville Trafalgar Community Centre.•Transition of Youth Services to responsive pop-up model and reduced long-term real estate leases.•Recreation Software replacement project - implementation plan in progress with cross-departmental team.
Environment•Reduction in print promotion materials supported by community uptake of Active Oakville.•Ice Resurfacer water treatment system expanded to all twin pad facilities reducing utility consumption.•Oakville Trafalger Community Centre LEED Silver certification. Pursuing Gold status with photovoltaic partnership with Oakville Hydro.
Mobility•Introduction of vehicle charging stations at Community Centre facilities.•Greening of arena ice resurfacer fleet beginning in 2021 with the town's first electric powered unit.
Page 71

test
Recreation and Culture Services
Key Performance Indicators 1. Percentage of gross operating budget
2016 2017 2018 2019 2020 13.8% 13.6% 14.5% 14.7% 14.6%
Why Important: Monitors the cost of the program as a proportion of the total cost for the town. How Calculated: Gross program operating costs (excluding transfers to reserves and internal charges) / Gross town operating costs (excluding transfers to reserves and internal charges)
2. Percentage of total FTEs
2016 2017 2018 2019 2020 20.0% 20.1% 21.1% 21.4% 21.2%
Why Important: Assesses the capacity of the program by examining the proportion of staff expertise against the total town FTEs. How Calculated: Total program FTEs including part-time / total town FTEs including part-time (includes Galleries; galleries = 11.2 FTE)
3. Square metres of public indoor recreation space per capita (ISO 37120 supporting indicator 13.1)
2016 2017 2018 2019 2020 0.41 m2/capita 0.41 m2/capita 0.49 m2/capita 0.46 m2/capita 0.47 m2/capita
Why Important: Demonstrates availability of indoor recreational facilities to residents and community organizations How Calculated: facility inventory size taken from building floor plans divided by population. Current square metre total is 102,184.
4. Square metres of cultural facilities per capita
2016 2017 2018 2019 2020 0.063 m2/capita 0.063 m2/capita 0.060 m2/capita
0.057 m2/capita 0.0566 m2/capita
Why Important: Demonstrates availability of cultural facilities to residents and community organizations How Calculated: Total municipal space dedicated to culture divided by population. Total space of Gairloch Gallery, Oakville Museum and Coach House, Sovereign House, Thomas House, Oakville Historical Society, Old Post Office, Oakville Galleries at Centennial Square and OCPA and 50% of QEPCCC. Current square metre total is 12,136.
Page 72

test
Recreation and Culture Services
5. Program capacity rates (registered programs) 2016 2017 2018 2019 2020
74% 73% 74% 76%
76% Projected to Dec. 31/20
Why Important: Determines efficiency, relevance and utilization of program planning efforts. How Calculated: Utilizes registration enrollment data for recreation and culture programs. Reporting on traditional seasonal registered programs to maintain reporting consistency – Qlikview.
6. Participant hours for recreation and culture programs per capita
2016 2017 2018 2019 2020
18 20 20 19
6 Projected to Dec. 31/20
Why Important: Captures the approximate activity level of facility and program users How Calculated: Utilizes participation hours for registered programs. For facility rentals, average hourly participation rates are assigned based on sport assumption. For memberships, assumes 60 minute participation per scan – Qlikview (Does not include OCPA, Oakville Galleries, Oakville Museum or events and exhibitions)
7. Annual facility visitors
2016 2017 2018 2019 2020 3,903,600 3,888,768
3,984,574 4,115,600
1,195,000
Projected to Dec. 31/20 Why Important: Recreation and Culture facilities are neighbourhood gathering places where residents can enjoy a variety of social, cultural and recreational activities for all ages. How Calculated: Many of our facilities use automated people counters to track the number of visitors. By knowing how many visitors attend each facility gives us a better understanding of community participation and facility use. We can also identify the busiest times of use, and the most popular locations, activities or events.
8. Percentage of citizens satisfied with recreation and culture programs and services
2016 2017 2018 2019 2020
86% 87% 87% 89%
90% Projected to Dec. 31/20
Why Important: Registered Program surveys capture customer experience scores about the program, the instructor, the facility and the registration experience. How Calculated: Utilizes customer feedback system survey results – SharePoint. The survey was updated in the Winter of 2019 to be responsive and shortened based on customer feedback. Response rate has improved from 8% in 2018 to 14% in 2019 and is currently at 13% for 2020.
Page 73
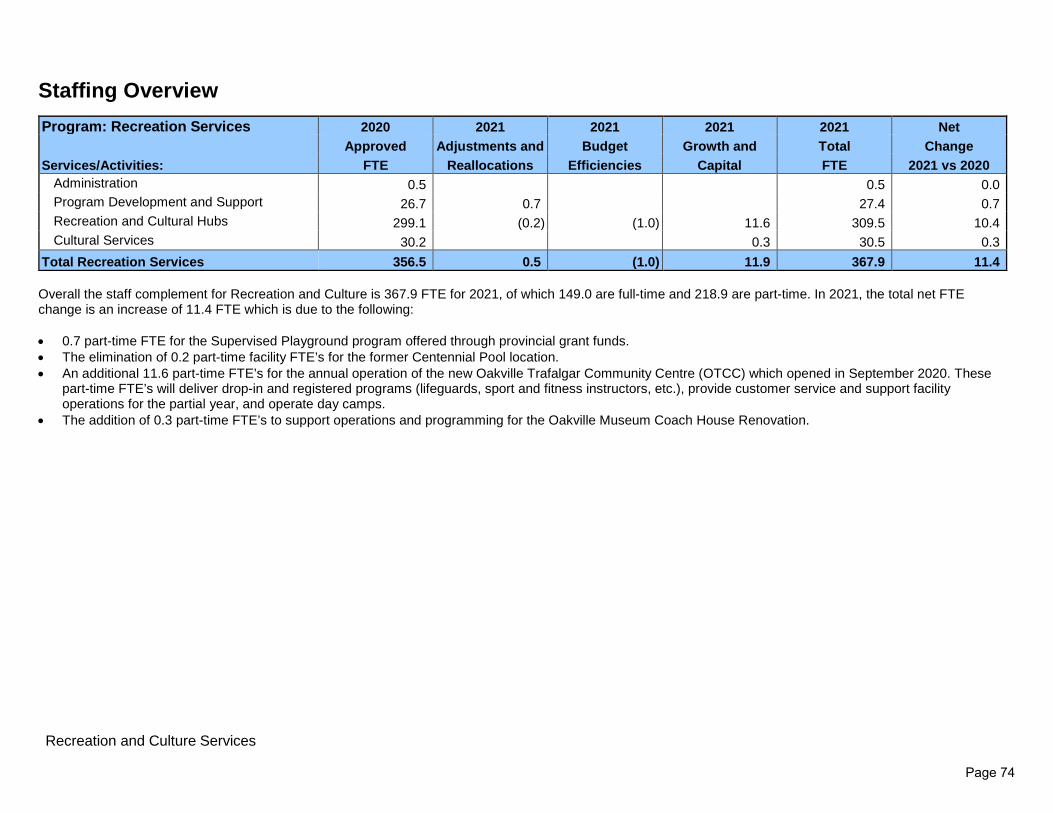
test
Recreation and Culture Services
Staffing Overview Program: Recreation Services 2020 2021 2021 2021 2021 Net Approved Adjustments and Budget Growth and Total Change Services/Activities: FTE Reallocations Efficiencies Capital FTE 2021 vs 2020
Administration 0.5 0.5 0.0 Program Development and Support 26.7 0.7 27.4 0.7 Recreation and Cultural Hubs 299.1 (0.2) (1.0) 11.6 309.5 10.4 Cultural Services 30.2 0.3 30.5 0.3
Total Recreation Services 356.5 0.5 (1.0) 11.9 367.9 11.4 Overall the staff complement for Recreation and Culture is 367.9 FTE for 2021, of which 149.0 are full-time and 218.9 are part-time. In 2021, the total net FTE change is an increase of 11.4 FTE which is due to the following: • 0.7 part-time FTE for the Supervised Playground program offered through provincial grant funds. • The elimination of 0.2 part-time facility FTE’s for the former Centennial Pool location. • An additional 11.6 part-time FTE’s for the annual operation of the new Oakville Trafalgar Community Centre (OTCC) which opened in September 2020. These
part-time FTE’s will deliver drop-in and registered programs (lifeguards, sport and fitness instructors, etc.), provide customer service and support facility operations for the partial year, and operate day camps.
• The addition of 0.3 part-time FTE’s to support operations and programming for the Oakville Museum Coach House Renovation.
Page 74

test
Recreation and Culture Services
Program Services Budget Overview
In 2021, Recreation and Culture has a budget increase of $3,309,000 or 17.7%. The temporary COVID impacts are responsible for 17.4% of the increase or $3,252,100. These impacts will be reversed in the 2022 budget. The minimal base budget increase of 0.5% includes inflation and adjustments for salaries and benefits and revenues. Operating impacts from capital projects total $734,600 which include the phased in transfer to the Building Maintenance reserve for Trafalgar Park Community Centre and the annualized cost of operating the Oakville Trafalgar Community Centre, (OTCC). Centennial Pool closed in 2020, and respective staffing and facility budgets have been included in the OTCC budget, reducing the operating budget impact. The full cost of OTCC in 2021 including temporary COVID impacts and cost reallocations from Centennial pool is $0.9 million. Staff then worked to find efficiencies to reduce the budget impact. Transitioning youth programming to a demand based pop-up model resulted in budget savings from fixed real estate costs with part-time staff dollars retained to continue to provide youth programming in the community hubs. Corporately, reductions to heat and hydro budgets were included, with the introduction of a BAS Specialist working with facility teams to identify and maximize utility reduction opportunities.
2020 2021 2021 2021 2021 $ Change % Change 2021 2021 $ Change % Change
Restated Infl & Adj Capita l/Growth Budget Base from from Temporary Requested from from
Budget Impacts & Service Impacts Efficiencies Budget 2020 2020 COVID Impacts Budget 2020 2020
Recreation and CultureAdministration 439,000 35,300 7,000 -13,300 468,000 29,000 6.6% -1,900 466,100 27,100 6.2%
Program Development and Support 3,009,400 127,300 -200 3,136,500 127,100 4.2% -86,800 3,049,700 40,300 1.3%
Recreation and Cultural HubsFacil ity Hub Admin 289,900 -11,900 278,000 -11,900 -4.1% -3,200 274,800 -15,100 -5.2%
Glen Abbey Hub 1,460,700 -58,400 -232,800 1,169,500 -291,200 -19.9% 728,400 1,897,900 437,200 29.9%
Iroquois Ridge Hub 1,322,700 -7,500 2,500 -44,400 1,273,300 -49,400 -3.7% 618,400 1,891,700 569,000 43.0%
QEPCCC Hub 3,028,100 9,100 -82,200 2,955,000 -73,100 -2.4% 496,300 3,451,300 423,200 14.0%
River Oaks Hub 1,324,700 -150,800 -27,700 1,146,200 -178,500 -13.5% 230,900 1,377,100 52,400 4.0%
Sixteen Mile Hub 1,711,600 -536,600 156,500 -68,700 1,262,800 -448,800 -26.2% 618,300 1,881,100 169,500 9.9%
Southern Facil ities 244,700 2,600 -700 246,600 1,900 0.8% -76,400 170,200 -74,500 -30.4%
Oakvil le Trafalgar CC Hub 882,000 797,000 44,100 -1,400 1,721,700 839,700 95.2% 304,700 2,026,400 1,144,400 129.8%
Trafalgar Park Hub 1,650,600 -142,000 153,000 -16,600 1,645,000 -5,600 -0.3% 76,800 1,721,800 71,200 4.3%
Seniors Centre 197,600 -1,800 -500 195,300 -2,300 -1.2% 87,400 282,700 85,100 43.1%
Cultural ServicesAdmin and Grants 774,800 6,000 780,800 6,000 0.8% -20,900 759,900 -14,900 -1.9%
OCPA 991,600 29,400 -9,300 1,011,700 20,100 2.0% 373,100 1,384,800 393,200 39.7%
Museums 534,700 16,100 9,700 -300 560,200 25,500 4.8% 26,500 586,700 52,000 9.7%
Events 443,800 900 444,700 900 0.2% -60,000 384,700 -59,100 -13.3%
Oakvil le Galleries Grant 362,800 67,500 430,300 67,500 18.6% -59,500 370,800 8,000 2.2%
Total Recreation and Culture 18,668,700 182,200 372,800 -498,100 18,725,600 56,900 0.3% 3,252,100 21,977,700 3,309,000 17.7%
Page 75

test
Recreation and Culture Services
Temporary COVID Impacts are significant in the Recreation and Culture program budget, due to the restrictions of the pandemic. Program and facility offerings have been changed substantially and staff have worked to reduce the financial impact as well. Kinoak and Maplegrove arenas and White Oaks pool are scheduled to stay closed until September 2021. Eight full-time positions will be held vacant for varying lengths during 2021 to provide further savings. These efficiencies have not been included in the FTE count, as they are a temporary measure. Over $2.0 million of savings is budgeted in part-time wages and benefits as well, due to the reductions in programming. Budgeted revenues were methodically reduced by $7,311,800, including program revenues, facility rentals, admissions and memberships. Budgets for facility staffing and cleaning have not been reduced, beyond the identified extended closures, with higher levels of cleaning expected through 2021.
The largest portion of the budget is related to the Recreation and Culture Hubs totaling $14,975,000. Cultural Services is the second largest service area with $ 3,486,900 which delivers and manages cultural services related to Oakville Centre for the Performing Arts, Oakville Museum, Events and Cultural grants including Oakville Galleries. The remainder of the budget is comprised of Program Development and Support and Administration in which the former provides customer care and service to customers, internal program and business support to community groups and organizations and community development.
Page 76

test
Recreation and Culture Services
Net Program Budget Change • Administration has increased $27,100. During the 2020 budget process,
the budget for mileage for the department was reallocated to Administration from all the other services. This reallocation provided an increase of $43,700 to Administration but was offset by a net budget efficiency savings of $13,300.
• Program Development and Support has increased $40,300. This includes inflation on salaries and benefits of $52,800. With the closure of Nottinghill Youth Centre, $43,600 of part-time dollars were moved to the Youth Administration business unit to support town wide initiatives. Temporary COVID Impact savings on personnel are included at $189,900 for nine months of gapping of a Customer Service Representative in Registration and Booking, 6 months of the currently vacant Senior Manager position, and part-time savings in Aquatics Administration and Inclusion Programs. The Recreation Connection fee assistance grant has increased by $20,000 which provides low-income individuals the ability to participate in recreational programs. The budgeted costs of $47,800 to produce the Recreation Brochure were removed along with the advertising revenue of $50,000. $15,000 was held for external reproduction costs to have a printing budget remaining for select printing projects.
• Recreation and Culture Hubs has increased $2,862,400. This substantial increases includes $3,081,600 of temporary COVID Impacts, reducing part-time budgets as well as revenues that will not likely be realized due to the current pandemic. Kinoak and Maplegrove arenas and White Oaks Pool are planned for extended closures from January – August of 2021 to reduce operating costs. As well, the Recreation Assistant position at OTCC will remain vacant for six months. Capital Impacts for OTCC and Trafalgar Park CC transfer to reserve increase the budget by $356,100. Staff were able to find budgeted efficiencies totaling $475,000.
• Cultural Services has increased by $379,200. Inflationary increases and adjustments were made to Cultural programs for personnel, municipal grants and for program revenue. However, Temporary COVID Impacts of $259,200 are increasing the budget due to the OCPA being unable to operate at capacity through most of 2021.
Page 77

test
Recreation and Culture Services
2021 Program Budget Drivers - Net $22,005,200
The Recreation and Cultural Services program’s total expenditures are $36,863,600 and total revenues are $14,858,400, resulting in a net budget of $22,005,200. In 2021, the budget has increased by $3,336,500 or 17.9%. The main drivers are:
• Personnel Services and Benefits has decreased by $1,746,700. Representing 59% of the gross expenditures, personnel makes up the largest expense component for Recreation and Culture with full complement being 367.9 FTEs. In addition to inflationary adjustments for salary and benefits, the budget includes an increase of 11.6 part-time FTE’s for the new OTCC as well as 0.3 part-time FTE’s for the Coach House renovation, totaling $446,300. Further changes include the elimination of 1.0 full-time FTE due to the Nottinghill Youth centre closure. Temporary COVID impacts for personnel total $2,754,900 including both full-time and part-time savings.
• Materials and Supplies has a total budget of $5.1 million making up 14.0% of the gross expenses, and has decreased by $255,900. $180,800 has been included for the new OTCC for utilities and various supplies, offset by savings from the closure of Centennial Pool. $217,700 of efficiencies reduced the budget for anticipated savings in heat and hydro expenses with an increased corporate focus on better managing the BAS systems. Temporary COVID impacts are primarily savings at Kinoak and Maplegrove arenas and White Oaks pool. As well, savings are included for the OCPA with respect to purchases of ticket stock, food and refreshments and beer and wine.
Activity Revenue,
$13,713,800
Internal Recoveries, $477,000
Grants, $644,100
Other Revenue, $51,000
2021 Revenues $14.9M
Page 78

test
Recreation and Culture Services
• Purchased Services has a budget of $4.3 million which has decreased by $1,049,100. $70,400 has been added to the budget for operating impacts related to OTCC, including contracted services, repairs and maintenance and programming, offset by savings from the closure of Centennial Pool. Budget efficiencies of $149,300 include rent expense savings from the Nottinghill Youth Centre, along with reductions to the building repair and maintenance accounts as staff work to proactively access warranties more often. Temporary COVID impacts are $1,048,900 and include savings from the temporary closure of Kinoak and Maplegrove arenas and White Oaks, as well as savings from the OCPA because of its significantly reduced capacity. There are also savings for Instructor and Performer fees for camps due to the massively reduced camp offerings.
• Minor Capital &Transfers to Reserves total $3.5 million and consist mainly of transfer to the Building Maintenance reserve to ensure funding for future asset
replacement needs as building components reach the end of their useful life. In 2021, costs have increased by $324,300 due to the phase-in of the Trafalgar Park Community Centre (TPCC) transfer to reserve of $153,000 and $7,000 to the equipment reserve. As well, $192,800 is included for the first year of the phase-in transfer for the OTCC.
• Internal Charges have decreased by $98,500. This cost category consists of the expenses charged to Recreation and Culture by other departments for service provided such as snow clearing and is based on actual usage of services. The internal charge to the Outdoor Pools from Kinoak and Maplegrove for work done by their staff during the summer to maintain the pools, is showing as a Temporary COVID impact as staff will not be available there until September 1. As well, the reciprocal agreement has been adjusted due to the fact that camps will not be operated in school facilities during 2021.
• Other Expenditures has increased by $600 mostly for increases to municipal grants and bank charges. In 2021 the Recreation Connection fee assistance grant increases by $20,000. This program uses unused capacity within existing programs and costs are offset by an internal allocation to activity revenues. Additional adjustment sare included for cultural grants, the arts council grant and the sports development grant. As well, bank service charges in Registration and Booking have been adjusted based on historical volumes. These budgeted increases offset the Temporary COVID Impacts of $21,200 for bank charges at OCPA Box office due to an anticipated significant reduction in ticket sales.
• Activity Revenue has a total budget of $13,713,800. In 2021, activity revenue has decreased by $6,125,100. Inflation has been included on all fees at 1.7%,
as well as rental revenues adjusted based on historical volume. Revenues for OTCC have also been added at $681,500, and include Admissions, registration fees, and gym and room rentals. Temporary COVID impacts for revenue total $7,311,800 and were adjusted methodically, using assumptions based on each revenue type.
• Grants maintains 3.1% of total revenue with $678,900 which have increased by $71,300. Grant revenue is comprised primarily of funding received through Provincial and Federal grants for various recreation and culture programs. In 2021, grant funding increased primarily due to grant added for Oakville Galleries.
• Internal Recoveries have decreased by $108,500 for changes to internal labour charges and internal arena charges, specifically the offset of the changes to the internal charges listed above.
• Other Revenue is $51,000 and consists of a $20,000 transfer from the Recreation Centre Equipment reserve to fund operating purchases of equipment. As well, it includes interest income of $3,000 for the Oakville Galleries and $27,500 reserve transfer has been added for a feasibility study planned in 2021.
Page 79

test
Recreation and Culture Services
2022 - 2023 Operating Budget Forecast
2021 2022 2021 - 2022 2023 2022 - 2023Requested Forecast Change Forecast Change
Budget (%) (%)
Administration 466,100 480,100 3.0% 492,300 2.5%Program Development and Support 3,890,300 4,153,100 6.8% 4,226,700 1.8%Recreation and Cultural Hubs
Facility Hub Admin 274,800 284,100 3.4% 290,400 2.2%Glen Abbey Hub 3,805,900 4,219,300 10.9% 4,317,300 2.3%River Oaks Hub 2,789,000 3,555,300 27.5% 3,641,300 2.4%Sixteen Mile Hub 5,233,900 5,485,500 4.8% 5,579,400 1.7%Iroquois Ridge Hub 4,274,900 4,883,500 14.2% 5,060,600 3.6%QEPCCC Hub 4,673,600 5,517,200 18.1% 5,639,000 2.2%Trafalgar Park Hub 2,897,600 3,386,900 16.9% 3,599,600 6.3%Southern Facilities 172,200 251,900 46.3% 255,400 1.4%Oakville Trafalgar CC Hub 2,765,400 3,382,500 22.3% 3,651,100 7.9%Seniors Centre 429,000 457,400 6.6% 468,800 2.5%
Total Recreation and Culture Hubs 27,316,300 31,423,600 15.0% 32,502,900 3.4%Cultural Services
Admin and Grants 759,900 797,800 5.0% 816,200 2.3%OCPA 2,190,500 2,870,300 31.0% 2,947,600 2.7%Museums 676,000 727,400 7.6% 754,000 3.7%Events 434,800 533,000 22.6% 544,100 2.1%Oakville Galleries Grant 1,129,700 1,117,700 -1.1% 1,142,700 2.2%
Total Cultural Services 5,190,900 6,046,200 16.5% 6,204,600 2.6%36,863,600 42,103,000 14.2% 43,426,500 3.1%
Administration 466,100 480,100 (3.0%) 492,300 (2.5%)Program Development and Support 3,049,700 3,190,200 4.6% 3,248,800 1.8%Recreation and Cultural Hubs
Facility Hub Admin 274,800 284,100 3.4% 290,400 2.2%Glen Abbey Hub 1,897,900 1,495,300 -21.2% 1,538,000 2.9%River Oaks Hub 1,377,100 1,357,300 -1.4% 1,396,300 2.9%Sixteen Mile Hub 1,881,100 1,575,100 -16.3% 1,585,600 0.7%Iroquois Ridge Hub 1,891,700 1,663,800 -12.0% 1,773,100 6.6%QEPCCC Hub 3,451,300 3,238,900 -6.2% 3,309,800 2.2%Trafalgar Park Hub 1,721,800 1,808,700 5.0% 1,993,700 10.2%Southern Facilities 170,200 249,900 46.8% 253,400 1.4%Oakville Trafalgar CC Hub 2,026,400 2,043,300 0.8% 2,282,300 11.7%Seniors Centre 282,700 202,000 -28.5% 209,200 3.6%
Total Recreation and Culture Hubs 14,975,000 13,918,400 -7.1% 14,631,800 5.1%Cultural Services
Admin and Grants 759,900 797,800 5.0% 816,200 2.3%OCPA 1,384,800 1,048,300 -24.3% 1,088,400 3.8%Museums 586,700 604,200 3.0% 619,500 2.5%Events 384,700 451,900 17.5% 461,400 2.1%Oakville Galleries Grant 370,800 407,200 9.8% 438,200 7.6%
Total Cultural Services 3,486,900 3,309,400 -5.1% 3,423,700 3.5%21,977,700$ 20,898,100$ (4.9%) 21,796,600$ 4.3%
Recreation Services
Gross Expenditures By Service
Total Gross ExpendituresTax Levy By Service
Total Tax Levy
Page 80

test
Recreation and Culture Services
2022 - 2023 Operating Budget Forecast Continued
2022 - 2023 Budget Forecast Highlights • The 2022 net budget is projected to decrease by (4.9%) or $(1,079,600) primarily due to the reversal of the temporary revenue adjustments associated with
the 2021 COVID impacts as service returns to normal levels. The one-time expenditure reductions from the 2021 budget have also been added back in for 2022 as well as inflationary increases to the cost of delivering services. In addition, there are operating impacts from capital projects that total $430,700. These impacts include the fourth year phase-in transfer to the Building Maintenance reserve for Trafalgar Park Community Centre $160,000. As well, a $145,500 net increase for OTCC which includes a $192,800 phase-in transfer to the Building Maintenance Reserve and $47,300 net revenues for Camps, Leagues and General Programs. $159,100 is included for a new Youth Centre along with 1.5 FTE’s effective mid-year 2022. The Coach House renovation project will also add 0.5 FTE and $31,100 to the budget. Finally, savings from the Energy Management projects for Kinoak and Maplegrove arenas are budgeted to provide a reduction of $52,500 in hydro costs.
• The 2023 net budget is projected to increase by 4.3% or $ $898,500 and reflects inflationary increases and the incremental increased transfer to the Building Reserve for Trafalgar Park Community Centre and OTCC, totaling $352,800. The annualized impact of the new Youth Centre will increase the budget by $62,000.
2021 2022 2021 - 2022 2023 2022 - 2023Requested Forecast Change Forecast Change
Budget (%) (%)
Personnel Services & Benefits 21,837,000 25,098,100 14.9% 25,797,100 2.8%Materials & Supplies 5,179,900 5,419,300 4.6% 5,532,600 2.1%Purchased Services 4,270,000 5,459,200 27.9% 5,586,700 2.3%Internal Charges 1,089,900 1,205,900 10.6% 1,206,000 0.0%Other Expenditures 1,009,400 1,050,900 4.1% 1,065,500 1.4%Minor Capital & Transfer To Reserves 3,477,400 3,869,600 11.3% 4,238,600 9.5%Total Expenses 36,863,600 42,103,000 14.2% 43,426,500 3.1%
Activity Revenue 13,713,800 20,012,700 45.9% 20,450,200 2.2%Internal Recoveries 477,000 586,900 23.0% 586,900 0.0%Grants 644,100 581,800 (9.7%) 569,300 (2.1%)Other Revenue 51,000 23,500 (53.9%) 23,500 0.0%Total Revenues 14,885,900 21,204,900 42.4% 21,629,900 2.0%
21,977,700$ 20,898,100$ (4.9%) 21,796,600$ 4.3%
Gross Expenditures By Type
Revenues By Type
Tax Levy
Recreation Services
Page 81

test
Recreation and Culture Services
2021 Recommended Capital Budget The Recreation and Culture capital budget provides for the asset replacements, planning studies, and service enhancements for the town’s recreation centres, senior’s centres, youth centres, museums, pools, and arenas. The various facility-specific equipment and capital replacement projects listed below ensure that building components, equipment, and furnishings remain in a state of good repair to support prescribed service levels. Studies projects provide for service, program, and growth planning to adjust for emerging trends and shifting demographics in Oakville. The Ice Resurfacer Replacement budgeted in 2021 will shift to electric power in order to better align with Council’s strategic greening initiatives. There is also a project at River Oaks Recreation Centre to Repurpose Shooter Pad to Multipurpose Space in order to better provide the youth in the community additional, more flexible opportunities for programming.
Capital Budget Operating Impacts Project Project Title Classification 2021 2021 46302101 Trafalgar Park - Equipment Replacement Infrastructure Renewal 5,000 46302102 Trafalgar Park - Capital Replacements Infrastructure Renewal 10,000 46312101 Southern Arenas - Capital Replacements Infrastructure Renewal 35,000 46312103 Slab Assessments - Various Locations Infrastructure Renewal 40,000 46312104 Ice Resurfacer Replacement - Electric Strategic Priorities 181,000 46402102 Outdoor Pools - Capital Replacements Infrastructure Renewal 103,000 46602101 Recreation Planning Studies Infrastructure Renewal 261,000 46602103 Senior's Centre - Capital Replacements Infrastructure Renewal 10,000 46632102 River Oaks - Fitness Equipment Replacement Infrastructure Renewal 5,000 46632103 River Oaks - Capital Replacements Infrastructure Renewal 10,000 46632104 Repurpose Shooter Pads to Multipurpose Space Strategic Priorities 302,000 46642002 Iroquois Ridge - Fitness Equipment Replacement Infrastructure Renewal 5,000 46642103 Iroquois Ridge - Capital Replacements Infrastructure Renewal 58,000 46652101 Glen Abbey - Fitness Equipment Replacement Infrastructure Renewal 22,800 46652102 Glen Abbey - Capital Replacements Infrastructure Renewal 352,000 46661902 QEPCCC - Fitness Equipment Replacement Infrastructure Renewal 5,000 46662101 QEPCCC - Capital Replacements Infrastructure Renewal 107,000 46672001 Joshua's Creek Arena - Capital Replacements Infrastructure Renewal 15,000 46682101 16 Mile - Capital Replacements Infrastructure Renewal 82,000 46692101 Oakville Trafalgar - Equipment Replacement Infrastructure Renewal 5,000 46692102 Oakville Trafalgar - Capital Replacements Infrastructure Renewal 20,000 47102101 Oakville Centre - Capital Replacements Infrastructure Renewal 5,000 47802101 Museum - Capital Replacements Infrastructure Renewal 18,000
TOTAL 1,656,800
Page 82

Program: Library Services
Program Based Budget
2021 - 2023
Vision
• Inspiring Oakville
Mission
• Cultivating discovery and creativity by:• Providing access to resources for information and recreation.• Fostering the joy of reading and learning for all ages.• Offering a welcoming and supportive environment.
Library Services Page 83

Program Services The Oakville Public Library (OPL) serves as a community hub and provides residents with access to collections, technology, and programs through welcoming physical and digital spaces. The library fosters opportunities for exploring new technologies, encouraging collaboration and innovation, as well as promoting literacy and life-long learning.
Library Services Page 84

Administrative Services
• Supports the Library Board• Strategic Planning• HR & corporate functions
Customer Experience
• Provides physical and digital collections and programming to the public
• Services provided through seven branches, ten book nooks, five book depots, three OPL Express locations as well as through outreach delivery and programming
• Develops flexible community spaces to maximize collaboration and innovation
Innovation and
Integration
• Collect, creates and provides access to relevant collections and programming to meet the evolving community needs
• Supports the public with digital and media literacy skills
• Leverages technology to provide efficient and convenient public services
• Create community partnership, fundraising and sponsorship opportunities
• Marketing and communication
• Information Oakville• Develops relevant and
innovative events
$0.6M
$6.2M
$3.4M
#REF!M
Library Services Page 85

2021 Program Key Initiatives
Key Performance Indicators 1. Percentage of gross operating budget
2016 2017 2018 2019 2020 4.2% 4.2% 4.2% 4.5% 4.4%
Why Important: Monitors the cost of the program as a proportion of the total cost for the town. How Calculated: Gross program operating costs (excluding transfers to reserves and internal charges) / Gross town operating costs (excluding transfers to reserves and internal charges)
2. Percentage of total FTEs
2016 2017 2018 2019 2020 6.9% 6.8% 6.4% 6.7% 6.6%
Why Important: Assesses the capacity of the program by examining the proportion of staff expertise against the total Town FTEs. How Calculated: Total program FTEs including part-time / Total town FTEs including part-time
3. Number of active library cardholders per capita [cardholder “purge” occurred and definition was modernized to reflect industry best practices]
2016 2017 2018 2019 2020 41% 39% 31% 30.2%
27.5%
(Sept 30, 2020) Why Important: Reflects relevance of Library service to the community
**The Library changed its calculation of active cardholders during 2018 so that it is now active cardholders over the last two years, when previously, it was three years. This is in line with provincial reporting standards.
How Calculated: # active cardholders / population
Engaged Community• Expand OPL Express locations to better support underserved Oakville communities. • Offer an updated outdoor space library at OPL's Glen Abbey Branch.
Library Services Page 86

4. Collection breakdown (% mix) - % annual operating budget of digital vs print/audio visual 2016 2017 2018 2019 2020
31% / 69% 29% / 71% 31% / 69% 30% / 70%
31% / 69% (Sept 30, 2020)
Why Important: Trend in spending reflects the increased supply of digital resources. How Calculated: Total operating budget – electronic resources
5. Percentage of citizens satisfied with library programs and services
2016 2017 2018 2019 2020 N/A 88% N/A 91% N/A
Why Important: Town Citizen Survey, respected tool to measure community satisfaction with library services, conducted every 2 years. How Calculated: Town-selected third-party consultant
6. Number of library items borrowed per capita annually
2016 2017 2018 2019 2020 9.35 8.64
* lower due to the fact that Iroquois Ridge branch was
closed for 6 months
8.87 * lower due to the fact that White Oaks branch was
closed for 6 months*
9.09 * Glen Abbey closed branch
starting June 2
5.14 (Sept 30, 2020) * COVID-19 pandemic closed
all branches for 5 months. Restrictions remain.
Why Important: Reflects one core aspect of library service. How Calculated: Circulation / population
Library Services Page 87

Staffing Overview
Program: Library 2020 2021 2021 2021 2021 Net Approved Adjustments and Budget Growth and Total Change Services/Activities: FTE Reallocations Efficiencies Capital FTE 2021 vs 2020
Administration Services 5.7 5.7 0.0 Customer Experience 77.7 (0.4) 77.3 (0.4) Innovation and Integration 27.6 (1.0) 26.6 (1.0)
Total Library 111.0 (1.0) 0.0 (0.4) 109.6 (1.4) In 2021, the Library reduced its complement by 1.0 part-time FTE, or two part-time positions—the Graphic Designer and Database Collection Assistant. Gapping savings had been identified in the 2020 budget with the intention to find permanent savings in part-time through attrition of staff. As well, the Library converted 2 part-time Children’s Programmer positions to one full-time position at a net neutral impact to the budget. Finally, the Central branch one desk conversion project will yield savings of 0.4 FTE.
Program Services Budget Overview
Overall the Library Services budget has increased by $161,800 or 1.6% resulting in a net budget of $10,214,400. Customer Experience represents 60% of the budget at $6.2M which provides services through brick and mortar branches, book nooks, book depots and OPL Express locations. Innovation and Integration is the second largest component at $3.4M which represents costs for various collection materials, technology support for both services and the public and community development and engagement which includes Information Oakville and the Halton Information Providers (HIP).
2020 2021 2021 2021 2021 $ Change % Change 2021 2021 $ Change % Change
Restated Infl & Adj Capital/Growth Budget Base from from Temporary Requested from from
Budget Impacts & Service Impacts Efficiencies Budget 2020 2020 COVID Impacts Budget 2020 2020
Oakville Public LibraryAdministrative Services 635,000 34,200 -3,300 665,900 30,900 4.9% -26,500 639,400 4,400 0.7%
Customer Experience 5,933,400 222,900 -13,500 -4,200 6,138,600 205,200 3.5% 14,700 6,153,300 219,900 3.7%
Innovation and Integration 3,484,200 -45,900 35,900 -1,900 3,472,300 -11,900 -0.3% -50,600 3,421,700 -62,500 -1.8%
Total Oakville Public Library 10,052,600 211,200 22,400 -9,400 10,276,800 224,200 2.2% -62,400 10,214,400 161,800 1.6%
Library Services Page 88

The Library’s base budget impact of 2.2% includes inflation on salaries and benefits, as well as some adjustments to the budget. The operating impacts from capital include staff savings of $13,500 for the Central branch one desk conversion, and $35,900 in collections costs for year two of a three year phase-in for the new Sixteen Mile branch that opened in 2019. Budget efficiencies reduce the budget by $9,400 and include reductions of $3,000 to professional development and skills improvement, $4,300 for mileage and $2,100 for building repairs and maintenance as staff work more proactively to access available warranty claims.
Temporary COVID Impacts reduce the budget by $62,400. Savings were found in staffing costs with a Supervisor position budgeted to stay vacant for six months. As well, a number of part-time positions will be held vacant to provide additional savings, however this will not enable the Library to open the same number of hours as pre-COVID. There are also temporary savings included for professional development and skills improvement, group training, staff and volunteer recognition, office supplies, instructor and performer costs, programming, and meal expenses totaling $38,800. These savings are offset by a significant addition of janitorial costs to the budget for day porter cleaning staff totaling $193,400. Finally, revenues have been reduced for registration, room rentals at a 75% reduction and photocopier revenue at 40%.
Library Services Page 89

Net Program Budget Change • Administration Services has increased $4,400 which includes inflation on
salaries and benefits of $10,100. Budget efficiencies of $3,300 are included here for professional development and mileage. Department adjustments include a one-time increase of $25,000 in legal fees for upcoming union negotiations. This is offset by the temporary COVID impacts of $26,500 for professional development/skills improvement, group training and staff and volunteer recognition.
• Customer Experience has increased $219,900. Inflation of $83,200 for personnel services and benefits is included in the budget. As well, operating impacts from capital include a reduction of $13,500 of part-time wages for the Central branch one desk conversion. $4,200 of efficiencies were found with budget reductions in mileage and repairs and maintenance for increased use of warranties. Department adjustments increase the budget by $139,700. The conversion of the Children’s Programmer part-time hours to a full-time position are included here at a net neutral cost. $73,000 of gapping savings budgeted in 2020 were permanently reduced from Innovation and Integration, but had been included in Customer Experience. Adjustments for non-union staff being paid lower in the band reduces the personnel budget by $22,400. Various adjustments include increases to the base budget for insurance costs, the removal of the transfer to reserve to offset reduced fine revenue of $17,000 and permanent reductions to fine revenue of $53,000 and registration fees of $10,000. Temporary COVID impacts add $14,700 to the budget with savings in part-time wages offsetting the increase to janitorial costs for increased cleaning.
• Innovation and Integration has decreased $(62,500) and includes inflation on salaries and benefits of $33,200. As well, $35,900 is added to the Collections Operations budget as an operating impact from the Sixteen Mile branch. Mileage reductions are included as a budget efficiency. Personnel services adjustments include the reduction of 1.0 FTEs for the Graphic Designer and Data Collections Assistant positions, but are offset by the $28,000 increase in transfer from the HIP reserve to operating for Information Oakville staff. The Alternative Services Supervisor being gapped for 6 months is included here as a temporary COVID impact.
Library Services Page 90

2021 Program Budget by Component – Net $10,214,400
• In 2021, the Library Services program’s total expenditures are $10,903,000 and total revenues are $ 688,600 resulting in a net budget of $ $10,214,400. The net change from the prior year $161,800 or 1.6%. The main drivers of the budget are noted in the details below:
• Personnel Services & Benefits is the largest cost component with $8.2 million representing 75.3% of total gross expenditures. Personnel costs have
decreased by $151,700. The net change is due to: o Inflation on salaries and benefits at $126,500. o The operating impact reduction of staffing costs of $13,500 or 0.4 FTE. o Net adjustments to personnel services costs reduce the budget by $2,700. This includes the conversion of 2 part-time Children’s Programmers to
full-time at a net neutral cost. Two part-time positions were also reduced permanently from the budget, 1.0 part-time FTE totaling $73,000 for the Graphic Designer and Database Collection Assistant positions. These changes reduced the gapping of $90,600 added to the budget in 2020 that were to be found during the year. $17,600 remains and will be found permanently during 2021.
Library Services Page 91

o Temporary COVID reductions of $262,000 for 2021 which include the gapping of the Alternative Services Supervisor for six months, as well as various part-time positions that will be held vacant to provide savings over the year, and help to offset the additional branch cleaning and janitorial expenses that are necessary to ensure the branches meet health standards.
• Materials and Supplies is the second largest component with $1.4 million which have increased by $19,900 which includes operating impacts from capital
of $35,900 for collection replacement costs at Sixteen Mile. Reallocations of budget dollars to Purchased Services offset the increase here, along with a temporary reduction of $800 to office supplies.
• Purchased Services have increased $194,100. This includes: o Net base budget adjustments of $47,600 which includes $25,000 of one-time additional legal fees for the contract negotiations that will begin in
2021. As well, the budget for insurance increased $5,800 along with various other adjustments to the base budget. o Budget Efficiencies of $9,400 for professional development/skills improvement, mileage and repairs and maintenance costs as staff become more
proactive on accessing available warranties on building equipment. o Temporary COVID impacts increasing the budget by $155,900-- $193,400 is for increased janitorial services costs for the branches, and is offset by
reductions to professional development/skills improvement, group training, staff and volunteer recognition, instructor and performer fees, programming and meal expense budgets.
• Internal Charges have not changed for 2021.
• Other Expenditures have decreased by $500 for the reduced collections agency costs due to the reduced circulation.
• Minor Capital & Transfers to Reserves have not changed for 2021.
• Activity Revenue is the largest revenue component which is mainly comprised of fines, admissions, room rentals, photocopier revenue and registration
fees. In 2021, revenues have decreased by $108,000 and includes:
o $63,000 permanent reduction in revenues-- $10,000 for registration fees due to the reduction in programs offered by the OPL that charge registration fees and $53,000 reduction in fine revenue as the OPL will not be charging fines on overdue materials.
o Temporary COVID Impacts of $39,200 which include $9,500 for registration fees due to decreased program offerings, $17,400 for room rental revenue and $18,100 for photocopier revenue.
• • Other Revenue increased by $11,000. The transfer form Halton Information Partners (HIP) increased by $28,000 as Information Oakville staff spend time
working on the Halton Newcomer InfoPods project, funded by Immigration, Refugees and Citizenship Canada. This is offset by the removal of the $17,000 transfer from the Development Reserve that was budgeted in 2020 to offset the reduction in fine revenue for the elimination of fines on Children’s print material.
• Grants consists of a Public Library Operating and Pay Equity grant from the Province of Ontario to assist in operational needs. The grant has remained relatively static for approximately 10 years at $182,300. As well, there is a grant to help fund the hiring of summer students to run the Summer Reading Program that is $6,700.
Library Services Page 92

2022 - 2023 Operating Budget Forecast
Library Services 2021 2022 2021 - 2022 2023 2022 - 2023
Requested Forecast Change Forecast Change Budget (%) (%)
Gross Expenditures By Service Administrative Services 821,700 841,600 2.4% 860,800 2.3% Customer Experience 6,285,000 6,395,200 1.8% 6,615,600 3.4% Innovation and Integration 3,796,300 3,944,700 3.9% 4,031,600 2.2% Community Engagement - - 0.0% - 0.0% Total Gross Expenditures 10,903,000 11,181,500 2.6% 11,508,000 2.9% Tax Levy By Service Administrative Services 639,400 659,300 3.1% 678,500 2.9% Customer Experience 6,153,300 6,216,000 1.0% 6,433,100 3.5% Innovation and Integration 3,421,700 3,566,900 4.2% 3,650,600 2.3% Community Engagement - - 0.0% - 0.0% Total Tax Levy 10,214,400 10,442,200 2.2% 10,762,200 3.1% Gross Expenditures By Type Personnel Services & Benefits 8,213,500 8,636,600 5.2% 8,917,000 3.2% Materials & Supplies 1,409,600 1,458,000 3.4% 1,486,500 2.0% Purchased Services 1,095,100 901,300 (17.7%) 918,600 1.9% Internal Charges 110,000 110,000 0.0% 110,000 0.0% Other Expenditures 14,300 14,800 3.5% 14,800 0.0% Minor Capital & Transfer To Reserves 60,500 60,800 0.5% 61,100 0.5% Total Expenses 10,903,000 11,181,500 2.6% 11,508,000 2.9% Revenues By Type Activity Revenue 281,700 332,400 18.0% 338,900 2.0% Internal Recoveries - - 0.0% - 0.0% Grants 189,000 189,000 0.0% 189,000 0.0% Other Revenue 217,900 217,900 0.0% 217,900 0.0% Total Revenues 688,600 739,300 7.4% 745,800 0.9% Tax Levy $10,214,400 $10,442,200 2.2% $10,762,200 3.1%
Library Services Page 93

2022 - 2023 Budget Forecast Highlights • The 2022 net budget is projected to increase by 2.2% or $227,800 and reflects inflationary increases to the cost of delivering services. As well, the Temporary
COVID impacts from the 2021 budget are reversed in the 2022 budget. 2022 capital impacts on operations reduce the budget by $27,600 and include the second year of operating savings of $13,500 for the Central Branch one desk conversion and $34,000 in operating savings for the vehicle purchase for OPL materials handling. These reductions are offset by the final year of the phase in of Collections increases for the new Sixteen Mile branch at $19,700.
• The 2023 net budget is projected to increase by 3.1% or $320,000 and reflects inflationary increases to the cost of delivering services. 2023 includes $47,400 of operating dollars for the Central Library Creation Hub.
2021 Recommended Capital Budget
The Oakville Public Library capital budget provides for facility asset replacements and service enhancements at Oakville’s library branches.
The Library Capital Replacement and Furniture and Equipment Replacement projects ensure building components, equipment, and furnishings remain in a state of good repair in order to support prescribed service levels, with the Glen Abbey Exterior Renovation and Incubator Library (OPL Express locations) projects aimed at expanding service and program offerings for customers. The Vehicle for Materials Handling project supports the growing demand of OPL services at branches and incubator spaces, and also provides for operating budget savings in 2022.
Capital Budget Operating Impacts Project Project Title Classification 2021 2021 71101901 Libraries Capital Replacement Infrastructure Renewal 22,000 71102103 Library Furniture and Equipment Infrastructure Renewal 81,000 71102104 Vehicle for Materials Handling Strategic Priorities 80,000 71102106 Incubator Libraries (Location TBD) Growth 66,300 71102107 Glen Abbey Library – Outdoor Space Strategic Priorities 321,000
TOTAL 570,300
Library Services Page 94

Program: Municipal Enforcement
Program Based Budget
2021 - 2023
Vision
• To promote livability, protect quality of life and maintain community standards through education, innovation and enforcement.
Mission
• To use industry best practices and legal guidelines to provide exceptional enforcement, parking, and licensing services through strategic planning, innovation and professionalism.
Municipal Enforcement Page 95
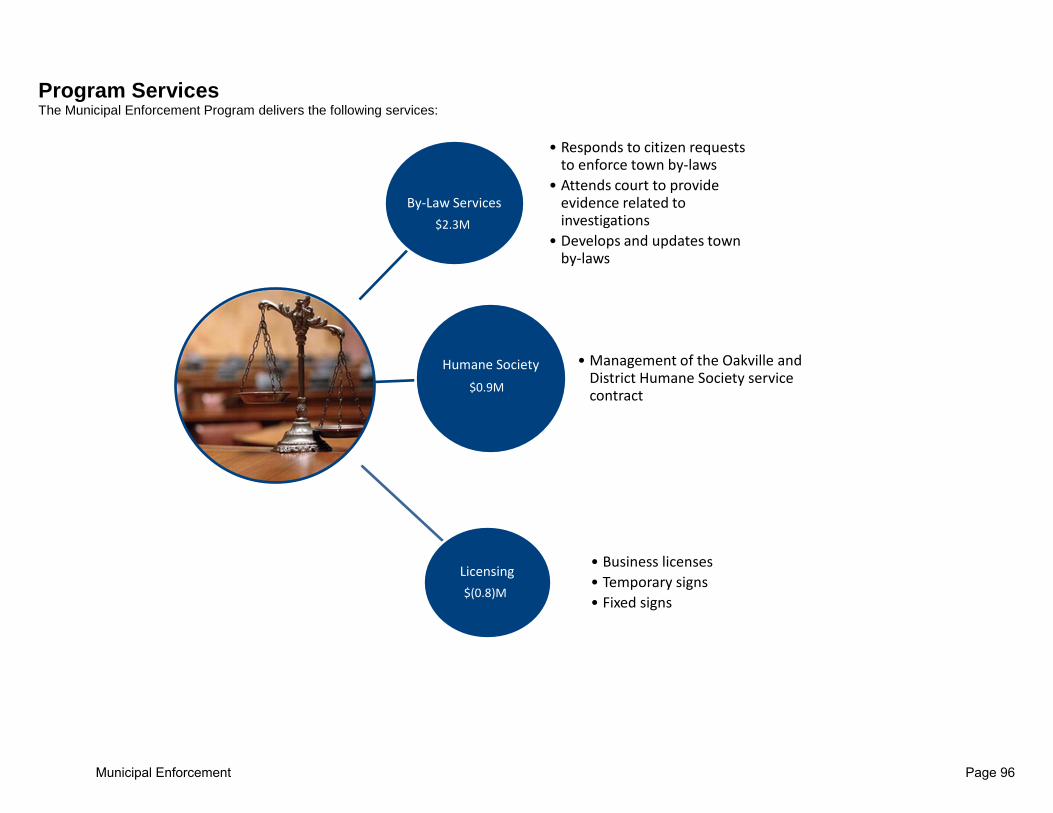
Program Services The Municipal Enforcement Program delivers the following services:
By-Law Services
• Responds to citizen requests to enforce town by-laws
• Attends court to provide evidence related to investigations
• Develops and updates town by-laws
Humane Society • Management of the Oakville and District Humane Society service contract
Licensing • Business licenses• Temporary signs• Fixed signs
$(0.8)M
$2.3M
$0.9M
$2.3M
Municipal Enforcement Page 96

2021 Program Key Initiatives
Livability• Support the Province and Regional governments COVID 19 pandemic, response protecting the community
through education and enforcement• support residents through proactive and reactive investigations addressing health and safety, nuissance,
property standards and consumer protection concerns.
Engaged Community• Consult residents and businesses for input in to the development/review of the noise, business licensing and lot
maintenance by-laws• Build positive community relationships by attending community events and communicating community
enforcement initiatives including motorcycle noise enforcement and parks patrols
Accountable Government• Continue to implement online and digital solutions to increase customer satisfaction and service efficiency• Implement opportunities to streamline licensing and permit approval processes
Environment• Promote anti-idling regulations through the use of social media, education and enforcement• Continue to support coexistence with wildlife as identified in the coyote education and response procedure
Mobility• Support transporation service level standards for taxi and transportation network companies through business
licensing • Enhance customer satisfaction and public saftey through tow truck and vehicle storage yard business licensing
Municipal Enforcement Page 97

Key Performance Indicators 1. Percentage of gross operating budget
2016 2017 2018 2019 2020 0.9% 1.0% 1.0% 1.1% 1.1%
Why Important: Monitors the cost of the program as a proportion of the total cost for the town. How Calculated: Gross program operating costs (excluding transfers to reserves and internal charges) / Gross town operating costs (excluding transfers to reserves and internal charges) 2017 is the first year the Program was separated on its own.
2. Percentage of total FTEs
2016 2017 2018 2019 2020 N/A 0.6% 0.7% 0.8% 0.8%
Why Important: Assesses the capacity of the program by examining the proportion of staff expertise against the total Town FTEs. How Calculated: Total program FTEs including part-time / Total town FTEs including part-time. 2017 is the first year the Program was separated on its own.
3.Average time to conclude an investigation
2016 2017 2018 2019 2020 IB = 41 days IL = 29 days
IB = 25 days IL = 26 days
IB = 27 days IL = 28 days
IB = 27 days IL = 23days
IB = 14 IL= 18
(November 9, 2020) Impacted by COVID-service level and response changes
Why Important: To continuously ensure the efficiency of investigations and quickly identify opportunities for improvement.
How Calculated: AMANDA report on the average time between the creation of investigative folder to the end of an investigation. IB= regulatory by-law investigations
IL= licensing by-law investigations
Municipal Enforcement Page 98

4.Number of yearly investigations 2016 2017 2018 2019 2020
IB = 3031 IL = 1164
Total: 4195
IB = 3360 IL = 969
Total: 4329
IB = 3583 IL = 996
Total: 4579
IB = 4002 IL = 639
Total: 4197
IB = 14,624 IL= 548 (includes COVID
enforcement) Total: 15,172
(November 9, 2020) Why Important: Understanding ongoing service demand allows us to monitor trends, predict resource requirements and strategically plan future enhancements. How Calculated: Number of IB’s and IL’s taken from AMANDA. Parks and COVID enforcement included in 2020, this is expected to continue in 2021.
IB= regulatory by-law investigations IL= licensing by-law investigations
5.Number of charges/penalty notices/orders issued yearly
2016 2017 2018 2019 2020 BG= 102 POA = 11
Orders =237 Total: 350
BG = 80 POA = 3
Orders =397 Total: 480
BG = 184 POA = 25
Orders = 537 Total: 746
BG = 513 POA = 33
Orders = 321 Total: 775
BG = 535 POA = 28
Orders= *185 Total = 748
(November 9, 2020) *Reduced due to business
licensing extension granted as a result of the COVID -19
pandemic Why Important: Issuing a penalty, in any form, means that a community standard has been ignored. Monitoring this KPI allows us to reflect on our regulations to ensure they remain current, while also helping us to understand future resource requirements. How Calculated: Estimate – AMANDA reporting under development BG = Administrative penalties POA = provincial offences tickets (Part 1 and 3) LM = Lot Maintenance PS= Property standards Note: LM order introduced June 2017 and licensing and zoning order for parking infractions introduced in 2016.
Municipal Enforcement Page 99

Staffing Overview
Program: Municipal Enforcement Services
2020 2021 2021 2021 2021 Net
Approved Adjustments
and Budget Growth and Total Change Services/Activities: FTE Reallocations Efficiencies Capital FTE 2021 vs 2020
Humane Society 0.0 0.0 0.0 Licensing 1.3 1.3 0.0 By-law Services 11.2 11.2 0.0
Total Municipal Enforcement Services 12.5 0.0 0.0 0.0 12.5 0.0 For 2021, the Municipal Enforcement complement remains unchanged at 12.5 FTE’s.
Program Services Budget Overview
Overall, Municipal Enforcement has a requested budget of $2,329,900 which is an increase of $922,300 or 65.5%. Impacts resulting from the COVID pandemic required a budget adjustment of $1,043,500 for Municipal Enforcement. The department will add eight temporary Mobile Compliance Officers for 2021 to assist with the education and patrol to ensure all provincial guidelines are followed. Based on recent volume trends, various license budgets are reduced.
By-Law Services enforces most of the town’s regulatory by-laws and represents the largest portion of the budget at $2.3 million. Licensing provides the enforcement of business licenses and provides a recovery of $0.8 million. Oakville Humane Society with a contract budget of $0.9 million is responsible for animal control services. Licensing services reflects an increase in revenue due to the transfer of permits for signs and advertising boards from the Infrastructure Planning program.
2020 2021 2021 2021 2021 $ Change % Change 2021 2021 $ Change % Change
Restated Infl & Adj Capita l/Growth Budget Base from from Temporary Requested from from
Budget Impacts & Service Impacts Efficiencies Budget 2020 2020 COVID Budget 2020 2020
Municipal Enforcement
By-law Services 1,435,400 20,000 - (500) 1,454,900 19,500 1.4% 832,000 2,286,900 851,500 59.3%
Humane Society 836,000 16,700 - - 852,700 16,700 2.0% - 852,700 16,700 2.0%
Licensing (864,200) (180,800) 23,400 - (1,021,600) (157,400) -18.2% 211,500 (810,100) 54,100 6.3%
Total Municipal Enforcement 1,407,200 (144,100) 23,400 (500) 1,286,000 (121,200) -8.6% 1,043,500 2,329,500 922,300 65.5%
Municipal Enforcement Page 100

Net Program Budget Change • By-law Services have increased by $851,500. The budget has been adjusted for
inflationary impacts for salaries and benefits and minimal increases for uniforms. To assist with enforcing provincial mandated COVID initiatives, eight temporary Mobile Compliance Officers are added to the complement for 2021. A budget of $832,000 is added for personnel costs and additional necessary supplies including uniforms, communication and rental vehicles. By-Law Services has also included $2,500 for temporary COVID reductions. Reductions have been added to meals and registration and filing fees.
• Licensing has increased by 54,100. In addition to inflation adjustment to personnel, the budget includes increases for contract services. COVID reductions are included for a reduction to part-time personnel and general equipment budgets. Based on current trend, the revenue licensing budgets for taxis (driver and owner), TNC, property maintenance, contractors and arborist licenses are decreased for anticipated COVID related impact.
• Humane Society contract for animal control services increased by $16,700 in line with inflation.
0
100,000
200,000
300,000
400,000
500,000
600,000
700,000
800,000
900,000
HumaneSociety
Licensing By-law Services
Net…
Municipal Enforcement Page 101

2021 Program Budget by Component– Net $ 2,329,900
2021 Expenditures $3.7M 2021 Revenues $1.3M
The Municipal Enforcement program’s total direct operating expenditures are $3,650,000 and anticipated revenues are $ 1,320,100, which results in a net overall budget of $ 2,329,900. Program changes are described below:
• Temporary COVID Impacts of $1,043,500 have been added for Municipal Enforcement. This includes temporary reductions to part-time, general equipment, meals and registration and filing fees. However, based on current trends and anticipated second wave impacts, licensing revenue is reduced by $216,000. In addition, to manage the pandemic requirements an increase to education and enforcement is needed resulting in an increase of eight temporary Mobile Compliance Officers to the complement. The budget for personnel and equipment is $832,000.
• Personnel Services & Benefits is the largest component of the budget and represents 44% of gross expenditures. In 2021, personnel costs have decreased by $159,700. In prior years, the incremental costs for the re-evaluation of the Mobile Compliance Officers was budgeted in Personnel Services. This has changed for 2021 and the expense is included with internal expenses. The offsetting recovery is budgeted in Parking.
• Purchased Services is the second largest expense budget and represents 28% of gross expenditures. In 2021, the budget has decreased by $4,200 with the most significant driver being a 2% inflation increase to the Oakville Milton Humane Society’s grant. Additional budget increases have been included for contract services and uniforms.
• Internal Charges has increased by $1,018,000. This includes the temporary budget for the eight Mobile Compliance Officers and the incremental cost for the change to the Officers rate. This budget was previously included in Personnel Services.
• Activity Revenue partially offsets department expenses and includes various fees for sign permits, by-law fines and administrative penalties. In 2021, the budget has decreased by $16,900. A 1.7% revenue adjustment is included for all licenses however due to anticipated second wave of the pandemic a reduction of $211,500 is included for certain licenses where impact is anticipated.
Personnel Services & Benefits,
$1,618,200
Materials & Supplies, $50,600
Purchased Services, $918,300
Other Expenditures,
$20,600
Minor Capital & Transfer to
Reserves, $24,300
Activity Revenue,
$1,320,100
Municipal Enforcement Page 102
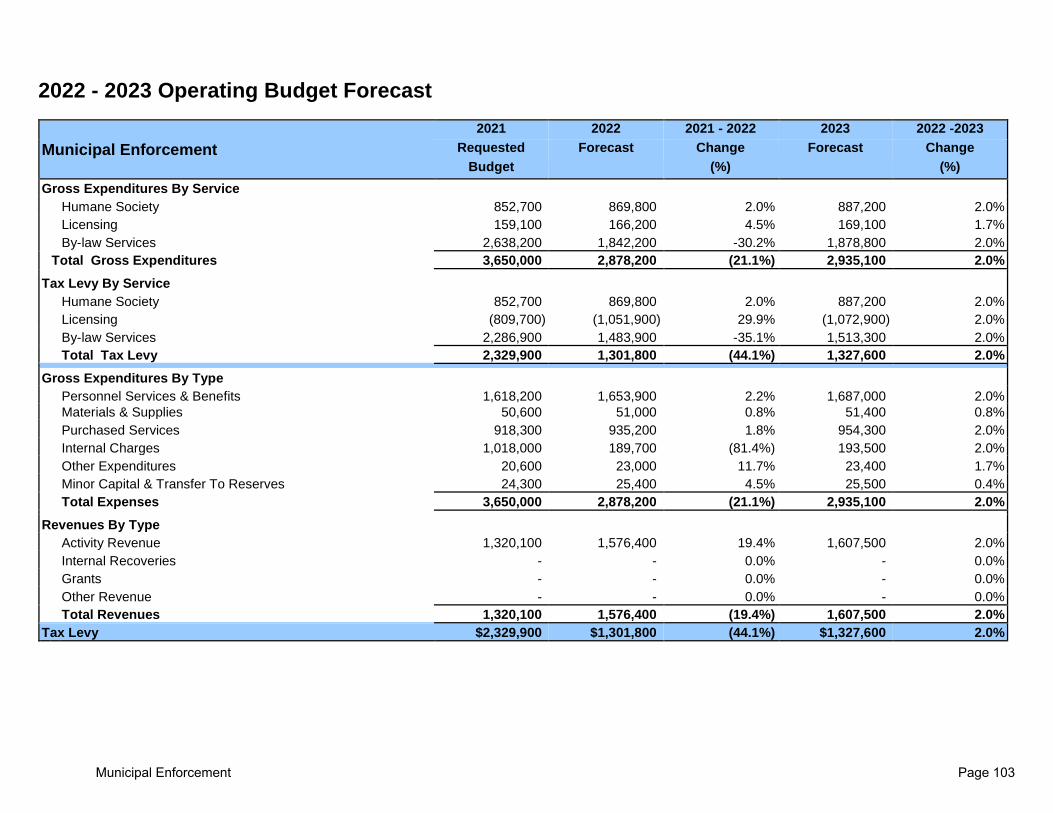
2022 - 2023 Operating Budget Forecast
Municipal Enforcement 2021 2022 2021 - 2022 2023 2022 -2023
Requested Forecast Change Forecast Change Budget (%) (%)
Gross Expenditures By Service Humane Society 852,700 869,800 2.0% 887,200 2.0% Licensing 159,100 166,200 4.5% 169,100 1.7% By-law Services 2,638,200 1,842,200 -30.2% 1,878,800 2.0% Total Gross Expenditures 3,650,000 2,878,200 (21.1%) 2,935,100 2.0% Tax Levy By Service Humane Society 852,700 869,800 2.0% 887,200 2.0% Licensing (809,700) (1,051,900) 29.9% (1,072,900) 2.0% By-law Services 2,286,900 1,483,900 -35.1% 1,513,300 2.0% Total Tax Levy 2,329,900 1,301,800 (44.1%) 1,327,600 2.0% Gross Expenditures By Type Personnel Services & Benefits 1,618,200 1,653,900 2.2% 1,687,000 2.0% Materials & Supplies 50,600 51,000 0.8% 51,400 0.8% Purchased Services 918,300 935,200 1.8% 954,300 2.0% Internal Charges 1,018,000 189,700 (81.4%) 193,500 2.0% Other Expenditures 20,600 23,000 11.7% 23,400 1.7% Minor Capital & Transfer To Reserves 24,300 25,400 4.5% 25,500 0.4% Total Expenses 3,650,000 2,878,200 (21.1%) 2,935,100 2.0% Revenues By Type Activity Revenue 1,320,100 1,576,400 19.4% 1,607,500 2.0% Internal Recoveries - - 0.0% - 0.0% Grants - - 0.0% - 0.0% Other Revenue - - 0.0% - 0.0% Total Revenues 1,320,100 1,576,400 (19.4%) 1,607,500 2.0% Tax Levy $2,329,900 $1,301,800 (44.1%) $1,327,600 2.0%
Municipal Enforcement Page 103

2022 - 2023 Budget Forecast Highlights • The 2022 net budget is projected to decrease by (44.1%) or $ (1,028,100) and includes inflationary increases to the cost of delivering services. For 2022, the
budget includes revenue increase and reduction for the eight temporary Mobile Compliance Officer as 2021 COVID impacts are removed. • The 2023 net budget is projected to increase by 2.0% or $ 25,800 and reflects inflationary increases to the cost of delivering services.
2021 Recommended Capital Budget
The capital budget provides funds for a review of the Noise By-law, to develop an online option for licensing, and to provide marked town vehicles to municipal standards investigators to address concerns surrounding officer safety, productivity and accountability while providing opportunities for increased efficiency and community engagement. Capital Budget Operating Impacts Project Project Title Classification 2021 2021 53612101 Noise By-law Review Strategic Priorities 76,000 53612102 Online Licensing and Self Serve Strategic Priorities 51,000 53612103 Municipal Enforcement Vehicles Strategic Priorities 151,000 23,400
TOTAL 278,000 23,400
Municipal Enforcement Page 104

test
Program: ServiceOakville
Program Based Budget
2021 - 2023
Vision
• To deliver citizen focused services that combine people, processes and technology to maximize value to the public.
Mission
• To help the town achieve its goals and objectives by delivering services valued by the organization and the community; providing leadership in the implementation of the town’s customer service strategy by working with other departments; and delivering accessible, integrated customer service solutions to the public.
Page 105

test
ServiceOakville
Program Services The program enhances the customer experience by:
2021 Program Key Initiatives
ServiceOakville
• Providing live answers during the town's business hours
• Effectively managing service requests to applicable business area
• Leveraging the Customer Relationship Management application to escalate outstanding items appropriately
Engaged Community• Modernize the platform and framework for future expansion and an enhanced customer experience.• Work collaboratively with department partners to improve and transform the customer experience with on-line
services.
$1.0M
Page 106
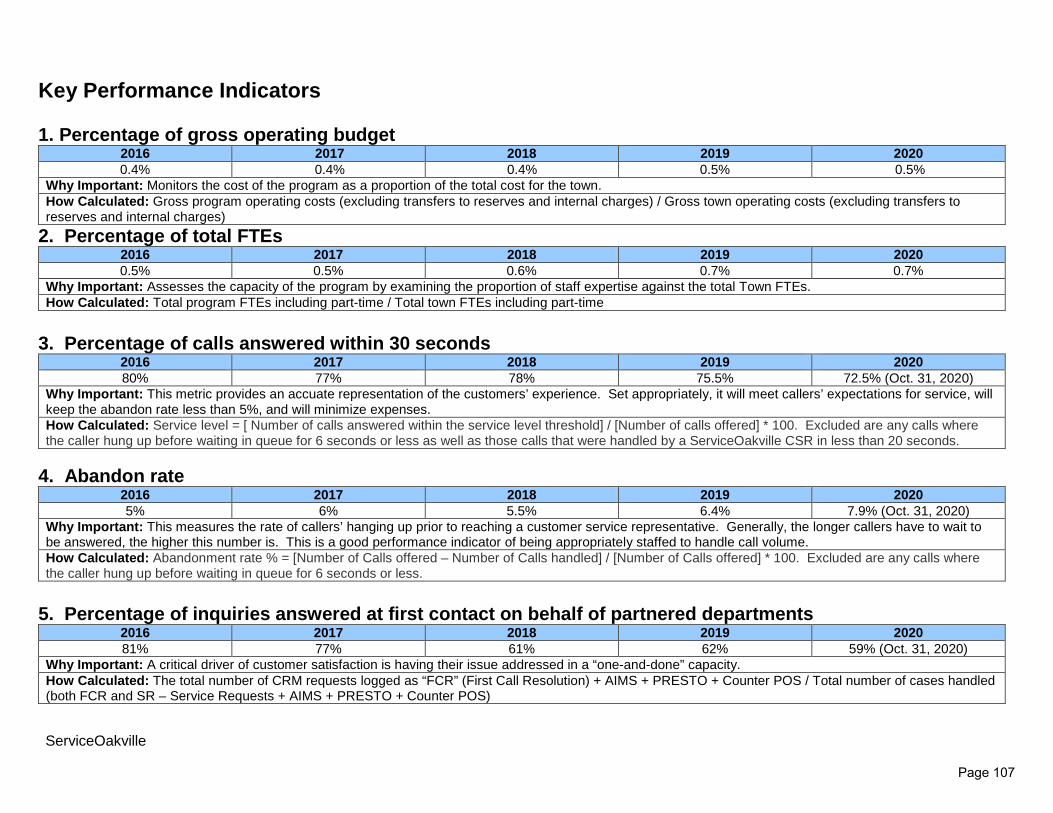
test
ServiceOakville
Key Performance Indicators 1. Percentage of gross operating budget
2016 2017 2018 2019 2020 0.4% 0.4% 0.4% 0.5% 0.5%
Why Important: Monitors the cost of the program as a proportion of the total cost for the town. How Calculated: Gross program operating costs (excluding transfers to reserves and internal charges) / Gross town operating costs (excluding transfers to reserves and internal charges)
2. Percentage of total FTEs 2016 2017 2018 2019 2020 0.5% 0.5% 0.6% 0.7% 0.7%
Why Important: Assesses the capacity of the program by examining the proportion of staff expertise against the total Town FTEs. How Calculated: Total program FTEs including part-time / Total town FTEs including part-time
3. Percentage of calls answered within 30 seconds
2016 2017 2018 2019 2020 80% 77% 78% 75.5% 72.5% (Oct. 31, 2020)
Why Important: This metric provides an accuate representation of the customers’ experience. Set appropriately, it will meet callers’ expectations for service, will keep the abandon rate less than 5%, and will minimize expenses. How Calculated: Service level = [ Number of calls answered within the service level threshold] / [Number of calls offered] * 100. Excluded are any calls where the caller hung up before waiting in queue for 6 seconds or less as well as those calls that were handled by a ServiceOakville CSR in less than 20 seconds.
4. Abandon rate
2016 2017 2018 2019 2020 5% 6% 5.5% 6.4% 7.9% (Oct. 31, 2020)
Why Important: This measures the rate of callers’ hanging up prior to reaching a customer service representative. Generally, the longer callers have to wait to be answered, the higher this number is. This is a good performance indicator of being appropriately staffed to handle call volume. How Calculated: Abandonment rate % = [Number of Calls offered – Number of Calls handled] / [Number of Calls offered] * 100. Excluded are any calls where the caller hung up before waiting in queue for 6 seconds or less.
5. Percentage of inquiries answered at first contact on behalf of partnered departments
2016 2017 2018 2019 2020 81% 77% 61% 62% 59% (Oct. 31, 2020)
Why Important: A critical driver of customer satisfaction is having their issue addressed in a “one-and-done” capacity. How Calculated: The total number of CRM requests logged as “FCR” (First Call Resolution) + AIMS + PRESTO + Counter POS / Total number of cases handled (both FCR and SR – Service Requests + AIMS + PRESTO + Counter POS)
Page 107

test
ServiceOakville
Staffing Overview Program: ServiceOakville 2020 2021 2021 2021 2021 Net Approved Adjustments and Budget Growth and Total Change Services/Activities: FTE Reallocations Efficiencies Capital FTE 2021 vs 2020
ServiceOakville 11.8 11.8 0.0 Total ServiceOakville 11.8 0.0 0.0 0.0 11.8 0.0 Overall, the total staff complement for this program is 11.8 FTEs, which is unchanged from 2020.
Program Services Budget Overview
The ServiceOakville program has a net budget of $1,021,600, which provides the cost to deliver a one-window approach to customer service that tracks and handles walk-in, email and telephone inquiries on behalf of several programs including Road and Works, Parks and Open Space, Municipal Enforcement, Parking Operations, Development Engineering, Engineering and Construction and Tourism. Staff are equipped and trained to answer inquiries on behalf of partner departments and log all service requests through the town’s Customer Relationship Management (CRM) application. This application is integrated into the town’s work order management system to provide efficient and effective service delivery to residents. The 2021 budget has increased $18,600 or 1.9% primarily due to inflationary adjustments for personnel. Expense reallocations to align current program requirements were also completed.
2020 2021 2021 2021 2021 $ Change % Change 2021 2021 $ Change % Change
Restated Infl & Adj Capita l/Growth Budget Base from from Temporary Requested from from
Budget Impacts & Service Impacts Efficiencies Budget 2020 2020 COVID Impacts Budget 2020 2020
Service OakvilleService Oakvil le 1,003,000 19,200 -100 1,022,100 19,100 1.9% -500 1,021,600 18,600 1.9%
Total Service Oakville 1,003,000$ 19,200$ -$ 100-$ 1,022,100$ 19,100$ 1.9% 500-$ 1,021,600$ 18,600$ 1.9%
Page 108

test
ServiceOakville
Net Program Budget Change • Service Oakville has increased by $18,600. This includes
inflationary adjustments for personnel, along with expense reallocations to align current trends.
Page 109

test
ServiceOakville
2021 Program Budget by Component – Net $1,021,600
The ServiceOakville program’s total expenditures are $1,196,600; total revenues are $175,000, resulting in a net budget of $1,021,600. In 2021, the budget increased $18,600 or 1.9%. The main components of the budget are:
• Personnel Services & Benefits represents 97% of the total gross expenditures. In 2021, personnel costs increased $25,900 as a result of compensatory and inflationary increases.
• Internal Recoveries represents 98% of the total revenue, which have increased by $3,400 for inflation.
Page 110

test
ServiceOakville
2022 - 2023 Operating Budget Forecast
Service Oakville 2021 2022 2021-2022 2023 2022-2023
Requested Forecast Change Forecast Change Budget (%) (%)
Gross Expenditures By Service Service Oakville 1,196,600 1,224,000 2.3% 1,249,900 2.1% Total Gross Expenditures 1,196,600 1,224,000 2.3% 1,249,900 2.1% Tax Levy By Service Service Oakville 1,021,600 1,044,000 2.2% 1,066,300 2.1% Total Tax Levy 1,021,600 1,044,000 2.2% 1,066,300 2.1%
Gross Expenditures By Type Personnel Services & Benefits 1,168,300 1,193,300 2.1% 1,218,800 2.1% Materials & Supplies 6,600 6,700 1.5% 6,800 1.5% Purchased Services 20,700 23,000 11.1% 23,300 1.3% Internal Charges - - 0.0% - 0.0% Other Expenditures - - 0.0% - 0.0% Minor Capital & Transfer To Reserves 1,000 1,000 0.0% 1,000 0.0% Total Expenses 1,196,600 1,224,000 2.3% 1,249,900 2.1% Revenues By Type Activity Revenue 2,000 3,500 75.0% 3,600 2.9% Internal Recoveries 173,000 176,500 2.0% 180,000 2.0% Grants - - 0.0% - 0.0% Other Revenue - - 0.0% - 0.0% Total Revenues 175,000 180,000 2.9% 183,600 2.0% Tax Levy $1,021,600 $1,044,000 2.2% $1,066,300 2.1%
2022 - 2023 Budget Forecast Highlights • The 2022-2023 forecasted budgets reflects inflationary increases to the cost of service delivery.
Page 111

test
ServiceOakville
2021 Recommended Capital Budget The Salesforce CRM (Customer Relationship Management) was installed in late 2017 and enhanced in 2018. The 2021 budget includes capital funding for an upgrade called Lightning, which will improve efficiencies in order to better respond to resident and business needs.
Capital Budget Operating Impacts Project Project Title Classification 2021 2021 36101906 Salesforce Upgrade and Enhancement Infrastructure Renewal 221,000
TOTAL 221,000
Page 112

test
Program: Political Governance
Program Based Budget
2021 - 2023
Vision• To be the most livable town in Canada.
Mission
• We create and preserve Canada’s most livable community that enhances the natural, cultural, social and economic environments. We achieve this by continuously improving programs and services that are both accessible and environmentally and fiscally sustainable.
• We are highly valued and widely celebrated due to the innovative and outstanding way we satisfy the needs of our residents, businesses and employees. As a result, the process is as fulfilling as the outcome.
• We ensure our staff receives the same level of respect, commitment and caring that they are expected to deliver to the community.
Page 113

test
Political Governance
Program Services Political Governance provides activities through the following services:
Mayor and Council,
Secretariat Services
• Strategic planning• Establishing internal
controls and policy• Representing public
interest
Council and Committee
Services
• Meeting services to Council and its boards and committees
• Implementation of policies and procedures
Elections• Administration of the
municipal election process
Print and Services
• Centralized print operations
• Internal and external distribution of all non-electronic mail for the corporation
$1.8M
$0.9M
$0.5M
$0.6M
Page 114

test
Political Governance
2021 Program Key Initiatives
Engaged Community• The delegation process allows citizens to address Council on issues and meetings have been made available to
participants electronically and can be viewed live on YouTube. Agendas and minutes are also available on the website.
Accountable Government• Policies and procedures are clearly set out, regularly reviewed and updated and accessible.• Time spent in Closed Session of Council is reported annually.• The Municipal Ombudsman is available to investigate, in an independent manner, decisions and
recommendations made and acts of the administration of the town and local boards.• The closed meeting investigator is available to investigate complaints about closed meetings, should there be
any.• The Integrity Commissioner is available to conduct inquiries into requests from council, a member of council or
local board, or a member of the public about whether a member of council or local board has contravened the code of conduct.
Environment• Access to electronic agendas and minutes and meetings reduces requirement to print copies and travel to
attend meetings.
Page 115

test
Political Governance
Key Performance Indicators 1. Percentage of gross operating budget
2016 2017 2018 2019 2020 1.5% 1.5% 1.9% 1.5% 1.5%
Why Important: Monitors the cost of the program as a proportion of the total cost for the town. How Calculated: Gross program operating costs (excluding transfers to reserves and internal charges) / Gross town operating costs (excluding transfers to reserves and internal charges).
2. Percentage of total FTEs
2016 2017 2018 2019 2020
0.8% 0.7% 0.7% 0.7% 0.7% Why Important: Assesses the capacity of the program by examining the proportion of staff expertise against the total Town FTEs. How Calculated: Total program FTEs including part-time / Total town FTEs including part-time.
3. Percentage of meeting time spent in open session
2016 2017 2018 2019 2020 90.0% 96.1% 94.8% 88.3% 80.4% (as of October 31,
2020) Why Important: Monitors transparency in terms of time spent in closed session of Council. How Calculated: Total number of minutes spent in meetings/ total number of minutes spent in open session in camera.
Page 116

test
Political Governance
Staffing Overview
Program: Political Governance 2020 2021 2021 2021 2021 Net Approved Adjustments and Budget Growth and Total Change Services/Activities: FTE Reallocations Efficiencies Capital FTE 2021 vs 2020
Mayor and Council and Secretariat 0.0 0.0 0.0 Council and Committee Services 7.5 (1.0) (1.0) 5.5 (2.0) Elections 0.0 0.0 0.0 Print and Mail Services 4.3 0.5 (1.0) 3.8 (0.5)
Total Political Governance 11.8 (0.5) (2.0) 0.0 9.3 (2.5)
For 2021, the total complement for Political Governance was reduced by 2.5 FTE and the 9.3 FTE. The changes to the department include:
- Due to internal changes efficiencies were recommended and the department reduced the complement by 1.0 FTE from Mail Services and 1.0 FTE from Council and Committee.
- An internal vacant position within Administration was redeployed to Regulatory Services. - In prior years, the Manager of Elections and Special Programs was split between Political Governance and Regulatory Services. It was determined, the split
was not required and the complement is part of Regulatory Services. This reduced the complement within Political Governance by 0.5 FTE.
Program Services Budget Overview
In 2021, the Political Governance program decreased by ($146,400) or -3.7% resulting in a net total budget of $3,792,400. This decrease is mainly driven by a reallocation to the departmental staffing model and has resulted in personnel efficiencies. Further temporary COVID reduction are included for professional fees and office supplies.
2020 2021 2021 2021 2021 $ Change % Change 2021 2021 $ Change % Change
Restated Infl & Adj Capita l/Growh
Budget Base from from Temporary Requested from from
Budget Impacts & Service Efficiencies Budget 2020 2020 COVID Budget 2020 2020
Political GovernanceMayor and Council and Secretariat 1,783,200 8,400 - - 1,791,600 8,400 0.5% - 1,791,600 8,400 0.5%
Council and Committee Services 1,080,900 (103,200) - (112,800) 864,900 (216,000) -20.0% (2,500) 862,400 (218,500) -20.2%
Election 450,000 43,600 - - 493,600 43,600 9.7% - 493,600 43,600 9.7%
Print Centre/Mail Services 624,700 94,100 - (74,000) 644,800 20,100 3.2% - 644,800 20,100 3.2%
Total Political Governance 3,938,800 42,900 - (186,800) 3,794,900 (143,900) -3.7% (2,500) 3,792,400 (146,400) -3.7%
Page 117

test
Political Governance
The Mayor and Council and Secretariat represents the largest portion of the budget at $1.8 million which are the costs for governance responsibilities including strategic planning, ensuring accountability and transparency, financial integrity and representing public interests. Council and Committee Services is the second largest portion at $0.9 million which represents costs to perform Council/committee meeting services and facilitate the implementation of policies and procedures. Other services include Election at $0.5 million and Print Centre and Mail Services at $0.6 million.
Page 118

test
Political Governance
(250,000)
(200,000)
(150,000)
(100,000)
(50,000)
-
50,000
100,000
Mayor andCouncil andSecretariat
Council andCommittee
Services
Election PrintCentre/Mail
Services
Net Change
Net Program Budget Change • Mayor and Council and Secretariat has increased by $8,400
due to inflationary and contractual increases for personnel mitigated with a decrease to office supplies, corporate communication and internet.
• Council and Committee has decreased by ($218,500). This decrease is mainly due to personnel efficiencies which resulted in the reduction of 1.0 FTR. Reductions are included for professional fees, mileage and accessibility costs.
• Election has increased by $43,600. Although 2020 is a non-election year, budgets were adjusted for contract services as staff prepare for the 2021 election. The current level of contribution to the reserve has a budget increase of $8,600.
• Print Centre/Mail Services has increased by $20,100. Increases for personnel, postage and contract services are offset with the efficiencies recommended and resulted in a reduction of 1.0 FTE.
Page 119

test
Political Governance
2021 Program Budget by Component – Net $3,792,400
2021 Expenditures $3.8M 2021 Revenue $0.0M
In 2021, the Political Governance program’s total expenditures is expected to be $3,803,200 with a total revenues of $10,800, for a net budget of $3,792,400. The net change from the prior year is ($146,400) or -3.7%. The main drivers for these changes are noted below:
• COVID reductions for professional fees and office supplies totaling $2,500 are included for 2021. • Personnel Services & Benefits is the largest cost component of the budget at $2.6 million, representing 69% of the total gross expenditures. In 2021
personnel costs have decreased by $188,300. The budget includes inflationary and contractual increases which are offset with the reduction of 2.0 FTE. The complement was reduced due to recommended departmental efficiencies.
• Purchased Services is the second largest expense component and represents 16% of the total expenses budgeted. In 2021 purchased services has increased by $30,100. This is mainly a result of increases to contracted services required for the election which is partially offset with reduction for skills improvement, mileage, internet, and corporate communication.
Personnel Services & Benefits,
$2,608,800
Materials & Supplies, $134,700
Purchased Services, $596,300
Other Expenditures,
$13,000
Minor Capital & Transfer to Reserves, $450,400
Activity Revenue, $11,600
Other Revenue, $0
Page 120

test
Political Governance
• Minor Capital & Transfers to Reserves is budgeted to increased mainly due to increases for the election. For 2021 the reserve transfer has increased by $8,600.
• Materials & Supplies is budgeted to be at $134,700 and has increased by $2,700 compared to 2020 budget. The increase is for postage and courier fees for the mailroom.
• Other Expenditures will decrease by $300 for a total budget of $13,000. The decrease is for accessibility costs. • Revenues at $10,800 has a budget decrease of $800 for miscellaneous recoveries.
Page 121
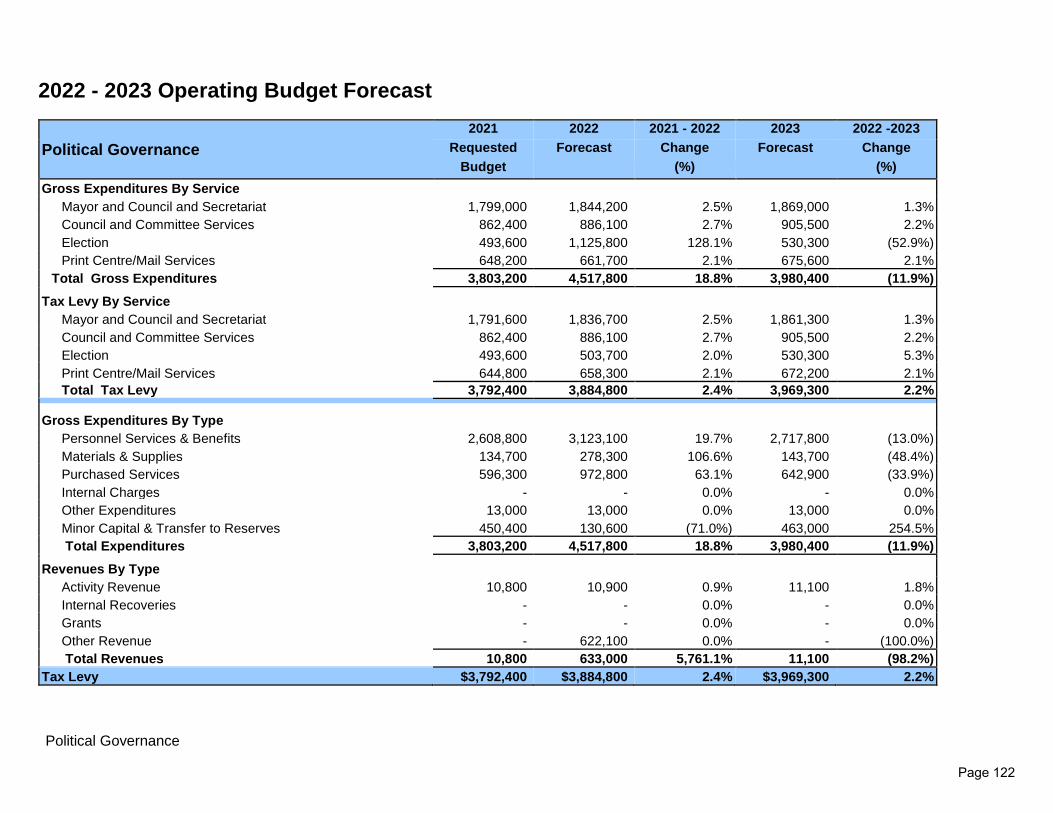
test
Political Governance
2022 - 2023 Operating Budget Forecast
Political Governance 2021 2022 2021 - 2022 2023 2022 -2023
Requested Forecast Change Forecast Change Budget (%) (%)
Gross Expenditures By Service Mayor and Council and Secretariat 1,799,000 1,844,200 2.5% 1,869,000 1.3% Council and Committee Services 862,400 886,100 2.7% 905,500 2.2% Election 493,600 1,125,800 128.1% 530,300 (52.9%) Print Centre/Mail Services 648,200 661,700 2.1% 675,600 2.1% Total Gross Expenditures 3,803,200 4,517,800 18.8% 3,980,400 (11.9%) Tax Levy By Service Mayor and Council and Secretariat 1,791,600 1,836,700 2.5% 1,861,300 1.3% Council and Committee Services 862,400 886,100 2.7% 905,500 2.2% Election 493,600 503,700 2.0% 530,300 5.3% Print Centre/Mail Services 644,800 658,300 2.1% 672,200 2.1% Total Tax Levy 3,792,400 3,884,800 2.4% 3,969,300 2.2% Gross Expenditures By Type Personnel Services & Benefits 2,608,800 3,123,100 19.7% 2,717,800 (13.0%) Materials & Supplies 134,700 278,300 106.6% 143,700 (48.4%) Purchased Services 596,300 972,800 63.1% 642,900 (33.9%) Internal Charges - - 0.0% - 0.0% Other Expenditures 13,000 13,000 0.0% 13,000 0.0% Minor Capital & Transfer to Reserves 450,400 130,600 (71.0%) 463,000 254.5% Total Expenditures 3,803,200 4,517,800 18.8% 3,980,400 (11.9%) Revenues By Type Activity Revenue 10,800 10,900 0.9% 11,100 1.8% Internal Recoveries - - 0.0% - 0.0% Grants - - 0.0% - 0.0% Other Revenue - 622,100 0.0% - (100.0%) Total Revenues 10,800 633,000 5,761.1% 11,100 (98.2%) Tax Levy $3,792,400 $3,884,800 2.4% $3,969,300 2.2%
Page 122

test
Political Governance
2022 - 2023 Budget Forecast Highlights • The 2022 net budget is projected to increase by 2.4% or $ 92,400 primarily due to inflationary costs adjustments. The budget also includes the $2,500
increase for COVID reductions made to the 2021 budget. • The 2023 budget is increasing by $ 84,500 or 2.2% which reflects inflationary increases to the cost of delivering services.
Page 123

Page 124

test
Program: Strategic Policy and Communications
Program Based Budget
2021 - 2023
Vision
• To be recognized leaders in providing high-quality strategic advice, communications and customer service programs and services that serve to engage and inform the community, our stakeholders and employees.
Mission
• To provide corporate leadership by creating and maintaining an effective strategic framework to help the town achieve its strategic goals and objectives, support accessible and responsive communications to the community, and support corporate and community climate change actions.
Page 125

test
Strategic Policy and Communications
Program Services The Strategy, Policy & Communications program provides the following services on behalf of the corporation and to client departments:
Corporate Communications
Climate Action
Strategy & Policy
• Development, governance and support of town’s website
• Supports Council’s vision to engage and serve all stakeholders, including staff and the community
$1.0M
$0.9M
$0.6M
• Develop and implement Climate Action Strategy
• Provide analysis
and development of corporate strategy and policies
Page 126
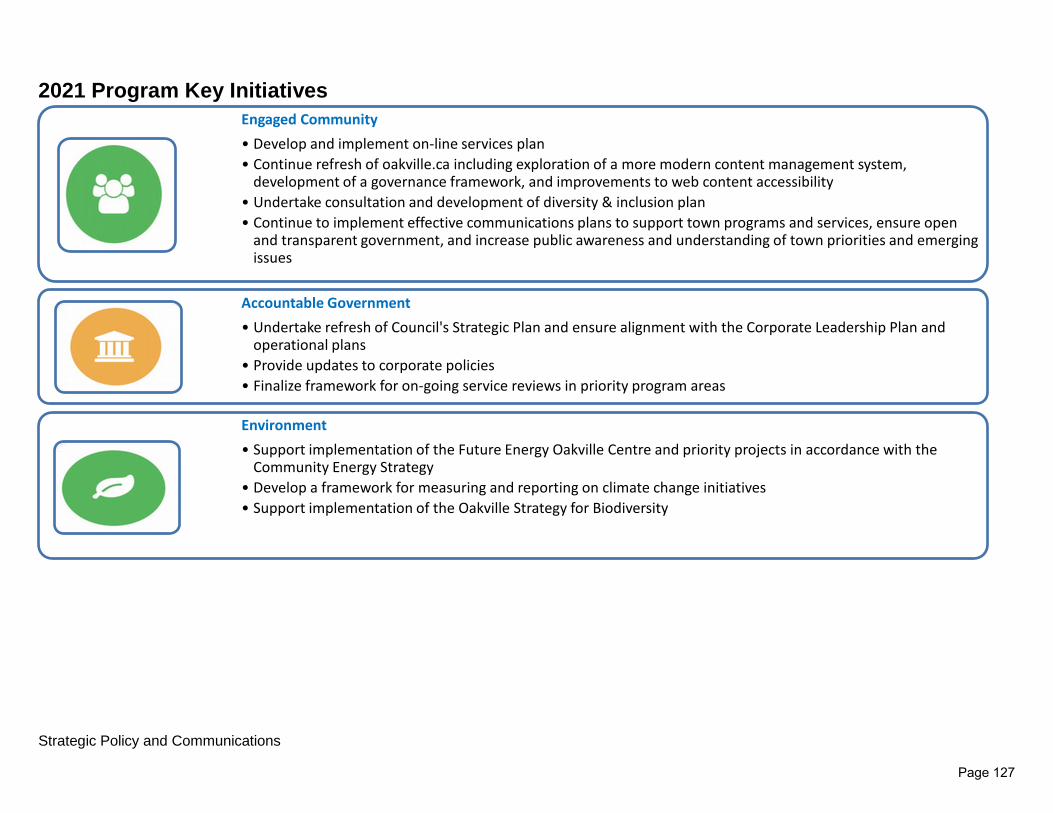
test
Strategic Policy and Communications
2021 Program Key Initiatives
Engaged Community• Develop and implement on-line services plan• Continue refresh of oakville.ca including exploration of a more modern content management system,
development of a governance framework, and improvements to web content accessibility • Undertake consultation and development of diversity & inclusion plan• Continue to implement effective communications plans to support town programs and services, ensure open
and transparent government, and increase public awareness and understanding of town priorities and emerging issues
Accountable Government• Undertake refresh of Council's Strategic Plan and ensure alignment with the Corporate Leadership Plan and
operational plans• Provide updates to corporate policies• Finalize framework for on-going service reviews in priority program areas
Environment• Support implementation of the Future Energy Oakville Centre and priority projects in accordance with the
Community Energy Strategy• Develop a framework for measuring and reporting on climate change initiatives• Support implementation of the Oakville Strategy for Biodiversity
Page 127

test
Strategic Policy and Communications
Key Performance Indicators 1. Percentage of gross operating budget
2016 2017 2018 2019 2020 1.0% 1.0% 1.0% 0.5% 0.8%
Why Important: Monitors the cost of the program as a proportion of the total cost for the town. How Calculated: Gross program operating costs (excluding transfers to reserves and internal charges) / Gross town operating costs (excluding transfers to reserves and internal charges).
2. Percentage of total FTEs
2016 2017 2018 2019 2020 0.6% 0.6% 0.6% 0.6% 0.6%
Why Important: Assesses the capacity of the program by examining the proportion of staff expertise against the total Town FTEs. How Calculated: Total program FTEs including part-time / Total town FTEs including part-time. 3. Percentage of citizens satisfied with the amount of information received by the town
2016 2017 2018 2019 2020 86%( 2015 survey) 84% (2017 survey) 84% (2017 survey) 80% (2019 survey) 80% (2019 survey)
Why Important: To track overall citizen satisfaction with town performance, identify merging issues, and help set strategic priorities for the future. Public engagement is a key component of open and transparent governance; it helps us to develop and deliver quality programs and services; and is important to Oakville achieving its vision of being the most livable town in Canada. How Calculated: To gather the opinions of local residents in the most comprehensive and efficient way, Pollara Strategic Insights conducted a 20-minute telephone survey among 808 randomly-selected residents of the Town of Oakville. The next survey will take place in 2022.
4. Number of unique visitors on Oakville.ca
2016 2017 2018 2019 2020 806,467 visitors viewed a total of 3,856,706 pages averaging
2.5 pages per visit
761,707 visitors viewed a total of 4,055,718 pages averaging
2.5 pages per visit
882,099 visitors viewed a total of 4,249,445 pages averaging 2.3 pages per visit
933,803 visitors viewed a total of 4,455,077 pages averaging
1.95 pages per visit
827,911 visitors viewed a total of 3,406,112 pages averaging
2.28 pages per visit (Oct 31, 2020)
Why Important: Oakville.ca is the town’s primary tool to provide information to residents, and 68 percent of respondents to the town’s 2019 Citizen Survey identified oakville.ca as their preferred way to access town information. How Calculated: The town uses Google web analytics to track web statistics.
Page 128

test
Strategic Policy and Communications
5. Number of followers on town social media sites 2016 2017 2018 2019 2020
34,185 41,294 53,774 64,269 78,039 (Oct. 31, 2020) Why Important: Social media is now used by almost 91 percent of Canadians, with two-thirds of Canadians accessing social media from their smartphone or tablet. Facebook remains the most popular social account in Canada followed by LinkedIn, Google+, Instagram and Twitter, and are effective channels for the town to engage in two-way communications with residents. How Calculated: Twitter and Facebook analytical tools are used to calculate totals.
6. Climate Action: Corporate Greenhouse Gas Emissions
2014 (Baseline) 2017 2018 2019 2020 9,354 tonnes CO2e n/a n/a 7,438 tonnes CO2e tbd
Why Important: The town is committed to reducing its corporate greenhouse gas emissions (GHGs) as outlined in its Conservation Demand Management (CDM) program and the Oakville Community Energy Strategy. How Calculated: The CDM set out target reductions of GHGs by 2021 of 24.4% based on 2014 data, not including Fleet or Transit. In 2019, GHS reductions of 20.5% were achieved, well on pace to achieve 2021 targets.
7. Climate Action: Corporate Energy Use
2014 (Baseline) 2017 2018 2019 2020 84,910,870 ekWh n/a 71,357,794 ekWh tbd
Why Important: The town is committed to reducing its corporate energy use as outlined in its Conservation Demand Management (CDM) program and the Oakville Community Energy Strategy. How Calculated: The CDM set out target reductions of energy use by 2021 of 17.5% based on 2014 data not including Fleet or Transit. In 2019 energy reductions of 16% were achieved, well on pace to achieve 2021 targets.
8. Climate Action: Air Quality Health Index Oakville
2016 2017 2018 2019 2020 34 27 48 35 23
Why Important: The Air Quality Health Index is a measure designed to help link air quality to health and is rated on a sale from 1 to 10: 1-3 low risk; 4-6 moderate risk; 7-10 high risk. It assesses three air pollutants which are known to harm human health: ground-level ozone, fine aprticulate matter, and nitrogen dioxide. How Calculated: Numbers reflect the days above “low risk” (1-3) air quality rating as reported by the province.
Page 129
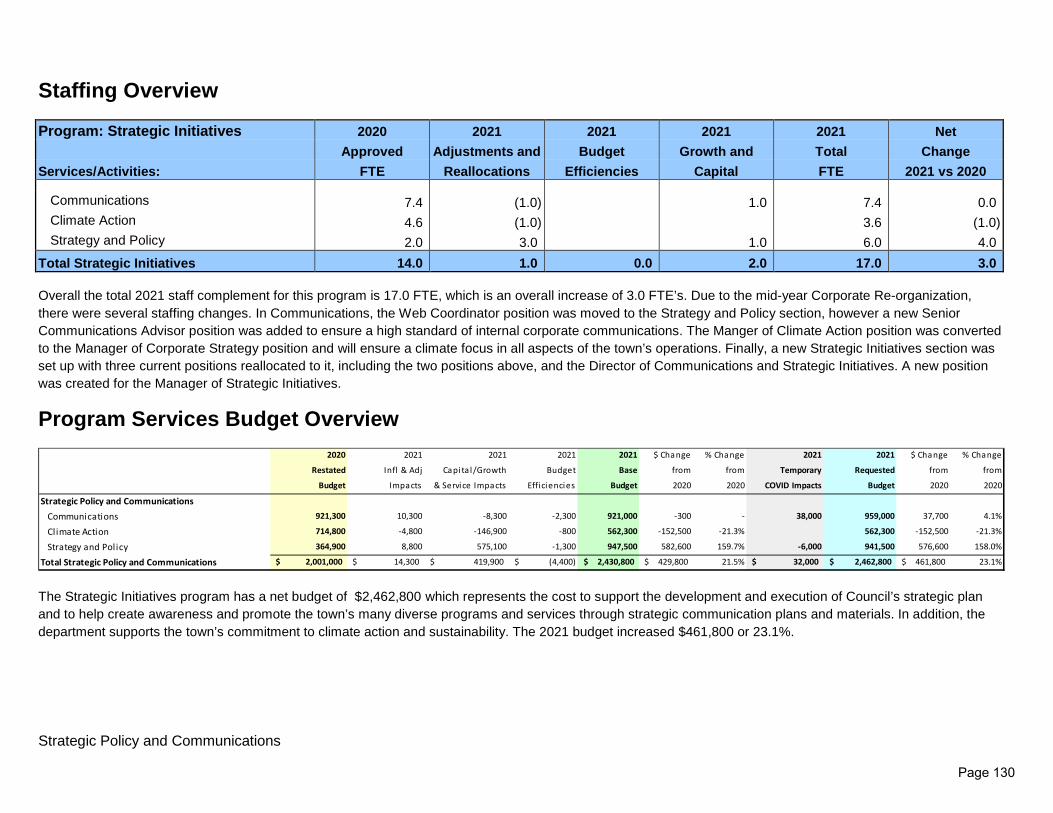
test
Strategic Policy and Communications
Staffing Overview
Program: Strategic Initiatives 2020 2021 2021 2021 2021 Net Approved Adjustments and Budget Growth and Total Change Services/Activities: FTE Reallocations Efficiencies Capital FTE 2021 vs 2020
Communications 7.4 (1.0) 1.0 7.4 0.0 Climate Action 4.6 (1.0) 3.6 (1.0) Strategy and Policy 2.0 3.0 1.0 6.0 4.0
Total Strategic Initiatives 14.0 1.0 0.0 2.0 17.0 3.0 Overall the total 2021 staff complement for this program is 17.0 FTE, which is an overall increase of 3.0 FTE’s. Due to the mid-year Corporate Re-organization, there were several staffing changes. In Communications, the Web Coordinator position was moved to the Strategy and Policy section, however a new Senior Communications Advisor position was added to ensure a high standard of internal corporate communications. The Manger of Climate Action position was converted to the Manager of Corporate Strategy position and will ensure a climate focus in all aspects of the town’s operations. Finally, a new Strategic Initiatives section was set up with three current positions reallocated to it, including the two positions above, and the Director of Communications and Strategic Initiatives. A new position was created for the Manager of Strategic Initiatives.
Program Services Budget Overview
The Strategic Initiatives program has a net budget of $2,462,800 which represents the cost to support the development and execution of Council’s strategic plan and to help create awareness and promote the town’s many diverse programs and services through strategic communication plans and materials. In addition, the department supports the town’s commitment to climate action and sustainability. The 2021 budget increased $461,800 or 23.1%.
2020 2021 2021 2021 2021 $ Change % Change 2021 2021 $ Change % Change
Restated Infl & Adj Capita l/Growth Budget Base from from Temporary Requested from from
Budget Impacts & Service Impacts Efficiencies Budget 2020 2020 COVID Impacts Budget 2020 2020
Strategic Policy and CommunicationsCommunications 921,300 10,300 -8,300 -2,300 921,000 -300 - 38,000 959,000 37,700 4.1%
Climate Action 714,800 -4,800 -146,900 -800 562,300 -152,500 -21.3% 562,300 -152,500 -21.3%
Strategy and Policy 364,900 8,800 575,100 -1,300 947,500 582,600 159.7% -6,000 941,500 576,600 158.0%
Total Strategic Policy and Communications 2,001,000$ 14,300$ 419,900$ (4,400)$ 2,430,800$ 429,800$ 21.5% 32,000$ 2,462,800$ 461,800$ 23.1%
Page 130

test
Strategic Policy and Communications
Net Program Budget Change • Communications has increased by $154,800, primarily driven by
one new position added to enhance internal staff communications. Temporary part-time position also added to support existing staff. Inflationary personnel changes and expense reallocations to align current program requirements were also completed.
• Climate Action has decreased by $5,600. For 2021, this activity’s scope mandate will change, resulting in budget efficiencies & expense realignments. Department consolidation completed. Compensation increases also included.
• Strategy & Policy has increased by $1,500. Temporary COVID reductions of $6,000 for professional fees included, as several strategic initiatives will be delayed to 2022.
Page 131

test
Strategic Policy and Communications
2021 Program Budget by Component – Net $2,462,800
The Strategy, Policy and Communication program’s total expenditures are $2,462,800. This program has no revenues. In 2021, the budget has increased by $461,800 or 23.1%. The main drivers for this increase are the following:
• Personnel Services & Benefits is the largest cost component of the budget at $1.9 million, representing 88% of total gross expenditures. In 2021, personnel costs have increased $480,700. This includes compensatory increases and new full-time positions explained above and one temporary position.
• Materials and Supplies has decreased by $53,800 for educational supplies and special events supplies. This aligns with current trends. • Purchased Services has increased by $36,100, primarily driven by consultant fees, professional fees and promotion expenses. Corporate budget efficiencies
of $4,400 include mileage and skills improvement partially offset this increase. In addition, revisions to Climate Action has resulted in several realignments. • Minor Capital and Transfer to Reserves has decreased by $200 in computer hardware.
Page 132

test
Strategic Policy and Communications
2022 - 2023 Operating Budget Forecast
Strategic Initiatives 2021 2022 2021 - 2022 2023 2022 - 2023
Requested Forecast Change Forecast Change Budget (%) (%)
Gross Expenditures By Service Communications 959,000 945,400 (1.4%) 970,800 2.7% Climate Action 562,300 577,400 2.7% 593,200 2.7% Strategy and Policy 941,500 956,400 1.6% 965,700 1.0% Total Gross Expenditures 2,462,800 2,479,200 0.7% 2,529,700 2.0% Tax Levy By Service Communications 959,000 945,400 (1.4%) 970,800 2.7% Climate Action 562,300 577,400 2.7% 593,200 2.7% Strategy and Policy 941,500 956,400 1.6% 965,700 1.0% Total Tax Levy 2,462,800 2,479,200 0.7% 2,529,700 2.0% Gross Expenditures By Type Personnel Services & Benefits 2,204,800 2,210,100 0.2% 2,255,300 2.0% Materials & Supplies 12,600 12,800 1.6% 13,000 1.6% Purchased Services 243,600 254,500 4.5% 259,600 2.0% Internal Charges - - 0.0% - 0.0% Other Expenditures 1,000 1,000 0.0% 1,000 0.0% Minor Capital & Transfer To Reserves 800 800 0.0% 800 0.0% Total Expenses 2,462,800 2,479,200 0.7% 2,529,700 2.0% Revenues By Type Activity Revenue - - 0.0% - 0.0% Internal Recoveries - - 0.0% - 0.0% Grants - - 0.0% - 0.0% Other Revenue - - 0.0% - 0.0% Total Revenues - - 0.0% - 0.0% Tax Levy $2,462,800 $2,479,200 0.7% $2,529,700 2.0%
2022 - 2023 Budget Forecast Highlights • The 2022 net budget is projected to increase by 0.7% or $16,400 and reflects inflationary increases to the cost of delivering services. • The 2023 net budget is projected to increase by 2.0% or $50,500 and reflects inflationary increases to the cost of delivering services.
Page 133

test
Strategic Policy and Communications
2021 Recommended Capital Budget Funding is included for the Web Based Services project to focus on the first part of Phase 2 of the oakville.ca redesign project. The Community Energy Plan Implementation project includes core funding and seed capital for the Implementation Management Office (IMO) that will provide community governance to implement the strategy. Funding is also included for the Biodiversity Strategy project.
Capital Budget Operating Impacts Project Project Title Classification 2021 2021 21101801 Web Based Services - Ph2 Strategic Priorities 494,000 21102103 Biodiversity (Natural Heritage System) Strategy Strategic Priorities 101,000 22102001 Community Energy Plan Implementation Strategic Priorities 100,000
TOTAL 695,000
Page 134

Program: Facilities and Construction Management
Program Based Budget
2021 - 2023
Vision
• To develop and maintain town buildings which are safe, comfortable and welcoming to all.
Mission
• To provide technical expertise and effective project management to facility user departments for facility design, construction, commissioning, capital replacements, repairs and maintenance of town buildings in an energy efficient, fully accessible, and sustainable manner.
Facilities and Construction Management Page 135
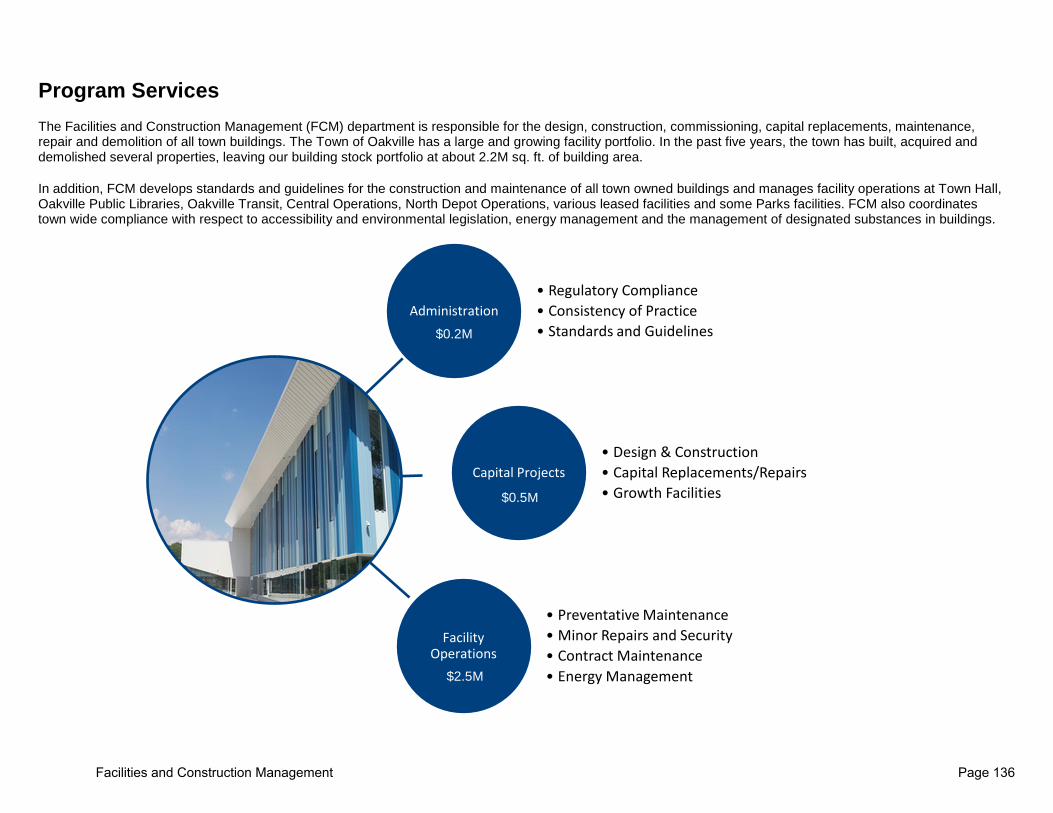
Program Services The Facilities and Construction Management (FCM) department is responsible for the design, construction, commissioning, capital replacements, maintenance, repair and demolition of all town buildings. The Town of Oakville has a large and growing facility portfolio. In the past five years, the town has built, acquired and demolished several properties, leaving our building stock portfolio at about 2.2M sq. ft. of building area. In addition, FCM develops standards and guidelines for the construction and maintenance of all town owned buildings and manages facility operations at Town Hall, Oakville Public Libraries, Oakville Transit, Central Operations, North Depot Operations, various leased facilities and some Parks facilities. FCM also coordinates town wide compliance with respect to accessibility and environmental legislation, energy management and the management of designated substances in buildings.
Administration• Regulatory Compliance• Consistency of Practice• Standards and Guidelines
Capital Projects• Design & Construction• Capital Replacements/Repairs• Growth Facilities
Facility Operations
• Preventative Maintenance• Minor Repairs and Security• Contract Maintenance• Energy Management
$0.2M
$0.5M
$2.5M
Facilities and Construction Management Page 136

2021 Program Key Initiatives
Livability• Protect cultural heritage assets of the community with the completion of the interior renovation of the Coach
House, and complete minor capital projects within the Gairloch Galleries Museum and Studio buildings. Through facility inspections, the capital forecast will be updated to assist with maintaining the state of good repair within Heritage Properties.
Engaged Community• Support public facing facilities which provide a safe, comfortable and welcoming environment.
Accountable Government• Ensure long term fiscal responsibility with building condition assessements and provide input into the capital 10
year forecast. • Maintain and update documentation pertaining to various facility related legislative requirements such as the
hazardous materials program, accessibility, and structural.
Environment• Transition towards a low carbon future with continual implementation of the Town's Conservation Demand
Management Plan, sound energy management practices, and identify capital projects geared towards a reduction in overall carbon footprint.
Mobility• Maintain parking infrastructure through capital repairs within the Church Street Parking Garage along with
continual structural reviews helping ensure building integrity.
Facilities and Construction Management Page 137

Key Performance Indicators 1. Percentage of gross operating budget
2016 2017 2018 2019 2020 1.8% 1.8% 1.8% 1.8% 1.9%
Why Important: Monitors the cost of the program as a proportion of the total cost for the town. How Calculated: Gross program operating costs (excluding transfers to reserves and internal charges) / Gross town operating costs (excluding transfers to reserves and internal charges)
2. Percentage of total FTEs 2016 2017 2018 2019 2020 1.4% 1.3% 1.3% 1.3% 1.3%
Why Important: Assesses the capacity of the program by examining the proportion of staff FTEs against the total Town FTEs. How Calculated: Total program FTEs including part-time / Total town FTEs including part-time
3. Operations: Orders to Comply for FCM Managed Facilities
2016 2017 2018 2019 2020 5 orders received / 4 Orders resolved within prescribed timeline / 1 Order did not meet the prescribed timeline but has been resolved.
6 Order received / 5 Order resolved within prescribed timeline / 1 Order did not meet the prescribed timeline but has been resolved.
7 Order received / 7 Order resolved within prescribed timeline
2 Order received / 2 Order resolved within prescribed timeline
36 Order received / 34 Orders resolved within prescribed/recommended timeline (Sept. 30, 2020)
Why Important: Measures our ability to achieve compliance within prescribed time frames. The measure also indicates whether or not our managed facilities are safe and compliant. How Calculated: Tracks total orders received vs. response time to bring into compliance. Authorities include, but not limited to, Electrical Safety Authority (ESA), Technical Standards and Safety Authority (TSSA), Ministry of Environment (MOE), Ministry of Health (MOH), Ministry of Labour (MOL).
4. Operations: Total cost of operating per square foot of facility managed
2016 2017 2018 2019 2020 $4,823,763 / 1,043,177 s.f. = $4.62 psf
$4,765,001 / 1,039,200 s.f. = $4.59 psf
$5,221,905 / 1,095,375 s.f. = $4.77 psf
$5,367,005 / 1,111,823 s.f. = $4.83 psf
$5,215,795 / 1,102,430 s.f. = $4.73 psf (Sept 30, 2020)
Why Important: Determines the total cost of providing facility operations and can be compared both to other organizations as well as year over year. Includes utilities, maintenance costs and staffing. How Calculated: Total Operating Costs divided by gross square footage managed. Does not include capital repair and replacement costs.
Facilities and Construction Management Page 138
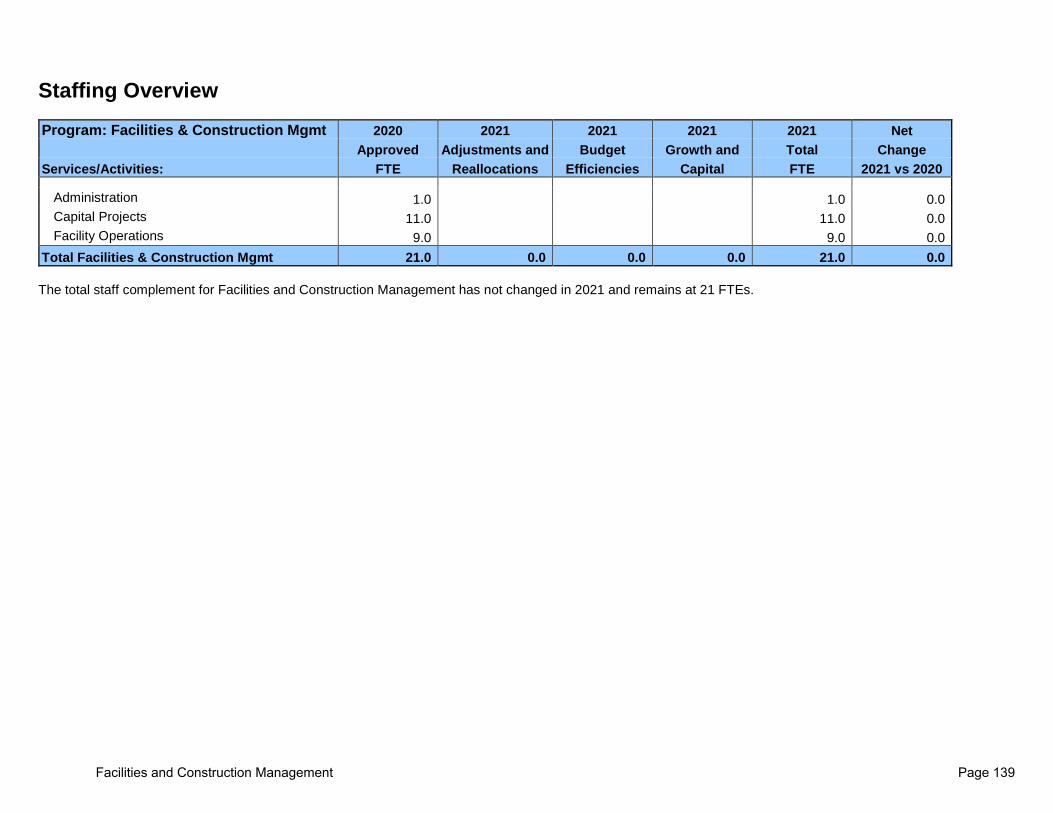
Staffing Overview
Program: Facilities & Construction Mgmt 2020 2021 2021 2021 2021 Net Approved Adjustments and Budget Growth and Total Change Services/Activities: FTE Reallocations Efficiencies Capital FTE 2021 vs 2020
Administration 1.0 1.0 0.0 Capital Projects 11.0 11.0 0.0 Facility Operations 9.0 9.0 0.0
Total Facilities & Construction Mgmt 21.0 0.0 0.0 0.0 21.0 0.0 The total staff complement for Facilities and Construction Management has not changed in 2021 and remains at 21 FTEs.
Facilities and Construction Management Page 139

Program Services Budget Overview
The 2021 Facilities and Construction Management program has increased by $213,100 or 7.2% resulting in a net total budget of $3,173,600. The base budget has increased by $143,800 or 4.9%, with temporary COVID cost reductions in purchased services, materials, and supplies and temporary COVID cost increases to janitorial services and building maintenance netting to a one-time increase of $69,300.
Facilities Operations manages the preventative maintenance, contract maintenance, and security of Town Hall, Oakville Public Libraries, Oakville Transit, Central Operations and North Operations Depots, as well as various town-owned corporate properties, and represents the largest portion of the budget at $2,469,900 and the largest cost increase at $128,900. Capital Projects manages the capital works and asset repair and replacement schedules of various program facilities town-wide as well as the design and construction of new facilities and demolitions of existing facilities, and represents the second largest program at $473,200 and the second largest increase at $81,800. Administration oversees and ensures regulatory compliance with accessibility and environmental legislation, energy management, and the management of designated substances in buildings, and is the smallest program at $230,500 with an increase of $2,400.
The primary drivers of the 2021 budget increase are impacts from capital as FCM takes on management of Centennial Pool, the impacts to operating of the scheduled demolition of the Cross Avenue Plaza corporate properties in Q1 of 2021, and one-time COVID expense increases at Town Hall relating to janitorial services and facility maintenance.
Budget efficiencies identified corporately in mileage, skills improvement, building maintenance, and utilities provide permanent savings to FCM of ($51,600). Budget efficiencies identified specifically through the Facility Review also result in a net unfavorable impact to FCM’s operating budget of $66,200 through the conversion of the Senior Supervisor position in Capital Projects, which has in part been recovered from capital, to a Building Automation Systems Specialist funded wholly from operating.
Facilities and Construction Management Page 140

Net Program Budget Change • Administration has increased $2,400 due to base inflationary
and contractual increases to salaries and benefits, offset by budget efficiencies and one-time COVID reductions to purchased services.
• Capital Projects has increased $81,800 due to base inflationary and contractual increases to salaries and benefits, the net impact of the Senior Supervisor conversion to BAS Specialist of $66,200, and the addition of $25,000 for project cost consulting fees. This is all offset by salary and benefit reductions as new staff have replaced more senior staff, and other budget efficiencies and one-time COVID reductions to purchased services.
• Facilities Operations has increased $128,900 primarily due to base inflationary and contractual increases to salaries and benefits, one-time increases to janitorial and maintenance costs at Town Hall of $75,000, and impacts from capital of taking on management of Centennial Pool of $40,100. Although the scheduled demolition of the corporate properties at Cross Avenue Plaza results in savings in utilities and property taxes of ($79,900), this is accompanied by a loss of budgeted rental revenue of ($168,800) resulting in a net impact to operating of $89,900. As a result of the demolition, significant savings are expected through the leased properties capital program to offset this effect to operating. These increases are all offset by the removal of maintenance and utilities budgets due to the sale of the Oakville Senior’s Centre of ($41,000), and by budget efficiencies and one-time COVID reductions to purchased services, materials, and supplies.
Facilities and Construction Management Page 141

2021 Program Budget by Component – Net $3,173,600
In 2021, the Facilities and Construction Management program’s total expenditures are $4,493,000 and total revenues are $1,319,400 resulting in a net budget of $3,173,600. The net change from the prior year is $213,100 or 7.2%. The main drivers for this change are noted in the details below:
• Personnel Services and Benefits is the largest component of the budget at $2.63 million, representing 58.5% of total gross expenditures. In 2021, personnel costs have decreased ($9,300) primarily due to inflationary and contractual increases in salaries and benefits of $61,100, offset by salary reductions of ($34,600) as new staff have replaced more senior staff and are compensated lower in their respective bands. There is also a favourable impact to personnel costs from the conversion of the Senior Supervisor position to a BAS Specialist of ($35,800) as recommended by the Facility Review and reflected through budget efficiencies. This conversion carries an unfavourable impact to Internal Recoveries outlined below.
• Purchased Services is the second largest component of the budget at $1.05 million, representing 23.9% of total gross expenditures, and is primarily made up of the budgets for contracted services, repairs, and maintenance for town facilities. The budget increased by $67,100 primarily due to one-time COVID increases to janitorial services and maintenance at Town Hall of $75,000, and a one-time cost of $25,000 to pilot the use of a project cost consultant in Capital Projects. These are offset by corporate budget efficiencies of ($15,500) to employee-related costs and contract services, as well as reductions to maintenance budgets due to the sale of the Oakville Senior’s Centre of ($20,500).
Facilities and Construction Management Page 142

• Materials and Supplies are budgeted at $0.68 million and are primarily made up of the costs for utilities at Town Hall and leased town properties. The budget has decreased by ($35,900) primarily due to utilities savings from the scheduled demolition of the Cross Avenue Plaza properties of ($17,800) and sale of the Oakville Senior’s Centre of ($11,600) as well as budget efficiencies in utilities at Town Hall resulting from the Facility Review of ($35,800). This is offset by an increase in utilities of $32,300 resulting from the shift of Centennial Pool from Recreation to Corporate Properties management in 2021.
• Internal Recoveries and Other Revenue are the largest portion of total revenues at $1.12 million and are primarily the recovery of salaries and benefits from the capital program to implement various facility-related capital projects. The budget has decreased by ($88,800) due to the impact of the Senior Supervisor no longer being recovered from Capital as a result of the conversion to BAS Specialist of ($102,000), offset by inflationary and contractual increase adjustments for other recovered staff of $13,200.
• Activity Revenue consists primarily of rental revenue on leased town properties and is budgeted at $202,400 for 2021. The budget has decreased by
($173,600) primarily driven by the loss of budgeted rental revenues at the Cross Avenue Plaza corporate properties scheduled for demolition in Q1 2021 totaling ($168,800), and one-time COVID revenue reductions to Town Hall facilities of ($4,800).
Facilities and Construction Management Page 143

2022 - 2023 Operating Budget Forecast
Facilities and Construction Management 2021 2022 2021 - 2022 2023 2022 - 2023
Requested Forecast Change Forecast Change Budget (%) (%)
Gross Expenditures By Service Administration 230,500 237,600 3.1% 243,100 2.3% Capital Projects 1,440,200 1,446,200 0.4% 1,476,800 2.1% Facilities Operations 2,822,300 2,809,300 (0.5%) 2,863,300 1.9% Total Gross Expenditures 4,493,000 4,493,100 0.0% 4,583,200 2.0% Tax Levy By Service Administration 230,500 237,600 3.1% 243,100 2.3% Capital Projects 473,200 479,200 1.3% 509,800 6.4% Facilities Operations 2,469,900 2,448,200 (0.9%) 2,498,100 2.0% Total Tax Levy 3,173,600 3,165,000 (0.3%) 3,251,000 2.7% Gross Expenditures By Type Personnel Services & Benefits 2,627,700 2,682,700 2.1% 2,738,800 2.1% Materials & Supplies 683,100 696,500 2.0% 710,200 2.0% Purchased Services 1,074,700 1,006,300 (6.4%) 1,026,500 2.0% Internal Charges 33,300 33,300 0.0% 33,300 0.0% Other Expenditures 61,200 61,200 0.0% 61,200 0.0% Minor Capital & Transfer To Reserves 13,000 13,100 0.8% 13,200 0.8% Total Expenses 4,493,000 4,493,100 0.0% 4,583,200 2.0% Revenues By Type Activity Revenue 202,400 211,100 4.3% 215,200 1.9% Internal Recoveries 967,000 967,000 0.0% 967,000 0.0% Grants - - 0.0% - 0.0% Other Revenue 150,000 150,000 0.0% 150,000 0.0% Total Revenues 1,319,400 1,328,100 0.7% 1,332,200 0.3% Tax Levy $3,173,600 $3,165,000 (0.3%) $3,251,000 2.7% 2022 - 2023 Budget Forecast Highlights
• The 2022 net budget is projected to decrease by (0.3%) or ($8,600) and reflects inflationary increases to salaries and benefits, materials, and purchased services. This is offset by the removal of one-time COVID-related adjustments budgeted in 2021 with a favourable net impact to 2022 of ($69,300).
• The 2023 net budget is projected to increase by 2.7% or $86,000 and reflects inflationary increases to salaries, benefits, materials, and purchased services.
Facilities and Construction Management Page 144

2021 Recommended Capital Budget Facilities and Construction Management capital projects provide for the continued state of good repair of town facilities. Facility assets replacement and repair schedules are generated by the town’s asset registry and are reviewed and updated on an annual basis. Facility assets are inspected and, if possible, replacements are deferred based on condition. Studies and inspections are also undertaken to asses building structures and conditions, asbestos remediation, and electrical safety. Funds are also identified for various strategic initiatives in accessibility improvements to remove physical barriers at various facilities across the town and to ensure compliance with the Accessibility for Ontarians with Disabilities Act, various energy management initiatives and improvements which support the town’s Conservation and Demand Management plan, as well as the demolition of properties at the Cross Avenue Plaza. Capital Budget Operating Impacts Project Project Title Classification 2021 2021 22101701 Energy Management System Solution Strategic Priorities 57,000 42101602 Leased Properties - Repairs and Replacements Infrastructure Renewal 25,000 42101904 Structural Inspections and Condition Assessments Infrastructure Renewal 44,000 42102003 Demolition of Town-owned Properties Strategic Priorities 317,000 42102005 Electrical Safety Authority Inspections Infrastructure Renewal 28,000 42102011 Asbestos Monitoring and Remediation Infrastructure Renewal 28,000 42102012 Facilities Emergency Repairs Infrastructure Renewal 111,000 42102102 Accessibility Improvements Strategic Priorities 317,800 42102103 Metro Marine Structural Investigation Infrastructure Renewal 50,000 42102105 Town Hall - Capital Replacements Infrastructure Renewal 177,700 42102106 Heritage Building Maintenance and Repair Infrastructure Renewal 48,000 42102107 Architectural/Structural Infrastructure Renewal 295,000 42102108 HVAC - Various Locations Infrastructure Renewal 1,051,500 42102109 Roof Replacement - Various Locations Infrastructure Renewal 188,500 42102110 Various Facility Accommodation Needs Infrastructure Renewal 221,000 42102111 Mechanical Commission Infrastructure Renewal 39,000 42102113 Facility Repairs Infrastructure Renewal 517,400 42102114 Sitework - Various Facilities (Drives) Infrastructure Renewal 1,205,400 42102115 Energy Management Large Buildings Infrastructure Renewal 395,000 42102116 Properties under 12,000 SF Maintenance and Repair Infrastructure Renewal 138,100 42102117 Electrical - Various Locations Infrastructure Renewal 132,000 42102119 OT High School Site Infrastructure Renewal 50,000
TOTAL 5,436,400
Facilities and Construction Management Page 145

Facility Initiatives in Other Programs: The following are some significant capital projects in other program areas with which the Facility and Construction Management team would be involved in planning, implementation, and overall management. Capital Budget Operating Impacts Project Project Title Classification 2021 2021 21101703 Corporate Leadership Plan Strategic Priorities 60,000 42101519 Brantwood School Demolition and Sitework Strategic Priorities 425,000 43302104 Fire Station Facility Maintenance Infrastructure Renewal 92,500 46632104 Repurpose Shooter Pads to Multipurpose Space Strategic Priorities 302,000 51312102 Central Operations Depot Capital Replacement Infrastructure Renewal 196,000 51312103 North Ops Capital Replacements Infrastructure Renewal 101,000 52282001 Parks Facilities Repairs Infrastructure Renewal 219,000 53512002 Parking Garage - Rehab - FCM Enterprise Initiatives 224,000 53512105 Parking - Minor repairs Enterprise Initiatives 37,000 54212102 Transit Facility Capital Repairs and Replacement Infrastructure Renewal 92,000 54212103 Electronics Repair Lab Infrastructure Renewal 210,000 54212104 On-Demand Call Centre Renovation Infrastructure Renewal 149,000 71101901 Libraries Capital Replacement Infrastructure Renewal 22,000 71102107 Glen Abbey Library – Outdoor Space Strategic Priorities 321,000 2,450,500
Facilities and Construction Management Page 146

2021 BUDGET – ACCOUNTABLE GOVERNMENT OPERATING AND CAPITAL
Accountable Governance Page 147

Accountable Government
Inspire public confidence through open, accountable and efficient delivery of government services.
• Lead in providing open and accountable government • Ensure long-term fiscal sustainability of the town while respecting the impact of decisions on taxpayers • Support a culture of continuous improvement and innovation to enhance cost-effective delivery of town
programs and services
8% of Total 2021 Operating
Budget
5% of Total 2021 Capital
Budget
8%
Total Operating Expenses $28.5 Million
8% of 2021 Operating
Budget
5% of 2021 Capital Budget
Accountable Governance Page 148

2021 Operating Budget Summary
% of 2021 Operating Budget Funded by Tax Levy
PROGRAMTotal Expenses Net Budget Total Expenses Total Revenue Net Budget $ Change % Change
Administrative Executive Management 1,931$ 1,931$ 2,466$ 650$ 1,816$ (115)$ -6%Asset Management 746$ 746$ 1,096$ -$ 1,096$ 350$ 47%Financial Services 6,394$ 4,870$ 6,294$ 1,519$ 4,775$ (95)$ -2%Human Resources 2,882$ 2,878$ 2,960$ 2$ 2,958$ 80$ 3%Information Technology Solutions 11,875$ 11,514$ 12,564$ 367$ 12,197$ 683$ 6%Regulatory Services 757$ 337$ 781$ 382$ 399$ 62$ 18%Legal Services 2,357$ 2,288$ 2,359$ 53$ 2,305$ 17$ 1%Total 26,942$ 24,564$ 28,519$ 2,973$ 25,546$ 982$ 4%
(in $1,000's)
2020 Budget 2021 Budget
Accountable Governance Page 149

Accountable Governance Page 150

Program: Administrative Executive Management
Program Based Budget
2021 - 2023
Vision
• To demonstrate leadership and a commitment to excellence in the overall administration and management of the Corporation of the Town of Oakville.
Mission
• To provide professional advice to Council and direction to the corporation with a focus on results, leadership, accountability and organizational values.
Administration Executive Management Page 151

Program Services The CAO Office provides services through the CAO/Executive Management Team program.
CAO/Executive Management • Provides leadership and
strategic direction, as implemented by Council, for the organization as a whole
$1.8M
Administration Executive Management Page 152

2021 Program Key Initiatives
Accountable Government• Work with Council to implement the town's 2020-2022 strategic plan and report progress annually• Manage the town's response to the COVID-19 pandemic to address the safety of staff and the community;
provide financial sustainability; and determine the appropriate use of town facilities• Provide leadership on key capital projects and corporate strategic initiatives• Prepare annual operating budgets that achieve Council's target to align the budgetary increase with the rate of
inflation• Undertake annual review of services to ensure that the town provides its citizens and businesses with value for
their tax dollars and excellence in customer service• Prepare annual capital budget and long-term capital forecast that reflect long-term financial stability and the
maintenance of town infrastructure • Continue to promote effective risk management, human resources management and sound decision-making
practices throughout the town
Administration Executive Management Page 153

Key Performance Indicators 1. Percentage of gross operating budget
2016 2017 2018 2019 2020 0.9% 0.9% 0.9% 0.8% 0.8%
Why Important: Monitors the cost of the program as a proportion of the total cost for the town. How Calculated: Gross program operating costs (excluding transfers to reserves and internal charges) / Gross town operating costs (excluding transfers to reserves and internal charges).
2. Percentage of total FTEs
2016 2017 2018 2019 2020 0.6% 0.6% 0.6% 0.6% 0.6
Why Important: Assesses the capacity of the program by examining the proportion of staff expertise against the total Town FTEs. How Calculated: Total program FTEs including part-time / Total town FTEs including part-time.
3. Annual overall tax rate increase
2016 2017 2018 2019 2020 1.6% 2.4% 1.75% 1.53% 2.0%
Why Important: Overall tax rate increase is the increase residents see on their tax bill. How Calculated: Based on final overall tax increase as identified in the Region of Halton annual tax policy report. * In 2019, Council approved an increase of 1.99 per cent to the town’s portion of the overall tax bill. When combined with the regional increase and the education tax rate, the property tax increase was 1.53 per cent compared to an inflation rate target of 2.0 per cent at time of budget preparation.
4. Percentage of citizens surveyed satisfied with town programs and services
2016 2017 2018 2019 2020
85%(2015 survey) 85%(2015 survey) 89%(2017 survey) 96%(2019 survey) 96%(2019 survey) Why Important: The town is committed to surveying its residents to provide statistically valide measures of statisfaction. This data assists Council and town staff in allocating program funds to meet public expectations. How Calculated: Pollara Strategic Insights conducts a 20 minute survey of 800 residents every two years on behalf of the town to produce survey results that are accurate to within 3.5 per cent, 19 times out of 20. Next survey will be conducted in 2021.
Administration Executive Management Page 154

5. Employee turnover rate 2016 2017 2018 2019 2020 4.9% 5.0% 5.0% 5.2% 4.9%
Why Important: Tracking employee turnover is important due to the financial costs associated with hiring, as well as impact on organizational effectiveness. How Calculated: Total employees leaving organization/Total program FTEs.
Administration Executive Management Page 155
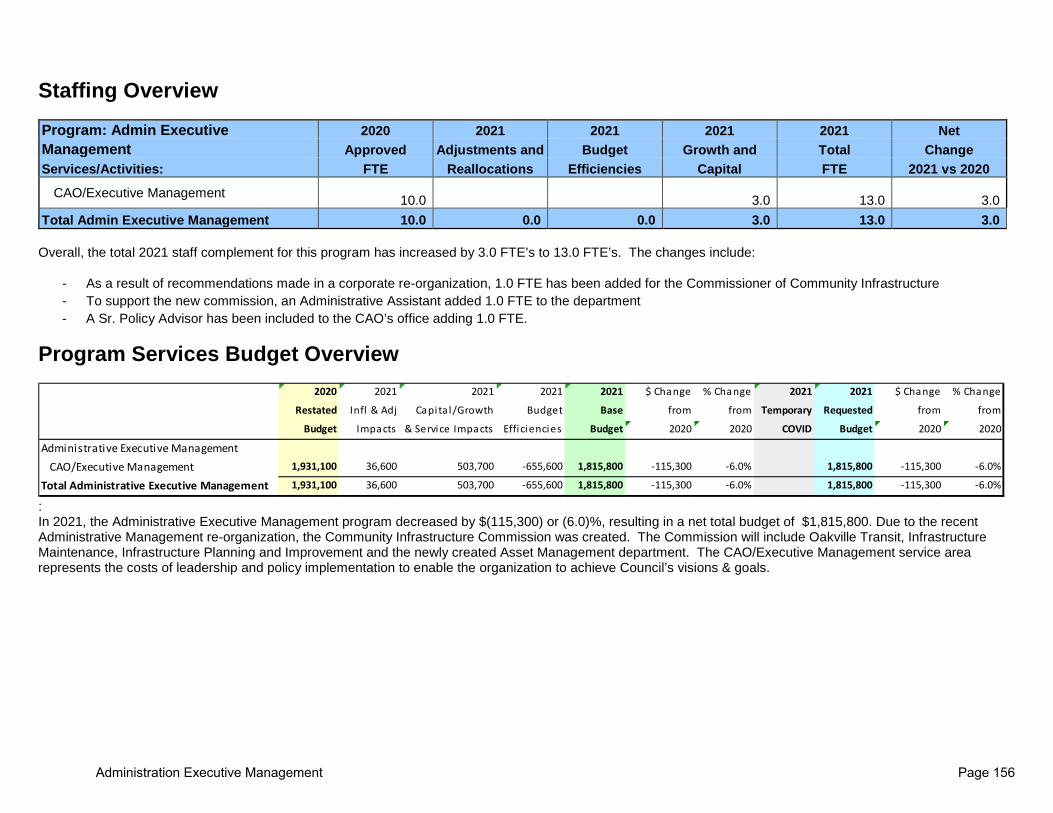
Staffing Overview
Program: Admin Executive 2020 2021 2021 2021 2021 Net Management Approved Adjustments and Budget Growth and Total Change Services/Activities: FTE Reallocations Efficiencies Capital FTE 2021 vs 2020
CAO/Executive Management 10.0 3.0 13.0 3.0 Total Admin Executive Management 10.0 0.0 0.0 3.0 13.0 3.0 Overall, the total 2021 staff complement for this program has increased by 3.0 FTE’s to 13.0 FTE’s. The changes include:
- As a result of recommendations made in a corporate re-organization, 1.0 FTE has been added for the Commissioner of Community Infrastructure - To support the new commission, an Administrative Assistant added 1.0 FTE to the department - A Sr. Policy Advisor has been included to the CAO’s office adding 1.0 FTE.
Program Services Budget Overview
: In 2021, the Administrative Executive Management program decreased by $(115,300) or (6.0)%, resulting in a net total budget of $1,815,800. Due to the recent Administrative Management re-organization, the Community Infrastructure Commission was created. The Commission will include Oakville Transit, Infrastructure Maintenance, Infrastructure Planning and Improvement and the newly created Asset Management department. The CAO/Executive Management service area represents the costs of leadership and policy implementation to enable the organization to achieve Council’s visions & goals.
2020 2021 2021 2021 2021 $ Change % Change 2021 2021 $ Change % Change
Restated Infl & Adj Capita l/Growth Budget Base from from Temporary Requested from from
Budget Impacts & Service Impacts Efficiencies Budget 2020 2020 COVID Budget 2020 2020
Administrative Executive ManagementCAO/Executive Management 1,931,100 36,600 503,700 -655,600 1,815,800 -115,300 -6.0% 1,815,800 -115,300 -6.0%
Total Administrative Executive Management 1,931,100 36,600 503,700 -655,600 1,815,800 -115,300 -6.0% 1,815,800 -115,300 -6.0%
Administration Executive Management Page 156
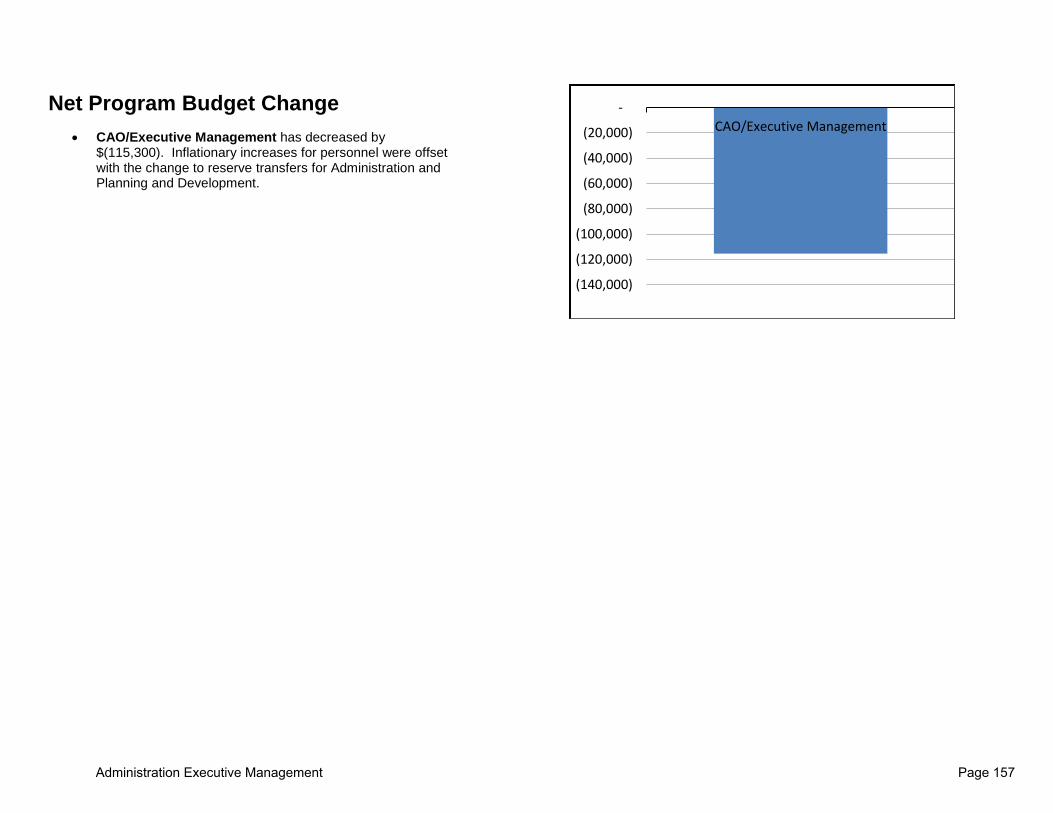
Net Program Budget Change • CAO/Executive Management has decreased by
$(115,300). Inflationary increases for personnel were offset with the change to reserve transfers for Administration and Planning and Development.
(140,000)
(120,000)
(100,000)
(80,000)
(60,000)
(40,000)
(20,000)
-CAO/Executive Management
Administration Executive Management Page 157

2021 Program Budget by Component – Net $1,815,800
In 2021, the Administrative Executive Management program’s total expenditures are $1,962,400 and total revenues are $650,300, resulting in a net budget of $1,815,800. The net change from the prior year is $(115,300) or -6%. The main drivers for this increase are the following:
• Personnel Services & Benefits is the largest component of the budget at $2.3 million, representing 91% of the total gross expenditures. Personnel increases have been included for inflationary and compensatory adjustments and overall personnel budget increased by $540,800.
• Other Revenues has increased by $650,300 due to the changes to the transfer from the Rate Stabilization Reserve for Administration and Planning andDevelopment to reflect future savings that will be realized as the implementation of the Service Reviews are in place.
Personnel Services & Benefits,
$2,264,900
Materials & Supplies, $4,500
Purchased Services, $195,800
Minor Capital & Transfer to
Reserves, $900
2021 Expenditures $2.5M
Activity Revenue, $0
Other Revenue, $650,300
2021 Revenues $0.7M
Administration Executive Management Page 158

2022 - 2023 Operating Budget Forecast
Administrative Executive Management 2021 2022 2021-2022 2023 2022-2023
Requested Forecast Change Forecast Change Budget (%) (%)
Gross Expenditures By Service CAO/Executive Management 2,466,100 2,513,600 1.9% 2,562,100 1.9% Total Gross Expenditures 2,466,100 2,513,600 1.9% 2,562,100 1.9% Tax Levy By Service CAO/Executive Management 1,815,800 1,863,300 2.6% 1,911,800 2.6% Total Tax Levy 1,815,800 1,863,300 2.6% 1,911,800 2.6%
Gross Expenditures By Type Personnel Services & Benefits 2,264,900 2,308,700 1.9% 2,353,400 1.9% Materials & Supplies 4,500 4,500 0.0% 4,500 0.0% Purchased Services 195,800 199,500 1.9% 203,300 1.9% Internal Charges - - 0.0% - 0.0% Other Expenditures - - 0.0% - 0.0% Minor Capital & Transfer To Reserves 900 900 0.0% 900 0.0% Total Expenditures 2,466,100 2,513,600 1.9% 2,562,100 1.9% Revenues By Type Activity Revenue - - 0.0% - 0.0% Internal Recoveries - - 0.0% - 0.0% Grants - - 0.0% - 0.0% Other Revenue 650,300 650,300 0.0% 650,300 0.0% Total Revenues 650,300 650,300 0.0% 650,300 0.0% Tax Levy $1,815,800 $1,863,300 2.6% $1,911,800 2.6%
2022 - 2023 Budget Forecast Highlights • The 2021 budget has been adjusted for inflationary increases primarily in personnel. • The 2022 budget has been adjusted for inflationary increases primarily in personnel.
Administration Executive Management Page 159

2021 Recommended Capital Budget The 2021 capital projects are shown below. Highlights include funding for the removal of the Brantwood school building as part of the recommendations resulting from the southeast land use study and options for the former surplus school sites as well as funding for engineering design and construction of storm water layout for Brantwood park properties fronting onto Douglas Avenue. Also included is funding for consulting support on diversity and inclusion initiatives to review and assess our HR policies, practices and tools to identify systemic barriers in our programs and then support to eliminate those barriers.
Capital Budget Operating Impacts Project Project Title Classification 2021 2021 21101703 Corporate Leadership Plan Strategic Priorities 60,000 21102101 Strategic Digital Development Strategic Priorities 151,000 21102102 Brantwood Site Servicing Strategic Priorities 253,000 24102101 Diversity and Inclusion Review Strategic Priorities 101,000 42101519 Brantwood School Demolition and Sitework Strategic Priorities 425,000
TOTAL 990,000
Administration Executive Management Page 160

Program: Asset Management
Program Based Budget
2021 – 2023
Vision
• To develop and implement the town's Strategic Asset Managment plan to ensuring long-term fiscal sustainability of all town assets and alignment with desired service outcomes.
Mission
• To create a culture that will facilitate the development of a set of planned actions enabling assets to provide the desired level of service in a sustainable way, while managing risk at the lowest lifecycle cost.
Asset Management Page 161

Program Services Asset Management delivers the following services:
$1.10M
Asset Management
$1.1m
• Development of the Town's Strategic Asset Management Plan
• On-going Management of Asset data and metrix
• Building Asset Management Capacity within the workforce
Asset Management Page 162

2021 Program Key Initiatives
Accountable Government• Continue to develop the town's Strategic Asset Managment plan in order to conform with O Reg 288/2017
Requirements.• Investigate Asset Management systems solutions that consolidate asset related service measures, technical
data and risk matrix to create a holistic decision making framework.• Continue to ensure integrity of asset managment data sets to facilitate monitoring and implementation of
operational maintenance activities and appropriate life cycle replacements.
Environment• Identify vulnerabilities to the town's infrastructure that may be caused by climate change and incorporate
mitigation strategies and adaptation opportunities within various asset management plans.
Asset Management Page 163

Key Performance Indicators 1. Percentage of gross operating budget
2016 2017 2018 2019 2020 0.3%
Why Important: Monitors the cost of the program as a proportion of the total cost for the town. How Calculated: Gross program operating costs (excluding transfers to reserves and internal charges) / Gross town operating costs (excluding transfers to reserves and internal charges)
2. Percentage of total FTEs
2016 2017 2018 2019 2020 0.4%
Why Important: Assesses the capacity of the program by examining the proportion of staff expertise against the total Town FTE’s. How Calculated: Total program FTEs including part-time / Total town FTEs including part-time
3. Achieve full expected life of assets
2016 2017 2018 2019 2020 78% 72% 78% 95% 73% (Sept. 30 ,2020)
Why Important: To ensure that all Tangible Capital Assets are set up with the correct useful life and that they are disposed of with a NBV of zero. Having the correct useful life enables the town to better plan replacements and schedule preventative maintenance and the associated costs at the correct time. How Calculated: (# of disposed assets at end of Useful Life or greater/Total # of TCA disposed * 100)
The Asset Management division is a newly formed division for 2021. Additional measures will be created and added in future years as the program develops.
Asset Management Page 164

Staffing Overview
Overall, the total 2021 staff complement for Asset Management is 8.0 FTE. Two positions were added to the complement—one reallocated from the Financial Planning division, and a new Director of Asset Management position created through the corporate reorganization. The other 6 were formally included as a section in Financial Services.
Program Services Budget Overview
Overall the Asset Management program has a net budget of $1,096,100 which is an increase of $350,000 or 46.9%. The Asset Management division is a newly formed section which will continue to develop over the coming year. The 2021 budget shown above was formerly included as part of the Finance program and has been in place to support the on-going management of tangible capital asset data, monitoring of operational maintenance activities and development of the long-term Strategic Asset Management plan. The $350,000 increase represents the new Director position and the reallocated position from Financial Planning.
Program: Asset Management 2020 2021 2021 2021 2021 NetApproved Adjustments and Budget Growth and Total Change
Services/Activities: FTE Reallocations Efficiencies Capital FTE 2021 vs 2020
Asset Management 6.0 1.0 1.0 8.0 2.0 Total Asset Management 6.0 1.0 0.0 1.0 8.0 2.0
2020 2021 2021 2021 2021 $ Change % Change 2021 2021 $ Change % Change
Restated Infl & Adj Capita l/Growth Budget Base from from Temporary Requested from from
Budget Impacts & Service Impacts Efficiencies Budget 2020 2020 COVID Impacts Budget 2020 2020
Asset ManagementAsset Management 746,100 15,500 336,100 -500 1,097,200 351,100 47.1% -1,100 1,096,100 350,000 46.9%
Total Asset Management 746,100 15,500 336,100 -500 1,097,200 351,100 47.1% -1,100 1,096,100 350,000 46.9%
Asset Management Page 165

Net Program Budget Change
Asset Management has increase by $350,000. The primary driver of the budget increase is related to the reallocation of staffing from within the organization as well as increases to salary and benefits.
0
50,000
100,000
150,000
200,000
250,000
300,000
350,000
400,000
Asset Management
Asset Management Page 166

2021 Program Budget by Component – Net $1,096,100
In 2021, the Asset Management program’s total expenditures are $1,096,100 and total revenues are zero, resulting in a net budget of $1,096,100. The net change from the prior year is $350,000 or 46.9%. The main drivers are the following.
• Personnel Services & Benefits make up 99% of the total expenditures and is the main driver of the Asset Management budget. Personnel services have increased by $351,300 as a result of the compensatory and inflationary changes.
• Purchased Services make up 1% of the total expenditures and have decreased by $1,600 as a result of a reallocation to align budget with actual expenditures.
• Materials & Supplies have increased by $300 as a result of a reallocation to align budget with actual expenditures.
Asset Management Page 167

2022 - 2023 Operating Budget Forecast
Asset Management 2021 2022 2021 - 2022 2023 2022 -2023
Requested Forecast Change Forecast Change Budget (%) (%)
Gross Expenditures by Service Asset Management 1,096,100 1,113,100 1.6% 1,129,500 1.5% Total Gross Expenditures 1,096,100 1,113,100 1.6% 1,129,500 1.5% Tax Levy By Service Asset Management 1,096,100 1,113,100 1.6% 1,129,500 1.5% Total Tax Levy 1,096,100 1,113,100 1.6% 1,129,500 1.5% Gross Expenditures By Type Personnel Services & Benefits 1,087,800 1,103,500 1.4% 1,119,700 1.5% Materials & Supplies 300 300 0.0% 300 0.0% Purchased Services 8,000 9,300 16.3% 9,500 2.2% Internal Charges - - 0.0% - 0.0% Other Expenditures - - 0.0% - 0.0% Minor Capital & Transfer To Reserves - - 0.0% - 0.0% Total Expenses 1,096,100 1,113,100 1.6% 1,129,500 1.5% Revenues By Type Activity Revenue - - 0.0% - 0.0% Internal Recoveries - - 0.0% - 0.0% Grants - - 0.0% - 0.0% Other Revenue - - 0.0% - 0.0% Total Revenues - - 0.0% - 0.0% Tax Levy $1,096,100 $1,113,100 1.6% $1,129,500 1.5%
2022 - 2023 Budget Forecast Highlights • The 2022 net budget is projected to increase by 1.6% or $17,000 while 2023 is projected to increase by 1.5% or $16,400. Both years reflect inflationary
increases to the cost of delivering services.
Asset Management Page 168

2021 Recommended Capital Budget The 2021 budget is shown below. Funding is included to investigate tools/systems to be used for asset management prioritization.
Capital Budget Operating Impacts Project Project Title Classification 2021 2021 33101701 Strategic Asset Management Plan Infrastructure Renewal 40,000
TOTAL 40,000
Asset Management Page 169

Asset Management Page 170

test
Program: Information Technology Solutions
Program Based Budget
2021 - 2023
Vision
• A vital participant providing enabling technology to support the town’s mission to create and preserve Canada’s most livable community, enhancing our natural, cultural, social and economic environments.
Mission
• Information Technology Solutions is a centre of expertise that adds value to the corporation through efficient, reliable services; effective and disciplined project and process management to support corporate and departmental projects; and strategic planning for the deployment of information and communications systems technology and processes.
Page 171

test
Information Technology Solutions
Program Services Information Technology Solutions provides services through the following programs:
Projects and Development
•Structured project management •Custom integrations and application development•Business re-engineering•Project consultation
Network Services
•Maintain data storage•Provide infrastructure for town's core applications
Client Services
•Manage Help Desk•Purchase corporate desktop hardware, software and printer technologies
Application Support •Database
administration•Manage corporate applications
Admin•Technology vision and strategic planning for the town
$1.3M
$3.8M
$1.8M
$5.1M $0.3M
Page 172

test
Information Technology Solutions
2021 Program Key Initiatives
Engaged Community• Opertational management of core digital infrastructure to provide quality, robust management of town on-line
services and content through digital means. Realiable and quality technology platforms.
Accountable Government• Operational service delivery for discovery and rendering of consolidated digital information via FOI requests.
Environment• Through multiple programs and projects - paper reduction through continued automation and digitzation of
core town processes and services.• Information technology operational efficiencies via enahnced management and architecture of core Data
Center Infrastucture resources to contribuite to the reducuction of Town total power consumption.
Mobility• Through multiple programs and projects - deliver multi platform including, but not limited to rendering of core
digital infrastructure to mobile devices. Provide quality, robust management of town on-line services and content through mobile digital platforms and tools.
Page 173

test
Information Technology Solutions
Key Performance Indicators 1. Percentage of gross operating budget
2016 2017 2018 2019 2020 4.3% 4.5% 4.8% 4.9% 4.9%
Why Important: Monitors the cost of the program as a proportion of the total cost for the town. How Calculated: Gross program operating costs (excluding transfers to reserves and internal charges) / Gross town operating costs (excluding transfers to reserves and internal charges).
2. Percentage of total FTEs 2016 2017 2018 2019 2020 3.6% 3.5% 3.5% 3.5% 3.5%
Why Important: Assesses the capacity of the program by examining the proportion of staff expertise against the total town FTEs. How Calculated: Total program FTEs including part-time / Total town FTEs including part-time.
3. Percentage of calls resolved within 24 hours
2016 2017 2018 2019 2020 81.1% 75.3% 73.6% 67.1 60.1% (est)
Why Important: Lower technology down time means more uptime for staff to complete duties. How Calculated: Number of calls divided by the number of those calls that were fixed within 24 hours. Department Comment: The Client Support Services labour complement was reduced by 42% for much of 2020. The 2020 estimated KPI’s are lower, based on this reduction in labour. Calls that are coming into the Help Desk are more complicated and precise, so it takes longer to fix these types of concerns, since external vendors may be involved in closing the case.
Page 174
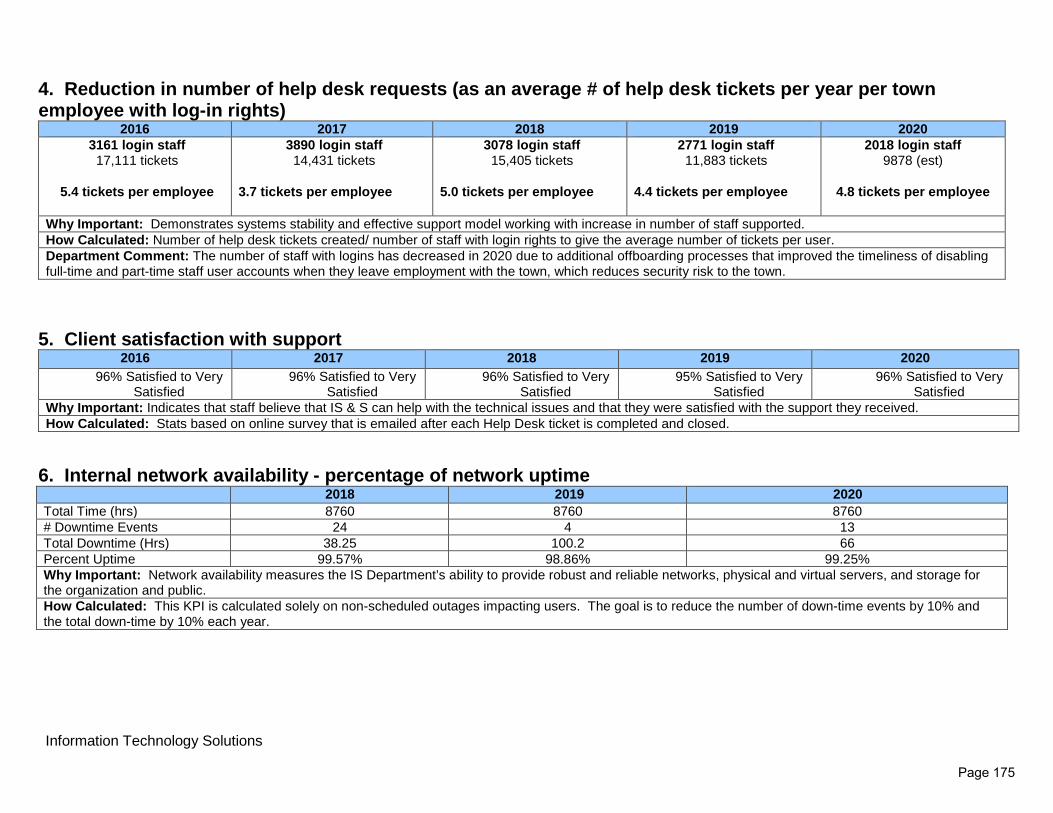
test
Information Technology Solutions
4. Reduction in number of help desk requests (as an average # of help desk tickets per year per town employee with log-in rights)
2016 2017 2018 2019 2020 3161 login staff 17,111 tickets
5.4 tickets per employee
3890 login staff 14,431 tickets
3.7 tickets per employee
3078 login staff 15,405 tickets
5.0 tickets per employee
2771 login staff 11,883 tickets
4.4 tickets per employee
2018 login staff 9878 (est)
4.8 tickets per employee
Why Important: Demonstrates systems stability and effective support model working with increase in number of staff supported. How Calculated: Number of help desk tickets created/ number of staff with login rights to give the average number of tickets per user. Department Comment: The number of staff with logins has decreased in 2020 due to additional offboarding processes that improved the timeliness of disabling full-time and part-time staff user accounts when they leave employment with the town, which reduces security risk to the town.
5. Client satisfaction with support
2016 2017 2018 2019 2020 96% Satisfied to Very
Satisfied 96% Satisfied to Very
Satisfied 96% Satisfied to Very
Satisfied 95% Satisfied to Very
Satisfied 96% Satisfied to Very
Satisfied Why Important: Indicates that staff believe that IS & S can help with the technical issues and that they were satisfied with the support they received. How Calculated: Stats based on online survey that is emailed after each Help Desk ticket is completed and closed.
6. Internal network availability - percentage of network uptime
2018 2019 2020 Total Time (hrs) 8760 8760 8760 # Downtime Events 24 4 13 Total Downtime (Hrs) 38.25 100.2 66 Percent Uptime 99.57% 98.86% 99.25% Why Important: Network availability measures the IS Department’s ability to provide robust and reliable networks, physical and virtual servers, and storage for the organization and public. How Calculated: This KPI is calculated solely on non-scheduled outages impacting users. The goal is to reduce the number of down-time events by 10% and the total down-time by 10% each year.
Page 175

test
Information Technology Solutions
Staffing Overview Program: Information Tech.
2020 2021 2021 2021 2021 Net
Approved Adjustments and Budget Growth and Total Change Services/Activities: FTE Reallocations Efficiencies Capital FTE 2021 vs 2020
Administration 2.0 2.0 0.0 Projects & Development 13.0 13.0 0.0 Network Services 15.0 15.0 0.0 Client Services 10.1 10.1 0.0 Application Services 18.0 18.0 0.0
Total Information Technology Solutions 58.1 0.0 0.0 0.0 58.1 0.0 The total staff complement for Information Technology Solutions has not changed from 2020 and remains at 58.1 FTEs for 2021.
Page 176
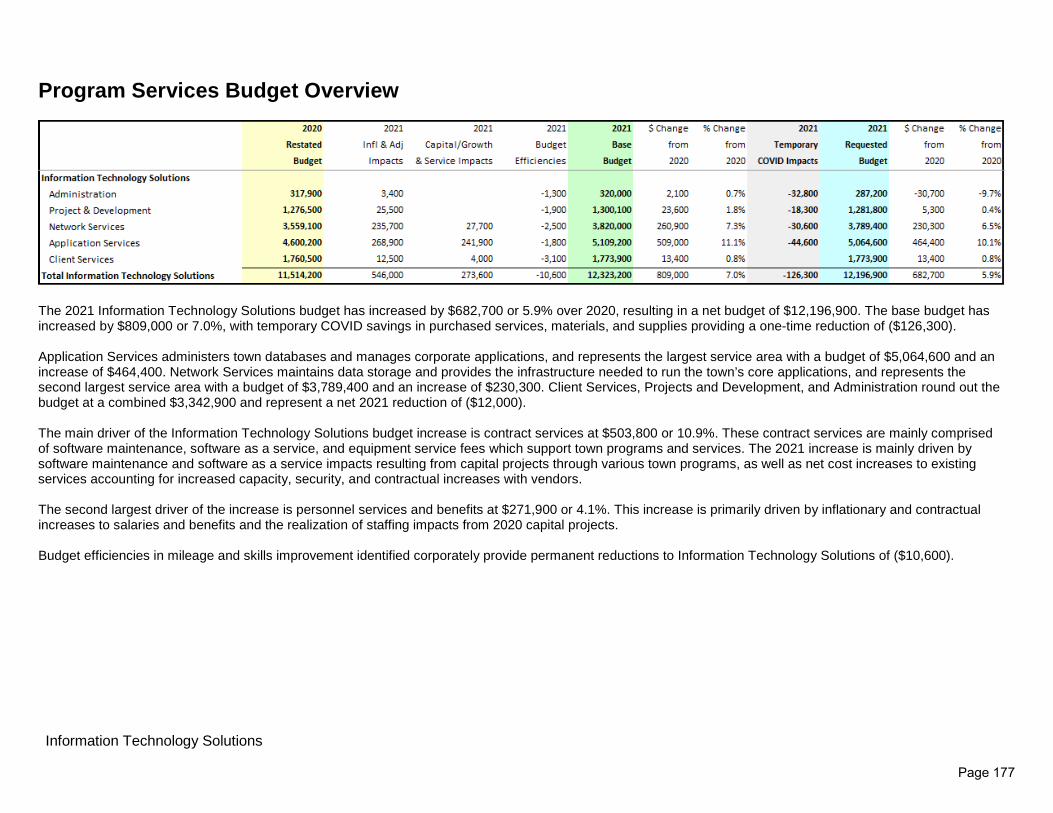
test
Information Technology Solutions
Program Services Budget Overview
The 2021 Information Technology Solutions budget has increased by $682,700 or 5.9% over 2020, resulting in a net budget of $12,196,900. The base budget has increased by $809,000 or 7.0%, with temporary COVID savings in purchased services, materials, and supplies providing a one-time reduction of ($126,300). Application Services administers town databases and manages corporate applications, and represents the largest service area with a budget of $5,064,600 and an increase of $464,400. Network Services maintains data storage and provides the infrastructure needed to run the town’s core applications, and represents the second largest service area with a budget of $3,789,400 and an increase of $230,300. Client Services, Projects and Development, and Administration round out the budget at a combined $3,342,900 and represent a net 2021 reduction of ($12,000). The main driver of the Information Technology Solutions budget increase is contract services at $503,800 or 10.9%. These contract services are mainly comprised of software maintenance, software as a service, and equipment service fees which support town programs and services. The 2021 increase is mainly driven by software maintenance and software as a service impacts resulting from capital projects through various town programs, as well as net cost increases to existing services accounting for increased capacity, security, and contractual increases with vendors. The second largest driver of the increase is personnel services and benefits at $271,900 or 4.1%. This increase is primarily driven by inflationary and contractual increases to salaries and benefits and the realization of staffing impacts from 2020 capital projects. Budget efficiencies in mileage and skills improvement identified corporately provide permanent reductions to Information Technology Solutions of ($10,600).
Page 177
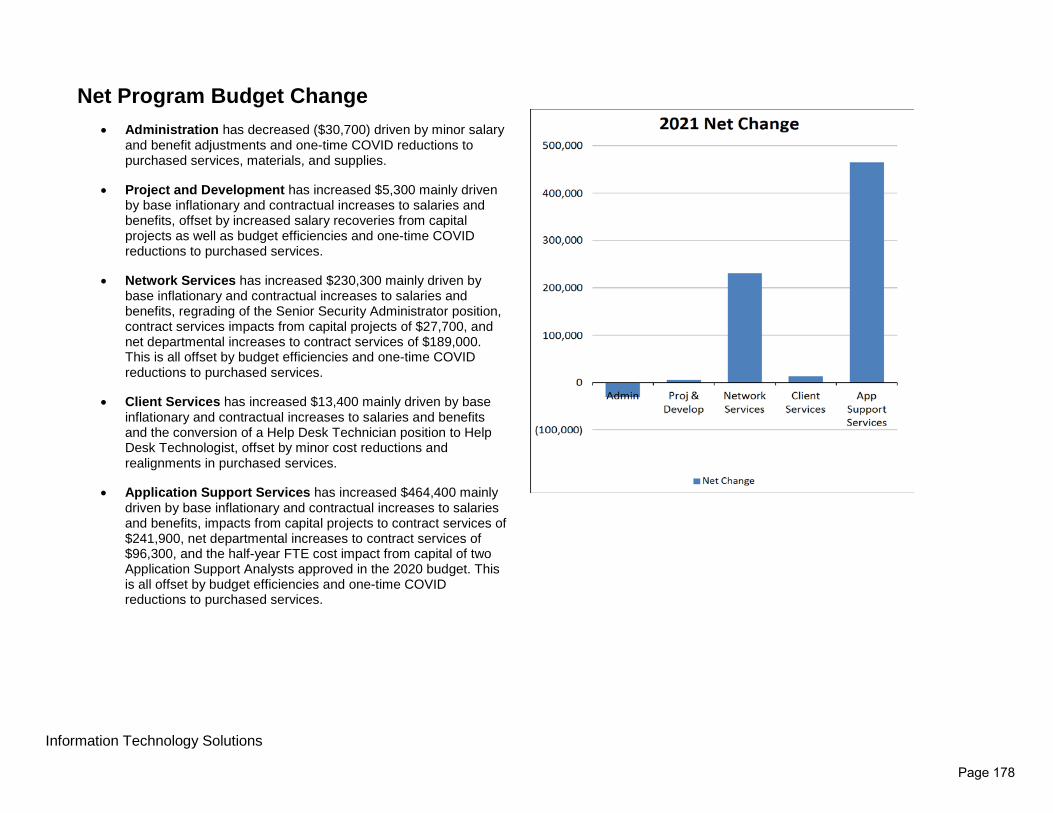
test
Information Technology Solutions
Net Program Budget Change • Administration has decreased ($30,700) driven by minor salary
and benefit adjustments and one-time COVID reductions to purchased services, materials, and supplies.
• Project and Development has increased $5,300 mainly driven by base inflationary and contractual increases to salaries and benefits, offset by increased salary recoveries from capital projects as well as budget efficiencies and one-time COVID reductions to purchased services.
• Network Services has increased $230,300 mainly driven by base inflationary and contractual increases to salaries and benefits, regrading of the Senior Security Administrator position, contract services impacts from capital projects of $27,700, and net departmental increases to contract services of $189,000. This is all offset by budget efficiencies and one-time COVID reductions to purchased services.
• Client Services has increased $13,400 mainly driven by base inflationary and contractual increases to salaries and benefits and the conversion of a Help Desk Technician position to Help Desk Technologist, offset by minor cost reductions and realignments in purchased services.
• Application Support Services has increased $464,400 mainly driven by base inflationary and contractual increases to salaries and benefits, impacts from capital projects to contract services of $241,900, net departmental increases to contract services of $96,300, and the half-year FTE cost impact from capital of two Application Support Analysts approved in the 2020 budget. This is all offset by budget efficiencies and one-time COVID reductions to purchased services.
Page 178
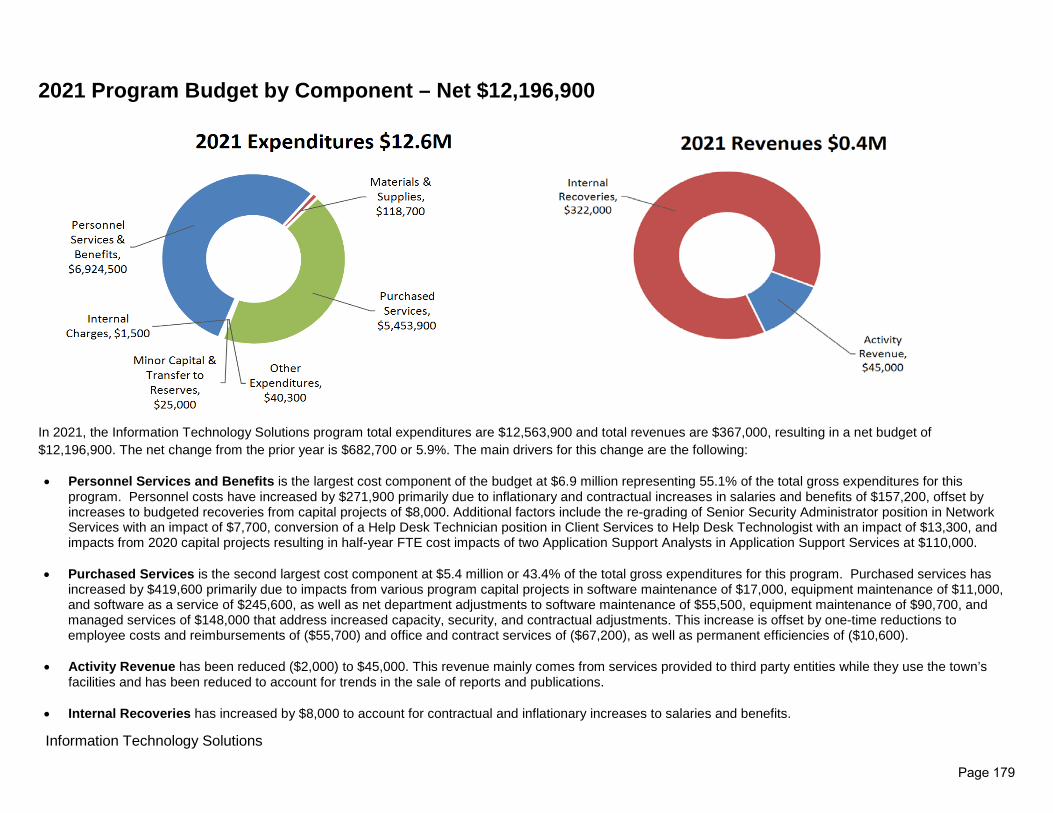
test
Information Technology Solutions
2021 Program Budget by Component – Net $12,196,900
In 2021, the Information Technology Solutions program total expenditures are $12,563,900 and total revenues are $367,000, resulting in a net budget of $12,196,900. The net change from the prior year is $682,700 or 5.9%. The main drivers for this change are the following:
• Personnel Services and Benefits is the largest cost component of the budget at $6.9 million representing 55.1% of the total gross expenditures for this program. Personnel costs have increased by $271,900 primarily due to inflationary and contractual increases in salaries and benefits of $157,200, offset by increases to budgeted recoveries from capital projects of $8,000. Additional factors include the re-grading of Senior Security Administrator position in Network Services with an impact of $7,700, conversion of a Help Desk Technician position in Client Services to Help Desk Technologist with an impact of $13,300, and impacts from 2020 capital projects resulting in half-year FTE cost impacts of two Application Support Analysts in Application Support Services at $110,000.
• Purchased Services is the second largest cost component at $5.4 million or 43.4% of the total gross expenditures for this program. Purchased services has increased by $419,600 primarily due to impacts from various program capital projects in software maintenance of $17,000, equipment maintenance of $11,000, and software as a service of $245,600, as well as net department adjustments to software maintenance of $55,500, equipment maintenance of $90,700, and managed services of $148,000 that address increased capacity, security, and contractual adjustments. This increase is offset by one-time reductions to employee costs and reimbursements of ($55,700) and office and contract services of ($67,200), as well as permanent efficiencies of ($10,600).
• Activity Revenue has been reduced ($2,000) to $45,000. This revenue mainly comes from services provided to third party entities while they use the town’s facilities and has been reduced to account for trends in the sale of reports and publications.
• Internal Recoveries has increased by $8,000 to account for contractual and inflationary increases to salaries and benefits.
Page 179

test
Information Technology Solutions
2022 - 2023 Operating Budget Forecast
Information Technology Solutions 2021 2022 2021 - 2022 2023 2022 - 2023
Requested Forecast Change Forecast Change Budget (%) (%)
Gross Expenditures By Service Administration 332,200 372,400 12.1% 380,600 2.2% Project & Development 1,544,800 1,597,100 3.4% 1,633,400 2.3% Network Services 3,789,400 4,129,400 9.0% 4,210,600 2.0% Client Services 1,773,900 1,809,800 2.0% 1,848,000 2.1% Application Services 5,123,600 5,446,400 6.3% 5,555,900 2.0% Total Gross Expenditures 12,563,900 13,355,100 6.3% 13,628,500 2.0% Tax Levy By Service Administration 287,200 327,400 14.0% 335,600 2.5% Project & Development 1,281,800 1,334,100 4.1% 1,370,400 2.7% Network Services 3,789,400 4,129,400 9.0% 4,210,600 2.0% Client Services 1,773,900 1,809,800 2.0% 1,848,000 2.1% Application Services 5,064,600 5,387,400 6.4% 5,496,900 2.0% Total Tax Levy 12,196,900 12,988,100 6.5% 13,261,500 2.1% Gross Expenditures By Type Personnel Services & Benefits 6,924,500 7,067,400 2.1% 7,215,900 2.1% Materials & Supplies 118,700 124,400 4.8% 126,900 2.0% Purchased Services 5,453,900 6,095,700 11.8% 6,217,300 2.0% Internal Charges 1,500 1,500 0.0% 1,500 0.0% Other Expenditures 40,300 41,100 2.0% 41,900 1.9% Minor Capital & Transfer To Reserves 25,000 25,000 0.0% 25,000 0.0% Total Expenses 12,563,900 13,355,100 6.3% 13,628,500 2.0% Revenues By Type Activity Revenue 45,000 45,000 0.0% 45,000 0.0% Internal Recoveries 322,000 322,000 0.0% 322,000 0.0% Grants - - 0.0% - 0.0% Other Revenue - - 0.0% - 0.0% Total Revenues 367,000 367,000 0.0% 367,000 0.0%
Tax Levy $12,196,900 $12,988,100 6.5% $13,261,500 2.1%
Page 180

test
Information Technology Solutions
2022 - 2023 Budget Forecast Highlights • The 2022 net budget is projected to increase by $791,200 or 6.5% from 2021 and includes inflationary increases to salaries and benefits, materials, and
purchased services. Also reflected are impacts from various program capital projects relating to software maintenance, software as a service, and equipment maintenance of $410,100.This increase also reflects the reinstatement of expenses identified as one-time 2021 COVID savings opportunities of $126,300.
• The 2023 net budget is projected to increase by $273,400 or 2.1% from 2022 and primarily reflects inflationary increases to salaries and benefits, materials, and purchased services.
2021 Recommended Capital Budget The capital budget for Information Technology Solutions ensures that software and supporting hardware are kept current to ensure the town's information management runs seamlessly and efficiently. 2021 projects include application infrastructure refreshes for the storage area network, SharePoint web platform, radio system, and Transit ITS server, as well as evergreening of town hardware, network infrastructure, and CCTV systems. Additional 2021 projects include maintenance of corporate applications, upgrades to the Amanda system, as well as implementation and enhancement of strategic priorities in cyber security, online licensing, and identity management. Capital Budget Operating
Project Project Title Classification 2021 2021 36101707 CCTV Security Technologies Infrastructure Renewal 25,000 36101709 Amanda System Upgrade and Enhancement Infrastructure Renewal 101,000 10,000 36101903 Storage Area Network Refresh Infrastructure Renewal 101,000 36101920 Networking Infrastructure Infrastructure Renewal 204,000 36102002 Transit ITS Server and System Infrastructure Infrastructure Renewal 151,000 36102003 Cyber Security Strategic Priorities 161,000 36102006 Misc Sustainment for Corporate Applications Infrastructure Renewal 121,000 3,200 36102010 Hardware Evergreening Infrastructure Renewal 1,043,000 36102101 Sharepoint Infrastructure Refresh Infrastructure Renewal 201,000 36102102 GIS System Data Services Infrastructure Renewal 30,000 36102106 Corporate Information System (CIS) Infrastructure Renewal 126,000 36102107 Microsoft 365 Licensing (E1 Lic) Strategic Priorities 121,000 36102108 Radio Infrastructure and Refresh Infrastructure Renewal 75,000 36102110 Idenity Gateway Strategic Priorities 100,000
TOTAL 2,560,000 13,200
Page 181

test
Information Technology Solutions
Technology Initiatives in Other Programs: The following are a selection of capital projects in other program areas with which the Information Technology Solutions team would be involved in sourcing, implementation, and support. Capital Budget Operating Impacts Project Project Title Classification 2021 2021 21101801 Web Based Services - Ph2 Strategic Priorities 494,000 21102101 Strategic Digital Development Strategic Priorities 151,000 22101701 Energy Management System Solution Strategic Priorities 57,000 33102102 Purchasing & Risk Mgmt System Updates Infrastructure Renewal 50,000 36101906 Salesforce Upgrade and Enhancement Infrastructure Renewal 221,000 46632104 Repurpose Shooter Pads to Multipurpose Space Strategic Priorities 302,000 51612004 Traffic Signal Interconnect Infrastructure Renewal 67,000 52712101 Cemeteries Software Replacement Enterprise Initiatives 101,000 53512103 Parkade Security Cameras Enterprise Initiatives 21,000 53512104 AIMS Parking System Enhancements Enterprise Initiatives 174,000 53612102 Online Licensing and Self Serve Strategic Priorities 51,000 54212103 Electronics Repair Lab Infrastructure Renewal 210,000 54422102 Digital Arrival Display Screens Strategic Priorities 136,000 62102001 Plan-It E-services Strategic Priorities 905,000 18,600
TOTAL 2,940,000 18,600
Page 182

Program: Regulatory Services
Program Based Budget
2021 - 2023
Vision• To incorporate legislative requirements and opportunities to excel in the provision of professional regulatory services.
Mission• We will provide quality and innovative services within a fiscally sustainable environment.
Regulatory Services Page 183

Program Services
Regulatory Services are provided by the Clerk’s department and address a variety of functions in accordance with provincial legislative requirements, municipal by-laws and Council direction, including marriage and lottery licensing, Corporate Records Management, Municipal Freedom of Information administration; civil marriage services; information and customer services such as issuance of burial permits and document commissioning.
Legislative Services
• Corporate Records Management
• Freedom of Information• Marriage Licences• Burial Permits• Civil Marriage Services• Document Commissioning
$0.3M
Regulatory Services Page 184

2021 Program Key Initiatives
Engaged Community• Provide civil marriage services to couples• Provide commissionings and sign Proof of Life forms for pensioners.
Accountable Government• Continue to process requests for information within legislated timeframes whenever possible and protect
personal privacy under the Municipal Freedom of Information and Protection of Privacy Act.
Regulatory Services Page 185

Key Performance Indicators 1. Percentage of gross operating budget
2016 2017 2018 2019 2020 0.4% 0.4% 0.3% 0.3% 0.3%
Why Important: Monitors the cost of the program as a proportion of the total cost for the town. How Calculated: Gross program operating costs (excluding transfers to reserves and internal charges) / Gross town operating costs (excluding transfers to reserves and internal charges).
2. Percentage of total FTEs 2016 2017 2018 2019 2020 1.0% 0.4% 0.4% 0.4% 0.4%
Why Important: Assesses the capacity of the program by examining the proportion of staff expertise against the total Town FTEs. How Calculated: Total program FTEs including part-time / Total town FTEs including part-time.
Regulatory Services Page 186
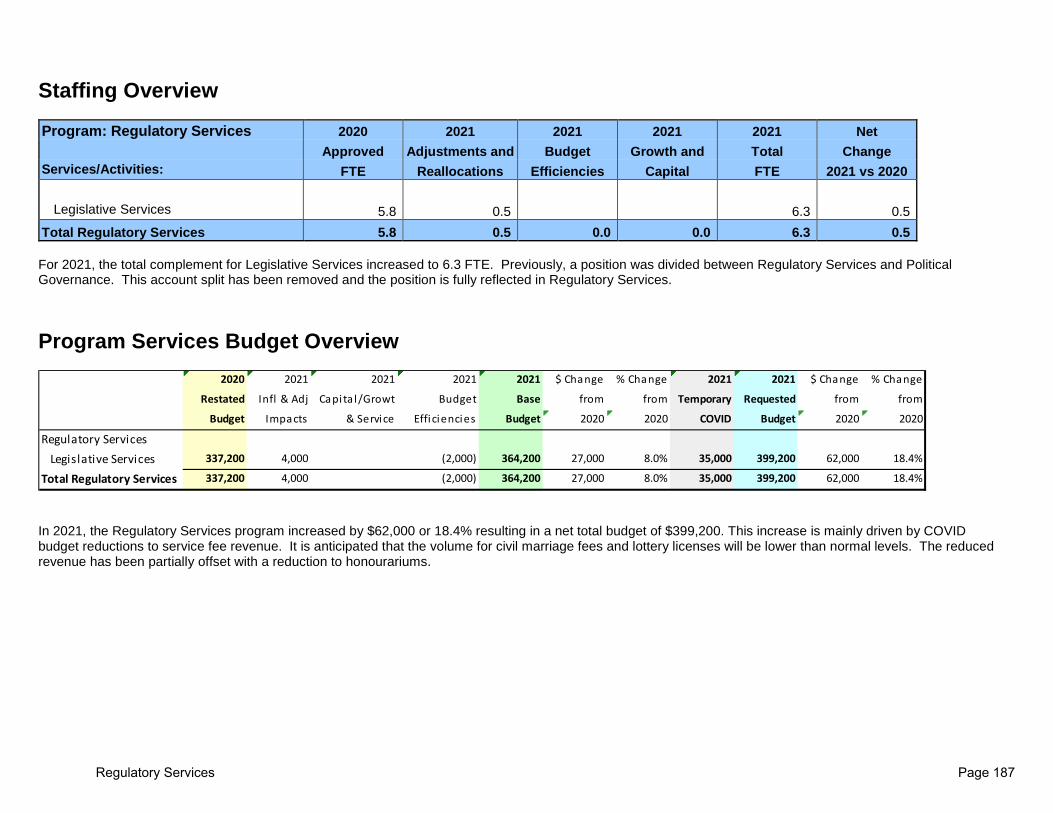
Staffing Overview
Program: Regulatory Services 2020 2021 2021 2021 2021 Net Approved Adjustments and Budget Growth and Total Change Services/Activities: FTE Reallocations Efficiencies Capital FTE 2021 vs 2020
Legislative Services 5.8 0.5 6.3 0.5
Total Regulatory Services 5.8 0.5 0.0 0.0 6.3 0.5 For 2021, the total complement for Legislative Services increased to 6.3 FTE. Previously, a position was divided between Regulatory Services and Political Governance. This account split has been removed and the position is fully reflected in Regulatory Services.
Program Services Budget Overview
In 2021, the Regulatory Services program increased by $62,000 or 18.4% resulting in a net total budget of $399,200. This increase is mainly driven by COVID budget reductions to service fee revenue. It is anticipated that the volume for civil marriage fees and lottery licenses will be lower than normal levels. The reduced revenue has been partially offset with a reduction to honourariums.
2020 2021 2021 2021 2021 $ Change % Change 2021 2021 $ Change % Change
Restated Infl & Adj Capita l/Growt Budget Base from from Temporary Requested from from
Budget Impacts & Service Efficiencies Budget 2020 2020 COVID Budget 2020 2020
Regulatory ServicesLegislative Services 337,200 4,000 (2,000) 364,200 27,000 8.0% 35,000 399,200 62,000 18.4%
Total Regulatory Services 337,200 4,000 (2,000) 364,200 27,000 8.0% 35,000 399,200 62,000 18.4%
Regulatory Services Page 187

Net Program Budget Change • Legislative Services has increased by $62,000. This is
due to an increase to contract services for records management and a reduction to civil marriage fees and lottery licenses resulting from anticipated lower volume.
-
10,000
20,000
30,000
40,000
50,000
60,000
70,000
Legislative ServicesNet Change
Regulatory Services Page 188

2021 Program Budget by Component – Net $399,200
2021 Expenditures $0.8M 2021 Revenue $0.4M
In 2021, Regulatory Services’ total expenditures is expected to be $780,800 with a total revenue of $ 381,600 for a net budget of $399,200. The net change versus 2020 budget is a decrease of $62,000 or 18.4%. The main drivers are the following:
• Temporary COVID adjustment have resulted in a $35,000 increase to the 2021 budget. The increase is mostly a result of reduced civil marriage fee and lottery license revenue due to reduced volume. A reduction to honourariums has partially offset the reduced revenue.
• Personnel Services and Benefits is the largest expense component with a budget of $655,900 which is 84% of the total expenses budgeted. For 2021, personnel costs have increased by $1,100 or 0.2%. Contractual and inflation increases for salary and benefits are included but are offset with position re-evaluation which reduced personnel costs and COVID reduction included for honourariums This budget is used to fund external staff used to officiate wedding ceremonies. Where possible, internal staff will be used in 2021.
• Purchased Services with a budget of $89,600 has increased by $23,000 for contracted services. This increase is required for the records management contract partially offset with a reduction to skills improvement.
• Activity Revenue has decreased by $37,900 or -9.0%.As a result of COVID, the budget for civil marriage fees is adjusted for reduced volumes. All COVID adjustment are for 2021 and the 2022 budget will reflect normal levels.
Personnel Services & Benefits, $655,900
Materials & Supplies, $1,700
Purchased Services, $89,600
Other Expenditures,
$33,600Activity
Revenue, $381,600
Regulatory Services Page 189

2022 - 2023 Operating Budget Forecast
Regulatory Service 2021 2022 2021 - 2022 2023 2022 - 2023
Requested Forecast Change Forecast Change Budget (%) (%)
Gross Expenditures By Service Legislative Services 780,800 780,800 0.0% 795,800 1.9% Total Gross Expenditures 780,800 780,800 0.0% 795,800 1.9% Tax Levy By Service Legislative Services 399,200 346,600 (13.2%) 353,000 1.8% Total Tax Levy 399,200 346,600 (13.2%) 353,000 1.8% Gross Expenditures By Type Personnel Services & Benefits 655,900 679,100 3.5% 692,800 2.0% Materials & Supplies 1,700 1,700 0.0% 1,700 0.0% Purchased Services 89,600 66,400 (25.9%) 67,700 2.0% Internal Charges - - 0.0% - 0.0% Other Expenditures 33,600 33,600 0.0% 33,600 0.0% Minor Capital & Transfer To Reserves - - 0.0% - 0.0% Total Expenses 780,800 780,800 0.0% 795,800 1.9% Revenues By Type Activity Revenue 381,600 434,200 13.8% 442,800 2.0% Internal Recoveries - - 0.0% - 0.0% Grants - - 0.0% - 0.0% Other Revenue - - 0.0% - 0.0% Total Revenues 381,600 434,200 13.8% 442,800 2.0% Tax Levy $399,200 $346,600 (13.2%) $353,000 1.8%
Regulatory Services Page 190

2022 - 2023 Budget Forecast Highlights • The 2022 net budget is projected to increase by (13.2%) or $ (52,600) mainly due to inflation in personnel costs and contracted services. The 2022 budget
has also been adjusted for the $35,000 COVID adjustment included in the 2021 budget. • The 2023 net budget is projected to increase by 1.8% or $ 6,400 mainly due to inflation.
Regulatory Services Page 191

Regulatory Services Page 192

Program: Human Resources
Program Based Budget
2021 - 2023
Vision
• To be the principal authority for human resources management and a key strategic contributor to corporate success.
Mission
• To support the town in achieving organizational goals and objectives by enhancing individual, team, group and corporate effectiveness.
Human Resources Page 193

Program Description Human Resources assists in the achievement of the town’s corporate priorities by advocating for human resource policies, programs and practices that enhance the effectiveness and satisfaction of individuals, groups and teams in the town’s administration and contribution to an organization that has a competitive advantage in the employment market place.
Admin and Policy
Development
• Guidance• Consistency of practice• Equity in application
Organizational Development
• Total Compensation• Recruitment and Selection• Reward and Recognition• Training and Development
Health and Safety
• Legislative Compliance• Employee Wellness
$0.3M
$0.3M
$2.4M
Human Resources Page 194
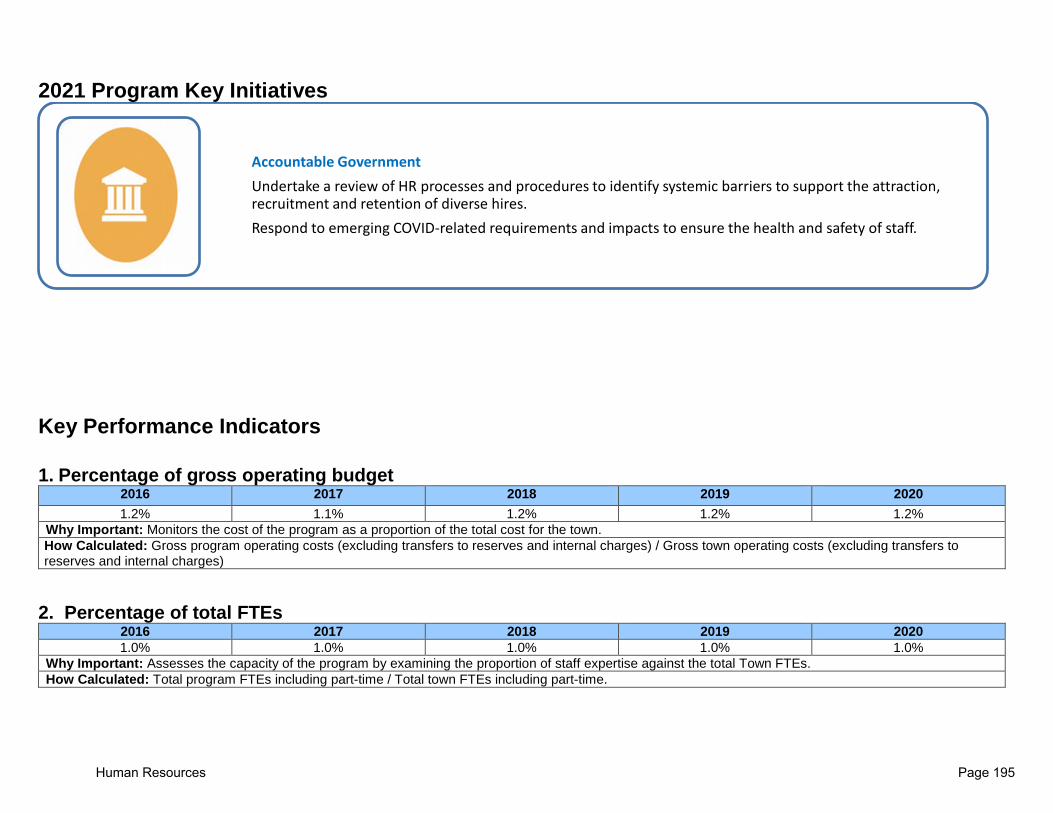
2021 Program Key Initiatives
Key Performance Indicators
1. Percentage of gross operating budget2016 2017 2018 2019 2020 1.2% 1.1% 1.2% 1.2% 1.2%
Why Important: Monitors the cost of the program as a proportion of the total cost for the town. How Calculated: Gross program operating costs (excluding transfers to reserves and internal charges) / Gross town operating costs (excluding transfers to reserves and internal charges)
2. Percentage of total FTEs2016 2017 2018 2019 2020 1.0% 1.0% 1.0% 1.0% 1.0%
Why Important: Assesses the capacity of the program by examining the proportion of staff expertise against the total Town FTEs. How Calculated: Total program FTEs including part-time / Total town FTEs including part-time.
Accountable GovernmentUndertake a review of HR processes and procedures to identify systemic barriers to support the attraction, recruitment and retention of diverse hires.Respond to emerging COVID-related requirements and impacts to ensure the health and safety of staff.
Human Resources Page 195

test
Human Resources
3. Average days per short term disability claims
2016 2017 2018 2019 2020 28.9 32.1 33.6 30.4 32.2 (Sept 30, 2020)
Why Important: Indicates trends in case managed short term disability absences. Includes only medical absences that are managed corporately by Human Resources. How Calculated: Total number of case-managed short term disability days/Total number of case-managed short term disability claims.
4. Percentage of training and development program participants who indicated an increase in learning 2016 2017 2018 2019 2020 80% 74% 84% 98% 92% (Sept 30, 2020)
Why Important: Reflects the value and relevance of the training and development programs to the participants. How Calculated: Summary of data from training program evaluation sheets (self-evaluation of level of knowledge pre and post learning).
5. Claims settled prior to grievance arbitration 2016 2017 2018 2019 2020 91% 73% 74% 99% 88% (Sept 30, 2020)
Why Important: Shows the effectiveness of the relationship in resolving disputes with the bargaining units. How Calculated: Percentage of grievances settled prior to arbitration.
6. Health and Safety – Lost time frequency rate
2016 2017 2018 2019 2020 2.3 1.9 2.1 2.4 2.8 (Sept 30, 2020)
Why Important: Assesses the effectiveness of our safety program. How Calculated: (# of incidents X 200,000 hours) / total number of worker hours. 200,000 represents the total annual hours for 100 staff as per industry standard.
7. Ministry of Labour orders
2016 2017 2018 2019 2020 0 3 2 1 2 (Sept 30, 2020)
Why Important: Indicator of the effectiveness of organization’s health and safety practices. How Calculated: Number of orders issues, to ensure compliance, by the Ministry of Labour.
Page 196

Staffing Overview
Program: Human Resources 2020 2021 2021 2021 2021 Net Approved Adjustments and Budget Growth and Total Change
Services/Activities: FTE Reallocations Efficiencies Capital FTE 2021 vs 2020 Administration and Policy Development 1.0 1.0 0.0 Advisory Services 10.0 10.0 0.0 Organizational Development 2.0 2.0 0.0 Reward and Recognition 2.0 2.0 0.0 Health, Safety & Wellness 1.1 1.1 0.0
Total Human Resources 16.1 0.0 0.0 0.0 16.1 0.0
Overall, the total 2021 staff complement for Human Resources is 16.1 FTEs. This remains unchanged from 2020.
Program Services Budget Overview
The 2021 budget increased by $80,200 or 2.8% resulting in a net total budget of $ 2,957,700. The budget reflects a careful consideration of expenditures required to fulfill the business plan, based on a five year historical analysis. In addition, several budget adjustments were completed to reallocate resources for the entire program.
2020 2021 2021 2021 2021 $ Change % Change 2021 2021 $ Change % Change
Restated Infl & Adj Capita l/Growth Budget Base from from Temporary Requested from from
Budget Impacts & Service Impacts Efficiencies Budget 2020 2020 COVID Impacts Budget 2020 2020
Human ResourcesAdministration and Policy Development 261,400 21,500 -100 282,800 21,400 8.2% 282,800 21,400 8.2%
Advisory Services 1,559,500 28,400 -200 1,587,700 28,200 1.8% -6,000 1,581,700 22,200 1.4%
Organizational Development 415,100 5,800 59,800 480,700 65,600 15.8% -11,500 469,200 54,100 13.0%
Reward and Recognition 310,500 6,400 316,900 6,400 2.1% -10,100 306,800 -3,700 -1.2%
Health, Safety & Wellness 331,000 -2,000 -100 328,900 -2,100 -0.6% -11,700 317,200 -13,800 -4.2%
Total Human Resources 2,877,500$ 60,100$ -$ 59,400$ 2,997,000$ 119,500$ 4.2% 39,300-$ 2,957,700$ 80,200$ 2.8%
Human Resources Page 197

Net Program Budget Change • Administration & Policy Development has
increased by $21,400 due to inflationary increases and ongoing subscription services for employees.
• Advisory Services has increased by $22,200. After personnel, the largest budget is legal fees at $150,000 as the cost of mediations and negotiations with various town labour groups continue. Inflationary increases also included.
• Organization Development has increased $54,100. Reductions to skills improvement from various programs were partially reinvested into corporate staff training. Inflationary increases also included.
• Reward and Recognition has decreased $(3,700). Revisions to reward program have been deferred to 2022, categorized as COVID reduction. Compensation increases are included.
• Health, Safety & Wellness has decreased $(13,800), primarily due to reduced professional fees related to EAP.
Human Resources Page 198

2021 Program Budget by Component – Net $ 2,957,700
In 2021, Human Resources program’s total expenditures are $2,959,700 and total revenues are $ 2,000, resulting in a net budget of $ 2,957,700. The net change from the prior year is $80,200 or 2.8%. The main drivers for this change are the following:
• Personnel Services and Benefits is the largest component of the budget at $2.1 million representing 71% of the total gross expenditures. In 2021, personnel costs have increased by $74,200. This increase is primarily from inflationary increases.
• Purchased Services is the second largest component of the budget at $0.8 million and includes corporate training, recruitment, staff & volunteer recognition, legal fees and professional fees. In 2021, Purchased Services increased by $21,500. This is primarily attributable to the increased corporate staff training and the cost of mediations and negotiations with various town labour groups.
• Activity Revenue is budgeted at $2,000, which is registration fees for town staff fitness classes. • Temporary COVID impacts total $39,300 for 2021. Reductions to meeting expenses, meals, equipment and revenue are affected as the pandemic
framework continues.
Human Resources Page 199

2022 - 2023 Operating Budget Forecast
Human Resources 2021 2022 2021 - 2022 2023 2022 - 2023
Requested Forecast Change Forecast Change Budget (%) (%)
Gross Expenditures By Service Administration and Policy Development 282,800 289,000 2.2% 295,300 2.2% Advisory Services 1,581,700 1,624,300 2.7% 1,661,800 2.3% Organizational Development 469,200 490,800 4.6% 501,500 2.2% Reward and Recognition 306,800 324,000 5.6% 331,400 2.3% Health, Safety & Wellness 319,200 339,600 6.4% 346,800 2.1% Total Gross Expenditures 2,959,700 3,067,700 3.6% 3,136,800 2.3% Tax Levy By Service Administration and Policy Development 282,800 289,000 2.2% 295,300 2.2% Advisory Services 1,581,700 1,624,300 2.7% 1,661,800 2.3% Organizational Development 469,200 490,800 4.6% 501,500 2.2% Reward and Recognition 306,800 324,000 5.6% 331,400 2.3% Health, Safety & Wellness 317,200 335,600 5.8% 342,700 2.1% Total Tax Levy 2,957,700 3,063,700 3.6% 3,132,700 2.3% Gross Expenditures By Type Personnel Services & Benefits 2,133,800 2,184,300 2.4% 2,236,000 2.4% Materials & Supplies 9,100 11,700 28.6% 12,000 2.6% Purchased Services 795,700 836,200 5.1% 852,600 2.0% Internal Charges 1,000 2,000 100.0% 2,000 0.0% Other Expenditures - - 0.0% - 0.0% Minor Capital & Transfer To Reserves 20,100 33,500 66.7% 34,200 2.1% Total Expenses 2,959,700 3,067,700 3.6% 3,136,800 2.3% Revenues By Type Activity Revenue 2,000 4,000 100.0% 4,100 2.5% Internal Recoveries - - 0.0% - 0.0% Grants - - 0.0% - 0.0% Other Revenue - - 0.0% - 0.0% Total Revenues 2,000 4,000 100.0% 4,100 2.5% Tax Levy $2,957,700 $3,063,700 3.6% $3,132,700 2.3%
Human Resources Page 200
2022 - 2023 Budget Forecast Highlights • The 2022 net budget is projected to increase by 3.6% or $ 106,000 and reflects inflationary increases to the cost of delivering services. • The 2023 net budget is projected to increase by 2.3% or $ 69,000 and reflects inflationary increases to the cost of delivering services.
Human Resources Page 201

Human Resources Page 202
Program: Financial Services
Program Based Budget
2021 - 2023
Financial Services Page 203
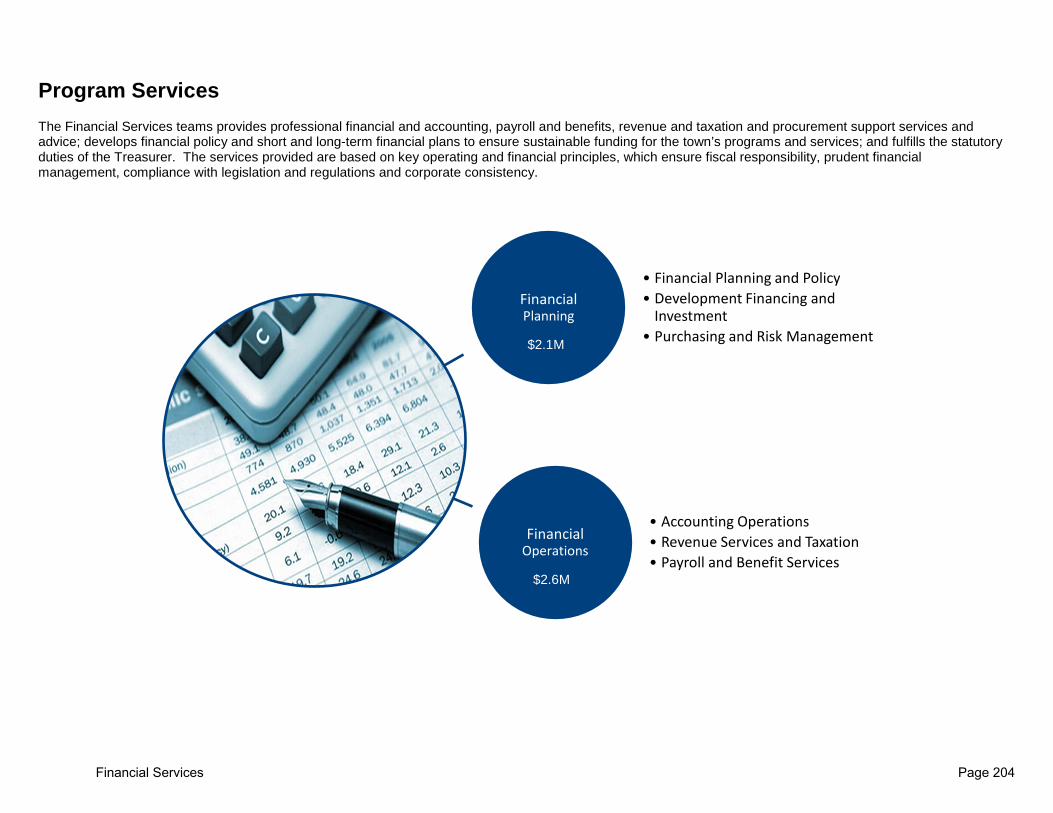
Program Services The Financial Services teams provides professional financial and accounting, payroll and benefits, revenue and taxation and procurement support services and advice; develops financial policy and short and long-term financial plans to ensure sustainable funding for the town’s programs and services; and fulfills the statutory duties of the Treasurer. The services provided are based on key operating and financial principles, which ensure fiscal responsibility, prudent financial management, compliance with legislation and regulations and corporate consistency.
Financial Planning
• Financial Planning and Policy• Development Financing and
Investment• Purchasing and Risk Management
Financial Operations
• Accounting Operations• Revenue Services and Taxation• Payroll and Benefit Services
$2.1M
$2.6M
Financial Services Page 204

2021 Program Key Initiatives
Key Performance Indicators 1. Percentage of gross operating budget
2016 2017 2018 2019 2020 3.0% 3.1% 3.0% 3.0% 2.9%
Why Important: Monitors the cost of the program as a proportion of the total cost for the town. How Calculated: Gross program operating costs (excluding transfers to reserves and internal charges) / Gross town operating costs (excluding transfers to reserves and internal charges)
2. Percentage of total FTEs
Engaged Community• Implement new property tax software to support property tax billing and collection and create online self-serve
capabilities.
Accountable Government• Amend Development Charges By-law to reflect recent legislative changes, ensuring maximum collection of
Development Charges to fund growth related capital projects • Annual budget and financial forecast prepared to ensure long-term financial sustainability• Investigate Insurance Claims Management Systems to enhance data and claims management capabilities to
support proactive risk management.
Financial Services Page 205

2016 2017 2018 2019 2020 3.6% 3.6% 3.6% 3.5% 3.5%
Why Important: Assesses the capacity of the program by examining the proportion of staff expertise against the total Town FTEs. How Calculated: Total program FTEs including part-time / Total town FTEs including part-time
3. Stabilization Reserves as a percentage of own source revenues
2016 2017 2018 2019 2020 21% 20% 21% 22% 24% (Sept. 30, 2020)
Why Important: GFOA recommends, at a minimum, that governments regardless of size, maintain unrestricted fund balances in their general fund of no less than two months of own source revenues to provide sufficient liquidity and protect against unforeseen events. This is equivalent to approximately 17%. How Calculated: Total Stabilization Reserves divided by total town own revenue.
4. Debt service ratio (debt charges to own source revenues) (ISO 37120 Core Indicator 9.1)
2016 2017 2018 2019 2020 5.3% 5.3% 4.69% 4.43% 4.29%
Why Important: Debt service ratio is an indication of financial flexibility of the organization. The Ministry of Housing limit is 25% and Council Policy is 12%. How Calculated: Total long-term debt servicing costs divided by total own source revenue. Values are provided from the FIR.
5. Own-Source revenue as a percentage of total revenues (ISO 37120 Supporting Indicator 9.3)
2016 2017 2018 2019 2020 71% 70% 75.9% 74.1% TBD
Why Important: Own-source revenue is an indication of the town’s ability to plan effectively and demonstrates control over own resources.
How Calculated: Own-source revenue divided by total revenue, where own source revenues includes all permit, user fees and taxes collected. 6. Tax collected as a percentage of tax billed (ISO 37120 Supporting Indicator 9.4)
2016 2017 2018 2019 2020 97.2% 97.4% 97.2% 97.3% TBD
Why Important: Provides an indicator of the financial health of the community at end of each fiscal year. How Calculated: (Total taxes levied in year – taxes receivable on current year levy)/Total taxes levied in year
7. Net Surplus/Deficit as a percentage of Approved Budget
Financial Services Page 206

2016 2017 2018 2019 2020 -0.9% -1.0% -1.9% 1.3% TBD
Why Important: Ensures proper budget practices are followed and spending is in accordance with approved budget. How Calculated: Net variance on town programs excluding Corporate Revenue & Expenses/ Approved budget
8. Unqualified external audit of town’s financial statements and internal controls
2016 2017 2018 2019 2020 Achieved Achieved Achieved Achieved TBD
Why Important: An unqualified opinion indicates the town is preparing the financial statements in accordance with the Public Sector Accounting Standards and that there are no significant control deficiencies How Calculated: External auditors provide an opinion after the interim and final audit of the annual statements, which is presented to Council.
9. Return on Investment Portfolio
2016 2017 2018 2019 2020 3.0% 3.0% 3.05% 2.63% 2.4% (Sept 30, 2020)
Why Important: Provides a measure of the effectiveness of the investment program to earn a reasonable rate of return on investment of its cash resources having regard to market, legislative and policy constraints. These earnings provide non-tax contributions to operations, reserve funds and trust funds. How Calculated: Average annual rate of return
Financial Services Page 207

Staffing Overview
Program: Financial Services 2020 2021 2021 2021 2021 Net Approved Adjustments and Budget Growth and Total Change Services/Activities: FTE Reallocations Efficiencies Capital FTE 2021 vs 2020
Administration 2.0 (1.0) 1.0 (1.0) Accounting Operations 8.3 8.3 0.0 Payroll and Benefit Services 7.0 (0.5) 6.5 (0.5) Revenue and Taxation 11.6 11.6 0.0 Financial Planning and Policy 12.2 (3.0) 9.2 (3.0) Development Financing and Investment 3.0 2.0 5.0 2.0 Purchasing and Risk Management 8.0 8.0 0.0
Total Financial Services 52.1 (2.0) (0.5) 0.0 49.6 (2.5) The total 2021 staff complement for Financial Services is 49.6 FTEs, which decreased 2.5 FTE from 2020. In Payroll, one full-time FTE was eliminated as a budget efficiency and replaced with 0.5 part-time FTE to provide coverage during busier months. Two full-time positions were reallocated, one from Administration and one from Financial Planning to Development Financing and Investments to manage increasing demands related to growth and development charges. An additional two full-time FTE’s were reallocated from Financial Planning to the Asset Management and the Strategy, Policy and Communications programs through re-organization.
Financial Services Page 208

Program Services Budget Overview
In 2021, the Financial Services program decreased by $(94,900) or (1.9)% resulting in a net total budget of $ 4,774,900. Financial Services has several service areas including Administration, Accounting Operations, Payroll & Benefits Services, Revenue & Taxation, Financial Planning & Policy, Development Financing & Investments, Purchasing Services and Risk Management. The budget above allows for staffing and resources to provide guidance and support to front line program areas to ensure prudent financial management, compliance with legislation and regulations and long-term financial stability.
2020 2021 2021 2021 2021 $ Change % Change 2021 2021 $ Change % Change
Restated Infl & Adj Capita l/Growth Budget Base from from Temporary Requested from from
Budget Impacts & Service Impacts Efficiencies Budget 2020 2020 COVID Impacts Budget 2020 2020
Financial ServicesAccounting Operations 884,200 18,200 -200 902,200 18,000 2.0% -200 902,000 17,800 2.0%
Administration 364,400 -70,200 -2,200 292,000 -72,400 -19.9% 292,000 -72,400 -19.9%
Payroll & Benefit Services 776,000 17,000 -55,800 737,200 -38,800 -5.0% 737,200 -38,800 -5.0%
Financial Planning & Policy 1,079,000 -93,900 -252,200 -100 732,800 -346,200 -32.1% 732,800 -346,200 -32.1%
Revenue & Taxation 683,800 10,000 -800 693,000 9,200 1.3% 25,000 718,000 34,200 5.0%
Development Financing & Investments 226,000 192,000 -2,000 416,000 190,000 84.1% 416,000 190,000 84.1%
Purchasing & Risk Management 856,400 122,900 -2,300 977,000 120,600 14.1% -100 976,900 120,500 14.1%
Total Financial Services 4,869,800$ 196,000$ (252,200)$ (63,400)$ 4,750,200$ (119,600)$ -2.5% 24,700$ 4,774,900$ (94,900)$ -1.9%
Financial Services Page 209

Net Program Budget Change • Administration has decreased by $(72,400) primarily
related to one position reallocated to Development Financing.
• Accounting Operations has increased by $17,800, primarily due to inflationary increases on salaries & benefits.
• Payroll & Benefit Services has decreased by $(38,800) which includes 1 eliminated FTE position and replaced with 0.5 part-time FTE. Compensation increases and expense reallocations are also included.
• Revenue & Taxation increased by $34,200. External revenues increased to align with current trends, which is partially offset by inflationary increases and reallocations. Temporary COVID impacts of $25,000 from on-going tourism decline and lower Municipal Accommodation Tax (MAT) revenue are also included.
• Financial Planning & Policy decreased by $(346,200), primarily related to two positions reallocated to Development Financing and to Strategy, Policy and Communications. Inflationary increases for wages and benefits also included.
• Development Financing & Investments increased by $190,000 for two new positions added to assist expanded capacity with growth and development charges. Minor reallocations also included.
• Purchasing & Risk Management increased $120,500 for temporary staffing for expanded demands in risk management and upgrades to the tender module in purchasing. Inflationary increases and reallocations also included.
Financial Services Page 210

2021 Program Budget by Component – Net $ 4,774,900
In 2021, Financial Services program’s total expenditures are $6,294,100 and total revenues are $ 1,519,200, resulting in a net budget of $ 4,774,900. The net change from 2020 is $(94,900) or (1.9)%. The main drivers for this change are noted in the details below:
• Personnel Services and Benefits is the largest component totaling $5.9 million, representing 94% of the total gross expenditures. In 2021, personnel services decreased by $107,400. There were 2.5 FTE allocated to other programs. In Payroll, one full-time FTE was eliminated as a budget efficiency and replaced with 0.5 part-time FTE to provide coverage during busier months. Two full-time positions were reallocated, one from Administration and one from Financial Planning to Development Financing and Investments to manage increasing demands related to growth and development charges. An additional two full-time FTE’s were reallocated from Financial Planning to the Asset Management and Strategy, Policy and Communications programs through a corporate re-organization.
• Activity Revenue is 46% of total revenues at $ 705,400. This includes fees for tax statements, tax special charges and ownership change fees. In 2021, revenues increased by $12,400 to align with current trends and forecasted volumes.
• Internal Recoveries are 43% of total revenues at $ 656,600. This represents capital recoveries for staff time spent on developing the 10 Year Capital Forecast, the Development Charges Study and overall capital reporting and project variance management. The budget for 2021 has decreased by $17,400 primarily due to temporary COVID reduction of $25,000 for the expected decrease in MAT revenue. Inflationary increases and minor adjustments for staffing recoveries have also been included.
• Other Revenue is 10% of total revenues at $ 157,200. It accounts for the investment interest recovery for Development Financing & Investments.
Financial Services Page 211

2022 - 2023 Operating Budget Forecast
Financial Services Page 212

2022 - 2023 Budget Forecast Highlights • The 2022 net budget is projected to increase by 2.1% or $ 101,100 and reflects inflationary increases to the cost of delivering services. Mention reversal of
temporary COVID impact from 2021 • The 2023 net budget is projected to increase by 2.7% or $ 130,100 and reflects inflationary increases to the cost of delivering services.
2021 Recommended Capital Budget The 2021 budget is shown below. Funding is included for updates to the Purchasing and Risk Management systems. Also included is funding to amend Development Charges By-law 2018-001 for the changes to the Development Charges Act, 1997 that are now proclaimed through Bill 108, the More Homes, More Choice Act.
Capital Budget Operating Impacts Project Project Title Classification 2021 2021 33102101 Development Charges Study Growth 50,000 33102102 Purchasing & Risk Mgmt System Updates Infrastructure Renewal 50,000
TOTAL 100,000
Financial Services Page 213

Financial Services Page 214

Program: Legal Services
Program Based Budget
2021 - 2023
Vision
• A team of skilled and dedicated professionals providing the highest level of in-house legal and real estate services and expertise to the town.
Mission
• The Legal Department provides expert and strategic legal and real estate services, professional advice, and time-sensitive support to Council and staff to ensure compliance with the law, and protect and advance the interests of the town.
Legal Services Page 215

Program Services The Legal Services program provides a full range of professional services and advice to Council and to all departments of the municipal corporation, with expertise in the fields of municipal and planning law and real estate transactions, to facilitate legally supportable decisions and actions and manage risks to the municipality.
Legal Services$1.5M
•Legal and strategic advice, research, and support to staff and Council•Negotiation, preparation, and review of legal documents, agreements, by-laws, and reports•Resolutions and enforcement proceedings of by-law infractions and administrative monetary penalties
Realty Services$0.3M
•Administration of land acquisitions, dispositions, and other real estate and leasehold interests and transactions•Administration of cash-in-lieu of parkland dedication•Title searches, registrations, and closings
Corporate Hearings & Litigation
$0.5M
•Litigation and advocacy before the courts, administrative tribunals, and other adjudicative authorities
Legal Services Page 216
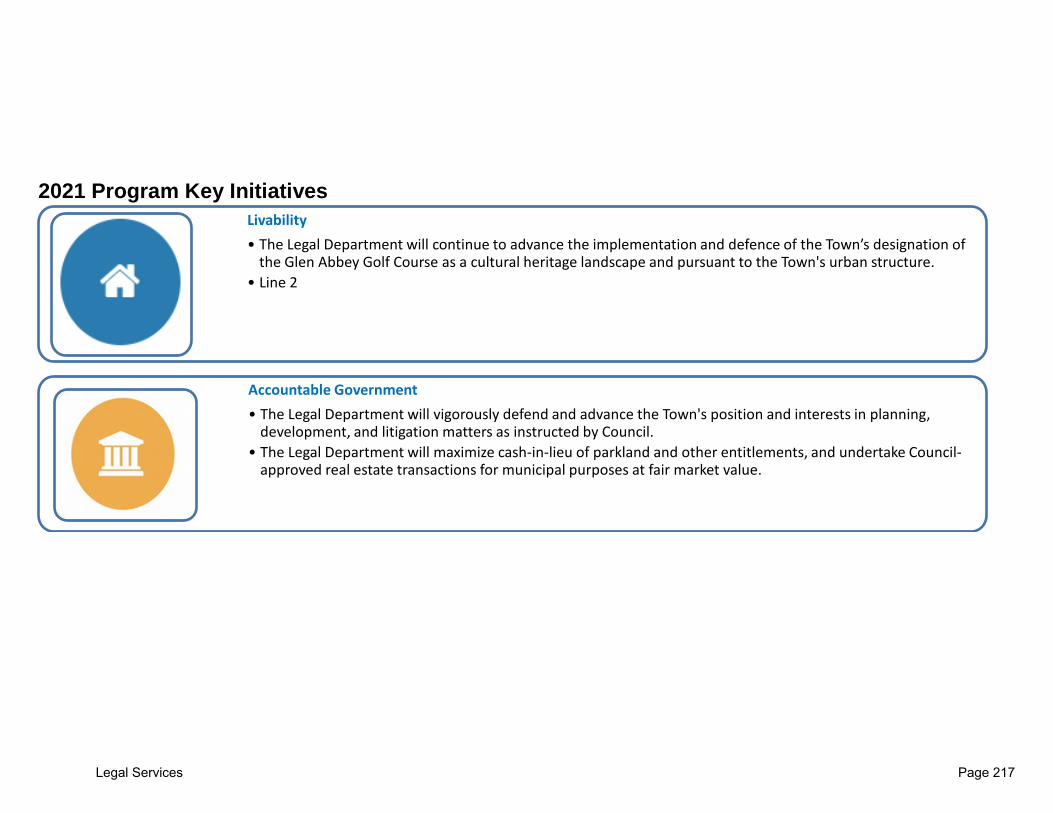
2021 Program Key Initiatives
Livability• The Legal Department will continue to advance the implementation and defence of the Town’s designation of
the Glen Abbey Golf Course as a cultural heritage landscape and pursuant to the Town's urban structure.• Line 2
Accountable Government• The Legal Department will vigorously defend and advance the Town's position and interests in planning,
development, and litigation matters as instructed by Council.• The Legal Department will maximize cash-in-lieu of parkland and other entitlements, and undertake Council-
approved real estate transactions for municipal purposes at fair market value.
Legal Services Page 217

Key Performance Indicators 1. Percentage of gross operating budget
2016 2017 2018 2019 2020 1.0% 1.0% 1.0% 1.0% 1.0%
Why Important: Monitors the cost of the program as a proportion of the total cost for the Town. How Calculated: Gross program operating costs (excluding transfers to reserves and internal charges) / Gross Town operating costs (excluding transfers to reserves and internal charges).
2. Percentage of total FTEs
2016 2017 2018 2019 2020 0.6% 0.6% 0.6% 0.6% 0.6%
Why Important: Assesses the capacity of the program by examining the proportion of staff expertise against the total Town FTEs. How Calculated: Total program FTEs, including part-time / Total Town FTEs, including part-time.
3. Number of proceedings, including LPAT appeals, resolved without going to litigation
2016 2017 2018 2019 2020 39 9 7 16 (Oct. 31, 2019) 24 (Oct. 31, 2020)
Why Important: Monitors the proportion of proceedings resolved to the satisfaction of the Town without incurring additional litigation costs. How Calculated: Total number of settled proceedings (excluding insured claims) for year to date.
4. Total value of cash-in-lieu of parkland dedication entitlements assessed by Realty Services
2016 2017 2018 2019 2020 $7,040,902 $2,544,359 $2,406,300 $23,035,243 (Oct. 31, 2019) $10,768,180 (Oct. 31, 2020)
Why Important: Monitors the value of cash in lieu of parkland dedication entitlements identified by Realty Services. How Calculated: Total value of all cash-in-lieu of parkland dedication entitlements identified by Realty Services for year to date.
5. Town’s livability through by-law compliance – successful enforcement through prosecutions
2016 2017 2018 2019 2020 96% 84% 93% 91% (Oct. 31, 2019) 80% (Oct. 31, 2020)
Why Important: Monitors the proportion of offences resulting in by-law compliance and/or conviction for non-compliance. How Calculated: Total number of proceedings resulting in by-law compliance and/or convictions / Total number of court dispositions for year to date.
Legal Services Page 218
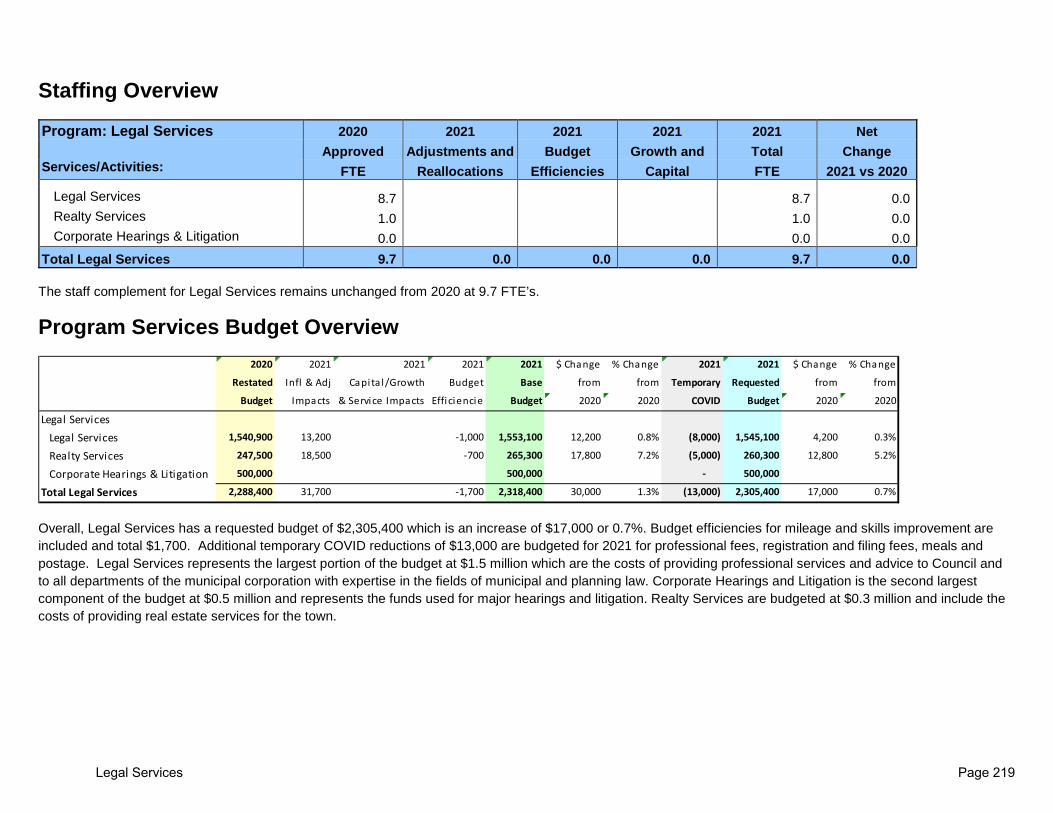
Staffing Overview
Program: Legal Services 2020 2021 2021 2021 2021 Net Approved Adjustments and Budget Growth and Total Change Services/Activities: FTE Reallocations Efficiencies Capital FTE 2021 vs 2020 Legal Services 8.7 8.7 0.0
Realty Services 1.0 1.0 0.0 Corporate Hearings & Litigation 0.0 0.0 0.0
Total Legal Services 9.7 0.0 0.0 0.0 9.7 0.0 The staff complement for Legal Services remains unchanged from 2020 at 9.7 FTE’s.
Program Services Budget Overview
Overall, Legal Services has a requested budget of $2,305,400 which is an increase of $17,000 or 0.7%. Budget efficiencies for mileage and skills improvement are included and total $1,700. Additional temporary COVID reductions of $13,000 are budgeted for 2021 for professional fees, registration and filing fees, meals and postage. Legal Services represents the largest portion of the budget at $1.5 million which are the costs of providing professional services and advice to Council and to all departments of the municipal corporation with expertise in the fields of municipal and planning law. Corporate Hearings and Litigation is the second largest component of the budget at $0.5 million and represents the funds used for major hearings and litigation. Realty Services are budgeted at $0.3 million and include the costs of providing real estate services for the town.
2020 2021 2021 2021 2021 $ Change % Change 2021 2021 $ Change % Change
Restated Infl & Adj Capita l/Growth Budget Base from from Temporary Requested from from
Budget Impacts & Service Impacts Efficiencie Budget 2020 2020 COVID Budget 2020 2020
Legal ServicesLegal Services 1,540,900 13,200 -1,000 1,553,100 12,200 0.8% (8,000) 1,545,100 4,200 0.3%
Realty Services 247,500 18,500 -700 265,300 17,800 7.2% (5,000) 260,300 12,800 5.2%
Corporate Hearings & Litigation 500,000 500,000 - 500,000
Total Legal Services 2,288,400 31,700 -1,700 2,318,400 30,000 1.3% (13,000) 2,305,400 17,000 0.7%
Legal Services Page 219

Net Program Budget Change • Legal Services has increasedby $4,200 primarily
for inflation to salaries and benefits, offset with reductions made for postage, mileage, office supplies professional fees, legal fees and registration and filing fees.
• Realty Services has increasedby $12,800 for increases to personnel and reductions to recovery. This was partially offset with reductions to professional fees associated with realty consultant reports and other realty activities, skills improvement and mileage.
• Corporate Hearings & Litigation budget has remained the same. Any shortfalls will be funded from the Rate Stabilization reserve.
-
5,000
10,000
15,000
Legal Services RealtyServices
CorporateHearings &LitigationNet Change
Legal Services Page 220

2021 Program Budget by Component - $2,305,400
2021 Expenditures $2.4M 2021 Revenues $0.1M
In 2021, the Legal Services program’s total expenditures are $2,358,700 and total revenues are $ 53,300, resulting in a net budget of $ $2,305,400. The net change from the prior year is $17,000 or 0.7%. The main drivers for this change are noted in the details below:
• Temporary COVID Impacts are included in the 2021 budget and total $13,000 for Legal Services. This includes temporary reductions for office supplies, mileage, legal fees, professional fees, meals and registration and filing fees.
• Personnel Services and Benefits is the largest component of the budget at $1.6 million, representing 69% of the total gross expenditures. In 2021, personnel costs have increased by $30,800, primarily due to inflationary increases on salaries and benefits.
• Purchased Services is the second largest component of the budget at $0.7 million and is mainly the cost of external legal and consulting services. The budget decreased by $23,900 for reductions to mileage, legal fees included in administration and for reductions to appraisal costs in professional fees for realty activities the associated recovery has also been reduced.
• Materials & Supplies is the third largest component with a budget of $0.05 million. The budget decreased by $1,300 for decreases made to postage and courier fees and office supplies.
• Activity Revenue has decreased by $16,000 for the external recoveries related to the professional fee decreases for Realty Services appraisal costs.
Personnel Services & Benefits,
$1,618,200
Materials & Supplies, $51,300
Purchased Services, $684,100
Other Expenditures,
$5,100
Activity Revenue, $21,500
Internal Recoveries,
$31,800
Legal Services Page 221
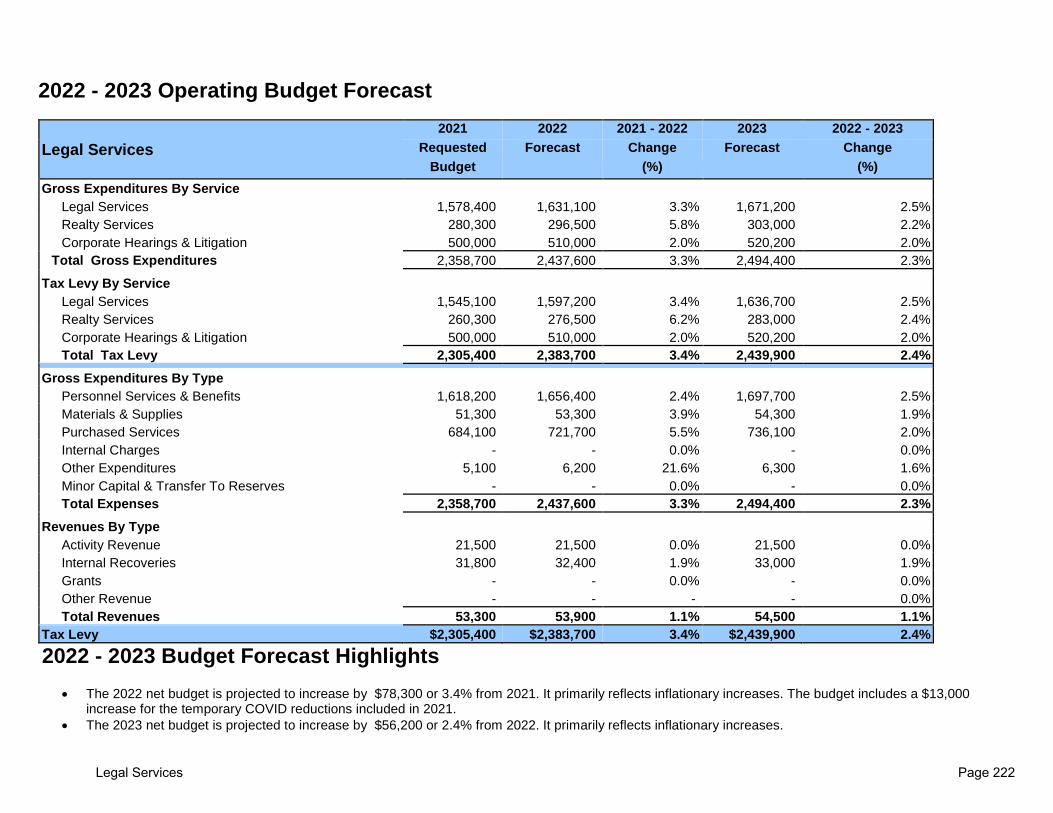
2022 - 2023 Operating Budget Forecast
Legal Services 2021 2022 2021 - 2022 2023 2022 - 2023
Requested Forecast Change Forecast Change Budget (%) (%)
Gross Expenditures By Service Legal Services 1,578,400 1,631,100 3.3% 1,671,200 2.5% Realty Services 280,300 296,500 5.8% 303,000 2.2% Corporate Hearings & Litigation 500,000 510,000 2.0% 520,200 2.0% Total Gross Expenditures 2,358,700 2,437,600 3.3% 2,494,400 2.3% Tax Levy By Service Legal Services 1,545,100 1,597,200 3.4% 1,636,700 2.5% Realty Services 260,300 276,500 6.2% 283,000 2.4% Corporate Hearings & Litigation 500,000 510,000 2.0% 520,200 2.0% Total Tax Levy 2,305,400 2,383,700 3.4% 2,439,900 2.4% Gross Expenditures By Type Personnel Services & Benefits 1,618,200 1,656,400 2.4% 1,697,700 2.5% Materials & Supplies 51,300 53,300 3.9% 54,300 1.9% Purchased Services 684,100 721,700 5.5% 736,100 2.0% Internal Charges - - 0.0% - 0.0% Other Expenditures 5,100 6,200 21.6% 6,300 1.6% Minor Capital & Transfer To Reserves - - 0.0% - 0.0% Total Expenses 2,358,700 2,437,600 3.3% 2,494,400 2.3% Revenues By Type Activity Revenue 21,500 21,500 0.0% 21,500 0.0% Internal Recoveries 31,800 32,400 1.9% 33,000 1.9% Grants - - 0.0% - 0.0% Other Revenue - - - - 0.0% Total Revenues 53,300 53,900 1.1% 54,500 1.1% Tax Levy $2,305,400 $2,383,700 3.4% $2,439,900 2.4%
2022 - 2023 Budget Forecast Highlights • The 2022 net budget is projected to increase by $78,300 or 3.4% from 2021. It primarily reflects inflationary increases. The budget includes a $13,000
increase for the temporary COVID reductions included in 2021. • The 2023 net budget is projected to increase by $56,200 or 2.4% from 2022. It primarily reflects inflationary increases.
Legal Services Page 222

2021 BUDGET – ENVIRONMENT OPERATING AND CAPITAL
Environment Page 223

Environment
Protect greenspace and promote environmentally sustainable practices.
• Ensure effective stewardship of the town’s natural environment • Create a climate change resilient community • Transition to a low carbon future
8% of 2021 Operating
Budget
46% of 2021 Capital Budget
Environment Page 224

2021 Operating Budget Summary
% of 2021 Operating Budget Funded by Tax Levy
PROGRAM
Total Expenses Net Budget Total Expenses Total Revenue Net Budget $ Change % Change
Parks & Open Space 23,352$ 17,957$ 23,552$ 4,415$ 19,137$ 1,180$ 7%Cemeteries 1,140$ 165$ 1,310$ 1,143$ 167$ 3$ 2%Harbours 2,092$ -$ 3,666$ 3,666$ -$ -$ 0%Total 26,585$ 18,122$ 28,528$ 9,224$ 19,304$ 1,183$ 7%
2020 Budget 2021 Budget
Environment Page 225

Environment Page 226

Program: Parks and Open Space
Program Based Budget
2021 - 2023
Vision
• A commitment to a better quality of life for individuals, families, businesses - today and tomorrow and to make Oakville the most livable town in Canada by developing and managing a safe and sustainable open space system for all our citizens to use and enjoy.
Mission
• A commitment to ensuring a diverse range of open space opportunities that preserves and enhances the quality of life for present and future generations. This will be accomplished by protecting and enhancing our heritage and environment, facilitating community partnerships and providing effective, efficient services through a dedicated and professional staff.
Parks and Open Space Page 227

Program Services Parks and Open Space provide activities through the following services:
Parks & Open Space Admin
• Overall supervision of department and ensure quality of customer service
Park Planning & Dev.
• Planning and development of new parkland and open space
• Implementation of parks master plans and capital infrastructure renewal
• Review planning applications, agreements and amendments for town parks and open space impact
Parks Mtc.
• Maintenance of parkland, horticulture beds, sports fields, trails and park pathways
• Snow and ice removal at town facilities
• Maintenance of park structures, equipment and assets
Forestry
• Maintenance of woodlots, trees along trail systems and large park trees, invasive species monitoring
• Annual tree planting program
$0.6M
$0.3M
$14.5M
$3.8M
Parks and Open Space Page 228
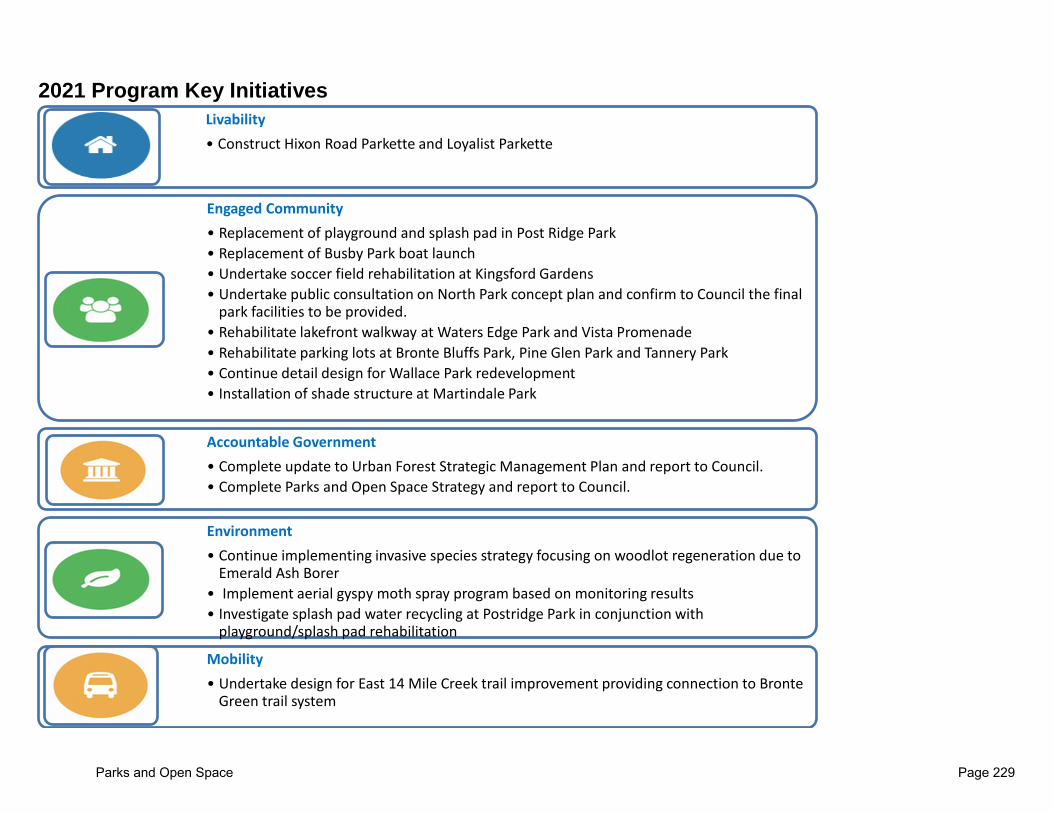
2021 Program Key Initiatives
Livability• Construct Hixon Road Parkette and Loyalist Parkette
Engaged Community• Replacement of playground and splash pad in Post Ridge Park• Replacement of Busby Park boat launch• Undertake soccer field rehabilitation at Kingsford Gardens• Undertake public consultation on North Park concept plan and confirm to Council the final
park facilities to be provided.• Rehabilitate lakefront walkway at Waters Edge Park and Vista Promenade• Rehabilitate parking lots at Bronte Bluffs Park, Pine Glen Park and Tannery Park• Continue detail design for Wallace Park redevelopment• Installation of shade structure at Martindale Park
Accountable Government• Complete update to Urban Forest Strategic Management Plan and report to Council.• Complete Parks and Open Space Strategy and report to Council.
Environment• Continue implementing invasive species strategy focusing on woodlot regeneration due to
Emerald Ash Borer• Implement aerial gyspy moth spray program based on monitoring results• Investigate splash pad water recycling at Postridge Park in conjunction with
playground/splash pad rehabilitation
Mobility• Undertake design for East 14 Mile Creek trail improvement providing connection to Bronte
Green trail system
Parks and Open Space Page 229
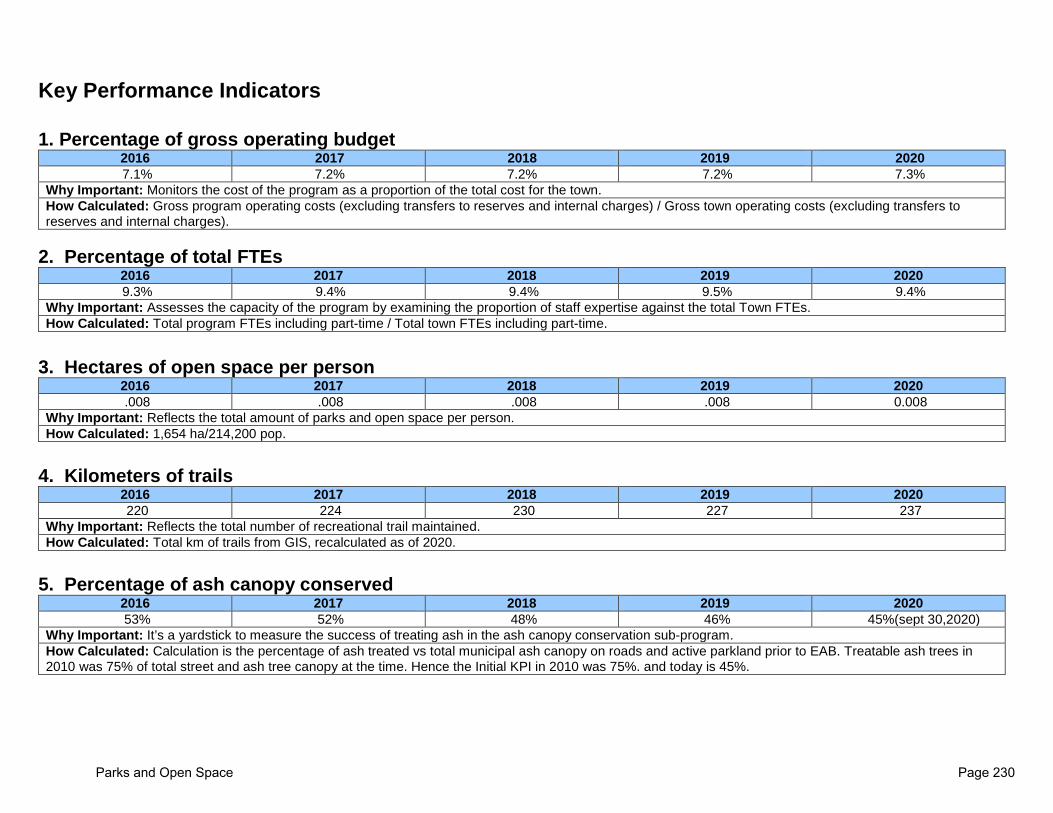
Key Performance Indicators 1. Percentage of gross operating budget
2016 2017 2018 2019 2020 7.1% 7.2% 7.2% 7.2% 7.3%
Why Important: Monitors the cost of the program as a proportion of the total cost for the town. How Calculated: Gross program operating costs (excluding transfers to reserves and internal charges) / Gross town operating costs (excluding transfers to reserves and internal charges).
2. Percentage of total FTEs
2016 2017 2018 2019 2020 9.3% 9.4% 9.4% 9.5% 9.4%
Why Important: Assesses the capacity of the program by examining the proportion of staff expertise against the total Town FTEs. How Calculated: Total program FTEs including part-time / Total town FTEs including part-time.
3. Hectares of open space per person
2016 2017 2018 2019 2020 .008 .008 .008 .008 0.008
Why Important: Reflects the total amount of parks and open space per person. How Calculated: 1,654 ha/214,200 pop.
4. Kilometers of trails
2016 2017 2018 2019 2020 220 224 230 227 237
Why Important: Reflects the total number of recreational trail maintained. How Calculated: Total km of trails from GIS, recalculated as of 2020.
5. Percentage of ash canopy conserved
2016 2017 2018 2019 2020 53% 52% 48% 46% 45%(sept 30,2020)
Why Important: It’s a yardstick to measure the success of treating ash in the ash canopy conservation sub-program. How Calculated: Calculation is the percentage of ash treated vs total municipal ash canopy on roads and active parkland prior to EAB. Treatable ash trees in 2010 was 75% of total street and ash tree canopy at the time. Hence the Initial KPI in 2010 was 75%. and today is 45%.
Parks and Open Space Page 230

Staffing Overview
Program: Parks and Open Space 2020 2021 2021 2021 2021 Net Approved Adjustments and Budget Growth and Total Change Services/Activities: FTE Reallocations Efficiencies Capital FTE 2021 vs 2020
Parks & Open Space Administration 2.7 2.7 0.0 Park Planning & Development 4.0 4.0 0.0 Parks Maintenance 122.4 1.9 124.3 1.9 Forestry 31.7 1.6 33.3 1.6
Total Parks and Open Space 160.8 0.0 0.0 3.5 164.3 3.5 Parks and Open Space staff complement has increase by 3.5 for a total of 164.3 FTE for 2021. The following provides details for the budget changes:
• The Parks Maintenance area requires a net increase staff complement of 1.9 FTEs. Impacts from capital projects and growth of 1.9 representing a seasonal small equipment operator, a seasonal utility 1 person, a seasonal labourer, and four students to support new neighbourhood parks, village square and trails in North Oakville.
• Forestry requires 1.6 FTE as a result of increased tree maintenance (watering) in the growth areas of North Oakville.
Program Services Budget Overview
2020 2021 2021 2021 2021 $ Change % Change 2021 2021 $ Change % Change
Restated Infl & Adj Capita l/Growth Budget Base from from Temporary Requested from from
Budget Impacts & Service Impacts Efficiencies Budget 2020 2020 COVID Impacts Budget 2020 2020
Parks & Open SpaceParks & Open Space Administration 555,300 17,300 3,500 576,100 20,800 3.7% -3,900 572,200 16,900 3.0%
Park Planning & Development 277,800 11,300 -2,000 287,100 9,300 3.3% -1,600 285,500 7,700 2.8%
Parks Maintenance 13,476,400 84,000 238,100 -2,200 13,796,300 319,900 2.4% 707,600 14,503,900 1,027,500 7.6%
Forestry 3,647,500 71,600 61,100 3,780,200 132,700 3.6% -5,100 3,775,100 127,600 3.5%
Total Parks & Open Space 17,957,000 184,200 302,700 -4,200 18,439,700 482,700 2.7% 697,000 19,136,700 1,179,700 6.6%
Parks and Open Space Page 231

The total requested budget of Parks & Open Space is $19,136,700, resulting in an increase of $1,179,700 or 6.6%. This includes Capital and Growth impacts of $302,700 which consists mainly of operating impacts to support new neighbourhood parks, village square, trails and as well as street trees planted in new North Oakville subdivisions. Also included in this are increases due to COVID that are one time in the amount of $697,000. These increases are mainly due to decreased revenues in adult and youth sportsfields. Before COVID the base budget had an increase of $482,700 or 2.7% compared to 2020. Within the base budget, Parks & Open Space has found efficiency savings of $4,200 which were reductions due to mileage. Other increases are due to inflationary and contractual obligations.
Parks Maintenance is the largest component of the net budget at 76% with $14.5 million which represents the cost to maintain and upkeep various parks and trails across town including activities such as grass cutting, sports field maintenance, horticulture, integrated pest management, sanitation services, maintenance of playground/splash pads and other amenities, and winter control at various town facilities. The second largest component is Forestry with a net budget of $3.8 million, which consist of costs for the preservation of the town’s tree canopy that includes street and park trees, woodlots and trees along trail systems. Parks Planning & Development section focuses on the planning and development of new parks and open space facilities, commenting on planning and development applications that impact parkand, along with the replacement and renewal of existing park infrastructure at a net budget of $0.3 million. Parks and Open Space Administration’s total net budget is $0.6 million and provides overall planning and customer service to client groups and stakeholders and ensures the efficient delivery of services to the community.
Parks and Open Space Page 232

Net Program Budget Change • Administration has increased by $16,900 due contractual
increases in salaries and an increase in insurance.
• Parks Planning and Development has increased by $7,700 mainly due to inflationary and contractual agreements in salaries and benefits.
• Parks Maintenance has increased by $1,027,500 mainly as result a result of a decrease in adult and youth sportsfield revenues. Additional adjustments are also seen in inflationary and contractual agreements to salaries and benefits and contracted services. The Parks Maintenance budget has been adjusted to reflect capital impacts to include personnel costs, utilities, contracted services and landscape material, for new parks that have been developed. COVID temporary reductions of $266,900 are comprised of temporary reductions of three gardeners and nine students for 17 weeks in the programs of Horticulture, IPM and sportsfields. Additional associated reductions are in vehicle rental and botanical supples. This reduction is due to a 15% reduction in planting and topdressing/overseeding. Parks maintenance is anticipating a large decline to due COVID in revenues from adult and youth sportsfields or $707,600.
• Forestry has increased by $127,600 as a result of inflationary and contractual agreements to salaries and benefits and contracted services for Oakville Hydro which are fully recovered. External revenues have also increased to fully recover all expenses related to Oakville Hydro. However due to COVID, professional fees, skills improvement and meals have been reduced by $5,100.
0
200,000
400,000
600,000
800,000
1,000,000
1,200,000
Parks & OpenSpace
Administration
Park Planning&
Development
ParksMaintenance
Forestry
Net…
Parks and Open Space Page 233

2021 Program Budget by Component– Net $19,136,700
The Parks and Open Space program’s total expenditures are $23,551,600 and total revenue is $ 4,414,900, resulting in a net budget of $19,136,700. In 2021, the budget has increased by $1,179,700 or 6.6%. The main drivers include:
• Personnel Services & Benefits is the largest cost component with $11.8 million representing 50% of the total gross expenditures. In 2021, personnel costs have increased by $170,200 and include inflationary and contractual increases for salaries and benefits. Capital impacts have increased due to a seasonal small equipment operator, a seasonal utility 1 person, a seasonal labourer, and four students due to support new neighbourhood parks, village square and trails in North Oakville. Forestry requires an additional 1.6 FTE as a result of increased tree maintenance (watering) in the growth areas in North Oakville. These increases are partially offset due to decreases in students and seasonals as a result of COVID-19.
• Materials and Supplies have increased by $11,300 which is primarily driven by increases in water, hydro and building materials for both capital impacts and to better reflect actuals to maintain new park infrastructure. These increases are partially offset by decreases in botanicals due to COVID-19.
• Purchased Services total $3.6 million, and have increased by $212,100. The majority of this increase is due to the increase of work requested by the Region in contracted services. This increase is partially mitigated by $45,000 in COVID-19 reductions in Integrated Pest Management and employee costs.
• Internal Charges is the second largest component with $5.5 million, which are primarily the costs charged by Fleet and Stores services to maintain parks vehicles and equipment. In 2021, internal charges were decreased by $195,400 to reflect decreased costs for, materials and labour for vehicle usage.
• Other Expenditures have increased by $700, to account for adjustments in licenses.
Parks and Open Space Page 234

• Activity Revenue represents 42% of the total revenue and includes sportfield rentals as well as recoveries from the Region and Hydro for services done on their behalf. In 2021, activity revenue has been decreased by $903,300 to reflect a decrease in sports field revenues and tree permit revenue as a result of COVID-19. These decreases have been partially offset by increases in recoveries for work expected to be completed for the Region an Oakville Hydro..
• Internal Recoveries are 58% of the total revenue, which have decreased by $59,800. This is mainly due to decreases in internal supervisor allocation as a result of back filling positions at a lower rate.
Parks and Open Space Page 235

2022 - 2023 Operating Budget Forecast
Parks & Open Spaces 2021 2022 2021 - 2022 2023 2022 - 2023
Requested Forecast Change Forecast Change Budget (%) (%)
Gross Expenditures By Service Parks & Open Space Administration 691,900 689,300 -0.4% 701,100 1.7% Park Planning & Development 576,500 590,300 2.4% 602,700 2.1% Parks Maintenance 17,550,400 18,736,500 6.8% 19,506,200 4.1% Forestry 4,732,800 4,852,400 2.5% 5,022,900 3.5% Total Gross Expenditures 23,551,600 24,868,500 5.6% 25,832,900 3.9% Tax Levy By Service Parks & Open Space Administration 572,200 530,400 -7.3% 542,200 2.2% Park Planning & Development 285,500 299,300 4.8% 311,700 4.1% Parks Maintenance 14,503,900 14,726,900 1.5% 15,455,400 4.9% Forestry 3,775,100 3,877,700 2.7% 4,030,900 4.0% Total Tax Levy 19,136,700 19,434,300 1.6% 20,340,200 4.7% Gross Expenditures By Type Personnel Services & Benefits 11,836,700 12,510,400 5.7% 12,818,200 2.5% Materials & Supplies 2,340,400 2,535,200 8.3% 2,703,000 6.6% Purchased Services 3,561,200 3,791,100 6.5% 4,004,200 5.6% Internal Charges 5,451,300 5,663,000 3.9% 5,933,200 4.8% Other Expenditures 168,000 173,400 3.2% 177,500 2.4% Minor Capital & Transfer To Reserves 194,000 195,400 0.7% 196,800 0.7% Total Expenses 23,551,600 24,868,500 5.6% 25,832,900 3.9% Revenues By Type Activity Revenue 1,945,000 2,918,300 50.0% 2,976,800 2.0% Internal Recoveries 2,465,700 2,472,500 0.3% 2,472,500 0.0% Grants - - 0.0% - 0.0% Other Revenue 4,200 43,400 (933.3%) 43,400 0.0% Total Revenues 4,414,900 5,434,200 23.1% 5,492,700 1.1% Tax Levy $19,136,700 $19,434,300 1.6% $20,340,200 4.7%
Parks and Open Space Page 236

2022 - 2023 Budget Forecast Highlights • The 2022 net budget is projected to increase by 1.6% or $ 297,600 and reflects inflationary increases for salaries and benefits as well as operational impacts
from capital to support new parks being built in North Oakville. These are partially offset by decreases in the COVID column as a result of reversing prior year COVID adjustments.
• The 2023 net budget is projected to increase by 4.7% or $ 905,900 and reflects inflationary increases for salaries and benefits as well as operational impacts from capital to support new parks and sportsfields being built in throughout Oakville.
2021 Recommended Capital Budget The capital budget will provide funds to maintain park infrastructure in a state of good repair, and provide parks and trails in new communities. The 2021 capital budget includes funding for the development of a parkette on the former St. Anne’s school site, along with new village squares and trails in North Oakville and the new Bronte Green subdivision. Annual maintenance of infrastructure is required for sports fields and courts, playgrounds, pathways, parking lots, and vehicle and equipment replacements. The Forestry program includes preventative maintenance, street tree planting, and invasive species control including the EAB Management program.
Parks and Open Space Page 237

Capital Budget Operating Impacts Project Project Title Classification 2021 2021 52211804 Avonhead Ridge Trail Extension Strategic Priorities 75,000 52211901 Loyalist Parkette (Staroak VS) Growth 520,000 52211902 Phase 2 Palermo Park Growth 130,000 52211908 St. Ann's Park (Hixon) Growth 500,000 52211909 StarOak NHS Trails Growth 190,000 52211911 Shorewood Promenade - West Growth 50,000 52212102 North Park Sports Park - South Parcel Growth 600,000 52212104 Uptown Core-Memorial Park Special Project Growth 832,000 52212105 Splash Pad - Southeast Oakville Strategic Priorities 52,000 52212106 Basketball Court - North Oakville Strategic Priorities 90,000 52212007 Wallace Park Redev and Washroom Exp/Reno Strategic Priorities 125,000 52272002 Woodlot Preventative Maintenance Infrastructure Renewal 75,000 52212010 Bronte Green (Merton) Parks and NHS Trails Growth 1,050,000 52271902 Preventative Maintenance Pruning Infrastructure Renewal 352,000 52252105 Martindale Park Playground Rehab Infrastructure Renewal 100,000 52261902 Cul-de-sac Rehabilitation Infrastructure Renewal 100,000 52242009 Postridge Park Playground and Splash Pad Rehab Infrastructure Renewal 550,000 52271903 Invasive Species Audit/Control Infrastructure Renewal 262,000 52242010 Playground Accessibility Improvements Infrastructure Renewal 52,000 52232102 East 14 Mile Creek Trail Growth 78,000 52222003 Bowbeer Park (Emgo VS) Growth 472,000 52252112 Shipyard Park Stairs Rehab Infrastructure Renewal 157,000 52262103 Bridge and Stair Renewal Infrastructure Renewal 75,000 52252111 Glen Oak Creek Trail N Playground Rehab Infrastructure Renewal 140,000 52242114 Oakville Park Irrigation Study Infrastructure Renewal 60,000 52282001 Parks Facilities Repairs Infrastructure Renewal 219,000 52242115 Pilgrim's Way Park Playground Rehab Infrastructure Renewal 77,000 52242106 Bishopstoke Park Minor Repairs Infrastructure Renewal 26,000 52211821 FD-Bronte Harbour Walkway Infrastructure Renewal 150,000 52252110 Sixteen Mile West Harbour Renewal Infrastructure Renewal 50,000 52242109 Pine Glen Park Parking Lot Infrastructure Renewal 208,000 52242113 Bloomfield Park Playground Rehab Infrastructure Renewal 150,000 52252113 Tannery Park Parking Lot Rehab Infrastructure Renewal 130,000 52242111 Ardleigh Park Minor Repairs Infrastructure Renewal 25,000 52292101 Parks Replacement Equipment Infrastructure Renewal 1,043,000
Parks and Open Space Page 238

Capital Budget Operating Impacts Project Project Title Classification 2021 2021 52262003 Pathway Rehabilitation Infrastructure Renewal 226,000 52242110 Kingsford Gardens Park Minor Repairs Infrastructure Renewal 47,000 52252114 Bronte Bluffs Park Parking Lot Rehab Infrastructure Renewal 172,000 52242112 Hopedale Park Minor Repairs Infrastructure Renewal 26,000 52242108 Sovereign Park Minor Repairs Infrastructure Renewal 31,000 52272003 Street Tree Planting Infrastructure Renewal 452,000 9,500 52292102 Park Signage Infrastructure Renewal 75,000 52242107 Pelee Woods Park Minor Repairs Infrastructure Renewal 47,000 52292001 Parks Growth Vehicles and Equipment Growth 280,000 48,300 52262102 Vista and Waters Edge Pathway Replacement Strategic Priorities 285,000 52272101 EAB Management Program Strategic Priorities 1,937,000 52272102 Gypsy Moth Aerial Spray Program Strategic Priorities 187,000 12,530,000 57,800
Parks and Open Space Page 239

Parks and Open Space Page 240

Parks and Open Space Page 241

Parks and Open Space Page 242

Parks and Open Space Page 243

Parks and Open Space Page 244
Program: Cemeteries
Program Based Budget
2021 - 2023
Vision
• A commitment to a better quality of life for individuals, families, businesses - today and tomorrow and to make Oakville the most livable town in Canada by developing and managing a safe and sustainable open space system for all our citizens to use and enjoy.
Mission
• To provide families and the community with attractive cemetery properties that are protected and preserved, and to provide a variety of cemetery products and services for the respectful disposition of the deceased while meeting legislated requirements.
Cemeteries Page 245

Program Services The Cemetery program provides activities through the following services:
Cemeteries
• Provide maintenance to Trafalgar Lawn Cemetery. This includes grounds maintenance, full burial, cremation burial, and installation of headstones and markers.
• Provide maintenance to seven pioneer cemeteries. These must be maintained under provincial legislation and obligation to families with interment rights.
$0.2M
Cemeteries Page 246

2021 Program Key Initiatives
Key Performance Indicators 1. Percentage of gross operating budget
2016 2017 2018 2019 2020 0.4% 0.3% 0.3% 0.3% 0.3%
Why Important: Monitors the cost of the program as a proportion of the total cost for the town. How Calculated: Gross program operating costs (excluding transfers to reserves and internal charges) / Gross town operating costs (excluding transfers to reserves and internal charges).
2. Percentage of total FTEs
2016 2017 2018 2019 2020 0.4% 0.4% 0.3% 0.3% 0.3%
Why Important: Assesses the capacity of the program by examining the proportion of staff expertise against the total town FTEs. How Calculated: Total program FTEs including part-time / total town FTEs including part-time.
Environment• Continue selling new graves as approved by BAO• Install new columbarium at Trafalgar Lawn Cemetery• Assess future fending and fnecing rehabilitation requirements for Pioneer Cemeteries
Cemeteries Page 247

Staffing Overview
Program: Cemeteries 2020 2021 2021 2021 2021 Net Approved Adjustments and Budget Growth and Total Change Services/Activities: FTE Reallocations Efficiencies Capital FTE 2021 vs 2020
Administration 1.5 1.5 0.0 Burials - Active Cemeteries 0.0 0.0 0.0 Maintenance - Active Cemeteries 2.1 2.1 0.0 Pioneer Cemeteries 1.8 1.8 0.0
Total Cemeteries 5.4 0.0 0.0 0.0 5.4 0.0 Cemeteries staff complement for 2021 is at 5.4 FTE. There is no change to the complement for 2021.
Program Services Budget Overview
Overall, the 2021 Cemeteries budget has increased by $2,800 or 1.7% for a net budget of $167,300 which represents the cost for preservation and care for historical locations known as Pioneer Cemeteries. The other 3 activities are all self supported by revenues with any surpluses or shortfalls being offset from the Cemetery reserve. These services include: Administration which is responsible for the overall care of the town cemeteries; Burials – Active Cemeteries; the care of the local cemeteries is budgeted in Maintenance – Active Cemeteries; and the preservation and care for historical locations are included in Pioneer Cemeteries.
2020 2021 2021 2021 2021 $ Change % Change 2021 2021 $ Change % Change
Restated Infl & Adj Capita l/Growth Budget Base from from Temporary Requested from from
Budget Impacts & Service Impacts Efficiencies Budget 2020 2020 COVID Impacts Budget 2020 2020
CemeteriesAdministration -53,500 8,000 -45,500 8,000 15.0% -45,500 8,000 15.0%
Maintenance - Active Cemeteries 210,200 100 210,300 100 210,300 100
Burials - Active Cemeteries -156,700 -8,100 -164,800 -8,100 -5.2% -164,800 -8,100 -5.2%
Pioneer Cemeteries 164,500 2,800 167,300 2,800 1.7% 167,300 2,800 1.7%
Total Cemeteries 164,500 2,800 167,300 2,800 1.7% 167,300 2,800 1.7%
Cemeteries Page 248

(10,000)
(8,000)
(6,000)
(4,000)
(2,000)
0
2,000
4,000
6,000
8,000
10,000
Administration Burials - ActiveCemeteries
Maintenance -Active
Cemeteries
PioneerCemeteries
2021 Net Change
Net Change
Net Program Budget Change
• Administration has increased by $8,000 as a result of an increase in the transfer to reserves required to balance the program.
• Burials – Active Cemeteries has decreased by ($8,100) as a result of a reduction in services fees.
• Maintenance – Active Cemeteries has increased by $100 as a result of contractual increases for staffing.
• Pioneer Cemeteries has increased by $2,800 as a result of an increase in service fees, and inflationary increases in staffing and an increase in vehicle maintenance partially offset by a decrease in marker sales.
Cemeteries Page 249

2021 Program Budget by Component – Net $167,300
The Cemeteries program has total gross expenditures of $1,309,800 and total revenue is $1,142,500 for a total net budget of $167,300. In 2021, the Cemetery budget has increased by $2,800. The main drivers of the budget are as follows:
• Personnel Services & Benefits is the second largest cost component for Cemeteries which represents 32% of the expense budget with $421,200. The 2021 budget has increased by $7,200 as a result of contractual increases for staff.
• Materials and Supplies budget totals $61,400. This has increased by $600 due to a small increase in motor vehicle parts. • Purchased Services is the third largest component at 16% of the expense budget with $205,300 and includes costs for contracted services to maintain
both active and pioneer cemeteries. Purchased Services also include budgets for security services, uniforms and professional development. For 2021, the budget has decreased by $6,300 mainly due to a reduction in insurance.
• Internal Charges provides 13% of the expense budget for Cemeteries and totals $174,300 which represents internal charges for vehicle and equipment maintenance as well as corporate overhead support. Internal Charges have increased by $6,300 due to increases in vehicle maintenance charges.
• Minor Capital & Transfer to Reserves is the largest component at $428,100 which represents 33% of the total expenses. In 2021, transfers to reserve have increased by $165,000 primarily due to the increase of the transfer to the Cemetery reserve and the perpetual care reserve as a result of increased perpetual care revenue.
• Activity Revenue for Cemeteries represents 86% of the total revenue; 2021 has increased by $167,000 due to an increase in plot sales and perpetual care fees.
Cemeteries Page 250

2022 - 2023 Operating Budget Forecast
Cemeteries 2021 2022 2021 vs 2022 2023 2022 vs 2023
Requested Forecast Change Forecast Change Budget (%) (%)
Gross Expenditures By Service Administration 636,200 794,800 24.9% 810,100 1.9% Burials - Active Cemeteries 36,000 36,600 1.7% 37,200 1.6% Maintenance - Active Cemeteries 332,200 336,800 1.4% 341,600 1.4% Pioneer Cemeteries 305,400 310,800 1.8% 316,900 2.0% Total Gross Expenditures 1,309,800 1,479,000 12.9% 1,505,800 1.8% Tax Levy By Service Administration (45,500) (46,900) 3.1% (48,400) 3.2% Burials - Active Cemeteries (164,800) (168,000) 1.9% (171,300) 2.0% Maintenance - Active Cemeteries 210,300 214,900 2.2% 219,700 2.2% Pioneer Cemeteries 167,300 170,500 1.9% 174,400 2.3% Total Tax Levy 167,300 170,500 1.9% 174,400 2.3% Gross Expenditures By Type Personnel Services & Benefits 421,200 430,400 2.2% 440,400 2.3% Materials & Supplies 61,400 62,500 1.8% 63,600 1.8% Purchased Services 205,300 209,300 1.9% 213,400 2.0% Internal Charges 174,300 174,300 0.0% 174,300 0.0% Other Expenditures 19,500 19,600 0.5% 19,700 0.5% Minor Capital & Transfer To Reserves 428,100 582,900 36.2% 594,400 2.0% Total Expenses 1,309,800 1,479,000 12.9% 1,505,800 1.8% Revenues By Type Activity Revenue 980,900 1,146,900 16.9% 1,169,800 (2.0%) Internal Recoveries - - 0.0% - 0.0% Grants - - 0.0% - 0.0% Other Revenue 161,600 161,600 0.0% 161,600 0.0% Total Revenues 1,142,500 1,308,500 14.5% 1,331,400 1.8% Tax Levy $167,300 $170,500 1.9% $174,400 2.3%
Cemeteries Page 251

2022 - 2023 Budget Forecast Highlights • The 2022 net budget is projected to increase by 1.9% or $ 3,200. The 2023 net budget is projected to increase by 2.3% or $ 3,900. • Although 2022 and 2023 have increased expenditures by inflationary adjustments and contractual obligations, the transfer to reserves has also been
increased to offset these adjustments.
2021 Recommended Capital Budget
The 2021 Capital budget for Cemeteries includes funding to keep the cemeteries and equipment in a state of good repair.
Capital Budget Operating Impacts Project Project Title Classification 2021 2021 52712001 Cemeteries Annual Provision Enterprise Initiatives 15,000 52712101 Cemeteries Software Replacement Enterprise Initiatives 101,000
TOTAL 116,000
Cemeteries Page 252

Program: Harbours
Program Based Budget
2021 - 2023
Vision
• A commitment to a better quality of life for individuals, families, businesses - today and tomorrow, and to make Oakville the most livable town in Canada by developing and managing a safe and sustainable open space system for all our citizens to use and enjoy.
Mission
• To provide the community with recreational boating and ancillary marine services at market value rates and operate the harbour services in an efficient and environmentally responsible and sustainable manner. Harbours service is responsible for the operation of Oakville and Bronte harbours serving approximately 490 boating customers. The day to day operation of the Harbours service is overseen by the Supervisor of Harbours and managed by the Harbours Administrator with support from full-time and part-time staff.
Harbours Page 253

Program Services The Harbours program provides activities through the following services:
Harbours
• Provide harbours services to mooring customers in Oakville and Bronte Harbours.
• Provision of full service marina in Bronte.
• Provide algae cleanup in Bronte.• Undertake dredging operations
as required.
$0M
Harbours Page 254

2021 Program Key Initiatives
Livability• Continue detail design on Phase 4 of West Sixteen Mile Landscape Rehabilitation• Complete Harbours Master Plan and report to Council
Engaged Community• Complete design and implement rehabilitation of launch ramp at Busby Park and accomodate kayak, canoe,
and paddle board water users• Complete report on Harbours and Coronation Park flood vulnerability study• Complete EA on Bronte inner harbour west seawall project and undertake public consultation
Accountable Government• Complete installation of steel dock program in Oakville harbour• Install new steps at Hillmer Park to ensure safe access to docks• Rehabilitate walkways in Bronte inner harbnour from previous flood damage• Rehabilitate steps at Shipyard Park
Environment• Extend Town's Clean Marine Program to Bronte Outer Harbour
Harbours Page 255

Key Performance Indicators 1. Percentage of gross operating budget
2016 2017 2018 2019 2020 0.5% 0.4% 0.4% 0.7% 0.7%
Why Important: Monitors the cost of the program as a proportion of the total cost for the town. How Calculated: Gross program operating costs (excluding transfers to reserves and internal charges) / Gross town operating costs (excluding transfers to reserves and internal charges).
2. Percentage of total FTEs
2016 2017 2018 2019 2020 0.5% 0.5% 0.5% 0.5% 0.5%
Why Important: Assesses the capacity of the program by examining the proportion of staff expertise against the total town FTEs. How Calculated: Total program FTEs including part-time / total town FTEs including part-time.
Harbours Page 256

Staffing Overview
Program: Harbours 2020 2021 2021 2021 2021 Net Approved Adjustments and Budget Growth and Total Change Services/Activities: FTE Realloctions Efficiencies Capital FTE 2021 vs 2020
Harbours 9.2 7.3 16.5 7.3
Total Harbours 9.2 0.0 0.0 7.3 16.5 7.3
Harbours staff complement has increased by 7.3 FTE as a result of acquiring the Bronte Outer Harbour and adding staff to operate and maintain the Harbour to our complement. The current FTE count is 16.5 FTE for 2021.
Program Services Budget Overview
The Harbours budget reflects all operating costs necessary to maintain the three (3) town harbours, Bronte Harbour and Oakville Harbour, as well as the Bronte Outer Harbour. The program is self-funded and budget increases are supported by revenue generated through fees. Although the Harbours program does not impact the tax levy, changes to the net budget have an impact to the Harbour reserve balance which may affect future capital purchases or projects.
2020 2021 2021 2021 2021 $ Change % Change 2021 2021 $ Change % Change
Restated Infl & Adj Capita l/Growth Budget Base from from Temporary Requested from from
Budget Impacts & Service Impacts Efficiencies Budget 2020 2020 COVID Impacts Budget 2020 2020
HarboursHarbours
CS-HARBOURS 798,600 169,200 323,000 1,290,800 492,200 61.6% -150,000 1,140,800 342,200 42.8%
CS-HRBS-OAKVILLE -264,300 -199,100 -463,400 -199,100 -75.3% 50,000 -413,400 -149,100 -56.4%
CS-HRBS-BRONTE -474,400 29,900 -444,500 29,900 6.3% 50,000 -394,500 79,900 16.8%
CS-BRONTE OUTER HARBOUR -59,900 -323,000 -382,900 -323,000 -539.2% 50,000 -332,900 -273,000 -455.8%
Total Harbours
Harbours Page 257

2021 Program Budget by Component – Net $0
Gross Program Budget Change • Harbours – The Harbours program is self-funded and any
changes to revenue or expenditures impacts the Harbours reserve. In 2021, the gross operating budget has increased by $1,573,800 which is primarily due taking over the Bronte Outer Harbour. This increased revenues and therefore the transfer to reserves also increased.
0
500,000
1,000,000
1,500,000
2,000,000
Harbours
Harbours Page 258

In 2021, the Harbours program’s total direct operating expenditures are $3,666,100 and anticipated revenues are $ 3,666,100, which results in a net revenue transfer to the Harbours reserve funds of $640,100. Overall program changes are described below.
• Personnel Services and Benefits is the largest expense at $1,481,800 and represents 40% of the expenses. Due to inflationary increases planned for salaries and benefits and the addition of the Bronte Outer Harbour, the costs have increased by $755,200.
• Materials & Supplies is the fifth largest component of the expense budget at 12% of the expenses. The majority of the increases of $340,700 are as a result of new fuel and utilities expenses for the Bronte Outer Harbour.
• Purchased Services is the third largest expense at $505,400 or 14% of total expenses. Purchased services have increased by $323,900 mainly due to property payment due to the Federal government.
• Internal Charges have decreased by $3,600 to reflect changes to Harbours for services provided by other departments. • Other Expenditures is the fourth largest component of the expense budget at $535,800 or 15% of total expenditures. For 2021, the Harbours budget
decreased by $143,100, due to the debt charges being eliminated. • Minor Capital & Transfer to Reserves is the second largest component of the expense budget at $640,100 or 17% of total expenditures. For 2021, the
budget has increased by $300,700. This is due to an increased transfer to the harbours reserve to balance the program. • Activity Revenues provides 98% of the revenue earned by Harbours. In 2021, the budget has increased by $1,572,600, mainly due to additional revenue
resulting from taking over the Bronte Outer Harbour.
Harbours Page 259
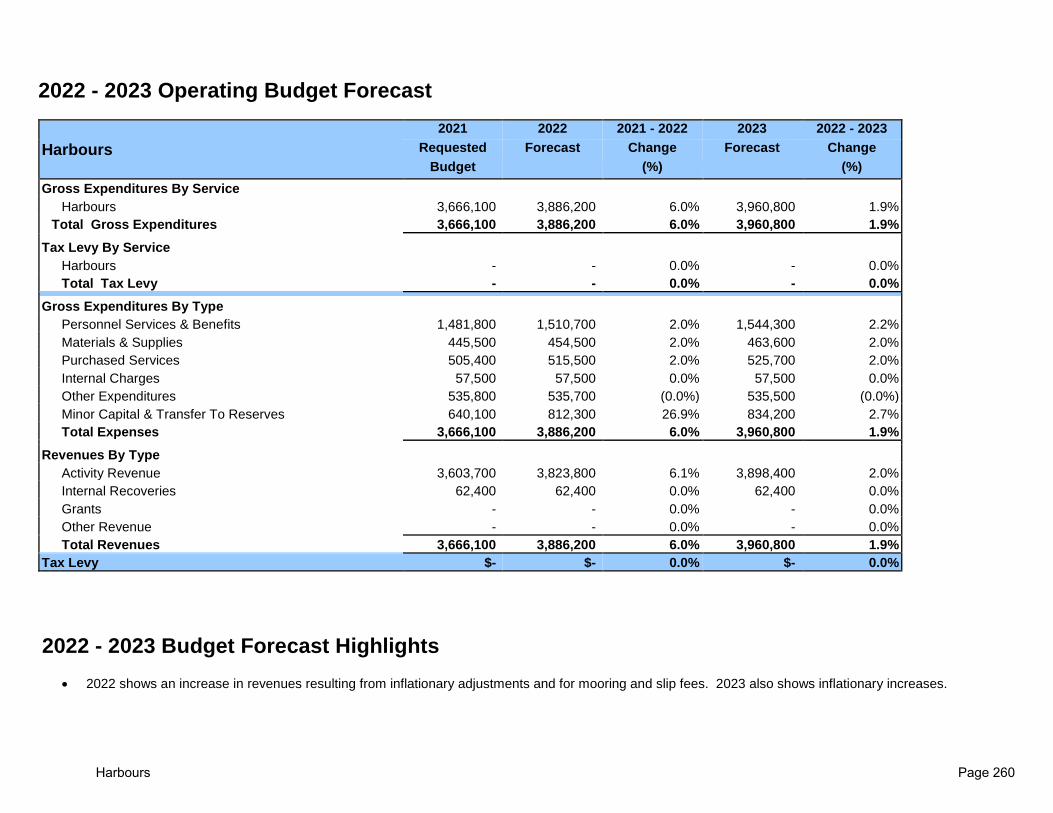
2022 - 2023 Operating Budget Forecast
Harbours 2021 2022 2021 - 2022 2023 2022 - 2023
Requested Forecast Change Forecast Change Budget (%) (%)
Gross Expenditures By Service Harbours 3,666,100 3,886,200 6.0% 3,960,800 1.9% Total Gross Expenditures 3,666,100 3,886,200 6.0% 3,960,800 1.9% Tax Levy By Service Harbours - - 0.0% - 0.0% Total Tax Levy - - 0.0% - 0.0% Gross Expenditures By Type Personnel Services & Benefits 1,481,800 1,510,700 2.0% 1,544,300 2.2% Materials & Supplies 445,500 454,500 2.0% 463,600 2.0% Purchased Services 505,400 515,500 2.0% 525,700 2.0% Internal Charges 57,500 57,500 0.0% 57,500 0.0% Other Expenditures 535,800 535,700 (0.0%) 535,500 (0.0%) Minor Capital & Transfer To Reserves 640,100 812,300 26.9% 834,200 2.7% Total Expenses 3,666,100 3,886,200 6.0% 3,960,800 1.9% Revenues By Type Activity Revenue 3,603,700 3,823,800 6.1% 3,898,400 2.0% Internal Recoveries 62,400 62,400 0.0% 62,400 0.0% Grants - - 0.0% - 0.0% Other Revenue - - 0.0% - 0.0% Total Revenues 3,666,100 3,886,200 6.0% 3,960,800 1.9% Tax Levy $- $- 0.0% $- 0.0%
2022 - 2023 Budget Forecast Highlights • 2022 shows an increase in revenues resulting from inflationary adjustments and for mooring and slip fees. 2023 also shows inflationary increases.
Harbours Page 260

2021 Recommended Capital Budget
The 2021 capital budget includes rehabilitation in Oakville and Bronte harbours as a result of flood damage, along with rehabilitation of the seawall at Busby Park including improvements to the launch ramp for community use.
Capital Budget Operating Impacts Project Project Title Classification 2021 2021 52902101 Harbours Equipment Replacement Enterprise Initiatives 40,000 52902103 FD-Oakville and Bronte Harbours Enterprise Initiatives 150,000 52902102 Busby Park Launch Ramp/Seawall Enterprise Initiatives 700,000
TOTAL 890,000
Harbours Page 261

Harbours Page 262
2021 BUDGET – MOBILTY OPERATING AND CAPITAL
Mobility Page 263

Mobility
Improve town’s multi-modal transportation network to support effective movement of people and goods.
• Plan, build and maintain road and parking infrastructure • Promote safe travel on town roads • Support opportunities for multi-modal transportation including walking, cycling and transit services
Mobility Page 264

2021 Operating Budget Summary
% of 2021 Operating Budget Funded by Tax Levy
PROGRAM
Total Expenses Net Budget Total Expenses Total Revenue Net Budget $ Change % Change
Infrastructure Maintenance 36,293$ 23,347$ 36,719$ 13,258$ 23,461$ 114$ 0%Oakville Transit 35,420$ 24,129$ 34,734$ 6,568$ 28,166$ 4,038$ 17%Infrastructure Planning & Improveme 3,974$ 2,317$ 4,333$ 1,730$ 2,603$ 286$ 0%Parking 4,670$ -$ 5,857$ 5,380$ 478$ 478$ 0%Total 80,358$ 49,793$ 81,644$ 26,936$ 54,708$ 4,915$ 10%
(in $1,000's)
2020 Budget 2021 Budget
Mobility Page 265

Mobility Page 266

Program: Infrastructure Planning & Improvements
Program Based Budget
2021 - 2023
Vision
• To meet the needs of our community today and tomorrow through the provision, management and rehabilitation of municipal transportation infrastructure.
Mission
• Provide safe and sustainable transportation infrastructure to keep residents and businesses of Oakville moving.
Infrastructure Planning and Improvements Page 267

Program Services The Infrastructure Planning and Improvements program provides:
Administration
• Overall leadership of department and ensure standard of customer satisfaction
Road Infrastructure Improvements
• Plan, design and construct capacity improvements to the transportation network for all modes of travel in order to address growing travel demands
Road Corridor Management
• Programs and strategies to ensure an efficient and safe road system through corridor enhancement, traffic calming, pedestrian safety and coordinating third party activies
$(0.1)M
$2.2M
$0.5M
Infrastructure Planning and Improvements Page 268
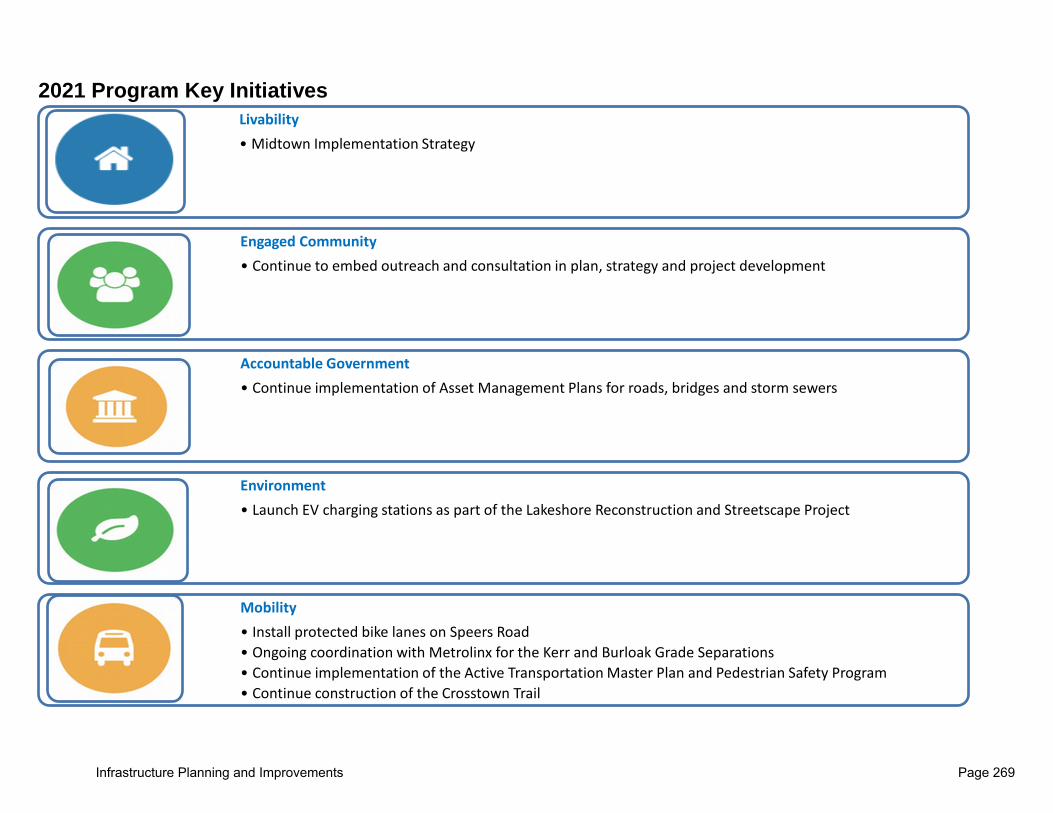
2021 Program Key Initiatives
Livability• Midtown Implementation Strategy
Engaged Community• Continue to embed outreach and consultation in plan, strategy and project development
Accountable Government• Continue implementation of Asset Management Plans for roads, bridges and storm sewers
Environment• Launch EV charging stations as part of the Lakeshore Reconstruction and Streetscape Project
Mobility• Install protected bike lanes on Speers Road• Ongoing coordination with Metrolinx for the Kerr and Burloak Grade Separations• Continue implementation of the Active Transportation Master Plan and Pedestrian Safety Program• Continue construction of the Crosstown Trail
Infrastructure Planning and Improvements Page 269
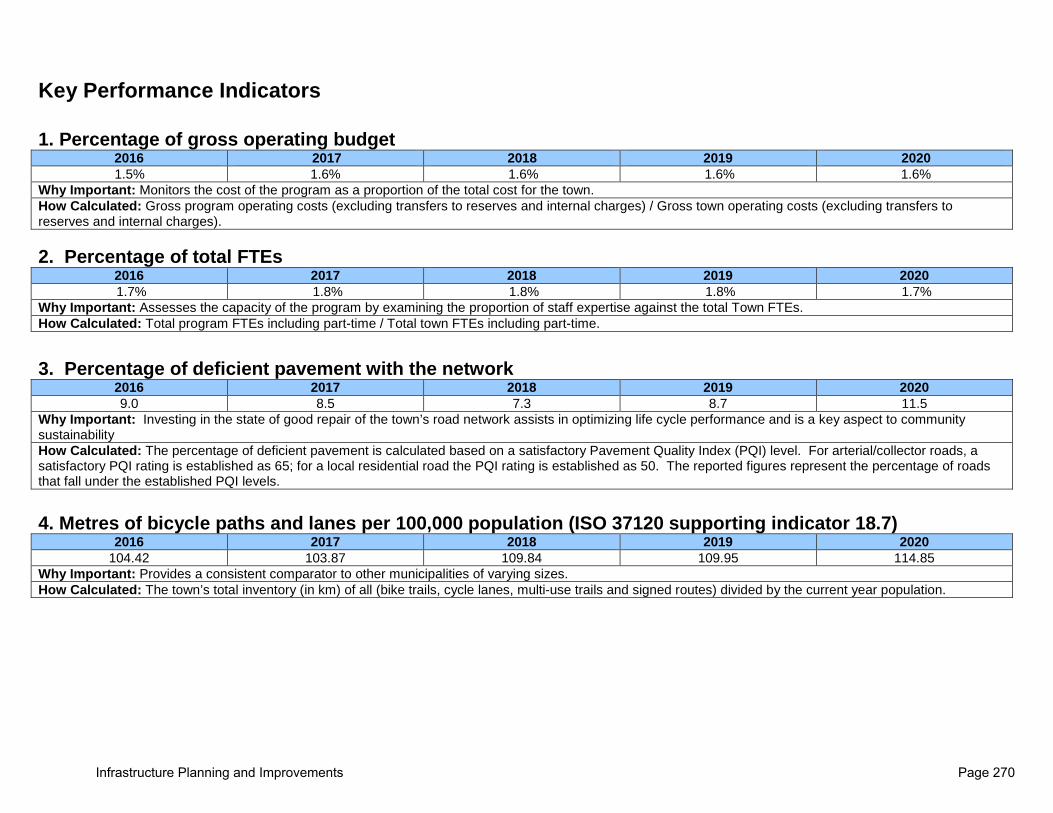
Key Performance Indicators 1. Percentage of gross operating budget
2016 2017 2018 2019 2020 1.5% 1.6% 1.6% 1.6% 1.6%
Why Important: Monitors the cost of the program as a proportion of the total cost for the town. How Calculated: Gross program operating costs (excluding transfers to reserves and internal charges) / Gross town operating costs (excluding transfers to reserves and internal charges).
2. Percentage of total FTEs
2016 2017 2018 2019 2020 1.7% 1.8% 1.8% 1.8% 1.7%
Why Important: Assesses the capacity of the program by examining the proportion of staff expertise against the total Town FTEs. How Calculated: Total program FTEs including part-time / Total town FTEs including part-time.
3. Percentage of deficient pavement with the network
2016 2017 2018 2019 2020 9.0 8.5 7.3 8.7 11.5
Why Important: Investing in the state of good repair of the town’s road network assists in optimizing life cycle performance and is a key aspect to community sustainability How Calculated: The percentage of deficient pavement is calculated based on a satisfactory Pavement Quality Index (PQI) level. For arterial/collector roads, a satisfactory PQI rating is established as 65; for a local residential road the PQI rating is established as 50. The reported figures represent the percentage of roads that fall under the established PQI levels. 4. Metres of bicycle paths and lanes per 100,000 population (ISO 37120 supporting indicator 18.7)
2016 2017 2018 2019 2020 104.42 103.87 109.84 109.95 114.85
Why Important: Provides a consistent comparator to other municipalities of varying sizes. How Calculated: The town’s total inventory (in km) of all (bike trails, cycle lanes, multi-use trails and signed routes) divided by the current year population.
Infrastructure Planning and Improvements Page 270

5. Kilometres of active transportation implemented per year
2016 2017 2018 2019 2020 18.2km 3.0km 19.5km 12.8km 17.8
Why Important: Monitors the success of implementation of the Active Transportation Master Plan How Calculated: Total length of new sidewalks, bike lanes, bike routes, and multiuse trails constructed per year, or total length of sidewalks, bike lanes, bike routes and multi-use trails constructed/total length of active transportation infrastructure (sidewalks, bike lanes, bike routes, multi-use trails) identified on the Active Transportation Master Plan network. 6. Traffic control system performance (intersection level of service) at acceptable levels
2016 2017 2018 2019 2020 98.6% 98.6% 98% 98.5% N/A
Why Important: Determines whether a signalized intersection is operating at acceptable levels of delay, on a scale of A to F. A location which is operating at LOS A, B, C or D is considered to have satisfactory operation with delays to motorists at acceptable levels (A-C) or reaching the upper limit of tolerable delays (D). When an intersection’s LOS is found to be LOS E or F, its levels of delay are not acceptable to motorists. Note: Unable to calculate in 2020 due to COVID. How Calculated: Percentage of signalized intersections at Level of Service A – D.
Infrastructure Planning and Improvements Page 271
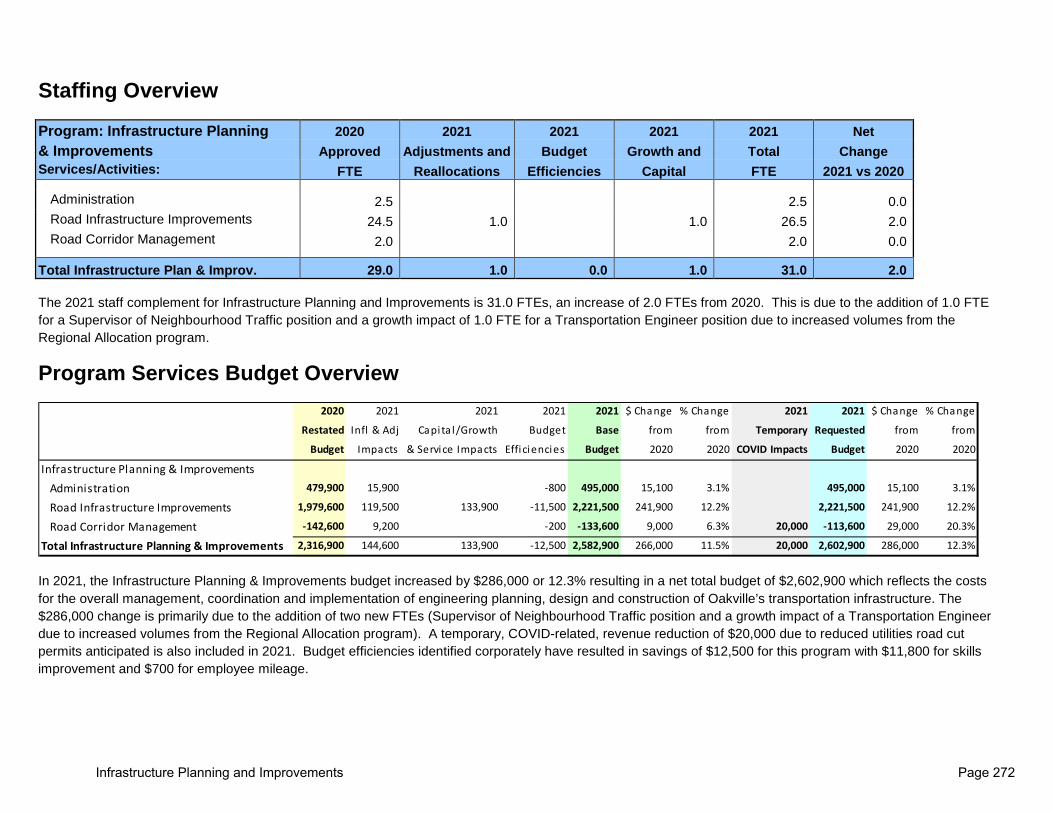
Staffing Overview
Program: Infrastructure Planning 2020 2021 2021 2021 2021 Net & Improvements Approved Adjustments and Budget Growth and Total Change Services/Activities: FTE Reallocations Efficiencies Capital FTE 2021 vs 2020
Administration 2.5 2.5 0.0 Road Infrastructure Improvements 24.5 1.0 1.0 26.5 2.0 Road Corridor Management 2.0 2.0 0.0
Total Infrastructure Plan & Improv. 29.0 1.0 0.0 1.0 31.0 2.0 The 2021 staff complement for Infrastructure Planning and Improvements is 31.0 FTEs, an increase of 2.0 FTEs from 2020. This is due to the addition of 1.0 FTE for a Supervisor of Neighbourhood Traffic position and a growth impact of 1.0 FTE for a Transportation Engineer position due to increased volumes from the Regional Allocation program.
Program Services Budget Overview
In 2021, the Infrastructure Planning & Improvements budget increased by $286,000 or 12.3% resulting in a net total budget of $2,602,900 which reflects the costs for the overall management, coordination and implementation of engineering planning, design and construction of Oakville’s transportation infrastructure. The $286,000 change is primarily due to the addition of two new FTEs (Supervisor of Neighbourhood Traffic position and a growth impact of a Transportation Engineer due to increased volumes from the Regional Allocation program). A temporary, COVID-related, revenue reduction of $20,000 due to reduced utilities road cut permits anticipated is also included in 2021. Budget efficiencies identified corporately have resulted in savings of $12,500 for this program with $11,800 for skills improvement and $700 for employee mileage.
2020 2021 2021 2021 2021 $ Change % Change 2021 2021 $ Change % Change
Restated Infl & Adj Capita l/Growth Budget Base from from Temporary Requested from from
Budget Impacts & Service Impacts Efficiencies Budget 2020 2020 COVID Impacts Budget 2020 2020
Infrastructure Planning & ImprovementsAdministration 479,900 15,900 -800 495,000 15,100 3.1% 495,000 15,100 3.1%
Road Infrastructure Improvements 1,979,600 119,500 133,900 -11,500 2,221,500 241,900 12.2% 2,221,500 241,900 12.2%
Road Corridor Management -142,600 9,200 -200 -133,600 9,000 6.3% 20,000 -113,600 29,000 20.3%
Total Infrastructure Planning & Improvements 2,316,900 144,600 133,900 -12,500 2,582,900 266,000 11.5% 20,000 2,602,900 286,000 12.3%
Infrastructure Planning and Improvements Page 272

Net Program Budget Change • Administration has increased by $15,100. This is primarily due
to inflationary adjustments for personnel and higher insurance costs.
• Road Infrastructure Improvements has increased by $241,900 primarily due to the addition of two new FTEs (Supervisor of Neighbourhood Traffic position and a growth impact of a Transportation Engineer position due to increased volumes from the Regional Allocation program).
• Road Corridor Management has increased by $29,000 primarily due to a temporary, COVID-related, revenue reduction of $20,000 due to reduced utilities road cut permits anticipated.
0
50,000
100,000
150,000
200,000
250,000
300,000
Administration RoadInfrastructureImprovements
Road CorridorManagement
Net Change
Infrastructure Planning and Improvements Page 273

2021 Program Budget by Component– Net $2,602,900
The Infrastructure Planning & Improvements program’s total expenditures are $4,333,200 and total revenues are $1,730,300, resulting in a net budget of $2,602,900. In 2021, the budget has increased by $286,000 or 12.3%. The main drivers are highlighted below.
• Personnel Services & Benefits is the largest cost component of the budget at $ 3.95 million representing 91% of the total gross expenditures. In 2021, personnel costs have increased by $353,100 primarily due to contractual and inflationary adjustments and the addition of two new FTEs (Supervisor of Neighbourhood Traffic position and a growth impact of a Transportation Engineer position due to increased volumes from the Regional Allocation program).
• Internal Charges have increased by $5,400 or $46.6% due to a new process to allocate out the costs related to the Fleet Driver Trainer to each department that uses this resource.
• Activity Revenue has decreased by $14,000 primarily due to a temporary, COVID-related, revenue reduction of $20,000 due to reduced utilities road cut permits anticipated. Inflationary increases for various permit fees have been included.
• Internal Recoveries which represent costs recovered from capital projects have increased by $87,000 or $7.1% due to time allocated to capital projects as well as inflation and contractual increases.
Infrastructure Planning and Improvements Page 274

2022 - 2023 Operating Budget Forecast
Infrastructure Planning and Improvements 2021 2022 2021 - 2022 2023 2022 -2023
Requested Forecast Change Forecast Change Budget (%) (%)
Gross Expenditures By Service Administration 497,000 507,900 2.2% 519,100 2.2% Road Infrastructure Improvements 3,549,000 3,619,900 2.0% 3,694,700 2.1% Road Corridor Management 287,200 292,200 1.7% 297,200 1.7% Total Gross Expenditures 4,333,200 4,420,000 2.0% 4,511,000 2.1% Tax Levy By Service Administration 495,000 505,900 2.2% 517,100 2.2% Road Infrastructure Improvements 2,221,500 2,265,900 2.0% 2,313,800 2.1% Road Corridor Management (113,600) (136,600) 20.2% (140,100) 2.6% Total Tax Levy 2,602,900 2,635,200 1.2% 2,690,800 2.1% Gross Expenditures By Type Personnel Services & Benefits 3,946,000 4,026,500 2.0% 4,111,100 2.1% Materials & Supplies 35,900 36,500 1.7% 37,100 1.6% Purchased Services 273,100 278,300 1.9% 283,600 1.9% Internal Charges 17,000 17,100 0.6% 17,200 0.6% Other Expenditures 20,500 20,800 1.5% 21,100 1.4% Minor Capital & Transfer To Reserves 40,700 40,800 0.2% 40,900 0.2% Total Expenses 4,333,200 4,420,000 2.0% 4,511,000 2.1% Revenues By Type Activity Revenue 421,300 449,600 6.7% 458,400 2.0% Internal Recoveries 1,309,000 1,335,200 2.0% 1,361,800 2.0% Grants - - 0.0% - 0.0% Other Revenue - - 0.0% - 0.0% Total Revenues 1,730,300 1,784,800 3.1% 1,820,200 2.0% Tax Levy $2,602,900 $2,635,200 1.2% $2,690,800 2.1% 2022 - 2023 Budget Forecast Highlights
• The 2022 net budget is projected to increase by 1.2% or $ 32,300 and reflects inflationary increases to the cost of delivering services. • The 2023 net budget is projected to increase by 2.1% or $ 55,600 and reflects inflationary increases to the cost of delivering services.
Infrastructure Planning and Improvements Page 275
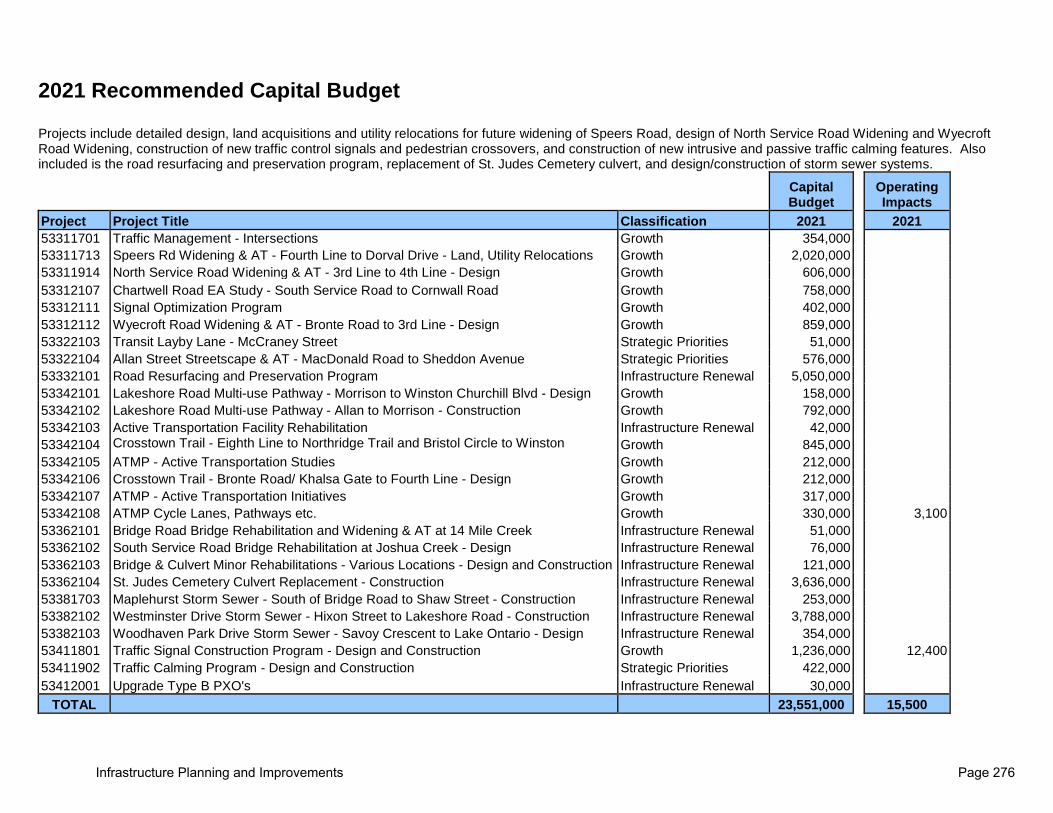
2021 Recommended Capital Budget
Projects include detailed design, land acquisitions and utility relocations for future widening of Speers Road, design of North Service Road Widening and Wyecroft Road Widening, construction of new traffic control signals and pedestrian crossovers, and construction of new intrusive and passive traffic calming features. Also included is the road resurfacing and preservation program, replacement of St. Judes Cemetery culvert, and design/construction of storm sewer systems.
Capital Budget
Operating Impacts
Project Project Title Classification 2021 2021 53311701 Traffic Management - Intersections Growth 354,000 53311713 Speers Rd Widening & AT - Fourth Line to Dorval Drive - Land, Utility Relocations Growth 2,020,000 53311914 North Service Road Widening & AT - 3rd Line to 4th Line - Design Growth 606,000 53312107 Chartwell Road EA Study - South Service Road to Cornwall Road Growth 758,000 53312111 Signal Optimization Program Growth 402,000 53312112 Wyecroft Road Widening & AT - Bronte Road to 3rd Line - Design Growth 859,000 53322103 Transit Layby Lane - McCraney Street Strategic Priorities 51,000 53322104 Allan Street Streetscape & AT - MacDonald Road to Sheddon Avenue Strategic Priorities 576,000 53332101 Road Resurfacing and Preservation Program Infrastructure Renewal 5,050,000 53342101 Lakeshore Road Multi-use Pathway - Morrison to Winston Churchill Blvd - Design Growth 158,000 53342102 Lakeshore Road Multi-use Pathway - Allan to Morrison - Construction Growth 792,000 53342103 Active Transportation Facility Rehabilitation Infrastructure Renewal 42,000 53342104 Crosstown Trail - Eighth Line to Northridge Trail and Bristol Circle to Winston
Growth 845,000
53342105 ATMP - Active Transportation Studies Growth 212,000 53342106 Crosstown Trail - Bronte Road/ Khalsa Gate to Fourth Line - Design Growth 212,000 53342107 ATMP - Active Transportation Initiatives Growth 317,000 53342108 ATMP Cycle Lanes, Pathways etc. Growth 330,000 3,100 53362101 Bridge Road Bridge Rehabilitation and Widening & AT at 14 Mile Creek Infrastructure Renewal 51,000 53362102 South Service Road Bridge Rehabilitation at Joshua Creek - Design Infrastructure Renewal 76,000 53362103 Bridge & Culvert Minor Rehabilitations - Various Locations - Design and Construction Infrastructure Renewal 121,000 53362104 St. Judes Cemetery Culvert Replacement - Construction Infrastructure Renewal 3,636,000 53381703 Maplehurst Storm Sewer - South of Bridge Road to Shaw Street - Construction Infrastructure Renewal 253,000 53382102 Westminster Drive Storm Sewer - Hixon Street to Lakeshore Road - Construction Infrastructure Renewal 3,788,000 53382103 Woodhaven Park Drive Storm Sewer - Savoy Crescent to Lake Ontario - Design Infrastructure Renewal 354,000 53411801 Traffic Signal Construction Program - Design and Construction Growth 1,236,000 12,400 53411902 Traffic Calming Program - Design and Construction Strategic Priorities 422,000 53412001 Upgrade Type B PXO's Infrastructure Renewal 30,000
TOTAL 23,551,000 15,500
Infrastructure Planning and Improvements Page 276

Infrastructure Planning and Improvements Page 277

Infrastructure Planning and Improvements Page 278

Infrastructure Planning and Improvements Page 279

Infrastructure Planning and Improvements Page 280

Infrastructure Planning and Improvements Page 281

Infrastructure Planning and Improvements Page 282
Program: Infrastructure Maintenance
Program Based Budget
2021 - 2023
Vision
• To meet the needs of our community through the support and maintenance of Oakville’s municipal transportation infrastructure network and water resource systems.
Mission
• Provide quality road, traffic and water resource systems maintenance and operations to the residents and businesses of Oakville.
Infrastructure Maintenance Page 283

Program Services The Infrastructure Maintenance program, as delivered through the department of Roads & Works Operations, is responsible for the maintenance and operation of the town’s transportation and water resource infrastructure systems. It manages the following service areas to achieve this:
Facilities & Admin
• Facility Maintenance & Administration of Operations
• Driver Safety & Collision Prevention
Fleet Operations
• Fleet Acquisition & Disposition
• Parts Inventory, Stores & Distribution
• Vehicle & Equipment Maintenance
Works Operations
• Road & Roadside Maintenance
• Bulk Loose Leaf Collection• Road Emergency Response• Winter Control• Stormwater System
Maintenance
Traffic Operations
• Traffic Control Device Maintenance
• Street Lighting• Crossing Guards
$1.9M
$(0.0)M
$13.8M
$7.8M
Infrastructure Maintenance Page 284
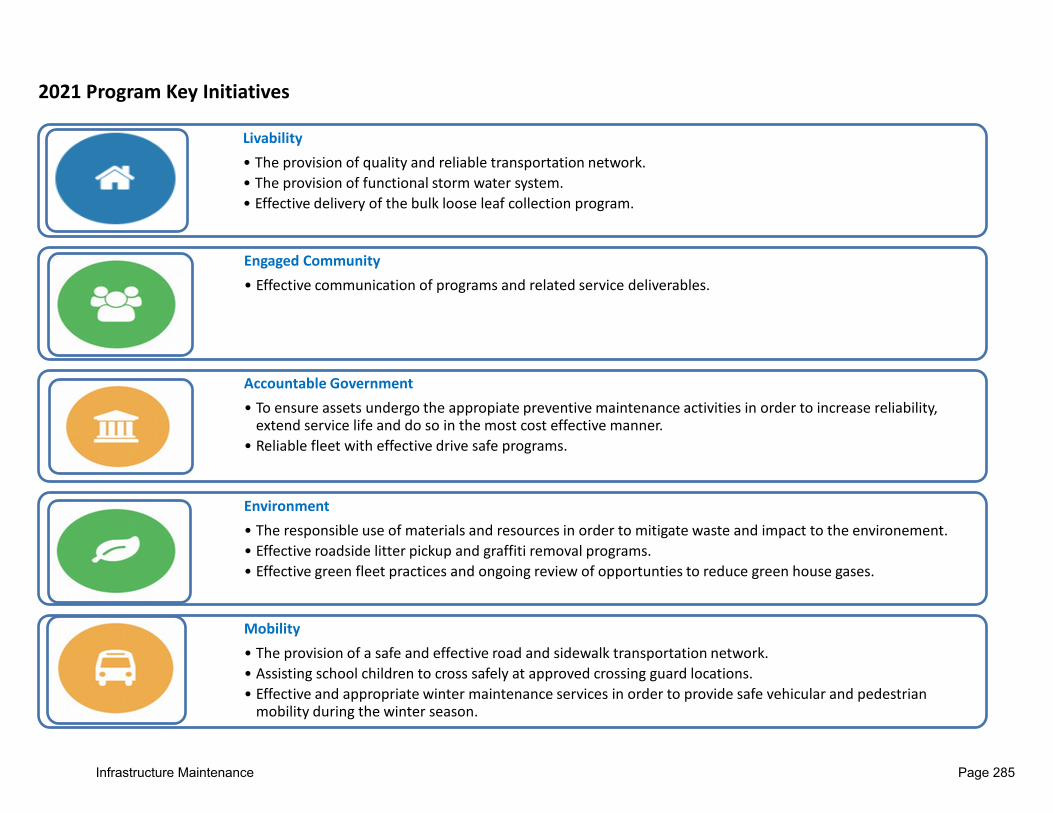
2021 Program Key Initiatives
Livability• The provision of quality and reliable transportation network.• The provision of functional storm water system. • Effective delivery of the bulk loose leaf collection program.
Engaged Community• Effective communication of programs and related service deliverables.
Accountable Government• To ensure assets undergo the appropiate preventive maintenance activities in order to increase reliability,
extend service life and do so in the most cost effective manner.• Reliable fleet with effective drive safe programs.
Environment• The responsible use of materials and resources in order to mitigate waste and impact to the environement. • Effective roadside litter pickup and graffiti removal programs.• Effective green fleet practices and ongoing review of opportunties to reduce green house gases.
Mobility• The provision of a safe and effective road and sidewalk transportation network. • Assisting school children to cross safely at approved crossing guard locations.• Effective and appropriate winter maintenance services in order to provide safe vehicular and pedestrian
mobility during the winter season.
Infrastructure Maintenance Page 285

Key Performance Indicators 1. Percentage of gross operating budget
2016 2017 2018 2019 2020 12.4% 12.4% 12.2% 12.1% 12.1%
Why Important: Monitors the cost of the program as a proportion of the total cost for the town. How Calculated: Gross program operating costs (excluding transfers to reserves and internal charges) / Gross town operating costs (excluding transfers to reserves and internal charges).
2. Percentage of total FTEs
2016 2017 2018 2019 2020 8.5% 8.6% 8.5% 8.4% 8.2%
Why Important: Assesses the capacity of the program by examining the proportion of staff expertise against the total town FTEs. How Calculated: Total program FTEs including part-time / total town FTEs including part-time.
3. Minimum maintenance standard deficiencies identified per lane kilometers
2016 2017 2018 2019 2020 0.25 0.23 0.21 0.16 0.22 projected (Oct. 30,
2020) Why Important: Assesses general road conditions with respect to provincial standards and provides ‘a state of good repair’ asset indicator. How Calculated: Minimum Maintenance Standard deficiencies identified (excluding street lights and sign retro-reflectivity) / total lane kilometer of town roads.
4. Percentage of citizens surveyed who are satisfied with town services (roads & sidewalks)
2016 2017 2018 2019 2020 85% (2015 Survey Results) 82% 82% (2017 Survey Results) 83% 83% (2019 Survey Results)
Why Important: To ensure we’re meeting the service expectations of our residents and to help us set our strategic priorities. How Calculated: To gather the opinions of local residents in the most comprehensive and efficient way, Pollara Strategic Insights conducted a 20-minute telephone survey among 805 randomly-selected residents of the Town of Oakville.
5. Percentage of respondents who were satisfied with winter road & sidewalk maintenance
2016 2017 2018 2019 2020 74% (2015 Survey Results) 88% 88% (2017 Survey Results) 76% 76% (2019 Survey Results)
Why Important: To ensure we’re meeting the service expectations of our residents and to help us set our strategic priorities. How Calculated: To gather the opinions of local residents in the most comprehensive and efficient way, Pollara Strategic Insights conducted a 20-minute telephone survey among 805 randomly-selected residents of the Town of Oakville.
Infrastructure Maintenance Page 286

6. Number of winter storm events that met town standard for snow clearing 2016 2017 2018 2019 2020 100%
(3 events) 100%
(7 events) 100%
(4 events) 100%
(6 events) 6 projected (Oct. 30, 2020)
Why Important: Assesses the performance of winter maintenance response for roads and sidewalks during the winter season. How Calculated: Response timelines are compared to established service levels for roads and sidewalks. Measured snow events are those which exceed 7.5cms and the seasonal number of events are indicated in brackets.
Infrastructure Maintenance Page 287
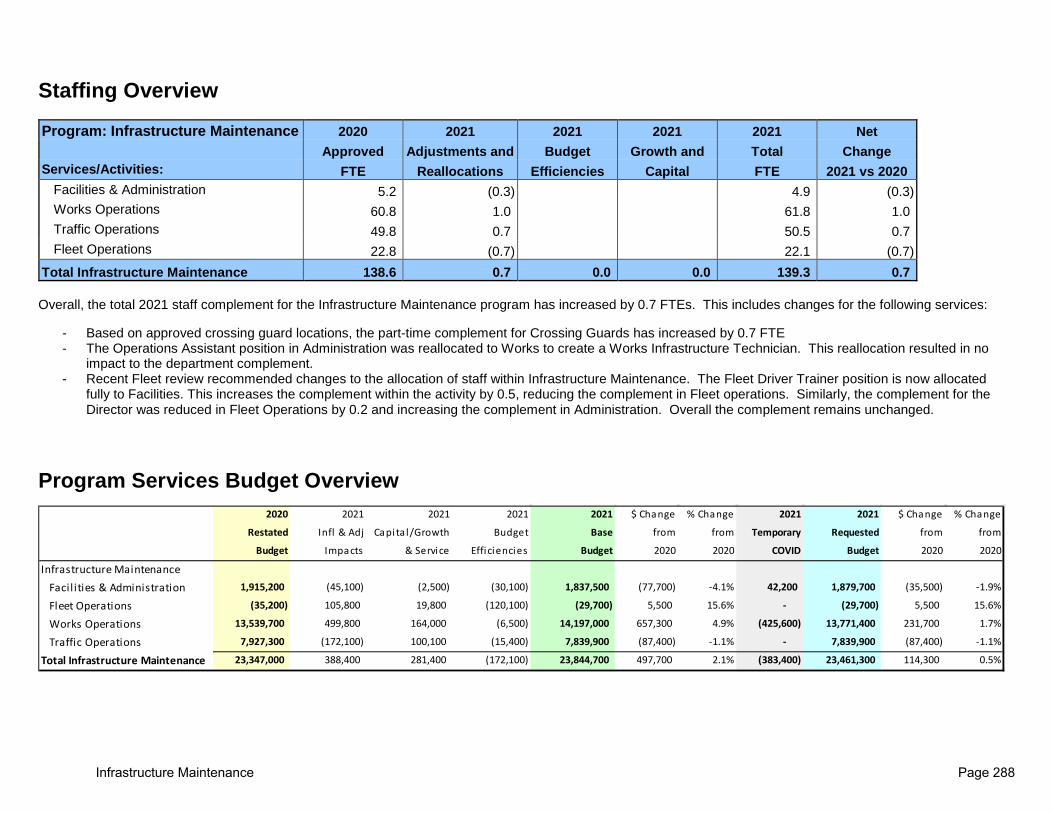
Staffing Overview
Program: Infrastructure Maintenance 2020 2021 2021 2021 2021 Net Approved Adjustments and Budget Growth and Total Change Services/Activities: FTE Reallocations Efficiencies Capital FTE 2021 vs 2020
Facilities & Administration 5.2 (0.3) 4.9 (0.3) Works Operations 60.8 1.0 61.8 1.0 Traffic Operations 49.8 0.7 50.5 0.7 Fleet Operations 22.8 (0.7) 22.1 (0.7)
Total Infrastructure Maintenance 138.6 0.7 0.0 0.0 139.3 0.7 Overall, the total 2021 staff complement for the Infrastructure Maintenance program has increased by 0.7 FTEs. This includes changes for the following services:
- Based on approved crossing guard locations, the part-time complement for Crossing Guards has increased by 0.7 FTE - The Operations Assistant position in Administration was reallocated to Works to create a Works Infrastructure Technician. This reallocation resulted in no
impact to the department complement. - Recent Fleet review recommended changes to the allocation of staff within Infrastructure Maintenance. The Fleet Driver Trainer position is now allocated
fully to Facilities. This increases the complement within the activity by 0.5, reducing the complement in Fleet operations. Similarly, the complement for the Director was reduced in Fleet Operations by 0.2 and increasing the complement in Administration. Overall the complement remains unchanged.
Program Services Budget Overview
2020 2021 2021 2021 2021 $ Change % Change 2021 2021 $ Change % Change
Restated Infl & Adj Capita l/Growth Budget Base from from Temporary Requested from from
Budget Impacts & Service Efficiencies Budget 2020 2020 COVID Budget 2020 2020
Infrastructure MaintenanceFacil ities & Administration 1,915,200 (45,100) (2,500) (30,100) 1,837,500 (77,700) -4.1% 42,200 1,879,700 (35,500) -1.9%
Fleet Operations (35,200) 105,800 19,800 (120,100) (29,700) 5,500 15.6% - (29,700) 5,500 15.6%
Works Operations 13,539,700 499,800 164,000 (6,500) 14,197,000 657,300 4.9% (425,600) 13,771,400 231,700 1.7%
Traffic Operations 7,927,300 (172,100) 100,100 (15,400) 7,839,900 (87,400) -1.1% - 7,839,900 (87,400) -1.1%
Total Infrastructure Maintenance 23,347,000 388,400 281,400 (172,100) 23,844,700 497,700 2.1% (383,400) 23,461,300 114,300 0.5%
Infrastructure Maintenance Page 288
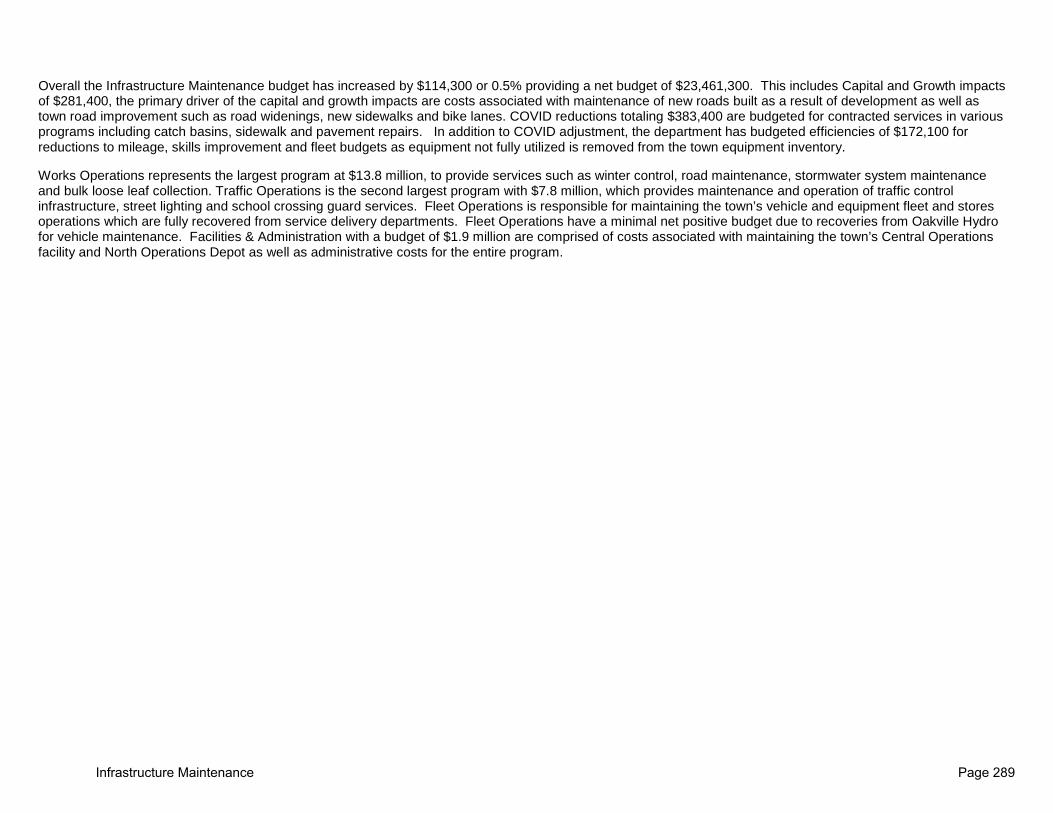
Overall the Infrastructure Maintenance budget has increased by $114,300 or 0.5% providing a net budget of $23,461,300. This includes Capital and Growth impacts of $281,400, the primary driver of the capital and growth impacts are costs associated with maintenance of new roads built as a result of development as well as town road improvement such as road widenings, new sidewalks and bike lanes. COVID reductions totaling $383,400 are budgeted for contracted services in various programs including catch basins, sidewalk and pavement repairs. In addition to COVID adjustment, the department has budgeted efficiencies of $172,100 for reductions to mileage, skills improvement and fleet budgets as equipment not fully utilized is removed from the town equipment inventory.
Works Operations represents the largest program at $13.8 million, to provide services such as winter control, road maintenance, stormwater system maintenance and bulk loose leaf collection. Traffic Operations is the second largest program with $7.8 million, which provides maintenance and operation of traffic control infrastructure, street lighting and school crossing guard services. Fleet Operations is responsible for maintaining the town’s vehicle and equipment fleet and stores operations which are fully recovered from service delivery departments. Fleet Operations have a minimal net positive budget due to recoveries from Oakville Hydro for vehicle maintenance. Facilities & Administration with a budget of $1.9 million are comprised of costs associated with maintaining the town’s Central Operations facility and North Operations Depot as well as administrative costs for the entire program.
Infrastructure Maintenance Page 289

Net Program Budget Change
• Facilities and Administration has decreased by $(35,500). Adjustments are primarily included for insurance, janitorial services necessary for additional facility cleaning, and building repair and personnel reallocations.
• Fleet Operations has increased by $5,500. Budget increases have been included for the transfer to vehicle and equipment reserves to ensure timely end of life replacement of assets. Additional budget adjustments are included for contracted services and insurance which are partially offset with reductions to various fleet budgets as a result of equipment reductions. Further changes include the percentage of Fleet Driver Training and Director included in Fleet.
• Works Operations has increased $231,700. Although COVID reductions totaling $425,600 are included in contracted services, as a result of increased costs associated with growth in the town road network the overall budget for Works has increased. Regional recoveries for winter control and other maintenance completed on behalf of the Region have partially offset increases.
• Traffic Operations has decreased $(87,400). Budget increases have been included for standby, contracted service, hydro, traffic supplies and signal parts which are offset with recoveries from the Region, area municipalities and internal departments.
(150,000)
(100,000)
(50,000)
0
50,000
100,000
150,000
200,000
250,000
Net Change
Infrastructure Maintenance Page 290

2021 Program Budget by Component – Net $ 23,461,300
2021 Expenditures $36.7M 2021 Revenues $13.3M
In the Infrastructure Maintenance program’s total expenditures are $36,718,800 and total revenues are $13,257,500, resulting in a net budget of $ 23,461,300. The net change from the prior year is $114,300 or .5%. The main drivers are the following:
• COVID reductions are included and total $383,400 mostly in contracted services for pavement repairs, catch basin maintenance and sidewalk and pathway maintenance. However as a result of increased volume of facility cleaning, janitorial services has increased by $37,200.
• Personnel Services & Benefits make up 34% of total expenditures with $12.4 million and is also the largest driver. Personnel costs have increased by $371,000 primarily due to inflationary adjustments for wages and benefits and contract obligations. Due to the increased number of crossing guard locations, the part-time budget has increased. Additional adjustments for overtime, shift premium and standby are added for 2021.
• Purchased Services make up 25% of total expenditures and is the second largest driver, which is comprised of contracted services and hired equipment to maintain the road networks throughout the various seasons, as well as maintaining the streetlights, fleet vehicles and stormwater systems. In 2021, purchased services have decreased by $(87,100). This is due to the COVID adjustments made in contracted services.
• Materials & Supplies make up 18% of total expenditures and includes de-icing materials for roads, utilities for Central Operations and North Operations, the street-lighting program, fuel for vehicles and electrical signal parts to maintain traffic signals. Materials & supplies have increased by $134,400 primarily due to increase for de-icing material, traffic supplies and signal parts.
Personnel Services & Benefits,
$12,359,400
Materials & Supplies,
$6,472,900Purchased Services,
$9,367,700
Internal Charges, $3,421,200
Other Expenditures,
$1,331,000Minor Capital & Transfer to Reserves,
$3,766,600
Activity Revenue,
$4,701,700Internal
Recoveries, $8,555,800
Infrastructure Maintenance Page 291

• Internal Charges are internal charges to the Works and Traffic Operations portions of the budget from Fleet and Stores for vehicle usage and maintenance as well as facility charges. Internal Charges have increased by $46,900 due to an increase to internal labour charges.
• Other Expenditures are mainly comprised of debt payments for the LED conversion program which have decreased by $(1,800). • Minor Capital & Transfer to Reserves are comprised of transfers to reserves for building maintenance, vehicle and equipment replacement and stormwater
system maintenance. Minor Capital & Transfer to Reserves have decreased by $(38,000) due to a decrease to the transfer to the equipment reserve resulting from equipment reductions. A recent fleet study identified various equipment which are not fully utilized. This equipment has been removed from the equipment inventory and the funding for the replacement of the equipment is not required. This has provided a reduction to the reserve transfer of $78,600.
• Internal Recoveries makes up 65% of total revenues and represent the recoveries in Fleet and Stores services for vehicle maintenance and stores costs charged to the various town departments. Internal Recoveries has increased by $114,400.
• Activity Revenue makes up 35% of total revenues and represent regional recoveries and overhead revenue for work done on behalf of external agencies such as Ministry of Transportation, Halton Region, Halton Hills and Oakville Hydro. Activity Revenue has increased by $196,700.
Infrastructure Maintenance Page 292

2022 - 2023 Operating Budget Forecast
Infrastructure Maintenance 2021 2022 2021 vs 2022 2023 2022 vs 2023
Requested Forecast Change Forecast Change Budget (%) (%)
Gross Expenditures By Service Facilities & Administration 2,896,900 2,851,300 -1.6% 2,896,200 1.6% Fleet Operations 7,584,900 7,887,700 4.0% 8,169,900 3.6% Works Operations 16,167,000 17,448,200 7.9% 18,033,000 3.4% Traffic Operations 10,070,000 10,432,900 3.6% 10,782,000 3.3% Total Gross Expenditures 36,718,800 38,620,100 5.2% 39,881,100 3.3% Tax Levy By Service Facilities & Administration 1,879,700 1,831,500 -2.6% 1,873,700 2.3% Fleet Operations (29,700) (29,700) 0.0% (29,700) 0.0% Works Operations 13,771,400 15,009,500 9.0% 15,550,500 3.6% Traffic Operations 7,839,900 8,170,700 4.2% 8,486,900 3.9% Total Tax Levy 23,461,300 24,982,000 6.5% 25,881,400 3.6% Gross Expenditures By Type Personnel Services & Benefits 12,359,400 12,777,700 3.4% 13,120,900 2.7% Materials & Supplies 6,472,900 6,660,900 2.9% 6,924,800 4.0% Purchased Services 9,367,700 10,499,300 12.1% 11,006,700 4.8% Internal Charges 3,421,200 3,421,800 0.0% 3,422,500 0.0% Other Expenditures 1,331,000 1,333,300 (0.2%) 1,335,300 0.2% Minor Capital & Transfer To Reserves 3,766,600 3,927,100 4.3% 4,070,900 3.7% Total Expenses 36,718,800 38,620,100 5.2% 39,881,100 3.3% Revenues By Type Activity Revenue 4,701,700 4,780,800 1.7% 4,861,400 1.7% Internal Recoveries 8,555,800 8,779,000 2.6% 9,060,000 3.2% Grants - - 0.0% - 0.0% Other Revenue - 78,300 0.0% 78,300 0.0% Total Revenues 13,257,500 13,638,100 2.9% 13,999,700 2.7% Tax Levy $23,461,300 $24,982,000 6.5% $25,881,400 3.6%
Infrastructure Maintenance Page 293

2022 - 2023 Budget Forecast Highlights
• The 2022 net budget is projected to increase by 6.5% or $ 1,520,700 and reflects inflationary increases to the cost of delivering services. In addition, covid adjustments included in the 2021 budget were removed for 2022. This provided an increase of $383,400 to the budget.
• The 2023 net budget is projected to increase by 3.6% or $ 899,400 and reflects inflationary increases to the cost of delivering services.
2021 Recommended Capital Budget The capital budget for Infrastructure Maintenance provides funds to ensure that traffic, fleet, and facility assets are maintained to a state of good repair mitigating unscheduled breakdowns as well as avoiding higher repair and maintenance costs. The Roads and Works Replacement Equipment schedule is based on life-cycle, condition, and usage metrics from the town's vehicle and equipment asset registry. The Roads and Works Growth Equipment budget provides for new vehicles and equipment which have been identified as a requirement to provide services to growth areas in the town, also ensuring associated future operating costs for this equipment are captured. The Central and North Operations Depot Capital Replacement budgets ensure that building equipment and systems maintain service levels and run at optimum efficiency. Traffic operations continues to repair and replace scheduled hardware and controllers on traffic signals through the various traffic signal capital listed below.
Infrastructure Maintenance Page 294

Capital Budget Operating Impacts Project Project Title Classification 2021 2021 51312101 Central Ops - Furniture Replacement Infrastructure Renewal 5,000 51312102 Central Operations Depot Capital Replacement Infrastructure Renewal 196,000 51312103 North Ops Capital Replacements Infrastructure Renewal 101,000 51322002 Roads and Works Growth Equipment Growth 50,000 6,600 51322101 Roads and Works Replacement Equipment Infrastructure Renewal 1,341,000 51612001 Traffic Signal Hardware Replacement Infrastructure Renewal 382,000 51612002 Major Traffic Signal Repairs Infrastructure Renewal 55,000 51612004 Traffic Signal Interconnect Infrastructure Renewal 67,000 51612005 Traffic Signal Controller Replacement Infrastructure Renewal 408,000 51631802 Streetlight Rehabilitation Infrastructure Renewal 55,000
TOTAL 2,660,000 6,600
Infrastructure Maintenance Page 295

Infrastructure Maintenance Page 296
Program: Oakville Transit
Program Based Budget
2021 – 2023
Vision
• To provide a viable and sustainable transportation option through innovative, responsive and customer focused service delivery.
Mission• To provide a safe, reliable, convenient and efficient public transit service.
Oakville Transit Page 297

Program Services The Oakville Transit program provides activities through the following services:
Transit Admin
• Providing leadership in the administration and management of all transit staff, services and functions
Transit Operations
• Delivery of scheduled fixed route conventional transit services, On-Demand, Specialized, Late Night Zone, Seniors Specials, School Specials and special event services
Transit Fleet and Mtce
• Maintenance of transit vehicle assets through provision of scheduled and unscheduled servicing of all transit vehicles
Transit Planning and
Accessible Services
• Planning and scheduling of all transit services (fixed route accessible conventional, On-Demand and specialized services)
$0.4M
$9.5M
$14.8M
$3.4M
Oakville Transit Page 298

2021 Program Key Initiatives
Livability• Initiate project to introduce fleet wide onboard WiFi• Safely and efficiently reintroduce service levels in response to increases in demand
Engaged Community• Launch of mobile app enabling transit customer self-serve trip management capability
Environment• Complete battery electric bus Needs Assessment and Rollout Plan• Award contract(s) for acquisition of Battery Electric buses and associated charging infrastructure
Mobility• Launch updated On-Demand real-time scheduling software• Build back service levels in response to demonstrated demand• Launch of two year bus stop infrastructure improvement plan to achieve 100% accessibility
Oakville Transit Page 299
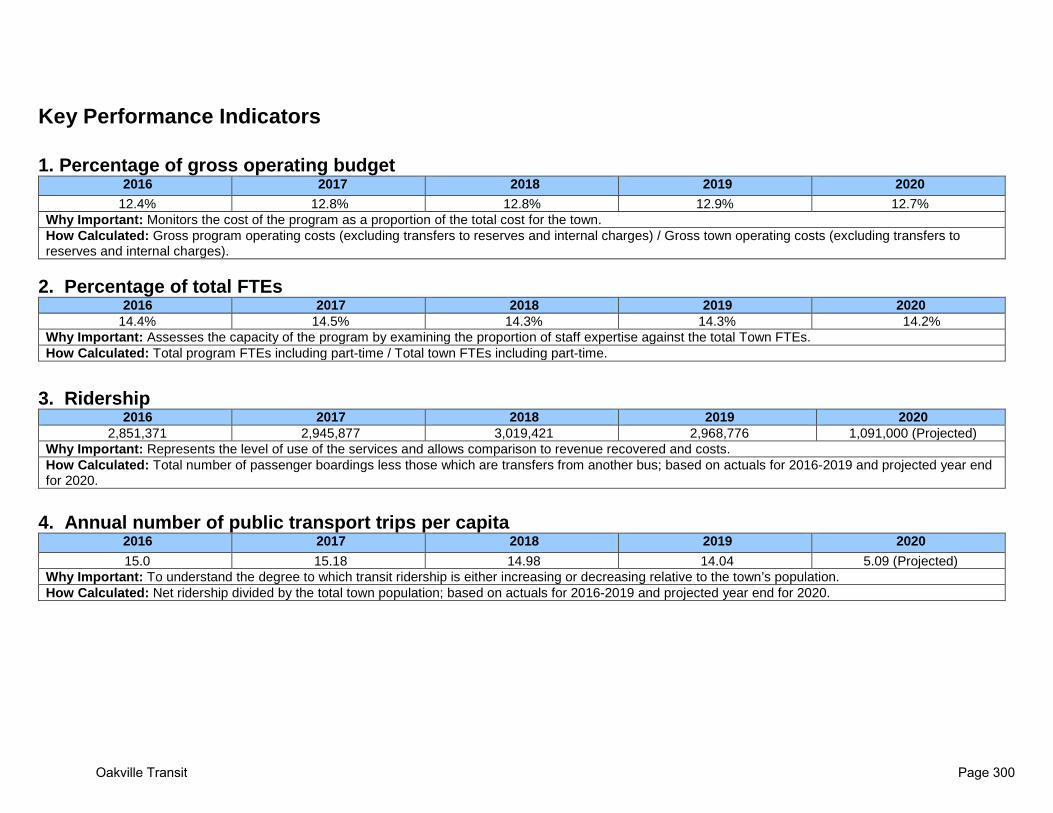
Key Performance Indicators 1. Percentage of gross operating budget
2016 2017 2018 2019 2020 12.4% 12.8% 12.8% 12.9% 12.7%
Why Important: Monitors the cost of the program as a proportion of the total cost for the town. How Calculated: Gross program operating costs (excluding transfers to reserves and internal charges) / Gross town operating costs (excluding transfers to reserves and internal charges).
2. Percentage of total FTEs
2016 2017 2018 2019 2020 14.4% 14.5% 14.3% 14.3% 14.2%
Why Important: Assesses the capacity of the program by examining the proportion of staff expertise against the total Town FTEs. How Calculated: Total program FTEs including part-time / Total town FTEs including part-time.
3. Ridership
2016 2017 2018 2019 2020 2,851,371 2,945,877 3,019,421 2,968,776 1,091,000 (Projected)
Why Important: Represents the level of use of the services and allows comparison to revenue recovered and costs. How Calculated: Total number of passenger boardings less those which are transfers from another bus; based on actuals for 2016-2019 and projected year end for 2020.
4. Annual number of public transport trips per capita
2016 2017 2018 2019 2020 15.0 15.18 14.98 14.04 5.09 (Projected)
Why Important: To understand the degree to which transit ridership is either increasing or decreasing relative to the town’s population. How Calculated: Net ridership divided by the total town population; based on actuals for 2016-2019 and projected year end for 2020.
Oakville Transit Page 300

5. Transit on-time performance 2016 2017 2018 2019 2020
72.4% 84.1% 84.5% 83.1% 84.8% (YTD Sept.) Why Important: This measures the reliability of transit services. How Calculated: This KPI relies on ITS to measure deviations from schedule. “On-time” is defined as a bus being no more than 1 minute ahead of schedule and no more than 3 minutes behind schedule; based on actuals for 2016-2019 and year to date for 2020.
6. Subsidy (tax levy per ride)
2016 2017 2018 2019 2020
5.99 5.89 6.27 6.27 18.04 (YTD Sept.) Why Important: Measures the degree to which cost of providing service is being shared between transit customers and taxpayers. How Calculated: The total net direct operating costs of conventional service divided by the number of conventional service rides; based on actuals for 2016-2019 and year to date for 2020.
7. Preventable accidents safety rating
2016 2017 2018 2019 2020 0.68 0.38 0.56 0.68 0.48 (YTD Sept.)
Why Important: Measures the effectiveness of driver training and of driver performance. How Calculated: The number of preventable collisions per 100,000 kms driven; based on actuals for 2016-2019 and year to date for 2020.
8. Cost recovery ratio - conventional
2016 2017 2018 2019 2020 28.4% 29.44% 29.12% 29.52% 13.07% (YTD Sept.)
Why Important: Measures the portion of operating costs recovered from external sources (fares, advertising, etc.). How Calculated: Total External Revenue / Gross Expenditures; based on actuals for 2016-2019 and year to date for 2020 (excludes Gas Tax funding) NOTE: administrative costs and building costs are fully included within the conventional cost recovery ratio.
9. Cost recovery ratio – specialized
2016 2017 2018 2019 2020 8.4% 7.92% 7.62% 7.34% 5.14% (YTD Sept.)
Why Important: Measures the portion of operating costs recovered from external sources (fares, advertising, etc.). How Calculated: Total External Revenue / Gross Expenditures; based on actuals for 2016-2019 and year to date for 2020 (excludes Gas Tax funding).
Oakville Transit Page 301
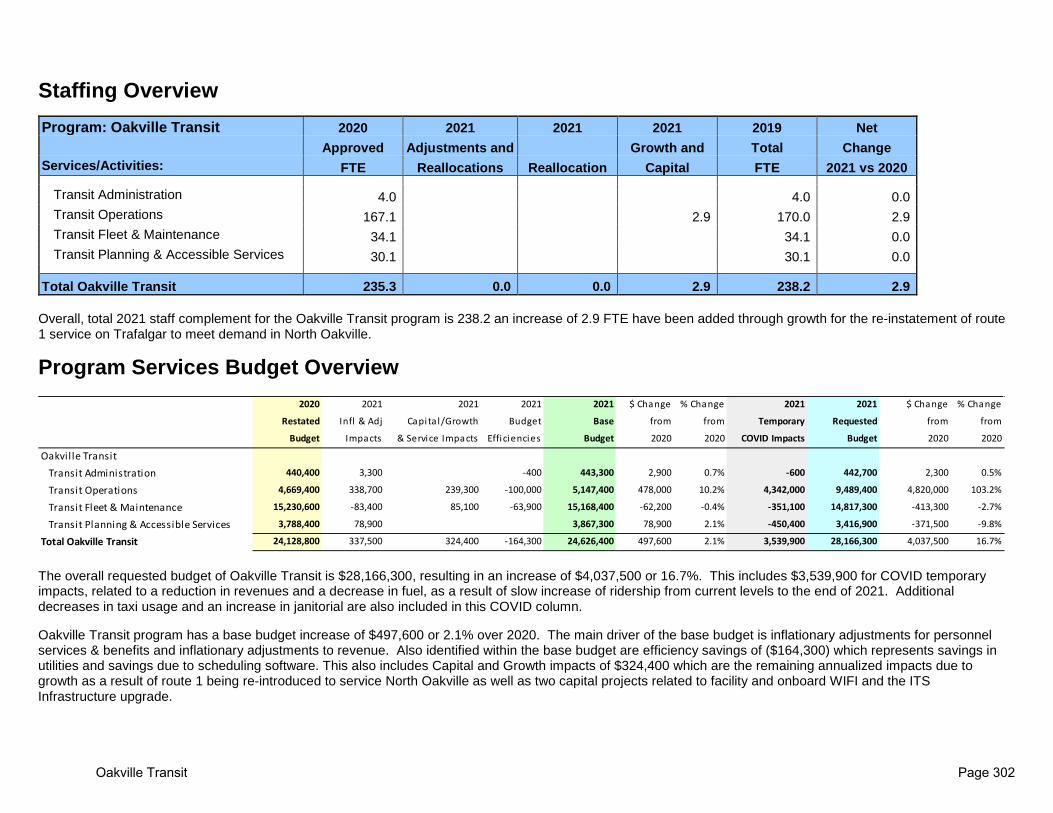
Staffing Overview Program: Oakville Transit 2020 2021 2021 2021 2019 Net Approved Adjustments and Growth and Total Change Services/Activities: FTE Reallocations Reallocation Capital FTE 2021 vs 2020
Transit Administration 4.0 4.0 0.0 Transit Operations 167.1 2.9 170.0 2.9 Transit Fleet & Maintenance 34.1 34.1 0.0 Transit Planning & Accessible Services 30.1 30.1 0.0
Total Oakville Transit 235.3 0.0 0.0 2.9 238.2 2.9 Overall, total 2021 staff complement for the Oakville Transit program is 238.2 an increase of 2.9 FTE have been added through growth for the re-instatement of route 1 service on Trafalgar to meet demand in North Oakville.
Program Services Budget Overview
The overall requested budget of Oakville Transit is $28,166,300, resulting in an increase of $4,037,500 or 16.7%. This includes $3,539,900 for COVID temporary impacts, related to a reduction in revenues and a decrease in fuel, as a result of slow increase of ridership from current levels to the end of 2021. Additional decreases in taxi usage and an increase in janitorial are also included in this COVID column.
Oakville Transit program has a base budget increase of $497,600 or 2.1% over 2020. The main driver of the base budget is inflationary adjustments for personnel services & benefits and inflationary adjustments to revenue. Also identified within the base budget are efficiency savings of ($164,300) which represents savings in utilities and savings due to scheduling software. This also includes Capital and Growth impacts of $324,400 which are the remaining annualized impacts due to growth as a result of route 1 being re-introduced to service North Oakville as well as two capital projects related to facility and onboard WIFI and the ITS Infrastructure upgrade.
2020 2021 2021 2021 2021 $ Change % Change 2021 2021 $ Change % Change
Restated Infl & Adj Capita l/Growth Budget Base from from Temporary Requested from from
Budget Impacts & Service Impacts Efficiencies Budget 2020 2020 COVID Impacts Budget 2020 2020
Oakvil le TransitTransit Administration 440,400 3,300 -400 443,300 2,900 0.7% -600 442,700 2,300 0.5%
Transit Operations 4,669,400 338,700 239,300 -100,000 5,147,400 478,000 10.2% 4,342,000 9,489,400 4,820,000 103.2%
Transit Fleet & Maintenance 15,230,600 -83,400 85,100 -63,900 15,168,400 -62,200 -0.4% -351,100 14,817,300 -413,300 -2.7%
Transit Planning & Accessible Services 3,788,400 78,900 3,867,300 78,900 2.1% -450,400 3,416,900 -371,500 -9.8%
Total Oakville Transit 24,128,800 337,500 324,400 -164,300 24,626,400 497,600 2.1% 3,539,900 28,166,300 4,037,500 16.7%
Oakville Transit Page 302

Transit Fleet & Maintenance services and makes up 53% of the 2021 overall net budget. Transit Fleet & Maintenance services is responsible for the maintenance and state of good repair of the conventional and specialized transit fleet. Transit Operations is the second largest component of the net budget at $9.5 million, which is comprised of costs to provide conventional and Home to Hub transit service which is offset by the revenue generated from various Transit services. Transit Planning & Accessible Services is comprised of costs associated with providing specialized transit service, planning of all transit services and co-ordination of office support for a net budget of $3.4 million. Finally, Transit Administration is comprised of costs associated with the overall management of Oakville Transit.
Net Program Budget Change • Transit Administration has increased by $2,300 primarily
due to inflationary increases for personnel services & benefits, and contracted services.
• Transit Operations has increased by $4,820,000. One of the primary drivers is the COVID column increase of $4,342,000, due to reduced ridership. Ridership increases have been phased in starting at current levels and increasing gradually though the year. Remaining increases are due to inflationary increases for personal services & benefits, and the final phase of Route 1 being reinstated, as well as two capital projects.
• Transit Fleet & Maintenance has decreased ($413,300), mainly as a result of decreases in the COVID column for fuel. Routes have been reduced to meet demand and are gradually increasing throughout the year.
• Transit Planning & Accessible Services has decreased ($371,500), due to a large reduction in taxi expenditures due to COVID.
(1,000,000)
0
1,000,000
2,000,000
3,000,000
4,000,000
5,000,000
6,000,000
TransitAdministration
TransitOperations
Transit Fleet &Maintenance
Transit Planning& Accessible
Services
Net Change
Oakville Transit Page 303

2021 Program by Component – Net $28,166,300
In 2021, the Oakville Transit program’s total expenditures are $34,734,300 and total revenues are $6,568,000 resulting in a net budget of $28,166,300. The net change from the prior year is $4,037,500 or 16.7% primarily due to contractual obligations and a loss of revenue to due to COVID. The main drivers are the following:
• Personnel Services & Benefits make up 60% of the total expenditures and are the largest driver at $21.0 million. The majority of the total FTEs are comprised of Transit drivers and mechanics to service the fleet. Personnel Services & Benefits have increased by $55,300 primarily due to inflationary impacts and capital and growth impacts from additional service provided in north Oakville. This is partially offset due to a reduction in casual drivers as a result of COVID.
• Materials & Supplies make up 13% of the total expenditures and are the second largest driver at $4.6 million. Motor vehicle parts and accessories is the second largest component of the Materials & Supplies budget, which has decreased by $598,400 primarily due to reductions in fuel as a result of COVID and efficiencies in utilities.
• Minor Capital & Transfers to Reserves total $4.6 million and also make up 13% of total expenditures. Minor Capital & Transfers to Reserves are comprised of transfers to reserves for building maintenance and vehicle and equipment replacement. In 2021, minor capital & transfers to reserves have increased by $1,100 primarily due to the increased transfer to the Vehicle and Equipment reserve for future replacement of new specialized buses.
Oakville Transit Page 304

• Purchased Services totals $3.6 million and make up 10% of the total expenditures, which is mainly comprised of contracted vehicle maintenance, contracted taxi services for specialized service, repairs and maintenance for the Transit facility and advertising. Purchased Services have decreased by $130,700 primarily due to COVID impacts for a gradual return to service, One-time savings are realized in the reduced usage of taxis and advertising.
• Other Expenditures mainly consist of Transit facility property taxes, licenses and presto fare settlement fees. Other expenditures have decreased by $25,500 primarily due to a decrease in property taxes.
• Activity Revenue makes up 68% of total revenues and is the largest revenue source, which is comprised of all revenues related to fares, service fees, and passes sales. Activity Revenue has decreased by $4,823,300. This decrease is due to a slow return to service and a gradually increase anticipated in ridership.
• Other Revenue makes up 3% of total revenues and is the second largest revenue source. Other Revenue has increased by 31% due to a transfer from reserves that represents future savings due to scheduling software.
Oakville Transit Page 305

2022 - 2023 Operating Budget Forecast
2021 2022 2021 - 2022 2023 2022 - 2023Requested Forecast Change Forecast Change
Budget (%) (%)
559,200 572,600 2.4% 585,000 2.2%15,028,700 16,232,200 8.0% 17,433,000 7.4%15,325,100 16,221,000 5.8% 17,196,700 6.0%3,821,300 4,832,300 26.5% 5,077,700 5.1%
34,734,300 37,858,100 9.0% 40,292,400 6.4%
442,700 456,100 3.0% 468,500 2.7%9,489,400 7,080,100 -25.4% 7,394,700 4.4%
14,817,300 15,713,200 6.0% 16,688,900 6.2%3,416,900 4,426,900 29.6% 4,671,300 5.5%
Total Tax Levy 28,166,300 27,676,300 (1.7%) 29,223,400 5.6%
Personnel Services & Benefits 20,995,400 22,709,900 8.2% 24,308,500 7.0%Materials & Supplies 4,561,900 5,152,600 12.9% 5,522,400 7.2%Purchased Services 3,607,900 4,250,200 17.8% 4,439,700 4.5%Internal Charges 23,000 23,000 0.0% 23,000 0.0%Other Expenditures 905,000 912,900 0.9% 921,500 0.9%Minor Capital & Transfer To Reserves 4,641,100 4,809,500 3.6% 5,077,300 5.6%
Total Expenses 34,734,300 37,858,100 9.0% 40,292,400 6.4%
Activity Revenue 4,469,100 8,082,900 80.9% 8,970,100 11.0%Internal Recoveries 71,600 71,600 0.0% 71,600 0.0%Grants - - 0.0% - 0.0%Other Revenue 2,027,300 2,027,300 0.0% 2,027,300 0.0%Total Revenues 6,568,000 10,181,800 55.0% 11,069,000 8.7%
28,166,300$ 27,676,300$ (1.7%) 29,223,400$ 5.6%
Oakville Transit
Gross Expenditures By Service
Total Gross Expenditures
Tax Levy By Service
Revenues By Type
Tax Levy
Transit AdministrationTransit OperationsTransit Fleet & MaintenanceTransit Planning & Accessible Services
Transit AdministrationTransit OperationsTransit Fleet & MaintenanceTransit Planning & Accessible Services
Gross Expenditures By Type
Oakville Transit Page 306

2022 - 2023 Budget Forecast Highlights • The 2022 net budget is projected to decrease by (1.7%) or $ (490,000); the decrease in 2022 is as a result of the COVID revenue adjustments being removed,
which are offset by expenditure adjustments for staffing, fuel and taxi services to resume to normal service levels. Also in 2022, are increases in operating impacts from capital for four specialized vehicle expansion buses and three conventional buses to continue to service the community. The 2023 net budget is projected to increase 5.6% or $ 1,547,100 as there is an operating impact for one expansion specialized and four conventional buses. Fees has been increased 2% for both years.
2021 Recommended Capital Budget
The 2021 capital budget ensures Transit fleet will be maintained in a state of good repair, with funds provided for vehicle refurbishments and replacements based on condition, along with new electric specialized and conventional buses. The recommended capital budget includes projects that have been submitted to the Investing in Canada Infrastructure Program (ICIP) – Public Transit Stream grant intake for the purchase of electric buses and to enhance/acquire new technology. The Town’s share of these projects is 26.67% with the additional funding coming from the Federal and Provincial governments. These projects will begin to green the transit fleet along with upgrading and acquiring technology that will improve the overall customer experience and efficiency of operations.
Capital Budget Operating Impacts Project Project Title Classification 2021 2021 54202002 New Shelters Growth 85,100 54211902 Bus Stop Accessibility Improvements Strategic Priorities 251,000 54212005 Transit Facility Equipment Replacement Infrastructure Renewal 205,000 54212102 Transit Facility Capital Repairs and Replacement Infrastructure Renewal 92,000 54212103 Electronics Repair Lab Infrastructure Renewal 210,000 54212104 On-Demand Call Centre Renovation Infrastructure Renewal 149,000 54411903 Major Vehicle Refurbishment Infrastructure Renewal 1,477,000 54411904 Electric Expansion Buses Growth 3,228,000 54412006 Specialized Electric Vehicle Expansion Growth 513,000 54412007 Electric Replacement Buses Infrastructure Renewal 7,179,000 54412101 Supervisory Vehicle Replacement Infrastructure Renewal 60,000 54412102 Electric Bus Charging Infrastructure-Heavy Duty Strategic Priorities 2,490,000 54412103 Maintenance Vehicle and Equipment Replacement Infrastructure Renewal 60,000 54422101 Integrated Conventional Scheduling Software Strategic Priorities 674,000 54422102 Digital Arrival Display Screens Strategic Priorities 136,000
TOTAL 16,809,100
Oakville Transit Page 307

Oakville Transit Page 308

Program: Parking
Program Based Budget 2021 - 2023
Vision
• To provide municipal parking operations for residents and businesses with practices that contribute and complement the “livability” of the entire Oakville community.
Mission
• To effectively plan, deliver and manage municipal parking strategy and business/field operations (infrastructure, services, enforcement) for the residents and businesses of Oakville in a financially self-supporting manner, and with a customer service focus.
Parking Page 309

Program Services The Parking program delivers the following services:
Commercial District Parking
• Manage and maintain public parking facilities to allow patrons and employees to park safely and conveniently
• Provide payment options, provide permits and ensure adequate parking supply and enforce parking regulations
Parking Operations & Enforcement
• Manage the town-wide parking enforcement program
• Work with all departments to ensure a safe, adequate and well planned parking supply is available to residents town-wide $0.8M
$(0.3)M
Parking Page 310

2021 Program Key Initiatives
Livability• Review systems and programs to improve efficiencies and technologies of service delivery.
Engaged Community• Liaise with commercial BIA's with regard to commercial parking programs and services.
Accountable Government• Inform the Parking Management Strategy• Assess, rehabilitate and replace parking system infrastructure that optimizes life cycle costing, public safety and
customer convenience.
Environment• Continue to implement public electric vehicle charging stations.
Mobility• Implement a parking management system to assist members of the public with finding available parking in
downtown Oakville.
Parking Page 311

Key Performance Indicators 1. Percentage of gross operating budget
2016 2017 2018 2019 2020 1.4% 1.5% 1.4% 1.5% 1.4%
Why Important: Monitors the cost of the program as a proportion of the total cost for the town. How Calculated: Gross program operating costs (excluding transfers to reserves and internal charges) / Gross town operating costs (excluding transfers to reserves and internal charges).
2. Percentage of total FTEs
2016 2017 2018 2019 2020 1.3% 1.2% 1.2% 1.3% 1.3%
Why Important: Assesses the capacity of the program by examining the proportion of staff expertise against the total Town FTEs. How Calculated: Total program FTEs including part-time / Total town FTEs including part-time.
3. Utilization rate of parking spaces by Commercial District
2016 2017 2018 2019 2020 N/A N/A N/A (no survey in 2018) N/A (no survey in 2019) N/A (no survey in 2020 due to
COVID) Why Important: Assesses the available parking in the commercial districts. How Calculated: From parking utilization surveys Downtown Oakville /Kerr Village.
4. Percentage of tickets paid and not disputed
2016 2017 2018 2019 2020 92% 91% 91% 91% 91% (As of Oct. 31/20)
Why Important: Assesses the quality of the tickets. How Calculated: Total tickets issued – number of tickets at early resolution and court/total tickets issued.
5. Percentage of tickets resolved during facilitation sessions
2016 2017 2018 2019 2020 99.7% 99.5% 99.2% 99.2% 98.5% (As of Oct. 31/20)
Why Important: Assesses the value and success of the program. How Calculated: Total number of tickets resolved/Total number of tickets at early resolution.
Parking Page 312
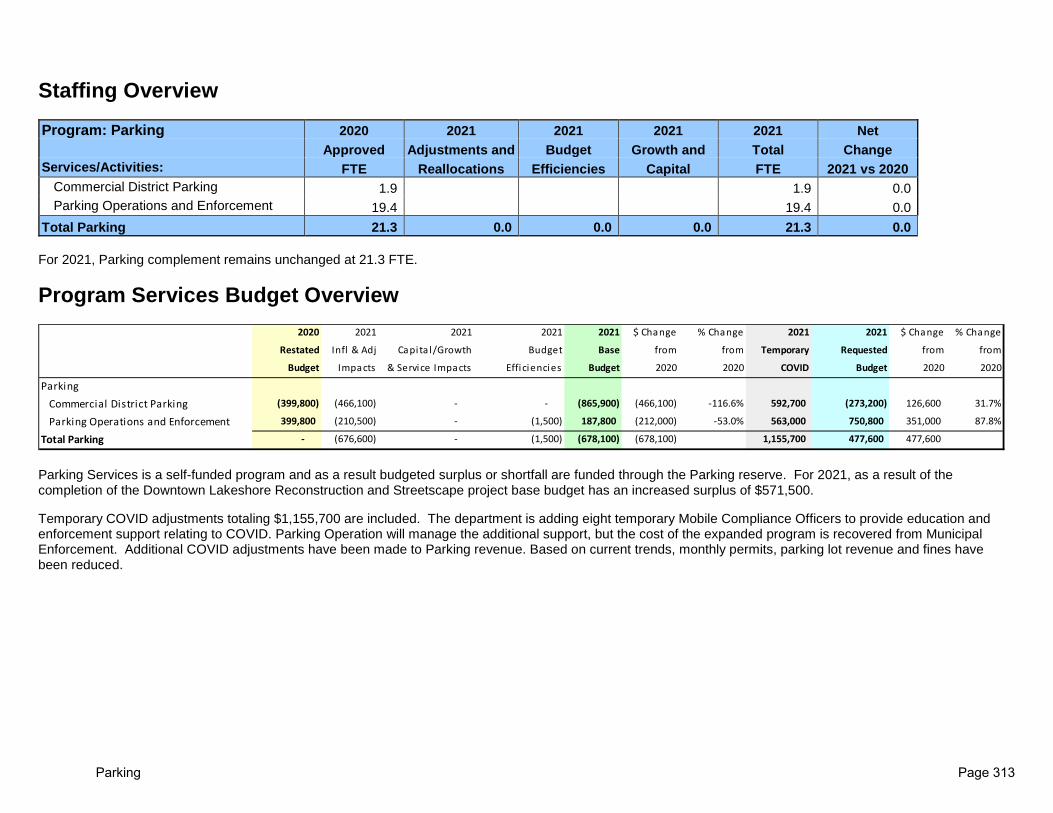
Staffing Overview
Program: Parking 2020 2021 2021 2021 2021 Net Approved Adjustments and Budget Growth and Total Change Services/Activities: FTE Reallocations Efficiencies Capital FTE 2021 vs 2020
Commercial District Parking 1.9 1.9 0.0 Parking Operations and Enforcement 19.4 19.4 0.0
Total Parking 21.3 0.0 0.0 0.0 21.3 0.0 For 2021, Parking complement remains unchanged at 21.3 FTE.
Program Services Budget Overview
Parking Services is a self-funded program and as a result budgeted surplus or shortfall are funded through the Parking reserve. For 2021, as a result of the completion of the Downtown Lakeshore Reconstruction and Streetscape project base budget has an increased surplus of $571,500.
Temporary COVID adjustments totaling $1,155,700 are included. The department is adding eight temporary Mobile Compliance Officers to provide education and enforcement support relating to COVID. Parking Operation will manage the additional support, but the cost of the expanded program is recovered from Municipal Enforcement. Additional COVID adjustments have been made to Parking revenue. Based on current trends, monthly permits, parking lot revenue and fines have been reduced.
2020 2021 2021 2021 2021 $ Change % Change 2021 2021 $ Change % Change
Restated Infl & Adj Capita l/Growth Budget Base from from Temporary Requested from from
Budget Impacts & Service Impacts Efficiencies Budget 2020 2020 COVID Budget 2020 2020
ParkingCommercial District Parking (399,800) (466,100) - - (865,900) (466,100) -116.6% 592,700 (273,200) 126,600 31.7%
Parking Operations and Enforcement 399,800 (210,500) - (1,500) 187,800 (212,000) -53.0% 563,000 750,800 351,000 87.8%
Total Parking - (676,600) - (1,500) (678,100) (678,100) 1,155,700 477,600 477,600
Parking Page 313

Net Program Budget Change • Commercial District Parking has increased by $126,600.
Personnel has been adjusted for inflationary increases to salary and benefits. Minimal adjustments have been made to traffic signs, internet and miscellaneous. The Downtown Lakeshore Reconstruction and Streetscape project is scheduled to be completed by the end of 2020, and service fees have increased to reflect normal business activities. However, COVID revenue reductions are included and represent a decrease of $597,100 to revenue budgets offset by a $4,400reduction to overtime.
• Parking Operations and Enforcement has increased by $351,000. Personnel has been adjusted for inflationary increases. Additional budget increases are included for bank charges. Due to anticipated COVID impact to revenue, permits, administrative penalties and fine budgets have been reduced by $563,900. In addition, eight Mobile Compliance Officers will be included as temporary enforcement support. Although the expense is included in Parking, the full cost is recovered by Municipal Enforcement.
Parking Page 314

2021 Program Budget by Component– Net $477,600
The Parking program’s total direct operating expenditures are $5,857,400 and anticipated revenues are $ 5,379,800. Overall program changes are described below.
• Temporary COVID Impacts total $1,155,700. Based on current trends, Parking revenue budgets have been reduced by $1,161,000. To support COVID enforcement requirements, eight temporary Mobile Compliance Officers will be added for 2021. The expense is fully recovered by Municipal Enforcement.
• Personnel Services & Benefits is the largest cost component at $3.2 million representing 55% of the gross expenditures. In 2021, personnel costs have increased by $1,020,200 primarily due to the addition of eight temporary Mobile Compliance Officers added to support COVID education and enforcement. Also, further adjustments have been made for inflation to salary and benefits, $2,300 is included for shift premium and $5,000 has been added for standby.
• Internal Charges comprises $1.1 million or 18% of the gross budget. The increase of $19,400 is from inflationary adjustments made to internal labour charges and adjustments made to winter control costs.
• Other Expenditures totals $553,100 and have decreased by $10,500 due to adjustments made to property taxes, bank charges and MTO services. • Purchased Services totals $606,000 or 10% of the gross expenditures. For 2021, the budget has increased by $121,400. This includes increases to
janitorial services, internet/cable, insurance and miscellaneous purchased services. • Materials and Supplies has increased by $22,500 for increases to hydro for the EV charging stations. • Minor Capital & Transfer to Reserves totals $150,600. This includes an annual transfer to the parking equipment reserve of $108,700 and a transfer to the
Parking reserve of $41,900 • Activity Revenue represents 67% of the budgeted revenue and has decreased by $308,500. Downtown Lakeshore Reconstruction and Streetscape project
should be complete for 2020. For 2021, any reductions related to this project have been removed.
Parking Page 315

• Other Revenue has reduced by $531,000 for the transfer from reserve that was used to fund the revenue shortfalls resulting from the Lakeshore Road reconstruction.
• Other Revenue has reduced by $531,000 in 2021 to reflect the reduction in a transfer from reserve. In 2020 a transfer from reserve was needed to fund the revenue shortfalls resulting from the Lakeshore Road reconstruction.
• Internal Recoveries which is 4% of revenues has increased for 2021 to $1,246,300. This includes the increased recovery from Municipal Enforcement to fund the eight temporary Mobile Compliance Officers.
Parking Page 316

2022 - 2023 Operating Budget Forecast
Parking 2021 2022 2021 - 2022 2023 2022 - 2023
Requested Forecast Change Forecast Change Budget (%) (%)
Gross Expenditures By Service Commercial District Parking 1,558,200 1,628,900 4.5% 1,644,600 1.0% Parking Operations and Enforcement 4,299,200 3,550,100 -17.4% 3,619,600 2.0% Total Gross Expenditures 5,857,400 5,179,000 (11.6%) 5,264,200 1.6% Tax Levy By Service Commercial District Parking (273,200) (836,400) (206.1%) (870,200) (4.0%) Parking Operations and Enforcement 750,800 224,100 -70.2% 225,400 0.6% Total Tax Levy 477,600 (612,300) (228.2%) (644,800) (5.3%) Gross Expenditures By Type Personnel Services & Benefits 3,217,700 2,526,900 (21.5%) 2,580,400 2.1% Materials & Supplies 268,600 263,800 (1.8%) 270,500 2.5% Purchased Services 606,000 615,200 1.5% 632,100 2.7% Internal Charges 1,061,400 1,065,600 0.4% 1,069,900 0.4% Other Expenditures 553,100 553,100 0.0% 553,100 0.0% Minor Capital & Transfer To Reserves 150,600 154,400 2.5% 158,200 2.5% Total Expenses 5,857,400 5,179,000 (11.6%) 5,264,200 1.6% Revenues By Type Activity Revenue 3,602,500 4,842,300 34.4% 4,956,200 2.4% Internal Recoveries 1,246,300 418,000 66.5% 421,800 0.9% Grants - - 0.0% - 0.0% Other Revenue 531,000 531,000 0.0% (531,000) (200.0%) Total Revenues 5,379,800 5,791,300 7.6% 4,847,000 (16.3%) Tax Levy $477,600 $(612,300) (228.2%) $(644,800) (5.3%)
2022 - 2023 Budget Forecast Highlights • The 2022 net budget is projected to increase by (5.3%) or $ (32,500) (zero dollar change). Inflationary increases have been budgeted and with the
construction completion of Lakeshore Road East, revenue is anticipated to start increasing to normal patterns. In addition, the budget is adjusted for the Covid impacts included in the 2021 budget.
Parking Page 317

• The 2023 net budget is projected to increase by (5.3%) or $ (32,500) (zero dollar change). The budget has been adjusted for inflationary increases.
2021 Recommended Capital Budget
The capital budget provides funds to maintain and replace parking assets including lots, the parking garage, on street and lot parking equipment and vehicles. Enhancements to the parking software system are planned, along with the acquisition and installation of electric vehicle charging stations with a portion funded by Natural Resources Canada’s Zero-Emission Vehicle Infrastructure Program.
Capital Budget Operating Impacts Project Project Title Classification 2021 2021 53512002 Parking Garage - Rehab - FCM Enterprise Initiatives 224,000 53512102 New Parkade Traffic and Revenue Control Equipment Enterprise Initiatives 167,000 53512103 Parkade Security Cameras Enterprise Initiatives 21,000 53512104 AIMS Parking System Enhancements Enterprise Initiatives 174,000 53512105 Parking - Minor repairs Enterprise Initiatives 37,000 53512106 Lot Maintenance and Repair Enterprise Initiatives 20,000 53521905 Replacement of on Street Parking Equipment Enterprise Initiatives 15,000 53522005 EV Charging Stations Enterprise Initiatives 203,000 53522101 Vehicle Replacement (Enforcement) Infrastructure Renewal 125,000 53522102 Vehicle Replacement (Operations) Infrastructure Renewal 60,000
TOTAL 1,046,000
Parking Page 318

Parking Page 319

Parking Page 320

test
Corporate Revenues and Expenses
Program: Corporate Revenue and Expenses
Program Based Budget
2021 - 2023
Vision
• The Corporate Revenue and Expenses program pertains to the town operations as a whole and includes all revenues and expenditures not identified with specific programs
Key Initiatives
• The Corporate and Financial Expenses service pertains to town operations as a whole or relating to financing costs versus operating costs. They are not directly identified with specific programs, but are recorded and reported as town expenditures.
• The Town Revenue service pertains to town operations as a whole and includes all revenues not identified as a revenue stream or as cost recoveries within specific programs.
Page 321
test
Corporate Revenue and Expenses
Program Services The Corporate Revenue and Expenses program provides activities through the following services:
\\
Corporate Revenues
• Taxation & Grants• Fines and Penalties• Interest Earned• Miscellaneous Revenues
Corporate Expenses
• Debt• Capital Funding• Corporate Expenses• WSIB Self Insurance• Town Grants
Page 322

test
Corporate Revenue and Expenses
Corporate Revenue Budget Summary
Corporate Revenue has increased by 4.4% in total. This reflects the increase in the tax levy resulting from the 2021 proposed operating. The budget for investment income reflects the full interest earned on all funds including reserves and reserve funds. The decrease in 2021 departmental revenues is a reflection of the temporary impacts of the pandemic on various fee supported program operations.
2021 Base 2021 2021 % 2022 2023
2020 Base Budget Requested Requested Change Forecast Forecast
Budget Budget Change (%) Adjustments Budget 2020-2021 Budget Budget
SOURCES OF REVENUECorporate Revenue
Taxation 207,287,900 211,555,100 2.1% 3,182,800 214,737,900 3.6% 221,320,000 229,655,000
Supplementary Taxes 1,250,000 1,250,000 0.0% 0 1,250,000 0.0% 1,250,000 1,250,000
Local Improvement Collections 0 0 0.0% 0 0 0.0% 0 0
Payments in Lieu of Taxes 4,474,700 4,474,700 0.0% 0 4,474,700 0.0% 4,474,700 4,474,700
General Provincial Grants 0 0 0.0% 0 0 0.0% 0 0
Income from Investments 11,634,200 11,634,200 0.0% 0 11,634,200 0.0% 11,634,200 11,634,200
POA Halton Court Fines 976,000 976,000 0.0% 0 976,000 0.0% 995,500 1,015,400
Tax Penalty & Interest 3,000,000 3,000,000 0.0% 0 3,000,000 0.0% 3,060,000 3,121,200
Oakville Hydro Revenue 11,616,800 11,616,800 0.0% 0 11,616,800 0.0% 11,634,700 11,653,000
Subdivision Agreement Fees 0 0 0.0% 0 0 0.0% 0 0
Other Service Fees 0 0 0.0% 0 0 0.0% 0 0
Fund Balance and Transfer 6,836,400 6,836,400 0.0% 3,474,600 10,311,000 50.8% 6,945,800 6,965,900
Total Corporate Revenue 247,076,000 251,343,200 1.7% 6,657,400 258,000,600 4.4% 261,314,900 269,769,400
Departmental Revenue 75,314,500 63,309,000 -15.9% 2,425,700 65,734,700 -12.7% 77,113,900 78,256,700
Internal Recoveries 23,144,400 24,271,700 4.9% 257,400 24,529,100 6.0% 24,240,100 24,702,600
TOTAL REVENUE 345,534,900$ 338,923,900$ -1.9% 9,340,500$ 348,264,400$ 0.8% 362,668,900$ 372,728,700$
Page 323
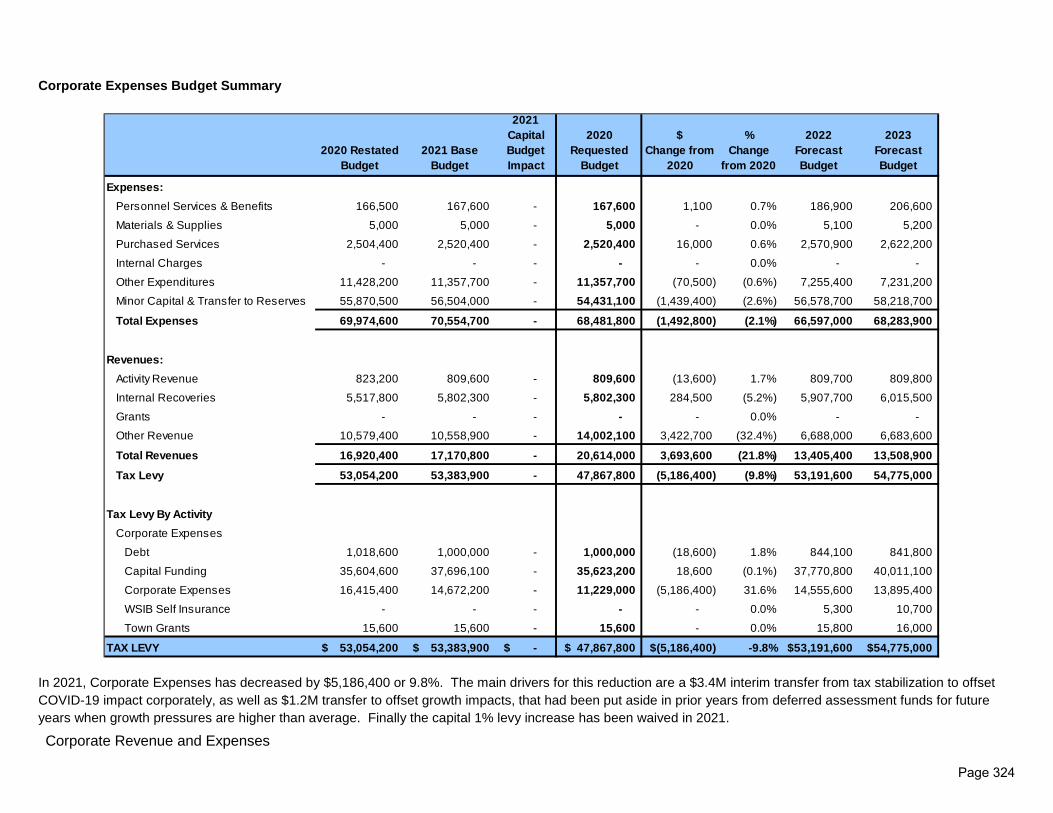
test
Corporate Revenue and Expenses
Corporate Expenses Budget Summary
In 2021, Corporate Expenses has decreased by $5,186,400 or 9.8%. The main drivers for this reduction are a $3.4M interim transfer from tax stabilization to offset COVID-19 impact corporately, as well as $1.2M transfer to offset growth impacts, that had been put aside in prior years from deferred assessment funds for future years when growth pressures are higher than average. Finally the capital 1% levy increase has been waived in 2021.
2020 Restated Budget
2021 Base Budget
2021 Capital Budget Impact
2020 Requested
Budget
$ Change from
2020
% Change
from 2020
2022 Forecast Budget
2023 Forecast Budget
Personnel Services & Benefits 166,500 167,600 - 167,600 1,100 0.7% 186,900 206,600
Materials & Supplies 5,000 5,000 - 5,000 - 0.0% 5,100 5,200
Purchased Services 2,504,400 2,520,400 - 2,520,400 16,000 0.6% 2,570,900 2,622,200
Internal Charges - - - - - 0.0% - -
Other Expenditures 11,428,200 11,357,700 - 11,357,700 (70,500) (0.6%) 7,255,400 7,231,200
Minor Capital & Transfer to Reserves 55,870,500 56,504,000 - 54,431,100 (1,439,400) (2.6%) 56,578,700 58,218,700
Total Expenses 69,974,600 70,554,700 - 68,481,800 (1,492,800) (2.1%) 66,597,000 68,283,900
Activity Revenue 823,200 809,600 - 809,600 (13,600) 1.7% 809,700 809,800
Internal Recoveries 5,517,800 5,802,300 - 5,802,300 284,500 (5.2%) 5,907,700 6,015,500
Grants - - - - - 0.0% - -
Other Revenue 10,579,400 10,558,900 - 14,002,100 3,422,700 (32.4%) 6,688,000 6,683,600
Total Revenues 16,920,400 17,170,800 - 20,614,000 3,693,600 (21.8%) 13,405,400 13,508,900
Tax Levy 53,054,200 53,383,900 - 47,867,800 (5,186,400) (9.8%) 53,191,600 54,775,000
Corporate Expenses
Debt 1,018,600 1,000,000 - 1,000,000 (18,600) 1.8% 844,100 841,800
Capital Funding 35,604,600 37,696,100 - 35,623,200 18,600 (0.1%) 37,770,800 40,011,100
Corporate Expenses 16,415,400 14,672,200 - 11,229,000 (5,186,400) 31.6% 14,555,600 13,895,400
WSIB Self Insurance - - - - - 0.0% 5,300 10,700
Town Grants 15,600 15,600 - 15,600 - 0.0% 15,800 16,000
53,054,200$ 53,383,900$ -$ 47,867,800$ (5,186,400)$ -9.8% 53,191,600$ 54,775,000$
Expenses:
Revenues:
Tax Levy By Activity
TAX LEVY
Page 324

Appendix I
Schedule of Full Time Equivalent Complement
Staff Complement Page 325

Summary of Total 2021 FTEs by Program
ProgramFull-time Restated
Part-time Restated
Reallocations and
AdjustmentsBudget
Efficiency
Capital Impact and
Growth TotalPolitical Governance 11.5 0.3 (0.5) (2.0) - 9.3 Administrative Executive Management 10.0 - - 3.0 - 13.0 ServiceOakville 9.0 2.8 - - - 11.8 Strategic Policy & Communications 13.0 1.0 1.0 2.0 - 17.0 Economic Development 4.0 - - 1.0 - 5.0 Human Resources 16.0 0.1 - - - 16.1 Regulatory Services 5.5 0.3 0.5 - - 6.3 Municipal Enforcement Services 11.5 1.0 - - - 12.5 Asset Management 6.0 - 1.0 - 1.0 8.0 Financial Services 51.0 1.1 (1.5) (1.0) - 49.6 Legal Services 8.6 1.1 - - - 9.7 Information Systems & Solutions 54.0 4.1 - - - 58.1 Facilities and Construction Management 20.0 1.0 - - - 21.0 Emergency Services 250.0 - - - - 250.0 Recreation and Culture Services 150.0 206.5 0.5 (1.0) 11.9 367.9 Parks & Open Spaces 81.1 77.8 - - 3.5 162.3 Cemeteries 3.7 1.7 - - - 5.4 Harbours 5.0 4.3 - - 7.3 16.5 Infrastructure Maintenance 99.3 39.3 0.7 - - 139.3 Infrastructure Planning & Improvements 25.6 3.4 1.0 - 1.0 31.0 Parking 20.4 0.9 - - - 21.3 Oakville Transit 214.0 21.3 - - 2.9 238.2 Strategic Business Support 10.0 - - - - 10.0 Building Services 41.8 1.5 1.0 - - 44.3 Planning Services 29.5 - (1.0) (1.0) 1.0 28.5 Development Engineering 25.7 1.5 - (1.0) 3.0 29.2 Other 5.0 - (1.0) - (1.0) 3.0
Total - Town 1,181.1 371.0 1.7 - 30.6 1,584.4
Galleries 7.0 4.2 - - - 11.2 Library Services 52.0 59.0 (1.0) - (0.4) 109.6 Forestry Temporary Arborists 2.0 - - - - 2.0 Building Temporary Positions 4.0 - - - - 4.0
Consolidated Total 1,246.1 434.3 0.7 - 30.2 1,711.2
Staff Complement Page 326

Schedule of Continuous Full-time Positions
Program2019
Restated2020
Restated 2020
Reallocations and
AdjustmentsBudget
Efficiency
Capital Impact and
Growth2020
Proposed FTEPolitical Governance 11.5 11.5 11.5 (0.5) (2.0) - 9.0 Administrative Executive Management 10.0 10.0 10.0 - 3.0 - 13.0 ServiceOakville 9.0 9.0 9.0 - - - 9.0 Strategic Policy & Communications 14.0 13.0 13.0 1.0 2.0 - 16.0 Economic Development 4.0 4.0 4.0 - 1.0 - 5.0 Human Resources 16.0 16.0 16.0 - - - 16.0 Regulatory Services 5.5 5.5 5.5 0.5 - - 6.0 Municipal Enforcement Services 11.5 11.5 11.5 - - - 11.5 Asset Management 6.0 6.0 6.0 1.0 - 1.0 8.0 Financial Services 50.0 51.0 51.0 (2.0) (1.0) - 48.0 Legal Services 8.6 8.6 8.6 - - - 8.6 Information Systems & Solutions 53.0 54.0 54.0 - - - 54.0 Facilities and Construction Management 20.0 20.0 20.0 - - - 20.0 Emergency Services 226.0 250.0 250.0 - - - 250.0 Recreation and Culture Services 145.0 150.0 150.0 - (1.0) - 149.0 Parks & Open Spaces 81.1 81.1 81.1 - - - 81.1 Cemeteries 3.7 3.7 3.7 - - - 3.7 Harbours 5.0 5.0 5.0 - - 5.0 10.0 Infrastructure Maintenance 99.3 99.3 99.3 - - - 99.3 Infrastructure Planning & Improvements 25.6 25.6 25.6 1.0 - 1.0 27.6 Parking 20.4 20.4 20.4 - - - 20.4 Oakville Transit 213.0 214.0 214.0 - - - 214.0 Strategic Business Support 10.0 10.0 10.0 - - - 10.0 Building Services 41.8 41.8 41.8 1.0 - - 42.8 Planning Services 29.5 29.5 29.5 (1.0) (1.0) 1.0 28.5 Development Engineering 24.7 25.7 25.7 - (1.0) 3.0 27.7 Other 6.0 5.0 5.0 (1.0) - (1.0) 3.0
Total - Town 1,150.0 1,181.0 1,181.0 - - 10.0 1,191.0
Galleries 7.0 7.0 7.0 - - - 7.0 Library Services 52.0 52.0 52.0 1.0 - 53.0 Forestry Temporary Arborists 2.0 2.0 2.0 - - - 2.0 Building Temporary Positions 4.0 4.0 4.0 - - - 4.0
Consolidated Total 1,215.0 1,246.0 1,246.0 1.0 - 10.0 1,257.0
Staff Complement Page 327

Schedule of Seasonal and Part-time Staff Stated as Full-time Equivalents
Program2019
Restated2020
Restated 2021
Reallocations and
AdjustmentsBudget
Efficiency
Capital Impact and
Growth2021
Proposed FTEPolitical Governance 0.3 0.3 0.3 - - - 0.3 Administrative Executive Management - - - - - - - ServiceOakville 2.8 2.8 2.8 - - - 2.8 Strategic Policy & Communications 1.4 1.0 1.0 - - - 1.0 Economic Development - - - - - - - Human Resources 0.1 0.1 0.1 - - - 0.1 Regulatory Services 0.3 0.3 0.3 - - - 0.3 Municipal Enforcement Services 1.0 1.0 1.0 - - - 1.0 Asset Management - - - - - - - Financial Services 1.1 1.1 1.1 0.5 - - 1.6 Legal Services 1.1 1.1 1.1 - - - 1.1 Information Systems & Solutions 4.1 4.1 4.1 - - - 4.1 Facilities and Construction Management 1.0 1.0 1.0 - - - 1.0 Emergency Services - - - - - - - Recreation Services 205.9 206.5 206.5 0.5 - 11.9 218.9 Parks & Open Spaces 73.4 77.8 77.8 - - 3.5 81.3 Cemeteries 1.7 1.7 1.7 - - - 1.7 Harbours 3.2 4.3 4.3 - - 2.3 6.6 Infrastructure Maintenance 39.3 39.3 39.3 0.7 - - 40.0 Infrastructure Planning & Improvements 3.4 3.4 3.4 - - - 3.4 Parking 0.5 0.9 0.9 - - - 0.9 Oakville Transit 21.0 21.3 21.3 - - 2.9 24.2 Strategic Business Support - - - - - - - Building Services 1.5 1.5 1.5 - - - 1.5 Planning Services - - - - - - - Development Engineering 1.5 1.5 1.5 - - - 1.5 Other - - - - - -
Total - Town 364.6 371.0 371.0 1.7 - 20.6 393.3
Galleries 4.2 4.2 4.2 - - - 4.2 Library Services 58.0 59.0 59.0 (2.0) - (0.4) 56.6
Consolidated Total 426.8 434.3 434.3 (0.3) - 20.2 454.1
Staff Complement Page 328

test
Program: Appendix II Reserve and Debt Schedules
Program Based Budget
Reserve and Debt Schedules Page 329

test
Town of Oakville2021 Projected Reserve, Reserve Fund Balances ($ Millions)
Reserve/Reserve Fund
Transfers to/(from)
Reserve from Operating
Capital Commitments1
Development Charges/ Revenues Total
Obligitory Reserve Funds:Development Charges 86.2 (3.9) (45.7) 47.2 83.7 3.2 87.0 Parkland 57.3 - (0.7) 5.0 61.6 1.5 63.0 Gas Tax 23.4 (1.9) (15.9) 8.8 14.4 0.5 14.9 Ont. Municipal Commuter Cycling 0.6 (0.6) - - - sub-total 167.4 (5.9) (62.3) 61.0 159.7 5.2 164.9
Discretionary Reserve Funds:Town Building Replacement 13.3 4.2 - - 17.5 0.4 17.9 Parking 2.9 (0.5) (0.5) - 1.9 0.1 2.0 Harbours (6.2) 0.5 (0.2) - (5.9) - (5.9) Street Trees 0.0 - (0.0) - - - - Employment Liability 22.8 0.7 - - 23.4 0.6 24.0 Bonus Zoning 2.9 - - - 2.9 0.1 3.0 Other 0.2 0.0 - - 0.2 0.0 0.2 sub-total 35.9 4.9 (0.7) - 40.1 1.1 41.2
Total Reserve Funds 203.3 (1.0) (63.0) 61.0 199.8 6.3 206.1 Town Reserves:Operational Reserves2 29.3 0.4 (1.5) - 28.3 - 28.3 Equipment Reserves 20.7 8.4 (8.5) - 20.6 0.5 21.1 Capital Reserves 68.7 12.4 (2.4) - 78.7 1.8 80.4 Stabilization Reserves2 66.0 (0.4) - - 65.6 - 65.6 Total Reserves 184.7 20.8 (12.3) - 193.2 2.3 195.5
Total Reserves, Reserve Funds 388.1 19.8 (75.4) 61.0 392.9 8.6 401.6 * Note: Schedule may not add due to rounding
2) The balance for Stabilization and Operational reserves includes preliminary estimated 2020 year end results based on Q2 projections.
Projected 2020 Ending
Balance
2021 Activity
Interest
Projected 2021 Ending
Balance
1) The Capital Commitments for Development Charges, Parkland and Gas Tax include all commitments from prior year approved budgets.
Reserve and Debt Schedules Page 330

test
Town of Oakville2021 Projected Outstanding Debt Principal ($ '000s)
2020 Outstanding
Debt
Prior Year Debt Approved Not
Issued Yet
2021 Proposed
Debt
2021 Debt Principal Payment
2021 Projected Outstanding
DebtTax Levy Supported Debt:
Municipal Buildings - - - - -
Roads 5,259 - - 549 4,709
LED Streetlight Conversion 8,476 1,150 - 1,036 8,590
Transit 550 - - 179 371
Fire Protection - - - - -
Recreation Facilities - - - - -
Parks and Pier Rehab 354 - - 180 175
sub-total 14,640$ 1,150$ -$ 1,945$ 13,845$ Self Supported Debt:
Harbours 1,326 1,100 - 177 2,248
Development (16 Mile Facility) 3,842 - - 3,842 -
Pine Glen Soccer Club 5,654 - - 482 5,171
sub-total 10,821$ 1,100$ -$ 4,502$ 7,420$ Hospital Debt:
New Oakville Hospital1 80,308 - - 2,131 78,177
sub-total 80,308$ -$ -$ 2,131$ 78,177$ TOTAL 105,770$ 2,250$ -$ 8,578$ 99,442$
1) Debt Principal Payment for the New Oakville Hospital reflects the contribution to the sinking fund.
Reserve and Debt Schedules Page 331

Reserve and Debt Schedules Page 332
Related Documents