2021-2027 Transportation Improvement Program Lowcountry Area Transportation Study (LATS) Metropolitan Planning Organization Adopted August 7 th , 2020

Welcome message from author
This document is posted to help you gain knowledge. Please leave a comment to let me know what you think about it! Share it to your friends and learn new things together.
Transcript
2021-2027
Transportation Improvement Program
Lowcountry Area Transportation Study (LATS) Metropolitan Planning Organization
Adopted August 7th, 2020
Table of Contents
List of Acronyms ........................................................................................................................................... 3
Introduction and Background................................................................................... 4 Structure ....................................................................................................................................................... 5 Federal Mandates ....................................................................................................................................... 5 Supporting Legislation .................................................................................................................................. 6 FAST Act ...................................................................................................................................................... 7 Title VI and Environmental Justice ............................................................................................................... 7 Joint Federal Highway Administration/ Federal Transit Administration Planning Rule ................................ 8
Planning Efforts ......................................................................................................... 8 Transportation Improvement Program (TIP) ................................................................................................ 8 Financial Constraint ..................................................................................................................................... 9 Long Range Transportation Plan (LRTP)..................................................................................................... 9 Project Prioritization ..................................................................................................................................... 9 Public Involvement ..................................................................................................................................... 12 Metropolitan and State TIPs ....................................................................................................................... 12
TIP Amendment Process ........................................................................................ 12 Policy Amendments ................................................................................................................................... 12 Administrative Modifications and Corrections ............................................................................................ 13
TIP Modification and Amendment Process ........................................................... 14 Processing of Revisions ............................................................................................................................. 14
Funding .................................................................................................................... 14 Guideshare Funds ...................................................................................................................................... 14 Transportation Alternative Program Projects ............................................................................................. 15 Additional Funding Sources ....................................................................................................................... 15 2021-2027 TIP Funding Table ................................................................................................................... 16
Performance Based Planning and Programing..................................................... 20 Performance Measure 1 – Safety (PM-1) .................................................................................................. 20 Performance Measure 2 – System Condition (PM-2) ............................................................................ 19 Pavement Quality ............................................................................................................19 Bridge Condition .............................................................................................................20 Performance Measure 3 – Reliability (PM-3) .......................................................................................... 22
Appendix A: Public Notice ..................................................................................... 25
2021-2027 Transportation Improvement Program
3
List of Acronyms
COG
FAST ACT
FHWA
FTA
ITS
JARC
LATS
LCOG
LOTTR
LRTA
LRTP
MPO
MAP-21
NEPA
PPP
SCDOT
STIP
STP
TAMP
TAP
TIP
UPWP
USDOT
UZA
V/C
Council of Government
Fixing America’s Surface Transportation Act
Federal Highway Administration
Federal Transit Administration
Intelligent Transportation Systems
Job Access/Reverse Commute
Lowcountry Area Transportation Study
Lowcountry Council of Governments
Level of Travel Time Reliability
Lowcountry Regional Transit Authority
Long Range Transportation Plan
Metropolitan Planning Organization
Moving Ahead for Progress in the 21st Century
National Environmental Policy Act
Public Participation Plan
South Carolina Department of Transportation
Statewide Transportation Improvement Program
Surface Transportation Program
Transportation Asset Management Plan
Transportation Alternative Program
Transportation Improvement Program
Unified Planning Work Program
United States Department of Transportation
Urbanized Area
Volume to Capacity Ratio (a measurement of roadway congestion)
2021-2027 Transportation Improvement Program
4
Introduction and Background
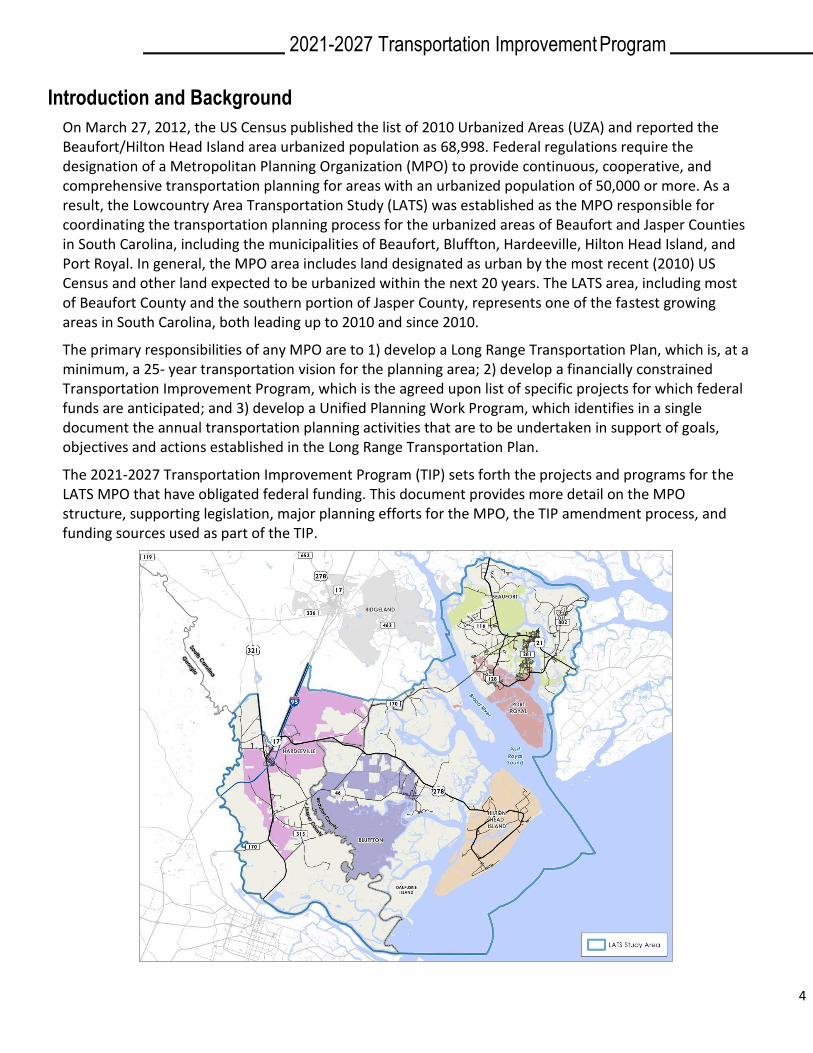
On March 27, 2012, the US Census published the list of 2010 Urbanized Areas (UZA) and reported the Beaufort/Hilton Head Island area urbanized population as 68,998. Federal regulations require the designation of a Metropolitan Planning Organization (MPO) to provide continuous, cooperative, and comprehensive transportation planning for areas with an urbanized population of 50,000 or more. As a result, the Lowcountry Area Transportation Study (LATS) was established as the MPO responsible for coordinating the transportation planning process for the urbanized areas of Beaufort and Jasper Counties in South Carolina, including the municipalities of Beaufort, Bluffton, Hardeeville, Hilton Head Island, and Port Royal. In general, the MPO area includes land designated as urban by the most recent (2010) US Census and other land expected to be urbanized within the next 20 years. The LATS area, including most of Beaufort County and the southern portion of Jasper County, represents one of the fastest growing areas in South Carolina, both leading up to 2010 and since 2010.
The primary responsibilities of any MPO are to 1) develop a Long Range Transportation Plan, which is, at a minimum, a 25‐ year transportation vision for the planning area; 2) develop a financially constrained Transportation Improvement Program, which is the agreed upon list of specific projects for which federal funds are anticipated; and 3) develop a Unified Planning Work Program, which identifies in a single document the annual transportation planning activities that are to be undertaken in support of goals, objectives and actions established in the Long Range Transportation Plan.
The 2021‐2027 Transportation Improvement Program (TIP) sets forth the projects and programs for the LATS MPO that have obligated federal funding. This document provides more detail on the MPO structure, supporting legislation, major planning efforts for the MPO, the TIP amendment process, and funding sources used as part of the TIP.
2021-2027 Transportation Improvement Program
5
Structure
To facilitate and encourage interaction among stakeholder groups and the local community, the LATS adopted a committee structure composed of a Policy Committee and Technical Committee. The functions of these two committees are detailed below:
Policy Committee
• Contains the voting membership
• Has final local approval and authority on all major transportation decision, policies, and programs of LATS
Technical Committee
• Provides recommendations to the Policy Committee on technical methods, procedures, and standards that are used in the development of transportation plans and programs
• Prioritizes projects in accordance with the criteria established by SCDOT and FAST/MAP‐21 requirements
• Develops funding scenarios for consideration by the Policy Committee and individual governmental entities
Membership of the Policy Committee and Technical Committee is prescribed by the LATS Policy Committee bylaws. The voting members consist of the following (or their designees):
• Town of Hilton Head Island Mayor
• Town of Bluffton Mayor
• Town of Port Royal Mayor
• City of Beaufort Mayor
• City of Hardeeville Mayor
• Beaufort County Council Chairman
• Jasper County Council Chairman
• Beaufort County Legislative Delegation Member
• Jasper County Legislative Delegation Member
• SCDOT Commissioners representing areas within the Lowcountry Metropolitan Planning Area
• LRTA Board Chairman
Federal Mandates
Federal regulations require that the TIP be a product of the metropolitan planning process. LATS implements the FAST Act through plans and programs that consider all modes of transportation, and which are “continuing, cooperative, and comprehensive to the degree appropriate” [SEC. 1203(a)(4)]. In addition, the FAST Act establishes a performance‐based program that provides a means to more efficient investment of Federal transportation funds by focusing on national transportation goals, increasing the accountability and transparency of the Federal highway programs, and improving transportation investment decision‐making through performance‐based planning and programming.
2021-2027 Transportation Improvement Program
6
Further, MPOs are responsible for meeting the requirements of the Joint Federal Highway Administration (FHWA)/Federal Transit Administration (FTA) Planning Rule (23 CFR part 450). The legislation requires that the metropolitan planning process must “include a proactive public involvement process that provides complete information, timely public notice, full public access to key decisions, and early and continuing involvement of the public in developing plans” and Transportation Improvement Programs (TIP) [23 CFR part 450.316(b)(1)].
Supporting Legislation
When the original LATS TIP was completed in 2015, MAP 21 was the guidance legislation.
MAP‐21
Adopted federal regulations provide guidance on the metropolitan transportation planning process. The Moving Ahead for Progress in the 21st Century Act (MAP‐21), enacted in July 2012 addressed the challenges the modern transportation system faces, including safety, security, traffic congestion, intermodal connectivity, freight movement, environmental protection, and delays in project delivery. To help guide the planning process, MAP‐21 set forth eight planning factors that agencies must consider when developing their plans:
• Support the economic vitality of the metropolitan area, especially by enabling global competitiveness, productivity, and efficiency.
• Increase the safety of the transportation system for motorized and non‐motorized users.
• Increase the security of the transportation system for motorized and non‐motorized users.
• Increase the accessibility and mobility of people and for freight.
• Protect and enhance the environment, promote energy conservation, improve the quality of life, and promote consistency between transportation improvements and State and local planned growth and economic development patterns.
• Enhance the integration and connectivity of the transportation system, across and between modes, people, and freight.
• Promote efficient system management and operation.
• Emphasize the preservation of the existing transportation system.
MAP‐21 also emphasized four broad focal points for transportation investment:
1. Streamlined Federal Highway transportation programs.
MAP‐21 provided the majority of Federal‐aid highway funds to the states through core programs. However, the core highway programs were reduced from seven to five.
The Interstate Maintenance, National Highway System, and Highway Bridge program were streamlined to create a single new program, called The National Highway Performance Program. The program provided increased flexibility, while guiding state and local investments to maintain and improve the conditions and performance of the National Highway System (NHS). This eliminated the barriers between existing programs that limited states’ flexibility to
2021-2027 Transportation Improvement Program
7
address the most vital needs for highways and bridges and will hold states accountable for improving outcomes and using tax dollars efficiently.
2. Established a performance‐based system.
MAP‐21 improves statewide and metropolitan planning processes to incorporate a more comprehensive performance‐based approach to decision making. Utilizing performance targets will assist states and metropolitan areas in targeting limited resources on projects that will improve the condition and performance of their transportation assets.
3. Creates jobs and supports economic growth.
The LATS MPO will coordinate transportation projects with local governments and agencies to improve the MPO region’s global competitiveness. This will be achieved by promoting transportation corridors that improve access to the region.
4. Supports the Department of Transportation’s (DOT) aggressive safety agenda.
MAP‐21 builds on the successful Highway Safety Improvement Program (HSIP). MAP‐21 substantially increases the amount of funding for this program because of the strong results it has achieved in reducing fatalities. Under HSIP, states must develop and implement a safety plan that identifies highway safety programs and a strategy to address them.
This program also replaced the Surface Transportation Program, but retained the same structure, goals and flexibility to allow states and metropolitan areas to invest in the projects that fit their unique needs and priorities.
FAST Act
The Fixing America’s Surface Transportation Act, adopted in December 2015, is the federal transportation legislation that replaces MAP‐21. Through the FAST Act, federal funding will be provided for transportation programs for the next five years. The act is anticipated to continue the focus on performance‐based planning established in MAP‐21. Certain funding programs have been created or modified as a part of the FAST Act. For instance, Transportation Alternatives funding has been placed under the umbrella of the Surface Transportation Program (STP). A new funding category has also been created to advance major freight initiatives.
Title VI and Environmental Justice
Environmental justice has been a federal requirement since recipients of federal funds were required to certify nondiscrimination through Title VI of the Civil Rights Act of 1964. A 1994 Presidential Executive Order required all federal agencies to make environmental justice part of their missions. The law was enacted to avoid the use of federal funds for projects, programs, or other activities that generate disproportionate or discriminatory adverse impacts on minority or low‐income populations. The U.S. Department of Transportation (USDOT) promotes environmental justice as an integral part of the long range transportation planning process as well as individual project planning and design.
According to the USDOT, environmental justice requires the understanding and incorporation of the unique needs of distinct socioeconomic groups in order to create transportation projects that fit harmoniously within the framework of their communities without sacrificing safety or mobility. The environmental justice assessment incorporated in the LRTP is based on three fundamental principles derived from guidance issued by the USDOT:
2021-2027 Transportation Improvement Program
8
• Avoid, minimize, or mitigate disproportionately high and adverse human health and environmental effects, including social and economic effects, on minority and low‐income populations.
• Ensure all potentially affected communities’ full and fair participation in the transportation decision‐making process.
• Prevent the denial of, reduction in, or significant delay in the receipt of benefits by minority and low‐income populations.
Investments made in the TIP must be consistent with federal Title VI requirements. Additionally, the process by which new projects are identified and prioritized for inclusion in the TIP must consider the equitable selection of projects in accordance with federal Title VI requirements.
Joint Federal Highway Administration/ Federal Transit Administration Planning Rule
The Joint Federal Highway Administration (FHWA)/ Federal Transit Administration (FTA) Planning Rule (23 CFR part 450, 49 CFR part 613) also requires MPOs to conduct locally‐developed public participation. This legislation requires “a proactive public involvement process that provides complete information, timely public notice, full public access to key decisions, and early and continuing involvement of the public in developing plans and TIPs (Transportation Improvement Programs),” including the Long Range Transportation Plan [23 CFR part 450.316(b)(1)].
Planning Efforts
Transportation Improvement Program (TIP)
The Lowcountry Area Transportation Study (LATS) 2021‐2027 Transportation Improvement Program (TIP) details projects and programs that have obligated federal funding. Currently, projects incorporated in this TIP are continuing projects and programs that originated in the 2040 LATS Long Range Transportation Plan, as well as SCDOT-identified projects for the Lowcountry region. The 2021-2027 TIP is the first to cover a seven-year period, rather than a four-year period, and has been developed by LATS with the cooperation of SCDOT and LRTA. The TIP has been advertised and made available for public comment. While the TIP is usually approved every three years, the document may be amended throughout the year. Procedures for amending and modifying the TIP are detailed in the next section. The TIP may also include surface transportation projects that are being implemented by the state, city, county, or regional transit agency for which federal funding is requested, as well as regionally significant projects requiring action by the FHWA or the FTA. This is the first TIP created for LATS since its establishment as an MPO.
TIP Requirements
The FAST Act, as well as the Metropolitan Planning Regulations, mandate that a TIP comprise the following:
1. Identify transportation improvement projects recommended for advancement during the program years. The projects required are those located within the study area and receiving Federal Highway Administration (FHWA) or Federal Transit Administration (FTA) funds;
2. Identify the criteria and process for prioritization for inclusion of projects in the TIP and any changes for past TIPs;
2021-2027 Transportation Improvement Program
9
3. Group improvements of similar urgency and anticipated staging into appropriate staging periods; Include realistic estimates of total costs and revenue for the program period;
4. Include a discussion of how improvements recommended for the Long Range Transportation Plan and congestion model were merged into the plan;
5. List major projects from previous TIPs that were implemented and identified and major delays in planning implementation.
6. Include, to the maximum extent practicable, a description of the anticipated effect of the TIP toward achieving the performance targets identified in the long‐range plan.
Financial Constraint
The TIP must be financially constrained, meaning that the amount of funding programmed must not exceed the amount of funding estimated to be available. In developing the 2021‐2027 TIP, LATS has taken into consideration the transportation funding revenues anticipated during the years of the TIP and has found the 2021‐2027 TIP to be financially constrained.
Should an action occur in the future that significantly affects the funding of programmed projects in the TIP, LATS along with its partners and the project sponsors would review the impact to the TIP. Appropriate action, such as potential amendments to the TIP, to address the funding of affected projects would be taken at that time.
Long Range Transportation Plan (LRTP)
The Lowcountry Area Transportation Study (LATS) Metropolitan Planning Organization’s Long Range Transportation Plan (LATS LRTP) defines the community’s current (or existing) strategy for creating a regional transportation system that accommodates the current mobility needs of residents and looks to the future to anticipate where new needs may arise. The LATS LRTP is a financially constrained plan, meaning it identifies projects and programs that can reasonably be implemented through the plan’s horizon of 25 years. In response to federal mandates and the desires of local residents, the LRTP addresses all modes of transit, including automobile, bicycle, pedestrian, transit, air, and rail movements.
The LATS LRTP is the largest planning effort required for completion by the Lowcountry Area Transportation Study. By its nature, it is also the most far‐reaching. The plan fulfills federal requirements and serves as the region’s transportation vision. It seeks to characterize current and future transportation needs, outline the region’s long‐range transportation vision, document multi‐modal transportation strategies to address needs anticipated during the course of 25 years, and identify long‐term opportunities beyond the current ability to fund projects. In order to reflect changing conditions and planning principles, the plan is required to be updated every five years. Federal funding cannot be allocated to transportation projects within the MPO region unless they are included in the financially‐constrained plan.
Project Prioritization
To best understand how to allocate the region’s limited financial resources, it is important to establish priorities for widening, new location, and intersection improvement projects. To balance priorities, project evaluations need to go beyond traffic impacts to consider cultural, environmental, economic, multimodal, and land use considerations. Recognizing the need to create a balanced prioritization to
2021-2027 Transportation Improvement Program
10
establish project rankings, South Carolina passed Act 114 in 2007, which added Sections 57‐1‐370 and 57‐1‐460 to the South Carolina Code of Laws. These sections provide details of the ranking process to be used by SCDOT as well as its affiliated MPOs and Councils of Governments (COGs).
Capital roadway projects recommended in the LATS LRTP are evaluated using a priority ranking process that is required to be consistent with Act 114 guidance and SCDOT best practices. The criteria also required to reflect the needs and priorities of the MPO area. The LATS Technical Committee develops roadway project prioritization criteria in collaboration with SCDOT and FHWA. As a relatively new MPO, LATS leaned on the existing Lowcountry COG priority ranking process, the SCDOT priority ranking process, and other COG and MPO ranking processes around the state.
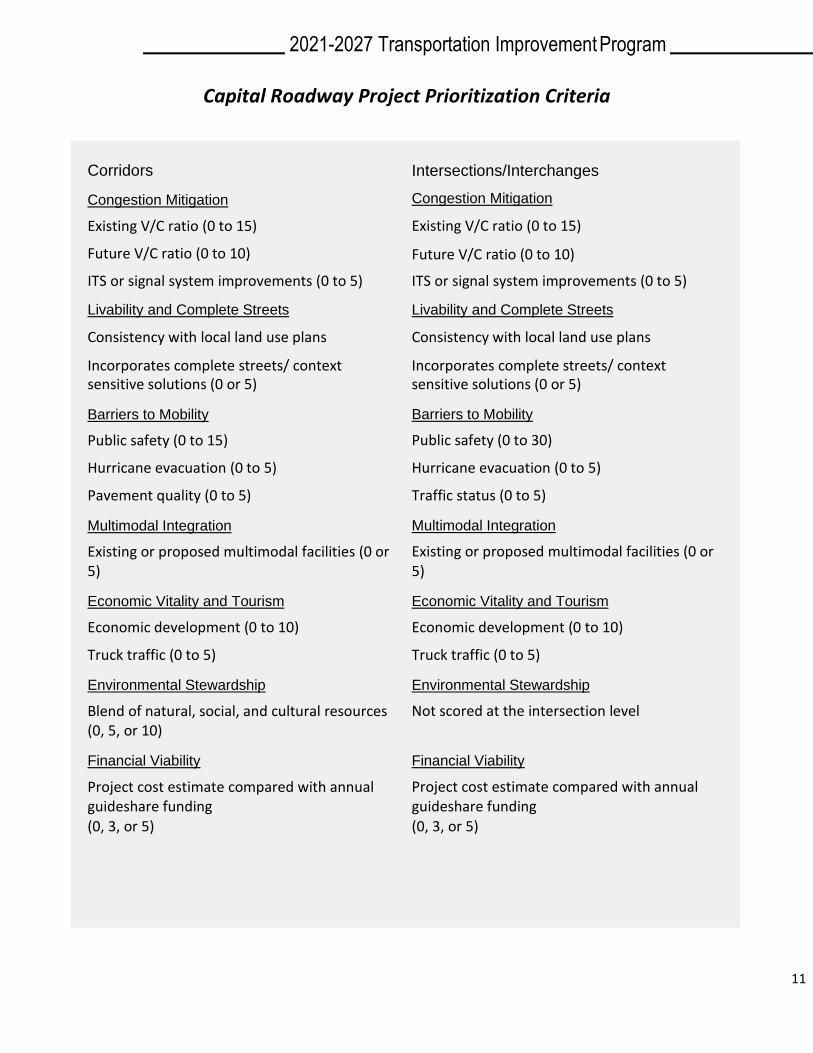
To remain consistent with the structure of the LATS LRTP, prioritization criteria are organized according to the plan’s guiding principles. Projects are separated by roadway corridors and intersections/interchanges. The evaluation measures used to assess each project in the 2040 LRTP are shown here along with their potential point ranges. Data for this prioritization process was gathered from the region’s travel demand model and SCDOT data sources.
The prioritization process established in the LRTP will be used as the basis for identifying future roadway capital projects for inclusion in the TIP. Roadway capital project prioritization was completed for this document by consulting previous prioritization efforts by LCOG as well as through discussion with the Technical Committee and LATS Policy Committee.
Bicycle and pedestrian projects that are collocated with another roadway improvement were included in the roadway prioritization process. Independent bicycle and pedestrian projects were not required to be prioritized as part of the LRTP. These projects will continue to be prioritized through the identification efforts of the LATS Committee members. If a region‐wide bicycle and pedestrian plan is prepared in the future, it is anticipated that independent bicycle and pedestrian projects will be prioritized using the methodology identified in that plan.
Transit projects will continue to be prioritized through the planning efforts of the LRTA.
2021-2027 Transportation Improvement Program
11
Capital Roadway Project Prioritization Criteria
Corridors
Congestion Mitigation
Existing V/C ratio (0 to 15)
Future V/C ratio (0 to 10)
ITS or signal system improvements (0 to 5)
Livability and Complete Streets
Consistency with local land use plans
Incorporates complete streets/ context sensitive solutions (0 or 5)
Barriers to Mobility
Public safety (0 to 15)
Hurricane evacuation (0 to 5)
Pavement quality (0 to 5)
Multimodal Integration
Existing or proposed multimodal facilities (0 or 5)
Economic Vitality and Tourism
Economic development (0 to 10)
Truck traffic (0 to 5)
Environmental Stewardship
Blend of natural, social, and cultural resources (0, 5, or 10)
Financial Viability
Project cost estimate compared with annual guideshare funding (0, 3, or 5)
Intersections/Interchanges
Congestion Mitigation
Existing V/C ratio (0 to 15)
Future V/C ratio (0 to 10)
ITS or signal system improvements (0 to 5)
Livability and Complete Streets
Consistency with local land use plans
Incorporates complete streets/ context sensitive solutions (0 or 5)
Barriers to Mobility
Public safety (0 to 30)
Hurricane evacuation (0 to 5)
Traffic status (0 to 5)
Multimodal Integration
Existing or proposed multimodal facilities (0 or 5)
Economic Vitality and Tourism
Economic development (0 to 10)
Truck traffic (0 to 5)
Environmental Stewardship
Not scored at the intersection level
Financial Viability
Project cost estimate compared with annual guideshare funding (0, 3, or 5)
2021-2027 Transportation Improvement Program
12
Public Involvement
Public involvement associated with LATS serves to actively solicit ideas from residents and stakeholders of the study area. Public involvement also seeks to provide meaningful ways for these residents and stakeholders to communicate with decision makers regarding the allocation of transportation funds. To better detail the role of public involvement in the preparation of key planning documents, LATS has adopted a Public Participation Plan (PPP). Through the implementation of the PPP, residents and stakeholders have access to information as well as established ways to provide feedback.
Metropolitan and State TIPs
Just as each MPO is required to develop a TIP, each state is required to compile a Statewide Transportation Improvement Plan (STIP) as a requirement of federal regulations. The STIP includes all federally funded transportation projects from throughout the state. In South Carolina, MPO TIPs are included in the STIP once approved by the relevant metropolitan planning organization (i.e. LATS in this area) and after the Federal Highway Administration (FHWA) and the Federal Transit Administration (FTA) make their required financial constraint and air quality findings (as necessary). Projects must be in the STIP before funding authorities, such as FTA, FHWA, or the South Carolina Department of Transportation (SCDOT) can obligate or commit monies to contracts and therefore, before sponsors can actually spend any of these funds.
TIP Amendment Process
As mentioned above, a major update of the TIP is typically conducted on a four-year schedule. However, during the life of the TIP it may be necessary to update certain projects or elements. This section details the process for identifying and conducting a policy amendment or an administrative modification to the TIP.
Policy Amendments
Policy amendments are those that:
• Add a new project to the TIP, regardless if the project has been in a previous TIP or not.
• Delete a programmed project from the TIP;
• Delete or significantly change a regionally significant project feature of an existing project (for example, change the project termini);
• Delete a regionally significant project or defer it from the first four years of the TIP;
• Change a project’s funding per table on the following page;
• Could potentially be inconsistent with recommendations in the LRTP; or
• Change a project description/scope or introducing any other change that is inconsistent with the National Environmental Policy Act (NEPA) documentation or will alter the NEPA determination.
Major policy amendments are those that involve any changes to the policy‐level recommendations in the fiscally constrained LATS LRTP, such as:
• Changing the nature and or function of corridors and intersections;
• Adding or deleting road segments including interchange ramps; or
2021-2027 Transportation Improvement Program
13
• Adding or deleting public transit routes, segments or transfer points.
Administrative Modifications and Corrections
Administrative modifications include all changes other than policy amendments.
These modifications usually involve:
• Shifting funds between years for an individual project or for projects within pools;
• Moving project staging between years without affecting the scope of the project,
• Affecting its expected completion within the first four years of the TIP, or affecting the current year staging;
• Changing the federal/state/local funding source;
• Changing the designated responsible agency with the original sponsor’s approval;
• Changing project funding in the first four TIP years per table on the following page;
• Changing the program allocation to the projects per table on the following page;
• Adding new projects from unallocated money in the SCDOT budget;
• Adding new bridge replacement or rehabilitation projects with bridge funds;
• Adding new safety projects; or
• Adding new public transit projects.
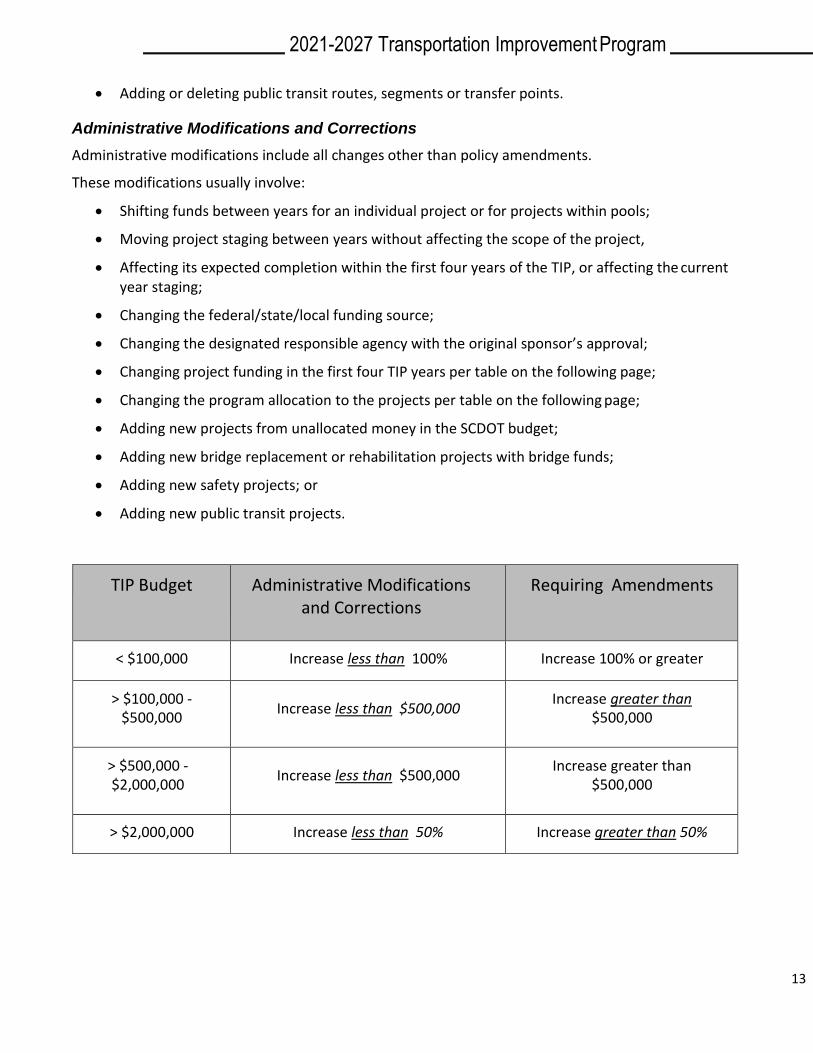
TIP Budget Administrative Modifications and Corrections
Requiring Amendments
< $100,000 Increase less than 100% Increase 100% or greater
> $100,000 ‐ $500,000
Increase less than $500,000 Increase greater than
$500,000
> $500,000 ‐ $2,000,000
Increase less than $500,000 Increase greater than
$500,000
> $2,000,000 Increase less than 50% Increase greater than 50%
2021-2027 Transportation Improvement Program
14
TIP Modification and Amendment Process
Processing of Revisions
Policy amendments will typically be processed quarterly, and must be submitted by January 1, April 1, July 1, and October 1 of each year. Policy amendments will be recommended by the LATS Technical Committee for LATS Policy Committee consideration and action. Formal public hearings will not typically be held. Public notification of the actions will be posted on the LATS page of the LCOG website and input will be accepted during the public comment period of any of the committee meetings considering the amendments.
Administrative modifications submitted to LATS staff by the first working day of each month will typically be processed by the fifteenth working day of that month, provided they are complete. Processing may be delayed if additional information is required. Administrative modifications and corrections do not require committee review or approval.
LATS staff will process TIP revisions by:
• Entering the requested amendments and modifications into the TIP project database;
• Notifying SCDOT of amendments and modifications for inclusion in the STIP; and
• Sending a summary of amendments and modifications to the TIP notification list as needed.
If a sponsor submits a TIP revision and LATS staff denies it, the sponsor may appeal the LATS staff decision to the Policy Committee.
Funding
LATS projects are funded through federal and state transportation funds. Several sources of funds are involved in projects that appear in the TIP.
Guideshare Funds
LATS projects are funded through federal and state transportation funds. Funds for road improvements are allocated by SCDOT through the Guideshare Program, otherwise known as the System Upgrade Program. The South Carolina Transportation Commission sets aside approximately $138 million dollars of FHWA and SCDOT funds each year and distributes the money among the state’s eleven MPOs and ten Councils of Governments based on population and vehicle miles of travel in each region. The Guideshare sets the annual budget for highway improvements within each MPO or COG, and total project costs in any given year normally cannot exceed the Guideshare apportionment.
Road improvements may include constructing new roads, adding traffic lanes to existing roads, constructing paved shoulders, installing traffic signals, constructing sidewalks or bike lanes, or making safety improvements. Major maintenance improvements may also be included, such as resurfacing a road. However, minor maintenance activities such as patching potholes are not funded through LATS, but are handled directly by SCDOT maintenance units.
2021-2027 Transportation Improvement Program
15
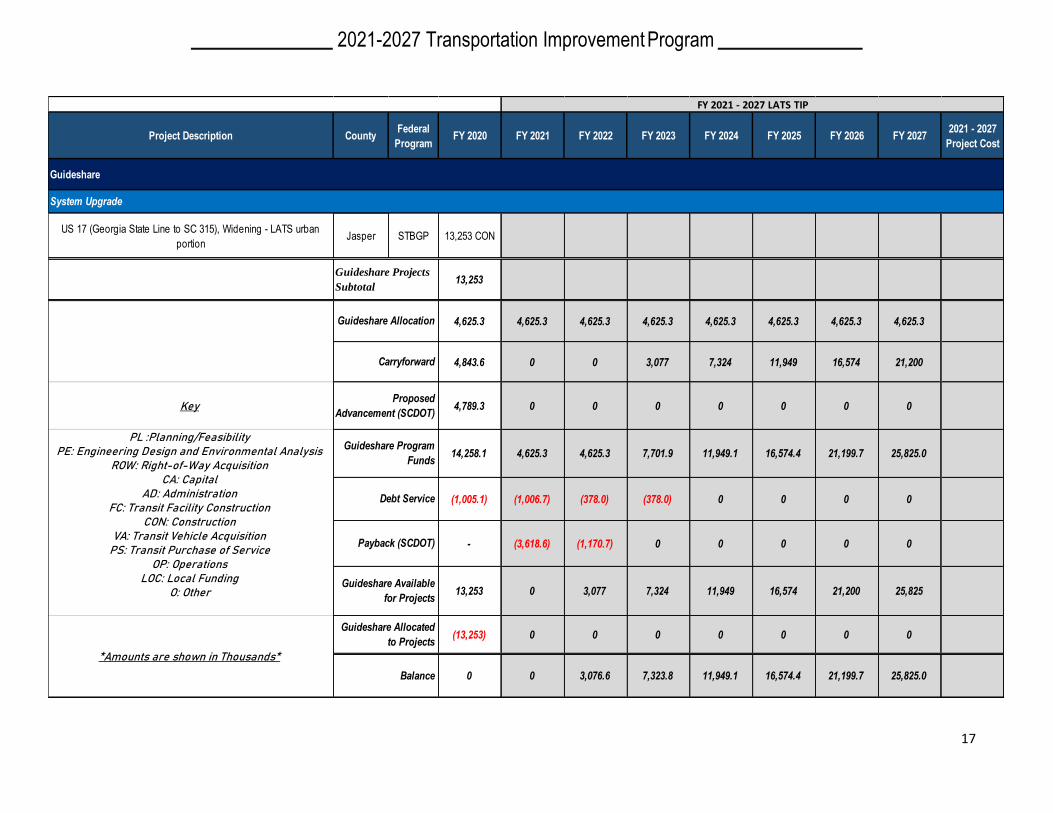
Due to its commitment to completely fund (with its sibling organization the Lowcountry Council of Governments (LCOG)) the widening of US 17 from SC 315 to the Georgia border, LATS will have no Guideshare funds available for other projects until FY 2022.
Transportation Alternative Program Projects
In 2012, Congress passed the Moving Ahead for Progress in the 21st Century (MAP‐21) Highway Authorization Bill. The former Transportation Enhancement Program, created by earlier legislation, was rebranded as the Transportation Alternative Program, or TAP, to maintain a level of funding for projects that had frequently been left out of highway improvement plans in past years. Three specific activities are permitted for use of TAP funding by SCDOT, as detailed below. All projects must have a clear relationship to transportation, and not merely beautification or recreation. For metropolitan areas with a population less than 200,000, projects are selected by the SCDOT Commission. Transportation Alternatives funds typically require a 20% match.
For the Transportation Alternatives Program, a pedestrian is not only defined as a person traveling by foot but also “any mobility impaired person using a wheelchair.” The definition of a bicycle transportation facility is “a new or improved lane, path, or shoulder for use by bicyclists and a traffic control device, shelter, or parking facility for bicycles.” Bicycle and pedestrian projects must be “principally for transportation, rather than recreation purposes.” It must also demonstrate a logical sense of connectivity.
Additional Funding Sources
Other projects in this TIP are programmed within the following funding categories:
1. Bridges – Funding for projects that address structurally deficient or functionally obsolete bridges on the federal‐aid system, with a portion of the funding required for use on bridges typically not eligible for federal funding (off‐system). Includes rehabilitation and replacement of bridges. Bridge Program funds typically require a 20% match. This is a Commission‐approved funding category.
2. Earmark – Funding for projects that has been established through legislative authority.
3. FTA Section 5307 Capital – FTA urbanized area mass transit formula program for capital projects. FTA Section 5307 Capital funds typically require a 20% match.
4. FTA Section 5307 Operations – FTA urbanized area mass transit formula program for operating assistance. FTA Section 5307 Operations funds typically require a 50% match.
5. Pavement/Reconstruction – Funding for resurfacing of Primary Routes (US and SC) and state secondary routes eligible for federal funding. Funding is divided between three categories of improvements including reconstruction, rehabilitation and preservation. Pavement and Reconstruction funds typically require a 20% match. This is a Commission‐approved funding category.
6. Recreational Trails – Funding used to develop and maintain recreational trails and trail‐related facilities for both non‐motorized and motorized recreational trail uses. The RTP funds come from the Federal Highway Trust Fund and represent a portion of the motor fuel excise tax collected from non‐highway recreational fuel use. The RTP is administered by the South Carolina Parks Recreation and Tourism.
2021-2027 Transportation Improvement Program
16
With each program, the proposed projects represent priority regional needs identified through the comprehensive transportation process.
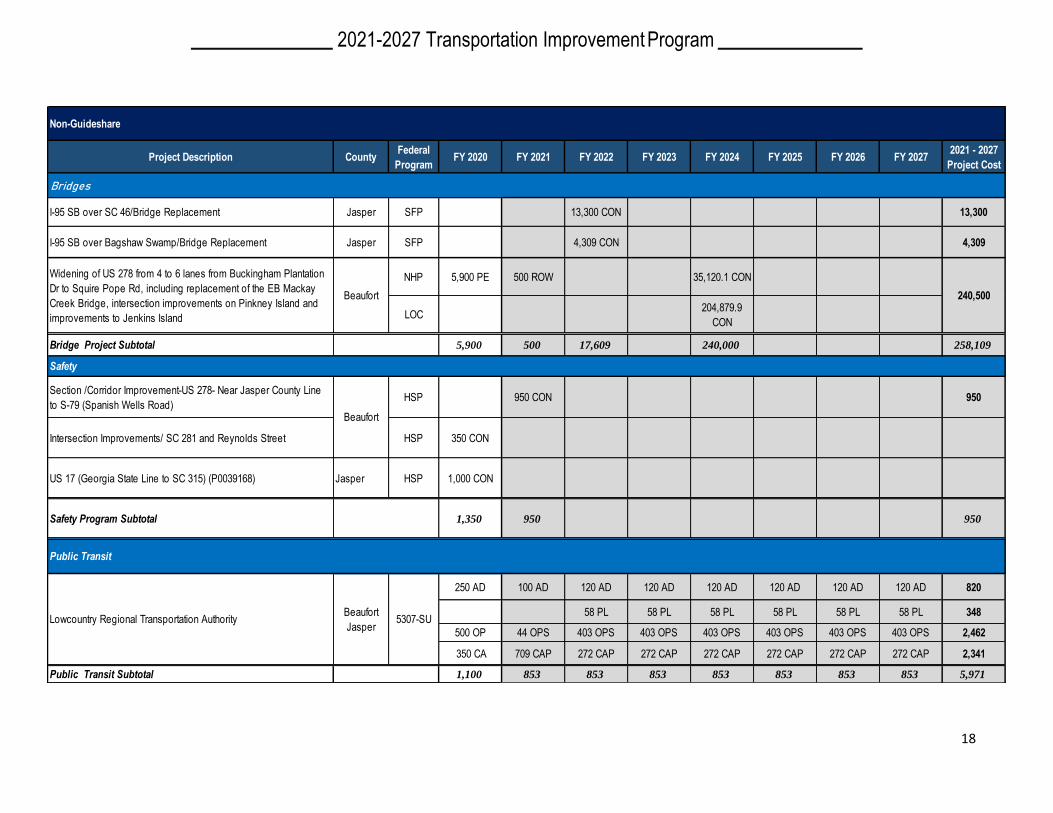
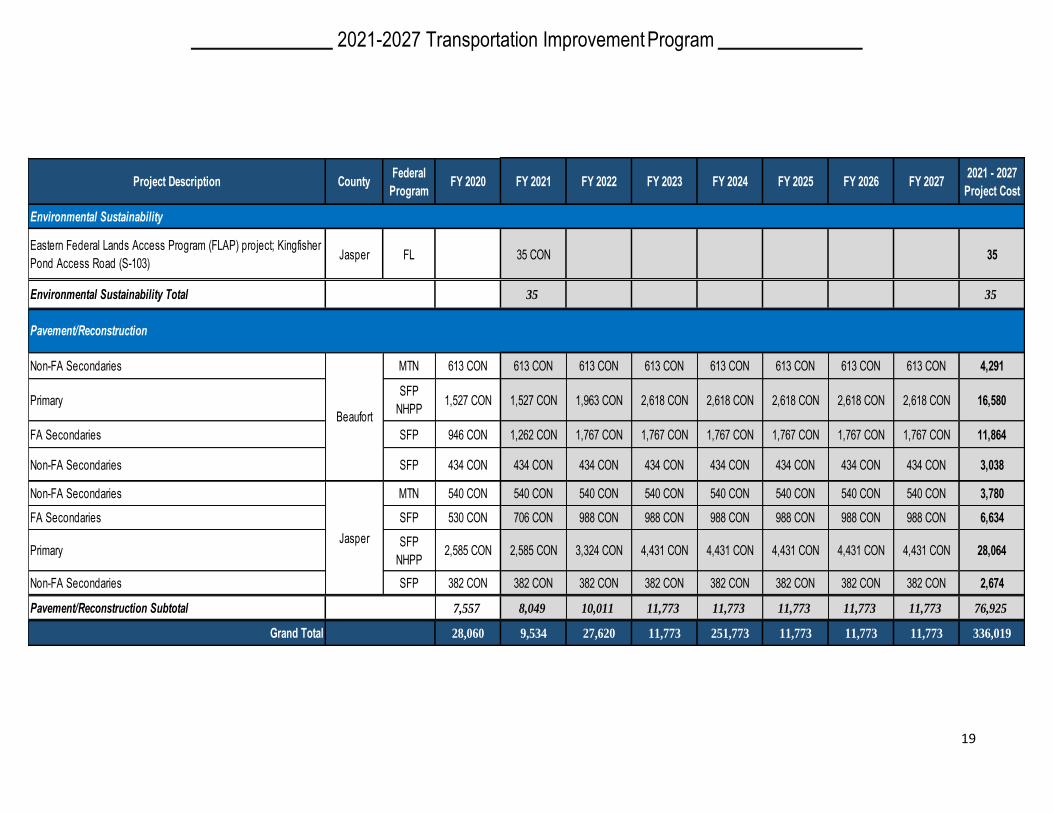
2021-2027 TIP Funding Table
The table following this narrative identifies the projects included in the 2021-2027 LATS Transportation Improvement Program. Funding for each project is shown by fiscal year as well as federal funding program. All of the projects contained within this table fall within the LATS MPO boundary, in either Beaufort or Jasper County as noted. Cost estimates for the projects shown in this table were developed in collaboration with SCDOT, and are shown in year of expenditure, thousands of dollars. Some of the projects are broken into phases, reflecting when construction, right‐of‐way, or preliminary engineering are expected to occur as well as the funding levels for each phase.
2021-2027 Transportation Improvement Program
17
Project Description CountyFederal
ProgramFY 2020 FY 2021 FY 2022 FY 2023 FY 2024 FY 2025 FY 2026 FY 2027
2021 - 2027
Project Cost
US 17 (Georgia State Line to SC 315), Widening - LATS urban
portionJasper STBGP 13,253 CON
13,253
4,625.3 4,625.3 4,625.3 4,625.3 4,625.3 4,625.3 4,625.3 4,625.3
4,843.6 0 0 3,077 7,324 11,949 16,574 21,200
Key 4,789.3 0 0 0 0 0 0 0
14,258.1 4,625.3 4,625.3 7,701.9 11,949.1 16,574.4 21,199.7 25,825.0
(1,005.1) (1,006.7) (378.0) (378.0) 0 0 0 0
- (3,618.6) (1,170.7) 0 0 0 0 0
13,253 0 3,077 7,324 11,949 16,574 21,200 25,825
(13,253) 0 0 0 0 0 0 0
0 0 3,076.6 7,323.8 11,949.1 16,574.4 21,199.7 25,825.0
Guideshare Program
Funds
Debt Service
Payback (SCDOT)
Guideshare Available
for Projects
Balance
Guideshare Projects
Subtotal
Guideshare Allocation
Carryforward
Guideshare
System Upgrade
FY 2021 - 2027 LATS TIP
PL :Planning/Feasibility PE: Engineering Design and Environmental Analysis
ROW: Right-of-Way AcquisitionCA: Capital
AD: AdministrationFC: Transit Facility Construction
CON: ConstructionVA: Transit Vehicle Acquisition
PS: Transit Purchase of Service OP: Operations
LOC: Local FundingO: Other
*Amounts are shown in Thousands*
Guideshare Allocated
to Projects
Proposed
Advancement (SCDOT)
2021-2027 Transportation Improvement Program
18
Project Description CountyFederal
ProgramFY 2020 FY 2021 FY 2022 FY 2023 FY 2024 FY 2025 FY 2026 FY 2027
2021 - 2027
Project Cost
I-95 SB over SC 46/Bridge Replacement Jasper SFP 13,300 CON 13,300
I-95 SB over Bagshaw Swamp/Bridge Replacement Jasper SFP 4,309 CON 4,309
NHP 5,900 PE 500 ROW 35,120.1 CON
LOC204,879.9
CON
Bridge Project Subtotal 5,900 500 17,609 240,000 258,109
Section /Corridor Improvement-US 278- Near Jasper County Line
to S-79 (Spanish Wells Road)HSP 950 CON 950
Intersection Improvements/ SC 281 and Reynolds Street HSP 350 CON
US 17 (Georgia State Line to SC 315) (P0039168) Jasper HSP 1,000 CON
Safety Program Subtotal 1,350 950 950
250 AD 100 AD 120 AD 120 AD 120 AD 120 AD 120 AD 120 AD 820
58 PL 58 PL 58 PL 58 PL 58 PL 58 PL 348
500 OP 44 OPS 403 OPS 403 OPS 403 OPS 403 OPS 403 OPS 403 OPS 2,462
350 CA 709 CAP 272 CAP 272 CAP 272 CAP 272 CAP 272 CAP 272 CAP 2,341
Public Transit Subtotal 1,100 853 853 853 853 853 853 853 5,971
Widening of US 278 from 4 to 6 lanes from Buckingham Plantation
Dr to Squire Pope Rd, including replacement of the EB Mackay
Creek Bridge, intersection improvements on Pinkney Island and
improvements to Jenkins Island
Beaufort
Beaufort
5307-SULowcountry Regional Transportation Authority
240,500
Public Transit
Beaufort
Jasper
Non-Guideshare
Bridges
Safety
2021-2027 Transportation Improvement Program
19
Project Description CountyFederal
ProgramFY 2020 FY 2021 FY 2022 FY 2023 FY 2024 FY 2025 FY 2026 FY 2027
2021 - 2027
Project Cost
Eastern Federal Lands Access Program (FLAP) project; Kingfisher
Pond Access Road (S-103)Jasper FL 35 CON 35
Environmental Sustainability Total 35 35
Non-FA Secondaries MTN 613 CON 613 CON 613 CON 613 CON 613 CON 613 CON 613 CON 613 CON 4,291
Primary SFP
NHPP 1,527 CON 1,527 CON 1,963 CON 2,618 CON 2,618 CON 2,618 CON 2,618 CON 2,618 CON 16,580
FA Secondaries SFP 946 CON 1,262 CON 1,767 CON 1,767 CON 1,767 CON 1,767 CON 1,767 CON 1,767 CON 11,864
Non-FA Secondaries SFP 434 CON 434 CON 434 CON 434 CON 434 CON 434 CON 434 CON 434 CON 3,038
Non-FA Secondaries MTN 540 CON 540 CON 540 CON 540 CON 540 CON 540 CON 540 CON 540 CON 3,780
FA Secondaries SFP 530 CON 706 CON 988 CON 988 CON 988 CON 988 CON 988 CON 988 CON 6,634
Primary SFP
NHPP 2,585 CON 2,585 CON 3,324 CON 4,431 CON 4,431 CON 4,431 CON 4,431 CON 4,431 CON 28,064
Non-FA Secondaries SFP 382 CON 382 CON 382 CON 382 CON 382 CON 382 CON 382 CON 382 CON 2,674
Pavement/Reconstruction Subtotal 7,557 8,049 10,011 11,773 11,773 11,773 11,773 11,773 76,925
Grand Total 28,060 9,534 27,620 11,773 251,773 11,773 11,773 11,773 336,019
Environmental Sustainability
Pavement/Reconstruction
Beaufort
Jasper
2021-2027 Transportation Improvement Program
20
Performance Based Planning and Programing
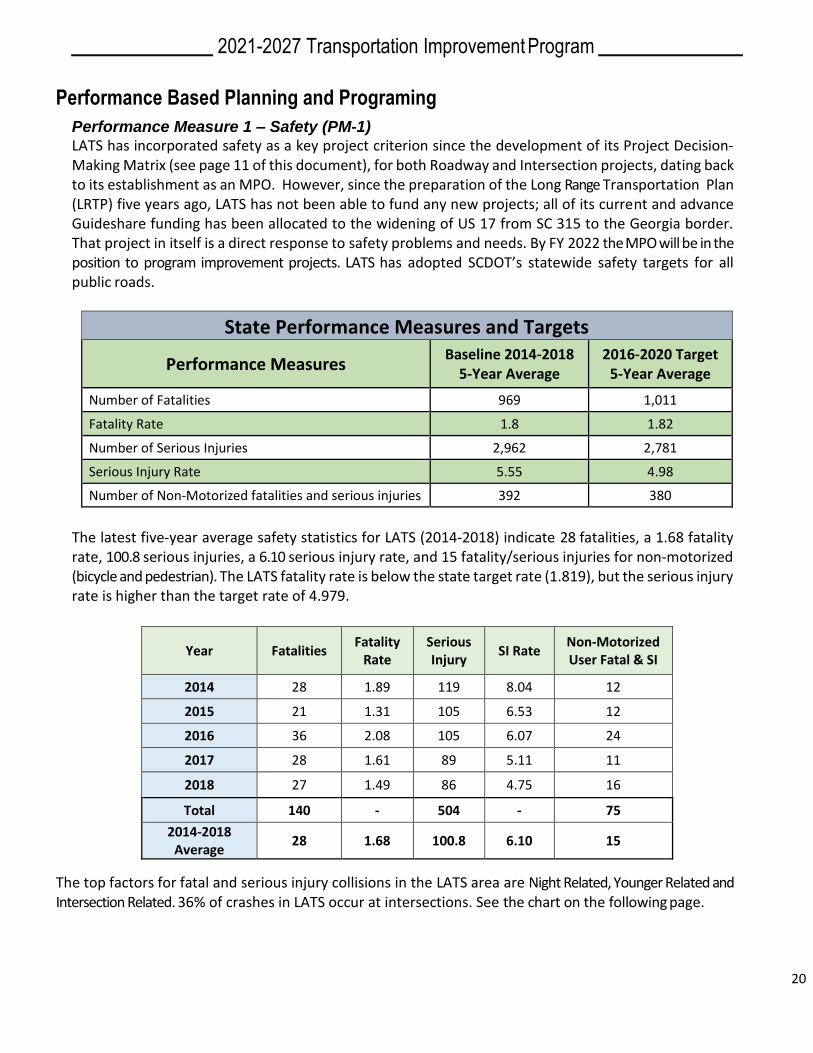
Performance Measure 1 – Safety (PM-1) LATS has incorporated safety as a key project criterion since the development of its Project Decision‐ Making Matrix (see page 11 of this document), for both Roadway and Intersection projects, dating back to its establishment as an MPO. However, since the preparation of the Long Range Transportation Plan (LRTP) five years ago, LATS has not been able to fund any new projects; all of its current and advance Guideshare funding has been allocated to the widening of US 17 from SC 315 to the Georgia border. That project in itself is a direct response to safety problems and needs. By FY 2022 the MPO will be in the position to program improvement projects. LATS has adopted SCDOT’s statewide safety targets for all public roads.
State Performance Measures and Targets
Performance Measures Baseline 2014-2018
5-Year Average 2016-2020 Target
5-Year Average
Number of Fatalities 969 1,011
Fatality Rate 1.8 1.82
Number of Serious Injuries 2,962 2,781
Serious Injury Rate 5.55 4.98
Number of Non‐Motorized fatalities and serious injuries 392 380
The latest five‐year average safety statistics for LATS (2014‐2018) indicate 28 fatalities, a 1.68 fatality rate, 100.8 serious injuries, a 6.10 serious injury rate, and 15 fatality/serious injuries for non‐motorized (bicycle and pedestrian). The LATS fatality rate is below the state target rate (1.819), but the serious injury rate is higher than the target rate of 4.979.
Year Fatalities Fatality
Rate Serious Injury
SI Rate Non-Motorized User Fatal & SI
2014 28 1.89 119 8.04 12
2015 21 1.31 105 6.53 12
2016 36 2.08 105 6.07 24
2017 28 1.61 89 5.11 11
2018 27 1.49 86 4.75 16
Total 140 - 504 - 75
2014-2018 Average
28 1.68 100.8 6.10 15
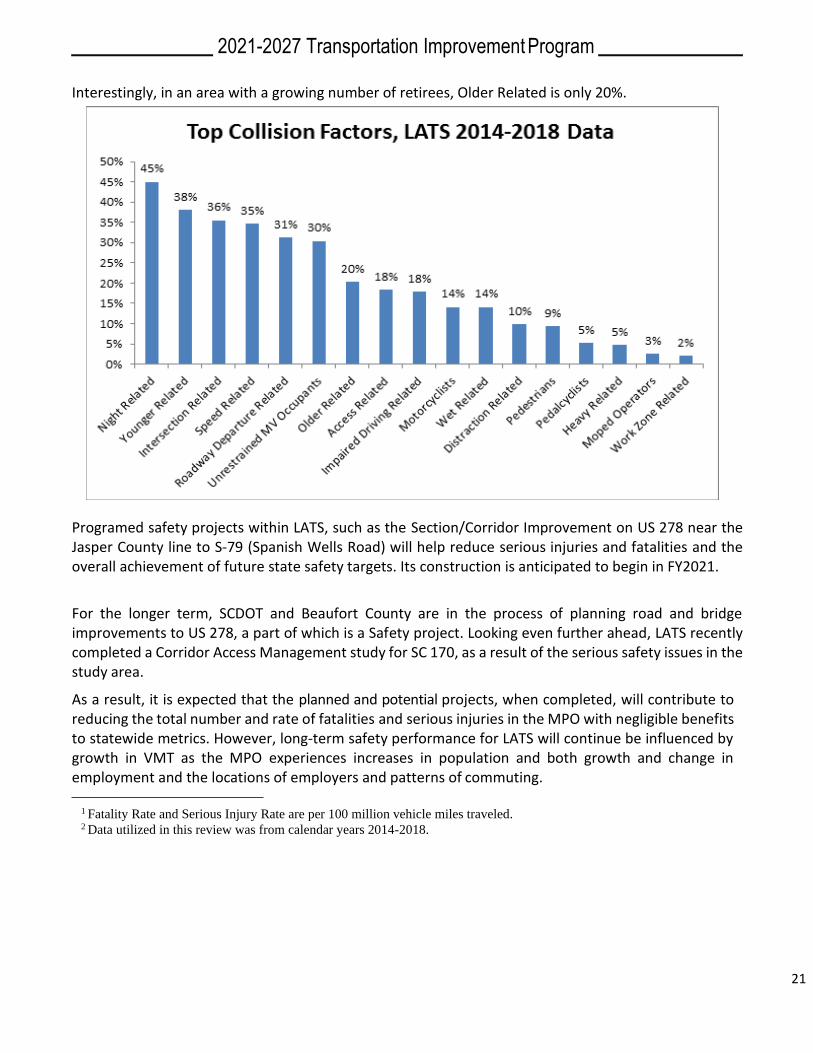
The top factors for fatal and serious injury collisions in the LATS area are Night Related, Younger Related and Intersection Related. 36% of crashes in LATS occur at intersections. See the chart on the following page.
2021-2027 Transportation Improvement Program
21
Interestingly, in an area with a growing number of retirees, Older Related is only 20%.
Programed safety projects within LATS, such as the Section/Corridor Improvement on US 278 near the Jasper County line to S-79 (Spanish Wells Road) will help reduce serious injuries and fatalities and the overall achievement of future state safety targets. Its construction is anticipated to begin in FY2021.
For the longer term, SCDOT and Beaufort County are in the process of planning road and bridge improvements to US 278, a part of which is a Safety project. Looking even further ahead, LATS recently completed a Corridor Access Management study for SC 170, as a result of the serious safety issues in the study area.
As a result, it is expected that the planned and potential projects, when completed, will contribute to reducing the total number and rate of fatalities and serious injuries in the MPO with negligible benefits to statewide metrics. However, long‐term safety performance for LATS will continue be influenced by growth in VMT as the MPO experiences increases in population and both growth and change in employment and the locations of employers and patterns of commuting.
1 Fatality Rate and Serious Injury Rate are per 100 million vehicle miles traveled. 2 Data utilized in this review was from calendar years 2014-2018.
2021-2027 Transportation Improvement Program
19
Performance Measure 2 – System Condition (PM-2) Pavement Quality
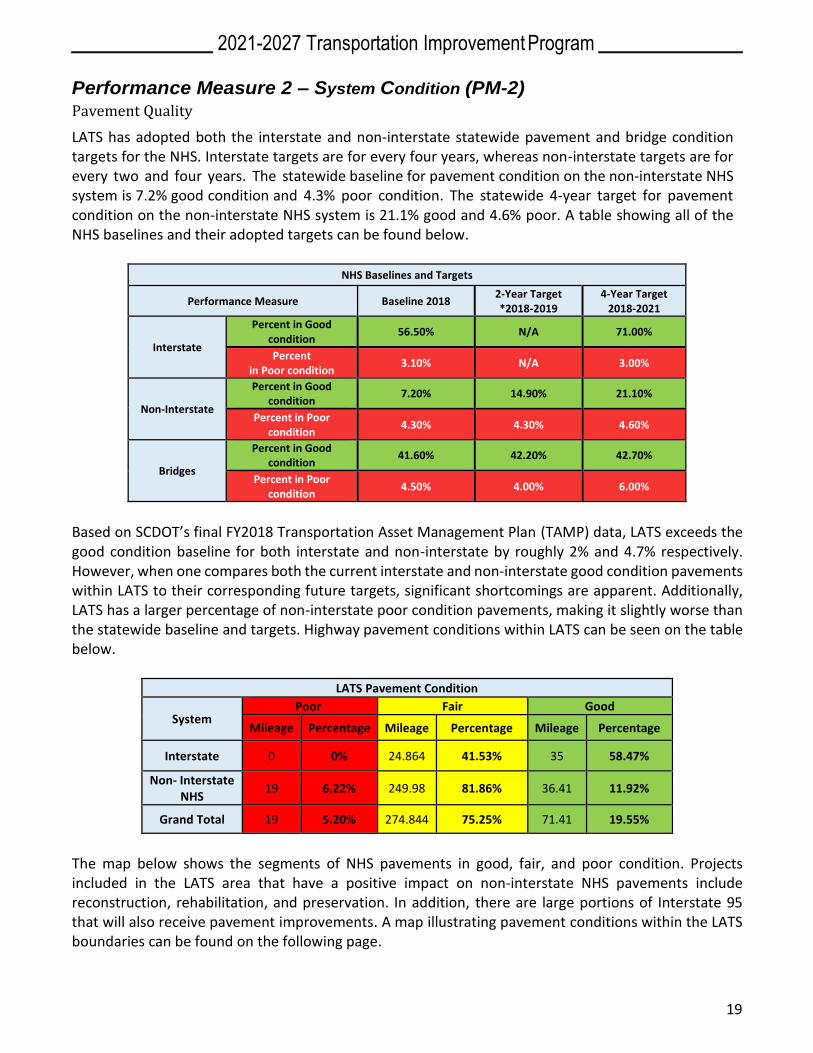
LATS has adopted both the interstate and non-interstate statewide pavement and bridge condition targets for the NHS. Interstate targets are for every four years, whereas non-interstate targets are for every two and four years. The statewide baseline for pavement condition on the non‐interstate NHS system is 7.2% good condition and 4.3% poor condition. The statewide 4‐year target for pavement condition on the non‐interstate NHS system is 21.1% good and 4.6% poor. A table showing all of the NHS baselines and their adopted targets can be found below.
NHS Baselines and Targets
Performance Measure Baseline 2018 2-Year Target *2018-2019
4-Year Target 2018-2021
Interstate
Percent in Good condition
56.50% N/A 71.00%
Percent in Poor condition
3.10% N/A 3.00%
Non-Interstate
Percent in Good condition
7.20% 14.90% 21.10%
Percent in Poor condition
4.30% 4.30% 4.60%
Bridges
Percent in Good condition
41.60% 42.20% 42.70%
Percent in Poor condition
4.50% 4.00% 6.00%
Based on SCDOT’s final FY2018 Transportation Asset Management Plan (TAMP) data, LATS exceeds the good condition baseline for both interstate and non-interstate by roughly 2% and 4.7% respectively. However, when one compares both the current interstate and non-interstate good condition pavements within LATS to their corresponding future targets, significant shortcomings are apparent. Additionally, LATS has a larger percentage of non-interstate poor condition pavements, making it slightly worse than the statewide baseline and targets. Highway pavement conditions within LATS can be seen on the table below.
LATS Pavement Condition
System Poor Fair Good
Mileage Percentage Mileage Percentage Mileage Percentage
Interstate 0 0% 24.864 41.53% 35 58.47%
Non‐ Interstate NHS
19 6.22% 249.98 81.86% 36.41 11.92%
Grand Total 19 5.20% 274.844 75.25% 71.41 19.55%
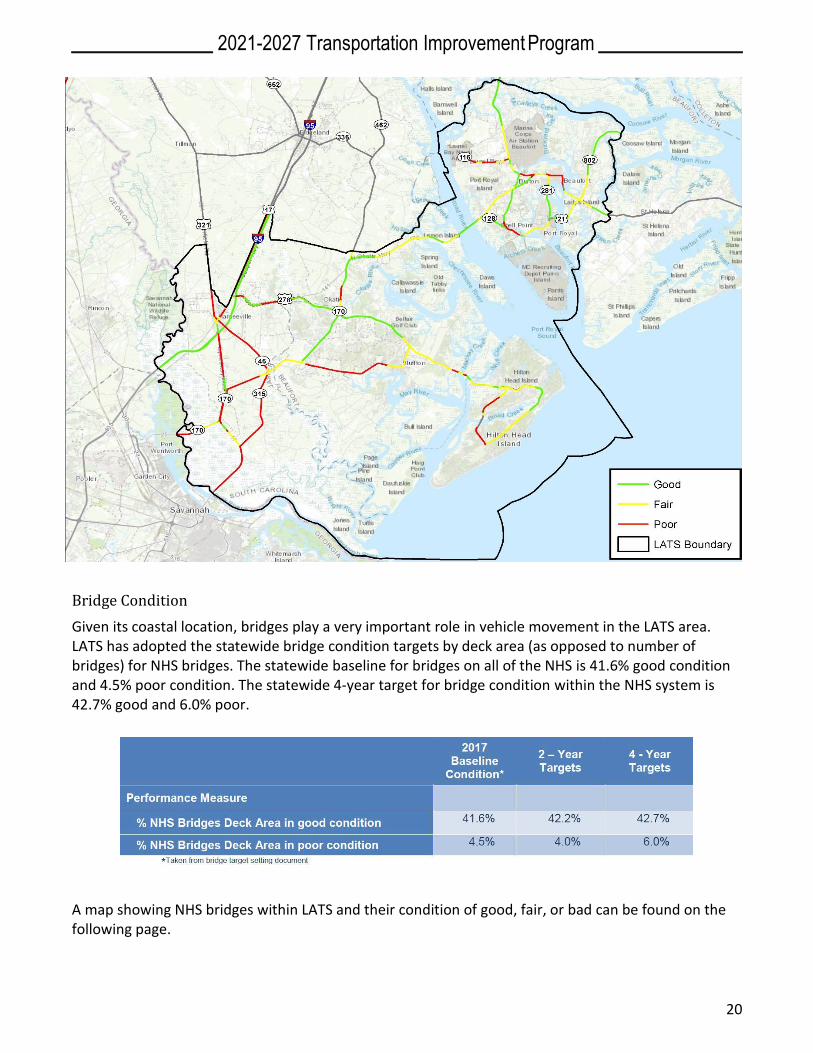
The map below shows the segments of NHS pavements in good, fair, and poor condition. Projects included in the LATS area that have a positive impact on non‐interstate NHS pavements include reconstruction, rehabilitation, and preservation. In addition, there are large portions of Interstate 95 that will also receive pavement improvements. A map illustrating pavement conditions within the LATS boundaries can be found on the following page.
2021-2027 Transportation Improvement Program
20
Bridge Condition
Given its coastal location, bridges play a very important role in vehicle movement in the LATS area. LATS has adopted the statewide bridge condition targets by deck area (as opposed to number of bridges) for NHS bridges. The statewide baseline for bridges on all of the NHS is 41.6% good condition and 4.5% poor condition. The statewide 4‐year target for bridge condition within the NHS system is 42.7% good and 6.0% poor.
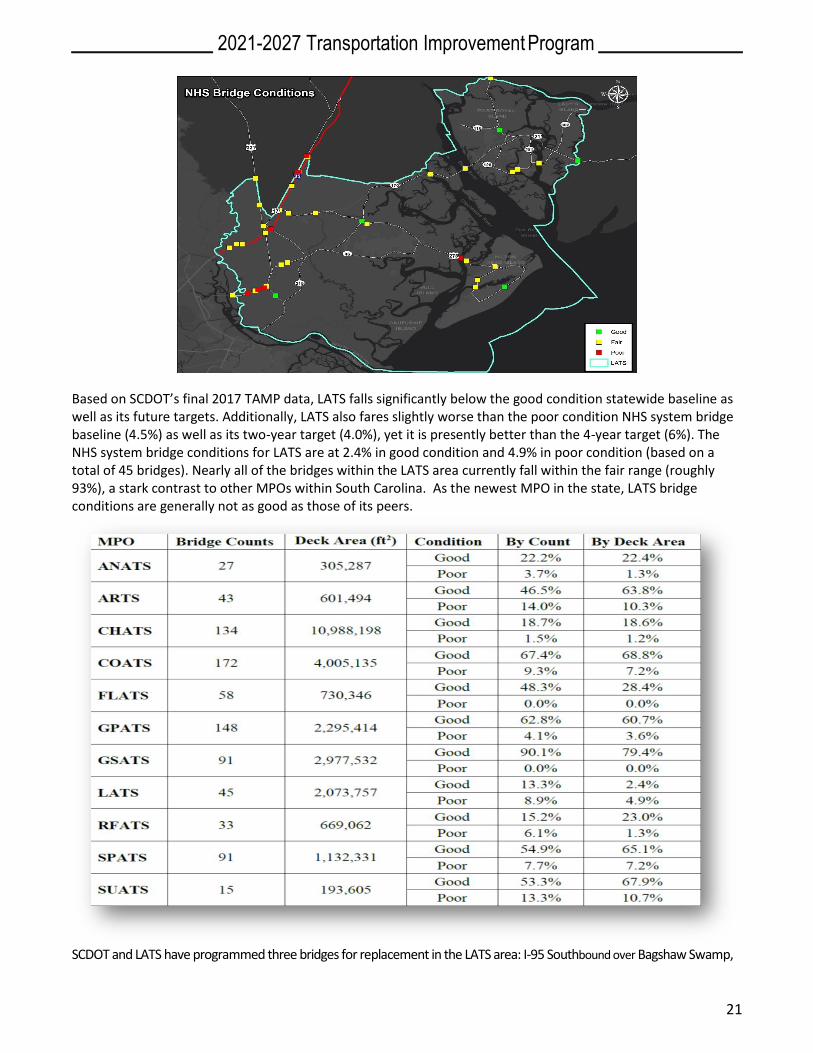
A map showing NHS bridges within LATS and their condition of good, fair, or bad can be found on the following page.
2021-2027 Transportation Improvement Program
21
Based on SCDOT’s final 2017 TAMP data, LATS falls significantly below the good condition statewide baseline as well as its future targets. Additionally, LATS also fares slightly worse than the poor condition NHS system bridge baseline (4.5%) as well as its two-year target (4.0%), yet it is presently better than the 4-year target (6%). The NHS system bridge conditions for LATS are at 2.4% in good condition and 4.9% in poor condition (based on a total of 45 bridges). Nearly all of the bridges within the LATS area currently fall within the fair range (roughly 93%), a stark contrast to other MPOs within South Carolina. As the newest MPO in the state, LATS bridge conditions are generally not as good as those of its peers.
SCDOT and LATS have programmed three bridges for replacement in the LATS area: I-95 Southbound over Bagshaw Swamp,
2021-2027 Transportation Improvement Program
22
I-95 Southbound over SC 46, as well as US 278 Mackay Creek Bridge Eastbound. These programed bridge replacements are anticipated to have construction begin in FY 2022 or later. As such, they will not impact the achievement of current 2020 and 2022-year statewide bridge targets, rather, their positive impact will affect subsequent future 2024 and 2026 targets.
Performance Measure 3 – Reliability (PM-3)
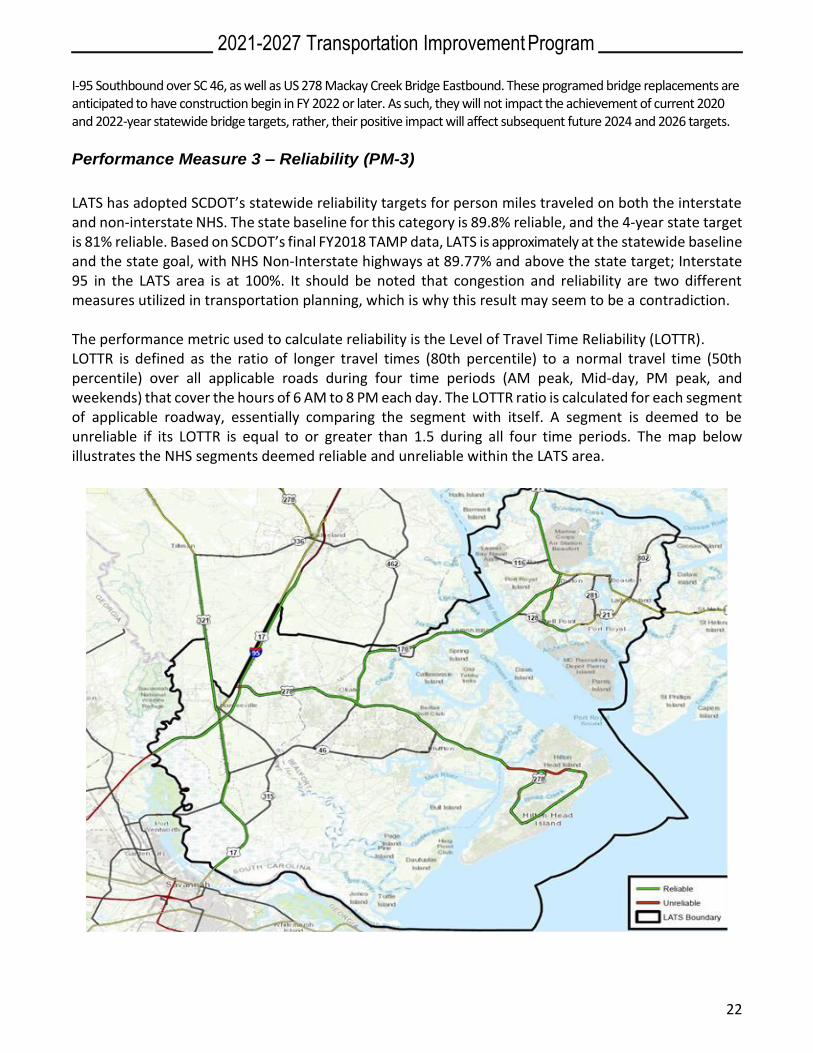
LATS has adopted SCDOT’s statewide reliability targets for person miles traveled on both the interstate and non‐interstate NHS. The state baseline for this category is 89.8% reliable, and the 4‐year state target is 81% reliable. Based on SCDOT’s final FY2018 TAMP data, LATS is approximately at the statewide baseline and the state goal, with NHS Non‐Interstate highways at 89.77% and above the state target; Interstate 95 in the LATS area is at 100%. It should be noted that congestion and reliability are two different measures utilized in transportation planning, which is why this result may seem to be a contradiction. The performance metric used to calculate reliability is the Level of Travel Time Reliability (LOTTR). LOTTR is defined as the ratio of longer travel times (80th percentile) to a normal travel time (50th percentile) over all applicable roads during four time periods (AM peak, Mid-day, PM peak, and weekends) that cover the hours of 6 AM to 8 PM each day. The LOTTR ratio is calculated for each segment of applicable roadway, essentially comparing the segment with itself. A segment is deemed to be unreliable if its LOTTR is equal to or greater than 1.5 during all four time periods. The map below illustrates the NHS segments deemed reliable and unreliable within the LATS area.
2021-2027 Transportation Improvement Program
23
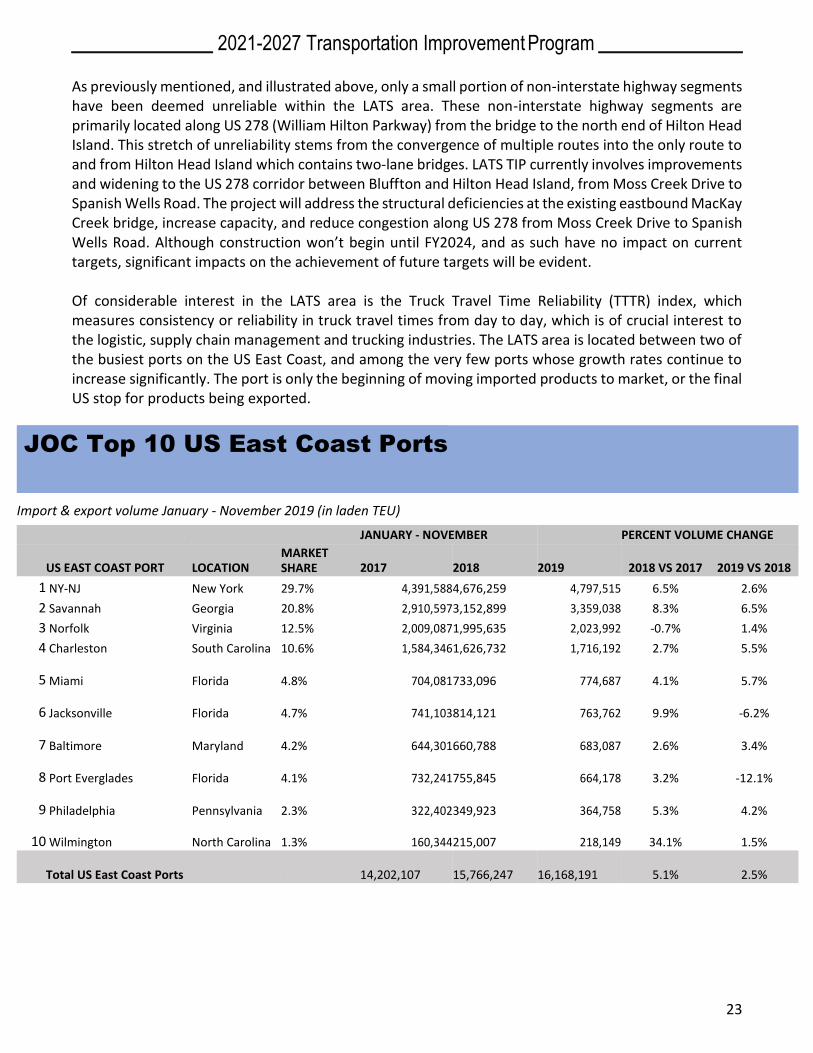
As previously mentioned, and illustrated above, only a small portion of non-interstate highway segments have been deemed unreliable within the LATS area. These non-interstate highway segments are primarily located along US 278 (William Hilton Parkway) from the bridge to the north end of Hilton Head Island. This stretch of unreliability stems from the convergence of multiple routes into the only route to and from Hilton Head Island which contains two-lane bridges. LATS TIP currently involves improvements and widening to the US 278 corridor between Bluffton and Hilton Head Island, from Moss Creek Drive to Spanish Wells Road. The project will address the structural deficiencies at the existing eastbound MacKay Creek bridge, increase capacity, and reduce congestion along US 278 from Moss Creek Drive to Spanish Wells Road. Although construction won’t begin until FY2024, and as such have no impact on current targets, significant impacts on the achievement of future targets will be evident. Of considerable interest in the LATS area is the Truck Travel Time Reliability (TTTR) index, which measures consistency or reliability in truck travel times from day to day, which is of crucial interest to the logistic, supply chain management and trucking industries. The LATS area is located between two of the busiest ports on the US East Coast, and among the very few ports whose growth rates continue to increase significantly. The port is only the beginning of moving imported products to market, or the final US stop for products being exported.
JOC Top 10 US East Coast Ports
Import & export volume January - November 2019 (in laden TEU)
JANUARY - NOVEMBER PERCENT VOLUME CHANGE
US EAST COAST PORT
LOCATION
MARKET SHARE
2017
2018
2019
2018 VS 2017
2019 VS 2018
1 NY‐NJ New York 29.7% 4,391,588 4,676,259 4,797,515 6.5% 2.6%
2 Savannah Georgia 20.8% 2,910,597 3,152,899 3,359,038 8.3% 6.5%
3 Norfolk Virginia 12.5% 2,009,087 1,995,635 2,023,992 ‐0.7% 1.4%
4 Charleston South Carolina 10.6% 1,584,346 1,626,732 1,716,192 2.7% 5.5%
5 Miami Florida 4.8% 704,081 733,096 774,687 4.1% 5.7%
6 Jacksonville Florida 4.7% 741,103 814,121 763,762 9.9% ‐6.2%
7 Baltimore Maryland 4.2% 644,301 660,788 683,087 2.6% 3.4%
8 Port Everglades Florida 4.1% 732,241 755,845 664,178 3.2% ‐12.1%
9 Philadelphia Pennsylvania 2.3% 322,402 349,923 364,758 5.3% 4.2%
10 Wilmington North Carolina 1.3% 160,344 215,007 218,149 34.1% 1.5%
Total US East Coast Ports
14,202,107
15,766,247
16,168,191
5.1%
2.5%
2021-2027 Transportation Improvement Program
24
The LATS area is likely to attract one or more major distribution/logistics centers in the foreseeable future, which will make the TTTR even more important. In 2018 that index was 1.58, considerably less reliable in comparison to South Carolina’s baseline of 1.34 and slightly less reliable than its 10‐year target of 1.53. LATS has already forecast interstate interchange improvements that would be needed to accommodate such economic development in its Lowcountry Distribution/Logistics Cluster Study of June 2018. In addition, SCDOT has identified funds for preliminary engineering and right of way acquisition for increasing capacity and addressing future congestion from the Georgia state line to exit 8. This segment is only a portion of phase one (Exit 0 -33) of the I-95 Corridor Improvement Project. These improvements will increase the reliability performance measures in the future.
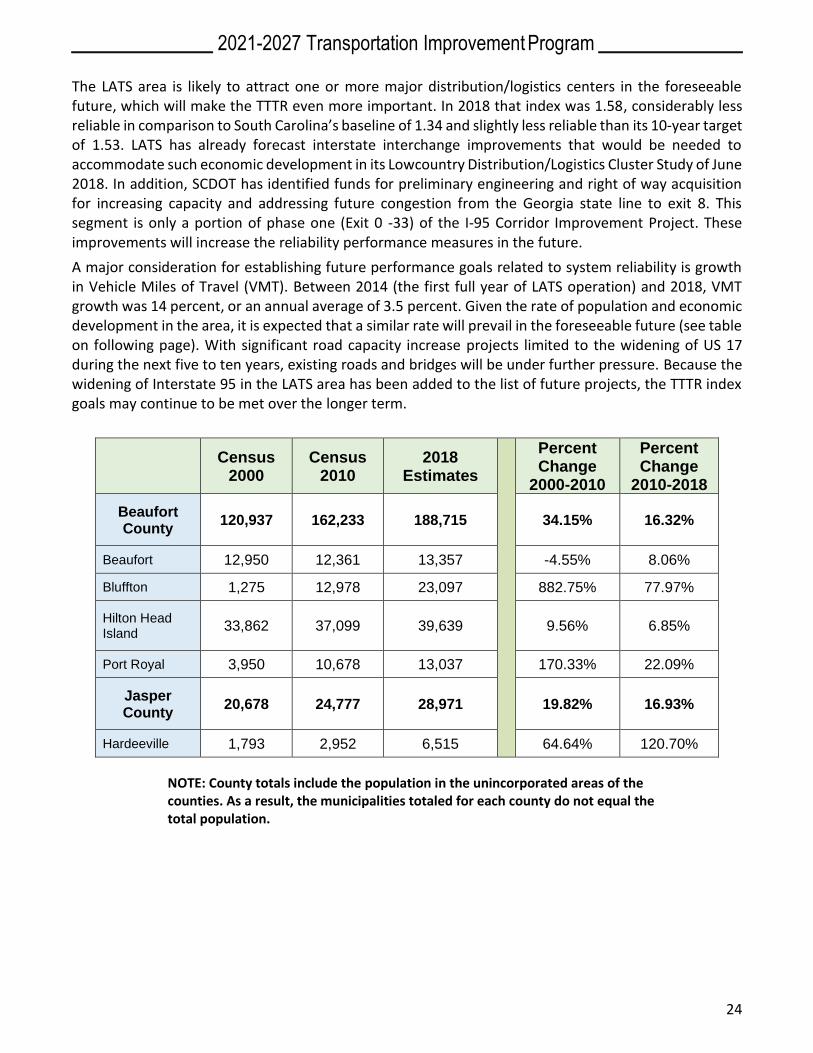
A major consideration for establishing future performance goals related to system reliability is growth in Vehicle Miles of Travel (VMT). Between 2014 (the first full year of LATS operation) and 2018, VMT growth was 14 percent, or an annual average of 3.5 percent. Given the rate of population and economic development in the area, it is expected that a similar rate will prevail in the foreseeable future (see table on following page). With significant road capacity increase projects limited to the widening of US 17 during the next five to ten years, existing roads and bridges will be under further pressure. Because the widening of Interstate 95 in the LATS area has been added to the list of future projects, the TTTR index goals may continue to be met over the longer term.
Census
2000 Census
2010 2018
Estimates
Percent Change
2000-2010
Percent Change
2010-2018
Beaufort County
120,937 162,233 188,715 34.15% 16.32%
Beaufort 12,950 12,361 13,357 -4.55% 8.06%
Bluffton 1,275 12,978 23,097 882.75% 77.97%
Hilton Head Island
33,862 37,099 39,639 9.56% 6.85%
Port Royal 3,950 10,678 13,037 170.33% 22.09%
Jasper County
20,678 24,777 28,971 19.82% 16.93%
Hardeeville 1,793 2,952 6,515 64.64% 120.70%
NOTE: County totals include the population in the unincorporated areas of the counties. As a result, the municipalities totaled for each county do not equal the total population.
2021-2027 Transportation Improvement Program
25
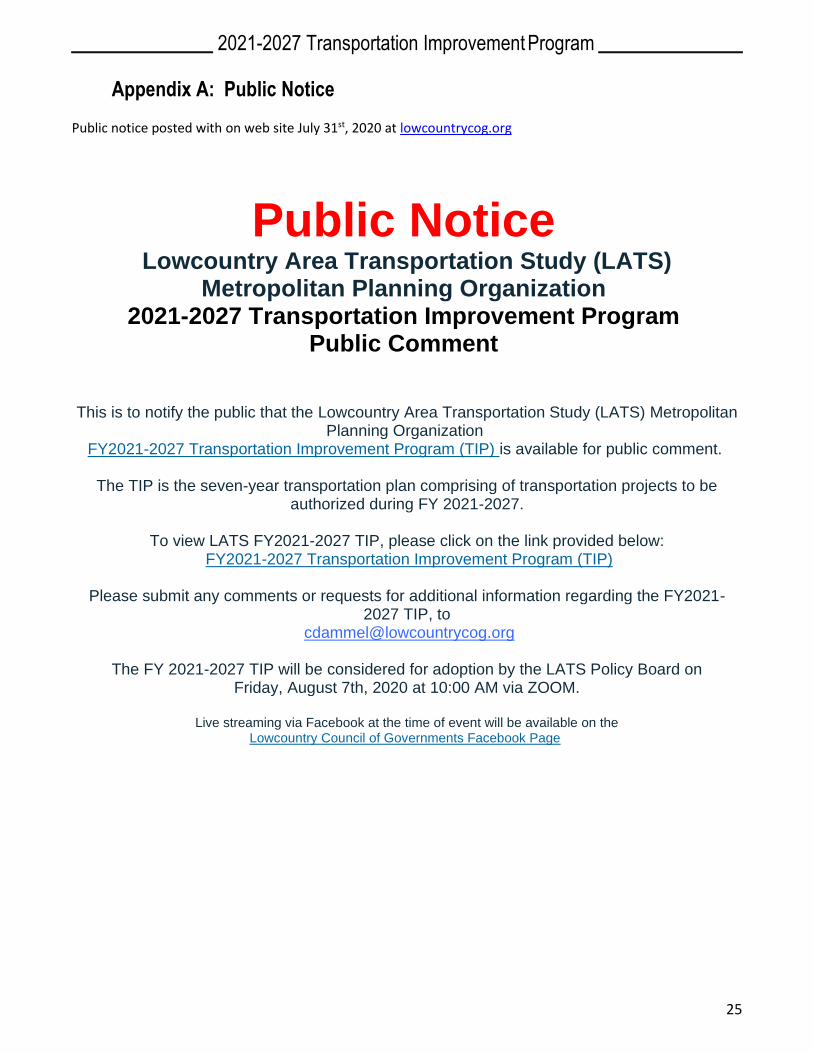
Appendix A: Public Notice Public notice posted with on web site July 31st, 2020 at lowcountrycog.org
Public Notice
Lowcountry Area Transportation Study (LATS) Metropolitan Planning Organization
2021-2027 Transportation Improvement Program Public Comment
This is to notify the public that the Lowcountry Area Transportation Study (LATS) Metropolitan Planning Organization
FY2021-2027 Transportation Improvement Program (TIP) is available for public comment.
The TIP is the seven-year transportation plan comprising of transportation projects to be authorized during FY 2021-2027.
To view LATS FY2021-2027 TIP, please click on the link provided below:
FY2021-2027 Transportation Improvement Program (TIP)
Please submit any comments or requests for additional information regarding the FY2021-2027 TIP, to
The FY 2021-2027 TIP will be considered for adoption by the LATS Policy Board on Friday, August 7th, 2020 at 10:00 AM via ZOOM.
Live streaming via Facebook at the time of event will be available on the
Lowcountry Council of Governments Facebook Page
Related Documents