[Type text] [Type text] [Type text] 2020

Welcome message from author
This document is posted to help you gain knowledge. Please leave a comment to let me know what you think about it! Share it to your friends and learn new things together.
Transcript
[Type text] [Type text] [Type text]
2020

TR. No. 2020/09
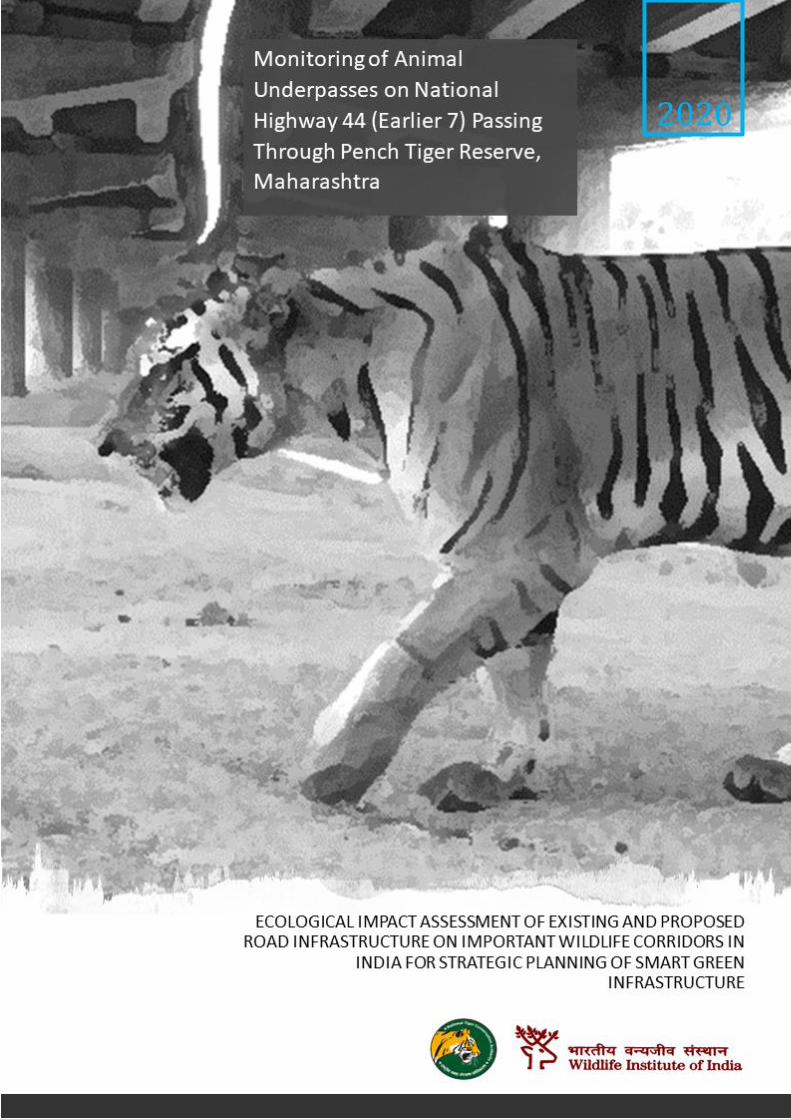
MONITORING OF ANIMAL UNDERPASSES ON NATIONAL HIGHWAY 44 (EARLIER 7) PASSING THROUGH PENCH TIGER RESERVE, MAHARASHTRA
ECOLOGICAL IMPACT ASSESSMENT OF EXISTING AND PROPOSED ROAD INFRASTRUCTURE ON IMPORTANT WILDLIFE CORRIDORS IN INDIA FOR STRATEGIC PLANNING OF SMART GREEN INFRASTRUCTURE
Principal Investigators Dr. Bilal Habib Co-Investigator Dr. Y. V. Jhala
Advisors Director, WII Dr. Asha Rajvanshi Member Secretary, NTCA Chief Wildlife Warden, Maharashtra Chief Wildlife Wardene, Madhya Pradesh
Researchers Akanksha Saxena Bhanupriya Rabha Mahima
Further Contact:
Dr. Bilal Habib Department of Animal Ecology and conservation Biology Wildlife Institute of India, Chandrabani Dehradun, India 248 001 Tell: 00 91 135 2646283 Fax: 00 91 135 2640117 E-mail; [email protected] Photo Credits: Research Team/Internet
Citation: Habib, B., Saxena, A., Jhala, Y. V. and Rajvanshi, A. (2020): Monitoring of animal underpasses on National
Highway 44 (Earlier 7) passing through Pench Tiger Reserve, Maharashtra, India. TR. No. 2020/09 – Pp 30.
Acknowledgements We would like to extend our sincere gratitude to the National Tiger Conservation Authority
(NTCA), New Delhi, for funding this research project. We are thankful for the support of Dr.
Rajesh Gopal, Sh. B.S. Bonal, Dr. Debabrata Swain, Dr. S.P. Yadav, Dr. H.S. Negi, Dr. Amit
Mallick, Sh. Sanjay Kumar, Sh. Nishant K. Verma, Sh. Surender Mehra, Dr. Vaibhav C. Mathur,
Dr. Raja Ram Singh and Sh. Hemant Kamdi.
We thank the Director, Dean, Research Coordinator and Project Advisors at the Wildlife Institute
of India, for their guidance, support, and cooperation. We are greatly indebted to Dr. V. B. Mathur
(ex-Director, WII) for his unending support and encouragement towards the project.
We are thankful to the Maharashtra Forest Department for their unconditional support towards the
project as well as the monitoring of the animal underpasses. Sh. N. Kakodkar (PCCF, (WL)), Dr.
Ravikiran Govekar (CCF&FD, Pench Tiger reserve), Sh. Kalyan Kumar (CCF, Nagpur Forest
Division, Territorial), Sh. Amlendu Pathak (DD, Pench Tiger reserve), DFOs of all divisions are
thanked for their guidance, support and cooperation. Sh. Pratik Modwan (RFO Pauni range), Sh.
Pradeep Sankpal (RFO Chorbauli range) and RFOs of Deolapar (WL and T), Pauni (T), Pauni
(FDCM) are thanked for providing on-ground support and valuable inputs.
We sincerely thank the contributions of our field assistants – Kuldeep Dubey, Brahmanand
Shiwane and Gautam Meshram at Pench Tiger Reserve, and the assistance and companionship
of the forest guards and forest staff.
Contents
S. No. Details Page No.
Executive Summary i
01 Introduction 01
02 Monitoring and design plan 04
03 Summary of findings 05
04 Structure wise use of underpasses 08
05 Species wise use of crossing structures 13
06 Use of underpasses by tigers 15
07 Human presence under crossing structures 16
08 Observations and suggestions 18
09 References 20
Executive Summary As part of the project funded by the National Tiger Conservation Authority, New Delhi, three sites
were chosen for study- the Central Indian tiger landscape including major roads cutting across the
animal corridors in the landscape, the National Highway 37 (now 715) cutting through the
Kaziranga-Karbi Anglong landscape in Assam, and the State Highway 33 passing through the
Nagarhole Tiger Reserve, Karnataka.
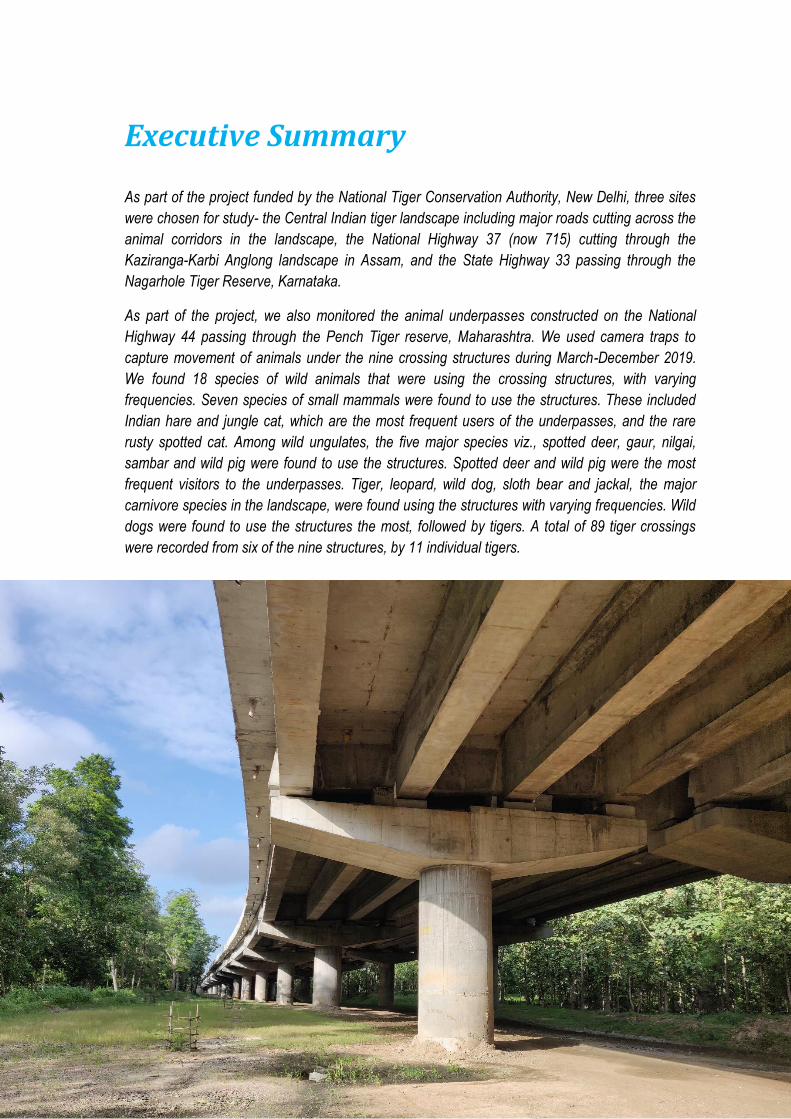
As part of the project, we also monitored the animal underpasses constructed on the National
Highway 44 passing through the Pench Tiger reserve, Maharashtra. We used camera traps to
capture movement of animals under the nine crossing structures during March-December 2019.
We found 18 species of wild animals that were using the crossing structures, with varying
frequencies. Seven species of small mammals were found to use the structures. These included
Indian hare and jungle cat, which are the most frequent users of the underpasses, and the rare
rusty spotted cat. Among wild ungulates, the five major species viz., spotted deer, gaur, nilgai,
sambar and wild pig were found to use the structures. Spotted deer and wild pig were the most
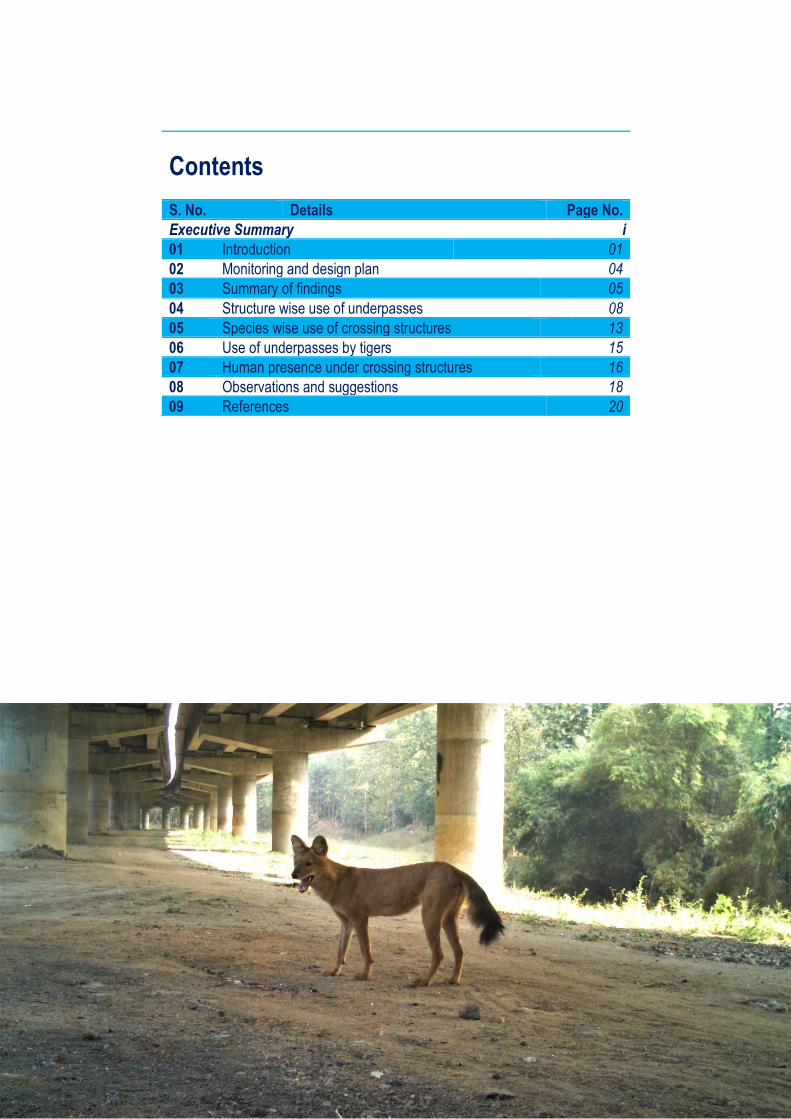
frequent visitors to the underpasses. Tiger, leopard, wild dog, sloth bear and jackal, the major
carnivore species in the landscape, were found using the structures with varying frequencies. Wild
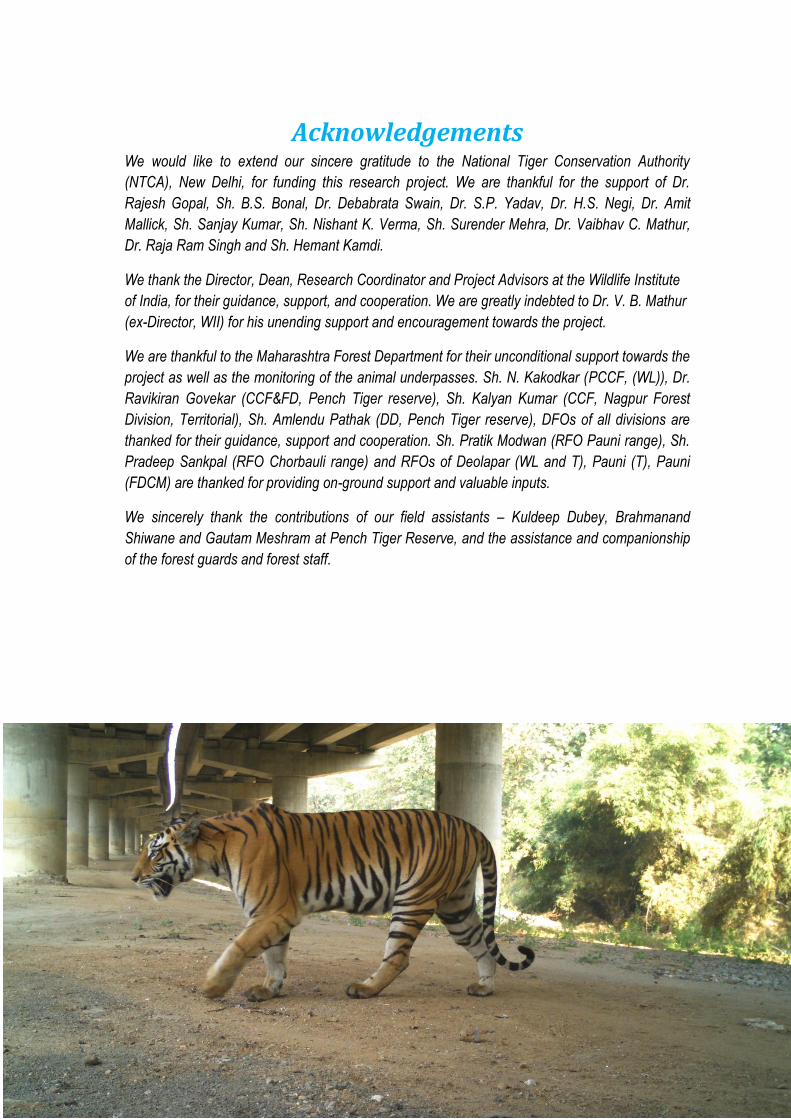
dogs were found to use the structures the most, followed by tigers. A total of 89 tiger crossings
were recorded from six of the nine structures, by 11 individual tigers.
1
1. Introduction
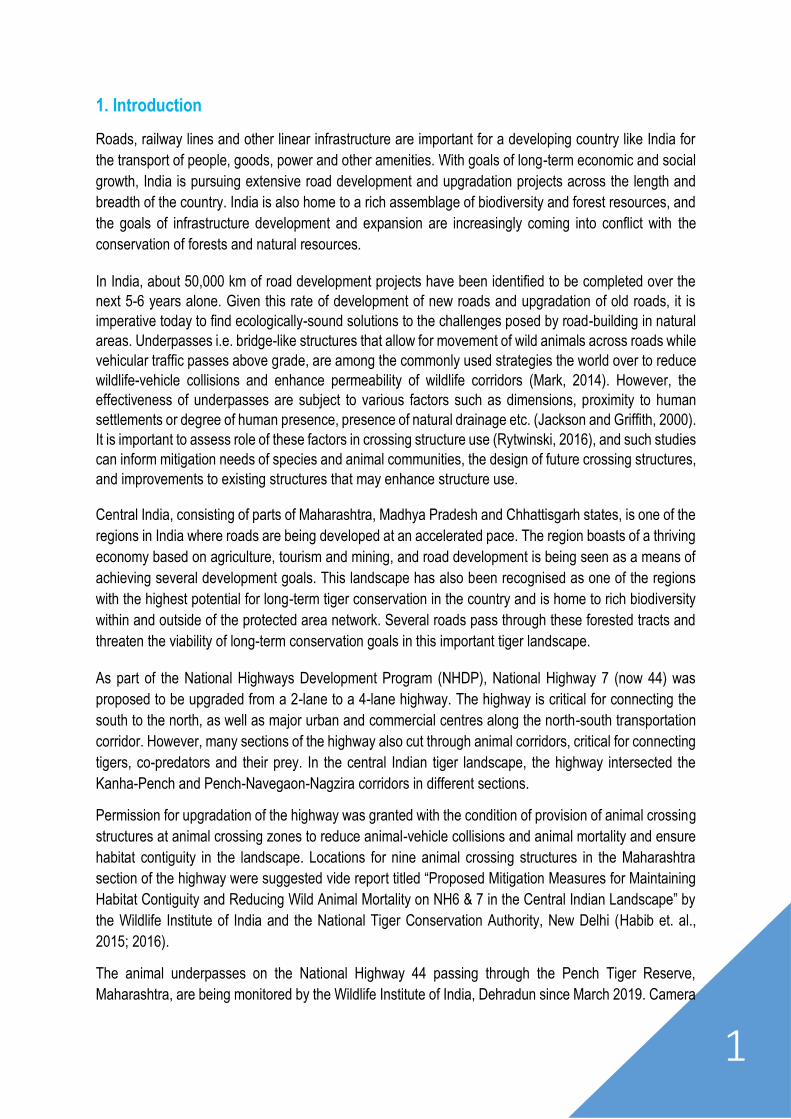
Roads, railway lines and other linear infrastructure are important for a developing country like India for
the transport of people, goods, power and other amenities. With goals of long-term economic and social
growth, India is pursuing extensive road development and upgradation projects across the length and
breadth of the country. India is also home to a rich assemblage of biodiversity and forest resources, and
the goals of infrastructure development and expansion are increasingly coming into conflict with the
conservation of forests and natural resources.
In India, about 50,000 km of road development projects have been identified to be completed over the
next 5-6 years alone. Given this rate of development of new roads and upgradation of old roads, it is
imperative today to find ecologically-sound solutions to the challenges posed by road-building in natural
areas. Underpasses i.e. bridge-like structures that allow for movement of wild animals across roads while
vehicular traffic passes above grade, are among the commonly used strategies the world over to reduce
wildlife-vehicle collisions and enhance permeability of wildlife corridors (Mark, 2014). However, the
effectiveness of underpasses are subject to various factors such as dimensions, proximity to human
settlements or degree of human presence, presence of natural drainage etc. (Jackson and Griffith, 2000).
It is important to assess role of these factors in crossing structure use (Rytwinski, 2016), and such studies
can inform mitigation needs of species and animal communities, the design of future crossing structures,
and improvements to existing structures that may enhance structure use.
Central India, consisting of parts of Maharashtra, Madhya Pradesh and Chhattisgarh states, is one of the
regions in India where roads are being developed at an accelerated pace. The region boasts of a thriving
economy based on agriculture, tourism and mining, and road development is being seen as a means of
achieving several development goals. This landscape has also been recognised as one of the regions
with the highest potential for long-term tiger conservation in the country and is home to rich biodiversity
within and outside of the protected area network. Several roads pass through these forested tracts and
threaten the viability of long-term conservation goals in this important tiger landscape.
As part of the National Highways Development Program (NHDP), National Highway 7 (now 44) was
proposed to be upgraded from a 2-lane to a 4-lane highway. The highway is critical for connecting the
south to the north, as well as major urban and commercial centres along the north-south transportation
corridor. However, many sections of the highway also cut through animal corridors, critical for connecting
tigers, co-predators and their prey. In the central Indian tiger landscape, the highway intersected the
Kanha-Pench and Pench-Navegaon-Nagzira corridors in different sections.
Permission for upgradation of the highway was granted with the condition of provision of animal crossing
structures at animal crossing zones to reduce animal-vehicle collisions and animal mortality and ensure
habitat contiguity in the landscape. Locations for nine animal crossing structures in the Maharashtra
section of the highway were suggested vide report titled “Proposed Mitigation Measures for Maintaining
Habitat Contiguity and Reducing Wild Animal Mortality on NH6 & 7 in the Central Indian Landscape” by
the Wildlife Institute of India and the National Tiger Conservation Authority, New Delhi (Habib et. al.,
2015; 2016).
The animal underpasses on the National Highway 44 passing through the Pench Tiger Reserve,
Maharashtra, are being monitored by the Wildlife Institute of India, Dehradun since March 2019. Camera
2
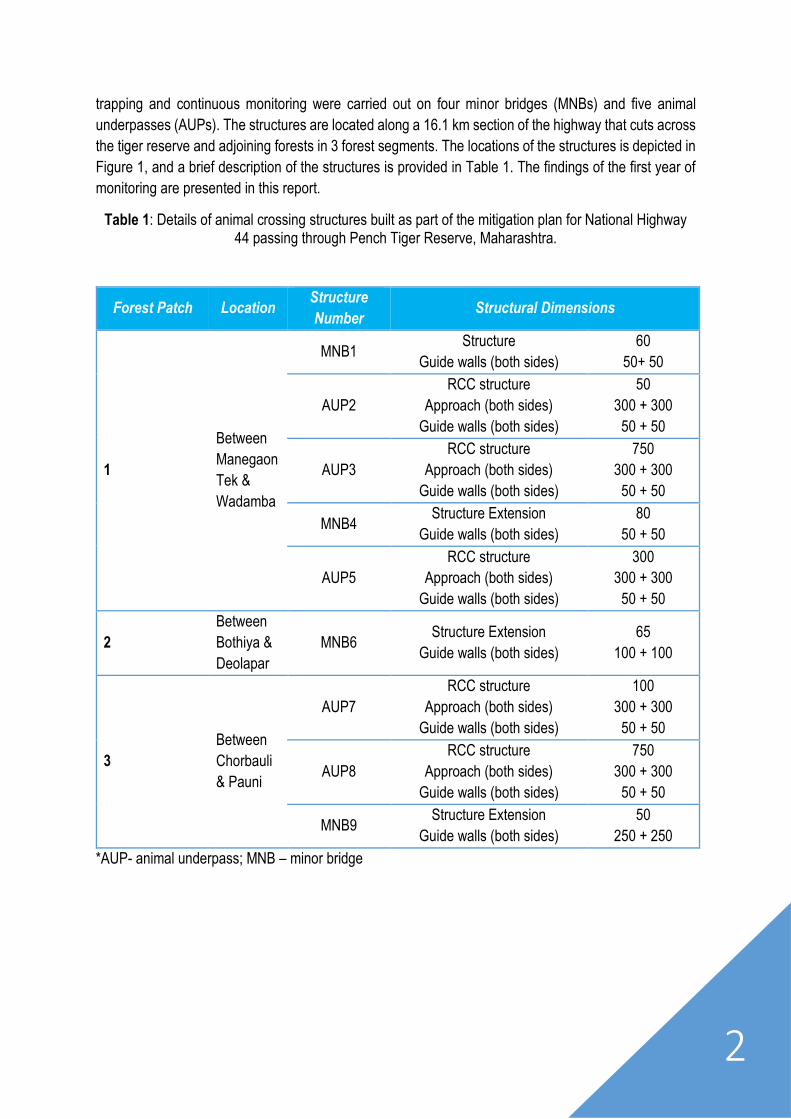
trapping and continuous monitoring were carried out on four minor bridges (MNBs) and five animal
underpasses (AUPs). The structures are located along a 16.1 km section of the highway that cuts across
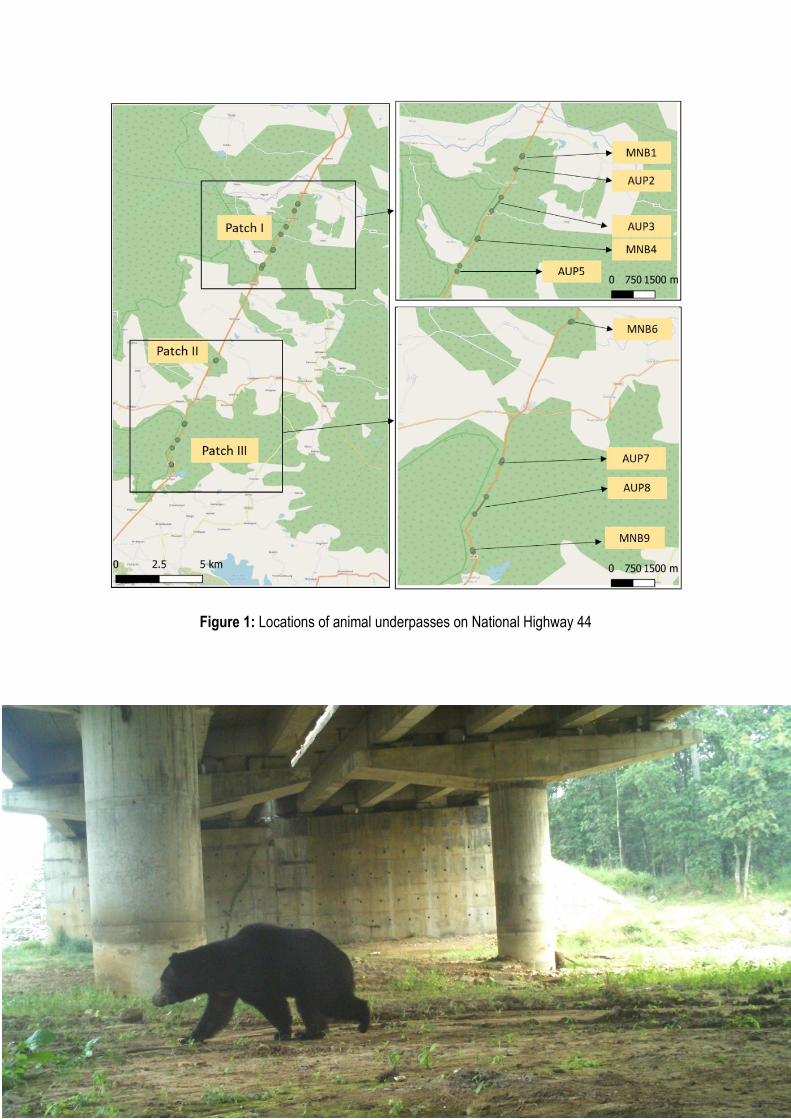
the tiger reserve and adjoining forests in 3 forest segments. The locations of the structures is depicted in
Figure 1, and a brief description of the structures is provided in Table 1. The findings of the first year of
monitoring are presented in this report.
Table 1: Details of animal crossing structures built as part of the mitigation plan for National Highway 44 passing through Pench Tiger Reserve, Maharashtra.
Forest Patch Location Structure
Number Structural Dimensions
1
Between
Manegaon
Tek &
Wadamba
MNB1 Structure
Guide walls (both sides)
60
50+ 50
AUP2
RCC structure
Approach (both sides)
Guide walls (both sides)
50
300 + 300
50 + 50
AUP3
RCC structure
Approach (both sides)
Guide walls (both sides)
750
300 + 300
50 + 50
MNB4 Structure Extension
Guide walls (both sides)
80
50 + 50
AUP5
RCC structure
Approach (both sides)
Guide walls (both sides)
300
300 + 300
50 + 50
2
Between
Bothiya &
Deolapar
MNB6 Structure Extension
Guide walls (both sides)
65
100 + 100
3
Between
Chorbauli
& Pauni
AUP7
RCC structure
Approach (both sides)
Guide walls (both sides)
100
300 + 300
50 + 50
AUP8
RCC structure
Approach (both sides)
Guide walls (both sides)
750
300 + 300
50 + 50
MNB9 Structure Extension
Guide walls (both sides)
50
250 + 250
*AUP- animal underpass; MNB – minor bridge
3
Figure 1: Locations of animal underpasses on National Highway 44
4
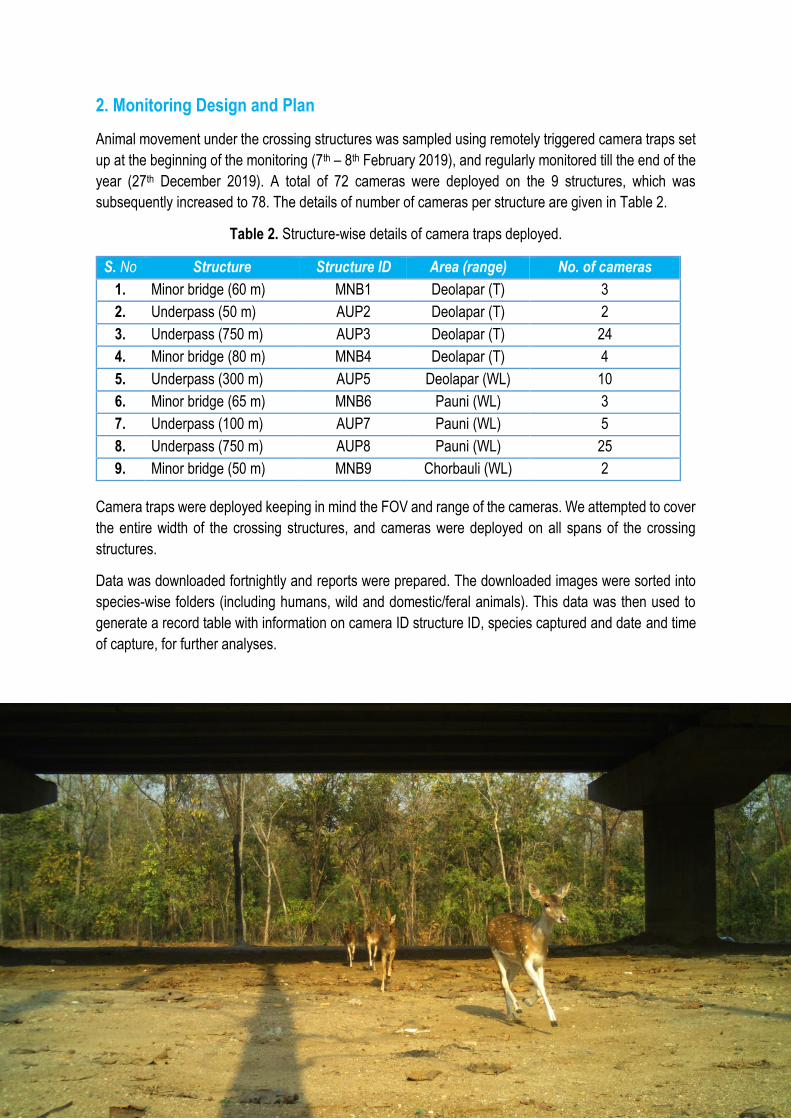
2. Monitoring Design and Plan
Animal movement under the crossing structures was sampled using remotely triggered camera traps set
up at the beginning of the monitoring (7th – 8th February 2019), and regularly monitored till the end of the
year (27th December 2019). A total of 72 cameras were deployed on the 9 structures, which was
subsequently increased to 78. The details of number of cameras per structure are given in Table 2.
Table 2. Structure-wise details of camera traps deployed.
S. No Structure Structure ID Area (range) No. of cameras
1. Minor bridge (60 m) MNB1 Deolapar (T) 3
2. Underpass (50 m) AUP2 Deolapar (T) 2
3. Underpass (750 m) AUP3 Deolapar (T) 24
4. Minor bridge (80 m) MNB4 Deolapar (T) 4
5. Underpass (300 m) AUP5 Deolapar (WL) 10
6. Minor bridge (65 m) MNB6 Pauni (WL) 3
7. Underpass (100 m) AUP7 Pauni (WL) 5
8. Underpass (750 m) AUP8 Pauni (WL) 25
9. Minor bridge (50 m) MNB9 Chorbauli (WL) 2
Camera traps were deployed keeping in mind the FOV and range of the cameras. We attempted to cover
the entire width of the crossing structures, and cameras were deployed on all spans of the crossing
structures.
Data was downloaded fortnightly and reports were prepared. The downloaded images were sorted into
species-wise folders (including humans, wild and domestic/feral animals). This data was then used to
generate a record table with information on camera ID structure ID, species captured and date and time
of capture, for further analyses.
5
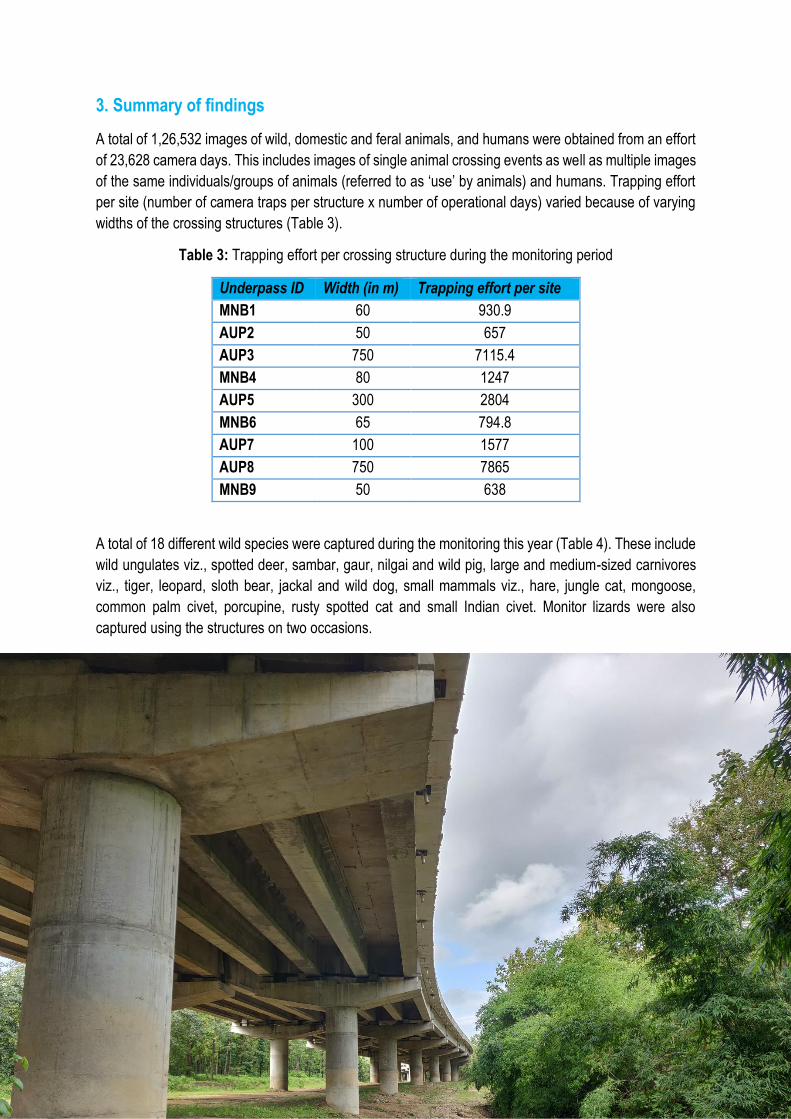
3. Summary of findings
A total of 1,26,532 images of wild, domestic and feral animals, and humans were obtained from an effort
of 23,628 camera days. This includes images of single animal crossing events as well as multiple images
of the same individuals/groups of animals (referred to as ‘use’ by animals) and humans. Trapping effort
per site (number of camera traps per structure x number of operational days) varied because of varying
widths of the crossing structures (Table 3).
Table 3: Trapping effort per crossing structure during the monitoring period
Underpass ID Width (in m) Trapping effort per site
MNB1 60 930.9
AUP2 50 657
AUP3 750 7115.4
MNB4 80 1247
AUP5 300 2804
MNB6 65 794.8
AUP7 100 1577
AUP8 750 7865
MNB9 50 638
A total of 18 different wild species were captured during the monitoring this year (Table 4). These include
wild ungulates viz., spotted deer, sambar, gaur, nilgai and wild pig, large and medium-sized carnivores
viz., tiger, leopard, sloth bear, jackal and wild dog, small mammals viz., hare, jungle cat, mongoose,
common palm civet, porcupine, rusty spotted cat and small Indian civet. Monitor lizards were also
captured using the structures on two occasions.
6
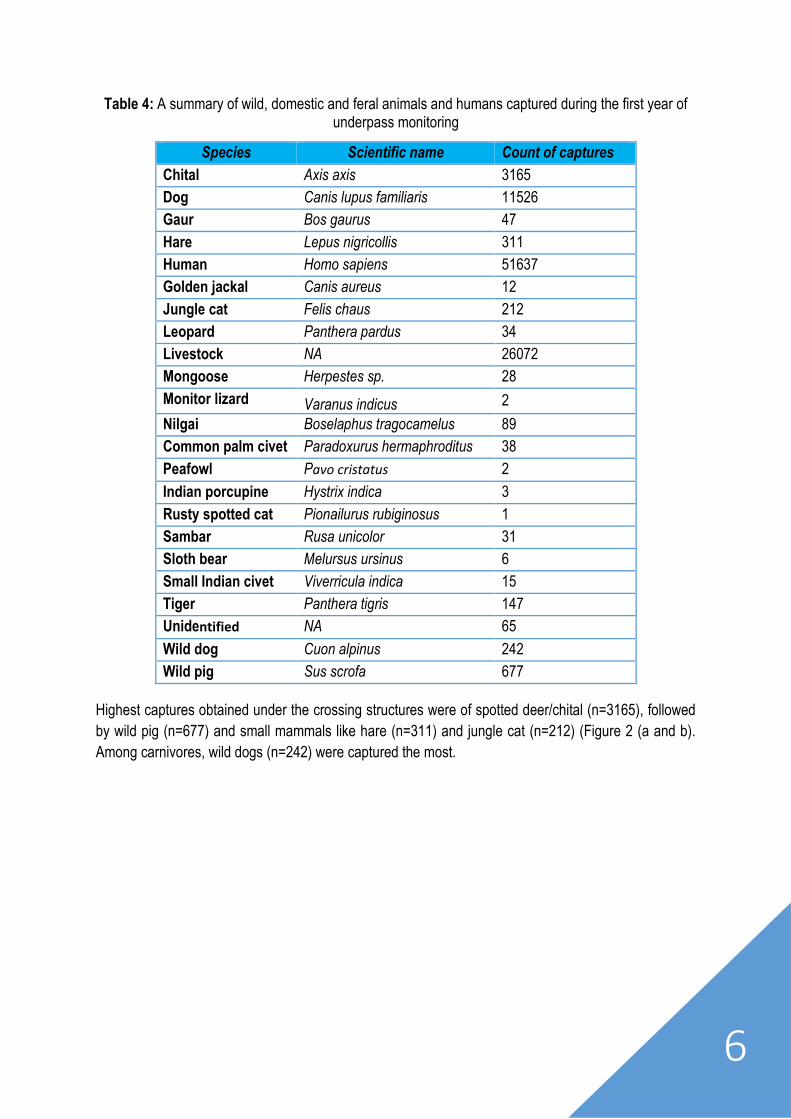
Table 4: A summary of wild, domestic and feral animals and humans captured during the first year of underpass monitoring
Species Scientific name Count of captures
Chital Axis axis 3165
Dog Canis lupus familiaris 11526
Gaur Bos gaurus 47
Hare Lepus nigricollis 311
Human Homo sapiens 51637
Golden jackal Canis aureus 12
Jungle cat Felis chaus 212
Leopard Panthera pardus 34
Livestock NA 26072
Mongoose Herpestes sp. 28
Monitor lizard Varanus indicus 2
Nilgai Boselaphus tragocamelus 89
Common palm civet Paradoxurus hermaphroditus 38
Peafowl Pavo cristatus 2
Indian porcupine Hystrix indica 3
Rusty spotted cat Pionailurus rubiginosus 1
Sambar Rusa unicolor 31
Sloth bear Melursus ursinus 6
Small Indian civet Viverricula indica 15
Tiger Panthera tigris 147
Unidentified NA 65
Wild dog Cuon alpinus 242
Wild pig Sus scrofa 677
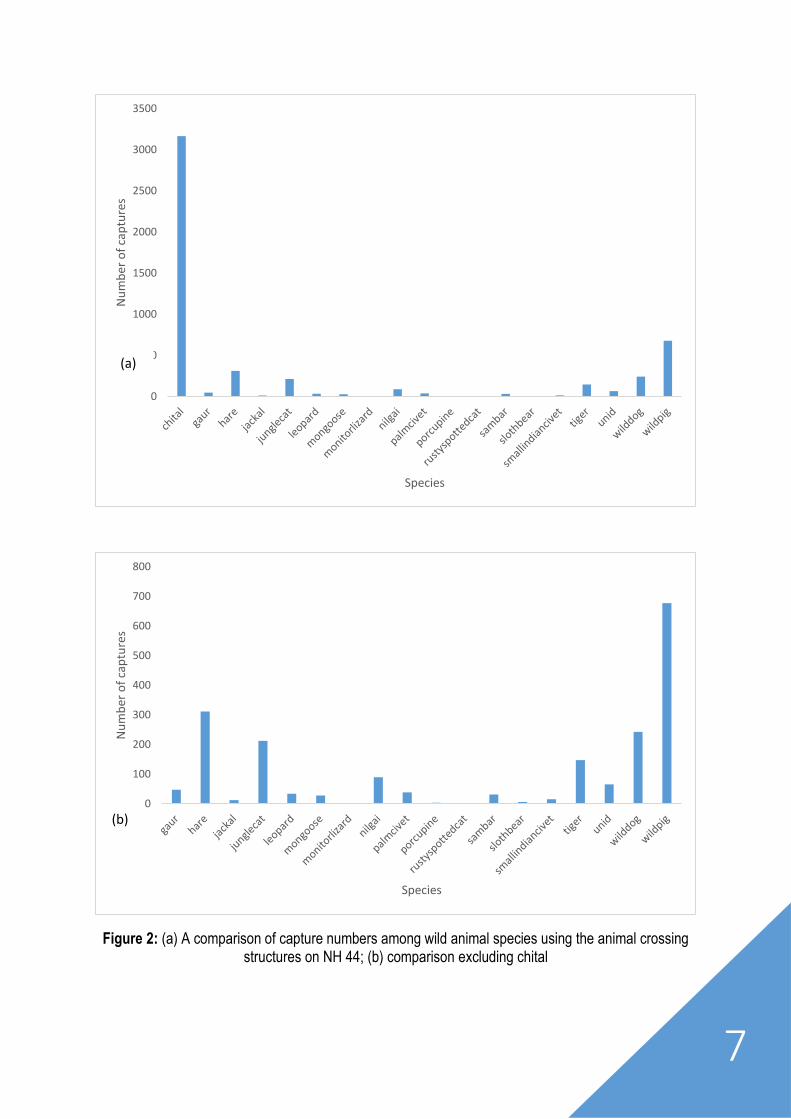
Highest captures obtained under the crossing structures were of spotted deer/chital (n=3165), followed
by wild pig (n=677) and small mammals like hare (n=311) and jungle cat (n=212) (Figure 2 (a and b).
Among carnivores, wild dogs (n=242) were captured the most.
7
Figure 2: (a) A comparison of capture numbers among wild animal species using the animal crossing structures on NH 44; (b) comparison excluding chital
0
500
1000
1500
2000
2500
3000
3500N
um
ber
of
cap
ture
s
Species
0
100
200
300
400
500
600
700
800
Nu
mb
er o
f ca
ptu
res
Species
(a)
(b)
8
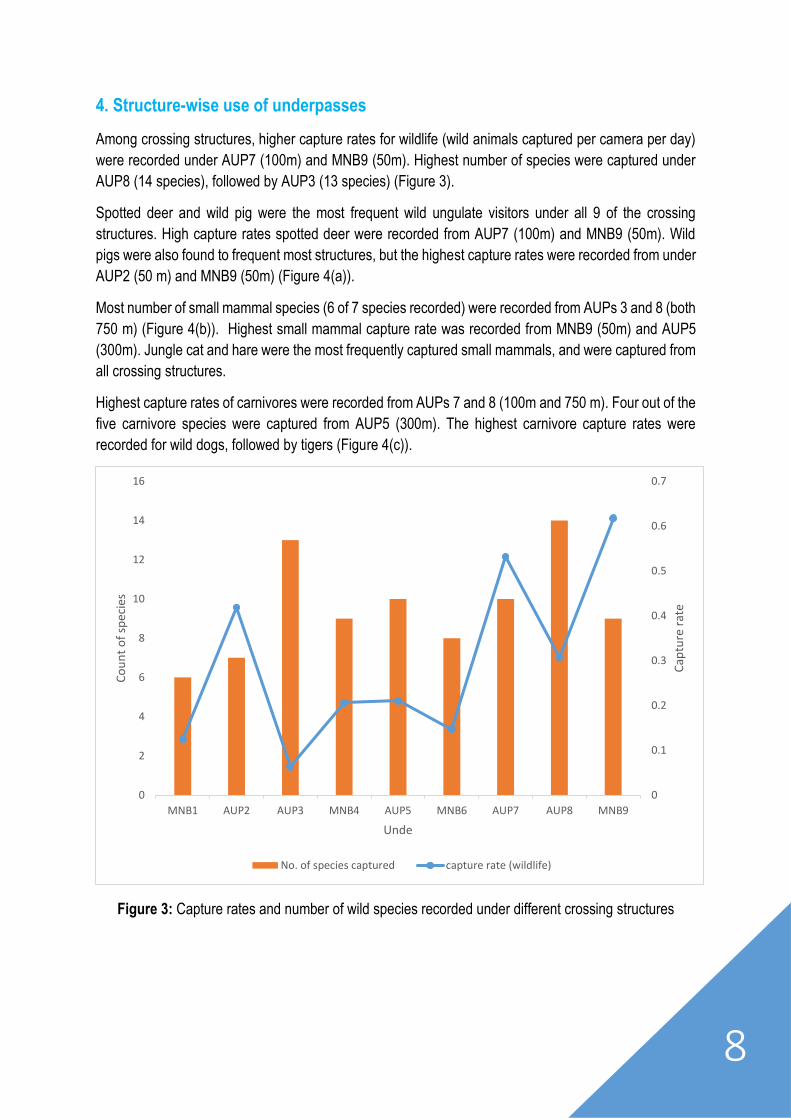
4. Structure-wise use of underpasses
Among crossing structures, higher capture rates for wildlife (wild animals captured per camera per day)
were recorded under AUP7 (100m) and MNB9 (50m). Highest number of species were captured under
AUP8 (14 species), followed by AUP3 (13 species) (Figure 3).
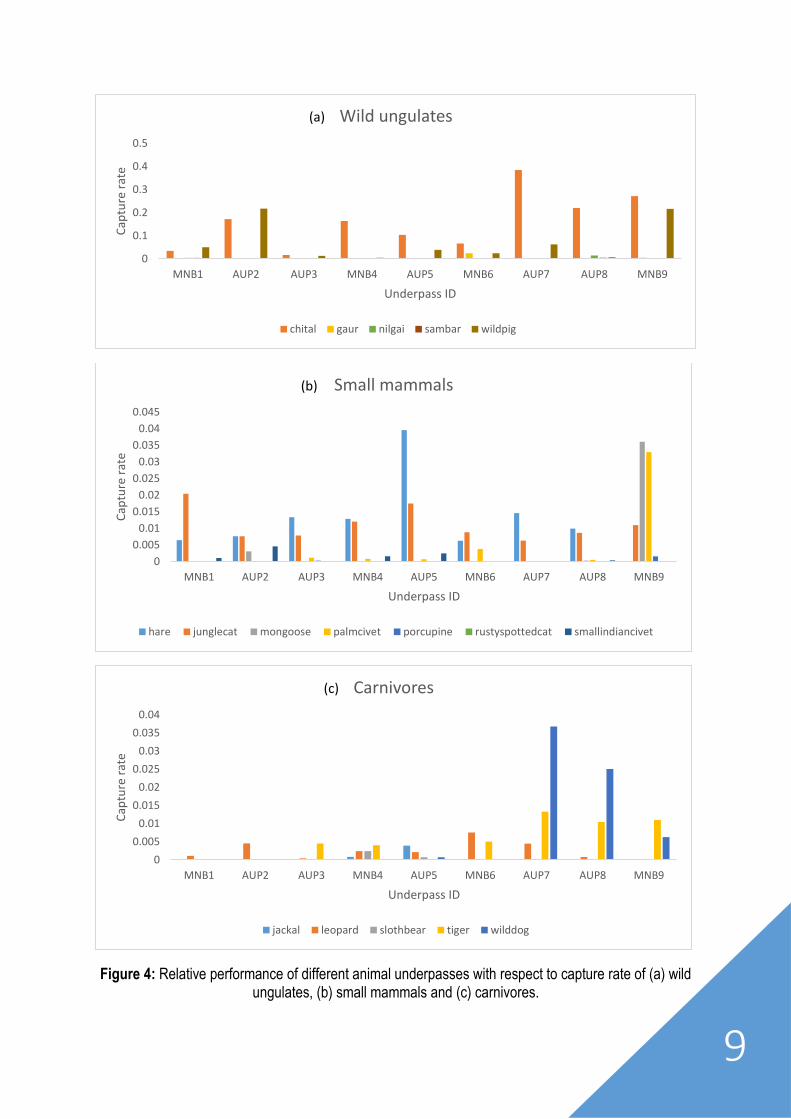
Spotted deer and wild pig were the most frequent wild ungulate visitors under all 9 of the crossing
structures. High capture rates spotted deer were recorded from AUP7 (100m) and MNB9 (50m). Wild
pigs were also found to frequent most structures, but the highest capture rates were recorded from under
AUP2 (50 m) and MNB9 (50m) (Figure 4(a)).
Most number of small mammal species (6 of 7 species recorded) were recorded from AUPs 3 and 8 (both
750 m) (Figure 4(b)). Highest small mammal capture rate was recorded from MNB9 (50m) and AUP5
(300m). Jungle cat and hare were the most frequently captured small mammals, and were captured from
all crossing structures.
Highest capture rates of carnivores were recorded from AUPs 7 and 8 (100m and 750 m). Four out of the
five carnivore species were captured from AUP5 (300m). The highest carnivore capture rates were
recorded for wild dogs, followed by tigers (Figure 4(c)).
Figure 3: Capture rates and number of wild species recorded under different crossing structures
0
0.1
0.2
0.3
0.4
0.5
0.6
0.7
0
2
4
6
8
10
12
14
16
MNB1 AUP2 AUP3 MNB4 AUP5 MNB6 AUP7 AUP8 MNB9
Cap
ture
rat
e
Co
un
t o
f sp
ecie
s
Unde
No. of species captured capture rate (wildlife)
9
Figure 4: Relative performance of different animal underpasses with respect to capture rate of (a) wild ungulates, (b) small mammals and (c) carnivores.
0
0.1
0.2
0.3
0.4
0.5
MNB1 AUP2 AUP3 MNB4 AUP5 MNB6 AUP7 AUP8 MNB9
Cap
ture
rat
e
Underpass ID
Wild ungulates
chital gaur nilgai sambar wildpig
0
0.005
0.01
0.015
0.02
0.025
0.03
0.035
0.04
0.045
MNB1 AUP2 AUP3 MNB4 AUP5 MNB6 AUP7 AUP8 MNB9
Cap
ture
rat
e
Underpass ID
Small mammals
hare junglecat mongoose palmcivet porcupine rustyspottedcat smallindiancivet
0
0.005
0.01
0.015
0.02
0.025
0.03
0.035
0.04
MNB1 AUP2 AUP3 MNB4 AUP5 MNB6 AUP7 AUP8 MNB9
Cap
ture
rat
e
Underpass ID
Carnivores
jackal leopard slothbear tiger wilddog
(a)
(b)
(c)
10
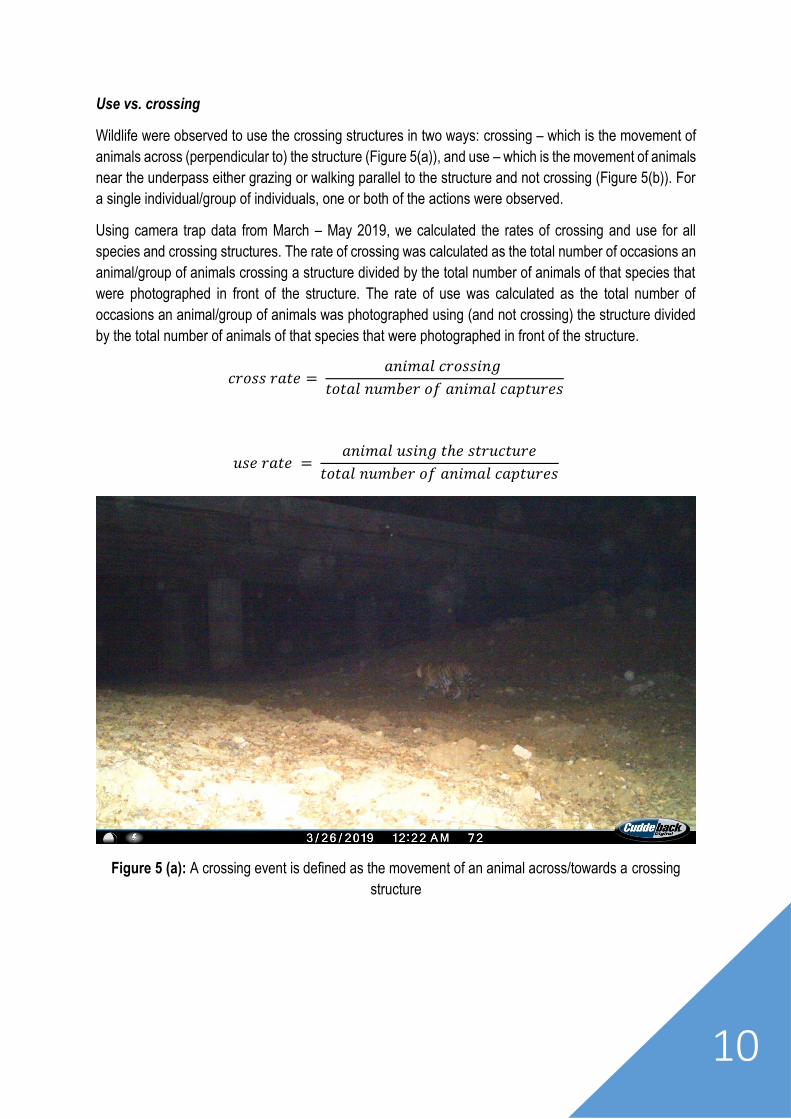
Use vs. crossing
Wildlife were observed to use the crossing structures in two ways: crossing – which is the movement of
animals across (perpendicular to) the structure (Figure 5(a)), and use – which is the movement of animals
near the underpass either grazing or walking parallel to the structure and not crossing (Figure 5(b)). For
a single individual/group of individuals, one or both of the actions were observed.
Using camera trap data from March – May 2019, we calculated the rates of crossing and use for all
species and crossing structures. The rate of crossing was calculated as the total number of occasions an
animal/group of animals crossing a structure divided by the total number of animals of that species that
were photographed in front of the structure. The rate of use was calculated as the total number of
occasions an animal/group of animals was photographed using (and not crossing) the structure divided
by the total number of animals of that species that were photographed in front of the structure.
𝑐𝑟𝑜𝑠𝑠 𝑟𝑎𝑡𝑒 = 𝑎𝑛𝑖𝑚𝑎𝑙 𝑐𝑟𝑜𝑠𝑠𝑖𝑛𝑔
𝑡𝑜𝑡𝑎𝑙 𝑛𝑢𝑚𝑏𝑒𝑟 𝑜𝑓 𝑎𝑛𝑖𝑚𝑎𝑙 𝑐𝑎𝑝𝑡𝑢𝑟𝑒𝑠
𝑢𝑠𝑒 𝑟𝑎𝑡𝑒 = 𝑎𝑛𝑖𝑚𝑎𝑙 𝑢𝑠𝑖𝑛𝑔 𝑡ℎ𝑒 𝑠𝑡𝑟𝑢𝑐𝑡𝑢𝑟𝑒
𝑡𝑜𝑡𝑎𝑙 𝑛𝑢𝑚𝑏𝑒𝑟 𝑜𝑓 𝑎𝑛𝑖𝑚𝑎𝑙 𝑐𝑎𝑝𝑡𝑢𝑟𝑒𝑠
Figure 5 (a): A crossing event is defined as the movement of an animal across/towards a crossing
structure
11
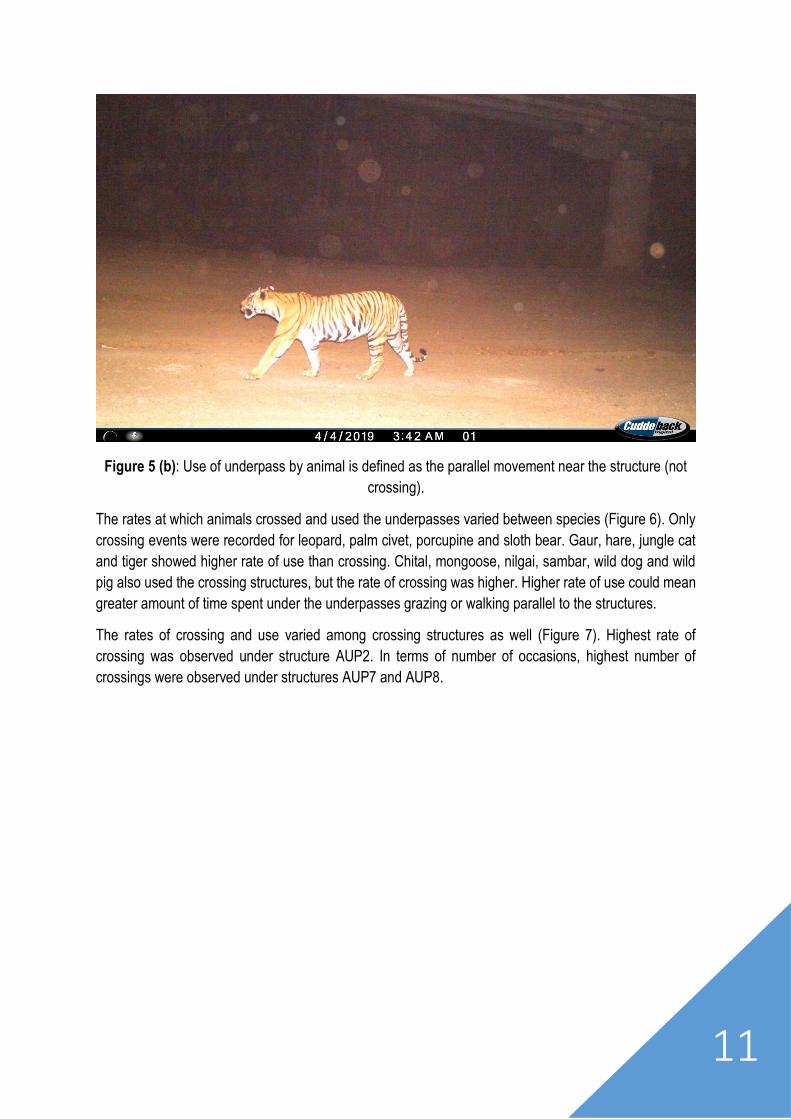
Figure 5 (b): Use of underpass by animal is defined as the parallel movement near the structure (not
crossing).
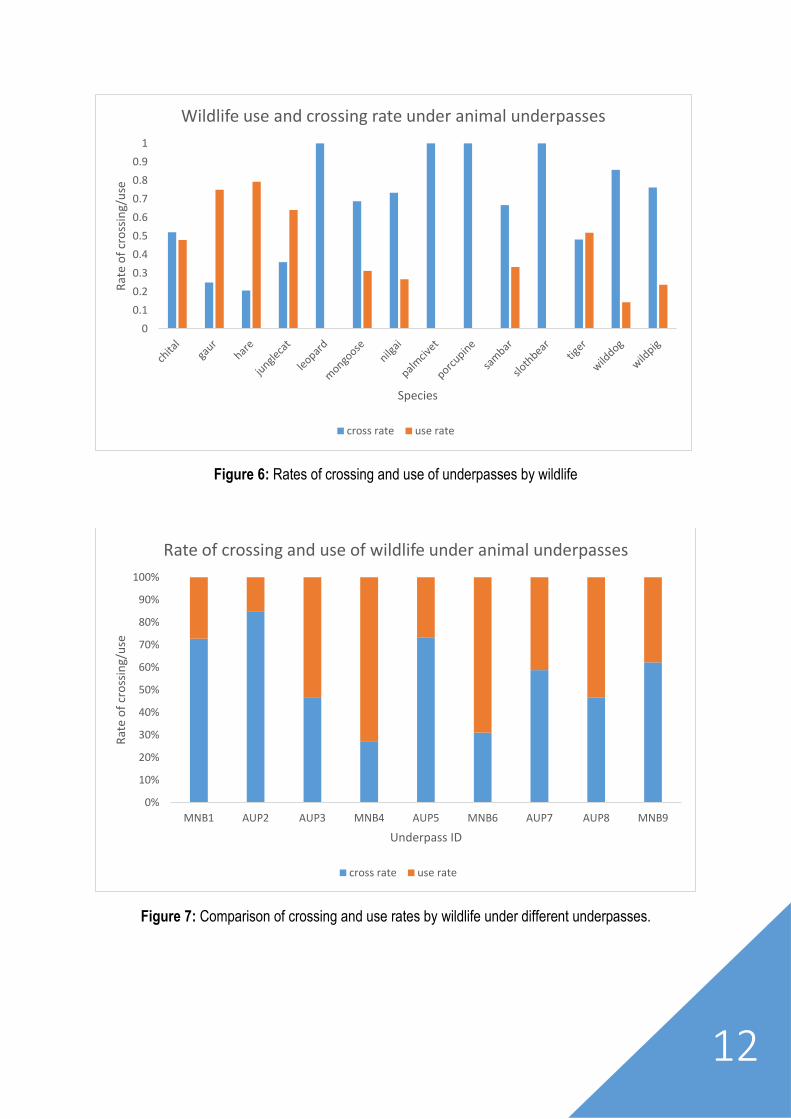
The rates at which animals crossed and used the underpasses varied between species (Figure 6). Only
crossing events were recorded for leopard, palm civet, porcupine and sloth bear. Gaur, hare, jungle cat
and tiger showed higher rate of use than crossing. Chital, mongoose, nilgai, sambar, wild dog and wild
pig also used the crossing structures, but the rate of crossing was higher. Higher rate of use could mean
greater amount of time spent under the underpasses grazing or walking parallel to the structures.
The rates of crossing and use varied among crossing structures as well (Figure 7). Highest rate of
crossing was observed under structure AUP2. In terms of number of occasions, highest number of
crossings were observed under structures AUP7 and AUP8.
12
Figure 6: Rates of crossing and use of underpasses by wildlife
Figure 7: Comparison of crossing and use rates by wildlife under different underpasses.
0
0.1
0.2
0.3
0.4
0.5
0.6
0.7
0.8
0.9
1
Rat
e o
f cr
oss
ing/
use
Species
Wildlife use and crossing rate under animal underpasses
cross rate use rate
0%
10%
20%
30%
40%
50%
60%
70%
80%
90%
100%
MNB1 AUP2 AUP3 MNB4 AUP5 MNB6 AUP7 AUP8 MNB9
Rat
e o
f cr
oss
ing/
use
Underpass ID
Rate of crossing and use of wildlife under animal underpasses
cross rate use rate
13
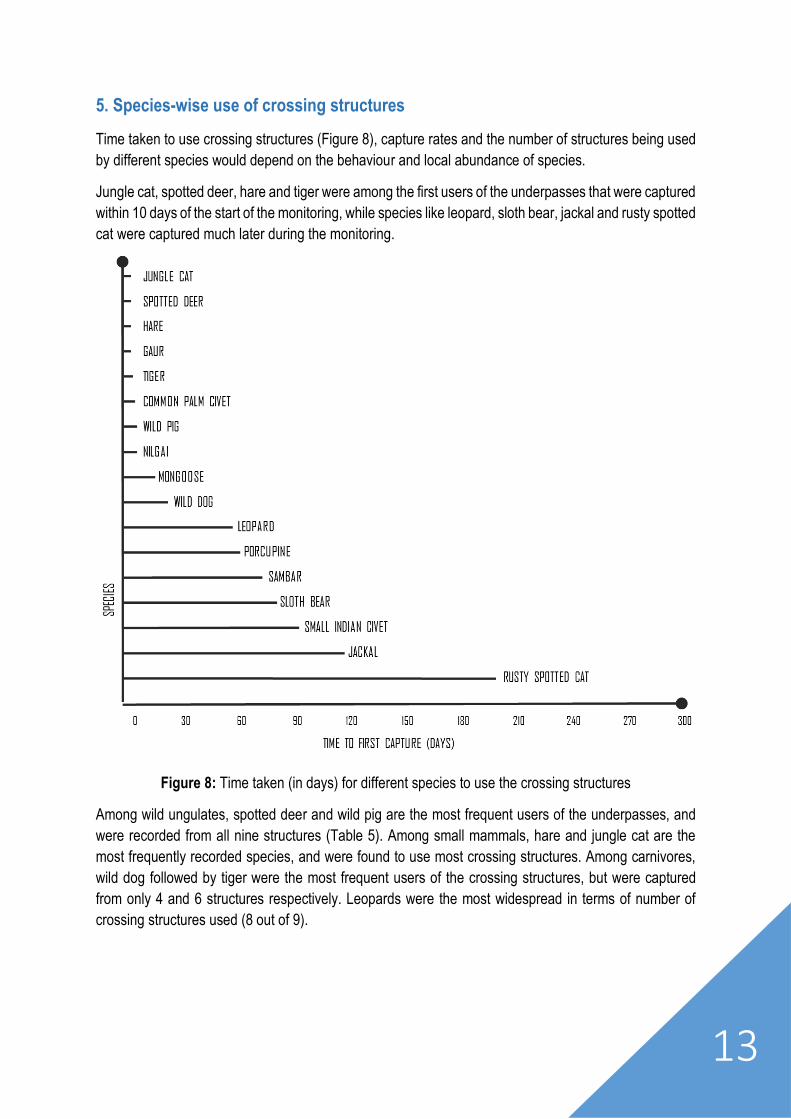
5. Species-wise use of crossing structures
Time taken to use crossing structures (Figure 8), capture rates and the number of structures being used
by different species would depend on the behaviour and local abundance of species.
Jungle cat, spotted deer, hare and tiger were among the first users of the underpasses that were captured
within 10 days of the start of the monitoring, while species like leopard, sloth bear, jackal and rusty spotted
cat were captured much later during the monitoring.
Figure 8: Time taken (in days) for different species to use the crossing structures
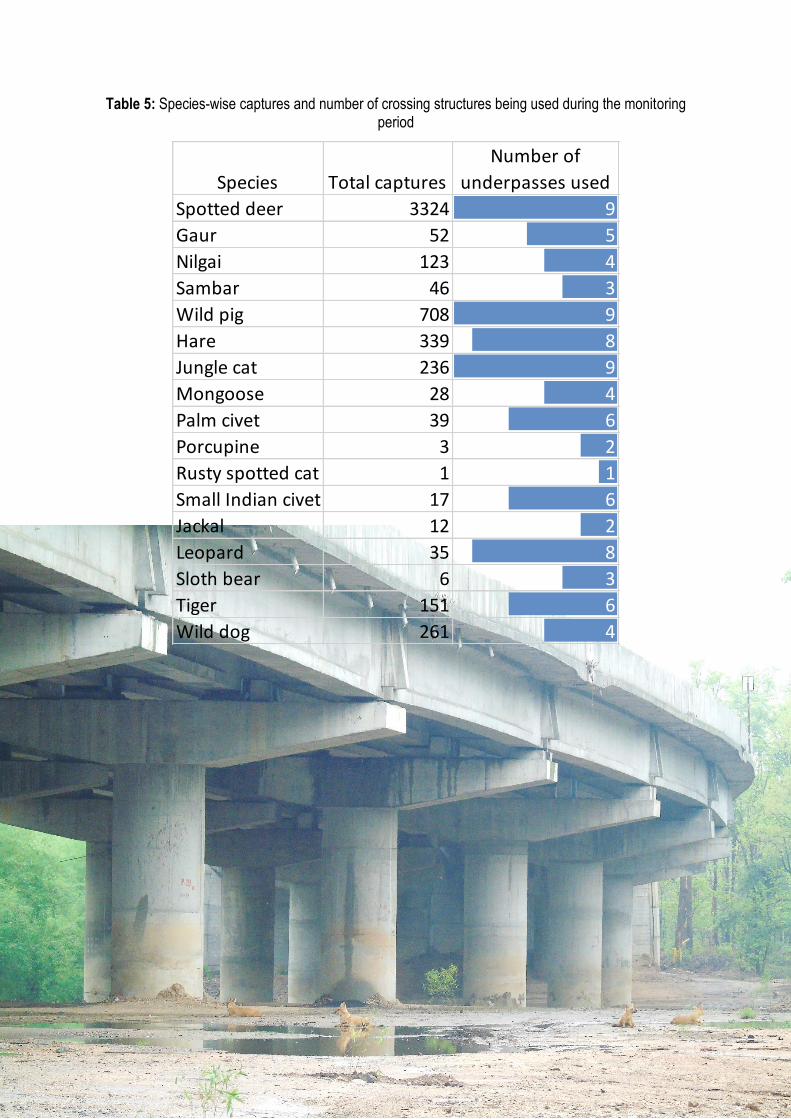
Among wild ungulates, spotted deer and wild pig are the most frequent users of the underpasses, and
were recorded from all nine structures (Table 5). Among small mammals, hare and jungle cat are the
most frequently recorded species, and were found to use most crossing structures. Among carnivores,
wild dog followed by tiger were the most frequent users of the crossing structures, but were captured
from only 4 and 6 structures respectively. Leopards were the most widespread in terms of number of
crossing structures used (8 out of 9).
14
Table 5: Species-wise captures and number of crossing structures being used during the monitoring period
Species Total captures
Number of
underpasses used
Spotted deer 3324 9
Gaur 52 5
Nilgai 123 4
Sambar 46 3
Wild pig 708 9
Hare 339 8
Jungle cat 236 9
Mongoose 28 4
Palm civet 39 6
Porcupine 3 2
Rusty spotted cat 1 1
Small Indian civet 17 6
Jackal 12 2
Leopard 35 8
Sloth bear 6 3
Tiger 151 6
Wild dog 261 4
15
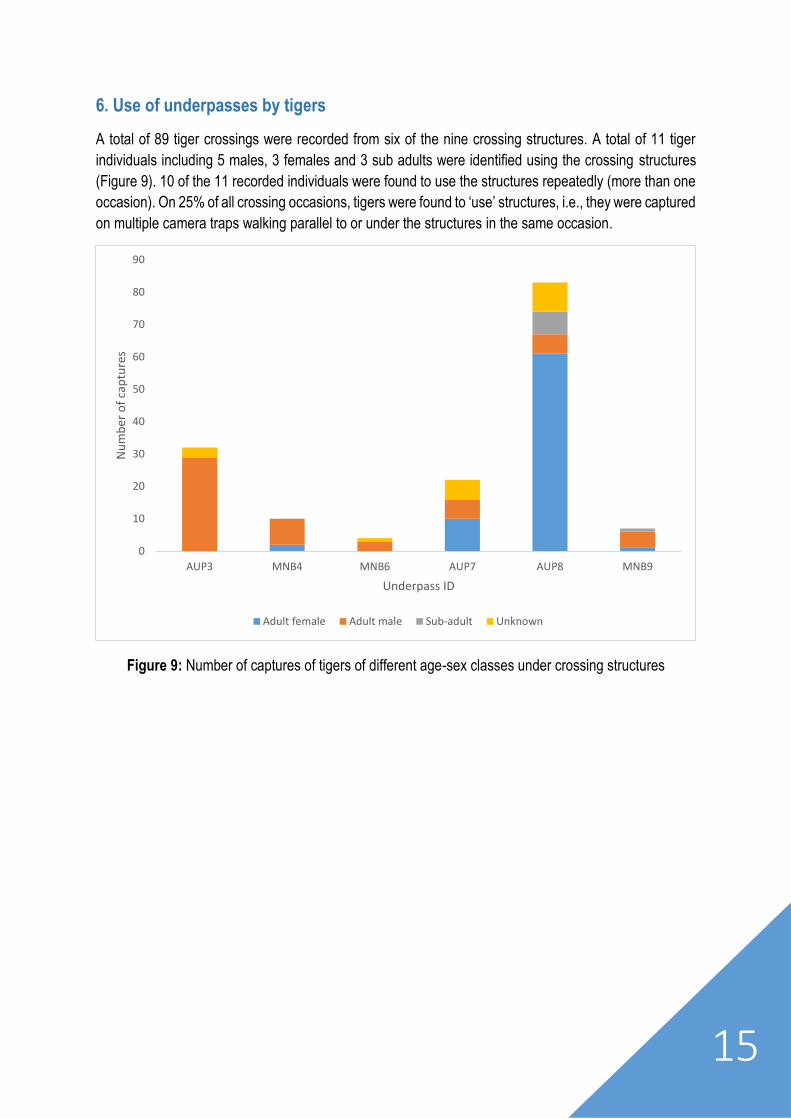
6. Use of underpasses by tigers
A total of 89 tiger crossings were recorded from six of the nine crossing structures. A total of 11 tiger
individuals including 5 males, 3 females and 3 sub adults were identified using the crossing structures
(Figure 9). 10 of the 11 recorded individuals were found to use the structures repeatedly (more than one
occasion). On 25% of all crossing occasions, tigers were found to ‘use’ structures, i.e., they were captured
on multiple camera traps walking parallel to or under the structures in the same occasion.
Figure 9: Number of captures of tigers of different age-sex classes under crossing structures
0
10
20
30
40
50
60
70
80
90
AUP3 MNB4 MNB6 AUP7 AUP8 MNB9
Nu
mb
er o
f ca
ptu
res
Underpass ID
Adult female Adult male Sub-adult Unknown
16
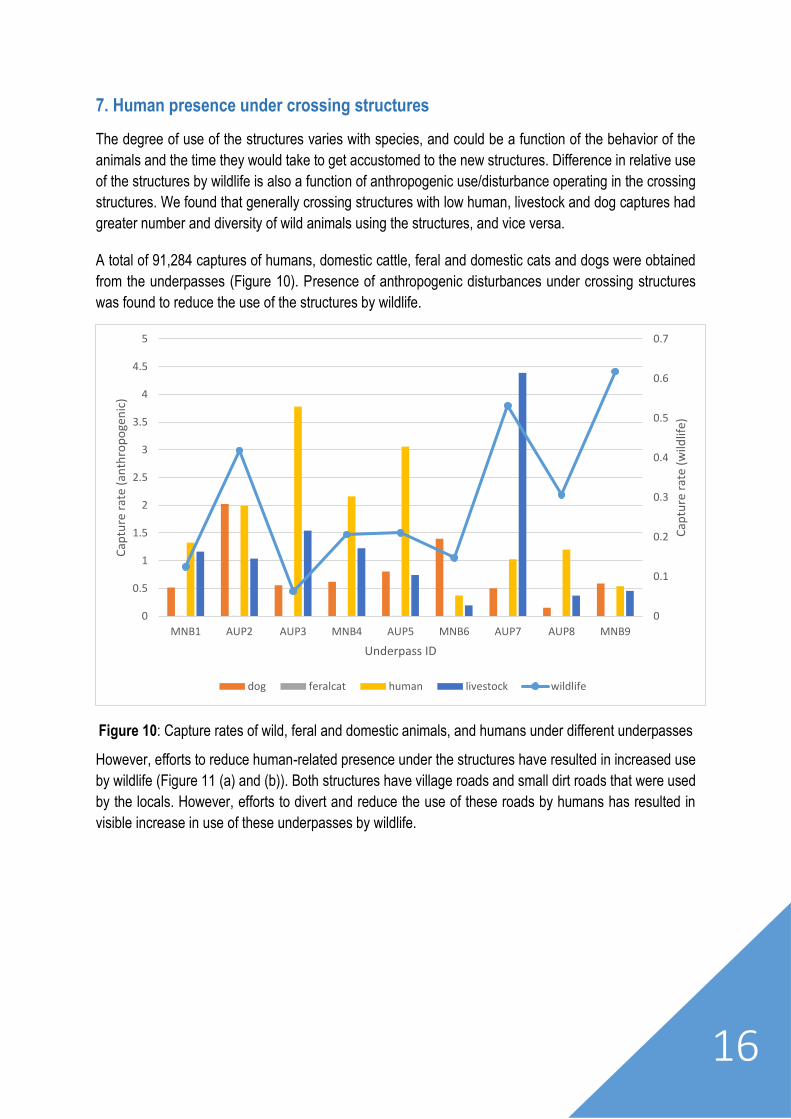
7. Human presence under crossing structures
The degree of use of the structures varies with species, and could be a function of the behavior of the
animals and the time they would take to get accustomed to the new structures. Difference in relative use
of the structures by wildlife is also a function of anthropogenic use/disturbance operating in the crossing
structures. We found that generally crossing structures with low human, livestock and dog captures had
greater number and diversity of wild animals using the structures, and vice versa.
A total of 91,284 captures of humans, domestic cattle, feral and domestic cats and dogs were obtained
from the underpasses (Figure 10). Presence of anthropogenic disturbances under crossing structures
was found to reduce the use of the structures by wildlife.
Figure 10: Capture rates of wild, feral and domestic animals, and humans under different underpasses
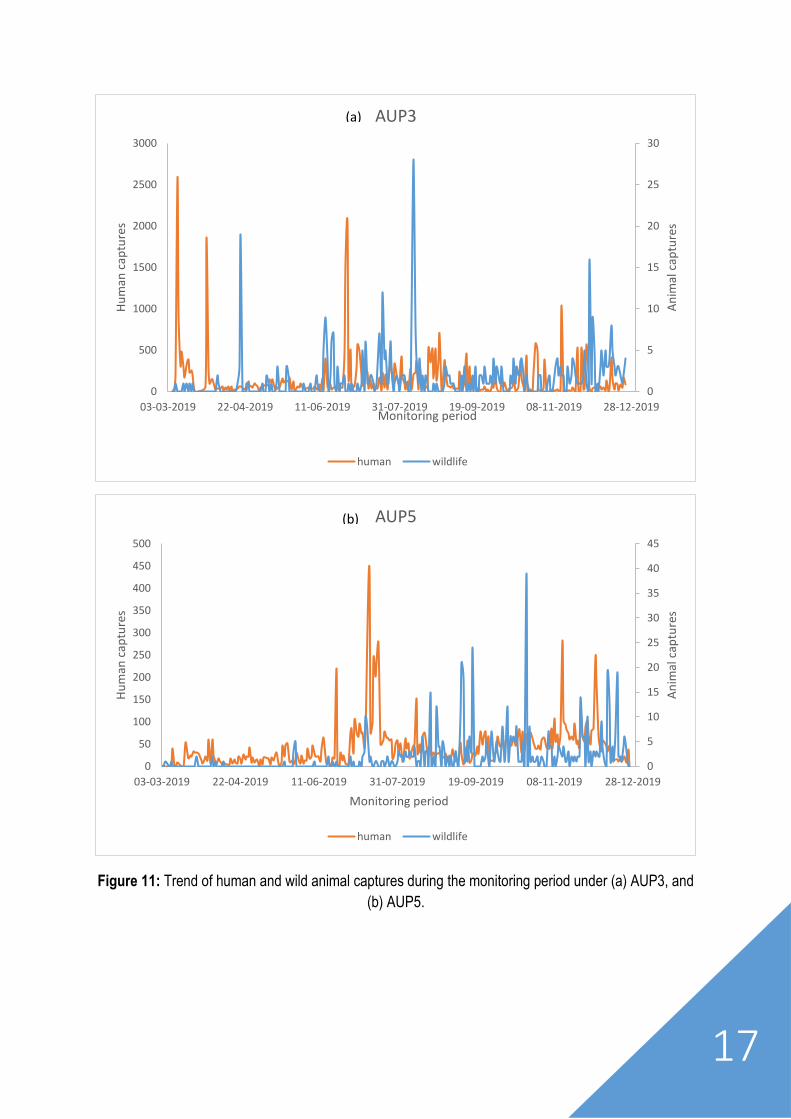
However, efforts to reduce human-related presence under the structures have resulted in increased use
by wildlife (Figure 11 (a) and (b)). Both structures have village roads and small dirt roads that were used
by the locals. However, efforts to divert and reduce the use of these roads by humans has resulted in
visible increase in use of these underpasses by wildlife.
0
0.1
0.2
0.3
0.4
0.5
0.6
0.7
0
0.5
1
1.5
2
2.5
3
3.5
4
4.5
5
MNB1 AUP2 AUP3 MNB4 AUP5 MNB6 AUP7 AUP8 MNB9
Cap
ture
rat
e (w
ildlif
e)
Cap
ture
rat
e (a
nth
rop
oge
nic
)
Underpass ID
dog feralcat human livestock wildlife
17
Figure 11: Trend of human and wild animal captures during the monitoring period under (a) AUP3, and
(b) AUP5.
0
5
10
15
20
25
30
0
500
1000
1500
2000
2500
3000
03-03-2019 22-04-2019 11-06-2019 31-07-2019 19-09-2019 08-11-2019 28-12-2019
An
imal
cap
ture
s
Hu
man
cap
ture
s
Monitoring period
AUP3
human wildlife
0
5
10
15
20
25
30
35
40
45
0
50
100
150
200
250
300
350
400
450
500
03-03-2019 22-04-2019 11-06-2019 31-07-2019 19-09-2019 08-11-2019 28-12-2019
An
imal
cap
ture
s
Hu
man
cap
ture
s
Monitoring period
AUP5
human wildlife
(a)
(b)
18
8. Observations and suggestions
Some common actions for habitat improvement and reduction of anthropogenic pressure under the
crossing structures are suggested as outlined below.
i. Levelling/ terracing/ merging with surrounds: Presently the terrain in the vicinity of some
structures is undulating. This has happened because of dumping and excavation of soil near the
structures, creating steep slopes which are not suitable for movement of some wild animals. It is
suggested to smoothen these slopes. Near the ends of the structures where such slopes exist
and where it may not be possible to completely remove the soil, it is suggested to carry out
terracing combined with pitching. This would also arrest any soil erosion during the rainy season.
ii. Planting of shrubs/ grass: The substrate near many structures is currently devoid of any
vegetation, and this lack of shrub/herbaceous cover could inhibit movement/use by some
animals. The substrate has also become compact owing to construction and post-construction
activities. It is therefore suggested to plough the substrate, and subsequently planting of suitable
native vegetation may be carried out.
iii. Painting of pillars/ walls with camouflage paints: To merge the concrete structures with the
surrounding natural habitat, it is suggested to paint the structures with natural-looking shades
that would camouflage the concrete appearance of the structures. Tested shades such as
Corbett brown, Corbett green or any other camouflage colours as appropriate are suggested.
iv. Daily patrolling by forest guards, weekly patrolling by the round officers and fortnightly by the
concerned range officers
v. Weekly cleaning of the underpasses.
vi. All approaches to the underpasses from the main highway should be closed off by excavation or
planting of thorny bushes (e g., Zizyphus). Bushes may also be planted near the guide walls.
vii. Dirt roads from the forest may be created for monitoring, patrolling and maintenance purposes
viii. Creation of trails to enhance use by wildlife may be taken up.
ix. Habitat enrichment measures such as placement of logs and branches in addition to increasing
vegetative cover near and below the underpasses.
x. Planting of suitable herbs and grassy vegetation under the structures.
xi. A monthly/bi-monthly routine for maintenance works by the highway agency may be drawn, and
the concerned range officers informed accordingly. Such activities should be restricted to daytime
(10 am – 3 pm) and completed with minimal machinery to avoid disturbance to wildlife.
xii. Simple and minimal sign boards may be put up at the beginning of the forest stretches informing
the public about the underpasses. These may include messages about the highway stretch being
19
animal corridors, do’s and don’t’s such as no littering, no stopping, feeding macaques/langurs.
The sign boards should be designed using a maximum of 2-3 colours (preferably only green and
black), with silhouettes of representative animals and minimal text, as this tends to increase the
visibility of the sign boards. Reflective material (radium) may be used to make the sign boards
visible at night.
xiii. Disposal of waste under the crossing structures by passing trucks that transport poultry, livestock
and fish is a major issue. The waste acts as an attractant to feral dogs and wild pigs and could
also be a source of diseases. Adequate enforcement to catch and fine culprits in association with
highway agencies could help reduce the problem.
Protection Measures
Barricading
Villagers, livestock and feral and domestic dogs have been found using 4 out of the 9 crossing structures.
Fewer wild animals have been photocaptured at these structures. It is therefore suggested to take steps
to reduce this anthropogenic presence in the crossing structures. The dirt roads that used to access the
crossing structures could be barricaded or removed completely to reduce this access by villagers.
Small roads under two underpasses (AUP3 and AUP5) leading to villages (Dulara and Navegaon) are
used by vehicles, and are a source of disturbance that inhibits movement of animals under these
structures. These cannot be completely closed down. Therefore it is suggested to barricade these roads
to prevent traffic noise and light from vehicles from causing disturbance under the structures.
Protection huts
Considering frequent use of the structures by wildlife, the possibility of these areas becoming poaching
hotspots cannot be ignored. Therefore, regular monitoring and patrolling are necessary to check any
suspicious activities. Establishment of protection huts near all crossing structures, like that near AUP8,
would help alleviate this risk to a large extent. The existing protection hut near AUP8 is manned by 4
personnel 24x7 with regular foot patrolling under the structure. Similar establishments near all crossing
structures would reduce poaching risk, check suspicious activities under the crossing structures and help
in overall maintenance and monitoring of the crossing structures.
20
8. References
Bellis, Mark. (2008) "Evaluating the Effectiveness of Wildlife Crossing Structures in Southern Vermont".
Masters Theses 1911 - February 2014. Retrieved from
https://scholarworks.umass.edu/theses/202
Habib, B., Saxena, A., Mondal, I., Rajvanshi, A., Mathur, V. B., and Negi, H. S. (2015). Proposed
Mitigation Measures for Maintaining Habitat Contiguity and Reducing Wild Animal Mortality on
NH 6 & 7 in the Central Indian Landscape. Technical Report, Wildlife Institute of India,
Dehradun and National Tiger Conservation Authority, Govt. of India, New Delhi.
Habib B, Rajvanshi A, Mathur VB and Saxena A (2016) Corridors at Crossroads: Linear Development-
Induced Ecological Triage As a Conservation Opportunity. Front. Ecol. Evol. 4:132. doi:
10.3389/fevo.2016.00132
Jackson, S. D., and C. R. Griffin. (2000). A strategy for mitigating highway impacts on wildlife. Wildlife
and Highways: Seeking solutions to an ecological and socioeconomic dilemma. The Wildlife
Society Bethesda, MD.
Jhala. Y.V., Q. Qureshi, & R. Gopal (eds) (2015). The status of tigers, copredators & prey in India 2014.
National Tiger Conservation Authority, New Delhi & Wildlife Institute of India, Dehradun.
TR2015/021
Rytwinski T, Soanes K, Jaeger JAG, Fahrig L, Findlay CS, Houlahan J, et al. (2016) How Effective Is
Road Mitigation at Reducing Road-Kill? A Meta-Analysis. PLoS ONE 11(11): e0166941.
doi:10.1371/journal.pone.0166941

Dr. Bilal Habib Department of Animal Ecology and Conservation Biology Wildlife Institute of India, Chandrabani Dehradun, India 248 001 Tell: 00 91 135 2646283 Fax: 00 91 135 2640117 E-mail; [email protected]
Related Documents