NEWS RELEASE Methanex Corporation 1800 - 200 Burrard St. Vancouver, BC Canada V6C 3M1 Investor Relations: (604) 661-2600 www.methanex.com For immediate release July 29, 2020 METHANEX REPORTS SECOND QUARTER 2020 RESULTS • Strong liquidity position with $783 million in cash on balance sheet and negotiated meaningful financial covenant relief • Records net loss attributable to Methanex shareholders of $65 million and Adjusted EBITDA of $32 million • Global methanol demand declined by 5% in the second quarter due to impacts from the COVID-19 pandemic and lower oil price environment • Extensive preventative measures ongoing to protect the health and safety of our employees, contractors and communities where we do business • Continue to deliver secure and reliable methanol supply to customers around the world amid challenging market conditions and well-positioned to capitalize on a global market recovery Except where otherwise noted, all currency amounts are stated in United States dollars. VANCOUVER, BRITISH COLUMBIA - For the second quarter of 2020, Methanex (TSX:MX) (NASDAQ:MEOH) reported a net loss attributable to Methanex shareholders of $65 million ($0.85 net loss per common share on a diluted basis) compared to net income of $23 million ($0.21 net income per common share on a diluted basis) in the first quarter of 2020. Adjusted EBITDA for the second quarter of 2020 was $32 million and Adjusted net loss was $64 million ($0.84 Adjusted net loss per common share). This compares with Adjusted EBITDA of $138 million and Adjusted net income of $8 million ($0.10 Adjusted net income per common share) for the first quarter of 2020. Second Quarter Results We estimate that global methanol demand declined by approximately 5% in the second quarter of 2020 compared to the first quarter. Methanol demand declined significantly in most parts of the world, other than China, due to impacts from the COVID-19 pandemic and lower oil price environment. We recorded substantially lower Adjusted EBITDA in the second quarter of 2020, compared to the first quarter, due to a lower average realized price and lower sales of Methanex-produced methanol, which was partially offset by lower production costs and selling, general and administrative costs. In addition, in a declining methanol price environment, our margins tend to be lower than in a stable price environment due to inventory timing differences. Business and Financial Update John Floren, President and CEO of Methanex, commented, “Our number one priority remains the safety of our employees, contractors and communities where we do business and we continue to take extensive preventative measures across our operations and offices during this uncertain time. We have demonstrated the resilience of our business model as our manufacturing operations and global supply chain continue to run effectively. I continue to be incredibly proud of our team who have done an outstanding job by maintaining secure and reliable methanol supply to our customers around the world." As we previously announced, we have taken a number of steps to protect our business to respond to lower methanol demand and further strengthen our balance sheet and preserve liquidity by idling our Titan plant in Trinidad and our Chile IV plant, deferring approximately $500 million in capital spending on the Geismar 3 project for up to 18 months, reducing our dividend by approximately $100 million on an annual basis and reducing 2020 maintenance capital spending by $30 million. We have a flexible cost structure as approximately 60% of our natural gas supply is linked to methanol price which reduces our operating METHANEX CORPORATION 2020 SECOND QUARTER NEWS RELEASE PAGE 1

Welcome message from author
This document is posted to help you gain knowledge. Please leave a comment to let me know what you think about it! Share it to your friends and learn new things together.
Transcript

NEWS RELEASEMethanex Corporation1800 - 200 Burrard St.
Vancouver, BC Canada V6C 3M1Investor Relations: (604) 661-2600
www.methanex.com
For immediate release
July 29, 2020
METHANEX REPORTS SECOND QUARTER 2020 RESULTS
• Strong liquidity position with $783 million in cash on balance sheet and negotiated meaningful financial covenant relief
• Records net loss attributable to Methanex shareholders of $65 million and Adjusted EBITDA of $32 million
• Global methanol demand declined by 5% in the second quarter due to impacts from the COVID-19 pandemic and lower oil price environment
• Extensive preventative measures ongoing to protect the health and safety of our employees, contractors and communities where we do business
• Continue to deliver secure and reliable methanol supply to customers around the world amid challenging market conditions and well-positioned to capitalize on a global market recovery
Except where otherwise noted, all currency amounts are stated in United States dollars.
VANCOUVER, BRITISH COLUMBIA - For the second quarter of 2020, Methanex (TSX:MX) (NASDAQ:MEOH) reported a net loss attributable to Methanex shareholders of $65 million ($0.85 net loss per common share on a diluted basis) compared to net income of $23 million ($0.21 net income per common share on a diluted basis) in the first quarter of 2020. Adjusted EBITDA for the second quarter of 2020 was $32 million and Adjusted net loss was $64 million ($0.84 Adjusted net loss per common share). This compares with Adjusted EBITDA of $138 million and Adjusted net income of $8 million ($0.10 Adjusted net income per common share) for the first quarter of 2020.
Second Quarter Results
We estimate that global methanol demand declined by approximately 5% in the second quarter of 2020 compared to the first quarter. Methanol demand declined significantly in most parts of the world, other than China, due to impacts from the COVID-19 pandemic and lower oil price environment.
We recorded substantially lower Adjusted EBITDA in the second quarter of 2020, compared to the first quarter, due to a lower average realized price and lower sales of Methanex-produced methanol, which was partially offset by lower production costs and selling, general and administrative costs. In addition, in a declining methanol price environment, our margins tend to be lower than in a stable price environment due to inventory timing differences.
Business and Financial Update
John Floren, President and CEO of Methanex, commented, “Our number one priority remains the safety of our employees, contractors and communities where we do business and we continue to take extensive preventative measures across our operations and offices during this uncertain time. We have demonstrated the resilience of our business model as our manufacturing operations and global supply chain continue to run effectively. I continue to be incredibly proud of our team who have done an outstanding job by maintaining secure and reliable methanol supply to our customers around the world."
As we previously announced, we have taken a number of steps to protect our business to respond to lower methanol demand and further strengthen our balance sheet and preserve liquidity by idling our Titan plant in Trinidad and our Chile IV plant, deferring approximately $500 million in capital spending on the Geismar 3 project for up to 18 months, reducing our dividend by approximately $100 million on an annual basis and reducing 2020 maintenance capital spending by $30 million. We have a flexible cost structure as approximately 60% of our natural gas supply is linked to methanol price which reduces our operating
METHANEX CORPORATION 2020 SECOND QUARTER NEWS RELEASE PAGE 1

costs in a low methanol price environment. In addition, we continue to actively manage our operating costs across the organization and realized a further $8 million in savings in the second quarter compared to the first quarter.
We ended the quarter with a strong liquidity position of $783 million in cash on the balance sheet. We have no near-term debt maturities. We also recently announced that we amended our $300 million committed revolving credit facility and $800 million non-revolving construction facility, which provides meaningful financial covenant relief. Following this amendment, we repaid $100 million of the amount outstanding on our revolving credit facility in the second quarter and that amount remains available as additional liquidity, if required.
Given the uncertainty in the broader economic environment, we continue to plan for a wide range of scenarios, including ones where we see a prolonged period of lower methanol demand and continued low methanol prices. We are focused on cash preservation and continue to evaluate all options to ensure we maintain financial capacity and flexibility to navigate the current environment and emerge stronger over the cycle as conditions improve.
Outlook
Mr. Floren, President and CEO of Methanex concluded, “We have begun to see some early signs of improving methanol demand with global economic activity beginning to recover and with oil pricing stabilizing in recent weeks. However, the near-term outlook remains uncertain as we believe that it is not possible to accurately predict the full extent and duration of the COVID-19 pandemic and lower oil price environment.”
"We remain focused on operating our plants safely and reliably, delivering secure and reliable supply to our customers and protecting our balance sheet during this very uncertain time. We believe that with our resilient business model and strong liquidity, we are well-positioned to sustain our business in this uncertain environment and generate significant long-term value when market conditions recover.”
FURTHER INFORMATIONThe information set forth in this news release summarizes Methanex's key financial and operational data for the second quarter of 2020. It is not a complete source of information for readers and is not in any way a substitute for reading the second quarter 2020 Management’s Discussion and Analysis ("MD&A") dated July 29, 2020 and the unaudited condensed consolidated interim financial statements for the period ended June 30, 2020, both of which are available from the Investor Relations section of our website at www.methanex.com. The MD&A and the unaudited condensed consolidated interim financial statements for the period ended June 30, 2020 are also available on the Canadian Securities Administrators' SEDAR website at www.sedar.com and on the United States Securities and Exchange Commission's EDGAR website at www.sec.gov.
METHANEX CORPORATION 2020 SECOND QUARTER NEWS RELEASE PAGE 2

FINANCIAL AND OPERATIONAL DATA
Three Months Ended Six Months Ended
($ millions except per share amounts and where noted)Jun 30
2020Mar 31
2020Jun 302019
Jun 302020
Jun 302019
Production (thousands of tonnes) (attributable to Methanex shareholders) 1,628 2,007 1,820 3,635 3,628
Sales volume (thousands of tonnes)
Methanex-produced methanol 1,717 1,976 1,669 3,693 3,590
Purchased methanol 418 548 716 966 1,189
Commission sales 271 264 216 535 545
Total sales volume 1 2,406 2,788 2,601 5,194 5,324
Methanex average non-discounted posted price ($ per tonne) 2 263 325 391 297 391
Average realized price ($ per tonne) 3 211 267 326 241 329
Revenue 4 512 745 848 1,257 1,749
Adjusted revenue 453 676 777 1,129 1,576
Adjusted EBITDA 32 138 146 170 340
Cash flows from operating activities 186 142 117 329 330
Net income (loss) (attributable to Methanex shareholders) (65) 23 50 (42) 89
Adjusted net income (loss) (64) 8 26 (56) 82
Basic net income (loss) per common share (0.85) 0.30 0.65 (0.55) 1.15
Diluted net income (loss) per common share (0.85) 0.21 0.51 (0.63) 1.09
Adjusted net income (loss) per common share (0.84) 0.10 0.34 (0.73) 1.07
Common share information (millions of shares)
Weighted average number of common shares 76 76 77 76 77
Diluted weighted average number of common shares 76 76 77 76 77
Number of common shares outstanding, end of period 76 76 76 76 76
1 Methanex-produced methanol represents our equity share of volume produced at our facilities and excludes volume marketed on a commission basis related to the 36.9% of the Atlas facility and 50% of the Egypt facility that we do not own.
2 Methanex average non-discounted posted price represents the average of our non-discounted posted prices in North America, Europe and Asia Pacific weighted by sales volume. Current and historical pricing information is available at www.methanex.com.
3 Average realized price is calculated as revenue, excluding commissions earned and the Egypt non-controlling interest share of revenue, but including an amount representing our share of Atlas revenue, divided by the total sales volume of Methanex-produced and purchased methanol.
4 Revenue for the three and six months ended June 30, 2019 have been restated as compared to revenue reported in our quarterly MD&A and condensed quarterly financial statements issued for 2019 based on a restatement for the recognition of revenue on Atlas-produced methanol.
METHANEX CORPORATION 2020 SECOND QUARTER NEWS RELEASE PAGE 3
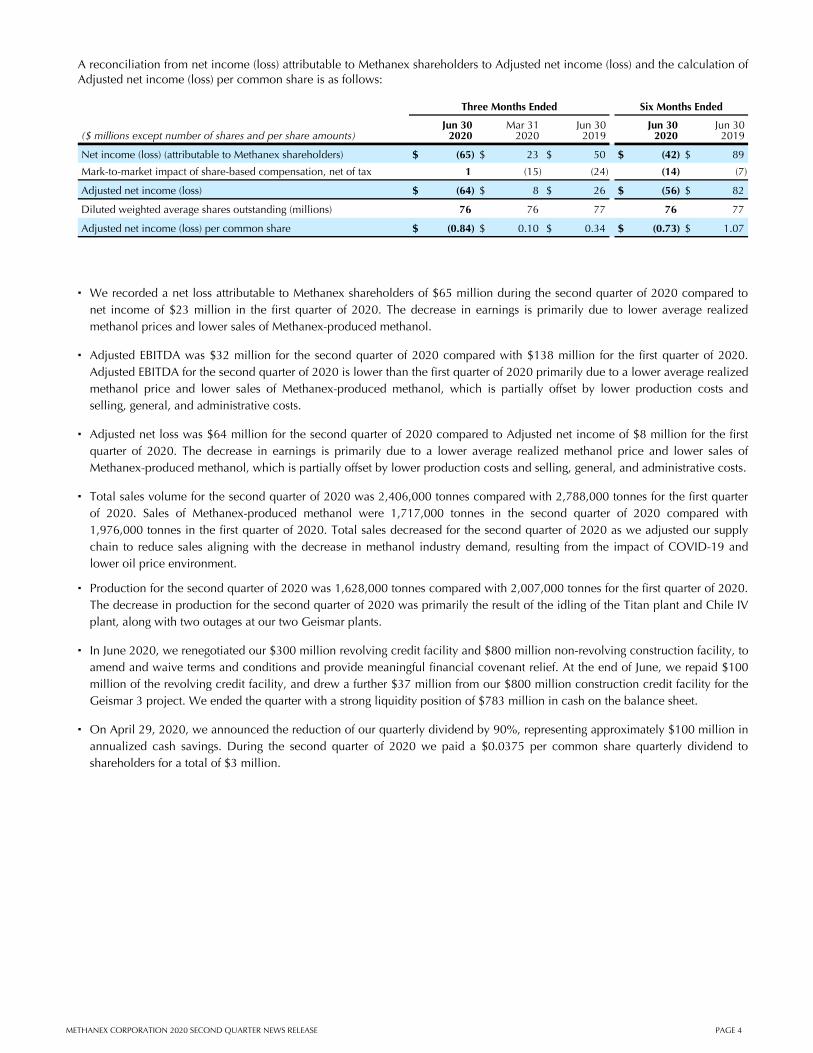
A reconciliation from net income (loss) attributable to Methanex shareholders to Adjusted net income (loss) and the calculation of Adjusted net income (loss) per common share is as follows:
Three Months Ended Six Months Ended
($ millions except number of shares and per share amounts)Jun 30
2020Mar 31
2020Jun 302019
Jun 302020
Jun 302019
Net income (loss) (attributable to Methanex shareholders) $ (65) $ 23 $ 50 $ (42) $ 89
Mark-to-market impact of share-based compensation, net of tax 1 (15) (24) (14) (7)
Adjusted net income (loss) $ (64) $ 8 $ 26 $ (56) $ 82
Diluted weighted average shares outstanding (millions) 76 76 77 76 77
Adjusted net income (loss) per common share $ (0.84) $ 0.10 $ 0.34 $ (0.73) $ 1.07
▪ We recorded a net loss attributable to Methanex shareholders of $65 million during the second quarter of 2020 compared to net income of $23 million in the first quarter of 2020. The decrease in earnings is primarily due to lower average realized methanol prices and lower sales of Methanex-produced methanol.
▪ Adjusted EBITDA was $32 million for the second quarter of 2020 compared with $138 million for the first quarter of 2020. Adjusted EBITDA for the second quarter of 2020 is lower than the first quarter of 2020 primarily due to a lower average realized methanol price and lower sales of Methanex-produced methanol, which is partially offset by lower production costs and selling, general, and administrative costs.
▪ Adjusted net loss was $64 million for the second quarter of 2020 compared to Adjusted net income of $8 million for the first quarter of 2020. The decrease in earnings is primarily due to a lower average realized methanol price and lower sales of Methanex-produced methanol, which is partially offset by lower production costs and selling, general, and administrative costs.
▪ Total sales volume for the second quarter of 2020 was 2,406,000 tonnes compared with 2,788,000 tonnes for the first quarter of 2020. Sales of Methanex-produced methanol were 1,717,000 tonnes in the second quarter of 2020 compared with 1,976,000 tonnes in the first quarter of 2020. Total sales decreased for the second quarter of 2020 as we adjusted our supply chain to reduce sales aligning with the decrease in methanol industry demand, resulting from the impact of COVID-19 and lower oil price environment.
▪ Production for the second quarter of 2020 was 1,628,000 tonnes compared with 2,007,000 tonnes for the first quarter of 2020. The decrease in production for the second quarter of 2020 was primarily the result of the idling of the Titan plant and Chile IV plant, along with two outages at our two Geismar plants.
▪ In June 2020, we renegotiated our $300 million revolving credit facility and $800 million non-revolving construction facility, to amend and waive terms and conditions and provide meaningful financial covenant relief. At the end of June, we repaid $100 million of the revolving credit facility, and drew a further $37 million from our $800 million construction credit facility for the Geismar 3 project. We ended the quarter with a strong liquidity position of $783 million in cash on the balance sheet.
▪ On April 29, 2020, we announced the reduction of our quarterly dividend by 90%, representing approximately $100 million in annualized cash savings. During the second quarter of 2020 we paid a $0.0375 per common share quarterly dividend to shareholders for a total of $3 million.
METHANEX CORPORATION 2020 SECOND QUARTER NEWS RELEASE PAGE 4

PRODUCTION HIGHLIGHTS
Q2 2020 Q1 2020 Q2 2019 YTD Q2 2020 YTD Q2 2019
(thousands of tonnes) Operating Capacity 1 Production Production Production Production Production
New Zealand 2 550 450 443 446 893 883
USA (Geismar) 500 441 530 530 971 935
Trinidad (Methanex interest) 3 500 241 429 384 670 813
Chile 430 204 319 290 523 531
Egypt (50% interest) 158 147 133 15 280 156
Canada (Medicine Hat) 150 145 153 155 298 310
2,288 1,628 2,007 1,820 3,635 3,628
1 Operating capacity includes only those facilities which are currently capable of operating, but excludes any portion of an asset that is underutilized due to a lack of natural gas feedstock over a prolonged period of time. The operating capacity of our production facilities may be higher than original nameplate capacity as, over time, these figures have been adjusted to reflect ongoing operating efficiencies at these facilities. Actual production for a facility in any given year may be higher or lower than operating capacity due to a number of factors, including natural gas composition or the age of the facility's catalyst.
2 The operating capacity of New Zealand is made up of the two Motunui facilities and the Waitara Valley facility. The New Zealand facilities are capable of producing up to 2.4 million tonnes annually, depending on natural gas composition and availability. In Q4 2019 we revised the Annual Operating Capacity from 2.4 million tonnes to 2.2 million tonnes based on the current outlook for available high CO2 natural gas.
3 The operating capacity of Trinidad is made up of the Titan (100% interest) and Atlas (63.1% interest) facilities.
Key production and operational highlights during the second quarter include:
▪ New Zealand produced 450,000 tonnes compared with 443,000 tonnes in the first quarter of 2020. Production was similar in the second quarter of 2020 compared to the first quarter due to continued lower gas deliveries. Our production guidance for New Zealand is approximately 80% for 2020, or approximately 1.8 million tonnes.
▪ Geismar produced 441,000 tonnes during the second quarter of 2020 compared to 530,000 tonnes during the first quarter of 2020. Production for Geismar is lower in the second quarter of 2020 compared to the first quarter of 2020 as both plants carried out maintenance outages during the second quarter.
▪ Trinidad produced 241,000 tonnes (Methanex interest) during the second quarter of 2020 compared with 429,000 tonnes in the first quarter of 2020. Production in Trinidad is lower during the second quarter of 2020 compared to the first quarter of 2020 due to the Titan plant being idled effective March 16, 2020. Atlas continued to operate at similar rates to the first quarter of 2020 throughout the second quarter.
▪ Chile produced 204,000 tonnes during the second quarter of 2020 compared to 319,000 tonnes during the first quarter of 2020. Production for the second quarter of 2020 is lower compared to the first quarter of 2020 primarily due to the Chile IV plant being idled effective April 1, 2020.
▪ The Egypt facility produced 294,000 tonnes (Methanex interest - 147,000 tonnes) in the second quarter of 2020 compared with 266,000 tonnes (Methanex interest - 133,000 tonnes) in the first quarter of 2020. Egypt production was higher in the second quarter of 2020 compared to the first quarter of 2020, as a planned maintenance outage was undertaken in February 2020 impacting first quarter production.
▪ Medicine Hat produced 145,000 tonnes during the second quarter of 2020 compared to 153,000 tonnes during the first quarter of 2020 as a result of reduced supply of CO2.
METHANEX CORPORATION 2020 SECOND QUARTER NEWS RELEASE PAGE 5
CONFERENCE CALL
A conference call is scheduled for July 30, 2020 at 11:00 am ET (8:00 am PT) to review these second quarter results. To access the call, dial the conferencing operator fifteen minutes prior to the start of the call at (416) 340-2217, or toll free at (800) 806-5484. A simultaneous audio-only webcast of the conference call can be accessed from our website at www.methanex.com and will also be available following the call. A playback version of the conference call will be available until August 13, 2020 at (905) 694-9451, or toll free at (800) 408-3053. The passcode for the playback version is 8140443#.
ABOUT METHANEX
Methanex is a Vancouver-based, publicly traded company and is the world’s largest producer and supplier of methanol to major international markets. Methanex shares are listed for trading on the Toronto Stock Exchange in Canada under the trading symbol "MX" and on the NASDAQ Global Market in the United States under the trading symbol "MEOH".
FORWARD-LOOKING INFORMATION WARNING
This second quarter 2020 press release contains forward-looking statements with respect to us and the chemical industry. By its nature, forward-looking information is subject to numerous risks and uncertainties, some of which are beyond the Company's control. Readers are cautioned that undue reliance should not be placed on forward-looking information as actual results may vary materially from the forward-looking information. Methanex does not undertake to update, correct or revise any forward-looking information as a result of any new information, future events or otherwise, except as may be required by applicable law. Refer to Forward-Looking Information Warning in the second quarter 2020 Management's Discussion and Analysis for more information which is available from the Investor Relations section of our website at www.methanex.com, the Canadian Securities Administrators' SEDAR website at www.sedar.com and on the United States Securities and Exchange Commission's EDGAR website at www.sec.gov.
NON-GAAP MEASURES
The Company has used the terms Adjusted EBITDA, Adjusted net income (loss), Adjusted net income (loss) per common share, Adjusted revenue and operating income (loss) throughout this document. These items are non-GAAP measures that do not have any standardized meaning prescribed by GAAP. These measures represent the amounts that are attributable to Methanex Corporation shareholders and are calculated by excluding the mark-to-market impact of share-based compensation as a result of changes in our share price and the impact of certain items associated with specific identified events. Refer to Additional Information - Supplemental Non-GAAP Measures on page 14 of the Company's MD&A for the period ended June 30, 2020 for reconciliations to the most comparable GAAP measures. Unless otherwise indicated, the financial information presented in this release is prepared in accordance with International Financial Reporting Standards ("IFRS") as issued by the International Accounting Standards Board ("IASB").
-end-
For further information, contact:
Kim CampbellDirector, Investor RelationsMethanex Corporation604-661-2600
METHANEX CORPORATION 2020 SECOND QUARTER NEWS RELEASE PAGE 6

2Share InformationMethanex Corporation’s common shares are listed for trading on the Toronto Stock Exchange under the symbol MX and on the Nasdaq Global Market under the symbol MEOH.
Transfer Agents & RegistrarsAST Trust Company (Canada)320 Bay Street Toronto, Ontario Canada M5H 4A6Toll free in North America: 1-800-387-0825
Investor InformationAll financial reports, news releases and corporate information can be accessed on our website at www.methanex.com.
Contact InformationMethanex Investor Relations1800 - 200 Burrard StreetVancouver, BC Canada V6C 3M1E-mail: [email protected] Toll-Free: 1-800-661-8851
Management's Discussion and Analysis for the
Three and Six Months Ended June 30, 2020
At July 28, 2020 the Company had 76,196,080 common shares issued and outstanding and stock options exercisable for 1,435,052 additional common shares.
SECOND QUARTER MANAGEMENT’S DISCUSSION AND ANALYSIS ("MD&A")Except where otherwise noted, all currency amounts are stated in United States dollars.
Business Update (COVID-19)
We continue to respond to the COVID-19 pandemic and take pro-active measures to preserve the strength of our business in this challenging environment. In addition to the steps taken in March and April to idle two of our plants, draw on our banking facilities, reduce our quarterly dividend, and defer $500 million of capital spending on the Geismar 3 project, we have secured additional financial flexibility by negotiating meaningful covenant relief on our credit facilities. Our manufacturing sites are operating safely with strict controls in place to monitor employee health and minimize staff onsite in locations where the risks of COVID-19 continue to be high, while our global supply chain continues to run effectively. We believe that with our resilient business model and strong liquidity, we are well-positioned to sustain our business in this uncertain environment and generate significant long-term value when market conditions recover.
FINANCIAL AND OPERATIONAL HIGHLIGHTS
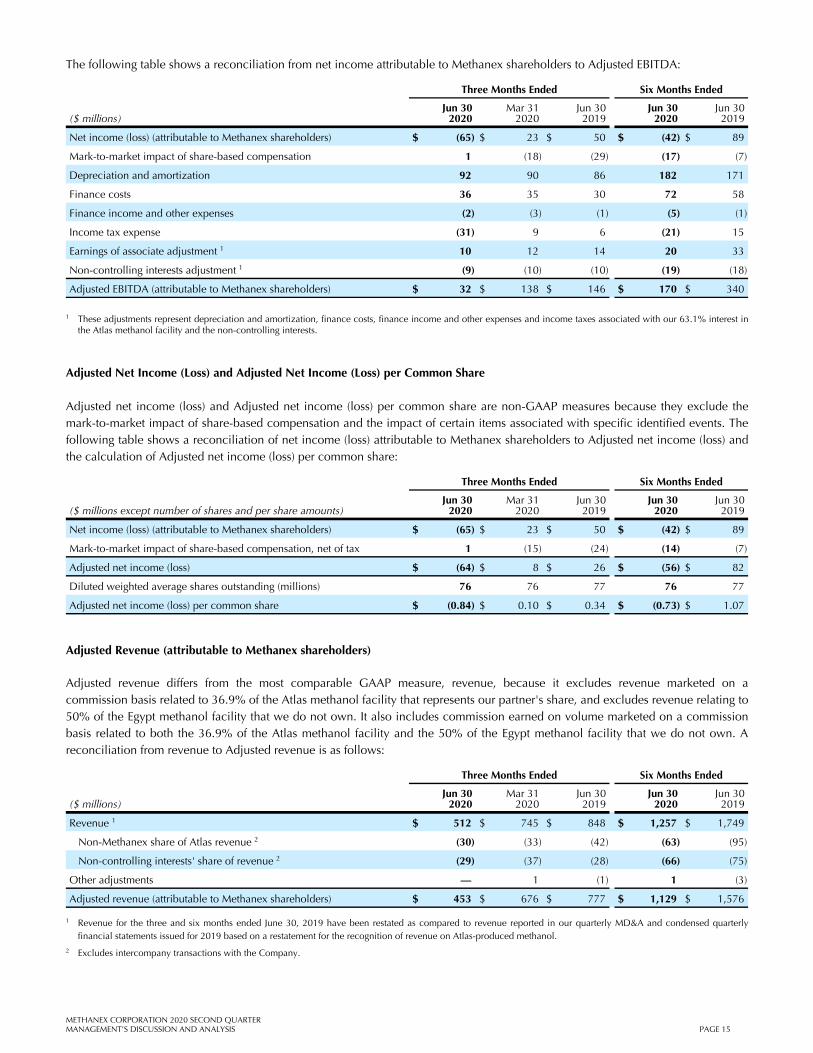
▪ A reconciliation from net income (loss) attributable to Methanex shareholders to Adjusted net income (loss) and the calculation of Adjusted net income (loss) per common share is as follows:
Three Months Ended Six Months Ended
($ millions except number of shares and per share amounts)Jun 30
2020Mar 31
2020Jun 302019
Jun 302020
Jun 302019
Net income (loss) (attributable to Methanex shareholders) $ (65) $ 23 $ 50 $ (42) $ 89
Mark-to-market impact of share-based compensation, net of tax 1 (15) (24) (14) (7)
Adjusted net income (loss) 1 $ (64) $ 8 $ 26 $ (56) $ 82
Diluted weighted average shares outstanding (millions) 76 76 77 76 77
Adjusted net income (loss) per common share 1 $ (0.84) $ 0.10 $ 0.34 $ (0.73) $ 1.07
1 The Company has used the terms Adjusted EBITDA, Adjusted net income (loss), Adjusted net income (loss) per common share, Adjusted revenue and operating income (loss) throughout this document. These items are non-GAAP measures that do not have any standardized meaning prescribed by GAAP and therefore are unlikely to be comparable to similar measures presented by other companies. Refer to Additional Information - Supplemental Non-GAAP Measures on page 14 of the MD&A for reconciliations to the most comparable GAAP measures.
▪ We recorded net loss attributable to Methanex shareholders of $65 million during the second quarter of 2020 compared to net income of $23 million in the first quarter of 2020. The decrease in earnings is primarily due to lower average realized methanol prices and lower sales of Methanex-produced methanol.
▪ Adjusted EBITDA was $32 million for the second quarter of 2020 compared with $138 million for the first quarter of 2020. Adjusted EBITDA for the second quarter of 2020 is lower than the first quarter of 2020 primarily due to a lower average realized methanol price and lower sales of Methanex-produced methanol, which is partially offset by lower production costs and selling, general, and administrative costs.
METHANEX CORPORATION 2020 SECOND QUARTER MANAGEMENT’S DISCUSSION AND ANALYSIS PAGE 1

▪ Adjusted net loss was $64 million for the second quarter of 2020 compared to Adjusted net income of $8 million for the first quarter of 2020. The decrease in earnings is primarily due to a lower average realized methanol price and lower sales of Methanex-produced methanol, which is partially offset by lower production costs and selling, general, and administrative costs.
▪ Total sales volume for the second quarter of 2020 was 2,406,000 tonnes compared with 2,788,000 tonnes for the first quarter of 2020. Sales of Methanex-produced methanol were 1,717,000 tonnes in the second quarter of 2020 compared with 1,976,000 tonnes in the first quarter of 2020. Total sales decreased for the second quarter of 2020 as we adjusted our supply chain to reduce sales aligning with the decrease in methanol industry demand, resulting from the impact of COVID-19 and lower oil price environment.
▪ Production for the second quarter of 2020 was 1,628,000 tonnes compared with 2,007,000 tonnes for the first quarter of 2020. The decrease in production for the second quarter of 2020 was primarily the result of the idling of the Titan plant and Chile IV plant, along with two outages at our two Geismar plants. Refer to the Production Summary section on page 4 of the MD&A.
▪ In June 2020, we renegotiated our $300 million revolving credit facility and $800 million non-revolving construction facility, to amend and waive terms and conditions and provide meaningful financial covenant relief. At the end of June, we repaid $100 million of the revolving credit facility, and drew a further $37 million from our $800 million construction credit facility for the Geismar 3 project. We ended the quarter with a strong liquidity position of $783 million in cash on the balance sheet.
▪ On April 29, 2020, we announced the reduction of our quarterly dividend by 90%, representing approximately $100 million in annualized cash savings. During the second quarter of 2020 we paid a $0.0375 per common share quarterly dividend to shareholders for a total of $3 million.
Outlook
We have begun to see some early signs of improving methanol demand as easing of government restrictions have resulted in higher industrial production levels and fuel demand and as oil prices have stabilized in recent weeks. However, the outlook over the coming months remains uncertain as we believe that it is not possible to accurately predict the full extent and duration of the COVID-19 pandemic and lower oil price environment.
We remain focused on operating our plants safely and reliably, delivering secure and reliable supply to our customers and protecting our balance sheet during this very uncertain time. We believe that with our resilient business model and strong liquidity,we are well-positioned to sustain our business in this uncertain environment and generate significant long-term value when market conditions recover.
This Second Quarter 2020 Management’s Discussion and Analysis dated July 29, 2020 for Methanex Corporation ("the Company") should be read in conjunction with the Company’s unaudited condensed consolidated interim financial statements for the period ended June 30, 2020 as well as the 2019 Annual Consolidated Financial Statements and MD&A included in the Methanex 2019 Annual Report. Unless otherwise indicated, the financial information presented in this interim report is prepared in accordance with International Financial Reporting Standards ("IFRS") as issued by the International Accounting Standards Board ("IASB"). The Methanex 2019 Annual Report and additional information relating to Methanex is available on our website at www.methanex.com, the Canadian Securities Administrators' SEDAR website at www.sedar.com and on the United States Securities and Exchange Commission's EDGAR website at www.sec.gov.
METHANEX CORPORATION 2020 SECOND QUARTER MANAGEMENT’S DISCUSSION AND ANALYSIS PAGE 2

FINANCIAL AND OPERATIONAL DATA
Three Months Ended Six Months Ended
($ millions except per share amounts and where noted)Jun 30
2020Mar 31
2020Jun 302019
Jun 302020
Jun 302019
Production (thousands of tonnes) (attributable to Methanex shareholders) 1,628 2,007 1,820 3,635 3,628
Sales volume (thousands of tonnes)
Methanex-produced methanol 1,717 1,976 1,669 3,693 3,590
Purchased methanol 418 548 716 966 1,189
Commission sales 271 264 216 535 545
Total sales volume 1 2,406 2,788 2,601 5,194 5,324
Methanex average non-discounted posted price ($ per tonne) 2 263 325 391 297 391
Average realized price ($ per tonne) 3 211 267 326 241 329
Revenue 4 512 745 848 1,257 1,749
Adjusted revenue 453 676 777 1,129 1,576
Adjusted EBITDA 32 138 146 170 340
Cash flows from operating activities 186 142 117 329 330
Net income (loss) (attributable to Methanex shareholders) (65) 23 50 (42) 89
Adjusted net income (loss) (64) 8 26 (56) 82
Basic net income (loss) per common share (0.85) 0.30 0.65 (0.55) 1.15
Diluted net income (loss) per common share (0.85) 0.21 0.51 (0.63) 1.09
Adjusted net income (loss) per common share (0.84) 0.10 0.34 (0.73) 1.07
Common share information (millions of shares)
Weighted average number of common shares 76 76 77 76 77
Diluted weighted average number of common shares 76 76 77 76 77
Number of common shares outstanding, end of period 76 76 76 76 76
1 Methanex-produced methanol represents our equity share of volume produced at our facilities and excludes volume marketed on a commission basis related to the 36.9% of the Atlas facility and 50% of the Egypt facility that we do not own.
2 Methanex average non-discounted posted price represents the average of our non-discounted posted prices in North America, Europe and Asia Pacific weighted by sales volume. Current and historical pricing information is available at www.methanex.com.
3 Average realized price is calculated as revenue, excluding commissions earned and the Egypt non-controlling interest share of revenue, but including an amount representing our share of Atlas revenue, divided by the total sales volume of Methanex-produced and purchased methanol.
4 Revenue for the three and six months ended June 30, 2019 have been restated as compared to revenue reported in our quarterly MD&A and condensed quarterly financial statements issued for 2019 based on a restatement for the recognition of revenue on Atlas-produced methanol.
METHANEX CORPORATION 2020 SECOND QUARTER MANAGEMENT’S DISCUSSION AND ANALYSIS PAGE 3

PRODUCTION SUMMARY
Q2 2020 Q1 2020 Q2 2019 YTD Q2 2020 YTD Q2 2019
(thousands of tonnes) Operating Capacity 1 Production Production Production Production Production
New Zealand 2 550 450 443 446 893 883
USA (Geismar) 500 441 530 530 971 935
Trinidad (Methanex interest) 3 500 241 429 384 670 813
Chile 430 204 319 290 523 531
Egypt (50% interest) 158 147 133 15 280 156
Canada (Medicine Hat) 150 145 153 155 298 310
2,288 1,628 2,007 1,820 3,635 3,628
1 Operating capacity includes only those facilities which are currently capable of operating, but excludes any portion of an asset that is underutilized due to a lack of natural gas feedstock over a prolonged period of time. The operating capacity of our production facilities may be higher than original nameplate capacity as, over time, these figures have been adjusted to reflect ongoing operating efficiencies at these facilities. Actual production for a facility in any given year may be higher or lower than operating capacity due to a number of factors, including natural gas composition or the age of the facility's catalyst.
2 The operating capacity of New Zealand is made up of the two Motunui facilities and the Waitara Valley facility. The New Zealand facilities are capable of producing up to 2.4 million tonnes annually, depending on natural gas composition and availability. In Q4 2019 we revised the Annual Operating Capacity from 2.4 million tonnes to 2.2 million tonnes based on the current outlook for available high CO2 natural gas. (refer to the New Zealand section below).
3 The operating capacity of Trinidad is made up of the Titan (100% interest) and Atlas (63.1% interest) facilities (refer to the Trinidad section below).
New Zealand
The New Zealand facilities produced 450,000 tonnes of methanol in the second quarter of 2020 compared with 443,000 tonnes in the first quarter of 2020. Production was similar in the second quarter of 2020 compared to the first quarter due to continued lower gas deliveries. Our production guidance for New Zealand is approximately 80% for 2020, or approximately 1.8 million tonnes.
United States
The Geismar facilities produced 441,000 tonnes during the second quarter of 2020 compared to 530,000 tonnes during the first quarter of 2020. Production for Geismar is lower in the second quarter of 2020 compared to the first quarter of 2020 as both plants carried out maintenance outages during the second quarter.
Trinidad
Trinidad produced 241,000 tonnes (Methanex interest) in the second quarter of 2020 compared with 429,000 tonnes (Methanex interest) in the first quarter of 2020. Production in Trinidad is lower during the second quarter of 2020 compared to the first quarter of 2020 due to the Titan plant being idled effective March 16, 2020. Atlas continued to operate at similar rates to the first quarter of 2020 throughout the second quarter.
Chile
Chile produced 204,000 tonnes during the second quarter of 2020 compared to 319,000 tonnes during the first quarter of 2020. Production for the second quarter of 2020 is lower compared to the first quarter of 2020 primarily due to the Chile IV plant being idled effective April 1, 2020.
Looking beyond the impact of COVID-19, we expect that our current gas agreements will allow for a two-plant operation in Chile during the southern hemisphere summer months and up to a maximum of 75% of a two-plant operation annually, to the end of 2020. The future of our Chile operations is primarily dependent on the level of natural gas exploration and development in southern Chile and our ability to secure a sustainable natural gas supply to our facilities on economic terms from Chile and Argentina. We are optimistic that we will be able to secure sufficient gas to underpin a full two-plant operation over the coming years.
METHANEX CORPORATION 2020 SECOND QUARTER MANAGEMENT’S DISCUSSION AND ANALYSIS PAGE 4

Egypt
The Egypt facility produced 294,000 tonnes (Methanex interest - 147,000 tonnes) in the second quarter of 2020 compared with 266,000 tonnes (Methanex interest - 133,000 tonnes) in the first quarter of 2020. Egypt production was higher in the second quarter of 2020 compared to the first quarter of 2020, as a planned maintenance outage was undertaken in February 2020 impacting first quarter production.
Canada
Medicine Hat produced 145,000 tonnes during the second quarter of 2020 compared to 153,000 tonnes during the first quarter of 2020 as a result of reduced supply of CO2.
FINANCIAL RESULTS
For the second quarter of 2020, we reported a net loss attributable to Methanex shareholders of $65 million ($0.85 net loss per common share on a diluted basis) compared with net income attributable to Methanex shareholders for the first quarter of 2020 of $23 million ($0.21 net income per common share on a diluted basis) and net income attributable to Methanex shareholders for the second quarter of 2019 of $50 million ($0.51 net income per common share on a diluted basis). For the six months ended June 30, 2020 compared with the same period in 2019, we reported net loss attributable to Methanex shareholders of $42 million ($0.63 net loss per common share on a diluted basis) and net income of $89 million ($1.09 net income per common share on a diluted basis).
For the second quarter of 2020, we recorded Adjusted EBITDA of $32 million and Adjusted net loss of $64 million ($0.84 Adjusted net loss per common share). This compares with Adjusted EBITDA of $138 million and Adjusted net income of $8 million ($0.10 Adjusted net income per common share) for the first quarter of 2020 and Adjusted EBITDA of $146 million and Adjusted net income of $26 million ($0.34 Adjusted net income per common share) for the second quarter of 2019. For the six months ended June 30, 2020, we recorded Adjusted EBITDA of $170 million and Adjusted net loss of $56 million ($0.73 Adjusted net loss per common share) compared to Adjusted EBITDA of $340 million and Adjusted net income of $82 million ($1.07 Adjusted net income per common share) for the same period in 2019.
We calculate Adjusted EBITDA and Adjusted net income (loss) by including amounts related to our equity share of the Atlas facility (63.1% interest) and by excluding the non-controlling interests' share, the mark-to-market impact of share-based compensation as a result of changes in our share price and the impact of certain items associated with specific identified events. Refer to Additional Information - Supplemental Non-GAAP Measures on page 14 of the MD&A for a further discussion on how we calculate these measures. Our analysis of depreciation and amortization, finance costs, finance income and other expenses and income taxes is consistent with the presentation of our consolidated statements of income and excludes amounts related to Atlas.
METHANEX CORPORATION 2020 SECOND QUARTER MANAGEMENT’S DISCUSSION AND ANALYSIS PAGE 5

We review our financial results by analyzing changes in Adjusted EBITDA, mark-to-market impact of share-based compensation, depreciation and amortization, finance costs, finance income and other expenses and income taxes. A summary of our consolidated statements of income (loss) is as follows:
Three Months Ended Six Months Ended
($ millions)Jun 30
2020Mar 31
2020Jun 302019
Jun 302020
Jun 302019
Consolidated statements of income (loss):
Revenue 1 $ 512 $ 745 $ 848 $ 1,257 $ 1,749
Cost of sales and operating expenses 2 (484) (599) (690) (1,083) (1,440)
Egypt insurance recovery — 10 — 10 —
Mark-to-market impact of share-based compensation 1 (18) (29) (17) (7)
Adjusted EBITDA (attributable to associate) 15 21 26 36 63
Amounts excluded from Adjusted EBITDA attributable to non-controlling interests (12) (21) (9) (33) (25)
Adjusted EBITDA (attributable to Methanex shareholders) 32 138 146 170 340
Mark-to-market impact of share-based compensation (1) 18 29 17 7
Depreciation and amortization (92) (90) (86) (182) (171)
Finance costs (36) (35) (30) (72) (58)
Finance income and other expenses 2 3 1 5 1
Income tax recovery (expense) 31 (9) (6) 21 (15)
Earnings of associate adjustment 3 (10) (12) (14) (20) (33)
Non-controlling interests adjustment 3 9 10 10 19 18
Net income (loss) (attributable to Methanex shareholders) $ (65) $ 23 $ 50 $ (42) $ 89
Net income (loss) $ (62) $ 34 $ 49 $ (28) $ 96
1 Revenue for the three and six months ended June 30, 2019 have been restated as compared to revenue reported in our quarterly MD&A and condensed quarterly financial statements issued for 2019 based on a restatement for the recognition of revenue on Atlas-produced methanol.
2 Cost of sales and operating expenses for the three and six months ended June 30, 2019 have been restated as compared to cost of sales and operating expenses reported in our quarterly MD&A and condensed quarterly financial statements issued for 2019 based on a restatement for the recognition of revenue on Atlas-produced methanol.
3 These adjustments represent depreciation and amortization, finance costs, finance income and other expenses and income taxes associated with our 63.1% interest in the Atlas methanol facility and the non-controlling interests.
Adjusted EBITDA (attributable to Methanex shareholders)
Our operations consist of a single operating segment - the production and sale of methanol. We review the results of operations by analyzing changes in the components of Adjusted EBITDA. For a discussion of the definitions used in our Adjusted EBITDA analysis, refer to How We Analyze Our Business on page 17 of the MD&A. Changes in these components - average realized price, sales volume and total cash costs - similarly impact net income attributable to Methanex shareholders. The changes in Adjusted EBITDA resulted from changes in the following:
($ millions)
Q2 2020compared with
Q1 2020
Q2 2020compared with
Q2 2019
YTD Q2 2020compared withYTD Q2 2019
Average realized price $ (119) $ (243) $ (407)
Sales volume (24) (20) (11)
Total cash costs 37 149 248
Decrease in Adjusted EBITDA $ (106) $ (114) $ (170)
METHANEX CORPORATION 2020 SECOND QUARTER MANAGEMENT’S DISCUSSION AND ANALYSIS PAGE 6

Average realized price
Three Months Ended Six Months Ended
($ per tonne)Jun 30
2020Mar 31
2020Jun 302019
Jun 302020
Jun 302019
Methanex average non-discounted posted price 263 325 391 297 391
Methanex average realized price 211 267 326 241 329
Methanex’s average realized price for the second quarter of 2020 was $211 per tonne compared to $267 per tonne in the first quarter of 2020 and $326 per tonne in the second quarter of 2019, decreasing Adjusted EBITDA by $119 million and $243 million, respectively.
For the six months ended June 30, 2020, our average realized price was $241 per tonne compared to $329 for the same period in 2019, decreasing Adjusted EBITDA by $407 million.
Our average realized price for the three months ended June 30, 2020 compared to the three months ended March 31, 2020, and for the three and six months ended June 30, 2020 decreased compared to the same periods in 2019 driven by lower average non-discounted posted prices (refer to Supply/Demand Fundamentals section on page 11 of the MD&A for more information).
Sales volume
Methanol sales volume excluding commission sales volume in the second quarter of 2020 was 389,000 tonnes lower than the first quarter of 2020 and 250,000 tonnes lower than the second quarter of 2019. The decrease in the second quarter of 2020 compared to the first quarter of 2020 decreased Adjusted EBITDA by $24 million. The decrease in the second quarter of 2020 compared with the same period in 2019 decreased Adjusted EBITDA by $20 million. For the six months ended June 30, 2020 compared with the same period in 2019, methanol sales volume excluding commission sales volume was 120,000 tonnes lower and this resulted in lower Adjusted EBITDA by $11 million. Total sales decreased for the second quarter of 2020 as we adjusted our supply chain to reduce sales aligning with the decrease in methanol industry demand, resulting from the impact of COVID-19 and lower oil price environment.
Total cash costs
The primary drivers of changes in our total cash costs are changes in the cost of Methanex-produced methanol and changes in the cost of methanol we purchase from others ("purchased methanol"). We supplement our production with methanol produced by others through methanol offtake contracts and purchases on the spot market to meet customer needs and to support our marketing efforts within the major global markets.
We apply the first-in, first-out method of accounting for inventories and it generally takes between 30 and 60 days to sell the methanol we produce or purchase. Accordingly, the changes in Adjusted EBITDA as a result of changes in Methanex-produced and purchased methanol costs primarily depend on changes in methanol pricing and the timing of inventory flows.
In a rising price environment, our margins at a given price are higher than in a stable price environment as a result of timing of methanol purchases and production versus sales. Generally, the opposite applies when methanol prices are decreasing.
The changes in Adjusted EBITDA due to changes in total cash costs were due to the following:
($ millions)
Q2 2020compared with
Q1 2020
Q2 2020compared with
Q2 2019
YTD Q2 2020compared withYTD Q2 2019
Methanex-produced methanol costs $ 30 $ 72 $ 143
Proportion of Methanex-produced methanol sales 4 25 23
Purchased methanol costs 10 30 62
Logistics costs 2 13 4
Egypt insurance recovery (5) — —
Other, net (4) 9 16
Increase in Adjusted EBITDA due to changes in total cash costs $ 37 $ 149 $ 248
METHANEX CORPORATION 2020 SECOND QUARTER MANAGEMENT’S DISCUSSION AND ANALYSIS PAGE 7

Methanex-produced methanol costsNatural gas is the primary feedstock at our methanol facilities and is the most significant component of Methanex-produced methanol costs. We purchase natural gas for more than half of our production under agreements where the unique terms of each contract include a base price and a variable price component linked to methanol revenue to reduce our commodity price risk exposure. The variable price component of each gas contract is adjusted by a formula linked to methanol sales prices above a certain level. For the second quarter of 2020 compared with the first quarter of 2020 and the second quarter of 2019, Methanex-produced methanol costs were lower by $30 million and $72 million, respectively. For the six months ended June 30, 2020 compared with the same period in 2019, Methanex-produced methanol costs were lower by $143 million. Changes in Methanex-produced methanol costs for all periods presented are primarily due to the impact of changes in realized methanol prices impacting Methanex revenue and the variable portion of our natural gas cost and changes in the mix of production sold from inventory.
Proportion of Methanex-produced methanol salesThe cost of purchased methanol is directly linked to the selling price for methanol at the time of purchase and the cost of purchased methanol is generally higher than the cost of Methanex-produced methanol. Accordingly, an increase in the proportion of Methanex-produced methanol sales results in a decrease in our overall cost structure for a given period. For the second quarter of 2020 compared with the first quarter of 2020 and the second quarter of 2019, a higher proportion of Methanex-produced methanol sales increased Adjusted EBITDA by $4 million and $25 million, respectively. For the six months ended June 30, 2020 compared with the same period in 2019, a higher proportion of Methanex-produced methanol sales increased Adjusted EBITDA by $23 million.
Purchased methanol costsChanges in purchased methanol costs for all periods presented are primarily a result of changes in methanol pricing and the timing of purchases sold from inventory.
Logistics costsLogistics costs vary from period to period primarily depending on the levels of production from each of our production facilities and the resulting impact on our supply chain and due to variability in bunker fuel costs. Logistics costs in the second quarter of 2020 were lower compared with the first quarter of 2020 and the second quarter of 2019, by $2 million and $13 million, respectively, increasing Adjusted EBITDA. Logistics costs for the six months ended June 30, 2020, compared with the same period in 2019, were $4 million lower, increasing Adjusted EBITDA. The introduction of new low-sulphur regulations in bunker fuels by the International Maritime Organization (IMO 2020) increased bunker fuel prices primarily in January and February, after which bunker fuel prices fell sharply with the decline in oil price, resulting in lower costs for the second quarter compared to the first quarter of 2020. Compared to the three and six month periods ended in 2019, bunker fuel prices are comparable, despite new low-sulphur regulations in place, with logistics benefiting from shorter routes and higher backhaul recoveries.
Egypt insurance recoveryWe experienced an outage at the Egypt plant from April to August 2019. In the fourth quarter of 2019, we recorded a $50 million ($25 million our share) insurance recovery. In the first quarter of 2020, we recorded a further $10 million ($5 million our share) insurance recovery, which represented the full and final settlement of the the claim which was received in the second quarter 2020.
Other, netOther, net relates to unabsorbed fixed costs, selling, general and administrative expenses and other operational items. For the second quarter of 2020 compared with the first quarter of 2020, other costs were higher by $4 million, primarily due to higher unabsorbed fixed costs expensed in the period due to plant outages. The increase in unabsorbed fixed costs were partially offset by lower selling, general and administrative expenses, which were a result of reduced spending and deferral of travel and other business activities in response to COVID-19.
For the second quarter of 2020 compared with the second quarter of 2019, other costs were lower by $9 million, primarily due to lower selling, general, and administrative expenses resulting from reduced spending and deferral of travel and projects in response to COVID-19. For the six months ended June 30, 2020 compared with the same period in 2019, other costs were lower by $16 million, primarily due to $10 million of lower selling, general, and administrative expenses, $4 million lower unabsorbed fixed costs at manufacturing sites, and $2 million lower costs relating to other operational items.
METHANEX CORPORATION 2020 SECOND QUARTER MANAGEMENT’S DISCUSSION AND ANALYSIS PAGE 8

Mark-to-Market Impact of Share-based Compensation We grant share-based awards as an element of compensation. Share-based awards granted include stock options, share appreciation rights, tandem share appreciation rights, deferred share units, restricted share units and performance share units. For all share-based awards, share-based compensation is recognized over the related vesting period for the proportion of the service that has been rendered at each reporting date. Share-based compensation includes an amount related to the grant-date value and a mark-to-market impact as a result of subsequent changes in the fair value of the share-based awards primarily driven by the Company’s share price. The grant-date value amount is included in Adjusted EBITDA and Adjusted net income (loss). The mark-to-market impact of share-based compensation as a result of changes in our share price is excluded from Adjusted EBITDA and Adjusted net income (loss) and analyzed separately.
Three Months Ended Six Months Ended
($ millions except share price)Jun 30
2020Mar 31
2020Jun 302019
Jun 302020
Jun 302019
Methanex Corporation share price 1 $ 18.08 $ 12.17 $ 45.46 $ 18.08 $ 45.46
Grant-date fair value expense included in Adjusted EBITDA and Adjusted net income 6 6 5 12 11
Mark-to-market impact due to change in share price 2 1 (18) (29) (17) (7)
Total share-based compensation expense (recovery), before tax $ 7 $ (12) $ (24) $ (5) $ 4
1 US dollar share price of Methanex Corporation as quoted on the NASDAQ Global Market on the last trading day of the respective period. 2 For all periods presented, the mark-to-market impact on share-based compensation is primarily due to changes in the Methanex Corporation share price.
Depreciation and Amortization
Depreciation and amortization was $92 million for the second quarter of 2020 compared with $90 million for the first quarter of 2020 and $86 million for the second quarter of 2019. Depreciation and amortization for the six months ended June 30, 2020 was $182 million compared with $171 million for the same period in 2019, with the increase primarily due to higher sales of produced methanol and higher vessel lease depreciation.
Finance Costs
Three Months Ended Six Months Ended
($ millions)Jun 30
2020Mar 31
2020Jun 302019
Jun 302020
Jun 302019
Finance costs before capitalized interest $ 45 $ 37 $ 31 $ 83 $ 59
Less capitalized interest (9) (2) (1) (11) (1)
Finance costs $ 36 $ 35 $ 30 $ 72 $ 58
Finance costs are primarily comprised of interest on borrowings and lease obligations. Finance costs before capitalized interest are higher for the second quarter of 2020 compared to the first quarter of 2020 due to a debt modification charge triggered by the amendment of our non-revolving construction facility. Finance costs before capitalized interest are higher for the three and six months ended June 30, 2020 compared to the same periods for 2019 as a result of increased borrowings entered into in the third quarter of 2019 and at the end of the first quarter of 2020, along with the debt modification charge in the second quarter of 2020. Capitalized interest relates to interest costs capitalized for the Geismar 3 project, which in the second quarter of 2020 includes the debt modification charge as it relates specifically to the construction facility. Refer to the Liquidity and Capital Resources section on page 12 of the MD&A.
Finance Income and Other Expenses
Three Months Ended Six Months Ended
($ millions)Jun 30
2020Mar 31
2020Jun 302019
Jun 302020
Jun 302019
Finance income and other expenses $ 2 $ 3 $ 1 $ 5 $ 1
The change in finance income and other expenses for all periods presented is primarily due to the impact of changes in foreign exchange rates and changes in interest income earned on cash balances.
METHANEX CORPORATION 2020 SECOND QUARTER MANAGEMENT’S DISCUSSION AND ANALYSIS PAGE 9

Income Taxes
A summary of our income taxes for the second quarter of 2020 compared to the first quarter of 2020 is as follows:
Three months ended June 30, 2020 Three months ended March 31, 2020
($ millions except where noted) Net LossAdjusted Net Loss Net Income
AdjustedNet Income
Amount before income tax $ (93) $ (91) $ 43 $ 17
Income tax recovery (expense) 31 27 (9) (9)
$ (62) $ (64) $ 34 $ 8
Effective tax rate 34 % 30 % 22 % 54 %
Six months ended June 30, 2020 Six months ended June 30, 2019
($ millions, except where noted) Net LossAdjusted Net Loss Net Income
Adjusted Net Income
Amount before income tax $ (49) $ (74) $ 111 $ 114
Income tax recovery (expense) 21 18 (15) (32)
$ (28) $ (56) $ 96 $ 82
Effective tax rate 43 % 24 % 14 % 28 %
We earn the majority of our income in New Zealand, Trinidad, the United States, Chile, Egypt and Canada. The statutory tax rate in Chile increased in 2020 from 35% to 44.5% as a result of recently enacted tax reform in that country increasing the applicable withholding tax rate on foreign distributions. In Trinidad the statutory tax rate is 35%. The statutory tax rate in New Zealand is 28%. In Canada, the statutory tax rate applicable to Methanex is 25.6%. The Egypt statutory tax rate applicable to Methanex is 27.5% and the United States statutory tax rate applicable to Methanex is 23%. We accrue for taxes that will be incurred upon distributions from its subsidiaries when it is probable that the earnings will be repatriated. As the Atlas entity is accounted for using the equity method, any income taxes related to Atlas are included in earnings of associate and therefore excluded from total income taxes but included in the calculation of Adjusted net income (loss).
The effective tax rate based on Adjusted net loss was 30% for the second quarter of 2020 compared to 54% on Adjusted net income for the first quarter of 2020. The effective tax rate on Adjusted net income was lower in the second quarter of 2020 compared to the first quarter of 2020 primarily due to the impact on the first quarter of the change in the statutory tax rate applicable in Chile. Adjusted net income (loss) represents the amount that is attributable to Methanex shareholders and excludes the mark-to-market impact of share-based compensation and the impact of certain items associated with specific identified events. The effective tax rate differs from period to period depending on the source of earnings and the impact of foreign exchange fluctuations against the United States dollar on our tax balances. In addition, the effective tax rate is impacted by changes in tax legislation in the jurisdictions in which we operate.
METHANEX CORPORATION 2020 SECOND QUARTER MANAGEMENT’S DISCUSSION AND ANALYSIS PAGE 10

SUPPLY/DEMAND FUNDAMENTALS
Demand
We estimate that global methanol demand declined by approximately 5% in the second quarter of 2020 compared to the first quarter, reflecting significant declines in most regions, other than China. We estimate that quarterly global methanol demand declined by approximately 12% in the second quarter of 2020, compared to the fourth quarter of 2019 due to impacts from the COVID-19 pandemic and lower oil price environment.
Methanol demand in China, which represents approximately 60% of global demand, began to recover and increased by approximately 4% in the second quarter of 2020 compared to the first quarter. Demand into traditional chemical applications, such as formaldehyde, improved as the government began to open the economy early in the quarter and manufacturing activity increased. Demand from energy-related applications in China improved as ground transportation and fuel demand into methyl tertiary-butyl ether ("MTBE"), dimethyl-ether ("DME") and other fuel applications increased. Methanol-to-olefin (“MTO”) demand was strong as several plants resumed production and maintained high operating rates following planned and unplanned outages in the first quarter.
Methanol demand outside of China declined by approximately 19% in the second quarter of 2020 compared to the first quarter. Traditional chemical demand declined outside of China due to significantly lower manufacturing activity, particularly in the automotive and construction markets. Demand into energy-related applications, including MTBE, declined as ground transportation and fuel demand were reduced.
Over the long-term, we believe that traditional chemical demand for methanol, which represents over 50% of global methanol demand, is influenced by the strength of global and regional economies and industrial production levels. We believe that demand for energy-related applications will be influenced by energy prices and pricing of end products, along with government regulations and policies that are playing an increasing role in encouraging new applications for methanol due to its emissions benefits as a fuel.
Early in the third quarter, we are beginning to see early signs of improving methanol demand as economic activity begins to recover and oil prices have stabilized in recent weeks. However, we believe the outlook over the next few months remains uncertain as we do not believe it is possible to predict the full extent and duration of COVID-19 and a lower oil price environment.
Supply
Global methanol industry supply declined in the second quarter of 2020 due to various outages and shutdowns around the world.
As we previously announced, we idled our Titan plant in Trinidad (annual capacity of 875 thousand tonnes) effective March 16, 2020 and our Chile IV plant (annual capacity of 840 thousand tonnes) effective April 1, 2020 to respond to lower methanol demand. We have seen other producers in Trinidad, Argentina, the Netherlands, Russia and China reduce operating rates or shut down. We estimate that global methanol supply declined by approximately 9% in the second quarter of 2020 compared to the fourth quarter of 2019.
Over the next few years, the majority of large-scale capacity additions outside of China are expected to be in the Americas and the Middle East. Two plants were expected to be completed in 2020, including a 1.0 million tonne plant in Trinidad that began construction in 2016, being built by Caribbean Gas Chemical Limited, and a 1.7 million tonne plant in Louisiana that began construction in 2017, being built by Koch Methanol Investments and Yuhuang Chemical. However, given current global economic conditions and low methanol price environment, the start-up timing of these plants is uncertain.
There are other large-scale projects under discussion in North America; however, we believe that none have yet reached a final investment decision. We continue to monitor a number of projects at various stages of construction in Iran, including the Bushehr and Kimiya Pars plants, which we understand are running on an intermittent basis.
Methanol Price
Our average realized price in the second quarter of 2020 was $211 per tonne compared to $267 per tonne in the first quarter of 2020. Methanol prices declined in the second quarter due to impacts from COVID-19 and a lower oil price environment.
METHANEX CORPORATION 2020 SECOND QUARTER MANAGEMENT’S DISCUSSION AND ANALYSIS PAGE 11

Our recent posted prices are shown in the following table. We recently announced our August contract prices which remained at $276 per tonne in North America and increased by $30 to $245 per tonne in Asia Pacific. Future methanol prices will ultimately depend on the strength of the global economy, industry operating rates, global energy prices, new supply additions and the strength of global demand.
Methanex Non-Discounted Regional Posted Prices 1
(US$ per tonne)Aug 2020
Jul 2020
Jun 2020
May 2020
Apr 2020
North America 276 276 289 313 359
Europe 2 260 260 285 285 285
Asia Pacific 245 215 215 225 260 1 Discounts from our posted prices are offered to customers based on various factors.2 €235 for Q3 2020 (Q2 2020 – €260) converted to United States
dollars.
LIQUIDITY AND CAPITAL RESOURCES
Cash flows from operating activities in the second quarter of 2020 were $186 million compared with $142 million for the first quarter of 2020 and $117 million for the second quarter of 2019. Cash flows from operating activities were higher in the second quarter of 2020 compared to both the first quarter of 2020 and the second quarter of 2019 primarily as a result of a significant release of non-cash working capital, which more than offset the decrease in Adjusted EBITDA. The release in working capital included the receipt of the $60 million Egypt insurance settlement, coupled with lower receivables and inventory balances corresponding with lower methanol prices and sales levels.
The changes in cash flows from operating activities resulted from changes in the following:
($ millions)
Q2 2020compared with
Q1 2020
Q2 2020compared with
Q2 2019
YTD Q2 2020compared withYTD Q2 2019
Change in Adjusted EBITDA (attributable to Methanex shareholders) $ (106) $ (114) $ (170)
Change in Adjusted EBITDA of associate 6 11 27
Change in dividends received from associate (11) (3) (23)
Cash flows attributable to non-controlling interests (9) 3 8
Non-cash working capital 159 151 95
Income taxes paid 3 13 36
Share-based payments 1 4 27
Other 1 4 (1)
Increase (decrease) in cash flows from operating activities $ 44 $ 69 $ (1)
We operate in a highly competitive commodity industry and believe it is appropriate to maintain a strong balance sheet and financial flexibility. At June 30, 2020, our cash balance was $783 million, including $68 million of cash related to our Egypt entity consolidated on a 100% basis and $14 million of cash related to our joint venture interests in ocean going vessels consolidated on a 100% basis. We invest our cash only in highly rated instruments that have maturities of three months or less to ensure preservation of capital and appropriate liquidity.
In June 2020, we finalized the changes to our revolving credit facility and non-revolving construction facility and secured additional financial flexibility by negotiating meaningful covenant relief. We then repaid $100 million of the $300 million draw we made from our revolving credit facility and drew a further $37 million from our $800 million construction credit facility for the Geismar 3 project. Both facilities are with a syndicate of highly rated financial institutions and expire in July 2024. As at June 30, 2020, management believes the Company was in compliance with all significant terms and default provisions related to long-term debt obligations. Refer to note 6 of the Company's unaudited condensed consolidated interim financial statements for further discussion of the terms of the credit facilities and long-term debt.
On April 29, 2020, we announced the Board of Directors approved the reduction of our quarterly dividend by 90%, representing approximately $100 million in annualized cash savings. During the second quarter of 2020 we paid a quarterly dividend of $0.0375 per common share for a total of $3 million.
METHANEX CORPORATION 2020 SECOND QUARTER MANAGEMENT’S DISCUSSION AND ANALYSIS PAGE 12

The changes to our credit facilities and the prudent decision to reduce the dividend provide us with enhanced financial flexibility and help to preserve liquidity to navigate the current challenging business and commodity price environment. We are focused on cash preservation and continue to evaluate all options to ensure we maintain financial capacity and flexibility to navigate the current environment and emerge stronger over the cycle as conditions improve.
Capital Projects and Growth Opportunities
On April 1, 2020, we announced the deferral of approximately $500 million of the planned capital budget for the Geismar 3 project for up to 18 months, putting the project on temporary care and maintenance in response to the uncertainty in the global economy from the COVID-19 pandemic. We anticipate continuing to invest approximately $130 million over the next 15 months while the project is in temporary care and maintenance. The Geismar 3 project is a 1.8 million tonne methanol plant under construction in Geismar, Louisiana adjacent to our Geismar 1 and Geismar 2 plants. We have invested $312 million at Geismar 3, excluding capitalized interest of $15 million, to date.
In the first quarter of 2020, we revised our planned 2020 maintenance capital budget, including our 63.1% share of Atlas and 50% of Egypt, from $150 million to $120 million, deferring $30 million. We remain focused on maintaining safe and reliable operations and with our revised capital expenditure budget we plan to spend approximately $85 million directed towards maintenance, turnarounds and catalyst changes over the remaining two quarters.
METHANEX CORPORATION 2020 SECOND QUARTER MANAGEMENT’S DISCUSSION AND ANALYSIS PAGE 13

CONTROLS AND PROCEDURES
During the second quarter of 2020, no changes, other than the continued progress below on addressing the material weakness disclosed in our most recent annual financial statements, were made in our internal control over financial reporting that have materially affected, or are reasonably likely to materially affect, our internal control over financial reporting.
Remediation of Material Weakness
A control deficiency was detected in the first quarter of 2020 prior to the filing of the Company's 2019 consolidated financial statements which resulted in the restatement of revenue and cost of sales for methanol from Atlas (our equity investee), correcting the presentation from a net to a gross basis, with no impact on net income, cash flows or financial position. Refer to note 25 of the Company's 2019 consolidated financial statements for additional detail of the restatement.
Due to the magnitude of the presentation change of revenue and cost of sales, the control deficiency was determined to be a material weakness over internal controls over financial reporting, specifically related to research and technical accounting analysis. This material weakness will need to be demonstrated to be remediated in order to relieve the adverse opinion currently in place over the Company’s internal controls over financial reporting. The remediation proposed includes the following:
i. Continue to consult with experts to assist in the evaluation of technical accounting matters.
ii. Extend documentation on analysis of contracts, including revision of management’s accounting checklist used to assess accounting implications for complex contracts.
iii. Implement enhanced review controls prior to and subsequent to adoption of new accounting standards to identify and resolve differences in accounting interpretations of standards and implement an additional layer of review by the Company’s newly hired Assistant Controller, before review by the Company’s VP & Controller and CFO.
Over the course of the second quarter, the Company has applied the remediation approach above to new transactions requiring research and technical accounting analysis, and applied diligence over the monitoring and application of new guidance on the accounting standards. We will continue to progress towards the remediation of the material weakness throughout the remainder of the year.
ADDITIONAL INFORMATION – SUPPLEMENTAL NON-GAAP MEASURES
In addition to providing measures prepared in accordance with IFRS, we present certain supplemental non-GAAP measures throughout this document. These are Adjusted EBITDA, Adjusted net income, Adjusted net income per common share, Adjusted revenue,and operating income. These measures do not have any standardized meaning prescribed by generally accepted accounting principles ("GAAP") and therefore are unlikely to be comparable to similar measures presented by other companies. These supplemental non-GAAP measures are provided to assist readers in determining our ability to generate cash from operations and improve the comparability of our results from one period to another. We believe these measures are useful in assessing operating performance and liquidity of the Company’s ongoing business on an overall basis. We also believe Adjusted EBITDA is frequently used by securities analysts and investors when comparing our results with those of other companies.
Adjusted EBITDA (attributable to Methanex shareholders)
Adjusted EBITDA differs from the most comparable GAAP measure, net income attributable to Methanex shareholders, because it excludes the mark-to-market impact of share-based compensation, depreciation and amortization, finance costs, finance income and other expenses and income taxes. Adjusted EBITDA includes an amount representing our 63.1% share of the Atlas facility and excludes the non-controlling shareholders' interests in entities which we control but do not fully own.
Adjusted EBITDA and Adjusted net income exclude the mark-to-market impact of share-based compensation related to the impact of changes in our share price on SARs, TSARs, deferred share units, restricted share units and performance share units. The mark-to-market impact related to share-based compensation that is excluded from Adjusted EBITDA and Adjusted net income is calculated as the difference between the grant-date value and the fair value recorded at each period-end. As share-based awards will be settled in future periods, the ultimate value of the units is unknown at the date of grant and therefore the grant-date value recognized in Adjusted EBITDA and Adjusted net income may differ from the total settlement cost.
METHANEX CORPORATION 2020 SECOND QUARTER MANAGEMENT’S DISCUSSION AND ANALYSIS PAGE 14
The following table shows a reconciliation from net income attributable to Methanex shareholders to Adjusted EBITDA:
Three Months Ended Six Months Ended
($ millions)Jun 30
2020Mar 31
2020Jun 302019
Jun 302020
Jun 302019
Net income (loss) (attributable to Methanex shareholders) $ (65) $ 23 $ 50 $ (42) $ 89
Mark-to-market impact of share-based compensation 1 (18) (29) (17) (7)
Depreciation and amortization 92 90 86 182 171
Finance costs 36 35 30 72 58
Finance income and other expenses (2) (3) (1) (5) (1)
Income tax expense (31) 9 6 (21) 15
Earnings of associate adjustment 1 10 12 14 20 33
Non-controlling interests adjustment 1 (9) (10) (10) (19) (18)
Adjusted EBITDA (attributable to Methanex shareholders) $ 32 $ 138 $ 146 $ 170 $ 340
1 These adjustments represent depreciation and amortization, finance costs, finance income and other expenses and income taxes associated with our 63.1% interest in the Atlas methanol facility and the non-controlling interests.
Adjusted Net Income (Loss) and Adjusted Net Income (Loss) per Common Share
Adjusted net income (loss) and Adjusted net income (loss) per common share are non-GAAP measures because they exclude the mark-to-market impact of share-based compensation and the impact of certain items associated with specific identified events. The following table shows a reconciliation of net income (loss) attributable to Methanex shareholders to Adjusted net income (loss) and the calculation of Adjusted net income (loss) per common share:
Three Months Ended Six Months Ended
($ millions except number of shares and per share amounts)Jun 30
2020Mar 31
2020Jun 302019
Jun 302020
Jun 302019
Net income (loss) (attributable to Methanex shareholders) $ (65) $ 23 $ 50 $ (42) $ 89
Mark-to-market impact of share-based compensation, net of tax 1 (15) (24) (14) (7)
Adjusted net income (loss) $ (64) $ 8 $ 26 $ (56) $ 82
Diluted weighted average shares outstanding (millions) 76 76 77 76 77
Adjusted net income (loss) per common share $ (0.84) $ 0.10 $ 0.34 $ (0.73) $ 1.07
Adjusted Revenue (attributable to Methanex shareholders)
Adjusted revenue differs from the most comparable GAAP measure, revenue, because it excludes revenue marketed on a commission basis related to 36.9% of the Atlas methanol facility that represents our partner's share, and excludes revenue relating to 50% of the Egypt methanol facility that we do not own. It also includes commission earned on volume marketed on a commission basis related to both the 36.9% of the Atlas methanol facility and the 50% of the Egypt methanol facility that we do not own. A reconciliation from revenue to Adjusted revenue is as follows:
Three Months Ended Six Months Ended
($ millions)Jun 30
2020Mar 31
2020Jun 302019
Jun 302020
Jun 302019
Revenue 1 $ 512 $ 745 $ 848 $ 1,257 $ 1,749
Non-Methanex share of Atlas revenue 2 (30) (33) (42) (63) (95)
Non-controlling interests' share of revenue 2 (29) (37) (28) (66) (75)
Other adjustments — 1 (1) 1 (3)
Adjusted revenue (attributable to Methanex shareholders) $ 453 $ 676 $ 777 $ 1,129 $ 1,576
1 Revenue for the three and six months ended June 30, 2019 have been restated as compared to revenue reported in our quarterly MD&A and condensed quarterly financial statements issued for 2019 based on a restatement for the recognition of revenue on Atlas-produced methanol.
2 Excludes intercompany transactions with the Company.
METHANEX CORPORATION 2020 SECOND QUARTER MANAGEMENT’S DISCUSSION AND ANALYSIS PAGE 15

Operating Income
Operating income is reconciled directly to a GAAP measure in our consolidated statements of income.
QUARTERLY FINANCIAL DATA (UNAUDITED)
Our operations consist of a single operating segment - the production and sale of methanol. Quarterly results vary due to the average realized price of methanol, sales volume and total cash costs. 2020 and 2019 periods presented reflect the adoption of IFRS 16. Financial information for all 2018 comparative periods does not reflect the impact of IFRS 16. A summary of selected financial information is as follows:
Three Months Ended
($ millions except per share amounts)Jun 30
2020Mar 31
2020Dec 31
2019Sep 30
2019
Revenue 1 $ 512 $ 745 $ 769 $ 765
Adjusted EBITDA 32 138 136 90
Net income (loss) (attributable to Methanex shareholders) (65) 23 9 (10)
Adjusted net income (loss) (64) 8 10 (21)
Basic net income (loss) per common share (0.85) 0.30 0.12 (0.13)
Diluted net income (loss) per common share (0.85) 0.21 0.12 (0.21)
Adjusted net income (loss) per common share (0.84) 0.10 0.13 (0.27)
Three Months Ended
($ millions except per share amounts)Jun 30
2019Mar 31
2019Dec 31
2018Sep 30
2018
Revenue 1 $ 848 $ 902 $ 1,101 $ 1,175
Adjusted EBITDA 146 194 197 293
Net income (attributable to Methanex shareholders) 50 38 161 128
Adjusted net income 26 56 90 152
Basic net income per common share 0.65 0.50 2.07 1.62
Diluted net income per common share 0.51 0.50 1.68 1.61
Adjusted net income per common share 0.34 0.73 1.15 1.92
1 Revenue for the 2019 and 2018 quarters have been restated as compared to revenue reported in our quarterly MD&A and condensed quarterly financial statements issued for 2019 and 2018 based on a restatement for the recognition of revenue on Atlas-produced methanol.
METHANEX CORPORATION 2020 SECOND QUARTER MANAGEMENT’S DISCUSSION AND ANALYSIS PAGE 16

HOW WE ANALYZE OUR BUSINESS
Our operations consist of a single operating segment - the production and sale of methanol. We review our financial results by analyzing changes in the components of Adjusted EBITDA, mark-to-market impact of share-based compensation, depreciation and amortization, finance costs, finance income and other expenses and income taxes.
The Company has used the terms Adjusted EBITDA, Adjusted net income, Adjusted net income per common share, Adjusted revenue and operating income throughout this document. These items are non-GAAP measures that do not have any standardized meaning prescribed by GAAP and therefore are unlikely to be comparable to similar measures presented by other companies. Refer to Additional Information - Supplemental Non-GAAP Measures section on page 14 of the MD&A for a description of each non-GAAP measure and reconciliations to the most comparable GAAP measures.
In addition to the methanol that we produce at our facilities, we also purchase and re-sell methanol produced by others and we sell methanol on a commission basis. We analyze the results of all methanol sales together, excluding commission sales volume. The key drivers of changes in Adjusted EBITDA are average realized price, cash costs and sales volume, which are defined and calculated as follows:
PRICE The change in Adjusted EBITDA as a result of changes in average realized price is calculated as the difference from period to period in the selling price of methanol multiplied by the current period total methanol sales volume, excluding commission sales volume, plus the difference from period to period in commission revenue.
CASH COSTS
The change in Adjusted EBITDA as a result of changes in cash costs is calculated as the difference from period to period in cash costs per tonne multiplied by the current period total methanol sales volume, excluding commission sales volume in the current period. The cash costs per tonne is the weighted average of the cash cost per tonne of Methanex-produced methanol and the cash cost per tonne of purchased methanol. The cash cost per tonne of Methanex-produced methanol includes absorbed fixed cash costs per tonne and variable cash costs per tonne. The cash cost per tonne of purchased methanol consists principally of the cost of methanol itself. In addition, the change in Adjusted EBITDA as a result of changes in cash costs includes the changes from period to period in unabsorbed fixed production costs, consolidated selling, general and administrative expenses and fixed storage and handling costs.
SALES VOLUME
The change in Adjusted EBITDA as a result of changes in sales volume is calculated as the difference from period to period in total methanol sales volume, excluding commission sales volume, multiplied by the margin per tonne for the prior period. The margin per tonne for the prior period is the weighted average margin per tonne of Methanex-produced methanol and margin per tonne of purchased methanol. The margin per tonne for Methanex-produced methanol is calculated as the selling price per tonne of methanol less absorbed fixed cash costs per tonne and variable cash costs per tonne. The margin per tonne for purchased methanol is calculated as the selling price per tonne of methanol less the cost of purchased methanol per tonne.
We own 63.1% of the Atlas methanol facility and market the remaining 36.9% of its production through a commission offtake agreement. A contractual agreement between us and our partners establishes joint control over Atlas. As a result, we account for this investment using the equity method of accounting, which results in 63.1% of the net assets and net earnings of Atlas being presented separately in the consolidated statements of financial position and consolidated statements of income, respectively. For purposes of analyzing our business, Adjusted EBITDA, Adjusted net income, Adjusted net income per common share and Adjusted revenue include an amount representing our 63.1% equity share in Atlas. Our analysis of depreciation and amortization, finance costs, finance income and other expenses and income taxes is consistent with the presentation of our consolidated statements of income and excludes amounts related to Atlas.
We own 50% of the 1.26 million tonne per year Egypt methanol facility and market the remaining 50% of its production through a commission offtake agreement. We account for this investment using consolidation accounting, which results in 100% of the revenues and expenses being included in our financial statements. We also consolidate less than wholly-owned entities for which we have a controlling interest. Non-controlling interests are included in the Company’s consolidated financial statements and represent the non-controlling shareholders’ interests in the Egypt methanol facility and any entity where we have control. For purposes of analyzing our business, Adjusted EBITDA, Adjusted net income, Adjusted net income per common share and Adjusted revenue exclude the amounts associated with non-controlling interests.
METHANEX CORPORATION 2020 SECOND QUARTER MANAGEMENT’S DISCUSSION AND ANALYSIS PAGE 17

FORWARD-LOOKING INFORMATION WARNING
This Second Quarter 2020 Management’s Discussion and Analysis ("MD&A") as well as comments made during the Second Quarter 2020 investor conference call contain forward-looking statements with respect to us and our industry. These statements relate to future events or our future performance. All statements other than statements of historical fact are forward-looking statements. Statements that include the words "believes," "expects," "may," "will," "should," "potential," "estimates," "anticipates," "aim," "goal", "targets", "plan," "predict" or other comparable terminology and similar statements of a future or forward-looking nature identify forward-looking statements.
More particularly and without limitation, any statements regarding the following are forward-looking statements:
• expected demand for methanol and its derivatives,
• expected new methanol supply or restart of idled capacity and timing for start-up of the same,
• expected shutdowns (either temporary or permanent) or restarts of existing methanol supply (including our own facilities), including, without limitation, the timing and length of planned maintenance outages,
• expected methanol and energy prices,
• expected levels of methanol purchases from traders or other third parties,
• expected levels, timing and availability of economically priced natural gas supply to each of our plants,
• capital committed by third parties towards future natural gas exploration and development in the vicinity of our plants,
• our expected capital expenditures,
• anticipated operating rates of our plants,
• expected operating costs, including natural gas feedstock costs and logistics costs,
• expected tax rates or resolutions to tax disputes,
• expected cash flows, earnings capability and share price,
• availability of committed credit facilities and other financing,
• our ability to meet covenants associated with our long-term debt obligations, including, without limitation, the Egypt limited recourse debt facilities that have conditions associated with the payment of cash or other distributions,
• our shareholder distribution strategy and anticipated distributions to shareholders,
• commercial viability and timing of, or our ability to execute future projects, plant restarts, capacity expansions, plant relocations or other business initiatives or opportunities, including our Geismar 3 Project,
• our financial strength and ability to meet future financial commitments,
• expected global or regional economic activity (including industrial production levels),
• expected outcomes of litigation or other disputes, claims and assessments,
• expected actions of governments, governmental agencies, gas suppliers, courts, tribunals or other third parties, and
• the potential future impact of the COVID-19 pandemic.
We believe that we have a reasonable basis for making such forward-looking statements. The forward-looking statements in this document are based on our experience, our perception of trends, current conditions and expected future developments as well as other factors. Certain material factors or assumptions were applied in drawing the conclusions or making the forecasts or projections that are included in these forward-looking statements, including, without limitation, future expectations and assumptions concerning the following:
• the supply of, demand for and price of methanol, methanol derivatives, natural gas, coal, oil and oil derivatives,
• our ability to procure natural gas feedstock on commercially acceptable terms,
• operating rates of our facilities, • receipt or issuance of third-party consents or approvals or
governmental approvals related to rights to purchase natural gas,
• the establishment of new fuel standards,
• operating costs, including natural gas feedstock and logistics costs, capital costs, tax rates, cash flows, foreign exchange rates and interest rates,
• the availability of committed credit facilities and other financing,
• timing of completion and cost of our Geismar 3 Project,
METHANEX CORPORATION 2020 SECOND QUARTER MANAGEMENT’S DISCUSSION AND ANALYSIS PAGE 18

• global and regional economic activity (including industrial production levels),
• absence of a material negative impact from major natural disasters,
• absence of a material negative impact from changes in laws or regulations,
• absence of a material negative impact from political instability in the countries in which we operate, and
• enforcement of contractual arrangements and ability to perform contractual obligations by customers, natural gas and other suppliers and other third parties.
However, forward-looking statements, by their nature, involve risks and uncertainties that could cause actual results to differ materially from those contemplated by the forward-looking statements. The risks and uncertainties primarily include those attendant with producing and marketing methanol and successfully carrying out major capital expenditure projects in various jurisdictions, including, without limitation:
• conditions in the methanol and other industries including fluctuations in the supply, demand and price for methanol and its derivatives, including demand for methanol for energy uses,
• the price of natural gas, coal, oil and oil derivatives,
• our ability to obtain natural gas feedstock on commercially acceptable terms to underpin current operations and future production growth opportunities,
• the ability to carry out corporate initiatives and strategies,
• actions of competitors, suppliers and financial institutions,
• conditions within the natural gas delivery systems that may prevent delivery of our natural gas supply requirements,
• our ability to meet timeline and budget targets for our Geismar 3 Project, including cost pressures arising from labour costs,
• competing demand for natural gas, especially with respect to any domestic needs for gas and electricity,
• actions of governments and governmental authorities, including, without limitation, implementation of policies or other measures that could impact the supply of or demand for methanol or its derivatives,
• changes in laws or regulations,
• import or export restrictions, anti-dumping measures, increases in duties, taxes and government royalties and other actions by governments that may adversely affect our operations or existing contractual arrangements,
• world-wide economic conditions,
• the future impact of the COVID-19 pandemic, and
• other risks described in our 2019 Annual Management’s Discussion and Analysis and this Second Quarter 2020 Management’s Discussion and Analysis.
Having in mind these and other factors, investors and other readers are cautioned not to place undue reliance on forward-looking statements. They are not a substitute for the exercise of one’s own due diligence and judgment. The outcomes implied by forward-looking statements may not occur and we do not undertake to update forward-looking statements except as required by applicable securities laws.
METHANEX CORPORATION 2020 SECOND QUARTER MANAGEMENT’S DISCUSSION AND ANALYSIS PAGE 19

Methanex CorporationConsolidated Statements of Income (Loss) (unaudited) (thousands of U.S. dollars, except number of common shares and per share amounts)
Three Months Ended Six Months Ended
Jun 302020
Jun 302019
Jun 302020
Jun 302019
(As restated - Note 12)
(As restated - Note 12)
Revenue $ 512,290 $ 847,751 $ 1,257,383 $ 1,749,360
Cost of sales and operating expenses (484,281) (689,688) (1,082,822) (1,439,858)
Depreciation and amortization (91,542) (85,637) (181,529) (170,956)
Egypt insurance recovery (note 11) — — 9,839 —
Operating income (loss) (63,533) 72,426 2,871 138,546
Earnings of associate (note 4) 5,145 11,109 14,215 29,163
Finance costs (note 5) (36,484) (29,579) (71,516) (57,999)
Finance income and other expenses 2,234 1,399 5,077 1,317
Income (loss) before income taxes (92,638) 55,355 (49,353) 111,027
Income tax (expense) recovery:
Current 1,503 (9,938) (9,873) (30,401)
Deferred 29,566 3,971 31,336 15,113
31,069 (5,967) 21,463 (15,288)
Net income (loss) $ (61,569) $ 49,388 $ (27,890) $ 95,739
Attributable to:
Methanex Corporation shareholders $ (64,752) $ 50,235 $ (41,982) $ 88,699
Non-controlling interests 3,183 (847) 14,092 7,040
$ (61,569) $ 49,388 $ (27,890) $ 95,739
Income per common share for the period attributable to Methanex Corporation shareholders
Basic net income (loss) per common share $ (0.85) $ 0.65 $ (0.55) $ 1.15
Diluted net income (loss) per common share (note 7) $ (0.85) $ 0.51 $ (0.63) $ 1.09
Weighted average number of common shares outstanding (note 7) 76,196,080 76,746,080 76,196,080 76,997,554
Diluted weighted average number of common shares outstanding (note 7) 76,196,080 76,883,889 76,196,080 77,183,984
See accompanying notes to condensed consolidated interim financial statements.
METHANEX CORPORATION 2020 SECOND QUARTER
CONDENSED CONSOLIDATED INTERIM FINANCIAL STATEMENTS (UNAUDITED) PAGE 1

Methanex CorporationConsolidated Statements of Comprehensive Income (Loss) (unaudited)(thousands of U.S. dollars)
Three Months Ended Six Months Ended
Jun 302020
Jun 302019
Jun 302020
Jun 302019
Net income (loss) $ (61,569) $ 49,388 $ (27,890) $ 95,739
Other comprehensive income (loss):
Items that may be reclassified to income:
Change in fair value of cash flow hedges (note 10) (30,798) (41,973) (76,556) (82,130)
Forward element excluded from hedging relationships (note 10) 5,719 23,017 93,529 67,570
Taxes on above items 5,733 4,409 (4,016) 3,308
(19,346) (14,547) 12,957 (11,252)
Comprehensive income (loss) $ (80,915) $ 34,841 $ (14,933) $ 84,487
Attributable to:
Methanex Corporation shareholders $ (84,098) $ 35,688 $ (29,025) $ 77,447
Non-controlling interests 3,183 (847) 14,092 7,040
$ (80,915) $ 34,841 $ (14,933) $ 84,487
See accompanying notes to condensed consolidated interim financial statements.
METHANEX CORPORATION 2020 SECOND QUARTER
CONDENSED CONSOLIDATED INTERIM FINANCIAL STATEMENTS (UNAUDITED) PAGE 2

Methanex CorporationConsolidated Statements of Financial Position (unaudited)(thousands of U.S. dollars)
AS ATJun 30
2020Dec 31
2019
ASSETS
Current assets:
Cash and cash equivalents $ 782,728 $ 416,763
Trade and other receivables 303,863 488,721
Inventories (note 2) 275,834 281,052
Prepaid expenses 29,030 37,805
Other assets 5,629 8,180
1,397,084 1,232,521
Non-current assets:
Property, plant and equipment (note 3) 3,695,247 3,576,195
Investment in associate (note 4) 186,866 193,474
Deferred income tax assets 121,201 111,614
Other assets 93,269 82,811
4,096,583 3,964,094
$ 5,493,667 $ 5,196,615
LIABILITIES AND EQUITY
Current liabilities:
Trade, other payables and accrued liabilities $ 503,711 $ 493,754
Current maturities on long-term debt (note 6) 39,163 38,420
Current maturities on lease obligations 95,986 89,820
Current maturities on other long-term liabilities 20,646 26,252
659,506 648,246
Non-current liabilities:
Long-term debt (note 6) 2,088,862 1,730,433
Lease obligations 649,343 628,685
Other long-term liabilities 262,590 286,071
Deferred income tax liabilities 254,967 272,820
3,255,762 2,918,009
Equity:
Capital stock 440,472 440,472
Contributed surplus 1,857 1,783
Retained earnings 967,549 1,039,819
Accumulated other comprehensive loss (137,432) (150,389)
Shareholders' equity 1,272,446 1,331,685
Non-controlling interests 305,953 298,675
Total equity 1,578,399 1,630,360
$ 5,493,667 $ 5,196,615
See accompanying notes to condensed consolidated interim financial statements.
METHANEX CORPORATION 2020 SECOND QUARTER
CONDENSED CONSOLIDATED INTERIM FINANCIAL STATEMENTS (UNAUDITED) PAGE 3

Methanex CorporationConsolidated Statements of Changes in Equity (unaudited) (thousands of U.S. dollars, except number of common shares)
Number of Common
SharesCapital
StockContributed
SurplusRetained Earnings
Accumulated Other
Comprehensive Loss
Shareholders' Equity
Non-Controlling
InterestsTotal Equity
Balance, December 31, 2018 77,263,273 $446,544 $1,597 $1,145,476 $(82,404) $1,511,213 $296,628 $1,807,841
Net income — — — 88,699 — 88,699 7,040 95,739
Other comprehensive loss — — — (1,541) (9,711) (11,252) — (11,252)
Compensation expense recorded for stock options — — 117 — — 117 — 117
Issue of shares on exercise of stock options 2,700 86 — — — 86 — 86 Reclassification of grant date fair value on exercise of stock
options — 26 (26) — — — — —
Payments for repurchase of shares (1,069,893) (6,184) — (46,621) — (52,805) — (52,805)
Dividend payments to Methanex Corporation shareholders — — — (53,015) — (53,015) — (53,015)
Distributions made and accrued to non-controlling interests — — — — — — (9,995) (9,995)
Impact of adoption of IFRS 16 — — — (34,513) — (34,513) (3,355) (37,868)
Balance, June 30, 2019 76,196,080 $440,472 $1,688 $1,098,485 $(92,115) $1,448,530 $290,318 $1,738,848
Net income (loss) — — — (932) — (932) 21,559 20,627
Other comprehensive loss — — — (2,873) (58,274) (61,147) — (61,147)
Compensation expense recorded for stock options — — 95 — — 95 — 95
Dividend payments to Methanex Corporation shareholders — — — (54,861) — (54,861) — (54,861)
Distributions made and accrued to non-controlling interests — — — — — — (10,983) (10,983)
Acquisition of non-controlling interest — — — — — — (2,219) (2,219)
Balance, December 31, 2019 76,196,080 $440,472 $1,783 $1,039,819 $(150,389) $1,331,685 $298,675 $1,630,360
Net income (loss) — — — (41,982) — (41,982) 14,092 (27,890)
Other comprehensive income — — — — 12,957 12,957 — 12,957
Compensation expense recorded for stock options — — 74 — — 74 — 74
Dividend payments to Methanex Corporation shareholders — — — (30,288) — (30,288) — (30,288)
Distributions made and accrued to non-controlling interests — — — — — — (12,314) (12,314)
Equity contributions by non-controlling interest — — — — — — 5,500 5,500
Balance, June 30, 2020 76,196,080 $440,472 $1,857 $967,549 $(137,432) $1,272,446 $305,953 $1,578,399
See accompanying notes to condensed consolidated interim financial statements.
METHANEX CORPORATION 2020 SECOND QUARTER
CONDENSED CONSOLIDATED INTERIM FINANCIAL STATEMENTS (UNAUDITED) PAGE 4

Methanex CorporationConsolidated Statements of Cash Flows (unaudited)(thousands of U.S. dollars)
Three Months Ended Six Months Ended
Jun 302020
Jun 302019
Jun 302020
Jun 302019
CASH FLOWS FROM / (USED IN) OPERATING ACTIVITIES
Net income (loss) $ (61,569) $ 49,388 $ (27,890) $ 95,739
Deduct earnings of associate (5,145) (11,109) (14,215) (29,163)
Dividends received from associate 5,048 7,572 20,823 43,539
Add (deduct) non-cash items:
Depreciation and amortization 91,542 85,637 181,529 170,956
Income tax expense (recovery) (31,069) 5,967 (21,463) 15,288
Share-based compensation expense (recovery) 6,817 (23,942) (4,853) 3,860
Finance costs 36,484 29,579 71,516 57,999
Other (1,598) 1,278 (5,544) 1,792
Income taxes paid (749) (13,515) (4,308) (39,638)
Other cash payments, including share-based compensation (778) (10,028) (2,553) (31,133)
Cash flows from operating activities before undernoted 38,983 120,827 193,042 289,239
Changes in non-cash working capital (note 9) 147,493 (4,080) 135,899 40,745
186,476 116,747 328,941 329,984
CASH FLOWS FROM / (USED IN) FINANCING ACTIVITIES
Payments for repurchase of shares — (47,049) — (52,805)
Dividend payments to Methanex Corporation shareholders (2,857) (27,517) (30,288) (53,015)
Interest paid (50,976) (35,789) (72,967) (54,041)
Net proceeds on issue of long-term debt (note 6) 37,000 — 473,000 —
Repayment of long-term debt and financing fees (104,929) (1,531) (122,804) (16,668)
Repayment of lease obligation (25,672) (21,392) (54,077) (46,326)
Restricted cash for debt service accounts (2,187) — (2,276) (100)
Equity contributions by non-controlling interests — — 5,500 —
Distributions to non-controlling interests (20,310) (320) (25,517) (21,620)
Proceeds on issue of shares on exercise of stock options — — — 86
Changes in non-cash working capital related to financing activities (note 9) — 1,780 — 1,780
(169,931) (131,818) 170,571 (242,709)
CASH FLOWS FROM / (USED IN) INVESTING ACTIVITIES
Property, plant and equipment (15,343) (46,723) (45,152) (135,370)
Geismar plant under construction (69,705) (19,685) (159,542) (19,685)
Proceeds from sale of assets — — 5,189 —
Restricted cash for capital projects 1,895 33,440 2,197 36,527
Changes in non-cash working capital related to investing activities (note 9) 25,904 (9,100) 63,761 3,145
(57,249) (42,068) (133,547) (115,383)
(Decrease) increase in cash and cash equivalents (40,704) (57,139) 365,965 (28,108)
Cash and cash equivalents, beginning of period 823,432 285,108 416,763 256,077
Cash and cash equivalents, end of period $ 782,728 $ 227,969 $ 782,728 $ 227,969
See accompanying notes to condensed consolidated interim financial statements.
METHANEX CORPORATION 2020 SECOND QUARTER
CONDENSED CONSOLIDATED INTERIM FINANCIAL STATEMENTS (UNAUDITED) PAGE 5

Methanex CorporationNotes to Condensed Consolidated Interim Financial Statements (unaudited)Except where otherwise noted, tabular dollar amounts are stated in thousands of U.S. dollars.
1. Basis of presentation:
Methanex Corporation ("the Company") is an incorporated entity with corporate offices in Vancouver, Canada. The Company’s operations consist of the production and sale of methanol, a commodity chemical. The Company is the world’s largest producer and supplier of methanol to the major international markets of Asia Pacific, North America, Europe and South America.
These condensed consolidated interim financial statements are prepared in accordance with International Accounting Standards ("IAS") 34, Interim Financial Reporting, as issued by the International Accounting Standards Board ("IASB") on a basis consistent with those followed in the most recent annual consolidated financial statements.
These condensed consolidated interim financial statements do not include all of the information required for full annual financial statements and were approved and authorized for issue by the Audit, Finance & Risk Committee of the Board of Directors on July 29, 2020.
These condensed consolidated interim financial statements should be read in conjunction with the Company’s consolidated financial statements for the year ended December 31, 2019.
2. Inventories:
Inventories are valued at the lower of cost, determined on a first-in first-out basis, and estimated net realizable value. The amount of inventories recognized as an expense in cost of sales and operating expenses and depreciation and amortization for the three and six month periods ended June 30, 2020 is $468 million (2019 — $618 million (as restated - see note 12)) and $1,075 million (2019 — $1,287 million (as restated - see note 12)).
3. Property, plant and equipment:
Owned Assets (a)
Right-of-use assets (b) Total
Net book value at June 30, 2020 $ 3,039,046 $ 656,201 $ 3,695,247
Net book value at December 31, 2019 $ 2,940,777 $ 635,418 $ 3,576,195
a) Owned assets:
Buildings, PlantInstallations &
MachineryPlants Under
Construction 1Ocean Going
Vessels Other Total
Cost at June 30, 2020 $ 4,821,681 $ 326,237 $ 193,576 $ 159,680 $ 5,501,174
Accumulated depreciation at June 30, 2020 2,322,009 — 20,268 119,851 2,462,128
Net book value at June 30, 2020 $ 2,499,672 $ 326,237 $ 173,308 $ 39,829 $ 3,039,046
Cost at December 31, 2019 $ 4,787,515 $ 155,871 $ 201,947 $ 154,468 $ 5,299,801
Accumulated depreciation at December 31, 2019 2,215,060 — 25,448 118,516 2,359,024
Net book value at December 31, 2019 $ 2,572,455 $ 155,871 $ 176,499 $ 35,952 $ 2,940,777
1 The Company is constructing a 1.8 million tonne methanol plant in Geismar, Louisiana adjacent to its Geismar 1 and Geismar 2 facilities. Included in Plants Under Construction is total cost incurred to date of $312 million, excluding $15 million of capitalized interest.
METHANEX CORPORATION 2020 SECOND QUARTER NOTES TO CONDENSED CONSOLIDATED INTERIM FINANCIAL STATEMENTS (UNAUDITED) PAGE 1

b) Right-of-use assets:
Ocean Going Vessels
Terminals and Tanks
Plant Installations and
Machinery Other Total
Cost at June 30, 2020 $ 564,410 $ 238,139 $ 23,660 $ 39,752 $ 865,961
Accumulated depreciation at June 30, 2020 115,841 75,545 9,135 9,239 209,760
Net book value at June 30, 2020 $ 448,569 $ 162,594 $ 14,525 $ 30,513 $ 656,201
Cost at December 31, 2019 $ 514,661 $ 221,303 $ 23,613 $ 38,520 $ 798,097
Accumulated depreciation at December 31, 2019 89,643 59,240 7,867 5,929 162,679
Net book value at December 31, 2019 $ 425,018 $ 162,063 $ 15,746 $ 32,591 $ 635,418
4. Interest in Atlas joint venture:
a) The Company has a 63.1% equity interest in Atlas Methanol Company Unlimited ("Atlas"). Atlas owns a 1.8 million tonne per year methanol production facility in Trinidad. The Company accounts for its interest in Atlas using the equity method. Summarized financial information of Atlas (100% basis) is as follows:
Statements of financial positionJun 30
2020Dec 31
2019
Cash and cash equivalents $ 54,344 $ 50,149
Other current assets 50,585 60,709
Non-current assets 240,742 241,860
Current liabilities (36,807) (28,191)
Other long-term liabilities, including current maturities (133,675) (138,866)
Net assets at 100% $ 175,189 $ 185,661
Net assets at 63.1% $ 110,544 $ 117,152
Long-term receivable from Atlas 76,322 76,322
Investment in associate $ 186,866 $ 193,474
Three Months Ended Six Months Ended
Statements of incomeJun 30
2020Jun 302019
Jun 302020
Jun 302019
Revenue $ 52,840 $ 93,762 $ 132,732 $ 196,329
Cost of sales and depreciation and amortization (38,104) (63,254) (92,645) (118,331)
Operating income 14,736 30,508 40,087 77,998
Finance costs, finance income and other expenses (2,538) (3,232) (5,236) (5,778)
Income tax expense (4,044) (9,671) (12,323) (26,003)
Net earnings at 100% $ 8,154 $ 17,605 $ 22,528 $ 46,217
Earnings of associate at 63.1% $ 5,145 $ 11,109 $ 14,215 $ 29,163
Dividends received from associate $ 5,048 $ 7,572 $ 20,823 $ 43,539
METHANEX CORPORATION 2020 SECOND QUARTER NOTES TO CONDENSED CONSOLIDATED INTERIM FINANCIAL STATEMENTS (UNAUDITED) PAGE 2
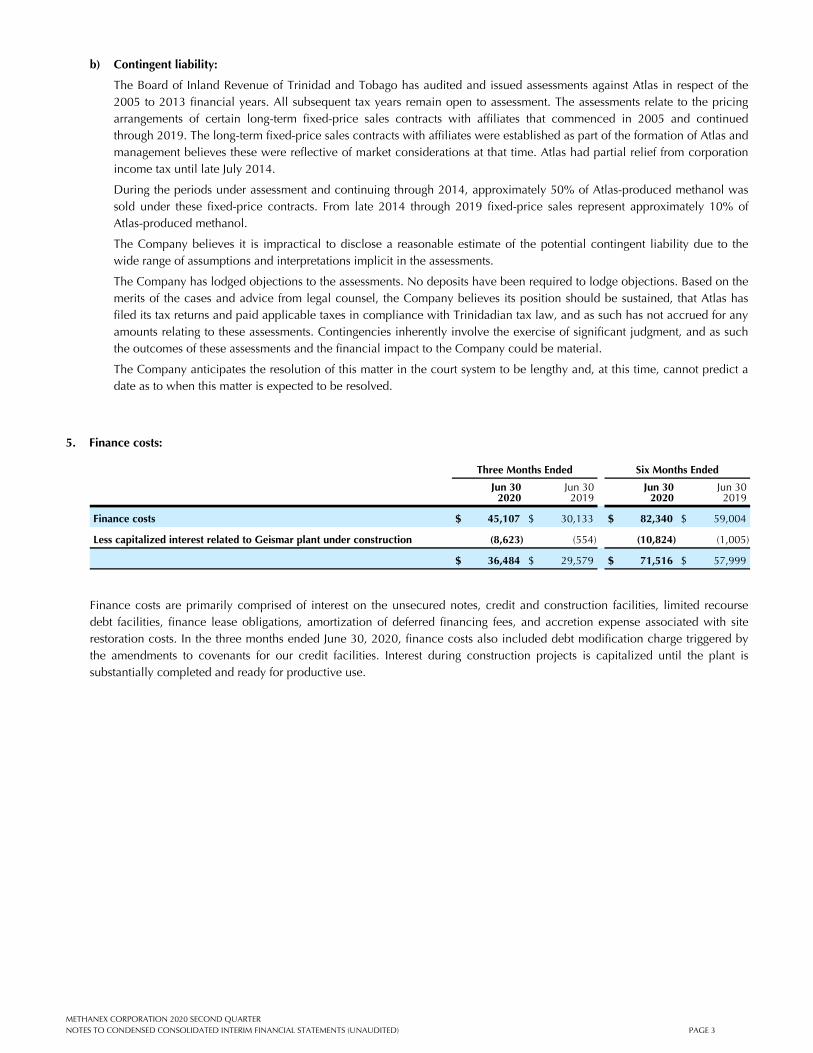
b) Contingent liability:
The Board of Inland Revenue of Trinidad and Tobago has audited and issued assessments against Atlas in respect of the 2005 to 2013 financial years. All subsequent tax years remain open to assessment. The assessments relate to the pricing arrangements of certain long-term fixed-price sales contracts with affiliates that commenced in 2005 and continued through 2019. The long-term fixed-price sales contracts with affiliates were established as part of the formation of Atlas and management believes these were reflective of market considerations at that time. Atlas had partial relief from corporation income tax until late July 2014.
During the periods under assessment and continuing through 2014, approximately 50% of Atlas-produced methanol was sold under these fixed-price contracts. From late 2014 through 2019 fixed-price sales represent approximately 10% of Atlas-produced methanol.
The Company believes it is impractical to disclose a reasonable estimate of the potential contingent liability due to the wide range of assumptions and interpretations implicit in the assessments.
The Company has lodged objections to the assessments. No deposits have been required to lodge objections. Based on the merits of the cases and advice from legal counsel, the Company believes its position should be sustained, that Atlas has filed its tax returns and paid applicable taxes in compliance with Trinidadian tax law, and as such has not accrued for any amounts relating to these assessments. Contingencies inherently involve the exercise of significant judgment, and as such the outcomes of these assessments and the financial impact to the Company could be material.
The Company anticipates the resolution of this matter in the court system to be lengthy and, at this time, cannot predict a date as to when this matter is expected to be resolved.
5. Finance costs:
Three Months Ended Six Months Ended
Jun 302020
Jun 302019
Jun 302020
Jun 302019
Finance costs $ 45,107 $ 30,133 $ 82,340 $ 59,004
Less capitalized interest related to Geismar plant under construction (8,623) (554) (10,824) (1,005)
$ 36,484 $ 29,579 $ 71,516 $ 57,999
Finance costs are primarily comprised of interest on the unsecured notes, credit and construction facilities, limited recourse debt facilities, finance lease obligations, amortization of deferred financing fees, and accretion expense associated with site restoration costs. In the three months ended June 30, 2020, finance costs also included debt modification charge triggered by the amendments to covenants for our credit facilities. Interest during construction projects is capitalized until the plant is substantially completed and ready for productive use.
METHANEX CORPORATION 2020 SECOND QUARTER NOTES TO CONDENSED CONSOLIDATED INTERIM FINANCIAL STATEMENTS (UNAUDITED) PAGE 3

6. Long-term debt:
As atJun 30
2020Dec 31
2019
Unsecured notes
$250 million at 5.25% due March 1, 2022 $ 249,137 $ 248,912
$300 million at 4.25% due December 1, 2024 297,801 297,607
$700 million at 5.25% due December 15, 2029 694,051 693,822
$300 million at 5.65% due December 1, 2044 295,365 295,321
1,536,354 1,535,662
Revolving credit facility at LIBOR+3% 200,000 —
Geismar 3 construction facility at LIBOR+3% 177,018 —
Other limited recourse debt facilities
LIBOR+2.5% due through 2021 915 1,526
5.58% due through June 30, 2031 71,793 73,700
5.35% due through September 30, 2033 80,613 82,800
Egypt limited recourse debt facilities 61,332 75,165
Total long-term debt 1 2,128,025 1,768,853
Less current maturities 1 (39,163) (38,420)
$ 2,088,862 $ 1,730,433 1 Long-term debt and current maturities are presented net of deferred financing fees.
Significant covenants and default provisions of the credit facilities include:
a) the obligation to maintain an EBITDA to interest coverage ratio of greater than or equal to 2:1 calculated on a four-quarter trailing basis, where for only one quarter during the term of the credit facility the ratio can be as low as, but not less than 1.25:1, and a debt to capitalization ratio of less than or equal to 57.5%, both calculated in accordance with definitions in the credit agreement that include adjustment to limited recourse subsidiaries,
b) a default if payment is accelerated by a creditor on any indebtedness of $50 million or more of the Company and its subsidiaries, except for the limited recourse subsidiaries, and
c) a default if a default occurs that permits a creditor to demand repayment on any other indebtedness of $50 million or more of the Company and its subsidiaries, except for the limited recourse subsidiaries.
The credit facilities also include other customary covenants including restrictions on the incurrence of additional indebtedness, restrictions against the sale or abandonment of the Geismar 3 project, as well as requirements associated with completion of plant construction and commissioning.
On June 3, 2020, the Company amended the terms of the committed revolving credit facility and the non-revolving construction facility for the Geismar 3 project modifying and waiving certain covenants. As part of the amendment, the debt to capitalization ratio has been increased to 60% for all the measurement periods starting on June 30, 2020 and ending on June 30, 2023. Additionally, the minimum EBITDA to interest coverage ratio threshold has been lowered or waived for each of the measurement periods starting June 30, 2020 and ending on June 30, 2021 as detailed in the table below:
Four quarters endedMinimum interest
coverage ratio Minimum EBITDA 1
Q2 2020 1.50x not applicable
Q3 2020 not applicable $70 million 2
Q4 2020 not applicable $25 million 2
Q1 2021 not applicable $30 million 2
Q2 2021 1.00x not applicable
1 EBITDA is defined under the terms of the credit facilities. 2 The minimum EBITDA provision may be fully waived for any two of these three periods.
METHANEX CORPORATION 2020 SECOND QUARTER NOTES TO CONDENSED CONSOLIDATED INTERIM FINANCIAL STATEMENTS (UNAUDITED) PAGE 4

During the quarter ended June 30, 2020, the Company made repayments of $2.4 million on its other limited recourse debt facilities. Other limited recourse debt facilities relate to financing for certain of our ocean going vessels which we own through less than wholly-owned entities under the Company's control.
The limited recourse debt facilities are described as limited recourse as they are secured only by the assets of the entity that carries the debt. Accordingly, the lenders to the limited recourse debt facilities have no recourse to the Company or its other subsidiaries.
The Egypt limited recourse debt facilities have covenants and default provisions that apply only to the Egypt entity, including restrictions on the incurrence of additional indebtedness and a requirement to fulfill certain conditions before the payment of cash or other shareholder distributions.
Failure to comply with any of the covenants or default provisions of the long-term debt facilities described above could result in a default under the applicable credit agreement that would allow the lenders to not fund future loan requests, accelerate the due date of the principal and accrued interest on any outstanding loans, or restrict the payment of cash or other distributions.
As at June 30, 2020, management believes the Company was in compliance with all significant terms and default provisions related to long-term debt obligations.
7. Net income (loss) per common share:
Diluted net income (loss) per common share is calculated by considering the potential dilution that would occur if outstanding stock options and, under certain circumstances, tandem share appreciation rights ("TSARs") were exercised or converted to common shares.
Outstanding TSARs may be settled in cash or common shares at the holder’s option and for purposes of calculating diluted net income (loss) per common share, the more dilutive of the cash-settled and equity-settled method is used, regardless of how the plan is accounted for. Accordingly, TSARs that are accounted for using the cash-settled method will require adjustments to the numerator and denominator if the equity-settled method is determined to have a dilutive effect on diluted net income per common share as compared to the cash-settled method. The cash-settled method was more dilutive for the three months ended June 30, 2020, and no adjustment was required for both the numerator and denominator. The equity-settled method was more dilutive for the six months ended June 30, 2020, and an adjustment was required for the numerator. No adjustment was required for the denominator as the weighted average share price at June 30, 2020 was lower than the exercise price for all outstanding TSARs. The equity-settled method was more dilutive for the three and six month periods ended June 30, 2019, and an adjustment was required for both the numerator and the denominator.
Stock options and, if calculated using the equity-settled method, TSARs are considered dilutive when the average market price of the Company’s common shares during the period disclosed exceeds the exercise price of the stock option or TSAR. For the three and six month periods ended June 30, 2020 stock options were not dilutive, resulting in no adjustment to the denominator. For the three and six month periods ended June 30, 2019, stock options were considered dilutive, resulting in an adjustment to the denominator.
A reconciliation of the numerator used for the purposes of calculating diluted net income per common share is as follows:
Three Months Ended Six Months Ended
Jun 302020
Jun 302019
Jun 302020
Jun 302019
Numerator for basic net income (loss) per common share $ (64,752) $ 50,235 $ (41,982) $ 88,699
Adjustment for the effect of TSARs:
Cash-settled recovery included in net income (loss) — (9,207) (2,445) (1,083)
Equity-settled expense — (1,873) (3,956) (3,838)
Numerator for basic and diluted net income (loss) per common share $ (64,752) $ 39,155 $ (48,383) $ 83,778
METHANEX CORPORATION 2020 SECOND QUARTER NOTES TO CONDENSED CONSOLIDATED INTERIM FINANCIAL STATEMENTS (UNAUDITED) PAGE 5

A reconciliation of the denominator used for the purposes of calculating diluted net income (loss) per common share is as follows:
Three Months Ended Six Months Ended
Jun 302020
Jun 302019
Jun 302020
Jun 302019
Denominator for basic net income (loss) per common share 76,196,080 76,746,080 76,196,080 76,997,554
Effect of dilutive stock options — 24,127 — 44,881
Effect of dilutive TSARs — 113,682 — 141,549
Denominator for diluted net income (loss) per common share 76,196,080 76,883,889 76,196,080 77,183,984
8. Share-based compensation:
a. Share appreciation rights ("SARs"), TSARs and stock options:
(i) Outstanding units:
Information regarding units outstanding at June 30, 2020 is as follows:
SARs TSARs
(per share amounts in USD) Number of UnitsWeighted Average
Exercise Price Number of UnitsWeighted Average
Exercise Price
Outstanding at December 31, 2019 857,407 $ 52.02 1,661,327 $ 52.55
Granted 96,160 29.27 761,050 29.27
Cancelled (23,694) 56.73 — —
Expired (60,500) 38.24 (74,020) 38.24
Outstanding at March 31, 2020 869,373 $ 50.33 2,348,357 $ 45.46
Cancelled (4,366) 56.47 (4,200) 60.66
Outstanding at June 30, 2020 865,007 $ 50.30 2,344,157 $ 45.43
Stock Options
(per share amounts in USD) Number of UnitsWeighted Average
Exercise Price
Outstanding at December 31, 2019 200,631 $ 49.07
Granted 15,440 29.27
Expired (31,320) 38.24
Outstanding at March 31, 2020 184,751 $ 49.25
Exercised/Cancelled — —
Outstanding at June 30, 2020 184,751 $ 49.25
METHANEX CORPORATION 2020 SECOND QUARTER NOTES TO CONDENSED CONSOLIDATED INTERIM FINANCIAL STATEMENTS (UNAUDITED) PAGE 6

Units Outstanding at June 30, 2020 Units Exercisable at June 30, 2020
Range of Exercise Prices(per share amounts in USD)
Weighted Average Remaining
Contractual Life (Years)
Numberof Units
Outstanding
Weighted Average
Exercise PriceNumber of Units
Exercisable
WeightedAverage
Exercise Price
SARs:
$29.27 to $35.51 4.04 280,706 $ 32.77 184,546 $ 34.59
$45.40 to $50.17 3.67 125,784 50.15 125,784 50.15
$54.65 to $78.59 2.40 458,517 61.08 399,182 61.83
3.12 865,007 $ 50.30 709,512 $ 52.67
TSARs:
$29.27 to $35.51 5.52 1,069,887 $ 30.81 308,837 $ 34.59
$45.40 to $50.17 3.84 311,851 49.84 290,031 50.17
$54.65 to $78.59 3.56 962,419 60.26 671,474 61.66
4.49 2,344,157 $ 45.43 1,270,342 $ 52.45
Stock options:
$29.27 to $35.51 3.57 69,207 $ 33.40 53,767 $ 34.59
$45.40 to $50.17 3.67 25,234 50.17 25,234 50.17
$54.65 to $78.59 2.38 90,310 61.14 78,436 61.94
3.00 184,751 $ 49.25 157,437 $ 50.71
(ii) Compensation expense related to SARs and TSARs:
Compensation expense for SARs and TSARs is measured based on their fair value and is recognized over the vesting period. Changes in fair value each period are recognized in net income for the proportion of the service that has been rendered at each reporting date. The fair value at June 30, 2020 was $4.2 million compared with the recorded liability of $3.7 million. The difference between the fair value and the recorded liability is $0.5 million and will be recognized over the weighted average remaining vesting period of approximately 1.8 years. The weighted average fair value was estimated at June 30, 2020 using the Black-Scholes option pricing model.
For the three and six month periods ended June 30, 2020, compensation expense related to SARs and TSARs included an expense in cost of sales and operating expenses of $3.5 million (2019 - a recovery of $14.9 million) and a recovery of $3.6 million (2019 - a recovery of $2.0 million), respectively. This included an expense of $1.2 million (2019 - a recovery of $16.8 million) and a recovery of $8.0 million (2019 - a recovery of $6.0 million), respectively, related to the effect of the change in the Company’s share price for the three and six month periods ended June 30, 2020.
METHANEX CORPORATION 2020 SECOND QUARTER NOTES TO CONDENSED CONSOLIDATED INTERIM FINANCIAL STATEMENTS (UNAUDITED) PAGE 7

b) Deferred, restricted and performance share units (old plan and new plan):
Deferred, restricted and performance share units (old plan and new plan) outstanding at June 30, 2020 are as follows:
Number of Deferred Share Units
Number of Restricted Share Units
Number of Performance Share Units (old plan)
Number of Performance
Share Units (new plan)
Outstanding at December 31, 2019 89,766 83,168 303,445 138,038
Granted 23,396 154,460 — 301,090
Performance factor impact on redemption 1 — — (117,674) —
Granted in-lieu of dividends 3,264 6,308 3,892 11,683
Redeemed — — (38,961) —
Cancelled — (1,064) (844) (1,064)
Outstanding at March 31, 2020 116,426 242,872 149,858 449,747
Granted 2,681 — — —
Granted in-lieu of dividends 241 447 277 829
Cancelled — (1,165) (217) (1,165)
Outstanding at June 30, 2020 119,348 242,154 149,918 449,411
1 Performance share units granted prior to 2019 have a feature where the ultimate number of units that vest are adjusted by a performance factor of the original grant as determined by the Company’s total shareholder return in relation to a predetermined target over the period to vesting. These units relate to performance share units redeemed in the quarter ended June 30, 2020.
Performance share units granted in 2019 and subsequently reflect a new long-term incentive plan. The performance share units granted under the new plan are redeemable for cash based on the market value of the Company's common shares and are non- dilutive to shareholders. They vest over three years and include two performance factors: (i) relative total shareholder return of Methanex shares versus a specific market index (the market performance factor) and (ii) three year average Return on Capital Employed (the non-market performance factor). The market performance factor is measured by the Company at the grant date and reporting date using a Monte-Carlo simulation model to determine fair value. The non-market performance factor reflects management's best estimate to determine the expected number of units to vest. Based on these performance factors, the performance share unit payout will range between 0% to 200%, with the first payout of the new performance share units in 2022.
Compensation expense for deferred, restricted and performance share units (old plan and new plan) is measured at fair value based on the market value of the Company’s common shares and is recognized over the vesting period. Changes in fair value are recognized in net income for the proportion of the service that has been rendered at each reporting date. The fair value of deferred, restricted and performance share units at June 30, 2020 was $14.7 million compared with the recorded liability of $8.3 million. The difference between the fair value and the recorded liability of $6.4 million will be recognized over the weighted average remaining vesting period of approximately 2.1 years.
For the three and six month periods ended June 30, 2020, compensation expense related to deferred, restricted and performance share units (old plan and new plan) included in cost of sales and operating expenses was an expense of $3.3 million (2019 - a recovery of $9.1 million) and a recovery of $1.3 million (2019 - an expense of $5.8 million), respectively. This included a recovery of $0.2 million ( 2019 - $12.7 million) and a recovery of $8.7 million (2019 - $1.3 million), respectively, related to the effect of the change in the Company’s share price for the three and six month periods ended June 30, 2020.
METHANEX CORPORATION 2020 SECOND QUARTER NOTES TO CONDENSED CONSOLIDATED INTERIM FINANCIAL STATEMENTS (UNAUDITED) PAGE 8

9. Changes in non-cash working capital:
Changes in non-cash working capital for the three and six months ended June 30, 2020 and 2019 were as follows:
Three Months Ended Six Months Ended
Jun 302020
Jun 302019
Jun 302020
Jun 302019
Changes in non-cash working capital:
Trade and other receivables $ 187,470 $ 7,305 $ 184,858 $ 45,750
Inventories 44,925 (25,578) 5,218 26,109
Prepaid expenses 3,345 (4,473) 8,775 (58)
Trade, other payables and accrued liabilities (69,235) 4,919 9,957 (41,973) 166,505 (17,827) 208,808 29,828
Adjustments for items not having a cash effect and working capital changes relating to taxes and interest paid 6,892 6,427 (9,148) 15,842
Changes in non-cash working capital having a cash effect $ 173,397 $ (11,400) $ 199,660 $ 45,670
These changes relate to the following activities:
Operating $ 147,493 $ (4,080) $ 135,899 $ 40,745
Financing — 1,780 — 1,780
Investing 25,904 (9,100) 63,761 3,145
Changes in non-cash working capital $ 173,397 $ (11,400) $ 199,660 $ 45,670
10. Financial instruments:
Financial instruments are either measured at amortized cost or fair value.
In the normal course of business, the Company's assets, liabilities and forecasted transactions, as reported in U.S. dollars, are impacted by various market risks including, but not limited to, natural gas prices and currency exchange rates. The time frame and manner in which the Company manages those risks varies for each item based on the Company's assessment of the risk and the available alternatives for mitigating risks.
The Company uses derivatives as part of its risk management program to mitigate variability associated with changing market values. Changes in fair value of derivative financial instruments are recorded in earnings unless the instruments are designated as cash flow hedges. The Company designates as cash flow hedges derivative financial instruments to hedge its risk exposure to fluctuations in natural gas prices and derivative financial instruments to hedge its risk exposure to fluctuations in the Euro compared to the U.S. dollar.
The fair value of derivative instruments is determined based on industry-accepted valuation models using market observable inputs and are classified within Level 2 of the fair value hierarchy. The fair value of all of the Company's derivative contracts as presented in the consolidated statements of financial position are determined based on present values and the discount rates used are adjusted for credit risk. The effective portion of the changes in fair value of derivative financial instruments designated as cash flow hedges is recorded in other comprehensive income. The spot element of forward contracts in the hedging relationships is recorded in other comprehensive income as the change in fair value of cash flow hedges. The change in the fair value of the forward element of forward contracts is recorded separately in other comprehensive income as the forward element excluded from the hedging relationships.
Until settled, the fair value of the derivative financial instruments will fluctuate based on changes in commodity prices or foreign currency exchange rates.
METHANEX CORPORATION 2020 SECOND QUARTER NOTES TO CONDENSED CONSOLIDATED INTERIM FINANCIAL STATEMENTS (UNAUDITED) PAGE 9

Natural gas forward contracts
The Company manages its exposure to changes in natural gas prices for a portion of its North American natural gas requirements by executing a number of fixed price forward contracts.
The Company has entered into forward contracts to manage its exposure to changes in natural gas prices for the Geismar site including (i) 40,000 mmbtu per day over the remaining term of 2020-2025 and (ii) 50,000 mmbtu per day for 2023 to 2032, which have been designated as cash flow hedges. Natural gas is fungible across the Geismar site. The Company has also entered into physical forward contracts to manage its exposure to changes in natural gas prices for the Medicine Hat facility. The Company has designated contracts for the 2021 and 2022 periods as cash flow hedges. Other costs incurred to transport natural gas from the contracted delivery point, either Henry Hub or AECO, to the relevant production facility represent an insignificant portion of the overall underlying risk and are recognized as incurred outside of the hedging relationship.
As at June 30, 2020, the Company had outstanding forward contracts in North America designated as cash flow hedges with a notional amount of $944.4 million (December 31, 2019 - $969.6 million) and a net negative fair value of $178.3 million (December 31, 2019 - negative fair value $195.1 million), of which $18.8 million is included in other current liabilities.
Euro forward exchange contracts
The Company manages its foreign currency exposure to euro denominated sales by executing a number of forward contracts which it has designated as cash flow hedges for its highly probable forecast euro collections.
As at June 30, 2020, the Company had outstanding forward exchange contracts designated as cash flow hedges to sell a notional amount of 11.7 million euros (December 31, 2019 - 18.4 million euros). The euro contracts had a negative fair value of $0.2 million included in current liabilities (December 31, 2019 - negative fair value of $0.4 million included in current liabilities).
Fair value
The fair value of the Company’s derivative financial instruments as disclosed above are determined based on Bloomberg quoted market prices and confirmations received from counterparties, which are adjusted for credit risk.
The table below shows the nominal net cash flows for derivative hedging instruments, excluding credit risk adjustments, based upon contracted settlement dates. The amounts reflect the maturity profile of the hedging instruments and are subject to change based on the prevailing market rate at each of the future settlement dates. Financial asset derivative positions are held with investment-grade counterparties and therefore the settlement day risk exposure is considered to be negligible.
Cash outflows by term to maturity
1 year or less 1-3 years 3-5 yearsMore than
5 years Total
Natural gas forward contracts 19,194 44,858 66,108 116,867 $ 247,027
Euro forward exchange contracts 189 — — — $ 189
The carrying values of the Company’s financial instruments approximate their fair values, except as follows:
June 30, 2020
As at Carrying Value Fair Value
Long-term debt excluding deferred financing fees $ 2,139,886 $ 1,955,507
Long-term debt consists of limited recourse debt facilities and unsecured notes. There is no publicly traded market for the limited recourse debt facilities. The fair value of the limited recourse debt facilities as disclosed on a recurring basis and categorized as Level 2 within the fair value hierarchy is estimated by reference to current market rates as at the reporting date. The fair value of the unsecured notes disclosed on a recurring basis and also categorized as Level 2 within the fair value hierarchy is estimated using quoted prices and yields as at the reporting date. The fair value of the revolving and construction credit facilities are equal to their carrying values. The fair value of the Company’s long term debt will fluctuate until maturity.
METHANEX CORPORATION 2020 SECOND QUARTER NOTES TO CONDENSED CONSOLIDATED INTERIM FINANCIAL STATEMENTS (UNAUDITED) PAGE 10

11. Egypt Insurance Recovery:
We experienced an outage at the Egypt plant from April to August 2019. In the quarter ended December 31, 2019, the Company recorded a $50 million ($25 million our share) insurance recovery which partially offsets repair costs charged to earnings and lost margins incurred in the second and third quarters of 2019. Subsequently, the final settlement agreement was signed by all parties, and an additional $9.8 million ($4.9 million our share) of insurance proceeds was recorded in the three months ended March 31, 2020. As at June 30, 2020, the amount had been fully collected.
12. Restatement:
As part of the restatement relating to presentation of revenue and cost of sales of Atlas-produced methanol on a gross basis disclosed in the most recent annual consolidated financial statements, revenue and costs of sales for the three and six months ended June 30, 2019 have been increased by $113 million and $273 million, respectively. Additionally, the amount of inventories recognized as cost of sales and operating expenses and depreciation and amortization for the three and six months ended June 30, 2019 has been increased by $62 million and $161 million, respectively (see note 2).
Please refer to note 25 of the 2019 audited consolidated financial statements for further details of this restatement.
METHANEX CORPORATION 2020 SECOND QUARTER NOTES TO CONDENSED CONSOLIDATED INTERIM FINANCIAL STATEMENTS (UNAUDITED) PAGE 11

Methanex CorporationQuarterly History (unaudited)
2020 Q2 Q1 2019 Q4 Q3 Q2 Q1
METHANOL SALES VOLUME
(thousands of tonnes)
Methanex-produced 1 3,693 1,717 1,976 7,611 2,056 1,965 1,669 1,921
Purchased methanol 966 418 548 2,492 623 680 716 473
Commission sales 1 535 271 264 1,031 307 179 216 329
5,194 2,406 2,788 11,134 2,986 2,824 2,601 2,723
METHANOL PRODUCTION
(thousands of tonnes)
New Zealand 893 450 443 1,865 513 469 446 437
USA (Geismar) 971 441 530 1,929 480 514 530 405
Trinidad (Methanex interest) 670 241 429 1,743 456 474 384 429
Egypt (50% interest) 280 147 133 392 151 85 15 141
Canada (Medicine Hat) 298 145 153 610 151 149 155 155
Chile 523 204 319 1,050 373 146 290 241
3,635 1,628 2,007 7,589 2,124 1,837 1,820 1,808
AVERAGE REALIZED METHANOL PRICE 2
($/tonne) 241 211 267 295 256 272 326 331
($/gallon) 0.72 0.63 0.80 0.89 0.77 0.82 0.98 1.00
ADJUSTED EBITDA 170 32 138 566 136 90 146 194
PER SHARE INFORMATION($ per common share attributable to Methanex shareholders)
Basic net income (loss) (0.55) (0.85) 0.30 1.15 0.12 (0.13) 0.65 0.50
Diluted net income (loss) (0.63) (0.85) 0.21 1.01 0.12 (0.21) 0.51 0.50
Adjusted net income (loss) (0.73) (0.84) 0.10 0.93 0.13 (0.27) 0.34 0.73
1 Methanex-produced methanol represents our equity share of volume produced at our facilities and excludes volume marketed on a commission basis related to the 36.9% of the Atlas facility and 50% of the Egypt facility that we do not own.
2 Average realized price is calculated as revenue, excluding commissions earned and the Egypt non-controlling interest share of revenue, but including an amount representing our share of Atlas revenue, divided by the total sales volume of Methanex-produced and purchased methanol.
METHANEX CORPORATION 2020 SECOND QUARTER
QUARTERLY HISTORY (UNAUDITED) PAGE 12
Related Documents