Alliance for Crea�vity and Entertainment www.alliance4crea�vity.com WHAT DO WE KNOW ABOUT 2020 MOVIE & TV PIRACY TRENDS WORLDWIDE Canada Australia Japan Italy Spain UK South America USA THE PREVALENCE & TYPES OF PIRACY CONSUMER RISKS FROM PIRACY SITES According to a study by RiskIQ for MPA-Canada: 1 out of 4 content theft sites visited by Canadians expose consumers to malicious content. 11.4B downloads globally of pirated wide release movies, primetime TV and video-on-demand (VOD) shows in 2020 using peer-to-peer protocols alone, not including other sources like streaming and downloading sites.1 137.2B visits to film and TV piracy sites globally in 2020. 13.8B visits to film and TV piracy sites in 2020. 943.6M downloads of pirated wide release movies, primetime TV and video-on-demand (VOD) shows in 2020 using peer-to-peer protocols alone, not including streaming and downloading sites.2 46% of the malicious content on content theft sites is phishing, where fake sites defraud users to log their username and password information, often redirecting users to legitimate websites afterwards.11 According to a study by Carnegie Mellon researchers: 2X time spent on piracy sites 30x times more likely to be exposed to malicious content on a content theft site than on a site in the general web site population.12 = 20% more malware infections In other words, the more users visited piracy sites, the more often their machines were infected with malware.13 1.5M monthly visitors to the 10 most popular streaming piracy sites, on average. 10.6% of households used known subscription TV piracy services in 2020, up from 6.9% in 2019 and 5.5% in 2018.3 12.2% of households used subscription TV piracy services in 2020, up from 9.3% in 2019 and 8.3% in 2018.4 340M visits per month to 1,447 online piracy sites in 2019.10 40% of consumers aged 15 or over watched pirated films, series, and live sports in 2020, up from 37% in 2019.6 32% of individuals viewed pirated films and 27% of consumers view pirated TV series in 2019. Including other content types, 5.2 billion total pirated files were accessed.7 20% of individuals watched pirated films, 14% watched pirated TV series, and 37% watched pirated live sports in 2020, during the pandemic.8 49.7% of internet users, or 110.5M unique users, accessed some form of online piracy.5 30% of teens watched pirated content in 2020, up from 25% in 2019. The COVID-19 lockdowns are a factor, with 40 percent saying they streamed or downloaded pirated movies and TV show more often in the last six months.9 During a Digital Citizens probe, investigators observed malware from piracy apps stealing usernames and passwords, probing user networks and surreptitiously uploading data without consent. In addition, the investigation found an illegal scheme to monetize stolen Netflix accounts.14 Host 9% 12% Streaming 79% P2P Data by SimilarWeb Phishing Scam Malicious redirector Malware Spam 46% 19% 22% 11% 2%

Welcome message from author
This document is posted to help you gain knowledge. Please leave a comment to let me know what you think about it! Share it to your friends and learn new things together.
Transcript
Alliance for Crea�vity and Entertainment www.alliance4crea�vity.com
WHAT DO WE KNOWABOUT
2020 MOVIE & TV PIRACY TRENDS WORLDWIDE
Canada
Australia
Japan
Italy
Spain
UK
South America
USA
THE PREVALENCE & TYPES OF PIRACY CONSUMER RISKS FROM PIRACY SITESAccording to a study by RiskIQ for MPA-Canada:
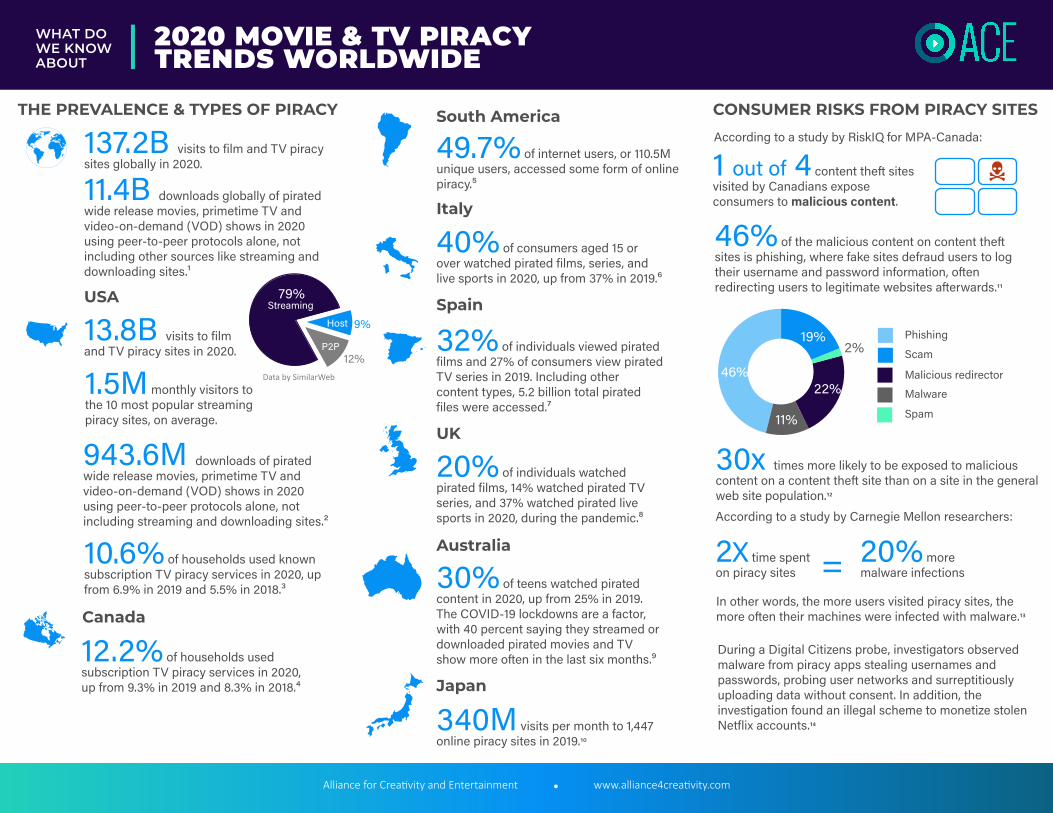
1 out of 4 content theft sites visited by Canadians expose consumers to malicious content. 11.4B downloads globally of pirated
wide release movies, primetime TV and video-on-demand (VOD) shows in 2020 using peer-to-peer protocols alone, not including other sources like streaming and downloading sites.1
137.2B visits to film and TV piracy sites globally in 2020.
13.8B visits to film and TV piracy sites in 2020.
943.6M downloads of pirated wide release movies, primetime TV and video-on-demand (VOD) shows in 2020 using peer-to-peer protocols alone, not including streaming and downloading sites.2
46% of the malicious content on content theft sites is phishing, where fake sites defraud users to log their username and password information, often redirecting users to legitimate websites afterwards.11
According to a study by Carnegie Mellon researchers:
2X time spent on piracy sites
30x times more likely to be exposed to malicious content on a content theft site than on a site in the general web site population.12
= 20% more malware infections
In other words, the more users visited piracy sites, the more often their machines were infected with malware.13
1.5M monthly visitors to the 10 most popular streaming piracy sites, on average.
10.6% of households used known subscription TV piracy services in 2020, up from 6.9% in 2019 and 5.5% in 2018.3
12.2% of households used subscription TV piracy services in 2020, up from 9.3% in 2019 and 8.3% in 2018.4
340M visits per month to 1,447 online piracy sites in 2019.10
40% of consumers aged 15 or over watched pirated films, series, and live sports in 2020, up from 37% in 2019.6
32% of individuals viewed pirated films and 27% of consumers view pirated TV series in 2019. Including other content types, 5.2 billion total pirated files were accessed.7
20% of individuals watched pirated films, 14% watched pirated TV series, and 37% watched pirated live sports in 2020, during the pandemic.8
49.7% of internet users, or 110.5M unique users, accessed some form of online piracy.5
30% of teens watched pirated content in 2020, up from 25% in 2019. The COVID-19 lockdowns are a factor, with 40 percent saying they streamed or downloaded pirated movies and TV show more often in the last six months.9
During a Digital Citizens probe, investigators observed malware from piracy apps stealing usernames and passwords, probing user networks and surreptitiously uploading data without consent. In addition, the investigation found an illegal scheme to monetize stolen Netflix accounts.14
Host 9%
12%
Streaming79%
P2P
Data by SimilarWeb
Phishing
Scam
Malicious redirector
Malware
Spam
46%
19%
22%
11%
2%

Alliance for Crea�vity and Entertainment www.alliance4crea�vity.com
WHAT DO WE KNOWABOUT
2020 MOVIE & TV PIRACY TRENDS WORLDWIDE
PIRACY PROFITSECONOMIC HARM FROM PIRACY
90% of piracy sites have at least one source of revenue, predominately advertising.20
86-93% profit margins for sites supported solely by advertising.21
$111M digital advertising revenue linked to infringed media estimated in 2016.
7-10% increase in online movie units sold, and a 4-7% increase in online movie units rented due to the shutdown of Megaupload and its associated sites.18
14-15% is the estimated increase in U.S./Canada box o�ice if piracy could be eliminated from the theatrical window (generally equivalent to $1 billion per year). The promotional e�ect of piracy is far outweighed by the cannibalization e�ect.16
19% decrease in box o�ice revenue due to pre-release piracy, as compared to what would have occurred if piracy were only available after the movie’s release.17
$1B revenue for pirate subscription IPTV annually in the U.S. alone, with an estimated 9 million subscribers.23
$160B estimated commercial value of digital piracy of film worldwide in 2015. The displacement of legitimate economic activity by counterfeiting and piracy has a negative e�ect on economic growth.15
Nearly all academic studies on video piracy find evidence that piracy displaces theatrical and home entertainment sales. Estimates for home video losses are, on average, larger than those for the box o�ice, with the exception of one study that suggests that pre-release piracy may be particularly devastating to theatrical revenue.19
This custom analysis uses SimilarWeb data to report across a group of sites o�en used for online piracy by category. It measures access to sites, but does not indicate what type of content was accessed (e.g. movies, TV, games, so�ware, etc.).
SimilarWeb data used in this report represents visits to websites by the United States and Global desktop and mobile users from January 2020 - December 2020. SimilarWeb is a market intelligence company that uses a combina�on of panel, crawler, ISP and other data for its data es�ma�ons. See: h�ps://www.similarweb.com/ourdata and h�ps://www.similarweb.com/blog/wp-content/uploads/2016/08/SW-vs-Direct-Measurement.pdf for more informa�on.
For the purpose of this analysis, sites used for online piracy included: Sites with over 10,000 copyright removal requests according to the Google Transparency Report (h�p://www.google.com/transparencyreport/) as of December 2020, including sites with any TV and/or movie content and excluding sites with only adult, music, games, UGC and eBook content; sites blocked in various countries or shut down due to copyright infringement, which have TV and/or movie content, and sites from www.opera�oncrea�ve.uk and other internal and external sources.
In the United States 28,376 sites were included, based on SimilarWeb data. MPA placed the sites into custom analysis categories including streaming sites (21,959), P2P sites (5,305) and cyberlocker/host sites (1,112).
Worldwide, 36,687 sites were included, based on SimilarWeb data. MPA placed the sites into custom analysis categories including streaming sites (28,428), P2P sites (7,101) and cyberlocker/host sites (1,158).
Methodology for Analysis of Site Visits
1 OpSec Security GDPI data2 OpSec Security GDPI data3 Sandvine, The State of Affairs: A Spotlight on Video and Television Piracy Worldwide, February 2020.4 Sandvine, The State of Affairs: A Spotlight on Video and Television Piracy Worldwide, February 2020.5 NetNames for Alianza Contra La Pirateria de Television Paga, “South AmericaTelevision Piracy Landscape,” January 2016.6 FAPAV/IPSOS, “Pirateria Audiovisiva in Italia, Presenta� I Da� FAPAV/IPSOS, July 2020. 7 GFK, “2019: Piracy Observatory and Digital Content Consump�on Habits,” 2019. 8 UK intellectual Property Office, “Online copyright infringement tracker survey (10th Wave),” April 2020. 9 Crea�ve Content Australia / Sycamore: 2020 Australian Piracy Behaviors and A�tudes Research, March 2021.10 Photonic System Solu�ons Inc. (PSS), Study Benchmarking and Tracking Online Film & TV Piracy in Japan, September 2019. 11 RiskIQ for MPA Canada, 2018 Study of the Presence of Malicious Content at Content Theft Sites Visited by Canadian Consumers, April 2019. 12 RiskIQ for MPA Canada, 2018 Study of the Presence of Malicious Content at Content Theft Sites Visited by Canadian Consumers, April 2019. 13 Telang, Does Online Piracy Make Computers Insecure? Evidence from Panel Data, March 2018.14 Digital Ci�zens Alliance/Dark Wolfe Consul�ng and GroupSense, Fishing in the Piracy Stream, April 2019.15 Fron�er Economics, The Economic Impact of Counterfei�ng and Piracy, February 2017.16 Montgomery, Ma, Smith, The Dual Impact of Movie Piracy on Box-office Revenue: Cannibalization and Promotion, February 2016.17 Montgomery, Ma, Smith, An Empirical Analysis of the Impact of Pre-Release Movie Piracy on Box-Office Revenue, July 2014.18 Danaher, et al, The Impact of the Megaupload Shutdown on Movie Sales, September 2013.19 Danaher, et al, Piracy Landscape Study: Analysis of Existing and Emerging Research Relevant to Intellectual Property Rights (IPR) Enforcement of Commercial-Scale Piracy, March 2020. 20 Incopro, Revenue Sources for Copyright Infringing Sites in the EU, 2015.21 MediaLink/Digital Ci�zens Alliance, Good Money Still Going Bad, May 2015.22 EY/TAG, Measuring digital advertising revenue to infringing sites, September 2017.23 Digital Ci�zens Alliance/NAGRA Kudelski, Money for Nothing: The Billion-Dollar Pirate Subscription IPTV Business, August 2020.
$36M from premium advertisers
$75M from non-premium advertisers, such as gaming, dating and virtual private network security services.22
+15%
Box O�ice
Related Documents


